Scanpower Limited Asset Management Plan
221
Prepared By: Peter Rue – Network Manager Authorised By: Lee Bettles – CEO Certified By: Scanpower Board of Directors Date: 4 th March 2020 Scanpower Limited Asset Management Plan 1st April 2020 – 31st March 2030
-
Upload
khangminh22 -
Category
Documents
-
view
0 -
download
0
Transcript of Scanpower Limited Asset Management Plan

Prepared By: Peter Rue – Network Manager
Authorised By: Lee Bettles – CEO
Certified By: Scanpower Board of Directors
Date: 4th March 2020
Scanpower Limited Asset Management Plan 1st April 2020 – 31st March 2030

Page 1 of 220
Table of Contents
Ref Description Page
1 TERMS OF REFERENCE 10
1.1 Date Completed and Period Covered 10
2 EXECUTIVE SUMMARY 10
2.1 Purpose of the Plan 10
2.2 Introduction to Scanpower 10
2.3 Overview of Scanpower’s Asset Management System 13
2.4 Asset Management Definition 14
2.5 Organisational Capability 14
2.6 Strategic Overview 15
2.7 Network Development Planning Summary 16
2.8 Summary of Asset Life Cycle Management Approach used by Scanpower 18
2.9 Network Expenditure Forecasts 19
3 THE ASSET MANAGEMENT SYSTEM 21
3.1 Background to the Asset Management Planning Process 21
3.2 Asset Management Plan Design Compliance 23
4 ASSET MANAGEMENT STRATEGY 24
4.1 Scanpower’s Strategic and Asset Management Planning Process 24
4.2 Stakeholder Analysis and the Commercial Environment 26
4.3 Corporate Level Strategy Formulation 30
5 PERFORMANCE OBJECTIVES AND SERVICE STANDARDS 34
5.1 Asset Management Objectives 34
6 ASSET KNOWLEDGE SET 38
6.1 Service Area 38
6.2 Large Customers 38
6.3 Load Characteristics 39
6.4 Energy Supplied and Demand 40
6.5 Network Configuration 42
6.6 Justification for Assets 51
7 ASSET INFORMATION SYSTEMS 53
7.1 Cablecad Geographic Information System (GIS) 53
7.2 NCS (Napier Computer Systems) customer/ICP information database 55
7.3 National Registry 55
7.4 SCADA System Records 55
7.5 Proprietary asset databases 56
7.6 Design Tools 56
7.7 Linkage between Data Systems and Asset Management Processes 57
7.8 Asset Management Information Systems Review 58
7.9 Justification for An Advanced Distribution Management System 60
7.10 Improvement Priorities 62
7.11 Technical Standards and Guidelines 63

Page 2 of 220
Table of Contents continued
Ref Description Page
7.12 Maturity of Information (AMMAT) 63
7.13 Capability Improvements 65
8 ORGANISATIONAL CAPABILITY 68
8.1 Accountabilities and Responsibilities 68
8.2 Developing Asset Management Organisational Capability 75
8.3 Competency Management 78
8.4 Communication and Participation 79
9 RISK MANAGEMENT 80
9.1 Introduction to Risk Management 80
9.2 Corporate Risk Management 81
9.3 Insurance 86
9.4 Asset Management Related Risk Management Process 88
9.5 Significant Assumptions 92
9.6 Business Model Risk 93
10 INVESTMENT PLANNING 94
10.1 Network Development Plan 94
10.2 Network Development Strategy 94
10.3 Planning Objectives 104
10.4 Planning Methodology 105
10.5 Policies and Standards 106
10.6 Feeder Development Plans 117
10.7 Network Development - Secondary Assets 140
10.8 Network Development Budget Forecast 141
11 LIFE CYCLE MANAGEMENT 144
11.1 Summary of Life Cycle Management 144
11.2 Introduction to Life Cycle Management 145
11.3 Asset Information by Category 145
11.4 Asset Age Profiles 147
11.5 Drivers for Maintenance Planning 155
11.6 Maintenance Driver Analysis by Asset Category 158
11.7 Maintenance Strategy and Practice 165
11.8 Asset Risk and Ten-Year Replacement Forecast 168
11.9 Operating Budgets 176
12 EVALUATION OF PERFORMANCE 186
12.1 Introduction 186
12.2 Consultation 186
12.3 Performance Measurement and Reporting 187
12.4 Overview of Key Performance Issues 187
12.5 Outage Analysis 192
12.6 Review of Outage Performance Strategies 199
12.7 Public Safety 202

Page 3 of 220
Table of Contents continued
Ref Description Page
12.8 Review of Progress Against Plan 203
APP A Asset Management Maturity Assessment Tool (AMMAT) 206
APP B COMPLIANCE ASSESSMENT MATRIX 209

Page 4 of 220
Table of Abbreviations
Abbreviation Full Description
ABS Air Break Switch
ACSR Aluminium Conductor Steel Reinforced
ADMD After Diversity Maximum Demand
ADMS Advanced Distribution Management System
ALARP As Low As Reasonably Practical
AM Asset Management
AMIS Asset Management Information Systems
AMMAT Asset Management Maturity Assessment Tool
AMP Asset Management Plan
BCP Business Continuity Plan
CB Circuit Breakers
CBD Central Business District
CML Customer Minutes Lost
DCF Discounted Cash Flow
DDO Direct Dropout Fuse
DRC Depreciated Replacement Cost
DRP Disaster Recovery Plan
EDB Electricity Distribution Businesses
ELB Electricity Line Businesses
ERP Emergency Response Plan
EV Electric vehicles
GIS Geographic Information System
HV High Voltage
ICT Information and Communication Technologies
ISO55000 Asset management – Overview, principles and terminology
LV Low Voltage
MMS Maintenance Management System
ND Network Development
NDP Network Development Plan
NGOC National Grid Operating Centre
ODV Optimised Deprival Valuation
POS Point of Supply
PS Public Safety
PSMS Public Safety Management System
PV Photovoltaic
RAB Regulatory Asset Base
RAPS Remote Area Power Supply
RMU Ring Main Unit
SCI Statement of Corporate Intent
SCADA Supervisory Control and Data Acquisition
SID Safety in Design
TDC Tararua District Council
TQM Total Quality Management

Page 5 of 220
Table of Figures
Ref Description Page
1 Graphical Representation of 10 Year Network Expenditure Forecast 20
2 The Asset Management System 22
3 The Asset Management Hierarchy 22
4 Scanpower Business Planning Process 25
5 Scanpower Stakeholder Analysis 27
6 Scanpower Area of Supply 38
7 Scanpower Load Profile Curves (Dannevirke and Woodville Points of Supply) 40
8 Typical Daily Consumption Profile (DVK and WDV – Winter / Summer) 41
9 Consumption by Feeder as at 1st March 2019 42
10 National Grid Configuration (Central North Island) 43
11 Scanpower Geographic Layout of 11kV Distribution Lines 44
12 Information Systems / Flow Schematic 58
13 Knowledge Maturity Scale 64
14 Scanpower Maturity Assessment 64
15 Asset Management Competency Framework 68
16 Scanpower Organisational Summary 71
17 Network Division Structure 72
18 Roles and Responsibilities Matrix within the Network Division Team 73
19 Key Objectives within the Network Division Team 74
20 Risk Management Framework 80
21 Conceptual Risk Assessment Process 88
22 Risk Treatment / Risk Characteristics Matrix 89
23 Non Coincident Maximum Demand Trend 97
24 Monthly Electricity Consumption (kWh) Trend 98
25 Transmission Cost Trend (April 2011 to Present) 100
26 Contingent Capacity for Dog Conductor at 11kV 112
27 Dannevirke GXP Single Line Diagram 117
28 Weber Feeder on Dannevirke Single Line Diagram 119
29 Weekly Load Profile of the Weber Feeder 119
30 Mangatera Feeder on Dannevirke Single Line Diagram 121
31 Weekly Load Profile of the Mangatera Feeder 121
32 Central Feeder on Dannevirke Single Line Diagram 122
33 Weekly Load Profile of the Central Feeder 122
34 Gordon Street High Voltage Ring Before Network Development 124
35 Gordon Street High Voltage Ring After Network Development 124
36 High Street Low Voltage Network As Is 125
37 High Street Low Voltage Network Proposed Network Development 125
38 Pacific Feeder on Dannevirke Single Line Diagram 126
39 Pacific Feeder (Final Configuration) on Dannevirke Single Line Diagram 127
40 Weekly Load Profile of the Pacific Feeder 128
41 Oringi Business Park Network As Is. 129
42 Oringi Business Park Proposed Network Development 130
43 East Feeder on Dannevirke Single Line Diagram 130
44 Weekly Load Profile of the East Feeder 131
45 North Feeder on Dannevirke Single Line Diagram 132
46 Weekly Load Profile of the North Feeder 133

Page 6 of 220
Table of Figures Continued
Ref Description Page
47 Adelaide Feeder on Dannevirke Single Line Diagram 134
48 Weekly Load Profile of the Adelaide Feeder 134
49 The Hub Transformer (Allardice Street) Network As Is 135
50 The Hub Transformer (Allardice Street) Network Proposed Network Development
136
51 Te Rehunga Feeder on Dannevirke Single Line Diagram (Final Version) 137
52 Weekly Load Profile of the Te Rehunga Feeder 137
53 Woodville Single Line Diagram 138
54 Weekly Load Profile of the Woodville Feeders 138
55 Conceptual Asset Age Profile Curves / Interval Setting 148
56 Conceptual Asset Age Profile Curves / Interval Setting 148
57 Pole Age Profile by Material Type 149
58 11kV Overhead Conductor Age Profile (Length and Type by Year of Installation) 149
59 11kV Underground Cable Age Profile (Length and Type by Year of Installation) 150
60 LV Overhead Conductor Age Profile (Length and Type by Year of Installation) 150
61 LV Underground Cables Age Profile (Length and Type by Year of Installation) 151
62 Small Transformer (<75kVA) Age Profile – Number Installed per Year by Capacity Rating
151
63 Large Transformer (>50kVA) Age Profile – Number Installed per Year by Capacity Rating
152
64 Air Break Switch Age Profile (Quantity by Year of Installation) 152
65 High Voltage Fuse Age Profile (Quantity by Year of Installation) 153
66 High Voltage Switchgear Age Profile (Quantity by Year of Installation) 153
67 Performance and Condition Factors – Conceptual Model 156
68 Risk-based Analysis and Justification Model 157
69 Forecast of the number of poles past their service life along with proposed pole renewal spend
169
70 Pole renewal spend and forecast 169
71 Forecast of the number of transformers past their service life along with proposed transformer renewal spend
170
72 Transformer renewal spend and forecast 170
73 Forecast of the number of ABSs past their service life along with proposed ABS renewal spend
171
74 ABS renewal spend and forecast 171
75 Forecast of the number of high voltage fuses past their service life along with proposed renewal spend
172
76 High voltage fuse renewal spend and forecast 172
77 Forecast of the number of overhead 11 kV conductors past their service life along with proposed renewal spend
173
78 Overhead 11 kV conductor renewal spend and forecast 173
79 Forecast of the number of overhead 400 V conductors past their service life along with proposed renewal spend
174
80 Overhead 400 V conductor renewal spend and forecast 174
81 Ten Year Capital Renewal Budget 180
82 Ten Year Network Expenditure Forecast (All Categories) 184
83 Yearly SAIDI Performance (2013 to 2019) 190

Page 7 of 220
Table of Figures Continued
Ref Description Page
84 Yearly SAIDI Performance (2013 to 2019)Yearly SAIFI Performance (2013 to 2019)
191
85 Outage Cause Analysis 2013 195
86 Outage Cause Analysis 2014 195
87 Outage Cause Analysis 2015 196
88 Outage Cause Analysis 2016 196
89 Outage Cause Analysis 2017 197
90 Outage Cause Analysis 2018 197
91 Outage Cause Analysis 2019 198
92 Outage Cause Analysis Ending January 2020 198
93 SAIDI Trend by Outage Cause (2016 to 2020) 199

Page 8 of 220
Table of Tables
Ref Description Page
1 Scanpower High Level Network Metrics as at March 201 11
2 Scanpower Key Network Data as at 31 March 201 12
3 Scanpower Key Financial Data as at 31 March 201 13
4 Scanpower Key Organisational Data at 31 March 20 13
5 Summary Corporate Strategy Map 15
6 Network Development Capital Expenditure Budget (2021 - 2030) 18
7 Ten Year Network Expenditure Forecast (all Categories) 19
8 Business Planning Document Summary 25
9 Summary of Stakeholder Interests 27
10 Summary Corporate Strategy Map 32
11 Asset Management Objectives and Policies 34
12 Scanpower Major Customer Details 39
13 Dannevirke Feeder Data 40
14 Woodville Feeder Data 41
15 Alignment of ISO 55000 to AMMAT Questions 65
16 Scanpower Corporate Risk Register 82
17 Insurance Cover Summary 87
18 Asset Management Related Risk Summary 90
19 Scanpower Security Standard 109
20 Contingent Capacity Calculations by Feeder 113
21 Scanpower’s Public Safety & Safety by Design Standard Summary 116
22 Network Development Budget Forecast 142
23 Financial Value of Network Assets at Depreciated Replacement Cost at 31st March 201
146
24 Hardwood HV Poles Maintenance Driver Summary 158
25 Hardwood LV Poles Maintenance Driver Summary 159
26 Small Transformers – Maintenance Policy, Criticality and Risk Assessment, and Gap Analysis
160
27 Large Transformers – Maintenance Policy, Criticality and Risk Assessment, and Gap Analysis
161
28 Air Break Switches – Maintenance Policy, Criticality and Risk Assessment, and Gap Analysis
162
29 Tree Management and Maintenance – Summary of Drivers, Objectives, Policies and Strategies
163
30 Historic and Forecast Tree Cutting Statistics 164
31 HV Line Inspection Maintenance Strategy and Practice 165
32 Below Ground Pole Inspections Maintenance Strategy and Practice 165
33 LV Line (Roadside) Inspections Maintenance Strategy and Practice 166
34 LV Line (Roadside) Inspections Maintenance Strategy and Practice 166
35 HV Switchgear Visual Ground Inspections Strategy and Practice 166
36 Ground Mounted Distribution Substations Strategy and Practice 167
37 Pole Mounted Distribution Substations Strategy and Practice 167
38 Tree Trimming Maintenance Strategy and Practice 167
39 Ten Year Maintenance Expenditure Budget 177
40 Ten Year Capital Expenditure by Regulatory Disclosure Category 178
41 Ten Year Capital Renewal Budget 179

Page 9 of 220
Table of Tables Continued
Ref Description Page
42 Ten Year Asset Renewal and Network Development Budget Summary 181
43 Ten Year Non Network Asset Budget Summary 182
44 Ten Year Total Network Expenditure Budget 183
45 2014/2015 Actual vs Budget Capital Expenditure 203
46 2015/2016 Actual vs Budget Capital Expenditure 203
47 2016/2017 Actual vs Budget Capital Expenditure 204
48 2016/2017 Actual vs Budget Capital Expenditure 204
49 2018/2019 Actual vs Budget Capital Expenditure 204
50 2019/2020 Actual vs Budget Capital Expenditure (Progress Ending December 2019, Waiting on January, February & March 2020 Results)
205

Page 10 of 220
1 TERMS OF REFERENCE
1.1 Date Completed and Period Covered
This Asset Management Plan relates to the period 1st April 2020 to 31st March 2030. The plan was completed in February 2020 and approved by Scanpower’s Board of Directors on 4th March 2020, prior to public disclosure. The plan is reviewed and restated on an annual rolling basis. The next plan will be available by 31st March 2021 and will cover the period 1st April 2021 to 31st March 2031.
2 EXECUTIVE SUMMARY
2.1 Purpose of the Plan
The purpose of this Asset Management Plan is to document the processes, objectives, systems and performance measures employed by Scanpower Limited in the management of the company’s electricity distribution network assets. Specifically, the asset management systems and processes documented herein, and undertaken in practice, are designed to ensure that: • The network assets meet customers’ electricity supply requirements, both in terms of
quality and cost. • Assets are maintained on a sustainable and long term basis. • Network performance targets are achieved. • Operational and efficiency improvements are achieved over time. Scanpower is required to produce and disclose this document annually in accordance with the Electricity Information Disclosure Determination 2012 published by the Commerce Commission on 1st October 2012.
2.2 Introduction to Scanpower
Scanpower Limited primary business activity is the ownership and operation of electricity distribution assets. These assets include overhead power lines, underground cables, transformers, switchgear, voltage regulators and peripheral communications and load control systems. The company’s network connects to the national electricity transmission grid operated by Transpower at two locations (Woodville and Dannevirke substations) and distributes electricity, on behalf of electricity retailers, to customer installations over a geographic area of ~2,500 square kilometres in the Northern Tararua region of New Zealand. The company’s head office is based at Oringi Business Park, Dannevirke. Scanpower was established during the 1920s and was known at that time as the “Dannevirke Electric Power Board”. Construction of the company’s distribution assets commenced at this time and has continued to develop and grow since. Following the Energy Companies Act 1992, the “Dannevirke Electric Power Board” was corporatised, having operated as a municipal / local body entity for the preceding seventy

Page 11 of 220
years. Scanpower Limited was established with a sole share being issued to the Scanpower Customer Trust, a body of five elected trustees who hold the investment in trust on behalf of the wider community. The beneficiaries of the trust are defined as any consumer connected to the Scanpower electricity network. It is of key strategic significance to note that the company’s customers are also its owners via the trust ownership structure. Customers elect trustees on a triennial basis to represent their interests and to drive the direction of the company via a Statement of Corporate Intent (SCI). The SCI is produced annually in consultation between the Board of Directors of Scanpower Limited and the Trustees of the Scanpower Customer Trust. It details such things as the scope of the company’s operations and establishes targets in relation to financial performance, network reliability and network pricing. The annual Statement of Corporate Intent can be viewed by any interested parties via Scanpower’s website. Scanpower has a natural monopoly on electricity distribution in the geographic area in which it operates and therefore, as with the other twenty eight regional distribution companies in New Zealand, is subject to scrutiny and regulation from the Commerce Commission. Whilst Scanpower is exempt from certain aspects of this regulation by virtue of its customer-owned status, it is still obligated to make certain information disclosures relating to matters such as network pricing, asset management planning documentation, and general technical and financial disclosures. Of the twenty nine electricity distribution companies in New Zealand, Scanpower is relatively small and operates in a predominantly rural area. The following table highlights the scale of the company’s operations relative to other industry participants.
Table 1 Scanpower High Level Network Metrics as at March 2019
Measure Scanpower Industry Median Ranking of 29
Connections (ICPs) 6,659 32,156 28th
Connection Density (ICPs / km) 6.3 9.7 23rd
Energy Density (kWh / ICP) 11,629 15,031 26th
Demand Density (kW / km) 15.2 32.4 26th
System Circuit Length (km) 1,050 3,949 26th
Value of Regulatory Asset Base ($000) 41,069 206,316 28th
Source: “Electricity Line Business 2018 Information Disclosure Compendium” - PWC, November 2019.
As is evident from the data above, in physical terms the Scanpower network is amongst the smallest in the country. In addition to this, both energy and demand density are also comparatively low. Since 1992 the electricity distribution sector has seen numerous mergers and acquisitions, resulting in the number of network companies falling from over fifty to the current twenty nine, although this kind of activity has tailed off in the past ten or so years. Over this time, whilst a range of options has been considered, the owners of Scanpower have indicated a strong preference for continued local ownership and representation of customer / owner interests at a local level.

Page 12 of 220
For this reason, both the Trust and Company remain committed to the current ownership structure and are confident that despite its size, Scanpower can operate as a stand-alone utility and deliver levels of service and cost that meet or exceed the expectations of its key stakeholders. A review undertaken by the Trust in 2016, including a survey of all customers, returned a 96.4% approval rating for continuation of the existing ownership structure (the next review will be performed in 2021). With this background in mind, to achieve economies of scale in terms of administration and overheads, and to provide business / community growth, since 2000 Scanpower has actively pursued a successful strategy of diversifying into new areas of business. In addition to the core network business, the company is now involved in the following activities: • Power line contracting in other network areas (Centralines, Powerco, Electra). • Property development and ownership of an investment property portfolio. • Tree and vegetation contracting. For the financial year ending 31st March 2019, 50% of the company’s revenue was derived from these other business activities. The diversity in the portfolio of Scanpower’s business activities is pertinent from a strategic perspective as correspondingly corporate level strategy has two distinct components: • Corporate level network strategy. • Corporate level strategy for unregulated / new business ventures. As this document is concerned with the electricity distribution assets of Scanpower, the remainder of this discussion of corporate strategy will focus on that relevant to the network business. By way of further background to the organisation, the tables below provide a summary of key network information, financial metrics and other company data.
Table 2 Scanpower Key Network Data as at 31 March 2019
Measure Quantity / Details
Geographic area covered 2,500km2
Customer connections (ICPs) 6,659
Main centres / townships supplied Dannevirke, Woodville, Norsewood, Weber, Ormondville,
Kumeroa
Connections to National Grid 2
GXP Locations of grid connections Dannevirke, Woodville
Maximum coincident system demand 17.5MW

Page 13 of 220
Table 2 Continued Scanpower Key Network Data as at 31 March 2019
Measure Quantity / Details
Electricity volumes carried 83GWh
Length of overhead 11kV lines 845km
Length of underground 11kV cables 17km
Length of overhead low voltage lines 111km
Length of underground low voltage cables 76km
Total system length 1,050km
Installed transformer capacity 72MVA
Table 3 Scanpower Key Financial Data as at 31 March 2019
Measure Quantity / Details
Total operating revenue $19,365,000
Network line revenue $9,666,000
Earnings before interest, customer discounts & tax $2,378,000
Customer discounts paid $1,553,000
Total assets $57,163,000
Shareholders’ equity $41,383,000
Regulatory value of network asset base $41,069,000
Table 4 Scanpower Key Organisational Data at 31 March 2020
Measure Quantity / Details
Total staff numbers 63
Office / depot locations Oringi Business Park, Dannevirke (Head Office)
Feilding (External Contracting Depot)
Paraparaumu (External Contracting Depot)
2.3 Overview of Scanpower’s Asset Management System
Scanpower has developed an asset management system based on the ISO 55000:2014 standard for the management of the electricity distribution assets that constitute its core business. This standard is considered by Scanpower as ‘best practice’ and a comprehensive methodology for compliance with the Asset Management Plan (AMP) disclosure requirements. This document is structured around both the core elements of ISO55000 and regulatory prescription. A cross-reference between the AMP and the prescription is provided in APPENDIX B.

Page 14 of 220
This document is structured with the following core elements:
• A description of the asset management system itself including a description of information systems, the organisation’s structure and capability, and a statement of the maturity of systems and processes.
• Derivation of the asset management objectives, service standards, and KPIs starting from Scanpower’s corporate level strategic objectives.
• A more detailed overview of the network assets, their configuration and the characteristics of the consumers/load they serve than outlined in the introduction above.
• Detail of the company’s risk management processes and their follow-on down to asset management practices.
• A comprehensive analysis and derivation of the Network Development Plan. This is essentially the planning activity Scanpower undertakes to ensure its network is capable of meeting consumer needs and company objectives into the future. It documents the processes for optimal solution selection and a forecast of resulting development expenditure.
• The details of Scanpower’s asset life cycle management policies, objectives and practices. This includes the derivation of maintenance strategies, operating practices, and asset renewal programs. The budgets associated with various work programs are presented in this section.
• Asset management is a quality management process and as such closes the cycle off with a review of performance against the plan. This is the final section of the AMP but is also is an input into the next cycle. For example, it includes an analysis of fault causes, which is used to identify key performance issues and target associated key assets.
2.4 Asset Management Definition
Asset Management is defined by ISO55000:2014 as: “The systematic and coordinated activities and practices through which an organisation optimally and sustainably manages its assets and asset systems, their performance, risks and expenditures over their lifecycles for the purpose of achieving its organisational strategic plan.”
2.5 Organisational Capability
In addition to adopting the ISO55000 standard as the basis of its asset management practices, Scanpower has also:
• Established a NZS 7901: 2008 compliant Public Safety Management System.
• Improved coordination of asset management and safety systems with its ISO 31000 risk management processes.

Page 15 of 220
• Restructured its staffing and resources to create a Network Division with an enhanced focus on customer service through the creation of a dedicated Fault Response and Network Field Services Team. In addition, the Network team has also now taken on chargeable customer service line work on the network, allowing for faster response times (this work was previously undertaken by Scanpower’s Power Line Contracting Division who now focus solely on “off network” projects).
2.6 Strategic Overview
Consistent with the ISO55000 approach, Scanpower’s asset management policies, strategies, plans and implementation are driven directly by the organisation’s corporate level strategy. The details of the over-arching corporate strategy are presented in the strategy map below. It is this corporate strategy that feeds into the asset management planning process, setting the high level objectives and expectations of the network business. By following this process, Scanpower aims to ensure that the organisation’s corporate level strategy, or strategic intent, flows through all asset management activities. Provided below is Scanpower’s Corporate Strategy Map. This details the company vision and mission, in addition to key strategic objectives with associated targets or key performance indicators.
Table 5 Summary Corporate Strategy Map
Company Vision (What we aspire to achieve)
Delivering more to our community by providing a high quality electricity distribution network and promoting economic growth.
Company Mission (Our fundamental purpose)
To provide our region with a reliable, safe, cost-effective and sustainable electricity distribution network, whilst using our innovation and skills to develop new business and employment opportunities within our local communities.
Strategic Objective 1 - To deliver a reliable and safe supply of electricity to our customers
Detailed Objective Target / KPI
To achieve SAIDI and SAIFI results within the top half of industry performance.
• Use of industry benchmarking studies
• SAIDI < 172 customer minutes
• SAIFI < 1.530 customer interruption
Maintain supply voltages within regulatory / appropriate levels.
• Supply voltage maintained within +/- 5% tolerance levels
• Number of customer voltage complaints
Provide a level of security of supply appropriate to various connection groups / sizes
• Appropriate security standards established and maintained
Maintaining and replacing assets on a sustainable and best practice basis
• ISO 5500 asset management methodology adopted
• AMP feedback from Commerce Commission review and industry ranking relative to other companies
• Planned capital and maintenance activities completed within time and financial budgets
• Total asset life cycle management approach adopted
Operating a compliant and effective public safety management system (PSMS)
• Scanpower PSMS achieves Telarc certification for compliance
• Zero harm caused to members of the public

Page 16 of 220
Table 5 Continued – Summary Corporate Strategy Map
Forecasting and responding to load growth with network development initiatives that ensure community and customer needs are met into the future.
• Capacity exists to accommodate all reasonably foreseeable growth within appropriate timeframes whilst maintaining quality standards.
• Network development adopts lowest cost-effective solutions including consideration of distributed generation and demand side solutions.
Strategic Objective 2 - To provide a cost effective supply of electricity to our customers
Detailed Objective Target / KPI
For Scanpower customers to pay lines charges (excluding transmission costs) that, having taken into account annual discounts, are in the lowest quartile in the country when compared to other networks.
• Use of industry benchmarking and pricing studies
• Distribution revenue per ICP (post discounts)
• Cents per kWH (post discounts)
• Annual cost for 8,000 kWH pa consumers
To maintain financial performance in terms of operating expenditure that supports this pricing objective and is better than the industry average.
• Use of industry benchmarking and pricing studies
• Operational expenditure per ICP per annum
Strategic Objective 3 - To earn a commercially appropriate return on our assets
Detailed Objective Target / KPI
Achieve a return on investment from our network assets that is consistent with the expectations of shareholders and commercially appropriate relative to the industry in which we operate.
• Return on Investment (prior to discounts) of ~7.5% on regulatory asset base value.
Strategic Objective 4 - To deliver financial benefits to our community via the network discount
Detailed Objective Target / KPI
To return a level of financial benefit to the customer shareholders on an annual basis using the network discount mechanism that is consistent with the expectations of the Customer Trust.
• Annual discount payment equal to, or greater than, $1.65m per annum, equating to $325 each for typical residential customers.
2.7 Network Development Planning Summary
This section of the asset management plan details the process of assessing the Network’s future development requirements in order to deliver on Scanpower’s long term business objectives. It records the asset management strategy and planning component of the Asset Management Conceptual Model. That is, it is the Network Division’s Strategic Plan as applied to the assets on which the core business is based. It is referred to as the Network Development Plan. The key features of the existing network with regard to its strategic planning environment are:
• The network has no sub-transmission system which means it has the potential to become capacity and voltage constrained. However, at current and foreseeable loads, this is not an issue.

Page 17 of 220
• The network has minimal interconnection capability particularly in the urban LV networks. No part of the network meets an N-1 security standard (which is appropriate to the load size).
• Some of the more significant differentiators of this network to its peers are; it has very little single phase distribution and its protection/switching is largely still HV expulsion fuse based.
• Electricity consumption on the network is trending downwards as a result of the loss of several major customers, and a general / creeping erosion of load. After several decades of population decline, the district is now showing some signs of creeping growth.
• “Public Safety” & “Safety in Design” are becoming more prevalent in decision making processes.
• The uncertainty of EV and PV uptake, and their effects on the low voltage and high voltage distribution network.
Simply put, whilst there is no load growth on the system that would justify the upgrade or the installation of extra capacity, there are certainly network development (ND) projects that can improve the safety and performance of the network. These projects will usually be initiated via capital renewals. More specifically the ND projects that are chosen will:
1. Increase the performance of the network.
2. Increase the safety of the network.
3. Help future proof the network for increased EV charging stations, EV home charging and PV solar injection.
4. Reduce the investment required in traditional lines where viable via alternative
methods such as solar, batteries and generators could be employed. Table 6 shows the forecast Network Development budget. In summary for 2021 Scanpower is investing capital in:
1. A Static VAR Generator to help improve voltage in the Jackson Road, Norsewood and Weber areas.
2. New low voltage data loggers and real time monitoring devices to measure and monitor key parts of the low voltage distribution network.
Scanpower has made an allowance for future network development resulting from new connections. The budget allows money for planned and unplanned projects. This ensures Scanpower can still respond to any unforeseen and unplanned capital renewal without jeopardising the planned renewals. As shown in the table, the first three years are generally easier to predict, however beyond that; Scanpower has allowed separate funds to accommodate the uncertainty in technological, load or regulatory changes.

Page 18 of 220
Table 6 Network Development Capital Expenditure Budget (2021 - 2030)
($000) 2021 2022 2023 2024 2025 2026 2027 2028 2029 2030
Power quality and voltage improvement
Static var generator installation - Jackson Rd / Norsewood / Weber
86 - - - - - - - - -
Other voltage improvement technology
- - - - - 55 56 57 59 60
Network resilience, security, reliability and reinforcement improvement
Air break switch installation - 16 17 17 17 18 18 18 19 19
Allardice street upgrade - 153 - - - - - - - -
High Street CBD Upgrade - - 156 - - - - - - -
Oringi Business Park Upgrade - Phase 1
- - - 159 - - - - - -
Oringi Business Park Upgrade - Phase 2
- - - - 162 - - - - -
Dannevirke & Woodville Low Voltage Reinforcement
- - - - - 55 - 57 - 60
Customer initiated works
Customer Initiated Capacity Upgrades / Transformer Changes
32 33 33 34 35 35 36 37 37 38
Customer Initiated Works Associated with New Connections
32 33 33 34 35 35 36 37 37 38
Network automation
Low voltage network monitoring - data loggers installation
53 - - - - - - - - -
Recloser, Ring Main Unit & Sectionaliser installation
- - - - - - 56 - 59 -
Other
To be Determined (Subject to Technology / Load Change etc)
- - - - - 55 56 57 59 60
Total Network Development 203 235 239 244 249 254 259 264 269 275
2.8 Summary of Asset Life Cycle Management Approach used by Scanpower
Scanpower does not have a significant population of any specific category of asset that is considered critical in terms of its primary service delivery objectives – ‘keeping the lights on’. The bulk of its asset is an 11kV/400V pole mounted electricity distribution network. The age and condition related replacement of hardwood poles in this network is the primary focus of Scanpower’s life cycle management activity. This plan has improved the targeting of replacements of assets and network segments where condition is driving performance. Analysis indicates that more attention/pace is warranted on

Page 19 of 220
the LV network which has passed the optimal point for renewal (but does not affect regulatory performance benchmarking). Scanpower’s hardwood pole replacement programme is due to be completed in 2024. From here, there will be more focus on crossarm replacement along with targeting specific softwood poles. The transformer population is approaching its optimal service life and because it is relatively expensive to renew, it will be pre-emptively replaced via opportunistic renewal policies as part of other work programmes in order to spread replacement over a wider time period. Scanpower’s next asset life cycle strategy is to target the transformer population. From 2025, at least forty pole top transformers and eight ground mount transformers will be renewed per annum. The ground mount transformers tend to supply electricity within key urban areas, hence from a risk based approach, more emphasis will be placed on their renewal. Service line condition, and the need for its replacement, is an issue that affects Scanpower’s costs although these are not assets it owns. The industry is still in the process of determining how it will respond to this issue. Tree management is currently a significant non-asset but performance driving issue on Scanpower’s network. Forestry outside the regulatory clearances is the main contributor. Scanpower has established major resourcing capacity to address this issue. Tree trimming funded by the network is a major component of life cycle costs and this will continue for several cycles until cost responsibility has been transferred to tree owners. With a recent increase in trend of tree faults on the network, Scanpower has introduced a three-pronged attack to increase the network performance which includes:
• Increasing the annual tree maintenance spend from $300,000 to $600,000.
• Actively working with forestry companies and tree owners by temporarily taking lines down for tree removal.
• Diverting high voltage lines away from high risk trees that have repetitively caused network faults.
2.9 Network Expenditure Forecasts
Total network expenditure for the coming ten-year period is summarised in Table 7, and is broken down into operating expenditure, routine capital expenditure and Network Development capital expenditure and non-network asset capital expenditure.
Table 7 Ten Year Network Expenditure Forecast (all Categories)
($000) 2021 2022 2023 2024 2025 2026 2027 2028 2029 2030
Description
Operating Expenditure 4,212 4,296 4,382 4,470 4,559 4,650 4,743 4,838 4,935 5,034
Asset Renewal 1,731 1,784 1,820 1,856 1,899 1,935 1,959 2,012 2,052 2,081
Network Development 203 235 239 244 249 254 259 264 269 275
Non Network Assets 599 92 94 96 97 99 101 103 105 108
Total Network Expenditure 6,745 6,407 6,535 6,665 6,804 6,939 7,062 7,218 7,362 7,497

Page 20 of 220
The expenditure trends are plotted in Figure 1. Scanpower is investing more into capital renewal and development than the annual deprecation rate, which supports the company’s strategic objective that assets are being replaced at an adequate rate to sustain the infrastructure. Comparing Scanpower’s performance to other distribution companies suggests that Scanpower is spending the correct amount on operating expenditure; more specifically in the areas of trees and network maintenance.
Figure 1 Graphical Representation of 10 Year Network Expenditure Forecast

Page 21 of 220
3 THE ASSET MANAGEMENT SYSTEM
3.1 Background to the Asset Management Planning Process
As part of an on-going process to improve the company’s asset management practices, Scanpower has decided to adopt the ISO55000:2014 approach to physical asset management. This international standard is an evolution of the former British Standard “PAS 55 – Optimal Management of Physical Assets”. ISO55000 is the de facto, world-wide best practice specification for businesses seeking to demonstrate a high level of professionalism in whole life cycle management of their physical assets. Further, the ISO framework is common to a wide range of other management systems adopted by Scanpower (safety, quality, risk, etc.) so the tools Scanpower has in place for managing these aspects of its wider business readily adapt and systems readily integrate. For example, Scanpower’s Asset Management System shares the Mango software tools for document control, defect/incident registers, risk assessment, continuous improvement, auditing, HR management, monitoring and reporting. An example of total integration with other systems would be the competency and training management of field staff. It is on this basis that Scanpower has decided to adopt such an approach. Our Asset Management System has been externally reviewed by suitably accredited ISO55000 experts and its asset management systems are now sufficiently mature that full accreditation could be obtained. Recent changes in leadership within the organisation have hindered the ISO55000 accreditation process. It’s aimed by 2025, that Scanpower will achieve full ISO55000 accreditation. Clearly compliance with international best practices is a better delivery on the key objectives of asset management disclosure regulation and publicly demonstrate that the electricity system is being maintained and development is justified, sustainable, efficient and effective manner, serving the interests of consumers, shareholders, and the nation with appropriate balance. The key elements of asset management practice as defined by ISO55000 are: 1. Organisation strategy and management 2. People 3. Risk management 4. Investment planning 5. Works delivery 6. Performance management 7. Information management and enabling technology Figure 2 below illustrates the conceptual asset management model. As is evident, the key driver of asset management strategy and planning is the organisational strategic plans.

Page 22 of 220
Figure 2 The Asset Management System
As shown in Figure 3 a key feature of the ISO55000 model is that asset management strategy is driven by the organisational strategic plan. This enables the establishment of a “strategic line of sight” that is evident at all levels of the organisation, and pervades all asset management activity as per the conceptual diagram below.
Figure 3 The Asset Management Hierarchy

Page 23 of 220
3.2 Asset Management Plan Design Compliance
This document has been structured to directly reflect the core elements of the ISO55000 Asset Management Conceptual Model presented above. Scanpower has adopted ISO55000 as a “best practice”. The AMP design is intended to comply with this standard in the first instance but it also attempts to interpret and align content to display clear intent to meet disclosure prescription. It is sectioned with the following core elements:
• Asset Management Strategy – detailing the process of deriving asset management strategy, objectives and policy from corporate strategy and company objectives.
• Asset Knowledge – description of assets, information systems, and processes.
• Organisational Capability – description of the people enablers, organisational structure, and the processes for assessing need and developing capability
• Asset Performance Objectives and Service Standards – derivation of performance standards from strategy objectives.
• Risk Assessment – detail of the risk management reviews and plans at corporate and network levels.
• Network Development Planning – detail of the planning process and derivation of the plan for meeting future demand and sustaining delivery on objectives.
• Life Cycle Management – detail of maintenance and renewal programs, reliability, quality and safety improvements.
• Evaluation of Performance – review of progress against plan as closure to the asset management continuous improvement quality circle.
The AMP serves an additional regulatory role of formally disclosing Scanpower’s asset management capability and performance. The content of this plan is targeted directly at meeting prescribed disclosure. APPENDIX B provides a table cross referencing AMP Disclosure Prescription in the Commerce Act (Electricity Distribution Disclosure) to the structure of this AMP document which follows the ISO55000 framework.

Page 24 of 220
4 ASSET MANAGEMENT STRATEGY
4.1 Scanpower’s Strategic and Asset Management Planning Process
Scanpower operates a rolling ten year, organisational level, strategic planning cycle with reviews undertaken by the Board of Directors and Executive Management team on an annual basis. During these reviews, a variety of strategic management techniques are used, including:
• Assessment of current strategy and historical performance.
• Internal organisational analysis (strengths and weaknesses).
• External organisational analysis (opportunities and threats).
• Environmental scanning (political, economic, social, technological, legal, environmental).
• Stakeholder analysis / customer needs assessment.
• Portfolio analysis of the company’s business activities.
• Confirmation / revision of the organisation’s vision and mission.
• Confirmation / revision of the organisation’s strategic intent and key goals.
• Strategy formulation and selection.
• Scenario analysis.
• Establishment of key performance metrics.
• Identification of critical success factors and risks.
Following the annual review, the ten year strategic plan is summarised and documented in the Statement of Corporate Intent. These detail the high level aspects of the organisational strategy such as:
• Company vision, mission and strategic objectives.
• The nature and scope of the company’s activities (industries, markets etc).
• Capital structure and dividend policies.
• Significant accounting policies.
• Acquisition / investment procedures.
• Key performance indicators and associated targets. The Statement of Corporate Intent is submitted by the Scanpower Limited Board of Directors to the Trustees of the Scanpower Customer Trust for comment, amendment and ultimately

Page 25 of 220
approval. Notably the Trustees, as advocates of both investor and customer interests, have the authority of final approval (or otherwise) over the key aspects of organisational level strategy. Following approval of the Statement of Corporate Intent, and associated key organisational level strategic drivers, by the Trustees of the Scanpower Customer Trust, the Executive Management team has responsibility for preparing business plans aimed at delivering the strategic objectives of the company. This includes annual tactical plans and budgets. The Board of Directors approve these plans and budgets, as well as monitor them on their monthly progress. At the end of each year, the company’s performance is measured against the annual business plans and budgets which is fed back into the annual review of the ten year strategic plan. Figure 4 summarises the overall planning process.
Figure 4 Scanpower Business Planning Process
Table 8 summarises the key components of the overall business planning process with details of the review frequency.
Table 8 Business Planning Document Summary
Planning Document Planning Horizon Review Frequency
Organisational Strategic Plan 10 years Annual
Asset Management Plan 10 years Annual
Non-Network Division Strategic Plans various – typically 5 years Annual
Statement of Corporate Intent 3 years Annual
Divisional Business Plans & Budgets 1 year Monthly

Page 26 of 220
4.2 Stakeholder Analysis and the Commercial Environment
As the conceptual diagram of the ISO55000 process on Figure 2 illustrates, key inputs / drivers of the organisational strategy setting process are:
• Customer requirements.
• Legislative requirements (including regulatory factors).
• Investor requirements.
• Influencing factors from the external commercial environment Customers, investors and legislators / regulators are stakeholders in Scanpower Limited whose requirements can be examined using a stakeholder analysis process. The influence of the broader commercial environment is best analysed using strategic management tools such as PESTLE (political, economic, social, technological, legal, environment) analysis, scenario planning and observation of general electricity related trends. To identify the range of key stakeholders in Scanpower Limited, the company has considered questions such as:
• Who are the purchasers of the company’s services?
• With whom does the company have a contractual relationship?
• Who owns the company?
• To whom does the company have a contractual, ethical or social obligation?
• To whom does the company have a statutory or regulatory reporting obligation?
• Where are the company’s assets located?
• Who may directly or indirectly come into contact with the company’s assets?
• Who are the company’s key suppliers, contractors and customers?
• Which customers / agencies rely most heavily on the company’s services?
• What regulatory / industry bodies does the company interact with?
• To whom does the company have a safety management obligation?
• What key pieces of legislation is the company bound to adhere to? A review of the key stakeholders in Scanpower’s electricity distribution business identified the groups illustrated in Figure 5.

Page 27 of 220
Figure 5 Scanpower Stakeholder Analysis
Having identified these stakeholder groups, it is necessary to ascertain their particular interests, and consider these in the strategy formulation process. These are summarised in Table 9:
Table 9 Summary of Stakeholder Interests
Stakeholder Nature of Interest / Desired Outcomes
Customers
Connected Electricity Consumers & Consumer Advocacy Groups
• A reliable supply of electricity with few or no interruptions.
• A quality supply of electricity in terms of stable voltage and availability of hot water (where electric).
• A safe supply of electricity.
• Timely response to service requests / issues / enquiries.
• Competitive level of network charges relative to others.
• Receipt of a meaningful annual network discount payment.
• Readily available information on network matters.
Customers
Electricity Retailers
• Ease of access to the network in contractual terms.
• Network charges are clear and understood.
• Information requests responded to in a timely manner.
• Line losses are minimised to the extent possible.
• Network billing is timely, accurate and compliant.
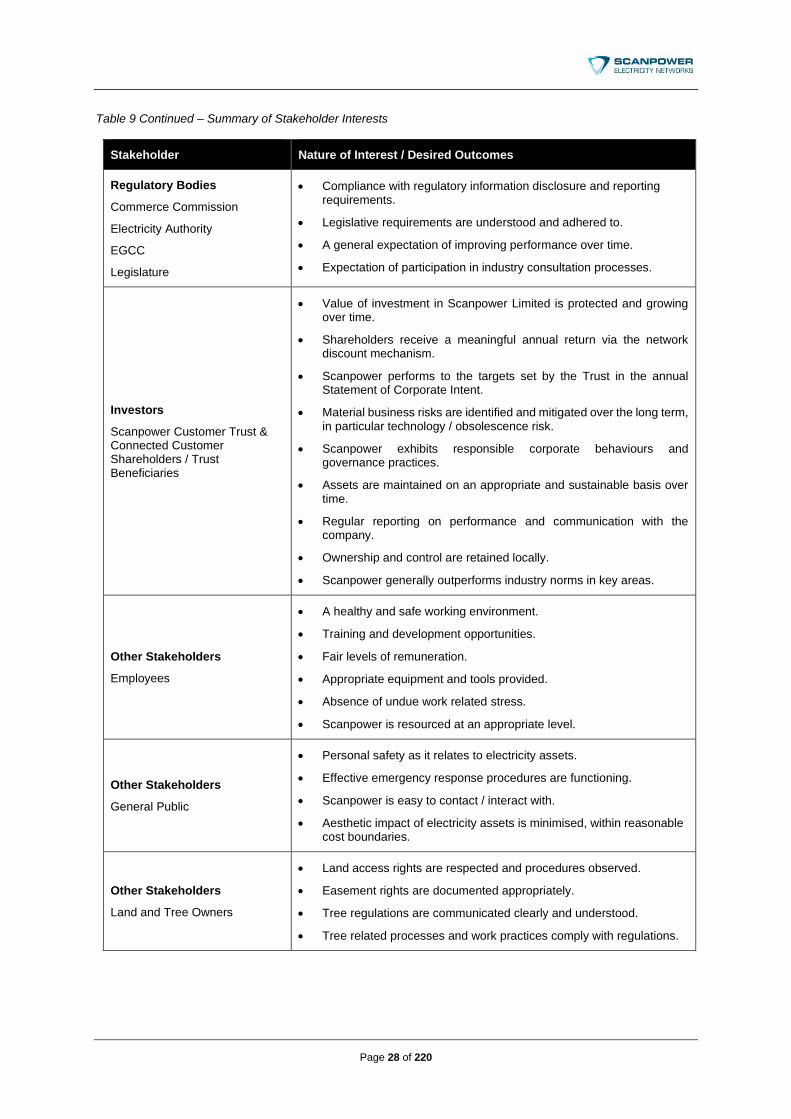
Page 28 of 220
Table 9 Continued – Summary of Stakeholder Interests
Stakeholder Nature of Interest / Desired Outcomes
Regulatory Bodies
Commerce Commission
Electricity Authority
EGCC
Legislature
• Compliance with regulatory information disclosure and reporting requirements.
• Legislative requirements are understood and adhered to.
• A general expectation of improving performance over time.
• Expectation of participation in industry consultation processes.
Investors
Scanpower Customer Trust & Connected Customer Shareholders / Trust Beneficiaries
• Value of investment in Scanpower Limited is protected and growing over time.
• Shareholders receive a meaningful annual return via the network discount mechanism.
• Scanpower performs to the targets set by the Trust in the annual Statement of Corporate Intent.
• Material business risks are identified and mitigated over the long term, in particular technology / obsolescence risk.
• Scanpower exhibits responsible corporate behaviours and governance practices.
• Assets are maintained on an appropriate and sustainable basis over time.
• Regular reporting on performance and communication with the company.
• Ownership and control are retained locally.
• Scanpower generally outperforms industry norms in key areas.
Other Stakeholders
Employees
• A healthy and safe working environment.
• Training and development opportunities.
• Fair levels of remuneration.
• Appropriate equipment and tools provided.
• Absence of undue work related stress.
• Scanpower is resourced at an appropriate level.
Other Stakeholders
General Public
• Personal safety as it relates to electricity assets.
• Effective emergency response procedures are functioning.
• Scanpower is easy to contact / interact with.
• Aesthetic impact of electricity assets is minimised, within reasonable cost boundaries.
Other Stakeholders
Land and Tree Owners
• Land access rights are respected and procedures observed.
• Easement rights are documented appropriately.
• Tree regulations are communicated clearly and understood.
• Tree related processes and work practices comply with regulations.

Page 29 of 220
Table 9 Continued – Summary of Stakeholder Interests
Stakeholder Nature of Interest / Desired Outcomes
Other Stakeholders
Disaster Recovery Agencies / Emergency Services
• As a utility operator, Scanpower participates in regional civil defence and emergency preparedness planning.
• Scanpower has appropriate disaster recovery and business continuity plans in place.
• Documentation such as outage planning and asset management plans are readily available.
Other Stakeholders
Regional Authorities
• District and regional council plans are complied with.
• Cooperation with other utilities (water, roading etc).
Whilst no formal weighting has been attributed to each of the stakeholder groups, the customer shareholders must rank highly as both the owners of the company and the purchasers of its services. From this perspective, the key needs arising from this analysis are therefore:
• A high quality, reliable supply of electricity
• A competitive service in terms of pricing and underlying cost structures
• A safe supply of electricity
• Responsive service and ease of access for interacting with the company In terms of the investor stakeholders, the Trustees of the Scanpower Customer Trust, the key needs arising are:
• The value of the investment in Scanpower Limited is protected and grown over the long term.
• The investment achieves an appropriate rate of return and the relationship between network pricing and annual customer discounts is balanced in a way acceptable to the Trust.
These factors, and other issues arising from the above analysis, are taken forward into the strategy formulation stage documented below.

Page 30 of 220
4.3 Corporate Level Strategy Formulation
Having considered the key needs arising from the stakeholder analysis, the explicitly stated details of Scanpower’s corporate level strategy (as approved by both the Scanpower Limited Board of Directors and the Trustees of the Scanpower Customer Trust) are detailed below.
4.3.1 Company Vision
At the top of the strategic hierarchy is the company vision statement; this is intended to encapsulate the type of organisation that Scanpower aspires to be and how it wishes to be seen. Scanpower’s vision statement is as follows: “Delivering more to our community by providing a high quality electricity distribution network and promoting economic growth”
4.3.2 Company Mission
The company mission is followed by its vision statement. This is intended to be a more explicit statement of the company’s fundamental purpose and its high level objectives. Scanpower’s mission statement is as follows: “To provide our region with a reliable, safe, cost-effective and sustainable electricity distribution network, whilst using our innovation and skills to develop new business and employment opportunities within our local communities”
4.3.3 Company Strategy
The corporate level strategy cascades down further into a more explicit set of high level organisational goals / strategic objectives. These are detailed below: 1. To deliver a reliable and safe supply of electricity to our customers. 2. To provide a cost effective supply of electricity to our customers. 3. To earn a commercially appropriate rate of return on our assets. 4. To generate additional earnings from other commercial activities. 5. To deliver financial benefits to our community via the network discount. 6. To add value to our region through our operating practices and community initiatives.
4.3.4 Company Strategic Objectives
Clearly it is necessary to take each of these strategies and both clarify and quantify (where possible) what the specific terms mean and what constitutes success in achieving them. For example, in the case of the first strategy relating to reliability and safety of supply, this can be broken down further into the following constituent detailed objectives:
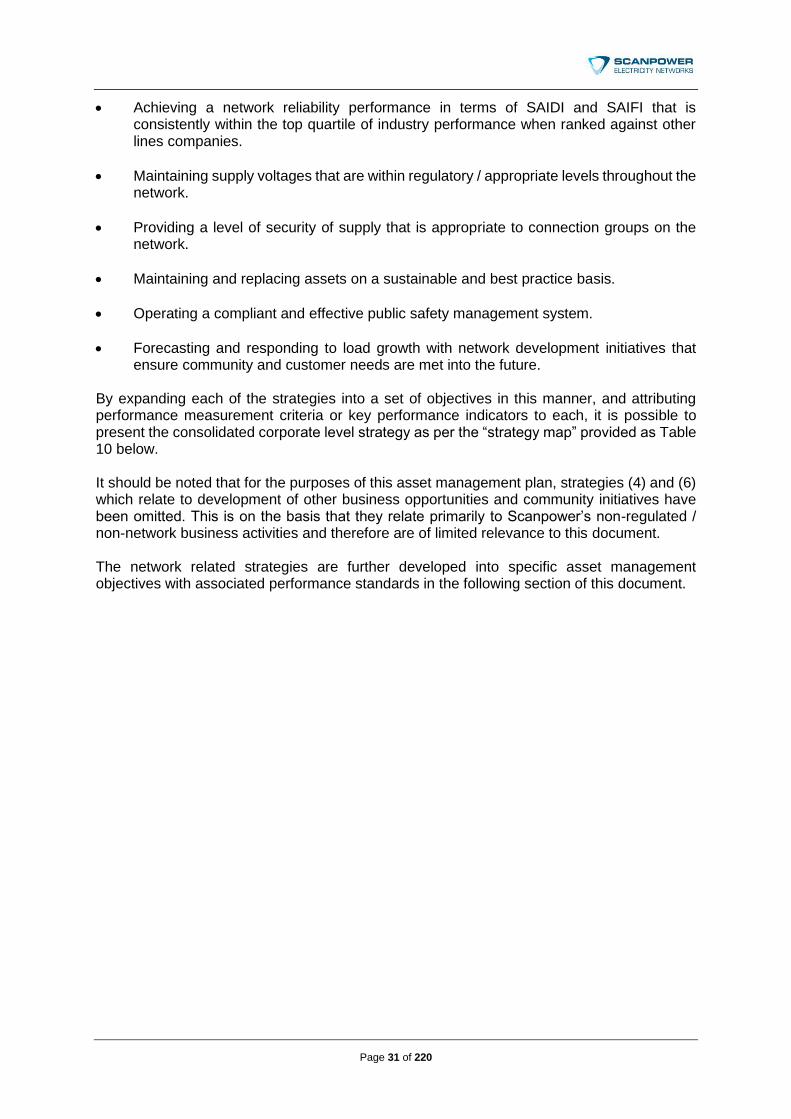
Page 31 of 220
• Achieving a network reliability performance in terms of SAIDI and SAIFI that is consistently within the top quartile of industry performance when ranked against other lines companies.
• Maintaining supply voltages that are within regulatory / appropriate levels throughout the network.
• Providing a level of security of supply that is appropriate to connection groups on the network.
• Maintaining and replacing assets on a sustainable and best practice basis.
• Operating a compliant and effective public safety management system.
• Forecasting and responding to load growth with network development initiatives that ensure community and customer needs are met into the future.
By expanding each of the strategies into a set of objectives in this manner, and attributing performance measurement criteria or key performance indicators to each, it is possible to present the consolidated corporate level strategy as per the “strategy map” provided as Table 10 below. It should be noted that for the purposes of this asset management plan, strategies (4) and (6) which relate to development of other business opportunities and community initiatives have been omitted. This is on the basis that they relate primarily to Scanpower’s non-regulated / non-network business activities and therefore are of limited relevance to this document. The network related strategies are further developed into specific asset management objectives with associated performance standards in the following section of this document.

Page 32 of 220
Table 10 Summary Corporate Strategy Map
Company Vision (What we aspire to achieve)
Delivering more to our community by providing a high quality electricity distribution network and promoting economic growth.
Company Mission (Our fundamental purpose)
To provide our region with a reliable, safe, cost-effective and sustainable electricity distribution network, whilst using our innovation and skills to develop new business and employment opportunities within our local communities.
Strategic Objective 1 - To deliver a reliable and safe supply of electricity to our customers
Detailed Objective Target / KPI
To achieve SAIDI and SAIFI results within the top half of industry performance.
• Use of industry benchmarking studies
• SAIDI < 172 customer minutes
• SAIFI < 1.530 customer interruption
Maintain supply voltages within regulatory / appropriate levels.
• Supply voltage maintained within +/- 5% tolerance levels
• Limit the number of customer voltage complaints
Provide a level of security of supply appropriate to various connection groups / sizes
• Appropriate security standards established and maintained
Maintaining and replacing assets on a sustainable and best practice basis
• ISO55000 asset management methodology adopted
• AMP feedback from Commerce Commission review and industry ranking relative to other companies
• Planned capital and maintenance activities completed within time and financial budgets
• Total asset life cycle management approach adopted
Operating a compliant and effective public safety management system (PSMS)
• Scanpower PSMS achieves Telarc certification for compliance
• Zero harm caused to members of the public
Forecasting and responding to load growth with network development initiatives that ensure community and customer needs are met into the future.
• Capacity exists to accommodate all reasonably foreseeable growth within appropriate timeframes whilst maintaining quality standards.
• Network development adopts lowest cost, effective solutions including consideration of distributed generation and demand side solutions.
To plan, design, construct, maintain and to disestablish assets that incorporates safety by design principles
• Provision of a construction and operation manual that is fit for purpose and is on a par with electrical industry benchmarks.

Page 33 of 220
Table 10 continued – Summary Corporate Strategy Map
Strategic Objective 2 - To provide a cost effective supply of electricity to our customers
Detailed Objective Target / KPI
For Scanpower customers to pay lines charges (excluding transmission costs) that having taken into account annual discounts are in the lowest quartile in the country when compared to other networks.
• Use of industry benchmarking and pricing studies
• Distribution revenue per ICP (post discounts)
• Cents per kWh (post discounts)
• Annual cost for 8,000 kWH pa consumer
To maintain financial performance in terms of operating expenditure that supports this pricing objective and is better than the industry average.
• Use of industry benchmarking and pricing studies
• Operational expenditure per ICP per annum
Strategic Objective 3 - To earn a commercially appropriate return on our assets
Detailed Objective Target / KPI
Achieve a return on investment from our network assets that is consistent with the expectations of shareholders and commercially appropriate relative to the industry in which we operate.
• Return on Investment (prior to discounts) of ~7.5% on regulatory asset base value.
Strategic Objective 5 - To deliver financial benefits to our community via the network discount
Detailed Objective Target / KPI
To return a level of financial benefit to the customer shareholders on an annual basis using the network discount mechanism that is consistent with the expectations of the Customer Trust.
• Annual discount payment equal to, or greater than, $1.65m per annum, equating to $325 each for typical residential customers.
It is this corporate strategy that feeds into the asset management planning process, setting the high level objectives and expectations of the network business. The next stage is to take this high level strategy and translate it into appropriate:
• Asset management policies.
• Asset management strategies.
• Asset management objectives.
• Asset management plans.
By following this process Scanpower aims to ensure that the organisation’s corporate level strategy, or strategic intent, flows through all asset management activities. This is covered in the next section of this document.

Page 34 of 220
5 PERFORMANCE OBJECTIVES AND SERVICE STANDARDS
This section of the AMP describes the service and performance targets for the strategic objectives set for Scanpower’s electricity lines business that are directly relevant to the management of the Network Division’s assets. There are four strategic business objectives derived in Section 4 of this Plan. Three are financial objectives and therefore not directly related to the management of physical assets deployed in the field. However, they are all influenced by the cost efficiency with which assets are managed over their life cycle and are dependent on the sustainability issues associated with continual development of the network to ensure the asset base itself is fit for purpose and efficient. The primary strategic objective related directly to the physical assets and their service delivery is: “To deliver a reliable and safe supply of electricity to our customers”
5.1 Asset Management Objectives
The subordinate asset management objectives associated with this business unit level objective are summarised in Table 11. Included in each case is the justification for each subordinate objective, a description of the associated asset management policies and targets / key performance indicators. It should be noted that targets applied at the planning stage are leading KPIs. Monitoring of subsequent outcomes is a lagging KPI.
Table 11 Asset Management Objectives and Policies
Asset Management Objective To achieve SAIDI and SAIFI results in the top quartile of industry performance
JUSTIFICATION
• These metrics are primary measures by which consumers can compare service with other companies and countries.
ASSET MANAGEMENT POLICIES
• To constrain all outages to under 6500 CML (customer minutes lost - equating to 1 SAIDI minute), through application of work practice innovation and technology deployment where justified.
• Security and reliability initiatives will be tested against an assessment of the Value of Lost Load (VoLL).
PERFORMANCE TARGETS / KPIs
• Achieve upper quartile performance per industry benchmarking studies.
• SAIDI < 172 customer minutes.
• SAIFI < 1.530 customer interruption.

Page 35 of 220
Table 11 continued – Asset Management Objectives and Policies
Asset Management Objective To maintain supply voltages within regulatory and appropriate quality levels
JUSTIFICATION
• The network is becoming constrained and modern power electronics in consumers installations is affecting power quality so more active monitoring and management is desirable.
ASSET MANAGEMENT POLICIES
• To maximise acceptable 11kV input voltage able to be delivered via Transpower’s voltage control equipment at GXPs – Scanpower has none of its own.
• To utilise and develop Load Management Systems, Special Protection Schemes, and DSM (demand side management).
• To require consumers to meet PFC, harmonic, and service line volt drop standards.
• To reuse or enhance existing technologies to increase the asset’s performance.
• To upgrade lines, install voltage correction equipment where required.
PERFORMANCE TARGETS / KPIs
• Supply voltage maintained within +/- 5% tolerance levels at the consumers’ POS (point of supply).
• Limit the number of customer voltage complaints to industry best practice.
Asset Management Objective To provide a level of security of supply appropriate to various customer connection groups / sizes
JUSTIFICATION
• Standards need to be meaningful to end users if they are to add value. This is primarily considered an issue of competiveness for local business.
• NOTE: Industry standards are based on load densities higher than those that bear any relevance to Scanpower’s load densities. That is, there is no part of Scanpower’s network that can justify N-1 security on the basis of load density. Consequently, Scanpower has re-defined its standard on the basis of economic impact such as CML which provides drivers for improving response times and establishing contingency provisions.
ASSET MANAGEMENT POLICIES
• To address security and contingency provisions for large users on a case by case basis.
• To develop LV interconnection in urban areas and contingent transformer and cable capacity.
• To increase the sectionalising capability into smaller network segments to achieve parity with other networks.
PERFORMANCE TARGETS / KPIs
• Appropriate security standards established and maintained.
Page 36 of 220
Table 11 continued – Asset Management Objectives and Policies
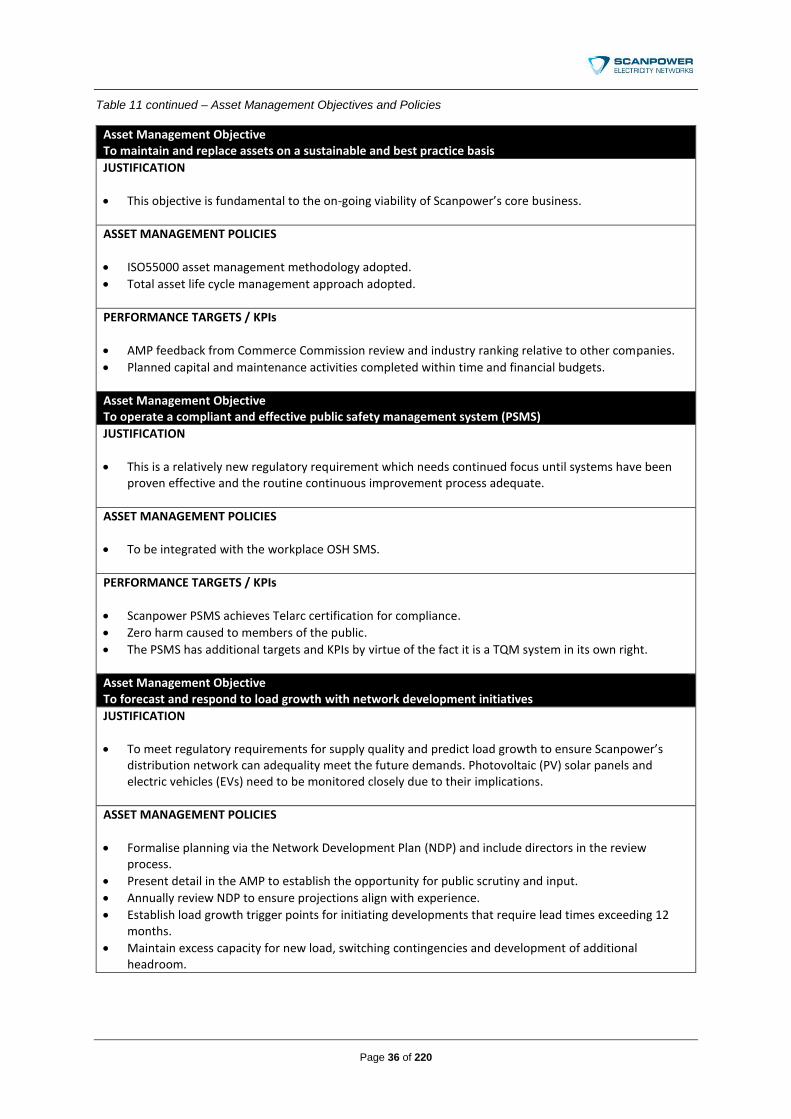
Asset Management Objective To maintain and replace assets on a sustainable and best practice basis
JUSTIFICATION
• This objective is fundamental to the on-going viability of Scanpower’s core business.
ASSET MANAGEMENT POLICIES
• ISO55000 asset management methodology adopted.
• Total asset life cycle management approach adopted.
PERFORMANCE TARGETS / KPIs
• AMP feedback from Commerce Commission review and industry ranking relative to other companies.
• Planned capital and maintenance activities completed within time and financial budgets.
Asset Management Objective To operate a compliant and effective public safety management system (PSMS)
JUSTIFICATION
• This is a relatively new regulatory requirement which needs continued focus until systems have been proven effective and the routine continuous improvement process adequate.
ASSET MANAGEMENT POLICIES
• To be integrated with the workplace OSH SMS.
PERFORMANCE TARGETS / KPIs
• Scanpower PSMS achieves Telarc certification for compliance.
• Zero harm caused to members of the public.
• The PSMS has additional targets and KPIs by virtue of the fact it is a TQM system in its own right.
Asset Management Objective To forecast and respond to load growth with network development initiatives
JUSTIFICATION
• To meet regulatory requirements for supply quality and predict load growth to ensure Scanpower’s distribution network can adequality meet the future demands. Photovoltaic (PV) solar panels and electric vehicles (EVs) need to be monitored closely due to their implications.
ASSET MANAGEMENT POLICIES
• Formalise planning via the Network Development Plan (NDP) and include directors in the review process.
• Present detail in the AMP to establish the opportunity for public scrutiny and input.
• Annually review NDP to ensure projections align with experience.
• Establish load growth trigger points for initiating developments that require lead times exceeding 12 months.
• Maintain excess capacity for new load, switching contingencies and development of additional headroom.

Page 37 of 220
Table 11 continued – Asset Management Objectives and Policies
PERFORMANCE TARGETS / KPIs
• Capacity exists to accommodate all reasonably foreseeable growth within appropriate timeframes whilst maintaining quality standards.
• Network development plans incorporate some efficient solutions using innovative techniques to allow for predicted load growth.
Asset Management Objective To plan, design, construct, maintain and to disestablish assets that incorporate safety by design principles
JUSTIFICATION
• Recent regulatory changes require safety by design principles to be incorporated in every aspect of an asset’s life cycle. The onus is on all divisional groups within an organisation to achieve these requirements.
ASSET MANAGEMENT POLICIES
• Formailse a safety by design guide for the company.
• Maintain Scanpower’s construction and operation manual.
• Develop policies on alternatives to Live Line practices.
PERFORMANCE TARGETS / KPIs
• A construction and operation manual that is fit for purpose and is on a par with electrical industry benchmarks.
• A reduction in Lost Time Injuries as a result of improved design and construction practices.
• Limited Live Line being used to maintain and replace assets.
Page 38 of 220
6 ASSET KNOWLEDGE SET
6.1 Service Area
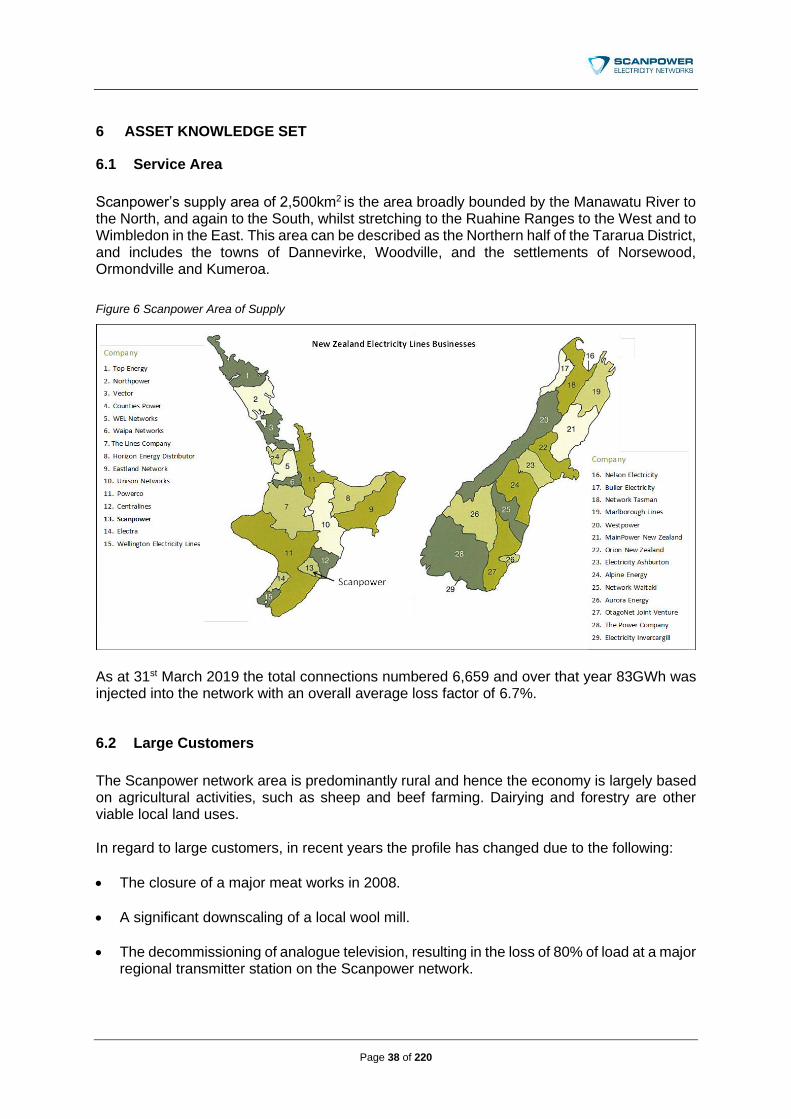
Scanpower’s supply area of 2,500km2 is the area broadly bounded by the Manawatu River to the North, and again to the South, whilst stretching to the Ruahine Ranges to the West and to Wimbledon in the East. This area can be described as the Northern half of the Tararua District, and includes the towns of Dannevirke, Woodville, and the settlements of Norsewood, Ormondville and Kumeroa.
Figure 6 Scanpower Area of Supply
As at 31st March 2019 the total connections numbered 6,659 and over that year 83GWh was injected into the network with an overall average loss factor of 6.7%.
6.2 Large Customers
The Scanpower network area is predominantly rural and hence the economy is largely based on agricultural activities, such as sheep and beef farming. Dairying and forestry are other viable local land uses. In regard to large customers, in recent years the profile has changed due to the following:
• The closure of a major meat works in 2008.
• A significant downscaling of a local wool mill.
• The decommissioning of analogue television, resulting in the loss of 80% of load at a major regional transmitter station on the Scanpower network.

Page 39 of 220
The impact of this has been that, at the time of writing, there is limited large commercial / industrial consumption on the network. To put this in in perspective, the details of the largest five consumers are as follows:
Table 12 Scanpower Major Customer Details at 31st January 2020
Customer Annual KWh GWh % of Total Peak Demand KVA
% Total Network Revenue
Small Meat Works 5,561,892 7.24% 1,215 3.95%
Lumber Mill 3,268,155 4.25% 507 2.98%
Cold Storage Business 3,700,673 4.82% 679 2.29%
Supermarket 1,167,222 1.52% 186 1.03%
Wool Factory 630,878 0.82% 415 0.88%
TOTAL 14,328,820 18.64% 3,002 11.13%
The next tranche of customers (in terms of size) below these are relatively small and include sites such as local fast-food restaurants, the swimming pool, and smaller retail premises. In general, at Scanpower’s scale of operation, the impact of the closure of one or more of the five largest sites would be financial (due to lost revenue). At this point, the company would face the decision of either accepting lower profits / returns or increasing prices across the remaining customers to ensure that status quo financial objectives are met. Having said this, no one individual customer within the group accounts for more than 3.5% of total network revenue. Therefore, the upside of limited industrial scale activity is that Scanpower has limited financial exposure to the closure of one of its largest customers.
6.3 Load Characteristics
Figure 7 illustrates daily maximum and minimum demands at the Dannevirke and Woodville grid exit points over the year 1st February 2019 to 31st January 2020. The overall profile is relatively flat, with the impact of irrigation starting to become apparent in the summer / early autumn months. The Woodville profile is similarly flat with a range of fluctuation of ~500KW in the daily maximums.

Page 40 of 220
Figure 7 Scanpower Load Profile Curves (Dannevirke and Woodville Points of Supply)
6.4 Energy Supplied and Demand
Table 13 summarises the key details of each of Scanpower’s 11kV feeders supplied by Transpower CBs at the Dannevirke GXP. Note that this is only a snapshot – comparison from year to year is not valid because load is shifted between feeders in order to manage constraints:
Table 13 Dannevirke Feeder Data
Feeder Name Description Rating Max Load
Pacific Rural feeder, mainly servicing industrial load 4.4MW 1.9MW
Weber Long Rural feeder servicing eastern extremity 4.4MW 2.6MW
Adelaide Rd Urban feeder into Dannevirke 4.4MW 2.9MW
East Urban feeder into Dannevirke 4.4MW 2.2MW
Central Urban feeder into Dannevirke 4.4MW 1.6MW
Mangatera Rural/Lifestyle/Urban feeder supplying Alliance 4.4MW 2.5MW
Te Rehunga Southern rural area feeder 4.4MW 1.9MW
North Rural feeder supplying Norsewood /Ormondville 4.4MW 2.3MW
Three 11 kV feeders radiate from the Woodville point of supply. Table 14 summarises the key details of each of these:

Page 41 of 220
Table 14 Woodville Feeder Data
Feeder Name Description Rating Max Load
Town 1 Urban feeder into Woodville / Eastern rural area 4.4MW 1.5MW
Town 2 Urban feeder into Woodville/Western rural area 4.4MW 1.1MW
Country Rural feeder to north of Woodville + Kumeroa 4.4MW 1.0MW
Figure 8 below provides the typical daily consumption profiles for the Dannevirke and Woodville points of supply across both winter and summer periods.
Figure 8 Typical Daily Consumption Profile (DVK and WDV – Winter / Summer)
Daily peaks are created by morning and evening residential load. The morning peak is larger because there is less diversity in its start-up and it is coincident with commercial and retail activity. Figure 9 below provides a snapshot, as at 1st March 2019, of the daily consumption profile by feeder.

Page 42 of 220
Figure 9 Consumption by Feeder as at 1st March 2019
Feeders with dairy load display very peaky load profiles at milking times. These feeders lack load diversity which limits load control options.
6.5 Network Configuration
6.5.1 Grid Exit Points
Scanpower’s network serves two main urban areas; Dannevirke and Woodville, and the surrounding rural areas. As shown in Figure 10, bulk supply is taken from Transpower’s 110kV Bunnythorpe / Fernhill lines via 110/11kV substations at Dannevirke and Woodville. The Dannevirke Transpower point of supply (POS) is approximately 6km SW of Dannevirke and has parallel 110/11kV 23MVA transformers, giving a firm supply of 23MVA compared with a maximum demand of 14MW Circuit breakers (CBs) are remotely switched from Transpower’s National Grid Operating Centre (NGOC). Eight 11kV feeders radiate from the Dannevirke point of supply. The transformer windings have tapping provisions to allow them to be reconnected as 110/33kV units should a significant load appear that requires sub-transmission support. Woodville’s Transpower point of supply is 3km west of Woodville and has parallel 110/11kV 10MVA transformers, giving an N-1supply of 10MVA compared with a maximum demand of 2.6MW. Woodville is also the generation injection point for the Te Apiti Wind farm and switching node in the regional 110kV network Details of energy flow in grid under various generation and contingency scenarios are described in Transpower’s Annual Planning Report.

Page 43 of 220
Figure 10 National Grid Configuration (Central North Island)
6.5.2 Sub-transmission
The Scanpower network has no 33kV sub transmission system. Its distribution lines operate at 11kV and 230/400V. The company has no zone substation assets. There is no N-1 security provision on any part of Scanpower’s network beyond the Transpower POS transformers. Without sub-transmission Scanpower’s network is limited to feeder loads in the order of 2-3 MW maximum. The thermal rating of Dog conductor is 4.4MW but the distance of load from the POS limits load as a result of voltage constraints. Consequently, any major new load exceeding these limits will need dedicated 11kV feeders to be developed back to the GXP with additional 11kV CBs provided by Transpower. Planning for such new load would therefore necessarily involve Transpower and be subject to their grid upgrade processes and time lines.
6.5.3 Distribution 11kV Overhead and Underground Lines
Scanpower’s core assets constitute an electricity distribution network of predominantly overhead/pole mounted 11kV lines/assets with historic maximum demand in the range of 15 - 16MW and a total system length of 1,050 kilometres. Figure 11 illustrates the geographic layout of the network.

Page 44 of 220
Figure 11 Scanpower Geographic Layout of 11kV Distribution Lines
Scanpower is ~90% through a life cycle renewal of the original hardwood pole population with concrete pole replacements. This program will continue until hardwood poles have been eliminated and then softwood poles will be targeted. It standardises on Dog, Ferret, and Gopher ACSR conductor but will continue to have a significant amount of copper and steel conductor types remaining over the term of this plan. One of the less typical features of Scanpower’s network is that it has very little single phase network and it has been historical practice to connect loads predominantly as 3 phase supplies in the rural areas. Consequently, it has a lot of very small 3 phase rural loads that cannot be rationalised to single phase installations without equipment upgrades and/or service line upgrades. This practice is the result of a need to minimise conductor size and capacity for economic reasons. It has a down-side in terms of efficient transformer utilisation. The economics of remote supply is shifting away from grid supply with the decline in the cost of alternatives. The new balance point will be determined by consumers as they renew/upgrade/modernise their installations.
6.5.4 Transformers
As at 31st March 2019 Scanpower has a distribution transformer population of 1,449 units (excluding spares) ranging from 2kVA to 1,000kVA capacity. At that date the total installed capacity was 72 MVA. The transformers are all standard oil immersed 11kV/400V units, with the majority (1,248) rated at 50kVA or less. Urban areas are supplied by larger transformers feeding LV reticulation. Distribution subs are typically ground mounted with a 200-300kVA transformer in a kiosk of various designs.
Page 45 of 220
Transformer HV pole-mounted fusing is usually provided at the point of connection to the HV network. There are fourteen 11kV ring main units on Scanpower’s street distribution network reflecting the fact that there is very little interconnection of the underground HV cable network – interconnection and switching is achieved via the overhead network. Rural areas have predominantly pole mounted transformers which supply a more limited group of ICPs given the distance limitations of LV reticulation. Very few transformers in the rural area are over 100kVA. A set of voltage regulators on the North feeder at Matamau were upgraded with larger units. These units were recovered from the Pacific feeder when they became redundant as a result of the Oringi Meat Works closure. The Matamau voltage regulators provide balanced 3 phase symmetric voltage correction. At the same time of installation, a new bussing point with two sub-feeders (“Norsewood” and “Ormondville” circuits) was created to give voltage correction to the northern area of the network.
6.5.5 Low Voltage System Overhead / Underground
The 400V network system consists of 187km of lines, 76km of which have now been installed underground. All customers on the network take supply at 400V with the exception of four (Alliance, Oringi Cool Stores/Business Park, Kiwi Lumber and Godfrey Hirst) which take supply at 11kV although they are metered on the LV side of their on-site distribution transformers. There is a very low level of LV interconnection and consequently very little excess or contingent capacity was designed into the LV network. It is now policy and practice to improve interconnection and cable capacity by installing intermediate substation sites as transformer and cable capacities become constrained. Without LV interconnection, faults on transformers and HV feeder cables result in high CML (Customer Minutes Lost) figures while repairs are undertaken. Scanpower has a relatively high number of ICPs per transformer in urban residential areas. Consumption per ICP is low and actual ADMD (After Diversity Maximum Demand) is below 1kW indicating that diversity and load factor at system level is high. This is considered to be largely the result of gas and wood fuel penetration into the domestic hot water and space heating market. It is viable for residential premises to fully meet their relatively low daily electricity consumption from PV (Photo Voltaic) installations. The peaky nature of this generation and the extent of its non-availability at night and low performance during winter, presents a load management issue as it will unbalance the existing capacity provision relative to load diversity. Currently, just under 49 PVs are connected to our network, with on average two new PV connections being made per annum. Scanpower also has two EV chargers installed on the Dannevirke and Woodville LV distribution network. There are no immediate concerns with capacity, voltage and power quality, however developing trends and emerging technologies are being closely watched. Scanpower is keeping in touch with the Tararua District Council (TDC) which has been driving the installation of EV charging stations. Key personnel at Scanpower has been going to related industry conferences and has been reviewing current

Page 46 of 220
standards. These have been part of a pre-emptive measure to mitigate the potential flow on effects of the emerging technologies. The company no longer pursues a policy of undergrounding in the urban Dannevirke and Woodville areas. This policy was abandoned as rising costs and reduced cooperation from other utilities reduced the viability of the work. Some undergrounding continues as opportunity presents and circumstances make this good practice with regard to long term outcomes.
6.5.6 Remote Area Power Supplies (RAPS)
Work has concluded with the installation of two Remote Area Power Supplies being installed on the outreaches of our network. These units consist of a PV solar array, lead acid batteries, a diesel generator and solar/battery inverters that are installed near the consumers point of supply. These units were installed as an alternative to replacing 6.4 km of HV lines that ran through a forestry block. The units were designed to accommodate the existing load profiles of our customers. Currently, these units supply a residential home and a cell tower site. The RAPS project has been challenging, and some initial learning has come from the design. However; improvements are continually being made to help enhance the customer experience. The Scanpower Board has approved the installation of a third RAPS site on Franklin Road allowing a further 1.7 km of high voltage line to be de-commissioned. This site is due to be commissioned in August 2020 at the request of the forestry block owner where the affected lines currently go through.
6.5.7 Distribution Equipment
A legacy feature of Scanpower’s network that differentiates it from an operational perspective is that it has retained its HV branch and group fusing and it uses this fusing as its primary means of switching and isolating. It has been late to take up distribution automation and supersede HV fusing with recloser and sectionalising equipment. It has not yet achieved optimal configuration at a system level and the density of isolation equipment for sectionalising the network into small segments is not as developed as its peers’. Consequently it has a low density of ABSs. These are limited to locations where 3-phase load breaking is desirable. There are eight Electropar automated load-break rated ABSs on the network. These are proving unacceptably unreliable. There are plans in the 2020/2021 capital renewal program to have all the automated switches upgraded. There are six peanut sectionalisers on the network; as with the Automates, they are also becoming unreliable. There are no active plans to replace the units, however options are being developed to either enhance the existing infrastructures or to install better performing technologies. Consequently, as the units come down, they are being kept for spares should the remaining units fail in the future. Scanpower owns fourteen ring main units (RMUs), with the majority being ABB SF6 Safe Links. Recently, there was a major fault with one RMU where the internal operating mechanism over travelled to the circuit earth position. That action effectively shorted out the Dannevirke GXP 11 kV bus. The fault was identified as a known manufacture defect, and provisions are being developed to rectify the remaining units.

Page 47 of 220
Reclosers and automated vacuum load break switches makes up the remainder of the distributed equipment. Scanpower currently owns thirteen reclosers and eight load break switches. These technologies have been performing well and it’s expected that several new reclosers will be installed within the upcoming years. To enhance branch and group fusing on the HV network, Fuse Savers have been deployed on the outskirts of the network. These units are placed in series with expulsion fuses and function as a one shot sectionaliser. They can clear transient faults before the fuse operates thus reducing the number of trippings caused by things other than network asset failure. This program continues but it has limited application i.e. it is not suitable in higher loaded, closed-in, meshed networks.
6.5.8 Secondary Assets
Scanpower does not own any feeder protection relays or any associated substation equipment like battery banks etc. This is because Transpower owns and operates all the feeder breakers at the Point of Supply. Any protection changes at a feeder level for example are required to go through Transpower for approval. Scanpower installed and commissioned its own private radio network during 2005/06. Vehicle radio communication operates via VHF mobiles and SCADA/Ripple communication is via UHF radio links. In 2012 it developed a new repeater at Ahiweka to improve coverage issues east of the Puketoi ranges and it has retained the Poupouatua repeater which better serves town and the valley between the Ruahine and Puketoi ranges. The standard life for this equipment is 15 years indicating that its replacement will be required within the forecast period of this plan. However, it is likely to reach technical obsolescence before age becomes an issue and therefore it is not known what it might be replaced with or its likely cost. The communication platform of smart metering (owned by others), for example, may provide an alternative to running a private radio system. Scanpower’s radio network is very simple – it does not have any linking between repeaters i.e. no backbone. Investigations have concluded that there is no clear advantage in adopting a digital platform due to the limited communication devices currently being used. Scanpower has been in communication with the Tararua District Council (TDC), and Downers who provide the TDC with their infrastructure management services. The TDC were initially looking at installing a tier 3 digital radio network, however Downers are taking the lead on this as part of their national network rollout. Downers’ tier 3 network design will cover 99% of all roads within the Tararua district. The system will consist of 6 repeater sites throughout the Tararua region that will be configured in a ring to provide extra redundancy. Scanpower would lease one of the six slots for primary open communication between staff. There would also be four available slots for peer to peer communication allowing Scanpower staff to have close communication in poor phone reception areas. In a regional civil defence emergency, all the slots would be opened to allow communication with other utilities like the TDC and civil defence. Scanpower is open to leasing 3rd party equipment as an alternative to owning and managing a radio network. In conjunction with Chorus and Downer, a new 2.3 km fibre tail from the Chorus network to the Oringi business park has been commissioned. The fibre is carried on Scanpower’s poles and enters the business park via the ground.

Page 48 of 220
In 2006 Scanpower installed and commissioned a new 283Hz Enermet ripple injection plant at the Dannevirke substation to replace the existing Zellweger static plant. Correspondingly, all ripple relay receivers at customer premises have now been upgraded to operate from this new system. In 2010 the existing plant at Woodville was replaced with a new 283 Hz system and all relays changed. This project was undertaken in conjunction with a major upgrade of the GXP substation by Transpower. In 2017, the Abbey master station and load management system was upgraded. As part of the upgrades, Scanpower can now modify the load management system internally without outside support. The SCADA system is used to operate and monitor equipment on the network including circuit breakers, sectionalisers and remote-control switches. The system provides real time load data and fault status information. It is also used for receiving data from Transpower’s feeder circuit breakers at the Dannevirke and Woodville substations. At present Scanpower is not able to operate the breakers remotely via the SCADA system, but this can be done by Transpower on request. The Scanpower Board had approved capital spend for the 2019/2020 financial year to install a new UHF link between Te Toke and Ahiweka (a 3rd party VHF network and Scanpower’s primary VHF network). This link will join the two VHF networks, (that have different coverage areas) together. This will allow direct communication between the control room and field staff in and around the Weber area, where coverage is currently limited. This link has been placed on hold while the Downer Tier 3 digital radio network is being assessed. The rationale being to reduce capital investment in an asset with no real operational advantage if the Downer tier 3 network goes ahead. The Scanpower Board has also approved capital spend for more “low voltage real time data loggers" for the purpose of monitoring the LV distribution network at critical nodes. These devices will give Scanpower visibility of the typical loads drawn from the LV feeders, which in turn will be used to determine the asset’s capacity and health. The data collected will be one of several inputs used in the investment decision process which will drive:
• Network development projects.
• Asset renewal.
• Network upgrades as a result of a customer-initiated works (CIW). Ten pad mount and five pole top data loggers have been successfully installed on the network. These units have been giving real time information about the utilisation of the low voltage network.
6.5.9 Non Works
Scanpower operates HV service lines as an integral component of the distribution network and meets obligations as an operator for these assets but not as the asset owner. It acknowledges that it is not the owner of these assets and they do not form part of its regulatory defined “works”. The regulatory responsibilities and associated rights applied to works do not extend to service lines. Specifically:
• Access and land use.
• Public safety
• Tree management

Page 49 of 220
• Compliance Scanpower adopts a ‘notify and make safe’ policy with regard to any non-compliance it discovers during the course of its operations. It does not undertake enforcement duties on behalf of the regulator. Scanpower incurs costs operating service line assets, for example responding to faults, but it does so on a discretionary basis and ‘average-costs’ these services into its larger asset base. This is another example of the regulatory model and business definition of an Electricity Lines Business not matching the operational reality for Scanpower. Management of the power supply beyond the extent of its network to the customer’s premises equates to approx. 15% of its network division’s operation.
6.5.10 Other Assets
6.5.10.1 Street Lighting
Scanpower owns the street lighting network that is embedded into its infrastructure with exclusion of the light fittings and dedicated street light columns. It also owns and operates the control equipment. All costs and maintenance associated with fittings and columns are undertaken by an external contractor for TDC. These contractors (and Chorus contractors) therefore access network assets. Policy with regard to cost sharing during undergrounding projects is ad hoc. In a Scanpower initiated project it may be optional to install street light cables and columns in exchange for footpath reinstatements.
6.5.10.2 Oringi
Scanpower owns and operates the Ex-Oringi Meat Processing Plant as an industrial park. It has inherited the 11kV and 400V distribution associated with the site. This includes an 11kV switchboard of GEC oil filled CBs. The site is fed from two main 11 kV lines with a normally open ring. There is sizeable refrigeration and water supply pumping assets owned by Scanpower at this site and load has grown over recent years as the site’s tenancy has developed. Currently there is no major load growth predicted at Oringi, however any unexpected load growth could be responded to within three months. Due to the age of the switchboard, replacement options are being considered. The replacement will be worked in conjunction with the property team, its asset replacement schedule, and the expected tenancy changes. As part of the network development programme, the Oringi 11 kV switchboard is due to be replaced with an outdoor high voltage ring using ring main units in the 2024 and 2025. More information is given in the network development plan.
6.5.10.3 Land
With no zone sub-stations the majority of Scanpower’s assets are located within road reserve or on land with use rights established under the Public Works Act. There has not been significant new network built on private land since this time. Scanpower does not require easements for new supplies for individual customers and it does not assert land use rights on
Page 50 of 220
their behalf. It does not claim ownership of service line assets and/or require their gifting to the network.
6.5.10.4 Tree Cutting Plant and Equipment
The district lacks resources for tree cutting services. This has created some challenges for Scanpower and tree owners with regard to managing trees clear of lines for both safety purposes and outage performance objectives. Consequently, Scanpower has made a significant investment in plant to support a tree service business it operates called Treesmart. The Network has a direct role in the use and funding of this asset.
6.5.10.5 Live Line Plant and Equipment
The Network division within Scanpower doesn’t have any “Glove & Barrier” or “Hot Stick” capabilities. It was decided at a corporate level to outsource any live line work to the Contracting division. Changes in health and safety legislation are now requiring justification for what the industry is perceiving as high risk work. This, along with the training, competency requirements and overall expense of maintaining live line equipment has made it difficult to justify the need for live line work. Hence, all the equipment owned by the network division has been sold off to Contracting. Scanpower is currently developing a justification process for live line in conjunction with industry groups. The main objective for live line is to install mid span isolators to reduce a shutdown area, or for simple tasks that would normally, under de-energised conditions, have caused major disruption for the network customers. Scanpower still sees a need for live line, as it’s a useful method for maintaining performance targets.
6.5.10.6 Mobile Supply Equipment
Scanpower owns a 100kVA diesel engine generation set mounted on a trailer. This is domiciled at Oringi where it provides standby power for Scanpower’s and Downer’s offices and the Control Room. It is able to inject at 400V back into isolated network segments via back-feeding a suitably sized distribution transformer. This also provides some outage management capability for network renewal in spur-connected areas. Scanpower is currently investigating options for purchasing more generators. Generators in conjunction with ABS installations are being considered as an alternative to live line. Scanpower is currently gaining expertise in managing and maintaining generators with the addition of the RAPSs. Scanpower is also looking at options for purchasing a transformer and recloser that can be used with the generator. This will allow the network team to use the generator for large scale back-feeding, while providing additional protection to the 11 kV network. Standard designs have accommodated pole connectors to be integrated within all new 400V pad mount kiosks, meaning in the event of a transformer or HV cable fault, the 100 kVA generator can be setup to back-feed the affected customers within an hour.

Page 51 of 220
Scanpower has also installed a backup generator to supply the control room and server room that houses the IP phone system. This means in the event of a loss of supply at Oringi and if the 100 kVA generator is off site, the control room and phone system can still be operated.
6.5.11 Other Generation
There is currently no significant generation on the system, just a few small microgeneration schemes (capacity not exceeding 10kW) but Scanpower can claim to have a fuel cell connected to its network (a Massey University research project). Scanpower itself has a 14 kW PV array on its offices but this is embedded behind its network connection and of insufficient size to ever inject back onto the network.
6.6 Justification for Assets
Scanpower meets the service levels required by its customers by carrying out a number of activities on its network assets (such as those detailed in Section 6), and including the initial step of actually creating / building these assets. Certain assets are required to deliver greater service levels than others, and the level of investment required will generally reflect the magnitude and nature of the demand being met. Matching the level of investment made in assets to the current and forecast service levels required necessitates consideration of factors such as:
• An understanding of how asset ratings and configurations create service levels such as capacity, security, reliability and voltage stability.
• An understanding of the asymmetric nature of under-investment and over-investment; i.e. over-investment creates the capability to meet service levels before they are required, whilst under-investing can lead to service failures and interruptions.
• A recognition that the existing network has been built over an 80 year period via a series of incremental investment decisions that were probably optimal at the time, but when taken in aggregate in the present may have been sub-optimal.
• A need to accommodate future growth (noting that the ODV Handbook now prescribes the number of years ahead that such growth can be accommodated).
In theory an asset would be justified if the service level it creates is equal to the service level required. In a practical world of asymmetric risks, discrete component ratings, non-linear behaviour of materials and uncertain future growth rates, we consider an asset to be justified if its resulting service level is not significantly greater than that required subject to allowing for reasonable demand growth and discrete component ratings. In the past a regulatory ODV revaluation exercise was undertaken as at the year-end 31 March 2004 for financial reporting and regulatory compliance purposes. The basis for this valuation was the draft ODV Handbook issued by the Commerce Commission and current at the time. The total replacement cost of Scanpower distribution assets at this date was $40,443,825 and the depreciated replacement cost (DRC) was $19,823,274. A key practical measure of justification is the ratio of Scanpower’s ODRC to DRC which, per our most recent ODV Report, is 0.9992. There were no in service assets deemed to be surplus

Page 52 of 220
to requirements at the time of the valuation and therefore there was no optimisation adjustment to this value. The Scanpower assets that required an optimising adjustment at that time were some older network spares that have now been scrapped. Economic value testing of the assets, performed at the time of that regulatory ODV report, by way of discounted cash flow analysis suggested there was no impairment or EV adjustment necessary, hence the optimised deprival value of the assets was calculated to be the same as the DRC at $19,823,274. More recently, the discounted cash flow (DCF) valuation was carried out on this network. The projected income was analysed and discounted back into today’s currency to work out the capital value of the network. This showed that Scanpower’s assets are valued at $37,300,816. this approach is intended to test if there is any economic impairment on the network assets resulting from consumer shifts to new technologies or lower electricity consumption levels.

Page 53 of 220
7 ASSET INFORMATION SYSTEMS
7.1 Cablecad Geographic Information System (GIS)
This is a geographic information system that provides an electronic, graphical representation of the Scanpower network. Its main utility is a connectivity model of the network which allows datasets to be extracted on the basis of their electrical connection to other assets. It includes assets such as transformers, distribution boxes, poles, lines, switches, cables and isolating fuses. The system is used to draw/record network plans for capital replacement and maintenance works, including overhead line replacement and laying of underground cables. It is also used to store the age and condition of network assets using the results reported from the relevant assets inspection program. A support agreement is in place with Enghouse in Canada and on-site technical support is provided from Auckland. As described in section 7.8, the existing GIS system will be replaced with Milsoft and ArcGIS. Section 7.8 gives more details around the rationale for the upgrade. It is intended that Cablecad and ArcGIS are used in parallel through the transition period.
7.1.1 Valuation
The GIS, being the repository of asset data, acts as the platform for serving data into other customised applications such as the spreadsheet tool Scanpower uses to calculate its network value. Initially valuation methodology was a prescribed and regulated process with asset classification, optimisation and values provided by the Commerce Commission per their Handbook for Optimised Deprival Valuation of System Fixed Assets of Electricity Lines Businesses. This defined the assets that constitute the Regulatory Asset Base (RAB). In order to get better alignment with accounting practice treatment of capital expenditure and the price path control of lines businesses, regulation has moved on, and now our RAB is based on historical accounting values, calibrated every few years by a formal valuation process but updated with annual adjustments for actual capital expenditure made each year. The original data fabricated to create the ODV (which is a tally of the physical asset and its modern equivalent asset replacement cost, depreciated over a prescribed standard life) always had an issue of not matching the accounting practice for valuation and the tax rules around depreciation. As these original assets are replaced, data becomes more accurate with regard to cost and life cycle. Accordingly the engineering/physical valuation is now more closely in alignment with the accounting/financial valuation. 2016 is the year that Scanpower was required to update its valuation. Accordingly we have made a number of improvements to our asset database that allows better alignment of the accounting treatment of capital expenditure on network renewal and development. Specifically: The ODV methodology treats lines and the structures that support them as a single asset group with a homogenous design over a fixed network segment. Accounting and tax practice treats conductor and pole structures as different assets with more resolution over size,

Page 54 of 220
material, design, etc. and depreciates these at different rates. This is more in line with actual asset management practices i.e. pole structures within a line segment get changed at different times, to different design standards, and independently to conductor renewal/upgrade. As Scanpower’s asset database already has pole and conductor information treated separately it has enhanced the valuation to a structure by structure, span by span level of detail. Accordingly it has created its own set of modern equivalent asset values for the standard pole structures and construction/design standards it actually builds to. This includes values for the other equipment, such as reclosers, ABSs, distribution subs, etc., it has standardised on through its life-cycle asset management role. That is, the structures have been rationalised to reflect the optimal design that we build today but without the betterment we might apply such as replacing a wooden pole with a concrete (the valuation still depreciates a wooden pole as a wooden pole). These values include installation components of labour, plant, management overhead, etc. So as not to be totally ring fenced by its own asset management process efficiency, values have been calibrated against the original Handbook prescribed values (which are “green field”) but adjusted for inflation. Interestingly the modern equivalent assets, being the most optimal solution, tend to be lower valued than the historic asset. For example, a concrete and hardwood pole do not vary that significantly in cost but the concrete pole has a nominal life that is 33% longer.
7.1.2 Service Lines
Scanpower’s asset management strategic planning process has determined the desirability of being able to manage service line assets more proactively on behalf of the consumer. To do this it needs the same level of data required to manage its own assets. Accordingly, it has initiated a data capture project with regard to the poles, wires and their condition that constitute the non-network assets of the distribution system i.e. the entire delivery system from the grid to the consumers premises – this equates approx. 15% of the distribution system.
7.1.3 Network Connection Database
Scanpower has enhanced its process for managing network connections in terms of design, compliance, and capacity. It now reviews these issues not only whenever a new connection is requested but whenever there is need for upgrade and/or the details of the connected load change. This is achieved by close management of service fuse size. It ensures capacity is not exceeded by unseen additional load and voltage standards are maintained. It also means that connection agreements are updated, and legacy terms are not perpetuated allowing new standards to be introduced. This has resulted in enhanced database records for both the GIS and the Network Connection Database. The GIS now has connectivity being populated from Service Fuse through to ICP with details of the physical assets in between. The Network Connection Database records the key connection data such as the loading (motor sizes, soft-starting, PFC, etc.), installation classification (e.g. commercial, dairy shed, etc.) and capacity limitations (cable rating, volt drop, fuse size). These two data bases overlap in the information they share and will ultimately be merged.

Page 55 of 220
7.2 NCS (Napier Computer Systems) customer/ICP information database
This was the legacy main financial recording system for Scanpower when it operated in the energy supply sector which has now been superseded by new accounting software. It held information needed for metering services and meter reading. This information has been migrated to a number of databases such as Scanpower’s records of customer connection information and is used to generate ICP numbers for new connections. The Network Division provides field services to retailers and metering companies. These companies have a number of their proprietary systems for requesting and managing service delivery. This activity is changing rapidly as the industry migrates to advanced metering infrastructure (smart meter platforms). The retailers also have a number of systems that Scanpower must interface with in order to bill them for the line function services it provides electricity consumers via its Use of System Agreements with each retailer.
7.3 National Registry
This is the national system through which all electricity connections (ICPs) are recorded and reconciled. It also records the current energisation status of ICPs on the network (e.g. energised, de-energised, or decommissioned), the network connected to and the retailer supplying them. It is a cloud resident system.
7.4 SCADA System Records
The SCADA system is licensed from Arthur D Riley and is operated / located in the Network Control Room at Oringi. Arthur D Riley bought out Abbey Systems in late 2017. This system is used for real time monitoring of the network, including feeder loadings, operation of remote control equipment on the network and load control information. During 2017, the master station and load management system was upgraded. This allowed Scanpower to programme the load management system in-house and has now reduced the risk of losing automated control of the network due to legacy equipment. Technical support is provided by Arthur D Riley in Wellington and Hamilton. Scanpower is internally developing its own first response capabilities due to the remoteness of the automated equipment. During 2012, remote laptop access to the Master Station was established for duty controllers to operate from home during after-hours. A back-up control room is being re-established due to the closure of the Gordon St office. Controllers can also access the SCADA system via their mobile phones. Technology is becoming increasingly more integrated, accessible and mobile. For example, mobile phones allow those involved in after-hours operations to receive information from the after-hours call centre in regard to fault reports and dispatch.

Page 56 of 220
NavMan units have been fitted in all Network and Contracting vehicles, with some also having two-way messaging capability. This aids crew dispatch and helps management of lone worker scenarios. Ten pad mount and five pole mount low voltage data loggers were installed in 2019 as part of the network development programme. As a result, Scanpower is starting to gain some visibility of the low voltage network. These loggers were installed on transformers that supply fast EV chargers and down Oringi Road where the new Static Var Generator has been installed. These loggers use the local 3G network to transmit the data to the cloud where it can be accessed by the network team.
7.5 Proprietary asset databases
This category of information systems refers to a suite of proprietary asset databases, created in Microsoft Excel. These often serve as intermediary stages in the data collection or reporting of financial accounting, tax accounting, ODV and other information disclosure requirements.
7.6 Design Tools
In 2013 Scanpower purchased several licences for CATAN which is a pole line structural engineering tool that the majority of NZ line companies now use – more specifically Scanpower’s neighbouring networks Powerco and Unison, so it can be shared by Scanpower’s Contracting Division when they are designing for these networks. It also enables Scanpower to share the materials libraries these networks load into their CATAN setup. Work continues with the standard assemblies and construction manual. AutoCad is being used to draw the standard assemblies which detail the materials, dimension and construction method. This manual will form the basis of our Network Materials Specification which is a key document for ISO55000 design and quality control as well documenting design and safety by design compliance. It will also feed into the Bill of Materials specification for the Work Order process and stores procurement process. In 2017, Scanpower acquired an enhanced spreadsheet for calculating volt drop in service designs. This spreadsheet has reduced the need for interpreting several factors when developing a design. This tool is also used to model an existing LV distribution network, and the effects of increased loading for new connections. Scanpower is continuing the process of developing a protection and load flow model of its HV network using Elplek. Currently the Woodville GXP, the Te Rehunga and Pacific Feeders have been modelled. A spreadsheet using ICP information was developed that classifies each distribution transformer on a specific feeder into the following load types:
• Residential;
• Dairying;
• Pump & woolshed;
• Commercial, and;
• Large known load users. This information was then used in conjunction with the feeders “maximum demand” and a “maximum demand contribution factor” to estimate the ADMD between line sections. This information was then inputted into the load flow model which allows electrical simulations of the network in different configurations to be modelled.

Page 57 of 220
As part of this project, the existing spreadsheet tools for protection coordination were enhanced which:
• Improved the protection grading design of new and existing assets and;
• Allowed a means of recording existing protection settings. As depicted in section 7.8, the existing GIS system will be replaced with Milsoft and ArcGIS. One major advantage with Milsoft is the integration of the ArcGIS and windmill (load flow and fault analysis tool). This means changes made in the GIS system are automatically updated in the windmill. ICP yearly consumption along with SCADA systems load data can be loaded to windmill to give accurate load distribution and voltage drop data across the Scanpower network. In turn more accurate modelling can be completed in a fraction of the time, improving the productivity of the planning team. The 10-year growth forecast can be completed by analysing the “what if” scenarios around penetration of EVs and PV, which in turn can determine what level of network development is required. The load increase of every new connection can be modelled to see the effects upstream on the 11 kV feeders and thus capital contributions can be evenly split between the customer and Scanpower. Being a small team, the Milsoft product offers the efficiency and productivity required for the planning team to effectively manage the network as is and mitigate against future technologies. Section 7.8 gives more details around the rationale for the upgrade. It is intended that Cablecad and ArcGIS are used in parallel through the transition period. In the interim, Elplek and the load distribution spreadsheets will be continued to be used until the new system is operational.
7.7 Linkage between Data Systems and Asset Management Processes
The asset information systems store and provide data that assists Scanpower in planning which capital and maintenance works to undertake so as to ensure network objectives are met. Figure 12 shows the information flow and systems.

Page 58 of 220
Figure 12 Information Systems / Flow Schematic
Figure 12 is the final version that Scanpower envisages the flow of information between systems to take. Milsoft, ESRI and the maintenance management system are yet to be implemented. The current GIS system still feeds the AMP, Information Disclosures and Magiq.
7.8 Asset Management Information Systems Review
No improvement to the asset management capability is claimed since the Asset Management Maturity Assessment Tool (AMMAT) assessment published in the 2016 AMP. Scanpower has not pursued ISO55000 accreditation at this time because it is working through a revision of operating systems following the HSAW Act, Revision 3 of the SMEIs and related practice changes being enforced by Worksafe. The change of Network Manger has also hindered this process. The following will be a recap from the 2019 AMP with an update following changes within the business. As part of the ISO55000 Asset Management process, the Network’s Asset Management Information Systems (AMIS) are reviewed on an annual cycle. A needs analysis is undertaken by the Network Manager to provide a strategic benchmark against which Scanpower’s existing AMIS elements and datasets were assessed with regard to:
• Continued development and enhancement of existing systems.
• Reassessment/confirmation of the current development path specifically with regard to change in staffing structures and associated work processes.
• An assessment of the market with regard to the competing leading solutions and their fit to Scanpower’s needs i.e. what applications are developed, implemented and proven in NZ power companies.
The conclusions of this review were:

Page 59 of 220
• In the 2012 review, Scanpower terminated its development of EMS Basix – it did not fit sufficiently to Scanpower’s needs analysis, priorities or development cost/time performance requirements. The incompatibility for EMS Basix to integrate with the legacy CableCAD GIS was a primary issue. The alternative market solutions also shared this issue.
• In 2017, Scanpower changed its financial system over from EXO to Magiq. The rationale for this was due to the ongoing maintenance costs of EXO. Advantages in Magiq included better accountability of purchase orders, increased reporting capability for tracking budgets and softcopy storages of invoices and receipts allowing more efficient accounting practices. The Network division is currently adopting the new system into its management system.
• Magiq is still being developed to allow standard assemblies to be added. This will help the Asset Management (AM) cost planning. It is hoped that it will allow the accumulation of historical actual cost records such that the average unit cost to be derived. This will allow the actual costs to be reconciled with the monthly budgets.
• One key project for the 2020/2021 financial year is to copy the network’s asset repository into Magiq. This will allow the network’s regulatory value to be more efficiently determined. This process will do away with the traditional excel translation programs that calculated the regulatory value directly from the GIS data. This also has the added benefit of allowing job costing for capital projects to filter directly into the network valuation.
With regard to AMIS priorities such as a Maintenance Management System (MMS) it was determined that existing RDMS platforms were adequate to meet Scanpower’s relatively simple needs. These can be enhanced with a scheduling tool to systemise the work flow process. In mid 2019 Scanpower engaged an ICT consultant to assist with:
• The executive team and their departments with: o The day-to-day ICT operational issues (tablet platforms, applications, cloud,
server, workstation etc.) and. o With the ICT component of each department’s long term strategic plans.
• Reviewing Scanpower’s ICT systems, governance, strategic plans, policies, objectives etc.
• Identifying synergies between departments to eliminate repetition of work (i.e. vehicle maintenance systems, pricing systems etc).
• Reviewing the ICT component of Scanpower’s BCP, disaster recovery plan (DRP) and emergency response plan (ERP).
• Producing a strategic ICT roadmap for future projects.
As part of the BCP review work undertaken, the network’s Cablecad GIS system was identified as a business critical application and is essential for:
• Operating the network effectively and safely.
• Preparing asset management plans.
• Preparing various compulsory / regulatory information disclosures.
• Feeding fixed asset data into the company’s financial records.
Page 60 of 220
• Producing maps / schematics / single line diagrams.
• Managing and recording customer outages.
• Serving as the primary repository / database for network asset information.
• Providing staff, contractors, customers and other interested parties with accurate asset information.
Due to the critical items that this system delivers to the network, it was deemed as a high risk item to the business with the recommendation of urgent replacement because of the following reasons.
• It has been in service for >10 years and correspondingly is technologically obsolete and has reached the end of its life.
• No further software developments are being introduced.
• It cannot be cloud hosted (i.e. will only reside in a traditional server environment).
• It is incompatible with modern desktop operating systems and is unable to integrate with other applications (for the purposes of achieving automation and efficiencies).
• It is highly resource hungry due to its manual maintenance processes (1 FTE).
• It is now only supported by one person in New Zealand (in the event that something goes wrong).
• Full or partial loss of data and / or functionality of the GIS system would have a significant and adverse impact on Scanpower’s business
As a result, the Scanpower Board in September 2019 gave approval for the network division to scope and identify an alternative replacement for the current system.
7.9 Justification for An Advanced Distribution Management System
The management of the electricity distribution network is continually changing with:
• Increasing pressures from compliance and reporting requirements.
• The future effects of distribution generation, PVs, EVs.
• The need to predict and manage their effects on the distribution networks.
All this leads to accurate information being required to support decision making. In order to have accurate information, systems and tools are critical. In replacing the GIS system, the key objective of this project is to deliver a modern GIS / asset information system that:
• Is fit for purpose and appropriate to Scanpower.
• Has a track record of proven performance within the electricity distribution sector.
• Has robust customer / technical support structures in place.
• Demonstrates a roadmap for application development / integration with other apps.
• Has complimentary modules and functionality available. With the aim of delivering the following benefits:
• A stable asset information / GIS platform for the Network into the future
• Reduction of a significant current risk.
• Improved understanding and management of network assets.
• Clearer identification of critical network assets and prioritisation thereof.

Page 61 of 220
• Real time integration with mobile devices so that changes in the field are updated immediately.
• Improved network modelling, analysis, outage planning and regulatory reporting.
• Integration of data with other business applications (e.g. financial systems). Though the original business case was centred around the GIS replacement, Scanpower took this opportunity to look at different ICT solutions that will offer benefits to the future challenges. Options included:
• Distributed energy resource management
• Network modelling (Load Flow, Harmonics and Fault Calculations)
• Outage management & planning.
• Load controlling.
• Network reporting. To ascertain Scanpower’s business needs from systems and tools that allow management of network assets, the project team completed a requirements workshop. Following the workshop, it was agreed that the following items represents the high-level functional criteria required of systems to support Scanpower’s network assets:
• Asset Information Recording
• Automation paper based systems
• Integration with other systems
• Mobility (As building in the field)
• Reporting functions (SAIDI & SAIFI)
• Control room management
• Network modelling (Load Flow)
• Minimal customisation
• Outage management system
• Ability to store network loads Scanpower gathered an understanding of all GIS systems in use across the NZ electricity distribution networks and expanded the search to some GIS solutions outside the electricity industry. A selection process was undertaken while trying to understand which systems are designed for Scanpower’s business size, scale and industry. Scanpower interviewed three other networks to see their GIS and ADMS systems in action to see whether they were scalable to Scanpower requirements. As a result of the research, four replacement options were considered: Option 1: Status quo (Do nothing) Option 2: Do the minimum (Replace with specialised GIS solution) Option 3: Intermediate (Implement Advanced Distribution Management System solution
that includes GIS) Option 4: Aspirational (Replace with fully featured Advance Distribution Management
System that includes a distributed energy resource management system) Do nothing is not a viable option. A minimal approach would reduce business risk, however lacked any future proofing, benefits or efficiencies that an intermediate approach would offer. An aspirational approach was considered too big for the scale of Scanpower’s network and that Scanpower did not have the resource to run or maintain such a system. Option 3, Intermediate was agreed as the preferred way forward because it:
• Meets all the mandatory requirements
• Provides the tools that allow Scanpower to better manage the network.
• Provides Scanpower the ability to model and predict outcomes based on loads.

Page 62 of 220
• Provides Scanpower a platform to support emerging technologies (such as EV and self-generation) that will become more mainstream over the next 10-15 years.
• Removes the potential for errors due to the manual calculations of SADI & SAFI numbers.
7.10 Improvement Priorities
In late January 2020, the Scanpower board approved the business case to install a new GIS and ADMS system to replace Cablecad in the 2020-2021 financial year. Based on the research as described in Section 7.9, Milsoft has been chosen for the GIS replacement. It is expected that the implementation of all the core base features will take 36 months. It is envisaged that to fully deploy and embed all the features of the modern network management system will span a five to six year period. Currently Mango which is Scanpower’s total quality management tool is used as its Maintenance Management System. As a quality tool, Mango is not suitable for a maintenance management function, thus during the 2020-2021 financial year, the newly employed Asset Information & Reporting Analyst will be tasked with developing a system using Microsoft office 365 share point and the family of applications. Due to Scanpower’s simplistic maintenance requirements share point will be an adequate tool. Scanpower has looked at other utility’s tools, however the cost of the standard systems along with the extra functionally that is redundant for Scanpower’s needs has justified using share point. Scanpower’s needs regarding the AM data it does not currently have include:
• The continued development of libraries in CATAN for our Standard Structures/Assemblies;
• The continued development of the remaining Dannevirke GXP feeders electrical protection and load flow models in Elpek. Once finished, this tool will enable long term strategic issues to be modelled, like the effects of the dairy sheds snap-chill conversions.
• The continuation of the data capture projects in progress including service lines, connection data, etc;
• To maximise the implementation and usefulness of the standard assembly exercise completed for valuation purposes – which involved the creation of records assigning standard assemblies for HV and LV crossarm structures, equipment assemblies, and other structure attachments such as foundations and staying – it is proposed to photograph each pole structure. Google Earth’s Street-view is limited to roadside poles.
• Installation of smart metering at key network nodes and an enhanced Load Management System on Scanpower’s SCADA are also priority objectives for development in its AMIS. As indicated in this AMP, there are plans for the 2020/2021 financial year to install extra devices around critical nodes within the network.

Page 63 of 220
7.11 Technical Standards and Guidelines
Several of Scanpower’s management processes – safety, asset management, risk management, etc – are, by definition and regulatory requirement, Total Quality Management (TQM) systems. These systems are built on a foundation of standards and procedures. Managing this documentation in a small organisation such as Scanpower is becoming a significant operational overhead. Consequently, Scanpower has moved the document management and TQM record keeping processes to an electronic platform. This platform is known as MANGO – it is cloud resident and accessible across all Scanpower’s operational division and their diverse locations. MANGO is essentially a series of modules that provide an engine for any ISO structured management system. Its primary application has been Safety Management, Asset Management, and Human Resource Training & Competency Management. MANGO is administered by the Health & Safety Manager, whose duties, in addition to a full corporate wide health and safety brief, extend to training program management and site property management for Oringi Business Park (one of Scanpower’s investment properties). With regard to the Network Division, he provides an internal audit function, document management/publishing, incident investigation, liaison on traffic management, ACC accreditation, Support with Public Safety accreditation, trainee programs, etc. Scanpower has a variety of technical standards and practice guidelines that it has largely adopted from other industry participants. Its involvement in the industry and contracting for other networks makes this a pragmatic solution to a lack of capacity in this area – Scanpower is simply not large enough to justify the expertise and resources needed. Scanpower also utilises Guidelines produced by the Electricity Engineers Association and aims to align as much as practical for the nature of its organisation practices where there is broad industry consensus. It is active in consultation and workshops that lead to the development of industry standards and practice guides.
7.12 Maturity of Information (AMMAT)
Schedule 13 of the Information Disclosure templates requires a self-assessment of the maturity of Scanpower’s asset management processes and systems. Such assessment and subsequent continuous improvement programmes are consistent with the ISO55000 best practice standard for Asset Management. 2013/14 was the first year this Information Disclosure requirement was made. Consequently, there is variance in the interpretation of assessment guidelines across Electricity Line Businesses (ELBs). This has prompted an industry workshop lead by the Electricity Engineers’ Association to better develop guidelines. During 2014 Scanpower had its Asset Management Systems maturity externally audited and assessed against the ISO55000 standard. This assessment provides Scanpower with a benchmark for development of its AMS towards ISO55000 accreditation. This is a more detailed assessment than the prescribed AMMAT – the results are provided below and included a cross-reference to AMMAT. ISO55000 assesses maturity level in accordance with Figure 13.

Page 64 of 220
Figure 13 Knowledge Maturity Scale
Scanpower’s current compliance status by practice area is illustrated in Figure 14. Maturity is currently sitting between Level 2 Developed and Level 3 Competent.
Figure 14 Scanpower Maturity Assessment
The ISO 55000 elements align approximately with the AMMAT elements as shown in Table 15.

Page 65 of 220
Table 15 Alignment of ISO 55000 to AMMAT Questions
ISO 55000 element Abbreviation AMMAT questions
Organisational strategy & management OSM Q3, Q10, Q11, Q26, Q27, Q42, Q53
People P Q29, Q37, Q40, Q48, Q49, Q50
Risk management RM Q33, Q69, Q79, Q82, Q88, Q91
Investment planning IP Q31, Q45, Q59, Q82, Q88, Q91
Works delivery WD Q45, Q91
Performance management PM Q64, Q82, Q95, Q99, Q105, Q109, Q113, Q115
Information management & enabling technology IMET Q62, Q63, Q64
7.13 Capability Improvements
A number of asset management process improvements have been initiated as a result of the above assessment which include: 1. Work continues on the process of standardisation of structures, minimisation of
materials inventory, and associated quality standards. 2. This work has formed the basis for the update to the network valuation during 2016
and the associated improvement to alignment of the engineering valuation and the accounting treatment. The above 2 items will flow in the process re-engineering planned for Scanpower’s Stores Operations.
3. Quality and safety audits have been introduced as part of the project sign-off process.
Project Managers are also more closely involved in the financial system billing and job closeout administration functions.
4. A Network ESR 5 year inspection program has been implemented. This program is
being driven by fault report feedback on where asset condition and design issues appear prevalent.
5. The Disaster Recovery Plan was updated, and an inventory of critical spares
established. The Regional Lifelines Group has reviewed the vulnerability and criticality of the regions key infrastructures during 2015. The Network Manager is Scanpower’s representative on this group.
6. Project Management processes were enhanced including Project Charters and
Expenditure Sanctions. 7. The Network Connection process has been tightened to ensure new load is captured
to ensure supply assets are not overloaded, connections records are updated, design and compliance with regulation and standards is being maintained, and the contractual agreement with regard to connection date is reset.
9. A Safety Manual for field staff in both the Network and Contracting has been introduced
as a precursor to Scanpower’s update to Revision 3 of the SM-EIs. This has been
Page 66 of 220
produced by the Health and Safety Manager as part of the corporate safety management strategy known as 360 Safe - the initiative is essentially increasing the robustness of employee participation in safety, acceptance of their responsibilities and roles, and clarification of the expectation and management of performance. The manual itself details the mission-critical rules and non-negotiable site safety management rules.
10. Public Safety Management improvements targeted the Close Approach approval
process including running a series of safety awareness training courses for contractors and associated staff. This has been extended into the management of High Load Transports which in turn feeds into the asset management initiatives as we act to eliminate low clearances that the process identifies.
11. Scanpower has transitioned to Office 365 with onsite servers being replaced with
storage on the cloud. With the help from the ICT consultant, several improvements have been made around cyber security awareness to improve IT security. Office 365 training for all office based staff members has improved productivity. Several network staff now have tablets meaning they now have limited access to the GIS and the ability to email and send photos of faults in the field.
Scanpower will continue to improve its safety management systems; as these are in fact Total Quality systems they overlap with, and drive, good practice in asset management systems such as quality, risk, training, compliance, and continual improvement systems. Specifically in 2020 Scanpower is continuing with the following initiatives:
1. Capture data with regard to customer service lines to support a campaign of inspection and upgrade of customer assets urgently requiring age related replacements.
2. Data capture with regard to network connection and installation load details is in
progress.
3. Scanpower will shift towards suites of documents that detail Safe Operating Practice on a task by task basis. These will be used for field and control room operations.
4. Develop customised libraries for the CATAN line design tool as per the standard
assemblies that have been created as part of the 2016 network revaluation.
5. The development of a Safety by Design manual that is integrated into the rest of the business. This document shall work in conjunction with the Public Safety Management System (PSMS) that has been adopted by Scanpower.
6. The development of a construction manual that adopts the standard designs and
incorporates the safety by design principles that allow equipment being built to have approved components while being constructed in a common way.
7. Enhancing our contractors’ approval and materials selection process. This is to ensue
anyone working on the network is familiar with Scanpower’s processes and any materials used will comply with the construction manual and construction procedures. i.e. ensuring that the crimp lug used on the network uses the standard crimper carried by the line staff.
8. Complete developments necessary to achieve ISO55000 accreditation. This is
primarily documenting the Asset Management System itself and the process controls
Page 67 of 220
around the operation of the system. The project involves responding to the recommended system improvements following external assessment/audit. As a result of these improvements, the Schedule 13 AMMAT Assessment has been updated and appended to this plan.
9. These are linked to a re-engineering of Scanpower’s stores processes.
10. The development of a Public Safety Management System manual to help document the methods required to comply with the PSMS standard.
11. The development of an ICT roadmap that links to Scanpower’s core corporate and network strategies.
Scanpower is looking ahead at the long term strategic issues. Drivers like staff retirement, local knowledge being lost, ageing assets, changing load profiles and revenues are behind the improvement goals as listed below:
1. Improving the management of the existing data. Currently there are several different repositories where information relating to assets is kept, whether it’s on Cable Cad, in custom built spread sheets or on paper. To add to this, there are currently different interpretations of asset health within the industry. As a result, asset decision making can be somewhat convoluted. The installation of the new GIS and ADMS system will play a pivotal role in achieving this improvement.
2. Streamlining Scanpower’s asset decision making processes. In short, once the data is
accurately managed, key information like asset health and criticality can be determined. Other factors like repetitive faults, known equipment defects and safety hazard management can be fed directly back into the AMP decision making process.
3. Incorporating Scanpower’s PSMS into the AMP. This allows public safety issues to be
a key influence in the Asset Management policies, strategies and objectives. For example, a recloser’s primary purpose is to protect life and equipment. Currently investment decisions are made on its age, health & performance. Now the risk of failure to public safety will be a key driver and if necessary, early replacement of such equipment could be justified for the greater good of public safety.
4. Improving the data quality of the network. Though this is at the early stages, Scanpower is looking at aerial survey for each pole where a high-resolution picture, a thermal picture, LIDAR and radio frequency of each pole is taken. This will enhance the current asset information as well as improving the determination process of equipment health and condition. Desktop decisions and assessments at central level can be more efficiently made and shared.

Page 68 of 220
8 ORGANISATIONAL CAPABILITY
Organisational structure deliberately reflects AM’s “strategic line of sight” described in section 4 from governance, to corporate management, to divisional management, to asset management, right through to field operatives and establishes clear lines of accountability for delivery on company objectives. The roles within the various layers of the structure reflect the asset management competency framework illustrated below.
Figure 15 Asset Management Competency Framework
8.1 Accountabilities and Responsibilities
The Chief Executive reports to a Board of five Directors (currently Allan Benbow (Chairman), Peter Clayton, Mark Kilmister, Bob Henry and Rodney Wong). The Directors, in turn, are employed by, and ultimately report to, the Trustees of the Scanpower Customer Trust (currently Rowena Bowie, Keith Cammock, Myles McKeefry, Stuart Smith and Bill Taylor). Ultimate responsibility for the management of Scanpower’s network assets lies with the Board of Directors, who are appointed by the Board of Trustees. The Trustees are elected on a triennial basis by consumers (the most recent election was in April 2018). The Board of Directors appoints the Chief Executive who is responsible for day to day management of the company and its assets. However, the Chief Executive is required to:
• Obtain Board approval on an annual basis for the Asset Management Plan and related capital and operating budgets.
• Report to the Board on a monthly basis on actual company performance relative to the objectives documented within the Asset Management Plan including:

Page 69 of 220
- Monthly financial performance (capex/opex) relative to budget, including appropriate variance analysis and commentary where required.
- Monthly network reliability performance (SAIDI and SAIFI) relative to target, with supporting commentary on the level and nature of network outages occurring during the month.
- A general commentary on monthly progress on network capital and maintenance activities.
• Obtain Board approval for any material deviation from the initiatives planned per the AMP (for example deferral of a particular project or implementing an unplanned project with a value greater than $100,000).
A summary of the current organisational structure is shown in Figure 16 below. As this illustrates, Scanpower operates four business units / divisions:
• Network (22 staff)
• Contracting (26 staff)
• Treesmart (7 staff)
• Corporate (8 staff) The Network Division is responsible for the management and operation of the company’s electricity network assets and business. The staff structure is shown in Figure 17 below. As is evident, Scanpower operates an ‘in-house’ strategy in regard to engineering and implementation of field work; that is to say, the company does not contract out / outsource to third parties for the majority of the functions necessary to run the network business and implement the asset management plan. The rationale behind this resourcing strategy is as follows:
• Foreseeable work loads are stable over the 10-year planning horizon.
• Given the company’s geographic location there are limited options in terms of contracting out services (i.e. there is not a healthy local contracting market).
• Scanpower believes insourcing is the lowest cost option over the long term.
• From a strategic perspective, the company is self-sufficient and has minimal reliance on third parties in relation to implementation of the asset management plan.
The exceptions to this approach are:
• Engineering expertise is provided by external consultants from time to time, on a ‘as required’ basis.
• Vegetation management and cutting of trees around power lines is undertaken by the company’s Treesmart Division (Treesmart provides specialist, utility arborist services to a number of lines companies).

Page 70 of 220
• Resources from the Contracting Division are periodically called on to assist the Network in times of peak workload (usually major fault response).
The Network Division is supported by a Corporate team of 8 staff that provides the following services to all business units:
• General management oversight from the company Chief Executive.
• Financial and management accounting.
• Regulatory reporting and liaison.
• Health, safety, quality and environmental management.
• Staff training and development.
• Marketing, information technology and insurance management.
What differentiates the Network Division from similar organisations is the responsibility to manage the long-term strategic objectives; while ensuring the day to day operational issues are kept in hand, to “keep the wheels turning” so to speak. This introduces a set of unique challenges with many employees wearing multiple hats to ensure the division’s objectives are met. To assist with the division’s objective, the staffing structure as shown in Figure 18 has been broken into four groups which are:
• Network Management;
• Asset Management;
• Delivery and;
• Operations. Each group has a specific list of objectives as listed in Figure 19. The rationale for the separation is to ensure that the operational and delivery issues encountered on a daily basis don’t interfere with the division’s long-term strategic planning objectives. As a secondary benefit, the key objectives also help the “operational” and “delivery” teams to keep on track during critical times in the year.

Page 71 of 220
Figure 16 Scanpower Organisational Summary
SCANPOWER LIMITED
ORGANISATIONAL STAFFING SUMMARY AT 23 JANUARY 2020
CONTRACTING - HOROWHENUA / KAPITI NETWORK MANAGEMENT - ORINGI TREESMART - ORINGI CHIEF EXECUTIVE - ORINGI
Allen Hutchison Regional GM Peter Rue Network Manager Warren Hirst Treesmart Manager Lee Bettles Chief Executive
Bruce Mills Project Manager Peter Hart Project Manager - Capex Jeff Graham Arborist Foreman
Ed Whakatihi Line Mechanic Kahn Day Project Manager - CIW Stuart Byne Arborist HEALTH, SAFETY, QUALITY & TRAINING - ORINGI
Marlon Cadle Trainee Line Mechanic Rob Joselyn Network Engineer Eden Carson Arborist Brent Dais GM - HSQT
Lara Deans Project Administrator Niraj Kunverji Network Engineer Hudson Mason Arborist Holly Elphick H&S Administrator
Tristan Smiley Network Engineer Glenn Aitken Arborist
CONTRACTING - WAIRARAPA / MANAWATU Aaron Bowles Electrical Inspector Jamie McDonald Trainee Arborist FINANCE & ADMINISTRATION - ORINGI
Peter Cooper Regional GM Michael Slater Asset Information Analyst Ben van der Spuy Company Accountant
Wayne Walsh Project Manager Sandy Sloane Network Admin Brenda Thirkell Administrator
Daryl Gilmore Project Manager Kathryn Peffers Payroll / Creditors (PT)
David Smith Project Manager NETWORK - FIELD CREW 1 - ORINGI Maureen Carol Business Analyst
Matt Clapham Designer / Draughtsman Chris Peffers Line Mechanic - Site Foreman
Michelle Makene Project Administrator Simon Gore Line Mechanic PROPERTY DIVISION
Lisa Cooper Project Administrator Luke Gray-Stuart Line Mechanic Mark Holdaway Property Manager
Tyson Maki Field Operations Manager Patrick Markman Line Mechanic
Kevin Jones Site Foreman Boyd Lyford Trainee Line Mechanic
George Watson Site Foreman
Joe Hennessy Site Foreman / Jointer NETWORK - FIELD CREW 2 - ORINGI
Dave Brosnahan Line Mechanic / Electrician Stephen Brown Line Mechanic - Site Foreman
Ethan Walsh Line Mechanic Peter Genet Line Mechanic
Brock MacDonald Line Mechanic Larry Duncan Line Mechanic
Stephen Balchin Line Mechanic Stephen Poole Trainee Line Mechanic CONTRACTING 26
Justin Mills Line Mechanic NETWORK 22
Mike Sandbrook Line Mechanic NETWORK - FAULTMEN TEAM - ORINGI TREESMART 7
Jason McConachy Trainee Line Mechanic Tama Petera Line Mechanic CORPORATE 8
Gavin Levave Trainee Line Mechanic John Oemcke Line Mechanic / Electrician TOTAL 63
Chris Munro Trainee Line Mechanic David Senior Line Mechanic
Calum Joselyn Trainee Line Mechanic Stuart Butler Line Mechanic / Electrician

Page 72 of 220
Figure 17 Network Division Structure

Page 73 of 220
Figure 18 Roles and Responsibilities Matrix within the Network Division Team

Page 74 of 220
Figure 19 Key Objectives within the Network Division Team

Page 75 of 220
8.2 Developing Asset Management Organisational Capability
The Network Division manages Scanpower’s core assets (in regard to quantity and value) which comprise an electricity distribution network servicing the northern Tararua District. The division’s core function is therefore asset management. The primary divisional strategy in regard to asset management is to manage to best practice embodied in the ISO55000 standard. In accordance with this standard, Scanpower’s Asset Management System therefore cyclically reviews the organisation’s management performance in order to identify opportunities for improvement. That is, the review specifically targets organisational capability. This was last completed in 2017.
8.2.1 Organisational Structure
The resignation of the former Network Manager (Ken Mitchell) in mid 2017 prompted a review of the organisational structure within the Network Division, and correspondingly the Chief Executive assumed the role of “Acting Network Manager” for a three-month period while this review was undertaken. Key points arising from that review included: 1. The company wished to continue its insourcing strategy and maintain in-house
electrical engineering capabilities. 2. The organisational structure (established in 2015) was stable and delivering effectively
on the asset management objectives of the company subject to:
- Some refinement to the planning and allocation of maintenance work with the faultmen team.
- Improvements to the reporting / transparency of project financial information
and understanding thereof. - Clearer prioritisation of customer initiated works versus planned capital works. - Better rostering of control room duties within the network management team.
3. Resourcing levels were appropriate relative to foreseeable workloads, and the internal service relationships with Treesmart and the Contracting Division were working effectively.
Having concluded this review, Scanpower recruited for a degree qualified electrical engineer with distribution experience and appointed Peter Rue (an internal candidate) into the role of Network Manager in early 2018. Given Peter’s existing employment with Scanpower, the transition has gone smoothly, with little or no disruption to day to day activities. As part of the DRP, BCP and ERP review completed midway through 2019, it was noted that the current GIS system needs an upgrade. After the Scanpower board approved the investigation of alternative product and approval for the purchase of the new GIS and ADMS system, it was decided that an Asset Information and Reporting Analyst would be required to drive the new system. Michael, an internal candidate from the Contracting division, was appointed to this position.

Page 76 of 220
Looking forward, ongoing development of new technologies around electricity (e.g. solar, battery storage, electric vehicles, smart home management systems) will create new demands and requirements in terms of staff resources. Scanpower is maintaining a watching brief on this, and we do foresee the future creation of new role(s) within the team specifically focused on new energy technologies.
8.2.2 Organisational Culture
Legacy factors that can have a bearing on Scanpower’s organisational culture include:
• The company is long established, having been set up almost a century ago.
• For much of its history the organisation was a statutory local authority.
• The average tenure of employees is relatively long (there are numerous employees with over forty years service).
• Historically there has been limited diversity within the work force, particularly in regard to age diversity.
• The fundamental business of network asset management and associated work practices have not radically changed; that is to say, only now is technology bringing potential disruption and a strategic ‘sea change’ to the industry.
• Prior to 2005, the work force was heavily unionised.
• Necessarily long decision-making cycles. The influence of these factors has in the past lead to undesirable cultural attitudes such as:
• Change aversity.
• A focus on terms and conditions of employment, as opposed to customer service.
• Limited willingness to demonstrate initiative or seek improvement.
• A relaxed approach to productivity.
• A disconnect between office based and field staff. Over the past decade, Scanpower has focused on initiatives aimed at improving organisational culture and moving on from these legacy issues. These have included:
• Better communication within the organisation (e.g. providing computer access to all staff, regular newsletters, displaying forward work schedules on large screens in staff amenity areas).
• Explaining long term asset management objectives to field staff, and clarifying the rationale behind the work done, on a project by project basis.
• A transition to individual employment agreements and employee specific training and development plans.

Page 77 of 220
• More consultative work planning processes between asset management / project management staff and field crews.
• Clearer setting and communication of performance objectives around productivity and challenging but achievable project targets.
• Employee participation in health and safety management.
• A structured reward scheme for identifying / recommending business improvements.
• Driving a focus on customer service and improving customer interactions.
• Co-location of engineering / project management staff and field staff (i.e. providing desks / office space to supervisory field staff and faultmen).
• More frequent and better structured team meetings These initiatives have been effective in leading the organisation towards a more customer and task-orientated culture, with higher levels of individual employment empowerment. This has been further enhanced by a structured programme of new traineeships which has bought a new generation of younger staff into the company, providing a higher degree of diversity and fresh thinking. In the coming year, Scanpower intends to launch a staff intranet with internal social media and newsfeed capabilities aimed at further improving communication within the organisation.
8.2.3 Stores Review
One area that has been identified for improvement in the coming year is the company’s approach to the management of stores / inventory / strategic spares. At the present time the Network Division operates an ‘inhouse’ but unmanned stores, whilst the Contracting Division has several offsite stores (Feilding, Paraparaumu) run on a consignment basis by third parties. Scanpower sees numerous potential benefits in rationalising its stores and material procurement processes across the whole organisation, including:
• Leveraging our consolidated purchasing power across all divisions with the aim of reducing unit costs.
• Better buying through bulk purchasing and tender processes (potentially incorporating procurement direct from suppliers in China)
• Maintaining economic order quantity stocks so as to enable us to respond to customer requests more quickly (as opposed to ordering on a job by job basis which can result in lengthy lead times).
• Rationalising / controlling the specifications of materials purchased so as to ensure quality and design standards are maintained.
In physical terms, Scanpower has ample available building space at Oringi Business Park to establish a centralised cross-divisional material procurement / stores function. We anticipate

Page 78 of 220
completing the business case for this by 30 September 2019, and subject to a favourable outcome, proceeding with implementation through the latter half of the year.
8.3 Competency Management
8.3.1 Training and Equipment Certification
The Electricity Industry has highly developed and formalised competency processes that impact on the company, affecting all roles within the organisation. In order to work in the industry, whether in regard to Scanpower’s network, its customer base, external networks/customers or partners in other sectors (e.g. Transpower), the ability to maintain and be able to demonstrate competency is a necessity. Like-wise, the plant and equipment used is required to have current certifications of various types. Trade level competencies and equipment certification is managed by the Health and Safety Manager with the assistance of the ITO. Industry specific safety rules and the related competency framework are included in this scope. Management processes include a regular review of needs with respect to customer requirements and staff development programs. The continuing development programs of tertiary qualified staff are self-managed by the staff concerned but with the input of divisional managers with regard to company needs. The Network team for example, determines what specialist engineering capability it will outsource or whose role gaining a specific skill set might best match. Other training requirements are managed at corporate level – both the Strategic Plan and Risk Management Plans address mission critical training and capability requirements. Safety management systems, information systems, and quality systems are addressed at this level – for example, training internal auditors. More specifically for the Network Division it has been decided to align staff competency with the Electricity Distribution Industry Competency and Training (EDICT) framework which aims to enhance staff and contractor competency approval for working across different network companies and industry sectors. It is based on NZQA unit standards and this has seen older staff with older qualifications going through a prior learning assessment process plus a significant amount of updating to meet Safe Operating Practice Guides e.g. working at heights, use of plant, etc. Specialist roles in works crews now have specialist training paths. For example, the line mechanics in the Fault Crew are working towards qualifications specific to field switching/operating and fault response (fault finding, protection systems, etc.) The EDICT is a trade orientated competency framework. The asset management team members have not necessarily come from a trade background and therefore do not meet the pre-requisites for some of the operational competency standards included in the framework e.g. Level 5 Network Controller. The Network Manager has therefore defined the Scanpower Network specific competency, training and experience required for the roles these staff are employed to fulfil. Specifically:
1. To visit work sites and engage in certain activities then Level 2 Introduction to Electricity Supply Certificate is required.

Page 79 of 220
2. Network Controlling and undertaking Duty Engineer functions will be supported with a
Level 3 Network Operator Certificate.
3. Those with trade qualification pre-requisites can achieve competency field work activities such as switching.
In the long term all network staff will have these qualifications but in the interim the training process works on experience in a supervised/mentored scenario. Technical training in specialist areas is maintained via continuing professional development programs.
8.4 Communication and Participation
Disseminating the information derived in asset management planning processes throughout the Line of Sight and receiving feedback from staff, participants and stakeholders has been achieved by the following actions: The Network Development Plan has been presented in detail to the executive management team and subsequently the Directors. The forecast capability and capacity resourcing issues of the wider organisation have been considered.
• AMP budgets have been prepared by a collaborative effort involving the CEO, Network Manager, and Company Finance Manager.
• Company organisational restructuring has followed a consultative process where input has been canvassed and then decisions presented and discussed with staff collectively.
• Asset management staff are allocated their tasks, projects, and budgets from the AMP.
• The completed AMP is then communicated to field staff at two levels. Firstly, the Network Manager presents the detail of the development projects and other initiatives, explains why they are necessary and explains the choice of solutions. Secondly, staff in asset management roles, who directly manage work crews, advise the work programme assumptions and the associated productivity assumptions in the AMP and budgeting.
• Weekly planning meetings are held with all field staff as a forum for discussing all operational matters. Network operational management is in daily contact with the foremen of the work crews. Network field staff facilities, offices, and the control room are all located on a single site at Oringi. 90% of the network is located within a 20km radius of Oringi.
This forms the basis of the Communications Plan as required by the ISO55000 standard.

Page 80 of 220
9 RISK MANAGEMENT
9.1 Introduction to Risk Management
Scanpower manages through its business risks in accordance with the principles and processes defined by ISO 31000.
Figure 20 Risk Management Framework
Risk Management Framework is a TQM system that is integrated into every step of asset management continuous improvement cycle:
• Risk is addressed discretely and separate to the AMP at a corporate level;
• And at the network divisional level;
• And further, risk assessments are inherent in asset criticality determinations, performance assessments and associated gap analysis against standards and AM objectives.
It is also integrated and coordinated with the other TQM processes Scanpower operates for safety management and quality management. The integral nature of risk management is directly evident in the ISO risk management principles listed below. Risk management:
• Creates and protects value
• Is an integral part of all organisational processes

Page 81 of 220
• Is part of the decision making
• Explicitly addresses uncertainty
• Is systematic, structured and timely
• Is based on the best information available
• Is tailored
• Takes human and cultural factors into account
• Is transparent and inclusive
• Is dynamic, iterative and responsive to change
• Facilitates continual improvement of the organisation However, in terms of asset management, it specifically focuses on the network assets, work practices, and the local operating environment. Scanpower’s broader business activities have their own risk management policies and practices.
9.2 Corporate Risk Management
The higher level corporate type risks with respect to Business Continuity, IT Security, Insurance, Treasury Policy, etc. are managed at that level in the organisation. Some Emergency Response and Preparedness Plans also need to be inclusive of the entire organisation (for example, in its company-wide Safety Management Systems). As can be seen in the corporate level risk assessment detailed below, the network, as Scanpower’s core business, features predominantly in the risk management “line of sight” starting at governance and executive management level. This assessment is reviewed annually between the CEO and Directors. Table 16 below summarises the 19 most significant corporate level risks as identified at a recent risk management exercise undertaken between the executive management team and the Scanpower Limited board of directors. The risks are not presented in any particular order of significance or severity. Each has been assigned a series of potential impacts on the organisation, and a corresponding set of mitigation or monitoring strategies.

Page 82 of 220
Table 16 Scanpower Corporate Risk Register
Corporate Risk 1 Inadequate network asset planning and management (short and/or long term)
POSSIBLE IMPACTS
• Potential public and staff safety issues including exposure to injury or death.
• Increased unplanned outages, deterioration in reliability performance and lost revenue.
• Creation of increasing backlog of capital and maintenance work that is hard and expensive to recover.
• Failure to adopt best practice and new technologies results in company falling behind other industry participants.
• Development opportunities are lost, potentially to competing companies, resulting in lost revenue.
• Exposure to legal and regulatory action on grounds of negligence / substandard asset management
RISK MITIGATION / MONITORING STRATEGY
• Ensuring annual asset management planning is completed and results of external assessments reviewed and considered.
• Ensuring annual capital and maintenance works are completed according to plan.
• Board members periodically visit work sites and physically verify works are being completed.
• Periodic external reviews / health checks by appropriately qualified consultants.
Corporate Risk 2 Impact on value and profitability of company as a result of sector regulation
POSSIBLE IMPACTS
• Price or rate of return control limits earning potential of company and hence the long term value of the business.
• Increased reporting and disclosure requirements add cost into the business.
• Company’s already low prices are locked in over the medium term (as happened 2004 to 2009).
RISK MITIGATION / MONITORING STRATEGY
• Continue to participate in Electricity Networks Association industry group and submissions.
• Maintain strong and positive relations with the Trust to allow continuance of current exemption from price control.
• Set pricing on a realistic basis and pre-emptive basis.
Corporate Risk 3 Inadequate compliance with industry regulations and requirements
POSSIBLE IMPACTS
• Reputational loss.
• Fines for non-compliance.
• Potential exposure to liability issues if the non-compliance is safety related.
RISK MITIGATION / MONITORING STRATEGY
• Prepare a schedule / calendar of annual compliance requirements and advise board.
• Report back to the board on adherence (or otherwise) with compliance requirements.
• Continue to comply with Energy Safety Service, Electricity & Gas Complaints Commission, and National Registry audits.
Corporate Risk 4 Network operational risk and staff / public safety
POSSIBLE IMPACTS
• Incorrect switching, work practices, asset failures lead to serious accident or death.
• Damage to customer premises and property.
• Damage to network assets.
RISK MITIGATION / MONITORING STRATEGY
• Ensure network control room is functioning effectively.
• Ensure network operational procedures are in place and adhered to.
• Ensure network operations are staffed appropriately.

Page 83 of 220
Table 16 Continued – Scanpower Corporate Risk Register
Corporate Risk 5 Major natural disasters and hazards
POSSIBLE IMPACTS
• Catastrophic damage to assets and associated interruption of electricity supply.
• Long term revenue loss.
• Failure to meet the civil defence needs of the community and other agencies.
RISK MITIGATION / MONITORING STRATEGY
• Ensure effective disaster recovery and business continuity plans in place.
• Ensure compliance with Public Safety Management Systems.
• Ensure ongoing liaison with regional civil defence planning.
Corporate Risk 6 Inadequate revenue management and pricing
POSSIBLE IMPACTS
• Inadequate cash flows to meet the long term needs of the business.
• Profitability and returns to customer diminish over the long term.
• Deterioration in financial performance and increasing stakeholder dissatisfaction.
• Lack of funding for necessary asset replacement and development.
RISK MITIGATION / MONITORING STRATEGY
• Make pricing decisions on an objective rather than emotive basis.
• Undertake short and medium term revenue and cash flow analysis.
• Consider pricing relative to peer group companies.
Corporate Risk 7 Diversion of attention from core network business
POSSIBLE IMPACTS
• A disproportionate amount of board and management time is devoted to non-core business activities, resulting in degradation of the core network business over time.
• Directors fail to accumulate knowledge relating to the core business over time resulting in poor governance performance.
• Resources are dedicated to non-relevant activities.
• Company pursues activities in which it has little or no expertise.
• Development opportunities in core areas are missed.
RISK MITIGATION / MONITORING STRATEGY
• Regular (at least annual) strategic planning sessions.
• Appropriate time, consideration and resources are applied to core business activities and closely related activities.
• Board to maintain focus on core / critical activities.
Corporate Risk 8 Lack of contract management expertise
POSSIBLE IMPACTS
• Legal and financial exposure where acting as the contractor.
• Failure to control contractors effectively where acting as the principal.
RISK MITIGATION / MONITORING STRATEGY
• Appropriate use of company solicitors to establish pro forma contracts.
• Use of company solicitors to review major contracts.
• Staff training on rudimentary contract law issues.
• Policies in place regarding staff ability to amend or change contracts.

Page 84 of 220
Table 16 Continued – Scanpower Corporate Risk Register
Corporate Risk 9 Data management risk / loss of data
POSSIBLE IMPACTS
• Loss of intellectual capital inherent in company data and corresponding deterioration in business performance.
• High costs associated with restructuring or recapturing lost data.
• Potential safety issues around loss of installation specific electricity data.
RISK MITIGATION / MONITORING STRATEGY
• Ensure that appropriate information technology architecture is in place, with storage redundancy.
• Ensure that regular back up procedures are established and followed.
• Ensure that a copy of back ups is held at off-site location.
Corporate Risk 10 Inadequate strategic planning
POSSIBLE IMPACTS
• Lack of coherent understanding between Directors, management and trustees as to the objectives and long term direction of the company.
• Lack of clear direction leads to inertia or time and resources being applied to strategically incompatible activities.
• Over the long term, company performance suffers.
RISK MITIGATION / MONITORING STRATEGY
• Establish an annual process for strategic planning, including annual board session.
• Consider behaviours and apparent strategies of other industry participants.
• Consider training for directors and staff on strategic planning.
Corporate Risk 11 Lack of security of supply management
POSSIBLE IMPACTS
• Lack of network supply contingency options in the event of significant failure.
• Extended loss of supply to large sections of the network (if not all).
• Associated revenue and safety issues arising from widespread outages.
RISK MITIGATION / MONITORING STRATEGY
• Ensure contingency / back up supply options are in place as appropriate to load.
• Ensure appropriate security of supply is in place where necessary.
• N-1 security in place at grid exit points.
Corporate Risk 12 New business venture failure
POSSIBLE IMPACTS
• Adverse financial implications of new business failure.
• Flow on impact on core business activities (e.g. cash flow shortage).
• Reputational damage.
• Negative response from owners / trustees and loss of faith.
RISK MITIGATION / MONITORING STRATEGY
• Set maximum investment levels where new business activity is outside core.
• Prohibit investments outside of core or related activities.
• Ensure appropriately experienced and qualified staff are recruited for new ventures.

Page 85 of 220
Table 16 Continued– Scanpower Corporate Risk Register
Corporate Risk 13 Inadequate business continuity planning
POSSIBLE IMPACTS
• Business fails to recover quickly (or at all) following an adverse incident.
• Associated revenue, reputational and safety issues.
• Long term value is destroyed.
RISK MITIGATION / MONITORING STRATEGY
• Ensure effective business continuity, disaster recovery, emergency management and data management plans in place.
• Periodic “rehearsal” and testing of disaster recovery procedures.
Corporate Risk 14 Failure of Transpower or electricity generators to deliver
POSSIBLE IMPACTS
• Loss of supply of electricity at generation or transmission level triggers regional emergency and significant loss of income to Scanpower.
• Typical of a “dry winter” as seen in recent years. Additional costs incurred participating in “national energy savings” campaign.
• Medically dependent customers exposed.
• Damage to customer property (e.g. frozen goods etc).
• Failure of security systems, water and sewage infrastructure etc.
RISK MITIGATION / MONITORING STRATEGY
• Participate in industry wide supply management forums.
• Ensure load shedding processes are in place with well understood priorities and protocols.
• Ensure customer communication plan is in place for such an event.
Corporate Risk 15 Loss of key staff
POSSIBLE IMPACTS
• Loss of intellectual capital and long term organisational knowledge.
• Recruitment costs associated with sourcing replacement staff.
• Potential shortages or lack of suitable replacement staff.
• 6-12 month plus disruption to operations and strategy implementation.
RISK MITIGATION / MONITORING STRATEGY
• Retention focused remuneration structures.
• Remuneration is at least at market (or better) levels.
• Structured staff reviews and feedback opportunities.
Corporate Risk 16 Inadequate insurance cover
POSSIBLE IMPACTS
• Financial exposure to claims not covered by insurers.
• Policy conditions result in non-coverage by insurers.
RISK MITIGATION / MONITORING STRATEGY
• Engage appropriately qualified and experienced insurance advisors.
• Board level review of policy cover on an annual basis.
• Utilize contractual mechanisms to limit liability where appropriate or possible.
• Consider alternative corporate and ownership structures to isolate areas of high potential liability

Page 86 of 220
Table 16 Continued – Scanpower Corporate Risk Register
Corporate Risk 17 Technological advances in distributed generation threaten / compete with the network business
POSSIBLE IMPACTS
• Traditional electricity supply over lines displaced by new technologies as they become more cost effective (e.g. photovoltaic solar, solar water heating, fuel cell technologies).
• Slow erosion of revenue with no corresponding reduction in costs leads to sharp decline in profitability and cash flows to the point the business cannot be sustained without dramatic price increases (thereby exacerbating the problem).
• “Creeping” revenue decline is not addressed before it is too late.
RISK MITIGATION / MONITORING STRATEGY
• Develop a longer term strategy around broader energy solutions services.
• Build organisational competencies and knowledge of new technologies over time.
• Resources dedicated to external environmental scanning (attending courses, seminars, conferences etc).
• Consider entering those industries which are in direct competition with electricity networks.
• Avoid the “Kodak moment”.
• Diversification into other industries.
Corporate Risk 18 Staff fraud / collusion
POSSIBLE IMPACTS
• Staff theft on an isolated or sustained basis.
• Adverse financial impacts.
RISK MITIGATION / MONITORING STRATEGY
• Management in conjunction with Audit Committee undertakes an assessment of potential sources of fraud / theft.
• Continue to review findings of annual audits by Audit NZ and ensure recommendations are responded to.
• Effective internal controls and policies are in place to minimize the threat of fraud or theft.
Corporate Risk 19 Sudden / significant change in board of directors and / or trustees
POSSIBLE IMPACTS
• Significant loss of accumulated organisational knowledge and experience impacts on performance.
• Extended learning curve / recovery period arising from lack of succession planning.
• Loss of strategic impetus.
• Increased potential for conflict and sudden shift in strategic focus.
RISK MITIGATION / MONITORING STRATEGY
• Succession planning and management in place to the best extent possible.
• Continued close communication between the Board and Trust.
9.3 Insurance
As part of the company’s approach to risk management, Scanpower maintains material damage insurance on certain elements of the network asset base and on peripheral but strategically significant non-network assets such as key buildings including the head office and control room areas. Scanpower engages insurance experts JLT on a consultancy basis to provide general risk management and insurance advice, and to secure cover in the insurance market on the company’s behalf. This is done on an annual basis.

Page 87 of 220
Due to the nature and configuration of Scanpower’s network asset base (i.e. no sub transmission system or zone substations), in value terms the asset is spread over a wide geographic area; with a replacement cost of $50M across 2,500km2 the average value per square kilometre is $20,000. Correspondingly, there are no major concentrations of asset in terms of value that you might find in other networks (e.g. substations). Discussions with insurers over the years have highlighted unwillingness on their part to insure the entire asset base, and even if they were it is anticipated that the cost would be prohibitive. Therefore, Scanpower only insures the following:
Table 17 Insurance Cover Summary
Asset Insured Value Basis of Insurance
Dannevirke GXP Ripple Injection Plant $350,000 Replacement
Woodville GXP Ripple Injection Plant $350,000 Replacement
Poupouatua Radio Comms Repeater $300,000 Replacement
Network Office Building / Control Room $3,872,000 Functional Replacement
Network Related Software / SCADA / GIS $850,000 Replacement
Network Stock / Strategic Spares $600,000 Replacement
Remote Area Power Supplies $150,000 Replacement
In relation to other network assets such as poles, conductors, switchgear, transformers and so on, Scanpower has opted to self-insure these assets. Scanpower’s insurance is arranged by brokers March / JTL and is underwritten by a portfolio of insurers via Lloyds of London. We are not aware of any further reinsurance undertaken by these parties. In deciding to self-insure network assets beyond those specified above, Scanpower took into consideration factors such as:
• Historical trends in both material damage incidents and costs.
• The company’s financial ability to meet these costs.
• Exposure to large scale loss events.
In the past 16 years, the most significant natural fault events were extremely heavy snow falls in 2003 and the Manawatu floods of 2004. In both cases the asset repairs and replacement necessitated by these events were met from operating cash flow, and the cost of neither was in excess of $150,000. In terms of Scanpower’s ability to fund asset replacement in the event of a large scale loss, the company has the following options / reserves:
• Each year Scanpower makes a discretionary network discount payment ranging from between $1.35M and $2.0M. This cash flow could be redirected to fund asset replacement if necessary.

Page 88 of 220
• Scanpower has a flexible financing facility in place with BNZ with a current limit of $8.5M. Whilst this balance fluctuates from time to time, there is $2.0m funding available as at the date of this asset management plan.
• Taking into account the above facility, Scanpower has no other significant long term liabilities, and given total assets (as at 31 March 2019) of $39.2M the company is not very highly geared. This provides substantial further borrowing capacity of at least $10M should the situation require it.
• Where assets have been damaged via third party events, i.e. trees through 11 kV lines or car vs pole, efforts are made to recover the associated costs.
Taking these historical factors into account, and the company’s financial position, the Board of Scanpower is of the view that the company can adequately self-insure those network assets not otherwise covered by the material damage policy.
9.4 Asset Management Related Risk Management Process
Specifically, with regards to network assets and asset management systems risk has the following definition: Risk = Likelihood of an Adverse Event x Consequences (cost and/or performance) Practically, Scanpower assesses risk and determines appropriate risk management actions by taking a typical 5x5 matrix qualitative approach to assessing the factors of which is consistent with its safety management system risk assessment process.
Figure 21 Conceptual Risk Assessment Process
Scanpower does not have many assets that are categorised as critical, its network is generally robust, and its public relatively tolerant. This places most risk issues in the tolerable region

Page 89 of 220
and therefore most risk management actions follow an ALARP (As Low As Reasonably Practical) strategy. ALARP is actually a prescribed approach for SMS and it conforms with the ISO55000 standard. The risk management strategies selected depend on the nature of the risk. In Scanpower’s case most risks are low probability low consequence risks that do not impact company objectives significantly so do not justify much expenditure to eliminate. At the other end of risk scale, the risks that are in the Intolerable, high consequence, high probability range are normally safety risks and therefore have necessarily been eliminated and/or mitigated. Consequently, where they are predictable the AM and operating practices are relatively mature in terms of established contingency, mitigation, quality, and other improvements. Unpredictable risks are addressed with improved SCADA providing timely information, and visibility and automation to speed response. Risk is also managed after an event through Contingency Plans, Disaster Recovery Plans (critical spares), and contingency provisions such as generators for security sensitive installations. Scanpower applies a VoLL (Value of Lost Load) analysis to determine the merit of funding enhanced security. This is undertaken as part of the Network Development Plan where security standards are reviewed, and issues addressed at system engineering/design level.
Figure 22 Risk Treatment / Risk Characteristics Matrix
The asset management risks that have been identified by drilling down from corporate risk identification are summarised in Table 18 below (number: risk is quantified in terms of the 10 year planning period of this plan):

Page 90 of 220
Table 18 Asset Management Related Risk Summary
Asset Management Risk 1 Stranding of line assets due to lower cost of supply technology options for consumers i.e. DG
LIKELIHOOD
• Low – assets most likely to be stranded are customer owned
CONSEQUENCE
• High
RISK
• Medium
ALARP STRATEGY
• Observe trend closely, look at alternative business solutions and update the NDP where needed.
Asset Management Risk 2 Loss of a large customer
LIKELIHOOD
• Medium
CONSEQUENCE
• Medium
RISK
• Medium
ALARP STRATEGY
• Support with customised efficiency, security and quality of supply measures
• Review network income and supplement loss with reduced customer rebate or increase network charges.
Asset Management Risk 3 Voltage constraints caused by changing load demographics
LIKELIHOOD
• Medium
CONSEQUENCE
• Medium
RISK
• Medium
ALARP STRATEGY
• Increased monitoring and more proactive planning.
Asset Management Risk 4 Loss of load control capability
LIKELIHOOD
• Medium
CONSEQUENCE
• Medium
RISK
• Medium
ALARP STRATEGY
• Enhance load control system functionality and take lead on smart meter / smart grid developments.

Page 91 of 220
Table 18 Continued – Asset Management Related Risk Summary
Asset Management Risk 5 Consumer driven developments occurring faster than the network plan/design/build capability
LIKELIHOOD
• Medium
CONSEQUENCE
• Medium
RISK
• Medium
ALARP STRATEGY
• Maintain sufficient headroom in Network Development Plan to pre-empt developments and bring actions forward as necessary.
Asset Management Risk 6 Technology capability and resourcing inadequate to meet demand of non-lines solutions to development needs
LIKELIHOOD
• Medium
CONSEQUENCE
• Medium
RISK
• Medium
ALARP STRATEGY
• Recruit appropriate engineering staff and bring more technical design/planning in house.
Asset Management Risk 7 Age profile of field crews
LIKELIHOOD
• High
CONSEQUENCE
• Medium
RISK
• High
ALARP STRATEGY
• Recruit trainees and develop existing staff with the key skills that may be lost to retirements.
Asset Management Risk 8 Development of dairying/intensive load in areas more than 20km from a GXP
LIKELIHOOD
• Medium
CONSEQUENCE
• High
RISK
• Medium
ALARP STRATEGY
• R & D on dairy shed energy balance with solar hot water, PV, and biomass.

Page 92 of 220
Table 18 Continued – Asset Management Related Risk Summary
Asset Management Risk 9 Condition of consumer owned lines driving up network operating costs
LIKELIHOOD
• High
CONSEQUENCE
• Medium
RISK
• High
ALARP STRATEGY
• Undertake inspections and notify consumers.
Asset Management Risk 10 Maturing plantations on land converted to forestry over-whelming tree fault statistics
LIKELIHOOD
• High
CONSEQUENCE
• High
RISK
• High
ALARP STRATEGY
• Increase sectionalising automation and line relocations where not practical to increase clearances.
9.5 Significant Assumptions
Scanpower’s AMP is based on the following assumptions:
• Significant intensive farming (such as dairying east of the Manawatu River) does not develop more than 20km from a GXP. Specifically, no major irrigation development that would support this intensification.
• Wind generation on the Puketoi Ranges requiring transmission support does not develop within the planning horizon of this plan. Note: there is a very large amount of generation consented by 3 different retailers on this range. Projects are on hold for lack of a transmission solution at this time which currently places the likelihood of these developments beyond the planning horizon of this plan.
• Oil is not discovered in commercially viable volumes in the District driving the development of a large scale new industry in the region. This information is closely guarded commercial information and therefore Scanpower is unable to assess its planning implications. However, drilling has been undertaken at 2 locations approximately 15km east of Dannevirke. The current global oil market is not likely to drive development in the medium term.
• Growth in dairying, population, and other econometric influences remains consistent. These are the major growth drivers in the NDP (Network Development Plan) forecasts and therefore an optimistic assumption is applied. Current global dairy commodity prices are likely to suppress new dairy developments for a few years.
• PV does not develop at a rate faster than the network can economically support with storage, capacity, and voltage management. PV has reached the economic trigger point

Page 93 of 220
for mass market up-take, but this assumes current grid supply energy charges remain high. Network planning has a high sensitivity to this pivot point. Specifically, the integration of PV with storage and backup generation via home energy management systems is likely to differentiate the experience in NZ from other countries that have been early adopters.
• Major customers remain viable and operating. They are all exporters and so remain sensitive to the global economy and pricing risks.
• No new industries and/or major customers emerge with intensive energy requirements. This would require a greenfield planning response – the size of Scanpower’s network is relatively small to the potential size of a major user. For example, the development of a dairy factory, cement plant, irrigation, etc.
Further details of planning criteria assumptions can be found in the Network Development Plan section of this document.
9.6 Business Model Risk
In terms of the AMP prescription, this describes: “A description of significant factors that may lead to a material difference between the prospective information disclosed and the corresponding actual information recorded in future disclosures” In fact, it is standard practice for Scanpower to manage each of its business units on a month by month basis to the annual business plan. Our business is much broader and more dynamic than regulatory assumption of what constitutes an Electricity Lines Business. The AMP has a longer term perspective and is limited by a one scenario set of assumptions. While it delivers a strategy for addressing issues that can be foreseen, actual responses will follow the emerging strategy that adapts to the actual situation. Change issues that may affect the continuity of the AMP from year to year are listed below and comparison of the AMP over a 3-year period shows that every issue listed has in fact eventuated:
• Change in polices resulting from reassessment of asset management practices following alignment to ISO55000.
• The associated change in work practices.
• The restructuring of Network and Contracting Divisions.
• The associated restructuring of the staffing establishment and resources.
• The associated alignment of budgets

Page 94 of 220
10 INVESTMENT PLANNING
10.1 Network Development Plan
Scanpower formally prepares a Network Development Plan (NDP) as part of the compliance requirements of its Asset Management Plan. This document describes the process and methodology applied to determine the optimal investment plan required to meet company objectives. The ISO 55000 Asset Management standard refers to this as Investment Planning.
10.2 Network Development Strategy
The NDP details the process of assessing the Network’s future development requirements in order to deliver on Scanpower’s long term business objectives. It records the asset management strategy and planning component of the AM Conceptual Model. That is, it is the Network Division’s Strategic Plan as applied to the assets on which the core business is based. Electricity consumption on the network is trending downwards as a result of the loss of several major customers, and a general / creeping erosion of load. The key features of the existing network and strategic environment with regard to its strategic planning environment are:
1. The network has no sub-transmission system which means it has the potential to become capacity and voltage constrained. However, at current and foreseeable loads, this is not an issue.
2. The network has minimal interconnection capability particularly in the urban LV
networks. No part of the network meets an N-1 security standard (which is appropriate to the load size).
3. Some of the more significant differentiators of this network to its peers are; it has very
little single phase distribution and its protection/switching is largely still HV expulsion fuse based. That is, the network is a traditional, predominantly overhead, low tech., manually operated, lineman orientated asset.
4. The LV distribution network tends to be voltage constrained due to:
a. The placement of ground mount transformers in relation to load densities, b. The standard distribution conductor size, and c. The run of conductor length.
5. This network still contains group fusing where one set of HV expulsion fuses will protect
two or more pad mount transformers. Some are located within critical areas.
6. Electricity consumption on the network is trending downwards as a result of the loss of several major customers, and a general / creeping erosion of load. After several decades of population decline, the district is now showing some signs of creeping growth.
7. “Safety in design” and “Public Safety” is becoming more prevalent in the decision
making process and is more regulated than in previous times.

Page 95 of 220
8. Some existing infrastructure doesn’t meet current design standards i.e. high voltage and low voltage line ground clearances, overloaded poles that are incorrectly stayed, structures overloaded with multiple fittings and conductors etc.
9. Operating expenditure continues to increase due to a range of factors including import
costs, Health & Safety requirements and previous under investment in training. 10. The uncertainty of EV and PV uptakes, and their effects on the low voltage and high
voltage distribution network. 11. The roles that distribution companies will play in the emerging technology market. 12. A significant amount of uneconomic line is due for replacement. 13. Of these lines, some are located on hill and valley peaks that are inaccessible to trucks.
Simply put, although there is no load growth which would justify the upgrade or the installation of extra capacity, there are network development projects that can improve the safety and performance of this network. These projects will usually be initiated via the capital renewals. For example, while replacing three pad mount transformers within the Central District Business (CBD), which are currently group fused, Scanpower would at the same time install LV inter-ties and HV switching infrastructure to improve operator safety, network reliability and help future proof the area for EV charging stations. More specifically, the ND projects that are chosen will:
1. Improve power quality and voltage by: a. Installing voltage regulators. b. Upgrading conductor size. c. Installing a static var generator. d. Installing filters etc.
2. Increase the network resilience, security, reliability and performance by:
a. Installing more switching points to help segregate the network for planned and unplanned work.
b. Rationalising reclosers so they have better impact during unplanned work. c. Installing HV back feeds that allow de-energised work to be completed with
minimal impacts. d. Installing HV bussing points, end of line capacitors, static VAR generators and
conductor upgrades to improve voltage quality. e. Reinforcement of the high voltage or low voltage network via capacity upgrades
or extra tie points.
3. Increase the safety of the network by: a. Updating our design standards to ensure better performing technology is
installed on the network. b. Rerouting lines to the road side so planned and unplanned work can be easily
be undertaken. c. De-cluttering network structures so either a cable termination or ABS is
connected, not both. d. Improving the design process so poles are not overloaded, or additional works
are carried out to underground where possible. e. Increasing road crossing and driveway clearance of HV and LV lines.

Page 96 of 220
4. Help future proof the network for increased EV charging stations, EV home charging
and PV solar injection. This will be done via enhancing the LV distribution network, installing more LV inter-ties and installing new transformers in better locations.
5. Reduce the investment required in traditional lines where applicable via alternative
methods such as solar, batteries and generators.
10.2.1 Justification
This strategy is justified by the changing political and local economic environment. Industries and utilities are more heavily regulated than in previous times. Scanpower cannot simply change an asset like for like. Considerations about public and employees’ safety must be considered in the asset’s life cycle process, i.e. from design to de-commissioning. Though lines were built to last, design details about clearances, pole capacity, ease of maintenance and replacement were not generally considered. Scanpower is in a challenging environment where it must balance the needs of the public, investors and legislators whilst ensuring the new designs meet the future requirements. Investment decisions must be justifiable to the investor whilst ensuring the critical assets in poor condition are given higher priority. In a nutshell, though the future may be uncertain, Scanpower must still supply electricity to the very last kilowatt hour and customer.
10.2.2 Planning Environment Context and Strategic Issues
At transmission level, the long term (10 year) load growth trend (12 month rolling average) has been declining both in terms of maximum demand (kW) and consumption (kWh). February 2017 was the lowest month on record with only 6,151,429 kWh of units being delivered. There has been a small break on this trend with in February 2018, consumption was recorded at 6,248,339 kWh. By comparison, the volume in February 2008 was 7,737,548 kWh indicating a reduction of 20% consumption over the past decade. Decline in demand has a stepped characteristic as shown in Figure 23 indicating it is the result of the loss of industrial consumers which have closed down, modernised or relocated. For example, Kordia shut down 300kW of analogue TV transmission and Feltex Wool Spinners relocated their main processing facility to Oamaru. In the previous Development Plan this customer was forecast to intensify its operations in Dannevirke – the development required to service the projected new load is now no longer required. Industrial processes tend to have high load factors and demand that is coincident with system demand. Growth on the network however is seen at a feeder by feeder level and its impact depends on the load characteristics of the dominant load groups on that feeder. For example, growth on a dairying area feeder will create higher peaks morning and evening (worsening capacity constraints) but may not be seen as coincident demand on the Grid Exit Point where peak demand occurs in the dairy off-season.
Though growth is analysed at a feeder level, The LV network is closely monitored. Within the urban networks, growth is analysed when new connections or upgrades of existing

Page 97 of 220
connections are made. The LV network is monitored and is checked for spare capacity. For the rural and remote networks, the transformer capacity is checked, and upgrades are made accordingly. Recently within the urban area, Scanpower has been noticing some load shift between transformers where medium sized businesses are relocating their premises.
Figure 23 Non Coincident Maximum Demand Trend
The growth witnessed in the dairy sector, in addition to new sheds and/or upgrades, has been driven by higher industry standards requiring faster chilling. Dry years also promote an increase in irrigation investment, but this is not being seen at the same levels as experienced in other regions mainly because of the availability of water. Such loads have a relatively low load factor driving high network investment relative to energy volumes supplied. Accordingly, this growth can be a negative trend with regard to cost of supply, capital efficiency, and sustainability. When the long-term trend of energy off-take from the transmission grid is observed in Figure 24 a strong downward trend of approx. 1.25% p.a. is evident. New growth is therefore less energy intensive than that of the load lost.

Page 98 of 220
Figure 24 Monthly Electricity Consumption (kWh) Trend
This is believed the result of an underlying trend in consumer energy efficiency. Scanpower has experienced the following changes in its household consumer load demographics (listed in chronologic sequence over the past 10 years):
• Substitution of electric water heating with gas. This is a retail energy pricing issue – Retailers with both gas and electricity offerings can maximise generation revenues and spread risks – gas pricing does have the same peak demand signalling.
• The widespread uptake of heat pumps displacing night store, all-electric alternatives.
• Consumers do not assess their energy costs in terms of the capital outlay they have made. Their decisions are based on maximising comfort and convenience for the same energy bill.
• Higher efficiency appliances and lighting in general as the appliance base is renewed, which is now occurring on a shorter replacement cycle.
• With the incomes of elderly and beneficiaries under real value downwards pressure, the increase in electricity costs curtails consumption – energy poverty is a real issue in communities like Dannevirke.
• Lower consumption for the same asset investment leads to the need for higher revenue recovery rates; the result being increased attractiveness for consumers of alternatives like solar energy, storage, and generators. These systems are now lower cost from the consumer’s perspective when compared to the retail cost they are paying for grid supply. Further, if they have a need to renew or upgrade their service line assets, the alternatives can be cheaper but also 3rd party funded.

Page 99 of 220
This is clearly not sustainable and ultimately the value of grid connected generation and the transmission system delivering that energy will need to be reduced. How quickly this occurs will depend on how quickly penetration into the markets of the existing retailer/generators by new companies offering alternative solutions with different business models i.e. disruption, occurs. This is a high risk sensitivity factor in the planning environment at the moment. Consumers are being offered bundled funding options so there is no hurdle to uptake only uncertainty of how retailers will respond to pressure to reduce their energy charges. There have been a number of requests for four to five section subdivisions to be connected to Scanpower’s network within Dannevirke and Woodville. This number has a direct correlation to the Manawatu property prices. Some issues have been raised around capital contribution for these subdivisions from the developer where there is no electrical network, or the existing network needs to be upgraded. Recently, the TDC has been issuing consent to developers to subdivide land for sale without the provision of utilities (power, communication, water & waste) In an ideal world, Scanpower would work with one developer and services would be provided to each property. Cost sharing between other utilities for trenches as an example would add efficiencies for the end user. However, with Scanpower dealing with individual customers for these sub-divisions means assets are being added in when needed and the cost passed on to the consumer. Scanpower is keeping a watch on the new connections with regards to the new motorway construction between Palmerston North and Woodville. It is expected that small villages or camps for the workers may be constructed in the near future. With current property prices, and the expected fifteen minute trip to Palmerston North from Woodville could see an increase of properties being built over the next ten years.
10.2.3 Transmission Costs
Despite the long term trends of demand and consumption declining at grid exit points Scanpower is seeing the opposite trend in regard to transmission costs as shown in Figure 25.

Page 100 of 220
Figure 25 Transmission Cost Trend (April 2011 to Present)
A couple of these step changes come after the renewal of the supply transformers and associated 11 kV switchgear. Woodville grid exit point had an extra transformer installed to give N-1 security, meaning now the Woodville township does not have to be turned off for a day while routine maintenance is carried out.
Currently demand-side management tools such as ripple injection load controlling methods are used to reduce the morning and evening system peaks. These help manage the transmission costs which are predominantly based on system peaks.
Though one might say these costs are unsustainable, but just like distribution costs, factors such as health and safety, design by safety, neglected training and higher import costs are driving electricity prices up.
It is therefore conceivable that distributed technology may offer alternatives to the traditional lines based solutions. Scanpower is continuing to watch this space.
It is Scanpower’s policy that transmission costs are passed straight through to the consumer.
10.2.4 Alternatives
As described in section 6.5.6, Scanpower has already invested in alternative technology to that of the traditional lines. These units were installed as an alternative to replacing 6.4 km of HV lines that ran through a forestry block. This project was only a partial success, with only two out of the three being commissioned, and with 15 poles and 1.7km still remaining. The Scanpower Board has approved the installation of a third RAPS site on Franklin Road allowing the remainder of the 1.7 km of high voltage line to be de-commissioned. This has been approved for the 2020/2021 financial year. Scanpower has been in communication with the forestry owner where the line currently passes through and who also owns the property the line supplies. The forestry owner is very supportive of this initiative as this alternative to the traditional line renewal will reduce the risk of forestry fires and increase the reliability of supply to the property and Scanpower’s network.

Page 101 of 220
Confidence to proceed with this project has been derived from the experience and skill of owning and operating the existing two sites. Scanpower has a better understanding of the benefits and shortcomings of these technologies. These alternative supplies are owned and operated by Scanpower to meet its supply obligations under the Electricity Act in the most direct manner. The consumer is being charged for both energy and line costs under a rental contract. The consumers have already benefited from a more secure and reliable supply. Given the right circumstances, Scanpower sees this as a viable alternative to the traditional line renewals; however, factors including having stranded assets, the loss of line charge revenue, a deferral in capital investment vs higher operational expenses for the maintenance of the RAPS and higher cost in capital for future capacity upgrades are all taken into account Previous asset management plans have discussed the use of generation and storage on the Network. Though in limited cases this is a more attractive option to line rebuilds, it is in Scanpower’s opinion that the cost benefits of such technologies have not yet reached a tipping point that makes such an option attractive. With reduced loads on the network, recent reinvestments into load management technologies, and with automated switchgear becoming a commodity item, reusing the existing infrastructure is Scanpower’s preferred option. Scanpower is in a difficult position where it must ensure supply to all its customers is met. For a significant amount of these in the rural areas, this is uneconomic, Scanpower must still be agile enough to adapt to a quickly changing environment. Scanpower does understand that such generation and storage technologies are becoming prevalent, and as such these technologies will be closely monitored. As described in Section 10.6.9, Scanpower is currently trialling the use of a static var generator for voltage support. Load increases on the Jackson Road sub circuit triggered this unplanned network development. Scanpower reused a spare 500 kVA transformer, cargo container and LV switchboard and designed inhouse a portable and containerised SVG unit. Scanpower was loaned a 300 kVAr generator from power electronics New Zealand in Napier and the unit was successfully commissioned in December 2019. Though a line upgrade was the optimal solution, it would only be needed for two months of the year. With the portable SVG unit, Scanpower has the ability to relocate it around the network where there are voltage constraints at different times of the year to increase utilization of the capital investment. This unit can also be used to support a weak tie for de-energised work. Modelling of the SVG was completed and pole top voltage data loggers were installed in the vicinity. Scanpower is waiting for the trial to be completed, however, early results from the unit are promising.
10.2.5 Photovoltaic
As depicted in section 6.5.5, there are currently just under 49 PV solar connections to the network. All of them being under 10 kW. Due to the social demographic of the connected consumers, Scanpower believes that they are likely to be late adaptors on the technology uptake scale. However, Scanpower continues to keep track of any new connections via its connection application process. Scanpower is looking at the Green Grid groups for new security and quality standards that manage the effects of solar on the LV distribution network.

Page 102 of 220
To put it simply, the LV distribution networks within the urban areas would have been designed for a ADMD of 3.5 kW per household. If every house generated a maximum of 10 kW during the peak generating hours, which is outside the typical morning and evening peaks, then there would be concerns that the LV distribution network could become overloaded. Scanpower is aiming to install metering points at the LV bus of some selected distribution substations within the urban networks in preparation for predicted increase of solar generation. It is hoped that the effects on the network could be better understood and if required, intervention to help mitigate any undesired effects.
10.2.6 Electric Vehicles
Family car specification electric vehicles are forecast to reach cost parity with combustion engine cars by 2020. Whilst they have the potential to double household energy consumption, they can also be totally charged from PV technology. Marketing strategies in the near future may bundle PV with the vehicle purchase – that is, an offering where vehicle performance is superior at equal cost, maintenance costs are fully mitigated, and fuel costs eliminated. This is still only an emerging market so how things might change with regards to vehicle ownership models, utilisation, and autonomous driving are left as possibilities on the planning horizon at this time. Scanpower over the past 10 years has lost 20% of energy consumption on its network. That equates to 1,489,209 kWh per month on average of consumption loss. The average EV takes 22 kWh to fully charge giving it a range of 200km which equates to a single household daily consumption. For a worst case scenario where the EV is charged daily, 682 kWh would be drawn monthly. Thus, to meet the energy consumption that occurred ten years previously, just over 2,000 EVs would have to be used on this network. This however is assuming that all EVs were trickle charged and charging predominantly occurred outside peak times (overnight). Scanpower is looking at the Green Grid Project, the EEA and other distribution networks in and outside New Zealand for early trigger point and alternative technology solutions for EVs. For example, there are some predictions that battery banks will be swapped out at petrol stations, thus the electrical distribution and transmission networks will be bypassed. Some developers are inventing cloud based solutions that allow charging stations to make decisions on when there is enough capacity in the grid for charging in lieu of the traditional ripple-based technology. Scanpower is currently investigating future connection standards. When comparing the fuel costs of EV, 40 cents per litre for a full charge is considerably cheaper that petroleum based products. It may be conceivable that 2025 may be a realistic year that the tipping point of EVs occurs.
10.2.7 Strategic Conclusions on Disruptive Technology for Distributors
Past solutions for capacity, security, and transmission services are no longer least cost. Life cycles are shorter and total life cycle costs of the traditional solutions are no longer appropriate.

Page 103 of 220
Networks will shrink in at their remote edges as lines become due for age replacement. Reconstruction of lines with customer densities of less than 2 connections per km (dependent on annual consumption) are simply not an economic option. As distribution networks become less strongly tied to the grid, they will take more of a role in managing the power quality services traditionally delivered by the grid i.e. voltage stability, frequency keeping, reactive power flow and security. Network development focus needs to shift towards the consumer end of the network to allow better interconnection between their supplies. Consumers also need closer technical support from networks.

Page 104 of 220
10.3 Planning Objectives
The specific objectives of the planning process include;
1. To forecast load growth to ensure sufficient capacity is available for local economic development.
2. To forecast voltage and capacity constraints and identify shortfalls against
Scanpower’s quality standards.
3. To forecast contingent capacity constraints and identify shortfalls against Scanpower’s security standards.
4. To forecast the capital renewal projects and identify network enhancements that can
be done in conjunction.
5. To identify critical and high risk “Public Safety” and “Design by Safety” issues that impede the network’s performance or increase its risk.
6. To identify the expected timing and/or trigger points of any network development
necessary to sustain standards and service delivery initiated by load growth and/or change in the load demographics.
7. To determine the optimal solutions, with regard to cost efficiency, affordability, and
service delivery, for resolving development issues.
8. To develop solutions that incorporate safety in design and public safety management principles, with the result of improving the networks performance, reliability and safety.
9. To formulate solutions into a coordinated plan that provides for a sustainable and
flexible development path.
10. To demonstrate the network capacity to connect new load, meet new service expectations associated with that new load, and provide an indication of the responsiveness with which the network can be developed.
11. To determine the preferred options/solutions for addressing foreseeable issues raised
by forecasts.
12. To identify the level of investment and expenditure timetable necessary to cover each foreseeable issue.
13. To develop associated policy necessary to manage risks and forecast fundraising
demands.

Page 105 of 220
10.4 Planning Methodology
The following methodology has been adopted by Scanpower in its ISO55000 Asset Management System;
1. Review standards against company policies and objectives.
2. Determine conductor capacities.
3. Determine contingent capacity constraints for load growth and contingent support at feeder tie points.
4. Analyse base load growth by feeder.
5. Identify load growth driven by econometric factors such as dairy conversion and
irrigation.
6. Identify new loads and projects such as industrial developments, sub-divisions, generation, infrastructure upgrades etc.
7. Project load growth on each feeder over the planning horizon to forecast when
constraints are likely to compromise standards.
8. Determine the optimal network reconfiguration to address issues identified. That is, address the issue of the network’s past design no longer being optimal for its future load characteristics.
9. Re-allocate the growth assumptions and projections across the reconfigured/optimal
network to identify which underlying development issues remain.
10. Determine all the assets that are due for renewal.
11. Determine all the assets that are deemed to have a high public safety risk.
12. Determine all the assets that are in poor health due to overloading, poorly designed, impossible to use or maintain and assets lumped together with minimal isolations.
13. Determine all the assets that require time intensive reactive maintenance, or have
multiple complaints
14. Logically group them together and determine the criticality of the assets. If they are deemed critical, develop strategies, designs and solutions against Scanpower standards that economically enhance the asset while improving the network’s reliability, performance and safety.
15. Investigate alternative development options. A risk assessment test is included to
ensure the network can invest, control, and manage alternatives such that they are able to be committed to as a long term strategy.
16. Determine a development strategy and associated preferred solutions. This process
involves costing to determine which solution delivers the most economic and service value at least cost over the long term.

Page 106 of 220
17. The forecast is then projected with the preferred solutions deployed and the process
reiterated until sufficient development headroom is established, with sufficient flexibility to meet potential development challenges arising in the medium term (10 year horizon).
18. The plan’s timeline is then adjusted for funding considerations.
10.4.1 Limitations of the Planning Process
By virtue of the fact that forecasting involves extrapolating historical data into the future, the NDP has accuracy limitations the further into the long term it is projected. Its long range value is simply to avoid any development issues that may result in not being able to sustainably meet Scanpower’s business objectives. For example, large load developments are unlikely to be visible more than 3 years in advance. Load forecasts are driven by peak demand data which may have very short load duration. Where these peaks affect continuity of supply via protection trippings, then the applying peak demand is a necessity. This results in a worst case forecast. Where there is good diversity or low risk resulting from low duration of peak conditions some judgement on criticality can be made. However, Scanpower’s network is relatively small and fed directly from Transpower at 11kV. Accordingly, there is a comparatively lower level of diversity and feeder profiles are typically dominated by specific load groups, e.g. dairy sheds. Forecast timetables are also quite limited particularly in the short term. It is based on long term historical trend, whereas short-term economic and climatic conditions can create load variance of as much as 40% in a single year. To address development lead-time issues growth forecasts and timing need to be optimistic which is a conservative approach. It is intended that developments that prove to be premature can be deferred. There is also a lower probability that all developments that are possible will ultimately be developed. The plan however needs to demonstrate that they are catered for. Consequently, expenditure forecasts are likely to prove an overstatement. That is, the plan is optimistic. Other limiting factors are asset knowledge, health index and criticality. Though Scanpower has a good knowledge set, the reliability may not be 100% accurate. Thus, the Network Development decision shall have to be determined by a mixture of data and experience. Scanpower is currently in the process of improving data quality, health and criticality and thus improving the investment decisions process.
10.5 Policies and Standards
This section covers Scanpower’s policies and standards that form the set of conditions that justifies the network development. Typically, there can be different reasons that require the asset to be upgraded and not one solution fits all problems. Specifically, this section covers the drivers of network development which includes:
• Voltage Quality
• System Security
• Contingent Capacity
• Growth Forecasting

Page 107 of 220
• Network Gap Analysis
• Public Safety
• Safety in Design
• Capital Renewal & Network Enhancements
• Asset Health and Criticality In short, network development will generally be driven by the renewal process, however if technology, load or regulations changes, or if there is a risk identified to the system voltage, security or public safety, then a Network Development project can still be justified. Less likely, but if system load increases such that it compromises the system voltage, Network Development plans will be developed and put to the Scanpower board for approval.
10.5.1 Voltage Quality
Scanpower will upgrade supply as necessary to meet the following voltage quality obligations:
• Scanpower maintains nominal system voltage delivered at point of connection of the customers assets to its network at +/-6%. Scanpower has no sub-transmission system with automatic voltage control equipment. Its voltage management capability is largely limited to fixed tap settings on distribution transformers. Accordingly, line load voltage regulation must be limited to within the 5% voltage range of is transformers. Regulation over relatively long 11kV lines is the primary constraint issue on Scanpower’s network.
• Transient voltage dips and flicker that present on the network as the result of large loads stopping and starting can cause disruption/annoyance and affect industrial production which in some instances can have more adverse outcomes than a longer outage. Scanpower addresses this by requiring installation design to comply with AS2279. Voltage disturbance is limited by requiring the Point of Common Coupling to be located where the network has sufficient strength to suppress the disturbance to acceptable levels (as defined in its Connection Standard). For large loads this may require dedicated supplies back to bussing points within the 11kV network. In some instances, the Network Development Plan will need to establish suitable bussing and/or voltage control points in key locations.
• Harmonics are an issue on networks with increasing industrial, dairy and irrigation. Harmonics cause increased heating in electrical plant and equipment and reduce the life of network assets like transformers. Scanpower’s Connection Standard requires compliance with NZECP 36 however addressing issues arising has been a reactive process. The EEA has drafted a new standard for more proactive management of harmonic levels on networks – Scanpower has adopted this standard. It is expected that there will be a number of legacy issues to be addressed as a result of changing the standard. Better monitoring is an expected benefit of smart meter deployment.
• Power Factor and losses are issues related to voltage and power quality. These are addressed as part of the assessment of upgrade options. There is very limited economic merit in addressing these issues on a standalone basis.
10.5.2 Security Standard
Scanpower has reviewed its Security Standard and concluded that the industry practice of investing in redundant assets and excess capacity on the basis of load size is not economically

Page 108 of 220
efficient, equitable, or practical on Scanpower’s network. The loads are too small to justify the levels of expenditure necessary to secure supply in this manner. Accordingly, the Security Standard has been rewritten to directly support Scanpower’s outage management objective and target of limiting all HV faults to less than 6500 Customer Minutes Lost (equates to 1 SAIDI minute). This objective treats all customers to a consistent standard – if the fault affects many customers (higher load) as in an urban situation then it must be responded to in a shorter time, if it affects fewer customers as in a remote situation then the response can be longer. The Standard therefore defines the preferred network configuration and contingency provisions necessary to support this objective. For example, specific security provisions for large customers, levels of network interconnection, contingent capacity, and automation. However, with regards to large consumer connections, Scanpower does not upgrade the connections to meet the Security Standard unless the consumer expresses a need for it. Scanpower’s security standard is expressed in Table 19.

Page 109 of 220
Table 19 Scanpower Security Standard
SCANPOWER SECURITY STANDARD
OBJECTIVE All HV faults restored within 1 SAIDI minute following first response getting to site.
LARGE ICPs SECURITY PROVISIONS
> 1000kVA Dual dedicated 11kV feeders from PCC, CB protected
> 500kVA Single dedicated 11kV feeder from PCC, CB protected, critical load secured with Genset
> 250kVA Dedicated LV feeder, Transformer/LV interconnection , LV security customer solution
>100kVA Transformer/LV interconnection - urban only
NETWORK LOAD CENTRES Definition: all load within a mesh network segment able to be by-passed or all load down stream of a radial network segment if not able to be by-passed.
URBAN ICPs
30% Installed kVA
No. of ICP's
km Network
90% ICP Restoration (min)
CML at Risk Contingent Capacity Security Provisions
>2MVA 1000 10 7.5 7500 100% N-1 Closed 11kV N-1 Ring, Auto-Sectionalising, DMS/SPS
>2MVA 500 10 15 7500 1MVA from 2 HV tie points CB Protected, Auto-sectionalising, Remote Control Tie Switches, Scada Indications
>1.5MVA 375 8 20 7500 500kVA from 2 HV tie points CB Protected, Auto-sectionalising, Remote Fault Indication, Manual Tie Switches
>1MVA 250 6 30 7500 1MVA from 1 HV tie point
CB Protected, Manual/Auto Sectionalising, Remote Fault Indication, Manual Tie Switches
>500kVA 100 4 75 7500 100kVA from 4 LV tie points
Ring Main, Manual/Auto Sectionalising, Remote Fault Indication on Tfmr/LV Feeders, Manual Tie Switches
>250kVA 50 3 150 7500 100kVA from 2 LV tie points
Fuse-saver, Manual/Auto Sectionalising, Remote Fault Indication on Tfmr/LV Feeders, Manual Tie Switches
>100kVA 25 2 300 7500 50kVA from 2 LV tie points
Fused, Manual Sectionalising, Remote Fault Indication on Tfmr/LV Feeders, Manual Tie Switches

Page 110 of 220
Table 19 continued – Scanpower Security Standard
Rural (ICP's/km < 5)
20% Installed kVA
No. of ICP's
km Network
90% ICP Restoration (min)
CML at Risk Contingent Capacity Security Provisions
>2MVA 500 100 15 7500 1MVA from 2 HV tie points CB Protected, Auto-sectionalising, Remote Control Tie Switches, Scada Indications
>1.5MVA 375 75 20 7500 500kVA from 2 HV tie points CB Protected, Auto-sectionalising, Remote Fault Indication, Manual Tie Switches
>1MVA 250 50 30 7500 500kVA from 2 HV tie points
CB Protected, Manual/Auto Sectionalising, Remote Fault Indication, Manual Tie Switches
>500kVA 100 25 75 7500 500kVA from 2 HV tie points
Ring Main, Manual/Auto Sectionalising, Remote Fault Indication on Tfmr/LV Feeders, Manual Tie Switches
>250kVA 50 10 150 7500 100kVA from Genset Fuse-saver, Manual/Auto Sectionalising, Remote Fault Indication on Tfmr/LV Feeders, Manual Tie Switches
>100kVA 25 5 300 7500 50kVA from 2 LV tie points
Fused, Manual Sectionalising, Remote Fault Indication on Tfmr/LV Feeders, Manual Tie Switches

Page 111 of 220
10.5.3 Contingent Capacity
Excess capacity is necessary on a network for:
• Provision of headroom for new growth between optimal periods of upgrade.
• Provision for unexpected major loads that would trigger major upgrades unable to be delivered within the development time of the new load. This reduces the “lack of available capacity” from presenting hurdles to economic development.
• Support of adjacent supplies during maintenance outages i.e. operational headroom. Where capacity is constrained, constraint on work practices and timing can increase operational costs.
• Tie capacity between feeders as a specific strategy for minimising unplanned outage and restoration/response times.
• Limiting contingent capacity on each 11kV feeder to a level that correlates to the 5-10% voltage drop band. That is, when voltage drop reaches 5%, a feeder capacity upgrade is triggered. For temporary situations such as new load connecting or outages, Scanpower’s voltage standards relax to 10%.
The main backbones of Scanpower’s 11kV feeders are conducted with “Dog” ACSR (Aluminium Conductor, Steel Reinforced). After de-rating for designed operating temperature, hot spots such as connections etc., Dog has a thermal (current related) capacity limit of 4.4MW. In order for a feeder to carry contingent load of a GXP half-bus shutdown, N-1 design criteria would target a maximum load of 2.2MW on each GXP feeder CB. The Dannevirke GXP bus has 8 feeders distributing 19MW of transformer capacity i.e. 2.4MW each (4.8MW during contingency) which is marginally over the thermal capacity of a feeder requiring load to be balanced and diversity utilised to manage contingency. However, Scanpower’s network has a radial configuration and no sub-transmission with relatively fewer feeders than a more developed network. This means that not only are feeder loads higher than typical 11kV feeders, but the loads are relatively remote to the GXP and not well interconnected. For example, the urban feeders have loads in the order of 2-3MW located more than 6km away from the GXP with minimal distributed load along the way.

Page 112 of 220
Figure 26 Contingent Capacity for Dog Conductor at 11kV
Contingent Capacity for Dog Overhead Conductor at 11kV
Load MW (0.95pf) km to 5%VD km to 10%VD
1.0 14.0 28.0
2.0 7.0 14.0
3.0 4.7 9.4
4.0 3.5 7.0
5.0 2.8 5.6
6.0 2.3 4.7
Note: Thermal limit (MW) Summer @ 75degC 6.7
Derate 35% for connectors, lower operating temp., etc. 4.4
Therefore the 5% VD distance limit (km) at max. thermal rating is 3.2
As a consequence, the network is voltage constrained. That is, high currents over long distances result in voltage drop that exceeds standards. For Dog conductor operated at 11kV the thermal 4.4MW capacity limit is constrained to 5% volt drop at a distance of only 3.2km.

Page 113 of 220
Table 20 Contingent Capacity Calculations by Feeder
10.5.4 Growth Forecasting
The planning environment is currently changing with uncertainty and economic growth being similarly volatile. That is, econometric assessment of likely load growth is indeterminate. Projecting past trends has reached the point where it introduces more error than assuming a zero baseline. Accordingly, Scanpower is not planning for any growth it does not know to be firm. As Scanpower is managing capacity constraint by shifting load between feeders on a year by year basis development strategies are being customised on a feeder by feeder basis.
10.5.5 Network Gap Analysis
Scanpower has no sub-transmission. This means its entire load is segmented into 11 feeders each carrying a high load relative to total system demand. They are operating close to their maximum capacity in terms of voltage constraint and carry insufficient contingent capacity to support a GXP half-bus shutdown without restrictions on outage windows to off-peak seasons and/or severe voltage quality issues. Scanpower has adopted a management practice, shifting the open points/loads from one feeder to its neighbour in order to balance the load connected to each. For obvious reasons load growth projections cannot be derived from comparing feeder loadings from one year to next. At system level there is no net load growth. Feeder load demographics, however, have changed and are creating issues in pockets of the network. This section will discuss what issues have been experienced over the past 3 years and what customised development solutions are proposed if trends continue. In general terms the strategy is to manage voltage, minimise investment in capacity and drive existing assets harder.
Feeder Max Demand Dist. To Load Growth Cap. Primary Tie Dist. to Tie Contingent Load Thermal Limit Cont. Capacity Cont. Capacity
MW km 5% VD km MW % OL 5%VD 10%VD
Central 1.4 6.1 1 ABS 21 – East 6.2 1.2 -41% -0.3 2.0
ABS117 - Adelaide 7.4 1.2 -41% -0.8 1.3
ABS 88 - Weber 5.7 1.2 -41% 0 2.3
East 2.5 6.1 -0.1 ABS 21 - Central 6.2 0.7 -27% -0.9 1.4
ABS197 - Weber 7.8 1.2 -16% -1.9 -0.1
Adelaide 2.5 6.7 -0.4 ABS12 - Mangatera 7.2 1.1 -18% -1.7 0.3
ABS117 - Central 7.8 0.7 -27% -1.4 0.5
Weber 2.4 9.8 -0.8 ABS197 - East 7.9 1.2 -18% -1.8 0.0
ABS 88 - Central 6.7 0.7 -30% -1 1.0
Mangatera 2.3 8.6 -0.7 ABS12 - Adelaide 8.0 1.2 -23% -1.7 0.2
F419 - North 13.9 1.2 -20% -2.5 -1.5
North 2.4 14 -1.4 F419 - Mangatera 6.4 1.1 -20% VR'S 0.7
Pacific 1.6 10.4 -0.1 ABS35 - Te Rehunga 6.8 1.2 -36% closed ring 1.2
Te Rehunga 1.2 4 2.3 ABS35 - Pacific 4 1.6 -36% 0.7 3.5
Danevirke GXP 16.3
Diversified 14.1 115%
Town 1 0.9 2.2 5.1 A106 - Town 2 3.3 0.9 -59% 2.4 5.2
Country 0.9 4.7 2.3 A109 - Town 2 4.7 0.9 -59% 1.4 4.4
Town 2 0.9 2.5 4.9 A106- Town 1 2.6 0.9 -59% 3.9 5.7
Woodville GXP 2.7
Diversified 2.4 112%

Page 114 of 220
With 5 feeders now carrying peak loads in the order of 2.5MW and their load centres exceeding the 6km 5% Volt Drop limitation on Dog conductor, voltage management during peak periods is a dominant operational issue. Scanpower has very limited voltage control capability. Transpower is the primary provider of feeder voltage control but this is achieved by the On-Load Tap Changers on the 110/11kV transformers at its GXPs. Scanpower has the voltage control set point at the highest voltage Transpower will allow. Transpower do not apply the line drop compensation that their equipment is capable of – this would help with seasonal load variation. The underlying issue here is that Transpower operates to transmission operating practices. 11kV, however, is a distribution voltage and different operating practices with regard to voltage management would be applied in a network which managed its own 11kV supply via its sub-transmission system. The optimal operational demarcation for grid supply of Scanpower’s network is therefore for Transpower to operate up to the 110kV transformer incomers and for Scanpower to operate the 110/11kV transformers and their associated 11kV switchboard. That is, the current asset ownership and operation connection assets is sub-optimal. Management of these distribution assets is subject to Transpower’s cost structure. Scanpower has up to 5% of voltage correction it can achieve via the fixed tap settings on each of its distribution transformers but these have limitations as the settings must cope with seasonal variations in load and associated load regulation. Feeders that are peaky in character, such as dairying, challenge the limitations of this capability. Scanpower’s preferred solution for such circumstances is to:
1. Install a bussing point on a feeder to which voltage correction can be applied then split the downstream load into sub-feeders.
2. Install end of line capacitors to help with reactive power draw. 3. Install a static var compensator . 4. Enhance the load management system to allow chunky loads like irrigators to be
turned off during feeder peaks. 5. Install bigger conductor 6. Install voltage regulators at bussing points.
When the network is operating at lower limits of its regulatory voltage standards, voltage issues will typically appear in the consumer’s installation in the first instance e.g. motors won’t start, milking cups drop off etc. The first to be affected are those service mains and sub-mains that are under-sized for the load they have connected. That is, where they have added new load without increasing the capacity of the lines to match. In some instances, the regulatory limitations on volt drop are being exceeded and their supply is dependent on margins in their network connection. While upgrade of their supply will provide some relief for them, it does signal that the network is at its limit of capability.
10.5.6 Public Safety Management & Safety in Design
A key objective of Scanpower’s Public Safety Management System is that it is integrated into the Asset Management Plan. The idea being that an asset’s risk towards the public can directly feed into the decision making process.

Page 115 of 220
As a result, where the opportunity arises, Scanpower will upgrade the network to meet new design standards. Key elements like road crossing heights, protection (fusing), earthing, pole loadings, conductor strength and clearances, physical protection of HV and LV equipment near key public areas can drive Network Development or early renewal. Scanpower is currently doing work in all the above areas however this has not been formalised in the network development plans. Scanpower is still at the early development phase of integrating the public safety into the asset management plans however as an interim measure, all design has “Safety in Design” and “Public Safety” principals applied to them. As a result, Table 21 lists the requirements that are identified when as asset is due for renewal.

Page 116 of 220
Table 21 Scanpower’s Public Safety & Safety by Design Standard Summary
SCANPOWERS PUBLIC SAFETY, SAFETY IN DESIGN STANARD SUMMARY
OBJECTIVE To improve the network’s reliability, performance through public safety and safety in design enhancements for existing equipment that is deemed critical or for new network development projects.
ASSET DRIVER DESCRIPTION
Critical Is on a main feeder line, or equipment that effects over 100 ICPs, of greater than 500 kVA of Load
Poor Condition Has a significant public safety risk, or design flaws that effect the assets performance.
In key public areas
Is located with key public areas, or within large urban population, or key thoroughfare, or key industrial / commercial areas.
Public Safety Management, Design by Safety, Network Development Requirements
Item Public Safety Design By Safety Network Development
Protection (HV & LV)
Has the priority of protecting public from inadvertent livening. Can be done in the form of direct and indirect protection. I.e insulation of protection relays. i.e. HV lines on the ground, car vs pole, LV transformer tank fault etc.
Protection settings or fuses correctly sized based on fault currents that have been calculated or measured to ensure protection operates correctly.
Upgrade equipment if both public safety and design by safety is not met. Install extra reclosers, or fuse savers. Remove group fusing. Convert LV lines to covered conductors, install more transformers etc. Divert lines to reduce public risk.
Earthing (HV & LV)
Has the priority of protecting the public from hazardous voltages experienced during equipment failure.
To ensure that
• Earth potential rises are limited to acceptable values,
• Protection for earths faults will operate as quickly as possible.
Upgrade the earthing system to suit. If Earth potential raises are too high, relocate out of public access, install barriers, install warnings signs
Pole & Conductor Loading
Has the priority of being safe, ensuring assets do not fall over injuring the public. Ensuring conductors are high enough so the public does not come into contact Ensuring if the equipment fails as a result of public interference in a safe manner
To ensure that
• Overhead structures are designed to ANZS 7000.
• Design manuals are in place.
• Overhead structures are constructed as per design.
• Lines do not clash
Upgrade structure / lines, install distribution equipment on different poles, re-route lines if necessary to reduce loadings.
Pole Road Crossing Heights
Are high enough off the ground for normal and abnormal high loads.
To ensure that all high voltage is 6.5m off the ground, and low voltage is 5.5m off the ground.
Install road crossing poles, install LV covered conductor.
Distribution Equipment
To ensure they do not create an undue hazard in normal conditions or when they fail.
Ensure the distributed equipment meets the design and construction manual standards.
Upgrade equipment if a high risk is determined.
10.5.7 Asset Health & Criticality
Scanpower is currently working through a three stage process to help with the asset decision making process. Firstly, asset data quality is being targeted. Secondly, a set of industry recognised standards from the EEA will be used to determine the assets health and thirdly, the criticality of the asset will be determined.

Page 117 of 220
Generally speaking, this system will not be used to justify the amount per annum is spent on Network Development but used as a tool to determine where the money is better spent. i.e. do you spend a dollar on upgrading ten items, or do you spend ten dollars on upgrading one item. This tool will also be used to help justify the need for network development.
10.5.8 Capital Renewal and Network Enhancement
There are two types of capital groups that assets fall into. Capital renewal (i.e. an asset that is due for age-based replacement) and Network Development (i.e. an asset that is being enhanced for external driven factors). Though the two are separate, there are many factors that will require a renewal asset to be enhanced at the same time. As a result, all assets that are being renewed shall go through the previously listed standards and policies to ensure the voltage, security, safety by design and public safety management standards and policies are met. For the most part, the majority of the renewal replacement projects will meet the modern standards, however for critical assets that are overloaded, grouped fused, or pose a public safety risk will require a network enhancement of some type.
10.6 Feeder Development Plans
Figure 27 shows an overview of the Dannevirke network. As shown, Dannevirke consists of a small township load, dairying load near the Ruahine Range and some remote line towards the east coast. Scanpower has five large customers. Any line that passes 10km east of the Dannevirke township is considered uneconomical.
C.B.D Uneconomical Lines
Farming
= Large Industrial Loads
Figure 27 Dannevirke GXP Single Line Diagram

Page 118 of 220
10.6.1 Related to All Feeders
As part of Scanpower’s security standard and design by safety criteria, nine ABSs have been installed in 2018, and from 2020 onwards, one new ABS will be installed per year. The key drivers behind this is the proposed live line policy. Scanpower must now justify live line for all jobs. Due the low customer density, most live line cannot be justified thus de-energised work methods have to be employed. Due to legacy design practices, Scanpower only has just under 180 ABSs. As a result, de-energised work methods will erode Scanpower’s performance. Simply put, Scanpower still needs the ability to carry out planned and unplanned work. The new ABSs will help:
• Reduce shutdowns areas thereby increasing network performance;
• Reduce group and fuse switching thereby increasing operator safety;
• Increase the number of earthing points for issuer applied safety measures thus increasing safety during maintenance activities;
• Load shifting to maintain voltage standards for unexpected load growth;
• Make Scanpower’s existing network comply with the security standards. As mentioned in section 6.5.7, there are current issues with the Auto M8 which is a remotely controlled ABS. The heads of the units are seizing up meaning linemen with bucket trucks and a hot stick are forcibly opening and closing the switch. These units were mainly installed in 2002 and were designed for a 30-year life cycle. Though the control equipment controlling the heads is expected to last the intended life cycle, the heads clearly won’t. As a result, Scanpower has allowed funds in the capital renewal programme to have the remainder of the AutoM8s replaced by the end of 2020. The key driver behind this decision is to:
• Increase operator and public safety
• Increase the performance of the network.
10.6.2 Weber Feeder
As shown in Figure 28, this is the biggest feeder in km terms on the network. It supplies the south-eastern corner of Scanpower’s area – largely dry land sheep farming. Its dominant industrial consumer is the Kiwi Lumber saw mill located approx. 10km from the GXP. The feeder extends for over 70km without any voltage correction – load density past the saw mill is therefore very low.

Page 119 of 220
Figure 29 Weekly Load Profile of the Weber Feeder
Figure 29 above illustrates the following load characteristics of the feeder: Kiwi Lumber does not mill over the weekend. This gives an indication of its load dominance when it is at full production. The saw mill suffers voltage issues at times of high load; however, a large contributor to these problems has been their own extremely poor power factor. Originally the feeder was split into two main branches which allowed load to be balanced across the dual routes. In order to alleviate voltage constraint at Kiwi Lumber, however one branch of the Weber feeder was shifted onto the East feeder which carries the load of the industrial area of Dannevirke.
Weber Feeder
New Busing Point
Kiwi Lumber
Old Busing Point
Figure 28 Weber Feeder on Dannevirke Single Line Diagram

Page 120 of 220
As referred to in a previous NDP, the existing 1.5 km Aerodrome line was upgraded with Dog conductor, and a new 1.1 km line installed consisting of 185 Aluminium HV cable and dog conductor. This links the new busing point on the corner of SH2 and Laws Rd as shown on Figure 28 to what was then the spur line off Weber Rd. This effectively shifted the HV bussing point back 2.4km towards the Dannevirke GXP. Once the line was upgraded, the Kiwi lumber load was shifted off the east feeder and placed back onto the weber feeder. This allowed the separation of the rural and urban feeders at the old busing point on Makirikiri Rd. The East feeder now has 750 kW of spare capacity to back-feed the urban feeders if necessary. Overall this project has alleviated the voltage drop at Kiwi Lumber and has added in some spare capacity for any future load growth. Kiwi Lumber upgraded its supply capacity by 500kW at the end of 2015 and added power factor correction. They have also added additional kiln capacity, so this upgrade is an expansion in production capacity. In the longer term any voltage issues encountered at the remote end of the Weber feeder will be addressed in the first instance by the installation of end of line capacitors. Apart from the installation of new ABSs and enhancements to the Auto M8s, there are no planned upgrades at this stage.
10.6.3 Mangatera Feeder
As shown in Figure 30 This feeder supplies the north end of Dannevirke and the Alliance Freezing Works. It previously supplied all the way out to Ormondville. The rural load past the Works was shifted onto the North Feeder when Voltage Regulators and sub-feeders were developed at Matamau. This reduced the security risk to urban and major loads from faults on the rural network. It also allowed the Mangatera feeder to carry more contingent capacity.

Page 121 of 220
The previous plan was to install a bussing point at the north end of Dannevirke (Smith Rd/Adelaide Rd), where 3 sub-feeders would be developed, and off-load the Adelaide feeder which has a very high residential load peak. Because of a fault on a section of line feeding the Works that passes across farmland with poor access through a forestry plantation, it was decided to relocate the line via a 500m rebuild along the roadside. This changed the preferred location of the proposed Dannevirke North bus to the intersection of Smith/ Guy / Ruahine / Umutaoroa Rd. Load has been shifted onto the Mangatera feeder as shown in Figure 31 from the North and Adelaide feeders to balance their peaks to approx. 2.5MW each. Sub-feeder development will be reduced by the addition of circuit breakers at the start of Umutaoroa Rd (a high density life style block area of 63 ICPs including 6 dairy sheds). This will isolate these areas from impacting the Works supply when they fault.
Figure 31 Weekly Load Profile of the Mangatera Feeder
Alliance Mangatera Feeder
New Recloser
Figure 30 Mangatera Feeder on Dannevirke Single Line Diagram
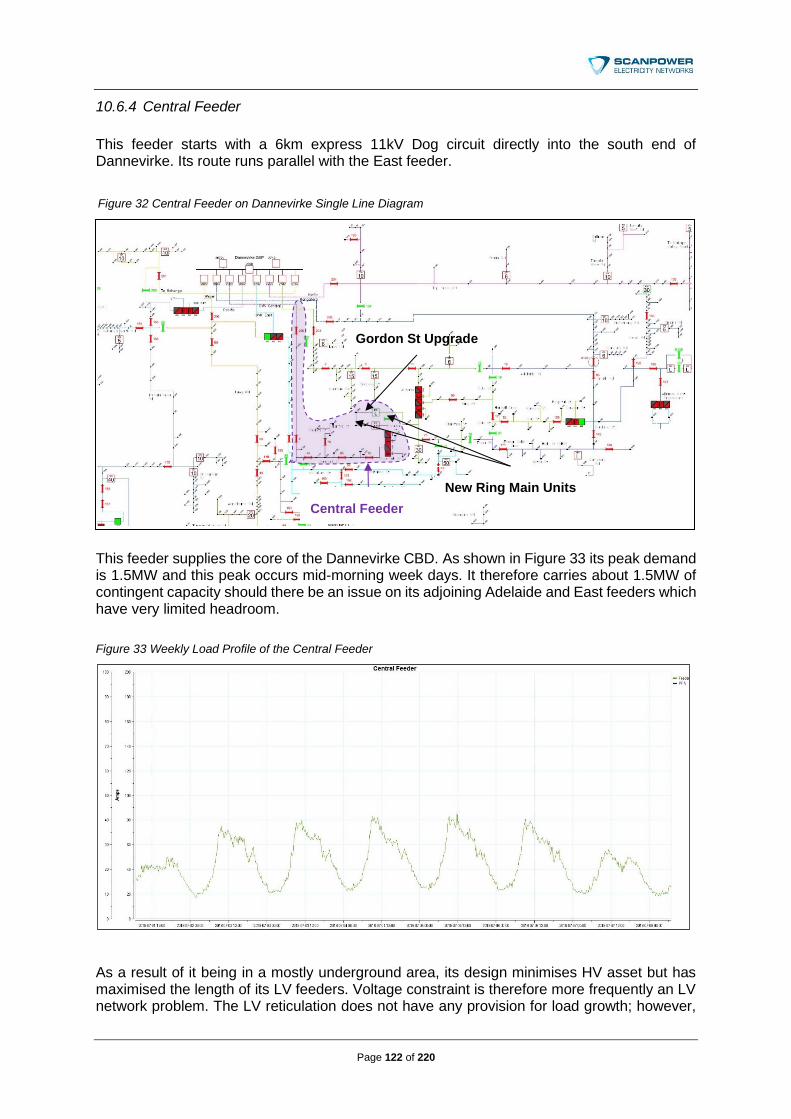
Page 122 of 220
10.6.4 Central Feeder
This feeder starts with a 6km express 11kV Dog circuit directly into the south end of Dannevirke. Its route runs parallel with the East feeder.
This feeder supplies the core of the Dannevirke CBD. As shown in Figure 33 its peak demand is 1.5MW and this peak occurs mid-morning week days. It therefore carries about 1.5MW of contingent capacity should there be an issue on its adjoining Adelaide and East feeders which have very limited headroom.
Figure 33 Weekly Load Profile of the Central Feeder
As a result of it being in a mostly underground area, its design minimises HV asset but has maximised the length of its LV feeders. Voltage constraint is therefore more frequently an LV network problem. The LV reticulation does not have any provision for load growth; however,
Central Feeder
Gordon St Upgrade
New Ring Main Units
Figure 32 Central Feeder on Dannevirke Single Line Diagram

Page 123 of 220
the counter to this is that, in general, voltage issues will occur within the consumer’s installation or service main. Scanpower’s strategy to address LV capacity issues in the urban area is as follows:
• Require all supplies exceeding 100A/phase to establish their Point of Common Coupling back to the LV rack of the nearest distribution transformer.
• If more transformer capacity is needed, the issue is resolved by increasing transformer density i.e. installing an intermediate transformer between two existing transformers. This halves the length of the LV cables and increases their capacity.
• Establish LV interconnection between LV distribution substations so contingent capacity is developed in the LV network. Greater LV interconnection allows better utilisation of DG.
This is a slow and expensive exercise for Scanpower so is only undertaken on an “as required” basis to a master plan. Approximately one new substation is installed in Dannevirke p.a. at a cost that may exceed $150,000. At this time, Scanpower has not found it necessary to levy new capacity charges. The implications for this are that any new business or building development in the CBD will generally trigger a relatively expensive upgrade of the consumer’s service and upgrade of the connection asset. This can lead to reassessment of economics so new electric load for say heat pumps may lose out to an upgraded gas supply. One major project in the CBD that was described in the 2019-2029 AMP was the Gordon Street ring upgrade. As shown in Figure 34, there were three pad mount transformers sitting in series fed from a set of normally closed high voltage expulsion fuses on one side and the other side with a normally open set. These pad mount transforms are group fused meaning any fault in the five sections of cable would result in a prolonged outage within the CBD. These transformers supply several businesses including the police station, court house, BP and KFC. There is no LV back-feeding, and there are operator safety issues with the DDOs. To get an outage to replace any section of the ring or transformers requires the co-operation of all the business which is virtually impossible. As a result of this project which is shown in Figure 35
1. LV inter-ties between all three distribution transformers and standard LV distribution cabinets at each transformer have been installed.
2. This will allow the LV to be fed from generators, or the load of one transformer can be supported from neighbouring transformers.
3. Three ring main units have been installed with fault pass indicators allowing any faulted sections of high voltage cable to be isolated via operator action allowing power to be restored quickly to the CBD.
4. With each transformer having individual protection means improved security in the event that a transformer fails. All power can be restored via back feeds if necessary.
5. Has improved the resilience, security and reliability around the Dannevirke CBD while reducing one of Scanpower’s biggest risks on the network.

Page 124 of 220
6. Has improved operator and public safety with a reduction of restoration time from one day to half an hour.
Figure 34 Gordon Street High Voltage Ring Before Network Development
Figure 35 Gordon Street High Voltage Ring After Network Development
Another project earmarked for 2023 is to reinforce the low voltage network that supplies key businesses in the Dannevirke CBD. Figure 36 shows the current configuration while Figure 37 shows the proposed development. The idea is to provide an LV intertie and increase the capacity of LT 721 to 500 kVA.

Page 125 of 220
This means in the event of a transformer or HV cable fault, power can be quickly restored to the affected area. Two new LV distribution cabinets with generator sockets will be installed to help segregate and reinforce the low voltage network supplying High Street.
Figure 36 High Street Low Voltage Network As Is
Figure 37 High Street Low Voltage Network Proposed Network Development
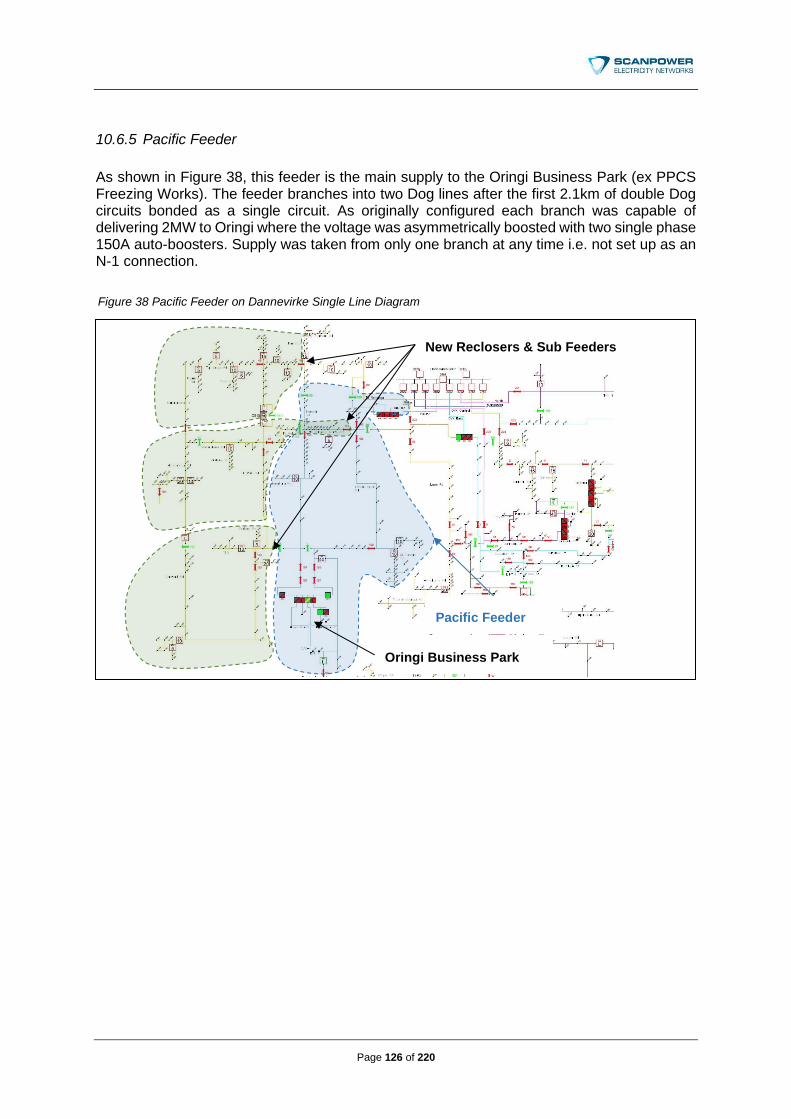
Page 126 of 220
10.6.5 Pacific Feeder
As shown in Figure 38, this feeder is the main supply to the Oringi Business Park (ex PPCS Freezing Works). The feeder branches into two Dog lines after the first 2.1km of double Dog circuits bonded as a single circuit. As originally configured each branch was capable of delivering 2MW to Oringi where the voltage was asymmetrically boosted with two single phase 150A auto-boosters. Supply was taken from only one branch at any time i.e. not set up as an N-1 connection.
Pacific Feeder
Oringi Business Park
New Reclosers & Sub Feeders
Figure 38 Pacific Feeder on Dannevirke Single Line Diagram

Page 127 of 220
Following closure of the works, load halved to that of the remaining Oringi Cool Store operation which accounts for approximately 800kW of very high load factor load. Metering arrangements were altered from centralised 11kV metering to LV metering at individual load centres. Specifically, much of the 11kV switchboard has been bypassed. The auto-boosters have been redeployed in a 3 phase configuration at Matamau where the old regulators had reached their capacity limits. Scanpower owns and operates the site. The following new load has materialised at the Oringi Business Park over the past 5 years as the site has become more fully tenanted:
• The OCS freezer capacity has been increased by 20%. The OCS facility is now leased to independent cool store operator. Handling volumes are up. An additional 200kW of load.
• Downers has formed an alliance with the Tararua District Council replacing the council’s roading contractor InfraCon. Their office and depot are located at Oringi – they occupy the other half of the administration building where Scanpower’s HQ is located. An additional 100kW of load.
• A sausage casings processing plant is operational on site. An additional 200kW of load.
• There is the potential for an extra 450 kW load growth as existing tenants increase their production.
It was predicted that load at Orinigi would climb to 1.8MW, however this has not eventuated. Figure 40 shows the typical load profile of the Pacific Feeder. Though it is flat compared to the other feeders, it is energy intensive. Currently the load at Oringi is peaking around 1.0 MW which is 450kW below the voltage constraints (which has been determined by electrical load flow simulation scenarios). This is not a lot of headroom considering if an extra 500kW of load is added.
Dual Dog Feeders, Each Protected by a Feeder CB
Open Ring (Future N-1 Security)
Sub Feeders (Off Main Ring)
Split Circuit
Figure 39 Pacific Feeder (Final Configuration) on Dannevirke Single Line Diagram

Page 128 of 220
Figure 40 Weekly Load Profile of the Pacific Feeder
Oringi is currently looking at leasing existing spaces to new and existing tenants. As a result, extra load growth at Oringi is not unrealistic. The key for Scanpower is to be agile enough to respond in a timely manner without investing in infrastructure that has minimal or no return on investment. Add to this, the end of the Te Rehunga feeder has being experiencing some voltage issues in the previous summer due to major irrigator usage in conjunction with dairying. The Te Rehunga feeder was drawing 2 MW of load, which in its current configuration was mainly supplied using ferret conductor. As a temporary mitigation, the end of the Te Regunga feeder (which is past Oringi) was transferred onto the Pacific Feeder which allowed this section to be supplied via dog conductor. This increased the voltage to acceptable values, however the security at Oringi was reduced. As a result, Scanpower has completed the following network development projects in the 2018/2019 financial year which was:
1. Splitting the dual circuit on a single pole located on the corner of Kumeti Road and Te Rehunga North Road allowing two independent supplies to feed Oringi from Dannevirke GXP (The Pacific and Te Rehunga feeders). As is shown in Figure 39, there is now an open ring that supplies Oringi, with the open point being located at the Oringi 11 kV switchboard. In this configuration, power can be restored to Oringi within 10 minutes if there is a fault on either feeder.
2. Installing three reclosers as shown in Figure 38 which created three sub feeders from
the two main circuits into Oringi. This has improved the security of supply to Oringi and the general region. This has also improved the voltage quality in the area with heavier conductor now being located closer to the higher load density.
3. This allowed the temporary configuration mentioned before to now become permanent.
This project only required minimal investment that resulted in the increase of security, reliability and performance on the Pacific and Te Rehunga feeders, while improving Scanpower’s ability to respond to any unforeseen load increases in the area.

Page 129 of 220
Any future network development at Oringi will be triggered via:
• A load increase of 450 kW, or.
• An asset renewal of the 11 kV switchboard due to age. Provided that the load does not trigger an early network development, then the business park high voltage network is due to be upgraded during the 2024 and 2025 financial year. Figure 41 shows the current configuration while Figure 42 shows the proposed configuration. In summary
1. There will be an indoor / outdoor conversion of the 11 kV switchgear that consists of: a. Two automated ring main units being installed at the point of supply to Oringi; b. Two RMUs being installed in conjunction with a new underground / overhead
ring that will be installed around Oringi Business Park, that will allow the portions of the Oringi load to be swapped between different Transpower feeders if necessary, to mitigate voltage constraints.
2. The consolidation of the LV metering points and distribution transformers. 3. If loadings exceed voltage constraints, then provisions have been made for installation
of voltage regulators. This design means the decentralisation of the indoor switchboard that allows the removal of the existing building which could make space for future development. For any unexpected load growth, Scanpower shall apply for extra funding from the board of directors.
Figure 41 Oringi Business Park Network As Is.

Page 130 of 220
Figure 42 Oringi Business Park Proposed Network Development
10.6.6 East Feeder
As shown in Figure 43 this feeder starts with a 6km express 11kV Dog circuit directly into the south end of Dannevirke. Its route runs parallel with the Central feeder. At this distance, its 5% Volt Drop constraint is 2.4MW. Its previous peak demand was 2.6MW but is now 2.3MW after the temporary configuration where it carried 600kW of one of the Weber feeder branches was reversed back to nominal state. It supplies a mix of industrial, commercial and residential load. Figure 44 shows the weekly load profile.
East Feeder
Wool Spinners
Figure 43 East Feeder on Dannevirke Single Line Diagram

Page 131 of 220
Figure 44 Weekly Load Profile of the East Feeder
Having these two express lines into Dannevirke terminating at the same location creates an opportunity to establish a bus at the south end of town, apply voltage correction and split the load into smaller sub-feeders. This was in fact the earlier development plan when Feltex Wool Spinners was progressing development of its Dannevirke site (on the East feeder) – planning was well advanced, and plant was being relocated from Australia – the project was relatively firm from a network planning perspective. Following the closure of the Summit Mill in Oamaru, Feltex purchased that site (which is much larger than Dannevirke) and decided at short notice to consolidate their expansion at Oamaru. Accordingly, the projected growth on East feeder changed to a significant loss of load which highlights the fickleness of the network planning environment. There are no plans at this stage to develop the East feeder and none of the industrial consumers it supplies are signalling expansion although normal organic growth of their businesses appears strong – MetalForm’s recent increase in production for example. The LV network is similar to the Central feeder and is managed in a similar fashion.
10.6.7 North Feeder
Figure 45 shows the “North” feeder on the Scanpower network. The North feeder has been upgraded with higher capacity voltage correction (3MW) at Matamau and the development of sub-feeders to Norsewood and Ormondville. Norsewood has a significant pocket of dairy farm load which is growing modestly, driven by increased chilling standards. This results in a very peaky morning and afternoon demand profile during milking season. This peak is not coincident with the system peak so is not seen as load growth at the GXP. Chilling milk faster increases demand but not overall energy consumption.

Page 132 of 220
There is also dairy load on the main feeder upstream of the regulators at Matamau. Growth of this load affects the optimal location of the regulators. Should load grow to a point where voltage drop exceeds the regulators correction capability then the regulators will need to be moved closer to the GXP or a large-scale conductor upgrade would need to be undertaken. Neither of these options are economic for Scanpower, therefore its strategy in this scenario will be to add capacitors to boost voltage. With the Norsewood dairy load being 35km from the GXP there are significant limitations on peak demand even with voltage correction. The maximum total demand the North feeder can be economically developed for is 2.5MW. The feeder reached this limitation in 2015. It has been relieved by shifting the load on the Umutaoroa Rd spur to the Mangatera Feeder as described above. Dairying represents approx. 50% of the feeder demand i.e. 1.25MW. Power factor is quite good and appears to only drop below 0.95 when pumping load is high. Analysis of the North feeder load profile as shown in Figure 46 indicates the morning peak is approximately 500kW starting at 6am, peaking at 8am and finishing at 11am. The afternoon peak is approximately 350kW starting at 3pm, peaking at 3:30pm and finishing at 6pm.
Norsewood Sub Feeder
North Feeder
Busing Point & Regulators
Ormondville Sub Feeder
Figure 45 North Feeder on Dannevirke Single Line Diagram

Page 133 of 220
Figure 46 Weekly Load Profile of the North Feeder
Load on the North Feeder has been steady so far. Scanpower is continuing to monitor any voltage issues and load growth. If voltage violations do arise, Scanpower will look at demand side management first, then alternative technologies such as line capacitors which are a relativity cheaper solution to the traditional conductor upgrades. The addition of solar energy to dairy sheds – either as direct hot water or PV – is also a more economical solution and something Scanpower will encourage investment in. The peaky nature of their load and their winter off season is a good match for PV. Every dairy shed could carry and use at least 10kW of PV. There are approx. 270 dairy sheds on Scanpower’s network, so this is minimum 2.7MW development opportunity.

Page 134 of 220
10.6.8 Adelaide Road Feeder
At 3.0MW the Adelaide feeder is Scanpower’s most heavily loaded. It is dominated by residential high evening peak demand and a smaller morning peak which is coincident with the system’s winter peak. It complements the high morning peak and lesser evening peak of the Central Feeder.
As shown in Figure 47 its load centre is 6.1km from the GXP and so the 5% volt drop constraint is approximately 2.1MW. Voltage is maintained at acceptable standards via the high GXP set-point and fixed taps on distribution transformers. However, the Network is relatively blind with regard to its knowledge of LV network loading – it is therefore in reactive mode when an issue arises. Figure 48 shows the weekly load profile.
Figure 48 Weekly Load Profile of the Adelaide Feeder
Adelaide Feeder
Figure 47 Adelaide Feeder on Dannevirke Single Line Diagram

Page 135 of 220
Its area of supply is built out by the Central, East, and Mangatera feeders – none of which, either together or individually, are able to carry its load. Most voltage issues that occur from time to time with localised load growth, occur in the LV network where feeders are operating at full capacity. This triggers additional distribution transformer installations with improved LV interconnection. Unlike rural locations the constraint tends to occur in the network reticulation as compared to the consumers’ service connections. With residential load becoming increasingly less energy intensive it is not residential load growth that is triggering upgrade but more typically commercial/community premises upgrade. These loads tend to be more easily ring fenced for user pays development. A network development has been scheduled for 2020. Figure 49 shows the present configuration on Allardice Street near the Hub. Currently there are three transformers that are group-fused together, meaning, in the event of a high voltage cable fault, transformer fault or LV rack fault, 100 customers within the CBD will lose power. Figure 50 shows the proposed network development. By installing the RMU, this will allow each transformer to have its own protection thus increasing the reliability and security of the network. There are no other upgrades planned for this feeder and the preferred response will remain reactive in nature and slow.
Figure 49 The Hub Transformer (Allardice Street) Network As Is

Page 136 of 220
Figure 50 The Hub Transformer (Allardice Street) Network Proposed Network Development
10.6.9 Te Rehunga Feeder
The Te Rehunga feeder supplies the main dairying area to the south of the Dannevirke GXP as shown in Figure 51. With a 1.3MW peak, it does experience some voltage constraint issues at its extremities where the 11kV conductor is light (Ferret & Gopher). As in other dairy load areas the growth is consistent with a trend towards peakier demand but not necessarily higher consumption. Real load growth is limited to the upgrade of old sheds to larger modern sheds plus some intensification in irrigation. Figure 52 shows the weekly load profile of the feeder. The feeder has been redeveloped as part of the upgrade of the Oringi Supply described in section 10.6.5. Within the 2020 financial year two new 50 kVA supplies down Oringi and Jackson Road triggered a network development project on the high voltage supplies. There is currently 700 kVA of load that is supplied by gopher conductor. The predominant load is irrigators that take water from the Manawatu River to supply local dairy farms. The peak load occurs during summer meaning any permanent solution is only needed during that time. Though the line upgrade was the optimal solution, it would only be needed for two months of the year. The idea being the portable SVG unit is to have the ability to relocate around the network where there are voltage constraints at different times of the year. Scanpower reused a spare 500 kVA transformer, cargo container, LV switchboard and designed inhouse a portable and containerised SVG unit. Scanpower was loaned a 300 kVAr generator from Power Electronics New Zealand in Napier and the unit was successfully commissioned in December 2019. Provided the trial goes well, there has been provision in the Network development plan to invest in a permanent unit for the 2020/2021 financial year.
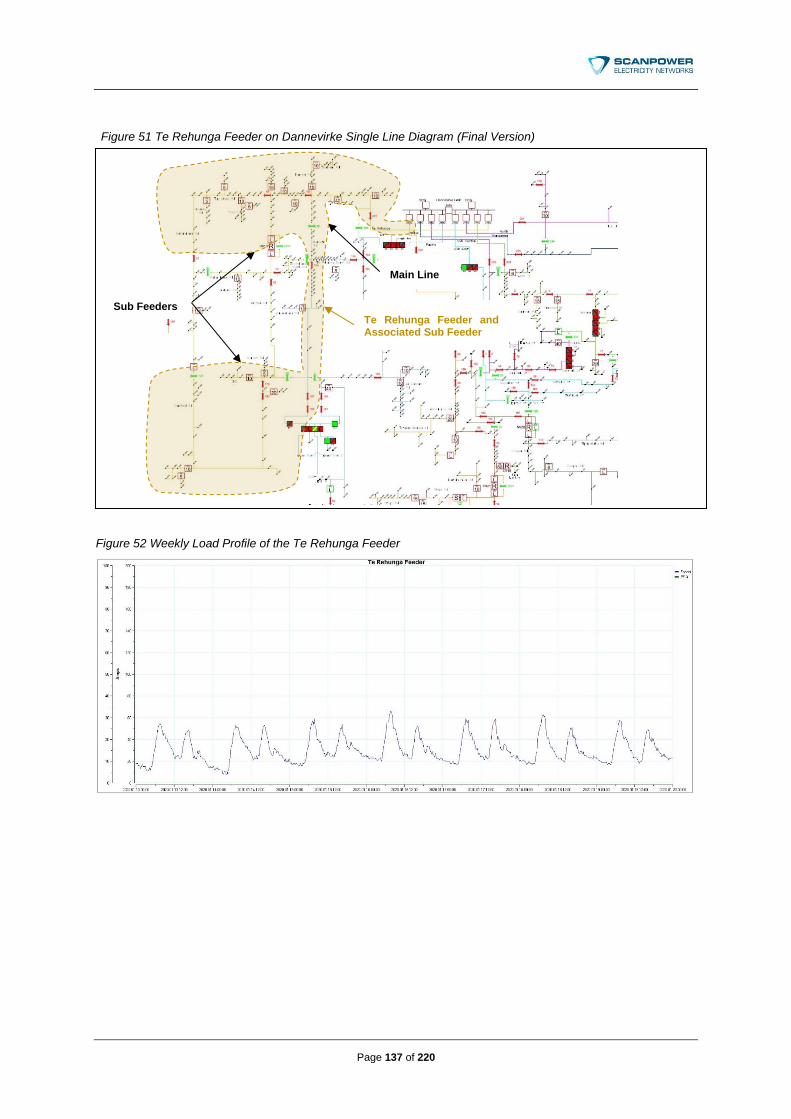
Page 137 of 220
Figure 52 Weekly Load Profile of the Te Rehunga Feeder
Te Rehunga Feeder and Associated Sub Feeder
Main Line
Sub Feeders
Figure 51 Te Rehunga Feeder on Dannevirke Single Line Diagram (Final Version)

Page 138 of 220
10.6.10 Woodville Feeders
The entire Woodville area is supplied via an isolated network segment as shown in Figure 53 consisting of three 11kV feeders, Town 1, Town 2 and Country, fed out of the Transpower Woodville GXP. The 93MW Te Apiti Wind farm injects at the same GXP. Their combined demand is approx. 2.1MW (which is approximately equal to a single feeder on the Dannevirke GXP) and they are reasonably balanced at about 900kW each.
Figure 54 Weekly Load Profile of the Woodville Feeders
Country Feeder
Town 1 Feeder
Town 2 Feeder
New Recloser
New Back feed to Kumeroa Kumeroa Spur
New Bussing Point
Normally Open
Normally Closed
Figure 53 Woodville Single Line Diagram

Page 139 of 220
The GXP experienced the loss of approx. 200kW of very high load factor demand when the Whariti TV transmitter turned off analogue transmission – there has been no recovery from this loss of load. The Woodville township services travellers and has no industrial load of significance. The surrounding rural area is predominantly dairying and has the same options for PV development as with all dairy sheds. The area has very little irrigation load. There was an isolated spur feeding the Kumeroa community. The SAIDI cost of outages in this area is high. The entire network segment and the load on it, is not efficiently serviced by the transmission system. For the same cost as 3-5years of transmission charges it is feasible to by-pass the transmission system with a standalone DG arrangement with a gas engine base load plus household PV solution. There is also the opportunity to embed the network behind the Te Apiti generation. Any decision to do so will be influenced by how the market for PV and batteries develops particularly at distribution network scale. Transmission and grid-connected generation pricing are current factors that affect certainty of the business case. As described in pervious AMPs, the Kumeroa spur which supplied from the corner of Pinfold Rd and SH2 has over 150 ICPs. This issue was exacerbated by the remaining hardwood poles due for replacement on this spur. Any prolonged outages will be very SAIDI and SAIFI intensive. The previous AMPs suggested that Kumeroa could be fed from:
• The Dannevirke GXP via Jackson Rd (the Te Rehunga feeder) or from;
• A new river crossing on the Manawatu river from the Town 2 Feeder (Woodville GXP). After further investigations, it was determined that:
• There is no spare capacity on the Jackson Rd feeder from the Dannevirke GXP;
• Tying the Woodville & Dannevirke GXP together requires Transpower approval which adds another complexity to the network;
• As Scanpower is metered at the GXP, consolidating the Kumeroa metering could become convoluted;
• Getting easements from DOC, LINZ & Horizons to cross the Manawatu river would be difficult.
As is shown in Figure 53, it was decided that the second feed to Kumeroa would be installed along Bluff Rd which included:
• A 624-metre run of new 185 3core AL HT underground cable installed in ducts;
• A new 670-metre line with new poles and conductor being installed;
• An 1,850-metre upgrade of crossarms and conductor to ferret,
• A 900-metre conductor upgrade to ferret; As a result of the completion of this project in the 2018/2019 financial period, it has delivered the following:
• A new bussing point on Nelson St in Woodville which has; o Two incomers:
▪ One normally closed (Country Feeder) and; ▪ One normally open (Town 2).
o Three sub-feeders which are: ▪ Pinfold Rd Feeder; ▪ SH2 Kumeroa Feeder;

Page 140 of 220
▪ Range Rd Feeder.
• A normally open point has been created at the Kumeroa Bridge allowing the load at down the Range Rd and SH2 leg to be halved, which has improved the voltage quality at Kumeroa;
• A closed ring that will allow sections of line on SH2 to be isolated for hardwood pole replacements without interrupting supply to Kumeroa.
• Peanut sectionaliser located on Oxford Rd that was protected directly by the Country Feeder breaker at Woodville point of supply has been removed:
o Previously a fault on the Pinfold Rd circuit would cause the Transpower breaker to operate, resulting in fluctuating power for the entire Kumeroa Rd area.
10.7 Network Development - Secondary Assets
10.7.1 Low Voltage Data Loggers & Real Time Monitoring Devices
The traditional philosophy of the electricity distribution network may no longer suit the changing environment. With the uncertainty of electric vehicle uptake and solar generation onto the Scanpower network, there is a risk that the existing infrastructure may not cope with the extra demand. As with most distribution companies, the high voltage network is documented, measured and controlled in such a way that investment decisions are relatively easy. The same cannot be said for the low voltage network. Currently Scanpower has limited loading knowledge of the low voltage network, and capital renewals and network development tends to be more reactive than proactive. The key with making investment and asset management decisions is having the correct data. In order to reduce the risk on the low voltage network with the potential change of load, the network division has been approved capital to buy twenty “low voltage data loggers and real time monitoring devices”. The intention is to connect these devices to key and high-risk transformers around the network. Once connected, regular current, voltage and temperature data can be stored, allowing the network team to have a better understanding of the network loadings. These devices will also be connected to a radio or IP network allowing real time data to be send back to the control room. Functions such as loss of power alarms can be set up allowing the faultmen to respond to low voltage distribution faults before our customers notify us. The data measured by these devices will be invaluable. Overloaded transformers and circuits will be detected before they turn into faults. Capital renewal and network development decisions based on loading trends can be more accurately made. When electric vehicle chargers do arrive on the network, Scanpower will be in a better position to respond and have better justification for new network development. Ten pad mount and five pole top data loggers have been successfully installed on the network. These units have been giving real time information about the consumption on the low voltage network. Scanpower is waiting for more data to come from these units for trending information.

Page 141 of 220
10.8 Network Development Budget Forecast
Table 22 shows the 10 year network forecast. The values given are in nominal terms with a yearly inflation of 2% Generally speaking, the first three years of the NDP will be accurate, however due to the uncertain future, it is feasible that new technologies, loads or regulations may drive some unplanned development. To accommodate this, Scanpower has made provisions for network development from 2026 onwards. Similarly, as described in section 11.9, Scanpower has also made provisions for unplanned network development. More specifically accommodating new network connections or existing upgrades. Scanpower has designed the budgets so the planned network development is not compromised by unforeseen or unplanned development. If necessary, Scanpower will ask the board for extra funding to cover the gaps. It’s Scanpower’s view that any investment in new load will only benefit the community and Scanpower in the long run. The above development strategies have been summarised into a programme and their costs estimated based on network valuation building blocks. The budget is summarised below.

Page 142 of 220
Table 22 Network Development Budget Forecast
($000) 2021 2022 2023 2024 2025 2026 2027 2028 2029 2030
Power Quality and Voltage Improvement
Static var generator installation - Jackson Rd / Norsewood / Weber 86 - - - - - - - - -
Other voltage improvement technology - - - - - 55 56 57 59 60
Network resilience, security, reliability and reinforcement improvements - - - - - - - - - -
Air break switch installation - 16 17 17 17 18 18 18 19 19
Allardice street upgrade - 153 - - - - - - - -
High Street CBD Upgrade - - 156 - - - - - - -
Oringi Business Park Upgrade - Phase 1 - - - 159 - - - - - -
Oringi Business Park Upgrade - Phase 2 - - - - 162 - - - - -
Dannevirke & Woodville Low Voltage Reinforcement - - - - - 55 - 57 - 60
Customer Initiated Works - - - - - - - - - -
Customer Initiated Capacity Upgrades / Transformer Changes 32 33 33 34 35 35 36 37 37 38
Customer Initiated Works Associated with New Connections 32 33 33 34 35 35 36 37 37 38
Network Automation - - - - - - - - - -
Low voltage network monitering - data loggers installation 53 - - - - - - - - -
Recloser, Ring Main Unit & Sectionaliser installation - - - - - - 56 - 59 -
Other - - - - - - - - - -
To be Determined (Subject to Technology / Load Change etc) - - - - - 55 56 57 59 60
Total Network Development 203 235 239 244 249 254 259 264 269 275

Page 143 of 220
10.8.1 Comment
At system level, the network has been experiencing negative growth over the past 10 years. Load demographics are changing to lower consumption with more peaky and seasonal demand profiles. This can drive the need for network development, particularly at feeder level where there is less diversity. Scanpower has limited and deferred development until actual constraints materialise. In these circumstances there is no margin for further deferral with declining performance. In the face of no revenue growth from changing load characteristics, it has been Scanpower’s risk mitigating choice to leave development expenditure to the last minute which has a financial consequence of lumpy investment requirements. It is also a fact that with high uncertainty and a zero growth signal, development plans are very short as they only include reactive response to firm issues. However, at a pragmatic level, Scanpower has limited resource when it comes to large work programmes. When these projects are triggered, work must necessarily be curtailed on routine maintenance and renewal programmes. We do not take on additional resourcing for short-term work and these projects do not have a revenue stream to support contracting in additional resources i.e. we must live within our means and capacity. It may be concluded that Scanpower manages its budgets on an annual plan as opposed to relying on longer term regulator-prescribed planning and pricing with any level of dependability or accuracy. The facts are; the future is facing disruption and tomorrow’s solutions to tomorrow’s problems do not necessarily exist yet.

Page 144 of 220
11 LIFE CYCLE MANAGEMENT
11.1 Summary of Life Cycle Management
Scanpower does not have a significant population of any specific category of asset that is considered critical in terms its primary service delivery objectives – keeping the lights on. The bulk of its asset is an 11kV/400V pole mounted electricity distribution network. The age and condition related replacement of hardwood poles in this network is the primary focus of Scanpower’s life cycle management activity. The previous plan has improved the targeting replacement of assets and network segments where condition is driving performance. A wooden pole inspection program has been completed and hardwood poles are on a replacement program based on their remaining strength and condition. Risk based on condition, and consequence of failure are also factored into the replacement program. Hence why all hardwood poles within the CBD are being prioritised over remote poles. Scanpower’s hardwood pole replacement programme is due to be completed in 2024. After then, there will be more focus on crossarm replacement along with targeting specific softwood poles. The extra attention/pace placed on the LV network (which had passed the optimal point for renewal) has recovered position. Accordingly, this focus will continue and is being extended into consumer owned service lines. Service line condition and the need for replacement, is an issue that affects Scanpower’s costs but is not an asset Scanpower owns. The industry is still in the process of determining how it will respond to this issue. The transformer population is approaching its optimal service life and because it is relatively expensive to renew, it will be pre-emptively replaced via opportunistic renewal policies as part of other work programmes in order to spread replacement over a wider time period. Scanpower has found that the LV network in rural areas suffers from line clashing as a result of being underbuilt on pole lines with too greater span length for conductor spacing. Additionally, the length of circuits is too long with respect the voltage drop and the loading. The response has been to reduce LV by adding additional transformers dedicated to individual loads, which is economic where load has grown. Scanpower’s next asset life cycle strategy is to target the transformer population. From 2025, at least forty pole top transformers and eight ground mount transformers will be renewed per annum. The ground mount transformers tend to supply electricity within key urban areas, thus from a risk based approach more emphasis will be placed on their renewals. Pole top transformers tend to supply rural customers where there are typically less than five ICPs per transformer. They are relativity easy to replace and represent a low risk to the business if failure occurs thus it is reasonable to run these assets to the end of their life cycle. Tree management is currently a significant non-asset but a performance driving issue on Scanpower’s network. Forestry outside the regulatory clearances is the main contributor. Scanpower has established major resourcing capacity to address these issues. Tree trimming funded by the network is a major component of life cycle costs. With a recent increase in trend of tree faults on the network, Scanpower has moved to introduce a three-pronged attack to manage trees on the network. Firstly, Scanpower is increasing the tree maintenance spend to $600k for the next five years on the network meaning there will be a full time crew completing tree maintenance, reactive to faults and working alongside the network division. Secondly, Scanpower is actively working with local

Page 145 of 220
forestry and tree owners on the removal of trees. Where required, Scanpower will drop the lines to enable forestry blocks to be safely cleared. Thirdly, Scanpower will target early line renewals where multiple faults have occurred and redirect the line to eliminate the tree hazard. Work continues to incorporate “public safety” and “safety in design” into the renewal process. When enhancement of the existing asset data process is completed, factors such as health and criticality can be determined. From there, risk and consequences for each asset can be determined which will aid in the renewal process.
11.2 Introduction to Life Cycle Management
In terms of ISO55000, life cycle management refers to the cyclical asset management process of: 1. Design/Build/Acquire
2. Operate
3. Inspect/Maintain/Repair
4. Renew/Replace/Dispose
Such that the cost and performance is optimised over the entire life cycle relative to the business objectives. Electricity distribution assets have long service lives and form part of a system. Individual assets can become technically obsolete, capacity constrained, business objectives may change, etc. such that these considerations require them to be replaced well before their serviceability dictates.
11.3 Asset Information by Category
11.3.1 Asset Values by Category
Information disclosure regulations prescribe the asset categories Scanpower must apply in this Plan. The categories relevant to Scanpower are:
• 11kV Network
• LV Network
• Transformers
• Switchgear
• Secondary Assets
The following table provides information on the size of the financial asset Scanpower has in each of these categories plus some additional detail of sub-asset categories Scanpower has assigned to the prescribed asset categories. Clearly evident from this information is that Scanpower’s assets are predominantly an overhead/pole mounted 11kV/400V distribution system in a relatively mature steady state.

Page 146 of 220
As at 31 March 2019 Scanpower completed a revaluation of its Network using a Discounted Cash Flow (DCF) methodology which is shown in Table 23. In contrast to the Depreciated Replacement Cost (DRC) methodology used prior to 2016, this approach is intended to test if there is any economic impairment on the network assets resulting from consumer shifts to new technologies or lower electricity consumption levels.
Table 23 Financial Value of Network Assets at Depreciated Replacement Cost at 31st March 2019
ASSET TYPE DCF VALUATION AT 31/3/19
POLES $15,337,388
11KV CONDUCTOR $3,615,391
11KV CABLES $1,030,340
400V CONDUCTOR $637,114
400V CABLES $2,560,324
TRANSFORMERS $5,092,008
SUBSTATIONS $882,866
TRANSFORMER FUSES $971,366
ISOLATING FUSES $205,349
AIR BREAK SWITCHES $1,129,027
RECLOSERS $328,513
SECTIONALISERS $281,191
RING MAIN UNITS $416,828
VOLTAGE REGULATORS $109,587
CIRCUIT BREAKERS $21,241
SERVICE FUSE BOXES $906,372
CONNECTIONS $761,105
NON-STANDARD NETWORK DISTRIBUTION ASSETS $4,962,305
SUB TOTAL $39,248,317
For the financial year end 31 March 2020, Scanpower has engaged PWC to undertake an external valuation of the network. The results of this will be available in the next published asset management plan. Scanpower has no sub-transmission system and therefore no zone substations – it takes supply directly from Transpower at 11kV which is its only distribution (high) voltage. Its LV reticulation is limited in its interconnection, that is it makes limited contribution to the systems engineering of the network. Scanpower does not own service lines (HV or LV) but operates HV service line asset largely as if it did. Service lines represent approx. +15% additional network in terms of the electricity distribution asset that forms the consumer supply. Clearly Scanpower is deeply involved with its operation and in terms of the regulatory scope of this plan it remains a very significant issue that is largely ignored. However, it is not an area where all networks can be treated equal, rural networks have more service line per consumer and the histories of who built and funded service lines are very diverse. Its operational scope includes the asset management of ancillary assets such as street light networks and it shares assets of other utilities such as Telecom. Consequently, there are limitations on how accurately Scanpower’s asset categories and associated cost/performance information fits the prescribed disclosure model.

Page 147 of 220
11.4 Asset Age Profiles
Age profiles are used to determine where in the life cycle the asset population sits as it is the probability density function (summation) of survival curves (bath-tub curve) for each asset (per the conceptual asset life profile figure below). Populations that display a roll-off of survival at certain age give an indication of the point at which an asset’s operating costs increase because they need more intensive maintenance and their reliability declines i.e. the age where they pass the optimal point with regard to life cycle costs. It also indicates how many years the asset can remain in service (with rising costs) before its performance becomes unacceptable and/or it fails in service. The roll-off point of the survival curve roughly approximates to the optimal point of the Life Cycle Cost depending on how sensitive/critical asset management objectives are to the asset performance. However, the process is not an exact science and relies on the experience and judgement of the asset manager. This is because historical records of asset age and quantity are not likely to be consistent and/or accurate, the asset deployed changes in materials, type and specification, there is variation in the quantities deployed every year, and the level of maintenance during the earlier life asset is in-determinant in terms of its contribution to life extension. For example, the age of an 11kV line is derived from the date it was originally constructed in its entirety. There are no records of whether the materials were new or recycled. The conductors and poles have different life expectancies. The standard for poles has changed from wooden to concrete. It is the condition of the wooden poles that is currently driving HV line maintenance. Depending on a particular asset group significance in terms of criticality determines the polices, strategies and practices applied to its maintenance and/or replacement. Critical assets for example, might get replaced before they reach the minimum cost point because a lower risk of in-service failure is deemed appropriate. However, when an asset passes its optimal point it displays rising costs for declining performance. There is a case for replacing assets before they get into this state because if they are replaced early before reaching the optimal cost/life point their costs are still higher than optimal, but their performance is significantly better for that higher cost. This rationale is used to spread the replacement time period of the asset populations replacement phase. Eventually, after several life cycles, a matured asset population will reach a steady state in terms of the annual quantities being renewed.

Page 148 of 220
Figure 55 Conceptual Asset Age Profile Curves / Interval Setting
Figure 56 Conceptual Asset Age Profile Curves / Interval Setting

Page 149 of 220
11.4.1 Asset Age Profile Graphs
Provided below are the age profile graphs for the main categories of network asset.
Figure 57 Pole Age Profile by Material Type
Figure 58 11kV Overhead Conductor Age Profile (Length and Type by Year of Installation)

Page 150 of 220
Figure 59 11kV Underground Cable Age Profile (Length and Type by Year of Installation)
Figure 60 LV Overhead Conductor Age Profile (Length and Type by Year of Installation)

Page 151 of 220
Figure 61 LV Underground Cables Age Profile (Length and Type by Year of Installation)
Figure 62 Small Transformer (<75kVA) Age Profile – Number Installed per Year by Capacity Rating

Page 152 of 220
Figure 63 Large Transformer (>50kVA) Age Profile – Number Installed per Year by Capacity Rating
Figure 64 Air Break Switch Age Profile (Quantity by Year of Installation)

Page 153 of 220
Figure 65 High Voltage Fuse Age Profile (Quantity by Year of Installation)
Figure 66 High Voltage Switchgear Age Profile (Quantity by Year of Installation)
Page 154 of 220
Note: limited age profile data is available for LV Poles. The asset records only have the date of construction for LV Lines. The above charts on conductor are also limited as to age profiles because of the practice of reusing second-hand conductor. LV records were not consistently kept prior to undergrounding programmes. Similarly, data on the LV lines underbuilt on HV Lines may relate to HV construction dates.
11.4.2 Asset Age Profile Conclusions
The survival rate of hardwood poles declines rapidly after 45 years. Scanpower has a policy of not climbing wooden poles, therefore safety management is currently driving renewal programmes. This population is at the end of its economic service life and at the life-cycle cost minimum. Lower condition pole populations (LV and service lines) are displaying higher fault response and reactive maintenance costs indicating this asset has past the optimum cost/performance trade-off. Compared to the previous profile based on 2012 data the number of Hardwood poles in the pre-1977 population has been significantly reduced as expected given their targeting by our pole replacement program. LV service lines in particular are well past the optimal replacement point. However Scanpower does not own these assets and their owners take a much shorter term view of costs and risks. Scanpower therefore has been controlling the impact of the rising cost of operating these assets via inspection and notification services to drive consumer funded renewal. Not much change to the HV conductor mix is evident in the age profile for overhead conductor. We install approx. 5km of new ACSR p.a. either for line extension, capacity upgrade, or replacement of rotten copper/steel. As with the pole data, some of the earlier ACSR conductor was second hand. Our records only show the construction data, and there are some gaps in the manufactured dates. Traditionally when new concrete poles were installed replacing the hardwood poles, the HV copper conductor was recycled onto the LV distribution network. The industry is doing work around asset management of conductor for which Scanpower is keeping an eye on. Most age replacement occurs on service lines and therefore does not show on the above profile. The transformer population is displaying evidence that the population is approaching its service limits. The asset is costly to renew if left to fail in service. The more optimal strategy is to start age replacement of population slightly ahead their predicted end of service. This smoothes expenditure at a small cost premium but does not incur the performance penalty in addition to the cost premium that results from leaving asset in service past its optimal service life. The Air Break Switch population is relativity flat from 1990 backwards. Though from the data, some of the ABSs within the Scanpower fleet are due for replacement soon, due to the limited number of ABS installed on the network, and the relative cost of replacement, keeping up with the optimal life cycle will be relativity easy. The high voltage fuse population is encroaching on the optimal replacement limit. This is evident with the increasing number of failures with the Gough type. Though a fixed number of fuses get replaced each year with other capital renewal and development projects, there has

Page 155 of 220
been no age driven replacement scheme. Though the optimal replacement limit for the population point has been reached, they are relativity inexpensive to replace. The switchgear population is at the early stages of the life cycle process meaning the fleet has several years of useful life yet before any replacement is required. The lifecycle of the switchgear is shorter than that of the pole and transformer, and this type of asset is more difficult to manage and more critical due to its nature. Scanpower has been recently experiencing some failures of the peanuts sectionalisers and automated air break switches, suggesting that the expected lifecycle of 25 years is inaccurate. Scanpower is continuing to monitor this closely. No life cycle conclusions can be drawn on other asset categories as there is inadequate data, and/or the life cycle is not sufficiently progressed.
11.5 Drivers for Maintenance Planning
11.5.1 Overview of Performance and Condition Assessment
Scanpower’s AM process for maintenance and renewals programmes is based on a cycle of:
• Targeting inspections, (which in the first instance are visual), on the basis of known condition, age and performance feedback from fault cause analysis.
• Inspection cycle periods are determined by consideration of type (e.g. wood versus concrete poles) and age. As the asset ages inspection frequency increases ensuring the survival roll-off point is captured before in-service failure. This is an improvement on earlier plans where inspection was comprehensive and at fixed intervals.
• The inspection process results include a risk assessment where assets are graded by significance of the defect and urgency with which it requires attention. This is a standard risk matrix approach and the management actions it drives are dependent on the assets criticality assessment.
• A rule based approach is also applied to determine whether or not assets will receive more formal testing such as ultra-sounding wooden poles. The data obtained from this testing allows more accurate assessment of remaining life and whether renewal is necessary, or a lesser repair is adequate. This is reactive maintenance.

Page 156 of 220
Figure 67 Performance and Condition Factors – Conceptual Model
Test results are fed back into the population condition data to improve the accuracy of records. For example, by modelling the design pole strength of standard structures and assigning a design strength to each pole record, the remaining strength can be better quantified by de-rating the structure for various conditions (e.g. missing stay) found during inspection. The resulting Safety Index can then be applied to prioritising replacement programmes. This is a continuous improvement process as illustrated above. Failure mode analysis and analysis of historical data is a lagging performance indicator whilst condition assessment is considered a leading performance indicator. The historical data applied to priorities is an example of the application of lagging performance indicator.
11.5.2 Criticality and Risk Assessment
Without a sub-transmission system and its associated high value assets, Scanpower does not have assets it assesses as being critical in terms of the risk profile they present to delivery of its most critical mission – keeping the power supply on. This tends to limit the options with regard to economically justified maintenance. Leaving assets in service until they fail is a valid strategy in many parts of Scanpower’s low load density network.

Page 157 of 220
Figure 68 Risk-based Analysis and Justification Model
11.5.3 Reliability and Cost Performance
Consequently, Scanpower applies mostly “rule-based” strategies for its core distribution assets. Reliability and cost performance (both the cost of unplanned response and the cost of planned or pre-emptive maintenance) are the two main drivers for selection of maintenance strategies.
11.5.4 Maintainability and Operability
These are also considerations that form part of a holistic asset management approach. However, the greatest opportunity for addressing issues with maintenance and operability is at the time of design e.g. design for live line maintenance. Altering work practice is an option for improvements in the mid-life cycle. Maintenance may therefore include elements of continuous improvement and/or modification. Relocating assets to more optimal positions in the network is an example.
11.5.5 Modernisation, Quality and Safety Improvements
Scanpower also applies some historical data derived strategies with regard to specific assets identified with age deterioration, quality, safety, or other sustainable performance issues.
11.5.6 Systemic Issues
Some issues of performance are driven by systemic issues such as:

Page 158 of 220
• Trade-offs made at the time of design to meet economic constraint on the cost of
supply e.g. lower strength/capacity design standards, reuse of second hand materials,
line route/accessibility, etc.
• Operating practices – Scanpower’s use of isolators as its primary switching device has
the disadvantage of not being able to break 3 phase load for example.
• Systems engineering – technology is only an improvement when it operates correctly.
11.6 Maintenance Driver Analysis by Asset Category
11.6.1 Hardwood HV Poles
Table 24 below summarises the maintenance drivers / approach to hardwood HV poles.
Table 24 Hardwood HV Poles Maintenance Driver Summary
HARDWOOD HV POLES Maintenance Drivers
POLICY & PRACTICE
• All hardwood poles to be eliminated from the system.
o Safety policy: Wooden poles must not be climbed with just a ladder.
o Age renewal: some poles are known to have been second hand when installed and
consequently the oldest poles are over 50 years old.
• In terms of safety compliance, all poles have been subjected to below ground inspection. A
replacement program has been developed on the basis of their remaining strength/ability to support
their loading, condition/specifically climbing safety, and criticality to network performance should it fail
in service.
CRITICALITY AND RISK ASSESSMENT
• This asset category is of moderate criticality to the overall system, therefore rules based asset
management practices have been applied.
• Maintenance work will be inspection driven with testing determining remaining life and urgency.
• Risk weighting has been calculated both in terms of ICPs and load.
• Impact and probability drivers assigned equal weighting as criticality is moderate
Having completed below ground inspections and ultra sounding of its entire hardwood pole population, Scanpower now has a comprehensive pole renewal action plan for the elimination of hardwood poles on its network. The pole replacement program is structured as follows: The primary driver is the assessment of remaining life about the poles strength compliance. Urgency considers the difference between poles with insufficient strength to stand up in extreme conditions and those that have insufficient strength to support human pole top load. Poles are further grouped into those that will be done by spot replacement (typically poles that have a higher strength requirement e.g. transformer poles) and those where an entire line section rebuild is warranted because the average condition of all the poles in that section are similar.

Page 159 of 220
Some poles are on lines that have been deemed uneconomic and are specifically targeted for replacement with alternative supplies. These are excluded from the replacement program. Most of these are in forestry blocks where access and establishing clearances have become major hurdles to economic renewal - the owners are aware of the increased fire risk and are involved in the planning of alternative supplies.
11.6.2 Hardwood LV Poles
Table 25 below summarises the maintenance drivers / approach to hardwood HV poles.
Table 25 Hardwood LV Poles Maintenance Driver Summary
HARDWOOD LV POLES Maintenance Drivers
POLICY & PRACTICE
• All hardwood poles to be eliminated from the system
o Safety policy: Wooden poles must not be climbed with just a ladder.
o Age renewal: some poles are known to have been second hand when installed and
consequently the oldest poles are over 50 years old.
• In terms of safety compliance, all remaining poles will be subject to below ground inspection over the
coming three years at a rate of 172 per year to allow for prioritisation of maintenance activity.
CRITICALITY AND RISK ASSESSMENT
• This asset category is of moderate criticality to the overall system, therefore rules based asset
management practices have been applied.
• Maintenance work will be inspection driven with testing determining remaining life and urgency.
• Risk weighting – prioritise urban locations where in-situ risk is higher.
• Impact on the need for pole climbing to operate service fusing.
This is the same strategy as for HV poles only the focus is on the poles that carry fusing and therefore are likely to be climbed and road crossing poles where failure creates additional public safety issues. The plan specifically includes budgetary allowance for addressing road crossings that are found to have clearance issues. More specifically bare open circuits are targeted for replacement with insulated neutral screen / covered conductor cable. The LV maintenance budget provisions for service fuse base upgrades and other minor work arising such as conductor clashing. This work is undertaken mainly by the Fault Crew.

Page 160 of 220
11.6.3 Small Transformers (Below 100kVA)
Table 26 below summarises the maintenance drivers / approach to transformers below 100 kVA.
Table 26 Small Transformers – Maintenance Policy, Criticality and Risk Assessment, and Gap Analysis
Policy and Practice Forecast Work
Service Life Indefinite - tend to be replaced for other reasons before failure - potentially at start of age renewal cycle (monitor failures)
6 p.a. for 10 years
Manufacturing Standards reduced in 1970s - newer transformers have a shorter nominal life 25-35yrs c.f. with 45yrs of BS147
Renewal Where poles are being replaced the transformer will also be renewed if older than 20 years 6 p.a. for 10
years
Transformers manufactured before 1964 have higher iron losses - to be systematically eliminated from population
14 p.a. for 12 years
Past practice of refurbishing old transformers stopped - does not extend life economically
Growth Limited to new installations - few capacity upgrades 8 p.a.
Quality Shift to concrete pole/steel crossarm standard design - match crossarm durability to transformer
Standardisation To be reviewed with respect to low capacity supplies and alternative solutions.
Security No contingent capacity provided as interconnection limited
Provision for 1 fault per annum 1 p.a.
Safety Theft of earths biggest safety issue - survey area when discovered and replace as required 20 p.a.
Older installations may need more satisfactory earthquake rated mounting - upgrade with HV inspection 20 p.a.
Criticality and Risk Assessment
Criticality Low (2-3 ICPs per transformer) - therefore replaced on failure, growth, condition, quality or safety
Risk Weighting Low - transformers are very lightly loaded and therefore not stressed
Lightning and trees clashing lines are the most common root cause of failue and shorten transformer life
Performance Low capacity utilisation as a result of historic 3 phase development standard
3 phase supplies have a reduced probability of total loss of supply and reduce the investment in customer service mains
However, more costly to the network and a barrier to alternative supply
Risk Management Inspection driven - rust, leaks, earth testing, safety - all testing is visual, oil testing is not undertaken
Opportunistic renewal undertaken when appropriate
Gap Analysis Forecast Work
Average installations per annum over 60 year population range 20 p.a.
Average installations per annum over last 10 years 26 p.a.
(Increase believed to be related to pole replacement - understated due to legacy practice of avoiding transformer poles)
(However, will assume high correlation between aged poles and transformers)
Pre 1964 transformers 14 p.a. for 12
years
(At an average rate of 35 replacements p.a. for the next 5 years it will be possible eliminate all transformers older than 50 years by 2025)

Page 161 of 220
11.6.4 Large Transformers (100kVA and above)
Table 27 below summarises the maintenance drivers / approach to transformers above 100 kVA.
Table 27 Large Transformers – Maintenance Policy, Criticality and Risk Assessment, and Gap Analysis
Policy and Practice Forecast
Work
Service Life Indefinite – tend to be replaced for other reasons before failure 1 p.a. for 10
years
Manufacturing Standards reduced in the 1970s – newer transformers have a shorter nominal life of 25-35yrs c.f. with 45yrs of BS147
Renewal Where poles are replaced the transformer will also be renewed if older than 20 years 1 p.a. for 10
years
Transformers manufactured before 1964 have high iron losses – to be systematically removed from the population
2 p.a. for 7 years
Past practice of refurbishing old transformers stopped – does not extend life economically
Growth Limited to new installations – few capacity upgrades 3 p.a.
Quality Shift to concrete pole / steel crossarm standard design – match crossarm durability to transformer
Standardisation To be reviewed with respect to low capacity supplies and alternative solutions
Security No contingent capacity provided as interconnection limited
Provision for 1 fault per annum 1 p.a.
Safety Theft of earths is the main safety issue – survey area when discovered and replace as necessary 20 p.a.
Older installations may need more satisfactory earthquake rated mounting – upgrade with HV inspection 20 p.a.
Criticality and Risk Assessment
Criticality High (many ICPs per transformer) – therefore replaced on growth, condition, quality or safety but prior to failure
Risk Weighting Medium – transformer loadings not accurately known at the present time
Minimal LV interconnection – low level of contingency capacity provisioned
Over loading is the most common root cause of failure and shortens transformer life
Performance High capacity utilisation as a result of low ADMD assumptions
3 phase supplies have a reduced probability of total loss of supply and reduce the investment in consumer service mains
However more costly to the network and a barrier to alternative supply
Risk Management Inspection driven – rust, leaks, earth testing, safety review – visual only, oil testing performed on all units above 750 kVA
Opportunistic renewal when appropriate
Infill distribution and develop LV interconnections as new capacity is required
Gap Analysis Forecast Work
Average installations per annum over 60 year population range 2 p.a.
Average installations per annum over last 10 years 7 p.a.
(Increase believed to be related to pole replacement - understated due to legacy practice of avoiding transformer poles)
(However, will assume high correlation between aged poles and transformers)
Pre 1964 transformers 2 p.a. for 7 years

Page 162 of 220
11.6.5 Air Break Switches
Table 28 below summarises the maintenance drivers / approach to Air Break Switches
Table 28 Air Break Switches – Maintenance Policy, Criticality and Risk Assessment, and Gap Analysis
Policy and Practice Forecast Work
Service Life Nominal life of 35 years – tend to remain on system until faulty 2 p.a.
Renewal May be recycled and / or relocated to locations requiring lower duty 2 p.a.
Growth Load Break heads to be fitted to ABSs breaking more than 1000kVA transformer capacity 2 p.a. for 10
years
ABSs are to be rated for Load Break Fault Make duty.
Quality Must be operable from the ground without ladders or shotgun stick.
Must be accessible – not obstructed by fences, ditches, vegetation, stock etc.
Standardisation Standardise to underhung mounting for live line installation or removal
Line will not be shackled off onto the ABS frame
Security Located where 3 phase switching and / or fault isolation / sectionalising is required. Density to be increased. 1 p.a.
Provision for 1 fault per annum. 1 p.a.
Safety Earthing standard revised – upgrades in progress 15 p.a. for 10
years
Criticality and Risk Assessment
Criticality Low – fuses are the primary isolation points, therefore ABSs are replaced on failure, growth, condition, quality or safety
Risk Weighting Low – rated for duty
Failure modes – out of adjustment, contact burning, cracked insulator / frost, animal / bird related blow-ups
Performance High – mature proven technology
3 phase supplies have a reduced probability of total loss of supply and reduce the investment in consumer service mains
However more costly to the network and a barrier to alternative supply
Risk Management Inspection driven – operating mechanisms, arc horn alignment, earth test, safety review
Opportunistic renewal and reoptimisation of location – old equipment may be redeployed
Gap Analysis Forecast
Work
Automation projects in 2005 and 2008 account for 40 installations
Excluding these the average installation rate over the past 10 years
13% of the population is older than the 35 year nominal life – indicative of recycling 4 p.a.
Additions due to growth 1 p.a.
Age or fault related replacements 2 p.a.
Load break heads required in some locations – replace with new ABS then relocate existing ABS to more suitable location
Density of sectionalising points to be increased for faster fault isolating processes – integrated with other development projects

Page 163 of 220
11.6.6 Tree Management
Table 29 below summarises the maintenance drivers / approach to trees.
Table 29 Tree Management and Maintenance – Summary of Drivers, Objectives, Policies and Strategies
Background
Trees are not a network asset but Scanpower has a regulatory requirement to manage the safety issues they create when they interfere with its assets.
Tree cutting is the single largest component of maintenance expenditure - managing these costs is a driver of operational efficiency of the Network business.
Scanpower has a high tree management challenge resulting from its area being windy and having relatively intensive forestry.
Objectives
ALARP - Fire risks associated with Scanpower owned lines.
ALARP - Public safety where public have uncontrolled access to Scanpower owned asset.
ALARP - Risks to stock and property from Scanpower owned asset.
Outages caused by tree/line clashing < 2000 CML per event.
Note: There are no "reasonably practical" solutions to addressing mature forestry blocks compliant with regulation in terms of clearance but presenting a fall zone risk – negotiate line relocations
Assumptions:
Forestry owners also actively manage fire risk.
Private property owners manage risks on their property and control public access accordingly.
Service line owners manage their own tree issues.
Policies
Free first cut.
No interest declarations subject to strict compliance with legislation.
Disconnection preferred alternative response to forced cuts for service lines.
Scanpower will meet duty to notify non-compliant discoveries - it will not police or enforce regulations.
No restoration of supply following a tree related incident until tree clearances have been restored .
Scanpower provides a network subsidised tree trimming service to address lack of resourcing available to tree owners - this service prioritises network tree clearing.
Gap Analysis
Trees were once the biggest single cause of outage on Scanpowers network - refer Fault Cause Analysis – this situation has been improved so now in a management change process to sustain position.
Cause analysis indicates that the high impact outages are caused by trees breaking in high winds damaging lines in difficult access locations - typically mature forestry planted after line construction.
These outages are not adequately mitigated by compliance with tree regulations - cost issues shift them outside the "reasonably practical" threshold.
Addressing the protection schemes performance to reclose, sectionalise, and clear transient faults has helped address tree clashing and burning issues with regard to managing outage.
Resource analysis has determined that there is a lack of tree cutting services in the district to allow tree owners to act on tree notices within prescribed timeframes.
Historical cutting statistics indicate a backlog in cutting resulting from lack of resource and resistance from tree owners to carry the cost. Refer Cutting Statistics Analysis.
Strategy
Target faster inspection/notice cycles (2 per annum) with an 90% resolution/action target on each cycle.
Determine more cost effective inspection and record keeping processes – potentially contract out
Utilise linemen resource to sustain clearance urgent/burning sites
Investigate use of hedge trimming contractor for management of road reserve vegetation
Migrate towards a higher component of chargeable work

Page 164 of 220
11.6.6.1 Tree Cutting Statistics and Forecast
Table 30 Historic and Forecast Tree Cutting Statistics
Actual & Projected
2019 - 2020 2020 – 2021 2021 – 2022 2022 – 2023 2023 – 2024 2024 – 2025
Eliminated Sites 15 15 15 15 15 15
Trimmed Sites 1st 55 40 25 10 0 0
Trimmed Sites 2nd 50 50 50 50 45 30
Trimmed Sites 3rd 50 50 50 50 50 50
Trimmed Sites 4th 50 50 50 50 50 50
Total 220 205 190 175 160 145
Network cost ($000) 300 300 300 300 300 300
Tree Owner cost 50 50 50 50 50 50
11.6.7 Maintenance and Capital Renewal Summary & Future Aims
All the identified assets are put through the Network Development criteria. Items like public safety and safety in design are considered. If the conditions are met, a network development project may be driven. For example, a pole that is already over-loaded within the CBD, which poses a public safety risk can be justified for replacement in addition to network / asset enhancements. Currently, assets for replacement are chosen based on age. It’s Scanpower’s aim to incorporate the risk and consequence of failure from a “public safety” and “safety in design” into the asset decision process. For example, a hardwood pole’s condition within the CBD might be in the upper quartile for health, however due to its location, the risk and consequence of failure will be high. Therefore, it’s within the public’s interest to replace the CBD poles first before the rural and remote poles. Work along this line has already started for the likes of Hardwood poles, as there is an abundance of condition health. For this technique to be applied across the rest of Scanpower’s assets including transformers, reclosers, conductors and crossarms the existing data needs to be enhanced. For example, “dissolved gag analysis” (DGA) testing of critical transformers can help determine remaining life. Detailed pictures of every pole structure can help determine crossarm health. Lab testing of conductors can help determine remaining life strength. This testing should be targeted towards assets that are reaching their end of life which will be beneficial for prioritising which asset is replaced first. With the correct data and data base, asset heath can be determined. From there, information like criticality, risk and consequence can be determined. This will aid with the asset decision making process. It’s Scanpower’s aim to enhance the existing maintenance schedules. As cited previously, Scanpower is looking at different ways to collect asset data. The ultimate goals are to implement a two & five year network inspection cycle. The two-year cycle would involve a visual inspection of all assets on the network. Obvious defects like broken stays and insulators would translate into job packs. The five-year inspections would involve a detailed inspection of all the network assets. From this, the asset health would be determined using standardised systems like the EEA guides. As an example, each crossarm’s condition can be determined.

Page 165 of 220
From this, its health can be used in the asset decision making process that will drive replacement or enhancement. It is noted that more frequent inspections should be conducted on assets that are approaching their end of life. Currently, Scanpower is in the reactive and preventative maintenance zones. It’s the aim that with new technology Scanpower can reach the predictive maintenance zone. Though this is a high bar to achieve, it will offer numerous benefits to the network.
11.7 Maintenance Strategy and Practice
11.7.1 HV Line Inspections – Visual Line Inspections
Table 31 HV Line Inspection Maintenance Strategy and Practice
HV Line Inspections - visual ground inspections
Objectives Identify need/priority for targeted condition assessment
Capture Defect Register records and assess defect criticality/risk
Identify development of safety issues - not all issues are visible from performance monitoring
Ensure maintenance is based on tangible necessity with regard to safety and performance
Cycle Nominally every 5 years for mature assets - dependent on age/condition risk assessments and/or performance
Age driven - 1st inspection 25 years, 2nd and 3rd 10 years, then 5 yearly for wood, continue at 10 yearly for concrete
Condition driven - declining average condition indicates assets approaching end of life.
Performance driven - lines in areas of high wind exposure display higher hardware defect rates
Scope Ref. NM 20.15
Includes check of broader issues such as trees, foundations/staying, and conductor condition
Line patrols are initiated on a reactive basis when casue of a fault or protection setting was not identified
Other The practice of line tightening 2-5 years after construction is to be introduced as a quality improvement
11.7.2 Below Ground Pole Inspections – Ultrasound
Table 32 Below Ground Pole Inspections Maintenance Strategy and Practice
Below Ground Pole Inspections - ultrasound
Objectives Zero in service pole failures
Identify remaining strength and service life
Prioritise wooden pole replacement programme
Cycle Final inspection of hardwood poles has been i.e. no more cycles poles will be eliminated from network within 10 years
Softwood pole population will be inspected when statistics show an increasing trend in failure rates
Scope Replacements are targeted by results of visual ground inspections and/or reported defects
Ultrasounds results are applied to assessment of design strength to determine remaining strength
Risk assessment criteria is applied to remaining strength to prioritise replacement programme

Page 166 of 220
11.7.3 LV Line Inspections – Roadside Reticulation Only
Table 33 LV Line (Roadside) Inspections Maintenance Strategy and Practice
LV Line Inspections - roadside reticulation only
Info As for HV poles with the following differentiation
LV poles and spans are shorter, services provide lateral pole top support, so design is inherently more robust
Lower risks associated with lower voltage. Condition poor in low density rural areas - limited justification for improvement
Lower performance drivers as incidents affects fewer consumers
Lower condition is driving higher reactive maintenance/fault response
Poorer condition in low density rural areas - limited justification for improvement
Little merit in upgrading line when consumer’s reluctant
Scope Note a significant portion of the LV network is underbuilt on HV poles or has been undergrounded
The condition of Telecom road crossing poles influences decisions to underground
11.7.4 LV Service Lines (Not Owned by Scanpower – Operating Service Only)
Table 34 LV Line (Roadside) Inspections Maintenance Strategy and Practice
LV Service Lines - not owned or managed by Scanpower - default operating service only
Info These assets are not covered by Line Function Services or Public Safety Management Systems
Customer initiated maintenance proving inadequate - driving fault response
Poles very old and often light-weight, conductor old and often inadequate capacity
Objectives Reducing the incidental costs and disruption to work programmes is being addressed via an inspection/notification process
Upgrade being targeted by condition and compliance assessment as part of the fault response
Followed up with a design service and quoting now provided by Network – facilitates broader network redesign scope
Consumers will be encouraged to underground when renewing LV service mains.
Fusing being coordinated to asset capacity and volt drop limits – triggers investigation of need for upgrade
Encourage capacity upgrade to improve voltage, protection coordination, and connections records updated
Chargeable work is now actioned by the Network not Contracting – closer management and interface with consumers
Cycle Currently in a data capture campaign to get the data needed to manage service lines proactively.
11.7.5 HV Switchgear – Visual Ground Inspections
Table 35 HV Switchgear Visual Ground Inspections Strategy and Practice
HV Switchgear - visual ground inspections
Info Includes ABSs, Reclosers, Auto LBSs, Sectionalisers, Ring Main Units
Objectives Capture Defect Register records and assess defect criticality/risk
Identify development of safety issues
Cycle Nominally every 5 years - sites are visited more frequently as part of routine operating
Age driven - 1st inspection 25 years, 2nd and 3rd 10 years, then 5 yearly for wood, continue at 10 yearly for concrete
Condition driven - declining average condition indicates assets approaching end of life.
Performance driven - equipment with lower reliability inspected more frequently
Scope Ref. NM 20.15
Includes check of broader issues such as trees, access, and earthing
Functional and/or trip tests are undertaken on a reactive basis i.e. following a mal-operating event.
Other Modern equipment does not require field maintenance.
ABSs require regular alignment and adjustment
Fusing and Isolators being reviewed as part of development programs

Page 167 of 220
11.7.6 Ground Mounted Distribution Substations
Table 36 Ground Mounted Distribution Substations Strategy and Practice
Ground Mounted Distribution Substations
Objectives Capture Defect Register records and assess defect criticality/risk
Identify development of safety issues
Assess loading - no MDI fitted so spot checks required
Cycle Every 2 years - sites are typically located in urban areas and transformers are larger, supplying more consumers
May lead to installation of load recorders to assess loading
May follow up with thermovision of cable terminations
Condition driven - addressing vandalism is the main issue
Performance driven - addressing loading is the main issue
Scope Ref. NF 05.10
Includes check of broader issues such as safety notices, trees, access, and earthing
Includes LV distribution frames and cable terminations
Other Oil processing no longer economic
11.7.7 Pole Mounted Distribution Substations
Table 37 Pole Mounted Distribution Substations Strategy and Practice
Pole Mounted Distribution Substations
Objectives Capture Defect Register records and assess defect criticality/risk
Identify development of safety issues
Assess loading - no MDI fitted so spot checks required
Cycle Every 5 years - sites are typically located in rural areas and transformers are smaller, supplying fewer consumers
May lead to installation of load recorders to assess loading
May follow up with the re-testing of cable terminations
Condition driven - rusting and oil leaks main issues experienced
Performance driven - addressing loading is the main issue
All transformers above 750 kVA or that feed critical supplies should be tested bi-annually
Scope Ref. NS 05/20 Earth testing NS 10.15 (Testing)
Includes check of broader issues such as safety notices, trees, birds nests, and earthing
Includes LV Fusing and cable terminations
11.7.8 Tree Trimming
Table 38 Tree Trimming Maintenance Strategy and Practice
Tree Trimming
Objectives Eliminate high risk/intolerable tree issues
Manage trees in the network lines to ALARP principles
Provide/support adequate tree trimming resources within the district.
Cycle 2 inspection/notification cycles p.a.
High priority sites - 3 month resolution/action
Medium priority sites - 1 year resolution/action
Low priority sites - 3 year resolution/action or priority reassessed
Target 90% cutting success rate per notice cycle
Scope HV network owned lines supplying multiple customers have a higher priority
Excludes Service lines other than notification of discovered issues unless intolerable safety issue (disconnect)
Other Also addressed by Protection and Automation Project

Page 168 of 220
11.8 Asset Risk and Ten-Year Replacement Forecast
This section summarises the forecast asset renewals on Scanpower’s fleet of assets. This analysis is looking at a macro level across key asset groups which include:
• Poles.
• Transformers.
• Air Break Switches.
• High Voltage Fuses.
• Overhead 11 kV Conductor.
• Overhead 400 V Conductor.
• Underground 11 kV Cable.
• Underground 400 V Cable. In summary, a model was developed which considered the current asset age profile, asset service life, unit cost of replacement at year zero and expected future inflation. The model was manually adjusted to change the number of assets being replaced within a given year. The model was optimised to smooth out the future replacements while ensuring the number of forecast assets past their service life was minimised. One key assumption in the model is that an asset’s age is a good indicator of its health. This can be extrapolated out across an asset fleet to determine the fleet’s health at a macro level. This model does not demonstrate the absolute network risk or criticality. It only indicates that at some point of time, an asset will need replacing. For example, over 20% of the transformer fleet is over the optimised service life which is made up of rural pole top transformers and urban ground mount transformers. Though the profile shows a higher proportion being pole top transformers, the actual risk lies with the urban transformers as they tend to supply a larger amount of ICPs and are harder to replace. Other condition based techniques should be used for prioritising asset groups nearing their optimal service life. End of life factors can be used to help accurately predict an asset’s end of life and thus prioritise for replacement based on likelihood of failure and risk presented. For example at a macro level, the hardwood poles have reached their optimal service life. Ultrasound tests were carried out on the majority of the fleet and based on the test results an end of life rating was calculated. From there the hardwood poles were prioritised based on life left, criticality and risk. DGA testing of ground mount transformers near their optimal service life is another useful end of life indicator. The purpose of this model is to assist with the ten year planning horizon. Scanpower’s major focus has been on hardwood pole replacement, however as this programme finishes, Scanpower needs to determine the next asset replacement strategy. If urban transformers are the next target, Scanpower needs to build or reduce capability and resources now to ensure it can meet the future demands. In short, Scanpower needs to adjust capability to meet work loads, not adjusting work loads to meet current capability. The following graphs display the forecast number of assets past their service life and the anticipated future replacements and spend required.

Page 169 of 220
11.8.1 Poles
Figure 69 Forecast of the number of poles past their service life along with proposed pole renewal spend
Figure 70 Pole renewal spend and forecast

Page 170 of 220
11.8.2 Transformers
Figure 71 Forecast of the number of transformers past their service life along with proposed transformer renewal spend
Figure 72 Transformer renewal spend and forecast

Page 171 of 220
11.8.3 Air Break Switches
Figure 73 Forecast of the number of ABSs past their service life along with proposed ABS renewal spend
Figure 74 ABS renewal spend and forecast

Page 172 of 220
11.8.4 High Voltage Fuses
Figure 75 Forecast of the number of high voltage fuses past their service life along with proposed renewal spend
Figure 76 High voltage fuse renewal spend and forecast

Page 173 of 220
11.8.5 Overhead 11 kV Conductors
Figure 77 Forecast of the number of overhead 11 kV conductors past their service life along with proposed renewal spend
Figure 78 Overhead 11 kV conductor renewal spend and forecast

Page 174 of 220
11.8.6 Overhead 400 V conductors
Figure 79 Forecast of the number of overhead 400 V conductors past their service life along with proposed renewal spend
Figure 80 Overhead 400 V conductor renewal spend and forecast

Page 175 of 220
11.8.7 Underground distribution network.
Graphs have been omitted for the underground distribution network as assets are mid-way through their life cycle. All critical high voltage cables from the GXP are only 15 years old and the low voltage distribution networks within the urban areas are halfway through their life cycle.
11.8.8 Asset risk and ten-year renewal forecast conclusions.
In summary:
• The hardwood pole replacement programme ends in 2024.
• A large investment in the renewal of switchgear has been made in 2021 due to the current worker risk and performance issues.
o More specifically, the AutoM8s are failing to operate and the contractors are refusing to assist them in their operation or rely on them as an isolation point for de-energised work.
o The spend has been targeted here to give an instant improvement to network performance and worker safety.
o As part of this renewal, enhancements have been made to turn some AutoM8s into sectionalisers which, in turn, will improve the network security and reliability.
• The next asset replacement strategy is to start the transformer replacement programme.
o This program will start in 2025. o A risk based approach will be taken with prioritisation of replacements. o There is a higher risk associated with the pad mount transformers in urban
areas and thus they will have a higher priority. o Though pole top transformers dominate in the numbers past service life,
Scanpower is happy to run these assets to failure due to the low risk they pose to the network.
▪ The rationale being pole top transformers have lower performance penalties compared to pad mount transformers and,
▪ They are relatively easier to be replaced in the event of failure and, ▪ They tend to have lower utilisation (i.e. woolsheds used six weeks of
the year) when compared to pad mount transformers that supply domestic loads and critical infrastructure like schools, pumping stations, hospitals etc.
o The model assumes that pole mount transformers have a service life of 55 years, not the standard 45.
▪ The rationale being transformers were constructed well back in the 50s and 60s with the majority of these transformers having had some type of midlife maintenance.
▪ The failure rates of the pole top transformers sits at 1% per annum excluding lightning strikes.
▪ This, in conjunction with the low utilisation rate, suggests that these transformers may be near, but have not reached their optimised lifecycle.

Page 176 of 220
• The ten-year renewal programme has been optimised and smoothed to reduce any spikes.
o This approach optimises the future resources needed to deliver the renewal program and provides workforce stability in the midterm planning horizon.
o Any resources needed can be planned for now to meet the future needs. o This approach also smoothes out the future cash flow needed to fund the
replacement activities and reduces the need to save or borrow extra or reduce dividends within a given year.
• Though the underground 400 V distribution network is halfway through its life cycle, there is an increasing number of failures in the low voltage joints and terminations within pillar boxes. Strategies are being developed to help identify the extent of the problem.
11.9 Operating Budgets
11.9.1 Asset and Resource Quantity Targets
The maintenance planning process determines the quantities and priorities. Specific assets can be targeted. Where there are a number of competing maintenance objectives, targets are balanced according to risk/cost – benefits. This is often necessary when there are conflicting short term and long term objectives. From this step the budget provisions are derived from historical unit costs and the quantity of labour/plant resources determined. The asset management team can then decide whether additional resources need to be outsourced and/or specialist skills such as “live line” work may need to be provisioned in order to deliver on outage budgets, for example. This process is dynamic because the element of reactive work in response to condition assessment, for example, may drive the need to re-optimise the plan. As Network resourcing is constrained both in staffing and corporate imposed budget, the work programs in regard to network development and growth, asset renewal and maintenance and customer driven/funded work, must be coordinated on the basis of category of expenditure and has the most urgent priority over limited resources. That is, all the work planned for a specific year cannot be achieved with the resources available. The expenditure forecasts in the Asset Management Plan are not firm commitments and we adapt to current operating conditions on a monthly management cycle. The purpose of the forecasts in the Asset Management Plan is to signal the implications of short term management decisions with regard to long term sustainability of the business. It is also noted that the industry is facing significant disruption and a changing business environment. This creates a high level of uncertainty with regard to all long term planning. Scanpower is looking at formalising a SAIDI and SAIFI budget for all planned work. This will then drive cost benefits analysis for outage tools such as generators and live line.

Page 177 of 220
11.9.2 Operating Expenditure Budget
Table 39 Ten Year Maintenance Expenditure Budget
($000) 2021 2022 2023 2024 2025 2026 2027 2028 2029 2030
Network Operating Expenditure
Service interruptions and emergencies 395 403 411 419 428 436 445 454 463 472
Vegetation management 600 612 624 637 649 662 676 689 703 717
Routine and corrective maintenance inspections 247 252 257 262 267 273 278 284 289 295
Asset replacement and renewal 446 455 464 473 483 492 502 512 523 533
Total Network operating expenditure 1,688 1,722 1,756 1,791 1,827 1,864 1,901 1,939 1,978 2,017
Non-network operating expenditure
System operations and network support 865 882 900 918 936 955 974 994 1,013 1,034
Business Support 1,659 1,692 1,726 1,761 1,796 1,832 1,868 1,906 1,944 1,983
Total Non-network operating expenditure 2,524 2,574 2,626 2,678 2,732 2,787 2,842 2,899 2,957 3,016
Total operating expenditure 4,212 4,296 4,382 4,470 4,559 4,650 4,743 4,838 4,935 5,034

Page 178 of 220
11.9.3 Capital Expenditure by Regulatory Disclosure Category
Table 40 Ten Year Capital Expenditure by Regulatory Disclosure Category
($000) 2021 2022 2023 2024 2025 2026 2027 2028 2029 2030
Description
Customer Connections 32 33 33 34 35 35 36 37 37 38
System Growth 32 33 33 34 35 35 36 37 37 38
Asset replacement and Renewal 1,731 1,784 1,820 1,856 1,899 1,935 1,959 2,012 2,052 2,081
Asset Relocations - - - - - - - - - -
Reliability, Safety and Environmental - - - - - - - - - -
- Quality of Supply 86 169 173 176 180 183 187 191 194 198
- Legislative and regulatory - - - - - - - - - -
- Other reliability, safety and environment 53 - - - - - - - - -
Non-Network Assets 599 92 94 96 97 99 101 103 105 108
Total Capital Expenditure 2,533 2,111 2,153 2,196 2,246 2,287 2,319 2,380 2,425 2,463

Page 179 of 220
11.9.4 Asset Renewal Budgets
Table 41 Ten Year Capital Renewal Budget
($000) 2021 2022 2023 2024 2025 2026 2027 2028 2029 2030
Asset Type
Pole replacement 1,170 1,071 1,092 1,114 233 116 118 121 123 125
Transformer replacement 71 428 437 446 1,299 1,435 1,492 1,442 1,470 1,446
Switchgear replacement 223 - - - - - - - - -
Air break switch replacement 77 79 80 82 84 85 - - - -
HV Fuse Replacement - 12 12 13 78 89 106 109 111 108
Overhead 11 kV conductor replacement - - - - - - - 92 94 96
Overhead 400 V conductor replacement - - - - - - 28 32 32 33
Underground 11 kV cable replacement - - - - - - - - - 23
Underground 400 V cable replacement - - - - - - - - - 24
Unplanned asset renewal 190 193 197 201 205 209 214 218 222 227
Total Capital Renewal 1,731 1,784 1,820 1,856 1,899 1,935 1,959 2,012 2,052 2,081

Page 180 of 220
Figure 81 Ten Year Capital Renewal Budget
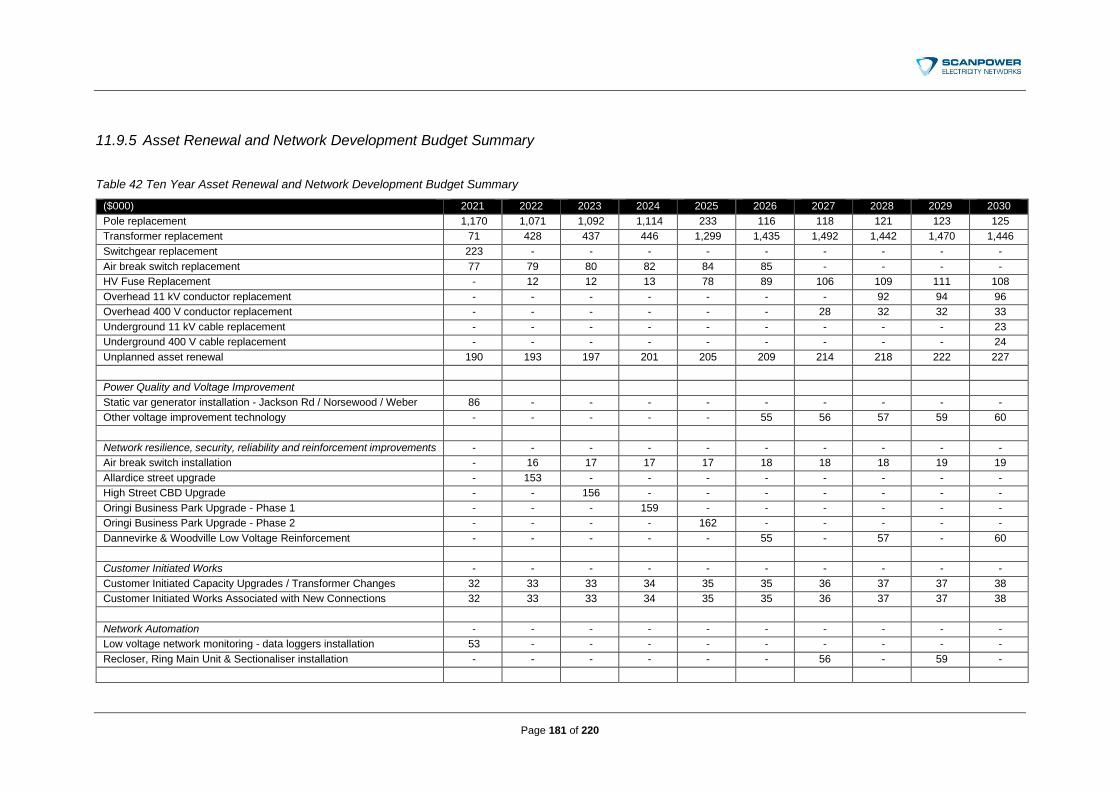
Page 181 of 220
11.9.5 Asset Renewal and Network Development Budget Summary
Table 42 Ten Year Asset Renewal and Network Development Budget Summary
($000) 2021 2022 2023 2024 2025 2026 2027 2028 2029 2030
Pole replacement 1,170 1,071 1,092 1,114 233 116 118 121 123 125
Transformer replacement 71 428 437 446 1,299 1,435 1,492 1,442 1,470 1,446
Switchgear replacement 223 - - - - - - - - -
Air break switch replacement 77 79 80 82 84 85 - - - -
HV Fuse Replacement - 12 12 13 78 89 106 109 111 108
Overhead 11 kV conductor replacement - - - - - - - 92 94 96
Overhead 400 V conductor replacement - - - - - - 28 32 32 33
Underground 11 kV cable replacement - - - - - - - - - 23
Underground 400 V cable replacement - - - - - - - - - 24
Unplanned asset renewal 190 193 197 201 205 209 214 218 222 227
Power Quality and Voltage Improvement
Static var generator installation - Jackson Rd / Norsewood / Weber 86 - - - - - - - - -
Other voltage improvement technology - - - - - 55 56 57 59 60
Network resilience, security, reliability and reinforcement improvements - - - - - - - - - -
Air break switch installation - 16 17 17 17 18 18 18 19 19
Allardice street upgrade - 153 - - - - - - - -
High Street CBD Upgrade - - 156 - - - - - - -
Oringi Business Park Upgrade - Phase 1 - - - 159 - - - - - -
Oringi Business Park Upgrade - Phase 2 - - - - 162 - - - - -
Dannevirke & Woodville Low Voltage Reinforcement - - - - - 55 - 57 - 60
Customer Initiated Works - - - - - - - - - -
Customer Initiated Capacity Upgrades / Transformer Changes 32 33 33 34 35 35 36 37 37 38
Customer Initiated Works Associated with New Connections 32 33 33 34 35 35 36 37 37 38
Network Automation - - - - - - - - - -
Low voltage network monitoring - data loggers installation 53 - - - - - - - - -
Recloser, Ring Main Unit & Sectionaliser installation - - - - - - 56 - 59 -

Page 182 of 220
Table 42 Continued Ten Year Asset Renewal and Network Development Budget Summary
($000) 2021 2022 2023 2024 2025 2026 2027 2028 2029 2030
Other - - - - - - - - - -
To be Determined (Subject to Technology / Load Change etc) - - - - - 55 56 57 59 60
Total Network Development 1,934 2,019 2,059 2,100 2,149 2,188 2,218 2,277 2,320 2,355
Table 43 Ten Year Non Network Asset Budget Summary
($000) 2021 2022 2023 2024 2025 2026 2027 2028 2029 2030
Non network assets
Information and technology systems 30 20 21 21 22 22 23 23 23 24
Asset management systems 277 - - - - - - - - -
Office buildings, depots and workshops - - - - - - - - - -
Office furniture and equipment - - - - - - - - - -
Motor vehicles 251 51 52 53 54 55 56 57 59 60
Tools, plant and machinery 41 20 21 21 22 22 23 23 23 24
Other - - - - - - - - - -
Total Non-Network Assets 599 92 94 96 97 99 101 103 105 108

Page 183 of 220
11.9.6 Ten Year Network Expenditure Summary
Table 44 Ten Year Total Network Expenditure Budget
($000) 2021 2022 2023 2024 2025 2026 2027 2028 2029 2030
Description
Operating Expenditure 4,212 4,296 4,382 4,470 4,559 4,650 4,743 4,838 4,935 5,034
Asset Renewal 1,731 1,784 1,820 1,856 1,899 1,935 1,959 2,012 2,052 2,081
Network Development 203 235 239 244 249 254 259 264 269 275
Non Network Assets 599 92 94 96 97 99 101 103 105 108
Total Network Expenditure 6,745 6,407 6,535 6,665 6,804 6,939 7,062 7,218 7,362 7,497

Page 184 of 220
Figure 82 Ten Year Network Expenditure Forecast (All Categories)
Scanpower has allowed $190k for unplanned asset renewals. This covers equipment failure such as lightning strikes on transformers, car vs pole and tree damage to the lines. Scanpower has also allowed $64k in network upgrades for customer initiated works (CIW). Examples include new transformers or LV underground installation for new subdivisions. The budget has been broken down into two buckets which are the “planned” and “unplanned”. This means that the planned capital renewal and development will never be compromised for unplanned works arising during the year. If need be, the board will be asked for extra funds if the unplanned budget is exceeded. Scanpower is opting to treat pole replacements whether condition driven or age renewal as capital. The pole replacement programme accounts for approximately 65% of the routine capital expenditure though within three years all the hardwood poles will be off the network. As shown in Table 44, network development and asset renewals are in a steady state. For 2021, there is a large non-network capital investment in a new ADMS system. Scanpower has changed its vehicle policies and is now owning its own vehicles rather than leasing. This has increased the non-network asset spend over ten years. Provisions have also been made for replacement of ICT equipment and general tools for the field staff.

Page 185 of 220
From a financial prospective, Scanpower is investing the same into capital renewal and development as the annual deprecation rate, which suggests that assets are being replaced at an adequate rate to sustain the depreciation infrastructure. Scanpower is spending on par with the other EDBs on operating expenditure. More specifically, Scanpower is spending more than the average amount on tree clearance. This has increased from $300,000 to $600,000 per annum. The aim of the increase is to improve network performance by reducing tree faults.

Page 186 of 220
12 EVALUATION OF PERFORMANCE
12.1 Introduction
This section of the asset management plan describes and details the asset management practices Scanpower applies to monitoring network performance, determining strategies and actions for performance improvement, and measuring the effectiveness of those strategies in regard to actual network performance outcomes. Paraphrasing the Network Division’s mission, which is almost generic for most other network operators, is fairly simple and concise: To deliver its consumers a safe, reliable, low cost supply.
12.2 Consultation
A detailed account of stakeholder consultation processes and outcomes can be found in Section 4 of this Plan. This is a key input to the corporate strategic planning process and drives the KPIs by which the network’s management is internally measured. Focus on the above issues is therefore influenced by stakeholder consultation, in particular our consumers, and this provides Scanpower with direction on the outcomes that customers value. In addition to the power supply that Scanpower provides, it is evident that customers also value the broader contribution to the community that the company makes. They are satisfied with the network’s reliability and have pride in their local company delivering something better than that being experienced in neighbouring regions. However, what is more important to them, is that the capability to service them is resident in the community and that their needs are not second priority to larger populations. They know the people involved at personal level, that there are job opportunities for their children and so on. The low cost of supply is meaningful to them in terms of the region’s ability to support and attract economic growth, and the annual network discount reinforces Scanpower’s value to them. The fact that Scanpower is a significant business within the community with managerial capacity to generate and maintain new economic activity that is otherwise retrenching from the regions, is strongly encouraged. There is high support for diversification, and subsidisation of the core business from revenues gained outside the local community. At a company level it makes strategic sense to retain as much economic activity and load in the region as possible even to the point of cherry picking opportunities and applying its entrepreneurial capabilities to grow those businesses and create company value. It is in fact vital for long term viability in the face of business disruption to diversify and create value outside the network. Taken to its conclusion it may be possible for Scanpower to fund a migration to a completely different business model for supply.

Page 187 of 220
12.3 Performance Measurement and Reporting
From an asset management perspective, the mission statement defines our core strategic objectives: performance is measured by,
• Safety compliance;
• Reliability of service and;
• Cost management.
These three factors are in tension with each other. Best performance is not picking a point on the cost-service trade-off line but delivering high service at low cost. Scanpower applies an annual cycle of:
• Benchmarking performance with other networks.
• Analysing annual performance.
• Setting performance targets.
• Determining management strategies and practices to deliver the required outcomes.
• Collating data and monitoring performance information on a monthly reporting cycle.
• Debriefing significant events.
• Completing an annual review to drive continuous improvement in the next cycle of asset management.
12.4 Overview of Key Performance Issues
12.4.1 Safety
Safety is a given. Scanpower is aware of its obligation to build, operate, and maintain assets to regulated standards. The assets are largely compliant with Electricty (Safety) Regulations and their associated Code of Practice. When non-compliance is discovered, it is risk assessed and managed through our defect/improvements management system which is integrated with our company wide Health and Safety, Quality Management, and Network Public Safety Management Systems (all integrated into a single management system developed on a cloud resident software platform called MANGO). These systems include their own processes of annual review, planning, monitoring, and continuous improvement. Health and Safety impacts mainly the operational practices we use; plant and equipment, and the training and competency of human resources. Consequently, it can also affect cost efficiency. It also influences asset management in terms of design, improvements to network configuration, switching and isolation capability.

Page 188 of 220
Public Safety is changing the way we interact with third parties, such as high load transporters, road contractors, and tree workers. This in turn reflects back into some asset management programmes such as improving clearances of road crossings. Safety by design is an area that gets public safety scrutiny. Public safety also blurs the boundaries between Scanpower’s involvement with consumer owned or non-works assets. Scanpower is an operator and its staff are “registered electrical workers” who need to take action when they find something that is not compliant. However, it is Scanpower’s strategy to be proactive with regard to assisting with the management of service line assets. In the long run this reduces their serviceability, impacting on network operations (specifically fault response), ensures network connections are necessary and meeting consumer needs, and sustains a level of consumer funded work against which operational overheads can be spread. Statistical performance monitoring and reporting in regard to safety management is undertaken within the company under the oversight of the Health and Safety Manager including training and associated HR management. That is, reporting of the network division’s safety performance is presented to the CEO and Directors on a monthly basis in accordance with their requirements. The annual management review process includes consultation with the Network Manager. There are a number of system review and auditing processes set in accordance with the Annual Safety Plan. The process is similar for Public Safety Management for which Scanpower holds NZS7900 accreditation externally audited by Telarc. This is only a requirement in regard to Network Division assets (works) and accordingly the Network Manager is designated “Responsible Person”. In all safety areas Scanpower has opted to select leading and lagging performance indicators that are consistent with other power companies so that we can contribute to and benchmark with industry wide programmes.
12.4.2 Cost of Supply
This is largely determined at corporate level which sets the Network’s key financial parameters annually, such as pricing and operating / capital budgets. Asset management operates within the constraints the company imposes in accordance with its corporate objectives and business plan. These are not planned on a 10 year forecast and financial management is adapted on a monthly basis depending on revenues and cash flows of the entire company. Scanpower’s Network Division accounts for less than 50% of total company revenue. The performance of the other divisions affects support of the Network through their contribution to the discount, the company’s ability to fund capital requirements, and minimisation of revenues that need recovery directly from consumers. When these divisions experience a drop in their cash flows, the Network tightens its expenditure to maintain overall company position. However, these other businesses have been set-up to operate independently of the network and we no longer share human and plant resources to prevent them presenting a risk to the network business. Monthly financial management within the Network division is achieved by shifting work programmes between development, routine asset renewal and maintenance, and consumer driven/funded activity. Expenditure is largely pegged by the level of resources the Network can access in terms of staffing establishment. We resource to the minimum requirements to maintain full operating independence in regard to the normal variance in servicing consumers

Page 189 of 220
and maintaining supply i.e. there is a minimum number of people and trucks needed to man operations on a 24/7 basis including response to unplanned events. This resource is treated largely as a fixed cost, so the only variance is what activity we apply them to. When a development project or consumer driven upgrades become a priority, then resources are directed away from routine maintenance and renewal work because there are not sufficient resources to meet each programme at its full “on demand” potential. Nor would it be efficient to resource for peaks. Scanpower’s location and the limited volumes of work it can offer make it unattractive for external contractors to come into the area. This strategy has limits – if the routine programmes are neglected for too long this will be reflected in network performance i.e. faults will increase. This is a matter of balance for which the decisions are informed by the quality of analysis in the asset management process i.e. knowing your assets’ condition and how this affects performance. In Scanpower’s case the assets are in good overall condition so there is some timing flexibility before the least cost life cycle cost is passed. Generally, there is a year or two before asset condition will deteriorate to the point of unacceptable performance. Further there are few critical assets in our network which favours relatively simple rules based asset management strategies.
12.4.3 Reliability
This is the area of performance that attracts the closest management scrutiny on a daily basis. The statistical outcomes are heavily managed results. Outcomes are affected by:
• Network design, standards and quality.
• Application of technology and/or labour innovation.
• Operating practices, working methods and plant.
• Quality of Asset management strategies and objectives. Reliability has two aspects for the consumer:
• How frequently the network faults (unplanned outage) or how frequently we turn supply off for operational issues such as maintenance (planned outage).
• How long the consumer is without an energised supply over the year. Like all NZ networks Scanpower uses two internationally defined indices to measure reliability and availability, which it is also under regulatory obligation to disclose. That is, the regulator has prescribed what the service measures will be – they are not driven by what the consumer necessarily values nor necessarily consistent with ISO55000 Asset Management best practice of determining optimal strategy in terms of corporate objectives.
• SAIDI – System Average Interruption Duration Index – The number of minutes of no supply experienced on average by each consumer connected to the network over a year i.e. how many minutes of non-supply can the average consumer expect each year.

Page 190 of 220
• SAIFI – System Average Interruption Frequency Index – the number of interruptions to supply experienced on average by a consumer supplied by the network each year i.e. how many times per year a consumer can expect to have their power interrupted.
There is a third index, CAIDI, which is a ratio of the above two. It gives an indication of how long it takes on average for supply to be restored once a consumer experiences an outage. As shown in Figure 83, over the past 4 years SAIDI displays an improvement trend equivalent to approximately 1 SAIDI minute every month. The previous year is an anomaly with factors such as targeting higher risk pole replacements within the Dannevirke and Woodville CBD and an unusually high number of truck and vehicles hitting Scanpower assets. Excluding last year’s result, the network is now delivering a performance better than required by the company’s strategic plan which has a KPI of 90 minutes per annum. Actual performance for the past 3 years is closer to 79minutes.
Figure 83 Yearly SAIDI Performance (2013 to 2019)
As per Figure 84, SAIFI displays a similar but slightly stronger downwards trend. Actual annual SAIFI is also well below the KPI target of 1. However this measure is highly sensitive to whether work programs are targeting HV or LV assets and whether they are located on works or private lines.

Page 191 of 220
Figure 84 Yearly SAIFI Performance (2013 to 2019)
At a day to day level Scanpower manages SAIDI / SAIFI performance by monitoring the number of Consumer Minutes Lost (CML) during planned and unplanned events. One SAIDI with a consumer base of 6,500 equates 6,500 CML if supply were lost to the entire network for one minute. Most outages affect only a few consumers but are likely to take longer than one minute to restore. SAIDI and SAIFI budgets are now estimated at the time the capital budgets are produced. Any outage that equates to more than one SAIDI minute requires SAIDI mitigation techniques to be investigated. The strategy is to reduce the shutdown area to an acceptable level. This is usually done by using live line to install mid span isolators, having a larger outage to break the high voltage conductor or using generators to back-feed the 11 kV network. Other techniques such as using multiple line Gangs on a job to increase productivity on a line rebuild and a single shutdown to commission the new line. Scanpower sets an annual target and then allocates this into planned and unplanned monthly budgets. If for example we see an improvement in unplanned outages that we have confidence in being attributable to a particular asset management strategy, then we may choose to lock in the performance improvement by lowering targets for future years. While we have little short term control on preventing unplanned outages, we can manage negative trends to our disclosure targets post event by changing the number of CML we will allow for the following months in respect of planned outages i.e. adjusting work practices and/or the number of consumers affected by a planned outage to compensate. Typically, we budget for planned outages to be approximately 35% of our annual total. Scanpower has managed to get its network into a base level of condition where the typical outage equates to approximately one SAIDI minute over a week and so it starts to be a little academic as to how much continuous improvement is merited. There are diminishing returns in minimising outages altogether and at some point, it would prevent our work crews being fully employed.

Page 192 of 220
The national (reference PWC 2019 Information Disclosure Compendium) average SAIDI sits at approximately 136.7 minutes for unplanned outages and 92.5 minutes for planned outages. In comparison, Scanpower’s performance is recorded as 96.8 minutes for unplanned outages and 78.4 minutes for planned outages. Scanpower has locked in a SAIDI target of 172 and a SAIFI target of 1.53 for the 2020/2021 financial year. In comparison, our neighbouring networks are Powerco and Unison (which are very large networks) and Centralines (which is managed by Unison but the next smallest network to Scanpower). These networks obviously share regional weather factors and terrain similarities with Scanpower, yet our performance is better by factors of 3 to 5. This is attributed to several differences in our asset management approach:
• We target upper quartile performance. This satisfies our consumer owners that we are delivering better performance than the larger companies and neighbouring regions which appeals to their parochialism. In reality it will always be difficult for a large company to move away from the national average as they dominate the statistics.
• Networks with different ownership structures will put shareholder interests ahead of consumer interests i.e. deliberately target a lower cost-performance trade-off.
• Accordingly our performance can be sensitive to extreme events and they do not need to be very large before they exceed our scope of influence. This would present too high a regulatory risk for companies subject to pricing control.
• Larger companies tend to apply strategies of technology innovation to gain some control over matters. In contrast, Scanpower’s management is very close to the coal face and so labour innovation is a more effective strategy for us. Instead of a high spend on technology that is able to deal with outages quickly and efficiently, Scanpower puts the investment into network design and condition so that it simply does not experience the same level of outage in the first place.
• Close management, labour innovation, and local people connected to the local community they are servicing is delivering better performance and cost management than other business models.
An example of close management is; Scanpower does not run a manned control room – there are no Operations Managers, dedicated planners, controllers, operators, working on a 24/7 basis. Instead, every engineer participates in the after hour controller duty roster (including the Network Manager); every engineer therefore has intimate network knowledge and experience of where the network condition and design issues are; every engineer project managing work programs prepares their own switching and has intimate knowledge of what that will cost in terms of CML; and every engineer involved in asset management or design has a working knowledge of network performance and how it is managed.
12.5 Outage Analysis
Outage statistics are analysed over a five year history to determine the effectiveness of past strategy and to determine the need for new strategies. This will look at what causes are driving the statistics and which areas/feeders are performing worse than others.

Page 193 of 220
All outages that cost more than 0.5 SAIDI minutes in a single event are debriefed to determine what the root cause may have been behind such a high cost event. This may be an organisational issue, network configuration or design issue, an access issue, and so on. The 2019/2020 period has been a good year with an estimate of the final SAIDI sitting at 115 minutes (Scanpower’s target).
• There have been several complaints from customers within the Dannevirke CBD about the number of interruptions they are receiving. Factors such as:
o The targeted hardwood pole replacements within the CBD. o The Gordon Street upgrade. o Recent equipment failure. o Bird strikes. o Vehicles vs pole incidents. o Tree issues. o Roofing iron from a house blowing into the lines during a Transpower 11 kV
half bus shutdown taking out the entire Dannevirke CBD.
• Scanpower is aware of the issues and is continually monitoring the situation. Though the planned outages within the CBD were an inconvenience, the resulting work has massively improved the future reliability and security.
• As shown in Figure 93, outages caused by trees are continually rising. Section 12.6.2 describes in detail Scanpower’s strategy for countering this trend.
• There has been a noticeable increase of new work which is increasing SAIDI. Though this reduces the performance of the network, there is also a trade off with extra load and increased revenue stream.
• The number of Gough DDOs that are failing in service is starting to become noticeable. For any planned work, the network faultmen are brought in to replace neighbouring Gough DDOs during planned shutdowns. Efforts are being made at every stop to eliminate them from the network.
• The increased fire risk during February 2020 has changed the way in which Scanpower responds to network faults. Faults in high risk fire areas now require line patrols before re-livening.
The 2018/2019 period has provided some unique challenges for Scanpower, with a final SAIDI sitting at 172 minutes. Several factors have contributed to this which include:
• One outage that nearly costed 22 SAIDI minutes which resulted from:
o A tree branch (which was outside the growth zone) falling onto the line before Weber township which caused the HT conductor to drop to the ground, while in conjunction with;
o A temporary network reconfiguration that shifted the “urban / rural” recloser onto another Transpower feeder breaker that operated incorrectly due inadequate protection coordination and;

Page 194 of 220
o Due to NGOC (Transpower Grid Controller) being busy with transmission faults, Scanpower had to wait 20 minutes before they would close the feeder breaker.
• Trees outside the growth zone are starting to become more intrusive, with some tree roots losing their foundation strength during a deluge of rain causing trees to fall directly onto our lines.
• In 2018 alone, there were several “car vs pole” and “truck vs pole” incidents;
o In one case, a single Ute destroyed two poles that were located 20km apart, within a 20 minute timeframe;
• The daily lightning storms over Christmas resulted in several pole mount transformer failures / replacements;
• Three reclosers, two sectionalisers and two ring main units had failed in service;
o This is of concern as one of the ring main units was only five years old. Scanpower is currently investigating why the unit had failed suddenly;
• A surge in customer initiated works is driving new transformer installations, existing transformer upgrades and general network upgrades.
As previously mentioned, the 2013-2023 AMP fault cause analysis determined that the three key issues driving outage were: 1. Ineffective transient fault clearing as a result of poorly functioning and uncoordinated
protection / automation, largely as a result of systems engineering and lack of integration between protection schemes and higher technology. A strategy of simplification and improved coordination was determined.
2. The tree management process was failing to reach a sufficient pace to deliver reduced
outages and reduced costs. A strategy of targeting only trees that affected HV works (as distinct from private services), including prioritising burning then establishing clearances from where future cost responsibility could be transferred to the tree owner was determined.
3. Asset condition i.e. equipment and specifically poles failing in service was found to be
at a level beyond the least cost life cycle point. The issue with delaying replacement until assets fail is that costs and performance penalties rapidly increase. In comparison, for the same expenditure, premature replacement results in greatly improved outage performance. The hardwood pole population was inspected, replacements more accurately prioritised based on condition and impact, and replacement rate increased until in service failures declined.
In comparison to the 2019/2020 year, issues like:
• Protection coordination has improved; however, more work is still required.
• Trees within the growth zone effectively managed, however trees outside the regulations are the main performance driving issues.

Page 195 of 220
• There have been no pole failures in service which supports the condition and risk based approach for pole renewals.
Provided below are pie charts that illustrate the outage cause analysis (by percentage of total annual SAIDI minutes) for the years 2013 to 2020.
Figure 85 Outage Cause Analysis 2013
Figure 86 Outage Cause Analysis 2014

Page 196 of 220
Figure 87 Outage Cause Analysis 2015
Figure 88 Outage Cause Analysis 2016

Page 197 of 220
Figure 89 Outage Cause Analysis 2017
Figure 90 Outage Cause Analysis 2018

Page 198 of 220
Figure 91 Outage Cause Analysis 2019
Figure 92 Outage Cause Analysis Ending January 2020

Page 199 of 220
Figure 93 SAIDI Trend by Outage Cause (2016 to 2020)
12.6 Review of Outage Performance Strategies
12.6.1 Protection and Automation
The strategy for reducing the level of ghost trippings and erroneous fault sectionalising indications present during faults has been to simplify the protection schemes and get their grading working correctly – technology is there to reduce outages but when it is poorly engineered, it makes things worse. Previous analysis determined that the “Peanut” sectionalisers were not functioning reliably due to their fault detection capability not working when load was very low. These were replaced with “fuse savers” at spur line branch fusing points. The downstream expulsion fusing was refined down so that it graded and provided more effective earth fault protection. The recloser scheme is now much more effective at pushing out fuses where the fault is permanent at the correct network section. The plan was to start with the Weber feeder and then the North feeder as these had the most complicated protection being the most remote from the primary 11kV protection on GXP breakers. This has proved effective. An 80% improvement was achieved in the first year and after three years this cause is now attributed to less than 0.5% (initially 26%) of faults. The fuse saver and grading review will continue to other feeders, but their fault level capability limits their use on “close in” or shorter feeders. The large spur connected area of Kumeroa is the next most beneficial priority. The fuse savers are worthwhile additions to the network even where this isn’t a performance issue because they still detect transient faults and “save” fuses during high winds and lightening.

Page 200 of 220
One improving trend is the correct operation of protection. There has been some work done at Dannevirke substation to modify the protection so urban feeders grade with the downstream protection on rural feeders in non-standard network configuration. This work has come as the result of mis-operation and incorrect grading in previous faults. There have been some recent faults where the sectionalisers and reclosers operate correctly to isolate the faulted sections of lines. This supports the work done by the engineering team to modify the protection and physical equipment on site. The upgraded AutoM8 heads have made a dramatic improvement to the performance of remote switching.
12.6.2 Trees
The level of tree related outages has also greatly improved. Outages due to tree contacts has dropped to an insignificant level. The practice of turning power off for planned tree trimming has also been reduced to minimal levels. The main issues from trees are now trees that are compliant in terms of clearances but fall through lines during adverse weather events. High winds can cause tree throw, typically of more minor nature such as tree top and branch breakout – 2014 shows this characteristic with a high number of events but relatively minimal network damage. Major damage events tend to be the result of large trees uprooting after ground conditions have been softened by rain and/or rot prior to high winds. In wet conditions, access across soggy ground slows fault response. Fall events should naturally decline as fewer and fewer trees in fall distance remain provided landowners can be discouraged from planting within clearance zones. Achieving this position has been an expensive exercise for the Network Division accounting for approximately 40% of its maintenance budget. Tree management is provided by Scanpower’s Treesmart business unit. The justification for Scanpower’s involvement (through its Treesmart Division) to provide the community with a tree cutting service, is that there is limited access in the regions to independent contractors as a result of a small base load of local work. Tree owners have, prior to the establishment of Treesmart, not been able to respond to notices because of lack of affordable resources. This is becoming more and more of an issue locally, with safety management driving up cutting costs and preventing self-service. It was this issue that resulted in the outage problems from inadequate levels of tree cutting that can be achieved via the Safety (Hazards from Trees) Regulations. Forestry is a unique management issue. Trees do not become an issue until they are approaching maturity and the opportunity to address planting has long gone. The problems are insufficient clearances/corridors for management, planted out access tracks to lines, high susceptibility to wind throw and snow break, fire risk, etc. Similar issues are faced by forest owners when it comes to harvest – the power cannot be interrupted for the long periods needed for harvest and it is very expensive to comply with safety codes of practice. Scanpower therefore seeks to negotiate with forestry owners where it is economic for relocation of lines out of forestry blocks and onto road reserve. The forestry owner is asked to contribute the remaining life value of the asset involved. Scanpower will continue to monitor the three pronged attack for managing trees as described in Section 11.1.

Page 201 of 220
12.6.3 Asset Condition
Condition based targeting of the hardwood pole population has resulted in a reduction in network HV in-service pole failures to below one pole per annum. Minor hardware defects are relatively stable. They are however sensitive to wind – analysis indicates the most defects are broken binders and jumpers and clashing issues. Planned pole replacements account for approximately 21% of outages. With decreasing unplanned outages, the position has been maintained via live line practice and minimising the number of consumers affected (reducing the shutdown area). Further in 2015, Scanpower acquired a 100kVA mobile genset – this allows remote ends of spurs to be back fed and is a new option for minimising planned outages in the future.
12.6.4 Fault Debriefing
Scanpower applies several processes to analysing faults and making improvements to reduce the impact of any future outage:
• Every fault report is checked for follow up actions that would eliminate known performance issues. For example, if one fuse base has faulted, the others will be replaced, fuse grading checked, etc.
• Every service line where a safety, compliance or poor condition issue is encountered, it is followed up with a hazard ID process and a quote/discussion with the consumer about its repair. If the consumer chooses not to proceed, a “Do Not Liven” tag is fitted to their connection point and when it fails again we will not re-liven the unsafe/non-compliant supply.
• Faults are debriefed with all field staff at weekly meetings. The purpose of this is to identify whether there are repeating events and/or need for a design review. This captures issues like line clashing resulting from inappropriate conductor spacing for span length. One strategy that has been derived from this process and is proving effective is to strip the network of any unused lines and equipment i.e. where a supply is not longer required the LV lines, transformer and fusing are removed. These are just assets that will age and eventually fault and new supply will need to be redesigned to current standards rather than reusing old asset/designs.
• All events, whether planned or unplanned, that exceed 0.5 SAIDI minutes (3,400 CML) are reviewed to identify why they were so costly. The conclusions from this year’s reviews has been that, in addition to spur connected nature of the network, Scanpower’s network lacks sufficient isolation points to allow the number of consumers affected by an outage to be reduced.
This limitation is the result of Scanpower not having a sub-transmission system; the entire network is split into 11 feeders which are very long and radially fed from the GXP. If for example, Scanpower had 5 zone sub-stations, feeder lengths would be halved and the number of feeders would be double. Scanpower’s strategy for managing voltage constraints by developing bussing points and sub-feeders will address this network configuration issue. It is also a feature of Scanpower’s network design that most of the switching and isolation points are provided by DDO style fusing i.e. it has very few ABS switching points

Page 202 of 220
(approximately 180 ABSs). DDOs do not provide 3 phase break capability and are more limited in terms of their load break / fault make rating when undertaking a fault locating and isolation process. Without switches on every branch, at network node, options for back-livening and/or keeping non-faulted segments of the network live are more limited. Scanpower has approximately twice the number of transformers per network segment than the average network. Accordingly, a plan has been created for the long term development of more ABS switching points on the network. This is a long term program as we can only justify a few each year on the basis of outage performance improvement. Priorities are driven by areas that are repeat offenders in high cost events – Umutaoroa Road is an example. However, the program will be bundled with other network development projects as there is inherent overlap with new design works. There are also other initiatives with regard to ABSs which create opportunity for coordination of objectives, such as ABSs needing upgrade because of a ferro-resonance issue or a load-breaking fault making short coming, in addition to routine age replacement. This is detailed in the Life-Cycle Management section of the Plan.
12.7 Public Safety
The public safety management system has determined the following key areas of focus: Clearances with regard to NZECP34 and specifically road crossings. This has been the outcome of improvements made managing network access by third parties, specifically contractors in the Close Approach Zone and high load transports. Our standard for LV road crossings is to use “neutral screen” cable which is fully insulated, and our plan is to eliminate all bare conductor LV road crossings. While road crossings on designated high load transportation routes are closely monitored and maintained there are a lot older crossings over rural roads that for one reason or another are no longer code compliant – these are not necessarily works and therefore their remedy is to be addressed with service line upgrades and renewal. In addition, older design standards have resulted in low clearances across farmland which is now traversable by modern farm machinery. The majority of fault events Scanpower responds to are in fact LV faults, which are excluded from fault statistics because they generally affect a very small number of connections, and are faults on customers’ service lines which may be HV or LV. As these are beyond the point of connection to Scanpower’s network, their maintenance and fault response falls outside our obligation with regard to Line Function Services. All such related work is undertaken on a user pays basis and attended to after network issues have had first priority to resources. However, Scanpower has opted to take a more proactive role in managing consumer owned assets which are connected to its network, firstly as a public safety initiative and secondly as a value added service to the community – it is simply easier for us to manage their asset for them. With its own assets in much better condition than privately owned assets, statistics indicate that higher value can be added in regards to outage performance delivered by concentrating on poor condition service lines. To support this strategy Scanpower:
• Is undertaking a service line data capture project – we have no data on pole condition, conductor size, design, etc. on which to manage beyond reactive response.

Page 203 of 220
• Established a team of dedicated salaried Faultmen and integrated their role with Network Field Services (services provided to Retailers and Metering companies).
• Established capacity to undertake chargeable service line rebuilds.
• Absorbed the role of design and quoting for service line upgrades into its engineering team giving us much tighter control on what is connected to our network and the standards we want it to comply with.
Our asset management now needs to coordinate priorities on our network and those of consumers. Peaks in service line work displace network activity. Plans and budgets are a little more dynamic in reality to what the Asset Management Plan presents in its prescribed format as there is a significantly broader scope to how Scanpower defines its core business and the narrow regulatory definition of an Electricity Lines Business.
12.8 Review of Progress Against Plan
12.8.1 Financial Performance – Capital Expenditure
The table below summarises Scanpower’s actual capital expenditure versus that budgeted from 2015 to 2019.
Table 45 2014/2015 Actual vs Budget Capital Expenditure
Expenditure Category 2014/15 Actual 2014/15 AMP
Budget
Variance
Routine Capital Expenditure $1,167,546 $1,061,400 +10%
Network Development Capital Expenditure $610,911 $541,000 +13%
TOTAL CAPITAL BUDGET $1,778,457 $1,602,400 +11%
As is evident, capital expenditure was higher than anticipated, by 11% with the variance being driven by unforeseen / unplanned works as opposed to scheduled works. Examples have included customer initiated transformer upgrades and new cabling at South School and Knox Church, and line reconfigurations associated with the (very) high loads brought through the network area by Fonterra (being the new silos for Pahiatua). Aside from this, our planned works were completed in line with expectations.
Table 46 2015/2016 Actual vs Budget Capital Expenditure
Expenditure Category 2015/16 Actual 2015/16 AMP
Budget
Variance
Routine Capital Expenditure $870,000 $983,423 -13%
Network Development Capital Expenditure $658,000 $593,430 +9%
TOTAL CAPITAL BUDGET $1,528,000 $1,576,823 -3%

Page 204 of 220
Table 47 2016/2017 Actual vs Budget Capital Expenditure
Expenditure Category 2016/17 Actual 2016/17 AMP
Budget
Variance
Routine Capital Expenditure $1,316,000 $1,316,038 0%
Network Development Capital Expenditure $357,000 $378,000 -5%
TOTAL CAPITAL BUDGET $1,673,000 $1,694,038 -1.2%
For the previous two financial periods, the total capital expenditure was three and one percent under budget respectively. Scanpower was able to carry out its target pole and transformer replacement program while targeting network development projects that have enhanced the overall performance of the network.
Table 48 2017/2018 Actual vs Budget Capital Expenditure
Expenditure Category 2017/18 Actual 2017/18 AMP
Budget
Variance
Routine Capital Expenditure $2,199,000 $1,339,253 +39%
Network Development Capital Expenditure $740,000 $287,178 +61%
TOTAL CAPITAL BUDGET $2,939,000 $1,626,431 +45%
During the 2017/2018 financial period 2.94 million was spent on capital renewal and network development projects. This was more than originally budgeted for; however, the decision was made to deploy the three line crews from the Contracting Division onto the local network for the five month period of their stand-down from the Powerco Network. Correspondingly, significantly more asset replacement was completed including 396 pole changes (against an initial plan of 200) and 64 transformer changes. Whilst this resulted in a higher level of network capital expenditure, it enabled Scanpower to accelerate the asset management program bring forward work that would have otherwise been undertaken in the coming years.
Table 49 2018/2019 Actual vs Budget Capital Expenditure
Expenditure Category 2018/19 Actual 2018/19 AMP
Budget
Variance
Routine Capital Expenditure $1,251,053 $1,290,000 -3%
Network Development Capital Expenditure $461,176 $460,000 0%
TOTAL CAPITAL BUDGET $1,712,229 $1,750,000 -2%
During the 2018/2019 financial period 1.71 million was spent on capital renewal and network development projects. In summary:

Page 205 of 220
• This year has seen some of Scanpower’s most difficult hardwood poles within high risk areas being renewed (which were SAIDI & cost intensive);
• Additional network development has been completed:
o With a new back feed / tie point being installed for the Kumeroa township and;
o Several new ABSs have been installed along with three new reclosers which will improve the networks resilience and performance.
• Scanpower has had a difficult year with unplanned capital replacements / installations due to asset failures, foreign interference and customer initiated works.
Table 50 shows the spend on capital renewals and network development as of the end of December 2019. The Kumeroa intertie was completed and capitalised under network development resulting in the 20% overspend on budget. The Gordon Street project has come in just over budget which is excellent considering the risk involved with underground projects. At the time of this AMP, the network division’s main focus is to complete the capital hardwood pole programme.
Table 50 2019/2020 Actual vs Budget Capital Expenditure (Progress Ending December 2019, Waiting on January, February & March 2020 Results)
Expenditure Category 2019/2020 Actual 2019/20 AMP
Budget
Variance
Routine Capital Expenditure $1,377,517 $1,714,000 -24%
Network Development Capital Expenditure $259,770 $208,000 20%
TOTAL CAPITAL BUDGET $1,637,287 $1,922,000 -17%

Page 206 of 220
APPENDIX A
Asset Management Maturity Assessment Tool (AMMAT)
Peter Rue Network Manager February 2020
Introduction Schedule 13 of the Electricity Distribution Information Disclosure Determination 2012 requires all Electricity Distribution Businesses (EDBs) to complete an assessment of the maturity of their asset management practices using a prescribed template derived from PAS 55. This requires each EDB to score the maturity of each identified asset management element between 0 and 4 using prompts, and it is expected that the assessment will be repeated at regular intervals as part of the Asset Management Plan disclosure process. Scanpower has in fact undertaken an assessment of its asset management system maturity with regard to preparedness for ISO55000 accreditation in 2023. This is much wider set of questions than required by the regulatory AMMAT. Since that time Scanpower has improved its systems documentation in order to address the weaknesses highlighted. This document updates the AMMAT for improvements achieved to date. Not surprisingly, an organisation preparing itself for ISO55000 will be targeting a maturity Level of 3 – Competent – All elements of ISO 55000 in place and being applied. ISO55000 (which supersedes PAS55) assesses maturity level in accordance with the following chart.

Page 207 of 220
This assessment is part the Asset Management System Annual Management Review. This is an internal review undertaken by the Network Manager. Asset Management of Scanpower’s Network Division is a key responsibility of the Network Manager. Detailed assessment of each element
Q. No. Question Score Evidence
3To what extent has an asset management policy been documented,
authorised and communicated?3
Asset Management Manual Section AM10.20 AM Policy
10
What has the organisation done to ensure that its asset
management strategy is consistent with other appropriate
organisational policies and strategies, and the needs of
stakeholders?
3
AMP Section 4 AM Strategy
11
In what way does the organisation's asset management strategy
take account of the lifecycle of the assets, asset types and asset
systems over which the organisation has stewardship?
3
AMP Section 10 Investment Planning and 11 Life Cycle Management
26
How does the organisation establish and document its asset
management plan(s) across the life cycle activities of its assets and
asset systems?
3
Asset Management Plan
27
How has the organisation communicated its plan(s) to all relevant
parties to a level of detail appropriate to the receiver's role in their
delivery?
3
Asset Management Manual Section AM10.50 AM Communication Plan
29How are designated responsibilities for delivery of asset plan
actions documented?3
Asset Management Manual Section AM20.00 People. AMP Section 8
Organisational Capability
31
What has the organisation done to ensure that appropriate
arrangements are made available for the efficient and cost effective
implementation of the plan(s)?
3
AMP Section 8 Organisational Capability and Section 12 Performance
Evaluation
33
What plan(s) and procedure(s) does the organisation have for
identifying and responding to incidents and emergency situations
and ensuring continuity of critical asset management activities?
3
Asset Management Manual Section AM10.60 AM Continous Improvement
and AM30.00 Risk management
37
What has the organisation done to appoint member(s) of its
management team to be responsible for ensuring that the
organisation's assets deliver the requirements of the asset
management strategy, objectives and plan(s)?
3
AMP Section 9 Risk management
40
What evidence can the organisation's top management provide to
demonstrate that sufficient resources are available for asset
management?
3
AMP Section 8 Organisational Capability
42
To what degree does the organisation's top management
communicate the importance of meeting its asset management
requirements?
3
Asset Management Manual Section AM10.50 AM Communication Plan
45
Where the organisation has outsourced some of its asset
management activities, how has it ensured that appropriate
controls are in place to ensure the compliant delivery of its
organisational strategic plan, and its asset management policy and
strategy?
2
Asset Management Manual Section AM50.00 Works Delivery - Contractor
approval process and service specifications in develpoment
48
How does the organisation develop plan(s) for the human resources
required to undertake asset management activities - including the
development and delivery of asset management strategy,
process(es), objectives and plan(s)?
3
Asset Management Manual Section AM20.00 People. AMP Section 8
Organisational Capability
49
How does the organisation identify competency requirements and
then plan, provide and record the training necessary to achieve the
competencies?
3
Asset Management Manual Section AM20.00 People. AMP Section 8
Organisational Capability
50
How does the organization ensure that persons under its direct
control undertaking asset management related activities have an
appropriate level of competence in terms of education, training or
experience?
3
Asset Management Manual Section AM20.00 People. AMP Section 8
Organisational Capability
53
How does the organisation ensure that pertinent asset
management information is effectively communicated to and from
employees and other stakeholders, including contracted service
providers?
3
Asset Management Manual Section AM10.50 AM Communication Plan
59
What documentation has the organisation established to describe
the main elements of its asset management system and
interactions between them?
3
Asset Management Manual

Page 208 of 220

Page 209 of 220
APPENDIX B
COMPLIANCE ASSESSMENT MATRIX
Reg. Ref. Description AMP Ref.
AMP Design
1 The core elements of asset management- 3.2
1.1 A focus on performance measurement, monitoring and continuous improvement of asset management practices; Sect. 3.0
1.2 Close alignment with corporate vision and strategy; Sect. 4.0
1.3 That asset management is driven by clearly defined strategies, business objectives and service level targets; Sect. 5.0
1.4 That responsibilities and accountabilities for asset management are clearly assigned; 8.1
1.5 An emphasis on knowledge of what assets are owned and why, the location of the assets and the condition of the assets; Sect. 6.0
1.6 An emphasis on optimising asset utilisation and performance; Sect. 10.0
1.7 That a total life cycle approach should be taken to asset management; Sect. 11.0
1.8 That the use of 'non-network' solutions and demand management techniques as alternatives to asset acquisition is considered . Sect.10.0
2 The disclosure requirements are designed to produce AMPs that-
2.1 Are based on, but are not limited to, the core elements of asset management identified in clause 1; 3.2
2.2 Are clearly documented and communicated to all stakeholders; 8.4
2.3 Contain sufficient information to allow interested persons to make an informed judgement about the extent to which the EDB's asset management processes meet best practice criteria consistent with outcomes produced in competitive markets;
Sect. 4.0

Page 210 of 220
Reg. Ref. Description AMP Ref.
2.4 Specifically support the achievement of disclosed service level targets; 5.1
2.5 Emphasise knowledge of the performance and risks of assets and identify opportunities to improve performance and provide a sound basis for ongoing risk assessment ;
9.4
2.6 Consider the mechanics of delivery including resourcing; 8.2
2.7 Consider the organisational structure and capability necessary to deliver the AMP; 8.2
2.8 Consider the organisational and contractor competencies and any training requirements; 8.3
2.9 Consider the systems, integration and information management necessary to deliver the plans; Sect. 7.0
2.10 Use unambiguous and consistent definitions of asset management processes to enhance comparability of asset management practices over time and between EDBs;
Sect. 3.0
2.11 Promote continual improvements to asset management practices. 3.2
3 The AMP must include the following:
3.1 A summary that provides a brief overview of the contents and highlights information that the EDB considers significant Sect. 2.0
3.2 Details of the background and objectives of the EDB's asset management and planning processes including the purpose statement in clause 3.3 of this appendix.
2.1
3.3 A purpose statement which:
3.3.1 makes clear the purpose and status of the AMP in the EDB's asset management practices. The purpose statement must also include a statement of the objectives of the asset management and planning processes
4.1
3.3.2 states the corporate mission or vision as it relates to asset management 4.3
3.3.3 identifies the documented plans produced as outputs of the annual business planning process adopted by the EDB 4.1
3.3.4 states how the different documented plans relate to one another, with particular reference to any plans specifically dealing with asset management 4.1

Page 211 of 220
Reg. Ref. Description AMP Ref.
3.3.5 includes a description of the interaction between the objectives of the AMP and other corporate goals, business planning processes, and plans. The purpose statement should be consistent with the EDB's vision and mission statements, and show a clear recognition of stakeholder interest.
3.1, 5.1
3.4 Details of the AMP planning period, which must cover at least a projected period of 10 years commencing with the disclosure year following the date on which the AMP is required to be disclosed
1.1
3.5 The date that it was approved by the directors - Declaration process has been changed N/A
3.6 A description of stakeholder interests (owners, consumers etc) which identifies important stakeholders and indicates: Sect. 4.0
3.6.1 how the interests of stakeholders are identified 4.2
3.6.2 what these interests are 4.2
3.6.3 how these interests are accommodated in asset management practices 4.2
3.6.4 how conflicting interests are managed 4.2
3.7 A description of the accountabilities and responsibilities for asset management on at least 3 levels, including:
3.7.1 governance-a description of the extent of director approval required for key asset management decisions and the extent to which asset management outcomes are regularly reported to directors
8.1
3.7.2 executive-an indication of how the in-house asset management and planning organisation is structured 8.1
3.7.3 field operations-an overview of how field operations are managed, including a description of the extent to which field work is undertaken in-house and the areas where outsourced contractors are used
8.1
3 .8 All significant assumptions are:
3.8.1 quantified where possible 9.5
3.8.2 clearly identified in a manner that makes their significance understandable to interested persons 9.5
3.8.3 a description of changes proposed where the information is not based on the EDB's existing business 9.5
3.8.4 set out the sources of uncertainty and the potential effect of the uncertainty on the prospective information 9.5

Page 212 of 220
Reg. Ref. Description AMP Ref.
3.8.5 include the price inflator assumptions used to prepare the financial information disclosed in nominal New Zealand dollars in the Network Expenditure AMP Report
9.5
3.9 A description of the factors that may lead to a material difference between the prospective information disclosed and the corresponding actual information recorded in future disclosures
9.6
3.10 An overview of asset management strategy and delivery 3.1
To support the AMMAT disclosure and assist interested persons to assess the maturity of asset management strategy and delivery, the AMP should identify:
• how the asset management strategy is consistent with the supplier's other strategy and policies;
• how the asset strategy takes into account the life cycle of the assets;
• the link between the asset management strategy and the AMP;
• processes that ensure costs, risks and system performance will be effectively controlled when the AMP is implemented.
3.11 An overview of systems and information management data Sect.7.0
To support the AMMAT disclosure and assist interested persons to assess the maturity of systems and information management, the AMP should describe :
• the processes used to identify asset management data requirements that cover the whole of life cycle of the assets;
• the systems used to manage asset data and where the data is used, including an overview of the systems to record asset conditions and operation capacity and to monitor the performance of assets;
• the systems and controls to ensure the quality and accuracy of asset management information; and
• the extent to which these systems, processes and controls are integrated .
3.12 A statement covering any limitations in the availability or completeness of asset management data and disclose any initiatives intended to improve the quality of this data
7.8
3.13 A description of the processes used within the EDB for: 7.6
3.13.1 managing routine asset inspections and network maintenance Sect. 11.0
3.13.2 planning and implementing network development projects Sect. 10.0

Page 213 of 220
Reg. Ref. Description AMP Ref.
3.13.3 measuring network performance. Sect.12.0
3.14 an overview of asset management documentation, controls and review processes
To support the AMMAT disclosure and assist interested persons to assess the maturity of asset management documentation, controls and review processes, the AMP should:
• identify the documentation that describes the key components of the asset management system and the links between the key components;
• describe the processes developed around documentation, control and review of key components of the asset management system;
• where the EDB outsources components of the asset management system, the processes and controls that the EDB uses to ensure efficient and cost effective delivery of its asset management strategy;
• where the EDB outsources components of the asset management system, the systems it uses to retain core asset knowledge in-house; and
• audit or review procedures undertaken in respect of the asset management system.
3.15 An overview of communication and participation processes 8.4
To support the AM MAT disclosure and assist interested persons to assess the maturity of asset management documentation, controls and review processes, the AMP should:
• communicate asset management strategies, objectives, policies and plans to stakeholders involved in the delivery of the asset management requirements, including contractors and consultants;
• incentivise staff engagement in the efficient and cost effective delivery of the asset management requirements.
3.16 The AMP must present all financial values in nominal New Zealand dollars; confirmed
3.17 The AMP must be structured and presented in a way that the EDB considers will support the purposes of AMP disclosure set out in clause 2 above. 3.2
Assets covered
4 The AMP must provide details of the assets covered, including:
4.1 a high-level description of the service areas covered by the EDB and the degree to which these are interlinked, including: Sect. 6.0

Page 214 of 220
Reg. Ref. Description AMP Ref.
4.1.1 the region(s) covered 6.1
4.1.2 identification of large consumers that have a significant impact on network operations or asset management priorities 6.2
4.1.3 description of the load characteristics for different parts of the network 6.3
4.1.4 peak demand and total energy delivered in the previous year, broken down by sub-network, if any. 6.4
4.2 a description of the network configuration, including: 6.5
4.2.1 identifying bulk electricity supply points and any embedded generation with a capacity greater than 1MW. State the existing firm supply capacity and current peak load of each bulk electricity supply point;
6.5.1
4.2.2 a description of the subtransmission system fed from the bulk electricity supply points, including the capacity of zone substations and the voltage(s) of the subtransmission network(s). The AMP must identify the extent to which individual zone substations have n-x subtransmission security;
6.5.2
4.2.3 a description of the distribution system, including the extent to which it is underground; 6.5.3
4.2.4 a brief description of the network's distribution substation arrangements; 6.5.4
4.2.5 a description of the low voltage network including the extent to which it is underground; and 6.5.5
4.2.6 an overview of secondary assets such as protection relays, ripple injection systems, SCADA and telecommunications systems . 6.5.7
4.3 If sub-networks exist, the network configuration information referred to in sub clause 4.2 above must be disclosed for each sub-network. 6.5.8
Network assets by category
4.4 The AMP must describe the network assets by providing the following information for each asset category: Sect. 11.0
4.4.1 voltage levels; 11.3
4.4.2 description and quantity of assets; 11.3.2
4.4.3 age profiles; 11.4

Page 215 of 220
Reg. Ref. Description AMP Ref.
4.4.4 value of the assets in the category; and 11.3.1
4.4.5 a discussion of the condition of the assets, further broken down into more detailed categories as considered appropriate. Systemic issues leading to the premature replacement of assets or parts of assets should be discussed.
11.5, 11.6
4.5 The asset categories discussed in sub clause 4.4 above should include at least the following: Sect. 6.0
4.5.1 the categories listed in the Network Asset AMP Report set out in Schedule 16; 6.5
4.5.2 assets owned by the EDB but installed at bulk supply points owned by others; 6.5.7
4.5.3 EDB owned mobile substations and generators whose function is to increase supply reliability or reduce peak demand; and 6.5.9
4.5.4 other generation plant owned by the EDB. Service Levels 6.5.10
Service Levels
5
The AMP must clearly identify or define a set of performance indicators for which annual performance targets have been defined. The annual performance targets must be consistent with business strategies and asset management objectives and be provided for each year of the AMP planning period. The targets should reflect what is practically achievable given the current network configuration, condition and planned expenditure levels. The targets should be disclosed for each year of the AMP planning period.
Sect. 5.0
6 For non-exempt EDBs, performance indicators for which targets have been defined in clause 5 above must include the SAlDl assessed value and the SAIFI assessed value required under the price quality path determination applying to the regulatory assessment period in which the next disclosure year falls.
5.1
7 Performance indicators for which targets have been defined in clause 5 above should also include:
7.1 Consumer oriented indicators that preferably differentiate between different categories of consumer; 10.5.2
7.2 Indicators of asset performance, asset efficiency and effectiveness, and service efficiency, such as technical and financial performance indicators related to the efficiency of asset utilisation and operation.
4.3.4
8 The AMP must describe the basis on which the target level for each performance indicator was determined. Justification for target levels of service includes consumer expectations or demands, legislative, regulatory, and other stakeholders' requirements or considerations. The AMP should demonstrate how stakeholder needs were ascertained and translated into service level targets.
Sect. 4&5
9 Targets should be compared to historic values where available to provide context and scale to the reader . 12.4.3
10 Where forecast expenditure is expected to materially affect performance against a target defined in clause 5 above, the target should be consistent with the expected change in the level of performance .
N/A

Page 216 of 220
Reg. Ref. Description AMP Ref.
Network Development Planning
11 AMPs must provide a detailed description of network development plans, including- Sect. 10.0
11.1 A description of the planning criteria and assumptions for network development; 10.2
11.2 Planning criteria for network developments should be described logically and succinctly. Where probabilistic or scenario-based planning techniques are used, this should be indicated and the methodology briefly described.
10.4
11.3 A description of strategies or processes (if any) used by the supplier that promote cost efficiency through the use of standardised assets and designs;
10.2
11.4 The use of standardised designs may lead to improved cost efficiencies. This section should discuss: 7.10
11.4.1 the categories of assets and designs that are standardised; 7.10
11.4.2 the approach used to identify standard designs. 7.10
11.5 A description of strategies or processes (if any) used by the EDB that promote the energy efficient operation of the network. 10.5
11.6 A description of the criteria used to determine the capacity of new equipment for different types of assets or different parts of the network.
10.5
11.7 A description of the process and criteria used to prioritise network development projects and how these processes and criteria align with the overall corporate goals and vision.
10.4
11.8 Details of demand forecasts, the basis on which they are derived, and the specific network locations where constraints are expected due to forecast increases in demand;
10.5
11.8.1 explain the load forecasting methodology and indicate all the factors used in preparing the load estimates; 10.5.4
11.8.2 provide separate forecasts to at least the zone substation level covering at least a minimum 5 year forecast period. Discuss how uncertain but substantial individual projects/developments that affect load are taken into account in the forecasts, making clear the extent to which these uncertain increases in demand are reflected in the forecasts;
10.5
11.8.3 identify any network or equipment constraints that may arise due to the anticipated growth in demand during the AMP planning period; and
10.5

Page 217 of 220
Reg. Ref. Description AMP Ref.
11.8.4 discuss the impact on the load forecasts of any embedded generation or anticipated levels of distributed generation in a network, and the projected impact of any demand management initiatives.
10.5
11.9 Analysis of the significant network level development options available and details of the decisions made to satisfy and meet target levels of service, including:
10.5
11.9.1 the reasons for choosing a selected option for projects where decisions have been made;
11.9.2 the alternative options proposed for projects that are planned to start in the next 5 years and the potential for non-network solutions described;
10.5
11.9.3 a consideration of planned innovations that improve efficiencies within the network, such as improved utilisation, extended asset lives, and deferred investment.
10.5
12 AMPs must include a description and identification of the network development programme including distributed generation and non-network solutions and actions to be taken, including associated expenditure projections. The network development plan must include:
10.5
12.1 A detailed description of the projects currently underway or planned to start within the next 12 months;
10.6, 10.7
12.2 A summary description of the projects planned for the next 4 years; and 10.6
12.3 An overview of the projects being considered for the remainder r of the AMP planning period. 10.6
13 AMPs must describe the EDB's policies on distributed generation, including the policies for connecting embedded generation. The impact of such generation on network development plans must also be stated.
10.2
14 AMPs must discuss the EDB's policies on non-network solutions, including: 10.2
14.1 Economically feasible and practical alternatives to conventional network augmentation. These are typically approaches that would reduce network demand and/or improve asset utilisation; and
10.2,10.6
14.2 The potential for non-network solutions to address network problems or constraints . 10.2,10.6
Lifecycle Asset Management Planning (Maintenance and Renewal)
15 The AMP must provide a detailed description of the lifecycle asset management processes, including- Sect. 11.0

Page 218 of 220
Reg. Ref. Description AMP Ref.
15.1 The key drivers for maintenance planning and assumptions ; 11.5
15.2 Identification of routine and corrective maintenance and inspection policies and programmes and actions to be taken for each asset category, including associated expenditure projections. This must include:
11.6
15.2.1 the approach to inspecting and maintaining each asset category, including a description of the types of inspections, tests and condition monitoring carried out and the intervals at which this is done;
11.7
15.2.2 any systemic problems identified with any particular asset types and the proposed actions to address these problems; and 11.5
15.2.3 budgets for maintenance activities broken down by asset category for the AMP planning period. 11.9
15.3 Identification of asset refurbishment and renewal policies and programmes and actions to be taken for each asset category, including associated expenditure projections. This must include:
11.6
15.3.1 the processes used to decide when and whether an asset is replaced or refurbished, including a description of the factors on which decisions are based;
11.5&6
15.3.2 a description of the projects currently underway or planned for the next 12 months; 11.7
15.3.3 a summary of the projects planned for the following 4 years; and 11.9
15.3.4 an overview of other work being considered for the remainder of the AMP planning period. 11.8,11.9
Risk Management
16 AMPs must provide details of risk policies, assessment, and mitigation, including- Sect. 9.0
16.1 Methods, details and conclusions of risk analysis; 9.4
16.2 Strategies used to identify areas of the network that are vulnerable to high impact low probability events and a description of the resilience of the network and asset management systems to such events;
9.4
16.3 A description of the policies to mitigate or manage the risks of events identified in sub clause 16.2 above; 9.4
17 Details of emergency response and contingency plans. 9.2

Page 219 of 220
Reg. Ref. Description AMP Ref.
18 Details of any insurance cover for the assets, including: 9.3
18.1 The EDB's approaches and practices in regard to the insurance of assets, including the level of insurance; 9.3
18.2 In respect of any self insurance, the level of reserves, details of how reserves are managed and invested, and details of any reinsurance. 9.3
Evaluation of performance
19 AMPs must provide details of performance measurement, evaluation, and improvement, including- Sect. 12.0
19.1 A review of progress against plan, both physical and financial;
• referring to the most recent disclosures made under clause 5 of section 2.5, discussing any significant differences and highlighting reasons for substantial variances;
• commenting on the progress of development projects against that planned in the previous AMP and provide reasons for substantial variances along with any significant construction or other problems experienced;
• commenting on progress against maintenance initiatives and programmes and discuss the effectiveness of these programmes noted.
19.2 An evaluation and comparison of actual service level performance against targeted performance; 12.6
• in particular, comparing the actual and target service level performance for all the targets discussed under the Service Levels section of the AMP over the previous 5 years and explain any significant variances;
19.3 An evaluation and comparison of the results of the asset management maturity assessment disclosed in the AMMAT Report against relevant objectives of the EDB's asset management and planning processes.
7.11
19.4 An analysis of gaps identified in sub clauses 19.2 and 19.3 above . Where significant gaps exist (not caused by one-off factors), the AMP must describe any planned initiatives to address the situation .
12.4
Capability to deliver
20 AMPs must describe the processes used by the EDB to ensure that;
20.1 The AMP is realistic and the objectives set out in the plan can be achieved ; 8.2
20.2 The organisation structure and the processes for authorisation and business capabilities will support the implementation of the AMP plans. 8.2

Page 220 of 220
Reg. Ref. Description AMP Ref.
AMMAT Report
21 Each supplier must complete the AMMAT Report. The EDB must ensure that the person responsible for managing network assets (or a similar level individual) in the organisation takes responsibility for completing and maintaining the AMMAT, including:
Append. B
21.1 Organising people within the organisation to answer the questions; 7.4
21.2 Arranging for all information to be captured within the AMMAT; 7.4
21.3 Reporting to the organisation on the results of the assessment; 7.4
21.4 Planning the assessment process, including:
21.4.1 determining the form the assessment process is to take. In this context, the principal formats are generally taken to be interviews, facilitated groups/pane ls or a combination of the two;
7.12
21.4.2 arranging for appropriate outsourced service providers and stakeholders to act as respondents during the assessment exercise; 7.12
21.4.3 providing appropriate pre-assessment communication (and training where appropriate) to ensure that, as a minimum, the proposed respondents are aware of the AMMAT process and the part within it that they are being asked to play;
7.12
21.4.4 identifying which questions are to be asked of which respondents . 7.12