township of southgate asset management plan roads, bridges ...
124
TOWNSHIP OF SOUTHGATE ASSET MANAGEMENT PLAN ROADS, BRIDGES, STORM, FACILITIES, WATER AND WASTEWATER ASSETS In association with: MARCH 13, 2014
-
Upload
khangminh22 -
Category
Documents
-
view
2 -
download
0
Transcript of township of southgate asset management plan roads, bridges ...

TOWNSHIP OF SOUTHGATE
ASSET MANAGEMENT PLAN
ROADS, BRIDGES, STORM, FACILITIES, WATER AND WASTEWATER ASSETS
In association with:
MARCH 13, 2014

Watson & Associates Economists Ltd. H:\Southgate\2013 AM\Southgate AMP Report.docx
CONTENTS Page
EXECUTIVE SUMMARY (i)
1. INTRODUCTION 1.1 Overview 1-1 1.2 Plan Development 1-1 1.3 Maintaining the Asset Management Plan 1-2 1.4 Plan Integration 1-3
2. STATE OF LOCAL INFRASTRUCTURE 2.1 Scope and Process 2-1 2.2 Capital Asset Overview 2-2 2.3 Asset Age Analysis 2-5 2.4 Asset Condition 2-6 2.5 Data Accuracy and Completeness 2-8
3. EXPECTED LEVELS OF SERVICE 3.1 Scope and Process 3-1 3.2 Current Levels of Service vs. Expected Levels of Service 3-1 3.3 Level of Service Performance Measures 3-3
4. ASSET MANAGEMENT STRATEGY 4.1 Scope and Process 4-1 4.2 Risk Assessment 4-1 4.3 Priority Identification 4-3 4.4 Long-Term Forecast 4-4 4.5 Procurement Methods 4-9
5. FINANCING STRATEGY 5.1 Scope and Process 5-1 5.2 Historical Results 5-2 5.3 Financing Strategy 5-5 5.4 Funding Shortfall 5-9
6. RECOMMENDATIONS 6-1

Watson & Associates Economists Ltd. H:\Southgate\2013 AM\Southgate AMP Report.docx
CONTENTS Page
APPENDICES A DETAILED ASSET INVENTORY A-1 B ASSET MANAGEMENT ASSUMPTIONS B-1 C DATA VERIFICATION AND CONDITION ASSESSMENT POLICY C-1 D LEVEL OF SERVICE IMPACT ANALYSIS D-1 E SCENARIO ANALYSIS – CAPITAL FORECASTS E-1 F TAX SUPPORTED ASSET MANAGEMENT STRATEGY & FINANCING STRATEGY F-1 G WATER ASSET MANAGEMENT STRATEGY & FINANCING STRATEGY G-1 H WASTEWATER ASSET MANAGEMENT STRATEGY & FINANCING STRATEGY H-1

Watson & Associates Economists Ltd. H:\Southgate\2013 AM\Southgate AMP Report.docx
EXECUTIVE SUMMARY


(i)
Watson & Associates Economists Ltd. H:\Southgate\2013 AM\Southgate AMP Report.docx
EXECUTIVE SUMMARY
This report contains the Asset Management Plan for the Township of Southgate (Township) and
has been organized as follows:
Chapter 1: Introduction;
Chapter 2: State of Local Infrastructure;
Chapter 3: Expected Levels of Service;
Chapter 4: Asset Management Strategy;
Chapter 5: Financing Strategy; and
Chapter 6: Recommendations.
The “state of local infrastructure” chapter provides an overview of the capital assets owned by
the Township. This includes detailed information on the Township’s asset inventory, including
asset attributes, accounting valuations, replacement costs, useful life, age and asset condition.
This information provides the foundation for other sections of the asset management plan.
“Expected levels of service” compares the current level of service provided by the Township to
the level of service determined to be expected in each area. This analysis combines both
descriptions/comments as well as performance measures in establishing service levels.
The “asset management strategy” provides a long term operating and capital forecast for asset
related costs, indicating the requirements for maintaining, rehabilitating, replacing/disposing and
expanding the Township’s assets, while moving towards the specified expected levels of service
identified above. The goal of the asset management strategy is to have the Township in (or
moving towards) a sustainable asset management position over the forecast period.
The “financing strategy” identifies a funding plan for the asset management strategy, including a
review of historical results and recommendations with respect to the required amounts and
types of funding (revenue) annually. Also, any infrastructure funding deficits/shortfalls are
identified and recommendations are made regarding potential approaches to reduce and
mitigate the shortfall over the forecast period.
Overall, this asset management plan is a tool to be used by Township staff for capital and
financial decision making. It can be tied to various existing reports (such as the Township’s
budget, official plan and strategic planning reports) to ensure the asset management plan can
be updated to reflect any changes in Township priorities.


Watson & Associates Economists Ltd. H:\Southgate\2013 AM\Southgate AMP Report.docx
1. INTRODUCTION


1-1
Watson & Associates Economists Ltd. H:\Southgate\2013 AM\Southgate AMP Report.docx
1. INTRODUCTION
1.1 Overview
The main objective of this asset management plan is to use the Township’s best available
information to develop a comprehensive long term plan for capital assets. In addition, the plan
should provide sound methodologies and support in order to improve the accuracy of the plan
on a go forward basis.
Watson & Associates Economists Ltd. (Watson) in association with Triton Engineering Services
Limited (Triton) was retained by the Township to prepare an asset management plan. This plan
is intended to be a tool for Township staff to use during various decision making processes,
including the annual budgeting process and capital grant application processes. This plan will
serve as a road map for sustainable infrastructure planning going forward.
The following assets are included in this asset management plan:
Road related (roads, bridges and culverts);
Storm catch basins;
Facilities;
Water related (mains and facilities); and
Wastewater (mains and facilities).
The Township’s goals and objectives with respect to their capital assets relate to the level of
service being provided to Township residents. Services should be provided at expected levels,
as defined within this asset management plan. Township infrastructure and other capital assets
should be maintained at condition levels that provides a safe and functional environment for its
residents. Therefore, the asset management plan and its implementation will be evaluated
based on the Township’s ability to meet these goals and objectives.
1.2 Plan Development
The asset management plan process developed a program that leverages the Township’s asset
database information, staff input and asset management principles.
The development of the Township’s asset management plan was based on the steps
summarized below:
1) Develop a complete listing of capital assets to be included in the plan, including
attributes such as size/material type, useful life, age, accounting valuation and current
valuation. Update current valuation to 2013 dollars, where required, using applicable
inflationary indices or benchmark data.

1-2
Watson & Associates Economists Ltd. H:\Southgate\2013 AM\Southgate AMP Report.docx
2) Assess current condition of the assets, based on a combination of existing Township
reports and an age analysis.
3) Assess the risk of asset failure for each asset, based on determining the probability of
each asset failing, as well as the consequence of the asset failing. This risk analysis
identifies priority projects for inclusion in the asset management plan, as well as asset
risk levels that require mitigation.
4) Determine and document current levels of service, as well as expected levels of service,
based on discussions with Township staff.
5) Prepare an asset management strategy (i.e. operating and capital forecast) based on
the asset inventory, identified priorities, forecast scenarios, and level of service analysis
discussed above.
6) Determine a financing strategy to support asset management strategy, thus determining
how the operating and capital related expenditure forecast will be funded over the
period.
7) Prepare a comprehensive Asset Management Plan final report.
1.3 Maintaining the Asset Management Plan
The asset management plan should be updated as the capital needs and priorities of the
Township change. This can be accomplished in conjunction with the Township’s budget
process. Township staff will have the tools available to perform updates to the plan when
needed.
When updating the asset management plan, note that the state of local infrastructure, expected
levels of service, asset management strategy and financing strategy are integrated and impact
each other. Looking at these components in reverse order, the financing strategy outlines how
the asset management strategy will be funded. The asset management strategy illustrates the
costs required to maintain expected levels of service at a sustainable level. The expected levels
of service component summarizes and links each service area to specific assets contained in
the state of local infrastructure section and thus determines how these assets will be used to
provide expected service levels.
While this report covers a forecast period of 20 years, the full lifecycle of the Township’s assets
was considered in the calculations. It is suggested that more focus and attention be put on the
first 5 years of the asset management plan, to ensure accurate capital planning in the short
term.

1-3
Watson & Associates Economists Ltd. H:\Southgate\2013 AM\Southgate AMP Report.docx
1.4 Plan Integration
The municipal environment is a continually changing and demanding environment when it
comes to legislation and other responsibilities. Integrating the asset management plan with the
Township’s budget process as well as Public Sector Accounting Board Section 3150 (PSAB
3150) requirements can make updates in all three areas more efficient.
With respect to integrating the Township’s budget process with asset management planning,
both require a projection of capital and operating costs of a future period. The budget outlines
total operating and capital requirements of the Township, while the asset management plan
focuses in on specific asset related requirements. With this link to the annual budget, the
budget update process can become an asset management plan update process.
Both asset management and PSAB 3150 require a complete and accurate asset inventory. The
significant difference between the two lies in valuation approaches; PSAB 3150 requires
historical cost valuation, while asset management requires future replacement cost valuation.
Using a single asset inventory containing both valuation methods is an effective approach to
maintaining the Township’s asset data.
Further integration into other Township financial/planning documents would assist in ensuring
the ongoing accuracy of the asset management plan, as well as the integrated
financial/planning documents. The asset management plan has been developed to allow
linkages to documents such as:
Development Charge Background Study;
Official Plan;
Water and Wastewater Rate Study;
Strategic Planning Reports;
Fiscal Impact/Operating Studies; and
Insurance valuations and records.


Watson & Associates Economists Ltd. H:\Southgate\2013 AM\Southgate AMP Report.docx
2. STATE OF LOCAL INFRASTRUCTURE


2-1
Watson & Associates Economists Ltd. H:\Southgate\2013 AM\Southgate AMP Report.docx
2. STATE OF LOCAL INFRASTRUCTURE
2.1 Scope and Process
This section of the plan provides an opportunity to develop a greater understanding of the
capital assets owned by the Township. The state of local infrastructure analysis includes:
An asset database documenting asset types, sub-types including quantities, materials
and other similar asset attributes;
Financial accounting valuation;
Replacement cost valuation;
Asset age distribution analysis and asset age as a proportion of expected useful life;
Asset condition information;
Data Verification and Asset Condition policies; and
Documentation of assumptions made in creating the asset inventory.
The Township has a detailed inventory listing, created for both capital planning and PSAB 3150
purposes. This asset inventory is updated annually and was used as a starting point in fulfilling
the requirements of this report. This inventory provides current financial account valuations (i.e.
historical cost, accumulated amortization and net book value) as well as attributes such as
useful life, and age. With respect to replacement cost, historical costs were inflated to 2013
dollars where replacement costs were not provided by Township staff, existing reports or Triton
Engineering.
The following data and reports were used to supplement the Township’s asset inventory during
this process:
a) Documents and data from Triton Engineering;
b) 2011 Water and Wastewater Rate Study;
c) 2011 Ontario Regulation 453/07 Water Financial Plan;
d) 2010 Development Charge Study Final Report;
e) Bridge Inspection Reports;
f) 2013 Road Condition Data; and
g) Discussions with Township staff.
2-2
Watson & Associates Economists Ltd. H:\Southgate\2013 AM\Southgate AMP Report.docx
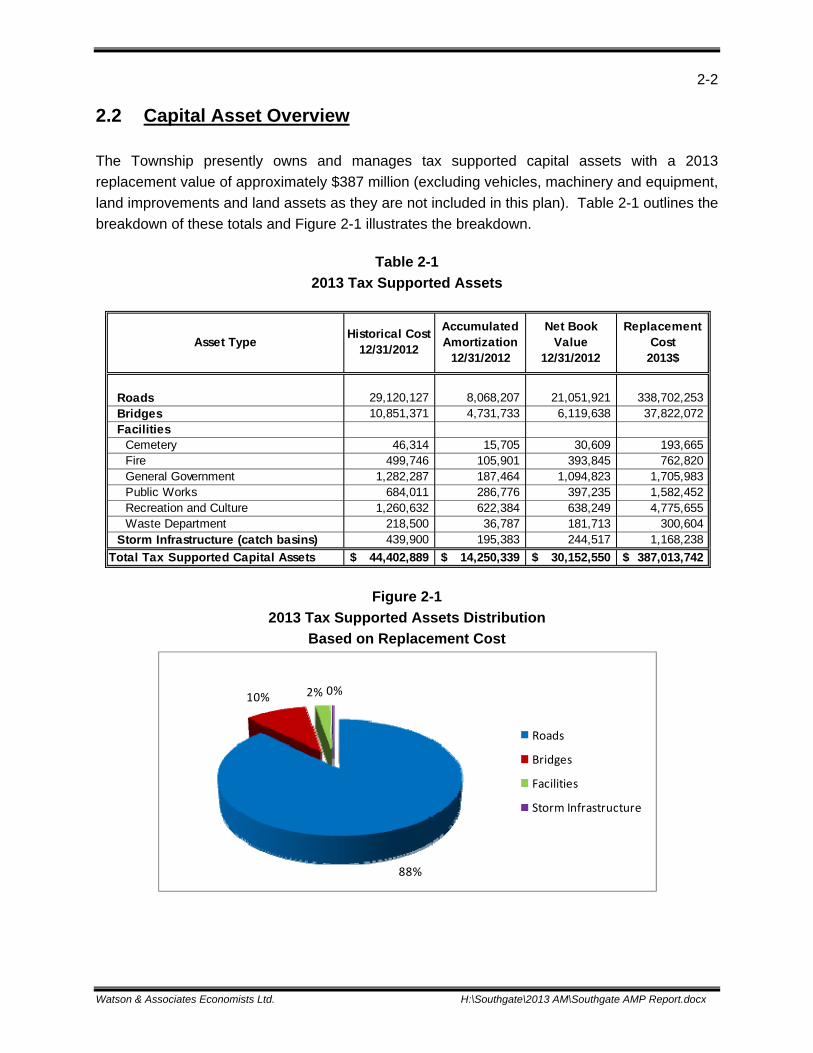
2.2 Capital Asset Overview
The Township presently owns and manages tax supported capital assets with a 2013
replacement value of approximately $387 million (excluding vehicles, machinery and equipment,
land improvements and land assets as they are not included in this plan). Table 2-1 outlines the
breakdown of these totals and Figure 2-1 illustrates the breakdown.
Table 2-1
2013 Tax Supported Assets
Figure 2-1
2013 Tax Supported Assets Distribution
Based on Replacement Cost
Roads 29,120,127 8,068,207 21,051,921 338,702,253 Bridges 10,851,371 4,731,733 6,119,638 37,822,072 Facilities
Cemetery 46,314 15,705 30,609 193,665 Fire 499,746 105,901 393,845 762,820 General Government 1,282,287 187,464 1,094,823 1,705,983 Public Works 684,011 286,776 397,235 1,582,452 Recreation and Culture 1,260,632 622,384 638,249 4,775,655 Waste Department 218,500 36,787 181,713 300,604
Storm Infrastructure (catch basins) 439,900 195,383 244,517 1,168,238
Total Tax Supported Capital Assets 44,402,889$ 14,250,339$ 30,152,550$ 387,013,742$
Asset TypeHistorical Cost
12/31/2012
Accumulated Amortization
12/31/2012
Net Book Value
12/31/2012
Replacement Cost
2013$
88%
10% 2% 0%
Roads
Bridges
Facilities
Storm Infrastructure

2-3
Watson & Associates Economists Ltd. H:\Southgate\2013 AM\Southgate AMP Report.docx
The Township presently owns and manages water capital assets with a 2013 replacement value
of approximately $8.21 million (excluding vehicles, machinery and equipment, land
improvements and land assets as they are not included in this plan). Table 2-2 outlines the
breakdown of these totals and Figure 2-2 illustrates the breakdown.
Table 2-2
2013 Water Assets
Figure 2-2
2013 Water Assets Distribution
Based on Replacement Cost
Water Facilities $ 1,679,069 $ 215,502 $ 1,463,567 $ 1,478,585 Water Mains $ 1,736,097 $ 666,329 $ 1,069,767 $ 6,728,940
Total Water Capital Assets 3,415,166$ 881,832$ 2,533,334$ 8,207,525$
Asset TypeHistorical
Cost12/31/2012
Accumulated Amortization
12/31/2012
Net Book Value
12/31/2012
Replacement Cost
2013$
18%
82%
Water Facilities
Water Mains

2-4
Watson & Associates Economists Ltd. H:\Southgate\2013 AM\Southgate AMP Report.docx
The Township presently owns and manages wastewater capital assets with a 2013 replacement
value of approximately $17.6 million (excluding vehicles, machinery and equipment, land
improvements and land assets as they are not included in this plan). Table 2-3 outlines the
breakdown of these totals and Figure 2-3 illustrates the breakdown.
Table 2-3
2013 Wastewater Assets
Figure 2-3
2013 Wastewater Assets Distribution
Based on Replacement Cost
Tables 2-1, 2-2 and 2-3 also shows the Township’s financial accounting valuation summary by
asset type. Since 2009, the Township has been required under PSAB 3150 to maintain asset
listings complete with historical cost (i.e. the original cost to purchase or construct an asset),
accumulated amortization and net book value. These values are reported on the Township’s
audited financial statements each year.
It is recommended at that vehicles, machinery and equipment and land improvements capital
assets be added to this plan in the future, so that all capital assets managed by the Township
are included in the analysis. It is also recommended that the Township’s PSAB 3150 asset data
Wastewater Facilities 1,804,163 525,376 1,278,787 3,366,866 Wastewater Mains 1,466,513 973,744 492,769 14,244,539
Total Wastewater Capital Assets 3,270,676$ 1,499,120$ 1,771,555$ 17,611,405$
Asset TypeHistorical
Cost12/31/2012
Accumulated Amortization
12/31/2012
Net Book Value
12/31/2012
Replacement Cost
2013$
19%
81%
Wastewater Facilities
Wastewater Mains

2-5
Watson & Associates Economists Ltd. H:\Southgate\2013 AM\Southgate AMP Report.docx
be consolidated with asset management data to allow for the upkeep and maintenance of one
all encompassing asset database.
The detailed capital asset inventory is contained in Appendix A. Assumptions pertaining to the
asset inventory were documented as part of the asset management process are shown in
Appendix B.
2.3 Asset Age Analysis
Each asset is tracked based on estimated total useful life and remaining service life. Using this
information, an age analysis of the Township’s assets can assist in identifying potential areas of
focus for the asset management plan.
Table 2-4 provides an age analysis summary, including the weighted (based on replacement
cost) average useful life and weighted average remaining useful life for all of the assets included
in this plan. This analysis can assist in identifying potential short-term priorities within specific
asset areas.
Table 2-4
Asset Age Analysis
Useful LifeRemaining Useful Life
% Useful Life Remaining
Roads 50 24 48.00%Bridges 50 15 30.00%Facilities
Cemetery 50 10 19.99%Fire 50 39 78.00%General Government 50 39 77.52%Public Works 50 26 51.07%Recreation and Culture 50 15 29.48%Waste Department 50 41 82.12%
Storm Infrastructure (catch basins) 50 21 41.02%
Asset Type
Weighted Average (Rounded)
Useful LifeRemaining Useful Life
% Useful Life Remaining
Water Facilities 39 32 80.44%Water Mains 70 29 40.86%
Asset Type
Weighted Average (Rounded)

2-6
Watson & Associates Economists Ltd. H:\Southgate\2013 AM\Southgate AMP Report.docx
Total useful life and remaining service life for each capital asset is documented in Appendix A.
While this analysis can be useful in looking at the overall age characteristics of specific asset
areas, asset condition (see below) will assist in providing a more accurate assessment of assets
reaching the end of their useful life.
2.4 Asset Condition
Including condition assessments in the asset management plan provides for a higher level of
accuracy than simply relying on useful life assumptions, especially when it comes to older,
highly used or more financially significant assets. Condition assessments can provide more
realistic estimates of remaining service life, which can then be used to establish rehabilitation or
replacement schedules.
Condition ratings were derived from a combination of ratings provided by Triton Engineering
(Triton), available studies (listed in section 2.1), data provided by staff and the age analysis.
Please refer to Appendix B for additional information on the condition ratings provided by Triton.
This numerical rating was then converted to a condition description of “Very Poor” to “Very
Good”. A high level summary of the weighted average condition in each asset category is as
follows:
Useful LifeRemaining Useful Life
% Useful Life Remaining
Wastewater Facilities 41 24 58.07%Wastewater Mains 70 33 46.98%
Weighted Average (Rounded)
Asset Type

2-7
Watson & Associates Economists Ltd. H:\Southgate\2013 AM\Southgate AMP Report.docx
Table 2-5
Weighted Average Condition by Asset Category
Further discussion of condition assessments will take place in Chapter 4 when assessing asset
risk and identifying asset priorities. Furthermore, detailed asset conditions are documented in
Appendix A to this report. It is recommended that these condition assessments be updated as
new information becomes available. This will allow the Township to move away from using
asset age to determine condition, to a more accurate rating system. Please see section 2.5 for
further details.
Roads AverageBridges AverageFacilities
Cemetery PoorFire GoodGeneral Government GoodPublic Works AverageRecreation and Culture PoorWaste Department Good
Storm Infrastructure (catch basins) Average
Asset Type Condition
Water Facilities GoodWater Mains Average
Asset Type Condition
Wastewater Facilities GoodWastewater Mains Average
ConditionAsset Type

2-8
Watson & Associates Economists Ltd. H:\Southgate\2013 AM\Southgate AMP Report.docx
2.5 Data Accuracy and Completeness
An important element of this asset management plan is ensuring that tools and procedures are
in place to maintain accuracy and completeness of the asset data and calculations moving
forward. As time passes, assets are used, maintained, improved, disposed of, and replaced.
All of these lifecycle events can trigger changes to the asset database used within the asset
management plan. Therefore, tools and procedures are essential to ensure the asset data
remains accurate and complete. Please refer to Appendix C to this report for the “Data
Verification and Condition Assessment Policy” for the Township. This policy illustrates how the
asset data will be updated and verified going forward. This includes the timing of condition
assessments for each asset area, as well as what should be included within the condition
assessment procedures.

Watson & Associates Economists Ltd. H:\Southgate\2013 AM\Southgate AMP Report.docx
3. EXPECTED LEVELS OF SERVICE

3-1
Watson & Associates Economists Ltd. H:\Southgate\2013 AM\Southgate AMP Report.docx
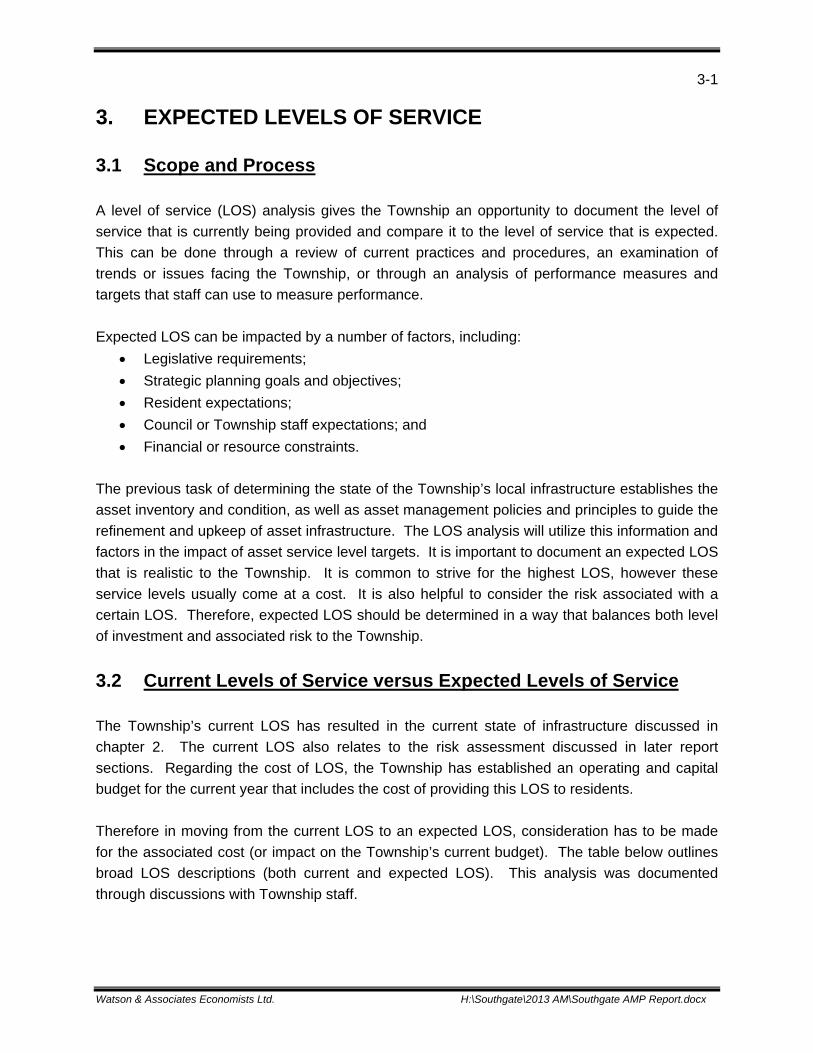
3. EXPECTED LEVELS OF SERVICE
3.1 Scope and Process
A level of service (LOS) analysis gives the Township an opportunity to document the level of
service that is currently being provided and compare it to the level of service that is expected.
This can be done through a review of current practices and procedures, an examination of
trends or issues facing the Township, or through an analysis of performance measures and
targets that staff can use to measure performance.
Expected LOS can be impacted by a number of factors, including:
Legislative requirements;
Strategic planning goals and objectives;
Resident expectations;
Council or Township staff expectations; and
Financial or resource constraints.
The previous task of determining the state of the Township’s local infrastructure establishes the
asset inventory and condition, as well as asset management policies and principles to guide the
refinement and upkeep of asset infrastructure. The LOS analysis will utilize this information and
factors in the impact of asset service level targets. It is important to document an expected LOS
that is realistic to the Township. It is common to strive for the highest LOS, however these
service levels usually come at a cost. It is also helpful to consider the risk associated with a
certain LOS. Therefore, expected LOS should be determined in a way that balances both level
of investment and associated risk to the Township.
3.2 Current Levels of Service versus Expected Levels of Service
The Township’s current LOS has resulted in the current state of infrastructure discussed in
chapter 2. The current LOS also relates to the risk assessment discussed in later report
sections. Regarding the cost of LOS, the Township has established an operating and capital
budget for the current year that includes the cost of providing this LOS to residents.
Therefore in moving from the current LOS to an expected LOS, consideration has to be made
for the associated cost (or impact on the Township’s current budget). The table below outlines
broad LOS descriptions (both current and expected LOS). This analysis was documented
through discussions with Township staff.

3-2
Watson & Associates Economists Ltd. H:\Southgate\2013 AM\Southgate AMP Report.docx
Table 3-1
Level of Service Analysis
Roads
Current Expected
Public WorksMeet Southgate's "Minimum Maintenance Standards" based on Ontario Regulation 239/02.
Meet "Minimum Maintenance Standards" as defined by Ontario Regulation 239/02.
Public WorksRoads Maintenance based on allocated budget.
Maintain adequate PCI as per the Roads Needs Study.
Public WorksRoads Maintenance based on allocated budget.
Roads Maintenance (I.e., Crack Sealing, Surface Treatment) as per the Roads Needs Study.
Public WorksGravel Resurfacing based on allocated budget and calcium treatment
Gravel Resurfacing on applicable roads every two (2) years consistent with directives from the Community Action Plan.
Bridges and Culverts
Current Expected
Public Works Maintain adequate condition and load limits.Maintain adequate condition (based on BCI) and posted load limits.
Public WorksBridge Inspections (i.e., using OSIM reports) required every two (2) years.
Bridge Inspections (i.e. using OSIM reports) required every two (2) years.
Public Works Annual Bridge and Culvert Maintenance.Bridge and Culvert Maintenance as per OSIM reports.
Buildings
Current Expected
VariousMeet legislative requirement (Building Code, Fire Code Accessibility, Health & Safety, etc.).
Meet legislative requirement (Building Code, Fire Code, Accessibility, Health & Safety, etc.).
Various Reactive Maintenance Approach.Proactive Maintenance as per the Facility Condition Report.
VariousSome Back-Up Power (Generators) in place.
Back-Up Power (Generators) where needed. Work towards Energy Management objectives and reduce GHG emissions.
Water Supply and Distribution
Current Expected
Water Meet all Legislative Requirements. Meet all Legislative Requirements.
Water Minimize Water Main Breaks. Minimize Water Main Breaks.
Water Minimize Unaccounted for Water. Minimize Unaccounted for Water.
Water Maintain/monitor cast iron watermainsEventual replacement of cast iron watermains
Water Reactive maintenance for Leak Detection.Continue Leak Detection, Backflow Prevention and Meter Replacement Programs.
WaterMaintain and Monitor Adequate Average Age of Water Mains.
WaterAddress Directives from Community Action Plan.
$7,000
Estimated Annual Operating/ Capital Cost Increases
$23,000
Estimated Annual Operating/ Capital Cost Increases
$65,000
Estimated Annual Operating/ Capital Cost Increases
$12,000
Estimated Annual Operating/ Capital Cost Increases
DepartmentLevel of Service Description
DepartmentLevel of Service Description
DepartmentLevel of Service Description
DepartmentLevel of Service Description

3-3
Watson & Associates Economists Ltd. H:\Southgate\2013 AM\Southgate AMP Report.docx
Please refer to Appendix D of this report for a table summarizing the estimated budget impacts
associated with implementing the expected LOS over the 20 year forecast period. This impact
analysis will be factored into the asset management strategy discussed in chapter 4 of this
report.
3.3 Level of Service Performance Measures
As mentioned above, using performance measures in the LOS review can also be helpful in
measuring the Township’s goals and objectives when it comes to asset management. The
Township currently tracks specific performance measures as part of the Municipal Performance
Measurement Program (MPMP) which the province has in place as part of the annual Financial
Information Return (FIR) submission. The FIR provides the annual financial results of the
Township, while the MPMP provides an evaluation of the Township’s “performance”. The
following table provides a summary of the specific MPMPs relating to capital asset
effectiveness. These calculations will be reviewed and may be adjusted by the Township for
future reporting years.
The Township will continue to calculate and monitor these performance measures, both for
MPMP and asset management purposes. As the Township’s asset management plan evolves
over time, new performance measures can be introduced to further measure the LOS being
provided in each service area.
Wastewater Treatment
Current Expected
Wastewater Be Compliant with C of A.Provide Standby Power at all Key Components.
Wastewater Improve Effluent Quality.
Wastewater Reduce Incidences of By Pass.
Wastewater Collection
Current Expected
Wastewater Be Compliant with ECA.Reduce Per Capita Flows by 5% through Conservation Initiatives, Expanded I/I Reduction Program.
Wastewater Reduce I/I to System. Develop Flushing Program.
$5,000
$15,000
DepartmentLevel of Service Description Estimated Annual Operating/
Capital Cost Increases
Estimated Annual Operating/ Capital Cost Increases
DepartmentLevel of Service Description

3-4
Watson & Associates Economists Ltd. H:\Southgate\2013 AM\Southgate AMP Report.docx
Table 3-2
Performance Measures Analysis
2011 2012 2013 Goal
FireBuildings, Equipment,
VehiclesResidential fire civilian injuries
per 1,000 persons- - Not yet available Minimize
FireBuildings, Equipment,
VehiclesResidential fire civilian fatalities
per 1,000 persons- - Not yet available Minimize
FireBuildings, Equipment,
VehiclesNumber of residential structural
fires per 1,000 households- 1.7120 Not yet available Minimize
PoliceBuildings, Equipment,
VehiclesTotal crime rate per 1,000
persons28.6510 26.9820 Not yet available Minimize
Transportation RoadsPercentage of paved lane Km where condition is rated as
good to very good95.90% 95.10% Not yet available Maximize
Transportation Bridges & CulvertsPercentage of bridges &
culverts where condition is rated as good to very good
91.40% 93.00% Not yet available Maximize
Transportation RoadsPercentage of winter events
where response met or exceeded local service levels
100.00% 100.00% Not yet available Maximize
Wastewater Wastewater MainsNumber of wastewater main
backups per 100 km of mains27.2727 - Not yet available Minimize
Wastewater BuildingsPercentage of wastewater
estimated to have by-passed treatment
49.41% 54.04% Not yet available Minimize
Water Water mainsWeighted # days when a boil
water advisory was issued- - Not yet available Minimize
Water Water mainsNumber of water main breaks
per 100 km of pipe35.7143 28.5714 Not yet available Minimize
Solid Waste Buildings, VehiclesNumber of complaints received concerning garbage & recycling
collection4.1080 4.1080 Not yet available Minimize
Solid Waste BuildingsNumber of days where a
compliance order for remediation was in effect
- - Not yet available Minimize
Library Buildings Total library uses per person 2.8800 3.9850 Not yet availableMaintain or
Increase
Department AssetsPerformance Measure
Description
Historical Performance

Watson & Associates Economists Ltd. H:\Southgate\2013 AM\Southgate AMP Report.docx
4. ASSET MANAGEMENT STRATEGY


4-1
Watson & Associates Economists Ltd. H:\Southgate\2013 AM\Southgate AMP Report.docx
4. ASSET MANAGEMENT STRATEGY
4.1 Scope and Process
The asset management strategy provides the recommended course of actions required to
maintain (or move towards) a sustainable asset funding position while delivering the expected
levels of service discussed in the previous chapter. The course of actions, when combined
together, form a long-term operating and capital forecast that includes:
a) Non-infrastructure solutions: reduce costs and/or extend expected useful life estimates;
b) Maintenance activities: regularly scheduled activities to maintain existing useful life
levels, or repairs needed due to unplanned events;
c) Renewal/Rehabilitation: significant repairs or maintenance planned to increase the
useful life of assets;
d) Replacement/Disposal: complete disposal and replacement of assets, when renewal or
rehabilitation is no longer an option; and
e) Expansion: given planned growth as outlined in the Township’s Development Charge
Background Study, other expansion or due to the introduction of new services.
Priority identification becomes a critical process during the asset management strategy
development. Priorities have been determined based on assessment of the overall risk of asset
failure, which is determined by looking at both the probability of an asset failing, as well as the
consequences of failure. The consequences of the Township not meeting desired levels of
service must also be considered in determining risk. As discussed in chapter 3, moving to
expected levels of service results in both operating and capital budget impacts over the 20 year
forecast period. This has to be taken into consideration, with the overall objective of moving
towards sustainable levels while mitigating risk.
4.2 Risk Assessment
The risk of an asset failing is defined by the following calculation:
Probability of failure has been determined based on the following considerations:
a) Bridges – condition rating (based on bridge condition index (BCI));
b) Roads – condition rating and pavement condition index (PCI);
c) Storm Catch Basins – condition rating based on age;
d) Tax Supported Buildings – condition rating based on age;
e) Watermains and Wastewater Mains – condition rating provided by Triton; and
Risk of Asset Failure = Probability of Failure X Consequence of Failure

4-2
Watson & Associates Economists Ltd. H:\Southgate\2013 AM\Southgate AMP Report.docx
f) Water Buildings and Wastewater Buildings – historical maintenance cost, frequency
facility off-line and standby power, as provided by Triton.
Consequence of failure has been determined by examining each asset type separately.
Consequence refers to the impact on the Township if a particular asset were to fail. Types of
impacts include the following:
Cost Impacts: the cost of failure to the Township (i.e. capital replacement, rehabilitation,
fines & penalties, damages, etc);
Social impacts: potential injury or death to residents or Township staff;
Environmental impacts: the impact of the asset failure on the environment;
Service delivery impacts: the impact of the asset failure on the Township’s ability to
provide services at desired levels; and
Location impacts: the varying impact of asset failure based on the asset’s location
within the Township.
Each type of impact was discussed with Township staff. Consequence of failure was determined
by using the following considerations:
a) Bridges – load limit, deck width and road type;
b) Roads Gravel – posted speed limit ranking, AADT scoring range and MTCE class;
c) Watermains – hydraulic capacity, trunk vs. local main and serviced land use;
d) Wastewater Mains – hydraulic capacity, trunk vs. local main, gravity or forcemain and
serviced land use;
e) Water Buildings and Wastewater Buildings – likelihood of failure and severity of failure;
and
f) Other Assets (storm catch basins, tax supported buildings) – high level discussions with
staff.
With both probability of failure and consequence of failure documented, total risk of asset failure
was determined by multiplying the two factors together. The higher the score the lower the
overall risk.
Total risk has been classified under the following categories:
Extreme Risk (E): risk well beyond acceptable levels;
High Risk (H): risk beyond acceptable levels;
Medium Risk (M): risk at acceptable levels, monitoring required to ensure risk does not
become high; and
Low Risk (L): risk at or below acceptable levels.
Risk levels can be reduced or mitigated through planned maintenance, rehabilitation and/or
replacement. An objective of this asset management plan is to reduce risk levels where they

4-3
Watson & Associates Economists Ltd. H:\Southgate\2013 AM\Southgate AMP Report.docx
are deemed to be too high, as well as ensure assets are maintained in a way that maintains risk
at acceptable levels.
Please refer to Appendix A for the detailed risk assessment for each of the Township’s capital
assets. It is recommended that this risk assessment be refined further by Township staff in the
future. Please refer to Appendix B for further details on the calculation of the probability of
failure and consequence of failure for each asset type.
4.3 Priority Identification
Through discussions with Township staff and review of the asset risk of failure assessment, the
following assets/categories were identified as being priorities of the Township:
Table 4-1
Priorities Based on Asset Risk
Area / Category Description Total Risk
Roads Southgate Sideroad 11 High
Roads Southgate Sideroad 15 High
Roads Southgate Sideroad 57 High
Roads Southgate Sideroad 39 High
Roads Southgate Sideroad 71 High
Roads Southgate Sideroad 47 High
Roads Southgate Road 10 High
Roads Southgate Sideroad 41 High
Roads Southgate-Glenelg Townline High
Roads Doyle Street High
Bridges & Culverts Structure 23: Southgate Road 12 Extreme/High
Bridges & Culverts Structure 27: Southgate Road 14 Extreme/High
Bridges & Culverts Structure 38: Southgate Road 24 High
Bridges & Culverts Structure 20: Southgate Road 10 High
Water Water Holding Tank Rehabilitation High
SewerSewage Pumping Station Process Rehabilitation
High
SewerSewage Aeration Blower Plant Rehabilitation
High
FacilitiesDundalk Olde Town Hall & Theatre Rehabilitation
High

4-4
Watson & Associates Economists Ltd. H:\Southgate\2013 AM\Southgate AMP Report.docx
4.4 Long-term Forecast
For many years, lifecycle costing has been used in the field of maintenance engineering and to
evaluate the advantages of using alternative materials in construction or production design. The
method has gained wider acceptance and has been used recently in the management of capital
assets. By definition, lifecycle costs are all the costs which are incurred during the lifecycle of a
capital asset, from the time it is purchased or constructed, to the time it is taken out of service
for disposal. The stages which an asset goes through in its lifecycle are as follows:
Figure 4-1
Asset Lifecycle Diagram
In defining the long-term forecast for the Township’s asset management strategy, costs incurred
through an asset’s lifecycle were considered and documented.
Asset Replacement Analysis
In forecasting the Township’s asset replacement needs, comparisons were made between the
following scenarios:
Scenario 1: Replacement forecast based on “PSAB 3150 Asset Data”
o Utilizing the PSAB 3150 inventory, year of installation and estimated service life, the
replacement of each asset was projected.
Scenario 2: Replacement forecast based on “Condition and Risk”;
o In addition to using the installation date, estimated useful life, the LOS, condition
information and staff identified priorities were used, where applicable to better predict
the timing of replacement. Results were smoothed over the forecast period.
PurchaseInstall
Commission
Removal / Decommission
Disposal
OperateMaintainMonitor
Throughout Life of AssetsTo End of Useful Life
Investment Costs
Operating Costs
Disposal Costs

4-5
Watson & Associates Economists Ltd. H:\Southgate\2013 AM\Southgate AMP Report.docx
Scenario 1: Replacement forecast based on “PSAB 3150 Asset Data”
The replacement forecast based on the PSAB 3150 asset data provides a snapshot of assets at
or nearing the end of their useful lives from a purely financial accounting perspective.
Figures 4-2 to 4-4 below show the forecasts over a 10 year period, where approximately $84.9
million (replacement cost) in tax supported capital assets, $0 in water capital assets and
$577,750 in wastewater capital assets are showing as “immediate needs”. For this scenario,
this simply means that these assets have reached the end of their accounting useful lives.
Please refer to Appendix E for charts and graphs depicting the entire forecast period for this
scenario.
Figure 4-2
Tax Supported Capital Assets - 10 Year Forecast
‐
10,000,000
20,000,000
30,000,000
40,000,000
50,000,000
60,000,000
70,000,000
80,000,000
90,000,000
Immediate Needs
2014 2015 2016 2017 2018 2019 2020 2021 2022 2023
Future Replacement Cost (Inflated)
Year of Replacement
Catch Basins
Facilities
Bridges
Roads

4-6
Watson & Associates Economists Ltd. H:\Southgate\2013 AM\Southgate AMP Report.docx
Figure 4-3
Water Capital Assets - 10 Year Forecast
Figure 4-4
Wastewater Capital Assets - 10 Year Forecast
Scenario 2: Replacement forecast based on “Condition and Risk”
Items that had been identified under the previous scenario have been distributed within the
forecast period. Based on these adjustments, $0 of tax supported capital assets, water capital
assets and wastewater capital assets are identified as “immediate needs”. Figures 4-5 to 4-7
show the 10 year forecasts under this scenario. This is the recommended scenario for the
Township. Please refer to Appendix E for charts and graphs depicting the entire forecast for
‐
100,000
200,000
300,000
400,000
500,000
600,000
700,000
800,000
900,000
1,000,000
Immediate Needs
2014 2015 2016 2017 2018 2019 2020 2021 2022 2023
Future Replacement Cost (Inflated)
Year of Replacement
Water Mains
Water Facilities
‐
100,000
200,000
300,000
400,000
500,000
600,000
700,000
800,000
900,000
1,000,000
Immediate Needs
2014 2015 2016 2017 2018 2019 2020 2021 2022 2023
Future Replacement Cost (Inflated)
Year of Replacement
Wastewater Mains
Wastewater Facilities

4-7
Watson & Associates Economists Ltd. H:\Southgate\2013 AM\Southgate AMP Report.docx
this scenario. A total of $69.62 million in tax supported, $4.95 million in water capital and $2.01
million in wastewater capital replacement needs are identified over the 20 year forecast period
($19.15 million, $3,749 and $1.25 million respectively in the first 10 years).
Maintenance, Non-Infrastructure Solutions, Renewal & Rehabilitation
For the recommended scenario to be feasible, the level of service adjustments discussed in
Chapter 3 and Appendix D are required in conjunction with current level of service amounts in
order to effectively maintain and rehabilitate the assets as needed. Appendix D provides
additional rehabilitation and maintenance requirements over the forecast period identified
through discussions with Township staff, Triton Engineering and the Township’s capital forecast.
The financing strategy discussed in the next Chapter will incorporate the level of service
adjustments outlined in Appendix D into the recommended financing analysis. In addition,
expansion related needs, will be layered into the forecast to determine total capital needs for
each year.
Figure 4-5
Tax Supported Capital Assets - 10 Year Forecast
‐
500,000
1,000,000
1,500,000
2,000,000
2,500,000
3,000,000
3,500,000
4,000,000
4,500,000
5,000,000
Immediate Needs
2014 2015 2016 2017 2018 2019 2020 2021 2022 2023
Future Replacement Cost (Inflated)
Year of Replacement
Catch Basins
Facilities
Bridges
Roads

4-8
Watson & Associates Economists Ltd. H:\Southgate\2013 AM\Southgate AMP Report.docx
Figure 4-6
Water Capital Assets - 10 Year Forecast
Figure 4-7
Wastewater Capital Assets – 10 Year Forecast
‐
100,000
200,000
300,000
400,000
500,000
600,000
700,000
800,000
900,000
1,000,000
Immediate Needs
2014 2015 2016 2017 2018 2019 2020 2021 2022 2023
Future Replacement Cost (Inflated)
Year of Replacement
Water Mains
Water Facilities
‐
50,000
100,000
150,000
200,000
250,000
300,000
350,000
400,000
450,000
500,000
Immediate Needs
2014 2015 2016 2017 2018 2019 2020 2021 2022 2023
Future Replacement Cost (Inflated)
Year of Replacement
Wastewater Mains
Wastewater Facilities
4-9
Watson & Associates Economists Ltd. H:\Southgate\2013 AM\Southgate AMP Report.docx
4.5 Procurement Methods
Section 270(1) of the Municipal Act, S.O. 2001, provides that municipalities (and local boards)
shall adopt and maintain policies with respect to its procurement of goods and services.
Procurement policies are developed to provide a framework to support open, fair, transparent
and accountable purchasing processes, and to ensure procurement processes are consistently
managed. Moreover, the establishment of a by-law adopting the procurement policy provides a
document which has the approval of Council, which allows an opportunity for public debate.
An effective procurement policy assists municipalities in identifying cost-effective options for
providing services, while at the same time reducing risk. Innovative project management
models, such as public-private partnerships (P3’s) or co-operative purchasing, can help bring
together expertise, resources and funding opportunities. Where appropriate, bidders can be
required to provide lifecycle costing for the products and/or services being tendered. Lifecycle
costs can include initial construction/purchase price, plus operating costs for a contracted period
of time. Incorporating a lifecycle perspective in the procurement process can encourage
effective asset management in the time period following the initial capital investment.
In order to have an effective and efficient procurement program, especially related to the
purchase/construction of large capital assets, the procurement policy can include clauses to
protect the Township, as well as assist in receiving competitive responses. Examples include:
Identification of the criteria used to determine the type of competitive process to be
followed (i.e. tender, RFP, RFQ);
Identification of circumstances when Sole Sourcing, Negotiation, and/or In-House Bids
can be used;
Description of the methods to be used for advertising a competitive process;
Providing direction for purchasing in cases of emergency;
Providing direction for purchasing as part of a co-operative purchasing group;
Outlining any requirements related to bid deposits or other financial security;
Inclusion of a non-discrimination clause highlighting positions such as having a ‘no local
preference’ policy;
Notification that any bid can be rejected by the Township;
Identification of reasons for terminating a contract with a supplier/contractor (i.e. poor
performance, unethical behaviour);
Identification of restrictions on the types and/or amounts of damages to which bidders
may be entitled, arising from their responding to a competitive process; and
Requirement for bidders to supply proof of insurance and WSIB.
As part of the continuous asset management update process, it is recommended that the
Township’s procurement policies and procedures be reviewed and compared against
procurement best practices to ensure resources are being allocated in an efficient manner.


Watson & Associates Economists Ltd. H:\Southgate\2013 AM\Southgate AMP Report.docx
5. FINANCING STRATEGY


5-1
Watson & Associates Economists Ltd. H:\Southgate\2013 AM\Southgate AMP Report.docx
5. FINANCING STRATEGY
5.1 Scope and Process
The financing strategy outlines the suggested financial approach to funding the recommended
asset management strategy outlined in Chapter 4, while utilizing the Township’s existing budget
structure. This section of the asset management plan includes:
Annual expenditure forecasts broken down by:
o Maintenance/non-infrastructure solutions;
o Renewal/rehabilitation activities;
o Replacement/disposal activities; and
o Expansion activities.
Actual expenditures in the above named categories for 2011, 2012 and budget
expenditures for 2013;
A breakdown of annual funding/revenue by source;
Identification of the funding shortfall, including how the impact will be managed; and
All key assumptions are documented within Appendix B.
The long-term financing strategy forecast (including both expenditure and revenue sources) was
prepared, consistent with the Township’s departmental budget structure, so that it can be used
in conjunction with the annual budget process. Various financing options, including taxation,
reserves, reserve funds, debt, user fees and grants were considered and discussed with
Township staff during the process. Figure 5-1 provides a visual representation of how various
financing methods can be used for both initial asset purchases, as well as asset replacements.
For the recommended asset management strategy scenario, a detailed twenty (20) year plan
was generated. The plan identifies specific maintenance & non-infrastructure solutions, renewal
& rehabilitation, replacement & disposal, and expansion activities required for the 20 year
forecast period as described in Chapter 4.

5-2
Watson & Associates Economists Ltd. H:\Southgate\2013 AM\Southgate AMP Report.docx
Figure 5-1 Financing Methods of Lifecycle Costs
5.2 Historical Results
Table 5-1 outlines the historical tax supported, water rate supported and wastewater rate
supported maintenance/non-infrastructure costs for 2011 and 2012, as well as 2013 budgeted
results. All maintenance for assets was funded through taxation revenue for tax supported
assets, water rates for water related assets and wastewater rates for wastewater related assets
based on the Township’s budget structure.
Purchase
Install
Commission
Operate
Maintain
Monitor(Throughout Life
of Assets)
(To End ofUseful Life)
Removal / Decommission
Disposal
New Assets Replacement Assets
Development Charges (Growth)Reserves/Reserve Funds
DebenturesTaxation
User FeesGrantsOther
Proceeds on DisposalFunding of Disposal /
Decommissioning Costs
Tax Supported Operating BudgetUser Fees Operating Budget
Financing Methods
Purchase
Install
Commission
Operate
Maintain
Monitor(Throughout Life
of Assets)
(To End ofUseful Life)
Removal / Decommission
Disposal

5-3
Watson & Associates Economists Ltd. H:\Southgate\2013 AM\Southgate AMP Report.docx
Table 5-1
Historical Results
Maintenance & Non-Infrastructure Solutions
Tables 5-2 to 5-4 outline the historical capital results for 2011, 2012 and budgeted results for
2013 including renewal/rehabilitation, replacement/disposal, and expansion. The capital funding
includes the use of development charges for growth (expansion) related costs, reserve/reserve
funds, gas tax funds, grants/subsidies, as well as contributions from the operating budget.
Tax Supported
Asset Maintenance 1,075,003 1,050,821 1,098,150 Taxation Funding 1,075,003 1,050,821 1,098,150
Net Unfunded - - -
Water
Asset Maintenance 136,766 135,081 142,270 Water Rate Revenue 136,766 135,081 142,270
Net Unfunded - - -
Wastewater
Asset Maintenance 115,613 113,398 110,000 Wastewater Rate Revenue 115,613 113,398 110,000
Net Unfunded - - -
Description Actual 2011
Actual 2012
Budget2013
Description Actual 2011
Actual 2012
Budget2013
Budget2013
Description Actual 2011
Actual 2012

5-4
Watson & Associates Economists Ltd. H:\Southgate\2013 AM\Southgate AMP Report.docx
Table 5-2 Tax Supported Historical Results
Renewal/Rehabilitation, Replacement/Disposal & Expansion
Table 5-3
Water Historical Results Renewal/Rehabilitation, Replacement/Disposal & Expansion
Capital Expenses
Administration - Facilities - - 25,000
Roads 750,742 1,065,553 815,000
Recreation - 55,061 3,200
Total Capital Expenses 750,742 1,120,614 843,200
Capital Financing
Provincial/Federal Grants - - - Debt - - -
Reserve Fund: Development Charges (All) 59,978 - 3,200
Other - 316,666 -
Reserve Fund: Gas Tax 366,233 281,087 100,000
Reserve Fund: Other - 50,216 - Transfer from Operating 324,531 368,928 615,000 Reserves - 70,118 125,000 Other Municipality - 33,599 -
Total Capital Financing 750,742 1,120,614 843,200
Total Capital Expenses less Capital Financing - - -
Budget2013
DescriptionActual2011
Actual2012
Capital Expenses
Water 519,984 16,466 160,000
Total Capital Expenses 519,984 16,466 160,000
Capital Financing
Provincial/Federal Grants 60,065 - -
Debt - - - Reserves 447,483 - 160,000 Transfer from Operating 12,435 16,466 -
Total Capital Financing 519,984 16,466 160,000
Total Capital Expenses less Capital Financing - - -
Actual2011
Actual2012
Budget2013
Description

5-5
Watson & Associates Economists Ltd. H:\Southgate\2013 AM\Southgate AMP Report.docx
Table 5-4 Wastewater Historical Results
Renewal/Rehabilitation, Replacement/Disposal & Expansion
5.3 Financing Strategy
Tax Supported
Table 5-5 shows the tax supported expenditure forecast for maintenance, renewal/rehabilitation,
replacement/disposal and expansion for the first 10 years of the forecast. While this summary
only shows high level cost classifications, further detail (including the full 20 year forecast) can
be obtained from Appendix F.
Table 5-5
Tax Supported Expenditure Forecast Summary
Items in Table 5-5 labelled as “LOS Adjustment” refer to the level of service analysis discussed
in Chapter 2 and Appendix D. Expansion related costs labelled as “DC related” refer to projects
identified in the Township’s Development Charge Background Study (please refer to Appendix
F).
Capital Expenses
Wastewater 42,458 66,321 847,170
Total Capital Expenses 42,458 66,321 847,170
Capital Financing
Provincial/Federal Grants - 35,891 564,780
Debt - - - Reserve Fund: Development Charges (All) - - - Transfer from Operating 42,458 9,618 -
Reserves - 20,811 282,390
Total Capital Financing 42,458 66,321 847,170
Total Capital Expenses less Capital Financing - - -
Actual2012
Budget2013
DescriptionActual2011
Forecast (Inflated)2014 2015 2016 2017 2018 2019 2020 2021 2022 2023
Maintenance: Current Service Levels 1,120,113 1,142,515 1,165,366 1,188,673 1,212,446 1,236,695 1,261,429 1,286,658 1,312,391 1,338,639 Maintenance: LOS Adjustment 22,950 46,818 61,550 76,853 92,743 94,598 96,490 98,419 100,388 102,396 Total Asset Maintenance 1,143,063 1,189,333 1,226,916 1,265,526 1,305,189 1,331,293 1,357,919 1,385,077 1,412,779 1,441,035
Rehabilitation/Replacement/Disposal 949,336 1,368,815 1,584,325 1,770,175 1,615,500 2,240,906 1,897,158 2,384,781 2,400,502 2,938,411 Replacement/Disposal - LOS Adjustment - - - - - - - - - - Total Replacement/Disposal 949,336 1,368,815 1,584,325 1,770,175 1,615,500 2,240,906 1,897,158 2,384,781 2,400,502 2,938,411
Expansion: DC Related - 27,849 - - - 251,945 32,284 - - 408,013 Expansion: LOS Adjustment - - - - - - - - - - Total Expansion - 27,849 - - - 251,945 32,284 - - 408,013
Total 2,092,399 2,585,997 2,811,241 3,035,701 2,920,690 3,824,145 3,287,361 3,769,857 3,813,281 4,787,459
Asset Lifecycle Costs

5-6
Watson & Associates Economists Ltd. H:\Southgate\2013 AM\Southgate AMP Report.docx
Table 5-6 summarizes the recommended strategy to finance the asset related costs identified in
Table 5-5.
Table 5-6
Breakdown of Annual Tax Supported Funding (Revenue) by Source
These lifecycle costs are being recovered through several methods:
Taxation funding is suggested for all maintenance costs, as well as level of service
adjustment related costs related to operations.
Debt financing is shown as required in years where significant capital needs are
identified.
The portion of newly acquired or constructed assets that are “growth (DC) related” are
shown as financed by development charges.
Gas Tax funding has been shown as a stable and long-term funding source for eligible
capital projects.
The Township will be dependent upon maintaining healthy capital reserves/reserve
funds in order to provide the remainder of the required lifecycle funding over the forecast
period. This will require the Township to proactively increase amounts being transferred
to these capital reserves during the annual budget process.
While the annual funding requirement may fluctuate, it is important for the Township to
implement a consistent, yet increasing annual investment in capital so that the excess annual
funds can accrue in capital reserve funds.
In order to fund the recommended asset requirements over the forecast period using the
Township’s own available funding sources (i.e. using taxation, gas tax funding and debentures),
an increase in the Township’s taxation levy of 4.93% per year would be required for each year
of the forecast period. This includes an annual provision of 2% for inflation in operating related
accounts. However, if other funding sources become available (i.e. grant funding) or if
maintenance and rehabilitation practices allow for the deferral of capital works, then the impact
on the Township’s taxation levy would decrease.
Forecast2014 2015 2016 2017 2018 2019 2020 2021 2022 2023
Taxation 1,143,063 1,189,333 1,226,916 1,265,526 1,305,189 1,331,293 1,357,919 1,385,077 1,412,779 1,441,035 Grants - - - - - - - - - - Debentures - 184,618 221,913 220,250 - 234,345 - - - - Development Charges Reserve Funds - 27,849 - - - 122,156 32,284 - - 401,832 Gas Tax Reserve Funds 219,848 219,848 219,848 219,848 219,848 219,848 219,848 219,848 219,848 219,848 Capital Reserve Fund 729,488 964,349 1,142,565 1,330,077 1,395,652 1,916,502 1,677,310 2,164,933 2,180,654 2,724,744
Total 2,092,399 2,585,997 2,811,241 3,035,701 2,920,690 3,824,145 3,287,361 3,769,857 3,813,281 4,787,459
Funding (Revenue) by Source

5-7
Watson & Associates Economists Ltd. H:\Southgate\2013 AM\Southgate AMP Report.docx
Water
Table 5-7 shows the water expenditure forecast for maintenance, renewal/rehabilitation,
replacement/disposal and expansion for the first 10 years of the forecast. While this summary
only shows high level cost classifications, further detail (including the full 20 year forecast) can
be obtained from Appendix G.
Table 5-7
Water Expenditure Forecast Summary
Items in Table 5-7 labelled as “LOS Adjustment” refer to the level of service analysis discussed
in Chapter 2 and Appendix D. Expansion related costs labelled as “DC related” refer to projects
identified in the Township’s Development Charge Background Study (please refer to Appendix
G).
Table 5-8 summarizes the recommended strategy to finance the asset related costs identified in
Table 5-7.
Table 5-8
Breakdown of Annual Water Funding (Revenue) by Source
These lifecycle costs are being recovered through several methods:
Water rate revenue is suggested for all maintenance costs, as well as level of service
adjustment related costs related to operations.
The Township will be dependent upon maintaining healthy capital reserves/reserve
funds in order to provide the remainder of the required lifecycle funding over the forecast
period. This will require the Township to proactively increase amounts being transferred
to these capital reserves during the annual budget process.
While the annual funding requirement may fluctuate, it is important for the Township to
implement a consistent, yet increasing annual investment in capital so that the excess annual
funds can accrue in capital reserve funds.
Forecast (Inflated)2014 2015 2016 2017 2018 2019 2020 2021 2022 2023
Maintenance: Current Service Levels 145,115 148,018 150,978 153,998 157,078 160,219 163,424 166,692 170,026 173,426 Maintenance: LOS Adjustment 4,692 9,572 14,645 19,917 25,394 25,902 26,420 26,948 27,487 28,037 Total Asset Maintenance 149,807 157,590 165,623 173,915 182,472 186,121 189,844 193,640 197,513 201,463
Rehabiliation/Replacement/Disposal - - - 3,729 - - - - - - Replacement/Disposal - LOS Adjustment - - - - - - - - - - Total Replacement/Disposal - - - 3,729 - - - - - -
Expansion: DC Related - - - - - - - - - - Expansion: LOS Adjustment - - - - - - - - - - Total Expansion - - - - - - - - - -
Total 149,807 157,590 165,623 177,643 182,472 186,121 189,844 193,640 197,513 201,463
Asset Lifecycle Costs
Forecast2014 2015 2016 2017 2018 2019 2020 2021 2022 2023
Water Rate Revenue 149,807 157,590 165,623 173,915 182,472 186,121 189,844 193,640 197,513 201,463 Development Charges Reserve Funds - - - - - - - - - - Capital Reserve Fund - - - 3,729 - - - - - - Total 149,807 157,590 165,623 177,643 182,472 186,121 189,844 193,640 197,513 201,463
Funding (Revenue) by Source

5-8
Watson & Associates Economists Ltd. H:\Southgate\2013 AM\Southgate AMP Report.docx
In order to fund the recommended asset requirements over the forecast period using the
Township’s own available funding sources (i.e. using water rate revenue and debentures), an
increase in revenue (i.e. combination of growth and rate increases) of 15% in 2014, 7.3% 2015
to 2020, declining to 3.6% thereafter would be required. These revenue requirement increases
are consistent with the recommended increases as calculated in the Township’s Rate Study.
However, if other funding sources become available (i.e. grant funding) or if maintenance and
rehabilitation practices allow for the deferral of capital works, then the impact on Township water
rate revenue would decrease. In order to assess the impacts of the water rates specifically, a
water rate study update would be required.
Wastewater
Table 5-9 shows the wastewater expenditure forecast for maintenance, renewal/rehabilitation,
replacement/disposal and expansion for the first 10 years of the forecast. While this summary
only shows high level cost classifications, further detail (including the full 20 year forecast) can
be obtained from Appendix H.
Table 5-9
Wastewater Expenditure Forecast Summary
Items in Table 5-9 labelled as “LOS Adjustment” refer to the level of service analysis discussed
in Chapter 2 and Appendix D. Expansion related costs labelled as “DC related” refer to projects
identified in the Township’s Development Charge Background Study (please refer to Appendix
H).
Table 5-10 summarizes the recommended strategy to finance the asset related costs identified
in Table 5-9.
Table 5-10
Breakdown of Annual Wastewater Funding (Revenue) by Source
Forecast (Inflated)2014 2015 2016 2017 2018 2019 2020 2021 2022 2023
Maintenance: Current Service Levels 112,200 114,444 116,733 119,068 121,449 123,878 126,355 128,883 131,460 134,089 Maintenance: LOS Adjustment 10,200 15,606 21,224 21,649 22,082 22,523 22,974 23,433 23,902 24,380 Total Asset Maintenance 122,400 130,050 137,957 140,717 143,531 146,401 149,329 152,316 155,362 158,469
Rehabilitation/Replacement/Disposal 119,551 123,137 126,831 130,636 134,555 80,615 - 162,388 167,260 172,278 Replacement/Disposal - LOS Adjustment - - - - - - - - - - Total Replacement/Disposal 119,551 123,137 126,831 130,636 134,555 80,615 - 162,388 167,260 172,278
Expansion: DC Related - - - - - - - - - - Expansion: LOS Adjustment - - - - - - - - - - Total Expansion - - - - - - - - - -
Total 241,951 253,187 264,788 271,353 278,086 227,016 149,329 314,704 322,622 330,747
Asset Lifecycle Costs
Forecast2014 2015 2016 2017 2018 2019 2020 2021 2022 2023
Wastewater Rate Revenue 122,400 130,050 137,957 140,717 143,531 146,401 149,329 152,316 155,362 158,469 Development Charges Reserve Funds - - - - - - - - - - Capital Reserve Fund 119,551 123,137 126,831 130,636 134,555 80,615 - 162,388 167,260 172,278 Total 241,951 253,187 264,788 271,353 278,086 227,016 149,329 314,704 322,622 330,747
Funding (Revenue) by Source

5-9
Watson & Associates Economists Ltd. H:\Southgate\2013 AM\Southgate AMP Report.docx
These lifecycle costs are being recovered through several methods:
Wastewater rate revenue is suggested for all maintenance costs, as well as level of
service adjustment related costs related to operations.
The Township will be dependent upon maintaining healthy capital reserves/reserve
funds in order to provide the remainder of the required lifecycle funding over the forecast
period. This will require the Township to proactively increase amounts being transferred
to these capital reserves during the annual budget process.
While the annual funding requirement may fluctuate, it is important for the Township to
implement a consistent, yet increasing annual investment in capital so that the excess annual
funds can accrue in capital reserve funds.
In order to fund the recommended asset requirements over the forecast period using the
Township’s own available funding sources (i.e. using wastewater rate revenue and debentures),
an increase in revenue (i.e. combination of growth and rate increases) of 14% per year for the
first 7 years of the forecast period, declining to 7% thereafter would be required. These revenue
requirement increases are consistent with the recommended increases as calculated in the
Township’s Rate Study. However, if other funding sources become available (i.e. grant funding)
or if maintenance and rehabilitation practices allow for the deferral of capital works, then the
impact on Township wastewater rate revenue would decrease. In order to assess the impacts
of the wastewater rates specifically, a wastewater rate study update would be required.
5.4 Funding Shortfall
Assuming the Township maintains adequate capital reserve funds, the recommended asset
management strategy discussed in Chapter 4 will be fully funded. It is believed this can be
accomplished through each annual budget process. However, the recommended asset
management strategy does defer significant capital replacements, in comparison to
recommendations stated in various Township asset related reports. In the event that certain
deferred replacements result in increased risks and/or projected asset failures, further funding
may be required to address the costs associated with accelerating replacement timelines.
A fundamental approach to calculating the cost of using a capital asset and for the provision of
the revenue required when the time comes to retire and replace it is the “sinking fund method”.
This method first estimates the future value of the asset at the time of replacement, by inflating
the current value of the asset at an assumed annual capital inflation rate. A calculation is then
performed to determine annual contributions which, when invested in a reserve fund, will grow
with interest to a balance equal to the future replacement cost. The contributions are calculated
such that they also increase annually with inflation. Under this approach, an annual capital
investment amount is calculated where funds are available for short-term needs while
establishing a funding plan for long-term needs. Annual contributions in excess of capital costs

5-10
Watson & Associates Economists Ltd. H:\Southgate\2013 AM\Southgate AMP Report.docx
in a given year would be transferred to a “capital replacement reserve fund” for future capital
replacement needs. This approach provides for a stable funding base, eliminating variances in
annual funding requirements, particularly in years when capital replacement needs exceed
typical capital levy funding. Please refer to Figure 5-2 for an illustration of this method.
Figure 5-2
Sinking Fund Method
Tax Supported
From a tax supported asset base perspective, the estimated annual sinking fund requirement,
based on using the calculations discussed above, is approximately $4.32 million (in 2013
dollars). Based on the Township’s 2013 budget, current annual capital investment is
approximately $645,000 (excluding existing debt and gas tax funding). This would provide a
high level estimate of the Township’s annual tax supported infrastructure funding deficit at $3.68
million (in 2013 dollars).
Water
From a water asset base perspective, the estimated annual sinking fund requirement, based on
using the calculations discussed above, is approximately $319,500 (in 2013 dollars). Based on
the Township’s 2013 budget, current annual capital investment is approximately $85,400. This
would provide a high level estimate of the Township’s annual water infrastructure funding deficit
at $234,100 (in 2013 dollars).
Wastewater
From a wastewater asset base perspective, the estimated annual sinking fund requirement,
based on using the calculations discussed above, is approximately $641,600 (in 2013 dollars).
Based on the Township’s 2013 budget, current annual capital investment is approximately
1 2 3 4 5 6 7 8 9 10
$
Year
$120,000 asset, 10 year life
Replacement Cost on Dec. 31 Beginning of Year Balance Annual Contribution Annual Interest Earned
On Dec. 31 of the 10th
year, balance in the reserve fund is exactly equal to the asset's replacement cost.
5-11
Watson & Associates Economists Ltd. H:\Southgate\2013 AM\Southgate AMP Report.docx
$166,600. This would provide a high level estimate of the Township’s annual wastewater
infrastructure funding deficit at $475,000 (in 2013 dollars).
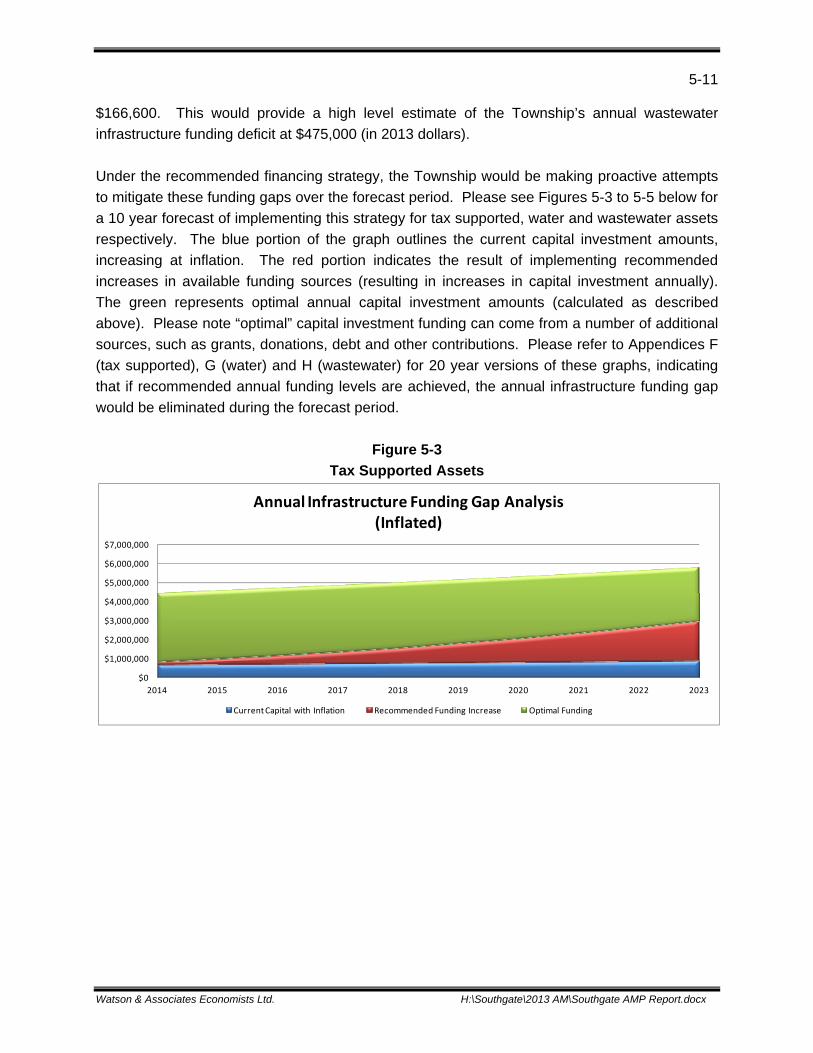
Under the recommended financing strategy, the Township would be making proactive attempts
to mitigate these funding gaps over the forecast period. Please see Figures 5-3 to 5-5 below for
a 10 year forecast of implementing this strategy for tax supported, water and wastewater assets
respectively. The blue portion of the graph outlines the current capital investment amounts,
increasing at inflation. The red portion indicates the result of implementing recommended
increases in available funding sources (resulting in increases in capital investment annually).
The green represents optimal annual capital investment amounts (calculated as described
above). Please note “optimal” capital investment funding can come from a number of additional
sources, such as grants, donations, debt and other contributions. Please refer to Appendices F
(tax supported), G (water) and H (wastewater) for 20 year versions of these graphs, indicating
that if recommended annual funding levels are achieved, the annual infrastructure funding gap
would be eliminated during the forecast period.
Figure 5-3
Tax Supported Assets
$0
$1,000,000
$2,000,000
$3,000,000
$4,000,000
$5,000,000
$6,000,000
$7,000,000
2014 2015 2016 2017 2018 2019 2020 2021 2022 2023
Annual Infrastructure Funding Gap Analysis(Inflated)
Current Capital with Inflation Recommended Funding Increase Optimal Funding

5-12
Watson & Associates Economists Ltd. H:\Southgate\2013 AM\Southgate AMP Report.docx
Figure 5-4
Water Assets
Figure 5-5
Wastewater Assets
To further mitigate the potential infrastructure funding deficit, the Township could consider:
Decreasing expected levels of service to make available capital funding;
Issuing debt for significant and/or unforeseen capital projects, in addition to the debt
recommended within this report, while staying within the Township’s debt capacity limits
(this would have the impact of spreading out the capital repayment over a defined term);
Actively seeking out and applying for grants;
Consider approaching the development community for funding assistance with respect
to growth/expansion related projects;
Rate increases, where needed (i.e. taxation, user fees); or
Implementing operating efficiencies (i.e. reduced operating costs to allow more capital
investment).
$0
$50,000
$100,000
$150,000
$200,000
$250,000
$300,000
$350,000
$400,000
$450,000
$500,000
2014 2015 2016 2017 2018 2019 2020 2021 2022 2023
Annual Infrastructure Funding Gap Analysis(Inflated)
Current Capital with Inflation Recommended Funding Increase Optimal Funding
$0
$100,000
$200,000
$300,000
$400,000
$500,000
$600,000
$700,000
$800,000
$900,000
$1,000,000
2014 2015 2016 2017 2018 2019 2020 2021 2022 2023
Annual Infrastructure Funding Gap Analysis(Inflated)
Current Capital with Inflation Recommended Funding Increase Optimal Funding

Watson & Associates Economists Ltd. H:\Southgate\2013 AM\Southgate AMP Report.docx
6. RECOMMENDATIONS


6-1
Watson & Associates Economists Ltd. H:\Southgate\2013 AM\Southgate AMP Report.docx
6. RECOMMENDATIONS
The following recommendations have been provided for consideration:
That the Township of Southgate Asset Management Plan be received and approved by
Council;
That consideration of this Asset Management Plan be made as part of the annual
budgeting process to ensure sufficient capital funds are available to fund capital
requirements; and
That this Asset Management plan be updated as needed over time to reflect the current
priorities of the Township.
The current level of funding for asset replacement and renewal at the Township will not
sufficiently fund capital needs or close the infrastructure funding gap. As such, it is
recommended that the following additional recommendations be considered during the annual
budget process:
Initiation of “level of service” (LOS) strategies discussed in Chapters 3, 4 and Appendix
D.
Consider an increase in taxation as part of upcoming budget deliberations, dedicated to
capital, to be transferred to capital reserve(s).
Water and wastewater revenue increases consistent with the calculations provided in
this report as well as the Township’s Rate Study.
Substantial investment in capital needs will be required over the forecast period. Through the
recommendations provided above, proactive steps would be taken to increase capital
investment, as well as reduce the annual infrastructure funding gap for these assets. Enhanced
level of service will assist in maintaining adequate asset conditions, mitigate asset risk, as well
as potentially defer capital needs within the forecast period. In addition, the Township should
pursue available capital grants, wherever possible, to further reduce the infrastructure funding
gap.
Through the creation of this plan, Township staff have been provided with a model in which
amendments and revisions can be made as needed. It is anticipated that the final plan adopted
by Council will be monitored and updated frequently by Township staff as part of the budget
process, with refinements and specific recommendations being provided with respect to the
priority of each individual project.


Watson & Associates Economists Ltd. H:\Southgate\2013 AM\Southgate AMP Report.docx
APPENDIX A
DETAILED ASSET INVENTORY


Township of Southgate2013 Asset Management PlanRoads
Road ID
Road Name From To Maintained By Road TypeRoad
Environment
Semi-Urban; Urban and
RuralSurface Material
Road Length
(m)
Useful Life
Rebuild (Gravel)
Pave (Asphalt)
Surface Treatment
Replacement Value/Cost 2013$
Cond. Rating 2013
PCI TotalPosted
Speed Limit Ranking
AADT Scoring Range
MTCE Class 2013
TotalTotal Risk of Asset Failure
Risk of Failure
10 10 20 3 10 10 23 460
$ 338,702,253
452 Southgate Sdrd 03 Southgate Rd 26 N 1.1 km SOUTHGATE MUNICIPAL UNOPENED EARTH 1183520 Southgate Sdrd 19 Southgate Rd 24 Dead End SOUTHGATE MUNICIPAL RURAL EARTH 1064570 Southgate-Glenelg Tow W 1.8 km Glenelg Sdrd 49 WEST GREY BOUNDARY RD UNOPENED EARTH 1828571 Southgate Sdrd 61 Southgate Rd 10 Southgate Rd 12 SOUTHGATE MUNICIPAL RURAL EARTH 1807204 Southgate Sdrd 07 Highway 89 Southgate Rd 04 SOUTHGATE SEASONAL UNOPENED EARTH 1717291 Southgate-Glenelg Tow Dead End Southgate Sdrd 57 WEST GREY BOUNDARY RD RURAL EARTH 430548 Southgate-Glenelg Tow Southgate Sdrd 57 E 1.1 km WEST GREY BOUNDARY RD RURAL EARTH 1124574 London Rd Highway 89 N .27 km SOUTHGATE BOUNDARY RD RURAL EARTH 274345 Southgate Sdrd 11 Highway 89 Southgate Rd 04 SOUTHGATE MUNICIPAL RURAL 725$ SURFACE TREATMENT 2036 50 1,476,792$ 5 6.3 11.3 1 6 4 11 124 H564 Homestead Rd W 0.2 km Dead End SOUTHGATE MUNICIPAL RURAL EARTH 201343 Southgate Sdrd 11 Southgate Rd 04 Southgate Rd 08 SOUTHGATE MUNICIPAL RURAL 725$ SURFACE TREATMENT 2047 50 2008 1,484,771$ 10 10 20 1 6 4 11 220 M257 Southgate Sdrd 47 Southgate Rd 08 Southgate Rd 10 SOUTHGATE MUNICIPAL RURAL 614$ GRAVEL 2049 50 1,258,086$ 5 8 13 1 8 4 13 169 H177 Southgate Rd 10 Southgate Sdrd 13 Southgate Sdrd 15 SOUTHGATE MUNICIPAL RURAL 725$ ASPHALT 2032 50 2011 1,473,891$ 10 10 20 1 8 4 13 260 M227 Southgate Sdrd 57 Southgate Rd 08 Southgate Rd 10 SOUTHGATE MUNICIPAL RURAL 614$ GRAVEL 2027 50 1,245,186$ 3 7.9 10.9 1 8 4 13 142 H110 Southgate Rd 08 Grey Rd 8 Southgate-Melanctho SOUTHGATE MUNICIPAL RURAL 614$ GRAVEL 2023 50 1,242,115$ 5 9 14 1 8 4 13 182 H522 Southgate-Melancthon S 1.3 km Southgate Rd 10 SOUTHGATE MUNICIPAL RURAL 614$ GRAVEL 681 50 417,724$ 5 9 14 1 8 4 13 182 H523 Southgate-Melancthon Southgate Rd 08 N 0.46 km SOUTHGATE MUNICIPAL RURAL 614$ GRAVEL 469 50 288,107$ 5 9 14 1 8 4 13 182 H524 Southgate-Melancthon S 0.46 km N 0.87 km MELANCTHON BOUNDARY RD RURAL 614$ GRAVEL 871 50 534,441$ 5 9 14 1 8 4 13 182 H517 Southgate Sdrd 15 Southgate Rd 04 N 1.7 km SOUTHGATE MUNICIPAL RURAL 725$ ASPHALT 1708 50 1,238,881$ 5 7 12 1 6 4 11 132 H496 Southgate Sdrd 49 Highway 89 Southgate Rd 04 SOUTHGATE MUNICIPAL RURAL 725$ ASPHALT 2049 50 2011 1,486,222$ 10 10 20 1 3 4 8 160 H140 Southgate Sdrd 15 Highway 89 Southgate Rd 04 SOUTHGATE MUNICIPAL RURAL 725$ ASPHALT 2031 50 2009 1,472,440$ 10 10 20 1 6 4 11 220 M466 Ida St Municipal Boundary 2nd Line South West SOUTHGATE MUNICIPAL RURAL 725$ ASPHALT 1719 50 1,246,859$ 8 9.1 17.1 1 3 4 8 137 H122 Southgate Sdrd 75 Southgate Rd 24 Southgate Rd 26 SOUTHGATE MUNICIPAL RURAL 725$ ASPHALT 2016 50 2008 1,461,560$ 10 10 20 1 6 4 11 220 M101 Southgate Sdrd 19 Southgate Rd 14 Grey Rd 9 SOUTHGATE MUNICIPAL RURAL 614$ GRAVEL 2058 50 1,263,615$ 6 9 15 1 8 4 13 195 H176 Southgate Sdrd 13 Highway 89 Southgate Rd 04 SOUTHGATE MUNICIPAL RURAL 614$ GRAVEL 2041 50 1,253,172$ 6 9 15 1 8 4 13 195 H331 Southgate Sdrd 49 Southgate Rd 14 Grey Rd 9 SOUTHGATE MUNICIPAL RURAL 725$ ASPHALT 2040 50 2011 1,479,694$ 10 10 20 1 3 4 8 160 H501 Southgate Sdrd 57 Highway 89 Southgate Rd 04 SOUTHGATE MUNICIPAL RURAL 614$ GRAVEL 2072 50 1,272,215$ 7 8.1 15.1 1 8 4 13 196 H330 Southgate Sdrd 49 Southgate Rd 12 Southgate Rd 14 SOUTHGATE MUNICIPAL RURAL 725$ ASPHALT 2064 50 2011 1,497,102$ 10 10 20 1 3 4 8 160 H465 Southgate Rd 22 Southgate Sdrd 61 E 0.99 km SOUTHGATE MUNICIPAL RURAL 614$ GRAVEL 991 50 2009 608,157$ 10 10 20 1 6 4 11 220 M148 Southgate Rd 12 Southgate Sdrd 21 Grey Rd 8 SOUTHGATE MUNICIPAL RURAL 725$ ASPHALT 2057 50 1,491,299$ 5 7.3 12.3 1 8 4 13 160 H329 Southgate Sdrd 49 Southgate Rd 10 Southgate Rd 12 SOUTHGATE MUNICIPAL RURAL 725$ ASPHALT 2043 50 2011 1,481,870$ 10 10 20 1 3 4 8 160 H599 Southgate Sdrd 41 Southgate Rd 04 Southgate Rd 06 SOUTHGATE MUNICIPAL RURAL 725$ ASPHALT 1056 50 765,234$ 8 8.9 16.9 1 3 4 8 135 H503 McFarlin Drive Highway 6 Grey Rd 6 WEST GREY BOUNDARY RD SEMI-URBAN 1,030$ ASPHALT 1127 50 2012 1,161,283$ 10 10 20 1 8 4 13 260 M326 Southgate Rd 04 Southgate Sdrd 47 Southgate Sdrd 49 SOUTHGATE MUNICIPAL RURAL 725$ ASPHALT 1640 50 2009 1,189,558$ 10 10 20 1 3 4 8 160 H594 Southgate Rd 04 Sligo Rd Southgate Sdrd 41 SOUTHGATE MUNICIPAL RURAL 725$ ASPHALT 24 50 16,683$ 8 9.1 17.1 1 3 4 8 137 H595 Southgate Rd 04 Southgate Sdrd 41 Southgate Sdrd 47 SOUTHGATE MUNICIPAL RURAL 725$ ASPHALT 2260 50 1,639,268$ 8 9.1 17.1 1 3 4 8 137 H218 Southgate Rd 12 Southgate Sdrd 61 Southgate Sdrd 03 SOUTHGATE MUNICIPAL RURAL 614$ GRAVEL 1336 50 2012 820,091$ 10 10 20 1 8 4 13 260 M325 Southgate Rd 04 Southgate Sdrd 47 Southgate Sdrd 47 SOUTHGATE MUNICIPAL RURAL 725$ ASPHALT 418 50 303,192$ 8 9.2 17.2 1 3 4 8 138 H327 Southgate Sdrd 49 Southgate Rd 04 Southgate Rd 08 SOUTHGATE MUNICIPAL RURAL 725$ ASPHALT 2056 50 2009 1,490,574$ 10 10 20 1 3 4 8 160 H142 Southgate Sdrd 15 Southgate Rd 10 Southgate Rd 12 SOUTHGATE MUNICIPAL RURAL 725$ ASPHALT 2193 50 1,590,671$ 5 7.9 12.9 1 6 4 11 142 H175 Southgate Rd 04 Southgate Sdrd 13 Southgate Sdrd 15 SOUTHGATE MUNICIPAL RURAL 614$ GRAVEL 2061 50 1,266,072$ 7 9 16 1 8 4 13 208 M200 Southgate Sdrd 13 Southgate Rd 10 Southgate Rd 12 SOUTHGATE MUNICIPAL RURAL 614$ GRAVEL 2036 50 1,250,101$ 7 9 16 1 8 4 13 208 M428 Southgate Rd 12 Grey Rd 8 Southgate-Melanctho SOUTHGATE MUNICIPAL RURAL 614$ GRAVEL 2017 50 1,239,043$ 7 9 16 1 8 4 13 208 M529 Southgate Rd 10 Grey Rd 14 E 1.6 km SOUTHGATE MUNICIPAL RURAL 614$ GRAVEL 1653 50 1,014,824$ 7 9 16 1 8 4 13 208 M328 Southgate Sdrd 49 Southgate Rd 08 Southgate Rd 10 SOUTHGATE MUNICIPAL RURAL 725$ ASPHALT 2039 50 2009 1,478,968$ 10 10 20 1 3 4 8 160 H226 Southgate Sdrd 57 Southgate Rd 10 Southgate Rd 12 SOUTHGATE MUNICIPAL RURAL 614$ GRAVEL 2053 50 1,260,544$ 5 8.1 13.1 1 8 4 13 170 H456 Southgate Rd 26 Southgate Rd 26 Southgate Sdrd 47 SOUTHGATE MUNICIPAL RURAL 725$ ASPHALT 354 50 256,045$ 5 8.2 13.2 1 6 4 11 145 H443 Southgate-Glenelg Tow Southgate Sdrd 41 Dead End WEST GREY BOUNDARY RD RURAL 614$ GRAVEL 221 50 135,760$ 4 9.3 13.3 1 8 4 13 173 H371 Southgate Sdrd 39 Grey Rd 9 Southgate Rd 22 SOUTHGATE MUNICIPAL RURAL 725$ ASPHALT 1841 50 2012 1,335,351$ 10 10 20 1 6 4 11 220 M166 Southgate Rd 22 Southgate Sdrd 19 Southgate Sdrd 21 SOUTHGATE MUNICIPAL RURAL 725$ ASPHALT 2046 50 2012 1,484,046$ 10 10 20 1 8 4 13 260 M254 Southgate Sdrd 47 Southgate Rd 10 Southgate Rd 12 SOUTHGATE MUNICIPAL RURAL 614$ GRAVEL 2048 50 1,258,086$ 4 8.7 12.7 1 8 4 13 165 H530 Southgate Rd 10 W 0.4 km Southgate Sdrd 13 SOUTHGATE MUNICIPAL RURAL 725$ ASPHALT 399 50 289,411$ 5 7.7 12.7 1 8 4 13 165 H92 Southgate Sdrd 21 Grey Rd 9 Southgate Rd 22 SOUTHGATE MUNICIPAL RURAL 614$ GRAVEL 2046 50 2012 1,256,244$ 10 10 20 1 8 4 13 260 M264 Southgate Rd 10 Southgate Sdrd 33 Grey Rd 109 SOUTHGATE MUNICIPAL RURAL 614$ GRAVEL 1851 50 1,136,455$ 4 8.8 12.8 1 8 4 13 166 H310 Southgate Sdrd 41 Southgate Rd 24 Wilder Lake Rd SOUTHGATE MUNICIPAL RURAL 614$ GRAVEL 1502 50 922,679$ 4 8.8 12.8 1 8 4 13 166 H141 Southgate Sdrd 15 Southgate Rd 12 Southgate Rd 14 SOUTHGATE MUNICIPAL RURAL 725$ ASPHALT 1882 50 2013 1,364,365$ 10 10 20 1 6 4 11 220 M
Goodfellow Rd Grey Rd 9 Southgate Sdrd 71 SOUTHGATE MUNICIPAL RURAL 614$ GRAVEL 483 50 296,707$ 8 9 17 1 8 4 13 221 M111 Southgate-Melancthon Southgate Rd 04 Southgate Rd 08 MELANCTHON BOUNDARY RD RURAL 614$ GRAVEL 2031 50 1,247,643$ 4 9 13 1 10 6 17 221 M112 Southgate-Melancthon Highway 89 Southgate Rd 04 SOUTHGATE BOUNDARY RD RURAL 614$ GRAVEL 2376 50 1,458,963$ 4 9 13 1 10 6 17 221 M114 Southgate Rd 08 Southgate Sdrd 19 Grey Rd 8 SOUTHGATE MUNICIPAL RURAL 614$ GRAVEL 4108 50 2,523,544$ 8 9 17 1 8 4 13 221 M182 Southgate Sdrd 15 Grey Rd 9 Southgate Rd 22 SOUTHGATE MUNICIPAL RURAL 725$ ASPHALT 2030 50 1,472,440$ 6 7 13 1 8 4 13 169 H198 Southgate Sdrd 13 Southgate Rd 10 Grey Rd 9 SOUTHGATE MUNICIPAL RURAL 614$ GRAVEL 2069 50 1,270,372$ 8 9 17 1 8 4 13 221 M199 Southgate Sdrd 13 Southgate Rd 12 Southgate Rd 14 SOUTHGATE MUNICIPAL RURAL 614$ GRAVEL 2038 50 1,251,329$ 8 9 17 1 8 4 13 221 M201 Southgate Sdrd 13 Southgate Rd 08 Southgate Rd 10 SOUTHGATE MUNICIPAL RURAL 614$ GRAVEL 2037 50 1,250,715$ 8 9 17 1 8 4 13 221 M202 Southgate Sdrd 13 Southgate Rd 04 Southgate Rd 08 SOUTHGATE MUNICIPAL RURAL 614$ GRAVEL 2043 50 1,254,401$ 8 9 17 1 8 4 13 221 M258 Southgate Rd 08 Southgate Sdrd 47 Southgate Sdrd 49 SOUTHGATE MUNICIPAL RURAL 614$ GRAVEL 2064 50 1,267,301$ 5 8 13 1 8 4 13 169 H426 Southgate Rd 04 Southgate-Melanctho Southgate-Melanctho SOUTHGATE MUNICIPAL RURAL 614$ GRAVEL 400 50 245,720$ 4 9 13 1 10 6 17 221 M427 Southgate Rd 10 Grey Rd 8 Southgate-Melanctho SOUTHGATE MUNICIPAL RURAL 614$ GRAVEL 2017 50 1,238,429$ 8 9 17 1 8 4 13 221 M526 Southgate Rd 04 W 7.03 km Southgate - Melancth SOUTHGATE MUNICIPAL RURAL 614$ GRAVEL 704 50 431,853$ 4 9 13 1 10 6 17 221 M528 Southgate Rd 08 W 0.42 km Southgate Sdrd 19 SOUTHGATE MUNICIPAL RURAL 614$ GRAVEL 429 50 263,535$ 8 9 17 1 8 4 13 221 M143 Southgate Sdrd 15 Southgate Rd 10 Grey Rd 9 SOUTHGATE MUNICIPAL RURAL 725$ ASPHALT 2071 50 1,501,454$ 6 8.3 14.3 1 6 4 11 157 H458 Southgate Sdrd 49 Southgate Rd 24 Southgate Rd 26 SOUTHGATE MUNICIPAL RURAL 725$ ASPHALT 1122 50 813,831$ 6 8.3 14.3 1 6 4 11 157 H150 Southgate Sdrd 71 Dead End 4th Line South West SOUTHGATE MUNICIPAL RURAL 725$ ASPHALT 1752 50 1,270,796$ 5 7.2 12.2 1 8 4 13 159 H
Probability of Failure Consequence of Failure
Watson & Associates Economists Ltd H:\Southgate\2013 AM\Southgate AM Inventory Model FINAL.xlsx
A-1

Township of Southgate2013 Asset Management PlanRoads
Road ID
Road Name From To Maintained By Road TypeRoad
Environment
Semi-Urban; Urban and
RuralSurface Material
Road Length
(m)
Useful Life
Rebuild (Gravel)
Pave (Asphalt)
Surface Treatment
Replacement Value/Cost 2013$
Cond. Rating 2013
PCI TotalPosted
Speed Limit Ranking
AADT Scoring Range
MTCE Class 2013
TotalTotal Risk of Asset Failure
Risk of Failure
10 10 20 3 10 10 23 460
Probability of Failure Consequence of Failure
454 Southgate Rd 26 Southgate Rd 26 Lake Rd SOUTHGATE MUNICIPAL RURAL 725$ ASPHALT 913 50 662,235$ 6 8.4 14.4 1 6 4 11 158 H577 London Rd S 0.67 km Wellington St E SOUTHGATE BOUNDARY RD RURAL 614$ GRAVEL 420 50 258,006$ 9 9 3 8 9 20 180 H459 Southgate Sdrd 49 Watra Rd Southgate Rd 26 SOUTHGATE MUNICIPAL RURAL 725$ ASPHALT 921 50 668,038$ 6 8.5 14.5 1 6 4 11 160 H245 Southgate Sdrd 61 Southgate Rd 22 Southgate Rd 24 SOUTHGATE MUNICIPAL RURAL 614$ GRAVEL 2075 50 1,274,058$ 5 8.4 13.4 1 8 4 13 174 H271 Southgate Rd 12 Southgate Sdrd 47 Southgate Sdrd 49 SOUTHGATE MUNICIPAL RURAL 614$ GRAVEL 2058 50 1,263,615$ 5 8.4 13.4 1 8 4 13 174 H96 Southgate Rd 10 Southgate Sdrd 21 Grey Rd 8 SOUTHGATE MUNICIPAL RURAL 725$ ASPHALT 2052 50 1,488,398$ 6 7.5 13.5 1 8 4 13 176 H
318 Southgate Sdrd 39 Wilder Lake Rd Southgate-Glenelg To SOUTHGATE MUNICIPAL RURAL 614$ GRAVEL 1847 50 1,133,998$ 5 8.5 13.5 1 8 4 13 176 H236 Southgate Rd 08 Southgate Sdrd 55 Southgate Sdrd 57 SOUTHGATE MUNICIPAL RURAL 614$ GRAVEL 1996 50 1,225,529$ 5 8.6 13.6 1 8 4 13 177 H315 Southgate Sdrd 41 Wilder Lake Rd Southgate-Glenelg To SOUTHGATE MUNICIPAL RURAL 614$ GRAVEL 1299 50 2011 797,361$ 10 10 20 1 8 4 13 260 M313 Wilder Lake Rd Southgate Sdrd 41 Southgate Rd 26 SOUTHGATE MUNICIPAL RURAL 614$ GRAVEL 1053 50 646,244$ 5 8.7 13.7 1 8 4 13 178 H367 Southgate Sdrd 49 Grey Rd 9 Southgate Rd 22 SOUTHGATE MUNICIPAL RURAL 725$ ASPHALT 2022 50 2012 1,466,637$ 10 10 20 1 6 4 11 220 M560 Southgate Sdrd 39 S 0.2 km Wilder Lake Rd SOUTHGATE MUNICIPAL RURAL 614$ GRAVEL 1641 50 1,007,452$ 6 9 15 1 6 4 11 165 H221 Southgate Rd 10 Southgate Sdrd 61 Southgate Sdrd 03 SOUTHGATE MUNICIPAL RURAL 614$ GRAVEL 1534 50 2007 941,722$ 10 10 20 1 8 4 13 260 M251 Southgate Rd 12 Southgate Sdrd 49 Southgate Sdrd 55 SOUTHGATE MUNICIPAL RURAL 614$ GRAVEL 2047 50 2012 1,257,472$ 10 10 20 1 8 4 13 260 M279 Southgate Sdrd 57 Southgate Rd 24 Southgate Rd 26 SOUTHGATE MUNICIPAL RURAL 614$ GRAVEL 2059 50 1,264,229$ 5 8.8 13.8 1 8 4 13 179 H273 Southgate Sdrd 47 Southgate Rd 10 Grey Rd 9 SOUTHGATE MUNICIPAL RURAL 614$ GRAVEL 2060 50 2012 1,264,844$ 10 10 20 1 8 4 13 260 M145 Southgate Rd 14 Southgate Sdrd 19 Southgate Sdrd 21 SOUTHGATE MUNICIPAL RURAL 725$ ASPHALT 2050 50 1,486,222$ 7 8.2 15.2 1 6 4 11 167 H161 Southgate Rd 26 Southgate Sdrd 73 Southgate Sdrd 75 SOUTHGATE MUNICIPAL RURAL 725$ ASPHALT 1188 50 861,704$ 7 8.2 15.2 1 6 4 11 167 H395 Southgate Rd 26 Southgate Sdrd 47 Southgate Sdrd 49 SOUTHGATE MUNICIPAL RURAL 725$ ASPHALT 2071 50 1,502,179$ 7 8.5 15.5 1 6 4 11 171 H460 Southgate Rd 26 Watra Rd Grey Rd 23 SOUTHGATE MUNICIPAL RURAL 725$ ASPHALT 1649 50 1,195,360$ 7 8.5 15.5 1 6 4 11 171 H173 Southgate Rd 08 Southgate Sdrd 13 Southgate Sdrd 15 SOUTHGATE MUNICIPAL RURAL 725$ ASPHALT 2045 50 2011 1,483,320$ 10 10 20 1 8 4 13 260 M531 Southgate Rd 24 Southgate Sdrd 71 E 1.5 km SOUTHGATE MUNICIPAL RURAL 614$ GRAVEL 1518 50 2012 931,893$ 10 10 20 1 8 4 13 260 M94 Southgate Sdrd 21 Southgate Rd 12 Southgate Rd 14 SOUTHGATE SEASONAL RURAL 614$ GRAVEL 2031 50 1,247,029$ 5 9 14 1 10 6 17 238 M95 Southgate Sdrd 21 Southgate Rd 10 Southgate Rd 12 SOUTHGATE MUNICIPAL RURAL 614$ GRAVEL 2031 50 1,247,643$ 5 9 14 1 10 6 17 238 M102 Southgate Sdrd 19 Southgate Rd 12 Southgate Rd 14 SOUTHGATE MUNICIPAL RURAL 614$ GRAVEL 2027 50 1,245,186$ 5 9 14 1 10 6 17 238 M246 Southgate Rd 22 Southgate Sdrd 57 Southgate Sdrd 61 SOUTHGATE MUNICIPAL RURAL 614$ GRAVEL 2058 50 2009 1,264,229$ 10 10 20 1 8 4 13 260 M256 Southgate Rd 10 Southgate Sdrd 47 Southgate Sdrd 49 SOUTHGATE MUNICIPAL RURAL 614$ GRAVEL 2018 50 1,239,657$ 6 8.4 14.4 1 8 4 13 187 H77 Southgate Sdrd 07 Southgate Rd 24 Southgate Rd 26 SOUTHGATE MUNICIPAL RURAL 725$ ASPHALT 2043 50 1,481,144$ 7 7.5 14.5 1 8 4 13 189 H164 Southgate Rd 22 Southgate Sdrd 21 Southgate Sdrd 71 SOUTHGATE MUNICIPAL RURAL 725$ ASPHALT 1310 50 2012 949,470$ 10 10 20 1 8 4 13 260 M259 Southgate Rd 08 Southgate Sdrd 41 Southgate Sdrd 47 SOUTHGATE MUNICIPAL RURAL 614$ GRAVEL 2243 50 2008 1,377,875$ 10 10 20 1 8 4 13 260 M263 Southgate Rd 10 Grey Rd 109 Southgate Sdrd 41 SOUTHGATE MUNICIPAL RURAL 614$ GRAVEL 1591 50 977,351$ 5 8.5 13.5 1 8 4 13 176 H76 Southgate Rd 22 Southgate Sdrd 07 Grey Rd 14 SOUTHGATE MUNICIPAL RURAL 725$ ASPHALT 2037 50 1,477,518$ 6 7.6 13.6 1 8 4 13 177 H99 Southgate Sdrd 71 Goodfellow Rd Grey Rd 9 SOUTHGATE MUNICIPAL RURAL 725$ ASPHALT 299 50 216,877$ 6 6.6 12.6 1 8 4 13 164 H
224 Southgate Rd 12 Southgate Sdrd 57 Southgate Sdrd 61 SOUTHGATE MUNICIPAL RURAL 614$ GRAVEL 2050 50 2012 1,258,701$ 10 10 20 1 8 4 13 260 M349 Southgate Rd 08 Grey Rd 14 Southgate Sdrd 13 SOUTHGATE MUNICIPAL RURAL 725$ ASPHALT 2052 50 2011 1,488,398$ 10 10 20 1 8 4 13 260 M351 Southgate Rd 22 Grey Rd 14 Southgate Sdrd 13 SOUTHGATE MUNICIPAL RURAL 725$ ASPHALT 2028 50 2011 1,470,990$ 10 10 20 1 8 4 13 260 M360 Southgate Rd 14 Grey Rd 14 Southgate Sdrd 13 SOUTHGATE MUNICIPAL RURAL 725$ ASPHALT 2031 50 1,472,440$ 6 7.6 13.6 1 8 4 13 177 H321 Southgate-Glenelg Tow Highway 6 Southgate Sdrd 39 WEST GREY BOUNDARY RD RURAL 614$ GRAVEL 2613 50 2010 1,605,166$ 10 10 20 1 6 4 11 220 M233 Southgate Rd 10 Southgate Sdrd 57 Southgate Sdrd 61 SOUTHGATE MUNICIPAL RURAL 614$ GRAVEL 2044 50 2007 1,255,015$ 10 10 20 1 8 4 13 260 M287 Southgate Sdrd 61 Southgate Rd 26 Southgate-Glenelg To SOUTHGATE MUNICIPAL RURAL 614$ GRAVEL 1171 50 718,731$ 6 8.7 14.7 1 8 4 13 191 H346 Southgate Rd 04 Grey Rd 14 Southgate Sdrd 07 SOUTHGATE MUNICIPAL RURAL 725$ ASPHALT 2024 50 2009 1,468,088$ 10 10 20 1 8 4 13 260 M394 Old RailRd Rd Southgate Sdrd 41 Southgate Rd 26 SOUTHGATE MUNICIPAL RURAL 725$ ASPHALT 1626 50 1,179,403$ 6 7.7 13.7 2 6 4 12 164 H527 Southgate Rd 08 Southgate Sdrd 15 E 1.6 km SOUTHGATE MUNICIPAL RURAL 725$ ASPHALT 1636 50 2009 1,186,656$ 10 10 20 1 8 4 13 260 M352 Southgate Rd 22 Southgate Sdrd 13 Southgate Sdrd 15 SOUTHGATE MUNICIPAL RURAL 725$ ASPHALT 2036 50 1,476,792$ 7 8.2 15.2 1 6 4 11 167 H105 Southgate Rd 10 Southgate Sdrd 19 Southgate Sdrd 21 SOUTHGATE MUNICIPAL RURAL 725$ ASPHALT 2059 50 1,492,750$ 6 7.8 13.8 1 8 4 13 179 H300 Southgate Sdrd 41 Southgate Rd 10 Grey Rd 9 SOUTHGATE MUNICIPAL RURAL 614$ GRAVEL 2009 50 1,234,129$ 5 8.8 13.8 1 8 4 13 179 H449 Southgate Rd 14 Southgate Sdrd 49 Southgate Sdrd 55 SOUTHGATE MUNICIPAL RURAL 614$ GRAVEL 2051 50 1,259,315$ 5 8.8 13.8 1 8 4 13 179 H495 Southgate Sdrd 55 Highway 89 Southgate Rd 04 SOUTHGATE MUNICIPAL RURAL 614$ GRAVEL 1100 50 675,116$ 3 8.4 11.4 1 10 6 17 194 H180 Southgate Rd 24 Southgate Sdrd 13 Southgate Sdrd 19 SOUTHGATE MUNICIPAL RURAL 725$ ASPHALT 4106 50 2,978,246$ 7 7.9 14.9 1 8 4 13 194 H240 Southgate Rd 14 Southgate Sdrd 57 Southgate Sdrd 61 SOUTHGATE MUNICIPAL RURAL 614$ GRAVEL 2039 50 1,251,943$ 6 8.9 14.9 1 8 4 13 194 H267 Southgate Rd 08 Highway 6 Southgate Sdrd 33 SOUTHGATE MUNICIPAL RURAL 614$ GRAVEL 1034 50 635,186$ 6 8.9 14.9 1 8 4 13 194 H305 Southgate Rd 22 Highway 6 Southgate Sdrd 39 SOUTHGATE MUNICIPAL RURAL 614$ GRAVEL 2765 50 2009 1,698,540$ 10 10 20 1 8 4 13 260 M152 Southgate Sdrd 71 Grey Rd 9 Southgate Rd 22 SOUTHGATE MUNICIPAL RURAL 725$ ASPHALT 2052 50 1,487,672$ 7 8.4 15.4 1 6 4 11 169 H558 Southgate Sdrd 39 N 1.56 km Southgate Rd 24 SOUTHGATE MUNICIPAL RURAL 725$ ASPHALT 291 50 211,074$ 5 9.4 14.4 1 6 4 11 158 H387 Orchardville SideRd Highway 6 Southgate Rd 14 SOUTHGATE BOUNDARY RD URBAN 1,639$ ASPHALT 510 50 836,125$ 4 7.5 11.5 1 10 6 17 196 H457 Southgate Rd 26 Southgate Sdrd 49 Watra Rd SOUTHGATE MUNICIPAL RURAL 725$ ASPHALT 392 50 283,608$ 7 8.5 15.5 1 6 4 11 171 H89 Southgate Rd 22 Southgate Sdrd 71 Southgate Sdrd 75 SOUTHGATE MUNICIPAL RURAL 614$ GRAVEL 2226 50 2009 1,367,432$ 10 10 20 1 8 4 13 260 M91 Southgate Sdrd 21 Southgate Rd 22 Southgate Sdrd 71 SOUTHGATE MUNICIPAL RURAL 614$ GRAVEL 1636 50 2010 1,004,381$ 10 10 20 1 8 4 13 260 M393 Southgate-Glenelg Tow Concession 2 Southgate Sdrd 41 WEST GREY BOUNDARY RD RURAL 725$ ASPHALT 1355 50 982,836$ 7 9.6 16.6 1 6 4 11 183 H239 Southgate Rd 12 Southgate Sdrd 55 Southgate Sdrd 57 SOUTHGATE MUNICIPAL RURAL 614$ GRAVEL 2051 50 1,259,929$ 5 9.2 14.2 1 8 4 13 185 H298 Southgate Rd 22 Southgate Sdrd 47 Southgate Sdrd 49 SOUTHGATE MUNICIPAL RURAL 614$ GRAVEL 2063 50 1,266,687$ 5 9.2 14.2 1 8 4 13 185 H440 Southgate Sdrd 71 Southgate Rd 24 Southgate Rd 26 SOUTHGATE MUNICIPAL RURAL 725$ ASPHALT 1482 50 2013 1,074,954$ 10 10 20 1 6 4 11 220 M472 Southgate Sdrd 71 Southgate Rd 24 Southgate Rd 24 SOUTHGATE MUNICIPAL RURAL 725$ ASPHALT 495 50 2013 359,043$ 10 10 20 1 6 4 11 220 M115 Southgate Rd 10 Southgate Sdrd 15 Southgate Sdrd 19 SOUTHGATE MUNICIPAL RURAL 725$ ASPHALT 2078 50 1,506,531$ 6 8.3 14.3 1 8 4 13 186 H230 Southgate Sdrd 55 Southgate Rd 04 Southgate Rd 08 SOUTHGATE MUNICIPAL RURAL 614$ GRAVEL 2027 50 1,244,572$ 6 8.3 14.3 1 8 4 13 186 H216 Southgate Rd 14 Southgate Sdrd 03 Southgate Sdrd 07 SOUTHGATE MUNICIPAL RURAL 725$ ASPHALT 2474 50 2012 1,793,766$ 10 10 20 1 8 4 13 260 M243 Southgate Sdrd 57 Southgate Rd 10 Grey Rd 9 SOUTHGATE MUNICIPAL RURAL 614$ GRAVEL 2038 50 1,251,329$ 5 8.4 13.4 1 8 4 13 174 H255 Southgate Rd 10 Southgate Sdrd 41 Southgate Sdrd 47 SOUTHGATE MUNICIPAL RURAL 614$ GRAVEL 2271 50 1,395,075$ 7 8.5 15.5 1 8 4 13 202 M160 Southgate Rd 24 Southgate Sdrd 75 Highway 10 SOUTHGATE MUNICIPAL RURAL 725$ ASPHALT 2088 50 1,513,785$ 6 7.6 13.6 1 8 4 13 177 H220 Southgate Rd 10 Southgate Sdrd 03 Southgate Sdrd 07 SOUTHGATE MUNICIPAL RURAL 614$ GRAVEL 2270 50 2013 1,393,847$ 10 10 20 1 8 4 13 260 M525 Southgate Rd 04 Grey Rd 8 E 0.93 km SOUTHGATE MUNICIPAL RURAL 614$ GRAVEL 930 50 571,299$ 6 9 15 1 10 6 17 255 M337 Southgate Sdrd 03 Southgate Rd 14 Grey Rd 9 SOUTHGATE MUNICIPAL RURAL 725$ ASPHALT 2076 50 1,505,806$ 8 8.2 16.2 1 6 4 11 178 H144 Southgate Rd 14 Southgate Sdrd 15 Southgate Sdrd 19 SOUTHGATE MUNICIPAL RURAL 725$ ASPHALT 2077 50 1,505,806$ 6 7.7 13.7 1 8 4 13 178 H165 Southgate Rd 24 Southgate Sdrd 19 Southgate Sdrd 71 SOUTHGATE MUNICIPAL RURAL 725$ ASPHALT 1708 50 1,238,881$ 7 7.7 14.7 1 8 4 13 191 H
Watson & Associates Economists Ltd H:\Southgate\2013 AM\Southgate AM Inventory Model FINAL.xlsx
A-2

Township of Southgate2013 Asset Management PlanRoads
Road ID
Road Name From To Maintained By Road TypeRoad
Environment
Semi-Urban; Urban and
RuralSurface Material
Road Length
(m)
Useful Life
Rebuild (Gravel)
Pave (Asphalt)
Surface Treatment
Replacement Value/Cost 2013$
Cond. Rating 2013
PCI TotalPosted
Speed Limit Ranking
AADT Scoring Range
MTCE Class 2013
TotalTotal Risk of Asset Failure
Risk of Failure
10 10 20 3 10 10 23 460
Probability of Failure Consequence of Failure
277 Southgate Sdrd 61 Southgate Rd 24 Southgate Rd 26 SOUTHGATE MUNICIPAL RURAL 614$ GRAVEL 2058 50 1,264,229$ 5 8.7 13.7 1 8 4 13 178 H532 Southgate Rd 24 W 1.5 km Southgate Sdrd 75 SOUTHGATE MUNICIPAL RURAL 725$ ASPHALT 714 50 517,893$ 5 8.7 13.7 1 8 4 13 178 H562 Wilder Lake Rd W 1.5 km Southgate Sdrd 39 SOUTHGATE MUNICIPAL RURAL 614$ GRAVEL 1515 50 930,665$ 5 8.7 13.7 1 8 4 13 178 H162 Southgate Sdrd 71 Southgate Rd 22 Southgate Rd 24 SOUTHGATE MUNICIPAL RURAL 725$ ASPHALT 1946 50 2012 1,411,512$ 10 10 20 1 6 4 11 220 M163 Southgate Sdrd 71 Southgate Rd 22 Southgate Rd 22 SOUTHGATE MUNICIPAL RURAL 725$ ASPHALT 108 50 2012 77,611$ 10 10 20 1 6 4 11 220 M214 Southgate Sdrd 07 Grey Rd 9 Southgate Rd 22 SOUTHGATE SEASONAL RURAL 614$ GRAVEL 2095 50 1,286,959$ 4 8.1 12.1 1 10 6 17 206 M146 Southgate Rd 14 Southgate Sdrd 21 Grey Rd 8 SOUTHGATE MUNICIPAL RURAL 725$ ASPHALT 2052 50 1,488,398$ 6 7.8 13.8 1 8 4 13 179 H181 Southgate Rd 22 Southgate Sdrd 15 Southgate Sdrd 19 SOUTHGATE MUNICIPAL RURAL 725$ ASPHALT 2064 50 2011 1,497,102$ 10 10 20 1 8 4 13 260 M260 Southgate Sdrd 47 Southgate Rd 04 Southgate Rd 08 SOUTHGATE SEASONAL RURAL 614$ GRAVEL 2061 50 1,265,458$ 5 8.8 13.8 1 8 4 13 179 H453 Southgate Rd 26 Grey Rd 23 Southgate Sdrd 57 SOUTHGATE MUNICIPAL RURAL 614$ GRAVEL 2042 50 1,253,786$ 6 8.8 14.8 1 8 4 13 192 H392 Southgate-Glenelg Tow Southgate Sdrd 39 Concession 2 WEST GREY BOUNDARY RD RURAL 614$ GRAVEL 247 50 151,732$ 7 9.5 16.5 1 6 4 11 182 H136 Southgate Rd 04 Southgate Sdrd 19 Grey Rd 8 SOUTHGATE MUNICIPAL RURAL 725$ ASPHALT 4098 50 2,972,443$ 6 7.9 13.9 1 8 4 13 181 H213 Southgate Rd 14 Southgate Sdrd 07 Grey Rd 14 SOUTHGATE MUNICIPAL RURAL 725$ ASPHALT 2029 50 1,470,990$ 6 7.9 13.9 1 8 4 13 181 H265 Southgate Sdrd 33 Southgate Rd 08 Southgate Rd 10 SOUTHGATE MUNICIPAL RURAL 614$ GRAVEL 1888 50 1,159,798$ 6 8.9 14.9 1 8 4 13 194 H303 Southgate Rd 22 Southgate Sdrd 39 Southgate Sdrd 41 SOUTHGATE MUNICIPAL RURAL 614$ GRAVEL 1597 50 2013 980,423$ 10 10 20 1 8 4 13 260 M368 Southgate Sdrd 49 Southgate Rd 22 Southgate Rd 24 SOUTHGATE MUNICIPAL RURAL 725$ ASPHALT 2049 50 1,486,222$ 8 8.6 16.6 1 6 4 11 183 H432 Southgate Sdrd 47 Southgate Rd 26 Southgate-Glenelg To SOUTHGATE MUNICIPAL RURAL 614$ GRAVEL 1269 50 779,547$ 6 9 15 1 8 4 13 195 H124 Ida St Glenelg St Southgate Rd 22 SOUTHGATE MUNICIPAL RURAL 725$ ASPHALT 1460 50 1,058,996$ 7 9.7 16.7 1 6 4 11 184 H338 Southgate Sdrd 03 Southgate Rd 12 Southgate Rd 14 SOUTHGATE MUNICIPAL RURAL 725$ ASPHALT 2021 50 1,465,187$ 8 8.7 16.7 1 6 4 11 184 H386 Southgate Rd 12 Highway 6 Grey Rd 109 SOUTHGATE MUNICIPAL RURAL 725$ ASPHALT 2881 50 2,089,705$ 7 8.7 15.7 1 6 4 11 173 H237 Southgate Rd 08 Southgate Rd 08 Southgate Sdrd 57 SOUTHGATE MUNICIPAL RURAL 614$ GRAVEL 122 50 74,945$ 5 9.1 14.1 1 8 4 13 183 H274 Southgate Sdrd 47 Grey Rd 9 Southgate Rd 22 SOUTHGATE MUNICIPAL RURAL 614$ GRAVEL 2028 50 1,245,800$ 6 9.1 15.1 1 8 4 13 196 H297 Southgate Sdrd 47 Southgate Rd 22 Southgate Rd 24 SOUTHGATE MUNICIPAL RURAL 614$ GRAVEL 2036 50 1,250,715$ 5 9.1 14.1 1 8 4 13 183 H269 Southgate Rd 10 Highway 6 Southgate Sdrd 33 SOUTHGATE SEASONAL RURAL 614$ GRAVEL 1065 50 653,615$ 5 8.4 13.4 1 10 6 17 228 M339 Southgate Sdrd 03 Southgate Rd 10 Southgate Rd 12 SOUTHGATE MUNICIPAL RURAL 725$ ASPHALT 2042 50 1,480,419$ 8 8.8 16.8 1 6 4 11 185 H137 Southgate Rd 04 Southgate Sdrd 15 Southgate Sdrd 19 SOUTHGATE MUNICIPAL RURAL 725$ ASPHALT 2047 50 1,484,771$ 7 8.2 15.2 1 8 4 13 198 H431 Southgate Rd 22 Southgate Sdrd 41 Southgate Sdrd 47 SOUTHGATE MUNICIPAL RURAL 614$ GRAVEL 2265 50 1,391,390$ 6 9.2 15.2 1 8 4 13 198 H551 Southgate Rd 22 E 1.15 km Southgate Sdrd 57 SOUTHGATE MUNICIPAL RURAL 614$ GRAVEL 1159 50 2009 711,359$ 10 10 20 1 8 4 13 260 M430 Southgate Sdrd 41 Southgate Rd 22 Southgate Rd 22 SOUTHGATE MUNICIPAL RURAL 614$ GRAVEL 182 50 2013 111,803$ 10 10 20 1 8 4 13 260 M566 Southgate Rd 24 Southgate Sdrd 39 Southgate Sdrd 41 SOUTHGATE MUNICIPAL RURAL 614$ GRAVEL 1348 50 827,462$ 5 9.3 14.3 1 8 4 13 186 H252 Southgate Sdrd 47 Southgate Rd 12 Southgate Rd 14 SOUTHGATE SEASONAL RURAL 614$ GRAVEL 2056 50 1,262,387$ 4 8.6 12.6 1 10 6 17 214 M302 Southgate Rd 14 Orchardville SideRd Grey Rd 109 SOUTHGATE MUNICIPAL RURAL 614$ GRAVEL 2569 50 1,577,522$ 6 9.4 15.4 1 8 4 13 200 H316 Southgate Sdrd 41 Wilder Lake Rd Wilder Lake Rd SOUTHGATE MUNICIPAL RURAL 614$ GRAVEL 552 50 338,479$ 5 9.4 14.4 1 8 4 13 187 H433 Southgate Sdrd 49 Southgate Rd 26 Southgate-Glenelg To SOUTHGATE MUNICIPAL RURAL 614$ GRAVEL 1257 50 772,175$ 5 9.4 14.4 1 8 4 13 187 H559 Southgate Sdrd 39 Southgate Rd 24 N 0.2 km SOUTHGATE MUNICIPAL RURAL 725$ ASPHALT 207 50 149,420$ 7 9.4 16.4 1 6 4 11 180 H72 Southgate Rd 12 Grey Rd 14 Southgate Sdrd 13 SOUTHGATE MUNICIPAL RURAL 725$ ASPHALT 2035 50 1,476,067$ 6 7.7 13.7 1 8 4 13 178 H138 Southgate Sdrd 15 Southgate Rd 08 Southgate Rd 10 SOUTHGATE MUNICIPAL RURAL 725$ ASPHALT 2037 50 1,477,518$ 8 8.5 16.5 1 6 4 11 182 H262 Southgate Rd 08 Grey Rd 109 Southgate Sdrd 41 SOUTHGATE MUNICIPAL RURAL 614$ GRAVEL 1615 50 991,480$ 7 8.8 15.8 1 8 4 13 205 M557 Southgate Sdrd 39 Southgate Rd 22 N 1.56 km SOUTHGATE MUNICIPAL RURAL 614$ GRAVEL 1562 50 2012 959,537$ 10 10 20 1 6 4 11 220 M123 Southgate Sdrd 75 Southgate Rd 22 Southgate Rd 24 SOUTHGATE MUNICIPAL RURAL 725$ ASPHALT 2048 50 1,485,496$ 8 9.7 17.7 1 6 4 11 195 H229 Southgate Rd 04 Southgate Sdrd 55 Southgate Sdrd 57 SOUTHGATE MUNICIPAL RURAL 614$ GRAVEL 2172 50 1,333,645$ 6 8.9 14.9 1 8 4 13 194 H344 Southgate Rd 04 Southgate Sdrd 07 Southgate Sdrd 11 SOUTHGATE MUNICIPAL RURAL 725$ ASPHALT 2036 50 2009 1,476,792$ 10 10 20 1 8 4 13 260 M404 Southgate Rd 24 W 0.89 km Southgate Sdrd 07 SOUTHGATE MUNICIPAL RURAL 725$ ASPHALT 2775 50 2,012,819$ 7 7.9 14.9 1 8 4 13 194 H469 Southgate Sdrd 03 Grey Rd 14 Southgate Sdrd 61 SOUTHGATE MUNICIPAL RURAL 725$ ASPHALT 77 50 55,851$ 8 9.7 17.7 1 6 4 11 195 H100 Southgate Rd 14 Grey Rd 8 Dead End SOUTHGATE MUNICIPAL RURAL 614$ GRAVEL 1214 50 745,760$ 7 9 16 1 10 6 17 272 M429 Southgate-Melancthon Dead End Southgate Rd 12 SOUTHGATE BOUNDARY RD RURAL 614$ GRAVEL 738 50 452,739$ 7 9 16 1 10 6 17 272 M377 Southgate Rd 12 Grey Rd 109 Southgate Sdrd 41 SOUTHGATE MUNICIPAL RURAL 725$ ASPHALT 1595 50 1,156,917$ 8 8.8 16.8 1 6 4 11 185 H518 Southgate Sdrd 15 S 1.7 km Southgate SideRd 13 SOUTHGATE MUNICIPAL RURAL 725$ ASPHALT 339 50 245,165$ 8 8.8 16.8 1 6 4 11 185 H178 Southgate Rd 12 Southgate Sdrd 13 Southgate Sdrd 15 SOUTHGATE MUNICIPAL RURAL 725$ ASPHALT 2073 50 2013 1,503,630$ 10 10 20 1 8 4 13 260 M355 Southgate Rd 24 Southgate Sdrd 07 Grey Rd 14 SOUTHGATE MUNICIPAL RURAL 725$ ASPHALT 2039 50 1,478,243$ 7 8 15 1 8 4 13 195 H253 Southgate Rd 12 Southgate Sdrd 41 Southgate Sdrd 47 SOUTHGATE MUNICIPAL RURAL 614$ GRAVEL 2256 50 1,385,247$ 7 9.1 16.1 1 8 4 13 209 M296 Southgate Sdrd 47 Southgate Rd 24 Southgate Rd 26 SOUTHGATE MUNICIPAL RURAL 614$ GRAVEL 2051 50 1,259,929$ 6 9.1 15.1 1 8 4 13 196 H103 Southgate Rd 12 Southgate Sdrd 15 Southgate Sdrd 19 SOUTHGATE MUNICIPAL RURAL 614$ GRAVEL 2116 50 1,299,859$ 6 9.2 15.2 1 8 4 13 198 H288 Southgate Rd 26 Southgate Sdrd 57 Southgate Sdrd 61 SOUTHGATE MUNICIPAL RURAL 614$ GRAVEL 2053 50 1,261,158$ 6 9.2 15.2 1 8 4 13 198 H317 Wilder Lake Rd Southgate Sdrd 39 Southgate Sdrd 41 SOUTHGATE MUNICIPAL RURAL 614$ GRAVEL 1605 50 985,337$ 6 9.2 15.2 1 8 4 13 198 H62 Doyle St Grey St E Dead End SOUTHGATE MUNICIPAL SEMI-URBAN 1,030$ GRAVEL 181 50 185,476$ 4 5.5 9.5 3 10 6 19 181 H
399 Southgate Rd 08 Southgate Sdrd 49 Southgate Sdrd 55 SOUTHGATE MUNICIPAL RURAL 614$ GRAVEL 2052 50 1,259,929$ 6 9.3 15.3 1 8 4 13 199 H289 Southgate Sdrd 57 Southgate Rd 26 Southgate-Glenelg To SOUTHGATE MUNICIPAL RURAL 614$ GRAVEL 1209 50 742,689$ 5 8.3 13.3 1 10 6 17 226 M388 Southgate Rd 14 Highway 6 Orchardville SideRd SOUTHGATE MUNICIPAL URBAN 1,639$ ASPHALT 62 50 101,647$ 4 9.3 13.3 1 10 6 17 226 M104 Southgate Rd 12 Southgate Sdrd 19 Southgate Sdrd 21 SOUTHGATE MUNICIPAL RURAL 614$ GRAVEL 2046 50 1,256,244$ 6 9.4 15.4 1 8 4 13 200 H299 Southgate Sdrd 41 Grey Rd 9 Southgate Rd 22 SOUTHGATE MUNICIPAL RURAL 614$ GRAVEL 1843 50 1,131,541$ 6 9.4 15.4 1 8 4 13 200 H93 Southgate Sdrd 21 Southgate Rd 10 Grey Rd 9 SOUTHGATE SEASONAL RURAL 614$ GRAVEL 2048 50 1,258,086$ 5 8.4 13.4 1 10 6 17 228 M
108 Southgate Sdrd 19 Southgate Rd 04 Southgate Rd 08 SOUTHGATE MUNICIPAL RURAL 614$ GRAVEL 2055 50 1,261,772$ 5 8.4 13.4 1 10 6 17 228 M109 Southgate Sdrd 19 Highway 89 Southgate Rd 04 SOUTHGATE MUNICIPAL RURAL 614$ GRAVEL 2035 50 1,250,101$ 5 8.4 13.4 1 10 6 17 228 M247 Southgate Sdrd 57 Southgate Rd 22 Southgate Rd 24 SOUTHGATE MUNICIPAL RURAL 614$ GRAVEL 2058 50 1,264,229$ 5 8.4 13.4 1 10 6 17 228 M248 Southgate Sdrd 57 Grey Rd 9 Southgate Rd 22 SOUTHGATE MUNICIPAL RURAL 614$ GRAVEL 2054 50 1,261,772$ 5 8.4 13.4 1 10 6 17 228 M106 Southgate Sdrd 19 Southgate Rd 08 Southgate Rd 10 SOUTHGATE MUNICIPAL RURAL 614$ GRAVEL 2033 50 1,248,258$ 5 8.5 13.5 1 10 6 17 230 M235 Southgate Sdrd 55 Southgate Rd 08 Southgate Rd 10 SOUTHGATE SEASONAL RURAL 614$ GRAVEL 2085 50 1,280,201$ 4 8.5 12.5 1 10 6 17 213 M241 Southgate Sdrd 61 Southgate Rd 10 Grey Rd 9 SOUTHGATE SEASONAL RURAL 614$ GRAVEL 2041 50 1,253,172$ 5 8.7 13.7 1 8 6 15 206 M217 Southgate Rd 14 Southgate Sdrd 61 Southgate Sdrd 03 SOUTHGATE MUNICIPAL RURAL 614$ GRAVEL 1254 50 770,332$ 5 9.6 14.6 1 8 4 13 190 H438 Artemesia-Southgate To Southgate Sdrd 15 Boar Farm Rd SOUTHGATE BOUNDARY RD RURAL 614$ GRAVEL 1098 50 674,501$ 6 9.6 15.6 1 8 4 13 203 M561 Wilder Lake Rd Cedar Lane E 0.96 km SOUTHGATE MUNICIPAL RURAL 725$ ASPHALT 962 50 697,052$ 6 8.7 14.7 1 8 4 13 191 H266 Southgate Rd 08 Southgate Sdrd 33 Grey Rd 109 SOUTHGATE MUNICIPAL RURAL 614$ GRAVEL 1442 50 885,206$ 7 8.8 15.8 1 8 4 13 205 M378 Southgate Sdrd 41 Southgate Rd 10 Southgate Rd 12 SOUTHGATE MUNICIPAL RURAL 725$ ASPHALT 1487 50 1,078,581$ 8 8.8 16.8 1 6 4 11 185 H
Watson & Associates Economists Ltd H:\Southgate\2013 AM\Southgate AM Inventory Model FINAL.xlsx
A-3

Township of Southgate2013 Asset Management PlanRoads
Road ID
Road Name From To Maintained By Road TypeRoad
Environment
Semi-Urban; Urban and
RuralSurface Material
Road Length
(m)
Useful Life
Rebuild (Gravel)
Pave (Asphalt)
Surface Treatment
Replacement Value/Cost 2013$
Cond. Rating 2013
PCI TotalPosted
Speed Limit Ranking
AADT Scoring Range
MTCE Class 2013
TotalTotal Risk of Asset Failure
Risk of Failure
10 10 20 3 10 10 23 460
Probability of Failure Consequence of Failure
379 Southgate Sdrd 41 Southgate Rd 08 Southgate Rd 10 SOUTHGATE MUNICIPAL RURAL 725$ ASPHALT 1271 50 921,182$ 8 8.8 16.8 1 6 4 11 185 H380 Southgate Sdrd 41 Southgate Rd 08 Southgate Rd 08 SOUTHGATE MUNICIPAL RURAL 725$ ASPHALT 775 50 561,413$ 8 8.8 16.8 1 6 4 11 185 H381 Southgate Sdrd 41 Southgate Rd 06 Southgate Rd 08 SOUTHGATE MUNICIPAL RURAL 725$ ASPHALT 1075 50 779,741$ 8 8.8 16.8 1 6 4 11 185 H382 Southgate Sdrd 41 Southgate Rd 10 Southgate Rd 10 SOUTHGATE MUNICIPAL RURAL 725$ ASPHALT 556 50 403,289$ 8 8.8 16.8 1 6 4 11 185 H384 Southgate Sdrd 41 Southgate Rd 12 Southgate Rd 12 SOUTHGATE MUNICIPAL RURAL 725$ ASPHALT 352 50 254,594$ 8 8.8 16.8 1 6 4 11 185 H242 Southgate Rd 14 Southgate Sdrd 55 Southgate Sdrd 57 SOUTHGATE MUNICIPAL RURAL 614$ GRAVEL 2036 50 1,250,101$ 7 8.9 15.9 1 8 4 13 207 M301 Southgate Rd 14 Grey Rd 109 Southgate Sdrd 41 SOUTHGATE MUNICIPAL RURAL 614$ GRAVEL 1628 50 1,000,080$ 7 9 16 1 8 4 13 208 M215 Southgate Sdrd 07 Southgate Rd 10 Grey Rd 9 SOUTHGATE SEASONAL RURAL 614$ GRAVEL 2050 50 1,258,701$ 4 8.9 12.9 1 10 6 17 219 M232 Southgate Rd 08 Southgate Sdrd 57 Southgate Sdrd 61 SOUTHGATE MUNICIPAL RURAL 614$ GRAVEL 2063 50 1,267,301$ 7 9.1 16.1 1 8 4 13 209 M556 Southgate Rd 22 W 0.69 km East 0.2 km SOUTHGATE MUNICIPAL RURAL 614$ GRAVEL 224 50 137,603$ 6 9.1 15.1 1 8 4 13 196 H272 Southgate Rd 14 Southgate Sdrd 41 Southgate Sdrd 47 SOUTHGATE MUNICIPAL RURAL 614$ GRAVEL 2273 50 1,396,304$ 7 9.2 16.2 1 8 4 13 211 M283 Southgate Sdrd 13 Southgate Rd 24 Southgate Rd 26 SOUTHGATE MUNICIPAL RURAL 614$ GRAVEL 2044 50 1,255,015$ 7 9.2 16.2 1 8 4 13 211 M290 Southgate Sdrd 13 Southgate Rd 22 Southgate Rd 24 SOUTHGATE MUNICIPAL RURAL 614$ GRAVEL 2068 50 1,270,372$ 7 9.2 16.2 1 8 4 13 211 M554 Southgate Rd 22 W 1.13 km Grey Rd 23 SOUTHGATE MUNICIPAL RURAL 614$ GRAVEL 1138 50 699,073$ 6 9.2 15.2 1 8 4 13 198 H555 Southgate Rd 22 Southgate Sdrd 49 W 0.69 km SOUTHGATE MUNICIPAL RURAL 614$ GRAVEL 685 50 420,796$ 6 9.2 15.2 1 8 4 13 198 H567 Southgate Rd 24 Highway 6 E 2.3 km SOUTHGATE MUNICIPAL RURAL 614$ GRAVEL 2315 50 2013 1,421,490$ 10 10 20 1 8 4 13 260 M572 Southgate Sdrd 61 S 0.2 km Southgate Rd 12 SOUTHGATE MUNICIPAL RURAL 614$ GRAVEL 228 50 140,060$ 5 9 14 1 10 6 17 238 M487 Southgate Sdrd 41 Wellington St E Southgate Rd 04 SOUTHGATE BOUNDARY RD RURAL 614$ GRAVEL 927 50 569,456$ 6 8.3 14.3 2 8 4 14 200 H314 Southgate Rd 26 Wilder Lake Rd Southgate Rd 26 SOUTHGATE MUNICIPAL RURAL 614$ GRAVEL 305 50 186,747$ 5 9.1 14.1 2 8 5 15 212 M203 Southgate Rd 04 Southgate Sdrd 11 Southgate Sdrd 13 SOUTHGATE MUNICIPAL RURAL 614$ GRAVEL 2046 50 1,256,858$ 6 9.3 15.3 1 8 4 13 199 H294 Southgate Rd 24 Southgate Sdrd 49 Grey Rd 23 SOUTHGATE MUNICIPAL RURAL 614$ GRAVEL 2047 50 1,256,858$ 6 9.3 15.3 1 8 4 13 199 H295 Southgate Rd 24 Southgate Sdrd 47 Southgate Sdrd 49 SOUTHGATE MUNICIPAL RURAL 614$ GRAVEL 2068 50 1,270,372$ 7 9.3 16.3 1 8 4 13 212 M448 Southgate Rd 14 Southgate Sdrd 47 Southgate Sdrd 49 SOUTHGATE MUNICIPAL RURAL 614$ GRAVEL 2061 50 1,266,072$ 7 9.3 16.3 1 8 4 13 212 M87 Southgate Sdrd 73 Southgate Rd 26 Artemesia-Southgate SOUTHGATE MUNICIPAL RURAL 725$ ASPHALT 2016 50 2013 1,461,560$ 10 10 20 1 6 4 11 220 M
403 Southgate Rd 22 W 0.99 km Southgate Sdrd 07 SOUTHGATE MUNICIPAL RURAL 725$ ASPHALT 2699 50 1,957,693$ 7 8.4 15.4 1 8 4 13 200 H391 Wilder Lake Rd Highway 6 Cedar Lane SOUTHGATE MUNICIPAL RURAL 725$ ASPHALT 71 50 50,774$ 6 9.5 15.5 1 8 4 13 202 M439 Southgate Rd 26 Southgate Sdrd 71 Southgate Sdrd 73 SOUTHGATE MUNICIPAL RURAL 725$ ASPHALT 1033 50 748,551$ 8 9.6 17.6 1 6 4 11 194 H470 Southgate Sdrd 03 Southgate Rd 08 Southgate Rd 10 SOUTHGATE MUNICIPAL RURAL 725$ ASPHALT 2070 50 1,500,728$ 8 9.6 17.6 1 6 4 11 194 H434 Southgate Sdrd 07 Southgate Rd 26 Artemesia-Southgate SOUTHGATE MUNICIPAL RURAL 725$ ASPHALT 1244 50 902,323$ 7 8.6 15.6 1 8 4 13 203 M435 Artemesia-Southgate To Southgate Sdrd 07 Grey Rd 14 SOUTHGATE BOUNDARY RD RURAL 725$ ASPHALT 1092 50 791,346$ 7 9.6 16.6 1 8 4 13 216 M207 Feairs Dr Grey Rd 14 Dead End SOUTHGATE MUNICIPAL RURAL 614$ GRAVEL 481 50 295,478$ 5 8.3 13.3 1 10 6 17 226 M500 Southgate Sdrd 47 Highway 89 Southgate Rd 04 SOUTHGATE MUNICIPAL RURAL 614$ GRAVEL 2112 50 1,297,402$ 5 8.4 13.4 2 8 5 15 201 M225 Southgate Sdrd 57 Southgate Rd 12 Southgate Rd 14 SOUTHGATE SEASONAL RURAL 614$ GRAVEL 2060 50 1,264,844$ 5 8.4 13.4 1 10 6 17 228 M550 Southgate Rd 22 Dromore Park Rd W 0.56 km SOUTHGATE MUNICIPAL RURAL 725$ ASPHALT 558 50 404,014$ 5 9.8 14.8 1 8 4 13 192 H602 Southgate Rd 22 Grey Rd 23 Dromore Park Rd SOUTHGATE MUNICIPAL RURAL 725$ ASPHALT 304 50 220,503$ 5 9.8 14.8 1 8 4 13 192 H445 Southgate Rd 04 Southgate Sdrd 57 Southgate Sdrd 61 SOUTHGATE MUNICIPAL RURAL 614$ GRAVEL 2047 50 1,256,858$ 7 8.9 15.9 1 8 4 13 207 M222 Southgate Sdrd 61 Southgate Rd 12 Southgate Rd 14 SOUTHGATE SEASONAL RURAL 614$ GRAVEL 2061 50 1,266,072$ 5 8.9 13.9 1 8 6 15 209 M231 Southgate Rd 04 Southgate Sdrd 49 Southgate Sdrd 55 SOUTHGATE MUNICIPAL RURAL 614$ GRAVEL 2065 50 1,268,530$ 7 9 16 1 8 4 13 208 M78 Southgate Sdrd 07 Southgate Rd 22 Southgate Rd 24 SOUTHGATE MUNICIPAL RURAL 725$ ASPHALT 2062 50 1,494,926$ 7 8.1 15.1 1 8 4 13 196 H179 Southgate Rd 14 Southgate Sdrd 13 Southgate Sdrd 15 SOUTHGATE MUNICIPAL RURAL 725$ ASPHALT 2042 50 1,480,419$ 7 9.2 16.2 1 8 4 13 211 M206 Southgate Rd 08 Southgate Sdrd 61 Southgate Sdrd 03 SOUTHGATE MUNICIPAL RURAL 614$ GRAVEL 1663 50 1,021,581$ 7 9.2 16.2 1 8 4 13 211 M447 Southgate Rd 04 Southgate Sdrd 61 Grey Rd 14 SOUTHGATE MUNICIPAL RURAL 614$ GRAVEL 1766 50 1,084,240$ 7 9.2 16.2 1 8 4 13 211 M219 Southgate Rd 12 Southgate Sdrd 03 Southgate Sdrd 07 SOUTHGATE MUNICIPAL RURAL 614$ GRAVEL 2407 50 1,478,620$ 8 9.3 17.3 1 8 4 13 225 M238 Southgate Rd 10 Southgate Sdrd 49 Southgate Sdrd 55 SOUTHGATE MUNICIPAL RURAL 614$ GRAVEL 2055 50 1,261,772$ 7 9.3 16.3 1 8 4 13 212 M244 Southgate Sdrd 61 Grey Rd 9 Southgate Rd 22 SOUTHGATE MUNICIPAL RURAL 614$ GRAVEL 2054 50 1,261,772$ 7 9.3 16.3 1 8 4 13 212 M311 Southgate Rd 24 Southgate Sdrd 41 Southgate Sdrd 47 SOUTHGATE MUNICIPAL RURAL 614$ GRAVEL 2266 50 1,391,390$ 7 9.3 16.3 1 8 4 13 212 M228 Southgate Sdrd 57 Southgate Rd 04 Southgate Rd 08 SOUTHGATE MUNICIPAL RURAL 614$ GRAVEL 1918 50 1,178,227$ 7 9.4 16.4 1 8 4 13 213 M402 Southgate Rd 24 Southgate Sdrd 61 E 0.89 km SOUTHGATE MUNICIPAL RURAL 614$ GRAVEL 890 50 2013 546,113$ 10 10 20 1 8 4 13 260 M596 Sligo Rd Dead End Southgate Sdrd 41 SOUTHGATE BOUNDARY RD RURAL 725$ ASPHALT 843 50 611,462$ 7 9.4 16.4 2 6 4 12 197 H446 Southgate Sdrd 61 Dead End Southgate Rd 04 SOUTHGATE MUNICIPAL RURAL 614$ GRAVEL 441 50 270,906$ 5 8.9 13.9 1 10 6 17 236 M353 Southgate Rd 24 Grey Rd 14 Southgate Sdrd 13 SOUTHGATE MUNICIPAL RURAL 725$ ASPHALT 2032 50 1,473,166$ 7 8.5 15.5 1 8 4 13 202 M451 Southgate Rd 26 Southgate Sdrd 61 Southgate Sdrd 03 SOUTHGATE MUNICIPAL RURAL 614$ GRAVEL 762 50 468,097$ 7 9.5 16.5 1 8 4 13 215 M234 Southgate Rd 10 Southgate Sdrd 55 Southgate Sdrd 57 SOUTHGATE MUNICIPAL RURAL 614$ GRAVEL 2027 50 1,245,186$ 7 9.6 16.6 1 8 4 13 216 M547 Southgate Rd 26 W 0.51 km Southgate Sdrd 07 SOUTHGATE MUNICIPAL RURAL 725$ ASPHALT 515 50 372,825$ 7 9 16 1 8 4 13 208 M467 Ida St Hanbury St Victoria St W SOUTHGATE MUNICIPAL RURAL 725$ ASPHALT 157 50 113,878$ 8 9.1 17.1 3 1 4 8 137 H468 Ida St Victoria St W Main St W SOUTHGATE MUNICIPAL RURAL 725$ ASPHALT 125 50 89,942$ 8 9.1 17.1 3 1 4 8 137 H208 Southgate Sdrd 07 Southgate Rd 08 Southgate Rd 10 SOUTHGATE MUNICIPAL RURAL 614$ GRAVEL 2056 50 1,262,387$ 8 9.3 17.3 1 8 4 13 225 M211 Southgate Rd 12 Southgate Sdrd 07 Grey Rd 14 SOUTHGATE MUNICIPAL RURAL 614$ GRAVEL 2010 50 1,234,743$ 8 9.3 17.3 1 8 4 13 225 M546 Southgate Rd 26 Southgate Sdrd 03 E 2.3 km SOUTHGATE MUNICIPAL RURAL 614$ GRAVEL 2390 50 1,467,563$ 7 9.3 16.3 1 8 4 13 212 M565 Southgate Rd 24 Southgate Sdrd 39 E 0.39 km SOUTHGATE MUNICIPAL RURAL 725$ ASPHALT 397 50 287,235$ 8 9.3 17.3 1 8 4 13 225 M485 Southgate Sdrd 61 Southgate Rd 08 Southgate Rd 10 SOUTHGATE SEASONAL RURAL 614$ GRAVEL 2056 50 1,263,001$ 6 8.6 14.6 1 10 6 17 248 M461 Watra Rd Southgate Sdrd 49 Southgate Rd 26 SOUTHGATE MUNICIPAL RURAL 725$ ASPHALT 1094 50 793,522$ 7 9.4 16.4 1 8 4 13 213 M280 Southgate Rd 24 Grey Rd 23 Southgate Sdrd 57 SOUTHGATE MUNICIPAL RURAL 614$ GRAVEL 2034 50 2013 1,248,872$ 10 10 20 1 8 4 13 260 M568 Southgate Rd 24 W 0.15 km Southgate Sdrd 39 SOUTHGATE MUNICIPAL RURAL 725$ ASPHALT 147 50 106,625$ 8 9.5 17.5 1 8 4 13 228 M120 Artemesia-Southgate To Murial St Highway 10 GREY HIGHLANDS BOUNDARY RD RURAL 725$ ASPHALT 2155 50 1,563,108$ 9 10 19 1 6 4 11 209 M549 Southgate-Glenelg Tow W 1.1 km Southgate Sdrd 61 WEST GREY BOUNDARY RD RURAL 614$ GRAVEL 937 50 575,599$ 5 8.8 13.8 1 10 6 17 235 M278 Southgate Rd 24 Southgate Sdrd 57 Southgate Sdrd 61 SOUTHGATE MUNICIPAL RURAL 614$ GRAVEL 2063 50 2013 1,267,301$ 10 10 20 1 8 4 13 260 M281 Southgate Rd 26 Southgate Sdrd 07 Grey Rd 14 SOUTHGATE MUNICIPAL RURAL 614$ GRAVEL 2062 50 1,266,687$ 7 9.6 16.6 1 8 4 13 216 M436 Southgate Rd 26 Southgate Sdrd 13 Southgate Sdrd 15 SOUTHGATE MUNICIPAL RURAL 614$ GRAVEL 2034 50 1,249,486$ 6 9.4 15.4 1 10 4 15 231 M10 Young St Victoria St W Main St W SOUTHGATE MUNICIPAL URBAN 1,639$ ASPHALT 121 50 2008 196,735$ 10 10 20 3 6 5 14 280 M116 Southgate Sdrd 19 Grey Rd 9 Southgate Rd 22 SOUTHGATE MUNICIPAL RURAL 614$ GRAVEL 2041 50 1,253,172$ 8 9.7 17.7 1 8 4 13 230 M117 Southgate Sdrd 19 Southgate Rd 22 Southgate Rd 24 SOUTHGATE MUNICIPAL RURAL 614$ GRAVEL 2043 50 1,254,401$ 8 9.7 17.7 1 8 4 13 230 M261 Southgate Rd 06 Grey Rd 109 Southgate Sdrd 41 SOUTHGATE MUNICIPAL RURAL 725$ ASPHALT 1608 50 1,165,621$ 8 8.7 16.7 1 8 4 13 217 M249 Southgate Sdrd 55 Southgate Rd 10 Grey Rd 9 SOUTHGATE SEASONAL RURAL 614$ GRAVEL 2019 50 1,239,657$ 5 9.1 14.1 1 10 6 17 240 M
Watson & Associates Economists Ltd H:\Southgate\2013 AM\Southgate AM Inventory Model FINAL.xlsx
A-4

Township of Southgate2013 Asset Management PlanRoads
Road ID
Road Name From To Maintained By Road TypeRoad
Environment
Semi-Urban; Urban and
RuralSurface Material
Road Length
(m)
Useful Life
Rebuild (Gravel)
Pave (Asphalt)
Surface Treatment
Replacement Value/Cost 2013$
Cond. Rating 2013
PCI TotalPosted
Speed Limit Ranking
AADT Scoring Range
MTCE Class 2013
TotalTotal Risk of Asset Failure
Risk of Failure
10 10 20 3 10 10 23 460
Probability of Failure Consequence of Failure
55 Highpoint St Bradley St Pine Crt SOUTHGATE MUNICIPAL SEMI-URBAN 1,030$ ASPHALT 70 50 2008 71,099$ 10 10 20 3 8 5 16 320 L38 Victoria St W Ida St McAuley St SOUTHGATE MUNICIPAL SEMI-URBAN 1,030$ ASPHALT 326 50 2010 335,917$ 10 10 20 3 6 5 14 280 M569 Southgate-Glenelg Tow Southgate Sdrd 47 E 0.22 km WEST GREY MUNICIPAL RURAL 614$ GRAVEL 230 50 140,675$ 5 9.5 14.5 1 10 6 17 247 M205 Southgate Sdrd 07 Southgate Rd 04 Grey Rd 14 SOUTHGATE MUNICIPAL RURAL 614$ GRAVEL 2043 50 1,255,015$ 8 9.6 17.6 1 8 4 13 229 M7 Owen Sound St Artemesia St N Osprey St N SOUTHGATE MUNICIPAL URBAN 1,639$ ASPHALT 146 50 237,722$ 5 6.9 11.9 3 8 5 16 190 H
209 Southgate Rd 10 Southgate Sdrd 07 Grey Rd 14 SOUTHGATE MUNICIPAL RURAL 614$ GRAVEL 2037 50 1,251,329$ 8 9.7 17.7 1 8 4 13 230 M437 Southgate Sdrd 15 Southgate Rd 26 Artemesia-Southgate SOUTHGATE MUNICIPAL RURAL 614$ GRAVEL 1252 50 768,489$ 7 9.3 16.3 1 10 4 15 245 M
1 Alice St Victoria St E Victoria St E SOUTHGATE MUNICIPAL SEMI-URBAN 1,030$ ASPHALT 117 50 2013 120,559$ 10 10 20 3 8 5 16 320 L86 Artemesia-Southgate To Boar Farm Rd Southgate Sdrd 73 SOUTHGATE BOUNDARY RD RURAL 614$ GRAVEL 1038 50 637,643$ 6 8.9 14.9 1 10 6 17 253 M
212 Southgate Sdrd 07 Southgate Rd 12 Southgate Rd 14 SOUTHGATE SEASONAL RURAL 614$ GRAVEL 2049 50 1,258,086$ 6 9.1 15.1 1 10 6 17 257 M586 Southgate Sdrd 41 Southgate Rd 12 N 1.5 km SOUTHGATE MUNICIPAL RURAL 614$ GRAVEL 1519 50 933,122$ 8 9.3 17.3 1 8 4 13 225 M587 Southgate Sdrd 41 S 0.18 km Southgate Rd 14 SOUTHGATE MUNICIPAL RURAL 725$ ASPHALT 187 50 135,639$ 8 9.3 17.3 1 8 4 13 225 M119 Artemesia-Southgate To Southgate Sdrd 73 Edgar St GREY HIGHLANDS BOUNDARY RD RURAL 725$ ASPHALT 253 50 182,786$ 9 9 18 3 6 5 14 252 M171 Artemesia-Southgate To Edgar St Murial St GREY HIGHLANDS BOUNDARY RD RURAL 725$ ASPHALT 97 50 70,358$ 9 9 18 3 6 5 14 252 M48 Owen Sound St Osprey St N Main St E SOUTHGATE MUNICIPAL URBAN 1,639$ ASPHALT 201 50 2011 329,531$ 10 10 20 3 8 5 16 320 L250 Southgate Sdrd 55 Southgate Rd 12 Southgate Rd 14 SOUTHGATE SEASONAL RURAL 614$ GRAVEL 2082 50 2012 1,278,973$ 10 10 20 1 10 6 17 340 L8 Young St Hagen St Gold St SOUTHGATE MUNICIPAL URBAN 1,639$ ASPHALT 66 50 108,204$ 6 8.7 14.7 3 6 5 14 206 M
125 Ida St Grey Rd 9 Glenelg St SOUTHGATE MUNICIPAL RURAL 725$ ASPHALT 587 50 425,775$ 7 9.7 16.7 3 3 4 10 167 H59 Bradley St Grey St E Dead End SOUTHGATE MUNICIPAL SEMI-URBAN 1,030$ ASPHALT 120 50 122,620$ 5 6.9 11.9 3 10 6 19 226 M
533 Grey St W Dead End Dundalk St SOUTHGATE MUNICIPAL SEMI-URBAN 1,030$ ASPHALT 127 50 129,833$ 6 7.2 13.2 3 8 5 16 211 M21 Edgar St Elder St Artemesia-Southgate SOUTHGATE MUNICIPAL RURAL 614$ GRAVEL 161 50 98,902$ 4 8.1 12.1 3 10 6 19 230 M
405 Elder St Edgar St Murial St SOUTHGATE MUNICIPAL RURAL 614$ GRAVEL 98 50 60,201$ 4 8.1 12.1 3 10 6 19 230 M406 Murial St Elder St Artemesia-Southgate SOUTHGATE MUNICIPAL RURAL 614$ GRAVEL 149 50 91,531$ 4 8.1 12.1 3 10 6 19 230 M512 Elder St Dead End Edgar St SOUTHGATE MUNICIPAL RURAL 614$ GRAVEL 93 50 56,516$ 4 8.1 12.1 3 10 6 19 230 M563 Homestead Rd Southgate Rd 26 E 0.06 km SOUTHGATE MUNICIPAL RURAL 614$ GRAVEL 69 50 41,772$ 5 9.4 14.4 1 10 6 17 245 M400 Southgate Sideroad 71 Artemesia-Southgate Artemesia-Southgate SOUTHGATE BOUNDARY RD RURAL 614$ GRAVEL 476 50 291,793$ 6 9.6 15.6 1 10 6 17 265 M282 Southgate Rd 26 Grey Rd 14 Southgate Sdrd 13 SOUTHGATE MUNICIPAL RURAL 614$ GRAVEL 2035 50 1,249,486$ 7 9.6 16.6 1 10 4 15 249 M43 Osprey St S Victoria St E Main St E SOUTHGATE MUNICIPAL URBAN 1,639$ ASPHALT 123 50 2009 201,654$ 10 10 20 3 8 5 16 320 L538 Holland St S Dundalk St N 0.4 km SOUTHGATE MUNICIPAL URBAN 1,639$ ASPHALT 40 50 63,939$ 6 7.8 13.8 3 8 5 16 221 M54 Russell St Victoria St E Main St E SOUTHGATE MUNICIPAL URBAN 1,639$ ASPHALT 121 50 198,375$ 6 8.7 14.7 3 6 5 14 206 M16 Grey St E Osprey St N Bradley St SOUTHGATE MUNICIPAL SEMI-URBAN 1,030$ ASPHALT 65 50 66,977$ 6 8 14 3 8 5 16 224 M46 Bradley St Highpoint St Grey St E SOUTHGATE MUNICIPAL SEMI-URBAN 1,030$ ASPHALT 75 50 77,282$ 6 8 14 3 8 5 16 224 M63 Grey St E Doyle St Artemesia St N SOUTHGATE MUNICIPAL SEMI-URBAN 1,030$ ASPHALT 52 50 53,582$ 6 8 14 3 8 5 16 224 M65 Grey St E Artemesia St N Osprey St N SOUTHGATE MUNICIPAL SEMI-URBAN 1,030$ ASPHALT 114 50 116,437$ 6 8 14 3 8 5 16 224 M
121 Southgate Rd 26 Southgate Sdrd 75 Highway 10 SOUTHGATE MUNICIPAL RURAL 725$ ASPHALT 1866 50 1,353,484$ 7 8 15 3 6 4 13 195 H56 Pine Crt Highpoint St Dead End SOUTHGATE MUNICIPAL SEMI-URBAN 1,030$ ASPHALT 116 50 2008 118,498$ 10 10 20 3 10 6 19 380 L64 Grey St E Proton St N Doyle St SOUTHGATE MUNICIPAL SEMI-URBAN 1,030$ ASPHALT 58 50 58,734$ 6 9 15 3 6 5 14 210 M83 Grey St W Dundalk St Proton St N SOUTHGATE MUNICIPAL SEMI-URBAN 1,030$ ASPHALT 104 50 107,164$ 6 9 15 3 6 5 14 210 M33 Victoria St W Nixon St Young St SOUTHGATE MUNICIPAL URBAN 1,639$ ASPHALT 107 50 175,422$ 6 8.2 14.2 3 6 5 14 199 H
545 Victoria St E S 1.1 km Russell St SOUTHGATE MUNICIPAL URBAN 1,639$ ASPHALT 112 50 183,620$ 6 9.3 15.3 3 6 5 14 214 M11 Owen Sound St Proton St N Holland St N SOUTHGATE MUNICIPAL URBAN 1,639$ ASPHALT 136 50 222,967$ 6 7.5 13.5 3 8 5 16 216 M25 Young St Gold St Victoria St W SOUTHGATE MUNICIPAL URBAN 1,639$ ASPHALT 148 50 242,640$ 6 8.5 14.5 3 8 5 16 232 M
455 Lake Rd Dead End Southgate Rd 26 SOUTHGATE MUNICIPAL RURAL 614$ GRAVEL 175 50 106,888$ 6 9.5 15.5 2 10 6 18 279 M410 Victoria St W Industrial Rd Nixon St SOUTHGATE MUNICIPAL RURAL 725$ ASPHALT 276 50 199,469$ 5 9.6 14.6 3 6 5 14 204 M591 Victoria St W McAuley St Industrial Rd SOUTHGATE MUNICIPAL RURAL 725$ ASPHALT 53 50 38,443$ 5 9.6 14.6 3 6 5 14 204 M474 Toronto St Dead End Dundalk St SOUTHGATE MUNICIPAL SEMI-URBAN 1,030$ ASPHALT 111 50 114,377$ 6 8.9 14.9 3 8 5 16 238 M576 London Rd S .27 km N .3 km SOUTHGATE BOUNDARY RD RURAL 614$ GRAVEL 307 50 188,590$ 5 8.6 13.6 3 10 6 19 258 M409 Bradley St Toronto St Highpoint St SOUTHGATE MUNICIPAL SEMI-URBAN 1,030$ ASPHALT 144 50 147,350$ 6 9 15 3 8 5 16 240 M539 Keppel St Main St W Dead End SOUTHGATE MUNICIPAL SEMI-URBAN 1,030$ ASPHALT 79 50 80,373$ 5 7.7 12.7 3 10 6 19 241 M535 Artemesia St N Grey St E Dead End SOUTHGATE MUNICIPAL SEMI-URBAN 792$ GRAVEL 37 50 29,295$ 5 8.8 13.8 3 10 6 19 262 M541 Industrial Rd Dead End Victoria St W SOUTHGATE MUNICIPAL SEMI-URBAN 1,030$ ASPHALT 51 50 51,521$ 6 8.4 14.4 3 8 5 16 230 M66 Glenelg St Ida St Grey St W SOUTHGATE MUNICIPAL SEMI-URBAN 1,030$ ASPHALT 719 50 740,872$ 7 8.6 15.6 3 6 5 14 218 M476 Lane St Grey Rd 109 Dead End SOUTHGATE MUNICIPAL SEMI-URBAN 792$ GRAVEL 103 50 80,759$ 4 9.2 13.2 3 10 6 19 251 M36 Victoria St W Young St Proton St S SOUTHGATE MUNICIPAL URBAN 1,639$ ASPHALT 192 50 314,776$ 7 8.8 15.8 3 6 5 14 221 M90 Southgate Rd 22 Ida St Dead End SOUTHGATE MUNICIPAL RURAL 614$ GRAVEL 516 50 316,979$ 8 9.4 17.4 1 10 6 17 296 M
284 Artemesia-Southgate To Grey Rd 14 Dead End SOUTHGATE BOUNDARY RD RURAL 614$ GRAVEL 699 50 428,781$ 7 9.8 16.8 1 10 6 17 286 M544 Victoria St E Alice St E 0.2 km SOUTHGATE MUNICIPAL SEMI-URBAN 1,030$ ASPHALT 231 50 236,997$ 7 9.6 16.6 3 6 5 14 232 M69 Petrie St Grey Rd 109 Dead End SOUTHGATE MUNICIPAL SEMI-URBAN 792$ GRAVEL 110 50 87,093$ 4 9.3 13.3 3 10 6 19 253 M13 Artemesia St S Victoria St E Main St E SOUTHGATE MUNICIPAL URBAN 1,639$ ASPHALT 126 50 204,933$ 6 9.3 15.3 3 8 5 16 245 M
588 Park Rd Grey Rd 109 Dead End SOUTHGATE MUNICIPAL SEMI-URBAN 792$ GRAVEL 180 50 142,515$ 5 9.4 14.4 3 10 6 19 274 M552 Dromore Park Rd Dead End Southgate Rd 22 SOUTHGATE MUNICIPAL RURAL 614$ GRAVEL 229 50 140,675$ 5 9.5 14.5 3 10 6 19 276 M590 John Irwan Lane Dead End Grey Rd 109 SOUTHGATE MUNICIPAL SEMI-URBAN 792$ GRAVEL 53 50 41,171$ 5 9.5 14.5 3 10 6 19 276 M9 Hagen St Dead End Young St SOUTHGATE MUNICIPAL SEMI-URBAN 1,030$ ASPHALT 241 50 248,331$ 5 9.4 14.4 3 8 5 16 230 M
51 Highpoint St Pine Crt Wilson Cres SOUTHGATE MUNICIPAL URBAN 1,639$ ASPHALT 92 50 2008 149,191$ 10 10 20 3 8 5 16 320 L14 Victoria St E Elm St Alice St SOUTHGATE MUNICIPAL SEMI-URBAN 1,030$ ASPHALT 220 50 225,662$ 7 9.8 16.8 3 6 5 14 235 M
593 Christie St Dead End Grey Rd 9 SOUTHGATE MUNICIPAL SEMI-URBAN 1,030$ ASPHALT 1020 50 1,051,028$ 9 9.8 18.8 1 10 6 17 320 L480 Mill St Main St E Braemore St W SOUTHGATE MUNICIPAL SEMI-URBAN 1,030$ ASPHALT 202 50 208,145$ 7 9 16 3 8 5 16 256 M29 Gold St Young St Dead End SOUTHGATE MUNICIPAL SEMI-URBAN 1,030$ ASPHALT 91 50 93,768$ 6 9.2 15.2 3 10 6 19 289 M26 Osprey St N Main St E Owen Sound St SOUTHGATE MUNICIPAL URBAN 1,639$ ASPHALT 86 50 140,994$ 7 9.2 16.2 3 8 5 16 259 M32 Osprey St N Owen Sound St Toronto St SOUTHGATE MUNICIPAL URBAN 1,639$ ASPHALT 212 50 347,566$ 7 9.2 16.2 3 8 5 16 259 M41 Osprey St N Toronto St Grey St E SOUTHGATE MUNICIPAL SEMI-URBAN 1,030$ ASPHALT 215 50 220,510$ 7 9.2 16.2 3 8 5 16 259 M60 Hanbury St Ida St Morrow Circle SOUTHGATE MUNICIPAL SEMI-URBAN 1,030$ ASPHALT 151 50 155,593$ 7 9.3 16.3 3 8 5 16 261 M
411 Hanbury St Morrow Circle Bell Circle SOUTHGATE MUNICIPAL SEMI-URBAN 1,030$ ASPHALT 127 50 130,863$ 7 9.3 16.3 3 8 5 16 261 M2 Proton St N Main St E Holland St N SOUTHGATE MUNICIPAL URBAN 1,639$ ASPHALT 121 50 196,735$ 8 9.8 17.8 3 6 5 14 249 M
Watson & Associates Economists Ltd H:\Southgate\2013 AM\Southgate AM Inventory Model FINAL.xlsx
A-5

Township of Southgate2013 Asset Management PlanRoads
Road ID
Road Name From To Maintained By Road TypeRoad
Environment
Semi-Urban; Urban and
RuralSurface Material
Road Length
(m)
Useful Life
Rebuild (Gravel)
Pave (Asphalt)
Surface Treatment
Replacement Value/Cost 2013$
Cond. Rating 2013
PCI TotalPosted
Speed Limit Ranking
AADT Scoring Range
MTCE Class 2013
TotalTotal Risk of Asset Failure
Risk of Failure
10 10 20 3 10 10 23 460
Probability of Failure Consequence of Failure
5 Proton St N Owen Sound St Toronto St SOUTHGATE MUNICIPAL SEMI-URBAN 1,030$ ASPHALT 41 50 42,247$ 8 9.8 17.8 3 6 5 14 249 M12 Proton St S Victoria St W Main St W SOUTHGATE MUNICIPAL URBAN 1,639$ ASPHALT 572 50 936,132$ 8 9.8 17.8 3 6 5 14 249 M17 Proton St N Holland St S Owen Sound St SOUTHGATE MUNICIPAL SEMI-URBAN 1,030$ ASPHALT 73 50 75,221$ 8 9.8 17.8 3 6 5 14 249 M18 Victoria St E Proton St S Artemesia St S SOUTHGATE MUNICIPAL URBAN 1,639$ ASPHALT 106 50 173,783$ 8 9.8 17.8 3 6 5 14 249 M30 Victoria St E Rowe's Lane Osprey St S SOUTHGATE MUNICIPAL URBAN 1,639$ ASPHALT 85 50 137,715$ 8 9.8 17.8 3 6 5 14 249 M37 Proton St N Toronto St Grey St E SOUTHGATE MUNICIPAL SEMI-URBAN 1,030$ ASPHALT 213 50 219,479$ 8 9.8 17.8 3 6 5 14 249 M45 Victoria St E Osprey St S Elm St SOUTHGATE MUNICIPAL URBAN 1,639$ ASPHALT 135 50 221,327$ 8 9.8 17.8 3 6 5 14 249 M53 McDowell St Main St E Braemore St E SOUTHGATE MUNICIPAL SEMI-URBAN 1,030$ ASPHALT 168 50 172,080$ 7 9.4 16.4 3 8 5 16 262 M35 Gold St Dead End Young St SOUTHGATE MUNICIPAL URBAN 1,639$ ASPHALT 199 50 326,253$ 7 9.6 16.6 3 8 5 16 266 M
578 London Rd S 0.57 km N 0.1 km SOUTHGATE BOUNDARY RD RURAL 614$ GRAVEL 136 50 83,545$ 8 9.6 17.6 3 8 5 16 282 M23 Wilson Cres Highpoint St Highpoint St SOUTHGATE MUNICIPAL URBAN 1,639$ ASPHALT 313 50 511,512$ 7 9.4 16.4 3 8 5 16 262 M4 Artemesia St N Owen Sound St Toronto St SOUTHGATE MUNICIPAL URBAN 1,639$ ASPHALT 123 50 200,014$ 8 9.6 17.6 3 8 5 16 282 M6 Artemesia St N Main St E Owen Sound St SOUTHGATE MUNICIPAL URBAN 1,639$ ASPHALT 143 50 232,803$ 8 9.6 17.6 3 8 5 16 282 M
39 McAuley St Victoria St W Main St W SOUTHGATE MUNICIPAL SEMI-URBAN 1,030$ ASPHALT 123 50 125,711$ 7 9.6 16.6 3 8 5 16 266 M42 Artemesia St N Toronto St Grey St E SOUTHGATE MUNICIPAL URBAN 1,639$ ASPHALT 214 50 350,844$ 8 9.6 17.6 3 8 5 16 282 M70 Church St Wellington St Grey Rd 109 SOUTHGATE MUNICIPAL SEMI-URBAN 1,030$ ASPHALT 111 50 114,377$ 8 9.7 17.7 3 8 5 16 283 M68 Cedar Lane Dead End Wilder Lake Rd SOUTHGATE MUNICIPAL RURAL 725$ ASPHALT 170 50 123,308$ 7 9.8 16.8 3 8 5 16 269 M49 Holland St N Proton St N Artemesia St N SOUTHGATE MUNICIPAL URBAN 1,639$ ASPHALT 108 50 177,062$ 8 9.7 17.7 3 8 5 16 283 M3 Toronto St Proton St N Artemesia St N SOUTHGATE MUNICIPAL URBAN 1,639$ ASPHALT 112 50 181,980$ 8 9.8 17.8 3 8 5 16 285 M
31 Toronto St Artemesia St N Osprey St N SOUTHGATE MUNICIPAL URBAN 1,639$ ASPHALT 115 50 188,538$ 8 9.8 17.8 3 8 5 16 285 M407 Toronto St Osprey St N Bradley St SOUTHGATE MUNICIPAL URBAN 1,639$ ASPHALT 81 50 131,157$ 8 9.8 17.8 3 8 5 16 285 M408 Young St Dead End Hagen St SOUTHGATE MUNICIPAL URBAN 1,639$ ASPHALT 70 50 113,123$ 8 9.8 17.8 3 8 5 16 285 M537 Holland St S S 0.6km Proton St N SOUTHGATE MUNICIPAL URBAN 1,639$ ASPHALT 67 50 108,204$ 8 9.8 17.8 3 8 5 16 285 M481 Braemore St W Mill St Dead End SOUTHGATE MUNICIPAL SEMI-URBAN 1,030$ ASPHALT 90 50 91,707$ 7 9 16 3 10 6 19 304 L28 Rowe's Lane Dead End Victoria St E SOUTHGATE MUNICIPAL SEMI-URBAN 1,030$ ASPHALT 208 50 214,327$ 7 9.1 16.1 3 10 6 19 306 L61 Morrow Circle Dead End Hanbury St SOUTHGATE MUNICIPAL SEMI-URBAN 1,030$ ASPHALT 58 50 58,734$ 7 9.3 16.3 3 10 6 19 310 L
412 Bell Circle Hanbury St Hanbury St SOUTHGATE MUNICIPAL SEMI-URBAN 1,030$ ASPHALT 63 50 64,916$ 7 9.3 16.3 3 10 6 19 310 L24 McDowell St Braemore St E Dead End SOUTHGATE MUNICIPAL SEMI-URBAN 1,030$ ASPHALT 39 50 40,186$ 7 9.4 16.4 3 10 6 19 312 L52 Braemore St E Dead End McDowell St SOUTHGATE MUNICIPAL SEMI-URBAN 1,030$ ASPHALT 117 50 120,559$ 7 9.4 16.4 3 10 6 19 312 L542 Elm St Dead End Victoria St E SOUTHGATE MUNICIPAL SEMI-URBAN 1,030$ ASPHALT 80 50 82,434$ 7 9.6 16.6 3 10 6 19 315 L22 Highpoint St Wilson Cres Dead End SOUTHGATE MUNICIPAL URBAN 1,639$ ASPHALT 13 50 21,313$ 7 9.4 16.4 3 10 6 19 312 L57 McGregor Crt Highpoint St Dead End SOUTHGATE MUNICIPAL URBAN 1,639$ ASPHALT 166 50 272,150$ 7 9.4 16.4 3 10 6 19 312 L15 Dundalk St Toronto St Grey St W SOUTHGATE MUNICIPAL URBAN 1,639$ ASPHALT 212 50 345,926$ 9 9.9 18.9 3 8 5 16 302 L27 Dundalk St Holland St S Toronto St SOUTHGATE MUNICIPAL URBAN 1,639$ ASPHALT 118 50 191,817$ 9 9.9 18.9 3 8 5 16 302 L40 Dundalk St Main St W Holland St S SOUTHGATE MUNICIPAL URBAN 1,639$ ASPHALT 88 50 142,633$ 9 9.9 18.9 3 8 5 16 302 L71 Centre St Grey Rd 109 Dead End SOUTHGATE MUNICIPAL SEMI-URBAN 1,030$ ASPHALT 177 50 182,384$ 8 9.7 17.7 3 10 6 19 336 L462 Wellington St Dead End Church St SOUTHGATE MUNICIPAL SEMI-URBAN 1,030$ ASPHALT 112 50 114,377$ 8 9.7 17.7 3 10 6 19 336 L473 Nixon St Dead End Victoria St W SOUTHGATE MUNICIPAL URBAN 1,639$ ASPHALT 77 50 126,238$ 7 9.8 16.8 3 10 6 19 319 L58 Highpoint St McGregor Crt Wilson Cres SOUTHGATE MUNICIPAL URBAN 1,639$ ASPHALT 81 50 131,157$ 7 9.4 16.4 3 8 9 20 328 L
482 Russell St Dead End Victoria St E SOUTHGATE MUNICIPAL URBAN 1,639$ ASPHALT 81 50 132,796$ 8 9.7 17.7 3 10 6 19 336 L
Watson & Associates Economists Ltd H:\Southgate\2013 AM\Southgate AM Inventory Model FINAL.xlsx
A-6

Township of Southgate2013 Asset Management PlanBridges
Structure No.
Road Name Structure Type Road Type Span WidthSingle < 7.0 m
Double > 7.0 m
Posted Load Limit
(tonne)
Deterioration Curve
Recommended Repair/Rehabilitation
BCIUseful
LifeYears to
Rehabilitation*Years to
Replacement*Maintenance
NeedsRoadside Safety
Upgrades1 -5 Years 6-10 years
Unit Cost/m of Span
Replacement Cost (2013$)
Condition Rating AMP
Load Limit Deck Width Road TypeTotal Risk
ScoreTotal Risk of Asset Failure
Risk of Failure
10 15 150
$ 37,822,072
2 Southgate Road 8 Rigid Frame RURAL 4 11 X n/p Br Replacement 75 50 21 46,000$ 77,500$ 310,000$ 7.5 5 5 5 15 113 L4 Southgate Road 10 Rigid Frame RURAL 5 11.8 X n/p Br Replacement 59 50 16 77,500$ 387,500$ 5.9 5 5 5 15 89 M5 Southgate Road 10 CSP RURAL 3.5 16.5 X n/p CS Roadside Safety 74.4 50 24 46,000$ 77,500$ 271,250$ 7.4 5 5 5 15 112 M6 Southgate Sideroad 21 Rigid Frame RURAL 5 10.4 X n/p Br. Roadside Safety 67.6 50 22 46,000$ 77,500$ 387,500$ 6.8 5 5 5 15 101 M7 Southgate Road 12 Rigid Frame RURAL 9.5 8.4 X n/p Br - 1 Rehabilitation 71.6 50 10 46,000$ 147,000$ 85,714$ 814,286$ 7.2 5 5 5 15 107 M8 Southgate Road 12 Rigid Frame RURAL 12 9.3 X n/p Br - 1 Rehabilitation 74.7 50 14 20,000$ 85,750$ 1,029,000$ 7.5 5 5 5 15 112 M9 Southgate Road 12 Concrete T- Beam RURAL 12.5 6 X n/p Br - 1 Rehabilitation 60.23 50 1 16,000$ 115,000$ 85,750$ 1,071,875$ 6.0 5 1 5 11 66 H
10 Southgate Sideroad 15 Rigid Frame RURAL 12.5 10 X n/p Br - 1 Rehabilitation 74 50 13 46,000$ 85,750$ 1,071,875$ 7.4 5 5 5 15 111 M11 Southgate Sideroad 15 Twin Rigid Frame RURAL 8.2 21.5 X n/p Br - 1 Rehabilitation 74.5 50 14 46,000$ 85,714$ 702,857$ 7.5 5 5 5 15 112 M12 Southagte Road 12 Rigid Frame RURAL 13.6 9.5 X n/p Br - 1 Rehabilitation 74.5 50 14 16,000$ 85,750$ 1,166,200$ 7.5 5 5 5 15 112 M13 Southgate Road 12 Rigid Frame RURAL 14.1 8.9 X n/p Br - 1 Rehabilitation 74.63 50 14 46,000$ 85,750$ 1,209,075$ 7.5 5 5 5 15 112 M14 Southgate Sideroad 13 Steel Truss RURAL 14.8 5.1 X 12 Br - 1 Replacement 43.6 50 8 950,000$ 85,750$ 1,269,100$ 4.4 3 1 5 9 39 H15 Southgate Road 10 Concrete Girder RURAL 18.5 9.15 X n/p Br - 1 Rehabilitation 73.8 50 13 46,000$ 85,750$ 1,586,375$ 7.4 5 5 5 15 111 M16 Southgate Road 8 CSP RURAL 3.4 17.7 X n/p CS Replacement 59 50 16 46,000$ 77,500$ 263,500$ 5.9 5 5 5 15 89 M17 Southgate Road 4 Rigid Frame RURAL 9.5 8.3 X n/p Br - 1 Rehabilitation 71.5 50 10 46,000$ 128,000$ 85,714$ 814,286$ 7.2 5 5 5 15 107 M18 Southgate Road 11 Twin Rigid Frame RURAL 12 14.8 X n/p Br - 1 Rehabilitation 75 50 14 1,000$ 16,000$ 85,750$ 1,029,000$ 7.5 5 5 5 15 113 L19 Southgate Road 10 Three cell rigid frame RURAL 19.5 9.5 X n/p Br - 1 Rehabilitation 75 50 14 16,000$ 85,750$ 1,672,125$ 7.5 5 5 5 15 113 L20 Southgate Road 10 Steel Truss RURAL 17 5.6 X 15 Br - 1 Replacement 46 50 10 1,000,000$ 85,750$ 1,457,750$ 4.6 3 1 5 9 41 H21 Southgate Road 70 Steel Girder RURAL 26 9.85 X n/p Br - 1 Rehabilitation 66.2 50 5 46,000$ 215,500$ 85,750$ 2,229,500$ 6.6 5 5 5 15 99 M22 Southgate Road 12 Rigid Frame RURAL 6 7.4 X n/p Br. Roadside Safety 63.8 50 18 46,000$ 77,500$ 465,000$ 6.4 5 5 5 15 96 M23 Southgate Road 12 CSP RURAL 4.7 20 X n/p CS Replacement 24.2 50 1 46,000$ 250,000$ 77,500$ 364,250$ 2.4 5 5 5 15 36 E24 Southgate Road 7 Rigid Frame RURAL 5.5 7.5 X n/p Br Roadside Safety 70.7 50 24 46,000$ 77,500$ 426,250$ 7.1 5 5 5 15 106 M25 Southgate Road 14 Precast Box Culvert RURAL 3.6 17.5 X n/p CC Roadside Safety 72.3 50 23 46,000$ 77,500$ 279,000$ 7.2 5 5 5 15 108 M26 Southgate Road 14 CSP RURAL 3.3 16.8 X n/p CS Roadside Safety 74.4 50 24 46,000$ 77,500$ 255,750$ 7.4 5 5 5 15 112 M27 Southgate Road 14 Rigid Frame RURAL 3 9.9 X n/p Br Replacement 19.36 50 1 250,000$ 77,500$ 232,500$ 1.9 5 5 5 15 29 E28 Southgate Road 13 Rigid Frame RURAL 5.5 7.5 X n/p Br Roadside Safety 74.6 50 29 46,000$ 77,500$ 426,250$ 7.5 5 5 5 15 112 M29 Southgate Road 14 Rigid Frame RURAL 3.7 10.4 X n/p Br Replacement 47.4 50 10 250,000$ 77,500$ 286,750$ 4.7 5 5 5 15 71 H30 Southgate Sideroad 15 Rigid Frame RURAL 4.4 16.4 X n/p Br Replacement 71.13 50 25 77,500$ 341,000$ 7.1 5 5 5 15 107 M31 Southgate Road 14 CSP RURAL 3.5 14.5 X n/p CS Roadside Safety 54.11 50 13 2,500$ 46,000$ 77,500$ 271,250$ 5.4 5 5 5 15 81 M32 Southgate Road 14 Twin CSP RURAL 7.2 19 X n/p CS Roadside Safety 75 50 24 46,000$ 85,714$ 617,143$ 7.5 5 5 5 15 113 L33 Southgate Sideroad 21 Rigid Frame RURAL 6.1 7.3 X 15 Br Replacement 43.6 50 8 350,000$ 77,500$ 472,750$ 4.4 3 5 5 13 57 H34 Southgate Road 14 CSP RURAL 3.7 20.5 X n/p CS Roadside Safety 63.8 50 18 46,000$ 77,500$ 286,750$ 6.4 5 5 5 15 96 M35 Southgate Road 57 Rigid Frame RURAL 6.1 7.4 X n/p Br - 1 Rehabilitation 73.4 50 12 46,000$ 77,500$ 472,750$ 7.3 5 5 5 15 110 M36 Southgate Sideroad 71 Rigid Frame RURAL 3.7 13.1 X n/p Br Replacement 65.2 50 19 46,000$ 77,500$ 286,750$ 6.5 5 5 5 15 98 M37 Southgate Road 24 Rigid Frame RURAL 3.7 7.4 X n/p Br Replacement 64.19 50 19 77,500$ 286,750$ 6.4 5 5 5 15 96 M38 Southgate Road 24 CSP RURAL 3 16.8 X n/p CS Replacement 26.8 50 1 250,000$ 77,500$ 232,500$ 2.7 5 5 5 15 40 H39 Southgate Sideroad 71 Rigid Frame RURAL 3 7.4 X n/p Br Roadside Safety 73 50 27 46,000$ 77,500$ 232,500$ 7.3 5 5 5 15 110 M40 Southgate Sideroad 21 Rigid Frame RURAL 3.7 7.5 X n/p Br Replacement 76.5 50 25 77,500$ 286,750$ 7.7 5 5 5 15 115 L41 Southgate Road 26 Rigid Frame RURAL 3.6 11 X n/p CC Replacement 74.7 50 26 46,000$ 77,500$ 279,000$ 7.5 5 5 5 15 112 M42 Southgate Road 26 CSP RURAL 4.2 19.7 X n/p CS Roadside Safety 74.6 50 24 46,000$ 77,500$ 325,500$ 7.5 5 5 5 15 112 M43 Southgate Sideroad 75 Rigid Frame RURAL 3 9.7 X n/p Br Roadside Safety 68.51 50 23 46,000$ 77,500$ 232,500$ 6.9 5 5 5 15 103 M48 Southgate Road 24 Precast Box Culvert RURAL 3.7 13.2 X n/p CC Roadside Safety 73.2 50 24 46,000$ 77,500$ 286,750$ 7.3 5 5 5 15 110 M49 Southgate Road 24 Rigid Frame RURAL 4 14 X n/p Br Roadside Safety 73.8 50 28 46,000$ 77,500$ 310,000$ 7.4 5 5 5 15 111 M50 Southgate Sideroad 13 Rigid Frame RURAL 6 8.7 X n/p Br None 98.4 50 47 77,500$ 465,000$ 9.8 5 5 5 15 148 L51 Southgate Road 26 Rigid Frame RURAL 3.8 7.4 X n/p Br Replacement 58.43 50 16 75,000$ 77,500$ 294,500$ 5.8 5 5 5 15 88 M52 Southgate Road 26 Steel Beam RURAL 21 9.15 X n/p Br - 1 None 87.3 50 22 85,750$ 1,800,750$ 8.7 5 5 5 15 131 L53 Southgate Road 26 Rigid Frame RURAL 7 9 X n/p Br - 1 None 85.2 50 21 85,714$ 600,000$ 8.5 5 5 5 15 128 L54 Southgate Road 24 CSP RURAL 3.3 16.8 X n/p CS Roadside Safety 74.3 50 24 46,000$ 77,500$ 255,750$ 7.4 5 5 5 15 111 M55 Southgate Road 24 Twin CSP RURAL 4.4 15.7 X n/p CS Roadside Safety 74.8 50 24 46,000$ 77,500$ 341,000$ 7.5 5 5 5 15 112 M56 Southgate Road 24 Rigid Frame RURAL 3.7 7.5 X n/p CC Roadside Safety 71.5 50 23 46,000$ 77,500$ 286,750$ 7.2 5 5 5 15 107 M57 Southgate Sideroad 7 Rigid Frame RURAL 3.7 7.5 X n/p Br Replacement 63.7 50 18 46,000$ 77,500$ 286,750$ 6.4 5 5 5 15 96 M58 Southgate Road 26 Rigid Frame RURAL 3.6 7.4 X n/p Br Replacement 44.8 50 9 250,000$ 77,500$ 279,000$ 4.5 5 5 5 15 67 H59 Southgate Sideroad 7 Concrete Girder RURAL 24.5 9.85 X n/p Br -1 Rehabilitation 72.6 50 11 46,000$ 85,750$ 2,100,875$ 7.3 5 5 5 15 109 M60 Southgate Road 26 2 span Concrete Gurder RURAL 36 12 X n/p Br -1 Rehabilitation 74.9 50 14 46,000$ 85,750$ 3,087,000$ 7.5 5 5 5 15 112 M
121 Southgate Road 4 CSP RURAL 3.9 21.5 X n/p CS Roadside Safety 74.5 50 24 46,000$ 77,500$ 302,250$ 7.5 5 5 5 15 112 M124 Southgate Road 10 Rigid Frame RURAL 3 11 X n/p CC Roadside Safety 66.3 50 19 46,000$ 77,500$ 232,500$ 6.6 5 5 5 15 99 M125 Southgate Road 14 Twin CSP RURAL 3.6 12 X n/p CS Replacement 45 50 9 250,000$ 77,500$ 279,000$ 4.5 5 5 5 15 68 H126 Southgate Sideroad 75 Twin CSP RURAL 3.6 15.4 X n/p CS Roadside Safety 72.2 50 23 46,000$ 77,500$ 279,000$ 7.2 5 5 5 15 108 M127 Southgate Road 24 Rigid Frame RURAL 3 14 X n/p CC Roadside Safety 73.3 50 24 46,000$ 77,500$ 232,500$ 7.3 5 5 5 15 110 M
No. of Lanes Consequence of Failure
Watson & Associates Economists Ltd H:\Southgate\2013 AM\Southgate AM Inventory Model FINAL.xlsx
A-7

Township of Southgate2013 Asset Management PlanStorm - Catch Basins
Asset Number
Pooled Asset
DescriptionAsset Status
Acquisition Year
Capitalization Date
Adjusted Capitalization Cost
Total Accumulated Depreciation at
December 31, 2012
Current Year (2013)
DepreciationNet Book Value
Asset Life Expectancy
(Yrs)
Remaining Useful Life
AgeReplacement Cost (2013$) Inflated HC
Condition Rating
(Age Based)
Asset Condition
Probability of Failure
Consequence of Failure
Risk of Failure
439,900.45$ 195,383.41$ -$ 244,517.04$ 1,168,238$
PW09520 No Hagen Street Catch Basin Active 1984 1/1/1984 16,428.00$ 9,528.03$ -$ 6,899.97$ 50 21 29 46,063$ 2 Average Unlikely Moderate MPW09521 No Gold Street Catch Basin Active 1989 1/1/1989 33,655.00$ 16,152.56$ -$ 17,502.44$ 50 26 24 66,329$ 3 Average Unlikely Moderate MPW09522 No Young Street Catch Basin Active 1965 1/1/1965 5,270.00$ 5,058.92$ -$ 211.08$ 50 2 48 55,270$ 0 Very Poor Likely Moderate HPW09523 No Russell Lane Catch Basin Active 1989 1/1/1989 23,372.00$ 11,217.28$ -$ 12,154.72$ 50 26 24 46,063$ 3 Average Unlikely Moderate MPW09524 No Sinclair Street Catch Basin Active 2008 1/1/2008 40,000.00$ 3,999.44$ -$ 36,000.56$ 50 45 5 42,039$ 5 Very Good Rare Moderate MPW09525 No Sheffield Street Catch Basin Active 2008 1/1/2008 57,600.00$ 5,759.21$ -$ 51,840.79$ 50 45 5 60,536$ 5 Very Good Rare Moderate MPW09526 No Alice Street Catch Basin Active 1972 1/1/1972 5,599.00$ 4,591.09$ -$ 1,007.91$ 50 9 41 36,850$ 1 Poor Possible Moderate MPW09527 No Osprey Street Catch Basin Active 2009 8/21/2009 661.45$ 44.48$ -$ 616.97$ 50 46 4 709$ 5 Very Good Rare Moderate MPW09527 No Osprey Street Catch Basin Active 1984 1/1/1984 19,713.00$ 11,433.27$ -$ 8,279.73$ 50 21 29 55,273$ 2 Average Unlikely Moderate MPW09528 No Owen Sound Street Catch Basin Active 1972 1/1/1972 6,999.00$ 5,739.07$ -$ 1,259.93$ 50 9 41 46,065$ 1 Poor Possible Moderate MPW09529 No Holland Street Catch Basin Active 1989 1/1/1989 9,349.00$ 4,487.00$ -$ 4,862.00$ 50 26 24 18,425$ 3 Average Unlikely Moderate MPW09530 No Proton Street Catch Basin Active 1972 1/1/1972 10,078.00$ 8,263.81$ -$ 1,814.19$ 50 9 41 66,329$ 1 Poor Possible Moderate MPW09531 No Artemesia Street Catch Basin Active 1994 1/1/1994 56,532.00$ 21,479.85$ -$ 35,052.15$ 50 31 19 110,549$ 3 Average Unlikely Moderate MPW09532 No Toronto Street Catch Basin Active 1994 1/1/1994 33,919.00$ 12,887.84$ -$ 21,031.16$ 50 31 19 66,329$ 3 Average Unlikely Moderate MPW09533 No Bradley Street Catch Basin Active 1989 1/1/1989 23,372.00$ 11,217.28$ -$ 12,154.72$ 50 26 24 46,063$ 3 Average Unlikely Moderate MPW09534 No Grey Street Catch Basin Active 1994 1/1/1994 4,711.00$ 1,790.00$ -$ 2,921.00$ 50 31 19 9,212$ 3 Average Unlikely Moderate MPW09535 No Highpoint Street Catch Basin Active 1989 1/1/1989 4,674.00$ 2,243.27$ -$ 2,430.73$ 50 26 24 9,212$ 3 Average Unlikely Moderate MPW09536 No Wilson Crescent Catch Basin Active 1989 1/1/1989 9,349.00$ 4,487.00$ -$ 4,862.00$ 50 26 24 18,425$ 3 Average Unlikely Moderate MPW09537 No Mill Street Catch Basin Active 1984 1/1/1984 13,142.00$ 7,622.18$ -$ 5,519.82$ 50 21 29 36,849$ 2 Average Unlikely Moderate MPW09538 No Dundalk Street Catch Basin Active 1984 1/1/1984 26,285.00$ 15,244.94$ -$ 11,040.06$ 50 21 29 73,701$ 2 Average Unlikely Moderate MPW09539 No Victoria Street Catch Basin Active 1972 1/1/1972 39,192.00$ 32,136.89$ -$ 7,055.11$ 50 9 41 257,946$ 1 Poor Possible Moderate M
Watson & Associates Economists Ltd H:\Southgate\2013 AM\Southgate AM Inventory Model FINAL.xlsx
A-8

Township of Southgate2013 Asset Management PlanAsset Type: Facilities
Asset Number
Description Asset Category Department Asset LocationAsset Status
Vendor NameAcquisition
YearImprovement Description
Acquisition Year for Option 2
(Blended Age Estimate)
Capitalization Date
Capitalization Cost
Write Down Amount
Adjustment Amount
Adjusted Capitalization
Cost
Total Accumulated Depreciation at
December 31, 2012
Current Year (2013)
DepreciationNet Book Value
Asset Life Expectancy
(Yrs)
Remaining Useful Life
Age NotesRSMeans Building
TypeComponent
Cost Allocation
Component Replacement
Cost(2013$)
Replacement Cost (2013$) Inflated HC
Condition Rating
(Age Based)
Asset Condition
Initial Probability of Failure
Consequence of Failure
Initial Risk of Failure
3,903,176.27$ 1,207,391.99$ -$ 2,695,784.28$ 10,338,812$ 8,928,771$ SOUTHGATE MUNICIPAL OFFICE AND HOPEVILLE WORKS GARAGE
BU00506090-002-15000 Hopeville Admin Office And Equipment Depot - 185667 Grey Rd 9
Buildings & Building Improvements (50 Yrs) General Government Former Proton Twp Active KEVIN MCROBB CONSTRU 2013Accessible Office
Entrance7/2/2013 9,972.48$ -$ -$ 9,972.48$ -$ -$ 9,972.48$ 50 50 0
Values of 2 bldg permits attached for renos. Dec/2007 reno approx. $40,000.
9,972$ 5 Very Good Rare Moderate M
BU00506090-002-15000 Hopeville Admin Office And Equipment Depot - 185667 Grey Rd 9
Buildings & Building Improvements (50 Yrs) General Government Former Proton Twp Active Sturrock Constructio 2007Office
Renovations12/1/2007 36,747.00$ -$ -$ 36,747.00$ 3,736.58$ -$ 33,010.42$ 50 44 6
Values of 2 bldg permits attached for renos. Dec/2007 reno approx. $40,000.
42,316$ 4 Good Rare Moderate M
BU00506090-002-15000 Hopeville Admin Office And Equipment Depot - 185667 Grey Rd 9
Buildings & Building Improvements (50 Yrs) General Government Former Proton Twp Active Russ VanAlstine 2000Addition - office space & council
chambers1/1/2000 76,000.00$ -$ -$ 76,000.00$ 19,758.96$ -$ 56,241.04$ 50 37 13
Values of 2 bldg permits attached for renos. Dec/2007 reno approx. $40,000.
123,287$ 4 Good Rare Moderate M
BU00506090-002-15000 Hopeville Admin Office And Equipment Depot - 185667 Grey Rd 9
Buildings & Building Improvements (50 Yrs) General Government Former Proton Twp Active J.R. Plume Construct 1987Addition - 2 Bays (works garage)
7/14/1987 152,768.00$ -$ -$ 152,768.00$ 77,812.34$ -$ 74,955.66$ 50 24 26 Values of 2 bldg permits attached for renos.
Dec/2007 reno approx. $40,000.
345,870$ 2 Average Unlikely Moderate M
BU00506090-002-15000 Hopeville Admin Office And Equipment Depot - 185667 Grey Rd 9
Buildings & Building Improvements (50 Yrs) General Government Former Proton Twp Active Bldg permit 1986Original facility construction
5/1/1986 73,000.00$ -$ -$ 73,000.00$ 38,937.33$ -$ 34,062.67$ 50 23 27 Values of 2 bldg permits attached for renos.
Dec/2007 reno approx. $40,000.
183,574$ 2 Average Unlikely Moderate M
BU00506 General Government 1985 70 0 2013 Structure Garage, Repair 32.60% $ 229,837 BU00506 General Government 1985 25 0 2013 Roof Garage, Repair 7.10% $ 50,056 BU00506 General Government 1985 25 0 2013 HVAC Garage, Repair 10.80% $ 76,142 BU00506 General Government 1985 50 0 2013 Other Garage, Repair 49.50% $ 348,985 SAND SHED AND EQUIPMENT STORAGE BUILDINGPW00505 090-002-15000 Hopeville Sand/Salt Shed - 185667 Grey Rd 9 Buildings & Building Improvements (50 Yrs) Public Works Former Proton Twp Active DOMM CONSTRUCTION LT 2009 Addition 2000 10/16/2009 96,239.08$ -$ -$ 96,239.08$ 6,176.15$ -$ 90,062.93$ 50 46 4 $ 103,115 103,115$ 5 Very Good Rare Moderate M
PW00505 090-002-15000 Hopeville Sand/Salt Shed - 185667 Grey Rd 9 Buildings & Building Improvements (50 Yrs) Public Works Former Proton Twp Active Domm Const. 1994Original facility construction
2000 1/1/1994 150,000.00$ -$ -$ 150,000.00$ 56,993.85$ -$ 93,006.15$ 50 31 19 $ 293,327 293,327$ 3 Average Unlikely Moderate M
PW00505 Public Works 2000 70 0 2013 Structure $ - PW00505 Public Works 2000 25 0 2013 Roof $ - PW00505 Public Works 2000 25 0 2013 HVAC N/APW00505 Public Works 2000 50 0 2013 Other $ - DUNDALK WORKS GARAGE
PW00504 110-001-44910 Dundalk Depot - 75 Dundalk St Buildings & Building Improvements (50 Yrs) Public Works Former Village Of Dundalk Active DOMM CONSTRUCTION LT 1996Original facility construction
1996 1/1/1996 171,800.00$ -$ -$ 171,800.00$ 58,409.66$ -$ 113,390.34$ 50 33 17 $ 319,747 319,747$ 3 Average Unlikely Moderate M
PW00504 Public Works 1996 70 0 2013 Structure Garage, Repair 32.60% $ 229,837 PW00504 Public Works 1996 25 0 2013 Roof Garage, Repair 7.10% $ 50,056 PW00504 Public Works 1996 25 0 2013 HVAC Garage, Repair 10.80% $ 76,142 PW00504 Public Works 1996 50 0 2013 Other Garage, Repair 49.50% $ 348,985 HOLSTEIN WORKS DEPOT (FORMER MUNICIPAL OFFICE)
PW00503 060-003-10013 Holstein Works Depot (Former Municipal Office) Buildings & Building Improvements (50 Yrs) Public Works Active 1972Original facility construction
1972
PW00503 060-003-10013 Holstein Works Depot (Former Municipal Office) Buildings & Building Improvements (50 Yrs) Public Works Active 1980Addition - office space & council
chambers1980 1/1/1980 142,000.00$ -$ -$ 142,000.00$ 93,718.07$ -$ 48,281.93$ 50 17 33 $ 528,395 528,395$ 2 Average Unlikely Moderate M
PW00503 Public Works 1980 70 0 2013 Structure Garage, Repair 32.60% $ 229,837 PW00503 Public Works 1980 25 0 2013 Roof Garage, Repair 7.10% $ 50,056 PW00503 Public Works 1980 25 0 2013 HVAC Garage, Repair 10.80% $ 76,142 PW00503 Public Works 1980 50 0 2013 Other Garage, Repair 49.50% $ 348,985 HOLSTEIN SAND DEPOT
PW00507 060-003-10013 Holstein Sand Dome - 127273 Southgate Rd 12 Buildings & Building Improvements (50 Yrs) Public Works Former Egremont Twp Active 1983Original facility construction
1983 1/1/1983 103,247.00$ -$ -$ 103,247.00$ 61,945.38$ -$ 41,301.62$ 50 20 30 $ 298,023 298,023$ 2 Average Unlikely Moderate M
PW00507 Public Works 1983 70 0 2013 Structure $ - PW00507 Public Works 1983 25 0 2013 Roof $ - PW00507 Public Works 1983 25 0 2013 HVAC N/APW00507 Public Works 1983 50 0 2013 Other $ - HOLSTEIN WORKS DEPOT (FORMER MUNICIPAL OFFICE)
PW00508 060-003-10013 Holstein Pole Storage Shed - 127273 Southgate Rd 12 Buildings & Building Improvements (50 Yrs) Public Works Former Egremont Twp Active DOMM Construction 1990Original facility construction
1990 1/1/1990 20,725.00$ -$ -$ 20,725.00$ 9,532.66$ -$ 11,192.34$ 50 27 23 $ 39,844 39,844$ 3 Average Unlikely Moderate M
PW00508 Public Works 1990 70 0 2013 Structure $ - PW00508 Public Works 1990 25 0 2013 Roof $ - PW00508 Public Works 1990 25 0 2013 HVAC N/APW00508 Public Works 1990 50 0 2013 Other $ - DUNDALK OLDE TOWN HALL
BU00517 110-001-27800 Dundalk Olde Town Hall & Theatre- 80 Main St E Buildings & Building Improvements (50 Yrs) Recreation and Culture Dundalk Olde Town Hall Active ZEKE AIR HEATING & C 2011 Replaced furnace 2011 5/4/2011 3,251.23$ -$ -$ 3,251.23$ 108.06$ -$ 3,143.17$ 50 48 2For valuation purposes, I used Jardines 2007 estimated replacement cost value deflated back to 1905.
$ 3,349 3,349$ 5 Very Good Rare Moderate M
BU00517 110-001-27800 Dundalk Olde Town Hall & Theatre- 80 Main St E Buildings & Building Improvements (50 Yrs) Recreation and Culture Dundalk Olde Town Hall Active Dominion Roofing 2009 Replaced roof 2009 9/30/2009 13,106.50$ -$ -$ 13,106.50$ 852.60$ -$ 12,253.90$ 50 46 4For valuation purposes, I used Jardines 2007 estimated replacement cost value deflated back to 1905.
$ 14,043 14,043$ 5 Very Good Rare Moderate M
BU00517 110-001-27800 Dundalk Olde Town Hall & Theatre- 80 Main St E Buildings & Building Improvements (50 Yrs) Recreation and Culture Dundalk Olde Town Hall Active B & M Construction 2006Drainage upgrades
2006 8/23/2006 12,359.14$ -$ -$ 12,359.14$ 1,571.40$ -$ 10,787.74$ 50 43 7For valuation purposes, I used Jardines 2007 estimated replacement cost value deflated back to 1905.
$ 15,192 15,192$ 4 Good Rare Moderate M
BU00517 110-001-27800 Dundalk Olde Town Hall & Theatre- 80 Main St E Buildings & Building Improvements (50 Yrs) Recreation and Culture Dundalk Olde Town Hall Active Kirkham Construction 2003 Repaired roof 2003 12/23/2003 12,716.40$ -$ -$ 12,716.40$ 2,295.03$ -$ 10,421.37$ 50 40 10For valuation purposes, I used Jardines 2007 estimated replacement cost value deflated back to 1905.
$ 18,717 18,717$ 4 Good Rare Moderate M
BU00517 110-001-27800 Dundalk Olde Town Hall & Theatre- 80 Main St E Buildings & Building Improvements (50 Yrs) Recreation and Culture Dundalk Olde Town Hall Active 1905Original facility construction
1905 1/1/1905 17,000.00$ -$ -$ 17,000.00$ 17,000.00$ -$ -$ 50 0 108For valuation purposes, I used Jardines 2007 estimated replacement cost value deflated back to 1905.
$ 927,902 927,902$ 0 Very Poor Likely Moderate H
BU00517 Recreation and Culture 1905 70 0 2013 Structure Town Hall, 2 Storey $ - BU00517 Recreation and Culture 2009 25 0 2013 Roof Town Hall, 2 Storey $ - BU00517 Recreation and Culture 2011 25 0 2013 HVAC Town Hall, 2 Storey $ - BU00517 Recreation and Culture 50 0 2013 Other Town Hall, 2 Storey $ - DUNDALK OLDE TOWN HALLDA00502 110-001-23301 Dundalk Arena (New) - 550 Main St E Buildings & Building Improvements (50 Yrs) Recreation and Culture Dundalk Arena Active 1345983 Ontario Ltd. 2010 HVAC 2010 10/31/2010 12,404.60$ -$ -$ 12,404.60$ 537.95$ -$ 11,866.65$ 50 47 3 13,300$ 5 Very Good Rare Moderate MDA00502 110-001-23301 Dundalk Arena (New) - 550 Main St E Buildings & Building Improvements (50 Yrs) Recreation and Culture Dundalk Arena Active Sturrock Constructio 2008 Overhead doors 2008 12/15/2008 11,698.00$ -$ -$ 11,698.00$ 946.09$ -$ 10,751.91$ 50 45 5 12,294$ 5 Very Good Rare Moderate MDA00502 110-001-23301 Dundalk Arena (New) - 550 Main St E Buildings & Building Improvements (50 Yrs) Recreation and Culture Dundalk Arena Active Domm Construction 2004 Front entrance 2004 1/1/2004 98,509.00$ -$ -$ 98,509.00$ 17,730.27$ -$ 80,778.73$ 50 41 9 136,038$ 4 Good Rare Moderate M
DA00502 110-001-23301 Dundalk Arena (New) - 550 Main St E Buildings & Building Improvements (50 Yrs) Recreation and Culture Dundalk Arena Active B & M CONSTRUCTION 1995Auditorium
kitchen1995 9/1/1995 54,000.00$ -$ -$ 54,000.00$ 18,720.00$ -$ 35,280.00$ 50 32 18 102,411$ 3 Average Unlikely Moderate M
DA00502 110-001-23301 Dundalk Arena (New) - 550 Main St E Buildings & Building Improvements (50 Yrs) Recreation and Culture Dundalk Arena Active Bye Construction 1975Original facility construction
1975 1/1/1975 390,000.00$ -$ -$ 390,000.00$ 296,389.32$ -$ 93,610.68$ 50 12 38 1,845,471$ 1 Poor Possible Moderate M
DA00502 Recreation and Culture 1975 70 0 2013 Structure Rink, Hockey 42.80% $ 902,872 DA00502 Recreation and Culture 1975 25 0 2013 Roof Rink, Hockey 3.80% $ 80,162 DA00502 Recreation and Culture 1975 25 0 2013 HVAC Rink, Hockey 10.60% $ 223,609 DA00502 Recreation and Culture 1975 50 0 2013 Other Rink, Hockey 42.80% $ 902,872 DROMORE PARK PICNIC SHELTER
DP00521 060-002-00730 Dromore Park Picnic Shelter - 224240 Southgate Rd 22 Buildings & Building Improvements (50 Yrs) Recreation and Culture Former Egremont Twp Active 1990Original facility construction
1990 1/1/1990 12,400.00$ -$ -$ 12,400.00$ 5,703.49$ -$ 6,696.51$ 50 27 23 $ 23,839 23,839$ 3 Average Unlikely Moderate M
DP00521 Recreation and Culture 1990 70 0 2013 Structure $ - DP00521 Recreation and Culture 1990 25 0 2013 Roof $ - DP00521 Recreation and Culture 1990 25 0 2013 HVAC N/ADP00521 Recreation and Culture 1990 50 0 2013 Other $ - HOLSTEIN COMMUNITY CENTRE
HL00522 060-031-06300 Holstein Community Centre - 392057 Grey Rd 109 Buildings & Building Improvements (50 Yrs) Recreation and Culture Former Egremont Twp Active YOUNG'S BUILDING MAT 2012Washroom renovations
2012 6/29/2012 2,495.44$ -$ -$ 2,495.44$ 25.28$ -$ 2,470.16$ 50 49 1 $ 2,515 2,515$ 5 Very Good Rare Moderate M
HL00522 060-031-06300 Holstein Community Centre - 392057 Grey Rd 109 Buildings & Building Improvements (50 Yrs) Recreation and Culture Former Egremont Twp Active Buddsteel Architectu 2012Washroom renovations
2012 6/29/2012 4,341.00$ -$ -$ 4,341.00$ 43.97$ -$ 4,297.03$ 50 49 1 $ 4,376 4,376$ 5 Very Good Rare Moderate M
HL00522 060-031-06300 Holstein Community Centre - 392057 Grey Rd 109 Buildings & Building Improvements (50 Yrs) Recreation and Culture Former Egremont Twp Active MCDONALD HOME HARDWA 2012Washroom renovations
2012 6/29/2012 152.87$ -$ -$ 152.87$ 1.55$ -$ 151.32$ 50 49 1 $ 154 154$ 5 Very Good Rare Moderate M
HL00522 060-031-06300 Holstein Community Centre - 392057 Grey Rd 109 Buildings & Building Improvements (50 Yrs) Recreation and Culture Former Egremont Twp Active U Line/Kevin Green 2012Washroom renovations
2012 5/31/2012 1,106.55$ -$ -$ 1,106.55$ 12.97$ -$ 1,093.58$ 50 49 1 $ 1,115 1,115$ 5 Very Good Rare Moderate M
HL00522 060-031-06300 Holstein Community Centre - 392057 Grey Rd 109 Buildings & Building Improvements (50 Yrs) Recreation and Culture Former Egremont Twp Active 1995Original facility construction
1995 1/1/1995 188,000.00$ -$ -$ 188,000.00$ 67,674.86$ -$ 120,325.14$ 50 32 18 $ 356,543 356,543$ 3 Average Unlikely Moderate M
DP00522 Recreation and Culture 1995 70 0 2013 Structure $ - DP00522 Recreation and Culture 1995 25 0 2013 Roof $ - DP00522 Recreation and Culture 1995 25 0 2013 HVAC N/ADP00522 Recreation and Culture 1995 50 0 2013 Other $ - HOLSTIEN PARK BOOTH AND WASHROOMS
HL00522A Lunch Booth/Ball Storage & Washrooms At Holstein Park Buildings & Building Improvements (50 Yrs) Recreation and Culture Former Egremont Twp Active 1995Original facility construction
1995 1/1/1995 22,000.00$ -$ -$ 22,000.00$ 7,919.40$ -$ 14,080.60$ 50 32 18 $ 41,723 41,723$ 3 Average Unlikely Moderate M
DP00522A Recreation and Culture 1995 70 0 2013 Structure $ - DP00522A Recreation and Culture 1995 25 0 2013 Roof $ - DP00522A Recreation and Culture 1995 25 0 2013 HVAC N/ADP00522A Recreation and Culture 1995 50 0 2013 Other $ - HOPEVILLE BALLPARK
HP00514 090-002-09800 Hopeville Park Pavilion - 185450 Grey Rd 9 Buildings & Building Improvements (50 Yrs) Recreation and Culture Former Proton Twp Active R VanAlstine & Sons 1981Original facility construction
1981 7/1/1981 31,000.00$ -$ -$ 31,000.00$ 19,531.07$ -$ 11,468.93$ 50 18 32 $ 101,028 101,028$ 2 Average Unlikely Moderate M
HP00514 Recreation and Culture 1981 70 0 2013 Structure $ - HP00514 Recreation and Culture 1981 25 0 2013 Roof $ - HP00514 Recreation and Culture 1981 25 0 2013 HVAC N/AHP00514 Recreation and Culture 1981 50 0 2013 Other $ - DUNDALK MEMORIAL PARK - POOLDR00510 110-001-30700 Dundalk Pool And Change House 250 Owen Sound St Buildings & Building Improvements (50 Yrs) Recreation and Culture Former Village Of Dundalk Active CALDECOTT MILLWRIGHT 2010 Door upgrades 2010 7/30/2010 1,163.00$ -$ -$ 1,163.00$ 56.36$ -$ 1,106.64$ 50 47 3 $ 1,247 1,247$ 5 Very Good Rare Moderate M
DR00510 110-001-30700 Dundalk Pool And Change House 250 Owen Sound St Buildings & Building Improvements (50 Yrs) Recreation and Culture Former Village Of Dundalk Active B & M CONSTRUCTION 2010Addition to pool
bldg - completion2010 3/31/2010 33,109.71$ -$ -$ 33,109.71$ 1,823.86$ -$ 31,285.85$ 50 47 3 $ 35,500 35,500$ 5 Very Good Rare Moderate M
DR00510 110-001-30700 Dundalk Pool And Change House 250 Owen Sound St Buildings & Building Improvements (50 Yrs) Recreation and Culture Former Village Of Dundalk Active B & M CONSTRUCTION 2009Addition to pool bldg - start of
2009 12/31/2009 10,590.22$ -$ -$ 10,590.22$ 635.56$ -$ 9,954.66$ 50 46 4 $ 11,347 11,347$ 5 Very Good Rare Moderate M
DR00510 110-001-30700 Dundalk Pool And Change House 250 Owen Sound St Buildings & Building Improvements (50 Yrs) Recreation and Culture Former Village Of Dundalk Active B & L Farm Services 2009 Fencing 2009 12/8/2009 6,976.87$ -$ -$ 6,976.87$ 427.49$ -$ 6,549.38$ 50 46 4 $ 7,475 7,475$ 5 Very Good Rare Moderate M
DR00510 110-001-30700 Dundalk Pool And Change House 250 Owen Sound St Buildings & Building Improvements (50 Yrs) Recreation and Culture Former Village Of Dundalk Active 1966Original facility construction
1966 7/2/1966 30,000.00$ -$ -$ 30,000.00$ 27,899.79$ -$ 2,100.21$ 50 3 47 $ 297,885 297,885$ 0 Very Poor Likely Moderate H
DR00510 Recreation and Culture 1981 70 0 2013 Structure $ - DR00510 Recreation and Culture 1981 25 0 2013 Roof $ - DR00510 Recreation and Culture 1981 25 0 2013 HVAC N/ADR00510 Recreation and Culture 1981 50 0 2013 Other $ - FRANK MACINTYRE BUILDING
DR00511 110-001-30700 Frank Macintyre Building - 250 Owen Sound St Buildings & Building Improvements (50 Yrs) Recreation and Culture Dundalk Frank Mac Bldg Active Buddsteel Architectu 2012Kitchen
Equipment2012 5/30/2012 2,281.00$ -$ -$ 2,281.00$ 26.85$ -$ 2,254.15$ 50 49 1 $ 2,299 2,299$ 5 Very Good Rare Moderate M
DR00511 110-001-30700 Frank Macintyre Building - 250 Owen Sound St Buildings & Building Improvements (50 Yrs) Recreation and Culture Dundalk Frank Mac Bldg Active GP CARPENTRY INC 2012 Renovations 2012 5/30/2012 44,684.32$ -$ -$ 44,684.32$ 526.06$ -$ 44,158.26$ 50 49 1 $ 45,040 45,040$ 5 Very Good Rare Moderate M
DR00511 110-001-30700 Frank Macintyre Building - 250 Owen Sound St Buildings & Building Improvements (50 Yrs) Recreation and Culture Dundalk Frank Mac Bldg Active Performance Flooring 2009 Renovations 2009 12/15/2009 5,562.90$ -$ -$ 5,562.90$ 338.72$ -$ 5,224.18$ 50 46 4 $ 5,960 5,960$ 5 Very Good Rare Moderate M
DR00511 110-001-30700 Frank Macintyre Building - 250 Owen Sound St Buildings & Building Improvements (50 Yrs) Recreation and Culture Dundalk Frank Mac Bldg Active R. VanAlstine & Sons 1985Original facility construction
1985 1/1/1985 118,000.00$ -$ -$ 118,000.00$ 66,073.53$ -$ 51,926.47$ 50 22 28 $ 315,221 315,221$ 2 Average Unlikely Moderate M
DR00511 Recreation and Culture 1985 70 0 2013 Structure $ - DR00511 Recreation and Culture 1985 25 0 2013 Roof $ - DR00511 Recreation and Culture 1985 25 0 2013 HVAC $ - DR00511 Recreation and Culture 1985 50 0 2013 Other $ - PARK PAVILION
DR00512 110-001-30700 Park Picnic Pavillion/Canteen/Washrooms/BBQ Shelter Buildings & Building Improvements (50 Yrs) Recreation and Culture Former Village Of Dundalk Active 1345983 Ont. Ltd. Pr 2010 Overhead doors 2010 10/31/2010 11,223.60$ -$ -$ 11,223.60$ 486.74$ -$ 10,736.86$ 50 47 3 $ 12,034 12,034$ 5 Very Good Rare Moderate M
DR00512 110-001-30700 Park Picnic Pavillion/Canteen/Washrooms/BBQ Shelter Buildings & Building Improvements (50 Yrs) Recreation and Culture Former Village Of Dundalk Active Mel Henry Contractin 1977Original facility construction
1977 1/1/1977 30,000.00$ -$ -$ 30,000.00$ 21,598.36$ -$ 8,401.64$ 50 14 36 $ 146,064 146,064$ 1 Poor Possible Moderate M
DR00512 Recreation and Culture 1977 70 0 2013 Structure $ -
Dundalk History book states the pool was officially opened on July 2, 1966. I asked Norm Jack to estimate the original cost (as it will be fully depreciated anyway) Norm said the pool project was an iniative of the Dundalk Service
Club and a good portion of the project was volunteered by members.
The F. Macintyre bldg was erected in 1985. In 1991 an addition was built on the back of the bldg (see attached permit appl) valued at $38,000 for
equipment storage.For valuation purposes, we used Jardine estimated 2007 replacement cost
deflated back to 1992.
Watson & Associates Economists Ltd H:\Southgate\2013 AM\Southgate AM Inventory Model FINAL.xlsx
A-9

Township of Southgate2013 Asset Management PlanAsset Type: Facilities
Asset Number
Description Asset Category Department Asset LocationAsset Status
Vendor NameAcquisition
YearImprovement Description
Acquisition Year for Option 2
(Blended Age Estimate)
Capitalization Date
Capitalization Cost
Write Down Amount
Adjustment Amount
Adjusted Capitalization
Cost
Total Accumulated Depreciation at
December 31, 2012
Current Year (2013)
DepreciationNet Book Value
Asset Life Expectancy
(Yrs)
Remaining Useful Life
Age NotesRSMeans Building
TypeComponent
Cost Allocation
Component Replacement
Cost(2013$)
Replacement Cost (2013$) Inflated HC
Condition Rating
(Age Based)
Asset Condition
Initial Probability of Failure
Consequence of Failure
Initial Risk of Failure
DR00512 Recreation and Culture 1977 25 0 2013 Roof $ - DR00512 Recreation and Culture 1977 25 0 2013 HVAC N/ADR00512 Recreation and Culture 1977 50 0 2013 Other $ - LAWN BOWLING STORAGE BUILDING
DR00523 Lawn Bowling Storage Shed & Equip Storage Buildings & Building Improvements (50 Yrs) Recreation and Culture Dundalk Parks Active 1980Original facility construction
1980 1/1/1980 3,500.00$ -$ -$ 3,500.00$ 2,309.94$ -$ 1,190.06$ 50 17 33Used Jardine's 2007 estimated replacement cost deflated back to 1980.
$ 13,024 13,024$ 2 Average Unlikely Moderate M
DR00523 Recreation and Culture 1980 70 0 2013 Structure $ - DR00523 Recreation and Culture 1980 25 0 2013 Roof $ - DR00523 Recreation and Culture 1980 25 0 2013 HVAC N/ADR00523 Recreation and Culture 1980 50 0 2013 Other $ - DUNDALK FIRE HALL
FD00518 110-001-44910 Fire Hall (NEW) - 85 Dundalk St N Buildings & Building Improvements (50 Yrs) Fire Dundalk Fire Hall (New) Active 2002Original facility construction
5/28/2002 499,746.00$ -$ -$ 499,746.00$ 105,901.00$ -$ 393,845.00$ 50 39 11Resolution attached.
762,820$ 4 Good Rare Major M
FD00518 Fire 2002 70 0 2013 Structure Fire Station, 2 Story 29.30% $ 223,506 FD00518 Fire 2002 25 0 2013 Roof Fire Station, 2 Story 3.00% $ 22,885 FD00518 Fire 2002 25 0 2013 HVAC Fire Station, 2 Story 19.50% $ 148,750 FD00518 Fire 2002 50 0 2013 Other Fire Station, 2 Story 48.20% $ 367,679 SOUTHGATE COMMUNITY SERVICES BUILDING AND LIBRARY
LI00537 Southgate Community Services Building - 80 Proton Street Buildings & Building Improvements (50 Yrs) General Government Active GEORGIAN BAY FIRE & 2010Alarm system
installation11/30/2010 5,140.92$ -$ -$ 5,140.92$ 214.51$ -$ 4,926.41$ 50 47 3 5,512$ 5 Very Good Rare Moderate M
LI00537 Southgate Community Services Building - 80 Proton Street Buildings & Building Improvements (50 Yrs) General Government Active DOMM CONSTRUCTION LT 2010Original facility construction
9/30/2010 572,122.58$ -$ -$ 572,122.58$ 25,782.72$ -$ 546,339.86$ 50 47 3 613,429$ 5 Very Good Rare Moderate M
LI00537 Southgate Community Services Building - 80 Proton Street Buildings & Building Improvements (50 Yrs) General Government Active Twp of Southgate 2010Original facility construction
7/31/2010 2,630.42$ -$ -$ 2,630.42$ 127.33$ -$ 2,503.09$ 50 47 3 2,820$ 5 Very Good Rare Moderate M
LI00537 Southgate Community Services Building - 80 Proton Street Buildings & Building Improvements (50 Yrs) General Government Active Township of Southgat 2010Original facility construction
7/31/2010 478.08$ -$ -$ 478.08$ 23.15$ -$ 454.93$ 50 47 3 513$ 5 Very Good Rare Moderate M
LI00537 Southgate Community Services Building - 80 Proton Street Buildings & Building Improvements (50 Yrs) General Government Active Georgian Bay Fire, H 2010Original facility construction
7/31/2010 12,034.29$ -$ -$ 12,034.29$ 582.52$ -$ 11,451.77$ 50 47 3 12,903$ 5 Very Good Rare Moderate M
LI00537 Southgate Community Services Building - 80 Proton Street Buildings & Building Improvements (50 Yrs) General Government Active 2009Original facility construction
12/31/2009 341,393.07$ -$ -$ 341,393.07$ 20,488.26$ -$ 320,904.81$ 50 46 4 365,785$ 5 Very Good Rare Moderate M
LI00537 General Government 2009 70 0 2013 Structure Town Hall, 1 Story 34.60% $ 346,333 LI00537 General Government 2009 25 0 2013 Roof Town Hall, 1 Story 6.40% $ 64,062 LI00537 General Government 2009 25 0 2013 HVAC Town Hall, 1 Story 8.60% $ 86,083 LI00537 General Government 2009 50 0 2013 Other Town Hall, 1 Story 50.40% $ 504,485 DUNDALK WASTE TRANSFER STATION
WM00529 Dundalk Transfer Station - Storage Building Buildings & Building Improvements (50 Yrs) Waste Department Waste Depot Active Twp Works moved buil 2006Original facility construction
2006 12/1/2006 7,500.00$ -$ -$ 7,500.00$ 912.54$ -$ 6,587.46$ 50 43 7 $ 9,219 9,219$ 4 Good Rare Major M
WM00529 Waste Department 2006 70 0 2013 Structure $ - WM00529 Waste Department 2006 25 0 2013 Roof $ - WM00529 Waste Department 2006 25 0 2013 HVAC N/AWM00529 Waste Department 2006 50 0 2013 Other $ - EGREMONT LANDFILL - WASTE GARAGE
WM00525 Egremont Landfill - Equipment Storage Bldg Buildings & Building Improvements (50 Yrs) Waste Department Waste Depot Active Domm Const. 2004Original facility construction
2004 7/1/2004 76,000.00$ -$ -$ 76,000.00$ 12,921.56$ -$ 63,078.44$ 50 41 9 $ 104,954 104,954$ 4 Good Rare Major M
WM00525 Waste Department 2004 70 0 2013 Structure $ - WM00525 Waste Department 2004 25 0 2013 Roof $ - WM00525 Waste Department 2004 25 0 2013 HVAC N/AWM00525 Waste Department 2004 50 0 2013 Other $ - EGREMONT LANDFILL - RECYCLING BUILDING
WM00526 Egremont Landfill - Recycling Bldg Buildings & Building Improvements (50 Yrs) Waste Department Waste Depot Active Domm Const. 2004Original facility construction
2004 7/1/2004 48,000.00$ -$ -$ 48,000.00$ 8,160.98$ -$ 39,839.02$ 50 41 9 $ 66,287 66,287$ 4 Good Rare Major M
WM00526 Waste Department 2004 70 0 2013 Structure $ - WM00526 Waste Department 2004 25 0 2013 Roof $ - WM00526 Waste Department 2004 25 0 2013 HVAC N/AWM00526 Waste Department 2004 50 0 2013 Other $ - EGREMONT LANDFILL - OFFICE BUILDING
WM00527 Egremont Landfill Site - Office Bldg Buildings & Building Improvements (50 Yrs) Waste Department Waste Depot Active Domm Const. 2004Original facility construction
2004 7/1/2004 67,000.00$ -$ -$ 67,000.00$ 11,391.37$ -$ 55,608.63$ 50 41 9 $ 92,525 92,525$ 4 Good Rare Major M
WM00527 Waste Department 2004 70 0 2013 Structure $ - WM00527 Waste Department 2004 25 0 2013 Roof $ - WM00527 Waste Department 2004 25 0 2013 HVAC N/AWM00527 Waste Department 2004 50 0 2013 Other $ - EGREMONT LANDFILL - SPECIAL WASTE BUILDING
WM00528 Egremont Landfill Site - Special Waste Bldg Buildings & Building Improvements (50 Yrs) Waste Department Waste Depot Active Domm Const. 2004Original facility construction
2004 7/1/2004 20,000.00$ -$ -$ 20,000.00$ 3,400.42$ -$ 16,599.58$ 50 41 9 $ 27,619 27,619$ 4 Good Rare Major M
WM00528 Waste Department 2004 70 0 2013 Structure $ - WM00528 Waste Department 2004 25 0 2013 Roof $ - WM00528 Waste Department 2004 25 0 2013 HVAC N/AWM00528 Waste Department 2004 50 0 2013 Other $ - HUNT CLUB BUILDING
WM00530Former Gilliam Cottage & Storage Shed(Now Used By Hunt Club)
Buildings & Building Improvements (50 Yrs) Recreation and Culture Active 1997Original facility construction
1997 1/1/1997 35,000.00$ -$ -$ 35,000.00$ 11,198.08$ -$ 23,801.92$ 50 34 16 $ 63,805 63,805$ 3 Average Unlikely Moderate M
WM00530 Waste Department 1997 70 0 2013 Structure $ - WM00530 Waste Department 1997 25 0 2013 Roof $ - WM00530 Waste Department 1997 25 0 2013 HVAC N/AWM00530 Waste Department 1997 50 0 2013 Other $ -
SW00520 090-003-05200 Swinton Park Community Centre - 245308 Southgate Rd 24 Buildings & Building Improvements (50 Yrs) Recreation and Culture Swinton Park Hall Active 1975 1975 1/1/1975 42,000.00$ -$ -$ 42,000.00$ 31,918.86$ -$ 10,081.14$ 50 12 38Bldg permit attached for renos in 1991
$ 198,743 198,743$ 1 Poor Possible Moderate M
CE00501 Maple Grove Cemetery - Chape Buildings & Building Improvements (50 Yrs) Cemetery Active 1954 1954 1/1/1954 10,000.00$ -$ -$ 10,000.00$ 10,000.00$ -$ -$ 50 0 59 $ 145,280 145,280$ 0 Very Poor Likely Minor MCE00501A Maple Grove Cemetery Storage Shed Buildings & Building Improvements (50 Yrs) Cemetery Active R. VanAlstine & Sons 1996 1996 8/1/1996 12,000.00$ -$ -$ 12,000.00$ 3,939.89$ -$ 8,060.11$ 50 33 17 $ 22,334 22,334$ 3 Average Unlikely Minor MCE00502 Maple Grove Cemetary Columbarium Buildings & Building Improvements (50 Yrs) Cemetery Maple Grove Cemetery Active 2009 2009 5/15/2009 24,314.00$ -$ -$ 24,314.00$ 1,765.39$ -$ 22,548.61$ 50 46 4 $ 26,051 26,051$ 5 Very Good Rare Minor L
Watson & Associates Economists Ltd H:\Southgate\2013 AM\Southgate AM Inventory Model FINAL.xlsx
A-10

Township of Southgate2013 Asset Management PlanWatermains
Probability of Failure
Condition Rating
Hydraulic Capacity
Trunk vs. Local
Serviced Land Use
Total Consequence of
Failure 10 15 150 Max
1,625,631$ 617,274$ 1,008,356$ 6,728,940$ 140,548$ WA10000 P-31 Water Main - Alice Street 1/1/1960 1960 5,356$ 4,059$ 1,297$ 70 17 53 150 126 Ductile Iron 63,681$ 4 5 5 5 15 60 M 1,262$ WA10001 P-39 Water Main - Artemesia Street 1/1/1960 1960 5,526$ 4,188$ 1,338$ 70 17 53 100 130 Ductile Iron 65,702$ 4 5 5 4 14 56 H 1,302$ WA10001A P-59 Water Main - Artemesia Street 1/1/1960 1960 6,695$ 5,074$ 1,621$ 70 17 53 100 157.5 Ductile Iron 79,601$ 4 5 5 4 14 56 H 1,577$ WA10001B P-60 Water Main - Artemesia Street 1/1/1990 1990 26,260$ 8,636$ 17,624$ 70 47 23 150 98 Ductile Iron 49,530$ 6 5 5 5 15 90 M 981$ WA10001C P-101 Water Main - Artemesia Street 1/1/1995 1995 40,066$ 10,312$ 29,754$ 70 52 18 150 147.5 Ductile Iron 74,547$ 6 5 5 5 15 90 M 1,477$ WA10001D P-100 Water Main - Artemesia Street 1/1/1995 1995 19,014$ 4,894$ 14,120$ 70 52 18 150 70 Ductile Iron 35,378$ 6 5 5 5 15 90 M 701$ WA10002 P-102 Water Main - Bradley Street 1/1/1960 1960 4,187$ 3,173$ 1,014$ 70 17 53 150 98.5 Cast Iron 49,782$ 2 5 5 5 15 30 E 986$ WA10002A P-71 Water Main - Bradley Street 1/1/1975 1975 8,655$ 4,703$ 3,952$ 70 32 38 150 79.5 Ductile Iron 40,180$ 5 5 5 5 15 75 M 796$ WA10002B P-82 Water Main - Bradley Street 1/1/1975 1975 11,268$ 6,123$ 5,145$ 70 32 38 150 103.5 Ductile Iron 52,309$ 5 5 5 5 15 75 M 1,036$ WA10003 P-81 Water Main - Doyle Street 1/1/1960 1960 7,566$ 5,734$ 1,832$ 70 17 53 100 178 Ductile Iron 89,962$ 4 5 5 5 15 60 M 1,782$ WA10004 P-49 Water Main - Dundalk Street 1/1/1960 1960 17,641$ 13,370$ 4,271$ 70 17 53 150 415 Ductile Iron 209,742$ 4 5 5 5 15 60 M 4,155$ WA10005 P-51 Water Main - Glenelg Street 1/1/1960 1960 6,652$ 5,041$ 1,611$ 70 17 53 100 156.5 Cast Iron 79,096$ 2 5 1 5 11 22 E 1,567$ WA10005A P-9 Water Main - Glenelg Street 1/1/1989 1989 31,366$ 10,764$ 20,602$ 70 46 24 150 120 Ductile Iron 60,648$ 6 5 1 5 11 66 M 1,202$ WA10006 P-44 Water Main - Gold Street 1/1/1960 1960 4,166$ 3,157$ 1,009$ 70 17 53 100 98 Ductile Iron 49,530$ 4 5 5 5 15 60 M 981$ WA10006A P-45 Water Main - Gold Street 1/1/1960 1960 8,778$ 6,653$ 2,125$ 70 17 53 100 206.5 Ductile Iron 104,366$ 4 5 5 5 15 60 M 2,068$ WA10007 P-50 Water Main - Grey Street 1/1/1960 1960 6,227$ 4,719$ 1,508$ 70 17 53 150 146.5 Ductile Iron 74,042$ 4 5 5 5 15 60 M 1,467$ WA10007A P-52 Water Main - Grey Street 1/1/1960 1960 4,421$ 3,351$ 1,070$ 70 17 53 150 104 Ductile Iron 52,562$ 4 5 5 5 15 60 M 1,041$ WA10007B P-53 Water Main - Grey Street 1/1/1960 1960 2,423$ 1,836$ 587$ 70 17 53 150 57 Ductile Iron 28,808$ 4 5 5 5 15 60 M 571$ WA10007C P-54 Water Main - Grey Street 1/1/1960 1960 2,168$ 1,643$ 525$ 70 17 53 150 51 Ductile Iron 25,776$ 4 5 5 5 15 60 M 511$ WA10007D P-70 Water Main - Grey Street 1/1/1960 1960 2,827$ 2,143$ 684$ 70 17 53 150 66.5 Ductile Iron 33,609$ 4 5 5 5 15 60 M 666$ WA10007E P-64 Water Main - Grey Street 1/1/1970 1970 3,727$ 2,292$ 1,435$ 70 27 43 100 111.5 Ductile Iron 28,176$ 5 5 5 5 15 75 M 558$ WA10008 P-135 Water Main - Hagan Street 1/1/1960 1960 8,757$ 6,637$ 2,120$ 70 17 53 150 206 Ductile Iron 104,113$ 4 5 5 5 15 60 M 2,063$ WA10009 P-83 Water Main - Holland Street 1/1/1960 1960 2,359$ 1,788$ 571$ 70 17 53 150 55.5 Ductile Iron 28,050$ 4 5 5 5 15 60 M 556$ WA10010A P-11 Water Main - Main Street 1/1/1960 1960 10,329$ 7,828$ 2,501$ 70 17 53 150 243 Ductile Iron 122,813$ 4 5 1 5 11 44 H 2,433$ WA10010B P-12 Water Main - Main Street 1/1/1960 1960 8,353$ 6,331$ 2,022$ 70 17 53 150 196.5 Ductile Iron 99,312$ 4 5 1 5 11 44 H 1,967$ WA10010C P-19 Water Main - Main Street 1/1/1960 1960 5,165$ 3,915$ 1,251$ 70 17 53 150 121.5 Ductile Iron 61,406$ 4 5 1 5 11 44 H 1,217$ WA10010D P-18 Water Main - Main Street 1/1/1960 1960 4,655$ 3,528$ 1,127$ 70 17 53 150 109.5 Ductile Iron 55,342$ 4 5 1 4 10 40 H 1,096$ WA10010E P-10 Water Main - Main Street 1/1/1960 1960 14,176$ 10,744$ 3,432$ 70 17 53 150 333.5 Ductile Iron 168,552$ 4 5 1 2 8 32 E 3,339$ WA10010F P-23 Water Main - Main Street 1/1/1960 1960 14,878$ 11,276$ 3,602$ 70 17 53 150 350 Ductile Iron 176,891$ 4 5 1 5 11 44 H 3,504$ WA10010G P-21 Water Main - Main Street 1/1/1960 1960 6,249$ 4,736$ 1,513$ 70 17 53 150 147 Ductile Iron 74,294$ 4 5 1 4 10 40 H 1,472$ WA10010H P-22 Water Main - Main Street 1/1/1960 1960 659$ 499$ 160$ 70 17 53 150 15.5 Ductile Iron 7,834$ 4 5 1 5 11 44 H 155$ WA10010I P-24 Water Main - Main Street 1/1/1960 1960 6,929$ 5,251$ 1,678$ 70 17 53 150 163 Ductile Iron 82,381$ 4 5 1 5 11 44 H 1,632$ WA10010J P-26 Water Main - Main Street 1/1/1960 1960 14,644$ 11,099$ 3,545$ 70 17 53 150 344.5 Ductile Iron 174,111$ 4 5 1 4 10 40 H 3,449$ WA10010K P-20 Water Main - Main Street 1/1/1960 1960 8,353$ 6,331$ 2,022$ 70 17 53 150 196.5 Ductile Iron 99,312$ 4 5 1 4 10 40 H 1,967$ WA10010L P-47 Water Main - Main Street 1/1/1960 1960 2,083$ 1,579$ 504$ 70 17 53 150 49 Ductile Iron 24,765$ 4 5 1 4 10 40 H 491$ WA10010M P-48 Water Main - Main Street 1/1/1960 1960 4,570$ 3,464$ 1,106$ 70 17 53 150 107.5 Ductile Iron 54,331$ 4 5 1 4 10 40 H 1,076$ WA10010N P-117 Water Main - Main Street 1/1/1960 1960 4,761$ 3,608$ 1,153$ 70 17 53 150 112 Ductile Iron 56,605$ 4 5 1 3 9 36 E 1,121$ WA10010O P-116 Water Main - Main Street 1/1/1960 1960 3,719$ 2,819$ 900$ 70 17 53 150 87.5 Ductile Iron 44,223$ 4 5 1 5 11 44 H 876$ WA10011 P-99 Water Main - Mill Street 1/1/1960 1960 6,440$ 4,881$ 1,559$ 70 17 53 150 251.5 Ductile Iron 76,569$ 4 5 5 5 15 60 M 1,517$ WA10012 P-35 Water Main - Osprey Street 1/1/1960 1960 5,335$ 4,043$ 1,292$ 70 17 53 150 125.5 Ductile Iron 63,428$ 4 5 1 5 11 44 H 1,257$ WA10012A P-66 Water Main - Osprey Street 1/1/1960 1960 8,310$ 6,298$ 2,012$ 70 17 53 150 195.5 Ductile Iron 98,806$ 4 5 1 5 11 44 H 1,957$ WA10012B P-65 Water Main - Osprey Street 1/1/1960 1960 8,990$ 6,813$ 2,177$ 70 17 53 150 211.5 Ductile Iron 106,893$ 4 5 1 5 11 44 H 2,118$ WA10012C P-69 Water Main - Osprey Street 1/1/1960 1960 4,272$ 3,238$ 1,034$ 70 17 53 150 100.5 Ductile Iron 50,793$ 4 5 1 5 11 44 H 1,006$ WA10013 P-67 Water Main - Owen Sound Street 1/1/1960 1960 2,806$ 2,127$ 679$ 70 17 53 100 66 Ductile Iron 33,357$ 4 5 5 5 15 60 M 661$ WA10013A P-68 Water Main - Owen Sound Street 1/1/1960 1960 6,185$ 4,688$ 1,497$ 70 17 53 150 145.5 Ductile Iron 73,536$ 4 5 5 5 15 60 M 1,457$ WA10013B P-107 Water Main - Owen Sound Street 1/1/1960 1960 3,146$ 2,384$ 762$ 70 17 53 150 74 Ductile Iron 37,400$ 4 5 5 5 15 60 M 741$ WA10013C P-108 Water Main - Owen Sound Street 1/1/1960 1960 2,380$ 1,804$ 576$ 70 17 53 150 56 Ductile Iron 28,303$ 4 5 5 5 15 60 M 561$ WA10014 P-41 Water Main - Proton Street 1/1/1960 1960 2,657$ 2,014$ 643$ 70 17 53 100 62.5 Ductile Iron 31,588$ 4 5 5 5 15 60 M 626$ WA10014A P-63 Water Main - Proton Street 1/1/1960 1960 4,952$ 3,753$ 1,199$ 70 17 53 150 116.5 Ductile Iron 58,879$ 4 5 5 5 15 60 M 1,166$ WA10014B P-57 Water Main - Proton Street 1/1/1960 1960 1,190$ 902$ 288$ 70 17 53 150 28 Ductile Iron 14,151$ 4 5 5 5 15 60 M 280$ WA10014C P-61 Water Main - Proton Street 1/1/1960 1960 8,948$ 6,782$ 2,166$ 70 17 53 150 210.5 Ductile Iron 106,387$ 4 5 5 5 15 60 M 2,108$ WA10014D P-62 Water Main - Proton Street 1/1/1960 1960 3,741$ 2,835$ 906$ 70 17 53 150 88 Ductile Iron 44,475$ 4 5 5 5 15 60 M 881$ WA10015 P-37 Water Main - Rowe's Lane 1/1/1960 1960 3,826$ 2,900$ 926$ 70 17 53 100 90 Ductile Iron 45,486$ 4 5 5 5 15 60 M 901$ WA10016 P-56 Water Main - Toronto Street 1/1/1960 1960 3,826$ 2,900$ 926$ 70 17 53 150 105 Ductile Iron 45,486$ 4 5 5 5 15 60 M 901$ WA10017 P-30 Water Main - Victoria Street 1/1/1960 1960 14,941$ 11,324$ 3,617$ 70 17 53 150 351.5 Ductile Iron 177,649$ 4 5 1 5 11 44 H 3,519$ WA10017A P-34 Water Main - Victoria Street 1/1/1960 1960 5,845$ 4,430$ 1,415$ 70 17 53 150 137.5 Ductile Iron 69,493$ 4 5 1 5 11 44 H 1,377$ WA10017B P-38 Water Main - Victoria Street 1/1/1960 1960 638$ 484$ 154$ 70 17 53 150 15 Ductile Iron 7,581$ 4 5 1 5 11 44 H 150$ WA10017C P-40 Water Main -Victoria Street 1/1/1960 1960 4,633$ 3,511$ 1,122$ 70 17 53 150 109 Ductile Iron 55,089$ 4 5 1 5 11 44 H 1,091$ WA10017D P-36 Water Main -Victoria Street 1/1/1960 1960 3,188$ 2,416$ 772$ 70 17 53 150 75 Ductile Iron 37,905$ 4 5 1 5 11 44 H 751$ WA10017E P-32 Water Main - Victoria Street 1/1/1960 1960 9,394$ 7,120$ 2,274$ 70 17 53 150 221 Ductile Iron 111,694$ 4 5 1 5 11 44 H 2,213$ WA10017F P-86 Water Main - Victoria Street 1/1/1960 1960 829$ 628$ 201$ 70 17 53 150 19.5 Ductile Iron 9,855$ 4 5 1 5 11 44 H 195$ WA10017G P-87 Water Main - Victoria Street 1/1/1960 1960 7,290$ 5,525$ 1,765$ 70 17 53 150 171.5 Ductile Iron 86,677$ 4 5 1 5 11 44 H 1,717$ WA10017H P-104 Water Main - Victoria Street 1/1/1960 1960 4,548$ 3,447$ 1,101$ 70 17 53 150 107 Ductile Iron 54,078$ 4 5 1 5 11 44 H 1,071$ WA10017I P-105 Water Main - Victoria Street 1/1/1960 1960 3,656$ 2,771$ 885$ 70 17 53 150 86 Ductile Iron 43,465$ 4 5 1 5 11 44 H 861$ WA10017J P-91 Water Main - Victoria Street 1/1/1960 1960 6,376$ 4,832$ 1,544$ 70 17 53 150 150 Ductile Iron 75,810$ 4 5 1 5 11 44 H 1,502$ WA10017K P-125 Water Main - Victoria Street 1/1/1960 1960 1,700$ 1,288$ 412$ 70 17 53 150 40 Ductile Iron 20,216$ 4 5 1 5 11 44 H 401$ WA10017L P-126 Water Main - Victoria Street 1/1/1960 1960 2,359$ 1,788$ 571$ 70 17 53 150 55.5 Ductile Iron 28,050$ 4 5 1 5 11 44 H 556$ WA10017M P-16 Water Main - Victoria Street 1/1/1960 1960 5,058$ 3,833$ 1,225$ 70 17 53 150 334 Ductile Iron 60,143$ 4 5 1 5 11 44 H 1,192$ WA10017N P-125a Water Main - Victoria Street 1/1/1989 1989 26,923$ 9,239$ 17,684$ 70 46 24 Ductile Iron 52,057$ 6 5 1 5 11 66 M 1,031$ WA10017O P-125b Water Main - Victoria Street 1/1/1989 1989 29,275$ 10,046$ 19,229$ 70 46 24 Ductile Iron 56,605$ 6 5 1 5 11 66 M 1,121$ WA10019A P-43 Water Main - Young Street 1/1/1960 1960 6,227$ 4,719$ 1,508$ 70 17 53 150 146.5 Ductile Iron 74,042$ 4 5 5 5 15 60 M 1,467$ WA10019B P-134 Water Main - Young Street 1/1/1960 1960 2,827$ 2,143$ 684$ 70 17 53 200 72.5 Ductile Iron 33,609$ 4 5 5 5 15 60 M 666$ WA10020 P-97 Water Main - McDowell Street 1/1/1979 1979 6,527$ 3,173$ 3,354$ 70 36 34 150 53 Ductile Iron 26,786$ 5 5 5 5 15 75 M 531$ WA10020A P-114 Water Main - McDowell Street 1/1/1979 1979 20,811$ 10,118$ 10,693$ 70 36 34 150 169 Ductile Iron 85,413$ 5 5 5 5 15 75 M 1,692$ WA10020B P-113 Water Main - McDowell Street 1/1/1979 1979 3,694$ 1,796$ 1,898$ 70 36 34 150 30 Ductile Iron 15,162$ 5 5 5 5 15 75 M 300$ WA10021 P-74 Water Main - Pine Court 1/1/1975 1975 12,411$ 6,744$ 5,667$ 70 32 38 150 114 Ductile Iron 57,616$ 5 5 5 5 15 75 M 1,141$ WA10022 P-133 Water Main - Trim Trends Service 1/1/1975 1975 8,457$ 4,595$ 3,862$ 70 32 38 150 8 Ductile Iron 37,877$ 5 5 1 4 10 50 H 750$ WA10023 P-128 Water Main - Well No. 3 1/1/1975 1975 3,919$ 2,130$ 1,790$ 70 32 38 75 36 Ductile Iron 18,195$ 5 5 1 5 11 55 H 360$
Total Accumulated Depreciation at
December 31, 2012Net Book Value
Est. Replacement Cost
2013
Total Risk of Asset Failure
Risk of FailureAsset Life
ExpectancyAge
Dia. (mm)
Length (m)
Pipe Material
Consequence of Failure
Asset Number Label DescriptionAcquisition
DateAcquisition
CostAcquisition
Year
Inflated Contributions
Based on Useful Life
Remaining Useful Life
Watson & Associates Economists Ltd H:\Southgate\2013 AM\Southgate AM Inventory Model FINAL.xlsx
A-11

Township of Southgate2013 Asset Management PlanWatermains
Probability of Failure
Condition Rating
Hydraulic Capacity
Trunk vs. Local
Serviced Land Use
Total Consequence of
Failure
Total Accumulated Depreciation at
December 31, 2012Net Book Value
Est. Replacement Cost
2013
Total Risk of Asset Failure
Risk of FailureAsset Life
ExpectancyAge
Dia. (mm)
Length (m)
Pipe Material
Consequence of Failure
Asset Number Label DescriptionAcquisition
DateAcquisition
CostAcquisition
Year
Inflated Contributions
Based on Useful Life
Remaining Useful Life
WA10023A P-95 Water Main - Well No. 3 1/1/1975 1975 6,532$ 3,549$ 2,983$ 70 32 38 150 60 Ductile Iron 30,324$ 5 5 1 5 11 55 H 601$ WA10023B P-94 Water Main - Well No. 3 1/1/1975 1975 1,470$ 799$ 671$ 70 32 38 150 13.5 Ductile Iron 6,823$ 5 5 1 5 11 55 H 135$ WA10023C P-130 Water Main - Well No. 3 1/1/1975 1975 1,089$ 592$ 497$ 70 32 38 150 126 Ductile Iron 5,054$ 5 5 1 5 11 55 H 100$ WA10023D P-131 Water Main - Well No. 3 1/1/1975 1975 1,361$ 740$ 621$ 70 32 38 150 10 Ductile Iron 6,318$ 5 5 1 5 11 55 H 125$ WA10023E P-132 Water Main - Well No. 3 1/1/1975 1975 871$ 473$ 398$ 70 32 38 150 12.5 Ductile Iron 4,043$ 5 5 1 5 11 55 H 80$ WA10023F P-122 Water Main - Well No. 3 1/1/1975 1975 2,667$ 1,449$ 1,218$ 70 32 38 250 24.5 Ductile Iron 13,217$ 5 5 1 5 11 55 H 262$ WA10023G P-120 Water Main - Well No. 3 1/1/1975 1975 2,737$ 1,487$ 1,250$ 70 32 38 250 22 Ductile Iron 11,868$ 5 5 1 5 11 55 H 235$ WA10023H P-124 Water Main - Well No. 3 1/1/1975 1975 1,804$ 980$ 824$ 70 32 38 250 14.5 Ductile Iron 7,822$ 5 5 1 5 11 55 H 155$ WA10023I P-123 Water Main - Well No. 3 1/1/1975 1975 2,986$ 1,623$ 1,363$ 70 32 38 250 24 Ductile Iron 12,947$ 5 5 1 5 11 55 H 257$ WA10023J P-110 Water Main - Well No. 3 1/1/1975 1975 3,733$ 2,028$ 1,705$ 70 32 38 250 30 Ductile Iron 16,184$ 5 5 1 5 11 55 H 321$ WA10025 P-98 Water Main - Braemore Street 1/1/1979 1979 15,455$ 7,514$ 7,941$ 70 36 34 150 125.5 Ductile Iron 63,428$ 5 5 5 5 15 75 M 1,257$ WA10026 P-33 Water Main - Elm Street 1/1/1979 1979 4,187$ 2,036$ 2,151$ 70 36 34 100 34 Ductile Iron 17,184$ 5 5 5 5 15 75 M 340$ WA10027 P-136 Water Main - Keppel Street 1/1/1979 1979 22,104$ 10,747$ 11,357$ 70 36 34 150 179.5 Ductile Iron 90,720$ 5 5 5 4 14 70 M 1,797$ WA10028 P-4 Water Main - Hanbury Street 1/1/1989 1989 39,862$ 13,679$ 26,183$ 70 46 24 150 152.5 Ductile Iron 77,074$ 6 5 5 4 14 84 M 1,527$ WA10029 P-5 Water Main - Bell Circle 1/1/1989 1989 52,539$ 18,029$ 34,510$ 70 46 24 150 201 Ductile Iron 101,586$ 6 5 1 4 10 60 M 2,013$ WA10030 P-73 Water Main - Highpoint Street 1/1/1989 1989 21,303$ 7,310$ 13,993$ 70 46 24 150 81.5 Ductile Iron 41,190$ 6 5 1 5 11 66 M 816$ WA10030A P-75 Water Main - Highpoint Street (Stream Crossing) 1/1/1989 1989 21,172$ 7,265$ 13,907$ 70 46 24 150 81 Ductile Iron 40,938$ 6 5 1 5 11 66 M 811$ WA10030B P-78 Water Main - Highpoint Street 1/1/1989 1989 9,541$ 3,274$ 6,267$ 70 46 24 150 36.5 Ductile Iron 18,447$ 6 5 1 5 11 66 M 365$ WA10030C P-79 Water Main - Highpoint Street 1/1/1989 1989 21,434$ 7,355$ 14,079$ 70 46 24 150 82 Ductile Iron 41,443$ 6 5 1 5 11 66 M 821$ WA10031 P-2 Water Main - Ida Street 1/1/1989 1989 32,543$ 11,167$ 21,376$ 70 46 24 150 124.5 Ductile Iron 62,923$ 6 5 1 5 11 66 M 1,247$ WA10031A P-3 Water Main - Ida Street 1/1/1989 1989 38,816$ 13,320$ 25,496$ 70 46 24 150 148.5 Ductile Iron 75,052$ 6 5 1 5 11 66 M 1,487$ WA10031B P-7 Water Main - Ida Street 1/1/1989 1989 10,063$ 3,453$ 6,610$ 70 46 24 150 38.5 Ductile Iron 19,458$ 6 5 1 5 11 66 M 385$ WA10031C P-8 Water Main - Ida Street 1/1/1989 1989 152,519$ 52,339$ 100,180$ 70 46 24 150 583.5 Ductile Iron 294,903$ 6 5 1 5 11 66 M 5,842$ WA10031D Water Main - Ida Street South To Eco Parkway 12/31/2008 2008 272,637$ 15,595$ 257,042$ 70 65 5 Ductile Iron 264,755$ 7 5 1 4 10 70 M 5,245$ WA10032 P-6 Water Main - Morrow Circle 1/1/1989 1989 16,990$ 5,830$ 11,160$ 70 46 24 150 65 Ductile Iron 32,851$ 6 5 5 4 14 84 M 651$ WA10033 P-29 Water Main - Russell Lane 1/1/1989 1989 32,804$ 11,257$ 21,547$ 70 46 24 150 125.5 Ductile Iron 63,428$ 6 5 1 5 11 66 M 1,257$ WA10034 P-76 Water Main - Wilson Crescent 1/1/1989 1989 48,226$ 16,549$ 31,677$ 70 46 24 150 184.5 Ductile Iron 93,247$ 6 5 5 5 15 90 M 1,847$ WA10034A P-77 Water Main - Wilson Cresc 1/1/1989 1989 27,707$ 9,508$ 18,199$ 70 46 24 150 106 Ductile Iron 53,573$ 6 5 5 5 15 90 M 1,061$ WA10035 P-106 Water Main - Nixon Street 1/1/1995 1995 24,719$ 6,362$ 18,357$ 70 52 18 150 91 Ductile Iron 45,992$ 6 5 5 5 15 90 M 911$ WA10037 P-112 Water Main - Braemore West 1/1/2000 2000 33,027$ 6,139$ 26,888$ 70 57 13 150 104 Ductile Iron 52,562$ 7 5 5 5 15 105 M 1,041$ WA10038 Water Main - Eco Parkway 12/31/2008 2008 44,287$ 2,533$ 41,754$ 70 65 5 Ductile Iron 43,007$ 7 5 1 4 10 70 M 852$ WA10038 Water Main - Eco Parkway 12/31/2009 2009 44,287$ 2,533$ 41,754$ 70 66 4 Ductile Iron 28,614$ 8 5 1 4 10 80 M 567$
P-27 Water Main - Sinclair Street 1993 1993 70 50 20 150 181 Ductile Iron 91,479$ 6 5 5 5 15 90 M 1,812$ P-28 Water Main - Sheffield Street 1993 1993 70 50 20 150 450 Ductile Iron 227,435$ 6 5 5 5 15 90 M 4,506$ P-80 Water Main - McGregor Court 1989 1990 70 47 24 Ductile Iron 46,497$ 6 5 5 5 15 90 M 921$
Watson & Associates Economists Ltd H:\Southgate\2013 AM\Southgate AM Inventory Model FINAL.xlsx
A-12

Township of Southgate2013 Asset Management PlanWater Facilities
Historic Maintenance
Cost
Freq. Facility Off-Line
Standby Power
Total Condition
Rating
Likelihood ofFailure
Severity of Failure
Total Consquence
of Failure
15 10 150 Max
1,679,069$ 215,502$ 1,463,567$ 1,478,585$
WA11000 Well #D4 - Pumphouse And Equipment Process Equipment Well #D4 - Pumphouse And Equipment Lt. 230, Conc. 1 1/1/2006 30 23 7 756,706 101,624 655,081 50 195,617 3 3 5 11 3 3 6 66 HWA11000 Well #D4 - Pumphouse And Equipment Process Electrical Well #D4 - Pumphouse And Equipment Lt. 230, Conc. 1 1/1/2006 40 33 7 114,110 3 3 5 11 3 3 6 66 HWA11000 Well #D4 - Pumphouse And Equipment Process Instrumentation Well #D4 - Pumphouse And Equipment Lt. 230, Conc. 1 1/1/2006 20 13 7 57,055 3 3 5 11 3 3 6 66 HWA11000 Well #D4 - Pumphouse And Equipment Process Piping Well #D4 - Pumphouse And Equipment Lt. 230, Conc. 1 1/1/2006 50 43 7 65,206 5 3 5 13 3 3 6 78 MWA11000 Well #D4 - Pumphouse And Equipment Building & Process Structural Well #D4 - Pumphouse And Equipment Lt. 230, Conc. 1 1/1/2006 60 53 7 195,617 5 3 5 13 5 1 6 78 MWA11000 Well #D4 - Pumphouse And Equipment Building Architectural Well #D4 - Pumphouse And Equipment Lt. 230, Conc. 1 1/1/2006 20 13 7 73,356 5 3 5 13 5 3 8 104 MWA11000 Well #D4 - Pumphouse And Equipment Building Services Well #D4 - Pumphouse And Equipment Lt. 230, Conc. 1 1/1/2006 20 13 7 114,110 5 3 5 13 5 3 8 104 MWA11001 Well #D3 Pumphouse & Equipment Process Equipment Well #D3 Pumphouse & Equipment Lt. 232, Conc. 2 1/1/2007 30 24 6 819,364 85,040 734,324 50 119,488 3 1 5 9 3 3 6 54 HWA11001 Well #D3 Pumphouse & Equipment Process Electrical Well #D3 Pumphouse & Equipment Lt. 232, Conc. 2 1/1/2007 40 34 6 69,701 3 1 5 9 3 3 6 54 HWA11001 Well #D3 Pumphouse & Equipment Process Instrumentation Well #D3 Pumphouse & Equipment Lt. 232, Conc. 2 1/1/2007 20 14 6 34,851 3 1 5 9 3 3 6 54 HWA11001 Well #D3 Pumphouse & Equipment Process Piping Well #D3 Pumphouse & Equipment Lt. 232, Conc. 2 1/1/2007 50 44 6 39,829 5 1 5 9 3 3 6 54 HWA11001 Well #D3 Pumphouse & Equipment Building & Process Structural Well #D3 Pumphouse & Equipment Lt. 232, Conc. 2 1/1/2007 60 54 6 119,488 5 5 5 15 5 1 6 90 MWA11001 Well #D3 Pumphouse & Equipment Building Architectural Well #D3 Pumphouse & Equipment Lt. 232, Conc. 2 1/1/2007 20 14 6 44,808 5 5 5 15 5 3 8 120 LWA11001 Well #D3 Pumphouse & Equipment Building Services Well #D3 Pumphouse & Equipment Lt. 232, Conc. 2 1/1/2007 20 14 6 69,701 5 5 5 15 5 3 8 120 LWA11002 Water Holding Tank Equipment - Reservoir @ Well #3 Process Equipment Water Holding Tank Equipment - Reservoir @ Well #3 Lt. 232, Conc. 2 11/1/1997 30 14 16 103,000 28,838 74,162 50 16,565 3 3 5 11 5 1 6 66 HWA11002 Water Holding Tank Equipment - Reservoir @ Well #3 Process Electrical Water Holding Tank Equipment - Reservoir @ Well #3 Lt. 232, Conc. 2 11/1/1997 40 24 16 3,313 3 3 5 11 5 1 6 66 HWA11002 Water Holding Tank Equipment - Reservoir @ Well #3 Process Instrumentation Water Holding Tank Equipment - Reservoir @ Well #3 Lt. 232, Conc. 2 11/1/1997 20 4 16 1,656 3 3 5 11 5 1 6 66 HWA11002 Water Holding Tank Equipment - Reservoir @ Well #3 Process Piping Water Holding Tank Equipment - Reservoir @ Well #3 Lt. 232, Conc. 2 11/1/1997 50 34 16 8,282 5 3 5 13 5 1 6 78 MWA11002 Water Holding Tank Equipment - Reservoir @ Well #3 Building & Process Structural Water Holding Tank Equipment - Reservoir @ Well #3 Lt. 232, Conc. 2 11/1/1997 60 44 16 134,176 5 5 5 15 5 1 6 90 MWA11002 Water Holding Tank Equipment - Reservoir @ Well #3 Building Architectural Water Holding Tank Equipment - Reservoir @ Well #3 Lt. 232, Conc. 2 11/1/1997 20 4 16 - 5 5 5 15 5 1 6 90 MWA11002 Water Holding Tank Equipment - Reservoir @ Well #3 Building Services Water Holding Tank Equipment - Reservoir @ Well #3 Lt. 232, Conc. 2 11/1/1997 20 4 16 1,656 5 5 5 15 5 1 6 90 M
Asset ID Asset ComponentTotal Risk of Asset Failure
Risk of FailureAssigned Name
Condition Rating Consequence of Failure
LocationIn Service
DateUseful Life
Remaining Useful Life
AgeAcqusition
CostAsset Life
Expextancy
Est. Replacement
Cost 2013
Total Accumulated Depreciation at
December 31, 2012Net Book Value
Watson & Associates Economists Ltd H:\Southgate\2013 AM\Southgate AM Inventory Model FINAL.xlsx
A-13

Township of Southgate2013 Asset Management PlanSanitary Sewer Mains
Probability of Failure
Condition Rating
Hydraulic Capacity
Trunk Vs. Local
Gravity Or Forcemain
Serviced Land Use
Total Consequence of
Failure
9 20 180 Max
14,244,539$
CO-1 Concrete Easement to Lagoons 94.8 600 MH-1 MH-2 1970 70 27 43 65,412$ 5 5 1 5 5 16 Average 80 MCO-2 Concrete Easement to Lagoons 110.9 600 MH-2 MH-3 1970 70 27 43 76,521$ 5 5 1 5 5 16 Average 80 MCO-3 Concrete Easement to Lagoons 111.9 600 MH-3 MH-4 1970 70 27 43 77,211$ 5 5 1 5 5 16 Average 80 MCO-4 Concrete Easement to Lagoons 104.5 600 MH-4 MH-5 1970 70 27 43 72,105$ 5 5 1 5 5 16 Average 80 MCO-5 Concrete Easement to Lagoons 99.4 600 MH-5 MH-6 1970 70 27 43 68,586$ 5 5 1 5 5 16 Average 80 MCO-6 Concrete Easement to Lagoons 104.5 600 MH-6 MH-7 1970 70 27 43 72,105$ 5 5 1 5 5 16 Average 80 MCO-7 Concrete Easement to Lagoons 102.7 600 MH-7 MH-8 1970 70 27 43 70,683$ 5 5 1 5 5 16 Average 80 MCO-8 Concrete Easement to Lagoons 92.7 600 MH-8 MH-9 1970 70 27 43 63,963$ 5 5 1 5 5 16 Average 80 MCO-10 Concrete Easement to Lagoons 79.9 600 MH-10 MH-11 1970 70 27 43 55,131$ 5 5 1 5 5 16 Average 80 MCO-11 Concrete Hagan St 120.1 500 MH-11 MH-12 1970 70 27 43 164,537$ 5 5 1 5 5 16 Average 80 MCO-12 Concrete Hagan St 128 500 MH-12 MH-13 1970 70 27 43 175,360$ 5 5 1 5 5 16 Average 80 MCO-13 Concrete Young St 65.5 500 MH-13 MH-14 1970 70 27 43 89,735$ 5 5 1 5 5 16 Average 80 MCO-14 Concrete Young St 75 500 MH-14 MH-83 1970 70 27 43 102,750$ 5 5 1 5 5 16 Average 80 MCO-15 Concrete Young St 73.5 500 MH-83 MH-15 1970 70 27 43 100,695$ 5 5 1 5 5 16 Average 80 MCO-16 Concrete Easement to Lagoons 110.1 600 MH-1 WASTE STABILIZATION PONDS 1970 70 27 43 75,969$ 5 5 1 5 5 16 Average 80 MCO-17 Concrete Victoria St 93.3 400 MH-15 MH-16 1970 70 27 43 123,156$ 5 5 1 5 4 15 Average 75 MCO-18 Concrete Victoria St 97.5 400 MH-16 MH-17 1970 70 27 43 128,700$ 5 5 1 5 4 15 Average 75 MCO-19 Concrete Victoria St 107.3 350 MH-17 MH-18 1970 70 27 43 134,125$ 5 5 1 5 5 16 Average 80 MCO-20 Concrete Victoria St 93 350 MH-18 MH-19 1970 70 27 43 32,550$ 5 5 1 5 5 16 Average 80 MCO-21 Asbestos Cement Victoria St 122.5 300 MH-19 MH-20 1970 70 27 43 150,675$ 3 5 1 5 5 16 Poor 48 HCO-22 Asbestos Cement Victoria St 121.6 300 MH-20 MH-21 1970 70 27 43 149,568$ 3 5 1 5 5 16 Poor 48 HCO-23 Asbestos Cement Victoria St 111.9 250 MH-21 MH-22 1970 70 27 43 134,840$ 3 5 1 5 5 16 Poor 48 HCO-24 Asbestos Cement Victoria St 121 200 MH-22 MH-23 1970 70 27 43 142,780$ 3 5 5 5 5 20 Poor 60 MCO-25 Asbestos Cement Victoria St 117 200 MH-23 MH-24 1970 70 27 43 138,060$ 3 5 5 5 5 20 Poor 60 MCO-26 Asbestos Cement Alice St 121 250 MH-22 MH-25 1970 70 27 43 145,805$ 3 5 1 5 5 16 Poor 48 HCO-27 Asbestos Cement Main St 111.9 250 MH-25 MH-26 1970 70 27 43 134,840$ 3 5 1 5 5 16 Poor 48 HCO-28 Asbestos Cement Main St 116.4 250 MH-26 MH-27 1970 70 27 43 140,262$ 3 5 1 5 5 16 Poor 48 HCO-29 Asbestos Cement Main St 111.9 250 MH-27 MH-28 1970 70 27 43 134,840$ 3 5 1 5 5 16 Poor 48 HCO-30 Asbestos Cement Main St 56.7 250 MH-28 MH-88 1970 70 27 43 68,324$ 3 5 1 5 5 16 Poor 48 HCO-31 Asbestos Cement Main St 106.7 250 MH-88 MH-29 1970 70 27 43 128,574$ 3 5 1 5 5 16 Poor 48 HCO-32 Asbestos Cement Main St 107.3 250 MH-29 MH-30 1970 70 27 43 129,297$ 3 5 1 5 3 14 Poor 42 HCO-33 Asbestos Cement Main St 117 250 MH-30 MH-31 1970 70 27 43 140,985$ 3 5 1 5 4 15 Poor 45 HCO-34 Asbestos Cement Main St 128 250 MH-31 MH-32 1970 70 27 43 154,240$ 3 5 1 5 4 15 Poor 45 HCO-35 Asbestos Cement Gold St 86.6 200 MH-33 MH-14 1970 70 27 43 102,188$ 3 5 5 5 5 20 Poor 60 MCO-36 Asbestos Cement Victoria St 72.5 200 MH-15 MH-34 1980 70 37 33 85,550$ 3 5 5 5 5 20 Poor 60 MCO-38 Asbestos Cement Victoria St 122.5 200 MH-35 MH-36 1980 70 37 33 144,550$ 3 5 5 5 5 20 Poor 60 MCO-39 Asbestos Cement Victoria St 121 200 MH-36 MH-37 1980 70 37 33 142,780$ 3 5 5 5 5 20 Poor 60 MCO-40 Asbestos Cement Young St 121 300 MH-15 MH-38 1970 70 37 33 148,830$ 3 5 1 5 4 15 Poor 45 HCO-41 Asbestos Cement Main St 49.1 200 MH-38 MH-39 1970 70 27 43 57,938$ 3 5 5 5 4 19 Poor 57 HCO-42 Asbestos Cement Main St 39.9 200 MH-39 MH-40 1970 70 27 43 47,082$ 3 5 5 5 4 19 Poor 57 HCO-44 Asbestos Cement Main St 42.7 200 MH-41 MH-42 1970 70 27 43 50,386$ 3 5 5 5 4 19 Poor 57 HCO-45 Asbestos Cement Main St 111.9 250 MH-42 MH-43 1970 70 27 43 134,840$ 3 5 1 5 4 15 Poor 45 HCO-47 Asbestos Cement Main St 103.3 200 MH-44 MH-45 1970 70 27 43 121,894$ 3 5 5 5 4 19 Poor 57 HCO-48 Asbestos Cement Main St 80.2 250 MH-45 MH-46 1970 70 27 43 96,641$ 3 5 5 5 4 19 Poor 57 HCO-49 Asbestos Cement Main St 91.7 250 MH-46 MH-47 1970 70 27 43 110,499$ 3 5 5 5 4 19 Poor 57 HCO-50 Asbestos Cement Main St 75.6 250 MH-47 MH-48 1970 70 27 43 91,098$ 3 5 5 5 4 19 Poor 57 HCO-51 Asbestos Cement Main St 93.6 250 MH-48 MH-49 1970 70 27 43 112,788$ 3 5 5 5 4 19 Poor 57 HCO-52 Asbestos Cement Main St 100 300 MH-38 MH-50 1970 70 27 43 123,000$ 3 5 5 5 4 19 Poor 57 HCO-53 Asbestos Cement Main St 97.5 300 MH-50 MH-51 1970 70 27 43 119,925$ 3 5 5 5 4 19 Poor 57 HCO-54 Asbestos Cement Main St 120.1 200 MH-51 MH-52 1970 70 27 43 141,718$ 3 5 5 5 5 20 Poor 60 MCO-55 Asbestos Cement Main St 121.6 200 MH-52 MH-53 1970 70 27 43 143,488$ 3 5 5 5 5 20 Poor 60 MCO-56 Asbestos Cement Main St 127.1 150 MH-53 MH-54 1970 70 27 43 143,623$ 3 5 5 5 2 17 Poor 51 HCO-57 Asbestos Cement Dundalk St 93 200 MH-39 MH-55 1970 70 27 43 109,740$ 3 5 5 5 3 18 Poor 54 HCO-58 Asbestos Cement Dundalk St 101.5 200 MH-55 MH-56 1970 70 27 43 119,770$ 3 5 5 5 3 18 Poor 54 HCO-59 Asbestos Cement Dundalk St 114.9 200 MH-56 MH-57 1970 70 27 43 135,582$ 3 5 5 5 3 18 Poor 54 HCO-60 Asbestos Cement Dundalk St 111.6 200 MH-57 MH-58 1970 70 27 43 131,688$ 3 5 5 5 3 18 Poor 54 HCO-61 Asbestos Cement Glenelg St 149.4 200 MH-58 MH-59 1970 70 27 43 176,292$ 3 5 5 5 5 20 Poor 60 MCO-62 Asbestos Cement Grey St 79.2 200 MH-58 MH-61 1970 70 27 43 93,456$ 3 5 5 5 3 18 Poor 54 HCO-63 Asbestos Cement Grey St 68.9 200 MH-61 MH-60 1970 70 27 43 81,302$ 3 5 5 5 3 18 Poor 54 HCO-64 Asbestos Cement Proton St 121.6 250 MH-42 MH-62 1970 70 27 43 146,528$ 3 5 5 5 5 20 Poor 60 MCO-65 Asbestos Cement Proton St 116.7 250 MH-62 MH-63 1970 70 27 43 140,624$ 3 5 5 5 4 19 Poor 57 HCO-66 Asbestos Cement Proton St 95.4 250 MH-63 MH-64 1970 70 27 43 114,957$ 3 5 5 5 5 20 Poor 60 MCO-67 Asbestos Cement Proton St 113.4 250 MH-64 MH-65 1970 70 27 43 136,647$ 3 5 5 5 5 20 Poor 60 MCO-68 Asbestos Cement Artemesia St 100 200 MH-66 MH-18 1970 70 27 43 118,000$ 3 5 5 5 5 20 Poor 60 MCO-69 Asbestos Cement Artemesia St 79.2 250 MH-43 MH-67 1970 70 27 43 95,436$ 3 5 5 5 5 20 Poor 60 MCO-70 Asbestos Cement Artemesia St 82.3 250 MH-67 MH-68 1970 70 27 43 99,172$ 3 5 5 5 5 20 Poor 60 MCO-71 Asbestos Cement Artemesia St 106.1 200 MH-68 MH-69 1970 70 27 43 125,198$ 3 5 5 5 5 20 Poor 60 MCO-72 Asbestos Cement Artemesia St 100.3 200 MH-69 MH-70 1970 70 27 43 118,354$ 3 5 5 5 5 20 Poor 60 M
Total Risk of Asset Failure
Risk of Failure
Label Structure Type Street / Location Length (m)Diameter
(mm)Start Node Stop Node
Consequence of FailureAsset
ConditionAcquisition
DateAsset Life
ExpectancyRemaining Useful Life
AgeEst. Replacement
Cost $2013
Watson & Associates Economists Ltd H:\Southgate\2013 AM\Southgate AM Inventory Model FINAL.xlsx
A-14

Township of Southgate2013 Asset Management PlanSanitary Sewer Mains
Probability of Failure
Condition Rating
Hydraulic Capacity
Trunk Vs. Local
Gravity Or Forcemain
Serviced Land Use
Total Consequence of
Failure
9 20 180 Max
Total Risk of Asset Failure
Risk of Failure
Label Structure Type Street / Location Length (m)Diameter
(mm)Start Node Stop Node
Consequence of FailureAsset
ConditionAcquisition
DateAsset Life
ExpectancyRemaining Useful Life
AgeEst. Replacement
Cost $2013
CO-73 Asbestos Cement Artemesia St 110.3 200 MH-70 MH-71 1970 70 27 43 130,154$ 3 5 5 5 5 20 Poor 60 MCO-74 Asbestos Cement Grey St 52.7 200 MH-71 MH-72 1970 70 27 43 62,186$ 3 5 5 5 5 20 Poor 60 MCO-75 Asbestos Cement Grey St 57.6 200 MH-71 MH-73 1970 70 27 43 67,968$ 3 5 5 5 5 20 Poor 60 MCO-76 Asbestos Cement Owen Sound St 15.8 200 MH-47 MH-74 1970 70 27 43 18,644$ 3 5 5 5 3 18 Poor 54 HCO-77 Asbestos Cement Owen Sound St 116.4 200 MH-74 MH-75 1970 70 27 43 137,352$ 3 5 5 5 5 20 Poor 60 MCO-78 Asbestos Cement Owen Sound St 107.9 200 MH-75 MH-76 1970 70 27 43 127,322$ 3 5 5 5 5 20 Poor 60 MCO-79 Asbestos Cement Owen Sound St 75 200 MH-76 MH-77 1970 70 27 43 88,500$ 3 5 5 5 5 20 Poor 60 MCO-80 Asbestos Cement Owen Sound St 68.3 200 MH-77 MH-68 1970 70 27 43 80,594$ 3 5 5 5 5 20 Poor 60 MCO-81 Asbestos Cement Owen Sound St 107.3 200 MH-68 MH-78 1970 70 27 43 126,614$ 3 5 5 5 5 20 Poor 60 MCO-82 Asbestos Cement Osprey St 134.7 200 MH-79 MH-80 1970 70 27 43 158,946$ 3 5 5 5 5 20 Poor 60 MCO-83 Asbestos Cement Toronto St 113.4 200 MH-80 MH-69 1970 70 27 43 133,812$ 3 5 5 5 5 20 Poor 60 MCO-84 Asbestos Cement Toronto St 69.8 200 MH-69 MH-81 1970 70 27 43 82,364$ 3 5 5 5 5 20 Poor 60 MCO-85 Asbestos Cement Mill St 113.4 250 MH-49 MH-82 1980 70 37 33 136,647$ 3 5 5 5 5 20 Poor 60 MCO-90 Asbestos Cement Osprey St 167.3 200 MH-80 MH-84 1970 70 27 43 197,414$ 3 5 5 5 5 20 Poor 60 MCO-91 Asbestos Cement Easement Bradley to Osprey 12.8 200 MH-84 MH-85 1970 70 27 43 15,104$ 3 5 5 5 5 20 Poor 60 MCO-92 Asbestos Cement Easement Bradley to Osprey 72.2 200 MH-85 MH-86 1970 70 27 43 85,196$ 3 5 5 5 5 20 Poor 60 MCO-93 Asbestos Cement Bradley St 148.4 200 MH-86 MH-87 1975 70 32 38 175,112$ 3 5 5 5 5 20 Poor 60 MCO-94 Asbestos Cement Osprey St 121 250 MH-45 MH-19 1970 70 27 43 145,805$ 3 5 1 5 5 16 Poor 48 HCO-95 Asbestos Cement Proton St 126.2 250 MH-42 MH-17 1970 70 27 43 152,071$ 3 5 5 5 5 20 Poor 60 MCO-96 Asbestos Cement Morrow Circle 54.9 200 MH-3 (DIP) MH-2 (DIP) 1990 70 47 23 64,782$ 4 5 5 5 4 19 Average 76 MCO-99 PVC Hanbury St 72.5 250 MH-2 (DIP) MH-4 (DIP) 1990 70 47 23 87,363$ 7 5 5 5 4 19 Good 133 LCO-100 PVC Hanbury St 72.8 250 MH-4 (DIP) MH-5 (DIP) 1990 70 47 23 87,724$ 7 5 5 5 4 19 Good 133 LCO-101 PVC Bell Circle 46.6 250 MH-5 (DIP) MH-6 (DIP) 1990 70 47 23 56,153$ 7 5 5 5 4 19 Good 133 LCO-102 Concrete Easement to Lagoons 95.8 600 MH-9 MH-9 (DIP) 1970 70 27 43 66,102$ 5 5 5 5 4 19 Average 95 MCO-103 Concrete Easement to Lagoons 13.3 600 MH-9 (DIP) MH-10 1970 70 27 43 9,177$ 5 5 5 5 4 19 Average 95 MCO-104 PVC Easement Bell to Lagoons 104.2 250 MH-6 (DIP) MH-7 (DIP) 1990 70 47 23 125,561$ 7 5 5 5 4 19 Good 133 LCO-105 PVC Easement Bell to Lagoons 82.3 250 MH-7 (DIP) MH-8 (DIP) 1990 70 47 23 99,172$ 7 5 5 5 4 19 Good 133 LCO-106 PVC Easement Bell to Lagoons 82.3 250 MH-8 (DIP) MH-9 (DIP) 1990 70 47 23 99,172$ 7 5 5 5 4 19 Good 133 LCO-107 Asbestos Cement Hanbury St 100.6 200 MH-2 (DIP) MH-1 (DIP) 1990 70 47 23 118,708$ 4 5 5 5 4 19 Average 76 MCO-108 PVC Eco Pkwy 89.9 250 MH-1 (IPR A) MH-2 (IPR A) 2008 70 65 5 108,330$ 9 5 5 5 4 19 Very Good 171 LCO-109 PVC Eco Pkwy 8.5 250 MH-2 (IPR A) MH-2 2008 70 65 5 10,243$ 9 5 5 5 4 19 Very Good 171 LCO-110 PVC Eco Pkwy 13.1 250 MH-2 MH-3 (IPR A) 2008 70 65 5 15,786$ 9 5 5 5 4 19 Very Good 171 LCO-111 PVC Eco Pkwy 15.8 250 MH-3 (IPR A) STUB 2008 70 65 5 19,039$ 9 5 5 5 4 19 Very Good 171 LCO-113 PVC Russel Ln 61 200 MH-1 (RUS) MH-2 (RUS) 1992 70 49 21 71,980$ 7 5 5 5 5 20 Good 140 LCO-114 PVC Russel Ln 47.9 200 MH-2 (RUS) MH-3 (RUS) 1992 70 49 21 56,522$ 7 5 5 5 5 20 Good 140 LCO-115 PVC Victoria St 109.7 200 MH-2 (RUS) MH-24 1992 70 49 21 129,446$ 7 5 5 5 5 20 Good 140 LCO-116 PVC Easement Wilson to Owen Sound 14.4 200 MH-75 MH-1 (HPT) 1989 70 46 24 16,992$ 7 5 5 5 1 16 Good 112 LCO-117 PVC Easement Wilson to Owen Sound 53.5 200 MH-1 (HPT) MH-2 (HPT) 1989 70 46 24 63,130$ 7 5 5 5 1 16 Good 112 LCO-118 PVC Easement Wilson to Owen Sound 61.5 200 MH-2 (HPT) MH-3 (HPT) 1989 70 46 24 72,570$ 7 5 5 5 1 16 Good 112 LCO-119 PVC Easement Wilson to Owen Sound 99.2 200 MH-3 (HPT) MH-4 (HPT) 1989 70 46 24 117,056$ 7 5 5 5 1 16 Good 112 LCO-120 PVC Easement Wilson to Owen Sound 48.4 200 MH-4 (HPT) MH-5 (HPT) 1989 70 46 24 57,112$ 7 5 5 5 1 16 Good 112 LCO-121 PVC Easement Wilson to Owen Sound 57.1 200 MH-5 (HPT) MH-6 (HPT) 1989 70 46 24 67,378$ 7 5 5 5 1 16 Good 112 LCO-123 PVC McGregor Court 94.1 200 MH-6 (HPT) MH-7 (HPT) 1989 70 46 24 111,038$ 7 5 5 5 1 16 Good 112 L
PVC McGregor Court 92 200 MH-8 MH-7 1990 70 46 23 108,560$ 5 5 5 5 5 20 Average 100 MCO-124 Asbestos Cement Bradley St 76.2 200 MH-115 MH-116 1975 70 32 38 89,916$ 3 5 5 5 5 20 Poor 60 MCO-125 Asbestos Cement Bradley St 25.6 200 MH-116 MH-86 1975 70 32 38 30,208$ 3 5 5 5 5 20 Poor 60 MCO-126 Asbestos Cement Highpoint St 86 200 MH-86 MH-117 1975 70 32 38 101,480$ 3 5 5 5 5 20 Poor 60 MCO-127 Asbestos Cement Pine Ct 76.2 200 MH-117 MH-118 1975 70 32 38 89,916$ 3 5 5 5 5 20 Poor 60 MCO-128 Asbestos Cement Pine Ct 31.7 200 MH-118 MH-119 1975 70 32 38 37,406$ 3 5 5 5 5 20 Poor 60 MCO-129 PVC Shellfield St 98.8 200 MH-3 (RUS) MH-1A 1993 70 50 20 116,584$ 7 5 5 5 5 20 Good 140 LCO-130 PVC Shellfield St 82 200 MH-1A MH-2A 1993 70 50 20 96,760$ 7 5 5 5 5 20 Good 140 LCO-131 PVC Shellfield St 98.5 200 MH-2A MH-3A 1993 70 50 20 116,230$ 7 5 5 5 5 20 Good 140 LCO-132 PVC Shellfield St 128.3 200 MH-3A MH-4A 1993 70 50 20 151,934$ 7 5 5 5 5 20 Good 140 LCO-133 PVC Sinclair St 21 200 MH-4A MH-5A 1993 70 50 20 24,780$ 7 5 5 5 5 20 Good 140 LCO-134 PVC Sinclair St 88.4 200 MH-5A MH-6A 1993 70 50 20 104,312$ 7 5 5 5 5 20 Good 140 LCO-135 PVC Shellfield St 37.8 200 MH-4A MH-7A 1993 70 50 20 44,604$ 7 5 5 5 5 20 Good 140 LCO-136 PVC Shellfield St 118 200 MH-7A MH-8A 1993 70 50 20 139,240$ 7 5 5 5 5 20 Good 140 LCO-137 Asbestos Cement Victoria St 36.3 200 MH-34 MH-2 (NIX) 1990 70 47 23 42,834$ 4 5 5 5 5 20 Average 80 MCO-138 Asbestos Cement Victoria St 86 200 MH-2 (NIX) MH-35 1990 70 47 23 101,480$ 4 5 5 5 5 20 Average 80 MCO-139 PVC Nixon Ct 80.2 200 MH-1 (NIX) MH-2 (NIX) 1990 70 47 23 94,636$ 7 5 5 5 5 20 Good 140 LCO-140 PVC Gold St 89.3 200 MH-1 (GOL) MH-14 1990 70 47 23 105,374$ 7 5 5 5 5 20 Good 140 LCO-141 Asbestos Cement McDowell St 12.2 250 MH-29 MH-1 (MCD) 1974 70 31 39 14,701$ 3 5 5 5 5 20 Poor 60 MCO-142 Asbestos Cement McDowell St 71.6 250 MH-1 (MCD) MH-2 (MCD) 1974 70 31 39 86,278$ 3 5 5 5 5 20 Poor 60 MCO-143 Asbestos Cement McDowell St 85 250 MH-2 (MCD) MH-3 (MCD) 1974 70 31 39 102,425$ 3 5 5 5 5 20 Poor 60 MCO-144 Asbestos Cement Braemore St 97.5 250 MH-3 (MCD) MH-4 (MCD) 1974 70 31 39 117,488$ 3 5 5 5 5 20 Poor 60 MCO-145 Asbestos Cement Braemore St 97.5 250 MH-4 (MCD) MH-5 (MCD) 1974 70 31 39 117,488$ 3 5 5 5 5 20 Poor 60 MCO-146 Asbestos Cement Braemore St 118.9 250 MH-5 (MCD) MH-6 (MCD) 1974 70 31 39 143,275$ 3 5 5 5 5 20 Poor 60 M
PVC Highpoint Street 38 200 MH-10 MH-9 1988 70 45 25 44,840$ 7 5 5 5 5 20 Good 140 LPVC Highpoint Street 81.5 200 MH-9 MH-7 1988 70 45 25 96,170$ 7 5 5 5 5 20 Good 140 L
Watson & Associates Economists Ltd H:\Southgate\2013 AM\Southgate AM Inventory Model FINAL.xlsx
A-15

Township of Southgate2013 Asset Management PlanSanitary Sewer Mains
Probability of Failure
Condition Rating
Hydraulic Capacity
Trunk Vs. Local
Gravity Or Forcemain
Serviced Land Use
Total Consequence of
Failure
9 20 180 Max
Total Risk of Asset Failure
Risk of Failure
Label Structure Type Street / Location Length (m)Diameter
(mm)Start Node Stop Node
Consequence of FailureAsset
ConditionAcquisition
DateAsset Life
ExpectancyRemaining Useful Life
AgeEst. Replacement
Cost $2013
PVC Wilson Crescent 116 200 MH-9 MH-12 1988 70 45 25 136,880$ 7 5 5 5 5 20 Good 140 LPVC Wilson Crescent 81 200 MH-12 MH-11 1988 70 45 25 95,580$ 7 5 5 5 5 20 Good 140 LPVC Wilson Crescent 116 200 MH-11 MH-7 1988 70 45 25 136,880$ 7 5 5 5 5 20 Good 140 L
Watson & Associates Economists Ltd H:\Southgate\2013 AM\Southgate AM Inventory Model FINAL.xlsx
A-16

Township of Southgate2013 Asset Management PlanWastewater Facilities
Historic Maintenance
Cost
Freq. Facility Off-Line
Standby Power
Total Condition
Rating
Likelihood ofFailure
Severity of Failure
Total Consquence
of Failure15 10 150 Max
1,804,163$ 525,376$ 1,278,787$ 3,366,866$
WW13000 Sewage Filtration Plant Process Equipment Sewage Filtration Plant Dundalk Pt.Lt.238&239,Conc.2 1/1/2001 30 18 12 1,623,840 389,633 1,234,207 70 582,686 3 5 1 9 3 3 6 54 HWW13000 Sewage Filtration Plant Process Electrical Sewage Filtration Plant Dundalk Pt.Lt.238&239,Conc.2 1/1/2001 40 28 12 139,845 3 5 1 9 3 3 6 54 HWW13000 Sewage Filtration Plant Process Instrumentation Sewage Filtration Plant Dundalk Pt.Lt.238&239,Conc.2 1/1/2001 20 8 12 69,922 3 5 1 9 3 3 6 54 HWW13000 Sewage Filtration Plant Process Piping Sewage Filtration Plant Dundalk Pt.Lt.238&239,Conc.2 1/1/2001 50 38 12 209,767 5 5 1 11 5 3 8 88 MWW13000 Sewage Filtration Plant Building & Process Structural Sewage Filtration Plant Dundalk Pt.Lt.238&239,Conc.2 1/1/2001 60 48 12 885,682 5 5 1 11 5 3 8 88 MWW13000 Sewage Filtration Plant Building Architectural Sewage Filtration Plant Dundalk Pt.Lt.238&239,Conc.2 1/1/2001 20 8 12 233,074 5 5 1 11 5 3 8 88 MWW13000 Sewage Filtration Plant Building Services Sewage Filtration Plant Dundalk Pt.Lt.238&239,Conc.2 1/1/2001 20 8 12 209,767 5 5 1 11 5 5 10 110 MWW13001 Sewage Pumping & Treatment Station Process Equipment Sewage Pumping & Treatment Station Dundalk Pt.Lt.238&239,Conc.2 1/1/1968 30 0 45 105,363 92,268 13,095 70 202,541 3 3 1 7 3 3 6 42 HWW13001 Sewage Pumping & Treatment Station Process Electrical Sewage Pumping & Treatment Station Dundalk Pt.Lt.238&239,Conc.2 1/1/1968 40 0 45 118,149 3 3 1 7 3 3 6 42 HWW13001 Sewage Pumping & Treatment Station Process Instrumentation Sewage Pumping & Treatment Station Dundalk Pt.Lt.238&239,Conc.2 1/1/1968 20 0 45 59,074 3 3 1 7 3 3 6 42 HWW13001 Sewage Pumping & Treatment Station Process Piping Sewage Pumping & Treatment Station Dundalk Pt.Lt.238&239,Conc.2 1/1/1968 50 5 45 67,514 5 3 1 9 5 3 8 72 HWW13001 Sewage Pumping & Treatment Station Building & Process Structural Sewage Pumping & Treatment Station Dundalk Pt.Lt.238&239,Conc.2 1/1/1968 60 31 45 202,541 5 3 1 9 5 1 6 54 HWW13001 Sewage Pumping & Treatment Station Building Architectural Sewage Pumping & Treatment Station Dundalk Pt.Lt.238&239,Conc.2 1/1/1968 20 0 45 75,953 5 3 1 9 5 3 8 72 HWW13001 Sewage Pumping & Treatment Station Building Services Sewage Pumping & Treatment Station Dundalk Pt.Lt.238&239,Conc.2 1/1/1968 20 0 45 118,149 5 3 1 9 5 5 10 90 MWW13002 Sewage Aeration Blower Plant Process Equipment Sewage Aeration Blower Plant Dundalk Pt.Lt.238&239,Conc.2 1/1/1984 30 1 29 74,960 43,476 31,484 70 19,420 5 5 1 11 5 3 8 88 MWW13002 Sewage Aeration Blower Plant Process Electrical Sewage Aeration Blower Plant Dundalk Pt.Lt.238&239,Conc.2 1/1/1984 40 11 29 1,884 5 5 1 11 3 3 6 66 HWW13002 Sewage Aeration Blower Plant Process Instrumentation Sewage Aeration Blower Plant Dundalk Pt.Lt.238&239,Conc.2 1/1/1984 20 0 29 1,942 5 5 1 11 3 3 6 66 HWW13002 Sewage Aeration Blower Plant Process Piping Sewage Aeration Blower Plant Dundalk Pt.Lt.238&239,Conc.2 1/1/1984 50 21 29 9,710 5 5 1 11 5 3 8 88 MWW13002 Sewage Aeration Blower Plant Building & Process Structural Sewage Aeration Blower Plant Dundalk Pt.Lt.238&239,Conc.2 1/1/1984 60 31 29 157,305 5 5 1 11 5 1 6 66 HWW13002 Sewage Aeration Blower Plant Building Architectural Sewage Aeration Blower Plant Dundalk Pt.Lt.238&239,Conc.2 1/1/1984 20 0 29 - 5 5 1 11 5 3 8 88 MWW13002 Sewage Aeration Blower Plant Building Services Sewage Aeration Blower Plant Dundalk Pt.Lt.238&239,Conc.2 1/1/1984 20 0 29 1,942 5 5 1 11 5 5 10 110 M
Age Acqusition CostAsset Life
ExpextancyLocation Street
In Service Date
Useful LifeRemaining Useful Life
Total Accumulated Depreciation at
December 31, 2012Net Book ValueAsset ID Asset Component Assigned Name
Total Risk of Asset Failure
Risk of FailureEst.
Replacement Cost 2013
Condition Rating Consequence of Failure
Watson & Associates Economists Ltd H:\Southgate\2013 AM\Southgate AM Inventory Model FINAL.xlsx
A-17


Watson & Associates Economists Ltd. H:\Southgate\2013 AM\Southgate AMP Report.docx
APPENDIX B
ASSET MANAGEMENT ASSUMPTIONS


B-1
Watson & Associates Economists Ltd. H:\Southgate\2013 AM\Southgate AMP Report.docx
APPENDIX B: ASSET MANAGEMENT PLAN ASSUMPTIONS
The following assumptions were made during the creation of the Township’s asset management
plan.
1. STATE OF LOCAL INFRASTRUCTURE
a) Indexing: When inflating an asset value to a 2013 replacement value, the Non-
Residential Building Construction Price Index (NRBCPI) was used for Roads, Bridges,
Culverts, Water and Wastewater related assets. In order to establish an initial condition
assessment for some assets, calculations were performed to link condition to asset age.
b) In order to establish initial condition assessments for some assets, calculations were
performed to link condition to asset age. This was done in order to establish condition
ratings for this report and it is recommended that the Township follow the “Condition
Assessment Policy” shown in Appendix C in the future.
c) Please see pages B-2 to B-7 for assumptions used by Triton Engineering and Township
staff.
2. ASSET MANAGEMENT STRATEGY
a) Capital inflation rate will be assumed to be 3% annually.
b) Operating budget inflation rate will be assumed to be 2% annually.
c) Regarding operating expenses included in the Township’s current budget, it is assumed
that they will increase at an operating inflation rate annually, unless staff have provided
alternative impacts.
d) When any existing debenture payments are complete (if applicable), annual budget
savings created through removing these payments have been dedicated to capital.
3. FINANCING STRATEGY
a) Taxation assessment growth is assumed to be 1.0% annually.
b) Development charges rates are assumed to increase at 2% annually.
c) Gas tax revenue has been identified as a funding source for the purposes of this
analysis (i.e. for asset replacement purposes), and has been assumed to continue
throughout the forecast period.
d) Interest rate earned on a Capital Replacement Reserve Fund will be 2% annually.
e) In the case where debt financing is needed, the model assumed debt terms of 20 years
at 5% annual interest. For growth related debt, debt payments are shown as funded
directly from the development charge reserve funds.
4. RISK ASSESSMENT CALCULATIONS
a) The following pages outline the calculations performed by Triton in establishing asset
risk.

A4160(13)R44
ROADS 1. Condition Assessment
Maximum Score
Condition Rating (from Road Needs Study)
10
PCI (Actual PCI divided by 10) 10
Total Maximum 20 2. Risk Management
Maximum Score
i) AADT 10
< 50 vpd 10 50 – 199 8
200 – 499 6 500 – 999 3
> 1000 1
ii) Posted Speed 3 40 - 50 kph 3 60 - 70 kph 2
80+ kph 1
iii) MTCE Class (from Road Needs Study)
10
Total Maximum 23
B-2
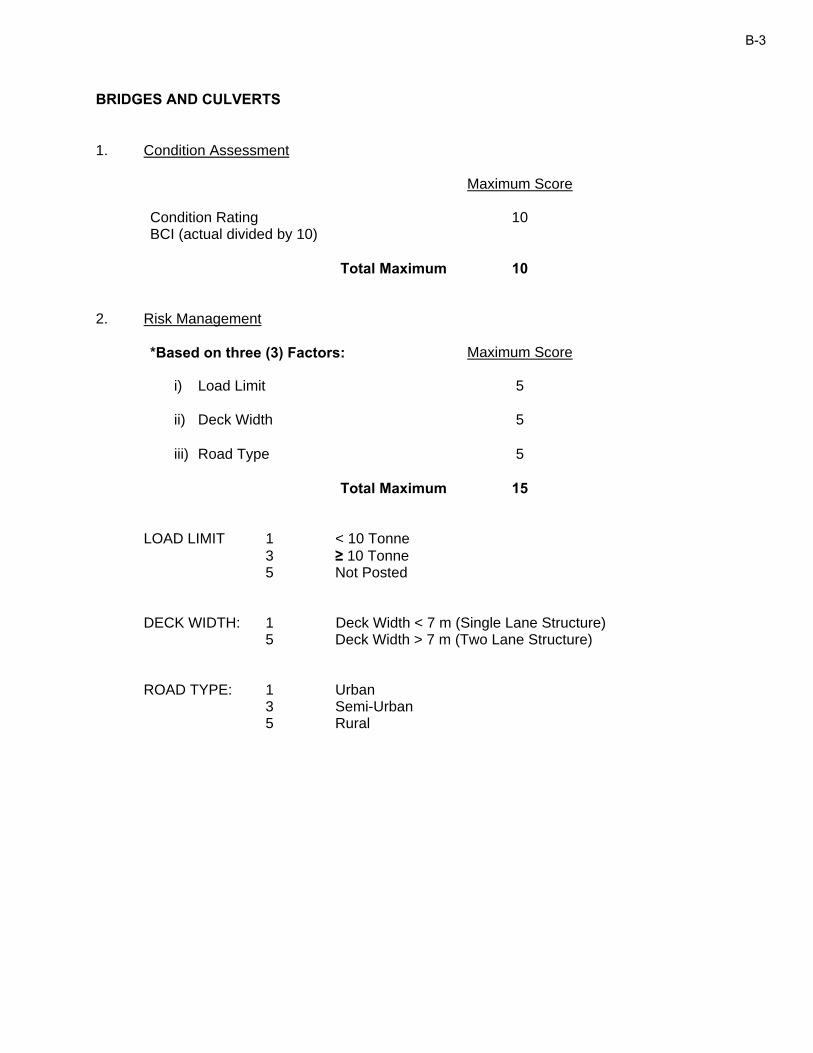
BRIDGES AND CULVERTS 1. Condition Assessment
Maximum Score
Condition Rating BCI (actual divided by 10)
10
Total Maximum 10
2. Risk Management
*Based on three (3) Factors: Maximum Score
i) Load Limit 5
ii) Deck Width 5
iii) Road Type 5
Total Maximum 15
LOAD LIMIT 1 < 10 Tonne 3 ≥ 10 Tonne 5 Not Posted DECK WIDTH: 1 Deck Width < 7 m (Single Lane Structure) 5 Deck Width > 7 m (Two Lane Structure) ROAD TYPE: 1 Urban 3 Semi-Urban 5 Rural
B-3

A4160(13)R44
WATERMAIN 1. Condition Assessment Based on age and pipe material (High Score - Good; Low Score - Not Good) AGE: (Score 1 to 5) 1 > 50 yrs. 2 30 to 50 yrs. 3 15 to 30 yrs. 4 5 to 15 yrs. 5 < 5 yrs. PIPE MATERIAL: (Score 1 to 5) Cast Iron / Asbestos Cement / Steel 1 Ductile Iron 3 PVC 5 Therefore a 50 year old cast iron watermain would score 2 while a 5 year old PVC would score 8. 2. Risk Management Based on hydraulic capacity (acceptable or not); trunk versus local main; is it a river crossing; and serviced land use. i) Hydraulic Capacity: Deficient 1 (Score 1 or 5) Not Deficient 5 ii) Trunk versus Local: Local 5 (Score 1 or 5) Trunk 1 iii) Serviced Land Use: Health Care Services/EMO 1 (Score 1 to 5) Educational Facility 2 Government Facility 3 Commercial/Industrial 4 Residential 5
B-4
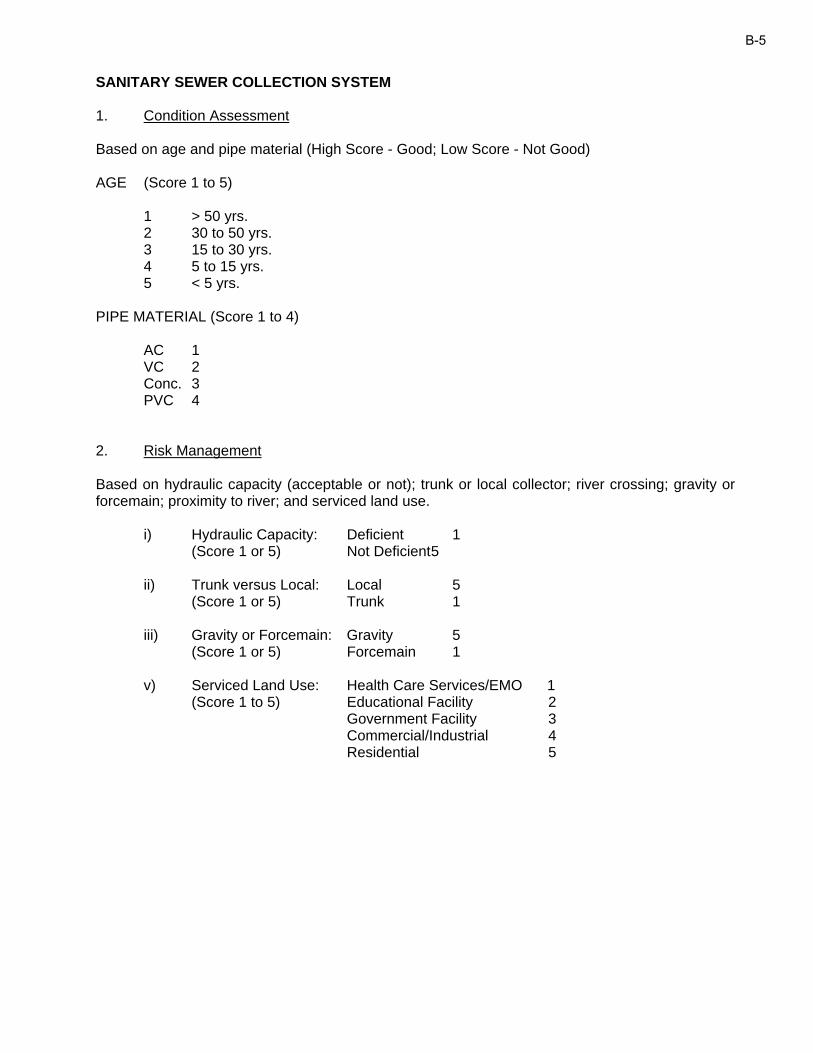
SANITARY SEWER COLLECTION SYSTEM 1. Condition Assessment Based on age and pipe material (High Score - Good; Low Score - Not Good) AGE (Score 1 to 5) 1 > 50 yrs. 2 30 to 50 yrs. 3 15 to 30 yrs. 4 5 to 15 yrs. 5 < 5 yrs. PIPE MATERIAL (Score 1 to 4) AC 1 VC 2 Conc. 3 PVC 4 2. Risk Management Based on hydraulic capacity (acceptable or not); trunk or local collector; river crossing; gravity or forcemain; proximity to river; and serviced land use. i) Hydraulic Capacity: Deficient 1 (Score 1 or 5) Not Deficient 5 ii) Trunk versus Local: Local 5 (Score 1 or 5) Trunk 1 iii) Gravity or Forcemain: Gravity 5 (Score 1 or 5) Forcemain 1 v) Serviced Land Use: Health Care Services/EMO 1 (Score 1 to 5) Educational Facility 2 Government Facility 3 Commercial/Industrial 4 Residential 5
B-5

WATER FACILITIES 1. Condition Assessment Based on individual components identified in PSAB Factors: AGE: (Average) 1 > 50 yrs. 2 30 to 50 yrs. 3 15 to 30 yrs. 4 5 to 15 yrs. 5 < 5 yrs. HISTORIC MAINTENANCE COST: 1 High 3 Average 5 Low FREQUENCY OF FACILITY OFF LINE: (last five (5) years) 5 0 3 1-5 1 > 5 STANDBY POWER: 5 Full Time 3 Portable 1 None Therefore, a pumping station (well) that is 40 years old, has high maintenance costs, has been off line seven (7) times in the last five years, and does not have standby power would score 9. 2. Risk Management i) Likelihood of Failure: Remote 5 Moderate 3 Good 1 ii) Severity of Failure: (Environmental, Public Health and Safety, Financial and Public Perception) Minimal 5 Moderate 3 Significant 1 Therefore, a pumping station (well) that has a good likelihood of failure with a significant severity of failure would score 2.
B-6

WASTEWATER FACILITIES 1. Condition Assessment Based on individual components identified in PSAB Factors: AGE: (Average) 1 > 50 yrs. 2 30 to 50 yrs. 3 15 to 30 yrs. 4 5 to 15 yrs. 5 < 5 yrs. HISTORIC MAINTENANCE COST: 1 High 3 Average 5 Low FREQUENCY OF BYPASS: (last five (5) years) 5 0 3 1-5 1 > 5 FULL TIME STANDBY POWER: 5 Yes 1 No Therefore, a SPS that is 40 years old, has high maintenance costs, has by-passed seven (7) times in the last five years, and does not have full time standby power would score 9. 2. Risk Management i) Likelihood of Failure: Remote 5 Moderate 3 Good 1 ii) Severity of Failure: (Environmental, Public Health and Safety, Financial and Public Perception) Minimal 5 Moderate 3 Significant 1
Therefore, a SPS that has a good likelihood of failure with a significant severity of failure would score 2.
B-7


Watson & Associates Economists Ltd. H:\Southgate\2013 AM\Southgate AMP Report.docx
APPENDIX C
DATA VERIFICATION AND CONDITION ASSESSMENT
POLICY


C-1
Watson & Associates Economists Ltd. H:\Southgate\2013 AM\Southgate AMP Report.docx
APPENDIX C: DATA VERIFICATION AND CONDITION
ASSESSMENT POLICY
Township of Southgate
Data Verification and Condition Assessment Policy
Data Verification
1. The main source of asset data updating and editing will be though the Township’s PSAB
3150 compliance procedures.
2. Asset additions, disposals, betterments, and write-offs will be recorded based on the
Township’s PSAB 3150 Compliance Policies.
3. Verification of the correct treatment of asset revisions will be completed through frequent
annual reviews by the Township’s Treasurer as well as an annual review by the
Township’s external auditor.
4. During years in which condition assessments are not being performed, asset
replacement cost will be determined based on a combination of inflating previous current
values or thorough the use of the current year’s historical invoice data. Where indices
are being used, the Non-Residential Building Construction Price Index (NRBCPI) shall
be used for construction related assets (i.e. roads related, storm, water, and facilities)
and the Consumer Price Index (CPI) shall be used for all other assets (i.e. machinery &
equipment, vehicles and land improvements).
Condition Assessment
1. Condition assessments shall be performed as outlined in Table C-1 below. Condition
assessments shall be performed by qualified individuals (or companies) and shall
include a review of the following:
Current asset condition (consistent with the rating format used within this report,
unless Township staff stipulate a new format);
i. Identify any unusual wear from asset use that may hinder asset performance
and eventually reduce useful life.
ii. Assess asset performance and identify (if any) capital improvements that can
be applied to extend the asset’s useful life and/or bring the asset back to
proper service levels.
Current asset replacement cost. This is to be based on replacing the asset under
current legislation/requirements using the Township’s specifications; and
Remaining service life, assuming current maintenance and usage levels.
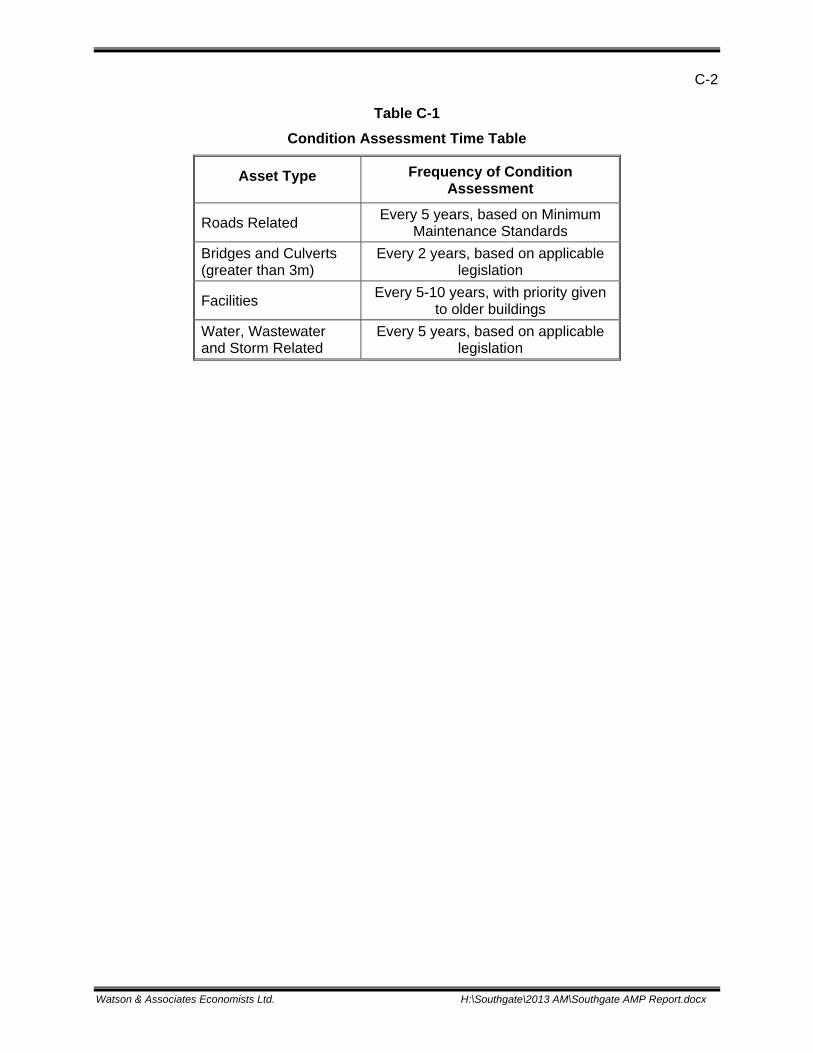
C-2
Watson & Associates Economists Ltd. H:\Southgate\2013 AM\Southgate AMP Report.docx
Table C-1
Condition Assessment Time Table
Asset Type Frequency of Condition Assessment
Roads Related Every 5 years, based on Minimum
Maintenance Standards
Bridges and Culverts (greater than 3m)
Every 2 years, based on applicable legislation
Facilities Every 5-10 years, with priority given
to older buildings
Water, Wastewater and Storm Related
Every 5 years, based on applicable legislation
Watson & Associates Economists Ltd. H:\Southgate\2013 AM\Southgate AMP Report.docx
APPENDIX D
LEVEL OF SERVICE IMPACT ANALYSIS


Impact (in Current Year $)
2014 2015 2016 2017 2018 2019 2020 2021 2022 2023 2024 2025 2026 2027 2028 2029 2030 2031 2032 2033
Roads RelatedExpenditures
Operating Expenditures Increased roads maintenance Maintenance 65,000 5 13,000 26,000 39,000 52,000 65,000 65,000 65,000 65,000 65,000 65,000 65,000 65,000 65,000 65,000 65,000 65,000 65,000 65,000 65,000 65,000 Operating Expenditures Increased bridge & culvert maintenance Maintenance 12,000 2 6,000 12,000 12,000 12,000 12,000 12,000 12,000 12,000 12,000 12,000 12,000 12,000 12,000 12,000 12,000 12,000 12,000 12,000 12,000 12,000
- - - - - - - - - - - - - - - - - - - - Sub-total Expenditures 77,000 19,000 38,000 51,000 64,000 77,000 77,000 77,000 77,000 77,000 77,000 77,000 77,000 77,000 77,000 77,000 77,000 77,000 77,000 77,000 77,000
Facilities RelatedExpenditures
Operating Expenditures Increased buildings maintenance Maintenance 7,000 2 3,500 7,000 7,000 7,000 7,000 7,000 7,000 7,000 7,000 7,000 7,000 7,000 7,000 7,000 7,000 7,000 7,000 7,000 7,000 7,000 - - - - - - - - - - - - - - - - - - - -
Sub-total Expenditures 7,000 3,500 7,000 7,000 7,000 7,000 7,000 7,000 7,000 7,000 7,000 7,000 7,000 7,000 7,000 7,000 7,000 7,000 7,000 7,000 7,000
Total Expenditures (Uninflated) 84,000 22,500 45,000 58,000 71,000 84,000 84,000 84,000 84,000 84,000 84,000 84,000 84,000 84,000 84,000 84,000 84,000 84,000 84,000 84,000 84,000
Total Operating Expenditures (Uninflated) 22,500 45,000 58,000 71,000 84,000 84,000 84,000 84,000 84,000 84,000 84,000 84,000 84,000 84,000 84,000 84,000 84,000 84,000 84,000 84,000
Total Capital Expenditures (Uninflated) - - - - - - - - - - - - - - - - - - - -
Total Operating Expenditures (Inflated) 22,950 46,818 61,550 76,853 92,743 94,598 96,490 98,419 100,388 102,396 104,443 106,532 108,663 110,836 113,053 115,314 117,620 119,973 122,372 124,820
Total Capital Expenditures (Inflated) - - - - - - - - - - - - - - - - - - - -
2014 2015 2016 2017 2018 2019 2020 2021 2022 2023 2024 2025 2026 2027 2028 2029 2030 2031 2032 2033
Maintenance 22,950 46,818 61,550 76,853 92,743 94,598 96,490 98,419 100,388 102,396 104,443 106,532 108,663 110,836 113,053 115,314 117,620 119,973 122,372 124,820 Rehabilitation/Renewal - - - - - - - - - - - - - - - - - - - - Replacement - - - - - - - - - - - - - - - - - - - - Expansion - - - - - - - - - - - - - - - - - - - -
Grand Total (Inflated) 22,950 46,818 61,550 76,853 92,743 94,598 96,490 98,419 100,388 102,396 104,443 106,532 108,663 110,836 113,053 115,314 117,620 119,973 122,372 124,820
Town of Southgate2013 Asset Management Plan
Asset Management Strategy - Change in Level of Service
Table D-1Tax Supported Services
Impact (Inflated)Planned Actions Summary
Departments Impact(2013$)
Phase-in Period
(in Years)Description Planned Actions
Watson & Associates Economists Ltd. H:\Southgate\2013 AM\Southgate AM Model FINAL.xlsx
D-1
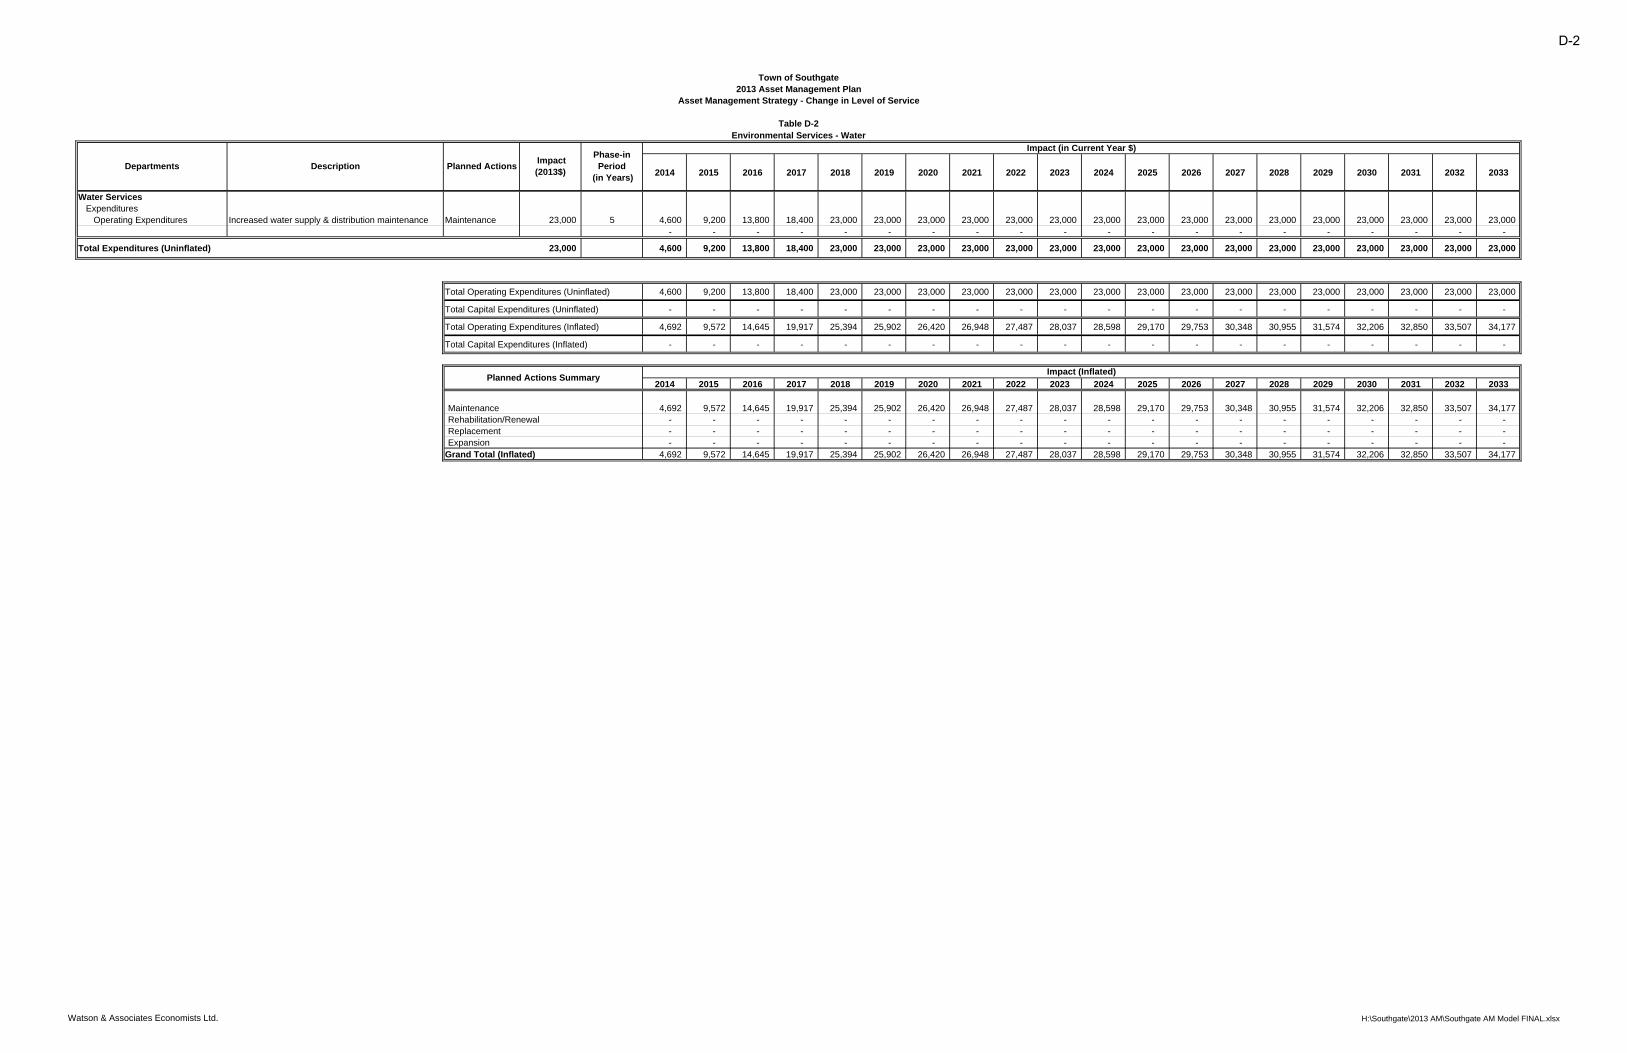
Town of Southgate2013 Asset Management Plan
Asset Management Strategy - Change in Level of Service
Impact (in Current Year $)
2014 2015 2016 2017 2018 2019 2020 2021 2022 2023 2024 2025 2026 2027 2028 2029 2030 2031 2032 2033
Water ServicesExpenditures
Operating Expenditures Increased water supply & distribution maintenance Maintenance 23,000 5 4,600 9,200 13,800 18,400 23,000 23,000 23,000 23,000 23,000 23,000 23,000 23,000 23,000 23,000 23,000 23,000 23,000 23,000 23,000 23,000 - - - - - - - - - - - - - - - - - - - -
Total Expenditures (Uninflated) 23,000 4,600 9,200 13,800 18,400 23,000 23,000 23,000 23,000 23,000 23,000 23,000 23,000 23,000 23,000 23,000 23,000 23,000 23,000 23,000 23,000
Total Operating Expenditures (Uninflated) 4,600 9,200 13,800 18,400 23,000 23,000 23,000 23,000 23,000 23,000 23,000 23,000 23,000 23,000 23,000 23,000 23,000 23,000 23,000 23,000
Total Capital Expenditures (Uninflated) - - - - - - - - - - - - - - - - - - - -
Total Operating Expenditures (Inflated) 4,692 9,572 14,645 19,917 25,394 25,902 26,420 26,948 27,487 28,037 28,598 29,170 29,753 30,348 30,955 31,574 32,206 32,850 33,507 34,177
Total Capital Expenditures (Inflated) - - - - - - - - - - - - - - - - - - - -
2014 2015 2016 2017 2018 2019 2020 2021 2022 2023 2024 2025 2026 2027 2028 2029 2030 2031 2032 2033
Maintenance 4,692 9,572 14,645 19,917 25,394 25,902 26,420 26,948 27,487 28,037 28,598 29,170 29,753 30,348 30,955 31,574 32,206 32,850 33,507 34,177 Rehabilitation/Renewal - - - - - - - - - - - - - - - - - - - - Replacement - - - - - - - - - - - - - - - - - - - - Expansion - - - - - - - - - - - - - - - - - - - -
Grand Total (Inflated) 4,692 9,572 14,645 19,917 25,394 25,902 26,420 26,948 27,487 28,037 28,598 29,170 29,753 30,348 30,955 31,574 32,206 32,850 33,507 34,177
Impact (Inflated)
Phase-in Period
(in Years)
Environmental Services - WaterTable D-2
Planned Actions Summary
Departments Description Planned Actions Impact(2013$)
Watson & Associates Economists Ltd. H:\Southgate\2013 AM\Southgate AM Model FINAL.xlsx
D-2

Town of Southgate2013 Asset Management Plan
Asset Management Strategy - Change in Level of Service
Impact (in Current Year $)
2014 2015 2016 2017 2018 2019 2020 2021 2022 2023 2024 2025 2026 2027 2028 2029 2030 2031 2032 2033
Wastewater ServiceExpenditures
Operating Expenditures Increased wastewater treatment maintenance Maintenance 15,000 3 5,000 10,000 15,000 15,000 15,000 15,000 15,000 15,000 15,000 15,000 15,000 15,000 15,000 15,000 15,000 15,000 15,000 15,000 15,000 15,000 Operating Expenditures Increased wastewater collection maintenance Maintenance 5,000 1 5,000 5,000 5,000 5,000 5,000 5,000 5,000 5,000 5,000 5,000 5,000 5,000 5,000 5,000 5,000 5,000 5,000 5,000 5,000 5,000
- - - - - - - - - - - - - - - - - - - -
Total Expenditures (Uninflated) 20,000 10,000 15,000 20,000 20,000 20,000 20,000 20,000 20,000 20,000 20,000 20,000 20,000 20,000 20,000 20,000 20,000 20,000 20,000 20,000 20,000
Total Operating Expenditures (Uninflated) 10,000 15,000 20,000 20,000 20,000 20,000 20,000 20,000 20,000 20,000 20,000 20,000 20,000 20,000 20,000 20,000 20,000 20,000 20,000 20,000
Total Capital Expenditures (Uninflated) - - - - - - - - - - - - - - - - - - - -
Total Operating Expenditures (Inflated) 10,200 15,606 21,224 21,649 22,082 22,523 22,974 23,433 23,902 24,380 24,867 25,365 25,872 26,390 26,917 27,456 28,005 28,565 29,136 29,719
Total Capital Expenditures (Inflated) - - - - - - - - - - - - - - - - - - - -
2014 2015 2016 2017 2018 2019 2020 2021 2022 2023 2024 2025 2026 2027 2028 2029 2030 2031 2032 2033
Maintenance 10,200 15,606 21,224 21,649 22,082 22,523 22,974 23,433 23,902 24,380 24,867 25,365 25,872 26,390 26,917 27,456 28,005 28,565 29,136 29,719 Rehabilitation/Renewal - - - - - - - - - - - - - - - - - - - - Replacement - - - - - - - - - - - - - - - - - - - - Expansion - - - - - - - - - - - - - - - - - - - -
Grand Total (Inflated) 10,200 15,606 21,224 21,649 22,082 22,523 22,974 23,433 23,902 24,380 24,867 25,365 25,872 26,390 26,917 27,456 28,005 28,565 29,136 29,719
Impact (Inflated)
Phase-in Period
(in Years)
Environmental Services - WastewaterTable D-3
Planned Actions Summary
Departments Description Planned Actions Impact(2013$)
Watson & Associates Economists Ltd. H:\Southgate\2013 AM\Southgate AM Model FINAL.xlsx
D-3


Watson & Associates Economists Ltd. H:\Southgate\2013 AM\Southgate AMP Report.docx
APPENDIX E
SCENARIO ANALYSIS – CAPITAL FORECASTS


Township of Southgate2013 Asset Management Plan
Scheduled Capital Replacement (Tax Supported Assets) - Inflated
Replacement Year Based on Scenario 1Table E-1
Asset TypeImmediate
Needs2014 2015 2016 2017 2018 2019 2020 2021 2022 2023 2024 2025 2026 2027 2028 2029 2030 2031 2032 2033 TOTAL
Total Scheduled Capital - Inflated 84,874,705 - 58,636 325,507 - - - 1,027,974 - 54,558,417 - - 20,705,668 - 220,935 - 12,796,173 1,839,230 171,993 534,397 538,263 177,651,897
Roads 72,574,080 - - - - - - 1,027,974 - 54,027,125 - - 17,791,108 - - - 12,796,173 944,346 - 534,397 - 159,695,203 Bridges 11,227,443 - - - - - - - - - - - - - - - - - - - - 11,227,443 Facilities 1 073 182 325 507 2 914 560 220 935 894 883 171 993 538 263 6 139 324
Replacement Year Based on Scenario 1
Facilities 1,073,182 - - 325,507 - - - - - - - - 2,914,560 - 220,935 - - 894,883 171,993 - 538,263 6,139,324 Catch Basins - - 58,636 - - - - - - 531,292 - - - - - - - - - - - 589,928
Asset TypeImmediate
Needs2014 2015 2016 2017 2018 2019 2020 2021 2022 2023 2024 2025 2026 2027 2028 2029 2030 2031 2032 2033 TOTAL
Replacement Year Based on Scenario 2Table E-2
Total Scheduled Capital - Inflated - 949,336 1,368,815 1,584,325 1,770,175 1,615,500 2,240,906 1,897,158 2,384,781 2,400,502 2,938,411 2,976,545 3,569,675 3,917,632 4,288,872 4,684,685 5,237,310 5,691,105 6,174,610 6,689,842 7,238,507 69,618,690
Roads - 914,249 1,064,501 1,541,982 1,504,745 1,560,946 1,948,045 1,826,924 2,061,059 2,311,634 2,579,855 2,866,351 3,172,538 3,499,664 3,848,972 4,221,698 4,619,331 5,043,604 5,496,105 5,978,765 6,493,216 62,554,185 Bridges - - 204,754 - 217,223 - 230,452 - 244,487 - 259,376 - 275,172 283,427 291,930 300,688 309,708 319,000 328,570 338,427 348,579 3,951,792 Facilities - 35,087 40,924 42,343 48,207 54,554 62,409 70,234 79,235 88,868 99,180 110,194 121,965 134,541 147,970 162,299 177,586 193,896 211,292 229,848 249,625 2,360,257 Catch Basins - - 58,636 - - - - - - - - - - - - - 130,684 134,605 138,643 142,802 147,086 752,457
90,000,000
Figure E‐1Tax Supported Assets
Scenario 1 ‐ Replacement Year Based on PSAB 3150 Data10,000,000
Figure E‐2Tax Supported Assets
Scenario 2 ‐ Replacement Year Based on Condition and Risk
70,000,000
80,000,000
lated)
7,000,000
8,000,000
9,000,000
fated)
40,000,000
50,000,000
60,000,000
lacement Cost (Infl
Catch Basins
Facilities 4 000 000
5,000,000
6,000,000
7,000,000
lacement Cost (Inlf
Catch Basins
10 000 000
20,000,000
30,000,000
Future Repl Facilities
Bridges
Roads
1 000 000
2,000,000
3,000,000
4,000,000
Future Repl
Facilities
Bridges
Roads
‐
10,000,000
0
1,000,000
Year of Replacement Year of Replacement
Watson & Associates Economists Ltd. H:\Southgate\2013 AM\Southgate AM Inventory Model FINAL.xlsx
E-1

Township of Southgate2013 Asset Management Plan
Scheduled Capital Replacement (Water Assets) - Inflated
Table E-3Replacement Year Based on Scenario 1
Asset TypeImmediate
Needs2014 2015 2016 2017 2018 2019 2020 2021 2022 2023 2024 2025 2026 2027 2028 2029 2030 2031 2032 2033 TOTAL
Total Scheduled Capital - Inflated - - - - 3,729 - - - - - - - - 359,088 250,976 - - 7,109,701 - - - 7,723,493
Water Facilities - - - - 3,729 - - - - - - - - 359,088 250,976 - - - - - - 613,792 Water Mains - - - - - - - - - - - - - - - - - 7,109,701 - - - 7,109,701
Replacement Year Based on Scenario 1
Asset TypeImmediate
Needs2014 2015 2016 2017 2018 2019 2020 2021 2022 2023 2024 2025 2026 2027 2028 2029 2030 2031 2032 2033 TOTAL
Total Scheduled Capital - Inflated - - - - 3,729 - - - - - - - - 359,088 250,976 670,158 690,262 710,970 732,299 754,268 776,896 4,948,646
Water Facilities - - - - 3,729 - - - - - - - - 359,088 250,976 - - - - - - 613,792
Replacement Year Based on Scenario 2Table E-4
, , , ,Water Mains - - - - - - - - - - - - - - - 670,158 690,262 710,970 732,299 754,268 776,896 4,334,853
8 000 000
Figure E‐3Water Assets
Scenario 1 ‐ Replacement Year Based on PSAB 3150 Data1,000,000
Figure E‐4Water Assets
Scenario 2 ‐ Replacement Year Based on Condition and Risk
6,000,000
7,000,000
8,000,000
nflated)
700 000
800,000
900,000
1,000,000
lfated)
4,000,000
5,000,000
placement Cost (In
Water Mains
400 000
500,000
600,000
700,000
placement Cost (Inl
Water Mains
1 000 000
2,000,000
3,000,000
Future Rep
Water Facilities
100 000
200,000
300,000
400,000
Future Rep
Water Facilities
‐
1,000,000
0
100,000
f lYear of Replacement Year of Replacement
Watson & Associates Economists Ltd. H:\Southgate\2013 AM\Southgate AM Inventory Model FINAL.xlsx
E-2

Township of Southgate2013 Asset Management Plan
Scheduled Capital Replacement (Wastewater Assets) - Inflated
Figure E-5Replacement Year Based on Scenario 1
Asset TypeImmediate
Needs2014 2015 2016 2017 2018 2019 2020 2021 2022 2023 2024 2025 2026 2027 2028 2029 2030 2031 2032 2033 TOTAL
Total Scheduled Capital - Inflated 577,750 20,003 - - - 78,267 - - 649,553 - - 2,608 - - - - - - 991,983 - 464,279 2,784,443
Wastewater Facilities 577,750 20,003 - - - 78,267 - - 649,553 - - 2,608 - - - - - - 991,983 - 464,279 2,784,443 Wastewater Mains - - - - - - - - - - - - - - - - - - - - - -
Replacement Year Based on Scenario 1
6
Asset TypeImmediate
Needs2014 2015 2016 2017 2018 2019 2020 2021 2022 2023 2024 2025 2026 2027 2028 2029 2030 2031 2032 2033 TOTAL
Total Scheduled Capital - Inflated - 119,551 123,137 126,831 130,636 134,555 80,615 - 162,388 167,260 172,278 180,054 - - - - - - 198,397 204,349 210,479 2,010,529
Wastewater Facilities - 119,551 123,137 126,831 130,636 134,555 80,615 - 162,388 167,260 172,278 180,054 - - - - - - 198,397 204,349 210,479 2,010,529 Wastewater Mains
Replacement Year Based on Scenario 2Figure E-6
Wastewater Mains - - - - - - - - - - - - - - - - - - - - - -
1,000,000
Figure E‐5Wastewater Assets
Scenario 1 ‐ Replacement Year Based on PSAB 3150 Data500 000
Figure E‐6Wastewater Assets
Scenario 2 ‐ Replacement Year Based on Condition and Risk
700 000
800,000
900,000
1,000,000
ated
)
350 000
400,000
450,000
500,000
fated)
400 000
500,000
600,000
700,000
acem
ent Cost (Infla
200 000
250,000
300,000
350,000
lacement Cost (Inlf
200,000
300,000
400,000
Future Rep
la
Wastewater Mains50 000
100,000
150,000
200,000
Future Rep
l
Wastewater Mains
‐
100,000
Y f R l t
Wastewater Facilities0
50,000
Y f R l
Wastewater Facilities
Year of Replacement Year of Replacement
Watson & Associates Economists Ltd. H:\Southgate\2013 AM\Southgate AM Inventory Model FINAL.xlsx
E-3


Watson & Associates Economists Ltd. H:\Southgate\2013 AM\Southgate AMP Report.docx
APPENDIX F
TAX SUPPORTED ASSET MANAGEMENT STRATEGY &
FINANCING STRATEGY


2014 2015 2016 2017 2018 2019 2020 2021 2022 2023 2024 2025 2026 2027 2028 2029 2030 2031 2032 2033
Growth Projects (DC)
Roads: Reconstruction of Braemore 303,600 303,600 Roads: Reconstruction of Doyle St 211,000 211,000 Administration: Development Charges Study 105,000 26,250 26,250 26,250 26,250 Stormwater: Main St. Crossing 1,000,000 1,000,000
Total Capital Expenditures 1,619,600 - 26,250 - - - 211,000 26,250 - - 303,600 1,000,000 26,250 - - - - 26,250 - - - Capital Financing
Provincial/Federal Grants - - - - - - - - - - - - - - - - - - - - - Developer Contributions - - - - - - - - - - - - - - - - - - - - - Growth Related Debenture Requirements - - - - - - - - - - - - - - - - - - - - - Non-Growth Related Debenture Requirements - - - - - - - - - - - - - - - - - - - - - Development Charges Reserve Fund 656,157 - 26,250 - - - 102,304 26,250 - - 299,001 149,852 26,250 - - - - 26,250 - - - Tax Supported Capital Reserve Fund 963,443 - - - - - 108,696 - - - 4,599 850,148 - - - - - - - - - Lifecycle Reserve Fund - - - - - - - - - - - - - - - - - - - - -
Total Capital Financing 1,619,600 - 26,250 - - - 211,000 26,250 - - 303,600 1,000,000 26,250 - - - - 26,250 - - -
Description TotalForecast
Town of Southgate2013 Asset Management Plan
Expansion Projects - Uninflated
Tax Supported AssetsTable F-1
Watson & Associates Economists Ltd. H:\Southgate\2013 AM\Southgate AM Model FINAL.xlsx
F-1

2014 2015 2016 2017 2018 2019 2020 2021 2022 2023 2024 2025 2026 2027 2028 2029 2030 2031 2032 2033
Prior Capital Expenses (Roads & Facilities)
Administration - Facilities - - 25,000 - - - - - - - - - - - - - - - - - - - - Roads 750,742 1,065,553 815,000 - - - - - - - - - - - - - - - - - - - - Recreation - 55,061 3,200 - - - - - - - - - - - - - - - - - - - -
Capital Replacement Forecast
Roads 914,249 1,064,501 1,541,982 1,504,745 1,560,946 1,948,045 1,826,924 2,061,059 2,311,634 2,579,855 2,866,351 3,172,538 3,499,664 3,848,972 4,221,698 4,619,331 5,043,604 5,496,105 5,978,765 6,493,216 Bridges - 204,754 - 217,223 - 230,452 - 244,487 - 259,376 - 275,172 283,427 291,930 300,688 309,708 319,000 328,570 338,427 348,579 Facilities 35,087 40,924 42,343 48,207 54,554 62,409 70,234 79,235 88,868 99,180 110,194 121,965 134,541 147,970 162,299 177,586 193,896 211,292 229,848 249,625 Storm Infrastructure - 58,636 - - - - - - - - - - - - - 130,684 134,605 138,643 142,802 147,086
Level of Service Adjustments
Rehabiliation and Renewal Works - - - - - - - - - - - - - - - - - - - - Capital Expansion Forecast
Growth Projects (DC) - 27,849 - - - 251,945 32,284 - - 408,013 1,384,234 37,426 - - - - 43,387 - - -
Total Expenditures 750,742 1,120,614 843,200 949,336 1,396,663 1,584,325 1,770,175 1,615,500 2,492,851 1,929,442 2,384,781 2,400,502 3,346,424 4,360,779 3,607,101 3,917,632 4,288,872 4,684,685 5,237,310 5,734,492 6,174,610 6,689,842 7,238,507
Capital Financing
Provincial/Federal Grants - - - - - - - - - - - - - - - - - - - - - - - Non-Growth Related Debentures - - - - 184,618 221,913 220,250 - 234,345 - - - - - - - - - - - - - - Growth Related Debentures - - - - - - - - - - - - - - - - - - - - - - -
Financing Strategy2013 Asset Management Plan
Town of Southgate
DescriptionForecast Actual
2011 Actual 2012
Budget 2013
Table F-2
Tax Supported Capital Forecast
Growth Related Debentures Reserve Fund: Development Charges 59,978 - 3,200 - 27,849 - - - 122,156 32,284 - - 401,832 207,430 37,426 - - - - 43,387 - - - Reserve Fund: Gas Tax 366,233 281,087 100,000 219,848 219,848 219,848 219,848 219,848 219,848 219,848 219,848 219,848 219,848 219,848 219,848 219,848 219,848 219,848 219,848 219,848 219,848 219,848 219,848 Reserve/Reserve Fund: Other - 120,334 125,000 - - - - - - - - - - - - - - - - - - - - Other (Donations) - 350,265 - - - - - - - - - - - - - - - - - - - - -
Transfer from Operating 324,531 368,928 615,000 - - - - - - - - - - - - - - - - - - - - Reserve Fund: New Capital (Tax Supported) - - - 729,488 964,349 1,142,565 1,330,077 1,395,652 1,916,502 1,677,310 2,164,933 2,180,654 2,724,744 3,933,501 3,349,827 3,697,784 4,069,024 4,464,837 5,017,462 5,471,257 5,954,762 6,469,994 7,018,659
Total Capital Financing 750,742 1,120,614 843,200 949,336 1,396,663 1,584,325 1,770,175 1,615,500 2,492,851 1,929,442 2,384,781 2,400,502 3,346,424 4,360,779 3,607,101 3,917,632 4,288,872 4,684,685 5,237,310 5,734,492 6,174,610 6,689,842 7,238,507
Total Capital Expenses less Capital Financing - - - - - - - - - - - - - - - - - - - - - - -
Watson & Associates Economists Ltd. H:\Southgate\2013 AM\Southgate AM Model FINAL.xlsx
F-2

Financing Strategy2013 Asset Management Plan
Town of Southgate
Non-Growth Related Debt Principal
Year (Inflated) 2014 2015 2016 2017 2018 2019 2020 2021 2022 2023 2024 2025 2026 2027 2028 2029 2030 2031 2032 2033
Budget 2013 - - - - - - - - - - - - - - - - - - - - -
2014 - - - - - - - - - - - - - - - - - - - -
2015 184,618 14,814 14,814 14,814 14,814 14,814 14,814 14,814 14,814 14,814 14,814 14,814 14,814 14,814 14,814 14,814 14,814 14,814 14,814
2016 221,913 17,807 17,807 17,807 17,807 17,807 17,807 17,807 17,807 17,807 17,807 17,807 17,807 17,807 17,807 17,807 17,807 17,807
2017 220,250 17,673 17,673 17,673 17,673 17,673 17,673 17,673 17,673 17,673 17,673 17,673 17,673 17,673 17,673 17,673 17,673
2018 - - - - - - - - - - - - - - - -
2019 234,345 18,804 18,804 18,804 18,804 18,804 18,804 18,804 18,804 18,804 18,804 18,804 18,804 18,804 18,804
2020 - - - - - - - - - - - - - -
2021 - - - - - - - - - - - - -
2022 - - - - - - - - - - - -
2023 - - - - - - - - - - -
2024 - - - - - - - - - -
2025 - - - - - - - - -
2026 - - - - - - - -
2027 - - - - - - -
2028 - - - - - -
2029 - - - - -
2030 - - - -
2031
Forecast
Table F-3Debt Requirements
2031 - - -
2032 - -
2033 - -
Total Annual Non-Growth Related Debt Charges 861,125 - - 14,814 32,621 50,294 50,294 69,099 69,099 69,099 69,099 69,099 69,099 69,099 69,099 69,099 69,099 69,099 69,099 69,099 69,099
Growth Related Debt Principal
Year (Inflated) 2014 2015 2016 2017 2018 2019 2020 2021 2022 2023 2024 2025 2026 2027 2028 2029 2030 2031 2032 2033
Budget 2013 - - - - - - - - - - - - - - - - - - - - -
2014 - - - - - - - - - - - - - - - - - - - -
2015 - - - - - - - - - - - - - - - - - - -
2016 - - - - - - - - - - - - - - - - - -
2017 - - - - - - - - - - - - - - - - -
2018 - - - - - - - - - - - - - - - -
2019 - - - - - - - - - - - - - - -
2020 - - - - - - - - - - - - - -
2021 - - - - - - - - - - - - -
2022 - - - - - - - - - - - - -
2023 - - - - - - - - - - - -
2024 - - - - - - - - - -
2025 - - - - - - - - -
2026 - - - - - - - -
2027 - - - - - - -
2028 - - - - - -
2029 - - - - -
2030 - - - -
2031 - - -
2032
Forecast
2032 - -
2033 - -
Total Annual Growth Related Debt Charges - - - - - - - - - - - - - - - - - - - - -
Development Charges Reserve Fund (All Tax Supported Funds) 2014 2015 2016 2017 2018 2019 2020 2021 2022 2023 2024 2025 2026 2027 2028 2029 2030 2031 2032 2033
Opening Balance 593,261 833,591 1,054,891 1,313,683 1,582,404 1,861,349 2,026,220 2,291,102 2,547,558 2,813,355 2,678,896 2,744,421 2,989,131 3,281,470 3,584,307 3,897,945 4,222,695 4,514,620 4,861,673 5,220,803
Development Charge Proceeds 223,985 228,464 233,034 237,694 242,448 247,297 252,243 206,503 210,633 214,846 219,143 223,526 227,996 232,556 237,207 241,952 246,791 251,726 256,761 261,896
Transfer to Capital - 27,849 - - - 122,156 32,284 - - 401,832 207,430 37,426 - - - - 43,387 - - -
Transfer to Operating (Debenture Payments) - - - - - - - - - - - - - - - - - - - -
Interest Earned 16,345 20,684 25,758 31,028 36,497 39,730 44,924 49,952 55,164 52,527 53,812 58,610 64,343 70,281 76,430 82,798 88,522 95,327 102,369 109,654
Closing Balance 833,591 1,054,891 1,313,683 1,582,404 1,861,349 2,026,220 2,291,102 2,547,558 2,813,355 2,678,896 2,744,421 2,989,131 3,281,470 3,584,307 3,897,945 4,222,695 4,514,620 4,861,673 5,220,803 5,592,353
Required from Development Charges - 27,849 - - - 122,156 32,284 - - 401,832 207,430 37,426 - - - - 43,387 - - -
Required Debenture Funding
Capital Reserve/Reserve Funds (Roads and Facilities) 2014 2015 2016 2017 2018 2019 2020 2021 2022 2023 2024 2025 2026 2027 2028 2029 2030 2031 2032 2033
Opening Balance 1,021,143 1,108,846 1,131,023 1,152,614 1,175,690 1,340,479 1,234,908 1,627,834 1,826,435 2,328,889 2,624,585 2,054,469 2,454,328 2,919,699 3,456,109 4,069,440 4,632,683 5,279,231 6,016,035 6,850,560
Transfers From Operating/Capital 795,449 964,349 1,141,556 1,330,100 1,534,157 1,786,717 2,038,318 2,327,721 2,637,443 2,968,978 3,323,100 3,701,562 4,105,906 4,537,667 4,998,375 5,489,868 6,014,290 6,573,604 7,170,195 7,806,081
Transfer to Capital 729,488 964,349 1,142,565 1,330,077 1,395,652 1,916,502 1,677,310 2,164,933 2,180,654 2,724,744 3,933,501 3,349,827 3,697,784 4,069,024 4,464,837 5,017,462 5,471,257 5,954,762 6,469,994 7,018,659
Transfer to Other
Transfer to Operating - - - - - - - - - - - - - - - - - - - -
Interest Earned 21,742 22,177 22,600 23,053 26,284 24,214 31,918 35,812 45,664 51,462 40,284 48,124 57,249 67,767 79,793 90,837 103,514 117,961 134,325 152,760
Closing Balance 1,108,846 1,131,023 1,152,614 1,175,690 1,340,479 1,234,908 1,627,834 1,826,435 2,328,889 2,624,585 2,054,469 2,454,328 2,919,699 3,456,109 4,069,440 4,632,683 5,279,231 6,016,035 6,850,560 7,790,742
Forecast
Forecast
Reserve and Reserve Fund Continuity SchedulesTable F-4
Note: Closing reserve fund balance as a percentage of capital asset balance 0.28% 0.28% 0.27% 0.27% 0.30% 0.27% 0.34% 0.37% 0.46% 0.50% 0.38% 0.44% 0.51% 0.59% 0.67% 0.75% 0.83% 0.91% 1.01% 1.11%
Watson & Associates Economists Ltd. H:\Southgate\2013 AM\Southgate AM Model FINAL.xlsx
F-3

Financing Strategy2013 Asset Management Plan
Town of Southgate
2014 2015 2016 2017 2018 2019 2020 2021 2022 2023 2024 2025 2026 2027 2028 2029 2030 2031 2032 2033
Net Expenditures/(Revenues)General Government (845,718) (1,000,380) (738,509) (753,200) (768,300) (783,600) (799,300) (815,300) (831,600) (848,200) (865,100) (882,400) (900,100) (918,100) (936,500) (955,200) (974,300) (993,700) (1,013,500) (1,033,800) (1,054,500) (1,075,600) (1,097,200) Protection 1,193,535 1,177,190 1,208,005 1,231,560 1,255,560 1,280,060 1,305,060 1,330,560 1,356,560 1,383,060 1,410,060 1,437,660 1,465,760 1,494,460 1,523,760 1,553,560 1,583,960 1,614,960 1,646,660 1,678,960 1,711,960 1,745,560 1,779,860 Building Department 31,025 47,565 350 400 400 400 400 500 500 500 500 500 500 500 600 600 600 600 600 700 700 700 700 Roads and Streetlighting 1,533,972 1,382,917 1,429,525 1,458,100 1,487,300 1,517,100 1,547,500 1,578,400 1,609,900 1,642,100 1,675,000 1,708,500 1,742,600 1,777,400 1,812,900 1,849,200 1,886,200 1,923,900 1,962,400 2,001,700 2,041,800 2,082,600 2,124,200 Waste Resources and Diversion Management 536,074 493,986 461,426 467,000 472,700 478,500 484,400 490,400 496,600 502,900 509,300 515,900 522,600 529,500 536,500 543,600 550,800 558,200 565,800 573,400 581,200 589,200 597,400 Recreation 321,364 329,404 286,765 292,500 298,300 304,200 310,300 316,500 322,800 329,300 335,900 342,600 349,400 356,400 363,500 370,700 378,100 385,600 393,300 401,200 409,200 417,400 425,800 Library 75,079 85,082 102,248 110,400 112,600 114,800 117,100 119,400 121,800 124,300 126,800 129,400 132,000 134,600 137,300 140,000 142,800 145,700 148,600 151,600 154,700 157,700 160,800 Cemetery 3,832 1,838 4,655 4,700 4,800 4,900 5,000 5,100 5,200 5,300 5,500 5,600 5,700 5,800 5,900 6,000 6,100 6,200 6,400 6,500 6,600 6,700 6,800 Planning/EDO 60,092 111,803 141,550 144,400 147,300 150,200 153,200 156,300 159,500 162,700 165,900 169,200 172,600 176,100 179,600 183,200 186,900 190,700 194,500 198,400 202,400 206,400 210,500 Industrial Park 259,672 266,386 174,315 176,214 178,114 180,114 182,114 184,114 186,214 188,314 190,514 192,714 194,914 197,214 199,514 201,914 204,314 206,814 209,314 211,914 214,514 217,214 219,914
Net Expenditures Due to Level of Service Adjustments - - - 22,950 46,818 61,550 76,853 92,743 94,598 96,490 98,419 100,388 102,396 104,443 106,532 108,663 110,836 113,053 115,314 117,620 119,973 122,372 124,820 Transfer to Capital - Roads and Facilities (historical only) 324,531 368,928 615,000 - - - - - - - - - - - - - - - - - - - - Transfer to Capital - Other Assets 199,989 233,455 224,000 228,480 233,050 237,711 242,465 247,314 252,260 257,306 262,452 267,701 273,055 278,516 284,086 289,768 295,563 301,475 307,504 313,654 319,927 326,326 332,852
Transfers to Reserve Funds (Historical)Transfers to Current Reserve Funds (Capital Related) - Roads and Facilities - 180,000 30,000 - - - - - - - - - - - - - - - - - - - - T f t C t R F d (C it l R l t d) Oth A t 50 000 100 000 102 000 104 040 106 121 108 243 110 408 112 616 114 869 117 166 119 509 121 899 124 337 126 824 129 361 131 948 134 587 137 279 140 024 142 825 145 681 148 595
Net Impact on TaxationForecast
Table F-5Tax Supported Operating Budget Forecast Summary
Actual 2011
Actual 2012
Budget 2013
Transfers to Current Reserve Funds (Capital Related) - Other Assets - 50,000 100,000 102,000 104,040 106,121 108,243 110,408 112,616 114,869 117,166 119,509 121,899 124,337 126,824 129,361 131,948 134,587 137,279 140,024 142,825 145,681 148,595
Transfer to Tax Supported Capital Reserve Fund (Roads & Facilities) - - - 795,449 964,349 1,141,556 1,330,100 1,534,157 1,786,717 2,038,318 2,327,721 2,637,443 2,968,978 3,323,100 3,701,562 4,105,906 4,537,667 4,998,375 5,489,868 6,014,290 6,573,604 7,170,195 7,806,081
DebenturesNew Debt - Growth Related - - - - - - - - - - - - - - - - - - - - - - - New Debt - Non-Growth Related - - - - - 14,814 32,621 50,294 50,294 69,099 69,099 69,099 69,099 69,099 69,099 69,099 69,099 69,099 69,099 69,099 69,099 69,099 69,099 Transfer from Reserve Fund: Development Charges (Debt) - - - - - - - - - - - - - - - - - - - - - - -
Prior Year Surplus Adjustment (14,281) 116,871 - - - - - - - - - - - - - - - - - - - - -
Total Taxation Levy 3,679,165 3,845,047 4,039,330 4,280,954 4,537,031 4,808,426 5,096,057 5,400,891 5,723,961 6,066,355 6,429,232 6,813,814 7,221,401 7,653,370 8,111,178 8,596,371 9,110,588 9,655,563 10,233,138 10,845,262 11,494,002 12,181,548 12,910,221
Taxation Levy AnalysisPrior Year Taxation Levy 3,507,422 3,679,165 3,845,047 4,039,330 4,280,954 4,537,031 4,808,426 5,096,057 5,400,891 5,723,961 6,066,355 6,429,232 6,813,814 7,221,401 7,653,370 8,111,178 8,596,371 9,110,588 9,655,563 10,233,138 10,845,262 11,494,002 12,181,548 Add: Provision for Assessment Growth (see below) - - - 40,393 42,810 45,370 48,084 50,961 54,009 57,240 60,664 64,292 68,138 72,214 76,534 81,112 85,964 91,106 96,556 102,331 108,453 114,940 121,815
Current Year Taxation Levy at 0.0% Increase 3,507,422 3,679,165 3,845,047 4,079,723 4,323,763 4,582,402 4,856,511 5,147,017 5,454,900 5,781,200 6,127,019 6,493,524 6,881,953 7,293,615 7,729,904 8,192,290 8,682,335 9,201,694 9,752,119 10,335,470 10,953,715 11,608,942 12,303,363 Additional Increase in Taxation Levy for the year 171,743 165,882 194,283 201,230 213,268 226,025 239,546 253,874 269,060 285,155 302,213 320,290 339,449 359,755 381,274 404,081 428,253 453,869 481,020 509,793 540,287 572,605 606,858 Total Taxation Levy 3,679,165 3,845,047 4,039,330 4,280,954 4,537,031 4,808,426 5,096,057 5,400,891 5,723,961 6,066,355 6,429,232 6,813,814 7,221,401 7,653,370 8,111,178 8,596,371 9,110,588 9,655,563 10,233,138 10,845,262 11,494,002 12,181,548 12,910,221
Percentage Increase (Factoring in Assessment Growth) 4.93% 4.93% 4.93% 4.93% 4.93% 4.93% 4.93% 4.93% 4.93% 4.93% 4.93% 4.93% 4.93% 4.93% 4.93% 4.93% 4.93% 4.93% 4.93% 4.93%
2014 2015 2016 2017 2018 2019 2020 2021 2022 2023 2024 2025 2026 2027 2028 2029 2030 2031 2032 2033Assessment Growth Estimate (%) 1.0% 1.0% 1.0% 1.0% 1.0% 1.0% 1.0% 1.0% 1.0% 1.0% 1.0% 1.0% 1.0% 1.0% 1.0% 1.0% 1.0% 1.0% 1.0% 1.0%
Forecast
Annual Infrastructure Funding Gap Analysis
$0
$1,000,000
$2,000,000
$3,000,000
$4,000,000
$5,000,000
$6,000,000
$7,000,000
$8,000,000
$9,000,000
2014 2015 2016 2017 2018 2019 2020 2021 2022 2023 2024 2025 2026 2027 2028 2029 2030 2031 2032 2033
(Inflated)
Current Capital with Inflation Recommended Funding Increase Optimal Funding
Watson & Associates Economists Ltd. H:\Southgate\2013 AM\Southgate AM Model FINAL.xlsx
F-4

Watson & Associates Economists Ltd. H:\Southgate\2013 AM\Southgate AMP Report.docx
APPENDIX G
WATER ASSET MANAGEMENT STRATEGY & FINANCING
STRATEGY


2014 2015 2016 2017 2018 2019 2020 2021 2022 2023 2024 2025 2026 2027 2028 2029 2030 2031 2032 2033
Growth Projects (DC)
Water: New Well 700,000 700,000 Water: New Water Tower 1,000,000 1,000,000
Total Capital Expenditures 1,700,000 - - - - - - - - - - 1,000,000 - - - - 700,000 - - - - Capital Financing
Provincial/Federal Grants - - - - - - - - - - - - - - - - - - - - - Developer Contributions - - - - - - - - - - - - - - - - - - - - - Growth Related Debenture Requirements - - - - - - - - - - - - - - - - - - - - - Non-Growth Related Debenture Requirements - - - - - - - - - - - - - - - - - - - - - Development Charges Reserve Fund 532,500 - - - - - - - - - - 313,200 - - - - 219,300 - - - - Tax Supported Capital Reserve Fund 1,167,500 - - - - - - - - - - 686,800 - - - - 480,700 - - - - Lifecycle Reserve Fund - - - - - - - - - - - - - - - - - - - - -
Total Capital Financing 1,700,000 - - - - - - - - - - 1,000,000 - - - - 700,000 - - - -
Description TotalForecast
Town of Southgate2013 Asset Management Plan
Expansion Projects - Uninflated
Table G-1Water Assets
Watson & Associates Economists Ltd. H:\Southgate\2013 AM\Southgate AM Model FINAL.xlsx
G-1

2014 2015 2016 2017 2018 2019 2020 2021 2022 2023 2024 2025 2026 2027 2028 2029 2030 2031 2032 2033
Prior Capital Expenses
Water Capital Expenses 519,984 16,466 160,000 - - - - - - - - - - - - - - - - - - - -
Capital Replacement Forecast
Facilities - - - 3,729 - - - - - - - - 359,088 250,976 - - - - - - Water Mains - - - - - - - - - - - - - - 670,158 690,262 710,970 732,299 754,268 776,896
Level of Service Adjustments
Rehabiliation and Renewal Works - - - - - - - - - - - - - - - - - - - - Capital Expansion Forecast
Growth Projects (DC) - - - - - - - - - - 1,384,234 - - - - 1,123,295 - - - -
Total Expenditures 519,984 16,466 160,000 - - - 3,729 - - - - - - 1,384,234 - 359,088 250,976 670,158 1,813,557 710,970 732,299 754,268 776,896
Capital Financing
Provincial/Federal Grants 60,065 - - - - - - - - - - - - - - - - - - - - - - Non-Growth Related Debentures - - - - - - - - - - - - - - - - - - - - - - - Growth Related Debentures - - - - - - - - - - - - - - - - - - - - - - - Reserve Fund: Development Charges - - - - - - - - - - - - - 433,542 - - - - 351,912 - - - - Reserve Fund: Gas Tax - - - - - - - - - - - - - - - - - - - - - - -
Town of Southgate2013 Asset Management Plan
Financing Strategy
Description Actual 2011
Actual 2012
Budget 2013
Forecast
Table G-2
Water Capital Forecast
Reserve Fund: Gas Tax Reserve/Reserve Fund: Other 447,483 - 160,000 - - - - - - - - - - - - - - - - - - - - Other (Donations) - - - - - - - - - - - - - - - - - - - - - - -
Transfer from Operating 12,435 16,466 - - - - - - - - - - - - - - - - - - - - - Reserve Fund: New Capital - - - - - - 3,729 - - - - - - 950,692 - 359,088 250,976 670,158 1,461,645 710,970 732,299 754,268 776,896
Total Capital Financing 519,984 16,466 160,000 - - - 3,729 - - - - - - 1,384,234 - 359,088 250,976 670,158 1,813,557 710,970 732,299 754,268 776,896
Total Capital Expenses less Capital Financing - - - - - - - - - - - - - - - - - - - - - - -
Watson & Associates Economists Ltd. H:\Southgate\2013 AM\Southgate AM Model FINAL.xlsx
G-2

Town of Southgate2013 Asset Management Plan
Financing Strategy
Non-Growth Related Debt Principal
Year (Inflated) 2014 2015 2016 2017 2018 2019 2020 2021 2022 2023 2024 2025 2026 2027 2028 2029 2030 2031 2032 2033
Budget 2013 - - - - - - - - - - - - - - - - - - - - -
2014 - - - - - - - - - - - - - - - - - - - -
2015 - - - - - - - - - - - - - - - - - - -
2016 - - - - - - - - - - - - - - - - - -
2017 - - - - - - - - - - - - - - - - -
2018 - - - - - - - - - - - - - - - -
2019 - - - - - - - - - - - - - - -
2020 - - - - - - - - - - - - - -
2021 - - - - - - - - - - - - -
2022 - - - - - - - - - - - -
2023 - - - - - - - - - - -
2024 - - - - - - - - - -
2025 - - - - - - - - -
2026 - - - - - - - -
2027 - - - - - - -
2028 - - - - - -
2029 - - - - -
2030 - - - -
2031
Forecast
Table G-3Debt Requirements
2031 - - -
2032 - -
2033 - -
Total Annual Non-Growth Related Debt Charges - - - - - - - - - - - - - - - - - - - - -
Growth Related Debt Principal
Year (Inflated) 2014 2015 2016 2017 2018 2019 2020 2021 2022 2023 2024 2025 2026 2027 2028 2029 2030 2031 2032 2033
Budget 2013 - - - - - - - - - - - - - - - - - - - - -
2014 - - - - - - - - - - - - - - - - - - - -
2015 - - - - - - - - - - - - - - - - - - -
2016 - - - - - - - - - - - - - - - - - -
2017 - - - - - - - - - - - - - - - - -
2018 - - - - - - - - - - - - - - - -
2019 - - - - - - - - - - - - - - -
2020 - - - - - - - - - - - - - -
2021 - - - - - - - - - - - - -
2022 - - - - - - - - - - - - -
2023 - - - - - - - - - - - -
2024 - - - - - - - - - -
2025 - - - - - - - - -
2026 - - - - - - - -
2027 - - - - - - -
2028 - - - - - -
2029 - - - - -
2030 - - - -
2031 - - -
2032
Forecast
2032 - -
2033 - -
Total Annual Growth Related Debt Charges - - - - - - - - - - - - - - - - - - - - -
Development Charges Reserve Fund
(Water) 2014 2015 2016 2017 2018 2019 2020 2021 2022 2023 2024 2025 2026 2027 2028 2029 2030 2031 2032 2033
Opening Balance 179,769 254,332 331,805 412,276 495,833 582,567 672,573 765,945 847,021 931,033 1,018,067 665,997 750,494 838,105 928,920 1,023,032 761,586 855,403 952,669 1,053,482
Development Charge Proceeds 69,576 70,968 72,387 73,835 75,311 76,818 78,354 64,467 65,757 67,072 68,413 69,782 71,177 72,601 74,053 75,534 77,044 78,585 80,157 81,760
Transfer to Capital - - - - - - - - - - 433,542 - - - - 351,912 - - - -
Transfer to Other - - - - - - - - - - - - - - - - - - - -
Transfer to Operating (Debenture Payments) - - - - - - - - - - - - - - - - - - - -
Interest Earned 4,987 6,506 8,084 9,722 11,423 13,188 15,019 16,608 18,256 19,962 13,059 14,716 16,433 18,214 20,059 14,933 16,773 18,680 20,657 22,705
Closing Balance 254,332 331,805 412,276 495,833 582,567 672,573 765,945 847,021 931,033 1,018,067 665,997 750,494 838,105 928,920 1,023,032 761,586 855,403 952,669 1,053,482 1,157,947
Required from Development Charges - - - - - - - - - - 433,542 - - - - 351,912 - - - -
Required Debenture Funding
Capital Reserve/Reserve Funds (Water) 2014 2015 2016 2017 2018 2019 2020 2021 2022 2023 2024 2025 2026 2027 2028 2029 2030 2031 2032 2033
Opening Balance 378,977 519,675 683,953 874,294 1,089,587 1,340,186 1,630,812 1,965,214 2,323,184 2,705,963 3,114,848 2,581,383 3,027,003 3,136,115 3,379,473 3,222,796 2,279,453 2,107,672 1,936,541 1,766,464
Transfers From Operating/Capital 130,508 150,867 173,198 197,658 224,321 258,649 295,868 312,418 329,721 347,809 366,612 386,267 406,707 428,069 450,289 473,606 497,862 523,197 549,555 576,981
Transfer to Capital - - - 3,729 - - - - - - 950,692 - 359,088 250,976 670,158 1,461,645 710,970 732,299 754,268 776,896
Transfer to Other
Transfer to Operating - - - - - - - - - - - - - - - - - - - -
Interest Earned 10,190 13,411 17,143 21,364 26,278 31,977 38,534 45,553 53,058 61,075 50,615 59,353 61,492 66,264 63,192 44,695 41,327 37,971 34,637 31,331
Reserve and Reserve Fund Continuity SchedulesTable G-4
Forecast
Forecast
Closing Balance 519,675 683,953 874,294 1,089,587 1,340,186 1,630,812 1,965,214 2,323,184 2,705,963 3,114,848 2,581,383 3,027,003 3,136,115 3,379,473 3,222,796 2,279,453 2,107,672 1,936,541 1,766,464 1,597,880
Note: Closing reserve fund balance as a percentage of capital asset balance 0.13% 0.17% 0.21% 0.25% 0.30% 0.35% 0.41% 0.47% 0.54% 0.60% 0.48% 0.55% 0.55% 0.58% 0.53% 0.37% 0.33% 0.29% 0.26% 0.23%
Watson & Associates Economists Ltd. H:\Southgate\2013 AM\Southgate AM Model FINAL.xlsx
G-3

Town of Southgate2013 Asset Management Plan
Financing Strategy
2014 2015 2016 2017 2018 2019 2020 2021 2022 2023 2024 2025 2026 2027 2028 2029 2030 2031 2032 2033
Water Net Expenditures 227,328 223,024 284,620 290,300 296,100 302,000 308,000 314,200 320,500 326,900 333,500 340,200 347,000 354,000 361,100 368,400 375,800 383,400 391,000 398,800 406,700 414,800 423,100
Net Expenditures due to Level of Service Adjustments - - - 4,692 9,572 14,645 19,917 25,394 25,902 26,420 26,948 27,487 28,037 28,598 29,170 29,753 30,348 30,955 31,574 32,206 32,850 33,507 34,177
Transfers to Reserve FundsTransfers to Capital Reserve Funds (Historical Only) - - 85,380 - - - - - - - - - - - - - - - - - - - - Transfer to Water Capital Reserve Fund - - - 130,508 150,867 173,198 197,658 224,321 258,649 295,868 312,418 329,721 347,809 366,612 386,267 406,707 428,069 450,289 473,606 497,862 523,197 549,555 576,981
DebenturesNew Debt - Growth Related - - - - - - - - - - - - - - - - - - - - - - - New Debt - Non-Growth Related - - - - - - - - - - - - - - - - - - - - - - - Transfer from Reserve Fund: Development Charges (Debt) - - - - - - - - - - - - - - - - - - - - - - -
Prior Year Surplus Adjustment 196,027 149,094 - - - - - - - - - - - - - - - - - - - - -
Water Service Revenue 423,355 372,118 370,000 425,500 456,539 489,843 525,575 563,915 605,051 649,188 672,866 697,408 722,846 749,210 776,537 804,860 834,217 864,644 896,180 928,868 962,747 997,862 1,034,258
Percentage Increase 15.0% 7.3% 7.3% 7.3% 7.3% 7.3% 7.3% 3.6% 3.6% 3.6% 3.6% 3.6% 3.6% 3.6% 3.6% 3.6% 3.6% 3.6% 3.6% 3.6%
Net Impact on Water Revenue Actual 2011
Actual 2012
Budget 2013
Forecast
Table G-5Water Operating Budget Forecast Summary
$0
$100,000
$200,000
$300,000
$400,000
$500,000
$600,000
$700,000
2014 2015 2016 2017 2018 2019 2020 2021 2022 2023 2024 2025 2026 2027 2028 2029 2030 2031 2032 2033
Annual Infrastructure Funding Gap Analysis(Inflated)
Current Capital with Inflation Recommended Funding Increase Optimal Funding p g p g
Watson & Associates Economists Ltd. H:\Southgate\2013 AM\Southgate AM Model FINAL.xlsx
G-4

Watson & Associates Economists Ltd. H:\Southgate\2013 AM\Southgate AMP Report.docx
APPENDIX H
WASTEWATER ASSET MANAGEMENT STRATEGY &
FINANCING STRATEGY


2014 2015 2016 2017 2018 2019 2020 2021 2022 2023 2024 2025 2026 2027 2028 2029 2030 2031 2032 2033
Growth Projects (DC)
Wastewater: Phase 1 Ida Street Trunk Sanitary Sewer South Main 163,400 163,400 Wastewater: Phase 2 Ida Street Sanitary Sewer North Main 211,000 211,000 Wastewater: Ida Street South Sanitary Extension to Industrial Park 464,600 464,600 Wastewater: New Sewage Treatment Plant 14,000,000 14,000,000
Total Capital Expenditures 14,839,000 - - - - - - - - - - 839,000 - - - - - 14,000,000 - - - Capital Financing
Provincial/Federal Grants - - - - - - - - - - - - - - - - - - - - - Developer Contributions - - - - - - - - - - - - - - - - - - - - - Growth Related Debenture Requirements - - - - - - - - - - - - - - - - - - - - - Non-Growth Related Debenture Requirements - - - - - - - - - - - - - - - - - - - - - Development Charges Reserve Fund 1,662,845 - - - - - - - - - - 384,545 - - - - - 1,278,300 - - - Tax Supported Capital Reserve Fund 13,176,155 - - - - - - - - - - 454,455 - - - - - 12,721,700 - - - Lifecycle Reserve Fund - - - - - - - - - - - - - - - - - - - - -
Total Capital Financing 14,839,000 - - - - - - - - - - 839,000 - - - - - 14,000,000 - - -
Description Total
Town of Southgate2013 Asset Management Plan
Expansion Projects - Uninflated
Table H-1
Forecast
Wastewater Assets
Watson & Associates Economists Ltd. H:\Southgate\2013 AM\Southgate AM Model FINAL.xlsx
H-1

2014 2015 2016 2017 2018 2019 2020 2021 2022 2023 2024 2025 2026 2027 2028 2029 2030 2031 2032 2033
Prior Capital Expenses
Wastewater Capital Expenses 42,458 66,321 847,170 - - - - - - - - - - - - - - - - - - - - - - - - - - - - - - - - - - - - - - - -
Capital Replacement Forecast
Facilities 119,551 123,137 126,831 130,636 134,555 80,615 - 162,388 167,260 172,278 180,054 - - - - - - 198,397 204,349 210,479 Sewer Mains - - - - - - - - - - - - - - - - - - - -
Level of Service Adjustments
Rehabiliation and Renewal Works - - - - - - - - - - - - - - - - - - - - Capital Expansion Forecast
Growth Projects (DC) - - - - - - - - - - 1,161,372 - - - - - 23,139,867 - - -
Total Expenditures 42,458 66,321 847,170 119,551 123,137 126,831 130,636 134,555 80,615 - 162,388 167,260 172,278 1,341,426 - - - - - 23,139,867 198,397 204,349 210,479
Capital Financing
Provincial/Federal Grants - 35,891 564,780 - - - - - - - - - - - - - - - - - - - - Non-Growth Related Debentures - - - - - - - - - - - - - - - - - - - 8,000,000 - - - Growth Related Debentures - - - - - - - - - - - - - - - - - - - - - - - Reserve Fund: Development Charges - - - - - - - - - - - - - 532,300 - - - - - 2,112,835 - - - Reserve Fund: Gas Tax - - - - - - - - - - - - - - - - - - - - - - - Reserve/Reserve Fund: Other - 20 811 282 390 - - - - - - - - - - - - - - - - - - - -
Financing Strategy2013 Asset Management Plan
Town of Southgate
Description Actual 2011
Actual 2012
Budget 2013
Forecast
Table H-2
Water Capital Forecast
Reserve/Reserve Fund: Other 20,811 282,390 Other (Donations) - - - - - - - - - - - - - - - - - - - - - - -
Transfer from Operating 42,458 9,618 - - - - - - - - - - - - - - - - - - - - - Reserve Fund: New Capital - - - 119,551 123,137 126,831 130,636 134,555 80,615 - 162,388 167,260 172,278 809,126 - - - - - 13,027,032 198,397 204,349 210,479
Total Capital Financing 42,458 66,321 847,170 119,551 123,137 126,831 130,636 134,555 80,615 - 162,388 167,260 172,278 1,341,426 - - - - - 23,139,867 198,397 204,349 210,479
Total Capital Expenses less Capital Financing - - - - - - - - - - - - - - - - - - - - - - -
Watson & Associates Economists Ltd. H:\Southgate\2013 AM\Southgate AM Model FINAL.xlsx
H-2
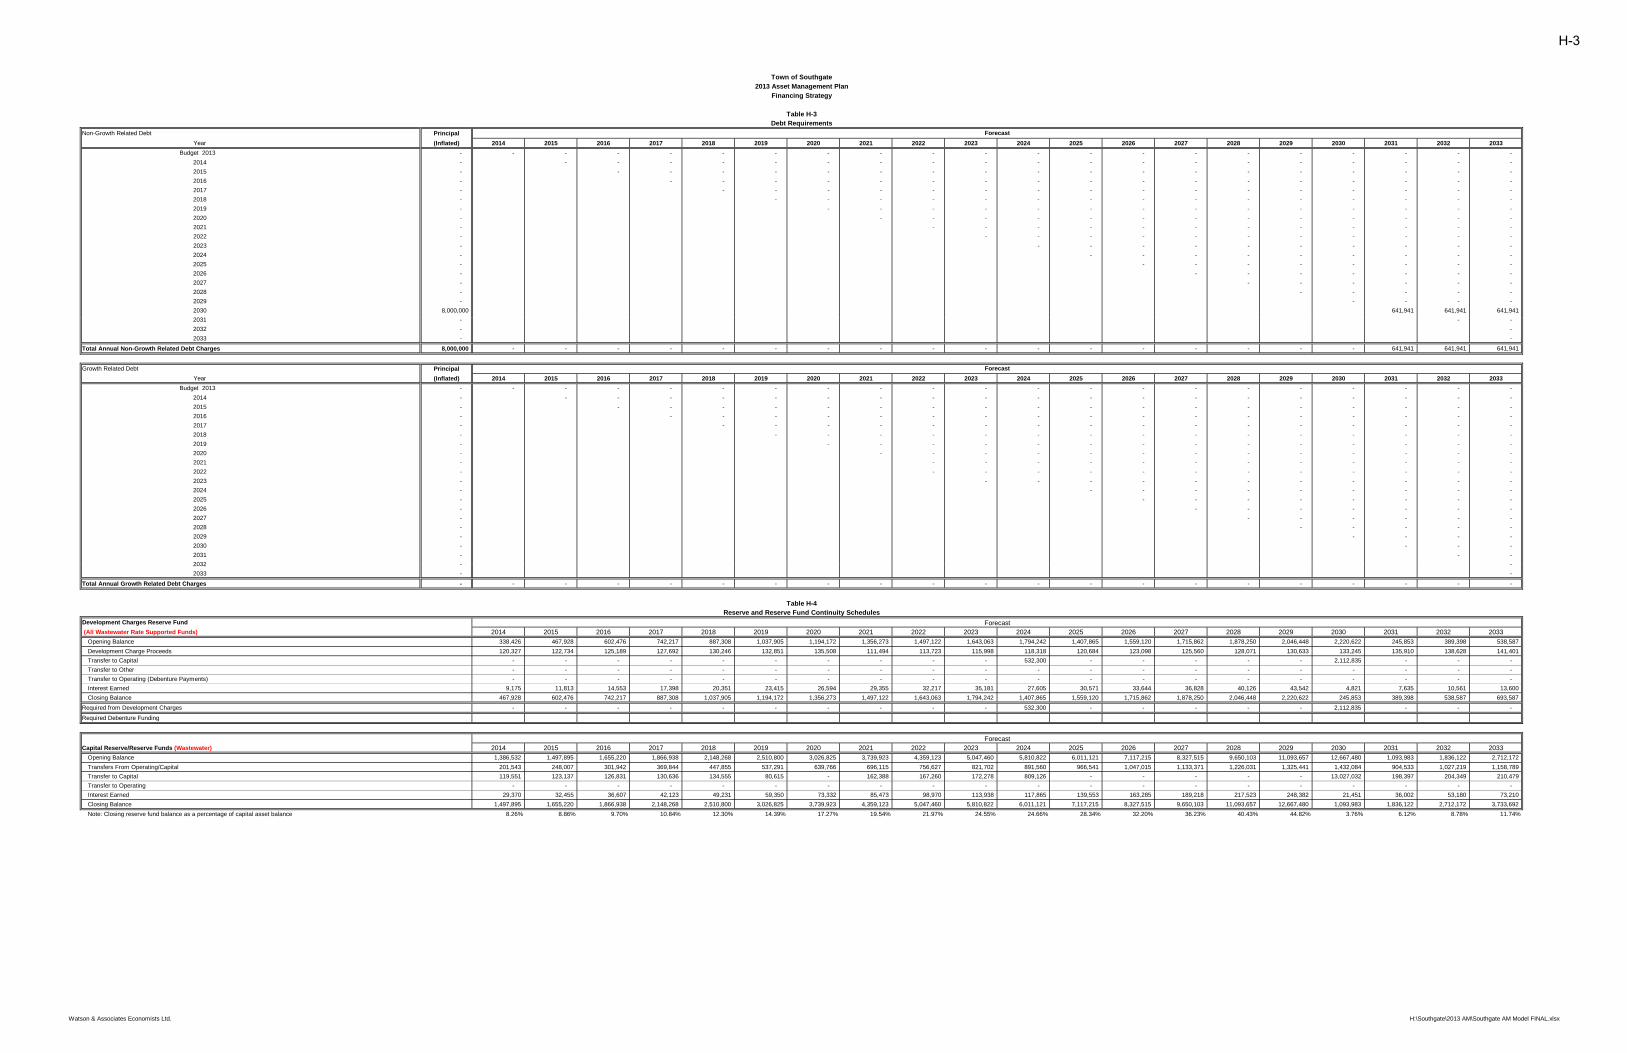
Financing Strategy2013 Asset Management Plan
Town of Southgate
Non-Growth Related Debt Principal
Year (Inflated) 2014 2015 2016 2017 2018 2019 2020 2021 2022 2023 2024 2025 2026 2027 2028 2029 2030 2031 2032 2033
Budget 2013 - - - - - - - - - - - - - - - - - - - - -
2014 - - - - - - - - - - - - - - - - - - - -
2015 - - - - - - - - - - - - - - - - - - -
2016 - - - - - - - - - - - - - - - - - -
2017 - - - - - - - - - - - - - - - - -
2018 - - - - - - - - - - - - - - - -
2019 - - - - - - - - - - - - - - -
2020 - - - - - - - - - - - - - -
2021 - - - - - - - - - - - - -
2022 - - - - - - - - - - - -
2023 - - - - - - - - - - -
2024 - - - - - - - - - -
2025 - - - - - - - - -
2026 - - - - - - - -
2027 - - - - - - -
2028 - - - - - -
2029 - - - - -
2030 8,000,000 641,941 641,941 641,941
2031
Forecast
Table H-3Debt Requirements
2031 - - -
2032 - -
2033 - -
Total Annual Non-Growth Related Debt Charges 8,000,000 - - - - - - - - - - - - - - - - - 641,941 641,941 641,941
Growth Related Debt Principal
Year (Inflated) 2014 2015 2016 2017 2018 2019 2020 2021 2022 2023 2024 2025 2026 2027 2028 2029 2030 2031 2032 2033
Budget 2013 - - - - - - - - - - - - - - - - - - - - -
2014 - - - - - - - - - - - - - - - - - - - -
2015 - - - - - - - - - - - - - - - - - - -
2016 - - - - - - - - - - - - - - - - - -
2017 - - - - - - - - - - - - - - - - -
2018 - - - - - - - - - - - - - - - -
2019 - - - - - - - - - - - - - - -
2020 - - - - - - - - - - - - - -
2021 - - - - - - - - - - - - -
2022 - - - - - - - - - - - - -
2023 - - - - - - - - - - - -
2024 - - - - - - - - - -
2025 - - - - - - - - -
2026 - - - - - - - -
2027 - - - - - - -
2028 - - - - - -
2029 - - - - -
2030 - - - -
2031 - - -
2032
Forecast
2032 - -
2033 - -
Total Annual Growth Related Debt Charges - - - - - - - - - - - - - - - - - - - - -
Development Charges Reserve Fund
(All Wastewater Rate Supported Funds) 2014 2015 2016 2017 2018 2019 2020 2021 2022 2023 2024 2025 2026 2027 2028 2029 2030 2031 2032 2033
Opening Balance 338,426 467,928 602,476 742,217 887,308 1,037,905 1,194,172 1,356,273 1,497,122 1,643,063 1,794,242 1,407,865 1,559,120 1,715,862 1,878,250 2,046,448 2,220,622 245,853 389,398 538,587
Development Charge Proceeds 120,327 122,734 125,189 127,692 130,246 132,851 135,508 111,494 113,723 115,998 118,318 120,684 123,098 125,560 128,071 130,633 133,245 135,910 138,628 141,401
Transfer to Capital - - - - - - - - - - 532,300 - - - - - 2,112,835 - - -
Transfer to Other - - - - - - - - - - - - - - - - - - - -
Transfer to Operating (Debenture Payments) - - - - - - - - - - - - - - - - - - - -
Interest Earned 9,175 11,813 14,553 17,398 20,351 23,415 26,594 29,355 32,217 35,181 27,605 30,571 33,644 36,828 40,126 43,542 4,821 7,635 10,561 13,600
Closing Balance 467,928 602,476 742,217 887,308 1,037,905 1,194,172 1,356,273 1,497,122 1,643,063 1,794,242 1,407,865 1,559,120 1,715,862 1,878,250 2,046,448 2,220,622 245,853 389,398 538,587 693,587
Required from Development Charges - - - - - - - - - - 532,300 - - - - - 2,112,835 - - -
Required Debenture Funding
Capital Reserve/Reserve Funds (Wastewater) 2014 2015 2016 2017 2018 2019 2020 2021 2022 2023 2024 2025 2026 2027 2028 2029 2030 2031 2032 2033
Opening Balance 1,386,532 1,497,895 1,655,220 1,866,938 2,148,268 2,510,800 3,026,825 3,739,923 4,359,123 5,047,460 5,810,822 6,011,121 7,117,215 8,327,515 9,650,103 11,093,657 12,667,480 1,093,983 1,836,122 2,712,172
Transfers From Operating/Capital 201,543 248,007 301,942 369,844 447,855 537,291 639,766 696,115 756,627 821,702 891,560 966,541 1,047,015 1,133,371 1,226,031 1,325,441 1,432,084 904,533 1,027,219 1,158,789
Transfer to Capital 119,551 123,137 126,831 130,636 134,555 80,615 - 162,388 167,260 172,278 809,126 - - - - - 13,027,032 198,397 204,349 210,479
Transfer to Operating - - - - - - - - - - - - - - - - - - - -
Interest Earned 29,370 32,455 36,607 42,123 49,231 59,350 73,332 85,473 98,970 113,938 117,865 139,553 163,285 189,218 217,523 248,382 21,451 36,002 53,180 73,210
Closing Balance 1,497,895 1,655,220 1,866,938 2,148,268 2,510,800 3,026,825 3,739,923 4,359,123 5,047,460 5,810,822 6,011,121 7,117,215 8,327,515 9,650,103 11,093,657 12,667,480 1,093,983 1,836,122 2,712,172 3,733,692
Reserve and Reserve Fund Continuity SchedulesTable H-4
Forecast
Forecast
Note: Closing reserve fund balance as a percentage of capital asset balance 8.26% 8.86% 9.70% 10.84% 12.30% 14.39% 17.27% 19.54% 21.97% 24.55% 24.66% 28.34% 32.20% 36.23% 40.43% 44.82% 3.76% 6.12% 8.78% 11.74%
Watson & Associates Economists Ltd. H:\Southgate\2013 AM\Southgate AM Model FINAL.xlsx
H-3

Financing Strategy2013 Asset Management Plan
Town of Southgate
2014 2015 2016 2017 2018 2019 2020 2021 2022 2023 2024 2025 2026 2027 2028 2029 2030 2031 2032 2033
Wastewater Net Expenditures 172,428 177,503 181,365 185,000 188,700 192,500 196,400 200,300 204,300 208,400 212,600 216,900 221,200 225,600 230,100 234,700 239,400 244,200 249,100 254,100 259,200 264,400 269,700
Net Expenditures due to Level of Service Adjustments - - - 10,200 15,606 21,224 21,649 22,082 22,523 22,974 23,433 23,902 24,380 24,867 25,365 25,872 26,390 26,917 27,456 28,005 28,565 29,136 29,719
Transfers to Reserve FundsTransfers to Current Reserve Funds (Capital Related) - - 166,635 - - - - - - - - - - - - - - - - - - - - Reserve Fund: New Capital (Wastewater) - - - 201,543 248,007 301,942 369,844 447,855 537,291 639,766 696,115 756,627 821,702 891,560 966,541 1,047,015 1,133,371 1,226,031 1,325,441 1,432,084 904,533 1,027,219 1,158,789
DebenturesNew Debt - Growth Related - - - - - - - - - - - - - - - - - - - - - - - New Debt - Non-Growth Related - - - - - - - - - - - - - - - - - - - - 641,941 641,941 641,941 Transfer from Reserve Fund: Development Charges (Debt) - - - - - - - - - - - - - - - - - - - - - - -
Prior Year Surplus Adjustment 204,648 176,602 - - - - - - - - - - - - - - - - - - - - -
Wastewater Service Revenue 377,076 354,105 348,000 396,743 452,313 515,666 587,893 670,237 764,114 871,140 932,148 997,429 1,067,282 1,142,027 1,222,006 1,307,587 1,399,161 1,497,148 1,601,997 1,714,189 1,834,239 1,962,696 2,100,149
Percentage Increase 14.0% 14.0% 14.0% 14.0% 14.0% 14.0% 14.0% 7.0% 7.0% 7.0% 7.0% 7.0% 7.0% 7.0% 7.0% 7.0% 7.0% 7.0% 7.0% 7.0%
Net Impact on Wastewater Revenue Actual 2011
Actual 2012
Budget 2013
Forecast
Table H-5Wastewater Operating Budget Forecast Summary
$0
$200,000
$400,000
$600,000
$800,000
$1,000,000
$1,200,000
$1,400,000
2014 2015 2016 2017 2018 2019 2020 2021 2022 2023 2024 2025 2026 2027 2028 2029 2030 2031 2032 2033
Annual Infrastructure Funding Gap Analysis(Inflated)
C C i l i h I fl i R d dF di I O i l F diCurrent Capital with Inflation Recommended Funding Increase Optimal Funding
Watson & Associates Economists Ltd. H:\Southgate\2013 AM\Southgate AM Model FINAL.xlsx
H-4