Satellite Monitoring of the Surface Water and Energy Budget in the Central Tibetan Plateau
12
ADVANCES IN ATMOSPHERIC SCIENCES, VOL. 25, NO. 6, 2008, 974–985 Satellite Monitoring of the Surface Water and Energy Budget in the Central Tibetan Plateau YANG Kun ∗ 1,2 ( ) and Toshio KOIKE 2 1 Institute of Tibetan Plateau Research, Chinese Academy of Sciences, P. O. 2871, Beijing 100085 2 Department of Civil Engineering, The University of Tokyo, Tokyo 113-8656, Japan (Received 16 May 2007; revised 12 September 2008) ABSTRACT The water and energy cycle in the Tibetan Plateau is an important component of Monsoon Asia and the global energy and water cycle. Using data at a CEOP (Coordinated Enhanced Observing Period)-Tibet site, this study presents a first-order evaluation on the skill of weather forecasting from GCMs and satellites in producing precipitation and radiation estimates. The satellite data, together with the satellite leaf area index, are then integrated into a land data assimilation system (LDAS-UT) to estimate the soil moisture and surface energy budget on the Plateau. The system directly assimilates the satellite microwave brightness temperature, which is strongly affected by soil moisture but not by cloud layers, into a simple biosphere model. A major feature of this system is a dual-pass assimilation technique, which can auto-calibrate model parameters in one pass and estimate the soil moisture and energy budget in the other pass. The system outputs, including soil moisture, surface temperature, surface energy partition, and the Bowen ratio, are compared with observations, land surface models, the Global Land Data Assimilation System, and four general circulation models. The results show that this satellite data-based system has a high potential for a reliable estimation of the regional surface energy budget on the Plateau. Key words: Tibetan Plateau, CEOP, microwave land data assimilation, surface energy budget, satellite products Citation: Yang, K., and T. Koike, 2008: Satellite monitoring of the surface water and energy budget in the central Tibetan Plateau. Adv. Atmos. Sci., 25(6), 974–985, doi: 10.1007/s00376-008-0974-8. 1. Introduction It is well known that the Tibetan Plateau (TP) is a huge elevated heat source during the summer (Ye and Gao, 1979), and this elevated heating to the atmo- sphere plays a fundamental role in the formation and maintenance of the summer circulation in the Asian region. The reverse temperature gradient over the TP and the Indian Ocean has been considered as an in- dex of the onset and withdraw of the Asian summer monsoon (Yanai et al., 1992). Wu and Zhang (1998) showed that the onset of the South Asian monsoon is directly linked to the thermal forcing as well as the mechanical forcing of the TP. Based on observa- tions, theoretical analysis, as well as large-eddy sim- ulations, Yang et al. (2004) demonstrated that the TP atmospheric boundary layer (ABL) can extend up to 3 km AGL (Abobe Ground Level) in the pre- monsoon season, which is mainly supported by sensi- ble heat from the surface. They also suggested that the TP mountain-valley circulations (MVC) interact with the diurnal evolvement of convection and thus the MVC differs from the widely accepted daytime upslope/nighttime downslope pattern. Fujinami et al. (2005) found this theory compatible with the satellite- observed cloud evolution. Using satellite data, Fu et al. (2006) established that the TP provides a short cir- cuit for the cross-tropopause transport of waver vapor in the Asian region, which is also driven by the ele- vated surface heating over the TP. Therefore, all of these atmospheric processes are related to the strong diurnal and seasonal variations of the TP land surface fluxes. To clarify the land-atmosphere interactions over the Tibetan Plateau in the context of the Asian mon- soon system, scientists in East Asia initiated the ∗ Corresponding author: YANG Kun, [email protected]
Transcript of Satellite Monitoring of the Surface Water and Energy Budget in the Central Tibetan Plateau

ADVANCES IN ATMOSPHERIC SCIENCES, VOL. 25, NO. 6, 2008, 974–985
Satellite Monitoring of the Surface Water and
Energy Budget in the Central Tibetan Plateau
YANG Kun∗1,2 (� �) and Toshio KOIKE2
1Institute of Tibetan Plateau Research, Chinese Academy of Sciences, P. O. 2871, Beijing 100085
2Department of Civil Engineering, The University of Tokyo, Tokyo 113-8656, Japan
(Received 16 May 2007; revised 12 September 2008)
ABSTRACT
The water and energy cycle in the Tibetan Plateau is an important component of Monsoon Asia andthe global energy and water cycle. Using data at a CEOP (Coordinated Enhanced Observing Period)-Tibetsite, this study presents a first-order evaluation on the skill of weather forecasting from GCMs and satellitesin producing precipitation and radiation estimates. The satellite data, together with the satellite leaf areaindex, are then integrated into a land data assimilation system (LDAS-UT) to estimate the soil moisture andsurface energy budget on the Plateau. The system directly assimilates the satellite microwave brightnesstemperature, which is strongly affected by soil moisture but not by cloud layers, into a simple biospheremodel. A major feature of this system is a dual-pass assimilation technique, which can auto-calibrate modelparameters in one pass and estimate the soil moisture and energy budget in the other pass. The systemoutputs, including soil moisture, surface temperature, surface energy partition, and the Bowen ratio, arecompared with observations, land surface models, the Global Land Data Assimilation System, and fourgeneral circulation models. The results show that this satellite data-based system has a high potential for areliable estimation of the regional surface energy budget on the Plateau.
Key words: Tibetan Plateau, CEOP, microwave land data assimilation, surface energy budget, satelliteproducts
Citation: Yang, K., and T. Koike, 2008: Satellite monitoring of the surface water and energy budget in thecentral Tibetan Plateau. Adv. Atmos. Sci., 25(6), 974–985, doi: 10.1007/s00376-008-0974-8.
1. Introduction
It is well known that the Tibetan Plateau (TP)is a huge elevated heat source during the summer (Yeand Gao, 1979), and this elevated heating to the atmo-sphere plays a fundamental role in the formation andmaintenance of the summer circulation in the Asianregion. The reverse temperature gradient over the TPand the Indian Ocean has been considered as an in-dex of the onset and withdraw of the Asian summermonsoon (Yanai et al., 1992). Wu and Zhang (1998)showed that the onset of the South Asian monsoonis directly linked to the thermal forcing as well asthe mechanical forcing of the TP. Based on observa-tions, theoretical analysis, as well as large-eddy sim-ulations, Yang et al. (2004) demonstrated that theTP atmospheric boundary layer (ABL) can extendup to 3 km AGL (Abobe Ground Level) in the pre-
monsoon season, which is mainly supported by sensi-ble heat from the surface. They also suggested thatthe TP mountain-valley circulations (MVC) interactwith the diurnal evolvement of convection and thusthe MVC differs from the widely accepted daytimeupslope/nighttime downslope pattern. Fujinami et al.(2005) found this theory compatible with the satellite-observed cloud evolution. Using satellite data, Fu etal. (2006) established that the TP provides a short cir-cuit for the cross-tropopause transport of waver vaporin the Asian region, which is also driven by the ele-vated surface heating over the TP. Therefore, all ofthese atmospheric processes are related to the strongdiurnal and seasonal variations of the TP land surfacefluxes.
To clarify the land-atmosphere interactions overthe Tibetan Plateau in the context of the Asian mon-soon system, scientists in East Asia initiated the
∗Corresponding author: YANG Kun, [email protected]
NO. 6 YANG AND KOIKE 975
GEWEX (Global Energy and Water cycle Experi-ment) Asian Monsoon Experiment (GAME) in theTibetan Plateau (GAME-Tibet) (Koike et al., 1999)and the Second Tibetan Plateau Experiment (TIPEX)(Xu, et al.) in 1998. Based on the observed data, sub-stantial progress has been made in understanding theTP land surface processes. Ma et al. (2002) and Yanget al. (2003) found that the thermal roughness length,an indispensable parameter for bulk flux parameteriza-tion, has clear diurnal variations, lower in the daytimeand higher in the nighttime. Yang et al. (2005) fur-ther addressed the importance of the Plateau alpinemeadow, where dense roots and organic matters ex-ist in the topsoil, in controlling the surface water andenergy budget. Tanaka et al. (2003) indicated thatthe melting and freezing of near-surface soil moistureplays a significant role in the variation of surface en-ergy fluxes during transitional seasons. Choi (2004)reported that the momentum exchange was less effi-cient than the Monin-Obukhov similarity prediction,and Hong et al. (2004) reported that low-frequency in-active eddies within the boundary layer did not affectmomentum fluxes, but caused heat fluxes to deviatefrom the similarity theory. These studies have con-siderably advanced our understanding of basic landprocesses and also facilitated model development.
However, the monitoring network in the Plateauis still sparse and there is a need to upscale the sur-face water and energy budget from the observationalplot-scale to the Plateau region. Land surface mod-eling has the ability to produce a continuous regionalsurface energy budget, but its output is strongly con-taminated by uncertainties of the model’s parameters;the model structure also plays a dominant role in theenergy partition (Yang et al., 2007a; Kato et al., 2007).Moreover, the forcing data for a regional simulation isusually obtained from satellite retrieval or reanalysisdata. Errors in this data, particularly precipitationand temperature data, may severely contaminate themodel output. Remote sensing approaches, using vis-ible and near-infrared satellites, have also been devel-oped to monitor the regional distribution of surfacefluxes (e.g., Ma et al., 2006). These approaches areapplicable to the surface energy budget under clearskies, but they have difficulties for operational appli-cations in the TP where cloud activities are vigorous.(Yang et al., 2007b) developed a land data assimila-tion system at the University of Tokyo (LDAS-UT).This system assimilates the microwave signal into asimple biosphere model (SiB2; Sellers et al., 1996) toimprove estimates of the surface energy budget andsoil moisture in the Plateau for all-sky conditions.
In this study, we continue the development ofLDAS-UT by introducing the JMA (Japan Meteoro-
logical Agency) new SiB (Hosaka and Ooizumi, 1999;Hirai et al., 2007) into the system. The new SiB isable to simulate soil freezing and thawing, which areimportant processes in the TP but not parameterizedin SiB2. We first introduce the in situ observations,satellite data, the Global Land Data Assimilation Sys-tem (GLDAS) and GCM output at a CEOP (Coor-dinated Enhanced Observing Period) Tibet referencesite (section 2). Satellite precipitation and radiationtogether with satellite land use and microwave dataare then integrated into LDAS-UT in order to esti-mate the surface energy budget, reasonably (section3). The accuracy of precipitation and surface radiationfrom the satellite products is evaluated by comparingthem with in situ data, GLDAS, and four operationalweather forecasting GCMs (section 4). Finally, we as-sess the accuracy of the soil moisture, surface tempera-ture, energy budget, and the Bowen ratio of LDAS-UTby comparing them with other outputs (section 5).
2. Site and data
CEOP seeks to archive data of common measure-ments from in situ and satellite remote sensing mea-surements, as well as to match model output with four-dimensional data assimilations (Koike, 2004). In thisstudy, CEOP data, together with other satellite dataat the central Tibet reference site are used.
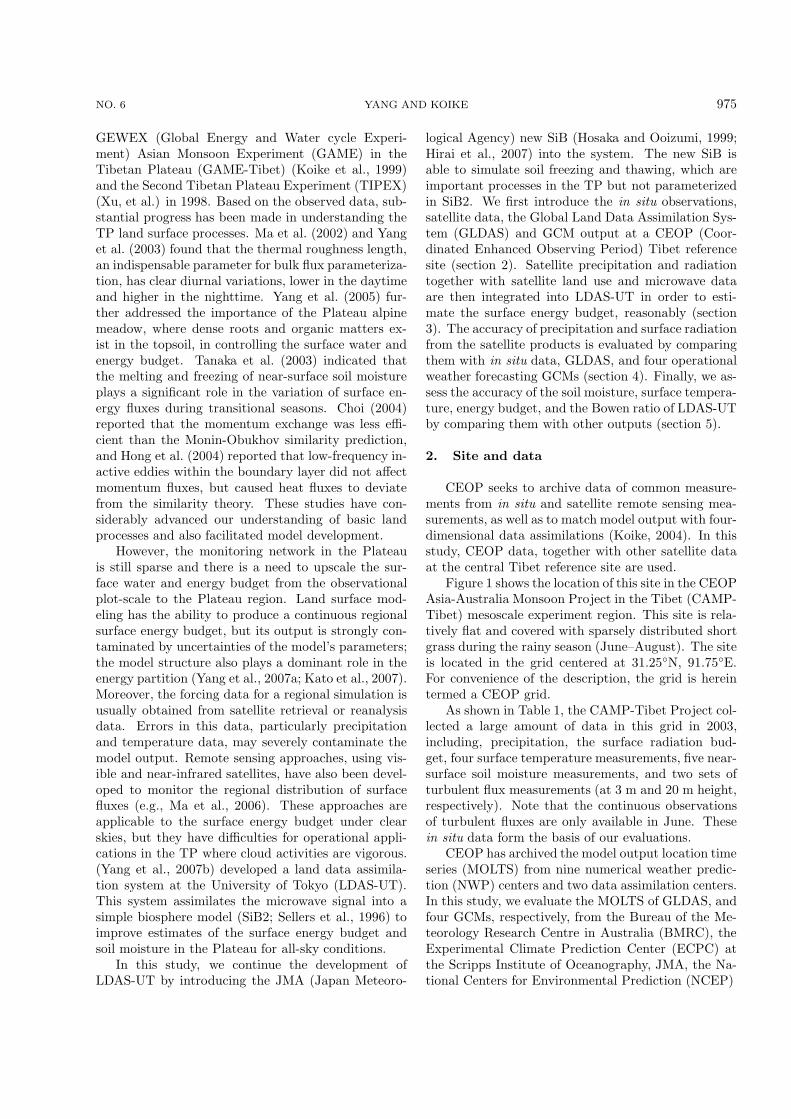
Figure 1 shows the location of this site in the CEOPAsia-Australia Monsoon Project in the Tibet (CAMP-Tibet) mesoscale experiment region. This site is rela-tively flat and covered with sparsely distributed shortgrass during the rainy season (June–August). The siteis located in the grid centered at 31.25◦N, 91.75◦E.For convenience of the description, the grid is hereintermed a CEOP grid.
As shown in Table 1, the CAMP-Tibet Project col-lected a large amount of data in this grid in 2003,including, precipitation, the surface radiation bud-get, four surface temperature measurements, five near-surface soil moisture measurements, and two sets ofturbulent flux measurements (at 3 m and 20 m height,respectively). Note that the continuous observationsof turbulent fluxes are only available in June. Thesein situ data form the basis of our evaluations.
CEOP has archived the model output location timeseries (MOLTS) from nine numerical weather predic-tion (NWP) centers and two data assimilation centers.In this study, we evaluate the MOLTS of GLDAS, andfour GCMs, respectively, from the Bureau of the Me-teorology Research Centre in Australia (BMRC), theExperimental Climate Prediction Center (ECPC) atthe Scripps Institute of Oceanography, JMA, the Na-tional Centers for Environmental Prediction (NCEP)
976 SATELLITE MONITORING OF TIBET WATER & ENERGY BUDGET VOL. 25
Fig. 1. Mesoscale map of the site of the CAMP/Tibetexperiments. BJ is a CEOP reference site. The boldgrid (hereafter termed the CEOP grid) is centered at(91.75◦E, 31.25◦N).
Table 1. Parameters measured at the CEOP central-Tibet reference site (BJ) in 2003. S-AWS1, S-AWS3, andSSMTMS are three stations located close to the BJ sta-tion. Note, there were two turbulence systems mounted ona tower at 3 m height and at 20 m height, respectively.
Items Station (depth)
Precipitation BJRadiation BJSurface BJ, MS3608temperature S-AWS1, S-AWS3
Near-surface BJ, MS3608 (4 cm)soil moisture S-AWS1, S-AWS3 (0–5 cm)
SSMTMS (0–3 cm)Turbulent fluxes BJ (3 m, 20 m)
in the USA, and the Met Office in the UK (UKMO).Note, there are two GCMs from ECPC and we used themost updated one, i.e., the Seasonal Forecast Model(SFM). Detailed model descriptions are referred toRodell et al. (2004) for GLDAS, Ruane and Roads(2007) for ECPC, Mitchell et al. (2005) for NCEP, Hi-rai et al. (2007) for JMA, and Milton and Earnshaw(2007) for UKMO. Major characteristics (model res-olution, output interval, land surface model, etc.) of
these MOLTS have been summarized in Table 1 ofYang et al. (2007a), in which a comprehensive reviewon all of these models with CEOP in situ data world-wide have been conducted.
GLDAS embeds three land surface models: Mo-saic (Koster and Suarez, 1996), Noah LSM (Korenet al., 1999), and the Common Land Model (CLM;Dai, 2003). They are driven by identical forcing data.A major contribution of GLDAS is the improvementof the forcing data. Specifically, GLDAS precipita-tion is a spatially and temporally disaggregated dataset based on the NOAA Climate Prediction CenterMerged Analysis of Precipitation (CMAP; Xie andArkin, 1997), and the radiation is derived from satel-lite cloudiness and from in situ observation.
Besides the above CEOP data, GPCP (GlobalPrecipitation Climatology Project) precipitation data(Huffman et al., 2001) and ISCCP (InternationalSatellite Cloud Climatology Project) downward radi-ation data (Zhang et al., 2004) are also evaluated inthis study.
In situ data, satellite products, and model outputgenerally represent a quantity at different scales, andthus a direct evaluation of satellite and model dataagainst in situ data might be questionable. Regardingto our case, the mesoscale region was intentionally setin a relatively flat area and is believed to be represen-tative for the central Plateau. This setting, to someextent, alleviates the problem caused by the represen-tativeness in the evaluation below.
3. LDAS-UT
LDAS-UT is a new variational land system toimprove the modeling of soil moisture and the sur-face energy budget. This system is driven by GPCPprecipitation data, ISCCP downward radiation data,MODIS gridded 8-day leaf area index (LAI) products(Knyazikhin et al., 1999), and NCEP reanalysis data(wind, temperature, and humidity). Biases in NCEPdata were corrected using in situ data before beinginterpolated to LDAS-UT grids. It assimilates theAMSR-E brightness temperatures of the vertical po-larization of 6.9 GHz and 18.7 GHz, because the signalat these frequencies is strongly affected by the near-surface soil moisture but not significantly by cloud lay-ers (Ulaby et al., 1981). Therefore, LDAS-UT can beapplied to all-sky conditions. In this aspect, LDAS-UTis superior to other land assimilation systems and re-mote sensing techniques for the Plateau region, whereintense convective activities are a striking feature.
The algorithm of this system has been detailed inYang et al. (2007b) and here we only give a brief in-troduction. As shown in Fig. 2, the system consists

NO. 6 YANG AND KOIKE 977
Fig. 2. (a) LDAS-UT system structure; (b) schematic ofthe dual-pass assimilation technique. Tg, Tc, and Wsfc arethe ground temperature, canopy temperature, and near-surface soil water content, respectively; Tb is the bright-ness temperature; F is the cost function; and ∆t is thedata assimilation window. Γp is the soil reflectivity, τc isthe optical thickness of the vegetation. The subscript pdenotes the polarization, obs denotes the observed value,and est is the estimated value.
of a land surface model (LSM) used to calculate thesurface fluxes and soil moisture, a radiative transfermodel (RTM) to estimate the microwave brightnesstemperature, and an optimization scheme to search foroptimal values of soil moisture by minimizing the dif-ference between the modeled and observed brightnesstemperature. The LSM is called the model operatorand the RTM is the observational operator. Severalparameters in the LSM and RTM can significantly af-fect the outputs of the land data assimilation system,but their values are either highly variable or unavail-able. To solve this problem, we developed a dual-passassimilation technique. Figure 2b shows the structureof the dual-pass algorithm and the detailed algorithmhas been shown in Fig. 2a of Yang et al. (2007b).Pass 1 inversely estimates the optimal values of themodel parameters with long-term (several months or
longer) forcing data and brightness temperature data,while Pass 2 estimates the near-surface soil moisturein a daily assimilation cycle. Up to now, the RTMin LDAS-UT is a Q–h model (Wang and Choudhury,1981) that can account for the effects of the surfaceroughness and vegetation, and the LSM is originallySiB2. In this study, another complex LSM, the JMAnew SiB, is introduced into this system to improvesimulations of the soil freezing and thawing processes.
In order to apply LDAS-UT to the Tibet region,two improvements have been made in SiB2 to im-prove the under-canopy flux transfer and in-canopyflux transfer, respectively, for a better description ofthe bare soil and short grasses processes. Details canbe found in Yang et al. (2007b). In terms of the JMAnew SiB, it has a canopy layer and an under-canopyground cover. This canopy structure is not applicableto the sparse grasslands of the Plateau, so the groundcover is removed by setting its fraction to be a verysmall number. The canopy aerodynamic parametersare re-calculated daily with satellite LAI data. In ad-dition, the top model layer is set to 5 cm, same as inSiB2. The JMA new SiB has included snow and frozensoil processes, and it is expected that the new SiB willhave a better performance for the winter and springseasons.
4. Evaluation of precipitation and radiation
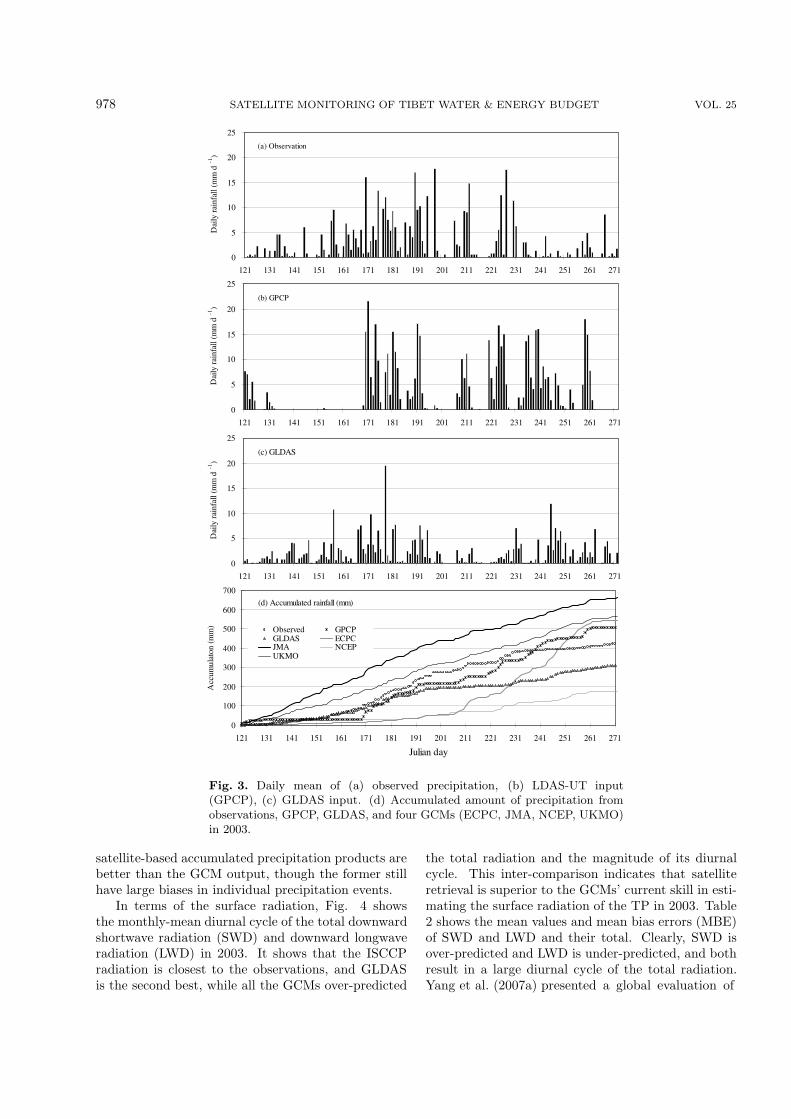
Figure 3 shows the comparisons of precipitation be-tween observations, GPCP, GLDAS precipitation (i.e.,CMAP), and four GCMs. GPCP is the input of LDAS-UT and CMAP is the input of GLDAS. Both aresatellite-based products. Figures 3a–c show the dailymean precipitation amounts and Fig. 3d shows the ac-cumulated amount of precipitation of each data set. Itis clear that the discrepancies among the products arelarge throughout the summer season in terms of rain-fall occurrence, timing, and amount. The accumulatedamount of rainfall during DOY (Day Of Year) 121–272is more than 600 mm in ECPC while less than 200mm in NCEP. In general, the surface is dry in the pre-monsoon season and wet in the monsoon season. Ourefforts mainly focused on whether the surface energyand water cycle in the transitional season was well pro-duced or not. From the observations, we defined thistransitional season to be DOY 131–171. During thisperiod, many rainfall events were observed, though theamount is not large. These rainfall events were repro-duced by CMAP but not by GPCP. In term of theGCMs, ECPC and JMA also produced many rainfallevents during this period, but the amounts are toolarge, while NCEP and UKMO reproduced few rain-fall events. This inter-comparison indicates that the
978 SATELLITE MONITORING OF TIBET WATER & ENERGY BUDGET VOL. 25
0
5
10
15
20
25
121 131 141 151 161 171 181 191 201 211 221 231 241 251 261 271
Julian day
Dai
ly r
ainf
all (
mm
d
-1
)
(a) Observation
0
5
10
15
20
25
121 131 141 151 161 171 181 191 201 211 221 231 241 251 261 271
Julian day
Dai
ly r
ainf
all (
mm
d
-1
)
(b) GPCP
0
5
10
15
20
25
121 131 141 151 161 171 181 191 201 211 221 231 241 251 261 271
Julian day
Dai
ly r
ainf
all (
mm
d
-1
)
(c) GLDAS
(d) Accumulated rainfall (mm)
0
100
200
300
400
500
600
700
121 131 141 151 161 171 181 191 201 211 221 231 241 251 261 271
Julian day
Acc
umul
aton
(mm
)
Observed GPCPGLDAS ECPCJMA NCEPUKMO
Fig. 3. Daily mean of (a) observed precipitation, (b) LDAS-UT input(GPCP), (c) GLDAS input. (d) Accumulated amount of precipitation fromobservations, GPCP, GLDAS, and four GCMs (ECPC, JMA, NCEP, UKMO)in 2003.
satellite-based accumulated precipitation products arebetter than the GCM output, though the former stillhave large biases in individual precipitation events.
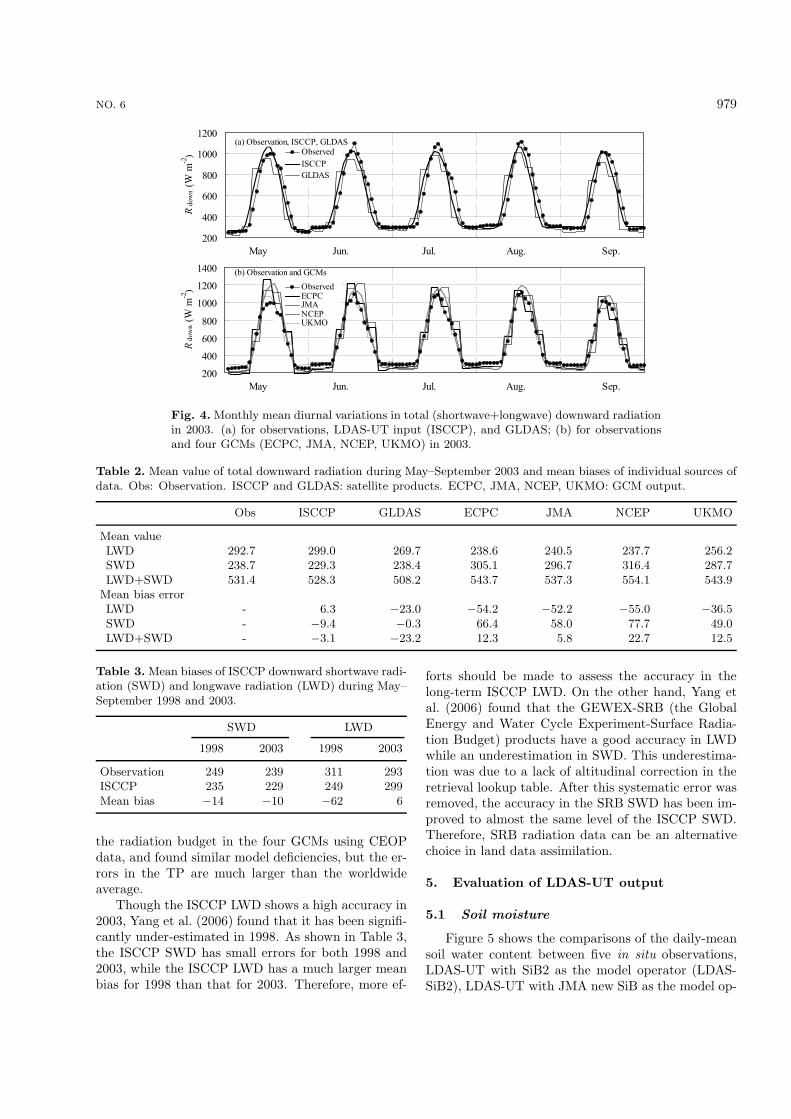
In terms of the surface radiation, Fig. 4 showsthe monthly-mean diurnal cycle of the total downwardshortwave radiation (SWD) and downward longwaveradiation (LWD) in 2003. It shows that the ISCCPradiation is closest to the observations, and GLDASis the second best, while all the GCMs over-predicted
the total radiation and the magnitude of its diurnalcycle. This inter-comparison indicates that satelliteretrieval is superior to the GCMs’ current skill in esti-mating the surface radiation of the TP in 2003. Table2 shows the mean values and mean bias errors (MBE)of SWD and LWD and their total. Clearly, SWD isover-predicted and LWD is under-predicted, and bothresult in a large diurnal cycle of the total radiation.Yang et al. (2007a) presented a global evaluation of
NO. 6 YANG AND KOIKE 979
200
400
600
800
1000
1200
Rdo
wn (
W m
-2) Observed
ISCCPGLDAS
(a) Observation, ISCCP, GLDAS
May Jun. Jul. Aug. Sep.
200
400
600
800
1000
1200
1400
Rdo
wn (
W m
-2) Observed
ECPCJMANCEPUKMO
(b) Observation and GCMs
May Jun. Jul. Aug. Sep.
Fig. 4. Monthly mean diurnal variations in total (shortwave+longwave) downward radiationin 2003. (a) for observations, LDAS-UT input (ISCCP), and GLDAS; (b) for observationsand four GCMs (ECPC, JMA, NCEP, UKMO) in 2003.
Table 2. Mean value of total downward radiation during May–September 2003 and mean biases of individual sources ofdata. Obs: Observation. ISCCP and GLDAS: satellite products. ECPC, JMA, NCEP, UKMO: GCM output.
Obs ISCCP GLDAS ECPC JMA NCEP UKMO
Mean valueLWD 292.7 299.0 269.7 238.6 240.5 237.7 256.2SWD 238.7 229.3 238.4 305.1 296.7 316.4 287.7LWD+SWD 531.4 528.3 508.2 543.7 537.3 554.1 543.9
Mean bias errorLWD - 6.3 −23.0 −54.2 −52.2 −55.0 −36.5SWD - −9.4 −0.3 66.4 58.0 77.7 49.0LWD+SWD - −3.1 −23.2 12.3 5.8 22.7 12.5
Table 3. Mean biases of ISCCP downward shortwave radi-ation (SWD) and longwave radiation (LWD) during May–September 1998 and 2003.
SWD LWD
1998 2003 1998 2003
Observation 249 239 311 293ISCCP 235 229 249 299Mean bias −14 −10 −62 6
the radiation budget in the four GCMs using CEOPdata, and found similar model deficiencies, but the er-rors in the TP are much larger than the worldwideaverage.
Though the ISCCP LWD shows a high accuracy in2003, Yang et al. (2006) found that it has been signifi-cantly under-estimated in 1998. As shown in Table 3,the ISCCP SWD has small errors for both 1998 and2003, while the ISCCP LWD has a much larger meanbias for 1998 than that for 2003. Therefore, more ef-
forts should be made to assess the accuracy in thelong-term ISCCP LWD. On the other hand, Yang etal. (2006) found that the GEWEX-SRB (the GlobalEnergy and Water Cycle Experiment-Surface Radia-tion Budget) products have a good accuracy in LWDwhile an underestimation in SWD. This underestima-tion was due to a lack of altitudinal correction in theretrieval lookup table. After this systematic error wasremoved, the accuracy in the SRB SWD has been im-proved to almost the same level of the ISCCP SWD.Therefore, SRB radiation data can be an alternativechoice in land data assimilation.
5. Evaluation of LDAS-UT output
5.1 Soil moisture
Figure 5 shows the comparisons of the daily-meansoil water content between five in situ observations,LDAS-UT with SiB2 as the model operator (LDAS-SiB2), LDAS-UT with JMA new SiB as the model op-

980 SATELLITE MONITORING OF TIBET WATER & ENERGY BUDGET VOL. 25
(a) Daily-mean near-surface soil water content of LDAS-SiB2
0
0.2
0.4
0.6
0.8
121 131 141 151 161 171 181 191 201 211 221 231 241 251 261 271
Julian day
wsf
c (m
-3 m
-3)
BJ(4cm) S-AWS1(0-5cm)
S-AWS3(0-5cm) SSMTMS(0-3cm)
MS3608(4cm) LDAS-SiB2 (0-5 cm)SiB2 (0-5 cm)
(b) Daily-mean near-surface soil water content of LDAS-SiB
0
0.2
0.4
0.6
0.8
121 131 141 151 161 171 181 191 201 211 221 231 241 251 261 271
Julian day
wsf
c (
m-3
m-3
)
BJ(4cm) S-AWS1(0-5cm)
S-AWS3(0-5cm) SSMTMS(0-3cm)
MS3608(4cm) LDAS-SiB (0-5 cm)SiB (0-5 cm)
Fig. 5. Daily mean near-surface soil water content measured at five stations [“BJ (4 cm)”,“S-AWS1 (0–5 cm)”, “S-AWS3 (0–5 cm)”, “SSMTMS (0–3 cm)”, and “MS3608 (4 cm)]”,LDAS-UT output, and LSM output for the CEOP grid from May to September 2003. (a)Model operator in LDAS-UT is SiB2 (LDAS-SiB2); (b) Model operator in LDAS-UT is JMASiB (LDAS-SiB).
erator (LDAS-SiB), and two LSMs (SiB2, SiB). Thetwo LSM cases are also called free-runs, as they arenot constrained by satellite data. The soil moisturemeasurements show significant variability within theCEOP grid. The values of soil moisture derived fromLDAS-SiB2 and SiB2 show similar variations fromDOY 170 but differ for the period prior to DOY 170.Similar results can be drawn from LDAS-SiB and SiB.The LSMs’ output clearly shows a dry bias that liesoutside the observed range of the moisture variabilityduring DOY 150–170; this is the response of the LSMsto the reduced precipitation input (i.e., GPCP), asshown in Fig. 3b. In contrast, the soil moisture de-rived from the assimilations is situated within the ob-served range throughout the entire study period. Inparticular, LDAS-UT produced an increase in near-surface soil moisture during DOY 150–170 in responseto the measured precipitation, even though the mea-sured precipitation was not included in the input data.In this way, the soil moisture derived from the assim-ilation system was corrected to some extent by assim-ilating microwave data. This makes the assimilationsystem less sensitive to the biases in input precipita-tion data than the free-run cases.
5.2 Surface skin temperature
Figure 6 shows the comparisons of the monthly-mean diurnal variations of the surface temperatures(Tsfc) between four in situ observations, LDAS-UT(LDAS-SiB2, LDAS-SiB), LSMs (SiB2, SiB), GLDAS,and four GCMs.
In May and June, the daytime biases in Tsfc aremuch larger in LDAS-SiB2 and SiB2 than in LDAS-SiB and SiB, indicating that the description of thefrozen soil processes in JMA SiB is important for re-ducing the temperature biases. For the period lackinginput precipitation (DOY 150–170), LDAS-SiB andLDAS-SiB2 produced smaller and more reasonable di-urnal variations than SiB and SiB2, since the formertwo yielded a more reasonable soil moisture. In otherwords, assimilating microwave data not only improvedthe soil moisture simulation but also improved the sur-face temperature simulation.
In other months, SiB and LDAS-SiB showed largerbiases in phase than SiB2 and LDAS-SiB2 because thethermal inertial in SiB is too high. Similar errors havealso been reported in the CEOP global evaluation byYang et al. (2007a).
GLDAS (Fig. 6c) and the four GCMs (Fig. 6d)

NO. 6 YANG AND KOIKE 981
(a) LDAS-SiB2
270
280
290
300
310
Tsf
c (K
)
S-AWS1 S-AWS3 BJ MS3608 LDAS-SiB2 SiB2
May Jun. Jul. Aug. Sep.
(b) LDAS-SiB
270
280
290
300
310
Tsf
c (K
)
S-AWS1 S-AWS3 BJ MS3608 LDAS-SiB SiB
May Jun. Jul. Aug. Sep.
(c) GLDAS
260
270
280
290
300
Tsf
c (K
)
S-AWS1 S-AWS3 BJ MS3608Mosaic CLM Noah
May Jun. Jul. Aug. Sep.(d) GCM
260
270
280
290
300
310
Tsf
c (K
)
S-AWS1 S-AWS3 BJ MS3608ECPC JMA NCEP UKMO
May Jun. Jul. Aug. Sep.
Fig. 6. Monthly mean diurnal variations of surface skin temperature compared withmeasurements at four stations (“S-AWS1”, “S-AWS3”, “BJ” and “MS3608”) in 2003,(a) LDAS-SiB2 and SiB2; (b) LDAS-SiB and SiB; (3) GLDAS (Mosaic, CLM, andNoah); (d) Four GCMs (ECPC, JMA, NCEP, UKMO).
produced a larger magnitude of diurnal variations thanthe observations and LDAS-UT. In particular, the noc-turnal temperature (or upward longwave radiation)was simulated too low in both GLDAS and the GCMs.This should be related to their too small downwardlongwave radiation at nighttime (See Fig. 4b and sec-tion 4). Tsuang et al. (2008) also showed that NCEPand other reanalysis data have similar underestimatesin the Plateau region.
5.3 Surface energy partition and Bowen ratio
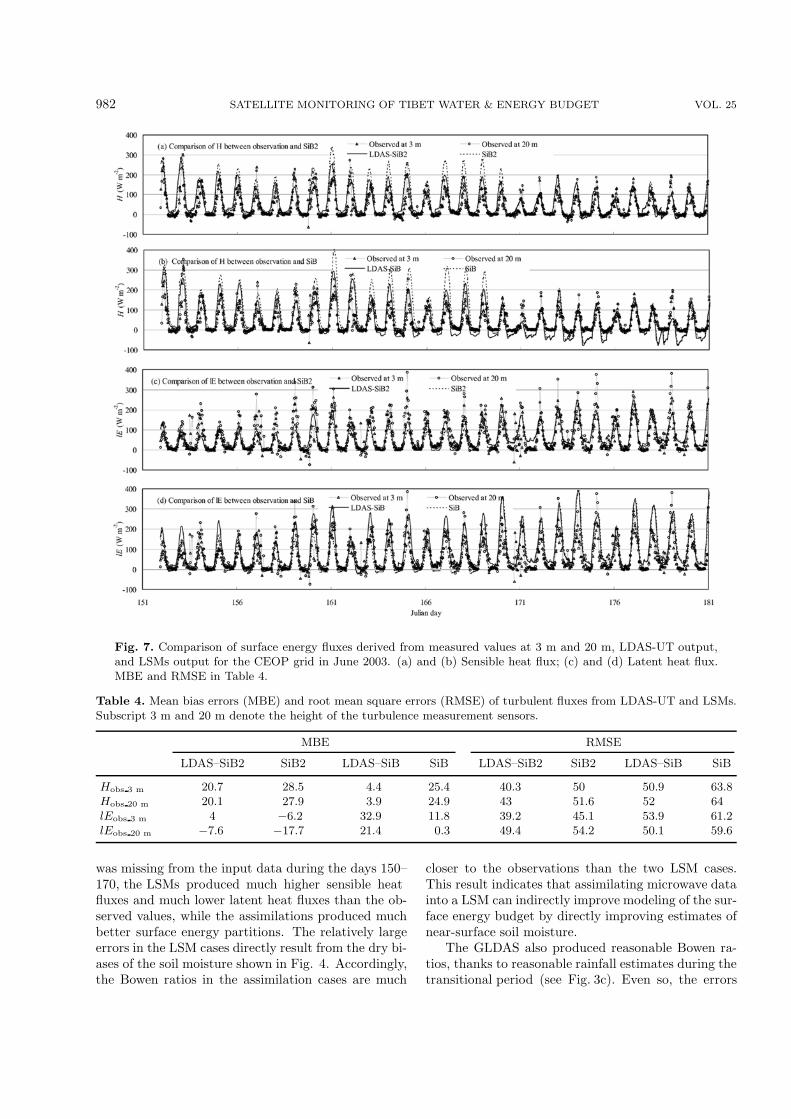
Figure 7 shows the comparisons of hourly sensi-ble heat fluxes (H) and latent heat fluxes (lE) be-tween observations at 3 m and 20 m using LDAS-UT(LDAS-SiB2, LDAS-SiB) and LSMs (SiB2, SiB); Table
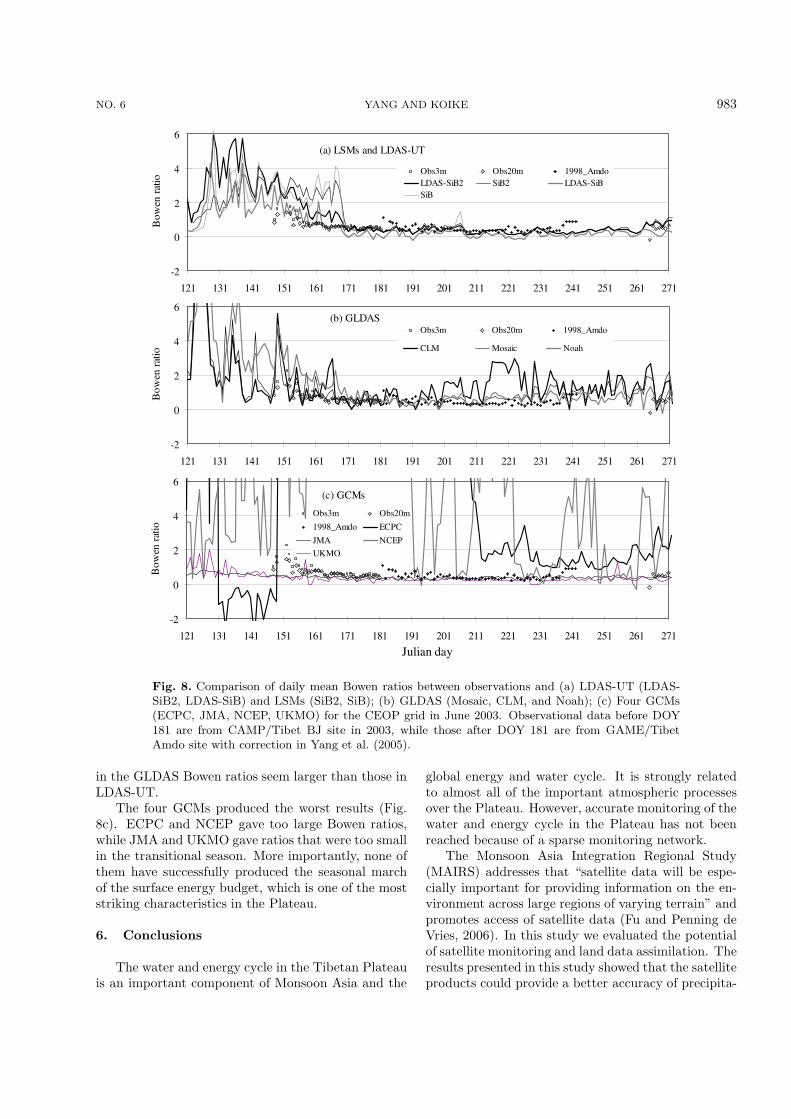
4 shows the MBE and root mean square error (RMSE)in the fluxes at the two levels. Figure 8 shows theBowen ratio in LDAS-UT, LSMs, GLDAS, and theGCMs. Because heat fluxes in 2003 were not availableafter the transitional season (DOY 181), the observedBowen ratios after DOY 181 in Fig. 8 were actuallythe values for the 1998 Amdo site after correction inYang et al. (2005).
In terms of the sensible and latent heat fluxes, theassimilations clearly produced better results than theLSM simulations. In the assimilation cases, the RM-SEs in hourly sensible heat fluxes are much smallerthan that in the LSM cases, and the RMSEs in la-tent heat fluxes are also smaller than that in the LSMcases. In particular, when the observed precipitation
982 SATELLITE MONITORING OF TIBET WATER & ENERGY BUDGET VOL. 25
Fig. 7. Comparison of surface energy fluxes derived from measured values at 3 m and 20 m, LDAS-UT output,and LSMs output for the CEOP grid in June 2003. (a) and (b) Sensible heat flux; (c) and (d) Latent heat flux.MBE and RMSE in Table 4.
Table 4. Mean bias errors (MBE) and root mean square errors (RMSE) of turbulent fluxes from LDAS-UT and LSMs.Subscript 3 m and 20 m denote the height of the turbulence measurement sensors.
MBE RMSE
LDAS–SiB2 SiB2 LDAS–SiB SiB LDAS–SiB2 SiB2 LDAS–SiB SiB
Hobs 3 m 20.7 28.5 4.4 25.4 40.3 50 50.9 63.8Hobs 20 m 20.1 27.9 3.9 24.9 43 51.6 52 64lEobs 3 m 4 −6.2 32.9 11.8 39.2 45.1 53.9 61.2lEobs 20 m −7.6 −17.7 21.4 0.3 49.4 54.2 50.1 59.6
was missing from the input data during the days 150–170, the LSMs produced much higher sensible heatfluxes and much lower latent heat fluxes than the ob-served values, while the assimilations produced muchbetter surface energy partitions. The relatively largeerrors in the LSM cases directly result from the dry bi-ases of the soil moisture shown in Fig. 4. Accordingly,the Bowen ratios in the assimilation cases are much
closer to the observations than the two LSM cases.This result indicates that assimilating microwave datainto a LSM can indirectly improve modeling of the sur-face energy budget by directly improving estimates ofnear-surface soil moisture.
The GLDAS also produced reasonable Bowen ra-tios, thanks to reasonable rainfall estimates during thetransitional period (see Fig. 3c). Even so, the errors
NO. 6 YANG AND KOIKE 983
(a) LSMs and LDAS-UT
-2
0
2
4
6
121 131 141 151 161 171 181 191 201 211 221 231 241 251 261 271
Julian day
Bow
en r
atio
Obs3m Obs20m 1998_AmdoLDAS-SiB2 SiB2 LDAS-SiBSiB
(b) GLDAS
-2
0
2
4
6
121 131 141 151 161 171 181 191 201 211 221 231 241 251 261 271
Julian day
Bow
en r
atio
Obs3m Obs20m 1998_Amdo
CLM Mosaic Noah
(c) GCMs
-2
0
2
4
6
121 131 141 151 161 171 181 191 201 211 221 231 241 251 261 271
Julian day
Bow
en r
atio
Obs3m Obs20m
1998_Amdo ECPC
JMA NCEP
UKMO
Fig. 8. Comparison of daily mean Bowen ratios between observations and (a) LDAS-UT (LDAS-SiB2, LDAS-SiB) and LSMs (SiB2, SiB); (b) GLDAS (Mosaic, CLM, and Noah); (c) Four GCMs(ECPC, JMA, NCEP, UKMO) for the CEOP grid in June 2003. Observational data before DOY181 are from CAMP/Tibet BJ site in 2003, while those after DOY 181 are from GAME/TibetAmdo site with correction in Yang et al. (2005).
in the GLDAS Bowen ratios seem larger than those inLDAS-UT.
The four GCMs produced the worst results (Fig.8c). ECPC and NCEP gave too large Bowen ratios,while JMA and UKMO gave ratios that were too smallin the transitional season. More importantly, none ofthem have successfully produced the seasonal marchof the surface energy budget, which is one of the moststriking characteristics in the Plateau.
6. Conclusions
The water and energy cycle in the Tibetan Plateauis an important component of Monsoon Asia and the
global energy and water cycle. It is strongly relatedto almost all of the important atmospheric processesover the Plateau. However, accurate monitoring of thewater and energy cycle in the Plateau has not beenreached because of a sparse monitoring network.
The Monsoon Asia Integration Regional Study(MAIRS) addresses that “satellite data will be espe-cially important for providing information on the en-vironment across large regions of varying terrain” andpromotes access of satellite data (Fu and Penning deVries, 2006). In this study we evaluated the potentialof satellite monitoring and land data assimilation. Theresults presented in this study showed that the satelliteproducts could provide a better accuracy of precipita-
984 SATELLITE MONITORING OF TIBET WATER & ENERGY BUDGET VOL. 25
tion and radiation than current GCMs. After integrat-ing the satellite data with satellite land use data as wellas microwave data into the land data assimilation sys-tem, developed at the University of Tokyo, the accu-racy of the surface soil moisture, surface temperature,and the surface energy budget can be improved com-pared to current GCMs and LSMs. Therefore, there isa high potential to apply this integrated method to theoperational monitoring of the Tibet water and energycycle with a reasonable accuracy.
Acknowledgements. This work was supported by
the “100-Talent” Project of Chinese Academy of Sciences.
The JMA new SiB was developed by Dr. M. Hosaka
and provided by Dr. I. Takayabu, JMA/MRI. The au-
thors would like to acknowledge Dr. K. Ueno, Dr. Y.
Ma, and Dr. H. Ishikawa, who provided CAMP/Tibet
in situ data. The authors are also grateful to Dr. M.
Hirai (JMA), Dr. K. Mitchell and S. Katz (NCEP),
Dr. P. Earnshaw and Dr. S. Milton (UKMO), Dr. J.
Roads and Mr. A. Ruane (ECPC), and Dr. M. Rodell
and Dr. H. Kato (GFSC/NASA) for providing MOLTS
data. The GPCP precipitation data was provided by the
NASA/Goddard Space Flight Center’s Laboratory for At-
mosphere. NCEP Reanalysis data was provided by the
NOAA-CIRES ESRL/PSD Climate Diagnostics Branch,
Boulder, Colorado.
REFERENCES
Choi, T., and Coauthors, 2004: Turbulent exchangeof heat, water vapor, and momentum over a Ti-betan prairie by eddy covariance and flux variancemeasurements. J. Geophys. Res., 109, D21106, doi:10.1029/2004D004767.
Cox, S. J., and Coauthors, 2006: The NASA/GEWEXSurface Radiation Budget Project: Overview andanalysis. Paper presented at 12th Conference on At-mospheric Radiation, Amer. Meteor. Soc., Madison,Wisconsin.
Dai, Y., and Coauthors, 2003: The Common Land Model(CLM). Bull. Amer. Meteor. Soc., 84, 1013–1023.
Fu, C., and F. Penning de Vries, 2006: Initial SciencePlan of the Monsoon Asia Integrated Regional Study.MAIRS International Program Office, Institute ofAtmospheric Physics, Chinese Academy of Sciences,79pp.
Fu, R., and Coauthors, 2006: Short circuit of water vaporand polluted air to the global stratosphere by convec-tive transport over the Tibetan Plateau. Proceedingsof the National Academy of Sciences of the UnitedStates of America, 103, 5664–5669.
Fujinami, H., S. Nomura, and T. Yasunari, 2005: Charac-teristics of diurnal variations in convection and pre-cipitation over the Southern Tibetan Plateau dur-ing summer. Scientific Online Letters on the Atmo-sphere, 1, 49–52.
Hirai, M., T. Sakashita, M. Hosaka, M. Oh’izumi, H.Kitagawa, and T. Tsuyuki, 2007: Development andValidation of a New Land Surface Model for theJMA’s Operational Global Model using the CEOPObservation Dataset. J. Meteor. Soc. Japan, 85A,1–24.
Hong, J., T. Choi, H. Ishikawa, and J. Kim, 2004: Tur-bulence structures in the near-neutral surface layeron the Tibetan Plateau. Geophys. Res. Lett., 31,L15106, doi: 10.1029/2004GL019935.
Hosaka, M. and M. Ooizumi, 1999: Improvements ofland surface models for long-term integration. Proc.Spring Meeting of the Meteor. Soc. Japan, 76, B211.(in Japanese)
Huffman, G. J., R. F. Adler, M. Morrissey, D. T. Bolvin,S. Curtis, R. Joyce, B. McGavock, and J. Susskind,2001: Global precipitation at one-degree daily res-olution from multi-satellite observations. Journal ofHydrometeorology, 2, 36–50.
Kato, H., M. Rodell, F. Beyrich, H. Cleugh, E. van Gorsel,H. Liu, and T. P. Meyers, 2007: Sensitivity of landsurface simulations to model physics, land character-istics, and forcings at four CEOP sites. J. Meteor.Soc. Japan, 85A, 187–204.
Knyazikhin, Y., and Coauthors, 1999: MODIS leaf areaindex (LAI) and fraction of photosynthetically ac-tive radiation absorbed by vegetation (FPAR) prod-uct (MOD15) algorithm theoretical basis document.NASA Goddard Space Flight Center, Tech. Rep.,126pp.
Koike, T., 2004: The coordinated enhanced observingperiod–An initial step for integrated global water cy-cle observation. WMO Bulletin, 53(2), 1–8.
Koike, T., T. Yasunari, J. Wang, and T. Yao, 1999:GAME-Tibet IOP summary report. Proceedings ofthe 1st International Workshop on GAME-Tibet, 11–13 January 1999, Xi’an, China, 1–2.
Koster, R. D., and M. J. Suarez, 1996: Energy and wa-ter balance calculations in the Mosaic LSM. NASATech. Memo. 104606, 9, 76pp.
Koren, V., J. Schaake, K. Mitchell, Q. Y. Duan, F. Chen,and J. M. Baker, 1999: A parameterization of snow-pack and frozen ground intended for NCEP weatherand climate models. J. Geophys. Res., 104, 19569–19585.
Ma, Y., O. Tsukamoto, J. Wang, H. Ishikawa, and I. Tam-agawa, 2002: Analysis of aerodynamic and thermo-dynamic parameters over the grassy marshland sur-face of Tibetan Plateau. Progress in Natural Science,12, 36–40.
Ma, Y., L. Zhong, Z. Su, H. Ishikawa, M. Menenti, and T.Koike, 2006: Determination of regional distributionsand seasonal variations of land surface heat fluxesfrom Landsat-7 Enhanced Thematic Mapper dataover the central Tibetan Plateau area. J. Geophys.Res., 111, D10305, doi: 10.1029/2005JD006742.
Milton, S., and P. Earnshaw, 2007: evaluation of surfacewater and energy cycles in the Met Office GlobalNWP Model using CEOP data. J. Meteor. Soc.

NO. 6 YANG AND KOIKE 985
Japan, 85A, 43–72.Mitchell, K., H. Wei, S. Lu, G. Gayno, and J. Meng, 2005:
NCEP implements major upgrade to its medium-range global forecast system, including land-surfacecomponent. GEWEX Newsletter, Nov. 2005, 8–9.
Rodell, M., and Coauthors, 2004: The Global Land DataAssimilation System. Bull. Amer. Meteor. Soc., 85,381–394.
Ruane, A. C., and J. O. Roads, 2007: The diurnal cycle ofwater and energy over the Continental United Statesfrom three reanalyses. J. Meteor. Soc. Japan, 85A,117–143.
Sellers, P. J., and Coauthors, 1996a: A revised land sur-face parameterization (SiB2) for atmospheric GCMs.Part I: Model formulation. J. Climate, 9, 676–705.
Tanaka, K., I. Tamagawa, H. Ishikawa, Y. Ma, and Z. Hu,2003: Surface energy budget and closure of the east-ern Tibetan Plateau during the GAME-Tibet IOP1998. J. Hydrol., 283, 169–183.
Tsuang, B.-J., M.-D. Chou, Y. Zhang, A. Roesch, and K.Yang, 2008: Evaluations of land/ocean skin tempera-tures of the ISCCP satellite retrievals and the NCEPand ERA reanalyses. J. Climate, 21, 308–330.
Ulaby, F. T., R. K. Moore, and A. K. Fung, 1981: Mi-crowave Remote Sensing: Active and Passive. Vol-ume I, Theory to Applications. Artech House, Nor-wood, MA, 456pp.
Wang, J. R., and B. J. Choudhury, 1981: Remote sensingof soil moisture content over bare fields at 1.4 GHzfrequency. J. Geophys. Res., 86, 5277–5282.
Wu, G. X., and Y. S. Zhang, 1998: Tibetan Plateau forc-ing and iming of the monsoon onset over South Asiaand South China Sea. Mon. Wea. Rev., 126, 913–927.
Xie, P., and P. A. Arkin, 1997: Global precipitation: A17-year monthly analysis based on gauge observa-tions, satellite estimates, and numerical model out-puts. Bull. Amer. Meteor. Soc., 78, 2539–2558.
Xu, X., and Coauthors, 2002: A comprehensive physicalpattern of land-air dynamic and thermal structureon the Qinghai-Xizang Plateau. Science in China(D),45, 577–595.
Yanai, M., C. Li, and Z. Song, 1992: Seasonal heatingof the Tibetan Plateau and its effects on the evolu-tion of the Asian summer monsoon. J. Meteor. Soc.Japan, 70, 319–351.
Yang, K., T. Koike, and D. Yang, 2003: Surface flux pa-rameterization in the Tibetan Plateau. Bound.-LayerMeteor., 106, 245–262.
Yang, K., T. Koike, H. Fujii, T. Tamura, X. Xu, B. Bian,and M. Zhou, 2004: The daytime evolution of theatmospheric boundary layer and convection over theTibetan Plateau: Observations and simulations. J.Meteor. Soc. Japan, 82, 1777–1792.
Yang, K., T. Koike, B. Ye, and L. Bastidas, 2005: In-verse analysis of the role of soil vertical hetero-geneity in controlling surface soil state and en-ergy partition. J. Geophys. Res., 110, D08101, doi:10.1029/2004JD005500.
Yang, K., T. Koike, P. Stackhouse, C. Mikovitz, andS. J. Cox, 2006: An assessment of satellite surfaceradiation products for highlands with Tibet instru-mental data. Geophys. Res. Lett., 33, L22403, doi:10.1029/2006GL027640.
Yang, K., and Coauthors, 2007a: Initial CEOP-based re-view of the prediction skill of operational general cir-culation models and land surface models. J. Meteor.Soc. Japan, 85A, 99–116.
Yang, K., T. Watanabe, T. Koike, X. Li, H. Fujii, K.Tamagawa, Y. Ma, and H. Ishikawa, 2007b: Auto-calibration system developed to assimilate AMSR-Edata into a land surface model for estimating soilmoisture and the surface energy budget. J. Meteor.Soc. Japan, 85A, 229–242.
Ye, D., and Y. Gao, 1979: The Meteorology of theQinghai-Xizang (Tibet) Plateau. Science Press, Bei-jing, 278pp. (in Chinese)
Zhang, Y.-C., W. B. Rossow, A. A. Lacis, V. Oinas,and M. I. Mishchenko, 2004: Calculation of radia-tive fluxes from the surface to top of atmospherebased on ISCCP and other global data sets: Re-finements of the radiative transfer model and theinput data. J. Geophys. Res., 109, D19105, doi:10.1029/2003JD004457.