SAS/GRAPH 9.4: Java Applets and ActiveX Control User's Guide
248
SAS/GRAPH ® 9.4: Java Applets and ActiveX Control User’s Guide SAS ® Documentation December 4, 2019
-
Upload
khangminh22 -
Category
Documents
-
view
1 -
download
0
Transcript of SAS/GRAPH 9.4: Java Applets and ActiveX Control User's Guide

SAS/GRAPH® 9.4: Java Applets and ActiveX Control User’s Guide
SAS® DocumentationDecember 4, 2019

The correct bibliographic citation for this manual is as follows: SAS Institute Inc. 2014. SAS/GRAPH® 9.4: Java Applets and ActiveX Control User’s Guide. Cary, NC: SAS Institute Inc.
SAS/GRAPH® 9.4: Java Applets and ActiveX Control User’s Guide
Copyright © 2014, SAS Institute Inc., Cary, NC, USA
All Rights Reserved. Produced in the United States of America.
For a hard copy book: No part of this publication may be reproduced, stored in a retrieval system, or transmitted, in any form or by any means, electronic, mechanical, photocopying, or otherwise, without the prior written permission of the publisher, SAS Institute Inc.
For a web download or e-book: Your use of this publication shall be governed by the terms established by the vendor at the time you acquire this publication.
The scanning, uploading, and distribution of this book via the Internet or any other means without the permission of the publisher is illegal and punishable by law. Please purchase only authorized electronic editions and do not participate in or encourage electronic piracy of copyrighted materials. Your support of others' rights is appreciated.
U.S. Government License Rights; Restricted Rights: The Software and its documentation is commercial computer software developed at private expense and is provided with RESTRICTED RIGHTS to the United States Government. Use, duplication, or disclosure of the Software by the United States Government is subject to the license terms of this Agreement pursuant to, as applicable, FAR 12.212, DFAR 227.7202-1(a), DFAR 227.7202-3(a), and DFAR 227.7202-4, and, to the extent required under U.S. federal law, the minimum restricted rights as set out in FAR 52.227-19 (DEC 2007). If FAR 52.227-19 is applicable, this provision serves as notice under clause (c) thereof and no other notice is required to be affixed to the Software or documentation. The Government’s rights in Software and documentation shall be only those set forth in this Agreement.
SAS Institute Inc., SAS Campus Drive, Cary, NC 27513-2414
December 2019
SAS® and all other SAS Institute Inc. product or service names are registered trademarks or trademarks of SAS Institute Inc. in the USA and other countries. ® indicates USA registration.
Other brand and product names are trademarks of their respective companies.
9.4-P10:grapaxug

ContentsChapter 1 / About the SAS/GRAPH Java Applets and ActiveX Control . . . . . . . . . . . . . . . . . . . . . . . . . 1
Displaying SAS/GRAPH Output with the ActiveX Control and Java Applets . . . . . . . 1SAS/GRAPH ActiveX Control Display Features . . . . . . . . . . . . . . . . . . . . . . . . . . . . . . . 2SAS/GRAPH Java Applet Display Features . . . . . . . . . . . . . . . . . . . . . . . . . . . . . . . . . . 3The SAS/GRAPH ACTIVEX, JAVA, and JAVAMETA Graphics Output Devices . . . . 8About Using the SAS/GRAPH ACTIVEX and JAVA Devices in SAS Studio . . . . . . 13The DS2TREE and DS2CONST Macros . . . . . . . . . . . . . . . . . . . . . . . . . . . . . . . . . . . . 14Data Tip and Drill-Down Support in Java and ActiveX . . . . . . . . . . . . . . . . . . . . . . . . 15Requirements for Viewing Java and ActiveX Output . . . . . . . . . . . . . . . . . . . . . . . . . . 16
Chapter 2 / Generating Interactive ActiveX Output . . . . . . . . . . . . . . . . . . . . . . . . . . . . . . . . . . . . . . . . . 17Overview of Creating Interactive Output for ActiveX . . . . . . . . . . . . . . . . . . . . . . . . . . 17Installing the SAS/GRAPH ActiveX Control . . . . . . . . . . . . . . . . . . . . . . . . . . . . . . . . . . 19Generating Output for ActiveX . . . . . . . . . . . . . . . . . . . . . . . . . . . . . . . . . . . . . . . . . . . . . 22About Languages in ActiveX . . . . . . . . . . . . . . . . . . . . . . . . . . . . . . . . . . . . . . . . . . . . . . 24About Special Fonts and Symbols in ActiveX . . . . . . . . . . . . . . . . . . . . . . . . . . . . . . . . 24SAS Formats Supported by ActiveX . . . . . . . . . . . . . . . . . . . . . . . . . . . . . . . . . . . . . . . . 27Configuring Drill-Down Links with ActiveX . . . . . . . . . . . . . . . . . . . . . . . . . . . . . . . . . . . 29Configuring Data Tips with ActiveX . . . . . . . . . . . . . . . . . . . . . . . . . . . . . . . . . . . . . . . . . 30Examples: Creating Interactive ActiveX Output . . . . . . . . . . . . . . . . . . . . . . . . . . . . . . 30
Chapter 3 / Generating Interactive Java Output . . . . . . . . . . . . . . . . . . . . . . . . . . . . . . . . . . . . . . . . . . . . 39Overview of Creating Interactive Output for Java . . . . . . . . . . . . . . . . . . . . . . . . . . . . . 39Downloading and Installing the SAS/GRAPH Java Applet JAR Files . . . . . . . . . . . . 40Generating Output for Java . . . . . . . . . . . . . . . . . . . . . . . . . . . . . . . . . . . . . . . . . . . . . . . 41Configuring Drill-Down Links for Java . . . . . . . . . . . . . . . . . . . . . . . . . . . . . . . . . . . . . . 48Configuring Data Tips with JAVA . . . . . . . . . . . . . . . . . . . . . . . . . . . . . . . . . . . . . . . . . . . 49Examples: Creating Interactive Java Output . . . . . . . . . . . . . . . . . . . . . . . . . . . . . . . . . 49
Chapter 4 / Generating Interactive Metagraphics Output . . . . . . . . . . . . . . . . . . . . . . . . . . . . . . . . . . . . 59Developing Web Presentations for the Metaview Applet . . . . . . . . . . . . . . . . . . . . . . 59Advantages of Using the JAVAMETA Device . . . . . . . . . . . . . . . . . . . . . . . . . . . . . . . . 60Using ODS with the JAVAMETA Device . . . . . . . . . . . . . . . . . . . . . . . . . . . . . . . . . . . . . 60Enhancing Web Presentations for the Metaview Applet . . . . . . . . . . . . . . . . . . . . . . . 61Specifying Non-English Resource Files and Fonts . . . . . . . . . . . . . . . . . . . . . . . . . . . 62Example: Generating Metacode Output with the JAVAMETA Driver . . . . . . . . . . . . . 63
Chapter 5 / Controlling Drill-Down Behavior for ActiveX and Java Using Parameters . . . . . . . . . . . 67Using ODS Parameter Tags . . . . . . . . . . . . . . . . . . . . . . . . . . . . . . . . . . . . . . . . . . . . . . . 67Using Drill-Down Tags . . . . . . . . . . . . . . . . . . . . . . . . . . . . . . . . . . . . . . . . . . . . . . . . . . . . 68Specifying the Drill-Down Mode . . . . . . . . . . . . . . . . . . . . . . . . . . . . . . . . . . . . . . . . . . . 69Understanding Variable Roles . . . . . . . . . . . . . . . . . . . . . . . . . . . . . . . . . . . . . . . . . . . . . 71Removing Blank Spaces from Data Values in Substitution Strings . . . . . . . . . . . . . . 71Using Variables as Substitution Strings . . . . . . . . . . . . . . . . . . . . . . . . . . . . . . . . . . . . . 72Configuring HTML Drill-Down Mode . . . . . . . . . . . . . . . . . . . . . . . . . . . . . . . . . . . . . . . . 73Configuring the Drill-Down Response in HTML and URL Modes . . . . . . . . . . . . . . . 76Configuring Script Drill-Down Mode . . . . . . . . . . . . . . . . . . . . . . . . . . . . . . . . . . . . . . . . 77Disabling Drill-Down Functionality . . . . . . . . . . . . . . . . . . . . . . . . . . . . . . . . . . . . . . . . . . 79

Chapter 6 / Generating Interactive Treeview Diagrams Using the DS2TREE Macro . . . . . . . . . . . . . 81Creating Treeview Diagrams . . . . . . . . . . . . . . . . . . . . . . . . . . . . . . . . . . . . . . . . . . . . . . 81Enhancing Presentations Displayed with the Treeview Applet . . . . . . . . . . . . . . . . . 85DS2TREE Macro Arguments . . . . . . . . . . . . . . . . . . . . . . . . . . . . . . . . . . . . . . . . . . . . . . 85Examples: Creating Interactive Treeview Diagrams . . . . . . . . . . . . . . . . . . . . . . . . . . 86
Chapter 7 / Generating Interactive Constellation Diagrams Using the DS2CONST Macro . . . . . . . . 93Creating Constellation Diagrams . . . . . . . . . . . . . . . . . . . . . . . . . . . . . . . . . . . . . . . . . . . 93Enhancing Presentations Displayed with the Constellation Applet . . . . . . . . . . . . . . 99DS2CONST Macro Arguments . . . . . . . . . . . . . . . . . . . . . . . . . . . . . . . . . . . . . . . . . . . 100Examples: Creating Interactive Constellation Diagrams . . . . . . . . . . . . . . . . . . . . . . 101
Chapter 8 / Troubleshooting Java and ActiveX Output . . . . . . . . . . . . . . . . . . . . . . . . . . . . . . . . . . . . . 111Overview . . . . . . . . . . . . . . . . . . . . . . . . . . . . . . . . . . . . . . . . . . . . . . . . . . . . . . . . . . . . . . 111Checking Browser Permissions . . . . . . . . . . . . . . . . . . . . . . . . . . . . . . . . . . . . . . . . . . . 115Using HTML Character Entities . . . . . . . . . . . . . . . . . . . . . . . . . . . . . . . . . . . . . . . . . . . 116Connecting to Web Servers That Require Authentication . . . . . . . . . . . . . . . . . . . . . 116Removing CLASSPATH Environment Variables . . . . . . . . . . . . . . . . . . . . . . . . . . . . . 116Setting the SAS_ALT_DISPLAY Variable for X Window Systems on UNIX . . . . . . 117Correcting Text Fonts . . . . . . . . . . . . . . . . . . . . . . . . . . . . . . . . . . . . . . . . . . . . . . . . . . . 117Resolving Differences between Graphs Generated with Different Technologies . 118
Chapter 9 / ActiveX Control and Java Applet Parameter Dictionary . . . . . . . . . . . . . . . . . . . . . . . . . . 119Specifying Parameters and Attributes for Java and ActiveX . . . . . . . . . . . . . . . . . . 121Attributes and Parameters That Apply to the ActiveX Control, and
the Contour, Graph, and Map Applets . . . . . . . . . . . . . . . . . . . . . . . . . . . . . . . . . . 125Parameters That Apply to the Metaview and Tile Chart Applets . . . . . . . . . . . . . . . 128Dictionary . . . . . . . . . . . . . . . . . . . . . . . . . . . . . . . . . . . . . . . . . . . . . . . . . . . . . . . . . . . . . 130
Chapter 10 / DS2CONST and DS2TREE Macro Argument Dictionary . . . . . . . . . . . . . . . . . . . . . . . . 169About the DS2CONST and DS2TREE Macro Arguments . . . . . . . . . . . . . . . . . . . . 172Arguments for the APPLET Tag . . . . . . . . . . . . . . . . . . . . . . . . . . . . . . . . . . . . . . . . . . 172Arguments for Data Definition . . . . . . . . . . . . . . . . . . . . . . . . . . . . . . . . . . . . . . . . . . . . 173Arguments for HTML and XML File Information . . . . . . . . . . . . . . . . . . . . . . . . . . . . . 177Arguments for Diagram Appearance . . . . . . . . . . . . . . . . . . . . . . . . . . . . . . . . . . . . . . 178Arguments for Page Formatting . . . . . . . . . . . . . . . . . . . . . . . . . . . . . . . . . . . . . . . . . . 181Arguments for Style Sheets . . . . . . . . . . . . . . . . . . . . . . . . . . . . . . . . . . . . . . . . . . . . . . 182Arguments for the SAS TITLE and FOOTNOTE Tags . . . . . . . . . . . . . . . . . . . . . . . 183Arguments for Character Transcoding . . . . . . . . . . . . . . . . . . . . . . . . . . . . . . . . . . . . . 184Reserved Names . . . . . . . . . . . . . . . . . . . . . . . . . . . . . . . . . . . . . . . . . . . . . . . . . . . . . . . 184Dictionary . . . . . . . . . . . . . . . . . . . . . . . . . . . . . . . . . . . . . . . . . . . . . . . . . . . . . . . . . . . . . 185
iv Contents

1About the SAS/GRAPH Java Applets and ActiveX Control
Displaying SAS/GRAPH Output with the ActiveX Control and Java Applets . . . . . . 1
SAS/GRAPH ActiveX Control Display Features . . . . . . . . . . . . . . . . . . . . . . . . . . . . . . . . . . . 2
SAS/GRAPH Java Applet Display Features . . . . . . . . . . . . . . . . . . . . . . . . . . . . . . . . . . . . . . . 3Java Applets That SAS/GRAPH Generates . . . . . . . . . . . . . . . . . . . . . . . . . . . . . . . . . . . . . 3Graph, Map, Tile Chart, and Contour Applets . . . . . . . . . . . . . . . . . . . . . . . . . . . . . . . . . . . . 4Treeview Applet . . . . . . . . . . . . . . . . . . . . . . . . . . . . . . . . . . . . . . . . . . . . . . . . . . . . . . . . . . . . . . . 5Constellation Applet . . . . . . . . . . . . . . . . . . . . . . . . . . . . . . . . . . . . . . . . . . . . . . . . . . . . . . . . . . . 6Metaview Applet . . . . . . . . . . . . . . . . . . . . . . . . . . . . . . . . . . . . . . . . . . . . . . . . . . . . . . . . . . . . . . . 7
The SAS/GRAPH ACTIVEX, JAVA, and JAVAMETA Graphics Output Devices . . . . . 8About the ACTIVEX, JAVA, and JAVAMETA Graphics Output Devices . . . . . . . . . . . . . 8The ACTIVEX Device and RTF with UTF-8 Character Encoding . . . . . . . . . . . . . . . . . . 9When to Use the ACTIVEX Graphics Output Device . . . . . . . . . . . . . . . . . . . . . . . . . . . . 10When to Use the JAVA Graphics Output Device . . . . . . . . . . . . . . . . . . . . . . . . . . . . . . . . 11When to Use the JAVAMETA Graphics Output Device . . . . . . . . . . . . . . . . . . . . . . . . . . 12The Output Process for the ACTIVEX and JAVA Graphics Output Devices . . . . . . . 12Device Catalog Entries for the ACTIVEX, JAVA, and JAVAMETA
Graphics Output Devices . . . . . . . . . . . . . . . . . . . . . . . . . . . . . . . . . . . . . . . . . . . . . . . . . . . 12Controlling the Appearance of the ACTIVEX, JAVA, and
JAVAMETA Graphics Output Device Output . . . . . . . . . . . . . . . . . . . . . . . . . . . . . . . . . . 13
About Using the SAS/GRAPH ACTIVEX and JAVA Devices in SAS Studio . . . . . . . 13Default Output in SAS Studio . . . . . . . . . . . . . . . . . . . . . . . . . . . . . . . . . . . . . . . . . . . . . . . . . 13Generating ActiveX and Java HTML Output in SAS Studio . . . . . . . . . . . . . . . . . . . . . . 13Generating ActiveX RTF Output in SAS Studio . . . . . . . . . . . . . . . . . . . . . . . . . . . . . . . . . 14
The DS2TREE and DS2CONST Macros . . . . . . . . . . . . . . . . . . . . . . . . . . . . . . . . . . . . . . . . . 14
Data Tip and Drill-Down Support in Java and ActiveX . . . . . . . . . . . . . . . . . . . . . . . . . . . 15
Requirements for Viewing Java and ActiveX Output . . . . . . . . . . . . . . . . . . . . . . . . . . . . 16
Displaying SAS/GRAPH Output with the ActiveX Control and Java Applets
In SAS/GRAPH, Java applets and the SAS/GRAPH ActiveX Control are used to provide an interactive display of graph output. The ActiveX control displays the
1

output of various SAS/GRAPH procedures and many of the SAS/GRAPH annotate functions. It is used to display SAS/GRAPH output when the ACTIVEX graphics output device is used with the ODS HTML, HTML3, HTMLCSS, or RTF destination. The SAS/GRAPH ActiveX Control enables such features as data tips, drill-down links, and interactive features available through pop-up menus. Later versions of the SAS/GRAPH ActiveX Control are typically backward compatible with the earlier versions. Output that is generated with the ACTIVEX graphics output device can usually be displayed using a later version of the SAS/GRAPH ActiveX Control.
The Java applets display the output of various SAS/GRAPH procedures and macros. A Java applet is used to display SAS/GRAPH output in the following cases:
n when the JAVA or JAVAMETA graphics output device is used with the ODS HTML, HTML3, or HTMLCSS destination
n when the DS2TREE macro is used to generate a tree view diagram
n when the DS2CONST macro is used to generate a constellation diagram
Depending on the applet, it can enable such features as data tips, drill-down links, or interactive features available through pop-up menus. As with the SAS/GRAPH ActiveX Control, later versions of the JRE are typically backward compatible with the earlier versions. Output that is generated with the JAVA or JAVAMETA graphics output device can usually be displayed using a later version of the JRE.
SAS/GRAPH ActiveX Control Display FeaturesThe SAS/GRAPH ActiveX control displays the output of most of the SAS/GRAPH procedures and many of the annotate functions. It enables extensive interactive features via a pop-up menu. The pop-up menus enable you to move, rotate (3-D graphs only), and zoom, and to control the properties of graphs such as its colors, legends, and axes.
You can enable data tips and drill-down links with presentations created for the ActiveX control. Figure 1.1 on page 3 shows output from the GCONTOUR procedure as displayed by the ActiveX control. (You can open the pop-up menu for the ActiveX control by right-clicking the graph.)
2 Chapter 1 / About the SAS/GRAPH Java Applets and ActiveX Control

Figure 1.1 Sample ActiveX Presentation
The ActiveX control can be viewed only in Windows operating environments with Microsoft Internet Explorer on a PC with the ActiveX control installed.
The ActiveX control displays output from the G3D, GAREABAR, GBARLINE, GCHART, GCONTOUR, GMAP, GPLOT, GRADAR, and GTILE procedures.
To create a graph to be displayed by ActiveX, specify DEVICE=ACTIVEX on your GOPTIONS statement. See Chapter 2, “Generating Interactive ActiveX Output,” on page 17 for more information.
SAS/GRAPH Java Applet Display Features
Java Applets That SAS/GRAPH GeneratesIf you want to deliver your presentation to more operating environments than just Windows, you can use one of the following Java applets:
Graph, Map, Tile Chart, and Contour appletsThese applets display the output of SAS/GRAPH procedures and offer many interactive features.
Treeview and Constellation appletsThese applets generate hierarchical treeview diagrams and constellation diagrams, respectively, and are generated with the DS2TREE and DS2CONST macros.
SAS/GRAPH Java Applet Display Features 3

Metaview appletThe Metaview applet displays the output of SAS/GRAPH procedures, and it enables data tips, drill-down links, panning, and zooming.
Graph, Map, Tile Chart, and Contour AppletsLike the SAS/GRAPH ActiveX Control, the Graph, Map, Tile Chart, and Contour applets display the output of SAS/GRAPH procedures and enable extensive interactive features. The Graph, Map, Tile Chart, and Contour applets enable interactive features such as data tips and drill-down links. They also provide pop-up menus, which enable the user to change properties such as the graph's colors, legends, and axes.
Figure 1.2 on page 4 shows PROC GCHART output displayed by the Java Graph applet showing data tips and drill-down capability.
Figure 1.2 Sample Java Presentation
These applets display the output of the following SAS/GRAPH procedures:
Graph applet G3D Scatter Plots, GCHART, GPLOT
Contour applet G3D Surface Plots, GCONTOUR
Map applet GMAP
Tile Chart applet GTILE
To create a graph to be displayed by one of these applets, specify DEVICE=JAVA on your GOPTIONS statement. For more information, see Chapter 3, “Generating Interactive Java Output,” on page 39.
4 Chapter 1 / About the SAS/GRAPH Java Applets and ActiveX Control

Treeview AppletThis applet displays a treeview diagram that shows the parent-child relationships in a tree structure. In a treeview diagram, each child node has exactly one parent, and each parent node has zero or more children. In other words, the relationships in a treeview diagram are one-to-many. A treeview diagram is ideal for displaying such data as organizational charts or the hierarchical relationships of the pages of a website.
By default, the Treeview applet zooms in on the portion of the tree that is in the center of the display, as if you were looking through a fish-eye lens. Nodes in the center of the display are spread apart and shown with more detail, including node labels. Nodes near the periphery of the display are compressed and shown with less detail. Initially, the Treeview applet places the root node in the center of the display. You can click and drag the diagram to change the portion of the diagram that is in the center of the display.
The Treeview applet supports a pop-up menu that enables you to search for nodes, select or hide subtrees, and so on. You can add hotspots that link to web pages when the user clicks on a node.
For example, Figure 1.3 on page 6 shows a treeview diagram (with the pop-up menu opened) displaying the structure of an XML Document Type Definition.
To generate a treeview diagram, use the DS2TREE macro. For more information, see Chapter 7, “Generating Interactive Constellation Diagrams Using the DS2CONST Macro,” on page 93.
SAS/GRAPH Java Applet Display Features 5

Figure 1.3 Sample Treeview Diagram
Constellation AppletThe Constellation applet displays a general node-link diagram. Each node can be linked to one or more other nodes. Unlike the Treeview applet, the Constellation applet does not require a hierarchical relationship between the nodes. (Although it can be used to display hierarchical relationships, the Constellation applet does not automatically place the root node at the center of the display.)
The Constellation applet supports node and link properties that determine the color and size of the nodes and the color and thickness of the link joining the nodes. These properties indicate the relative strength of the relationship between the nodes.
Like the Treeview applet, by default, the Constellation applet zooms in on the portion of the diagram that is in the center of the display, as if you were looking through a fish-eye lens. Nodes in the center of the display are spread apart and shown with more detail, including node labels. Nodes near the periphery of the display are compressed and shown with less detail. You can click and drag the diagram to change the portion of the diagram that is in the center of the display.
The Constellation applet has a pop-up menu that supports several functions such as highlighting specific links and searching for specific nodes. You can add hotspots that link to web pages when the user clicks on a node.
6 Chapter 1 / About the SAS/GRAPH Java Applets and ActiveX Control

Figure 1.4 on page 7 shows a constellation diagram (with the Mouse Help window displayed).
To generate the Constellation applet, use the DS2CONST macro. For more information, see Chapter 7, “Generating Interactive Constellation Diagrams Using the DS2CONST Macro,” on page 93.
Figure 1.4 Sample Constellation Diagram
Metaview AppletThe Metaview applet displays the output of SAS/GRAPH procedures and enables interactive features that are not available with static images such as GIFs or PNGs. It enables zooming and scrolling and supports pop-up menus with customized user-selectable links. When you generate a graph with the Metaview applet, you can specify background colors and text fonts, and enable drill-down links to HTML files, metagraphics files, and sets of metacodes.
Figure 1.5 on page 8 shows the zoom control and a stick-type data tip that the Metaview applet provides.
SAS/GRAPH Java Applet Display Features 7

Figure 1.5 Sample Metaview Applet
The Metaview applet displays output from the G3D, GANNO, GBARLINE, GCHART, GCONTOUR, GPLOT, GMAP, GRADAR, GREPLAY, and GSLIDE procedures. To create a graph to be displayed by the Metaview applet, specify DEVICE=JAVAMETA on your GOPTIONS statement.
For more information, see Chapter 4, “Generating Interactive Metagraphics Output,” on page 59.
The SAS/GRAPH ACTIVEX, JAVA, and JAVAMETA Graphics Output Devices
About the ACTIVEX, JAVA, and JAVAMETA Graphics Output Devices
The SAS/GRAPH ACTIVEX, JAVA, and JAVAMETA graphics output devices are used to generate interactive graphs. The ACTIVEX graphics output device output uses the SAS/GRAPH ActiveX Control to display graphs in Internet Explorer web browser on Windows. The JAVA and JAVAMETA graphics output device output use Java applets to display graphs in any supported web browser. The following table provides a summary of these graphics output devices.
8 Chapter 1 / About the SAS/GRAPH Java Applets and ActiveX Control

Table 1.1 Summary of the ACTIVEX, JAVA, and JAVAMETA Graphics Output Devices
Graphics Output Device Name 1
SAS/GRAPH Graphics Output Device Category
Valid ODS Destinations
SAS/GRAPH Procedures Supported
ACTIVEX 2 ActiveX and Java ODS HTML
ODS HTML4
ODS HTML3
ODS HTMLCSS
ODS RTF 3
G3D, GAREABAR, GBARLINE, GCHART, GCONTOUR, GMAP, GPLOT, GRADAR, and GTILE
JAVA ActiveX and Java ODS HTML
ODS HTML4
ODS HTML3
ODS HTMLCSS
ODS RTF
G3D, GCHART, GPLOT, GMAP, and GTILE
JAVAMETA Native ODS HTML
ODS HTML4
ODS HTML3
ODS HTMLCSS
ODS RTF
G3D, GANNO, GBARLINE, GCHART, GCONTOUR, GMAP, GPLOT, GRADAR, GREPLAY, and GSLIDE
1 The default output environment in SAS Studio does not support the ACTIVEX, JAVA, or JAVAMETA devices. To use these devices in SAS Studio, you must open your own ODS destination. See “About Using the SAS/GRAPH ACTIVEX and JAVA Devices in SAS Studio” on page 13.
2 See SAS Usage Note 57554 on support.sas.com.3 The SAS/GRAPH ActiveX Control is not compatible with the RTF output format when UTF-8
character encoding is used. See “The ACTIVEX Device and RTF with UTF-8 Character Encoding” on page 9.
Note: Some SAS/GRAPH procedure options are not supported by ActiveX and Java. For information about SAS/GRAPH procedure option support, see “Summary of ActiveX and Java Support” in SAS/GRAPH: Reference.
For more information about SAS/GRAPH graphics output devices, see “Using Graphics Devices” in SAS/GRAPH: Reference.
The ACTIVEX Device and RTF with UTF-8 Character Encoding
You can generate ActiveX RTF output if your SAS client is configured to use a character encoding other than UTF-8. The SAS/GRAPH ActiveX Control is not compatible with RTF output when UTF-8 encoding is used. To display the character encoding that your SAS client is configured to use, run the following code:
The SAS/GRAPH ACTIVEX, JAVA, and JAVAMETA Graphics Output Devices 9

proc options option=encoding;run;
A message similar to the following is written to the SAS log:
ENCODING=WLATIN1 Specifies the default character-set encoding for the SAS session.
If your SAS client is configured to use an encoding other than UTF-8, generate your RTF output using the ACTIVEX device as you normally would.
If your SAS client is configured to use UTF-8 encoding, SAS/GRAPH automatically switches from the ACTIVEX device to the ACTXIMG device and writes the following warning to the SAS log:
WARNING: The ACTIVEX device is not currently supported with RTFoutput and UTF-8 encoding. Switching to the ACTXIMG device.
In that case, you cannot generate interactive ActiveX RTF output.
When to Use the ACTIVEX Graphics Output DeviceIf your users use the Windows operating environment, you can use the SAS/GRAPH ActiveX Control to generate your graphs. On Windows, graphs generated using the SAS/GRAPH ActiveX Control can be viewed using the Internet Explorer web browser. They can also be integrated into Microsoft Word, PowerPoint, and Excel documents.
Note: See SAS Usage Note 57554 on support.sas.com.
In general, the interactive features of the SAS/GRAPH ActiveX Control are comparable to those that are provided in Java through the Java applets. Some features differ, as you can see in the comparison table that is presented in “Attributes and Parameters That Apply to the ActiveX Control, and the Contour, Graph, and Map Applets” on page 125. Also, the JAVA graphics output device does not display output that is generated with the GAREABAR, GBARLINE, or GRADAR procedures.
Unlike the JAVA graphics output device, you can use the ACTIVEX graphics output device to embed interactive graphics in Microsoft Word documents by using the ODS RTF statement, as shown in “Example: Generating an ActiveX Graph for a Microsoft Word Document” on page 31 and in “Importing Your Graphs into Microsoft Office” in SAS/GRAPH: Reference. You can also copy the ActiveX window out of Internet Explorer and paste it into a Microsoft Word, Excel, or PowerPoint document.
If you have created a graph with the ACTIVEX graphics output device, but you do not need the interactivity that it provides, then use the ACTXIMG graphics output device, as described in “Developing Web Presentations with the JAVAIMG and ACTXIMG Devices” in SAS/GRAPH: Reference. The ACTXIMG graphics output device creates a static snapshot of the graph in a PNG file. The graph has the same look as the graph that is produced with the ACTIVEX graphics output device, but the graph does not support interactivity. You can use the ACTXIMG graphics output device to create graphics output only on Windows systems. Although you do not
10 Chapter 1 / About the SAS/GRAPH Java Applets and ActiveX Control

need the SAS/GRAPH ActiveX Control when you are viewing the ACTXIMG output, to produce the output file, the SAS/GRAPH ActiveX Control must be installed on your computer. When SAS is installed on a Windows host, the SAS/GRAPH ActiveX Control is installed with the SAS software on that host. If you need to install the SAS/GRAPH ActiveX Control manually, see “Installing the SAS/GRAPH ActiveX Control” on page 19.
You can generate output for the SAS/GRAPH ActiveX Control even if you are not working in the Windows operating environment. For example, you can generate HTML output for ActiveX in the UNIX operating environment, even though you cannot run Internet Explorer in that environment. Opening the HTML in Internet Explorer on Windows displays the output as if it were generated in that operating environment. You can also run your SAS jobs in a stored process on UNIX and display the output in the Internet Exporer browser on Windows.
When you use the ACTIVEX graphics output device with an ODS destination that does not support the ACTIVEX graphics output device, SAS/GRAPH switches to the ACTXIMG graphics output device, which generates a PNG image. For example, the ODS PDF statement generates output for the Adobe Reader in a Portable Document Format (PDF) file. This format does not support embedded ActiveX applications. Specifying the ACTIVEX graphics output device with the ODS PDF statement generates a PDF output file that contains a static image of the graphics output. The ODS RTF destination creates an RTF file that contains a PNG image. The ODS PRINTER destinations use their native format.
The ACTXIMG graphics output device provides data tip support and drill-down functionality that is similar to the PNG graphics output device.See “Enhancing Web Presentations with Chart Descriptions, Data Tips, and Drill-Down Functionality” in SAS/GRAPH: Reference.
For more information about the using the ACTIVEX graphics output device, see Chapter 2, “Generating Interactive ActiveX Output,” on page 17.
When to Use the JAVA Graphics Output DeviceIf your users use a variety of web browsers, you can use the SAS/GRAPH JAVA graphics output device to generate your graphs. The JAVA graphics output device output can be viewed on any supported web browser with Java enabled. The JAVA graphics output device generates output for the Graph, Map, Tile, and Contour applets. These applets provide user interactivity in all of the supported web browsers. If you do not need interactivity, then use the JAVAIMG graphics output device, as described in “Developing Web Presentations with the JAVAIMG and ACTXIMG Devices” in SAS/GRAPH: Reference, or use the PNG graphics output device, as described in “Developing Web Presentations with the PNG, SVG, and GIF Devices” in SAS/GRAPH: Reference.
Note: The JAVA graphics output device does not support character values on the response axis. When generating plots with the JAVA graphics output device, at least one variable must be numeric. When a numeric value is specified for the category axis and a character variable is specified for the response axis, the axis values are swapped in order to place the character value on the category axis. If both values are character values, the plot is not generated.
For more information about using the JAVA graphics output device, see Chapter 3, “Generating Interactive Java Output,” on page 39.
The SAS/GRAPH ACTIVEX, JAVA, and JAVAMETA Graphics Output Devices 11

When to Use the JAVAMETA Graphics Output DeviceIf your users use a variety of web browsers and you want to add panning and zooming features to your graph, the JAVAMETA graphics output device might be a better choice than the JAVA graphics output device. It is also a good choice for creating animated graphs and slide shows. Like the JAVA graphics output device, the JAVAMETA graphics output device output can be viewed on any supported web browser with Java enabled. The JAVAMETA graphics output device generates output for the G3D, GANNO, GBARLINE, GCHART, GCONTOUR, GPLOT, GMAP, GRADAR, GREPLAY, and GSLIDE procedures. The JAVAMETA output provides user interactivity in all web browsers, but it is limited to panning, zooming, data tips, and drill-down links. You cannot move the graph, change the graph colors, or change the graph type.
For more information, see Chapter 4, “Generating Interactive Metagraphics Output,” on page 59.
The Output Process for the ACTIVEX and JAVA Graphics Output Devices
The following diagram illustrates the output process for the JAVA and ACTIVEX graphics output devices.
goptions device=
activex | java;
ods html;
proc ...
PROC DOCUMENTworks fromthis point
image
ODS
ODS Output Object
ACTIVEXor JAVADevice
XML
HTML and XML File Browser
Size and colorinformation
from styles is incorporated here
Device Catalog Entries for the ACTIVEX, JAVA, and JAVAMETA Graphics Output Devices
SAS/GRAPH provides device entries for your operating environment in the SASHELP.DEVICES catalog. Entries for the ACTIVEX, JAVA, and JAVAMETA graphics output devices are included. The ACTIVEX and JAVA graphics output devices do not honor the specifications in these device entries while the JAVAMETA graphics output device does. For the JAVAMETA graphics output device, you can use the QDEVICE procedure to view the JAVAMETA graphics output device entry or a custom metagraphics device entry. You can use the GDEVICE procedure to create and modify custom metagraphics device entries.
12 Chapter 1 / About the SAS/GRAPH Java Applets and ActiveX Control

For more information about SAS/GRAPH graphics output devices and the device catalog entries, see “Using Graphics Devices” in SAS/GRAPH: Reference.
Controlling the Appearance of the ACTIVEX, JAVA, and JAVAMETA Graphics Output Device Output
You can use graphics options and ODS styles to control the appearance of your ACTIVEX, JAVA, and JAVAMETA graphics output device output. For information about controlling the appearance of your SAS/GRAPH output, see SAS/GRAPH: Reference.
You can also specify parameters in the ODS statement to affect the output. For information about the ActiveX and Java parameters, see “ActiveX Control and Java Applet Parameter Dictionary” on page 119.
About Using the SAS/GRAPH ACTIVEX and JAVA Devices in SAS Studio
Default Output in SAS StudioBy default, SAS Studio generates output as HTML, PDF, and RTF files. HTML is the primary output format in SAS Studio. When you run a SAS program in SAS Studio, any HTML output that is generated is displayed in the Results tab. PDF and RTF output, if requested, is also generated but is not displayed. You must download any PDF and RTF output from the Results tab. For information about results in SAS Studio, see SAS Studio: User’s Guide for your version of SAS Studio. You can find the documentation for all versions of SAS Studio on the SAS Studio documentation page on support.sas.com.
Generating ActiveX and Java HTML Output in SAS StudioThe HTML output in SAS Studio is generated using a customized ODS HTML5 destination that generates images in the PNG or SVG format. Using the GOPTIONS DEVICE= option to specify a device has no effect on the default HTML output in SAS Studio. To generate ActiveX and Java output in HTML in SAS Studio, use your own ODS HTML destination as follows:
1 Close the currently open ODS destinations:
ods _all_ close;
2 Open your ODS HTML destination, and specify the location of the output files:
ods html path="path-to-output" file="html-filename.html" <options>
About Using the SAS/GRAPH ACTIVEX and JAVA Devices in SAS Studio 13

where:
path="path-to-output"specifies a writable path for the output file that is accessible to the SAS Studio server.
file="html-filename.html"specifies a name for the HTML output file.
<options>specifies one or more additional ODS options. For information about additional ODS options, see SAS Output Delivery System: User’s Guide.
3 Use SAS/GRAPH procedures such as GCHART or GPLOT to generate your output.
4 When you have finished generating your output, close your ODS HTML destination:
ods html close;
The examples in this book follow this general pattern so that you can run the examples in SAS Studio or in the SAS windowing environment.
Generating ActiveX RTF Output in SAS StudioUnless your SAS Studio is configured to use UTF-8 character encoding, you can generate ActiveX RTF output using the default output in SAS Studio. Otherwise, you can generate only static RTF output using the ACTXIMG device. See “The ACTIVEX Device and RTF with UTF-8 Character Encoding” on page 9. If your SAS Studio is configured to use an encoding other than UTF-8, generate your RTF output using the ACTIVEX device as you normally would in SAS Studio, and then download the RTF output from the Results tab. Alternatively, use a pattern similar to that described in “Generating ActiveX and Java HTML Output in SAS Studio” on page 13 to open your own ODS RTF destination.
The DS2TREE and DS2CONST MacrosSAS/GRAPH provides the following macros that you can use to generate tree view and constellation diagrams from a SAS data set:
n DS2TREE, which generates tree view diagrams
n DS2CONST, which generates constellation diagrams
To use these macros, define your data, and then call one of these macros using the appropriate options. For these macros, you do not use ODS or call a SAS/GRAPH procedure. For additional information, see Chapter 6, “Generating Interactive Treeview Diagrams Using the DS2TREE Macro,” on page 81 and Chapter 7, “Generating Interactive Constellation Diagrams Using the DS2CONST Macro,” on page 93.
14 Chapter 1 / About the SAS/GRAPH Java Applets and ActiveX Control

Data Tip and Drill-Down Support in Java and ActiveX
When generating graphs using the Java applet or the SAS/GRAPH ActiveX Control, you can enhance your graphs by doing the following:
n displaying pop-up text when the mouse pointer is over a portion of the diagram. See “Data Tips for Web Presentations” in SAS/GRAPH: Reference.
n adding drill-down links that enable you to link to other web resources. See “Adding Links and Enhancements with the URL=, HTML=, and HTML_LEGEND= Options” in SAS/GRAPH: Reference.
Note: The Java applet and SAS/GRAPH ActiveX Control do not support chart descriptions.
The following table lists the enhancements that are supported by the Java applet and the SAS/GRAPH ActiveX Control.
Table 1.2 Support for Data Tips and Drill-Down Functionality
Graphics Device or Macro
Data Tips Drill-down Links
Generated by default
Can be customized
Generated by default
Can be customized
ACTIVEX graphics output device
Yes Yes No Yes
JAVA graphics output device
Yes Yes No Yes
JAVAMETA graphics output device
No Yes No Yes
DS2CONST macro
Yes1 Yes2 No Yes
DS2TREE macro
Yes1 Yes2 No Yes
1 Node data tips only.2 Both node and link data tips.
Data Tip and Drill-Down Support in Java and ActiveX 15

Requirements for Viewing Java and ActiveX Output
To view your SAS/GRAPH Java applet or ActiveX control output, you must view the HTML file through a supported web browser. You can find a list of supported web browsers on the Third-Party Software Requirements page on support.sas.com.
Depending on how the output is generated, there might be additional requirements. The following table shows what is required in addition to a supported browser.
Table 1.3 Additional Requirements
Graphics Output Device or Macro Additional Requirements
ACTIVEX graphics output device
The presentation must be viewed with Internet Explorer on a Windows system with the SAS/GRAPH ActiveX Control installed locally. See “Installing the SAS/GRAPH ActiveX Control” on page 19.
JAVA and JAVAMETA graphics output devices
DS2TREE and DS2CONST macros
The Java applet JAR files must be installed locally or on a server accessible by the client machine at the path specified by the CODEBASE applet option. The Java plug-in must be installed on each client machine. On Windows systems, the user is prompted to install the plug-in if it is not already installed. On other systems, the plug-in must be installed manually. See “About the Java HTML Output and the Java Runtime Environment Plug-in” on page 44.
Note:
n Graphs generated with the ACTIVEX driver can be viewed only with Internet Explorer on any Windows PC with the SAS/GRAPH ActiveX Control installed locally. The Microsoft Edge browser does not support ActiveX.
n The SAS/GRAPH Java applets are no longer shipped with SAS Viya starting with SAS Viya 3.5 and SAS Studio 5.2. The applets are still shipped with SAS 9.4. To view output from the SAS/GRAPH JAVA device in SAS Viya 3.5 and later releases, you must download the SAS/GRAPH Java applets from support.sas.com and install them locally. See “Downloading and Installing the SAS/GRAPH Java Applet JAR Files” on page 40.
16 Chapter 1 / About the SAS/GRAPH Java Applets and ActiveX Control

2Generating Interactive ActiveX Output
Overview of Creating Interactive Output for ActiveX . . . . . . . . . . . . . . . . . . . . . . . . . . . . 17
Installing the SAS/GRAPH ActiveX Control . . . . . . . . . . . . . . . . . . . . . . . . . . . . . . . . . . . . . 19About the ActiveX Control Installation . . . . . . . . . . . . . . . . . . . . . . . . . . . . . . . . . . . . . . . . . . 19Customizing the SAS/GRAPH ActiveX Control Installation Process . . . . . . . . . . . . . . 19Configuring Your ActiveX Presentation to Install the SAS/GRAPH
ActiveX Control from Your Local Network . . . . . . . . . . . . . . . . . . . . . . . . . . . . . . . . . . . . 20Configuring an Existing ActiveX Presentation to Install the SAS/
GRAPH ActiveX Control from Your Local Network . . . . . . . . . . . . . . . . . . . . . . . . . . . . 21Uninstalling the SAS/GRAPH ActiveX Control . . . . . . . . . . . . . . . . . . . . . . . . . . . . . . . . . . 22
Generating Output for ActiveX . . . . . . . . . . . . . . . . . . . . . . . . . . . . . . . . . . . . . . . . . . . . . . . . . . 22
About Languages in ActiveX . . . . . . . . . . . . . . . . . . . . . . . . . . . . . . . . . . . . . . . . . . . . . . . . . . . 24
About Special Fonts and Symbols in ActiveX . . . . . . . . . . . . . . . . . . . . . . . . . . . . . . . . . . . 24
SAS Formats Supported by ActiveX . . . . . . . . . . . . . . . . . . . . . . . . . . . . . . . . . . . . . . . . . . . . 27
Configuring Drill-Down Links with ActiveX . . . . . . . . . . . . . . . . . . . . . . . . . . . . . . . . . . . . . 29
Configuring Data Tips with ActiveX . . . . . . . . . . . . . . . . . . . . . . . . . . . . . . . . . . . . . . . . . . . . . 30
Examples: Creating Interactive ActiveX Output . . . . . . . . . . . . . . . . . . . . . . . . . . . . . . . . . 30About These Examples . . . . . . . . . . . . . . . . . . . . . . . . . . . . . . . . . . . . . . . . . . . . . . . . . . . . . . . 30Example: Generating an ActiveX Graph for a Microsoft Word Document . . . . . . . . . 31Example: Generating an Interactive Contour Plot in ActiveX . . . . . . . . . . . . . . . . . . . . . 33Example: Script Drill-Down Mode with ActiveX . . . . . . . . . . . . . . . . . . . . . . . . . . . . . . . . . 33Example: URL Drill-Down Mode with ActiveX . . . . . . . . . . . . . . . . . . . . . . . . . . . . . . . . . . . 36Example: HTML Drill-Down ActiveX . . . . . . . . . . . . . . . . . . . . . . . . . . . . . . . . . . . . . . . . . . . 37
Overview of Creating Interactive Output for ActiveX
The SAS/GRAPH ActiveX Control provides user interactivity in Microsoft Office products in the Windows operating environment. Interactive features include the ability to change graph types (a bar chart to a pie chart, for example), display data tips at the point of the cursor, rotate and zoom, reassign variable roles, and modify axes, legends, colors, and text fonts.
17

For your web users who have installed SAS locally, the control is run automatically when the HTML output file is displayed in Internet Explorer. For your web users who do not have the SAS system installed locally, and who have not already installed the SAS/GRAPH ActiveX Control, you can configure your HTML output file to prompt them to install the control at display time, as described in “Installing the SAS/GRAPH ActiveX Control” on page 19.
You can enhance your ActiveX presentations by adding drill-down links (see “Configuring Drill-Down Links with ActiveX” on page 29) and configuring interactive features (see “Specifying Parameters and Attributes for Java and ActiveX” on page 121).
In addition to HTML output, you can use the SAS/GRAPH ActiveX Control to display interactive graphs in Object Linked Embedded (OLE) documents, and in applications written in Visual Basic, C++, and JavaScript. You can also include them in Microsoft Office Products, such as Word, Excel, and PowerPoint. See “Using SAS/GRAPH Output with Microsoft Office Products” in SAS/GRAPH: Reference.
The following table lists the procedures and statements that generate output that can be displayed in the SAS/GRAPH ActiveX Control.
Table 2.1 Procedures and Statements That Generate Output for the SAS/GRAPH ActiveX Control
Procedure Statements
GAREABAR HBAR, VBAR
GBARLINE BAR, PLOT
GCHART BLOCK, HBAR, HBAR3D, VBAR, VBAR3D, PIE, PIE3D, DONUT
GCONTOUR PLOT
GMAP CHORO, BLOCK, PRISM
GPLOT BUBBLE, BUBBLE2, PLOT, PLOT2
GRADAR CHART
G3D PLOT, SCATTER
GTILE FLOW, TILE, TOGGLE
Note the following:
n Using PROC GMAP to generate a highly detailed map might create a large HTML output file, which might cause problems on certain web browsers. If this is the case, you can use PROC GREDUCE to remove some of the complexity and produce a more usable map.
n The SAS/GRAPH ActiveX Control does not enable 8-bit gray scale images. If you use images for backgrounds or chart elements, make sure that they are 24-bit images.
18 Chapter 2 / Generating Interactive ActiveX Output

n The ACTIVEX device does not support character values on the response axis. When generating plots with the ACTIVEX device, at least one variable must be numeric. When a numeric value is specified for the category axis and a character variable is specified for the response axis, the axis values are swapped in order to place the character value on the category axis. If both values are character values, the plot is not generated.
Installing the SAS/GRAPH ActiveX Control
About the ActiveX Control InstallationThe SAS/GRAPH ActiveX Control is installed silently when you install SAS/GRAPH. When you create a web presentation using the SAS/GRAPH ACTIVEX device, by default, the resulting presentation is configured to prompt users to install the SAS/GRAPH ActiveX Control if it is not already installed. The SAS/GRAPH software configures the presentation by setting the CODEBASE= option in the HTML file as shown in the following example:
CODEBASE="http://www2.sas.com/codebase/graph/v94/sasgraph.exe#version=9,4"
No files are installed without the user's permission. Your users can refuse installation by refusing the licensing agreement at the beginning of the installation process. Also note that the installation program does not run if the control has already been installed. You can customize the installation process as described in “Customizing the SAS/GRAPH ActiveX Control Installation Process” on page 19.
Customizing the SAS/GRAPH ActiveX Control Installation Process
Rather than using the default installation process, you can customize the installation by downloading the installation program and running it manually on your local computers. You can also make the installation program available to all of your users on your local network for installation on an as-needed basis. To download the installation program, do the following:
1 Open the SAS All Downloads page in your web browser:
http://support.sas.com/demosdownloads/
2 Click SAS/GRAPH Software in the SAS system software list.
3 Click SAS/GRAPH Control for ActiveX under the appropriate SAS version.
4 In the SAS/GRAPH Control for ActiveX download table, click the executable file under Request Download for your Windows platform.
5 If the Sign In page is displayed, enter your credentials, and then click Sign In.
Installing the SAS/GRAPH ActiveX Control 19

Note: You must be signed in on your account in order to download files. If you do not have an account, click Create Profile under New User? to create your account profile.
6 Click the executable file under Request Download for your Windows platform again.
7 Read the license agreement, and then click Accept to accept the agreement.
Note: To cancel the download, click Do Not Accept.
8 Download the file to your local computer.
To install the SAS/GRAPH ActiveX on a local computer, run the Control for ActiveX installation program as Administrator, and then and follow the installation prompts. The installation program installs the SAS/GRAPH ActiveX Control files in the folder shown in the following table.
Computer Platform ActiveX Control Platform Installation Folder
Win32 Win32 C:\Program Files\SASHome\Graph\V9
Win64 Win32 c:\Program Fiiles (x86)\SASHome\Graph\V9
Win64 C:\Program Files\SASHome\Graph\V9
Installation requires about 15 megabytes of disk space for the 32-bit version and about 30 megabytes for the 64-bit version.
If you want to configure your SAS/GRAPH ActiveX web presentations to install the SAS/GRAPH ActiveX Control as-needed from your local network rather than the SAS website, copy the installation program to a shared location on your network. The shared location can be a shared directory or public folder on your file system, or a web server on your network. After you have made the installation program available to your users, you can then configure your new and existing ActiveX presentations to install the SAS/GRAPH ActiveX Control from your local network. See “Configuring Your ActiveX Presentation to Install the SAS/GRAPH ActiveX Control from Your Local Network” on page 20 and “Configuring an Existing ActiveX Presentation to Install the SAS/GRAPH ActiveX Control from Your Local Network” on page 21.
Configuring Your ActiveX Presentation to Install the SAS/GRAPH ActiveX Control from Your Local Network
To configure a SAS/GRAPH ActiveX web presentation to install the SAS/GRAPH ActiveX control from your local network, do the following:
20 Chapter 2 / Generating Interactive ActiveX Output

1 If you have not already done so, download the SAS/GRAPH ActiveX Control installation program and copy it to a shared location as described in “Customizing the SAS/GRAPH ActiveX Control Installation Process” on page 19.
2 In the SAS program for your presentation, use the CODEBASE= option with the ODS HTML statement to configure the HTML output file to reference the installation program when the HTML file is opened. For example:
ods html body="myGraph.html"codebase="http://www.ourco.com/sasweb/graph/installation-filename.exe#version=9,4";
where installation-filename.exe is the name of the Control for ActiveX installation program.
If the installation program is stored on your file system rather than on a web server, then you can use a file specification as the value of the CODEBASE attribute. For example:
ods html body="myGraph.html"codebase="/sasweb/graph/installation-filename.exe#version=9,4";
3 (Optional) If SAS or the SAS/GRAPH ActiveX Control is not installed on a local computer, open your web presentation and verify the following:
n A prompt to install the SAS/GRAPH ActiveX control appears.
n The installation is successful.
n The presentation is displayed properly.
Note: If you want to remove the SAS/GRAPH ActiveX Control after the test, follow the instructions in “Uninstalling the SAS/GRAPH ActiveX Control” on page 22.
Configuring an Existing ActiveX Presentation to Install the SAS/GRAPH ActiveX Control from Your Local Network
To configure an existing SAS/GRAPH ActiveX web presentation so that it installs the SAS/GRAPH ActiveX Control from your local network, do the following:
1 If you have not already done so, download the SAS/GRAPH ActiveX Control installation program and copy it to a shared location as described in “Customizing the SAS/GRAPH ActiveX Control Installation Process” on page 19.
2 In a text editor, open the initial HTML file of your web presentation.
3 In the OBJECT tag, insert the CODEBASE= attribute. The attribute references the location of the installation program. The following CODEBASE value references a public directory:
CODEBASE="/sasweb/graph/installation-filename.exe#version=9,4"
If the installation program is stored on a web server, use an HTTP reference. For example:
CODEBASE="http://www.ourco.com/sasweb/graph/installation-filename.exe#version=9,4"
Installing the SAS/GRAPH ActiveX Control 21

4 Save the HTML file and close the editor.
5 (Optional) If SAS or the SAS/GRAPH ActiveX Control is not installed on a local computer, open the modified web presentation and verify the following:
n A prompt to install the SAS/GRAPH ActiveX control appears.
n The installation is successful.
n The presentation is displayed properly.
Note: If you want to remove the SAS/GRAPH ActiveX Control after the test, see “Uninstalling the SAS/GRAPH ActiveX Control” on page 22.
With the file thus modified, displaying the HTML file gives users who need it the option of installing the control in the default location on their local computers.
Uninstalling the SAS/GRAPH ActiveX ControlIf the SAS/GRAPH ActiveX Control was installed with the SAS/GRAPH software, you cannot manually uninstall the SAS/GRAPH ActiveX Control separately from the SAS/GRAPH software. In that case, to uninstall the SAS/GRAPH ActiveX Control, you must uninstall the SAS/GRAPH software. If you manually installed the SAS/GRAPH ActiveX Control, you can manually uninstall it.
To manually uninstall the SAS/GRAPH ActiveX Control on Windows 10, for example, do the following:
1 In the taskbar search box, type control panel, and then press Enter.
Note: If the search box is not on your taskbar, right-click Start, and then select Search.
2 Under Programs, click Uninstall a program.
3 Click SAS/Graph ActiveX Control version 9.4 in the list of currently installed programs.
4 Click Uninstall/Change, and then follow the prompts to remove the program.
5 Close the Control Panel window.
For information about how to manually uninstall this program on other versions of Microsoft Windows, refer to the Microsoft documentation.
Generating Output for ActiveXThe SAS/GRAPH ActiveX Control displays interactive charts, maps, and plots. The following table lists the various ways that you can deliver ActiveX output to your audience.
22 Chapter 2 / Generating Interactive ActiveX Output

Table 2.2 Primary Delivery Choices for SAS/GRAPH ActiveX Control Output
Application ODS Statement Output File
Internet Explorer ODS HTML HTML
Microsoft Word ODS RTF Rich text format
Adobe Acrobat Reader ODS PDF Portable document format
Ghostview, and so on ODS PS PostScript format
Note: These choices also apply to the JAVA device.
Table 2.1 on page 18 lists the SAS/GRAPH procedures that generate output for ActiveX.
Follow these steps to generate a default web presentation that runs the SAS/GRAPH ActiveX Control.
1 Reset the graphics options and specify the ACTIVEX device:
goptions reset=all device=activex;
2 Close the currently open ODS destinations:
ods _all_ close;
3 Open an ODS destination that is listed in Table 2.2 on page 23. Use the STYLE= option to specify an ODS style (see “Using ODS Styles, Device Parameters, and Options” in SAS/GRAPH: Reference), and use the PATH= and BODY= options to specify an output filename other than the default. Use the NOGTITLE option to write the graph title outside the graph borders.
Note: When the ACTIVEX device is used, the graph title is always written outside the graph border. The GTITLE option is ignored in that case.
For example:
ods html style=analysis path="output-path" file="your_file.htm" nogtitle;
4 Run a procedure or procedures that are supported by the ACTIVEX device (see Table 2.1 on page 18):
title "Chart of Average Weight and Height by Sex";proc gchart data=sashelp.class; vbar sex / type=mean sumvar=height group=age subgroup=sex space=0;run;quit;
5 Close the ODS destination that you opened in step 3 to close the HTML file. If you are using the SAS windowing environment, reopen the ODS HTML destination. For example:
ods html close;ods html; /* Not required in SAS Studio. */
Generating Output for ActiveX 23

The preceding program assumes that your web users have installed the SAS/GRAPH ActiveX Control in advance. If the SAS/GRAPH ActiveX Control is not already installed on a user's computer, your web presentation automatically prompts the user to install the SAS/GRAPH ActiveX Control. For information about prompting new users to start the SAS/GRAPH ActiveX Control installation process, see “Configuring Your ActiveX Presentation to Install the SAS/GRAPH ActiveX Control from Your Local Network” on page 20. For further troubleshooting information, see Chapter 8, “Troubleshooting Java and ActiveX Output,” on page 111. For information about enhancing the default web presentation, see “Configuring Drill-Down Links with ActiveX” on page 29.
About Languages in ActiveXFor international audiences, the SAS/GRAPH ActiveX Control has a graphical user interface that can appear in the following languages:
Arabic French KoreanChinese, simplified German PolishChinese, traditional Hebrew RussianDanish Hungarian SpanishDutch Italian SwedishEnglish Japanese Turkish
In general, web-based ActiveX devices must use a language-specific operating environment and web browser in order to display a translated graphical user interface. For further information, contact your on-site SAS support personnel.
About Special Fonts and Symbols in ActiveXThe ACTIVEX device supports only system fonts. You can also use characters from many of the fonts that you have installed on your computer. The ACTIVEX device supports most of the symbols that you can use with the VALUE= option in the SYMBOL statement. (See “SYMBOL Statement” in SAS/GRAPH: Reference.) The following table shows the symbols that are supported by ActiveX and the value that you must specify in the SYMBOL statement VALUE= option for each.
Table 2.3 Symbols That Are Supported by ActiveX
Value Symbol Value Symbol
ARROW MARS or >
ARROWDOWN MARSFILLED
24 Chapter 2 / Generating Interactive ActiveX Output

Value Symbol Value Symbol
ARROWLEFT PLUS
ARROWRIGHT POINT
ASTER SALTIRE
ASTERISK SALTIREFILLED
CHAIN SPADE or " (double quote)
CIRCLE SPADEFILLED
CIRCLEFILLED SPHERE
CLUB or % SPIRAL
CLUBFILLED SQUARE
CONE SQUAREFILLED
CROSS STAR or =
CROSSFILLED HEX
CUBE STARFILLED
CYLINDER TACK
DIAMOND or $ TILDE
DIAMONDFILLED TRIANGLE
DOT TRIANGLEDOWN
EARTH or + TRIANGLEDOWNFILLED
EARTHFILLED TRIANGLEFILLED
About Special Fonts and Symbols in ActiveX 25

Value Symbol Value Symbol
FEMALEFIGURE TRIANGLELEFT
FEMALEFIGUREFILLED
TRIANGLELEFTFILLED
FLAG TRIANGLERIGHT
FLAGFILLED TRIANGLERIGHTFILLED
GREATERTHAN UNION
HASH VENUS or * (asterisk)
HEART or # VENUSFILLED
HEARTFILLED WEAVE
HEX WIDEARROW
HEXAGON WIDEARROWDOWN
HEXAGONFILLED WIDEARROWDOWNFILLED
HOME WIDEARROWFILLED
HOMEDOWN WIDEARROWLEFT
HOMEDOWNFILLED WIDEARROWLEFTFILLED
HOMEFILLED WIDEARROWRIGHT
HOURGLASS WIDEARROWRIGHTFILLED
HOURGLASSFILLED X
IBEAM Y
LESSTHAN Z
26 Chapter 2 / Generating Interactive ActiveX Output

Value Symbol Value Symbol
MALEFIGURE
MALEFIGUREFILLED
The following table lists the symbols that are not supported by ActiveX.
Table 2.4 Symbols That Are Not Supported by ActiveX
Value Symbol Value Symbol
PAW <
_ (underscore) , (comma)
& /
' (single quote) ?
- (hyphen) (
@ )
. (period) :
SAS Formats Supported by ActiveXThe ActiveX devices support the SAS character, numeric, and date and time formats that are listed in the following tables. For more information about the formats, see the SAS System Options: Reference.
Table 2.5 Character Formats Supported by ActiveX
$ $ASCII $BINARY $BYVAL $CHAR
$EBCDIC $HEX $OCTAL $QUOTE $REVERJ
$REVERS $UPCASE $XPORTCH
SAS Formats Supported by ActiveX 27

Table 2.6 Numeric Formats Supported by ActiveX
BEST BESTX BINARY COMMA COMMAX
D DOLLAR DOLLARX E EURO
EUROX F FLOAT FRACT HEX
IB IBR IEEE IEEER LOGPROB
MINGUO MRB NEGPAREN NUMX OCTAL
ODDSR PB PCPIB PERCENT PERCENTN
PIB PIBR PK PVALUE RB
ROMAN S370FF S370FHEX S370FIB S370FIBU
S370FPD S370FPDU S370FPIB S370FRB S370FZD
S370FZDL S370FZDS S370FZDT S370FZDU SIZEK
SIZEKB SIZEKMG SSN VAXRB WORDF
WORDS XPORTFLT XPORTINT YEN Z
ZD
Note: The ACTIVEX and ACTXIMG devices do not honor a numeric format that is applied to the values of a base 10 logarithmic axis.
Table 2.7 Date and Time Formats Supported by ActiveX
DATE DATEAMPM DATETIME DAY DDMMYY
DDMMYYB DDMMYYC DDMMYYD DDMMYYN DDMMYYP
DDMMYYS DOWNAME DTDATE DTMONYY DTWKDATX
DTYEAR DTYYQC HHMM HOUR JULDATE
JULDAY JULIAN MDYAMPM MMDDYY MMDDYYB
MMDDYYC MMDDYYD MMDDYYN MMDDYYP MMDDYYS
MMSS MMYY MMYYC MMYYD MMYYN
MMYYP MMYYS MONNAME MONTH MONYY
NENGO PDJULG PDJULI QTR QTRR
TIME TIMEAMPM TOD WEEKDATE WEEKDATX
WEEKDAY WORDDATE WORDDATX XYYMMDD YEAR
28 Chapter 2 / Generating Interactive ActiveX Output

YYMM YYMMC YYMMD YYMMDD YYMMDDB
YYMMDDC YYMMDDD YYMMDDN YYMMDDP YYMMDDS
YYMMN YYMMP YYMMS YYMON YYQ
YYQC YYQD YYQN YYQP YYQR
YYQRC YYQRD YYQRN YYQRP YYQRS
YYQS YYQZ
Note: The ACTIVEX and ACTXIMG devices do not support nested formats that include user-defined formats in the nesting. If you want to use a custom format with these devices and the custom format nests other formats, make sure that it nests only the formats that are provided by SAS.
Note: The ACTIVEX and ACTXIMG devices do not honor the DATATYPE=DATE option in the FORMAT procedure PICTURE statement.
Configuring Drill-Down Links with ActiveXActiveX parameters provide a way to implement drill-down functionality and to configure interactive features. The purpose and syntax of these parameters are defined in “ActiveX Control and Java Applet Parameter Dictionary” on page 119. In the ODS HTML statement, ActiveX parameters are specified with the PARAMETERS= option, as described in Chapter 5, “Controlling Drill-Down Behavior for ActiveX and Java Using Parameters,” on page 67.
The SAS/GRAPH ActiveX Control enables the URL, HTML, and Script drill-down modes for charts and maps. Drill-down functionality is not enabled for contour plots. These drill-down modes are implemented in ActiveX in the same way that they are implemented in Java. For information about implementing these drill-down modes, see “Specifying the Drill-Down Mode” on page 69.
Note: You can convert the Java examples to ActiveX by changing the DEVICE=JAVA graphics option in the GOPTIONS statement to DEVICE=ACTIVEX.
The following table lists the procedures and statements that generate output that can be used in ActiveX presentations with drill-down functionality.
Table 2.8 Statements Enabled for Drill-Down Functionality in ActiveX
Procedure Statements
GBARLINE BAR, PLOT
Configuring Drill-Down Links with ActiveX 29

Procedure Statements
GCHART HBAR, HBAR3D, VBAR, VBAR3D, PIE, PIE3D, DONUT
GPLOT PLOT, BUBBLE
GMAP CHORO, BLOCK, PRISM
G3D PLOT, SCATTER
Configuring Data Tips with ActiveXFor output generated with the ACTIVEX graphics output device, data tips are created by default. The data tips are displayed when the mouse pointer is positioned over a graph data element. Use the TIPS=NONE parameter to suppress data tips for ActiveX. For example:
ODS HTML parameters=("Tips"="NONE")
For SAS/GRAPH procedures that support the HTML= option, you can add custom data tips to the output as described in “Adding Custom Data Tips with the HTML= Option” in SAS/GRAPH: Reference. To determine whether a procedure supports the HTML= option, refer to the description for that procedure in SAS/GRAPH: Reference.
Note: The output from the ACTIVEX graphics output device does not display custom data tips when the number of observations in the graph data exceeds 5000.
Examples: Creating Interactive ActiveX Output
About These ExamplesThe examples in this section describe how to create interactive graphs using the ACTIVEX device. The examples include:
n “Example: Generating an ActiveX Graph for a Microsoft Word Document” on page 31
n “Example: Generating an Interactive Contour Plot in ActiveX” on page 33
n “Example: Script Drill-Down Mode with ActiveX” on page 33
30 Chapter 2 / Generating Interactive ActiveX Output

The following additional samples are available in the Sample Library:
n GWBAXBLK—Generating an Interactive Block Diagram
n GWBAXCON—Generating an Interactive Contour Plot
n GWBAXMAP—Generating an Interactive Map for the web
n GWBDRACT—ActiveX Map with Script-mode drill-down
n GWBDRAC2—Another ActiveX Map with JavaScript
Note: The SAS Sample Library is not available in SAS Studio. If you are using SAS Studio, you can download the SAS/GRAPH samples in the SAS Sample Library in zipped form from the SAS/GRAPH documentation page on support.sas.com.
Example: Generating an ActiveX Graph for a Microsoft Word Document
Here is an example that demonstrates how the ODS RTF statement can be combined with the ACTIVEX device to generate interactive graphs inside Microsoft Word files.
Here is the example program code.
goptions reset=all device=activex hsize=4.5in vsize=3.5in;ods _all_ close;ods rtf path="output-path" file="vehicles.rtf" style=statistical;title1 "Types of Vehicles Produced Worldwide (Details)";proc gchart data=sashelp.cars;pie type / detail=drivetrain detail_percent=best detail_value=none detail_slice=best detail_threshold=2 legend;run;quit;ods rtf close;ods html; /* Not required in SAS Studio. */
The following figure shows the result.
Examples: Creating Interactive ActiveX Output 31

The SAS/GRAPH ActiveX Control provides a pop-up menu that enables you to change many aspects of the graph, including the chart type. For example, to change the pie chart to a bar chart, right-click the graph, and then select ChartType ð VerticalBar in the pop-up menu. The chart changes from a pie chart to a vertical bar chart as shown in the following figure.
Note: The SAS/GRAPH ActiveX pop-up menu is not displayed if the SAS/GRAPH ActiveX Control is in the design mode in Microsoft Word. If the ActiveX object is in the design mode, in Microsoft Word, click the Exit Design Mode icon in the Control Toolbox.
32 Chapter 2 / Generating Interactive ActiveX Output

Example: Generating an Interactive Contour Plot in ActiveXHere is an example that displays a contour plot of water depth in a lake. The SAS/GRAPH ActiveX Control lets you manipulate many of the aspects of the plot using the pop-up menu that is displayed when you right-click.
Here is the example program code.
goptions reset=all border device=activex;ods _all_ close;ods html path="output-path" file="contour.html" style=default;proc gcontour data=sashelp.lake; plot width * length = depth;run;quit;ods html close;ods html; /* Not required in SAS Studio */
The following figure shows the result and the pop-up menu that appears when you right-click the graph.
Example: Script Drill-Down Mode with ActiveXHere is an example that shows how to implement the script drill-down mode in the SAS/GRAPH ActiveX Control. This example generates the drill-down vertical bar chart shown in the following figure.
Examples: Creating Interactive ActiveX Output 33

Figure 2.1 ActiveX Drill-down Graph of Mean Highway MPG for Sedans and Wagons by Origin
SAS/GRAPH provides data tips by default. These data tips are displayed when the cursor is over a bar. When a bar is clicked, a horizontal bar chart of mean highway mileage for sedans and wagons by drivetrain is opened in a new browser window. The following figure shows the drill-down chart that opens when the Europe bar for sedan is clicked.
To implement JavaScript drill-down functionality, PUT statements are used in a DATA step to insert code for the JavaScript function GRAPHDRILL into the drill-down chart HTML file after the file is generated. The GRAPHDRILL function
34 Chapter 2 / Generating Interactive ActiveX Output

generates the URL to the drill-down chart and opens the URL in a new browser window when a bar is clicked. Here is the SAS code for this example.
/* Specify the output path and HTML filename. */filename gout "output-path";%let fileurl=url-to-files; /* Terminate with a path separator such as '/'. */%let htmlfn=mileage.html;
/* Extract data for sedans and wagons from Sashelp.Cars. */data cars; set sashelp.cars(where=(type in ("Sedan" "Wagon")));run;
/* Generate the drill-down graphs. */%macro gengraph(origin,type); ods _all_ close; ods html file="mpg_&origin._&type..html" path=gout(url="&fileurl"); title "Mileage By Drivetrain for &type.s Made In &origin"; proc gchart data=cars(where=(origin eq "&origin" and type eq "&type")); hbar3d drivetrain / sumvar=mpg_highway type=mean mean name="MPG_&origin"; run; quit; ods html close;%mend gengraph;
goptions reset=all device=actximg gsfname=gout ypixels=250 xpixels=380 nodisplay;%gengraph(USA,Sedan);%gengraph(USA,Wagon);%gengraph(Europe,Sedan);%gengraph(Europe,Wagon);%gengraph(Asia,Sedan);%gengraph(Asia,Wagon);
/* Generate the main drill-down graph. */ods _all_ close;goptions reset=all device=activex nodisplay xpixels=500 ypixels=350;ods html file="&htmlfn" path=gout(url="&fileurl") parameters=("DRILLDOWNMODE"="Script" "EXTERNALNAME"="GIDX" "DRILLTARGET"="_self" "DRILLFUNC"="GraphDrill") attributes=("NAME"="GIDX");
title "Mileage By Origin for Sedans and Wagons";proc gchart data=cars(where=(type in ("Sedan" "Wagon")));vbar3d origin / sumvar=mpg_highway type=mean group=type;run;quit;ods html close;
/* Insert JavaScript function GRAPHDRILL into the HTML file. Function GRAPHDRILL generates the URL to the drill-down graph and opens the graph in a new browser window when a bar is clicked. */data _null_ ;
Examples: Creating Interactive ActiveX Output 35

file "%sysfunc(pathname(gout))/&htmlfn" mod;put " " ;put "<SCRIPT LANGUAGE='JavaScript'>" ;put "function GraphDrill( appletref )";put "{";put " /* Get Origin and Type. */";put " for(i = 2; i < GraphDrill.arguments.length; i += 2)";put " {";put " if (GraphDrill.arguments[i] == 'G_INDEPV,f' )";put " var origin = GraphDrill.arguments[i+1];";put " if (GraphDrill.arguments[i] == 'G_GROUPV,f' )";put " var type = GraphDrill.arguments[i+1];";put " };";put " ";put " /* Open the drill-down graph in a new browser window. */";put " window.open('mpg_' + origin + '_' + type + '.html',";put " ' ', 'height=350, width=550');";put "};";put "</SCRIPT>";run ;
goptions reset=all;ods html; /* Not required in SAS Studio. */
Example: URL Drill-Down Mode with ActiveXThe behavior is the same. Clicking a bar in the drill-down graph opens a drill-down graph in a new browser windows as shown in Figure 2.1 on page 34. Instead of using a JavaScript function to generate drill-down URLs, in this example, the URLs are added to the plot data in a DATA step. The HTML= option is then used in the VBAR3D statement to specify the link URL variable. Here is the code for this example.
/* Specify the output path and HTML filename. */filename gout "output-path";%let fileurl=url-to-files; /* Terminate with a path separator such as '/'. */%let htmlfn=mileage.html;
/* Extract data for sedans and wagons from Sashelp.Cars and add a URL variable. */data cars; length url $80; set sashelp.cars(where=(type in ("Sedan" "Wagon"))); url="href='&fileurl.mpg_" || strip(origin) || "_" || strip(type) || ".html'";run;
/* Generate the drill-down graphs. */%macro gengraph(origin,type); ods _all_ close; ods html file="mpg_&origin._&type..html" path=gout(url="&fileurl"); title "Mileage By Drivetrain for &type.s Made In &origin"; proc gchart data=cars(where=(origin eq "&origin" and type eq "&type")); hbar3d drivetrain / sumvar=mpg_highway type=mean mean name="MPG_&origin"; run;
36 Chapter 2 / Generating Interactive ActiveX Output

quit; ods html close;%mend gengraph;
goptions reset=all device=actximg gsfname=gout ypixels=250 xpixels=380 nodisplay;%gengraph(USA,Sedan);%gengraph(USA,Wagon);%gengraph(Europe,Sedan);%gengraph(Europe,Wagon);%gengraph(Asia,Sedan);%gengraph(Asia,Wagon);
/* Generate the main drill-down graph. */ods _all_ close;goptions reset=all device=activex nodisplay xpixels=500 ypixels=350;ods html file="&htmlfn" path=gout parameters=("DRILLDOWNMODE"="URL");
title "Mileage By Origin for Sedans and Wagons";proc gchart data=cars(where=(type in ("Sedan" "Wagon")));vbar3d origin / sumvar=mpg_highway type=mean group=type html=url;run;quit;ods html close;
goptions reset=all;ods html; /* Not required in SAS Studio. */
Example: HTML Drill-Down ActiveXThe behavior is the same. Clicking a bar in the drill-down graph opens a drill-down graph in a new browser windows as shown in Figure 2.1 on page 34. Instead of using a JavaScript function to generate drill-down URLs or adding URLs to the plot data, in this example, the specified URL pattern incorporates the value of the Origin and Type variables in the plot data to generate the drill-down links dynamically. Because variable Origin is the independent variable, the origin is obtained from parameter G_INDEPV. Because variable Type is the group variable, type is obtained from parameter G_GROUPV. The %NRSTR macro function is used to mask &G_INDEPV and &G_GROUPV in the URL-pattern string so that SAS does not interpret them as macro variables. Here is the code for this example.
/* Specify the output path and HTML filename. */filename gout "output-path";%let fileurl=url-to-files; /* Terminate with a path separator such as '/'. */%let htmlfn=mileage.html;
/* Extract data for sedans and wagons from Sashelp.Cars. */data cars; set sashelp.cars(where=(type in ("Sedan" "Wagon")));run;
Examples: Creating Interactive ActiveX Output 37

/* Generate the drill-down graphs. */%macro gengraph(origin,type); ods _all_ close; ods html file="mpg_&origin._&type..html" path=gout(url="&fileurl"); title "Mileage By Drivetrain for &type.s Made In &origin"; proc gchart data=cars(where=(origin eq "&origin" and type eq "&type")); hbar3d drivetrain / sumvar=mpg_highway type=mean mean name="MPG_&origin"; run; quit; ods html close;%mend gengraph;
goptions reset=all device=actximg gsfname=gout ypixels=250 xpixels=380 nodisplay;%gengraph(USA,Sedan);%gengraph(USA,Wagon);%gengraph(Europe,Sedan);%gengraph(Europe,Wagon);%gengraph(Asia,Sedan);%gengraph(Asia,Wagon);
/* Generate the main drill-down graph. */ods _all_ close;goptions reset=all device=activex nodisplay xpixels=500 ypixels=350;ods html file="&htmlfn" path=gout parameters=("DRILLDOWNMODE"="HTML" "DRILLPATTERN"=%nrstr("mpg_{&G_INDEPV,f}_{&G_GROUPV,f}.html"));
title "Mileage By Origin for Sedans and Wagons";proc gchart data=cars(where=(type in ("Sedan" "Wagon")));vbar3d origin / sumvar=mpg_highway type=mean group=type;run;quit;ods html close;
goptions reset=all;ods html; /* Not required in SAS Studio. */
38 Chapter 2 / Generating Interactive ActiveX Output

3Generating Interactive Java Output
Overview of Creating Interactive Output for Java . . . . . . . . . . . . . . . . . . . . . . . . . . . . . . . 39
Downloading and Installing the SAS/GRAPH Java Applet JAR Files . . . . . . . . . . . . . 40
Generating Output for Java . . . . . . . . . . . . . . . . . . . . . . . . . . . . . . . . . . . . . . . . . . . . . . . . . . . . . 41Generating Output for the Graph and Map Applets . . . . . . . . . . . . . . . . . . . . . . . . . . . . . . 41Resolving a Java OutOfMemoryError Exception in SAS . . . . . . . . . . . . . . . . . . . . . . . . . 43About the Java HTML Output and the Java Runtime Environment Plug-in . . . . . . . . 44About Languages in JAVA . . . . . . . . . . . . . . . . . . . . . . . . . . . . . . . . . . . . . . . . . . . . . . . . . . . . 44About Special Fonts and Symbols in JAVA . . . . . . . . . . . . . . . . . . . . . . . . . . . . . . . . . . . . . 44SAS Formats Supported for Java . . . . . . . . . . . . . . . . . . . . . . . . . . . . . . . . . . . . . . . . . . . . . . 45
Configuring Drill-Down Links for Java . . . . . . . . . . . . . . . . . . . . . . . . . . . . . . . . . . . . . . . . . . 48
Configuring Data Tips with JAVA . . . . . . . . . . . . . . . . . . . . . . . . . . . . . . . . . . . . . . . . . . . . . . . 49
Examples: Creating Interactive Java Output . . . . . . . . . . . . . . . . . . . . . . . . . . . . . . . . . . . . 49About These Examples . . . . . . . . . . . . . . . . . . . . . . . . . . . . . . . . . . . . . . . . . . . . . . . . . . . . . . . 49Example: Local Drill-Down Mode with Java . . . . . . . . . . . . . . . . . . . . . . . . . . . . . . . . . . . . 50Example: Script Drill-Down Mode with Java . . . . . . . . . . . . . . . . . . . . . . . . . . . . . . . . . . . . 52Example: URL Drill-Down Mode with Java . . . . . . . . . . . . . . . . . . . . . . . . . . . . . . . . . . . . . 54Example: HTML Drill-Down Mode . . . . . . . . . . . . . . . . . . . . . . . . . . . . . . . . . . . . . . . . . . . . . 56
Overview of Creating Interactive Output for JavaThe JAVA graphics output device generates interactive presentations that run in the Graph, Map, Tile, and Contour applets. These applets can display the output of certain SAS/GRAPH procedures as follows:
Graph applet G3D scatter plots, GCHART, GPLOT
Map applet GMAP
Tile Chart applet GTILE
Contour applet G3D surface plots, GCONTOUR
The Java applets enable web users to display data tips, to change the graph type, to pan, rotate, and zoom, and to change colors, fonts, axes, legends, and variable roles.
Note: The Java applets do not support the GAREABAR, GBARLINE, or GRADAR procedures. To provide interactivity with the output of these procedures, use the
39

ACTIVEX graphics output device instead, as described in Chapter 2, “Generating Interactive ActiveX Output,” on page 17. ActiveX output can also appear in Microsoft Word documents or other OLE applications.
You can enhance Java graphs by setting applet parameters and specifying Output Delivery System (ODS) options. Applet parameters let you configure drill-down links and override default values in the user interface. Information about parameters is provided in “ActiveX Control and Java Applet Parameter Dictionary” on page 119.
You can use ODS styles to enhance the appearance of Java graphs, as described in “Using ODS Styles, Device Parameters, and Options” in SAS/GRAPH: Reference.
To generate a web presentation that runs the Graph, Map, or Contour applet, you generally specify the JAVA graphics output device in a GOPTIONS statement, open the HTML destination, generate one or more graphs, and then close the HTML destination, as described in “Generating Output for Java” on page 41.
You can generate the same graphs as static images using the DEVICE=JAVAIMG graphics option. Static images can be displayed without requiring that the web user install the applets or Java Runtime Environment (JRE). For details, see “SVG, PNG, GIF, and TIFF Devices Compared to ACTXIMG and JAVAIMG Devices” in SAS/GRAPH: Reference.
You can also use the JAVAMETA graphics output device to create interactive metagraphics output. See Chapter 4, “Generating Interactive Metagraphics Output,” on page 59.
Downloading and Installing the SAS/GRAPH Java Applet JAR Files
The SAS/GRAPH Java applet JAR files are shipped with SAS 9.4, and with SAS 3.4 and earlier SAS releases. Starting with SAS Viya 3.5 and SAS Studio 5.2, the applet JAR files are not shipped with SAS . If you want to view SAS/GRAPH interactive Java output in SAS Viya 3.5 and later releases, you can download the SAS/GRAPH Java applet JAR files from support.sas.com and install them in a location that is accessible to your users. This also makes the applets available to users who do not have Read access to the SAS/GRAPH Java applet JAR files in your SAS installation directory.
Typically, the applet JAR files are installed on a web server. To install the SAS/GRAPH Java applet JAR files on your web server, do the following:
1 Go to support.sas.com and sign in.
Note: You must sign in to download files from support.sas.com. If you do not have a profile on support.sas.com, click Create a profile to create your profile.
2 In the right pane (Hello your-name), click Manage My Software.
3 In the Get Help row, click Get Downloads.
4 Under SAS System Software, click SAS/GRAPH Software.
40 Chapter 3 / Generating Interactive Java Output

5 For SAS 9.4 and SAS , click SAS/GRAPH Java Applets for Web Servers for the latest release of SAS.
6 In the Request Download column of the SAS/GRAPH Java Applets for Web Servers table, locate the appropriate graphapplet file for the target platform. Review the readme file for information about disk space requirements. Verify that sufficient disk space is available on the target machine.
7 If sufficient disk space is available on the target machine, click the graphapplet file to start the download.
8 Read the SAS License Agreement for Download, and then click Accept if you want to continue.
9 Save the file in a directory on the target machine or in a directory that is accessible to the target machine.
10 Extract the graphapplet file to a temporary directory.
11 In the temporary directory, run the setup script for the operating system, and then follow the installation prompts to install the files on your web server.
12 In SAS , set system option APPLETLOC to the URL of the SAS/GRAPH Java applet files as shown in the following example:
option appletloc="https://www.yourcompany.com/SAS/GraphApplets";
Generating Output for Java
Generating Output for the Graph and Map AppletsTo develop a SAS/GRAPH program that generates output for the Graph applet or Map applet, follow these steps:
1 Reset graphics options and specify the JAVA graphics output device:
goptions reset=all device=java;
2 currently open ODS destinations:
ods _all_ close;
3 Open the ODS HTML destination. You can use the STYLE= option to specify an ODS style and the FILE= option to specify the HTML filename. See “Using ODS Styles, Device Parameters, and Options” in SAS/GRAPH: Reference. Use the PARAMETERS= option to configure the applet. See “Specifying Parameters and Attributes for Java and ActiveX” on page 121. Use the NOGTITLE option to write the graph title outside the graph border.
Note: When the JAVA device is used, the graph title is always written outside the graph border. The GTITLE option is ignored in that case.
Generating Output for Java 41

For example:
ods html style=statistical path="output-path" file="your_file.htm" nogtitle parameters=("tips"="none");
Note: To run an applet, your users must be able access the appropriate Java archive files. Two archives are referenced by default: one is the Java plug-in from Oracle, and the other is the SAS Java archive.
In the HTML output file, the location of the Java plug-in from Oracle is specified in the CODEBASE attribute of the OBJECT tag. If you need to change this default value, then use the ATTRIBUTES= option of the ODS statement, as described in “Specifying Parameters and Attributes for Java and ActiveX” on page 121. On Windows systems, the user is prompted to install the plug-in if it is not already installed. On other systems, the plug-in can be installed from the SAS Third-Party Software Requirements web page.
The location of the SAS Java archive is specified in the JAVA_CODEBASE and ARCHIVE parameters in the body of the APPLET tag. The default JAVA_CODEBASE is specified by the APPLETLOC= system option. If the default value of this system option specifies a widely accessible URL, then you do not need to change this value. If you need to specify a different location, then you can change the value of the system option. Another alternative is to override the APPLETLOC= system option by specifying a value for the ODS statement option CODEBASE=, as described in “Specifying Parameters and Attributes for Java and ActiveX” on page 121.
Note: When specifying a location for the SAS Java archive, you can use an HTTP address, or you can use a UNC path, such as //sasjava, with forward slashes instead of backward slashes. If you use an HTTP address, the HTML file can be viewed through a web server or directly from the file system. However, if use a UNC path, the HTML file can be viewed from the file system only.
4 Run a procedure or procedures that are used by the JAVA graphics output device (see Table 2.1 on page 18):
title "Chart of Average Weight and Height by Sex";proc gchart data=sashelp.class; vbar sex / type=mean sumvar=height group=age subgroup=sex space=0;run;quit;
5 Close ODS HTML to close the output file, and then reopen ODS HTML:
ods html close;ods html; /* Not required in SAS Studio. */
Running your program starts the applet and displays the initial graph. If a large amount of data is used to generate the graph, the Java Virtual Machine (JVM) default heap size might not be sufficient to render the graph in your browser. In that case, the chart fails to display in your web browser, and the following error appears in the Java Console:
java.lang.OutOfMemoryError: Java heap space
42 Chapter 3 / Generating Interactive Java Output

To correct the problem, include the PARAMETERS= option in your ODS HTML statement to increase the heap size as described in “Specifying the Java Virtual Machine Maximum Heap Size” on page 124.
If the browser display differs from what you see in SAS, then ensure that your SAS/GRAPH procedure is fully enabled in the applet. See “Summary of ActiveX and Java Support” in SAS/GRAPH: Reference for details.
Note: Using the GMAP procedure to generate a highly detailed map might create a large HTML output file, which might cause problems on certain browsers. If this is the case, you can run the GREDUCE procedure to remove some of the complexity and produce a more usable map.
For further information about troubleshooting web output, see Chapter 8, “Troubleshooting Java and ActiveX Output,” on page 111.
Resolving a Java OutOfMemoryError Exception in SASIn some cases, Java might not have sufficient memory available to generate your Java graph. In that case, an OutOfMemoryError exception is thrown in SAS when you execute your SAS program. To increase the memory for Java, restart SAS and specify the following options in option -JREOPTIONS when you invoke SAS:
-Xmsspecifies the minimum Java memory (heap) size, in bytes. Set this value to a multiple of 1024 bytes that is greater than 1MB. Append the letter k or K to indicate kilobytes, or m or M to indicate megabytes. The default is 2MB. Here are some examples.
-Xms6291456-Xms6144k-Xms6m
-Xmxspecifies the maximum size, in bytes, of the memory allocation pool. Set this value to a multiple of 1024 bytes that is greater than 2MB. Append the letter k or K to indicate kilobytes, or m or M to indicate megabytes. The default is 64MB. Here are some examples.
-Xmx83886080-Xmx81920k-Xmx80m
As a general rule, set the minimum heap size (-Xms) equal to the maximum heap size (-Xmx) to minimize garbage collections. When selecting the new size, be aware of the maximum amount of physical memory that your computer has available. Typically, SAS sets both -Xms and -Xmx to be about 1/4 of the total available memory or a maximum of 128M. You can set a more aggressive maximum memory (heap) size, but it should never be more than 1/2 of physical memory. Here is an example that increases the memory for Java to 256M.
-jreoptions (-Xmx256m -Xms256m)
You might need to specify the setting in quotation marks:
Generating Output for Java 43

-jreoptions '(-Xmx256m -Xms256m)'
The exact syntax for specifying Java options varies, depending on your operating system. The amount of memory that you can allocate varies from system to system. The set of JRE options must be enclosed in parentheses. The JRE options that you specify are appended to the JRE options that are currently defined. Invalid JRE options are ignored.
For more information, see the SAS Companion for your operating system.
About the Java HTML Output and the Java Runtime Environment Plug-in
The Java Runtime Environment (JRE) plug-in is required to open HTML output that is generated by the JAVA graphics device. If the Java plug-in is not already installed in your browser, you must manually install it in order to open the JAVA device output. Refer to the browser documentation for information about installing the Java plug-in for your browser. Your users must also install the Java plug-in if it is not already installed on their computer.
The JRE requirements for the SAS/GRAPH 9.4 Graph, Map, Tile, and Contour applets are listed on the SAS Third-Party Software Requirements web page on support.sas.com. If later JREs are backward compatible, then the applets should work without any issues.
About Languages in JAVAFor international audiences, the Java applets have graphical user interfaces that can appear in the following languages: Chinese (simplified), Czech, Danish, English, French, German, Hebrew, Hungarian, Italian, Japanese, Korean, Norwegian, Polish, Russian, Spanish, and Swedish. Generally, to display a translated graphical user interface, web-based JAVA devices must use a language-specific operating environment and web browser. This requires the all-languages version of the JRE. For further information, contact your on-site SAS support personnel.
About Special Fonts and Symbols in JAVAThe Java devices support only system fonts. The following table shows the special symbols that the Java devices support and the value that you must specify in the SYMBOL statement VALUE= option for each.
Table 3.1 Symbols That Are Supported by Java
Value Symbol Value Symbol
* (asterisk) PLUS
44 Chapter 3 / Generating Interactive Java Output

Value Symbol Value Symbol
+ SQUARE
> STAR
CIRCLE TRIANGLE
DIAMOND X
DOT
See “SYMBOL Statement” in SAS/GRAPH: Reference for more information.
SAS Formats Supported for JavaThe JAVA devices support the SAS character, numeric, and the date and time formats that are listed in the following tables. For a description of these formats, see SAS System Options: Reference.
Table 3.2 Character Formats Supported by Java
$ $ASCII $BINARY $CHAR
$F $HEX $OCTAL
Table 3.3 Numeric Formats Supported by Java
BEST BINARY COMMA COMMAX COMMAX
D DOLLAR DOLLARX E EURO
EUROX F HEX LOGPROB NEGPAREN
NLBEST NLD NLMNIAED NLMNIAUD NLMNIBGN
NLMNIBRL NLMNICAD NLMNICHF NLMNICNY NLMNICZK
NLMNIDKK NLMNIEEK NLMNIEGP NLMNIEUR NLMNIGBP
NLMNIHKD NLMNIHRK NLMNIHUF NLMNIIDR NLMNIILS
NLMNIINR NLMNIJPY NLMNIKRW NLMNILTL NLMNILVL
NLMNIMOP NLMNIMXN NLMNIMYR NLMNINOK NLMNINZD
Generating Output for Java 45

NLMNIPLN NLMNIROL NLMNIRUB NLMNIRUR NLMNISEK
NLMNISGD NLMNISKK NLMNITHB NLMNITRY NLMNITWD
NLMNIUSD NLMNIZAR NLMNLAED NLMNLAUD NLMNLBGN
NLMNLBRL NLMNLCAD NLMNLCHF NLMNLCNY NLMNLCZK
NLMNLDKK NLMNLEEK NLMNLEGP NLMNLEUR NLMNLGBP
NLMNLHKD NLMNLHRK NLMNLHUF NLMNLIDR NLMNLILS
NLMNLINR NLMNLJPY NLMNLKRW NLMNLLTL NLMNLLVL
NLMNLMOP NLMNLMXN NLMNLMYR NLMNLNOK NLMNLNZD
NLMNLPLN NLMNLROL NLMNLRUB NLMNLRUR NLMNLSEK
NLMNLSGD NLMNLSKK NLMNLTHB NLMNLTRY NLMNLTWD
NLMNLUSD NLMNLZAR NLMNY NLMNYI NLNUM
NLNUMI NLPCT NLPCTI NLPVALUE NUMX
OCTAL PERCENT PERCENTN PVALUE ROMAN
RSTDOCNY RSTDOCYY RSTDONYN RSTDOPNY RSTDOPYN
RSTDOPYY YEN
Table 3.4 Date and Time Formats Supported by Java
AFRDFDD AFRDFDE AFRDFDN AFRDFDT AFRDFDWN
AFRDFMN AFRDFMY AFRDFWDX AFRDFWKX CATDFDD
CATDFDE CATDFDN CATDFDT CATDFDWN CATDFMN
CATDFMY CATDFWDX CATDFWKX CRODFDD CRODFDE
CRODFDN CRODFDT CRODFDWN CRODFMN CRODFMY
CRODFWDX CRODFWKX CSYDFDD CSYDFDE CSYDFDN
CSYDFDT CSYDFDWN CSYDFMN CSYDFMY CSYDFWDX
CSYDFWKX DANDFDD DANDFDE DANDFDN DANDFDT
DANDFDWN DANDFMN DANDFMY DANDFWDX DANDFWKX
DATE DATEAMPM DATETIME DAY DDMMYY
DDMMYYN DESDFDD DESDFDE DESDFDN DESDFDT
DESDFDWN DESDFMN DESDFMY DESDFWDX DESDFWKX
46 Chapter 3 / Generating Interactive Java Output

DEUDFDD DEUDFDE DEUDFDN DEUDFDT DEUDFDWN
DEUDFMN DEUDFMY DEUDFWDX DEUDFWKX DOWNAME
DTDATE DTMONYY DTWKDATX DTYEAR DTYYQC
ENGDFDD ENGDFDE ENGDFDN ENGDFDT ENGDFDWN
ENGDFMN ENGDFMY ENGDFWDX ENGDFWKX ESPDFDD
ESPDFDE ESPDFDN ESPDFDT ESPDFDWN ESPDFMN
ESPDFMY ESPDFWDX ESPDFWKX EURDFDD EURDFDE
EURDFDN EURDFDT EURDFDWN EURDFMN EURDFMY
EURDFWDX EURDFWKX FINDFDD FINDFDE FINDFDN
FINDFDT FINDFDWN FINDFMN FINDFMY FINDFWDX
FINDFWKX FRADFDD FRADFDE FRADFDN FRADFDT
FRADFDWN FRADFMN FRADFMY FRADFWDX FRADFWKX
FRSDFDD FRSDFDE FRSDFDN FRSDFDT FRSDFDWN
FRSDFMN FRSDFMY FRSDFWDX FRSDFWKX HHMM
HOUR HUNDFDD HUNDFDE HUNDFDN HUNDFDT
HUNDFDWN HUNDFMN HUNDFMY HUNDFWDX HUNDFWKX
ITADFDD ITADFDE ITADFDN ITADFDT ITADFDWN
ITADFMN ITADFMY ITADFWDX ITADFWKX JDATEMD
JDATEMON JDATEQRW JDATEQTR JDATESEM JDATESMW
JULDATE JULDAY JULIAN MACDFDD MACDFDE
MACDFDN MACDFDT MACDFDWN MACDFMN MACDFMY
MACDFWDX MACDFWKX MMDDYY MMDDYYN MMSS
MMYY MMYYN MONNAME MONTH MONYY
NLDATE NLDATEMD NLDATEMN NLDATEW NLDATEWN
NLDATEYM NLDATEYQ NLDATEYR NLDATEYW NLDATM
NLDATMAP NLDATMDT NLDATMMD NLDATMTM NLDATMTZ
NLDATMW NLDATMWN NLDATMWZ NLDATMYM NLDATMYQ
NLDATMYR NLDATMYW NLDATMZ NLDDFDD NLDDFDE
NLDDFDN NLDDFDT NLDDFDWN NLDDFMN NLDDFMY
Generating Output for Java 47

NLDDFWDX NLDDFWKX NLSTRMON NLSTRQTR NLSTRWK
NLTIMAP NLTIME NORDFDD NORDFDE NORDFDN
NORDFDT NORDFDWN NORDFMN NORDFMY NORDFWDX
NORDFWKX POLDFDD POLDFDE POLDFDN POLDFDT
POLDFDWN POLDFMN POLDFMY POLDFWDX POLDFWKX
PTGDFDD PTGDFDE PTGDFDN PTGDFDT PTGDFDWN
PTGDFMN PTGDFMY PTGDFWDX PTGDFWKX QTR
QTRR RUSDFDD RUSDFDE RUSDFDN RUSDFDT
RUSDFDWN RUSDFMN RUSDFMY RUSDFWDX RUSDFWKX
SLODFDD SLODFDE SLODFDN SLODFDT SLODFDWN
SLODFMN SLODFMY SLODFWDX SLODFWKX SVEDFDD
SVEDFDE SVEDFDN SVEDFDT SVEDFDWN SVEDFMN
SVEDFMY SVEDFWDX SVEDFWKX TIME TIMEAMPM
TOD WEEKDATE WEEKDATX WEEKDAY WEEKU
WEEKV WEEKW WORDDATE WORDDATX YEAR
YYMM YYMMDD YYMMDDN YYMMN YYMON
YYQ YYQN YYQR YYQRN YYWEEKU
YYWEEKV YYWEEKW
Note: The JAVA and JAVAIMG devices do not support nested formats that include user-defined formats. If you want to use a custom format with these devices and the custom format nests other formats, make sure that it nests only the formats that are provided by SAS.
Note: The JAVA and JAVAIMG devices do not honor the DATATYPE=DATE and NOEDIT options in the FORMAT procedure PICTURE statement.
Configuring Drill-Down Links for JavaYou can configure your Java applet to add drill-down links to your graph in one of the following modes:
48 Chapter 3 / Generating Interactive Java Output

n Local mode
n Script mode
n URL mode
See Chapter 5, “Controlling Drill-Down Behavior for ActiveX and Java Using Parameters,” on page 67. See also “Examples: Creating Interactive Java Output” on page 49.
Configuring Data Tips with JAVAFor output generated with the JAVA graphics output device, data tips are created by default. The data tips are displayed when the mouse pointer is positioned over a graph data element. Use the TIPS=NONE parameter to suppress data tips for Java. For example:
ODS HTML parameters=("Tips"="NONE")
For SAS/GRAPH procedures that support the HTML= option, you can add custom data tips to the output as described in “Adding Custom Data Tips with the HTML= Option” in SAS/GRAPH: Reference. To determine whether a procedure supports the HTML= option, refer to the description for that procedure in SAS/GRAPH: Reference.
Examples: Creating Interactive Java Output
About These ExamplesThe examples in this section demonstrate how to generate interactive graphs using the JAVA graphics output device. The examples include:
n “Example: Local Drill-Down Mode with Java” on page 50
n “Example: Script Drill-Down Mode with Java” on page 52
n “Example: URL Drill-Down Mode with Java” on page 54
n “Example: HTML Drill-Down Mode” on page 56
Additional examples are available in the Sample Library:
n GWBJABAR—Generating a Bar Chart for the web
n GWBJACON—Generating a Contour Plot for the web
n GWBJALOC—A Web Bar Chart with Local Drill-Down
n GWBJAMAP—Generating a Map with Hotspots for the Web
n GWBSCDRL—Java Map with Script-mode drill-down
Examples: Creating Interactive Java Output 49

Note: The SAS Sample Library is not available in SAS Studio. If you are using SAS Studio, you can download the SAS/GRAPH samples in the SAS Sample Library in zipped form from the SAS/GRAPH documentation page on support.sas.com.
Example: Local Drill-Down Mode with JavaHere is an example that generates an HTML output file that runs the Graph applet. If the graph contains a group or subgroup, then by default the applet automatically provides drill-down functionality. When a user clicks on an element in the graph, the applet generates and displays a new graphic based on the selected elements. This example creates a drill-down graph for data in Sashelp.Cars. In the example, variable Origin is assigned the category role, variable Type is assigned the group role, and variable Drivetrain is assigned the subgroup role in a VBAR3D statement. The following figure shows output produced by this example.
When the mouse pointer is positioned on a bar, the mouse pointer indicates an active link, and a data tip displays the information for that bar. Clicking the Asia bar for Wagon, for example, displays the drill-down graph shown in the following figure.
50 Chapter 3 / Generating Interactive Java Output

Clicking the Sedan bar for Type displays the drill-down graph shown in the following figure.
Here is the example program code.
/* Specify the output path and HTML filename. */%let outp=output-path;%let htmlfn=mileage.html;%let graphappjars=graph-jar-file-url;
ods _all_ close;goptions reset=all device=java;
Examples: Creating Interactive Java Output 51

ods html file="&htmlfn" path="&outp" codebase="&graphappjars";
title "Vehicle Mileage for Sedans and Wagons";proc gchart data=sashelp.cars(where=(type in ("Sedan" "Wagon")));vbar3d origin / sumvar=mpg_highway type=mean group=type subgroup=drivetrain;run;quit;ods html close;
ods html; /* Not required in SAS Studio. */
You can also use the URL= procedure option to implement local drill-down links in your graphs. See “Adding Links and Enhancements with the URL=, HTML=, and HTML_LEGEND= Options” in SAS/GRAPH: Reference.
Example: Script Drill-Down Mode with JavaHere is an example that shows how to implement the script drill-down mode in the Graph applet. This example generates the drill-down vertical bar chart shown in the following figure.
Figure 3.1 Java Drill-down Graph of Mean Highway MPG for Sedans and Wagons by Origin
SAS/GRAPH provides data tips by default. These data tips are displayed when the cursor is over a bar. When a bar is clicked, a horizontal bar chart of mean highway mileage for sedans and wagons by drivetrain is opened in a new browser window. The following figure shows the drill-down chart that opens when the Europe bar for sedan is clicked.
52 Chapter 3 / Generating Interactive Java Output

To implement JavaScript drill-down functionality, PUT statements are used in a DATA step to insert code for the JavaScript function GRAPHDRILL into the drill-down chart HTML file after the file is generated. The GRAPHDRILL function generates the URL to the drill-down chart and opens the URL in a new browser window when a bar is clicked. Here is the SAS code for this example.
/* Specify the output path and HTML filename. */filename gout "output-path";%let fileurl=url-to-files; /* Terminate with a path separator such as '/'. */%let htmlfn=mileage.html;%let graphappjars=graph-jar-file-url;
/* Extract data for sedans and wagons from Sashelp.Cars. */data cars; set sashelp.cars(where=(type in ("Sedan" "Wagon")));run;
/* Generate the drill-down graphs. */%macro gengraph(origin,type); ods _all_ close; ods html file="mpg_&origin._&type..html" path=gout(url="&fileurl"); title "Mileage By Drivetrain for &type.s Made In &origin"; proc gchart data=cars(where=(origin eq "&origin" and type eq "&type")); hbar3d drivetrain / sumvar=mpg_highway type=mean mean name="MPG_&origin"; run; quit; ods html close;%mend gengraph;
goptions reset=all device=actximg gsfname=gout ypixels=250 xpixels=380 nodisplay;%gengraph(USA,Sedan);%gengraph(USA,Wagon);%gengraph(Europe,Sedan);
Examples: Creating Interactive Java Output 53

%gengraph(Europe,Wagon);%gengraph(Asia,Sedan);%gengraph(Asia,Wagon);
/* Generate the main drill-down graph. */ods _all_ close;goptions reset=all device=java nodisplay xpixels=500 ypixels=350;ods html file="&htmlfn" path=gout codebase="&graphappjars" parameters=("DRILLDOWNMODE"="SCRIPT" "DRILLFUNC"="GRAPHDRILL");
title "Mileage By Origin for Sedans and Wagons";proc gchart data=cars(where=(type in ("Sedan" "Wagon")));vbar3d origin / sumvar=mpg_highway type=mean group=type;run;quit;ods html close;
/* Insert JavaScript function GRAPHDRILL into the HTML file. Function GRAPHDRILL generates the URL to the drill-down graph and opens the graph in a new browser window when a bar is clicked. */data _null_ ;file "%sysfunc(pathname(gout))/&htmlfn" mod;put " " ;put "<SCRIPT LANGUAGE='JavaScript'>" ;put "function GraphDrill( appletref )";put "{";put " /* Get Origin and Type. */";put " for(i = 2; i < GraphDrill.arguments.length; i += 2)";put " {";put " if (GraphDrill.arguments[i] == 'G_INDEPV,f' )";put " var origin = GraphDrill.arguments[i+1];";put " if (GraphDrill.arguments[i] == 'G_GROUPV,f' )";put " var type = GraphDrill.arguments[i+1];";put " };";put " ";put " /* Open the drill-down graph in a new browser window. */";put " window.open('&fileurl.mpg_' + origin + '_' + type + '.html',";put " ' ', 'height=350, width=550');";put "};";put "</SCRIPT>";run ;
goptions reset=all;ods html; /* Not required in SAS Studio. */
Example: URL Drill-Down Mode with JavaThe behavior is the same. Clicking a bar in the drill-down graph opens a drill-down graph in a new browser windows as shown in Figure 3.1 on page 52. Instead of using a JavaScript function to generate drill-down URLs, in this example, the URLs are added to the plot data in a DATA step. The HTML= option is then used in the
54 Chapter 3 / Generating Interactive Java Output

VBAR3D statement to specify the link URL column. Here is the code for this example.
/* Specify the output path and HTML filename. */filename gout "output-path";%let fileurl=url-to-files; /* Terminate with a path separator such as '/'. */%let htmlfn=mileage.html;%let graphappjars=graph-jar-file-url;
/* Extract data for sedans and wagons from Sashelp.Cars and add a URL column. */data cars; length url $80; set sashelp.cars(where=(type in ("Sedan" "Wagon"))); url="href='&fileurl.mpg_" || strip(origin) || "_" || strip(type) || ".html'";run;
/* Generate the drill-down graphs. */%macro gengraph(origin,type); ods _all_ close; ods html file="mpg_&origin._&type..html" path=gout(url="&fileurl"); title "Mileage By Drivetrain for &type.s Made In &origin"; proc gchart data=cars(where=(origin eq "&origin" and type eq "&type")); hbar3d drivetrain / sumvar=mpg_highway type=mean mean name="MPG_&origin"; run; quit; ods html close;%mend gengraph;
goptions reset=all device=actximg gsfname=gout ypixels=250 xpixels=380 nodisplay;%gengraph(USA,Sedan);%gengraph(USA,Wagon);%gengraph(Europe,Sedan);%gengraph(Europe,Wagon);%gengraph(Asia,Sedan);%gengraph(Asia,Wagon);
/* Generate the main drill-down graph. */ods _all_ close;goptions reset=all device=java nodisplay xpixels=500 ypixels=350;ods html file="&htmlfn" path=gout codebase="&graphappjars" parameters=("DRILLDOWNMODE"="URL");
title "Mileage By Origin for Sedans and Wagons";proc gchart data=cars(where=(type in ("Sedan" "Wagon")));vbar3d origin / sumvar=mpg_highway type=mean group=type html=url;run;quit;ods html close;
goptions reset=all;ods html; /* Not required in SAS Studio. */
Examples: Creating Interactive Java Output 55

Example: HTML Drill-Down ModeThe behavior is the same. Clicking a bar in the drill-down graph opens a drill-down graph in a new browser windows as shown in Figure 3.1 on page 52. Instead of using a JavaScript function to generate drill-down URLs or adding URLs to the plot data, in this example the specified URL pattern incorporates the value of the Origin and Type variables in the plot data to generate the drill-down links dynamically. Because variable Origin is the independent variable, the value is obtained from parameter G_INDEPV. Because variable Type is the group variable, type is obtained from parameter G_GROUPV. The %NRSTR macro function is used to mask &G_INDEPV and &G_GROUPV in the URL-pattern string so that SAS does not interpret them as macro variables. The %NRSTR macro function is used to mask &G_INDEPV and &G_GROUPV in the URL-pattern string so that SAS does not interpret them as macro variables. Here is the code for this example.
/* Specify the output path and HTML filename. */filename gout "output-path";%let fileurl=url-to-files; /* Terminate with a path separator such as '/'. */%let htmlfn=mileage.html;%let graphappjars=graph-jar-file-url;
/* Extract data for sedans and wagons from Sashelp.Cars. */data cars; set sashelp.cars(where=(type in ("Sedan" "Wagon")));run;
/* Generate the drill-down graphs. */%macro gengraph(origin,type); ods _all_ close; ods html file="mpg_&origin._&type..html" path=gout(url="&fileurl"); title "Mileage By Drivetrain for &type.s Made In &origin"; proc gchart data=cars(where=(origin eq "&origin" and type eq "&type")); hbar3d drivetrain / sumvar=mpg_highway type=mean mean name="MPG_&origin"; run; quit; ods html close;%mend gengraph;
goptions reset=all device=actximg gsfname=gout ypixels=250 xpixels=380 nodisplay;%gengraph(USA,Sedan);%gengraph(USA,Wagon);%gengraph(Europe,Sedan);%gengraph(Europe,Wagon);%gengraph(Asia,Sedan);%gengraph(Asia,Wagon);
/* Generate the main drill-down graph. */ods _all_ close;goptions reset=all device=java nodisplay xpixels=500 ypixels=350;ods html file="&htmlfn" path=gout codebase="&graphappjars" parameters=("DRILLDOWNMODE"="HTML"
56 Chapter 3 / Generating Interactive Java Output

"DRILLPATTERN"=%nrstr("mpg_{&G_INDEPV,f}_{&G_GROUPV,f}.html"));
title "Mileage By Origin for Sedans and Wagons";proc gchart data=cars(where=(type in ("Sedan" "Wagon")));vbar3d origin / sumvar=mpg_highway type=mean group=type;run;quit;ods html close;
goptions reset=all;ods html; /* Not required in SAS Studio. */
Examples: Creating Interactive Java Output 57

58 Chapter 3 / Generating Interactive Java Output

4Generating Interactive Metagraphics Output
Developing Web Presentations for the Metaview Applet . . . . . . . . . . . . . . . . . . . . . . . . 59
Advantages of Using the JAVAMETA Device . . . . . . . . . . . . . . . . . . . . . . . . . . . . . . . . . . . . 60
Using ODS with the JAVAMETA Device . . . . . . . . . . . . . . . . . . . . . . . . . . . . . . . . . . . . . . . . . 60
Enhancing Web Presentations for the Metaview Applet . . . . . . . . . . . . . . . . . . . . . . . . . 61
Specifying Non-English Resource Files and Fonts . . . . . . . . . . . . . . . . . . . . . . . . . . . . . . 62
Example: Generating Metacode Output with the JAVAMETA Driver . . . . . . . . . . . . . . 63
Developing Web Presentations for the Metaview Applet
The JAVAMETA device driver generates graphs that are stored in metagraphics format and displayed by the SAS Metaview applet to create interactive graphical web presentations. The metacodes that comprise the metagraphics format are simple ASCII codes that look like the following:
37 8 106 97 118 97 109 101 116 97 30 0 10 1 13 5 0 0 0 50 8 32 32 32 32 32 32 32 32 51 18 5746 48 48 46 48 48 77 48 68 48 56 48 49 50 48 48
You can use a GOPTIONS statement with the DEVICE=JAVAMETA option to create metacode output from one or more SAS/GRAPH procedures. When the graph is viewed, the browser passes the metacodes as a parameter to the Metaview applet. The Metaview applet renders the output defined by the metacodes, and displays the interactive graph to the user.
Most SAS/GRAPH procedures that generate GSEG catalog entries, as well as some other SAS procedures such as the GANTT procedure, can be used with the JAVAMETA device to generate metagraphics output. For a list of these procedures, see “Metaview Applet” on page 7.
Interactive features of the Metaview applet include pan and a play mode for animations. You can add data tips, specify resource files for language translation, specify background colors and text fonts, and drill down to HTML files, metagraphics files, and sets of metacodes. You can also provide a list of selectable drill-down URLs in the pop-up menu. Whereas regular HTML drill-down allows only a single
59

drill-down, the metaview applet allows a selection list of multiple drill-downs per each chart element. For information about these enhancements, see “Enhancing Web Presentations for the Metaview Applet” on page 61.
For information about how to generate a Metaview applet presentation, see “Using ODS with the JAVAMETA Device” on page 60.
To see examples of programs that generate a web presentation for the Metaview applet, see “Example: Generating Metacode Output with the JAVAMETA Driver ” on page 63.
Advantages of Using the JAVAMETA DeviceThe Metaview applet offers these advantages:
n The images produced by the Metaview applet are vector graphics, so the zooming capability provided by the Metaview applet allows the user to zoom in on a graph without degrading the graph's appearance. The zoom control is included by default. You can disable it with the ZOOMCONTROLENABLED= on page 167 parameter.
n Compared to raster images (GIF, JPEG, PNG), the Metaview applet offers faster data tips, and the data tips stay up as long as you hold your mouse pointer over them. Also, for animations and slide shows, data tips are displayed for each graph in the sequence.
Note: The MetaView applet does not support the High Contrast Black color scheme.
Using ODS with the JAVAMETA DeviceThe following steps use ODS to develop a web presentation for the Metaview applet. This particular example displays a single graph. The metacodes for that graph are embedded in the body of the HTML output file.
1 Specify the JAVAMETA device driver.
goptions reset=all device=javameta;
2 Close all open ODS destinations to conserve resources.
ods _all_ close;
3 Open the HTML destination. You can also specify an HTML filename with the BODY= option. If you do not specify an HTML output filename, the default filename is sashtml.htm. The APPLETLOC= system option specifies the default location of the applet JAR files. If necessary, you can specify another location using parameter JAVA_CODEBASE in option PARAMETERS in the ODS HTML statement.
60 Chapter 4 / Generating Interactive Metagraphics Output

ods html path="output-path" body="filename.htm" < parameters=("java_codebase"="path-to-jar-files")>;
You can enhance your web presentation by specifying other applet parameters, as described in “Parameters That Apply to the Metaview and Tile Chart Applets” on page 128.
4 Include the SAS/GRAPH procedure code.
proc gchart data=sashelp.cars;vbar type / sumvar=mpg_highway mean;run;
5 Close the HTML destination. You must close the HTML destination to generate output. If you are using the SAS windowing environment, reopen the HTML destination.
ods html close;ods html; /* Not required in SAS Studio. */
Submit the program to generate the HTML output file, which includes the metacodes generated by the JAVAMETA device.
When you view the HTML file in a web browser, the Metaview applet renders the graph defined by the metacodes.
Enhancing Web Presentations for the Metaview Applet
Programming for the default configuration of the Metaview applet consists of specifying the JAVAMETA device driver, specifying an HTML output file, and generating a graph, as described in “Developing Web Presentations for the Metaview Applet” on page 59.
You can enhance the default configuration as follows:
n Specify a non-English resource file and font for Java 1.02 presentations. See “Specifying Non-English Resource Files and Fonts” on page 62.
n Display and configure a zoom control. See the applet parameters that begin with ZOOM, in “Parameters That Apply to the Metaview and Tile Chart Applets” on page 128.
n Display and configure a play button to display multiple graphs or to produce an animation effect.
n Set the background color by setting the applet parameter BACKGROUNDCOLOR.
n If you specify an ODS style, do not specify a style that uses a background image (such as Dtree, Netdraw, or BlockPrint) or specify the NOIMAGEPRINT option in the GOPTIONS statement.
Note: Starting with SAS 9.4M5, the BlockPrint ODS style is deprecated. Existing SAS programs that use the BlockPrint style will still function, but the BlockPrint style no longer appears in the list of available styles.
Enhancing Web Presentations for the Metaview Applet 61

Note that you can combine almost all of the available enhancements.
To learn how to specify applet parameters, see “Specifying Parameters and Attributes for Java and ActiveX” on page 121. Reference information about applet parameters is provided in “ActiveX Control and Java Applet Parameter Dictionary” on page 119.
You can also add data tips and drill-down links to your graphs in many cases. Many of the SAS/GRAPH procedure statements support the HTML= option, which enables you to add data tips and drill-down links to your graphs. To determine whether a SAS/GRAPH procedure supports the HTML= option, see SAS/GRAPH: Reference. Using the HTML= option, you can add data tips and drill-down links to your graphs as follows:
n Create a variable in your plot data that contains the ALT= tag or HREF= tag for each observation as shown in the following examples.
alt="data-tip-text"href="url-string"
Note: You must specify the data-tip text in an ALT= tag. The JAVAMETA device does not support the TITLE= tag.
The variable can contain one or both tags in any order. In the latter case, a data tip and a drill-down link are added. If the value is blank, no action is taken for that observation.
n Use the HTML= option in your plot statement to specify the name of the variable that contains the Alt text or URL strings.
TIP Use the DATATIPSTYLE and DATATIPHIGHLIGHTCOLOR applet parameters to configure the appearance of the data tips. See “Parameters That Apply to the Metaview and Tile Chart Applets” on page 128.
For an example, see “Example: Generating Metacode Output with the JAVAMETA Driver ” on page 63.
Specifying Non-English Resource Files and Fonts
The Metaview applet supports Java 1.02, which is good in that it runs in most browsers. Unfortunately, Java 1.02 does not support the use of resource files and fonts, which would enable the automated use of translated text and localized formats as supported by Java 1.2. To overcome this limitation, the Metaview applet enables you to name a resource file and a resource font by specifying applet parameters. In this resource file, you can hardcode translated versions of the text that the Metaview applet uses.
Follow these steps to manually translate the text in the Metaview applet:
1 Specify the LOGRESOURCES parameter in your SAS job, generate the HTML, and view it in a browser. (See “Parameters That Apply to the Metaview and Tile
62 Chapter 4 / Generating Interactive Metagraphics Output

Chart Applets” on page 128.) The Metaview applet will then write its tag/value pairs to the Java console.
2 Copy the tag/value pairs that you want to translate out of the Java console and paste them into your resources file. Then translate those values to your language. You do not need to translate all of the tag/value pairs. The defaults will be used where translations are not provided.
3 Name your resources file MVAResources.properties.
4 Store your resources file in the same directory as either the HTML output file or the sas.graph.metaviewapplet.jar file.
5 In the SAS program, remove the LOGRESOURCES parameter specification.
6 If your resources file requires a non-English text font, then specify that font as the value of the parameter RESOURCESFONTNAME. To display this font, your web audience must have this font installed.
7 Run your program and test your web output.
For information about specifying applet parameters, see “Specifying Parameters and Attributes for Java and ActiveX” on page 121. For reference information about the Metaview applet parameters, see “Parameters That Apply to the Metaview and Tile Chart Applets” on page 128.
Example: Generating Metacode Output with the JAVAMETA Driver
The following example uses the JAVAMETA device and the GCHART procedure to generate a sales chart that shows total sales by year and quarter. The chart is grouped by country and product. The JAVAMETA device generates metacodes that are to be displayed by the Metaview applet. The ODS HTML destination is used to generate an HTML file that passes the metacodes to the Metaview applet, which displays the output in the browser.
When you use DEVICE=JAVAMETA with ODS, only one graph can be passed to an instance of the Metaview applet at a time. ODS generates a separate invocation of the Metaview applet for each SAS/GRAPH procedure that it runs. If a procedure includes BY GROUP processing, it generates another separate invocation of the Metaview applet for each BY-group chart. In this example, the data contains quarterly sales figures for the years 1993 and 1994. Because BY-group processing is used for both year and quarter, eight invocations of the Metaview applet are required.
Metaview applet presentations generated by ODS that contain multiple graphs do not contain a slider page control or drop-down list graph control that allows a user to select a graph to display. Although an HTML page generated by ODS can contain multiple instances of the Metaview applet, each instance can display one graph only. A user must scroll the HTML page to see all of the graphs.
Example: Generating Metacode Output with the JAVAMETA Driver 63
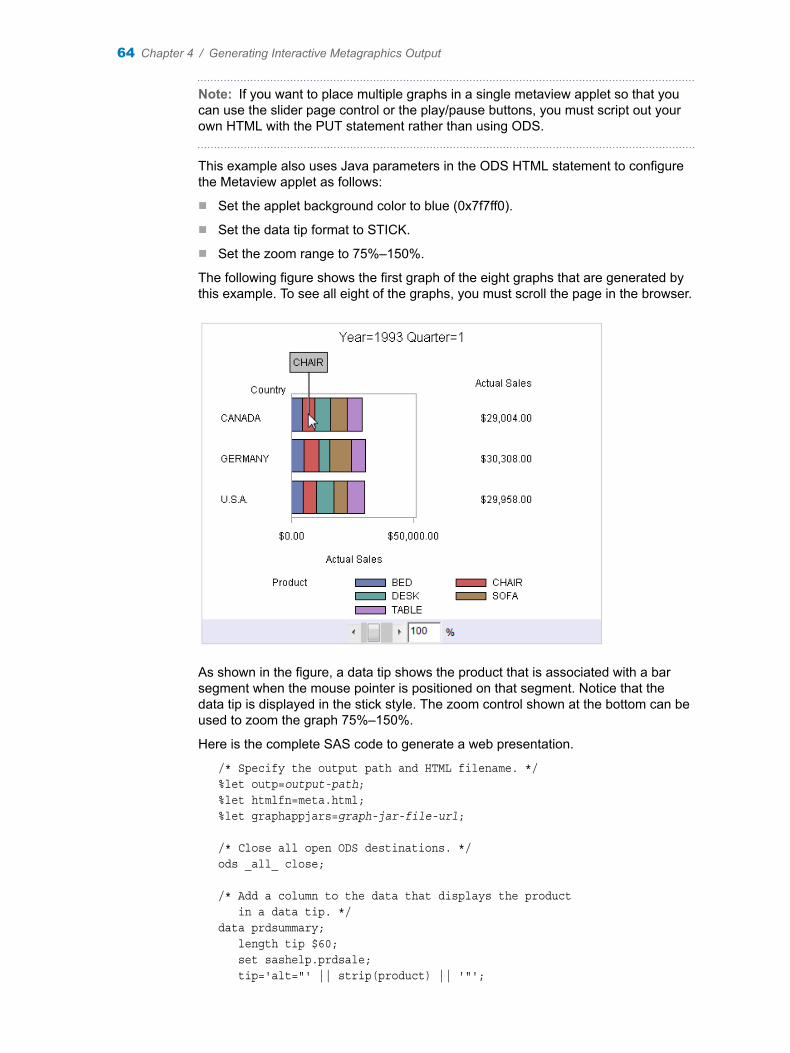
Note: If you want to place multiple graphs in a single metaview applet so that you can use the slider page control or the play/pause buttons, you must script out your own HTML with the PUT statement rather than using ODS.
This example also uses Java parameters in the ODS HTML statement to configure the Metaview applet as follows:
n Set the applet background color to blue (0x7f7ff0).
n Set the data tip format to STICK.
n Set the zoom range to 75%–150%.
The following figure shows the first graph of the eight graphs that are generated by this example. To see all eight of the graphs, you must scroll the page in the browser.
As shown in the figure, a data tip shows the product that is associated with a bar segment when the mouse pointer is positioned on that segment. Notice that the data tip is displayed in the stick style. The zoom control shown at the bottom can be used to zoom the graph 75%–150%.
Here is the complete SAS code to generate a web presentation.
/* Specify the output path and HTML filename. */%let outp=output-path;%let htmlfn=meta.html;%let graphappjars=graph-jar-file-url;
/* Close all open ODS destinations. */ods _all_ close;
/* Add a column to the data that displays the product in a data tip. */data prdsummary; length tip $60; set sashelp.prdsale; tip='alt="' || strip(product) || '"';
64 Chapter 4 / Generating Interactive Metagraphics Output

run;
/* Sort the data by year and quarter. */proc sort data=prdsummary; by year quarter; run;
/* Set the graphics options. */goptions reset=all device=javameta ftext="Trebuchet" htext=1.5 hby=2;
/* Open ODS HTML and specify applet parameters. */ods html file="&htmlfn" path="&outp" codebase="&graphappjars" parameters=( "BACKGROUNDCOLOR"="0x7f7ff0" /* applet background color */ "DATATIPSTYLE"="STICK" /* stick data tips */ "ZOOMCONTROLMIN"="75" /* zoom 75%-150% */ "ZOOMCONTROLMAX"="150");
/* Generate the graph. */proc gchart data=prdsummary; by year quarter; hbar country / sumvar=actual subgroup=product sum html=tip; run; quit;
ods html close;
goptions reset=all;ods html; /* Not required in SAS Studio. */
The statement GOPTIONS DEVICE=JAVAMETA causes PROC GCHART to produce metacodes that are embedded in the HTML file that is produced by ODS and passed to the Metaview applet as parameters. The ODS HTML statement is used to generate the presentation file, meta.html. The PARAMETER= option in the ODS HTML statement configures the Metaview applet. The HTML= option in the GCHART statement specifies the variable that contains the data-tip text.
Example: Generating Metacode Output with the JAVAMETA Driver 65

66 Chapter 4 / Generating Interactive Metagraphics Output

5Controlling Drill-Down Behavior for ActiveX and Java Using Parameters
Using ODS Parameter Tags . . . . . . . . . . . . . . . . . . . . . . . . . . . . . . . . . . . . . . . . . . . . . . . . . . . . . 67
Using Drill-Down Tags . . . . . . . . . . . . . . . . . . . . . . . . . . . . . . . . . . . . . . . . . . . . . . . . . . . . . . . . . . 68
Specifying the Drill-Down Mode . . . . . . . . . . . . . . . . . . . . . . . . . . . . . . . . . . . . . . . . . . . . . . . . 69
Understanding Variable Roles . . . . . . . . . . . . . . . . . . . . . . . . . . . . . . . . . . . . . . . . . . . . . . . . . . 71
Removing Blank Spaces from Data Values in Substitution Strings . . . . . . . . . . . . . . 71
Using Variables as Substitution Strings . . . . . . . . . . . . . . . . . . . . . . . . . . . . . . . . . . . . . . . . 72
Configuring HTML Drill-Down Mode . . . . . . . . . . . . . . . . . . . . . . . . . . . . . . . . . . . . . . . . . . . . 73Using the DRILLDOWNMODE, DRILLPATTERN,
PATTERNSTRIP, and DRILLTARGET Parameters . . . . . . . . . . . . . . . . . . . . . . . . . . . . 73Specifying Graphs for Each Drill-Down Level . . . . . . . . . . . . . . . . . . . . . . . . . . . . . . . . . . . 74
Configuring the Drill-Down Response in HTML and URL Modes . . . . . . . . . . . . . . . . . 76
Configuring Script Drill-Down Mode . . . . . . . . . . . . . . . . . . . . . . . . . . . . . . . . . . . . . . . . . . . . 77Using the DRILLDOWNMODE, DRILLFUNC, PATTERNSTRIP,
and DRILLTARGET Parameters . . . . . . . . . . . . . . . . . . . . . . . . . . . . . . . . . . . . . . . . . . . . . 77Working with the Array of Elements . . . . . . . . . . . . . . . . . . . . . . . . . . . . . . . . . . . . . . . . . . . . 78Implementing Script Drill-Down Mode . . . . . . . . . . . . . . . . . . . . . . . . . . . . . . . . . . . . . . . . . . 79Formatting Data Values in Script Drill-Down Mode . . . . . . . . . . . . . . . . . . . . . . . . . . . . . . 79
Disabling Drill-Down Functionality . . . . . . . . . . . . . . . . . . . . . . . . . . . . . . . . . . . . . . . . . . . . . . 79
Using ODS Parameter TagsYou can use parameter tags in the ODS HTML statement to specify drill-down behavior for the ActiveX control, the Graph applet, or the Map applet, in the ODS HTML statement. Parameters are specified in the ODS destination statement with the PARAMETERS= option as follows:
ODS HTML PARAMETERS=(options);
See “Specifying Parameters and Attributes for Java and ActiveX” on page 121 for a detailed description of the parameter tags and attributes that are available for use with ActiveX and Java.
67

Using Drill-Down TagsYou can use the following tags to specify drill-down behavior for the Graph applet, Map applet, or ActiveX control. The following table defines the drill-down tags and explains the types of graphs to which the tags can be applied.
Table 5.1 Drill-Down Tags Used by the Graph Applet, Map Applet, and ActiveX Control
Tag Name Description
Definition of the Value That Follows the Tag Applied in
G_COLOR Use new colors for the graph elements
Name of the new color variable
Scatter plots
G_COLORV Use the color variable from the preceding level
None Scatter plots
G_DEP Use a new dependent variable
Name of the new dependent variable
All charts
G_DEPV Use the dependent variable from the previous level
None All charts
G_DEPTH Use a new depth variable
Name of the new depth variable
Vertical bar charts and scatter plots
G_DEPTHV Use the depth variable that was used in the previous level
None Vertical bar charts and scatter plots
G_GROUP Use a new group variable
Name of the new group variable
Bar charts
G_GROUPV Use the group variable that was used in the previous level
None Bar charts
G_INDEP Use a new independent variable
Name of the new independent variable
Charts and maps
G_INDEPV Use the independent variable that was used in the previous level
None Charts and maps
68 Chapter 5 / Controlling Drill-Down Behavior for ActiveX and Java Using Parameters

Tag Name Description
Definition of the Value That Follows the Tag Applied in
G_LABEL Use a new label Name of the new label (mapID) variable
Maps
G_LABELV Use the same label that was used in the previous level
None Maps
G_SUBGR Use a new subgroup variable
Name of the new subgroup variable
Bar charts and scatter plots
G_SUBGRV Use the same subgroup variable that was used in the previous level
None Bar charts and scatter plots
When you specify a variable name after a tag, the name must be specified exactly how it appears in the data set. Variable names are case-sensitive in JavaScript. To find out how a variable was defined in the data set, use the CONTENTS procedure.
Specifying the Drill-Down ModeTo enable a given drill-down mode, specify a value for the parameter DRILLDOWNMODE. The DRILLDOWNMODE parameter is specified in an ODS statement. The following syntax sets the DRILLDOWNMODE parameter in the ODS statement:
ODS HTML PARAMETERS= ("DRILLDOWNMODE"="LOCAL" | "SCRIPT" | "URL" | "HTML" | “ANY”);
Here is a description of the DRILLDOWNMODE values.
LOCALresponds to drill-down actions by dynamically generating and displaying new graphs. The data in the initial graph is subset based on the graph element that was selected in the drill-down action. The user can select another graph element to generate another graph. Another graph is generated as long as the data can still be subset, or you have configured your own levels of drill-down functionality.
To configure a graph at a given level, you specify the applet parameter DDLEVELn. The value of this parameter determines the graph type, data subset, variable roles, and colors. Local is the default drill-down mode for the Graph applet.
Restriction Supported by the Graph applet only.
See “Links in JAVA Presentations” in SAS/GRAPH: Reference
Specifying the Drill-Down Mode 69

Example “Example: Local Drill-Down Mode with Java” on page 50
SCRIPTcalls a JavaScript method that you specify in your SAS/GRAPH program. You provide the JavaScript that responds to the selected area. The data passed to the JavaScript method determines the graphic portion selected, and the appropriate action.
Restriction Supported by the Map applet and ActiveX control only.
See “Configuring Script Drill-Down Mode” on page 77
Examples “Example: Script Drill-Down Mode with Java” on page 52
“Example: Script Drill-Down Mode with ActiveX” on page 33
URLdisplays URLs that are provided by the HTML= variable. The URLs identify HTML files.
Restriction If the graphics procedure that generates the graph specifies the HTML= option, then the value of the DRILLDOWNMODE= parameter is automatically set to URL. All modes specified in ODS are overridden.
See “HTML” on page 137
Example “Example: URL Drill-Down Mode with Java” on page 54
HTMLgenerates drill-down URLs based on a substitution pattern that you specify in your SAS/GRAPH program. The ActiveX control, the Graph applet, and the Map applet complete the URL by inserting the specified data from the selected graph element.
ods html file="statepop.htm" parameters=("DRILLDOWNMODE"="HTML" "DRILLPATTERN"=%nrstr("http://www.state.{&statename}.us"));
The data set variable value STATENAME completes the drill-down URL.
Note Define the variable with the partial URL when creating the graphic.
Tip Use the %NRSTR macro function to mask the URL-pattern string so that SAS does not interpret variable substitution strings such as &STATENAME as macro variables.
See “Adding Links and Enhancements with the URL=, HTML=, and HTML_LEGEND= Options” in SAS/GRAPH: Reference
Example “Example: HTML Drill-Down Mode” on page 56
ANYattempts to implement the four drill-down modes in succession until a valid web destination is found. The order is Local (Graph applet only), Script, URL, and HTML.
Restriction Supported by Graph applet and ActiveX control only.
70 Chapter 5 / Controlling Drill-Down Behavior for ActiveX and Java Using Parameters

See “Specifying Parameters and Attributes for Java and ActiveX” on page 121 for a complete list of ODS parameters.
Understanding Variable RolesThe assignment of roles to variables determines the appearance of the resulting graph. The assignment of roles takes place in the SAS/GRAPH statement that generates the graph. One variable is always assigned the role of independent variable, and another is always assigned the role of dependent variable. Once the initial graph has been displayed in the applet or control, web users can change the variable roles using menu options.
Variable roles are used to configure the Local, HTML, and Script drill-down modes. The roles are assigned with parameters, using the PARAMETERS= option in the ODS statement. In the specification of a parameter, the assignment of roles is done with drill-down tags.
Removing Blank Spaces from Data Values in Substitution Strings
The drill-down modes Script (see “Configuring Script Drill-Down Mode” on page 77) and HTML (see “Configuring the Drill-Down Response in HTML and URL Modes” on page 76) use substitution strings to generate a response to drill-down actions. The substitution strings are replaced with data values. Blank spaces in those data values can produce unexpected results. To remove blank spaces from data values when those values are to be used in a substitution string, specify the PATTERNSTRIP= parameter as follows in the ODS statement:
ODS HTML FILE=fileref-or-external-filePARAMETERS=("DRILLDOWNMODE"="SCRIPT" | "URL""PATTERNSTRIP"= | "NONE" | "YES" | "COMPRESS");
NONEis the default value. Any blank spaces in the data value are inserted into the substitution string.
YESremoves all blank spaces from the end of the data value, but retains blank spaces elsewhere.
COMPRESSremoves all blank spaces from the data value, wherever they occur.
Removing Blank Spaces from Data Values in Substitution Strings 71

Using Variables as Substitution StringsWhen you specify a variable name as a substitution string in the HTML drill-down mode, the applet or control replaces the entire string with the value of the variable as it is specified in the selected graph element. The syntax of the substitution string is as follows:
{&variable_name}
Because JavaScript is case sensitive, the name of the variable must be exactly the same as it is in the data set.
A variable name substitution string might look like this:
http://ourweb.com/uspop/{&statename}/poptable.htm
The substitution string above could be used in a web presentation that begins with a map of the United States. In response to a drill-down action in HTML mode, the value of the STATENAME variable for the selected state would be substituted into the URL. The resulting URL would point to a web page that contains a table of population information for the selected state.
In the HTML drill-down mode, you can specify variable roles or labels as substitution strings, using drill-down tags, as described in “Understanding Variable Roles” on page 71. The syntax of these substitution strings is as follows:
{&drill-down-tag}
where drill-down-tag specifies a variable role or label in the initial graph. The applet or control replaces the substitution string by deriving a variable name from the role or label and applying the value of that variable to the URL. The value is taken from the data that is associated with the selected graph element.
For example, a web presentation could be configured using this URL:
http://ourweb.com/regstaff/{&G_INDEPV}/stafflist.htm
When a web user selects a data element with the independent variable REGION, if the value of REGION is East, the applet displays this URL:
http://ourweb.com/regstaff/East/stafflist.htm
The default value for the DRILLPATTERN parameter is as follows:
{&G_INDEPV,f}{&G_GROUPV,f}{&G_SUBGRV,f}.html
The URL that is created points to an HTML file that is in the same directory as the top level HTML file. The name of the file is a concatenation of formatted values for the first independent, group, and subgroup variables defined in the data set.
See “Example: URL Drill-Down Mode with Java” on page 54 for more information.
72 Chapter 5 / Controlling Drill-Down Behavior for ActiveX and Java Using Parameters

Configuring HTML Drill-Down Mode
Using the DRILLDOWNMODE, DRILLPATTERN, PATTERNSTRIP, and DRILLTARGET Parameters
You can use the parameters DRILLDOWNMODE, DRILLPATTERN, PATTERNSTRIP, and DRILLTARGET to configure the HTML drill-down mode for the ActiveX control, the Graph applet, and the Map applet.
In the HTML drill-down mode, the applet or control responds to drill-down actions by constructing a uniform resource locator (URL) using the data in the selected graph element. The URL is passed to the web browser for display.
The parameter DRILLDOWNMODE (see “ActiveX Control and Java Applet Parameter Dictionary” on page 119) establishes the HTML drill-down mode. The PATTERNSTRIP parameter (see “Removing Blank Spaces from Data Values in Substitution Strings” on page 71) can be used to selectively remove blank spaces from data values before those values are applied to the URL. The DRILLTARGET parameter (see “Using Variables as Substitution Strings” on page 72) enables you to specify where you want the drill-down graph to appear in the browser.
Specify the DRILLPATTERN parameter in the ODS statement as shown in the following example:
ODS HTMLPARAMETERS=("DRILLDOWNMODE"="HTML"
"DRILLPATTERN"="URL-with-substitution-strings");
An example of this statement might look like this:
ods html file="statepop.htm" parameters=("DRILLDOWNMODE"="HTML" "DRILLPATTERN"=%nrstr("http://www.state.{&statename}.us"));
In this example, the value of the data set variable STATENAME completes the drill-down URL.
When ODS is configured as shown above, the applet or control dynamically generates URLs in response to drill-down actions. The applet or control replaces the substitution strings with data values from the graph element that was selected in the drill-down action. The URL-with-substitution-strings value can include multiple substitution strings. Substitution strings can include combinations of variable names, variable roles or labels, and drill-down tags. For details, see “Using Variables as Substitution Strings” on page 72. All substitution strings are enclosed in braces ( { and } ) and begin with an ampersand character (&). The %NRSTR macro function can be used to mask the URL-pattern string so that SAS does not interpret the variable substitution strings as macro variables.
If a variable name is specified as a substitution string in drill-down mode; the applet and the control replace the string with the value of the selected data item.
Configuring HTML Drill-Down Mode 73

Specifying Graphs for Each Drill-Down LevelThe DDLEVELn parameter lets you specify the graphs that are generated at each drill-down level.
Note: The ActiveX Control does not support the DDLEVELn parameter.
The DDLEVELn parameter is specified in the ODS statement as shown in the following example:
ODS HTMLPARAMETERS=("DDLEVELn"="string");
nrepresents the number of the drill-down level that is being configured.
stringn specifies the graph type.
n names the variable roles.
n specifies the color of the data elements.
n names the variable to subset, to create the next graph.
The syntax of the string argument is as follows:
{CHART} {chart_type} {tag_1} {variable_1...} {...tag_n} {variable_n} | {subset_tag_1...} <{...subset_tag_n}>
{CHART} {chart_type}identifies the type or style of the graph. This tag is case sensitive: it must always be specified in uppercase. The values of the tag (chart types) are not case sensitive. To use the same chart type as the preceding drill-down level, do not specify the CHART tag. When the {CHART}{chart_type} is specified in the DDLEVELn parameter, the chart type can be completely changed, but not the chart orientation. For example:
n a vertical or horizontal bar chart can be changed to a pie chart
n a horizontal bar chart cannot be changed to a vertical bar chart
n vertical bar chart cannot be changed to a horizontal bar chart
Available chart types are as follows:
BARgenerates a two-dimensional bar chart.
BAR3Dgenerates a three-dimensional bar chart.
PIEgenerates a two-dimensional pie chart.
PIE3Dgenerates a three-dimensional pie chart.
PLOTgenerates a two-dimensional scatter plot that is similar in appearance to the plot shown in “Scatter Plots” in SAS/GRAPH: Reference.
74 Chapter 5 / Controlling Drill-Down Behavior for ActiveX and Java Using Parameters

SCATTERgenerates a scatter plot that is similar in appearance to the plot shown in “Scatter Plots, 3-D” in SAS/GRAPH: Reference.
LINEgenerates a line or needle plot that is similar in appearance to “Needle Plots” in SAS/GRAPH: Reference.
BOXgenerates a box plot that is similar in appearance to “Box Plots” in SAS/GRAPH: Reference.
HILOgenerates a high-low chart that is similar in appearance to “High-Low Plots” in SAS/GRAPH: Reference.
For BAR and BAR3D charts, the orientation from the previous chart is used. If the previous chart does not have an orientation, the vertical orientation is used by default.
{tag_1} {variable_1...} {...tag_n} {variable_n}associates drill-down tags with data set variables, to specify roles for variables in the new graph, and to determine the color of the elements in the new graph (optional). For definitions of the drill-down tags, see “ActiveX Control and Java Applet Parameter Dictionary” on page 119.
{subset_tag_1...} <{...subset_tag_n}>specifies one or more variable roles from the original graph whose values are used to subset the data in the preceding graph. If you specify G_GROUPV, then the data that is used to draw the new graph, is only the data that is associated with the group variable in the preceding graph. If the group variable in the preceding graph is REGION, and the data element labeled East is selected, only observations where REGION=EAST are represented in the next graph.
At least one of the following tags must be specified as the subset variable: G_INDEPV, G_GROUPV, G_SUBGRV, or G_DEPTHV. For definitions of these tags, see “ActiveX Control and Java Applet Parameter Dictionary” on page 119.
Specifying multiple subset variables means that two or more values must match the value in the selected graph element in order for that observation to be used in the new graph. For example, assuming that you specify {G_INDEPV}{G_SUBGRV} as the subset variables, and that the selected graph element has an independent variable of YEAR and a subgroup variable of STATE. Also assume that the values for these variables in the selected graph element were 2000 and NC. The observations that would be used in the drill-down graph would include those with YEAR=2000 and STATE=NC.
The following example shows how the DDLEVENn parameter can be used to specify the default behavior for the first drill-down level.
ods html file=odsout parameters=("drilldownmode"="local" "ddlevel1"="{chart}{vbar3d} {g_dep}{sales} {g_indep}{year} | {g_indepv}" );
As the example shows, the value of the DDLEVELn parameter is divided into two halves, which are separated by a vertical bar character. The drill-down graph is configured in the syntax that appears before the vertical bar character ( | ). After the vertical bar, drill-down tags specify how the data from the previous drill-down level is to be subset for use in the current drill-down graph.
Configuring HTML Drill-Down Mode 75

The first drill-down level (DDLEVEL1) is configured as a three-dimensional vertical bar chart. The dependent variable is SALES and the independent variable is YEAR. The G_INDEPV tag specifies that the data is to be based on the values of the independent variable. In our example the independent variable in the initial graph is REGION. If the web user selects a graph element that describes the WEST region, the graph has only observations where the value of REGION is WEST.
If you do not specify a role for a variable, then that variable does not appear in the drill-down graph. If you do not specify variables for the G_DEP and G_INDEP tags, then the Graph applet uses the independent and dependent variables of the graph in the preceding drill-down level.
You can explicitly remove a variable role from the drill-down graph by specifying a $ character as the drill-down value, as in the following code:
{G_GROUP} {$}
web users can make this change in the Graph applet menus by selecting the None option from the list of variables that can be applied to a given variable role.
Note: Note that you cannot assign a $ to the G_INDEP and G_DEP variables, because they must always be present in the drill-down graph.
Configuring the Drill-Down Response in HTML and URL Modes
In the HTML and URL drill-down modes, you can specify the parameter DRILLTARGET to specify where you want the web browser to display drill-down graphs. By default, the applet or control displays drill-down graphs in a new web browser window.
Specify the DRILLTARGET parameter in the ODS statement as shown in the following example:
ODS HTML PARAMETERS=(PARAMETERS=("DRILLDOWNMODE"="HTML""DRILLTARGET"="_blank" | "_self" | "_parent" | "_top" | any_named_target);
Note: The predefined target values must be entered in lowercase.
Each value does the following:
_blankdisplays the drill-down graph in a newly opened, unnamed browser window.
_selfdisplays the drill-down graph in the same frame or window as the initial graph. This is the default behavior in most browsers.
_parentdisplays the drill-down graph in the parent frame in a frame set. If no frames are defined, this value is the same as _SELF.
76 Chapter 5 / Controlling Drill-Down Behavior for ActiveX and Java Using Parameters

_topdisplays the drill-down graph in the full browser window, thereby replacing any frames that were defined in that window.
target_namedisplays the drill-down graph in the frame or browser window named target_name.
Configuring Script Drill-Down Mode
Using the DRILLDOWNMODE, DRILLFUNC, PATTERNSTRIP, and DRILLTARGET Parameters
You can use the parameters DRILLDOWNMODE, DRILLFUNC, PATTERNSTRIP, and DRILLTARGET to configure the Script drill-down mode for the ActiveX control, the Graph applet, and the Map applet. The Script drill-down mode enables you to execute a JavaScript callback method in response to drill-down actions. You use PUT statements to write the callback method into the HTML output file. Some experience with JavaScript is therefore required.
The syntax used to implement the Script drill-down mode is specified in the ODS statement as shown in the following example:
ODS HTML PARAMETERS=("DRILLDOWNMODE"="SCRIPT" "DRILLFUNC"="method");
The applet parameter DRILLDOWNMODE (see “Specifying the Drill-Down Mode” on page 69) establishes the Script drill-down mode. The DRILLFUNC parameter specifies the name of the JavaScript callback method that is executed in response to drill-down actions.
In response to a drill-down mode. The DRILLFUNC parameter specifies the name of the JavaScript callback method that is executed in response to drill-down actions.
In response to a drill-down action, the applet or control generates an array of arguments that is to be passed into the callback method. The array contains all of the data in the array as it generates its output. As the callback method terminates, it might return an object. The applet or control ignores this object.
To invoke the callback method, the applet or control issues netscape.javascript.JSObject.call() in the following form:
PUBLIC OBJECT CALL(STRING method-name, OBJECT argument-array-name[])
The method-name argument is the name of the callback method that you define in JavaScript in your program. The applet or control supplies the argument-array-name.
Configuring Script Drill-Down Mode 77

Working with the Array of ElementsUnderstanding the structure of the array of arguments is important for you to be able to access those elements in your callback method. The elements in the array represent all of the variables and values that are represented by the graph element that was selected in the drill-down action. The data is labeled in the array using drill-down tags. The tags identify variable roles or labels and values. For details, see “Using Drill-Down Tags” on page 68 and “Understanding Variable Roles” on page 71.
The first element in the array of arguments is the name of the applet or control. The second element in the array is the name of a file. The name of that file is derived from the variable roles in the graph at the preceding drill-down level, using the following substitution string:
{&G_INDEPV,f}{&G_GROUPV,f}{&G_SUBGRV,f}.html
The filename is a concatenation of the formatted values of the independent, group, and subgroup variables in the graph at the preceding drill-down level.
Note: The filename and file type are provided as a convenience. If you use this filename and file type, then you must create the actual file and provide its content.
The remaining elements in the array consist of drill-down tags, and the data that is associated with those tags in the graph element that was selected in the drill-down action. Each variable is represented by triplet pairs of arguments in the array:
tag variable_nametagV variable_valuetagV,F formatted_value
For example, assume that each graph data element selected is represented by six arguments in the array.
The graph shown in “Example: Script Drill-Down Mode with Java” on page 52 is configured for Script drill-down mode. Selecting the east region sales figures for the state of North Carolina generates the following array:
[appletName East1998NC.htmlG_DEP Sales G_DEPV 10000 G_DEPV,F $10,000G_INDEP Region G_INDEPV East G_INDEPV,F EastG_GROUP Year G_GROUPV 1998 G_GROUPV,F 1998G_SUBGR State G_SUBGRV NC G_SUBGRV,F NC]
The output filename is East1998NC.html. The remaining triplet pairs capture the roles, and values of the variables that make up the selected data element. All variable names are case sensitive as they appear in the array. For example, the value Region is capitalized. This is the case only if the variable name is defined as Region in the DATA step.
78 Chapter 5 / Controlling Drill-Down Behavior for ActiveX and Java Using Parameters

Implementing Script Drill-Down ModeTo implement Script drill-down mode, use PUT statements in a DATA step to write a JavaScript callback method into the HTML output file.
For an example of implementing script drill-down mode, see “Example: Script Drill-Down Mode with Java” on page 52. For information about writing JavaScript, refer to JavaScript tutorials that are available on the internet.
Formatting Data Values in Script Drill-Down ModeFor Script drill-down mode only, you can specify that data values are to be formatted or not formatted. By default, the values of the variables are not formatted. If the characters ,f are appended to the end of the tag, then those values are presented in formatted form. This parameter tag specifies that the values of the independent variable cost are to appear in formatted form.
{g_inep,f}{cost}
The format is applied using the FORMAT statement in the DATA step or graphics procedure that generated the data for the graph. Formatted values are specified in the statement that generated the original graph. Formatted values are used for axis labels, legends, and data tips that are displayed when the mouse is positioned over a graph data element.
Disabling Drill-Down FunctionalityFor the Graph applet, you can specify the DISABLEDRILLDOWN parameter to disable the drill-down functionality. Specify the DRILLDOWNMODE parameter in the ODS statement as shown in the following example:
ODS HTML PARAMETERS=("DISABLEDRILLDOWN"="TRUE");
Disabling Drill-Down Functionality 79

80 Chapter 5 / Controlling Drill-Down Behavior for ActiveX and Java Using Parameters

6Generating Interactive Treeview Diagrams Using the DS2TREE Macro
Creating Treeview Diagrams . . . . . . . . . . . . . . . . . . . . . . . . . . . . . . . . . . . . . . . . . . . . . . . . . . . . 81About the Treeview Applet . . . . . . . . . . . . . . . . . . . . . . . . . . . . . . . . . . . . . . . . . . . . . . . . . . . . 81When to Use the Treeview Applet . . . . . . . . . . . . . . . . . . . . . . . . . . . . . . . . . . . . . . . . . . . . . 82Interactivity Enabled by the Treeview Applet . . . . . . . . . . . . . . . . . . . . . . . . . . . . . . . . . . . 83Programming with the DS2TREE Macro for the Treeview Applet . . . . . . . . . . . . . . . . . 83
Enhancing Presentations Displayed with the Treeview Applet . . . . . . . . . . . . . . . . . . 85
DS2TREE Macro Arguments . . . . . . . . . . . . . . . . . . . . . . . . . . . . . . . . . . . . . . . . . . . . . . . . . . . . 85
Examples: Creating Interactive Treeview Diagrams . . . . . . . . . . . . . . . . . . . . . . . . . . . . . 86About These Examples . . . . . . . . . . . . . . . . . . . . . . . . . . . . . . . . . . . . . . . . . . . . . . . . . . . . . . . 86Example: Treeview Diagram with XML Embedded in the HTML File . . . . . . . . . . . . . . 86Example: Treeview Diagram with XML Written to an External File . . . . . . . . . . . . . . . . 88Example: Treeview Diagram with Custom Actions . . . . . . . . . . . . . . . . . . . . . . . . . . . . . . 89
Creating Treeview Diagrams
About the Treeview AppletThe Treeview applet generates node and link diagrams for hierarchical data, with optional fish-eye distortion that highlights the central area of interest, as shown in the following figure:
81

Figure 6.1 A Treeview Applet Web Link Diagram
You can scroll across the diagram by selecting off-center nodes or by searching for nodes. Positioning the cursor over a node can display optional data tips. If you then right-click, you access a pop-up menu. The menu enables you to highlight or hide subtrees or drill-down to an optional URL. The menu also enables you to select all nodes, display all previously hidden nodes, reset the view, display applet help, and search for nodes using various search parameters.
SAS/GRAPH programming for the Treeview applet differs from some of the other applets in that it does not use ODS, a graphics output device specification, or a SAS/GRAPH procedure. Instead, the DS2TREE macro references data sets to generate and configure an HTML output file that runs the Treeview applet.
When to Use the Treeview AppletThe Treeview applet is suitable for the illustration of hierarchical data sets. The fish-eye distortion factor, coupled with extensive node selection features, means that a single node and link diagram can accommodate large data sets. Applet parameters can be set to specify the layout of the diagram. You specify a starting node, and then you specify how the other nodes are to be drawn in relation to that node. The resulting diagram can be as complex as the web link diagram in Figure 6.1 on page 82, or as simple as an organizational tree for a department in a corporation.
If you need a higher degree of configurability to illustrate weighted relationships between the nodes and links in your diagram, then the Constellation applet might be
82 Chapter 6 / Generating Interactive Treeview Diagrams Using the DS2TREE Macro

a better choice than the Treeview applet, as described in “Creating Constellation Diagrams” on page 93.
Interactivity Enabled by the Treeview AppletThe Treeview applet provides a pop-up menu that enables you to interact with the applet. You can also use your mouse to interact with the applet. To open the pop-up menu, right-click on the tree diagram. The pop-up menu appears as shown in the following picture.
To display information about how to use the menu to interact with the applet, select Help ð Treeview Applet Help from the pop-up menu. To display information about how to use your mouse to interact with the applet, select Help ð Mouse Help from the pop-up menu.
Programming with the DS2TREE Macro for the Treeview Applet
The DS2TREE macro generates HTML output files for the Treeview applet. Macro arguments enable you to generate and format an HTML file and to customize the appearance of your node and link diagram.
Follow the steps shown in the following code to generate a web presentation that runs the Treeview applet. (Note that the ODS LISTING destination must be open when you run the DS2TREE macro.)
/* Specify the HTML output filename and the SAS/GRAPH applet JAR file URL. */ %let htmlfile=html-filename.htm;%let jarfiles=graph-jar-file-url;
/* Define a data set that contains parent-child relationships. */
Creating Treeview Diagrams 83

data myorg;input name $ empno mgrno deptname $22. deptcode $;cards;Peter 2620 1420 Documentation DOCLinda 6915 1420 Research & Development R&DMaria 1320 1420 Legal LGLVince 1420 1750 Executive EXEJim 6710 6915 Quality Assurance QANancy 22560 6915 Quality Assurance QAPatrick 28470 6915 Quality Assurance QAElsa 33075 6915 Development DEVClement 22010 6915 Development DEVMurielle 3020 6915 Development DEVDavid 11610 6915 Research RES;run;
/* Specify titles and footnotes: (optional). */title1 'Organizational Chart';footnote1 'To display the department name, place the cursor over a node.';footnote2 'To rotate the chart, click and drag a node.';
/* Close the currently open ODS destinations, and then open ODS LISTING. You must use the ODS LISTING destination. */ods _all_ close;ods listing;
/* Run the DS2TREE macro. */%ds2tree(ndata=myorg, /* data sets and files */ codebase=&jarfiles, xmltype=inline, htmlfile=&htmlfile, nid=empno, /* roles of variables */ nparent=mgrno, ntip=deptname, nlabel=name, height=500, /* appearance */ width=600, tcolor=navy, fcolor=black);
ods listing close;ods html; /* Not required in SAS Studio. */
Display the resulting HTML file in a web browser to run the Treeview applet and display the node and link diagram.
The preceding example shows how the arguments of the DS2TREE macro identify a data set and specify how the variables in that data set are to be interpreted to generate the diagram. Appearance arguments define the size of the diagram and the color of the text in the title and footnotes.
For information about generating more complex diagrams for the Treeview applet, see “Enhancing Presentations Displayed with the Treeview Applet” on page 85.
For definitions of all DS2TREE macro arguments, see “DS2TREE Macro Arguments” on page 85.
84 Chapter 6 / Generating Interactive Treeview Diagrams Using the DS2TREE Macro

Enhancing Presentations Displayed with the Treeview Applet
The Treeview applet displays interactive node and link diagrams. The diagrams are generated in SAS using a hierarchical data set and the DS2TREE macro, as described in “Programming with the DS2TREE Macro for the Treeview Applet” on page 83.
To enhance Treeview applet presentations, specify additional arguments for the DS2TREE macro. The following table describes some of the available enhancements and identifies the DS2TREE arguments that implement them. For a complete list of macro arguments, see “DS2CONST and DS2TREE Macro Argument Dictionary” on page 169.
Table 6.1 Treeview Applet Enhancements
Enhancement DS2TREE Argument
Specify a style sheet to format your HTML output file.
SSFILE, SSFREF, SSHREF, SSMEDIA, SSREL, SSREV, SSTITLE, SSTYPE
Specify dash patterns for link lines. LSTIP, LSTIPFAC
Specify a background color, image, or drill-down URL.
IBACKPOS, IBACKLOC, IBACKURL
Add pop-up data tips to nodes. NTIP, TIPS
Add drill-down URLs to nodes. NURL
Specify an action for the menu. ACTION, NACTION
Change the amount of fisheye distortion. FACTOR, FISHEYE
Determine layout of diagram. SPREAD, TREEDIR, TREESPAN
DS2TREE Macro ArgumentsThe DS2TREE macro uses the following syntax:
%DS2TREE(argument1=value1, argument2=value2, ...);
DS2TREE Macro Arguments 85

The macro arguments specify the configuration of the HTML output file, the location of the data that is used to generate the diagram, and the configuration of the applet's interactive features. The arguments can be grouped as follows:
n “Arguments for the APPLET Tag” on page 172
n “Arguments for Data Definition” on page 173
n “Arguments for HTML and XML File Information” on page 177
n “Arguments for Diagram Appearance” on page 178
n “Arguments for Page Formatting” on page 181
n “Arguments for Style Sheets” on page 182
n “Arguments for the SAS TITLE and FOOTNOTE Tags” on page 183
n “Arguments for Character Transcoding” on page 184
Examples: Creating Interactive Treeview Diagrams
About These ExamplesThis section includes examples of how to generate interactive Treeview diagrams. The examples include:
n “Example: Treeview Diagram with XML Embedded in the HTML File” on page 86
n “Example: Treeview Diagram with XML Written to an External File” on page 88
n “Example: Treeview Diagram with Custom Actions” on page 89
Example: Treeview Diagram with XML Embedded in the HTML File
This example generates a very simple Treeview diagram. The following figure shows the Treeview diagram that is generated by the sample code in a web browser. Notice the pop-up menu, which appears when you right-click in the diagram. Because the diagram is displayed by the Treeview applet, it is not just a static picture. You can manipulate the diagram, for example, by bringing selected nodes to the center, spreading out the nodes, and searching for nodes. You can also access the Help information for the Treeview applet as shown in the following figure. See “Interactivity Enabled by the Treeview Applet” on page 83.
86 Chapter 6 / Generating Interactive Treeview Diagrams Using the DS2TREE Macro

Here is the example program code. As you review the code, notice the following:
n The parameter XMLTYPE=INLINE tells the DS2TREE macro that the XML that it generates from the SAS data set should be included inline in the HTML file.
n The parameter HTMLFILE= specifies the complete path and name of the HTML file to be created by the DS2TREE macro. If you want to run this sample, then change the values of HTMLFILE and CODEBASE to the locations that you want to use.
n The parameter CUTOFF=1 specifies that every node on the graph be labeled. Use this parameter to suppress node labels for diagrams with numerous nodes.
Here is the SAS code for this example.
/* Specify the HTML output filename and the URL to the SAS/GRAPH applet JAR files. */%let htmlfile=html-filename.htm;%let jarfiles=graph-jar-file-url;
/* Create the data */data father_and_sons;input id $8. name $15. father $8.;cards;aaron Aaron Parker bob Bob Parker aaroncharlie Charlie Parker aarondavid David Parker aaronedward Edward Parker david;run;
/* Close the currently open ODS destinations and open ODS LISTING. You must use the ODS LISTING destination. */ods _all_ close;ods listing;
Examples: Creating Interactive Treeview Diagrams 87

/* run the macro */%ds2tree(ndata=father_and_sons, /* data set */ codebase=&jarfiles, xmltype=inline, htmlfile=&htmlfile, nid=id, /* use this variable as the id */ cutoff=1, /* display the name on every node */ nparent=father,/* this identifies the parent of each node */ nlabel=name, /* display this on each node */ height=400, width=400, tcolor=navy, fcolor=black);
ods listing close;ods html; /* Not required in SAS Studio. */
Example: Treeview Diagram with XML Written to an External File
This example generates the same Treeview as the previous example, “Example: Treeview Diagram with XML Embedded in the HTML File” on page 86, with the difference that the XML is written to an external file instead of being embedded in the HTML file. Here is the example program code. As you review the code, notice the following:
n The parameter HTMLFILE= specifies the complete path and name of the HTML file to be created by the DS2TREE macro. If you want to run this sample, then change the value of HTMLFILE to something that makes sense for you.
n The parameter XMLTYPE=EXTERNAL tells the DS2TREE that the XML that it generates from the SAS data set should be written to an external file.
n The parameter XMLURL= specifies how the XML file is to be addressed from within the HTML file.
n The parameter XMLFILE= specifies the path and filename of the XML file to be created.
n The parameter CUTOFF=1 specifies that every node on the graph be labeled. Use this parameter with a value between 0 and 1 to suppress node labels for diagrams with numerous nodes.
Here is the SAS code for this example.
/* Specify the HTML output filename and the URL to the SAS/GRAPH applet JAR files. */%let htmlfile=html-filename.htm;%let xmlfile=xml-filename.xml;%let xmlurl=xml-file-url;%let jarfiles=graph-jar-file-url;
/* Create the data. */data father_and_sons;input id $8. name $15. father $8.;cards;aaron Aaron Parker
88 Chapter 6 / Generating Interactive Treeview Diagrams Using the DS2TREE Macro

bob Bob Parker aaroncharlie Charlie Parker aarondavid David Parker aaronedward Edward Parker david;run; goptions reset=all;
/* Close the currently open ODS destinations, and then open ODS LISTING. You must use the ODS LISTING destination. */ods _all_ close;ods listing;
/* Run the DS2TREE macro. */%ds2tree(ndata=father_and_sons, /* data set */ codebase=&jarfiles, htmlfile=&htmlfile, xmltype=external, makexml=y, xmlurl=&xmlurl, xmlfile=&xmlfile, nid=id, /* as the id, use this variable specified here */ cutoff=1, /* display the name on every node */ nparent=father,/* this identifies the parent of each node */ nlabel=name, /* display the value of this variable on each node */ height=400, width=400, tcolor=navy, fcolor=black);
ods listing close;ods html; /* Not required in SAS Studio. */
Example: Treeview Diagram with Custom ActionsThis example generates the same Treeview as the previous example, “Example: Treeview Diagram with XML Embedded in the HTML File” on page 86, with the difference that two custom actions are associated with each node in the tree. Each custom action is a link to a web page. Here are the URLs.
n Link 1: http://www.sas.com
n Link 2: http://www.support.sas.com
The custom actions are listed as the node’s first name (link 1) and last name (link 2) in the pop-up menu. To open the Charlie URL, for example, the user right-clicks the Charlie Parker node, and then selects Custom Action ð Charlie from the pop-up menu as shown below.
Examples: Creating Interactive Treeview Diagrams 89

Here is the example program code. As you review the code, notice the following:
n The URL and ACTION columns in the node data set contain the URLs and action names. A semicolon separates each URL string and name. In this example, the URLs are the same for each node. You can use different URLs for each node.
Note: Because the column values contain a semicolon, the DATALINES4 statement is used in the DATA step instead of the DATALINES statement. Four semicolons are required to terminate the DATALINES4 statement.
n The parameter NURL= specifies the column in the node data set that contains the link URLs.
n The parameter NACTION= specifies the column in the node data set that contains the name of each action as it appears under the Custom Action item in the pop-up menu.
n The parameter DRILTARG=_TOP specifies that the HTML file is to be opened in the same window as the Treeview diagram instead of in a new window, as is the default.
Here is the SAS code for this example.
/* Specify the HTML output filename and the URL to the SAS/GRAPH applet JAR files. */%let htmlfile=html-filename.htm;%let jarfiles=graph-jar-file-url;
/* Create the data. */data father_and_sons;input id $8. name $15. father $8. url $42. action $20.;datalines4;aaron Aaron Parker http://www.sas.com;http://support.sas.com Aaron;Parker
90 Chapter 6 / Generating Interactive Treeview Diagrams Using the DS2TREE Macro

bob Bob Parker aaron http://www.sas.com;http://support.sas.com Bob;Parkercharlie Charlie Parker aaron http://www.sas.com;http://support.sas.com Charlie;Parkerdavid David Parker aaron http://www.sas.com;http://support.sas.com David;Parkeredward Edward Parker david http://www.sas.com;http://support.sas.com Edward;Parker;;;;run;
/* Close the currently open ODS destinations, and then open ODS LISTING. You must use the ODS LISTING destination. */ods html close;ods listing;
/* Run the DS2TREE macro. */%ds2tree(ndata=father_and_sons, /* data set */ codebase=&jarfiles, xmltype=inline, htmlfile=&htmlfile, nid=id, /* as the id, use the variable specified here */ cutoff=1, /* display the name on every node */ nparent=father,/* this identifies the parent of each node */ nlabel=name, /* display the value of this variable on each node */ height=400, width=400, tcolor=navy, fcolor=black, nurl=url, naction=action, driltarg=_top);
ods listing close;ods html; /* Not required in SAS Studio. */
Examples: Creating Interactive Treeview Diagrams 91

92 Chapter 6 / Generating Interactive Treeview Diagrams Using the DS2TREE Macro

7Generating Interactive Constellation Diagrams Using the DS2CONST Macro
Creating Constellation Diagrams . . . . . . . . . . . . . . . . . . . . . . . . . . . . . . . . . . . . . . . . . . . . . . . 93About the Constellation Applet . . . . . . . . . . . . . . . . . . . . . . . . . . . . . . . . . . . . . . . . . . . . . . . . 93When to Use the Constellation Applet . . . . . . . . . . . . . . . . . . . . . . . . . . . . . . . . . . . . . . . . . 94Programming with the DS2CONST Macro for the Constellation Applet . . . . . . . . . . . 95
Enhancing Presentations Displayed with the Constellation Applet . . . . . . . . . . . . . . 99
DS2CONST Macro Arguments . . . . . . . . . . . . . . . . . . . . . . . . . . . . . . . . . . . . . . . . . . . . . . . . . 100
Examples: Creating Interactive Constellation Diagrams . . . . . . . . . . . . . . . . . . . . . . . 101About These Examples . . . . . . . . . . . . . . . . . . . . . . . . . . . . . . . . . . . . . . . . . . . . . . . . . . . . . . 101Example: Constellation Chart with DATATYPE=ARCS . . . . . . . . . . . . . . . . . . . . . . . . . 101Example: Constellation Chart with DATATYPE=ASSOC . . . . . . . . . . . . . . . . . . . . . . . 103Example: Constellation Chart with XML Written to an External File . . . . . . . . . . . . . 106Example: Constellation Chart with Hotspots . . . . . . . . . . . . . . . . . . . . . . . . . . . . . . . . . . . 108
Creating Constellation Diagrams
About the Constellation AppletThe Constellation applet provides interactivity for node and link diagrams that illustrate data that is associative or requires an arc list. Node and link color and size can be associated with specified data values.
93
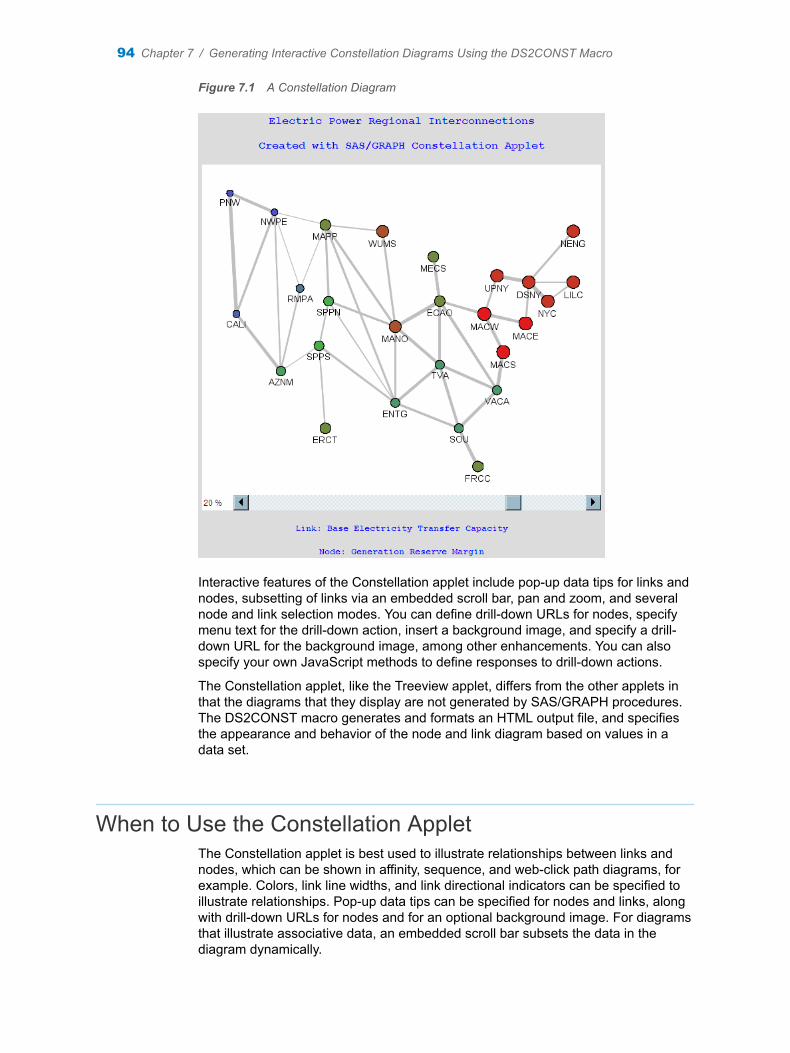
Figure 7.1 A Constellation Diagram
Interactive features of the Constellation applet include pop-up data tips for links and nodes, subsetting of links via an embedded scroll bar, pan and zoom, and several node and link selection modes. You can define drill-down URLs for nodes, specify menu text for the drill-down action, insert a background image, and specify a drill-down URL for the background image, among other enhancements. You can also specify your own JavaScript methods to define responses to drill-down actions.
The Constellation applet, like the Treeview applet, differs from the other applets in that the diagrams that they display are not generated by SAS/GRAPH procedures. The DS2CONST macro generates and formats an HTML output file, and specifies the appearance and behavior of the node and link diagram based on values in a data set.
When to Use the Constellation AppletThe Constellation applet is best used to illustrate relationships between links and nodes, which can be shown in affinity, sequence, and web-click path diagrams, for example. Colors, link line widths, and link directional indicators can be specified to illustrate relationships. Pop-up data tips can be specified for nodes and links, along with drill-down URLs for nodes and for an optional background image. For diagrams that illustrate associative data, an embedded scroll bar subsets the data in the diagram dynamically.
94 Chapter 7 / Generating Interactive Constellation Diagrams Using the DS2CONST Macro

The Constellation applet cannot be used to display hierarchical data. To create hierarchical diagrams such as organizational trees, use the Treeview Applet. For information about the Treeview Applet, see “Creating Treeview Diagrams” on page 81.
Programming with the DS2CONST Macro for the Constellation Applet
The DS2CONST macro enables you to generate complete web presentations for the Constellation applet. The macro has a large number of arguments that you can use to generate and format an HTML output file, configure the diagram, and describe how data sets and variables are to be applied to the diagram.
The macro arguments are structured so that you can associate a variable with an aspect of the diagram. The values of the variable are then used for that part of the diagram. For example, the NLABEL argument specifies the name of the variable whose values define the text labels that are to be applied to the nodes. Other arguments provide default values that are used when no variable value is provided.
Descriptions of all of the arguments of the DS2CONST macro are provided in “DS2CONST Macro Arguments” on page 100.
Run the following code to use the DS2CONST macro to generate the web presentation for the Constellation applet shown in the picture above. (Note that the ODS LISTING destination must be open when you run the DS2CONST macro.)
/* Define the path to the archive file, the HTML output file, and the SASlibrary */%let jarfiles = jar-file-url;%let htmlfile = html-filename.htm;%let lib = WORK; /* put everything in the WORK library */
/* Define the node names and locations. */data regions;length regionName $80 /* Node text label */ regionId $4 /* Node identifying string */ xLoc yLoc 8; /* Pixel position of node */input regionID xLoc yLoc reserve RegionName $ &;cards;PNW 30 30 8.5 Western Systems Coordinating Council - Pacific NorthwestNWPE 100 60 8.5 Western Systems Coordinating Council - Northwest Power Pool EastCALI 40 220 9.5 Western Systems Coordinating Council - CaliforniaRMPA 140 180 10.8 Western Systems Coordinating Council - Rocky Mountain Power AreaAZNM 110 310 12.9 Western Systems Coordinating Council - AZNMSNVMAPP 180 80 15 Mid-continent Area Power PoolSPPN 185 200 13.6 Southwest Power Pool - NorthSPPS 170 270 13.6 Southwest Power Pool - SouthERCT 180 400 15 Electric Reliability Council of TexasWUMS 270 90 17 Wisconsin - Upper MichiganMANO 290 240 17 Mid-America Interconnected Network - SouthENTG 290 360 12.4 EntergyMECS 350 130 15 Michigan Electric Coordination SystemECAO 360 200 15 East Central Area Reliability Coordination Agreement - SouthTVA 360 300 12.4 Tennessee Valley AuthoritySOU 390 400 12.4 Southern Company
Creating Constellation Diagrams 95

FRCC 420 460 15 Florida Reliability Coordinating CouncilVACA 450 340 12.4 Virginia and CarolinasMACS 460 280 19 Mid-Atlantic Area Council - SouthMACE 495 235 19 Mid-Atlantic Area Council - EastMACW 430 220 19 Mid-Atlantic Area Council - WestUPNY 450 160 18 Upstate New YorkDSNY 500 170 18 Downstate New YorkNYC 530 200 18 New York CityLILC 570 170 18 Long Island Lighting CompanyNENG 570 90 18 New England Power Pool;run;
/* Define the node connections. */data links;length from to $4 ltip $12 lcolor $8;format capacity comma.;input from to capacity;lcolor = "#BBBBBB"; /* Light gray lines */ltip = left(put(capacity, comma.) || " MW"); /* Define the tool tips */if capacity < 500 then width = 1; /* Define the line widths */else if capacity < 1000 then width = 2;else if capacity < 2000 then width = 3;else if capacity < 3000 then width = 4;else width = 5;cards;MECS ECAO 2250ECAO MECS 2250ECAO MACW 2957ECAO MANO 1655ECAO TVA 1890ECAO VACA 2334ERCT SPPS 635MACE MACW 1500MACE DSNY 1130MACS MACW 1800MACS VACA 3075MACW ECAO 2612MACW MACE 3368MACW MACS 3075MACW UPNY 481MANO ECAO 3033MANO WUMS 608MANO MAPP 531MANO SPPN 1191MANO TVA 2207MANO ENTG 1245WUMS MANO 1080WUMS MAPP 676MAPP MANO 1150MAPP WUMS 324MAPP SPPN 1172MAPP ENTG 1000MAPP NWPE 150MAPP RMPA 233NENG DSNY 1425
96 Chapter 7 / Generating Interactive Constellation Diagrams Using the DS2CONST Macro

UPNY MACW 1418UPNY DSNY 3750DSNY LILC 788DSNY MACE 308DSNY NENG 1125DSNY UPNY 3750DSNY NYC 3750NYC LILC 788NYC DSNY 3750LILC DSNY 938LILC NYC 788SPPN MANO 1228SPPN MAPP 891SPPN SPPS 525SPPN ENTG 636SPPS ERCT 569SPPS ENTG 636SPPS SPPN 900SPPS AZNM 315SPPS ENTG 1200ENTG SOU 1136ENTG TVA 1278ENTG MANO 1399ENTG SPPS 292ENTG SPPN 292ENTG MAPP 856SOU FRCC 4516SOU TVA 1810SOU VACA 1346SOU ENTG 1902FRCC SOU 21TVA ECAO 2235TVA MANO 2331TVA SOU 2052TVA ENTG 2153TVA VACA 2261VACA ECAO 2822VACA MACS 2794VACA SOU 3042VACA TVA 2240CALI PNW 4922CALI AZNM 0CALI NWPE 1184PNW CALI 5903PNW NWPE 1050RMPA MAPP 233RMPA AZNM 518RMPA NWPE 413NWPE RMPA 413NWPE CALI 1574NWPE MAPP 113NWPE AZNM 840NWPE PNW 2145AZNM CALI 5663AZNM NWPE 638AZNM RMPA 518
Creating Constellation Diagrams 97

AZNM SPPS 315;run;
/* Close the currently open ODS destinations, and then open ODS LISTING. You must use the ODS LISTING destination. */ods _all_ close;ods listing;
/* Set chart title. */title1 "Electric Power Regional Interconnections";title2 "Created with SAS/GRAPH Constellation Applet";footnote1 "Link: Base Electricity Transfer Capacity";footnote2 "Node: Generation Reserve Margin";
/* Run the DS2CONST macro to generate the chart. */%ds2const(/* arguments for the applet tag */ codebase=&jarfiles, /* path to archive file */ height=520, /* applet window height */ width=600, /* applet window width */
/* Arguments for Data Definition */ datatype=assoc, /* size nodes by nvalue var */ nsize=reserve, /* node sizes */ ncolval=reserve, /* node colors */ layout=user, /* use nx/ny to position nodes */ nx=xLoc, /* x-coordinate of node */ ny=yLoc, /* y-coordinate of node */ lcolor=lcolor, /* link color */ lvalue=width, /* link values */ lwidth=width, /* link widths */ minlnkwt=0, /* sets minimum link weight displayed*/ labels=y, /* display node labels */ linktype=line, /* do not show flow direction */ ndata=&lib..regions, /* node data */ ldata=&lib..links, /* node linkage data */ nid=regionID, /* var for node ID string */ nlabel=regionID, /* var for node label string */ lfrom=from, /* var for from-node ID */ lto=to, /* var for to-node ID */ ntip=RegionName, /* var for popup node text */ ltip=ltip, /* var for popup line text */
/* Arguments for Generating HTML and XML Files */ htmlfile=&htmlfile, /* output file name */ openmode=replace, /* create a new html file */
/* Arguments for Diagram Appearance */ nodeshap=circle, /* node shape */ border=y, /* enclose diagram */ colormap=y, /* use colormap for link/node colors */ fntsize=14, /* node label font size */ fntstyl=plain, /* node label font style */
/* Arguments for Page Formatting */ bgtype=color, /* use page background color */
98 Chapter 7 / Generating Interactive Constellation Diagrams Using the DS2CONST Macro

bg=#DDDDDD, /* page background color */ center=y, /* center chart on the page */ septype=none, /* no separator line */
/* Arguments for the SAS TITLE and FOOTNOTE Tags */ tcolor=#0000FF, /* title text color */ fcolor=#0000FF, /* footnote text color */ tsize=3, /* title text size */ fsize=2); /* footnote text size */
ods listing close;ods html; /* Not required in SAS Studio. */
Display the resulting HTML file in a web browser to run the applet and generate the diagram.
Arguments in the DS2CONST macro identify the name of the nodes and links data sets. In the nodes data set, arguments identify a node ID variable and a node label variable. Other arguments identify the links data set and the variables that define the nodes at the start and end of each link line.
For information about more complex presentations for the Constellation applet, see “Enhancing Presentations Displayed with the Constellation Applet” on page 99.
Enhancing Presentations Displayed with the Constellation Applet
The Constellation applet displays interactive node and link diagrams. These diagrams can show relationships between nodes and links. The Constellation applet displays affinity, sequence, and ring diagrams that are generated out of arc or associative data sets. The Constellation applet provides a number of interactive features by default, as described in “Creating Constellation Diagrams” on page 93.
Enhancements to Constellation applet presentations are configured in your SAS/GRAPH program by specifying arguments in the DS2CONST macro. The following table lists some of the available enhancements and the DS2CONST arguments that implement them. These enhancements enable you to provide data tips and drill-down URLs for nodes and links, and to increase the visible distinctions between the data values that are associated with the nodes and links.
Table 7.1 Constellation Applet Enhancements
Enhancements DS2CONST Arguments
Specify link weights and configure a scroll bar that controls the display of links based on weight.
LVALUE, MINLNKWT, SCLNKWT
Lay out the diagram automatically or as specified in a data set.
LAYOUT
Enhancing Presentations Displayed with the Constellation Applet 99

Enhancements DS2CONST Arguments
Specify a style sheet to format the HTML output file.
BDCLASS, SEPCLASS, SPCLASS, SSFILE, SSHREF
See “Arguments for Style Sheets” on page 182.
Add pop-up data tips to nodes and links. LTIP, NTIP
Define drill-down URLs for nodes and links.
LURL, NURL
Specify menu option text for a drill-down action.
ACTION, NACTION
Specify a browser window or frame that displays drill-down URLs.
DRILTARG
Add a background color, image, or drill-down URL.
IBACKLOC, IBACKPOS, IBACKURL,
Specify text colors, fonts, styles, and sizes.
NFNTNAME, NSFNTNAM, CTEXT, CATEXT
See “Arguments for Diagram Appearance” on page 178.
Specify colors for nodes and links. NCOLVAL, NCOLOR, CNODE, LCOLVAL, LCOLOR, CLINK
Specify dashed link lines. LSTIP and LSTIPFAC
Note that a number of enhancements apply only to associative data sets when you specify the macro argument DATATYPE=ASSOC. The macro argument definitions identify which features apply only to associative data.
The DS2CONST macro requires you to specify node and link data sets. As an enhancement, you can define a node styles data set that contains style information only. You can use the node styles data set to standardize the appearance of a series of diagrams, among other uses.
Reference information about the arguments of the DS2CONST macro is provided in “DS2CONST Macro Arguments” on page 100.
DS2CONST Macro ArgumentsThe DS2CONST macro uses the following syntax:
%DS2CONST(argument1=value1, argument2=value2, ...);
100 Chapter 7 / Generating Interactive Constellation Diagrams Using the DS2CONST Macro

The macro arguments specify the configuration of the HTML output file, the location of the data that is used to generate the diagram, and the configuration of the applet's interactive features. The arguments can be grouped as follows:
n “Arguments for the APPLET Tag” on page 172
n “Arguments for Data Definition” on page 173
n “Arguments for HTML and XML File Information” on page 177
n “Arguments for Diagram Appearance” on page 178
n “Arguments for Page Formatting” on page 181
n “Arguments for Style Sheets” on page 182
n “Arguments for the SAS TITLE and FOOTNOTE Tags” on page 183
n “Arguments for Character Transcoding” on page 184
Examples: Creating Interactive Constellation Diagrams
About These ExamplesThe examples in this section generate various types of constellation diagrams. The examples include:
n “Example: Constellation Chart with DATATYPE=ARCS” on page 101
n “Example: Constellation Chart with DATATYPE=ASSOC” on page 103
n “Example: Constellation Chart with XML Written to an External File” on page 106
n “Example: Constellation Chart with Hotspots” on page 108
Example: Constellation Chart with DATATYPE=ARCSThis sample program generates a very simple Constellation diagram. It displays a number of countries and the languages spoken in those countries. Here is the Constellation diagram that is generated by the sample code shown below. Notice the Mouse Help window. Because the diagram is displayed by the Constellation applet, it is not just a static picture. A user can manipulate the diagram, for example, by moving nodes and searching for nodes. The Mouse Help window in the following diagram documents for the user what interactivity is available (right-click a diagram to invoke the window).
Examples: Creating Interactive Constellation Diagrams 101

Here is the example program code. As you review the code, notice the following:
n The parameter HTMLFILE= specifies the complete path and name of the HTML file to be created by the DS2CONST macro. If you want to run this sample, then change the value of HTMLFILE to the location where you want the HTML file stored.
n The parameter NSHAPE= specifies the variable in the SAS data set that encodes the shape of each node.
n The parameter NCOLOR= specifies the variable in the SAS data set that encodes the color of each node.
Here is the SAS code for this example.
/* Specify the HTML output filename and the URL to the SAS/GRAPH applet JAR files. */%let htmlfile=html-filename.htm;%let jarfiles=graph-jar-file-url;
/* Define a nodes data set of countries and languages. */data nodedata;input nodeLabel $15. shape $10. color $8. size;cards;France square red .1Germany square red .1Italy square red .1Belgium square red .1Switzerland square red .1Holland square red .1German triangle blue .1French triangle blue .1Italian triangle blue .1Flemish triangle blue .1
102 Chapter 7 / Generating Interactive Constellation Diagrams Using the DS2CONST Macro

Dutch triangle blue .1;run;
/* Define a links data set. */data linkdata;input from $15. to $15.;cards;France FrenchGermany GermanBelgium FrenchBelgium GermanBelgium FlemishBelgium DutchSwitzerland FrenchSwitzerland GermanSwitzerland ItalianItaly ItalianItaly GermanHolland Dutch;run;goptions reset=all;
/* Close the currently open ODS destinations, and then open ODS LISTING. You must use the ODS LISTING destination. */ods _all_ close;ods listing;
/* Run the DS2CONST macro. */%ds2const(ndata=nodedata, /* node parameters */ ldata=linkdata, /* node linkage parameters */ datatype=arcs, /* use arc list for data */ height=400, /* applet window height */ width=500, /* applet window width */ code=ConstChart, /* class name */ codebase=&jarfiles, /* path to archive file */ htmlfile=&htmlfile, /* HTML output file name */ nid=nodelabel, /* var for node ID string */ nlabel=nodelabel, /* var for node label */ lfrom=from, /* var for from-node ID */ lto=to, /* var for to-node ID */ fntsize=12, /* node label font size */ nshape=shape, /* var for node shape */ ncolor=color, /* var for node color */ nsize=size); /* var for node size */
ods listing close;ods html; /* Not required in SAS Studio. */
Example: Constellation Chart with DATATYPE=ASSOCThis sample program generates a very simple Constellation diagram with DATATYPE=ASSOC. The following figure shows Constellation diagram that is
Examples: Creating Interactive Constellation Diagrams 103

generated by the sample code. A Constellation diagram with DATATYPE=ASSOC depicts the strength of the relationships among variables. Variables in the SAS data set determine the size and color of nodes, as well as the width and color of the lines between nodes. At the bottom of the picture, notice the slider bar that enables a user to choose how many of the links on the diagram are displayed. Move the slider to the left, and only the most important links are displayed. Move the slider to the right, and all of the links are displayed.
Here is the example program code. As you review the code, notice the following:
n The parameter HTMLFILE= specifies the complete path and name of the HTML file to be created by DS2CONST. If you want to run this sample, then change the value of HTMLFILE to something that makes sense for you.
n The parameter NCOLVAL= specifies the data set variable that is used to determine the color of each node.
n The parameter NSIZE= specifies the data set variable that is used to determine the size of each node.
n The parameter LVALUE= specifies the data set variable that is used to determine the width and color of each line between nodes.
Here is the SAS code for this example.
/* Specify the HTML output filename and the URL to the SAS/GRAPH applet JAR files. */%let htmlfile=html-filename.htm;%let jarfiles=graph-jar-file-url;
/* Define the node data. */data nodedata;length nodeID value 8 label $11 tip $25;input nodeID value @11 label $char11. @25 tip $char25.;cards;0 6556 depression depression: #65561 6322 anxiety anxiety: #63222 5980 fatigue fatigue: #5980
104 Chapter 7 / Generating Interactive Constellation Diagrams Using the DS2CONST Macro

3 5286 headache headache: #52864 4621 chest pain chest pain: #46216 3149 nausea nausea: #3149;run;
/* Define the link data. */data linkdata;length from to linkvalue 8 tip $40;input from to linkvalue @13 tip $char40.; cards;2 0 5978 #5978, Support:63.0790, Conf:99.98334 1 4621 #4621, Support:48.7602, Conf:100.00001 0 4307 #4307, Support:45.4469, Conf:68.12721 2 3964 #3964, Support:41.8276, Conf:62.70172 3 3010 #3010, Support:31.7611, Conf:50.34290 3 3009 #3009, Support:31.7506, Conf:47.59571 6 2772 #2772, Support:29.2498, Conf:43.84694 6 2609 #2609, Support:27.5298, Conf:56.45964 0 2606 #2606, Support:27.4982, Conf:56.39474 2 2263 #2263, Support:23.8789, Conf:48.97213 0 1980 #1980, Support:20.8927, Conf:40.68213 1 1701 #1701, Support:17.9487, Conf:34.94973 2 1701 #1701, Support:17.9487, Conf:34.94971 3 1593 #1593, Support:16.8091, Conf:25.19774 3 1152 #1152, Support:12.1557, Conf:24.92970 6 623 #623, Support:6.5738, Conf:9.85452 6 623 #623, Support:6.5738, Conf:10.41986 3 597 #597, Support:6.2995, Conf:20.02683 6 372 #372, Support:3.9253, Conf:7.64336 0 344 #344, Support:3.6298, Conf:11.5398;run;
/* Close the currently open ODS destinations, and then open ODS LISTING. You must use the ODS LISTING destination. */ods _all_ close;ods listing;
/* Run the DS2CONST macro. */title1 "Diagnosis Sequence Diagram.";%ds2const(ndata=nodedata, /* node parameters */ ldata=linkdata, /* node linkage parameters */ datatype=assoc, /* size nodes by nvalue var */ minlnkwt=30, /* minimum link display */ height=450, /* applet window height */ width=600, /* applet window width */ codebase=&jarfiles, /* path to archive file */ htmlfile=&htmlfile, /* HTML output file name */ colormap=y, /* use colormap for link/node colors */ nid=nodeID, /* var for node ID string */ nlabel=label, /* var for node label */ ncolval=value, /* var for node color */ nsize=value, /* var for node size */ fntsize=12, /* node label font size */ ntip=tip, /* var for popup node text */
Examples: Creating Interactive Constellation Diagrams 105

lfrom=from, /* var for from-node ID */ lto=to, /* var for to-node ID */ lcolval=linkvalue, /* var for link colors */ lvalue=linkvalue, /* var for link values */ ltip=tip, /* var for popup line text */ linktype=arrow); /* use arrows for links */
ods listing close;ods html; /* Not required in SAS Studio. */
Example: Constellation Chart with XML Written to an External File
This sample program generates the same Constellation diagram as the previous example, “Example: Constellation Chart with DATATYPE=ASSOC” on page 103, with the difference that the XML is written to an external file instead of being embedded in the HTML file.
Here is the example program code. As you review the code, notice the following:
n The parameter HTMLFILE= specifies the complete path and name of the HTML file to be created by DS2CONST. If you want to run this sample, then change the value of HTMLFILE to something that makes sense for you.
n The parameter XMLTYPE=EXTERNAL tells the DS2CONST macro that the XML that it generates from the SAS data set should be written to an external file.
n The parameter XMLURL= specifies how the XML file is to be addressed from within the HTML file.
n The parameter XMLFILE= specifies the path and filename of the XML file to be created.
Here is the SAS code for this example.
/* Specify the HTML output filename and the URL to the SAS/GRAPH applet JAR files. */%let htmlfile=html-filename.htm;%let xmlfile=xml-filename.xml;%let xmlurl=xml-file-url;%let jarfiles=graph-jar-file-url;
/* Define the node data. */data nodedata;length nodeID value 8 label $11 tip $25;input nodeID value @11 label $char11. @25 tip $char25.;cards;0 6556 depression depression: #65561 6322 anxiety anxiety: #63222 5980 fatigue fatigue: #59803 5286 headache headache: #52864 4621 chest pain chest pain: #46216 3149 nausea nausea: #3149;run;
/* Define the link data. */
106 Chapter 7 / Generating Interactive Constellation Diagrams Using the DS2CONST Macro
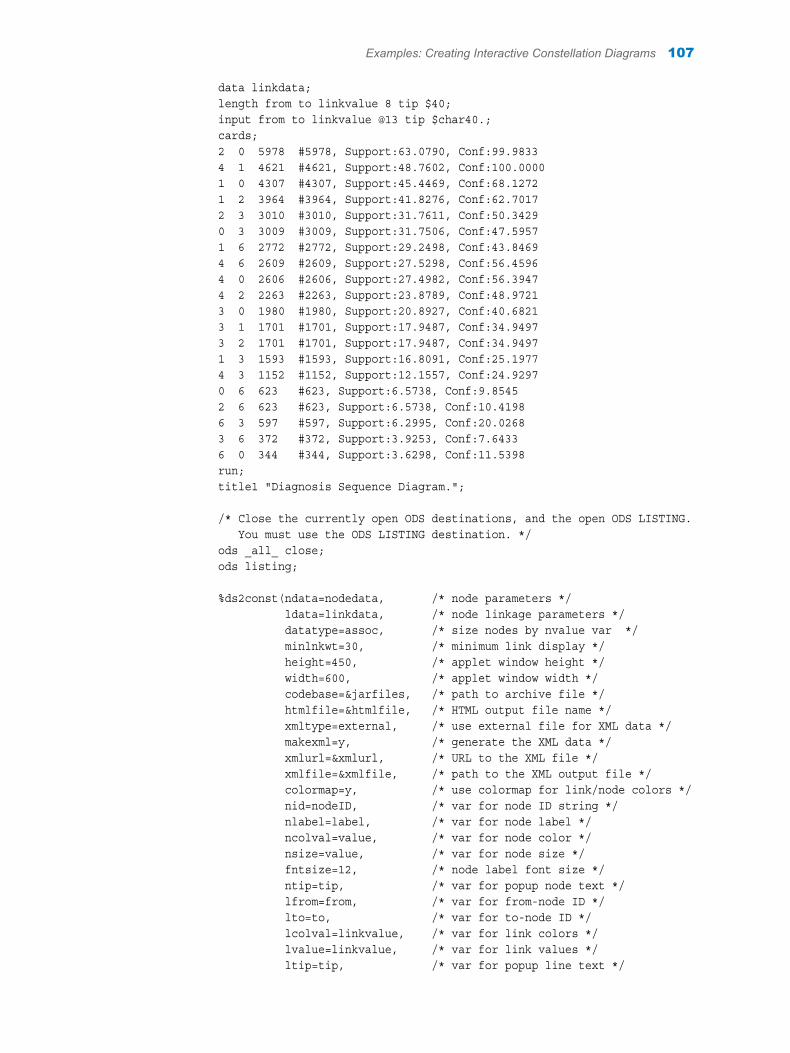
data linkdata;length from to linkvalue 8 tip $40;input from to linkvalue @13 tip $char40.; cards;2 0 5978 #5978, Support:63.0790, Conf:99.98334 1 4621 #4621, Support:48.7602, Conf:100.00001 0 4307 #4307, Support:45.4469, Conf:68.12721 2 3964 #3964, Support:41.8276, Conf:62.70172 3 3010 #3010, Support:31.7611, Conf:50.34290 3 3009 #3009, Support:31.7506, Conf:47.59571 6 2772 #2772, Support:29.2498, Conf:43.84694 6 2609 #2609, Support:27.5298, Conf:56.45964 0 2606 #2606, Support:27.4982, Conf:56.39474 2 2263 #2263, Support:23.8789, Conf:48.97213 0 1980 #1980, Support:20.8927, Conf:40.68213 1 1701 #1701, Support:17.9487, Conf:34.94973 2 1701 #1701, Support:17.9487, Conf:34.94971 3 1593 #1593, Support:16.8091, Conf:25.19774 3 1152 #1152, Support:12.1557, Conf:24.92970 6 623 #623, Support:6.5738, Conf:9.85452 6 623 #623, Support:6.5738, Conf:10.41986 3 597 #597, Support:6.2995, Conf:20.02683 6 372 #372, Support:3.9253, Conf:7.64336 0 344 #344, Support:3.6298, Conf:11.5398run;title1 "Diagnosis Sequence Diagram.";
/* Close the currently open ODS destinations, and the open ODS LISTING. You must use the ODS LISTING destination. */ods _all_ close;ods listing;
%ds2const(ndata=nodedata, /* node parameters */ ldata=linkdata, /* node linkage parameters */ datatype=assoc, /* size nodes by nvalue var */ minlnkwt=30, /* minimum link display */ height=450, /* applet window height */ width=600, /* applet window width */ codebase=&jarfiles, /* path to archive file */ htmlfile=&htmlfile, /* HTML output file name */ xmltype=external, /* use external file for XML data */ makexml=y, /* generate the XML data */ xmlurl=&xmlurl, /* URL to the XML file */ xmlfile=&xmlfile, /* path to the XML output file */ colormap=y, /* use colormap for link/node colors */ nid=nodeID, /* var for node ID string */ nlabel=label, /* var for node label */ ncolval=value, /* var for node color */ nsize=value, /* var for node size */ fntsize=12, /* node label font size */ ntip=tip, /* var for popup node text */ lfrom=from, /* var for from-node ID */ lto=to, /* var for to-node ID */ lcolval=linkvalue, /* var for link colors */ lvalue=linkvalue, /* var for link values */ ltip=tip, /* var for popup line text */
Examples: Creating Interactive Constellation Diagrams 107

linktype=arrow); /* use arrows for links */
ods listing close;ods html; /* Not required in SAS Studio. */
Example: Constellation Chart with HotspotsThis sample program generates the same Constellation diagram as in “Example: Constellation Chart with DATATYPE=ARCS” on page 101 and adds hotspots to the nodes of the diagram. Here is the example program code. As you review the code, notice that the parameter NURL= specifies the variable in the SAS data set that contains the URL to be linked to when a user double-clicks the node. Here is the SAS code for this example.
/* Specify the HTML output filename and the URL to the SAS/GRAPH applet JAR files. */%let htmlfile=html-filename.htm;%let jarfiles=graph-jar-file-url;
/* Define a node data set of countries and languages. */data nodedata;input nodeLabel $15. shape $10. color $8. size url $40.;cards;France square red .1 https://www.sas.com/fr_fr/home.htmlGermany square red .1 https://www.sas.com/de_de/home.htmlItaly square red .1 https://www.sas.com/it_it/home.htmlBelgium square red .1 https://www.sas.com/en_be/home.htmlSwitzerland square red .1 https://www.sas.com/de_ch/home.htmlHolland square red .1 https://www.sas.com/nl_nl/home.htmlGerman triangle blue .1 https://www.sas.com/de_de/home.htmlFrench triangle blue .1 https://www.sas.com/fr_fr/home.htmlItalian triangle blue .1 https://www.sas.com/it_it/home.htmlFlemish triangle blue .1 https://www.sas.com/nl_nl/home.htmlDutch triangle blue .1 https://www.sas.com/nl_nl/home.html;run;
/* Define the link data. */data linkdata;input from $15. to $15.;cards;France FrenchGermany GermanBelgium FrenchBelgium GermanBelgium FlemishBelgium DutchSwitzerland FrenchSwitzerland GermanSwitzerland ItalianItaly ItalianItaly GermanHolland Dutch;
108 Chapter 7 / Generating Interactive Constellation Diagrams Using the DS2CONST Macro

run;goptions reset=all;
/* Close the currently open ODS destinations, and then open ODS LISTING. You must use the ODS LISTING destination. */ods html close;ods listing;
/* Run the DS2CONST macro. */%ds2const(ndata=nodedata, /* node parameters */ ldata=linkdata, /* node linkage parameters */ nurl=url, /* var for drill-down links */ datatype=arcs, /* use an arc list for data */ height=400, /* applet window height */ width=500, /* applet window width */ code=ConstChart, /* class name */ codebase=&jarfiles, /* path to archive file */ htmlfile=&htmlfile, /* HTML output file name */ nid=nodelabel, /* var for node ID string */ nlabel=nodelabel, /* var for node label */ lfrom=from, /* var for from-node ID */ lto=to, /* var for to-node ID */ fntsize=12, /* node label font size */ nshape=shape, /* var for node shape */ ncolor=color, /* var for node color */ nsize=size); /* var for node size */
ods listing close;ods html; /* Not required in SAS Studio. */
Examples: Creating Interactive Constellation Diagrams 109

110 Chapter 7 / Generating Interactive Constellation Diagrams Using the DS2CONST Macro

8Troubleshooting Java and ActiveX Output
Overview . . . . . . . . . . . . . . . . . . . . . . . . . . . . . . . . . . . . . . . . . . . . . . . . . . . . . . . . . . . . . . . . . . . . . . 111
Checking Browser Permissions . . . . . . . . . . . . . . . . . . . . . . . . . . . . . . . . . . . . . . . . . . . . . . . 115
Using HTML Character Entities . . . . . . . . . . . . . . . . . . . . . . . . . . . . . . . . . . . . . . . . . . . . . . . . 116
Connecting to Web Servers That Require Authentication . . . . . . . . . . . . . . . . . . . . . . 116
Removing CLASSPATH Environment Variables . . . . . . . . . . . . . . . . . . . . . . . . . . . . . . . . 116
Setting the SAS_ALT_DISPLAY Variable for X Window Systems on UNIX . . . . . . 117
Correcting Text Fonts . . . . . . . . . . . . . . . . . . . . . . . . . . . . . . . . . . . . . . . . . . . . . . . . . . . . . . . . . 117
Resolving Differences between Graphs Generated with Different Technologies 118
OverviewThis chapter contains information that you can use to resolve rendering problems on client workstations.
If you or a member of your audience cannot display your presentation, then refer to the following table for solutions.
Note: To ensure that software requirements have been met, see “Requirements for Viewing Java and ActiveX Output” on page 16.
111

Table 8.1 Symptom, Cause, and Remedy Chart
Symptom Cause Remedy
Cannot access the HTML file.
Incorrect URL. Check the URL in the browser.
Network access denied. Check operating environment permissions for the HTML file.
Check firewall access permissions for internet clients.
112 Chapter 8 / Troubleshooting Java and ActiveX Output

Symptom Cause Remedy
Browser cannot display the file.
Browser or Java plug-in might not meet requirements.
Check the requirements. See “Requirements for Viewing Java and ActiveX Output” on page 16.
ActiveX control might not have been installed or might be out of date.
Install the ActiveX control manually. See “Customizing the SAS/GRAPH ActiveX Control Installation Process” on page 19. Consider updating the presentation to prompt users to install the control. See “Configuring an Existing ActiveX Presentation to Install the SAS/GRAPH ActiveX Control from Your Local Network” on page 21.
User attempting to run the ActiveX control in a browser other than Internet Explorer.
Switch to the required version of the Internet Explorer web browser.
User has not been authenticated for that browser and that web page.
Check to see whether authentication is needed, and then authenticate. See “Connecting to Web Servers That Require Authentication” on page 116.
Browser does not recognize the file as HTML.
Ensure that the type of the HTML file is correctly specified.
Browser permissions too restrictive.
Check browser permissions. See “Checking Browser Permissions” on page 115.
Browser cannot run the applet or control.
For Java, ensure that the HTML file is correctly referencing the Java plug-in and SAS Java archive. See “Specifying the Location of Control and Applet Files (CODEBASE= and ARCHIVE= Options)” on page 123.
Check browser permissions for running Java scripts. See “Checking Browser Permissions” on page 115.
In the UNIX operating environment, remove any CLASSPATH environment variables. See “Removing CLASSPATH Environment Variables” on page 116.
Open the browser's Java Console and trace the source of the error.
Overview 113

Symptom Cause Remedy
Graph is not rendering as specified by the ODS graph style.
A style attribute might not be enabled for your ODS destination.
Ensure that the attribute is enabled for your ODS destination. For example, the URL attribute is not enabled for the PS destination. Refer to the table of style attributes for the STYLE statement of the TEMPLATE procedure in SAS Output Delivery System: Procedures Guide.
A style attribute might be overridden by a global option, global statement option, procedure option, or statement option.
Specify the minimum options needed for your graph, for example:goptions reset=all device=activex;
In ActiveX, the user gets the message There is a pending reboot for this machine...
1 Virus-scanning software might be interfering with the installation of the control.
2 Other instances of the control might be running.
1 Turn off any virus-scanning software before installing the control.
2 Be sure to close all instances of Internet Explorer before installing the control.
Text font is incorrect. Java font is defined differently.
Change browser fonts or change the SAS/GRAPH program. See “Correcting Text Fonts” on page 117.
Text in browser shows incorrect characters.
Browser misinterpreting special characters.
Replace special characters with character entities. See “Using HTML Character Entities” on page 116.
114 Chapter 8 / Troubleshooting Java and ActiveX Output

Symptom Cause Remedy
Graph in browser differs from graph in SAS.
A graphics option or global statement might be unsupported or partially supported for that applet or control. See also “Resolving Differences between Graphs Generated with Different Technologies” on page 118 .
Refer to the descriptions for the options that you are using and to “Summary of ActiveX and Java Support” in SAS/GRAPH: Reference for information about whether a statement or option is supported.
A default value in the applet or control is overriding a default option value.
Specify a value for the option rather than relying on the default. See “Resolving Differences between Graphs Generated with Different Technologies” on page 118.
In ActiveX, black-and-white image is not displayed
ActiveX does not enable 8-bit grayscales images.
Convert the image to 24-bit monochrome.
Graph loses attributes after graph type is changed in the web browser.
Some attribute loss is inherent in graph type changes.
Select the Refresh button in the web browser to restore the original graph.
Changes made through the Data Options dialog box cause the graph to revert to its original view.
The graph discards subsetting information if you make changes through the Data Options dialog box.
Make any changes needed through the Data Options dialog box before subsetting the graph.
Checking Browser PermissionsAccess permissions vary from browser to browser, but some form of access control is enforced in most browsers. To check your permissions, open the browser's preferences or internet options window, and then look for the advanced options. Use your browser's Help system and contact your system support representative as needed to ensure that the browser permissions allow the following:
n Style sheets
n Java
n JavaScripts
Checking Browser Permissions 115

n Java Console
In the Security tab of the Internet Explorer's Internet Options window, make sure that the selected web content zone enables access to the web presentation.
Using HTML Character EntitiesIf a special character in your web presentation does not resolve in the browser, that character might need to be changed to a character entity in the source file or in the SAS program. A character entity is a standardized string of characters that represents a special character. The browser recognizes the string and replaces it with the special character when it is formatting the display. One common character entity is >. This entity represents the greater-than symbol (<).
Lists of standard character entities are provided in HTML reference books and in online HTML references.
For presentations that run in the Constellation and Treeview applets, the macros DS2CONST and DS2TREE enable the ENCODE argument, which you can use to automatically replace or not replace angle brackets (“<” and “>”) in TITLE and FOOTNOTE statements.
Connecting to Web Servers That Require Authentication
If you are unable to run a Java applet or install the ActiveX control, then you might be trying to access a web server that requires authentication. To resolve this problem, access a different file on that server and enter your user ID and password. Redisplaying your web presentation should now enable you to access that web server.
Removing CLASSPATH Environment VariablesIn the UNIX operating environment, if the Java applet does not run after you have verified that your Java archive is correctly specified, then you should remove any CLASSPATH environment variables that have been set. The Java archive files contain all the required classes to run the applets. Your CLASSPATH might point to old versions of the required classes (for example, for use with the webAF software). This can cause the applets to fail to load. Most applications enable you to specify a CLASSPATH at start-up, by using a start-up option. This is often safer for running multiple clients than using the environment variables.
116 Chapter 8 / Troubleshooting Java and ActiveX Output

Setting the SAS_ALT_DISPLAY Variable for X Window Systems on UNIX
You might need to define a special environment variable, SAS_ALT_DISPLAY, because some server features require a valid X Windows System graphics display. This environment variable is used to locate a graphics display when the value of the environment variable commonly used by the X Window System, DISPLAY, has not been set. The value of SAS_ALT_DISPLAY must refer to a display that will always be available during the operation of a SAS server. For example, if the server machine on which SAS servers are running also runs an X server, then set the value of SAS_ALT_DISPLAY to the name of the server machine. To set the SAS_ALT_DISPLAY environment variable, edit the file !SASROOT/bin/sasenv and substitute your display name for value:0.0 in the line,
SAS_ALT_DISPLAY=value:0.0
If an X server is not available on the server machine, an alternative is to use the X virtual frame buffer (Xvfb) as supplied by the operating system vendor. Refer to your vendor-supplied documentation for information about the use of Xvfb.
Correcting Text FontsIf your presentation displays an incorrect text font on a given client computer, then the cause might be that the client computer maps a logical font name such as Courier to a different physical font set. If the logical font is not mapped to any physical font, Java uses a default font.
When you are using the Java and ActiveX devices or the DS2TREE or DS2CONST macros, the actual fonts used are determined at run time. The fonts are resolved based on the fonts available on the system where the graph is viewed. When you use the JAVA or ACTIVEX device, the fonts specified by the styles are also specified in the HTML or RTF file that is generated. When the file is viewed, if a font is not available, the font mapper on the system where the file is viewed determines the font that is substituted.
It is recommended that you specify system fonts whenever possible. See “Determining What Fonts Are Available” in SAS/GRAPH: Reference and “TrueType Fonts Supplied by SAS” in SAS/GRAPH: Reference for more information.
For programs that use the JAVAMETA device, specify one of these font names: Helvetica, TimesRoman, Courier, Dialog, DialogInput, or ZapfDingbats; or, specify one of these font styles: serif, sans-serif, or monospaced. You can also specify the bold, italic, or italic bold versions of any of these fonts except ZapfDingbats (for example, HelveticaBold, sansserifItalic, or DialogInputItalicBold). If you specify a font style instead of a specific font, the actual font used is determined at run time based on the fonts available on the system where the output is viewed.
Correcting Text Fonts 117

Resolving Differences between Graphs Generated with Different Technologies
Graphics output that is rendered with one of the Java or ActiveX devices is rendered using Java or ActiveX technology, and graphics output that is rendered with other devices such as PNG, GIF, or SVG is rendered with SAS technology.
Because of technological differences between SAS, Java, and ActiveX, output generated with these different technologies might differ from each other even if the output is generated with the same SAS procedure code. The graphs might differ in appearance, in the default values used for certain options, or in the availability of certain features.
For example, differences might occur if you are using a global statement or procedure option that is not enabled for an applet or control. Most global statement and procedure options are fully supported by the Java and ActiveX device drivers. Exceptions are identified in the procedure and statement documentation and summarized in “Summary of ActiveX and Java Support” in SAS/GRAPH: Reference.
In certain cases, differences between graphs can occur when an applet or control overrides the default value of a procedure option. To resolve this issue, specify a value for the option rather than relying on the default. For example, consider a bubble plot that is being displayed in the Graph applet. The default bubble size is 5. The Graph applet overrides that default with a larger bubble size. To apply a bubble size of 5, specify BSIZE=5 in the BUBBLE statement, rather than relying on the default value of the BSIZE= option.
118 Chapter 8 / Troubleshooting Java and ActiveX Output

9ActiveX Control and Java Applet Parameter Dictionary
Specifying Parameters and Attributes for Java and ActiveX . . . . . . . . . . . . . . . . . . . 121About Specifying Parameters in ODS Statements . . . . . . . . . . . . . . . . . . . . . . . . . . . . . 121Specifying the Location of Control and Applet Files (CODEBASE=
and ARCHIVE= Options) . . . . . . . . . . . . . . . . . . . . . . . . . . . . . . . . . . . . . . . . . . . . . . . . . . 121Specifying the Location of the Java Plug-in (CODEBASE= Attribute) . . . . . . . . . . . . 121Specifying the Java Virtual Machine Maximum Heap Size . . . . . . . . . . . . . . . . . . . . . . 121
Attributes and Parameters That Apply to the ActiveX Control, and the Contour, Graph, and Map Applets . . . . . . . . . . . . . . . . . . . . . . . . . . . . . . . . . . . . . . . . . 125
Parameters That Apply to the Metaview and Tile Chart Applets . . . . . . . . . . . . . . . . 128
Dictionary . . . . . . . . . . . . . . . . . . . . . . . . . . . . . . . . . . . . . . . . . . . . . . . . . . . . . . . . . . . . . . . . . . . . . 130AMBIENT Parameter . . . . . . . . . . . . . . . . . . . . . . . . . . . . . . . . . . . . . . . . . . . . . . . . . . . . . . . . 130BACKDROPCOLOR Parameter . . . . . . . . . . . . . . . . . . . . . . . . . . . . . . . . . . . . . . . . . . . . . . 130BACKGROUNDCOLOR Parameter . . . . . . . . . . . . . . . . . . . . . . . . . . . . . . . . . . . . . . . . . . 130BACKIMAGE Parameter . . . . . . . . . . . . . . . . . . . . . . . . . . . . . . . . . . . . . . . . . . . . . . . . . . . . 131CLIPTIPS Parameter . . . . . . . . . . . . . . . . . . . . . . . . . . . . . . . . . . . . . . . . . . . . . . . . . . . . . . . . 131COLORNAMELIST Parameter . . . . . . . . . . . . . . . . . . . . . . . . . . . . . . . . . . . . . . . . . . . . . . . 131COLORNAMES Parameter . . . . . . . . . . . . . . . . . . . . . . . . . . . . . . . . . . . . . . . . . . . . . . . . . . 132COLORSCHEME Parameter . . . . . . . . . . . . . . . . . . . . . . . . . . . . . . . . . . . . . . . . . . . . . . . . 132DATATIPHIGHLIGHTCOLOR Parameter . . . . . . . . . . . . . . . . . . . . . . . . . . . . . . . . . . . . . 133DATATIPSTYLE Parameter . . . . . . . . . . . . . . . . . . . . . . . . . . . . . . . . . . . . . . . . . . . . . . . . . . 133DDLEVELn Parameters . . . . . . . . . . . . . . . . . . . . . . . . . . . . . . . . . . . . . . . . . . . . . . . . . . . . . 134DEFAULTTARGET Parameter . . . . . . . . . . . . . . . . . . . . . . . . . . . . . . . . . . . . . . . . . . . . . . . 134DIRECT Parameter . . . . . . . . . . . . . . . . . . . . . . . . . . . . . . . . . . . . . . . . . . . . . . . . . . . . . . . . . 134DRAWIMAGE Parameter . . . . . . . . . . . . . . . . . . . . . . . . . . . . . . . . . . . . . . . . . . . . . . . . . . . . 135DRAWMISSING Parameter . . . . . . . . . . . . . . . . . . . . . . . . . . . . . . . . . . . . . . . . . . . . . . . . . . 135DRAWSIDES Parameter . . . . . . . . . . . . . . . . . . . . . . . . . . . . . . . . . . . . . . . . . . . . . . . . . . . . 136DRILLDOWNFUNCTION Parameter . . . . . . . . . . . . . . . . . . . . . . . . . . . . . . . . . . . . . . . . . 136DRILLDOWNMODE Parameter . . . . . . . . . . . . . . . . . . . . . . . . . . . . . . . . . . . . . . . . . . . . . . 136DRILLPATTERN Parameter . . . . . . . . . . . . . . . . . . . . . . . . . . . . . . . . . . . . . . . . . . . . . . . . . 137DRILLTARGET Parameter . . . . . . . . . . . . . . . . . . . . . . . . . . . . . . . . . . . . . . . . . . . . . . . . . . . 137DUPLICATEVALUES Parameter . . . . . . . . . . . . . . . . . . . . . . . . . . . . . . . . . . . . . . . . . . . . . 138FILLPOLYGONEDGES Parameter . . . . . . . . . . . . . . . . . . . . . . . . . . . . . . . . . . . . . . . . . . . 138FREQNAME Parameter . . . . . . . . . . . . . . . . . . . . . . . . . . . . . . . . . . . . . . . . . . . . . . . . . . . . . 139G_COLOR Parameter . . . . . . . . . . . . . . . . . . . . . . . . . . . . . . . . . . . . . . . . . . . . . . . . . . . . . . . 139G_COLORV Parameter . . . . . . . . . . . . . . . . . . . . . . . . . . . . . . . . . . . . . . . . . . . . . . . . . . . . . 139G_DEP Parameter . . . . . . . . . . . . . . . . . . . . . . . . . . . . . . . . . . . . . . . . . . . . . . . . . . . . . . . . . . 140G_DEPTH Parameter . . . . . . . . . . . . . . . . . . . . . . . . . . . . . . . . . . . . . . . . . . . . . . . . . . . . . . . 140G_DEPTHV Parameter . . . . . . . . . . . . . . . . . . . . . . . . . . . . . . . . . . . . . . . . . . . . . . . . . . . . . . 140G_DEPV Parameter . . . . . . . . . . . . . . . . . . . . . . . . . . . . . . . . . . . . . . . . . . . . . . . . . . . . . . . . 141
119

G_GROUP Parameter . . . . . . . . . . . . . . . . . . . . . . . . . . . . . . . . . . . . . . . . . . . . . . . . . . . . . . 141G_GROUPV Parameter . . . . . . . . . . . . . . . . . . . . . . . . . . . . . . . . . . . . . . . . . . . . . . . . . . . . . 141G_INDEP Parameter . . . . . . . . . . . . . . . . . . . . . . . . . . . . . . . . . . . . . . . . . . . . . . . . . . . . . . . . 141G_INDEPV Parameter . . . . . . . . . . . . . . . . . . . . . . . . . . . . . . . . . . . . . . . . . . . . . . . . . . . . . . 142G_LABEL Parameter . . . . . . . . . . . . . . . . . . . . . . . . . . . . . . . . . . . . . . . . . . . . . . . . . . . . . . . . 142G_LABELV Parameter . . . . . . . . . . . . . . . . . . . . . . . . . . . . . . . . . . . . . . . . . . . . . . . . . . . . . . 142G_SUBGR Parameter . . . . . . . . . . . . . . . . . . . . . . . . . . . . . . . . . . . . . . . . . . . . . . . . . . . . . . . 143G_SUBGRV Parameter . . . . . . . . . . . . . . . . . . . . . . . . . . . . . . . . . . . . . . . . . . . . . . . . . . . . . 143GRADIENTBACKGROUND Parameter . . . . . . . . . . . . . . . . . . . . . . . . . . . . . . . . . . . . . . . 143GRADIENTSTARTCOLOR GRADIENTENDCOLOR Parameters . . . . . . . . . . . . . . . 144HONORASPECT Parameter . . . . . . . . . . . . . . . . . . . . . . . . . . . . . . . . . . . . . . . . . . . . . . . . . 144IMAGEPOSX IMAGEPOSY Parameters . . . . . . . . . . . . . . . . . . . . . . . . . . . . . . . . . . . . . . 145LEGENDFIT Parameter . . . . . . . . . . . . . . . . . . . . . . . . . . . . . . . . . . . . . . . . . . . . . . . . . . . . . 145LEGENDFONT Parameter . . . . . . . . . . . . . . . . . . . . . . . . . . . . . . . . . . . . . . . . . . . . . . . . . . . 145LEGENDFONTSIZE Parameter . . . . . . . . . . . . . . . . . . . . . . . . . . . . . . . . . . . . . . . . . . . . . . 146LEGENDHEIGHTPERCENT Parameter . . . . . . . . . . . . . . . . . . . . . . . . . . . . . . . . . . . . . . 146LEGENDPERCENT Parameter . . . . . . . . . . . . . . . . . . . . . . . . . . . . . . . . . . . . . . . . . . . . . . 146LEGENDWIDTHPERCENT Parameter . . . . . . . . . . . . . . . . . . . . . . . . . . . . . . . . . . . . . . . 147LEVELOFDETAIL Parameter . . . . . . . . . . . . . . . . . . . . . . . . . . . . . . . . . . . . . . . . . . . . . . . . 147LIGHTING Parameter . . . . . . . . . . . . . . . . . . . . . . . . . . . . . . . . . . . . . . . . . . . . . . . . . . . . . . . 147LOADFUNC Parameter . . . . . . . . . . . . . . . . . . . . . . . . . . . . . . . . . . . . . . . . . . . . . . . . . . . . . 148LOCALE Parameter . . . . . . . . . . . . . . . . . . . . . . . . . . . . . . . . . . . . . . . . . . . . . . . . . . . . . . . . . 148LODCOUNT Parameter . . . . . . . . . . . . . . . . . . . . . . . . . . . . . . . . . . . . . . . . . . . . . . . . . . . . . 148LOGRESOURCES Parameter . . . . . . . . . . . . . . . . . . . . . . . . . . . . . . . . . . . . . . . . . . . . . . . 149MENUnLABEL Parameters . . . . . . . . . . . . . . . . . . . . . . . . . . . . . . . . . . . . . . . . . . . . . . . . . . 149MENUnVALUE Parameters . . . . . . . . . . . . . . . . . . . . . . . . . . . . . . . . . . . . . . . . . . . . . . . . . . 150MENUn.mLABEL Parameters . . . . . . . . . . . . . . . . . . . . . . . . . . . . . . . . . . . . . . . . . . . . . . . . 150MENUn.mVALUE Parameters . . . . . . . . . . . . . . . . . . . . . . . . . . . . . . . . . . . . . . . . . . . . . . . 151MENUREMOVE Parameter . . . . . . . . . . . . . . . . . . . . . . . . . . . . . . . . . . . . . . . . . . . . . . . . . . 152METACODES Parameter . . . . . . . . . . . . . . . . . . . . . . . . . . . . . . . . . . . . . . . . . . . . . . . . . . . . 153METACODES1–METACODESn Parameters . . . . . . . . . . . . . . . . . . . . . . . . . . . . . . . . . . 153METACODESLABEL METACODES1LABEL–METACODESnLABEL Parameters 154MINLEGENDFONTSIZE Parameter . . . . . . . . . . . . . . . . . . . . . . . . . . . . . . . . . . . . . . . . . . 154MISSINGCOLOR Parameter . . . . . . . . . . . . . . . . . . . . . . . . . . . . . . . . . . . . . . . . . . . . . . . . 154NAME Attribute . . . . . . . . . . . . . . . . . . . . . . . . . . . . . . . . . . . . . . . . . . . . . . . . . . . . . . . . . . . . . 155NAVIGATERENDERMODE Parameter . . . . . . . . . . . . . . . . . . . . . . . . . . . . . . . . . . . . . . . 155NOJSOOBJECT Parameter . . . . . . . . . . . . . . . . . . . . . . . . . . . . . . . . . . . . . . . . . . . . . . . . . 155OUTLINES Parameter . . . . . . . . . . . . . . . . . . . . . . . . . . . . . . . . . . . . . . . . . . . . . . . . . . . . . . 156OVERFLOWCOLOR Parameter . . . . . . . . . . . . . . . . . . . . . . . . . . . . . . . . . . . . . . . . . . . . . 156PATTERNSTRIP Parameter . . . . . . . . . . . . . . . . . . . . . . . . . . . . . . . . . . . . . . . . . . . . . . . . . 156PROJECTION Parameter . . . . . . . . . . . . . . . . . . . . . . . . . . . . . . . . . . . . . . . . . . . . . . . . . . . 157PROJECTIONRATIO Parameter . . . . . . . . . . . . . . . . . . . . . . . . . . . . . . . . . . . . . . . . . . . . . 157RENDERMODE Parameter . . . . . . . . . . . . . . . . . . . . . . . . . . . . . . . . . . . . . . . . . . . . . . . . . . 157RENDEROPTIMIZE Parameter . . . . . . . . . . . . . . . . . . . . . . . . . . . . . . . . . . . . . . . . . . . . . . 158RENDERQUALITY Parameter . . . . . . . . . . . . . . . . . . . . . . . . . . . . . . . . . . . . . . . . . . . . . . . 158RESOURCESFONTNAME Parameter . . . . . . . . . . . . . . . . . . . . . . . . . . . . . . . . . . . . . . . . 159SHOWBACKDROP Parameter . . . . . . . . . . . . . . . . . . . . . . . . . . . . . . . . . . . . . . . . . . . . . . 159SIMPLEDEPTHSORT Parameter . . . . . . . . . . . . . . . . . . . . . . . . . . . . . . . . . . . . . . . . . . . . 160SIMPLETHRESHOLD Parameter . . . . . . . . . . . . . . . . . . . . . . . . . . . . . . . . . . . . . . . . . . . . 160STACKED Parameter . . . . . . . . . . . . . . . . . . . . . . . . . . . . . . . . . . . . . . . . . . . . . . . . . . . . . . . 161STACKPERCENT Parameter . . . . . . . . . . . . . . . . . . . . . . . . . . . . . . . . . . . . . . . . . . . . . . . . 161SURFACESIDECOLOR Parameter . . . . . . . . . . . . . . . . . . . . . . . . . . . . . . . . . . . . . . . . . . 161TIPBACKCOLOR Parameter . . . . . . . . . . . . . . . . . . . . . . . . . . . . . . . . . . . . . . . . . . . . . . . . 162TIPBORDERCOLOR Parameter . . . . . . . . . . . . . . . . . . . . . . . . . . . . . . . . . . . . . . . . . . . . . 162
120 Chapter 9 / ActiveX Control and Java Applet Parameter Dictionary

TIPS Parameter . . . . . . . . . . . . . . . . . . . . . . . . . . . . . . . . . . . . . . . . . . . . . . . . . . . . . . . . . . . . 162TIPMODE Parameter . . . . . . . . . . . . . . . . . . . . . . . . . . . . . . . . . . . . . . . . . . . . . . . . . . . . . . . 163TIPSTEMSIZE Parameter . . . . . . . . . . . . . . . . . . . . . . . . . . . . . . . . . . . . . . . . . . . . . . . . . . . 163TIPTEXTCOLOR Parameter . . . . . . . . . . . . . . . . . . . . . . . . . . . . . . . . . . . . . . . . . . . . . . . . . 164UNDERFLOWCOLOR Parameter . . . . . . . . . . . . . . . . . . . . . . . . . . . . . . . . . . . . . . . . . . . . 164USERFMT Parameter . . . . . . . . . . . . . . . . . . . . . . . . . . . . . . . . . . . . . . . . . . . . . . . . . . . . . . . 164VIEW2D Parameter . . . . . . . . . . . . . . . . . . . . . . . . . . . . . . . . . . . . . . . . . . . . . . . . . . . . . . . . . 165VIEWPOINT Parameter . . . . . . . . . . . . . . . . . . . . . . . . . . . . . . . . . . . . . . . . . . . . . . . . . . . . . 165WEBLINK_LIST Parameter . . . . . . . . . . . . . . . . . . . . . . . . . . . . . . . . . . . . . . . . . . . . . . . . . . 165XBINS YBINS Parameters . . . . . . . . . . . . . . . . . . . . . . . . . . . . . . . . . . . . . . . . . . . . . . . . . . . 166ZOOMCONTROLENABLED Parameter . . . . . . . . . . . . . . . . . . . . . . . . . . . . . . . . . . . . . . 167ZOOMCONTROLMIN Parameter . . . . . . . . . . . . . . . . . . . . . . . . . . . . . . . . . . . . . . . . . . . . 167ZOOMCONTROLMAX Parameter . . . . . . . . . . . . . . . . . . . . . . . . . . . . . . . . . . . . . . . . . . . . 167
Specifying Parameters and Attributes for Java and ActiveX
About Specifying Parameters in ODS StatementsYou can specify attributes and parameters in ODS to override default values in Java and ActiveX. No attributes or parameters are required. SAS provides workable defaults.
Attributes can be any HTML name/value pair that is valid inside the initial (opening) OBJECT tag. Parameters are values that appear in the body of the OBJECT tag to configure the appearance or functionality of a Java applet or the ActiveX control.
Attributes and parameters are specified as options of one of the available ODS statements, such as ODS HTML:
ODS HTML<ATTRIBUTES=("attr-name"="attr-value")><PARAMETERS=("param-name"="param-value")><other-options>;
The preceding syntax applies to all applicable ODS statements, such as HTML, MARKUP, PDF, PS, and RTF.
You can specify more than one "name"="value" pair (separated by blank spaces) inside the parenthesis of an ATTRIBUTES= or PARAMETERS= option. You can also specify multiple ATTRIBUTES= and PARAMETERS= options in a single ODS statement. These options can be specified in any order in the ODS statement.
You can remove a parameter tag by specifying a $ for its value, or by setting it to None using the menu of the applet or control. This removes the data and axis label that would otherwise be included in the graph.
You can also append ,n to tags that reference variables whose values are URLs. Normally, the substitution string is URL-encoded for browsers that do not support embedded white space in URL strings. Use ,n to prevent this encoding.
Specifying Parameters and Attributes for Java and ActiveX 121

No intervening white space should be added between the primary tag and the appended ,f or ,n characters. For information about the ,f characters, see “Formatting Data Values in Script Drill-Down Mode” on page 79.
Note: Using ,n is not the same as using the applet parameter PATTERNSTRIP. The PATTERNSTRIP parameter removes blank spaces from data values before those values are applied to substitution strings.
Most of the examples in the following topics specify parameters:
n “Examples: Creating Interactive Java Output” on page 49
n “Examples: Creating Interactive ActiveX Output” on page 30
n “Example: Generating Metacode Output with the JAVAMETA Driver ” on page 63
For information about other ODS statement options, see the SAS Output Delivery System: User’s Guide.
In HTML output that runs an applet or a control, all values of the ATTRIBUTES= option appear in the opening OBJECT tag. For example, a SAS/GRAPH program can specify the WIDTH attribute as follows:
ods html file="C:\sashtml\piechart.htm" attributes=("width"="720");
In the HTML output file, the WIDTH attribute appears inside the beginning OBJECT tag as shown in the following:
<script language="javascript" type="text/javascript"><!-- document.writeln("<OBJECT"); document.writeln('style=" width: 720px; height: 480px; background-color: #4E5056; border-width: 0px;"'); document.writeln("ALIGN=\"baseline\" class=\"Graph\""); . . .//--></script>
Valid attribute names are those that are enabled for the OBJECT tag in HTML. Valid attributes must also be specified as required by JAVA or ACTIVEX device drivers that run in the operating environment.
All of the name/value pairs that are specified in the ODS statement option PARAMETERS= appear in the body of the OBJECT tag. For example, a SAS program can disable the data tips and set the background color for a graph as follows:
ods html file="test.html" parameters=( "tips"="none" "backdropcolor"="CXff0000");
Valid parameter values for the ActiveX control, Graph applet, Map applet, and Contour applet are defined in “Attributes and Parameters That Apply to the ActiveX Control, and the Contour, Graph, and Map Applets” on page 125. Valid parameter values for the Metaview and Tile Chart applet are defined in “Parameters That Apply to the Metaview and Tile Chart Applets” on page 128.
122 Chapter 9 / ActiveX Control and Java Applet Parameter Dictionary

Specifying the Location of Control and Applet Files (CODEBASE= and ARCHIVE= Options)
About the Control and Applet FilesWhen you generate web presentations with the JAVA and ACTIVEX device drivers, the SAS/GRAPH software generates HTML pages that automatically look for the Java archive files or the ActiveX control file in the default installation location. If you install the ActiveX control .exe file or the Java archive JAR files in a location other than the default or if you want to publish Output Delivery System (ODS) output containing the SAS/GRAPH control or the applets in a web server, then you might need to specify the location of the .exe file or the JAR files when you generate your web presentation.
You can use the CODEBASE= option to specify the location of the ActiveX control or the Java applets. You can use the ARCHIVE= option to specify the name of the Java archive file.
Note: The ActiveX control must be installed locally on each PC where the web presentation is viewed.
Specifying the Location of the ActiveX ControlIf you use the ACTIVEX device driver to generate output containing an ActiveX control, then specify the location and version of the .exe file with the CODEBASE= option in the ODS statement. Specify the directory and filename of the .exe file. The CODEBASE location can be specified as a pathname or as a URL. (See “Specifying the CODEBASE= URL” on page 124 for more information.) If previous versions of the ActiveX control have been installed, then you also need to specify the version that you want to use. For example, if your .exe file is sasgraph.exe in directory /sasweb/graph, specify the following:
ods html file="/path/to/mygraph.html" codebase="/sasweb/graph/sasgraph.exe#version=9,4";
Specifying the Location of the Java AppletsBy default, the location of the SAS Java archive files is specified by the APPLETLOC= system option. This value is the default value of the CODEBASE= parameter. If the default location is accessible by users who are viewing your web presentation, and the SAS Java archive is installed at that location, then you do not need to change the value of the CODEBASE= parameter.
If you use the JAVA device driver to generate output containing a SAS/GRAPH applet, then specify the path to the JAR file with the CODEBASE= option in the ODS statement. Specify only the directory of the JAR file. The CODEBASE location can be specified as a pathname or as a URL. (See “Specifying the CODEBASE= URL” on page 124 for more information.) For example, if your JAR file is in directory /sasweb/graph, you would specify the following:
Specifying Parameters and Attributes for Java and ActiveX 123

ods html body="/path/to/mygraph.html" codebase="/sasweb/graph";
The ARCHIVE= option specifies the filename of the JAR file or files. You do not need to specify the ARCHIVE= option in the ODS statement unless you have renamed the JAR files.
For applets generated with macros, specify the CODEBASE= argument for the macro. For example:
%ds2const(codebase=http://your_path_to_archive, htmlfile=your_path_and_filename.htm ...);
For the DS2TREE and DS2CONST macros, you do not need to specify the ARCHIVE= argument unless you have renamed the JAR files.
Specifying the CODEBASE= URLIf the value that you specify for CODEBASE= is a URL, it can be a full URL (for example, http://your_server/sasweb/graph), or it can be relative to your web server (/sasweb/graph). If you are publishing HTML only on web servers where the control or the applets are installed in a common location, then it is generally recommended that you use the shorter, relative URL. A relative URL enables you to move the HTML to any web server without modifying the HTML (assuming the control or the applets are installed on that server). If you are creating HTML that will be viewed from an email or copied to a web server on which the applets are not installed, then you should use a full URL to point to the applet JAR files at a known location.
Specifying the Location of the Java Plug-in (CODEBASE= Attribute)
The CODEBASE= attribute in the ODS statement specifies the location of the Java plug-in from Oracle. By default, SAS points to the website of the Java plug-in from Oracle. If necessary, you can change the location of the Java plug-in by specifying the CODEBASE= attribute in the ODS statement. For example:
ods html file="c:\myfile.htm" attributes=( "codebase"= "http://ourco.com/Plugins/java-plugin-filename.exe");
On Windows systems, the user is prompted to install the plug-in if it is not already installed. On other systems, the plug-in can be installed from the SAS Third-Party Software Requirements web page.
Specifying the Java Virtual Machine Maximum Heap SizeTo change the Java Virtual Machine (JVM) maximum heap size from the default size, include the PARAMETERS= option in your ODS HTML statement and set applet parameter JAVA_PARAMETERS to Xmxnnnm, where nnn is the new heap
124 Chapter 9 / ActiveX Control and Java Applet Parameter Dictionary

size in megabytes. For example, to set the heap size to 256 megabytes, use the following ODS HTML statement:
ods html parameters=("JAVA_PARAMETERS"="Xmx256m");
For information about the ODS HTML statement PARAMETERS= option, see SAS Output Delivery System: User’s Guide. For information about the Java parameters, visit the Oracle website.
Attributes and Parameters That Apply to the ActiveX Control, and the Contour, Graph, and Map Applets
The following table lists the parameters that apply to the ActiveX Control, and the Contour, Graph, and Map applets.
Table 9.1 Attributes and Parameters Enabled for the ActiveX Control, and the Contour, Graph, and Map Applets
Parameter
Applies To (✓):
ActiveX Control
Contour Applet
Graph Applet
Map Applet
AMBIENT (p. 130) ✓ ✓
BACKDROPCOLOR (p. 130) ✓ ✓
BACKIMAGE (p. 131) ✓1 ✓ ✓ ✓
CLIPTIPS (p. 131) ✓
COLORNAMELIST (p. 131) ✓
COLORNAMES (p. 132) ✓ ✓
COLORSCHEME (p. 132) ✓ ✓
DDLEVELn (p. 134) ✓
DIRECT (p. 134) ✓ ✓
DRAWIMAGE (p. 135) ✓ ✓ ✓
DRAWMISSING (p. 135) ✓
DRAWSIDES (p. 136) ✓
DRILLDOWNFUNCTION (p. 136) ✓ ✓ ✓
DRILLDOWNMODE (p. 136) ✓ ✓ ✓
Attributes and Parameters That Apply to the ActiveX Control, and the Contour, Graph, and Map Applets 125

Parameter
Applies To (✓):
ActiveX Control
Contour Applet
Graph Applet
Map Applet
DRILLPATTERN (p. 137) ✓ ✓ ✓
DRILLTARGET (p. 137) ✓ ✓ ✓
DUPLICATEVALUES (p. 138) ✓
FILLPOLYGONEDGES (p. 138) ✓
FREQNAME (p. 139) ✓
G_COLOR (p. 139) ✓ ✓ ✓
G_COLORV (p. 139) ✓ ✓ ✓
G_DEP (p. 140) ✓ ✓ ✓
G_DEPTH (p. 140) ✓ ✓ ✓
G_DEPTHV (p. 140) ✓ ✓ ✓
G_DEPV (p. 141) ✓ ✓ ✓
G_GROUP (p. 141) ✓ ✓ ✓
G_GROUPV (p. 141) ✓ ✓ ✓
G_INDEP (p. 141) ✓ ✓ ✓
G_INDEPV (p. 142) ✓ ✓ ✓
G_LABEL (p. 142) ✓
G_LABELV (p. 142) ✓
G_SUBGR (p. 143) ✓ ✓ ✓
G_SUBGRV (p. 143) ✓ ✓ ✓
GRADIENTBACKGROUND (p. 143) ✓ ✓ ✓
GRADIENTENDCOLOR (p. 144) ✓ ✓ ✓
GRADIENTSTARTCOLOR (p. 144) ✓ ✓ ✓
HONORASPECT (p. 144) ✓
IMAGEPOSX (p. 145) ✓ ✓ ✓
IMAGEPOSY (p. 145) ✓ ✓ ✓
LEGENDFIT (p. 145) ✓
126 Chapter 9 / ActiveX Control and Java Applet Parameter Dictionary

Parameter
Applies To (✓):
ActiveX Control
Contour Applet
Graph Applet
Map Applet
LEGENDFONT (p. 145) ✓
LEGENDFONTSIZE (p. 146) ✓
LEGENDHEIGHTPERCENT (p. 146) ✓
LEGENDPERCENT (p. 146) ✓
LEGENDWIDTHPERCENT (p. 147) ✓
LEVELOFDETAIL (p. 147) ✓
LIGHTING (p. 147) ✓
LOADFUNC (p. 148) ✓
LOCALE (p. 148) ✓ ✓ ✓
LODCOUNT (p. 148) ✓
MENUREMOVE (p. 152) ✓ ✓
MINLEGENDFONTSIZE (p. 154) ✓
MISSINGCOLOR (p. 154) ✓
NAME (p. 155) ✓ ✓ ✓
NAVIGATERENDERMODE (p. 155) ✓
NOJSOOBJECT (p. 155) ✓
OUTLINES (p. 156) ✓
OVERFLOWCOLOR (p. 156) ✓
PATTERNSTRIP (p. 156) ✓ ✓ ✓
PROJECTION (p. 157) ✓
PROJECTIONRATIO (p. 157) ✓
RENDERMODE (p. 157) ✓
RENDEROPTIMIZE (p. 158) ✓
RENDERQUALITY (p. 158) ✓ ✓
SHOWBACKDROP (p. 159) ✓ ✓
SIMPLEDEPTHSORT (p. 160) ✓
Attributes and Parameters That Apply to the ActiveX Control, and the Contour, Graph, and Map Applets 127

Parameter
Applies To (✓):
ActiveX Control
Contour Applet
Graph Applet
Map Applet
SIMPLETHRESHOLD (p. 160) ✓
STACKED (p. 161) ✓
STACKPERCENT (p. 161) ✓
SURFACESIDECOLOR (p. 161) ✓
TIPBACKCOLOR (p. 162) ✓
TIPBORDERCOLOR (p. 162) ✓
TIPS (p. 162) ✓ ✓ ✓ ✓
TIPMODE (p. 163) ✓
TIPSTEMSIZE (p. 163) ✓
TIPTEXTCOLOR (p. 164) ✓
UNDERFLOWCOLOR (p. 164) ✓
USERFMTn (p. 164) ✓
VIEW2D (p. 165) ✓ ✓ ✓
VIEWPOINT (p. 165) ✓
XBINS (p. 166) ✓
YBINS (p. 166) ✓
1 This option works only if STYLE=MINIMAL is specified in the ODS destination statement.
Parameters That Apply to the Metaview and Tile Chart Applets
The following table lists the parameters that apply to the Metaview and Tile Chart applets.
128 Chapter 9 / ActiveX Control and Java Applet Parameter Dictionary

Table 9.2 Parameters Enabled for the Metaview and Tile Chart Applets
Parameter
Applies To (✓):
Metaview Applet
Tile Chart Applet
BACKGROUNDCOLOR (p. 130) ✓
DATATIPHIGHLIGHTCOLOR (p. 133) ✓
DATATIPSTYLE (p. 133) ✓
DEFAULTTARGET (p. 134) ✓
LOGRESOURCES (p. 149) ✓
MENUnLABEL (p. 149) ✓
MENUnVALUE (p. 150) ✓
MENUn.mLABEL (p. 150) ✓
MENUn.mVALUE (p. 151) ✓
METACODES (p. 153) ✓
METACODES1-METACODESn (p. 153) ✓
METACODESLABEL (p. 154) ✓
METACODES1LABEL-METACODESnLABEL (p. 154) ✓
RESOURCESFONTNAME (p. 159) ✓
WEBLINK_LIST (p. 165) ✓
ZOOMCONTROLENABLED (p. 167) ✓
ZOOMCONTROLMIN (p. 167) ✓
ZOOMCONTROLMAX (p. 167) ✓
Parameters That Apply to the Metaview and Tile Chart Applets 129

Dictionary
AMBIENT Parameterspecifies the intensity of non-directional ambient light in relation to direct light.
Default: 0.4
Range: 0.0–1.0
Applies to: ActiveX Control, Contour applet
Restriction: The sum of the AMBIENT= and DIRECT= parameter values cannot exceed 1.0.
Interaction: If the sum of the AMBIENT= and DIRECT= parameter values exceeds 1.0, the AMBIENT= value is reduced so that the sum of the two values equals 1.0.
SyntaxAMBIENT=light-level
BACKDROPCOLOR Parameterspecifies the color of all of the walls and the floor as an RGB color in hexadecimal (0xrrggbb).
Default: 0xffffff (white)
Applies to: Graph applet, Contour applet
SyntaxBACKDROPCOLOR=color
BACKGROUNDCOLOR Parameterspecifies the background color as an RGB color in hexadecimal (0xrrggbb).
Default: 0xd3d3d3 (gray)
Applies to: Metaview applet
Tip: This parameter changes the background color for the applet only. To set the background color for the entire graph, use the CBACK= graphics option in a GOPTIONS statement. See “Graphics Options and Device Parameters Dictionary” in SAS/GRAPH: Reference.
130 Chapter 9 / ActiveX Control and Java Applet Parameter Dictionary

SyntaxBACKGROUNDCOLOR=color
BACKIMAGE Parameterspecifies the URL of an image that is to be displayed as the background of the applet image area.
Default: The background is drawn in a single solid color.
Applies to: ActiveX Control, Graph applet, Map applet, Contour applet
Requirements: For the ActiveX Control, the background image must be in GIF, JPEG, or BMP format.For the Graph, Map, or Contour applet, the URL must be absolute and not relative.
Tip: Use the DRAWIMAGE= parameter to specify how the image is applied to the background.
SyntaxBACKIMAGE=image-URL
CLIPTIPS Parameterindicates whether data tips should be clipped.
Default: TRUE
Applies to: Contour applet
Note: The data tips window hugs the boundary and displays the value of the element that is closest to the cursor along that edge of the plot.
SyntaxCLIPTIPS=TRUE | FALSE
Argument ValuesTRUE
does not display data tips when the cursor is outside of the plot area.
FALSEdisplays data tips when the cursor is outside of the plot area.
COLORNAMELIST Parameterspecifies which of two named color lists has priority when searching for named colors.
Default: Search the list of HTML 3.2 colors, then search the SAS name list.
COLORNAMELIST Parameter 131

Applies to: Contour applet
Note: Specifying SAS as the string reverses the default search priority, giving SAS names the higher priority.
SyntaxCOLORNAMELIST=string | SAS
COLORNAMES Parameterspecifies the color names and associated 6-digit hexadecimal RGB values that are displayed in the Standard Colors list box in the Color dialog box.
Default: Aqua, Bisque, Black, Blue, Burlywood, Cornflowerblue, Cornsilk, Fuchsia, Gray, Green, Gold, Lightseagreen, Lime, Maroon, Navy, Olive, Purple, Red, Seagreen, Silver, Skyblue, Teal, White, and Yellow
Applies to: Graph applet, Contour applet
Requirements: The names and RGB values must be specified as a comma-separated list of name=value pairs with no spaces.A value must be a valid 6-digit hexadecimal RGB code. The color names are displayed as specified in the list box.
Note: A name can be any valid string.
See: the applet Help for information about how to open the Color dialog box.
SyntaxCOLORNAMES=name1=value1,name2=value2, ... nameN=valueN
COLORSCHEME Parameterspecifies the name of the color scheme that is applied to the graph.
Default: No color scheme is applied to the graph.
Applies to: ActiveX Control, Graph applet
SyntaxCOLORSCHEME=scheme-name
132 Chapter 9 / ActiveX Control and Java Applet Parameter Dictionary

DATATIPHIGHLIGHTCOLOR Parameterspecifies the color of the outline that appears around a graph element when its data-tip information is being displayed.
Default: 0xff0000 (red)
Applies to: Metaview applet
Requirements: The color must be specified as an RGB hexadecimal value (0xrrggbb).The DATATIPSTYLE= parameter must be set to HIGHTLIGHT. Otherwise, the DATATIPHIGHLIGHTCOLOR= parameter is ignored.
SyntaxDATATIPHIGHLIGHTCOLOR=color
DATATIPSTYLE Parameterspecifies the style of the data-tip pop-up window.
Default: HIGHLIGHT
Applies to: Metaview applet
SyntaxDATATIPSTYLE=HIGHLIGHT | STICK | STICK_FIXED
Argument ValuesHIGHLIGHT
causes the data tip pop-up window to appear above the segment with no connecting line. The border of the graph element is highlighted. As long as the cursor remains in the element, the pop-up window displays the data tip, and the element outline is highlighted.
Tip Use the DATATIPHIGHLIGHTCOLOR= parameter to specify the highlight border color.
STICKconnects the data tip pop-up window to the graph element with a line. The pop-up window is positioned over the cursor. As long as the cursor remains in the element, when the cursor is moved, the pop-up window and the connecting line move with the cursor.
STICK_FIXEDconnects a stationary data tip pop-up window to the graph element with a line drawn into the middle of the graph element. As long as the cursor remains in the element, the pop-up window displays the data tip.
DATATIPSTYLE Parameter 133

DetailsThe following figure shows an example of each of the data-tip styles for a segment of a subgrouped bar.
DDLEVELn Parametersconfigures the drill-down graph that is generated at the drill-down level that is specified by the letter n.
Applies to: Graph applet
Tip: The drill-down graph is configured using drill-down tags such as G_INDEPV.
SyntaxDDLEVELn=configuration-string
DEFAULTTARGET Parameterspecifies where the browser opens drill-down URLs by default.
Default: _blank, which displays drill-down URLs in a new browser window.
Applies to: Metaview applet
Interaction: The drill-down tag TARGET attribute overrides this parameter.
Tip: The value of this parameter can be an HTML target such as _blank or the name of a window or frame in the web presentation.
SyntaxDEFAULTTARGET=target-name
DIRECT Parameterspecifies the intensity of direct light (from a light source) in relation to the ambient (non-directional) light.
134 Chapter 9 / ActiveX Control and Java Applet Parameter Dictionary

Default: 0.6
Range: 0.0–1.0
Applies to: ActiveX Control, Contour applet
Restriction: The sum of AMBIENT= and DIRECT= parameter values cannot exceed 1.0.
Interaction: If the sum of the AMBIENT= and DIRECT= parameter values exceeds 1.0, the AMBIENT= value is reduced so that the sum of the two values equals 1.0.
SyntaxDIRECT=light-level
DRAWIMAGE Parameterspecifies how the image specified in the BACKIMAGE parameter is applied to the background of the applet window.
Default: SCALE
Applies to: Graph applet, Map applet, Contour applet
See: “BACKIMAGE Parameter” on page 131
SyntaxDRAWIMAGE=CENTER | POSITION | SCALE | TILE
Argument ValuesCENTER
centers a single instance of the image in the background, without resizing the image.
POSITIONplaces a single instance of the image at the location supplied by the IMAGEPOSX= and IMAGEPOSY= parameters, without resizing. If these parameters are not specified, then the image is centered in the applet window.
SCALEfills the entire background of the applet window with a single instance of the specified image, which is resized as necessary.
TILEfills the entire background of the applet window using multiple instances of the specified image, without resizing that image. The images are arranged in rows and columns.
DRAWMISSING Parameterspecifies whether missing values should be drawn.
DRAWMISSING Parameter 135

Default: FALSE. Missing values are not drawn.
Applies to: Contour applet
Requirement: For DRAWMISSING=TRUE to have any effect, the Styles menu option must be set to Block, Smooth, or Surface.
SyntaxDRAWMISSING=TRUE | FALSE
DRAWSIDES Parameterspecifies that sides should be drawn when the value of the STACKED parameter is TRUE and when the Styles menu option is set to Surface, Areas, or LinesAndAreas.
Default: FALSE
Applies to: Contour applet
Tip: To override this parameter, you can specify an ODS style template.
SyntaxDRAWSIDES=TRUE | FALSE
DRILLDOWNFUNCTION Parameterspecifies the name of the JavaScript function that is called in Script drill-down mode.
Alias: DRILLFUNC
Applies to: ActiveX Control, Graph applet, Map applet
SyntaxDRILLDOWNFUNCTION=function-nameDRILLFUNC=function-name
DRILLDOWNMODE Parameterspecifies the drill-down mode.
Defaults: LOCAL for the Graph appletThe Map applet and the ActiveX control do not enable user-selectable drill-down modes.
Applies to: ActiveX Control, Graph applet, Map applet
136 Chapter 9 / ActiveX Control and Java Applet Parameter Dictionary

SyntaxDRILLDOWNMODE=HTML | LOCAL | SCRIPT | URL
Argument ValuesHTML
uses a substitution string to dynamically generate a URL based on the selected chart elements, and then passes the URL to the browser.
LOCALconstructs and displays a new graph based on the data in the previous level of a drill-down graph.
Note LOCAL applies to the Graph applet only.
SCRIPTinvokes the JavaScript function specified in the DRILLDOWNFUNCTION= parameter, and passes into the function data from the selected graph element.
URLprovides static drill-down functionality, using an image map in the HTML file. The image map is generated by ODS when you use the ODS HTML destination with the URL= or HTML= option in SAS/GRAPH.
DRILLPATTERN Parameterspecifies how to construct the drill-down URL when the drill-down mode is HTML.
Applies to: ActiveX Control, Graph applet, Map applet
Tip: The substitution string is constructed with drill-down tags, which are expressed in parameters such as G_DEPV, as described in “Configuring Drill-Down Links with ActiveX” on page 29.You can also use variable substitution as described in “Using Variables as Substitution Strings” on page 72.
SyntaxDRILLPATTERN=substitution-string
DRILLTARGET Parameterspecifies where the drill-down destination is displayed in the browser.
Default: _BLANK, which displays the drill-down destination in a new browser window.
Applies to: ActiveX Control, Graph applet, Map applet
Tip: The target can be specified as another reserved target name or as the name of a window or frame in your web presentation.
DRILLTARGET Parameter 137

SyntaxDRILLTARGET=target
DUPLICATEVALUES Parameterdetermines how the applet handles data values for grid positions that already have a data value.
Default: MEAN
Applies to: Contour applet
SyntaxDUPLICATEVALUES=FIRST | LAST | MAX | MEAN | MIN | NMISS | RANGE | SUM
Argument ValuesCOUNT
stores at each grid location the number of values found for that location.
FIRSTstores the first value found.
LASTstores the last value found.
MAXstores the maximum value found.
MEANstores the mean (average) of all values found.
MINstores the maximum value found.
NMISSstores the number of missing values found.
RANGEstores the range of values found. The range is computed as the maximum value minus the minimum value.
SUMstores the sum of all values found.
FILLPOLYGONEDGES Parameterspecifies whether to adjust rendering to fix a temporary vendor rendering defect.
Applies to: Contour applet
138 Chapter 9 / ActiveX Control and Java Applet Parameter Dictionary

SyntaxFILLPOLYGONEDGES=ALWAYS | NEVER | OS/2
DetailsWhen you set the value to ALWAYS, the adjusted rendering is always performed, regardless of the operating system on which the applet is running. Similarly, if you set the value to NEVER, the adjusted rendering is never performed on any operating system. If the value of this parameter equals the os.name Java system property, then the Contour applet sets the default value of this parameter to OS/2, which enables the polygon edges to be properly rendered. However, this extra drawing effort slows performance. If you set this parameter to the value of the parameter of the name of the operating system returned in os.name, then the adjusted rendering is performed when the applet runs on that operating system because the applet notifies the Java console.
FREQNAME Parameterspecifies a name for a new variable that contains the frequency count when a frequency chart is produced.
Default: Frequency
Applies to: Graph applet
Interaction: This parameter might be overridden if you specify an ODS style template.
SyntaxFREQNAME=variable-name
G_COLOR Parameterspecifies a new color variable for the current drill-down level.
Applies to: ActiveX Control, Graph applet, Map applet
SyntaxG_COLOR=variable-name
G_COLORV Parameterspecifies that the current color variable is the same variable that was used to configure the previous drill-down level.
Applies to: ActiveX Control, Graph applet, Map applet
G_COLORV Parameter 139
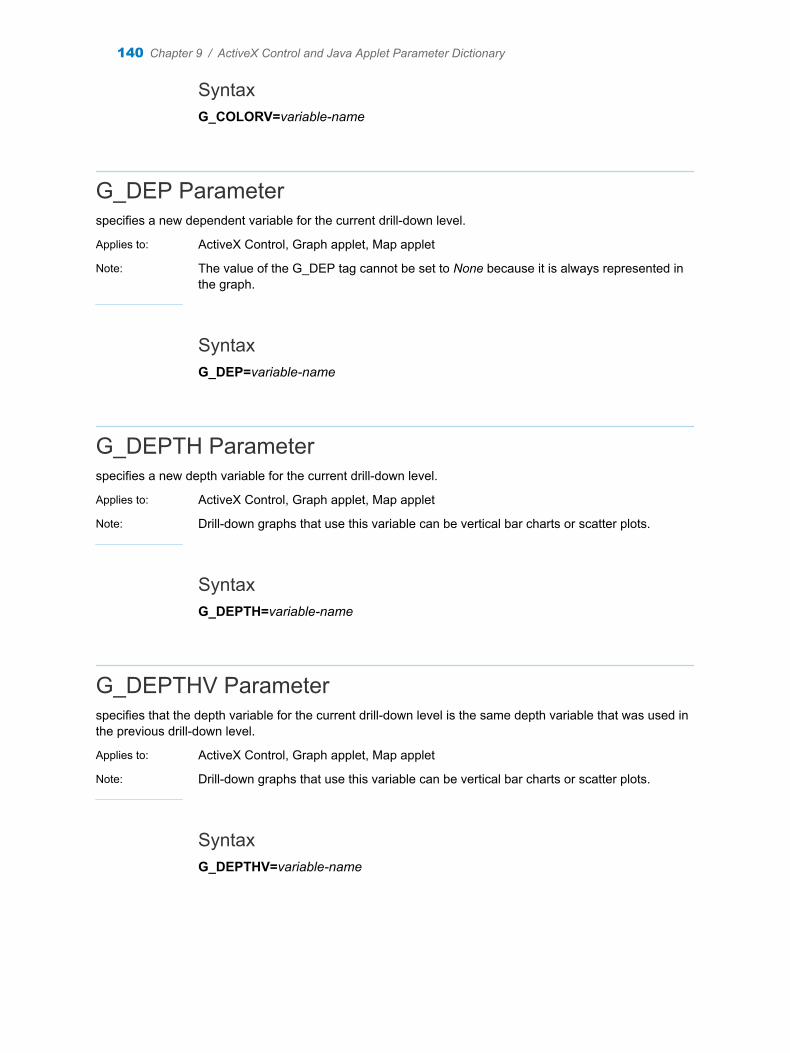
SyntaxG_COLORV=variable-name
G_DEP Parameterspecifies a new dependent variable for the current drill-down level.
Applies to: ActiveX Control, Graph applet, Map applet
Note: The value of the G_DEP tag cannot be set to None because it is always represented in the graph.
SyntaxG_DEP=variable-name
G_DEPTH Parameterspecifies a new depth variable for the current drill-down level.
Applies to: ActiveX Control, Graph applet, Map applet
Note: Drill-down graphs that use this variable can be vertical bar charts or scatter plots.
SyntaxG_DEPTH=variable-name
G_DEPTHV Parameterspecifies that the depth variable for the current drill-down level is the same depth variable that was used in the previous drill-down level.
Applies to: ActiveX Control, Graph applet, Map applet
Note: Drill-down graphs that use this variable can be vertical bar charts or scatter plots.
SyntaxG_DEPTHV=variable-name
140 Chapter 9 / ActiveX Control and Java Applet Parameter Dictionary

G_DEPV Parameterspecifies that the drill-down graph at the specified drill-down level is to use the same dependent variable that was used in the previous drill-down level.
Applies to: ActiveX Control, Graph applet, Map applet
SyntaxG_DEPV=variable-name
G_GROUP Parameterspecifies a new group variable for the current drill-down level.
Applies to: ActiveX Control, Graph applet, Map applet
Note: Drill-down graphs that use this variable can be bar charts.
SyntaxG_GROUP=variable-name
G_GROUPV Parameterspecifies that this group variable should be the same group variable that was used at the previous drill-down level.
Applies to: ActiveX Control, Graph applet, Map applet
Note: Drill-down graphs that use this variable can be bar charts.
SyntaxG_GROUPV=variable-name
G_INDEP Parameterspecifies a new independent variable for the current drill-down level.
Applies to: ActiveX Control, Graph applet, Map applet
Restriction: The values of the G_INDEP tags cannot be set to None because it is always represented in the graph.
G_INDEP Parameter 141

Note: Drill-down graphs that use this variable can be charts and maps.
SyntaxG_INDEP=variable-name
G_INDEPV Parameterspecifies that an independent variable at the current drill-down level is the same variable that was used at the previous drill-down level.
Applies to: ActiveX Control, Graph applet, Map applet
Note: Drill-down graphs that use this variable can be charts and maps.
SyntaxG_INDEPV=variable-name
G_LABEL Parameterspecifies a new label variable for the current drill-down level.
Applies to: Map applet
Note: Drill-down graphs that use this variable can be maps.
SyntaxG_LABEL=variable-name
G_LABELV Parameterspecifies that this label variable should be the same label variable that was used at the previous drill-down level.
Applies to: Map applet
Note: Drill-down graphs that use this variable can be maps.
SyntaxG_LABELV=variable-name
142 Chapter 9 / ActiveX Control and Java Applet Parameter Dictionary

G_SUBGR Parameterspecifies a new subgroup variable for the current drill-down level.
Applies to: ActiveX Control, Graph applet, Map applet
Note: Drill-down graphs that use this variable can be bar charts and scatter plots.
SyntaxG_SUBGR=variable-name
G_SUBGRV Parameterspecifies that a subgroup variable at this drill-down level is the same subgroup variable that was used at the previous drill-down level.
Applies to: ActiveX Control, Graph applet, Map applet
Note: Drill-down graphs that use this variable can be bar charts and scatter plots.
SyntaxG_SUBGRV=variable-name
GRADIENTBACKGROUND Parameterspecifies whether a color gradient is displayed in the window background.
Default: FALSE
Applies to: Graph applet, Map applet, Contour applet
Interaction: This parameter is ignored when the BACKIMAGE parameter is specified.
Tips: To override this parameter, you can specify an ODS style template.Use GRADIENTSTARTCOLOR= and GRADIENTENDCOLOR= parameters to specify the colors that are used to draw the color gradient.
SyntaxGRADIENTBACKGROUND=TRUE | FALSE | VERTICAL | HORIZONTAL
GRADIENTBACKGROUND Parameter 143

Argument ValuesTRUE | VERTICAL | HORIZONTAL
specifies that a color gradient is shown in the window background. Both TRUE and VERTICAL specify a vertical color gradient, where color changes top to bottom from GRADIENTSTARTCOLOR to GRADIENTENDCOLOR. HORIZONTAL specifies a horizontal gradient, where color changes left to right from GRADIENTSTARTCOLOR to GRADIENTENDCOLOR.
FALSEspecifies that a color gradient is not displayed in the window background.
GRADIENTSTARTCOLOR
GRADIENTENDCOLOR Parametersspecify the start color and the end color when two colors are blended in a gradient across a wall, background, or graph element.
Applies to: Graph applet, Map applet, Contour applet
Requirement: The color must be an HTML 3.2 color name or a 6-digit hexadecimal RGB value.
Interaction: This parameter might be overridden if you specify an ODS style template.
SyntaxGRADIENTSTARTCOLOR=colorGRADIENTENDCOLOR=color
HONORASPECT Parameterspecifies whether the aspect of the data being displayed is honored.
Used by: Contour applet
Default: FALSE
Notes: The value FALSE scales the shortest axis (x or y).When this parameter is set to FALSE, certain annotations, such as pies, might be displayed differently in the applet than in SAS.
SyntaxHONORASPECT=TRUE | FALSE
144 Chapter 9 / ActiveX Control and Java Applet Parameter Dictionary

IMAGEPOSX
IMAGEPOSY Parametersspecifies the location of the upper left corner of the background image that is named in the BACKIMAGE= parameter.
Applies to: Graph applet, Map applet, Contour applet
Requirement: These options have effect only when DRAWIMAGE=POSITION.
Note: Positive pixel values are measured from the top left corner of the applet window. Negative pixel values are measured from the bottom right corner of the applet window.
SyntaxIMAGEPOSX=horizontal-pixelsIMAGEPOSY=vertical-pixels
LEGENDFIT Parameterspecifies whether the legend should fit within the height of the contour plot area.
Default: The legend occupies as much of the applet height as is feasible.
Applies to: Contour applet
Interaction: When this parameter is set to TRUE, the LEGENDHEIGHTPERCENT= argument is ignored.
Note: When this parameter is set to TRUE, the height of the legend is restricted to the height of the contour plot within the legend.
SyntaxLEGENDFIT=TRUE | FALSE
LEGENDFONT Parameterspecifies which font to use in the legend.
Applies to: Contour applet
Requirement: Except for the case, the font name must match the name of a Java font available in the browser.
LEGENDFONT Parameter 145

SyntaxLEGENDFONT=font
LEGENDFONTSIZE Parameterspecifies the default size of the font to be used in the legend.
Used by: Contour applet
Requirement: The font size specification must be a positive value.
SyntaxLEGENDFONTSIZE=font-size
LEGENDHEIGHTPERCENT Parameterrestricts the height of the legend to a specified percentage of the height of the Contour applet.
Default: 20
Range: 0 < percentage < 100
Applies to: Contour applet
Note: A vertical margin is always maintained.
SyntaxLEGENDHEIGHTPERCENT=percentage
LEGENDPERCENT Parameterspecifies how much of the Contour applet space (width) to use as the legend area.
Default: 20
Range: 0–80
Applies to: Contour applet
SyntaxLEGENDPERCENT=percentage
146 Chapter 9 / ActiveX Control and Java Applet Parameter Dictionary

LEGENDWIDTHPERCENT Parameterrestricts the width of the legend to a specified percentage of the width of the Contour applet.
Default: 20
Range: 0–80
Applies to: Contour applet
Note: A horizontal margin is always maintained.
SyntaxLEGENDWIDTHPERCENT=percentage
LEVELOFDETAIL Parameterspecifies whether the level-of-detail processing should be used when drawing plots.
Default: TRUE
Applies to: Contour applet
See: LODCOUNT on page 148
SyntaxLEVELOFDETAIL=TRUE | FALSE
LIGHTING Parameterspecifies the position of the light source relative to the position of the graph.
Default: HEADLIGHT, which directs two light sources at the graph from the front-center of the screen.
Applies to: Contour applet
SyntaxLIGHTING=HEADLIGHT | OVERHEAD | NORTHEAST | SOUTHEAST
LIGHTING Parameter 147

LOADFUNC Parameterspecifies the name of a JavaScript method in the HTML output file that loads values and specifications.
Applies to: Graph applet
Restriction: This parameter should not be specified if you are using ODS.
SyntaxLOADFUNC=Java-method
LOCALE Parameterspecifies the language and country to use when displaying locale-sensitive text.
Applies to: Graph applet, Map applet, Contour applet
SyntaxLOCALE=xx_yy<_variant>
Argument ValuesThe values for this parameter are java.util locale specifiers, which are the following.
xxrepresents the required two-digit ISO-639 language code, as defined at the following URL:
http://www.loc.gov/standards/iso639-2/
yyrepresents the required two-digit ISO-3166 country code, as defined at the following URL:
http://www.iso.org/iso/country_codes/iso_3166_code_lists.htm
<_variant>represents the optional variant code, which depends on the browser and operating environment. If a variant is specified, the initial underscore character is required.
LODCOUNT Parameterspecifies the number of cells to use as the level-of-detail threshold.
Default: 2000
148 Chapter 9 / ActiveX Control and Java Applet Parameter Dictionary

Applies to: Contour applet
Interaction: When the number of cells involved in drawing a plot in the applet exceeds this value and level-of-detail processing is on, some cells are ignored when rendering the plot representation.
See: LEVELOFDETAIL on page 147
SyntaxLODCOUNT=number-of-cell(s)
LOGRESOURCES Parameterspecifies whether tag/value pairs in the key definition file are logged to a resource file.
Default: FALSE
Applies to: Metaview applet
See: RESOURCESFONTNAME on page 159
SyntaxLOGRESOURCES=TRUE | FALSE
DetailsThe tag/value pairs are copied out of the key definition file and modified to create a resource file. The resource file is named MVAResources.properties. It enables the Metaview applet text to be translated to another language.
MENUnLABEL Parametersspecifies the text of a custom menu item that is to appear in the pop-up menu at all drill-down levels of a tile chart.
Applies to: Tile Chart applet
Restriction: You cannot specify the MENUnLABEL= and MENUn.mLABEL= parameters together. You must specify one or the other. If you specify both, the MENUnLABEL= parameters take precedence and the MENUn.mLABEL= parameters are ignored.
Requirement: For each MENUnLABEL= parameter that you specify, you must also specify a corresponding MENUnVALUE= parameter.
SyntaxMENUnLABEL=string
MENUnLABEL Parameters 149

Argument Valuesn
specifies the position that this item appears in the pop-up menu.
Requirement The menu positions (n) must be numbered consecutively starting with 1.
stringspecifies the menu item text. You can include variable value placeholders in the menu item text that are replaced with their variable value at run time. Use the WEBLINK_LIST= on page 165 parameter to specify variables that you want to use. Insert the appropriate {&v} placeholder in the text string value where you want each variable value to appear. At run time, each {&v} placeholder is replaced with its variable value.
MENUnVALUE Parametersspecifies the action for a MENUnLABEL= parameter.
Applies to: Tile Chart applet
See: “Specifying Custom Items in the Chart Pop-Up Menu” in SAS/GRAPH: Reference
Example: The following example specifies menu items “View Sales Chart” and “View Sales Report” in the pop-up menu at all drill-down levels. When selected, these items open the URL to the appropriate web resource.
ods html file="filename" parameters=( "MENU1LABEL"="View Sales Chart" "MENU1VALUE"="http://www.xyz.com/sales/chart.html" "MENU2LABEL"="View Sales Report" "MENU2VALUE"="http://www.xyz.com/sales/report.html");
SyntaxMENUnVALUE=URL-string
Argument ValuesURL-string
specifies the action for menu item n. Typically, the action is the URL of a web resource.
MENUn.mLABEL Parametersspecifies the label for a custom menu item that is to appear in the pop-up menu at a specific drill-down level of a tile chart.
Applies to: Tile Chart applet
150 Chapter 9 / ActiveX Control and Java Applet Parameter Dictionary

Restriction: You cannot specify the MENUn.mLABEL= and MENUnLABEL= parameters together. You must specify one or the other. If you specify both, the MENUnLABEL= parameters take precedence and the MENUn.mLABEL= parameters are ignored.
Requirement: For each MENUn.mLABEL= parameter that you specify, you must also specify a corresponding MENUn.mVALUE= parameter.
See: “Specifying Custom Items in the Chart Pop-Up Menu” in SAS/GRAPH: Reference
SyntaxMENUn.mLABEL=string
Argument Valuesn
specifies the position that this item appears in the pop-up menu.
Requirement The menu positions (n) must be numbered consecutively starting with 1.
mspecifies the drill-down level at which this menu item is to appear in the pop-up menu.
Range 1 to the number of actual drill-down levels in the chart, where 1 is the top-most level (initial view)
Interaction This parameter is ignored if m is not valid for the chart.
stringspecifies the menu item text. You can include variable value placeholders in the menu item text that are replaced with their variable value at run time. Use the WEBLINK_LIST on page 165 parameter to specify variables that you want to use. Insert the appropriate {&v} placeholder in the text string value where you want each variable value to appear. At run time, each {&v} placeholder is replaced with its variable value.
MENUn.mVALUE Parametersspecifies the action for a MENUn.mLABEL= parameter.
Applies to: Tile Chart applet
Interaction: This parameter is ignored if m is not valid for the chart.
See: “Specifying Custom Items in the Chart Pop-Up Menu” in SAS/GRAPH: Reference
Example: The following example specifies two custom menu items in the pop-up menu for each of three drill-down levels in a tile chart. From level 1 down to level 3, the tile chart displays total sales data, regional sales data, and state sales data. At each level, the first menu item opens the URL to a sales chart, which summarizes the sales data at that level. The second item opens the URL to a corresponding detailed report.
ods html path="output-path" file="html-filename.htm" parameters=( "MENU1.1LABEL"="View Sales Chart"
MENUn.mVALUE Parameters 151

"MENU1.1VALUE"="http://www.xyz.com/total_chart.html" "MENU2.1LABEL"="View Sales Report" "MENU2.1VALUE"="http://www.xyz.com/total_report.html" "MENU1.2LABEL"="View Regional Sales Chart" "MENU1.2VALUE"="http://www.xyz.com/regional_chart.html" "MENU2.2LABEL"="View Regional Sales Report" "MENU2.2VALUE"="http://www.xyz.com/regional_report.html" "MENU1.3LABEL"="View State Sales Chart" "MENU1.3VALUE"="http://www.xyz.com/state_chart.html" "MENU2.3LABEL"="View State Sales Report" "MENU2.3VALUE"="http://www.xyz.com/state_report.html");
SyntaxMENUn.mVALUE=URL-string
Argument ValuesURL-string
specifies the action for menu item n at drill-down level m. Typically, the action is the URL of a web resource.
MENUREMOVE Parameterremoves one or more items from the Graph applet or Map applet menu.
Applies to: Graph applet, Map applet
SyntaxMENUREMOVE=menu-item(s)
Argument Valuesmenu-item(s)
specifies the menu items that are to be removed. Here is the syntax of menu-item(s):
menu1-item<.menu2-item... .menuN-item, menu–item2, ...menu-itemN>
Menu items are specified using the text that is displayed by the applet, with the blank spaces removed. You do not need to match the case. A period (“.”) separates menu levels in a menu path. The last item specified in a menu path is the item that is removed. Commas separate multiple menu items and menu paths.
DetailsTo remove one or more menu items, first, generate the graph without the MENUREMOVE= parameter. Next, open the applet menu and note the path to the
152 Chapter 9 / ActiveX Control and Java Applet Parameter Dictionary

menu items that you want to remove. Finally, specify the path to those items in the MENUREMOVE= parameter value. For example, suppose that you want to remove the Pie and Plot items from the Graph applet Chart Type menu shown in the following figure.
To remove these items, include the MENUREMOVE= parameter shown in the following example in your ODS HTML statement.
ods html path="output-path" file="html-filename.htm" parameters=("MENUREMOVE"="CHARTTYPE.PIE,CHARTTYPE.PLOT");
METACODES Parameteridentifies a text file that contains metagraphics codes, or it provides inline metagraphics codes.
Applies to: Metaview applet
Note: The file specification is an absolute or relative URL.
SyntaxMETACODES=codes-or-file-specification
METACODES1–METACODESn Parametersidentifies additional metacode specifications when you need to identify more than one file or more than one set of inline metagraphics codes.
Applies to: Metaview applet
SyntaxMETACODES1–METACODESn=codes-or-file-specification
METACODES1–METACODESn Parameters 153

METACODESLABEL
METACODES1LABEL–METACODESnLABEL Parametersnames the text labels that are used to identify the graphs specified in the METACODES= and METACODESn= parameters.
Applies to: Metaview applet
Requirements: The METACODESLABEL parameters must be specified sequentially (METACODESLABEL, METACODES1LABEL, METACODES2LABEL, and so on).If the METACODES and METACODESn parameters are specified, there should be as many METACODESLABEL parameters as there are METACODESn parameters.
Note: The applet displays the labels in an embedded graph-selection control.
SyntaxMETACODESLABEL=menu-labelMETACODES1LABEL–METACODESnLABEL=menu-label
MINLEGENDFONTSIZE Parameterspecifies the minimum font to be used when attempting to fit the legend in the available applet area.
Applies to: Contour applet
Requirement: Values must be positive integers.
SyntaxMINLEGENDFONTSIZE=font-size
MISSINGCOLOR Parameterspecifies a color that is to be used to draw missing values.
Default: Black
Applies to: Contour applet
Requirement: The color value must be a valid HTML 3.2 color name or 6-digit hexadecimal RGB value.
154 Chapter 9 / ActiveX Control and Java Applet Parameter Dictionary

SyntaxMISSINGCOLOR=color
NAME Attributespecifies the name for this instance of the applet.
Applies to: Graph applet, Map applet, Contour applet
Interaction: This attribute might be overridden if you specify an ODS style template.
Tip: Use this attribute only if you have more than one instance of the APPLET tag in your HTML file, and if you have included your own scripts or DHTML that communicates with or acts on a particular instance of the applet.
SyntaxNAME=applet-name
NAVIGATERENDERMODE Parameterspecifies how to render the graph during pan, rotate, and zoom.
Default: WIREFRAME
Applies to: Contour applet
Requirement: The RENDERQUALITY= parameter must be set to CUSTOM for this parameter to have any effect.
Interaction: This parameter might be overridden if you specify an ODS style template.
SyntaxNAVIGATERENDERMODE=NONE | POINT | SOLID | WIREFRAME
NOJSOOBJECT Parameterspecifies that no JavaScript callback options can be created or used within the applet.
Applies to: Graph applet
Interaction: This parameter might be overridden if you specify an ODS style template.
SyntaxNOJSOOBJECT
NOJSOOBJECT Parameter 155

OUTLINES Parameterspecifies whether outlines should be drawn for the current contour style.
Applies to: Contour applet
Requirement: For OUTLINES=TRUE to have any effect, the Styles menu option must be set to Area, Block, or Surface.
SyntaxOUTLINES=TRUE | FALSE
OVERFLOWCOLOR Parameterspecifies a color that is assigned to data values that exceed the maximum range of colors that have been defined in the style or color list.
Default: CYAN
Applies to: Contour applet
Requirement: The color value must be a valid HTML 3.2 color name or a 6-digit hexadecimal RGB color specification.
SyntaxOVERFLOWCOLOR=color
PATTERNSTRIP Parameterremoves preceding and trailing white space from drill-down substitution patterns before the substituted text is added into a dynamically generated drill-down URL.
Default: FALSE
Applies to: ActiveX Control, Graph applet, Map applet
SyntaxPATTERNSTRIP=TRUE | FALSE
156 Chapter 9 / ActiveX Control and Java Applet Parameter Dictionary

PROJECTION Parameterspecifies the type of projection that is used to draw contours.
Default: ORTHOGRAPHIC
Applies to: Contour applet
SyntaxPROJECTION=ORTHOGRAPHIC | PERSPECTIVE
PROJECTIONRATIO Parameterspecifies the ratio of the plot area (applet size minus legend reserve) to the longest dimension of the plot.
Default: 1.5
Applies to: Contour applet
Requirement: Values must be greater than or equal to 1.0.
Example: Specifying a value of 2.0 means that the area that contains the contour plot is twice the size of the longest plot dimension. This guarantees that the plot is surrounded by a space that measures half the length of the longest projection (not including axes).
SyntaxPROJECTIONRATIO=plot-size-ratio
RENDERMODE Parameterspecifies how to render the contours when you are not navigating (panning, rotating, or zooming) the Contour applet.
Default: SOLID
Applies to: Contour applet
Note: In some cases, changing the representation can provide additional information about the image, such as more clearly displaying cell boundaries.
SyntaxRENDERMODE=POINT | SOLID | WIREFRAME
RENDERMODE Parameter 157

Argument ValuesHere are the valid values for the polygon representations that determine how the Contour applet image can be drawn:
POINTdraws polygons using only single-pixel points at the polygon vertices.
SOLIDdraws filled polygons.
WIREFRAMEdraws polygons using only lines to represent their edges.
RENDEROPTIMIZE Parametersets the default for rendering optimization for the Contour applet.
Defaults: When RENDERQUALITY=BESTQUALITY, the default is NEVER.When RENDERQUALITY=FASTERNAVIGATION, the default is ONNAVIGATION.When RENDERQUALITY=BESTPERFORMANCE, the default is ALWAYS
Applies to: Contour applet
Requirement: The RENDERQUALITY= parameter must be set to CUSTOM for this parameter to have any effect.
SyntaxRENDEROPTIMIZE=ALWAYS | NAVIGATION | NEVER | ONNAVIGATION
DetailsTo correctly render images, the applet must first sort the polygons that comprise the image. Some polygons require additional sorting steps to ensure that they are correctly drawn. In many cases, these additional steps are unnecessary because they only slow applet performance and do not add to image quality. This parameter lets you specify if and when the applet should attempt to optimize or reduce the number of sorting operations to be performed.
RENDERQUALITY Parameterspecifies how two available rendering algorithms, one slower and one faster, are applied to the graph.
Default: FASTERNAVIGATION | NAVIGATION
Applies to: Map applet, Contour applet
Interaction: This parameter might be overridden if you specify an ODS style template.
158 Chapter 9 / ActiveX Control and Java Applet Parameter Dictionary

SyntaxRENDERQUALITY=BESTPERFORMANCE | BESTQUALITY | FASTERNAVIGATION | CUSTOM
Argument ValuesBESTPERFORMANCE
always uses the faster, less complex rendering algorithm.
Alias PERFORMANCE
BESTQUALITYalways uses the slower, more complex rendering algorithm.
Alias QUALITY
FASTERNAVIGATIONuses the faster, less complex rendering algorithm during pan, rotate, and zoom, and uses the more complex algorithm otherwise.
Alias NAVIGATION
CUSTOMlets the user select individual elements that control speed and quality directly, rather than as a group when rendering an image.
Restriction CUSTOM applies to the Contour applet only.
RESOURCESFONTNAME Parameterspecifies the name of the font family that is used to display the resource values in a user-defined resource file.
Applies to: Metaview applet
See: LOGRESOURCES on page 149
SyntaxRESOURCESFONTNAME=font-name
DetailsThe applet first tries to use the specified font-name, then it tries to use the SansSerif font, then it tries to use the Serif font, then it uses the first font that is returned by the Java.Awt.Toolkit. The first font that is found is the font that is used.
SHOWBACKDROP Parameterspecifies whether all walls (including the floor) should be displayed.
SHOWBACKDROP Parameter 159

Applies to: Graph applet, Contour applet
Interaction: This parameter overrides any ODS settings.
SyntaxSHOWBACKDROP=TRUE | FALSE
SIMPLEDEPTHSORT Parameterspecifies whether the simpler polygon sorting algorithm is used when rendering the plot.
Default: TRUE
Applies to: Contour applet
SyntaxSIMPLEDEPTHSORT=TRUE | FALSE
SIMPLETHRESHOLD Parameterspecifies an integer for the threshold that is used to determine whether the graph should be rendered using simple geometry.
Default: 500
Applies to: Graph applet
Note: if you select and display a subset of the graph, and if the number of elements in the resulting graph drops below the value of the SIMPLETHRESHOLD parameter, regular markers are drawn and the Shape menu is made available.
SyntaxSIMPLETHRESHOLD=number-of-elements | NEVER
DetailsFor bar charts, simple geometry means that graphical elements are represented as lines. For plots, simple geometry means that graphical elements are represented as plus signs (+). If the graph contains a number of elements that is greater than the SIMPLETHRESHOLD= parameter value, simple geometry is used and the Shape menu is made unavailable.
NEVER specifies that simple geometry is never used and the Shape menu is always available.
160 Chapter 9 / ActiveX Control and Java Applet Parameter Dictionary

STACKED Parameterspecifies whether the contours should be displayed in stacked form, where height is added to the contour plot based on the contour level.
Default: FALSE
Applies to: Contour applet
Requirement: For this option to have any effect, the Style menu option must be set to Areas or LinesAndAreas.
See: DRAWSIDES on page 136
SyntaxSTACKED=TRUE | FALSE
STACKPERCENT Parameterspecifies the maximum stacking height as a percentage of the longest axis.
Default: 30
Applies to: Contour applet
SyntaxSTACKPERCENT=height-percentage
SURFACESIDECOLOR Parameterspecifies the color of the sides of a contour plot when that plot uses multiple colors.
Default: The color of the minimum data value.
Applies to: Contour applet
Requirement: The value must be an HTML 3.2 color name or a 6-digit hexadecimal RGB value.
Interaction: The value of the parameter is ignored when drawing a surface plot in a single color.
SyntaxSURFACESIDECOLOR=color
SURFACESIDECOLOR Parameter 161

TIPBACKCOLOR Parameterspecifies a color for the background of the data tips.
Default: YELLOW
Applies to: Contour applet
Requirement: The color value must be a valid HTML 3.2 color name or a 6-digit hexadecimal RGB value.
SyntaxTIPBACKCOLOR=color
TIPBORDERCOLOR Parameterspecifies a color for the border of the data tips.
Default: BLACK
Applies to: Contour applet
Requirement: The color value must be a valid HTML 3.2 color name or a 6-digit hexadecimal RGB value.
SyntaxTIPBORDERCOLOR=color
TIPS Parameterspecifies whether to display data tips.
Applies to: ActiveX Control, Graph applet, Map applet, Contour applet
SyntaxTIPS=NONE | STATIONARY | TRUE | FALSE
Argument ValuesNONE | FALSE
specifies that data tips are to be disabled. NONE is valid for the Graph applet and the Map applet. FALSE is valid for the Contour applet and the ActiveX Control.
162 Chapter 9 / ActiveX Control and Java Applet Parameter Dictionary

STATIONARY | TRUEspecifies that data tips are to be enabled. STATIONARY is valid for the Graph applet and the Map applet. TRUE is valid for the Contour applet and the ActiveX Control.
TIPMODE Parameterspecifies which of two types of data tips are to be displayed.
Default: STANDARD
Applies to: ActiveX Control
SyntaxTIPMODE=STANDARD | HTML | TABULAR | ALL
Argument ValuesHTML
displays only the data tips that are indicated by the HTML= statement option.
TABULARdisplay only the data tips that are indicated by the value of the TIPS parameter.
STANDARD | ALLdisplays both sets of data tips.
DetailsOne set of data tips is specified with the TIPS parameter. The other set of data tips is specified with the HTML= statement option. The syntax of that option is HTML="TITLE='text' | variable-name". For further information about data tips, see “Data Tips for Web Presentations” in SAS/GRAPH: Reference.
TIPSTEMSIZE Parameterspecifies the length in pixels of the line that connects the data tips to the graph element that uses that data.
Default: 20
Applies to: Contour applet
SyntaxTIPSTEMSIZE=line-length
TIPSTEMSIZE Parameter 163

TIPTEXTCOLOR Parameterspecifies a color for the text in the data tips.
Default: Black
Applies to: Contour applet
Requirement: The color value must be a valid HTML 3.2 color name or a 6-digit hexadecimal RGB value.
SyntaxTIPTEXTCOLOR=color
UNDERFLOWCOLOR Parameterspecifies a color that is assigned to data values that are smaller than the minimum range of colors that have been defined in the style or color list.
Default: White
Applies to: Contour applet
Requirement: The color value must be a valid HTML 3.2 color name or a 6-digit hexadecimal RGB value.
SyntaxUNDERFLOWCOLOR=color
USERFMT Parameterdefines the user format specification.
Applies to: Contour applet
SyntaxUSERFMTn=string(s)
DetailsThe syntax is the same as that of the VALUE and PICTURE statements for PROC FORMAT. You can specify multiple USERFMTn parameters by replacing n with the appropriate number from 1 to n, where n is the number of format parameters to be
164 Chapter 9 / ActiveX Control and Java Applet Parameter Dictionary

defined. For example, to define a simple YESNO format, specify the parameter <PARAM NAME="USERFMT1" VALUE="VALUE YESNO 1='Yes' 2='No' ">.
VIEW2D Parameterindicates whether the view point should be locked to two dimensions.
Defaults: TRUE for the Contour appletFALSE for the Graph applet and the ActiveX Control
Applies to: ActiveX Control, Graph applet, Contour applet
Interaction: This parameter might be overridden if you specify an ODS style template.
SyntaxVIEW2D=TRUE | FALSE
VIEWPOINT Parameterdefines the initial viewpoint for the Contour applet.
Defaults: 2D for GCONTOUR statement outputSOUTHEAST for G3D statement output
Applies to: Contour applet
Note: The value SE or SOUTHEAST sets the initial viewpoint to Southeast, a three-dimensional viewpoint.
Tip: Setting this parameter unlocks the 2–D view.
See: VIEW2D
SyntaxVIEWPOINT=2D | SE | SOUTHEAST
WEBLINK_LIST Parameterspecifies the variables by name that are referenced in the MENUnVALUE and MENUn.mVALUE parameter values.
Applies to: Tile Chart applet
Requirement: The variables listed in the WEBLINK_LIST= parameter must also be listed in the TILEBY= option in the PROC GTILE statement for the tile chart.
See: “MENUnLABEL Parameters” on page 149“MENUn.mLABEL Parameters” on page 150
WEBLINK_LIST Parameter 165

“Specifying Custom Items in the Chart Pop-Up Menu” in SAS/GRAPH: Reference
Example: The following example inserts the value of variable REGION in the WEBLINK_LIST= variable list into a custom menu value:
ods html file=filename.html parameters=( "WEBLINK_LIST" = "country, region, division" "MENU1VALUE" = "Total Sales for the {&2} Region");
SyntaxWEBLINK_LIST=variable-1<, variable-2, …>
DetailsThe variables are one or more variables that are specified in the PROC GTILE statement TILEBY= option. See “GTILE Procedure” in SAS/GRAPH: Reference. For multiple variables, each variable is separated by a comma. The value of the variables can be inserted into the MENUnVALUE and MENUn.mVALUE parameter by inserting a {&v} variable placeholder in the label value where you want the variable value to appear. v is the position of the variable in the WEBLINK_LIST= list, which starts with 1. You can insert as many variable placeholders as you want. At run time, each {&v} placeholder is replaced with its variable value.
XBINS
YBINS Parametersconfigures the bins uses to generate a contour plot.
Applies to: Contour applet
Requirement: When specifying a single integer, the value must be greater than 2.
Notes: Specifying a single integer uses that number of bins. Specifying multiple values uses multiple bins with those values.Multiple values are real numbers that are separated by semicolons, as follows:
ods html file=filename.html parameters=( "XBINS"="-1;0;2.5;3.5;4" "YBINS"="1;2;3;4;5;6");
SyntaxXBINS=bin-number-or-valuesYBINS=bin-number-or-values
166 Chapter 9 / ActiveX Control and Java Applet Parameter Dictionary
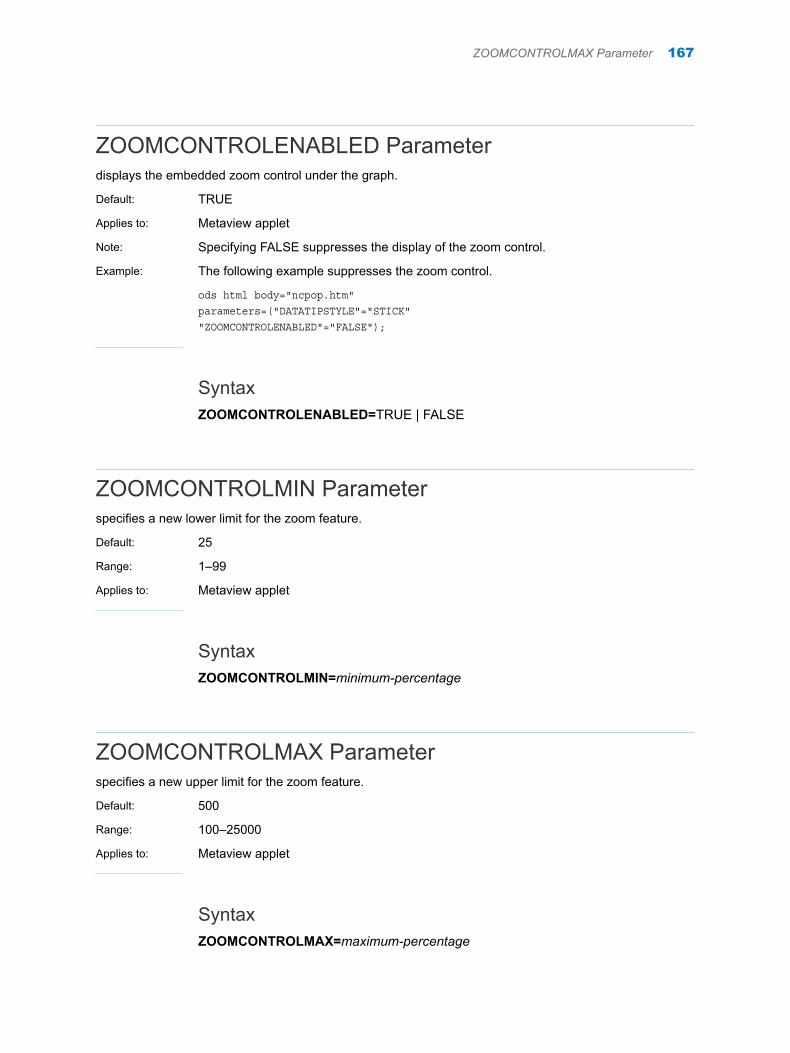
ZOOMCONTROLENABLED Parameterdisplays the embedded zoom control under the graph.
Default: TRUE
Applies to: Metaview applet
Note: Specifying FALSE suppresses the display of the zoom control.
Example: The following example suppresses the zoom control.
ods html body="ncpop.htm" parameters=("DATATIPSTYLE"="STICK" "ZOOMCONTROLENABLED"="FALSE");
SyntaxZOOMCONTROLENABLED=TRUE | FALSE
ZOOMCONTROLMIN Parameterspecifies a new lower limit for the zoom feature.
Default: 25
Range: 1–99
Applies to: Metaview applet
SyntaxZOOMCONTROLMIN=minimum-percentage
ZOOMCONTROLMAX Parameterspecifies a new upper limit for the zoom feature.
Default: 500
Range: 100–25000
Applies to: Metaview applet
SyntaxZOOMCONTROLMAX=maximum-percentage
ZOOMCONTROLMAX Parameter 167

168 Chapter 9 / ActiveX Control and Java Applet Parameter Dictionary

10DS2CONST and DS2TREE Macro Argument Dictionary
About the DS2CONST and DS2TREE Macro Arguments . . . . . . . . . . . . . . . . . . . . . . . 172
Arguments for the APPLET Tag . . . . . . . . . . . . . . . . . . . . . . . . . . . . . . . . . . . . . . . . . . . . . . . 172
Arguments for Data Definition . . . . . . . . . . . . . . . . . . . . . . . . . . . . . . . . . . . . . . . . . . . . . . . . . 173
Arguments for HTML and XML File Information . . . . . . . . . . . . . . . . . . . . . . . . . . . . . . . . 177
Arguments for Diagram Appearance . . . . . . . . . . . . . . . . . . . . . . . . . . . . . . . . . . . . . . . . . . 178
Arguments for Page Formatting . . . . . . . . . . . . . . . . . . . . . . . . . . . . . . . . . . . . . . . . . . . . . . . 181
Arguments for Style Sheets . . . . . . . . . . . . . . . . . . . . . . . . . . . . . . . . . . . . . . . . . . . . . . . . . . . 182
Arguments for the SAS TITLE and FOOTNOTE Tags . . . . . . . . . . . . . . . . . . . . . . . . . . . 183
Arguments for Character Transcoding . . . . . . . . . . . . . . . . . . . . . . . . . . . . . . . . . . . . . . . . 184
Reserved Names . . . . . . . . . . . . . . . . . . . . . . . . . . . . . . . . . . . . . . . . . . . . . . . . . . . . . . . . . . . . . . 184
Dictionary . . . . . . . . . . . . . . . . . . . . . . . . . . . . . . . . . . . . . . . . . . . . . . . . . . . . . . . . . . . . . . . . . . . . . 185ACTION Macro Argument . . . . . . . . . . . . . . . . . . . . . . . . . . . . . . . . . . . . . . . . . . . . . . . . . . . 185AHUNITS Macro Argument . . . . . . . . . . . . . . . . . . . . . . . . . . . . . . . . . . . . . . . . . . . . . . . . . . 186ALIGN Macro Argument . . . . . . . . . . . . . . . . . . . . . . . . . . . . . . . . . . . . . . . . . . . . . . . . . . . . . 186ALT Macro Argument . . . . . . . . . . . . . . . . . . . . . . . . . . . . . . . . . . . . . . . . . . . . . . . . . . . . . . . . 186ANGLE Macro Argument . . . . . . . . . . . . . . . . . . . . . . . . . . . . . . . . . . . . . . . . . . . . . . . . . . . . 187ARCHIVE Macro Argument . . . . . . . . . . . . . . . . . . . . . . . . . . . . . . . . . . . . . . . . . . . . . . . . . . 187AWUNITS Macro Argument . . . . . . . . . . . . . . . . . . . . . . . . . . . . . . . . . . . . . . . . . . . . . . . . . . 188BDCLASS Macro Argument . . . . . . . . . . . . . . . . . . . . . . . . . . . . . . . . . . . . . . . . . . . . . . . . . 189BG Macro Argument . . . . . . . . . . . . . . . . . . . . . . . . . . . . . . . . . . . . . . . . . . . . . . . . . . . . . . . . 189BGTYPE Macro Argument . . . . . . . . . . . . . . . . . . . . . . . . . . . . . . . . . . . . . . . . . . . . . . . . . . . 189BORDER Macro Argument . . . . . . . . . . . . . . . . . . . . . . . . . . . . . . . . . . . . . . . . . . . . . . . . . . 190BRTITLE Macro Argument . . . . . . . . . . . . . . . . . . . . . . . . . . . . . . . . . . . . . . . . . . . . . . . . . . . 190CATEXT Macro Argument . . . . . . . . . . . . . . . . . . . . . . . . . . . . . . . . . . . . . . . . . . . . . . . . . . . 190CBACK Macro Argument . . . . . . . . . . . . . . . . . . . . . . . . . . . . . . . . . . . . . . . . . . . . . . . . . . . . 191CENTER Macro Argument . . . . . . . . . . . . . . . . . . . . . . . . . . . . . . . . . . . . . . . . . . . . . . . . . . . 191CHANDLE Macro Argument . . . . . . . . . . . . . . . . . . . . . . . . . . . . . . . . . . . . . . . . . . . . . . . . . 191CHARSET Macro Argument . . . . . . . . . . . . . . . . . . . . . . . . . . . . . . . . . . . . . . . . . . . . . . . . . 192CLINK Macro Argument . . . . . . . . . . . . . . . . . . . . . . . . . . . . . . . . . . . . . . . . . . . . . . . . . . . . . 192CNODE Macro Argument . . . . . . . . . . . . . . . . . . . . . . . . . . . . . . . . . . . . . . . . . . . . . . . . . . . . 192CODEBASE Macro Argument . . . . . . . . . . . . . . . . . . . . . . . . . . . . . . . . . . . . . . . . . . . . . . . 193COLORMAP Macro Argument . . . . . . . . . . . . . . . . . . . . . . . . . . . . . . . . . . . . . . . . . . . . . . . 193CSELECT Macro Argument . . . . . . . . . . . . . . . . . . . . . . . . . . . . . . . . . . . . . . . . . . . . . . . . . 193CTEXT Macro Argument . . . . . . . . . . . . . . . . . . . . . . . . . . . . . . . . . . . . . . . . . . . . . . . . . . . . 194CUTOFF Macro Argument . . . . . . . . . . . . . . . . . . . . . . . . . . . . . . . . . . . . . . . . . . . . . . . . . . . 194
169

DATATYPE Macro Argument . . . . . . . . . . . . . . . . . . . . . . . . . . . . . . . . . . . . . . . . . . . . . . . . 195DEPTH Macro Argument . . . . . . . . . . . . . . . . . . . . . . . . . . . . . . . . . . . . . . . . . . . . . . . . . . . . 195DOCTYPE Macro Argument . . . . . . . . . . . . . . . . . . . . . . . . . . . . . . . . . . . . . . . . . . . . . . . . . 195DRILTARG Macro Argument . . . . . . . . . . . . . . . . . . . . . . . . . . . . . . . . . . . . . . . . . . . . . . . . . 196DUPCHECK Macro Argument . . . . . . . . . . . . . . . . . . . . . . . . . . . . . . . . . . . . . . . . . . . . . . . 196ENCODE Macro Argument . . . . . . . . . . . . . . . . . . . . . . . . . . . . . . . . . . . . . . . . . . . . . . . . . . 197FACTOR Macro Argument . . . . . . . . . . . . . . . . . . . . . . . . . . . . . . . . . . . . . . . . . . . . . . . . . . . 197FCLASS TCLASS Macro Arguments . . . . . . . . . . . . . . . . . . . . . . . . . . . . . . . . . . . . . . . . . 198FCOLOR TCOLOR Macro Arguments . . . . . . . . . . . . . . . . . . . . . . . . . . . . . . . . . . . . . . . . 198FFACE TFACE Macro Arguments . . . . . . . . . . . . . . . . . . . . . . . . . . . . . . . . . . . . . . . . . . . . 198FISHEYE Macro Argument . . . . . . . . . . . . . . . . . . . . . . . . . . . . . . . . . . . . . . . . . . . . . . . . . . 199FNTNAME Macro Argument . . . . . . . . . . . . . . . . . . . . . . . . . . . . . . . . . . . . . . . . . . . . . . . . . 199FNTSIZE Macro Argument . . . . . . . . . . . . . . . . . . . . . . . . . . . . . . . . . . . . . . . . . . . . . . . . . . 200FNTSTYL Macro Argument . . . . . . . . . . . . . . . . . . . . . . . . . . . . . . . . . . . . . . . . . . . . . . . . . . 200FSIZE TSIZE Macro Arguments . . . . . . . . . . . . . . . . . . . . . . . . . . . . . . . . . . . . . . . . . . . . . . 200FTAG TTAG Macro Arguments . . . . . . . . . . . . . . . . . . . . . . . . . . . . . . . . . . . . . . . . . . . . . . . 201HEIGHT Macro Argument . . . . . . . . . . . . . . . . . . . . . . . . . . . . . . . . . . . . . . . . . . . . . . . . . . . 207HSPACE Macro Argument . . . . . . . . . . . . . . . . . . . . . . . . . . . . . . . . . . . . . . . . . . . . . . . . . . . 207HTMLFILE Macro Argument . . . . . . . . . . . . . . . . . . . . . . . . . . . . . . . . . . . . . . . . . . . . . . . . . 208HTMLFREF Macro Argument . . . . . . . . . . . . . . . . . . . . . . . . . . . . . . . . . . . . . . . . . . . . . . . . 208IBACKLOC Macro Argument . . . . . . . . . . . . . . . . . . . . . . . . . . . . . . . . . . . . . . . . . . . . . . . . 208IBACKPOS Macro Argument . . . . . . . . . . . . . . . . . . . . . . . . . . . . . . . . . . . . . . . . . . . . . . . . 209IBACKURL Macro Argument . . . . . . . . . . . . . . . . . . . . . . . . . . . . . . . . . . . . . . . . . . . . . . . . . 209IBACKX IBACKY Macro Arguments . . . . . . . . . . . . . . . . . . . . . . . . . . . . . . . . . . . . . . . . . . 210LABELS Macro Argument . . . . . . . . . . . . . . . . . . . . . . . . . . . . . . . . . . . . . . . . . . . . . . . . . . . 210LAYOUT Macro Argument . . . . . . . . . . . . . . . . . . . . . . . . . . . . . . . . . . . . . . . . . . . . . . . . . . . 210LCOLFMT Macro Argument . . . . . . . . . . . . . . . . . . . . . . . . . . . . . . . . . . . . . . . . . . . . . . . . . 211LCOLOR Macro Argument . . . . . . . . . . . . . . . . . . . . . . . . . . . . . . . . . . . . . . . . . . . . . . . . . . . 211LCOLVAL Macro Argument . . . . . . . . . . . . . . . . . . . . . . . . . . . . . . . . . . . . . . . . . . . . . . . . . . 212LDATA Macro Argument . . . . . . . . . . . . . . . . . . . . . . . . . . . . . . . . . . . . . . . . . . . . . . . . . . . . . 212LFROM Macro Argument . . . . . . . . . . . . . . . . . . . . . . . . . . . . . . . . . . . . . . . . . . . . . . . . . . . . 212LINKTYPE Macro Argument . . . . . . . . . . . . . . . . . . . . . . . . . . . . . . . . . . . . . . . . . . . . . . . . . 213LPT Macro Argument . . . . . . . . . . . . . . . . . . . . . . . . . . . . . . . . . . . . . . . . . . . . . . . . . . . . . . . 213LSTIP Macro Argument . . . . . . . . . . . . . . . . . . . . . . . . . . . . . . . . . . . . . . . . . . . . . . . . . . . . . 213LSTIPFAC Macro Argument . . . . . . . . . . . . . . . . . . . . . . . . . . . . . . . . . . . . . . . . . . . . . . . . . 214LTIP Macro Argument . . . . . . . . . . . . . . . . . . . . . . . . . . . . . . . . . . . . . . . . . . . . . . . . . . . . . . . 214LTIPFMT Macro Argument . . . . . . . . . . . . . . . . . . . . . . . . . . . . . . . . . . . . . . . . . . . . . . . . . . . 214LTO Macro Argument . . . . . . . . . . . . . . . . . . . . . . . . . . . . . . . . . . . . . . . . . . . . . . . . . . . . . . . 215LVALUE Macro Argument . . . . . . . . . . . . . . . . . . . . . . . . . . . . . . . . . . . . . . . . . . . . . . . . . . . 215LWHERE Macro Argument . . . . . . . . . . . . . . . . . . . . . . . . . . . . . . . . . . . . . . . . . . . . . . . . . . 215LWIDTH Macro Argument . . . . . . . . . . . . . . . . . . . . . . . . . . . . . . . . . . . . . . . . . . . . . . . . . . . 216MAKEHTML Macro Argument . . . . . . . . . . . . . . . . . . . . . . . . . . . . . . . . . . . . . . . . . . . . . . . 216MAKEXML Macro Argument . . . . . . . . . . . . . . . . . . . . . . . . . . . . . . . . . . . . . . . . . . . . . . . . . 217MINLNKWT Macro Argument . . . . . . . . . . . . . . . . . . . . . . . . . . . . . . . . . . . . . . . . . . . . . . . . 217NACTION Macro Argument . . . . . . . . . . . . . . . . . . . . . . . . . . . . . . . . . . . . . . . . . . . . . . . . . . 217NAME Macro Argument . . . . . . . . . . . . . . . . . . . . . . . . . . . . . . . . . . . . . . . . . . . . . . . . . . . . . 218NCOLFMT Macro Argument . . . . . . . . . . . . . . . . . . . . . . . . . . . . . . . . . . . . . . . . . . . . . . . . . 219NCOLOR Macro Argument . . . . . . . . . . . . . . . . . . . . . . . . . . . . . . . . . . . . . . . . . . . . . . . . . . 219NCOLVAL Macro Argument . . . . . . . . . . . . . . . . . . . . . . . . . . . . . . . . . . . . . . . . . . . . . . . . . . 219NDATA Macro Argument . . . . . . . . . . . . . . . . . . . . . . . . . . . . . . . . . . . . . . . . . . . . . . . . . . . . 220NFNTNAME Macro Argument . . . . . . . . . . . . . . . . . . . . . . . . . . . . . . . . . . . . . . . . . . . . . . . 220NFNTSIZE Macro Argument . . . . . . . . . . . . . . . . . . . . . . . . . . . . . . . . . . . . . . . . . . . . . . . . . 220NFNTSTYL Macro Argument . . . . . . . . . . . . . . . . . . . . . . . . . . . . . . . . . . . . . . . . . . . . . . . . 221NID Macro Argument . . . . . . . . . . . . . . . . . . . . . . . . . . . . . . . . . . . . . . . . . . . . . . . . . . . . . . . . 221
170 Chapter 10 / DS2CONST and DS2TREE Macro Argument Dictionary

NLABEL Macro Argument . . . . . . . . . . . . . . . . . . . . . . . . . . . . . . . . . . . . . . . . . . . . . . . . . . . 221NODEBDR Macro Argument . . . . . . . . . . . . . . . . . . . . . . . . . . . . . . . . . . . . . . . . . . . . . . . . . 222NODESHAP Macro Argument . . . . . . . . . . . . . . . . . . . . . . . . . . . . . . . . . . . . . . . . . . . . . . . 222NPARENT Macro Argument . . . . . . . . . . . . . . . . . . . . . . . . . . . . . . . . . . . . . . . . . . . . . . . . . 223NPW Macro Argument . . . . . . . . . . . . . . . . . . . . . . . . . . . . . . . . . . . . . . . . . . . . . . . . . . . . . . 223NSCBACK Macro Argument . . . . . . . . . . . . . . . . . . . . . . . . . . . . . . . . . . . . . . . . . . . . . . . . . 223NSCTEXT Macro Argument . . . . . . . . . . . . . . . . . . . . . . . . . . . . . . . . . . . . . . . . . . . . . . . . . 224NSDATA Macro Argument . . . . . . . . . . . . . . . . . . . . . . . . . . . . . . . . . . . . . . . . . . . . . . . . . . . 224NSFNTNAM Macro Argument . . . . . . . . . . . . . . . . . . . . . . . . . . . . . . . . . . . . . . . . . . . . . . . 224NSFNTSIZ Macro Argument . . . . . . . . . . . . . . . . . . . . . . . . . . . . . . . . . . . . . . . . . . . . . . . . . 225NSFNTSTY Macro Argument . . . . . . . . . . . . . . . . . . . . . . . . . . . . . . . . . . . . . . . . . . . . . . . . 225NSHAPE Macro Argument . . . . . . . . . . . . . . . . . . . . . . . . . . . . . . . . . . . . . . . . . . . . . . . . . . . 225NSID Macro Argument . . . . . . . . . . . . . . . . . . . . . . . . . . . . . . . . . . . . . . . . . . . . . . . . . . . . . . 226NSIZE Macro Argument . . . . . . . . . . . . . . . . . . . . . . . . . . . . . . . . . . . . . . . . . . . . . . . . . . . . . 226NSPW Macro Argument . . . . . . . . . . . . . . . . . . . . . . . . . . . . . . . . . . . . . . . . . . . . . . . . . . . . . 226NSTYLE Macro Argument . . . . . . . . . . . . . . . . . . . . . . . . . . . . . . . . . . . . . . . . . . . . . . . . . . . 227NSWHERE Macro Argument . . . . . . . . . . . . . . . . . . . . . . . . . . . . . . . . . . . . . . . . . . . . . . . . 227NTEXTCOL Macro Argument . . . . . . . . . . . . . . . . . . . . . . . . . . . . . . . . . . . . . . . . . . . . . . . . 227NTIP Macro Argument . . . . . . . . . . . . . . . . . . . . . . . . . . . . . . . . . . . . . . . . . . . . . . . . . . . . . . 228NTIPFMT Macro Argument . . . . . . . . . . . . . . . . . . . . . . . . . . . . . . . . . . . . . . . . . . . . . . . . . . 228NURL Macro Argument . . . . . . . . . . . . . . . . . . . . . . . . . . . . . . . . . . . . . . . . . . . . . . . . . . . . . 228NVALUE Macro Argument . . . . . . . . . . . . . . . . . . . . . . . . . . . . . . . . . . . . . . . . . . . . . . . . . . . 229NWHERE Macro Argument . . . . . . . . . . . . . . . . . . . . . . . . . . . . . . . . . . . . . . . . . . . . . . . . . . 229NX NY Macro Arguments . . . . . . . . . . . . . . . . . . . . . . . . . . . . . . . . . . . . . . . . . . . . . . . . . . . . 230OPENMODE Macro Argument . . . . . . . . . . . . . . . . . . . . . . . . . . . . . . . . . . . . . . . . . . . . . . . 230PAGEPART Macro Argument . . . . . . . . . . . . . . . . . . . . . . . . . . . . . . . . . . . . . . . . . . . . . . . . 231RBSIZING Macro Argument . . . . . . . . . . . . . . . . . . . . . . . . . . . . . . . . . . . . . . . . . . . . . . . . . 231RUNMODE Macro Argument . . . . . . . . . . . . . . . . . . . . . . . . . . . . . . . . . . . . . . . . . . . . . . . . 232SASPOWER Macro Argument . . . . . . . . . . . . . . . . . . . . . . . . . . . . . . . . . . . . . . . . . . . . . . . 232SCLNKWT Macro Argument . . . . . . . . . . . . . . . . . . . . . . . . . . . . . . . . . . . . . . . . . . . . . . . . . 233SCLWIDTH Macro Argument . . . . . . . . . . . . . . . . . . . . . . . . . . . . . . . . . . . . . . . . . . . . . . . . 233SCNSIZE Macro Argument . . . . . . . . . . . . . . . . . . . . . . . . . . . . . . . . . . . . . . . . . . . . . . . . . . 234SEPCLASS Macro Argument . . . . . . . . . . . . . . . . . . . . . . . . . . . . . . . . . . . . . . . . . . . . . . . . 234SEPLOC Macro Argument . . . . . . . . . . . . . . . . . . . . . . . . . . . . . . . . . . . . . . . . . . . . . . . . . . . 234SEPTYPE Macro Argument . . . . . . . . . . . . . . . . . . . . . . . . . . . . . . . . . . . . . . . . . . . . . . . . . 235SHOWLINKS Macro Argument . . . . . . . . . . . . . . . . . . . . . . . . . . . . . . . . . . . . . . . . . . . . . . 235SPCLASS Macro Argument . . . . . . . . . . . . . . . . . . . . . . . . . . . . . . . . . . . . . . . . . . . . . . . . . 235SPREAD Macro Argument . . . . . . . . . . . . . . . . . . . . . . . . . . . . . . . . . . . . . . . . . . . . . . . . . . . 236SSFILE1–SSFILE5 Macro Arguments . . . . . . . . . . . . . . . . . . . . . . . . . . . . . . . . . . . . . . . . 236SSFREF1–SSFREF5 Macro Arguments . . . . . . . . . . . . . . . . . . . . . . . . . . . . . . . . . . . . . . 236SSHREF1–SSHREF5 Macro Arguments . . . . . . . . . . . . . . . . . . . . . . . . . . . . . . . . . . . . . 237SSMEDIA1–5 Macro Arguments . . . . . . . . . . . . . . . . . . . . . . . . . . . . . . . . . . . . . . . . . . . . . 237SSREL1–5 Macro Arguments . . . . . . . . . . . . . . . . . . . . . . . . . . . . . . . . . . . . . . . . . . . . . . . . 237SSREV1–5 Macro Arguments . . . . . . . . . . . . . . . . . . . . . . . . . . . . . . . . . . . . . . . . . . . . . . . 238SSTITLE1–5 Macro Arguments . . . . . . . . . . . . . . . . . . . . . . . . . . . . . . . . . . . . . . . . . . . . . . 238SSTYPE1–5 Macro Arguments . . . . . . . . . . . . . . . . . . . . . . . . . . . . . . . . . . . . . . . . . . . . . . 238TCLASS Macro Argument . . . . . . . . . . . . . . . . . . . . . . . . . . . . . . . . . . . . . . . . . . . . . . . . . . . 239TCOLOR Macro Argument . . . . . . . . . . . . . . . . . . . . . . . . . . . . . . . . . . . . . . . . . . . . . . . . . . 239TFACE Macro Argument . . . . . . . . . . . . . . . . . . . . . . . . . . . . . . . . . . . . . . . . . . . . . . . . . . . . 239TIPS Macro Argument . . . . . . . . . . . . . . . . . . . . . . . . . . . . . . . . . . . . . . . . . . . . . . . . . . . . . . . 239TIPTYPE Macro Argument . . . . . . . . . . . . . . . . . . . . . . . . . . . . . . . . . . . . . . . . . . . . . . . . . . 239TRANLIST Macro Argument . . . . . . . . . . . . . . . . . . . . . . . . . . . . . . . . . . . . . . . . . . . . . . . . . 240TREEDIR Macro Argument . . . . . . . . . . . . . . . . . . . . . . . . . . . . . . . . . . . . . . . . . . . . . . . . . . 240TREESPAN Macro Argument . . . . . . . . . . . . . . . . . . . . . . . . . . . . . . . . . . . . . . . . . . . . . . . . 241
Contents 171

TSIZE Macro Argument . . . . . . . . . . . . . . . . . . . . . . . . . . . . . . . . . . . . . . . . . . . . . . . . . . . . . 241TTAG Macro Argument . . . . . . . . . . . . . . . . . . . . . . . . . . . . . . . . . . . . . . . . . . . . . . . . . . . . . . 242VSPACE Macro Argument . . . . . . . . . . . . . . . . . . . . . . . . . . . . . . . . . . . . . . . . . . . . . . . . . . . 242WIDTH Macro Argument . . . . . . . . . . . . . . . . . . . . . . . . . . . . . . . . . . . . . . . . . . . . . . . . . . . . 242XMLFILE Macro Argument . . . . . . . . . . . . . . . . . . . . . . . . . . . . . . . . . . . . . . . . . . . . . . . . . . 242XMLFREF Macro Argument . . . . . . . . . . . . . . . . . . . . . . . . . . . . . . . . . . . . . . . . . . . . . . . . . 243XMLTYPE Macro Argument . . . . . . . . . . . . . . . . . . . . . . . . . . . . . . . . . . . . . . . . . . . . . . . . . 243XMLURL Macro Argument . . . . . . . . . . . . . . . . . . . . . . . . . . . . . . . . . . . . . . . . . . . . . . . . . . . 243ZOOM Macro Argument . . . . . . . . . . . . . . . . . . . . . . . . . . . . . . . . . . . . . . . . . . . . . . . . . . . . . 244
About the DS2CONST and DS2TREE Macro Arguments
The DS2CONST and DS2TREE macros use the following syntax:
%macroname(argument1=value1, argument2=value2, ...);
The macro arguments specify the configuration of the HTML output file, the location of the data that is used to generate the diagram, and the configuration of the applet's interactive features. The arguments can be grouped as follows:
n Arguments for the APPLET Tag
n Arguments for Data Definition
n Arguments for HTML and XML File Information
n Arguments for Diagram Appearance
n Arguments for Page Formatting
n Arguments for Style Sheets
n Arguments for the SAS TITLE and FOOTNOTE Tags
n Arguments for Character Transcoding
Arguments for the APPLET TagThe following table lists the DS2CONST and DS2TREE macro arguments that apply to the APPLET tag.
Argument Description
Applies To (✓):
DS2CONST DS2TREE
AHUNITS Specifies the units of the HEIGHT= argument. ✓ ✓
172 Chapter 10 / DS2CONST and DS2TREE Macro Argument Dictionary

Argument Description
Applies To (✓):
DS2CONST DS2TREE
ALIGN Specifies the alignment of the applet window in the browser window or frame.
✓ ✓
ALT Specifies the text that is displayed on mouseover by browsers that understand the tag but cannot run Java applets.
✓ ✓
ARCHIVE Specifies the name of the Java archive file or files. ✓ ✓
AWUNITS Specifies the units of the WIDTH= argument. ✓ ✓
CODEBASE Specifies the path of the SAS Java archives specified in the ARCHIVE= argument.
✓ ✓
HEIGHT Specifies the height of the applet window. ✓ ✓
HSPACE Specifies the amount of horizontal space, in pixels, to the left and right of the graph or diagram.
✓ ✓
NAME Specifies the name for this instance of the applet. ✓ ✓
VSPACE Specifies the amount of vertical space, in pixels, to the top and bottom of the graph or diagram.
✓ ✓
WIDTH Specifies the width of the applet window. ✓ ✓
Arguments for Data DefinitionThe following table lists the DS2CONST and DS2TREE macro arguments that apply to data definition.
Argument Description
Applies To (✓):
DS2CONST DS2TREE
DATATYPE Specifies the type of the XML data. ✓
LABELS Indicates whether node labels are displayed in the diagram.
✓ ✓
Arguments for Data Definition 173

Argument Description
Applies To (✓):
DS2CONST DS2TREE
LAYOUT Specifies whether the Constellation applet lays out the diagram using stress and strain equations or the NX and NY arguments.
✓
LCOLFMT Specifies the name of a user-defined SAS format that converts the values in the variable named in the LCOLOR= argument to valid HTML color names.
✓ ✓
LCOLOR Specifies the name of the variable that determines the color of the link lines.
✓ ✓
LCOLVAL Specifies the name of the variable that determines the color mapping of link lines.
✓
LDATA Specifies the name of the SAS data set that contains the link data that is used to generate the diagram.
✓
LFROM Specifies the name of the variable whose values define the nodes at the start of link lines.
✓
LINKTYPE Specifies whether the links are drawn as lines or arrows that indicate the direction of flow.
✓
LPT Specifies the password that is needed for accessing a password-protected link data set that is specified with the LDATA= argument.
✓
LSTIP Specifies the name of the variable in the data set that determines the stipple mask.
✓ ✓
LSTIPFAC Specifies the name of the variable in the data set whose value specifies a multiplier for the binary stipple mask.
✓ ✓
LTIP Specifies the name of the variable in the data set that provides the text that is displayed in the pop-up data tips windows for links.
✓ ✓
LTIPFMT Specifies the name of a user-defined SAS format that is applied to the values in the variable specified in the LTIP= argument to configure those values for display in the pop-up data tips window.
✓ ✓
LTO Specifies the name of the variable whose values identify the nodes at the ends of link lines.
✓
174 Chapter 10 / DS2CONST and DS2TREE Macro Argument Dictionary

Argument Description
Applies To (✓):
DS2CONST DS2TREE
LVALUE Specifies the name of the variable whose values determine the weights of the link lines, which determines the color and relative thickness of link lines.
✓
LWHERE Specifies a WHERE clause that subsets the link data for display in the diagram.
✓
LWIDTH Specifies the name of the variable in the data set that determines the width of the link lines.
✓ ✓
MINLNKWT Specifies the initial minimum link weight, which determines which links are initially displayed.
✓
NACTION Specifies the name of the variable in the nodes data set that provides the menu text that is displayed for custom actions for each node.
✓ ✓
NCOLFMT Specifies the name of a user-defined SAS format that converts the values in the variable named in the NCOLOR= argument to valid HTML color names.
✓
NCOLOR Specifies the variable in the nodes data set that determines the background color of the nodes.
✓ ✓
NCOLVAL Specifies the name of the variable in the nodes data set that determines the color mapping for the nodes.
✓
NDATA Specifies the SAS data set that contains the node data. ✓ ✓
NFNTNAME Specifies the name of the variable that determines the text font for the node labels.
✓ ✓
NFNTSIZE Specifies the name of the variable in the nodes data set that determines the size of the text font used for node labels.
✓ ✓
NFNTSTYL Specifies the name of the variable that determines the font style for the node label.
✓ ✓
NID Specifies the name of the variable in the nodes data set whose values are to be illustrated as the nodes in the diagram.
✓ ✓
NLABEL Specifies the name of the variable that represents the node labels.
✓ ✓
Arguments for Data Definition 175

Argument Description
Applies To (✓):
DS2CONST DS2TREE
NPARENT Specifies the name of the variable that represents the parent nodes.
✓
NPW Specifies the password that is needed for accessing a password-protected data set.
✓ ✓
NSCBACK Specifies the name of the variable in the node styles data set that determines the background color of the nodes.
✓ ✓
NSCTEXT Specifies the name of the variable in the node styles data set that provides the colors for the node label text.
✓ ✓
NSDATA Specifies the name of the node styles data set. ✓ ✓
NSFNTNAM Specifies the name of the variable in the node styles data set that determines the text font that is to be used for node labels.
✓ ✓
NSFNTSIZ Specifies the name of the variable in the node styles data set that determines the size of the node label text, in points.
✓ ✓
NSFNTSTY Specifies the name of the variable in the node styles data set that determines the style of the node label text.
✓ ✓
NSHAPE Specifies the name of the variable that determines the shape of the nodes.
✓
NSID Specifies the name of the variable in the node styles data set that represents the nodes.
✓ ✓
NSIZE Specifies the name of the variable that determines the size of the nodes.
✓
NSPW Specifies the password that is needed to access a password-protected node styles data set.
✓ ✓
NSTYLE Specifies the name of the variable that determines the style of the nodes.
✓ ✓
NSWHERE Specifies a WHERE clause that subsets the node styles data set for display in the diagram.
✓ ✓
NTEXTCOL Specifies the name of the variable that determines the color of the text for the node labels.
✓ ✓
176 Chapter 10 / DS2CONST and DS2TREE Macro Argument Dictionary

Argument Description
Applies To (✓):
DS2CONST DS2TREE
NTIP Specifies the name of the variable that provides the data or text that is displayed in the pop-up data tips window.
✓ ✓
NTIPFMT Specifies the name of a user-defined SAS format that is applied to the data tips variable that is named in the NTIP= argument.
✓ ✓
NURL Specifies the name of the variable that provides the drill-down URLs for each node.
✓ ✓
NVALUE Specifies the name of the variable that determines the relative node size.
✓
NWHERE Specifies a WHERE clause that subsets the nodes data set for display in the diagram.
✓ ✓
NX Specify the variables that determine the locations of the centers of the nodes.
✓
Arguments for HTML and XML File InformationThe following table lists the DS2CONST and DS2TREE macro arguments that specify HTML and XML file information.
Argument Description
Applies To (✓):
DS2CONST DS2TREE
HTMLFILE Specifies the name and storage location of the HTML output file.
✓ ✓
HTMLFREF Specifies the SAS fileref that identifies the name and storage location of the HTML output file.
✓ ✓
MAKEHTML Specifies whether an HTML file is to be generated. ✓ ✓
MAKEXML Specifies whether an XML file is to be generated. ✓ ✓
Arguments for HTML and XML File Information 177

Argument Description
Applies To (✓):
DS2CONST DS2TREE
OPENMODE Indicates whether the new HTML or XML output or both overwrites the information that is currently in the specified file or files, or whether the new output is appended to the end of the existing file or files.
✓ ✓
RUNMODE Specifies whether you are running the DS2TREE macro in batch or server mode.
✓ ✓
XMLFILE Specifies the name and storage location of the XML output file.
✓ ✓
XMLFREF Specifies the SAS fileref that identifies the name and storage location of the XML output file.
✓ ✓
XMLTYPE Specifies whether the XML output file is to be written to an external file or included inline with the HTML.
✓ ✓
XMLURL Specifies the URL of the existing file that contains the XML tags that define the node and link diagram.
✓ ✓
Arguments for Diagram AppearanceThe following table lists the DS2CONST and DS2TREE macro arguments that affect the appearance of the diagram.
Argument Description
Applies To (✓):
DS2CONST DS2TREE
ACTION Specifies the default text that is displayed in the pop-up menu that appears when the web user right-clicks a node.
✓ ✓
ANGLE Used with the TREESPAN= argument to determine the direction of growth for the diagram.
✓
BORDER Specifies whether a border is drawn around the background area.
✓ ✓
CATEXT Specifies a default color for the text in the diagram. ✓ ✓
178 Chapter 10 / DS2CONST and DS2TREE Macro Argument Dictionary

Argument Description
Applies To (✓):
DS2CONST DS2TREE
CBACK Specifies a background color for the Treeview applet. ✓
CHANDLE Specifies the color of the Collapse/Expand handle on the nodes.
✓
CLINK Specifies a default color for the links in the diagram. ✓ ✓
CNODE Specifies the node background color. ✓ ✓
COLORMAP Specifies whether the NCOLOR= and LCOLOR= arguments determine node and link colors instead of the color map.
✓
CSELECT Specifies a color for nodes that are selected by the mouse or as the result of a node search.
✓ ✓
CUTOFF Specifies the percentage of the nodes that will be displayed with node labels.
✓ ✓
DEPTH Specifies a whole number greater than zero that determines the maximum number of links that are to be displayed in the node and link diagram.
✓
DRILTARG Specifies the HTML target or the name of the browser window or frame where drill-down URLs are displayed.
✓ ✓
DUPCHECK Specifies whether the applet will check for duplicate node IDs.
✓
FACTOR Specifies the distortion factor for the fish-eye lens. ✓
FISHEYE Specifies whether the diagram is to be displayed with the fish-eye distortion.
✓
FNTNAME Specifies the default text font for node labels. ✓ ✓
FNTSIZE Specifies the size of the node label text font, in points. ✓ ✓
FNTSTYL Specifies the text font style for node labels. ✓ ✓
IBACKLOC Specifies a URL for the image that you want to use in the background of the diagram.
✓ ✓
IBACKPOS Specifies how to display the background image in the IBACKLOC= argument.
✓ ✓
Arguments for Diagram Appearance 179

Argument Description
Applies To (✓):
DS2CONST DS2TREE
IBACKURL Specifies the URL that is displayed when you click on the background image.
✓ ✓
IBACKX and IBACKY
Specifies the x (horizontal) and y (vertical) pixel coordinates of the upper left corner of the background image.
✓ ✓
NODEBDR Specifies the appearance of the node border line. ✓
NODESHAP Specifies the shape of the nodes. ✓
RBSIZING Specifies whether the height and the width of the dialog box frames are read in from the resource bundle.
✓ ✓
SCLNKWT Specifies whether the link weight values are to be scaled into the range of 0–1, which corresponds to 0–100%.
✓
SCLWIDTH Specifies whether the link width values are to be scaled into the range of 0–1.
✓
SCNSIZE Specifies whether the node size values are to be scaled into the range of 0–1.
✓
SHOWLINKS Specifies whether initially to display all arc lines between nodes.
✓
SPREAD Specifies the angular spreading factor for the layout of the diagram.
✓
TIPS Indicates whether pop-up data tips are displayed when the cursor is positioned over nodes or links or both.
✓ ✓
TIPTYPE Specifies whether the pop-up data tip window moves with the cursor or remains stationary.
✓
TREEDIR Determines the growth direction of the node and link diagram.
✓
TREESPAN Specifies the angular width of the diagram in degrees. ✓
ZOOM Specifies the zoom value that is used for the initial display of the diagram.
✓
180 Chapter 10 / DS2CONST and DS2TREE Macro Argument Dictionary

Arguments for Page FormattingThe following table lists the DS2CONST and DS2TREE macro arguments that affect page formatting.
Argument Description
Applies To (✓):
DS2CONST DS2TREE
BDCLASS Specifies the name of the style sheet that is to be applied to the body of the HTML output file.
✓ ✓
BG Specifies the background color or image, based on the value of the BGTYPE= argument.
✓ ✓
BGTYPE Specifies the background type. ✓ ✓
BRTITLE Specifies the text that appears in the title bar of the browser window.
✓ ✓
CENTER Specifies whether the graph or diagram is centered in the browser window.
✓ ✓
CTEXT Specifies a default text color that replaces the default text color in the browser.
✓ ✓
DOCTYPE Specifies the DOCTYPE tag. ✓ ✓
ENCODE Specifies whether the angle bracket characters (< and >) in SAS TITLE and FOOTNOTE statements are replaced with the HTML character entities < and > respectively.
✓ ✓
PAGEPART Specifies which part or parts of the HTML page are to be written into the HTML output file.
✓ ✓
SASPOWER Specifies the path or URL, relative or absolute, to the image file of the SAS Powered logo.
✓ ✓
SEPCLASS Specifies the path or URL, relative or absolute, to the style sheet that is used for the page separator.
✓ ✓
SEPLOC Specifies the path or URL, relative or absolute, to the image that you want to use as the separator between the graphs in your presentation.
✓ ✓
Arguments for Page Formatting 181

Argument Description
Applies To (✓):
DS2CONST DS2TREE
SEPTYPE Specifies the type of separator that is used between multiple applets in your presentation.
✓ ✓
SPCLASS Specifies the name of the style sheet class that is to be used for the Powered by SAS logo.
✓ ✓
Arguments for Style SheetsStyle sheet arguments reference style information in one of two ways. Most of the arguments specify parameters in the HTML LINK tag:
<LINK HREF="1qtr98.css" TYPE="text/css" REL="stylesheet">
Use these arguments when you do not want to enter your style information directly into your HTML file when you create that file.
Other arguments embed the style information into the header of the HTML file. Use these arguments when you want to collect style information from multiple style sheets. The end result must create a complete STYLE tag in your HTML file.
You can combine LINK tag arguments with arguments that embed style information, but you cannot use the same ordinal number in two arguments. For example, you can specify the arguments SSHREF1= and SSFILE2=, but you cannot specify SSHREF1= and SSFILE1=.
The following arguments link to two different style sheets and include text comments for each style sheet.
ssfile1=comments1.txt, /* embeds text */sshref2=/style/style1.css, /* links to stylesheet */sstype2=text/css, /* parameters for style sheets */ssrel2=stylesheet,ssfile3=comments2.txt, /* embeds text */sshref4=/style/style2.css, /* link to stylesheets */sstype4=text/css,ssrel4=stylesheet,
The following table lists the DS2CONST and DS2TREE macro arguments that apply to style sheets.
182 Chapter 10 / DS2CONST and DS2TREE Macro Argument Dictionary

Argument Description
Applies To (✓):
DS2CONST DS2TREE
SSFILE1–SSFILE5
Embeds in the HTML file the entire contents of the specified file.
✓ ✓
SSFREF1–SSFREF5
Embeds in the HTML file the entire contents of the file that is referenced by the SAS fileref.
✓ ✓
SSHREF1–SSHREF5
Specifies the URL of the style sheet in the HREF= attribute of the LINK tag.
✓ ✓
SSMEDIA1–5 Specifies the media for which the style sheet was designed.
✓ ✓
SSREL1–5 Specifies the REL= attribute of the LINK tag, which describes the relationship from the linked file to the HTML file.
✓ ✓
SSREV1–5 Specifies the REV= attribute of the LINK tag, which describes the relationship from the HTML file to the linked file.
✓ ✓
SSTITLE1–5 Specifies the TITLE= attribute of the LINK tag. The TITLE= attribute provides a title for the referenced page.
✓ ✓
SSTYPE1–5 Specifies the TYPE= attribute of the LINK tag. ✓ ✓
Arguments for the SAS TITLE and FOOTNOTE Tags
The following table lists the DS2CONST and DS2TREE macro arguments that apply to SAS TITLE and FOOTNOTE statements.
Argument Description
Applies To (✓):
DS2CONST DS2TREE
FCLASS and TCLASS
Specifies the name of the style sheet class that is to be used for the SAS TITLE or FOOTNOTE.
✓ ✓
Arguments for the SAS TITLE and FOOTNOTE Tags 183
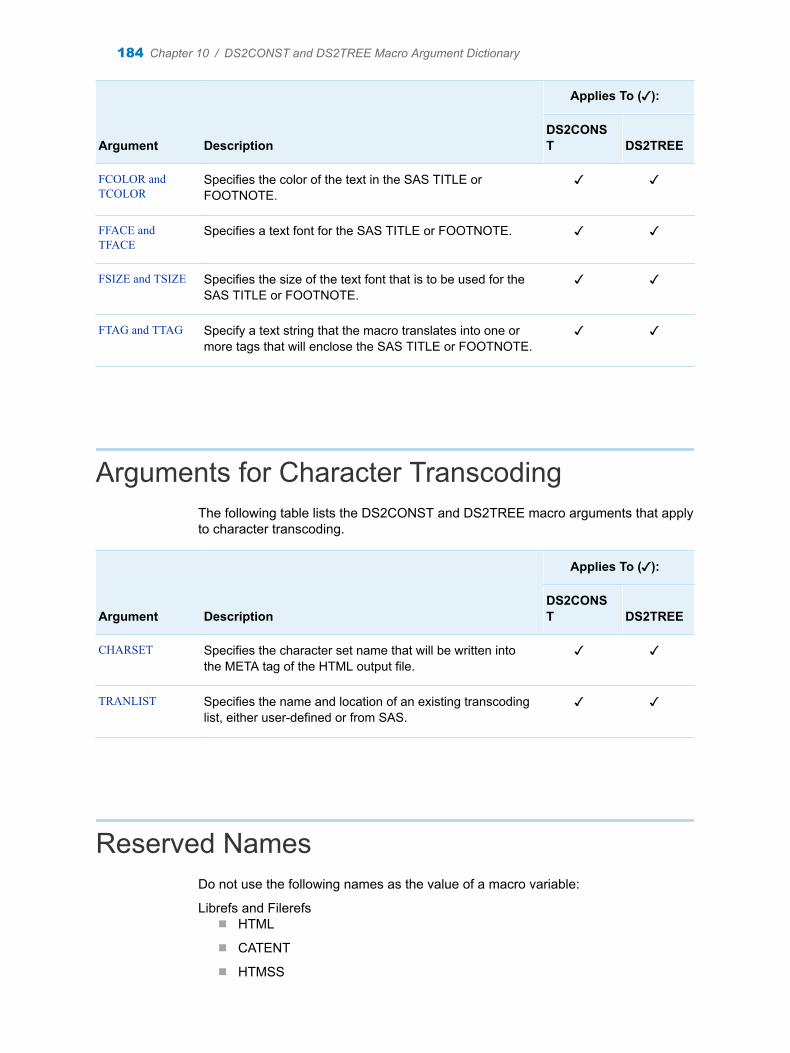
Argument Description
Applies To (✓):
DS2CONST DS2TREE
FCOLOR and TCOLOR
Specifies the color of the text in the SAS TITLE or FOOTNOTE.
✓ ✓
FFACE and TFACE
Specifies a text font for the SAS TITLE or FOOTNOTE. ✓ ✓
FSIZE and TSIZE Specifies the size of the text font that is to be used for the SAS TITLE or FOOTNOTE.
✓ ✓
FTAG and TTAG Specify a text string that the macro translates into one or more tags that will enclose the SAS TITLE or FOOTNOTE.
✓ ✓
Arguments for Character TranscodingThe following table lists the DS2CONST and DS2TREE macro arguments that apply to character transcoding.
Argument Description
Applies To (✓):
DS2CONST DS2TREE
CHARSET Specifies the character set name that will be written into the META tag of the HTML output file.
✓ ✓
TRANLIST Specifies the name and location of an existing transcoding list, either user-defined or from SAS.
✓ ✓
Reserved NamesDo not use the following names as the value of a macro variable:
Librefs and Filerefsn HTML
n CATENT
n HTMSS
184 Chapter 10 / DS2CONST and DS2TREE Macro Argument Dictionary

Global Macro Variablesn _htmovp
n _htmcap
n _htmtitl
n _htmwher
Data Sets or Viewsn WORK._BYGRP
Catalogsn WORK._HTMLG_
n SASHELP.HTMLNLS
Catalog Entriesn SASHELP.HTMLGEN.DSPROP.SLIST
n SASHELP.HTMLGEN.IDENTITY.SLIST
n SASHELP.HTMLGEN.OUTPROP.SLIST
n SASHELP.HTMLGEN.TABPROP.SLIST
n SASHELP.HTMLGEN.TAGS.SLIST
Dictionary
ACTION Macro Argumentspecifies the default text that is displayed in the pop-up menu that appears when the web user right-clicks a node.
Category: Diagram Appearance
Applies to: DS2CONST and DS2TREE
Restriction: For DS2TREE, the ACTION= argument can be used only when the NURL= argument specifies one URL. When the NURL= argument specifies multiple URLs, the ACTION= argument is ignored. To specify the menu item text for multiple URLs, use the NACTION= argument instead.
Interaction: This argument is overridden by the NACTION= argument.
Tip: This argument is useful when you want to use the same menu text for most of the nodes in your diagram. The default menu option text is Open URL (URL-string).
SyntaxACTION=text
ACTION Macro Argument 185

DetailsFor DS2CONST, the menu option text appears in the pop-up menu when a user right-clicks a node in the constellation diagram. Selecting the menu option text in the pop-up menu opens the URL that is specified by the NURL= argument. For DS2TREE, the menu option text appears in the pop-up menu when a user right-clicks a node in the treeview diagram, and then selects Custom Action in the pop-up menu. Selecting the menu option text in the Custom Action list opens the URL that is specified by the NURL= argument.
AHUNITS Macro Argumentspecifies the units of the HEIGHT= argument.
Category: APPLET Tag
Default: PIXELS
Applies to: DS2CONST and DS2TREE
See: AWUNITS on page 188
SyntaxAHUNITS=PIXELS | PERCENT
ALIGN Macro Argumentspecifies the alignment of the applet window in the browser window or frame.
Category: APPLET Tag
Applies to: DS2CONST and DS2TREE
SyntaxALIGN=LEFT | RIGHT | TOP | BOTTOM | TEXTTOP | MIDDLE | ABSMIDDLE | BASELINE | ABSBOTTOM
ALT Macro Argumentspecifies the text that is displayed on mouseover by browsers that understand the tag but cannot run Java applets.
Category: APPLET Tag
Defaults: “SAS Institute Inc. Constellation Chart Applet“SAS Institute Inc. TreeView Applet
Applies to: DS2CONST and DS2TREE
186 Chapter 10 / DS2CONST and DS2TREE Macro Argument Dictionary

SyntaxALT=text
ANGLE Macro Argumentused with the TREESPAN= argument to determine the direction of growth for the diagram.
Category: Diagram Appearance
Default: 0
Range: 0–360
Applies to: DS2TREE
SyntaxANGLE=link-angle
DetailsThe ANGLE= argument is valid only when you do not specify the TREEDIR= argument. The TREESPAN= argument defines the angular width of the tree (narrow or wide layout). The TREESPAN angle can be visualized as a V shape in which the starting node is positioned at the base of the V. The rest of the nodes are laid out between the spreading arms of the V. The ANGLE= argument specifies the angle of the V shape. By default, the value of the ANGLE= argument is zero (0) and the V shape opens to the right, as if the letter V was rotated 90 degrees clockwise, to the three-o'clock position. Values of the ANGLE= argument that are greater than zero rotate the V shape counterclockwise away from the three-o'clock position.
ARCHIVE Macro Argumentspecifies the name of the Java archive file or files.
Category: APPLET Tag
Applies to: DS2CONST and DS2TREE
Tip: Use the CODEBASE= argument to specify the path to the Java archive files.
SyntaxARCHIVE=filename(s)
ARCHIVE Macro Argument 187

Argument Valuesfilename(s)
specifies the names of the JAR files that contain the applet classes. Multiple files must be separated by a comma. The JAR files listed in the following are required.
Macro Applet JAR File Auxiliary JAR Files
DS2CONST sas.graph.constapp.jar sas.graph.nld.jar
sas.graph.j2d.jar
DS2TREE sas.graph.treeview.jar sas.graph.nld.jar
sas.graph.j2d.jar
In SAS releases prior to 9.1, the treeview.jar or constapp.jar JAR file is all that is required. Although you can continue to use the older JAR files by specifying ARCHIVE=treeview.jar or ARCHIVE=constapp.jar, future versions might not support these older JAR files.
Defaults For DS2CONST: sas.graph.constapp.jar, sas.graph.nld.jar, and sas.graph.j2d.jar
For DS2TREE: sas.graph.treeview.jar, sas.graph.nld.jar, and sas.graph.j2d.jar
Examples For DS2CONST:archive=%str(sas.graph.constapp.jar, sas.graph.nld.jar,sas.graph.j2d.jar)
For DS2TREE:archive=%str(sas.graph.treeview.jar, sas.graph.nld.jar,sas.graph.j2d.jar)
AWUNITS Macro Argumentspecifies the units of the WIDTH= argument.
Category: APPLET Tag
Default: PIXELS
Applies to: DS2CONST and DS2TREE
See: HEIGHT on page 207 and AHUNITS on page 186
SyntaxAWUNITS=PIXELS | PERCENT
188 Chapter 10 / DS2CONST and DS2TREE Macro Argument Dictionary

BDCLASS Macro Argumentspecifies the name of the style sheet that is to be applied to the body of the HTML output file.
Category: Page Formatting
Applies to: DS2CONST and DS2TREE
SyntaxBDCLASS=body-stylesheet-name
BG Macro Argumentspecifies the background color or image, based on the value of the BGTYPE= argument.
Category: Page Formatting
Applies to: DS2CONST and DS2TREE
Interaction: When BGTYPE=IMAGE, this argument specifies a background image, using a relative or absolute path or URL.
Tip: The color can be specified as an HTML 3.2 color name or as a six-digit hexadecimal RGB value.
SyntaxBG=color-or-image
BGTYPE Macro Argumentspecifies the background type.
Category: Page Formatting
Default: NONE
Applies to: DS2CONST and DS2TREE
SyntaxBGTYPE=NONE | COLOR | IMAGE
Argument ValuesNONE
causes the applet to display its default background color.
BGTYPE Macro Argument 189

COLORspecifies that the value of the BG= argument must be an HTML 3.2 color name or hexadecimal RGB value.
IMAGEspecifies that the value of the BG= argument must be the path or URL pointing to an image file that is displayed in the background of the applet window.
BORDER Macro Argumentspecifies whether a border is drawn around the background area.
Category: Diagram Appearance
Default: N
Applies to: DS2CONST and DS2TREE
SyntaxBORDER=Y | N
BRTITLE Macro Argumentspecifies the text that appears in the title bar of the browser window.
Category: Page Formatting
Default: No title is displayed
Applies to: DS2CONST and DS2TREE
SyntaxBRTITLE=browser-window-title
CATEXT Macro Argumentspecifies a default color for the text in the diagram.
Category: Diagram Appearance
Applies to: DS2CONST and DS2TREE
Requirement: The color specification must be an HTML 3.2 color name or a six-digit hexadecimal RGB value.
Interaction: For DS2CONST, this argument is overridden by the FNTNAME= argument and the NTEXTCOL= argument.
190 Chapter 10 / DS2CONST and DS2TREE Macro Argument Dictionary

SyntaxCATEXT=default-text-color
CBACK Macro Argumentspecifies a background color for the Treeview Applet.
Category: Diagram Appearance
Applies to: DS2TREE
Requirement: The color specification must be a valid HTML 3.2 color name.
SyntaxCBACK=color
CENTER Macro Argumentspecifies whether the graph or diagram is centered in the browser window.
Category: Page Formatting
Default: N
Applies to: DS2CONST and DS2TREE
SyntaxCENTER=Y | N
CHANDLE Macro Argumentspecifies the color of the Collapse/Expand handle on the nodes.
Category: Diagram Appearance
Applies to: DS2TREE
Requirement: The color specification must be a valid HTML color name.
Note: The handle is represented by a small plus sign (+) that is prefixed to the label of the node when its subtree is collapsed.
SyntaxCHANDLE=color
CHANDLE Macro Argument 191

CHARSET Macro Argumentspecifies the character set name that is written into the META tag of the HTML output file.
Category: Character Transcoding
Applies to: DS2CONST and DS2TREE
Note: For information about available character set names, see http://www.iana.org/assignments/character-sets/character-sets.xml.
SyntaxCHARSET=char-set-name
CLINK Macro Argumentspecifies a default color for the links in the diagram.
Category: Diagram Appearance
Applies to: DS2CONST and DS2TREE
Requirement: The color specification must be an HTML 3.2 color name or a six-digit RGB value.
Interaction: For DS2CONST, this argument is overridden by the LCOLOR= and LCOLVAL= arguments.
SyntaxCLINK=default-link-color
CNODE Macro Argumentspecifies the node background color.
Category: Diagram Appearance
Applies to: DS2CONST and DS2TREE
Requirement: The color specification must be a valid HTML color name. For the DS2CONST macro, the color specification can also be a six-digit RGB value.
Interactions: For the DS2TREE macro, this argument is overridden by the NCOLOR= argument.For the DS2CONST macro, this argument is overridden by the NCOLOR=, NCOLVAL=, NVALUE=, or NSCBACK= argument.
192 Chapter 10 / DS2CONST and DS2TREE Macro Argument Dictionary

SyntaxCNODE=color
CODEBASE Macro Argumentspecifies the path of the SAS Java archives specified in the ARCHIVE= argument.
Category: APPLET Tag
Applies to: DS2CONST and DS2TREE
Requirement: You must specify this argument when you run the DS2CONST or DS2TREE macro.
Note: The value of the APPLETLOC= system option is not used as the default value.
Tips: You can specify CODEBASE="." if the HTML file and Java archive files are in the same directory.You can specify the location pointed to by the SAS system option APPLETLOC=, or you can specify a different location. To display the current value of the APPLETLOC= system option, run the following code:
proc options option=appletloc;run;
See: The APPLETLOC= option in SAS System Options: Reference
SyntaxCODEBASE=path-or-URL
COLORMAP Macro Argumentspecifies whether the NCOLOR= and LCOLOR= arguments determine node and link colors instead of the color map.
Category: Diagram Appearance
Default: N
Applies to: DS2CONST
See: LCOLOR on page 211 and NCOLOR on page 219
SyntaxCOLORMAP=N | Y
CSELECT Macro Argumentspecifies a color for nodes that are selected by the mouse or as the result of a node search.
CSELECT Macro Argument 193

Category: Diagram Appearance
Applies to: DS2CONST and DS2TREE
Requirement: The color specification must be a valid HTML 3.2 color name.
SyntaxCSELECT=color
CTEXT Macro Argumentspecifies a default text color that replaces the default text color in the browser.
Category: Page Formatting
Applies to: DS2CONST and DS2TREE
Requirement: The color specification must be an HTML 3.2 color name or as a six-digit hexadecimal RGB value.
Tip: Other color arguments can be used to override this new default.
SyntaxCTEXT=default-text-color
CUTOFF Macro Argumentspecifies the percentage of the nodes that are displayed with node labels.
Category: Diagram Appearance
Default: 0.5
Range: 0.0–1.0
Applies to: DS2CONST and DS2TREE
Notes: The decimal values map to a percentage from 0% to 100%.After the percentage has been reached, nodes are drawn as rectangles. The size of those rectangles decreases as the distance from the starting node increases.
See: DEPTH on page 195
SyntaxCUTOFF=detail-percentage
194 Chapter 10 / DS2CONST and DS2TREE Macro Argument Dictionary

DATATYPE Macro Argumentspecifies the type of the XML data.
Category: Data Definition
Default: ARCS
Applies to: DS2CONST
SyntaxDATATYPE=ARCS | ASSOC
Argument ValuesARCS
indicates that the data set is in the form of an arc list.
ASSOCindicates that the data set is associative. The links can be displayed based on their weighted values, and node size and link width can represent the relative size of the node and link values.
DEPTH Macro Argumentspecifies a whole number greater than zero that determines the maximum number of links that are to be displayed in the node and link diagram.
Category: Diagram Appearance
Applies to: DS2TREE
Interaction: This argument value is ignored when CUTOFF=1.0.
Notes: This argument affects only the initial display of the diagram.Paths whose lengths exceed the limit are truncated.Nodes that are initially hidden can become visible as a user selects nodes and navigates around the diagram.
SyntaxDEPTH=max-path-length
DOCTYPE Macro Argumentspecifies the DOCTYPE tag.
DOCTYPE Macro Argument 195

Category: Page Formatting
Default: <!DOCTYPE HTML PUBLIC "-//W3C//DTD HTML 3.2 Final//EN">
Applies to: DS2CONST and DS2TREE
Tips: To use a different DOCTYPE tag, specify the entire contents of the tag as the value of the DOCTYPE= argument, including the angle brackets.If you specify DOCTYPE="", then no DOCTYPE tag is generated in the HTML output file.
SyntaxDOCTYPE=DOCTYPE-tag
DRILTARG Macro Argumentspecifies the HTML target or the name of the browser window or frame where drill-down URLs are displayed.
Category: Diagram Appearance
Default: _BLANK
Applies to: DS2CONST and DS2TREE
SyntaxDRILTARG=target-window-or-frame
DUPCHECK Macro Argumentspecifies whether the applet checks for duplicate node IDs.
Category: Diagram Appearance
Default: FALSE
Applies to: DS2TREE
Tip: When this argument is set to TRUE, the applet updates an ID if a duplicate ID is found, instead of creating a new node with the same ID. This enables you to collect node information from different locations in the data set.
SyntaxDUPCHECK=TRUE | FALSE
196 Chapter 10 / DS2CONST and DS2TREE Macro Argument Dictionary

ENCODE Macro Argumentspecifies whether the angle bracket characters (< and >) in SAS TITLE and FOOTNOTE statements are replaced with the HTML character entities < and > respectively.
Category: Page Formatting
Default: Y
Applies to: DS2CONST and DS2TREE
SyntaxENCODE=Y | N
DetailsWhen this argument is set to Y (default), the angle bracket characters (< and >) in SAS TITLE and FOOTNOTE lines are replaced with the HTML character entities (> and <) respectively. Specifying ENCODE=N causes the browser to interpret the angle brackets as parts of HTML tags. For example, you would use ENCODE=N if you wanted to use the following TITLE statement:
title "<FONT COLOR="red">Out of Range Data</FONT>";
FACTOR Macro Argumentspecifies the distortion factor for the fish-eye lens.
Category: Diagram Appearance
Default: 1.0 (the lowest amount of distortion)
Applies to: DS2TREE
Requirement: The value specified must be greater than or equal to 1.0.
Interaction: This argument is valid only when the value of the FISHEYE= argument is Y.
SyntaxFACTOR=fish-eye-distortion-factor
DetailsThe distortion factor determines the amount that the central region of the display is to be expanded (or zoomed). The maximum effective value (beyond which no further distortion is visible) is variable depending on the number of nodes in the diagram.
FACTOR Macro Argument 197

FCLASS
TCLASS Macro Argumentsspecifies the name of the style sheet class that is to be used for the SAS TITLE or FOOTNOTE.
Category: SAS TITLE and FOOTNOTE Tags
Applies to: DS2CONST and DS2TREE.
SyntaxFCLASS=footnote-style-sheet-nameTCLASS=title-style-sheet-name
FCOLOR
TCOLOR Macro Argumentsspecifies the color of the text in the SAS TITLE or FOOTNOTE.
Category: SAS TITLE and FOOTNOTE Tags
Applies to: DS2CONST and DS2TREE.
Requirement: The color specification must be an HTML 3.2 color name or a six-digit hexadecimal RGB value.
SyntaxFCOLOR=footnote-text-colorTCOLOR=title-text-color
FFACE
TFACE Macro Argumentsspecifies a text font for the SAS TITLE or FOOTNOTE.
198 Chapter 10 / DS2CONST and DS2TREE Macro Argument Dictionary

Category: SAS TITLE and FOOTNOTE Tags
Applies to: DS2CONST and DS2TREE.
Note: Valid values are browser-specific.
SyntaxFFACE=footnote-text-fontTFACE=title-text-font
FISHEYE Macro Argumentspecifies whether the diagram is to be displayed with the fish-eye distortion.
Category: Diagram Appearance
Default: Y
Applies to: DS2TREE
Tip: Use the FACTOR= argument to specify the amount of distortion.
SyntaxFISHEYE=Y | N
DetailsFish-eye distortion displays the central region of the diagram at a specified size and displays the rest of the diagram as if it were mapped onto a ball where the nodes and links disappear over a curved horizon. The web user can move the diagram past the central region by scrolling or searching for nodes. The amount of distortion used in the fish-eye lens is determined by the FACTOR= argument.
FNTNAME Macro Argumentspecifies the default text font for node labels.
Category: Diagram Appearance
Applies to: DS2CONST and DS2TREE
Interaction: This argument is overridden by the NFNTNAME= and NSFNTNAM= arguments.
SyntaxFNTNAME=SERIF | SANSSERIF | DIALOG | DIALOGINPUT | MONOSPACED
FNTNAME Macro Argument 199

FNTSIZE Macro Argumentspecifies the size of the node label text font, in points.
Category: Diagram Appearance
Applies to: DS2CONST and DS2TREE
Interaction: This argument is overridden by the NFNTSIZE= argument.
SyntaxFNTSIZE=node-font-size
FNTSTYL Macro Argumentspecifies the text font style for node labels.
Category: Diagram Appearance
Default: PLAIN
Applies to: DS2CONST and DS2TREE
Interaction: This argument is overridden by the NFNTSTYL= argument.
SyntaxFNTSTYL=BOLD | ITALIC | PLAIN
FSIZE
TSIZE Macro Argumentsspecifies the size of the text font that is to be used for the SAS TITLE or FOOTNOTE.
Category: SAS TITLE and FOOTNOTE Tags
Applies to: DS2CONST and DS2TREE.
Requirement: The size specification n must be an integer value.
Note: Valid values are browser-specific depending on how the browser handles the SIZE attribute on the FONT tag.
200 Chapter 10 / DS2CONST and DS2TREE Macro Argument Dictionary

SyntaxFSIZE=n | +n | –nTSIZE=n | +n | –n
FTAG
TTAG Macro Argumentsspecify a text string that the macro translates into one or more tags that will enclose the SAS TITLE or FOOTNOTE.
Category: SAS TITLE and FOOTNOTE Tags
Default: PREFORMATTED + HEADER 3
Applies to: DS2CONST and DS2TREE.
SyntaxFTAG=tag-stringTTAG=tag-string
DetailsFor each possible value of the TTAG= and FTAG= arguments, the following table shows the HTML tags that are generated by the macro for the SAS TITLE and FOOTNOTE lines (the corresponding end tags are generated automatically).
Table 10.1 SAS Title and Footnote Tags Generated by the DS2TREE Macro
TTAG or FTAG Value
HTML Tag or Tags Enclosing the SAS TITLE or SAS FOOTNOTE
NO FORMATTING (none)
STRONG <STRONG>
EMPHASIS <EM>
HEADER 1 <H1>
HEADER 2 <H2>
HEADER 3 <H3>
HEADER 4 <H4>
TTAG Macro Arguments 201

TTAG or FTAG Value
HTML Tag or Tags Enclosing the SAS TITLE or SAS FOOTNOTE
HEADER 5 <H5>
HEADER 6 <H6>
PREFORMATTED TEXT <PRE>
CITATION TEXT <CITE>
COMPUTER CODE TEXT <CODE>
KEYBOARD INPUT TEXT <KBD>
LITERAL TEXT <SAMP>
VARIABLE TEXT <VAR>
BOLD <B>
ITALICIZED TEXT <I>
UNDERLINE TEXT <U>
TYPEWRITER <TT>
BIG TEXT <BIG>
SMALL TEXT <SMALL>
STRIKE OUT TEXT <STRIKE>
DEFINING INSTANCE TEXT <DFN>
PREFORMATTED + STRONG <PRE><STRONG>
PREFORMATTED + EMPHASIS <PRE><EM>
PREFORMATTED + HEADER 1 <PRE><H1>
PREFORMATTED + HEADER 2 <PRE><H2>
PREFORMATTED + HEADER 3 <PRE><H3>
PREFORMATTED + HEADER 4 <PRE><H4>
PREFORMATTED + HEADER 5 <PRE><H5>
202 Chapter 10 / DS2CONST and DS2TREE Macro Argument Dictionary

TTAG or FTAG Value
HTML Tag or Tags Enclosing the SAS TITLE or SAS FOOTNOTE
PREFORMATTED + HEADER 6 <PRE><H6>
PREFORMATTED + CITATION <PRE><CITE>
PREFORMATTED + COMPUTER CODE <PRE><CODE>
PREFORMATTED + KEYBOARD INPUT <PRE><KBD>
PREFORMATTED + LITERAL <PRE><SAMP>
PREFORMATTED + VARIABLE <PRE><VAR>
PREFORMATTED + BOLD <PRE><B>
PREFORMATTED + ITALICIZED <PRE><I>
PREFORMATTED + TYPEWRITER <PRE><TT>
PREFORMATTED + UNDERLINE <PRE><U>
PREFORMATTED + BIG <PRE><BIG>
PREFORMATTED + SMALL <PRE><SMALL>
PREFORMATTED + STRIKE OUT <PRE><STRIKE>
PREFORMATTED + DEFINING INSTANCE <PRE><DFN>
STRONG + EMPHASIS <STRONG><EM>
STRONG + ITALICIZED <STRONG><I>
STRONG + CITATION <STRONG><CITE>
STRONG + COMPUTER CODE <STRONG><CODE>
STRONG + KEYBOARD INPUT <STRONG><KBD>
STRONG + LITERAL <STRONG><SAMP>
STRONG + VARIABLE <STRONG><VAR>
STRONG + TYPEWRITER <STRONG><TT>
STRONG + BIG <STRONG><BIG>
TTAG Macro Arguments 203

TTAG or FTAG Value
HTML Tag or Tags Enclosing the SAS TITLE or SAS FOOTNOTE
STRONG + SMALL <STRONG><SMALL>
EMPHASIS + CITATION <EM><CITE>
EMPHASIS + COMPUTER CODE <EM><CODE>
EMPHASIS + KEYBOARD INPUT <EM><KBD>
EMPHASIS + LITERAL <EM><SAMP>
EMPHASIS + VARIABLE <EM><VAR>
EMPHASIS + TYPEWRITER <EM><TT>
EMPHASIS + BIG <EM><BIG>
EMPHASIS + SMALL <EM><SMALL>
BOLD + EMPHASIS <B><EM>
BOLD + ITALICIZED <B><I>
BOLD + CITATION <B><CITE>
BOLD + COMPUTER CODE <B><CODE>
BOLD + KEYBOARD INPUT <B><KBD>
BOLD + LITERAL <B><SAMP>
BOLD + VARIABLE <B><VAR>
BOLD + TYPEWRITER <B><TT>
BOLD + BIG <B><BIG>
BOLD + SMALL <B><SMALL>
ITALICIZED + CITATION <I><CITE>
ITALICIZED + COMPUTER CODE <I><CODE>
ITALICIZED + KEYBOARD INPUT <I><KBD>
ITALICIZED + LITERAL <I><SAMP>
204 Chapter 10 / DS2CONST and DS2TREE Macro Argument Dictionary

TTAG or FTAG Value
HTML Tag or Tags Enclosing the SAS TITLE or SAS FOOTNOTE
ITALICIZED + VARIABLE <I><VAR>
ITALICIZED + TYPEWRITER <I><TT>
ITALICIZED + BIG <I><BIG>
ITALICIZED + SMALL <I><SMALL>
STRONG + EMPHASIS + BIG <STRONG><EM><BIG>
STRONG + CITATION + BIG <STRONG><CITE><BIG>
STRONG + COMPUTER CODE + BIG <STRONG><CODE><BIG>
STRONG + KEYBOARD INPUT + BIG <STRONG><KBD><BIG>
STRONG + LITERAL + BIG <STRONG><SAMP><BIG>
STRONG + VARIABLE + BIG <STRONG><VAR><BIG>
STRONG + TYPEWRITER + BIG <STRONG><TT><BIG>
EMPHASIS + CITATION + BIG <EM><CITE><BIG>
EMPHASIS + COMPUTER CODE + BIG <EM><CODE><BIG>
EMPHASIS + KEYBOARD INPUT + BIG <EM><KBD><BIG>
EMPHASIS + LITERAL + BIG <EM><SAMP><BIG>
EMPHASIS + VARIABLE + BIG <EM><VAR><BIG>
EMPHASIS + TYPEWRITER + BIG <EM><TT><BIG>
BOLD + EMPHASIS + BIG <BOLD><EM><BIG>
BOLD + ITALICIZED + BIG <BOLD><I><BIG>
BOLD + CITATION + BIG <BOLD><CITE><BIG>
BOLD + COMPUTER CODE + BIG <BOLD><CODE><BIG>
BOLD + KEYBOARD INPUT + BIG <BOLD><KBD><BIG>
BOLD + LITERAL + BIG <BOLD><SAMP><BIG>
TTAG Macro Arguments 205

TTAG or FTAG Value
HTML Tag or Tags Enclosing the SAS TITLE or SAS FOOTNOTE
BOLD + VARIABLE + BIG <BOLD><VAR><BIG>
BOLD + TYPEWRITER + BIG <BOLD><TT><BIG>
ITALICIZED + CITATION + BIG <I><CITE><BIG>
ITALICIZED + COMPUTER CODE + BIG <I><CODE><BIG>
ITALICIZED + KEYBOARD INPUT + BIG <I><KBD><BIG>
ITALICIZED + LITERAL + BIG <I><SAMP><BIG>
ITALICIZED + VARIABLE + BIG <I><VAR><BIG>
ITALICIZED + TYPEWRITER + BIG <I><TT><BIG>
STRONG + EMPHASIS + SMALL <STRONG><EM><SMALL>
STRONG + ITALICIZED + SMALL <STRONG><I><SMALL>
STRONG + CITATION + SMALL <STRONG><CITE><SMALL>
STRONG + COMPUTER CODE + SMALL <STRONG><CODE><SMALL>
STRONG + LITERAL + SMALL <STRONG><SAMP><SMALL>
STRONG + VARIABLE + SMALL <STRONG><VAR><SMALL>
STRONG + TYPEWRITER + SMALL <STRONG><TT><SMALL>
EMPHASIS + CITATION + SMALL <EM><CITE><SMALL>
EMPHASIS + COMPUTER CODE + SMALL <EM><CODE><SMALL>
EMPHASIS + KEYBOARD INPUT + SMALL <EM><KBD><SMALL>
EMPHASIS + LITERAL + SMALL <EM><SAMP><SMALL>
EMPHASIS + TYPEWRITER + SMALL <EM><TT><SMALL>
BOLD + EMPHASIS + SMALL <BOLD><EM><SMALL>
BOLD + ITALICIZED + SMALL <BOLD><I><SMALL>
BOLD + CITATION + SMALL <BOLD><CITE><SMALL>
206 Chapter 10 / DS2CONST and DS2TREE Macro Argument Dictionary

TTAG or FTAG Value
HTML Tag or Tags Enclosing the SAS TITLE or SAS FOOTNOTE
BOLD + COMPUTER CODE + SMALL <BOLD><CODE><SMALL>
BOLD + KEYBOARD INPUT + SMALL <BOLD><KBD><SMALL>
BOLD + LITERAL + SMALL <BOLD><SAMP><SMALL>
BOLD + VARIABLE + SMALL <BOLD><VAR><SMALL>
BOLD + TYPEWRITER + SMALL <BOLD><TT><SMALL>
ITALICIZED + CITATION + SMALL <I><CITE><SMALL>
ITALICIZED + COMPUTER CODE + SMALL <I><CODE><SMALL>
ITALICIZED + KEYBOARD INPUT + SMALL <I><KBD><SMALL>
ITALICIZED + LITERAL + SMALL <I><SAMP><SMALL>
ITALICIZED + VARIABLE + SMALL <I><VAR><SMALL>
ITALICIZED + TYPEWRITER + SMALL <I><TT><SMALL>
HEIGHT Macro Argumentspecifies the height of the applet window.
Category: APPLET Tag
Default: 600
Applies to: DS2CONST and DS2TREE
Tip: The AHUNITS= argument determines the default unit of measure, which is pixels by default.
SyntaxHEIGHT=applet-height
HSPACE Macro Argumentspecifies the amount of horizontal space, in pixels, to the left and right of the graph or diagram.
Category: APPLET Tag
HSPACE Macro Argument 207

Applies to: DS2CONST and DS2TREE
SyntaxHSPACE=pixels
HTMLFILE Macro Argumentspecifies the name and storage location of the HTML output file.
Category: HTML and XML File Information
Applies to: DS2CONST and DS2TREE
Restriction: Do not specify both the HTMLFILE= and HTMLFREF= parameters. Use one or the other.
Note: If the external file does not exist, then it is created for you.
SyntaxHTMLFILE=external-filename
HTMLFREF Macro Argumentspecifies the SAS fileref that identifies the name and storage location of the HTML output file.
Category: HTML and XML File Information
Applies to: DS2CONST and DS2TREE
Restrictions: Do not specify both the HTMLFREF= and HTMLFILE= parameters. Use one or the other.Do not use a reserved name. See “Reserved Names” on page 184.
Requirement: When MAKEHTML=Y, you must specify either this argument or the HTMLFILE= argument.
Note: If the external file does not exist, then it is created for you.
SyntaxHTMLFREF=fileref
IBACKLOC Macro Argumentspecifies a URL for the image that you want to use in the background of the diagram.
Category: Diagram Appearance
208 Chapter 10 / DS2CONST and DS2TREE Macro Argument Dictionary

Applies to: DS2CONST and DS2TREE
See: IBACKPOS
SyntaxIBACKLOC=image-URL
IBACKPOS Macro Argumentspecifies how to display the background image in the IBACKLOC= argument.
Category: Diagram Appearance
Applies to: DS2CONST and DS2TREE
SyntaxIBACKPOS=CENTER | SCALE | TILE | POSITION
Argument ValuesCENTER
centers the image in the browser window without resizing the image.
SCALEresizes the image to fit the browser window.
TILEfills the browser window by replicating the image at its original size.
POSITIONpositions the image without resizing at the values specified by the IBACKX= and IBACKY= arguments.
IBACKURL Macro Argumentspecifies the URL that is displayed when you click on the background image.
Category: Diagram Appearance
Applies to: DS2CONST and DS2TREE
Interaction: This argument is valid only when IBACKPOS=POSITION.
Note: If you are including the Powered by SAS logo, then you must use this argument to link the image to the SAS website.
SyntaxIBACKURL=background-drilldown-URL
IBACKURL Macro Argument 209

IBACKX
IBACKY Macro Argumentsspecifies the x (horizontal) and y (vertical) pixel coordinates of the upper left corner of the background image.
Category: Diagram Appearance
Applies to: DS2CONST and DS2TREE
Requirement: You must specify both the IBACKX= and IBACKY= arguments.
Interaction: These parameters are valid only when IBACKPOS=POSITION.
Note: Positive values are measured from the upper left corner of the background area. Negative values are measured from the lower right corner of the background area.
SyntaxIBACKX=corner-coordinateIBACKY=corner-coordinate
LABELS Macro Argumentindicates whether node labels are displayed in the diagram.
Category: Data Definition
Default: Y
Applies to: DS2CONST and DS2TREE
SyntaxLABELS=Y | N
LAYOUT Macro Argumentspecifies whether the Constellation applet lays out the diagram using stress and strain equations or the NX= and NY= arguments.
Category: Data Definition
Default: AUTO
Applies to: DS2CONST
210 Chapter 10 / DS2CONST and DS2TREE Macro Argument Dictionary

See: NX and NY on page 230
SyntaxLAYOUT=AUTO | USER
Argument ValuesAUTO
uses the stress and strain equations to lay out the diagram.
USERuses the NX= and NY= arguments to lay out the diagram.
LCOLFMT Macro Argumentspecifies the name of a user-defined SAS format that converts the values in the variable named in the LCOLOR= argument to valid HTML color names.
Category: Data Definition
Applies to: DS2CONST and DS2TREE
Note: The SAS format does not change any values in the data set. The formatted values are applied to the diagram only.
SyntaxLCOLFMT=user-defined-format-name
LCOLOR Macro Argumentspecifies the name of the variable that determines the color of the link lines.
Category: Data Definition
Default: The value set by the CLINK= argument
Applies to: DS2CONST and DS2TREE
Requirement: The values of this argument must be valid HTML 3.2 color names. The LCOLFMT= argument can be used to specify a format that converts the values into valid HTML 3.2 color names, if necessary.
Interaction: For the DS2CONST macro, the LCOLOR= argument is overridden by the LCOLVAL= argument.
SyntaxLCOLOR=variable-name
LCOLOR Macro Argument 211

LCOLVAL Macro Argumentspecifies the name of the variable that determines the color mapping of link lines.
Category: Data Definition
Applies to: DS2CONST
Interaction: This argument is valid only when DATATYPE=ASSOC and COLORMAP=Y.
Note: If the LCOLVAL= argument is not specified, the link colors are determined by the following arguments in the following order: LCOLOR= and CLINK=.
SyntaxLCOLVAL=variable-name
LDATA Macro Argumentspecifies the name of the SAS data set that contains the link data that is used to generate the diagram.
Category: Data Definition
Applies to: DS2CONST
Requirement: This argument must be specified for the DS2CONST macro.
SyntaxLDATA=data-set-name
LFROM Macro Argumentspecifies the name of the variable whose values define the nodes at the start of link lines.
Category: Data Definition
Applies to: DS2CONST
Requirements: This argument must be specified for the DS2CONST macro.The LFROM= variable values must be coordinated with the values of the variables that are named in the NID= and LTO= arguments.
SyntaxLFROM=variable-name
212 Chapter 10 / DS2CONST and DS2TREE Macro Argument Dictionary

LINKTYPE Macro Argumentspecifies whether the links are drawn as lines or arrows that indicate the direction of flow.
Category: Data Definition
Default: ARROW
Applies to: DS2CONST
SyntaxLINKTYPE=LINE | ARROW
LPT Macro Argumentspecifies the password that is needed for accessing a password-protected link data set that is specified with the LDATA= argument.
Category: Data Definition
Applies to: DS2CONST
Note: The LPT= argument is required if the data set has a READ or PW password. You do not need to specify this argument if the data set has a WRITE or ALTER password.
SyntaxLPT=password
LSTIP Macro Argumentspecifies the name of the variable in the data set that determines the stipple mask.
Category: Data Definition
Applies to: DS2CONST and DS2TREE
See: LSTIPFAC
SyntaxLSTIP=variable-name
LSTIP Macro Argument 213

DetailsThe stipple mask generates dashed or dotted link lines. The value of the variable must be an integer, which is then converted into a binary value. In the binary value, a “1” bit means that a pixel is to be drawn and a “0” bit means that no pixel is to be drawn. For example, if the variable has a value of 61680, the binary conversion of that value is 1111000011110000. This stipple mask generates a dashed link line with dashes and spaces that are four pixels wide.
LSTIPFAC Macro Argumentspecifies the name of the variable in the data set whose value specifies a multiplier for the binary stipple mask.
Category: Data Definition
Applies to: DS2CONST and DS2TREE
Note: The multiplier lengthens the dashes in the base mask. For example, if the multiplier is 2, a stipple mask that specifies four-pixel dashes and four-pixel spaces generates link lines with eight-pixel dashes and spaces.
See: LSTIP
SyntaxLSTIPFAC=variable-name
LTIP Macro Argumentspecifies the name of the variable in the data set that provides the text that is displayed in the pop-up data tips windows for links.
Category: Data Definition
Applies to: DS2CONST and DS2TREE
SyntaxLTIP=variable-name
LTIPFMT Macro Argumentspecifies the name of a user-defined SAS format that is applied to the values in the variable specified in the LTIP= argument to configure those values for display in the pop-up data tips window.
Category: Data Definition
Applies to: DS2CONST and DS2TREE
214 Chapter 10 / DS2CONST and DS2TREE Macro Argument Dictionary

Note: The SAS format does not change any values in the data set. The formatted values are applied to the diagram only.
SyntaxLTIPFMT=user-defined-format-name
LTO Macro Argumentspecifies the name of the variable whose values identify the nodes at the ends of link lines.
Category: Data Definition
Applies to: DS2CONST
Requirements: This argument must be specified for the DS2CONST macro.The LTO= variable values must be coordinated with the values of the variables that are named in the LFROM= and NID= arguments.
SyntaxLTO=variable-name
LVALUE Macro Argumentspecifies the name of the variable whose values determine the weights of the link lines, which determines the color and relative thickness of link lines.
Category: Data Definition
Applies to: DS2CONST
Requirement: The variable values must be real numbers.
Interaction: The LVALUE= argument is valid only when DATATYPE=ASSOC.
Note: The link weights are used with the MINLNKWT= argument and the SCLNKWT= argument to control the display of link lines.
SyntaxLVALUE=variable-name
LWHERE Macro Argumentspecifies a WHERE clause that subsets the link data for display in the diagram.
Category: Data Definition
LWHERE Macro Argument 215

Applies to: DS2CONST
Note: If the expression contains any special characters (for example, % or &), include %NRBQUOTE in the expression to process those characters correctly. The following example shows how to correctly specify INT%:
LWHERE=%NRBQUOTE(value="Int%")
See: NWHERE on page 229
SyntaxLWHERE=subset-expression
LWIDTH Macro Argumentspecifies the name of the variable in the data set that determines the width of the link lines.
Category: Data Definition
Defaults: For DS2CONST, the width is determined by the LVALUE= argument.For DS2TREE, the width of all of the links is set to the minimum link width in the pixel range.
Applies to: DS2CONST and DS2TREE
Interaction: For DS2CONST, this argument is valid only when DATATYPE=ASSOC.
Note: For DS2TREE, this option maps the range of values of the specified variable to a range of link widths. If only one link width value is provided for all of the links, then the width of all of the links is set to the minimum link width in the pixel range.
SyntaxLWIDTH=variable-name
MAKEHTML Macro Argumentspecifies whether an HTML file is to be generated.
Category: HTML and XML File Information
Default: Y
Applies to: DS2CONST and DS2TREE
Note: If you specify MAKEHTML=N and MAKEXML=Y, then only an XML file is generated.
SyntaxMAKEHTML=Y | N
216 Chapter 10 / DS2CONST and DS2TREE Macro Argument Dictionary

MAKEXML Macro Argumentspecifies whether an XML file is to be generated.
Category: HTML and XML File Information
Default: Y
Applies to: DS2CONST and DS2TREE
Requirement: If MAKEXML=N and MAKEHTML=Y, you must specify a value for the XMLURL= argument.
Note: When you specify MAKEXML=N and MAKEHTML=Y, only an HTML file is generated.
SyntaxMAKEXML=Y | N
MINLNKWT Macro Argumentspecifies the initial minimum link weight, which determines which links are initially displayed.
Category: Data Definition
Applies to: DS2CONST
Interaction: This argument is valid only when DATATYPE=ASSOC.
Note: Link weights are determined by the LVALUE= argument.
SyntaxMINLNKWT=minimum-link-weight
DetailsThe initial diagram shows only those links that have weights that are greater than or equal to the minimum weight. In the Constellation Applet, a scroll bar enables the web user to change the minimum link weight in order to change the number of links that are displayed. Selecting the browser's Refresh option restores the initial minimum link weight that is specified in the MINLNKWT= argument.
NACTION Macro Argumentspecifies the name of the variable in the nodes data set that provides the menu text that is displayed for custom actions for each node.
Category: Data Definition
NACTION Macro Argument 217

Default: Menu option text “Open URL (URL-string”
Applies to: DS2CONST and DS2TREE
Restriction: For DS2CONST, the variable can specify only one menu text string.
Requirement: For DS2TREE:n When the variable specifies multiple menu text strings, each string must be
separated by a semicolon.n When the NURL= argument specifies multiple URLs, the number of menu text strings
that are specified by the variable must match the number of URLs that are specified by the NURL= argument.
Interaction: This argument overrides the ACTION= argument.
SyntaxNACTION=variable-name
DetailsThe way in which this option is used differs between DS2CONST and DS2TREE. For DS2CONST, only one menu text string is specified. In the constellation diagram, the menu option text appears in the pop-up menu when a user right-clicks a node. Selecting the menu option text in the pop-up menu opens the URL that is specified by the NURL= argument.
For DS2TREE, one or more menu text strings can be specified, which correspond one-to-one with the URLs that are specified by the NURL= argument. When multiple menu text strings are specified in the variable value, each string is separated by a semicolon. When the user right-clicks a node in the treeview diagram and then selects Custom Action in the pop-up menu, the menu option text is displayed as a list of one or more actions. Selecting a menu item in the Custom Action menu opens the URL that is associated with that menu item.
NAME Macro Argumentspecifies the name for this instance of the applet.
Category: APPLET Tag
Applies to: DS2CONST and DS2TREE
Note: Use this argument only if you have more than one instance of the APPLET tag in your HTML file, and if you have included your own scripts or DHTML that communicates with or acts on a particular instance of the applet.
SyntaxNAME=applet-name
218 Chapter 10 / DS2CONST and DS2TREE Macro Argument Dictionary

NCOLFMT Macro Argumentspecifies the name of a user-defined SAS format that converts the values in the variable named in the NCOLOR= argument to valid HTML color names.
Category: Data Definition
Applies to: DS2TREE
Note: The data in the data set is not altered; the formatted value is used in the hierarchical tree rather than the data value.
SyntaxNCOLFMT=SAS-format-name
NCOLOR Macro Argumentspecifies the variable in the nodes data set that determines the background color of the nodes.
Category: Data Definition
Applies to: DS2CONST and DS2TREE
Requirement: The colors must be specified as HTML 3.2 color names or six-digit hexadecimal RGB values.
Tip: If the variable does not contain valid HTML color names, then you can use the NCOLFMT= argument to convert those values to the HTML color names.
See: NCOLVAL on page 219 and NVALUE on page 229
SyntaxNCOLOR=variable-name
NCOLVAL Macro Argumentspecifies the name of the variable in the nodes data set that determines the color mapping for the nodes.
Category: Data Definition
Default: The value specified by the LVALUE= argument
Applies to: DS2CONST
Interaction: This argument is valid only when DATATYPE=ASSOC and COLORMAP=Y.
NCOLVAL Macro Argument 219

SyntaxNCOLVAL=variable-name
NDATA Macro Argumentspecifies the SAS data set that contains the node data.
Category: Data Definition
Applies to: DS2CONST and DS2TREE
Requirement: This argument must be specified for the DS2CONST and DS2TREE macros.
SyntaxNDATA=SAS-data-set-name
NFNTNAME Macro Argumentspecifies the name of the variable that determines the text font for the node labels.
Category: Data Definition
Default: The font specified by the FNTNAME= argument.
Applies to: DS2CONST and DS2TREE
SyntaxNFNTNAME=SERIF | SANSSERIF | DIALOG | DIALOGINPUT | MONOSPACED
NFNTSIZE Macro Argumentspecifies the name of the variable in the nodes data set that determines the size of the text font used for node labels.
Category: Data Definition
Applies to: DS2CONST and DS2TREE
Interaction: This argument overrides the FNTSIZE= argument.
Note: This font size is expressed in points.
SyntaxNFNTSIZE=variable-name
220 Chapter 10 / DS2CONST and DS2TREE Macro Argument Dictionary

NFNTSTYL Macro Argumentspecifies the name of the variable that determines the font style for the node label.
Category: Data Definition
Applies to: DS2CONST and DS2TREE
SyntaxNFNTSTYL=BOLD | ITALIC | PLAIN
NID Macro Argumentspecifies the name of the variable in the nodes data set whose values are to be illustrated as the nodes in the diagram.
Category: Data Definition
Applies to: DS2CONST and DS2TREE
Requirements: You must specify a value for this argument.For the DS2CONST macro, the values of the NID= variable must be coordinated with the values of the LFROM= and LTO= variables.
Note: The node ID variable type can be either numeric or character.
SyntaxNID=variable-name
NLABEL Macro Argumentspecifies the name of the variable that represents the node labels.
Category: Data Definition
Applies to: DS2CONST and DS2TREE
Note: This variable type can be either numeric or character.
SyntaxNLABEL=node-label-variable-name
NLABEL Macro Argument 221

NODEBDR Macro Argumentspecifies the appearance of the node border line.
Category: Diagram Appearance
Default: OUTLINE
Applies to: DS2TREE
SyntaxNODEBDR=LINE | NONE | FILL | OUTLINE
Argument ValuesLINE
show solid border lines around the nodes.
NONEshow no border lines or background.
FILLshow background but no border lines.
OUTLINEshow a border line and background. This is the default value.
NODESHAP Macro Argumentspecifies the shape of the nodes.
Category: Diagram Appearance
Default: SQUARE
Applies to: DS2CONST
Interaction: This argument is overridden by the NSHAPE= argument.
Tip: When DATATYPE=ASSOC, NODESHAP=NONE is ignored and square nodes are displayed. To hide the nodes in that case, use DATATYPE=ARCS and NODESHAP=NONE.
SyntaxNODESHAP=CIRCLE | DIAMOND | NONE | SQUARE | TRIANGLE
222 Chapter 10 / DS2CONST and DS2TREE Macro Argument Dictionary

NPARENT Macro Argumentspecifies the name of the variable that represents the parent nodes.
Category: Data Definition
Applies to: DS2TREE
Note: This variable type can be either numeric or character.
SyntaxNPARENT=node-parent-variable-name
NPW Macro Argumentspecifies the password that is needed for accessing a password-protected data set.
Category: Data Definition
Applies to: DS2CONST and DS2TREE
Requirement: You must provide a value for this argument if the data set has a READ or PW password. You do not need to specify a value for this argument if the data set has only WRITE or ALTER passwords.
SyntaxNPW=password
NSCBACK Macro Argumentspecifies the name of the variable in the node styles data set that determines the background color of the nodes.
Category: Data Definition
Default: The value of the CNODE= argument.
Applies to: DS2CONST and DS2TREE
Requirement: The variable values must be valid HTML 3.2 color names.
SyntaxNSCBACK=variable-name
NSCBACK Macro Argument 223
NSCTEXT Macro Argumentspecifies the name of the variable in the node styles data set that provides the colors for the node label text.
Category: Data Definition
Default: The value of the CATEXT= argument
Applies to: DS2CONST and DS2TREE
Requirement: The variable values must be valid HTML 3.2 color names.
SyntaxNSCTEXT=variable-name
NSDATA Macro Argumentspecifies the name of the node styles data set.
Category: Data Definition
Applies to: DS2CONST and DS2TREE
SyntaxNSDATA=SAS-data-set-name
NSFNTNAM Macro Argumentspecifies the name of the variable in the node styles data set that determines the text font that is to be used for node labels.
Category: Data Definition
Applies to: DS2CONST and DS2TREE
Interaction: This argument overrides the FNTNAME= argument.
SyntaxNSFNTNAM=SERIF | SANSSERIF | DIALOG | DIALOGINPUT | MONOSPACED
224 Chapter 10 / DS2CONST and DS2TREE Macro Argument Dictionary

NSFNTSIZ Macro Argumentspecifies the name of the variable in the node styles data set that determines the size of the node label text, in points.
Category: Data Definition
Applies to: DS2CONST and DS2TREE
Interaction: This argument overrides the FNTSIZE= argument.
SyntaxNSFNTSIZ=variable-name
NSFNTSTY Macro Argumentspecifies the name of the variable in the node styles data set that determines the style of the node label text.
Category: Data Definition
Default: PLAIN
Applies to: DS2CONST and DS2TREE
Interaction: This argument overrides the FNTSTYL= argument.
SyntaxNSFNTSTY=BOLD | ITALIC | PLAIN
NSHAPE Macro Argumentspecifies the name of the variable that determines the shape of the nodes.
Category: Data Definition
Default: SQUARE
Applies to: DS2CONST
Interaction: This argument overrides the NODESHAP= argument.
SyntaxNSHAPE=CIRCLE | DIAMOND | NONE | SQUARE | TRIANGLE
NSHAPE Macro Argument 225

NSID Macro Argumentspecifies the name of the variable in the node styles data set that represents the nodes.
Category: Data Definition
Applies to: DS2CONST and DS2TREE
SyntaxNSID=variable-name
NSIZE Macro Argumentspecifies the name of the variable that determines the size of the nodes.
Category: Data Definition
Applies to: DS2CONST
Interaction: This argument is valid only when DATATYPE=ASSOC.
Note: The values of this variable can be real numbers.
SyntaxNSIZE=variable-name
DetailsNode sizes are determined based on the value of the LAYOUT= argument. When LAYOUT=USER, the values of the NSIZE variable are interpreted as literal pixel measurements. When LAYOUT=AUTO, the values of the NSIZE variable determine the size of the nodes based on the relative size of individual values. The values of the NSIZE variable can be scaled with the SCNSIZE= argument.
NSPW Macro Argumentspecifies the password that is needed to access a password-protected node styles data set.
Category: Data Definition
Applies to: DS2CONST and DS2TREE
Requirement: You must specify a value for this argument if the data set has a READ or PW password. You do not need to specify a value for this argument if the data set has only WRITE or ALTER passwords.
226 Chapter 10 / DS2CONST and DS2TREE Macro Argument Dictionary

SyntaxNSPW=password
NSTYLE Macro Argumentspecifies the name of the variable that determines the style of the nodes.
Category: Data Definition
Applies to: DS2CONST and DS2TREE
Requirement: The values must correspond to the node identifiers specified in the NSID= argument.
Note: This variable type can be either numeric or character.
SyntaxNSTYLE=variable-name
NSWHERE Macro Argumentspecifies a WHERE clause that subsets the node styles data set for display in the diagram.
Category: Data Definition
Applies to: DS2CONST and DS2TREE
Tip: If the expression contains any special characters (for example, % or &), then include %NRBQUOTE in the expression to process those characters correctly.
Example: The following example shows how to correctly specify INT%:
NSWHERE=%NRBQUOTE(value="Int%")
SyntaxNSWHERE=subset-expression
NTEXTCOL Macro Argumentspecifies the name of the variable that determines the color of the text for the node labels.
Category: Data Definition
Applies to: DS2CONST and DS2TREE
Requirement: Variable values must be valid HTML 3.2 color names.
NTEXTCOL Macro Argument 227

SyntaxNTEXTCOL=variable-name
NTIP Macro Argumentspecifies the name of the variable that provides the data or text that is displayed in the pop-up data tips window.
Category: Data Definition
Applies to: DS2CONST and DS2TREE
SyntaxNTIP=variable-name
NTIPFMT Macro Argumentspecifies the name of a user-defined SAS format that is applied to the data tips variable that is named in the NTIP= argument.
Category: Data Definition
Applies to: DS2CONST and DS2TREE
Note: The data set is not altered; the formatted value is used only in the diagram.
See: NTIP on page 228
SyntaxNTIPFMT=user-defined-format-name
NURL Macro Argumentspecifies the name of the variable that provides the drill-down URLs for each node.
Category: Data Definition
Default: No URL is assigned to the nodes. The Open URL or Custom Action menu item is disabled.
Applies to: DS2CONST and DS2TREE
Restriction: For DS2CONST, the variable specifies only one URL for each node.
Requirement: For DS2TREE, when the variable specifies multiple URLs, each URL must be separated by a semicolon.
228 Chapter 10 / DS2CONST and DS2TREE Macro Argument Dictionary

SyntaxNURL=drill-down-URL
DetailsThe way in which this option is used differs between DS2CONST and DS2TREE. For DS2CONST, the variable specifies only one URL for each node. In the constellation diagram, if a URL is assigned to a node, menu item Open URL is enabled in that node’s pop-up menu. To open the URL in a web browser window, you can double-click the node, or you can select Open URL in the node’s pop-up menu.
For DS2TREE, the variable specifies one or more URLs for each node. Multiple URLs are separated by a semicolon. In the treeview diagram, if one or more URLs are assigned to a node, menu item Custom Action is enabled in that node’s pop-up menu. To display a list of the URLs that are assigned to the node, select Custom Action in the pop-up menu. To open a URL in a web browser window, select the URL in the list.
By default, the URL appears in the pop-up menu as Open URL in a constellation diagram and as Open URL (URL-string) in a treeview diagram. You can use the NACTION= argument or the ACTION= argument to change the default menu text.
NVALUE Macro Argumentspecifies the name of the variable that determines the relative node size.
Category: Data Definition
Default: The largest value of NVALUE is mapped to red, the median value to green, and the lowest value to blue. Values in between result in interpolated colors.
Applies to: DS2CONST
Interactions: This argument is valid only when DATATYPE=ASSOC.If you do not specify a particular node color using either the NCOLOR=or NCOLVAL= argument (and if COLORMAP=Y), then this argument also determines a default node color.
SyntaxNVALUE=variable-name
NWHERE Macro Argumentspecifies a WHERE clause that subsets the nodes data set for display in the diagram.
Category: Data Definition
Applies to: DS2CONST and DS2TREE
Tip: If the expression contains any special characters (for example, % or &), then include %NRBQUOTE in the expression to process those characters correctly.
NWHERE Macro Argument 229

See: LWHERE on page 215
Example: The following example shows how to correctly specify INT%:
NWHERE=%NRBQUOTE(value="Int%")
SyntaxNWHERE=subset-expression
NX
NY Macro Argumentsspecify the variables that determine the locations of the centers of the nodes.
Category: Data Definition
Applies to: DS2CONST
Interaction: These arguments are valid only when LAYOUT=USER.
Notes: The values are expressed in pixels.Positive values are measured from the top left corner of the screen. Negative values are measured from the bottom right corner of the screen.
SyntaxNX=variable-nameNY=variable-name
OPENMODE Macro Argumentindicates whether the new HTML or XML output or both overwrites the information that is currently in the specified file or files, or whether the new output is appended to the end of the existing file or files.
Category: HTML and XML File Information
Default: REPLACE
Applies to: DS2CONST and DS2TREE
Note: APPEND is not valid if you are writing your resulting HTML to a partitioned data set (PDS) on z/OS.
SyntaxOPENMODE=REPLACE | APPEND
230 Chapter 10 / DS2CONST and DS2TREE Macro Argument Dictionary

PAGEPART Macro Argumentspecifies which part or parts of the HTML page are to be written into the HTML output file.
Category: Page Formatting
Default: ALL
Applies to: DS2CONST and DS2TREE
Tip: This argument is helpful when you are appending HTML output to the end of an existing HTML file, or when you are using separate files for the head, body, and foot of your web page.
SyntaxPAGEPART=ALL | HEAD | BODY | FOOT
Argument ValuesALL
writes the entire HTML file, including the XML tags for the DS2CONST and DS2TREE. Do not use this value if you are appending an existing HTML file.
HEADwrites the HTML header information and or XML (for DS2CONST and DS2TREE) into the HTML file. The header information consists of the HEAD and BODY tags. HTML footer information is not included.
BODYwrites only the XML tags (for DS2CONST and DS2TREE) into the HTML output file. No head or foot information is generated in the HTML output file.
FOOTwrites metagraphics codes or XML tags and the </BODY> and </HTML> tags to conclude the HTML file.
RBSIZING Macro Argumentspecifies whether the height and the width of the dialog box frames are read in from the resource bundle.
Category: Diagram Appearance
Default: N
Applies to: DS2CONST and DS2TREE
SyntaxRBSIZING=Y | N
RBSIZING Macro Argument 231

Detailsthe default value N indicates that size information from the resource bundle is not to be used for sizing the two dialog boxes that can be invoked from the pop-up menu that appears when a user right-clicks on a diagram. The two dialog boxes are the About dialog box and the Mouse Help dialog box.
Specify Y for this argument for languages other than English. If you specify Y, then the height and the width of the dialog box frames are read in from the resource bundle. This enables translators to set appropriate heights and widths for the frames in the resource bundle, based on the length of the message strings in each language.
RUNMODE Macro Argumentspecifies whether you are running the DS2TREE macro in batch or server mode.
Category: HTML and XML File Information
Applies to: DS2CONST and DS2TREE
Note: Batch mode (RUNMODE=B, the default) means that you are submitting the DS2TREE macro in the SAS Program Editor or you have included it in a SAS program. Server mode (RUNMODE=S) generates the HTTP header that is required by Application Dispatcher in the SAS/IntrNet software.
SyntaxRUNMODE=B | S
SASPOWER Macro Argumentspecifies the path or URL, relative or absolute, to the image file of the SAS Powered logo.
Category: Page Formatting
Default: The logo is omitted
Applies to: DS2CONST and DS2TREE
Note: In the HTML file, the image appears at the bottom of the page. Selecting the image displays the SAS home page.
Tip: To obtain the logo image file, see http://www2.sas.com/dispatcher/index.html.
See: SPCLASS on page 235
SyntaxSASPOWER=logo-image-file
232 Chapter 10 / DS2CONST and DS2TREE Macro Argument Dictionary

SCLNKWT Macro Argumentspecifies whether the link weight values are to be scaled into the range of 0–1, which corresponds to 0–100%.
Category: Diagram Appearance
Default: Y
Applies to: DS2CONST
Interaction: The SCLNKWT= argument is valid only when DATATYPE=ASSOC.
Note: When SCLNKWT=N, the range of link weights (maximum minus minimum) must be greater than 2. Otherwise, the scroll bar does not correctly map the link weights.
SyntaxSCLNKWT=Y | N
DetailsWhen the value is Y (default), specifies that the link weight values are to be scaled into the range of 0–1, which corresponds to 0–100%. When SCLNKWT=Y, the scroll bar in Constellation Applet displays a percentage of the range of the link weights. When SCLNKWT=N, the link weights are not scaled and the scroll bar reflects the actual link weight data values. These values are real numbers that are specified in the LVALUE= argument.
SCLWIDTH Macro Argumentspecifies whether the link width values are to be scaled into the range of 0–1.
Category: Diagram Appearance
Applies to: DS2CONST
Interaction: This argument is valid only when DATATYPE=ASSOC.
Note: When the value is Y (default), indicates that the link width values are to be scaled into the range of 0–1. Specifying N indicates that the link widths are already scaled into that range.
SyntaxSCLWIDTH=Y | N
SCLWIDTH Macro Argument 233

SCNSIZE Macro Argumentspecifies whether the node size values are to be scaled into the range of 0–1.
Category: Diagram Appearance
Applies to: DS2CONST
Interaction: This argument is valid only when DATATYPE=ASSOC.
Note: When the value is Y (default), indicates that the node size values are to be scaled into the range of 0–1. Specifying N indicates that the node sizes are already scaled into that range.
Tip: Use the NSIZE= argument to specify the node size.
SyntaxSCNSIZE=Y | N
SEPCLASS Macro Argumentspecifies the path or URL, relative or absolute, to the style sheet that is used for the page separator.
Category: Page Formatting
Applies to: DS2CONST and DS2TREE
Interaction: If the value of the SEPTYPE= argument is RULE, then the value of the SEPCLASS= argument is used on the CLASS attribute of the HTML tag <HR>. If the value of the SEPTYPE= argument is IMAGE, then the value of SEPCLASS= argument is used on the CLASS attribute of the HTML tag <IMG>.
SyntaxSEPCLASS=page-separator-stylesheet
SEPLOC Macro Argumentspecifies the path or URL, relative or absolute, to the image that you want to use as the separator between the graphs in your presentation.
Category: Page Formatting
Applies to: DS2CONST and DS2TREE
Interaction: This argument is valid only when SEPTYPE=IMAGE.
234 Chapter 10 / DS2CONST and DS2TREE Macro Argument Dictionary

SyntaxSEPLOC=separator-image
SEPTYPE Macro Argumentspecifies the type of separator that is used between multiple applets in your presentation.
Category: Page Formatting
Default: RULE
Applies to: DS2CONST and DS2TREE
SyntaxSEPTYPE=IMAGE | NONE | RULE
Argument ValuesIMAGE
specifies separate graphs using the image specified in the SEPLOC= argument.
NONEspecifies not to use a separator between applets.
RULEinserts a line between applets. This is the default.
SHOWLINKS Macro Argumentspecifies whether initially to display all arc lines between nodes.
Category: Diagram Appearance
Default: Y
Applies to: DS2CONST
Notes: This argument affects only the initial display. A viewer can subsequently control which arc lines are displayed by right-clicking and selecting Show links from the pop-up menu.Specifying N suppresses all arc lines.
SyntaxSHOWLINKS=Y | N
SPCLASS Macro Argumentspecifies the name of the style sheet class that is to be used for the Powered by SAS logo.
SPCLASS Macro Argument 235

Category: Page Formatting
Applies to: DS2CONST and DS2TREE
SyntaxSPCLASS=logo-stylesheet-name
SPREAD Macro Argumentspecifies the angular spreading factor for the layout of the diagram.
Category: Diagram Appearance
Default: 1.25
Applies to: DS2TREE
Requirement: The value specified must be greater than or equal to 1.0.
SyntaxSPREAD=angular-factor
SSFILE1–SSFILE5 Macro Argumentsembeds in the HTML file the entire contents of the specified file.
Category: Style Sheets
Applies to: DS2CONST and DS2TREE
SyntaxSSFILE1–SSFILE5=file-specification
SSFREF1–SSFREF5 Macro Argumentsembeds in the HTML file the entire contents of the file that is referenced by the SAS fileref.
Category: Style Sheets
Applies to: DS2CONST and DS2TREE
SyntaxSSFREF1–SSFREF5=fileref
236 Chapter 10 / DS2CONST and DS2TREE Macro Argument Dictionary

SSHREF1–SSHREF5 Macro Argumentsspecifies the URL of the style sheet in the HREF= attribute of the LINK tag.
Category: Style Sheets
Applies to: DS2CONST and DS2TREE
Note: If you specify a relative URL, it must be relative to the location of the HTML output file.
SyntaxSSHREF1–SSHREF5=style-sheet-URL
SSMEDIA1–5 Macro Argumentsspecifies the media for which the style sheet was designed.
Category: Style Sheets
Default: The value of SCREEN
Applies to: DS2CONST and DS2TREE
Notes: The value is applied to the MEDIA= attribute of the LINK tag.Examples of other valid MEDIA values include BRAILLE for tactile feedback devices, and HANDHELD for small-screen devices.
SyntaxSSMEDIA1–5=media
SSREL1–5 Macro Argumentsspecifies the REL= attribute of the LINK tag, which describes the relationship from the linked file to the HTML file.
Category: Style Sheets
Applies to: DS2CONST and DS2TREE
SyntaxSSREL1–5=relationship
SSREL1–5 Macro Arguments 237

DetailsThe value of this tag is generally STYLESHEET. The arguments SSREL1–5= can also be used with the arguments SSREV1–5 to link HTML pages in a series. For example, the SSREL1= argument can specify the next document in the series, and the SSREV2= argument can specify the reverse relationship, which would be the previous document in the series. Both arguments, SSRELn= and SSREVn=, can appear in the same LINK tag.
SSREV1–5 Macro Argumentsspecifies the REV= attribute of the LINK tag, which describes the relationship from the HTML file to the linked file.
Category: Style Sheets
Applies to: DS2CONST and DS2TREE
See: SSREL1–5
SyntaxSSREV1–5=relationship
SSTITLE1–5 Macro Argumentsspecifies the TITLE= attribute of the LINK tag. The TITLE= attribute provides a title for the referenced page.
Category: Style Sheets
Applies to: DS2CONST and DS2TREE
Tip: Use this argument when you are using the SSRELn= and SSREVn= arguments to specify next and previous links in a series of web pages.
SyntaxSSTITLE1–5=title-of-linked-page
SSTYPE1–5 Macro Argumentsspecifies the TYPE= attribute of the LINK tag.
Category: Style Sheets
Applies to: DS2CONST and DS2TREE
Tip: For cascading style sheets, this value usually is TEXT/CSS. For JavaScript style sheets, this value is generally TEXT/JAVASCRIPT.
238 Chapter 10 / DS2CONST and DS2TREE Macro Argument Dictionary

SyntaxSSTYPE1–5=stylesheet-type
TCLASS Macro Argumentspecifies the name of the style sheet class that is to be used for the SAS TITLE or FOOTNOTE.
See: FCLASS and TCLASS on page 198
TCOLOR Macro Argumentspecifies the color of the text in the SAS TITLE or FOOTNOTE.
See: FCOLOR and TCOLOR on page 198
TFACE Macro Argumentspecifies a text font for the SAS TITLE or FOOTNOTE.
See: FFACE and TFACE on page 198
TIPS Macro Argumentindicates whether pop-up data tips are displayed when the cursor is positioned over nodes or links or both.
Category: Diagram Appearance
Default: Y
Applies to: DS2CONST and DS2TREE
SyntaxTIPS=Y | N
TIPTYPE Macro Argumentspecifies whether the pop-up data tip window moves with the cursor or remains stationary.
Category: Diagram Appearance
Default: TRACKING
Applies to: DS2CONST
TIPTYPE Macro Argument 239

SyntaxTIPTYPE=TRACKING | STATIONARY
TRANLIST Macro Argumentspecifies the name and location of an existing transcoding list, either user-defined or from SAS.
Category: Character Transcoding
Applies to: DS2CONST and DS2TREE
Requirements: This argument is required if you are implementing character transcoding.The transcoding list name must be a four-level name, and the fourth level must be SLIST, as in the following example:
TRANLIST=SASHELP.HTMLGEN.IDENTITY.SLIST
Tip: SAS provides a number of transcoding lists in the SASHELP.HTMLNLS catalog. For a description of these transcoding lists, and for information about generating your own transcoding lists, see the SAS website at http://support.sas.com/rnd/web/intrnet/format/lang2.html.
SyntaxTRANLIST=transcoding-list-name
TREEDIR Macro Argumentdetermines the growth direction of the node and link diagram.
Category: Diagram Appearance
Default: CIRCULAR
Applies to: DS2TREE
Interaction: The TREEDIR= argument overrides the ANGLE= argument.
SyntaxTREEDIR=CIRCULAR | DOWN | LEFT | RIGHT | UP
Argument ValuesCIRCULAR
grows the tree in a circular pattern. This is the default value.
Alias C
DOWNgrows the tree from top to bottom using center alignment.
240 Chapter 10 / DS2CONST and DS2TREE Macro Argument Dictionary

Alias D
LEFTgrows the tree from left to right and top to bottom.
Alias L
RIGHTgrows the tree from right to left and top to bottom.
Alias R
UPgrows the tree from the bottom up using center alignment.
Alias U
DetailsIf the value of the TREEDIR= argument is UP or DOWN, then the value of the TREESPAN= argument is used to set the angular width of the diagram. The starting node is aligned horizontally in the center of the applet. The diagram grows out of the starting node based on the angular width specified in the TREESPAN= argument. The wider the angle, the wider the layout of the diagram.
TREESPAN Macro Argumentspecifies the angular width of the diagram in degrees.
Category: Diagram Appearance
Default: 60
Range: 0 < angular-diagram-width < 360
Applies to: DS2TREE
See: TREEDIR and ANGLE on page 187
SyntaxTREESPAN=angular-diagram-width
TSIZE Macro Argumentspecifies the size of the text font that is to be used for the SAS TITLE or FOOTNOTE.
See: FSIZE and TSIZE on page 200
TSIZE Macro Argument 241

TTAG Macro Argumentspecifies a text string that the macro translates into one or more tags that will enclose the SAS TITLE or FOOTNOTE.
See: FTAG and TTAG on page 201
VSPACE Macro Argumentspecifies the amount of vertical space, in pixels, to the top and bottom of the graph or diagram.
Category: APPLET Tag
Applies to: DS2CONST and DS2TREE
SyntaxVSPACE=pixels
WIDTH Macro Argumentspecifies the width of the applet window.
Category: APPLET Tag
Applies to: DS2CONST and DS2TREE
Note: The unit of measure defaults to pixels unless otherwise specified by the AWUNITS= argument.
SyntaxWIDTH=applet-width
XMLFILE Macro Argumentspecifies the name and storage location of the XML output file.
Category: HTML and XML File Information
Applies to: DS2CONST and DS2TREE
Restriction: Do not specify both XMLFILE= and XMLFREF=. Specify one or the other.
Requirement: If you specify MAKEXML=Y and XMLTYPE=EXTERNAL, you must also specify the XMLFILE= argument or the XMLREF= argument.
Note: If the external file does not exist, then it is created for you.
242 Chapter 10 / DS2CONST and DS2TREE Macro Argument Dictionary

SyntaxXMLFILE=external-filename
XMLFREF Macro Argumentspecifies the SAS fileref that identifies the name and storage location of the XML output file.
Category: HTML and XML File Information
Applies to: DS2CONST and DS2TREE
Restrictions: Do not specify both XMLFREF and XMLFILE. Specify one or the other.Do not use a reserved name. See “Reserved Names” on page 184.
Requirement: If you specify MAKEXML=Y and XMLTYPE=EXTERNAL, you must also specify the XMLFREF= or XMLFILE= argument.
Note: If the external file does not exist, then it is created for you.
SyntaxXMLFREF=fileref
XMLTYPE Macro Argumentspecifies whether the XML output file is to be written to an external file or included inline with the HTML.
Category: HTML and XML File Information
Default: INLINE
Applies to: DS2CONST and DS2TREE
Requirements: If you specify MAKEXML=Y, you must also specify the XMLTYPE= argument. If you specify EXTERNAL=, you must also specify a value for the XMLFILE= argument or the XMLFREF= argument.
SyntaxXMLTYPE=INLINE | EXTERNAL
XMLURL Macro Argumentspecifies the URL of the existing file that contains the XML tags that define the node and link diagram.
Category: HTML and XML File Information
XMLURL Macro Argument 243

Applies to: DS2CONST and DS2TREE
Requirement: If you specify XMLTYPE=EXTERNAL, you must also specify a value for the XMLURL= argument.
SyntaxXMLURL=URL
ZOOM Macro Argumentspecifies the zoom value that is used for the initial display of the diagram.
Category: Diagram Appearance
Default: 100
Applies to: DS2CONST
SyntaxZOOM=starting-percentage
DetailsAfter the initial display, the web user can change the zoom percentage moving the mouse upward or downward while pressing Ctrl + left mouse button. Selecting the Refresh button on the browser runs the applet and restores the initial zoom setting. The default value is 100%. The initial diagram can be scaled up with a value greater than 100 or scaled down with a value less than 100.
244 Chapter 10 / DS2CONST and DS2TREE Macro Argument Dictionary