SAS/GRAPH 9.4: Java Applets and ActiveX Control User's Guide
Upload
khangminh22Category
view
3download
0
© 2009-2021 Eye4Software B.V.
Eye4Software Hydromagic 9.4

Eye4Software Hydromagic 9.42
© 2009-2021 Eye4Software B.V.
Table of Contents
Foreword 0
Part I Introduction 6
1 Supported Hardware ........................................................................................................... 6
Part II Configuration 9
1 Installation .......................................................................................................................... 9
2 Activation .......................................................................................................................... 10
3 Hardware Configuration .................................................................................................... 13
Configuring NMEA0183 hardware ..................................................................................................................... 13
4 Software Configuration ..................................................................................................... 20
Echosounder Offset ............................................................................................................................................ 20
Motion sensor calibration .................................................................................................................................. 22
Vessel shape and offsets .................................................................................................................................. 24
System Settings ................................................................................................................................................... 29
Echogram settings .............................................................................................................................................. 32
Unit Settings .......................................................................................................................................................... 36
Map footer settings ............................................................................................................................................. 43
Factory Reset ........................................................................................................................................................ 46
5 Geodesy Configuration ...................................................................................................... 48
Manage Ellipsoids ................................................................................................................................................ 48
Manage Datums .................................................................................................................................................... 51
Manage Grids ........................................................................................................................................................ 55
Manage Geoids ..................................................................................................................................................... 59
Manage Countries ............................................................................................................................................... 61
Part III User Interface Features 65
1 Projects ............................................................................................................................. 65
2 Toolbar .............................................................................................................................. 71
3 Accelerator Keys ............................................................................................................... 73
4 Activity View ..................................................................................................................... 75
5 Data View .......................................................................................................................... 78
6 Helmsman Display ............................................................................................................. 83
7 Area Measurements .......................................................................................................... 86
8 Coordinate calculator ........................................................................................................ 88
9 Alarms ............................................................................................................................... 92
10 Query objects .................................................................................................................... 96
11 Raw data manager ............................................................................................................ 98
12 Sounding manager .......................................................................................................... 101
13 Import raw data ............................................................................................................... 107
Import NMEA0183 ASCII log files ..................................................................................................................... 107
Import SEG-Y files .............................................................................................................................................. 114

3Contents
3
© 2009-2021 Eye4Software B.V.
Import CEE HydroSystems project files ........................................................................................................ 119
Import Kongsberg Simrad raw data files ...................................................................................................... 123
Import ODOM raw data files ............................................................................................................................. 127
Import Hydromagic raw data files .................................................................................................................. 131
Import Hypack raw data files ........................................................................................................................... 135
Part IV Map display / Background maps 140
1 Map display customization .............................................................................................. 140
2 Loading Maps .................................................................................................................. 144
3 Loading IHO S-57 ENC's ................................................................................................... 147
4 Loading IHO S-63 ENC's ................................................................................................... 149
5 Supported Raster Formats ............................................................................................... 154
6 Supported Vector Formats ............................................................................................... 155
7 Downloading Maps .......................................................................................................... 156
8 Downloading Electronic Navigational Charts .................................................................. 160
9 Managing Maps ............................................................................................................... 163
10 Layer properties and display options .............................................................................. 166
11 Changing drawing order ................................................................................................. 172
12 Placing waypoints ........................................................................................................... 174
13 Projecting Waypoints ...................................................................................................... 177
14 Placing comments ........................................................................................................... 179
15 Creating Boundaries ........................................................................................................ 183
16 Cross Sections ................................................................................................................. 185
17 Cross Sections from CAD ................................................................................................. 188
18 Channel Design ............................................................................................................... 193
19 Route Planner ................................................................................................................. 197
20 Depth colors and color legend ........................................................................................ 204
Part V Recording Data 209
1 Getting Started ................................................................................................................ 209
2 Creating a new singlebeam sounding ............................................................................. 210
3 Events and annotation ..................................................................................................... 215
4 RTK tide corrections ........................................................................................................ 221
5 Analyzing recorded raw data .......................................................................................... 227
Part VI Single beam processing 237
1 Getting Started ................................................................................................................ 237
2 Selecting Files ................................................................................................................. 238
3 Tide Correction ................................................................................................................ 240
4 Tide File Editor ................................................................................................................ 244
5 Draft and Sound Velocity ................................................................................................. 248
6 Dynamic draft correction file editor ................................................................................. 251

Eye4Software Hydromagic 9.44
© 2009-2021 Eye4Software B.V.
7 Correcting Data ............................................................................................................... 253
8 Filter Tool ........................................................................................................................ 254
9 Echogram Editor .............................................................................................................. 256
10 Position Editor ................................................................................................................. 261
11 Miscellaneous Tools ........................................................................................................ 264
12 Latency adjustment tool .................................................................................................. 269
13 Time adjustment tool ....................................................................................................... 272
14 Apply Offsets .................................................................................................................... 274
15 Table Editor ..................................................................................................................... 276
16 PPK processing ............................................................................................................... 279
17 Generate Soundings ........................................................................................................ 283
18 Import Soundings ............................................................................................................ 287
19 Export soundings ............................................................................................................. 292
Part VII Post Processing 296
1 Shoreline data ................................................................................................................. 296
2 Generate and Display Matrix ........................................................................................... 300
3 Generate and display delta matrices ............................................................................... 307
4 Generate Matrix from Sections ........................................................................................ 311
5 Generate Matrix from CAD .............................................................................................. 313
6 Import Matrix from ASCII XYZ data .................................................................................. 318
7 Generate Depth Contours ................................................................................................ 322
8 Volume Calculation (Matrix) ............................................................................................ 328
9 Volume Calculation (Stages) ........................................................................................... 331
10 Volume Calculation (Sections) ........................................................................................ 335
11 Export to Google Earth .................................................................................................... 339
12 Export to AutoCad ........................................................................................................... 345
13 Export current view ......................................................................................................... 350
14 Export echograms ........................................................................................................... 355
15 Export Cross Sections ...................................................................................................... 358
Part VIII Dredging 363
1 Hydromagic Dredging ...................................................................................................... 363
2 Configuring Vessels ......................................................................................................... 366
3 Configuring Dredging Equipment .................................................................................... 372
4 Configuring Dredger Segments ....................................................................................... 376
5 Dogbones configuration on excavators ........................................................................... 379
6 Excavator or backhoe calibration .................................................................................... 382
7 Configuring an echo sounder .......................................................................................... 385
8 Dredger Configuration Examples .................................................................................... 391

5Contents
5
© 2009-2021 Eye4Software B.V.
Trailing Suction Hopper Dredger .................................................................................................................... 391
Part IX Utilities 401
1 3D Terrain Viewer ........................................................................................................... 401
2 Using the EGM2008 geoid model ..................................................................................... 406
3 License Updater .............................................................................................................. 409
4 Geoid Converter .............................................................................................................. 412
Part X Plugins 417
1 General information on using plugins ............................................................................. 417
2 AirMar EchoRange plugin ................................................................................................ 420
3 CEESCOPE Plugin ........................................................................................................... 424
4 Echologger Plugin ........................................................................................................... 430
5 Garmin USB-GPS plugin .................................................................................................. 440
6 GPS heading plugin ........................................................................................................ 443
7 Generic echosounder plugin ........................................................................................... 447
8 Hydromagic ASCII output plugin ..................................................................................... 451
9 Hydromagic NMEA0183 output plugin .............................................................................. 456
10 Hydromagic Manual Sound Velocity plugin .................................................................... 460
11 Manual Tide Plugin ......................................................................................................... 464
12 Hydromagic Modbus-RTU plugin ..................................................................................... 467
13 NMEA0183 Playback Plugin ............................................................................................. 471
14 Hydromagic NTRIP Plugin ............................................................................................... 475
15 Hydromagic Simulator Plugin ......................................................................................... 479
16 Knudsen echo sounder plugin ......................................................................................... 483
17 Kongsberg EA4xx Series Plugin ...................................................................................... 492
18 MAVLink communication plugin ...................................................................................... 500
19 Odom Echotrac Plugin ..................................................................................................... 504
20 Odom Ethernet Plugin ..................................................................................................... 510
21 Unabara Hydro-2F Plugin ................................................................................................ 516
Index 521

Eye4Software Hydromagic 9.46
© 2009-2021 Eye4Software B.V.
1 Introduction
Hydromagic is an hydrographic survey software tool, which can be used to map areas using a GPS andechosounder. Use the software to import, view and edit your maps, display your position and to recorddepths (create soundings). The software will work with almost any GPS and echosounder, and can beused on any desktop, laptop or netbook computer running Windows 7 or higher.
The software has been tested successfully on the following operating systems:
üWindows 7-32 bit;üWindows 7-64 bit;üWindows 8-32 bit;üWindows 8-64 bit;üWindows 8.1-32 bit;üWindows 8.1-64 bit;üWindows 10-64 bit.
Since version 7.0 there is also the possibility of monitoring dredge operation. In order to use these features, you need to purchase the Hydromagic Dredging edition as well.
Some application examples:
ü Record depth data using a GPS and echosounder;ü Show your current position and depth on a loaded map;ü Convert your soundings to a regularly spaced XYZ data (DTM);ü Convert your soundings to different file formats;ü Show cross-sections and calculate volumes;ü Design and generate theoretical DTM's (channel design);ü Create depth contours and save them as ESRI shape files;ü Add comments, symbols or routes to your maps;ü Perform real time positioning on research and hydrographic survey vessels;ü Fishing industry, for instance to navigate inside the assigned fishing parcels;ü View GIS features on shape files, CAD and S57 (ENC) data;
1.1 Supported Hardware
Supported Hardware
The list below is just an indication, the software will probably work with more models then the ones thatare displayed below.
Supported Echosounders
ü NMEA0183 Compatible Echosounders;ü Cee Hydrosystems Ceestar;ü Cee Hydrosystems Ceeducer pro;ü Elac Hydrostar LAZ4300;ü Elac LAZ4100;ü Elac STG 721C;ü Innerspace Technologies 440S;
ü Simrad EA200 series;ü Simrad EA300 series;ü Simrad EA400 series;ü Simrad EA500 series;ü Simrad EA600 series;ü STN Atlas Deso 11;ü STN Atlas Deso 14;

Introduction 7
© 2009-2021 Eye4Software B.V.
ü Innerspace Technologies 448;ü Innerspace Technologies 449;ü Innerspace Technologies 455;ü Innerspace Technologies 456;ü Knudsen 320 series;ü Navitronic Navisound 2000;ü SyQwest Bathy 500DF;ü SyQwest Bathy 500MF;ü SyQwest Bathy 1500C;ü Ohmex SonarMite;ü Odom DigiTrace;ü Odom EchoTrac DF3200 MK II;ü Odom EchoTrac MK III;ü Odom EchoTrac CV100;ü Odom EchoTrac CV200;ü Odom EchoTrac CV300;ü Odom EchoTrac CVM;ü Odom HydroTrac;ü Odom HydroTrac II;
ü STN Atlas Deso 15;ü STN Atlas Deso 17;ü STN Atlas Deso 20;ü STN Atlas Deso 22;ü STN Atlas Deso 25;ü STN Atlas Deso 30;ü STN Atlas Deso 35;ü STN Atlas Deso 350M;ü Reson Navisound 110;ü Reson Navisound 205;ü Reson Navisound 210;ü Reson Navisound 215;ü Reson Navisound 420;ü Reson Navisound 630DS;ü Unabara Hydrobookü Unabara Hydro-2F
Supported GPS Receivers
ü NMEA0183 Compatible GPS Receivers;ü NMEA0183 Compatible DGPS Receivers;ü NMEA0183 Compatible RTK Receivers;ü Garmin USB GPS receivers using the PVT protocol;ü Trimble RTK Receivers;
Supported Tide Receivers
ü MGB Tech MTU821-D;ü MGB Tech MTU821-W;ü Ohmex TidaLite;ü Vyner MK2;
Supported AIS Receivers
ü AdvanSea AIS RX-100;ü Digital Yacht AIS100;ü Digital Yacht AIS200PRO;ü Digital Yacht AIS200N2K;ü Digital Yacht ANT200;ü Digital Yacht iAIS;ü EuroNav AIS-2-NMEA;ü EuroNav AIS-2-USB;ü Furuno FA30;ü Icom MXA-5000;ü Nasa AIS Engine 1;ü Nasa AIS Engine 2;ü Nasa AIS Engine 3;ü Smart Radio SR161;

Eye4Software Hydromagic 9.48
© 2009-2021 Eye4Software B.V.
Supported Motion Sensors
ü TSS1 Compatible Motion Sensors;ü SBG Systems SBG01;
Supported Total Stations
ü Total stations supporting the pseudo NMEA GGA format;ü Total stations supporting the Trimble Geodimeter format;

Configuration 9
© 2009-2021 Eye4Software B.V.
2 Configuration
2.1 Installation
System Requirements
The software requires a system which is capable of running Microsoft Windows Vista or later. It will notwork on earlier versions of this operating system. The software is available as both a 32 and 64 bit version. Which one to use depends on the operatingsystem you are running.
The 32 bit version will run on both 32 and 64 bit operating systems, but when running a 64 bit Windowsversion, we recommend using the 64 bit version of the software.
When you are going to post-process soundings (3D, contour generation, matrix generation etc.), werecommend a computer with at least a dual-core processor and 2 Gigabyte of free RAM. You will alsoneed sufficient space on the hard disk to store maps, soundings and matrix files.
Installation
To start the installation, and you own a hardlock or dongle, run the setup_hydro_full.exe downloadedfrom the website, or from the program CD.When you want to try the software, and you do not have a dongle yet, you should run thesetup_hydro.exe which is a demo version with some exporting and printing functions disabled.It is recommended to run the setup program as Administrator, as shown in the image below:

Eye4Software Hydromagic 9.410
© 2009-2021 Eye4Software B.V.
Just follow the steps of the setup program. After setup has completed, the software will startautomatically.
2.2 Activation
Software Protection
Eye4Software Hydromagic is protected against unauthorized use by an (USB) dongle, or by installing asoftware based, computer bound, license on the computer.Upon ordering or renting the full version of the software, either the dongle is shipped, or an activation linkwill be send. This depends on the license type ordered.
Computer bound license
Since version 8.4 of the software, the software can also be activated with a so called 'computer boundlicense'.

Configuration 11
© 2009-2021 Eye4Software B.V.
When the customer chooses a computer bound license instead of a physical dongle, an URL isgenerated for each computer the user is allowed to run the software on.
This license doesn't require any shipping, so delievery times are close to zero. It is not possible totransfer this kind of license from one computer to another.For more information on how computer bound licenses work, please check this document.
Dongle
Make sure the dongle is inserted in the USB socket correctly. Two LED's (red and green) will lit upshortly after insertion.When you start the software, and the following error message is displayed, either the dongle is notinserted correctly,or it doesn't contain the correct license(s) for the version(s) you are trying to run.
Dongle troubleshooting
In some cases the software displays this error, even when the dongle has been inserted. Only in rarecases this is caused by a faulty dongle.When you encounter this error message while the dongle has been inserted, please perform the followingsteps first:
- Make sure the dongle has been inserted fully;
When the device isn't inserted correctly in the USB socket of the computer, the dongle isn't going to berecognized by Windows.
- Try different USB sockets on your PC;
Some devices won't work with USB 3.0 sockets on your computer, trying another port might help.This check also rules out defective or not connected USB sockets on your computer.
- Make sure the CodeMeter runtime is installed;
The CodeMeter runtime is used by Windows and Hydromagic to access the dongle.When this piece of software is missing the dongle might not work.
The CodeMeter runtime is installed during the Hydromagic installation.For some reason the installation may have been corruped, you can reinstall it by reinstallingHydromagic.

Eye4Software Hydromagic 9.412
© 2009-2021 Eye4Software B.V.
- Check whether the dongle shows up in the Windows explorer as an USB drive;
This is a good indication to see whether Windows has detected and installed the device driver softwarefor the dongle.When the dongle doesn't show up you might try another computer. When the dongle shows up, but isn'trecognized by the software, please request a license update.
- Try the dongle on another PC.
After performing the above steps, it can be possible the dongle still isn't working.In this case, repeat the steps on another PC. If still not working, please contact support.
Getting version and licensing information
In order to get information on the (build) version used and the licensing status of the product,select the "About Hydromagic..." option from the "Help" menu.
A dialog box will be displayed containing licensing status, dongle or software license serial number (ifapplicable) as well as the version and build number.Please provide this information when contacting technical support. We can use this information to checkyour support contract status.

Configuration 13
© 2009-2021 Eye4Software B.V.
Dongle Form Factors
When ordering a new Hydromagic license, an USB dongle will be shipped to the address supplied duringthe ordering process.In case you don't have any USB ports available for an USB dongle, we can also supply a dongle in one ofthe following form factors:
ü PC-Cardü Express CardüCF-Cardü SD-Cardümicro SD-Card
Please contact sales for more information on these alternatives.Please note that an additional fee may apply.
2.3 Hardware Configuration
2.3.1 Configuring NMEA0183 hardware
NMEA0183 GPS and RTK Receivers
The most important device required for this software to work, is a GPS or RTK receiver. At this moment, all GPS and RTK receivers with a NMEA0183 compatible data output are supported.
The GPS is used to get position, elevation, course, speed and information on GPS quality and / orprecision.When using a RTK receiver in RTK fixed mode, you should be able to get real time tide information aswell.
In order to connect a GPS receiver, you need to have at least one available serial port. If there is no portavailable, you can add a serial port by using an USB-to-Serial converter or a NMEA0183 data combiner equippedwith an USB port.
Because an USB-to-Serial convertion can cause minor delays (latency) in the serial communication, werecommend to use a multiport serial adapter instead.

Eye4Software Hydromagic 9.414
© 2009-2021 Eye4Software B.V.
Multiport serial adapters are available as PCI cards as well as PC-Cards for use in laptops.
In addition to NMEA0183 data over a serial device, Hydromagic is able to read NMEA0183 data overTCP/IP connections.This allows you to transfer data over for instance an Ethernet or WiFi connection. Protocols supportedare TCP and UDP.
When using such a converter, make sure it is connected at the time you are going to configure the GPS.When you have no control on which sentences are sent by the device, it is recommended to only selectthe GGA and VTG options in the NMEA0183 settings.
NMEA0183 Echosounders
Most echosounders these days do support their own proprietary output format as well as the morestandardized NMEA0183 protocol. If your echosounder does not support the NMEA0183 protocol, you should be able to configure it usingone of the plugins shipped with Hydromagic.
In order to connect an echosounder, you need to have at least one available serial port. If there is no portavailable, you can add a serial port by using an USB-to-Serial converter or a NMEA0183 data combiner equippedwith an USB port.
When using such a converter, make sure it is connected at the time you are going to configure thesounder.
In addition to the serial communications setup, you also have to check the echosounder offsetconfiguration.
Supported NMEA0183 sentences for GPS devices
Hydromagic is able to decode the following NMEA0183 sentences used by GPS and RTK devices:
Sentence Description
$GPGGA Global Positioning System Fix Data, Time and Position
$GPGLL Geographic Position - Latitude and Longitude
$GPGSA GPS DOP and Active Satellites
$GPGSV Satellites in view
$GPRMC Recommended Minimum Navigation Information
$GPVTG Track Made Good and Ground Speed
$GPZDA GPS Time
$PTNL,GGK Trimble RTK positioning data and ellipsoidal height
Supported NMEA0183 sentences for sounders
Hydromagic is able to decode the following NMEA0183 sentences used by echosounder devices:

Configuration 15
© 2009-2021 Eye4Software B.V.
Sentence Description
$SDDBK Depth below keel
$SDDBS Depth below surface
$SDDBT Depth below transducer
$SDDPT Depth and keel offset
Configuration
To add a NMEA0183 compatible device to the configuration, select "Preferences..." from the "Options" menu and select the "Devices" tab:
In the devices tab, click the "Add..." button to load a NMEA0183 plugin.You can load a maximum of four NMEA0183 plugins at the same time.

Eye4Software Hydromagic 9.416
© 2009-2021 Eye4Software B.V.
Next, select the first available NMEA0183 plugin in the "Select Device" dialog that appears after clickingthe "Add..." button
Device Settings
After the plugin has been loaded, a configuration dialog is displayed where you can pass the requiredinformation to the plugin.

Configuration 17
© 2009-2021 Eye4Software B.V.
Connection Type

Eye4Software Hydromagic 9.418
© 2009-2021 Eye4Software B.V.
The NMEA0183 plugin supports two types of connection types: serial and TCP/IP.When a device is connected through an USB or serial connection, you select the "Serial" option.
In cases where the device is connected using an Ethernet cable or WiFi connection, you have to select the "TCP/IP" option from the "Connection Type" drop down box.
When switching between the "Serial" and "TCP/IP" connection type, the function of the edit and selection boxes in the "Connection" section will change as can be seen in the two screen shots above.
Serial Port
Use this drop down box to select the COMxx number of the serial port the device is connected to.This can be either a regular serial port, or a virtual serial port, which are used with USB to Serial andBluetooth adapters.
Serial Speed
The default serial baudrate for NMEA0183 devices is 4800bps. However, some hardware use otherspeeds (for instance, an AIS receiver will use 38400).When configuring a RTK receiver, the serial speed can sometimes deviate from the standard. 9600,19200 and 38400 bps are mostly used on these devices.
Serial Format
You can leave this setting at it's default value. Devices that use NMEA0183 protocol with other settingsare very rare.
Socket Type
Use the "Socket Type" dropdown box to select the TCP/IP protocol used. Possible values are "TCP" and"UDP".Please refer to the hardware vendor on which option is supported. Most devices support both protocols.
Host IP
The IP address of the device. This value is required only for TCP connections.For UDP connections, just provide a valid port number.
Host IP Port
Enter the IP (TCP or UDP) port number the device is listening on here.For most wireless NMEA0183 devices, the port 10110 is used, which is the reserved port for NMEA0183.
Latency
Latency (sometimes called lag) is the time between a measurement has been made (for instance aposition fix, or depth) and when the serial data is received by the application.If this value is know for a certain device, you can enter it here to get more accurate soundings.
NMEA0183 Settings
Talker ID

Configuration 19
© 2009-2021 Eye4Software B.V.
Use this option to filter NMEA0183 sentences by talker ID. It sometimes happens that both echosounderand GPS devices are transmitting GPS sentences, in this case you can either select the GPS orechosounder by specifying "GP" or "SD" in this field.
Sentences
To select which NMEA0183 sentences will be decoded, and which ones will be ignored on this channel,click the "Select sentences..." button.
The dialog that appears allows you to select which sentences are used. For most GPS devices,selecting only the GGA sentence will suffice. If you choose to use the heading and speed calculated by the GPS device, you should also select theVTG sentence.
For a echosounder, you should use either the DBS, DBT, DBK or DPT sentence.
Testing the device(s)
When everything has been configured correctly, and the device has been turned on, you should havesome green values in the data view window.

Eye4Software Hydromagic 9.420
© 2009-2021 Eye4Software B.V.
Serial Communications Monitor
You can always check whether data is coming in by running the serial communications monitor.
To start this monitor, select the "Preferences..." option from the "Tools", and select the "Devices" tab. Select the device you want to monitor and click the "Monitor..." button.
2.4 Software Configuration
2.4.1 Echosounder Offset
Echo sounder offset (draft)
The echo sounder offset can be used to correct the difference between the depth outputted by the echosounder, and the real depth.This offset is also called static or fixed draft. Dynamic draft (depending on the speed of the vessel) canbe corrected when processing your raw data files.
The transducer of the echo sounder measures the water level from the bottom of the transducer to thebottom of the river.The height of the water which is above the bottom of the transducer has to be added to the echo sounderoutput, and can be entered here.
Most echo sounders have the option to enter the distance between the water surface and thetransducer, so in this case you do have to disable this option, or you can use it for other corrections.

Configuration 21
© 2009-2021 Eye4Software B.V.
Entering the echo sounder offset
To enter an offset for the echo sounder, select "Preferences..." from the "Option" menu. In the dialog that appears, select the "Calibration" tab. You should see the following dialog:
The static draft can be entered in the "Calibration" tab.
The value entered is added to the depth (both high and low frequency depths) reported by the echosounder. To subtract from the sounders value (in case of depth below keel), just prefix the value with the minussign "-".
To disable the correction, just remove the tick from the "Apply Echosounder Offset" checkbox,or click the "Reset" button to load the defaults.
Raw data files
Please make sure the echosounder offset is measured and entered into the software beforerecording any data.The depth written in the raw data files is the depth corrected with the echo sounder offset !

Eye4Software Hydromagic 9.422
© 2009-2021 Eye4Software B.V.
The depth data received is corrected with the static draft before saving.
Using RTK
When you are measuring the elevation of the river bed using a RTK receiver, and the offset between thetransducer and GPS antenna is fixed, you can just enter this offset in the RTK settings tab. However, werecommend to fill out both the antenna and transducer offset separately in case you ever need theabsolute water depths.
NMEA0183 compatible echo sounders
When using a NMEA0183 compatible echo sounder, whether to enter an offset depends on theNMEA0183 sentence(s) used to retrieve the depth data.
Sentence Depth Value Correction
$SDDBK Depth below keel Enter the distance between the keel of the ship and the watersurface.
$SDDBS Depth below surface No correction is needed, as the depth is measured from thewater surface.
$SDDBT Depth belowtransducer
Enter the distance between the transducer and the watersurface.
$SDDPT Depth The offset configured in the echo sounder is used.
Some NM EA0183 depth sentences supported by Hydromagic.
2.4.2 Motion sensor calibration
Motion sensors
Since Hydromagic version 6.0, the software has built in support for motion sensors. Motion sensors canbe used to correct your soundings for heave, pitch and roll.

Configuration 23
© 2009-2021 Eye4Software B.V.
In Hydromagic, motion sensors are configured using hardware plugins supplied with the software.Supported devices include Teledyne TSS, SBG Systems, IMU and compatible hardware.
Motion sensor calibration
A motion sensor can be calibrated in the "Motion Calibration" section of the preferences window. To openthis tab, select "Preferences..." from the options menu, and select the "Calibration" tab.
The following window should appear:
Enable the"Use motion sensor offsets" option tocalibrate your motion sensor.
Echo sounder heave offset
Heave is used to correct the vertical motion of the vessel, caused by for instance, waves. It is importantto disable heave compensation by a motion sensor when heave is corrected within the hydrographic echosounder. For this, select the "Echosounder outputs heave corrected depths" check box. The heave offsetbox will be disabled.
Motion sensor offsets
To use offsets for your motion sensor, or to tare / calibrate your device, enable the offsets by checkingthe "use motion sensor offsets" check box.
Use the motion sensor offset fields to correct the roll (x), pitch (y) and heave (z) offsets outputted by amotion sensor.Enter the heave offset in the vertical units used by your project (normally meters), thepitch and roll offsets are always in degrees.

Eye4Software Hydromagic 9.424
© 2009-2021 Eye4Software B.V.
In case you want to tare your sensor, just click the "Set" button to set all values automatically when thesensor is connected and the vessel is stable (for instance when docked).
To disable calibration, click the "Reset" button to set all values to their defaults.
When done, just click "OK" to apply the values. In the data view the heave, pitch and roll values shouldnow contain valid values.
2.4.3 Vessel shape and offsets
Vessel shape and offsets
Using the built in "Vessel Editor" you can specify how the vessel should be drawn on the map. It alsoallows you to set the exact location of the sensors, like transducer and GPS antenna.
The position of the sensors is used to calculate the offset between the GPS position and the transducerposition when the vessel's heading is known.
The vessel editor
To start the "Vessel Editor" utility, open the preferences dialog by selecting "Preferences..." from the"Options" menu. In the preferences dialog, select the "Map" tab, and click the "Editor..." button asshown in the screen shot below:
Click the "Editor..." button to start the "Vessel Designer"

Configuration 25
© 2009-2021 Eye4Software B.V.
The vessel editor will be started and will display the vessel as specified in the "File" field. If no vessel filehas been specified yet, it opens with a blank project.
Loading designs
Hydromagic is shipped with a couple of example vessel files. To load one of these files into the vesseleditor, select the "Open Design..." option from the "File" menu. By default, all vessel designs are storedin the "C:\ProgramData\Hydromagic\Vessel" folder.
Use the "Vessel Designer" to create or alter vessel or dredger shapes, and to set sensor offsets.
Creating a new design
To create a new design, just select "New Design" from the "File" menu. If you have unsaved data, theapplication will prompt you to save it now.
After creating a new project, make sure you select the units for your new design first. This can be doneby clicking the currently selected units in the status bar, or by selecting the "Units..." option from the"Options" menu.
The best is to select the same units that are used in the drawing you have as reference. In case youforgot to select the correct units, you can always convert all coordinates by using the "Scale Features"option.

Eye4Software Hydromagic 9.426
© 2009-2021 Eye4Software B.V.
Select the units of your choice.
Grid options
To change grid options, select "Grid" from the "Options" menu. Using the grid options, you can display agrid which can be used as guidance when placing objects. The grid can also be used to snap objects to,both options can be enabled or disabled.
Use the grid as guidance when drawing.
Adding and modifying features
To add a line segment or polygon to the design, select "Draw Polyline" from the "Cursor" menu. Tochange the location of a single point, you can either drag the point around using the mouse, or alter thecoordinates manually by right clicking the point, and select the "Edit Vertex..." option.

Configuration 27
© 2009-2021 Eye4Software B.V.
You can enter vertex coordinates manually.
Removing features
Existing segments can be modified by using drag and drop. To remove features from the design, rightclick on the shape in the "Object View" windows, and select "Remove Polyline". To remove a single point(vertex) from a line segment or polygon, right click the point and select the "Remove Vertex..." optionfrom the context menu.
Moving features
In the vessel designer, features can be moved by entering the amount of units it has to move (shift) in thegiven directions. To move features, click the "Move" button in the toolbar.
In the dialog box that appears, enter how many units the object has to move on the X and Y axes.
A negative value on the X axis means the object will be moved to the left. A negative value on the Y axismeans the object will be moved down.
M ove the design.
Scaling features
To scale the design by a specified amount, click the "Scale" button. Alternatively, you can select the"Scale" option from the "Modify" menu.
In the dialog that appears, enter the scale factor. All coordinates will be multiplied with this value.
Entering a value greater then 1.0 increases the size of the design. When entering a number smaller then1.0 the size decreases.
This function can also be used to convert a design from, for instance, feet to meters. In this example youwould enter a scale factor of 0.3048.

Eye4Software Hydromagic 9.428
© 2009-2021 Eye4Software B.V.
Scale the design.
Mirror features
Objects can be mirrored horizontally or vertically by clicking one of the mirror buttons in the tool bar.Alternatively, you can select these options from the "Modify" menu.
To undo a mirroring action, just perform the action again to restore the object to its current shape.
Rotate features
Using the rotate function you can rotate an object around its origin by any amount of degrees. Objectscan be rotated clockwise or counter clockwise.
To start the rotating tool, click either the "Rotate Left" or "Rotate Right" button in the tool bar.Alternatively, you can select these options from the "Modify" menu.
Rotate the design clockwise or counterclockwise.
Setting sensor position offsets
You will notice two circles labeled "TXD", and "GPS". The "TXD" circle can be dragged onto the vessel tomark the location of the transducer, the "GPS" circle is used to mark the location of the GPS antenna.
Instead of dragging the offset positions using the mouse, you can set them manually as well. To do so,select the "Offsets" option from the "Modify" menu.

Configuration 29
© 2009-2021 Eye4Software B.V.
Offsets can also be entered manually.
Saving designs
After the design has been completed, and the GPS and transducer locations have been selected, youcan save your design by selecting "Save Design..." from the "File" menu. Now you can close the "VesselEditor" and select the design in the Hydromagic Survey software. When a valid GPS position is available,the ship will be drawn on the map using the specified vessel shape:
Example of a vessel shape created in the "Vessel Designer".
2.4.4 System Settings
System Settings
The system settings window allows you to adjust some system wide settings, such as date and timeformats and power saving behaviors. To access the system settings window, first select the"Preferences..." item from the "Options" menu to open the preferences dialog. In the preferences dialog,

Eye4Software Hydromagic 9.430
© 2009-2021 Eye4Software B.V.
select the "Miscellaneous" tab, and click the "Setup..." button in the "System Settings" section asshown below:
Click the "Setup..."button in the "System Settings" section.
The system settings dialog
After clicking the "Setup..." button, the following dialog appears:

Configuration 31
© 2009-2021 Eye4Software B.V.
The "System Settings" dialog appears.
Windows screen saver
When the "Disable Windows Screensaver activation" option has been selected, Hydromagic preventsWindows from starting the screen saver as long as the Hydromagic application has focus. Please notethat this option only works when a screen saver without password protection is used. This optionsprevents situations where your screen blanks when you do not touch the mouse or keyboard for sometime when performing a survey.
Windows power saver
When the "Disable Windows Powersaver activation" option has been selected, Hydromagic preventsWindows from putting the monitor or laptop display in sleep mode as long as the Hydromagic applicationhas focus. This options prevents situations where your screen blanks when you do not touch the mouseor keyboard for some time when performing a survey.
Time Formats
Use this option to specify the time and date formats used in Hydromagic for log files, exported ASCIIdata, screen dumps and printing. Click the "Setup..." button to access these settings.

Eye4Software Hydromagic 9.432
© 2009-2021 Eye4Software B.V.
Customize day and time formats for exported data
To change the time and date formats, select your language and country using the "Language" selection.After selecting the language, the dialog displays the possible date and time formats for this language.You can preview the settings in the "Preview" pane. To apply the settings, click "OK".
2.4.5 Echogram settings
Echograms in Hydromagic
In Hydromagic an echogram is a graph which displays measured depth versus time elapsed. Whensupported by your echosounder, it is even possible to view the sonar echo envelope from the entire watercolumn.
An echogram display is used in some real time displays, such as the echogram for high and lowfrequency data, the echogram for sub-bottom data, the echogram digitizer and the echogram export inthe soundings list.
Loading the echogram settings dialog
To access the echogram settings window, first select the "Preferences..." item from the "Options" menuto open the preferences dialog. In the preferences dialog, select the "Miscellaneous" tab, and click the"Setup..." button in the "Echogram Settings" section as shown below:

Configuration 33
© 2009-2021 Eye4Software B.V.
The echogram settings dialog
After clicking the "Setup..." button, the following dialog appears:

Eye4Software Hydromagic 9.434
© 2009-2021 Eye4Software B.V.
Setting a custom echogram range
By default the range (minimum and maximum depth in graph) is detected automatically. If you want toset the range manually, for instance to zoom in on the data, uncheck the "Autodetect depth range"checkbox and use the 'Minimum depth value' and 'Maximum depth value' text boxes to view a specificrange as shown in the example below:

Configuration 35
© 2009-2021 Eye4Software B.V.
Maximum update rate
With the 'maximum update rate' option you can set how often the echogram display can be refreshed persecond. Please note that this option is only applicable for the real-time echogram displays since theother ones will only be redrawn when they are being zoomed or when settings are changed.
When you are using a laptop or desktop computer without an advanced graphics processing unit,sometimes an high update rate can cause the computer or software to slow down a bit. In these cases,you can select a lower update rate using this setting.
Echogram offset
This option allows you to correct the whole echogram image with a fixed offset or draft value. Forinstance when you need to apply a draft after the data has been recorded, and no draft has been set inthe sounder use this setting to apply a correction.
Echogram filter
The minimum and maximum filter values can be used to control which return echo intensities aredisplayed in the echogram. You can use this filter to eliminate noise or to suppress the display of thetransmit pulse.
Echogram colors
The echogram color editor can be used to define your own color ranges to use for the echogram. Use thebuttons on the right to add, remove or insert colors. You can also choose one of the many pre-definedcolor schema's:
· Gold (Black, Red and Yellow);· Four (Red, Green, Yellow and Blue);· RGB (Red, Green, Blue and Yellow);· HSV (Rainbow Colors);· Grayscale (Black, Gray and White);· Blue (Blue and White);· Green (Green and White);· Red (Red and White);· RedBlue (Red, White and Blue);· SIMRAD (Simrad Colors);· Unabara (Use with Unabara sub bottom profilers).

Eye4Software Hydromagic 9.436
© 2009-2021 Eye4Software B.V.
2.4.6 Unit Settings
Units
In the "Units" tab in the preferences window, you can select the desired units for speed, area andvolumes.You can also find the selection for the geographic coordinates formatting here.
Modifying unit settings
To access the unit settings, first select the "Preferences..." item from the "Options" menu to open thepreferences dialog.In the preferences dialog, select the "Units" tab:

Configuration 37
© 2009-2021 Eye4Software B.V.
Geographic position format
The position format defines how geographic (latitude and longitude) coordinates will be displayedthroughout the software.This settings will be applied to the data window, cursor position in the status bar and all dialogs whichdisplay WGS84 coordinates.

Eye4Software Hydromagic 9.438
© 2009-2021 Eye4Software B.V.
Speed units
Speed is displayed in the data window, but is also used in some other dialogs where speed is a factor,like the dynamic draft profile dialog.Supported units for speed are Miles per Hour, Kilometers per Hour, Knots and Meters per Second.

Configuration 39
© 2009-2021 Eye4Software B.V.
Area units
Area's are used for instance in the area calculation tool, but also in generated volume reports (matrix,cross sections and staging volumes).Supported units for area are Square Meters, Square Feet, Square Kilometers, Square Yards and Acres.

Eye4Software Hydromagic 9.440
© 2009-2021 Eye4Software B.V.
Volume units
Volumes are mainly used in generated volume reports (matrix, cross sections and staging volumes).Supported units for volumes are Cubic Meters, Cubic Inch, Cubic Yard, Cubic Feet, Barrels and Gallons.

Configuration 41
© 2009-2021 Eye4Software B.V.
Horizontal units
Horizontal units are used to display easting and northing positions and will be used in distancecalculations as well. Horizontal units are part of the geodesy settings and need to be set before creating a new project. Theycannot be modified here.

Eye4Software Hydromagic 9.442
© 2009-2021 Eye4Software B.V.
Vertical units
Vertical units are used for altitude, depth, tides and elevations. Vertical units are part of the geodesy settings and need to be set before creating a new project. Theycannot be modified here.

Configuration 43
© 2009-2021 Eye4Software B.V.
Sound velocity units
Sound velocity units are used to display the sound velocity (sound of speed). It is displayed in the datawindow and the sound velocity profile editor.These units are auto detected by the vertical units setting. When Feet (International or U.S. Survey) isused, it will be displayed in Feet per Second, otherwise in Meters per Second.
2.4.7 Map footer settings
A map footer is a section with text that is projected over the map in the lower left corner of exported orprinted maps or views.This footer contains information on the project, like surveyor name, project description, date and the unitsand projection used.
You can choose whether you want to have a footer displayed on your exported or printed map or not.
Modifying map footer settings
To access the map footer settings, first select the "Preferences..." item from the "Options" menu to openthe preferences dialog. In the preferences dialog, select the "Miscellaneous" tab, and click the "Setup..."button in the "Map Footer" section as shown below:
Eye4Software Hydromagic 9.444
© 2009-2021 Eye4Software B.V.
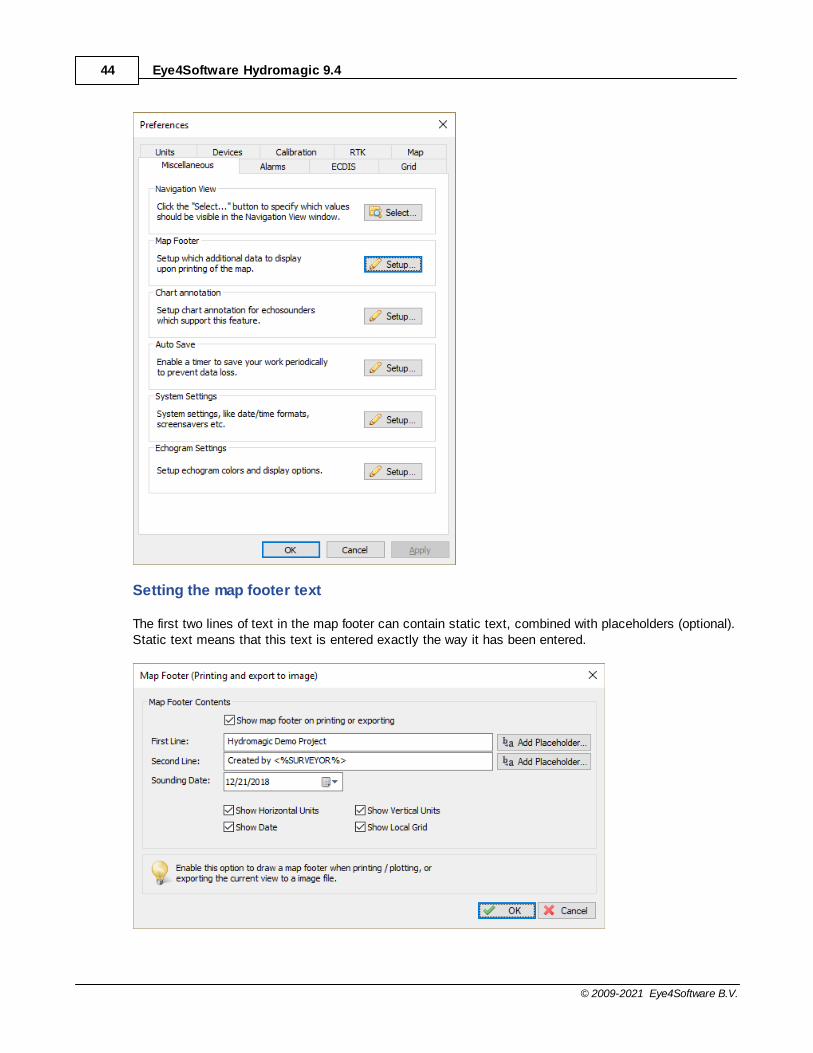
Setting the map footer text
The first two lines of text in the map footer can contain static text, combined with placeholders (optional).Static text means that this text is entered exactly the way it has been entered.

Configuration 45
© 2009-2021 Eye4Software B.V.
When inserting a placeholder, this placeholder will be replaced with a project variable when the map isexported or printed.To insert one of the placeholders that are recognized by the software, click the "Add Placeholder..."button for that line.
When one of the "Add Placeholder..." buttons has been clicked, the "Select Placeholder" dialog will beshown.Just select an item from the list, and click "OK" to insert the placeholder into your line of text.
The various placeholders can be found in this dialog along with an explanation on how they will bereplaced with project variables.
Map footer optional settings
Sounding date
To include the sounding data into the map footer, make sure that the "Show Date" check box has beenchecked.Next click the date selection control to select which date to display in the footer. This is usually the datethe sounding has been performed.
By default today's date has been selected. To configure how the date will be formatted,please refer to the "Time Formats" section at the end of the System Options manual page.
Show horizontal units
Include the horizontal units (easting and northing units) used in the coordinate reference system into themap footer.
Show vertical units
Include the vertical units (depth and elevation units) used in the coordinate reference system into themap footer.
Show Local Grid

Eye4Software Hydromagic 9.446
© 2009-2021 Eye4Software B.V.
Checking this check box causes the local coordinate reference system name to be included into themap footer.
2.4.8 Factory Reset
Factory Reset
The factory reset option in Hydromagic can be used to restore configuration items in Hydromagic to theiroriginal settings.This can be used in case of problem, for instance when you want to start over with a clean configuration,when you are missing toolbar items, or when windows disappear.
The 'Factory Reset' tool allows you to select which parts of the configuration are reset, there is no needto delete all settings at once.To start the 'Factory Reset' tool, select the "Load Factory Defaults..." option from the "File" menu.

Configuration 47
© 2009-2021 Eye4Software B.V.
Reset Toolbar Options
When this options has been selected, the default toolbar layout will be loaded for the main window.Use this option when buttons are missing, the toolbar won't show up, or buttons are mixed up forwhatever reason.
Reset Docking Windows
This option restores the original positions of the docking windows like the 'Project Explorer' and the 'DataView'.Use when one of the docking or popup windows is no longer visible and you cannot restore it by hidingand then showing it.
Reset Configuration
Please use this function with caution since it removes all your settings like plugin configurations, colors,units and map settings.It restores the configuration to the default values. You can use the "Export Configuration" option tobackup your config first.
Applying the factory defaults
After selecting one or more options, click the "OK" button to reset the selected items to factory defaults.The software prompts you to restart the program because the settings will be restored the next time it isstarted.

Eye4Software Hydromagic 9.448
© 2009-2021 Eye4Software B.V.
2.5 Geodesy Configuration
2.5.1 Manage Ellipsoids
Manage Ellipsoids - Eye4Software Coordinate Calculator
We recommend to manage your geodesy configuration database from the "Eye4Software CoordinateCalculator" which is a freeware tool which is shipped with Hydromagic. To start the "CoordinateCalculator", select "Geodesy Calculations" => "Coordinate Conversion..." option from the "Tools" menuas shown below:
Select the "Coordinate Conversion..." option to start the Coordinate Calculator.
The database containing all geodesy definitions, like ellipsoids, datums, coordinate systems andcorrection grids is stored in the "C:\ProgramData\Hydromagic\Database\" folder, and it is shared bymultiple applications, like Hydromagic Survey, Hydromagic Dredging and the Coordinate Calculator.Most of its content has been taken from the EPSG geodetic database and it will be updated regularly.

Configuration 49
© 2009-2021 Eye4Software B.V.
All geodesy definitions are stored in a shared database file.
Managing Ellipsoid Definitions
To open the "Manage Ellipsoids" window, select "Tools" => "Preferences" => "Manage Ellipsoids..."from the menu. Using this window, you will be able to view, delete or modify existing ellipsoid definitions,or to add your own. For a list of ellipsoids that are already in the database, click here.
The "Ellipsoids" dialog can be opened from the "Tools" menu.
Ellipsoid List
When clicking an item in the list, its parameters are displayed below the list. You can edit theseparameters by clicking the "Modify" button.

Eye4Software Hydromagic 9.450
© 2009-2021 Eye4Software B.V.
By clicking on an Ellipsoid in the list, you can view its parameters.
Deleting an ellipsoid
Although not recommended, you can delete an ellipsoid definition, by selecting an item from the list andclicking the button "Delete". The software will show a popup window to confirm that you are sure youwant to delete. Please note that you won't be able delete ellipsoids that are in use by a datum definition.
You have to confirm deletion of an ellipsoid definition.
Modifying an ellipsoid
You can modify an ellipsoid by clicking the "Modify" button after you selected an ellipsoid from the list.After clicking the button, the "OK" button text will change to "Save". Clicking the "Save" button will savethe modifications, clicking "Cancel" will keep the old data.
Adding an ellipsoid
To add a new ellipsoid definition, click the "Add" button. When adding a new definition, it is required tospecify a name for this ellipsoid, otherwise it cannot be saved. Other required fields are "Semi-MajorAxis" and "Inverse Flattening". Click the "Save" button to store the newly created ellipsoid, by clickingcancel the input is ignored and you will return to the list.

Configuration 51
© 2009-2021 Eye4Software B.V.
2.5.2 Manage Datums
Manage Datums - Eye4Software Coordinate Calculator
We recommend to manage your geodesy configuration database from the "Eye4Software CoordinateCalculator", which is a freeware tool which is shipped with Hydromagic. To start the "CoordinateCalculator", select "Geodesy Calculations" => "Coordinate Conversion..." option from the "Tools" menuas shown below:
Select the "Coordinate Conversion..." option to start the Coordinate Calculator.
The database containing all geodesy definitions, like ellipsoids, datums, coordinate systems andcorrection grids is stored in the "C:\ProgramData\Hydromagic\Database\" folder, and it is shared bymultiple applications, like Hydromagic Survey, Hydromagic Dredging and the Coordinate Calculator.Most of its content has been taken from the EPSG geodetic database and it will be updated regularly.

Eye4Software Hydromagic 9.452
© 2009-2021 Eye4Software B.V.
All geodesy definitions are stored in a shared database file.
Supported Transformations
In Hydromagic, you need to set the transformation parameters to convert to WGS84 for each newlycreated datum. The following transformation methods are supported:
§ None (no transformation needed);§ Molodensky (3 parameters);§ Bursa Wolf (7 parameters);§ NADCON;§ HARN/HPGN;§ NTv2.
Grid files
The last three methods mentioned above do not require parameters, but you have to specify a valid gridfile. For NADCON and HARN/HPGN, files for North America are shipped with the product.
To add your own NADCON, HARN or NTv2 files, just copy the file to the "NADCON" or "NTv2" folder inthe "Program Data/Hydromagic" installation directory.
NADCON and HARN files are pre-installed in the "Nadcon" Program Data folder.
Managing map datums

Configuration 53
© 2009-2021 Eye4Software B.V.
To open the "Manage Datums" window, select "Tools" => "Preferences" => "Manage Datums..." fromthe menu. Using this window, you will be able to view, delete or modify existing datum definitions, or toadd your own. For a list of datums that are already in the database, click here.
The "Datums" dialog can be opened from the "Tools" menu.
Datum List
When clicking an item in the list, its parameters are displayed below the list. You can edit theseparameters by clicking the "Modify" button.

Eye4Software Hydromagic 9.454
© 2009-2021 Eye4Software B.V.
The "Datums" dialog can be opened from the "Tools" menu.
Deleting a datum
You can delete an datum definition, by selecting an item from the list and clicking the button "Delete".The software will show a popup to confirm that you are sure you want to delete. Please note that youcannot delete datums that are used in a grid definition.
You have to confirm deletion of a datum definition.

Configuration 55
© 2009-2021 Eye4Software B.V.
Modifying a datum
You can modify a datum by clicking the "Modify" button after you selected a datum from the list. Afterclicking the button, the "OK" button text will change to "Save". Clicking the "Save" button will save themodifications, clicking "Cancel" will keep the old data.
Adding a datum
To add a new datum definition, click the "Add" button. When adding a new definition, it is required tospecify a name for this datum, as well as the ellipsoid used. Other fields are optional and are defaultingto 0.0 when not used.
Please note that the X,Y and Z translations have to be entered in Meters, the X,Y and Z rotations areentered in arc seconds. If you have a datum definition that uses radians, you have to convert from radiansto arcseconds first: 1 radian = 206 264.806 arcseconds.
Click the "Save" button to store the newly created datum, by clicking cancel the input is ignored and youwill return to the list.
2.5.3 Manage Grids
Manage Grids - Eye4Software Coordinate Calculator
We recommend to manage your geodesy configuration database from the "Eye4Software CoordinateCalculator" which is a freeware tool which is shipped with Hydromagic. To start the "CoordinateCalculator", select "Geodesy Calculations" => "Coordinate Conversion..." option from the "Tools" menuas shown below:
Select the "Coordinate Conversion..." option to start the Coordinate Calculator.
The database containing all geodesy definitions, like ellipsoids, datums, coordinate systems andcorrection grids is stored in the "C:\ProgramData\Hydromagic\Database\" folder, and it is shared by

Eye4Software Hydromagic 9.456
© 2009-2021 Eye4Software B.V.
multiple applications, like Hydromagic Survey, Hydromagic Dredging and the Coordinate Calculator.Most of its content has been taken from the EPSG geodetic database and it will be updated regularly.
All geodesy definitions are stored in a shared database file.
Manage Grid Definitions
To open the "Manage Grids" window, select "Tools" => "Preferences" => "Manage Grids" from themenu. Using this window, you will be able to view, delete or modify existing grid definitions, or to addyour own. For a list of map grids that are currently in the database, click here.
The "M anage Grids" dialog can be opened from the "Tools" menu.
Grid list
When clicking an item in the list, its parameters are displayed below the list. You can edit theseparameters by clicking the "Modify" button.

Configuration 57
© 2009-2021 Eye4Software B.V.
Select a grid to show or alter its properties.
The map grid list can be sorted by clicking on the list columns. You can sort the list by country, gridname and geodetic datum used. A map grid definition is displayed by the flag of the country where itapplies to. If a grid can be used in multiple countries or regions, instead of a flag, a globe is displayed.
Deleting a grid
You can delete an datum definition, by selecting an item from the list and clicking the button "Delete".The software will show a popup to confirm that you are sure you want to delete. When clicking "Yes" thegrid will be deleted.

Eye4Software Hydromagic 9.458
© 2009-2021 Eye4Software B.V.
You have to confirm deletion of a grid definition.
Modifying a grid
You can modify a grid by clicking the "Modify" button after you selected a grid from the list. After clickingthe button, the "OK" button text will change to "Save". Clicking the "Save" button will save themodifications, clicking "Cancel" will keep the old data.
Adding a grid
To add a new grid definition, click the "Add" button. When adding a new definition, it is required tospecify a name for this grid, as well as the datum and projection used. Depending on the chosenprojection, the input fields are enabled or disabled. The table below shows what fields are required for thedifferent projections:
Selecting a country is not required, but the country can be used to sort lists by country, if the grid doesnot apply to a simple country, just select "Earth", "Europe", "Asia" etc... When you want to use otherunits for the Northing and Easting values calculated ( default is Meters ), you can also select the units tobe used. Please note that when changing this, you also have to enter the False Northing and FalseEasting in these units. Units currently supported are:

Configuration 59
© 2009-2021 Eye4Software B.V.
§ Meters§ Kilometers§ International Foot§ British Foot§ Clarke's Foot§ Gold Coast Foot§ Indian Foot§ British Foot (Sears)§ U.S. Survey Foot§ Link§ Clarke's Link§ British Link (Sears)§ U.S. Survey Link§ Statute Mile§ U.S. Survey Mile§ Chain§ Clarke's Chain§ British Chain (Sears)§ U.S. Survey Chain
Click the "Save" button to store the newly created grid, by clicking cancel the input is ignored and youwill return to the list.
2.5.4 Manage Geoids
Introduction
In Hydromagic, a geoid model is used to calculate the separation between the local vertical datum andthe WGS84 ellipsoidal height.Each geoid model is in fact a simple binary file containing separation values in a regularly spaced grid.
The geoid files have the file extension ".geo" and are stored in the "\ProgramData\Hydromagic\Geoids"folder on your harddrive.To access the "\ProgramData\Hydromagic" folder, please select the "Open Program Data Folder..."option from the "Help" menu.
To open the "Manage Geoids" window, select the "Coordinate Systems" => "Manage Geoids" optionfrom the "Tools" menu.Using this tool, you will be able to add new, remove or alter geoid definitions in the built in database.
Please note that not all geoids are installed by default. Geoid models that are configured, but notinstalled, are displayed in red.These geoids can be downloaded from our website:http://www.eye4software.com/hydromagic/documentation/geoid-models/

Eye4Software Hydromagic 9.460
© 2009-2021 Eye4Software B.V.
Geoid List
When clicking an item in the list, its parameters are displayed below the list. You can edit theseparameters by clicking the "Modify" button.The altered parameters can be saved by clicking the "Save" button, or discarded by clicking the "Cancel"button.
Deleting a geoid
You can delete a geoid definition, by selecting an item from the list and clicking the button "Delete". The software will show a popup to confirm that you are sure you want to delete the selected item. Please note that the geoid file will not be deleted and can still be used.
Modifying a geoid
You can modify a geoid model by clicking the "Modify" button after you selected a geoid model from thelist. After clicking the button, the "OK" button text will change to "Save". Clicking the "Save" button will savethe modifications, clicking "Cancel" will keep the old data.
Adding a geoid
To add a new geoid model definition, click the "Add" button. When adding a new definition, it is requiredto specify a name for this geoid as well as the file containing the separation values.
Configuration 61
© 2009-2021 Eye4Software B.V.
Click the "Save" button to store the newly created datum, by clicking cancel the input is ignored and youwill return to the list.
2.5.5 Manage Countries
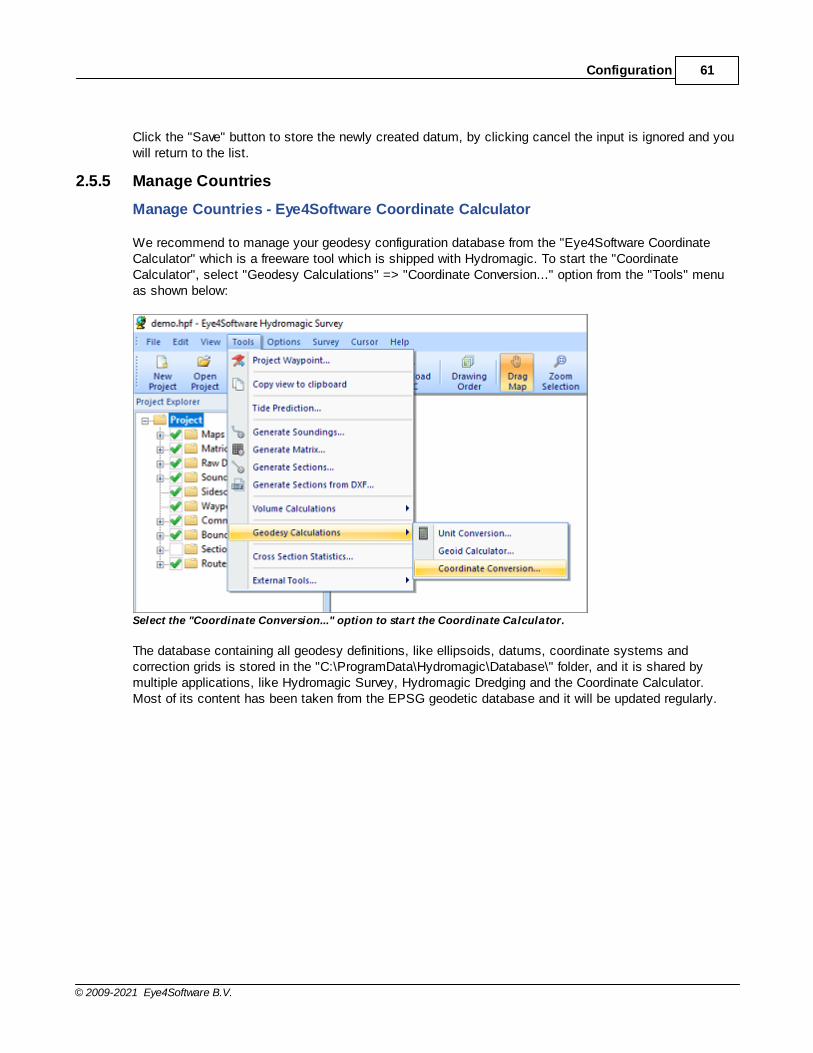
Manage Countries - Eye4Software Coordinate Calculator
We recommend to manage your geodesy configuration database from the "Eye4Software CoordinateCalculator" which is a freeware tool which is shipped with Hydromagic. To start the "CoordinateCalculator", select "Geodesy Calculations" => "Coordinate Conversion..." option from the "Tools" menuas shown below:
Select the "Coordinate Conversion..." option to start the Coordinate Calculator.
The database containing all geodesy definitions, like ellipsoids, datums, coordinate systems andcorrection grids is stored in the "C:\ProgramData\Hydromagic\Database\" folder, and it is shared bymultiple applications, like Hydromagic Survey, Hydromagic Dredging and the Coordinate Calculator.Most of its content has been taken from the EPSG geodetic database and it will be updated regularly.
Eye4Software Hydromagic 9.462
© 2009-2021 Eye4Software B.V.
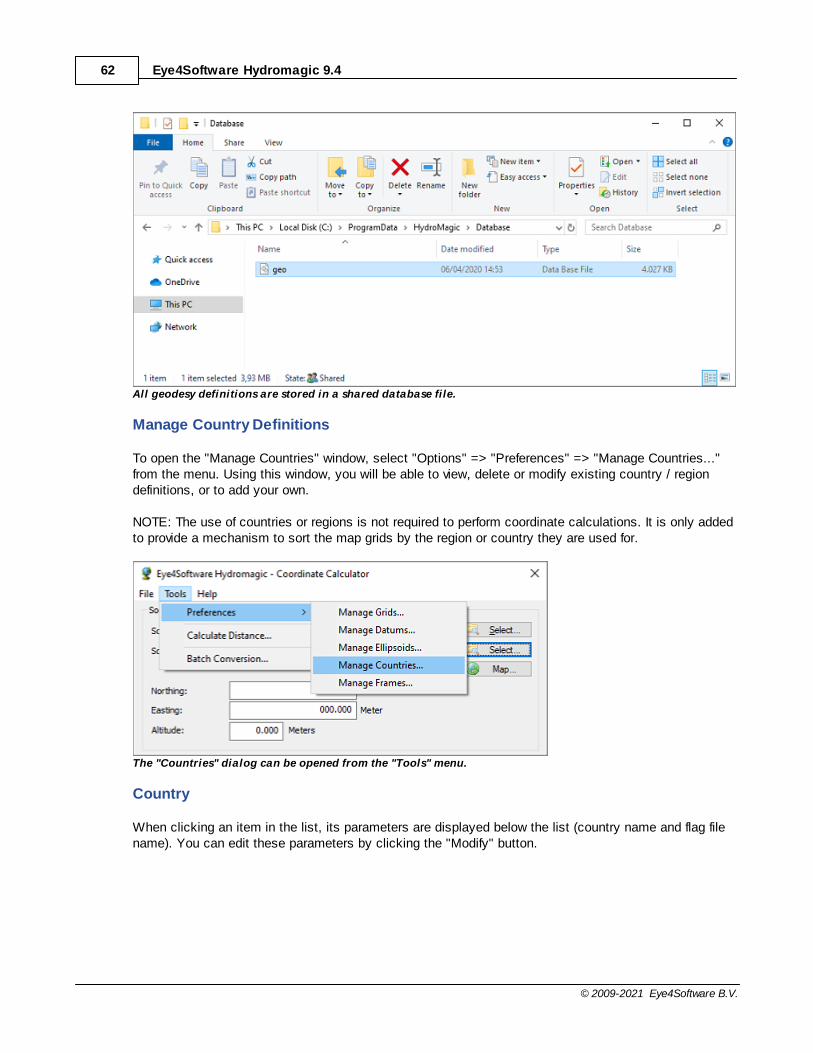
All geodesy definitions are stored in a shared database file.
Manage Country Definitions
To open the "Manage Countries" window, select "Options" => "Preferences" => "Manage Countries..."from the menu. Using this window, you will be able to view, delete or modify existing country / regiondefinitions, or to add your own.
NOTE: The use of countries or regions is not required to perform coordinate calculations. It is only addedto provide a mechanism to sort the map grids by the region or country they are used for.
The "Countries" dialog can be opened from the "Tools" menu.
Country
When clicking an item in the list, its parameters are displayed below the list (country name and flag filename). You can edit these parameters by clicking the "Modify" button.

Configuration 63
© 2009-2021 Eye4Software B.V.
Click a country to view or alter its properties.
Deleting a country
You can delete a country definition, by selecting an item from the list and clicking the button "Delete".The software will show a popup to confirm that you are sure you want to delete. Please note that youcannot delete countries that are used in a grid definition.
You have to confirm deletion of a country definition.
Modifying a country
You can modify a country by clicking the "Modify" button after you selected a country from the list. Youcan for instance translate the country name to your own language, or modify previously created regions.The flag associated with the country or region can be changed by clicking the "Browse" button. How toadd your own symbols or flags is described in the "Adding a country" section below. After clicking thebutton, the "OK" button text will change to "Save". Clicking the "Save" button will save the modifications,clicking "Cancel" will keep the old data.
Adding a country

Eye4Software Hydromagic 9.464
© 2009-2021 Eye4Software B.V.
To add a new country definition, click the "Add" button. When adding a new definition, it is required tospecify a name for this country. Specifying a symbol or flag for this country is optional, when no imagehas been specified a globe is displayed in the grid list. If you want to add your own symbol, convert thissymbol to a 16x16 PNG Image file and copy this file to the "Flags" folder in the program directory. Youcan select a flag or symbol by clicking the "Browse" button. The software ships with flags for mostcountries around. Click the "Save" button to store the newly created datum, by clicking cancel the inputis ignored and you will return to the list.

User Interface Features 65
© 2009-2021 Eye4Software B.V.
3 User Interface Features
3.1 Projects
Hydromagic Projects
Hydromagic organizes a set of background maps, raw data files, polls, map overlays, and boundaries asprojects. Each project has its own projection settings, the surveyor's name and associated projectdescription, and is stored in a separate folder on the disk.
The project settings are saved in a "Hydromagic Project File" with the file extension ".HPF". These filesare saved in XML format and, although not recommended, can be changed with any text editor.
Example on how a Hydromagic project is organized on disk.
Hydromagic project folders
Some folders, such as "Draft", "Reports", "Tides" and "Velocity" are intended to keep the projectorganized. The "Backups", "Maps", "Matrices", "Modified", "RawData" and "Soundings" folders arerequired to run the software and will be (re)created automatically by the software upon loading of theproject by the software. Hydromagic projects can be shared by Hydromagic Survey and HydromagicDredging.
Folder Description
Backups Folder to store backups from raw data f iles, the project f ile and the configuration
Maps Folder to store imported and dow nloaded maps
Matrices Folder used to store matrices generated from soundings or dredging matrices
Raw Data Folder w here raw data f iles are recorded during hydrographic surveys
Modif ied Folder w here modif ications to raw data f iles are stored

Eye4Software Hydromagic 9.466
© 2009-2021 Eye4Software B.V.
Soundings Folder w here soundings generated from raw data f iles are stored
Logs Folder to store user defined dredging logs generated in Hydromagic Dredging
Sidescan Folder w here imported sidescan data f iles are stored
Draft Folder to store draft f iles generated by the draft f ile editor
Tides Folder to store tide f iles generated by the tide f ile editor
Reports Folder to store PDF reports generated by one of the volume calculation tools
Velocity Folder to store sound velocity f iles
Folders created when creating a new Hydromagic project.
Creating a new project
The first thing to do when you start working with the software is to create a project. That is, of course,when there is no project available to load. To create a new project, select "New Project..." from the "File"menu in the Hydromagic application.
Select the "New Project..." option to start a new project.
When a project is currently loaded, you are asked if you want to save and discard changes. The followingdialog box is displayed. Just fill in the required fields and click the "Create" button to create a blankproject.
In the "Create new project" dialog, you can enter the project's name and coordinate system.

User Interface Features 67
© 2009-2021 Eye4Software B.V.
Project Name
Enter a descriptive name for the project. This name is also used as the folder name for the project on thedisk. Note that this name cannot contain any of the following characters: ' | ', ' / ', ' * ', ' : ' ,' ? ', ' " ', ' < 'and ' > '. The reason you can not use these, is because Windows forbids to use them in file names.
Project Location
Here you can select the location where the project will be saved. By default, the "Hydromagic" folder isselected under the "My Documents" folder.
Map Projection
Select the map projection that will be used in this project by clicking the "Select ..." button. Please notethat you cannot change the map projection after the project has been created..
Select a coordinate reference system for your new project.
Project Description

Eye4Software Hydromagic 9.468
© 2009-2021 Eye4Software B.V.
You can enter a description for the project here. The use of this field is optional. The value of this fieldcan be selected as part of the map footer text.
Surveyor
You can enter the name(s) of the surveyor(s) here. The use of this field is optional. The value of this fieldcan be selected as part of the map footer text.
Project Explorer
Your project and its contents can be viewed and modified using the "Project Explorer". It can be used todownload maps, import maps or data, remove items, starting utilities and much more.
In addition to the maps, you can also access raw data, soundings, sidescan data, routes, waypoints,boundaries and matrices here. For more options, just right-click with your mouse on an item to get apopup menu.
When the "Project Explorer" isn't visible it could be hidden or closed. To restore it, select the "ProjectExplorer" option from the "View" menu.
Backup projects
Using the "Project Explorer" it is possible to backup or archive your entire project with just a couple ofmouse clicks. To do so, right click the project root in the "Project Explorer" and select the "Archiveproject..." option.
A file dialog will appear, allowing you to set the name and location of the output file. The backup can bewritten as either a ZIP, TAR or ISO file. Click "OK" to generate the file.
Select the "Archive project..." optionto send your project files to a ZIP archive.
Open project folder
To open a Windows Explorer window containing the contents of the project, right click the root of theproject in the "Project Explorer" and select the "Show containing folder..." option. This might come inhandy when, for instance, you want to manually copy or backup files from or to your project.

User Interface Features 69
© 2009-2021 Eye4Software B.V.
Select the "Show containing folder..." optionto open your project files in Windows Explorer.
Alter project properties
This function can be used to alter some project properties like the surveyors name and the projectdescription. It is not possible to change the projection, units and project name once a project has beencreated. To use a different project after your survey, just create a new project with the correct projection,and import the recorded raw data files.
To show or modify these properties, right click the root of the project in the "Project Explorer" and selectthe "Show project properties..." option. When done editing, just click the "OK" button to store themodifications.
Select the "Show project properties..." optionto view or alter project properties.
Cloning a project

Eye4Software Hydromagic 9.470
© 2009-2021 Eye4Software B.V.
This feature has been added since version 9.0 after having a couple of requests for it. In some scenariosyou will survey the same area a couple of months later, but you would like to have a separate projectwithout going through the map download, drawing of the boundary and section generation again.
This is where the 'Clone Project' function comes in handy. You can let Hydromagic generate a newproject for you based on an existing project. You will be able to choose the new project name as well aswhich items will be copied from the existing project.
To clone a project, right click the root of the project in the "Project Explorer" and select the "CloneProject..." option:
Select the "Clone Project..." option togenerate a customized copy of your project.
The following dialog should now appear, already showing you a suggestion for the name of the newproject. Of course you can alter the project name to suit your needs. By default, the root folder shouldcontain the location where all your projects are. If you are using a different location for your project root,you might want to change the "Project Folder" value by clicking the "Browse..." button.
From the tree, select the items you want to keep in the new project. In most cases this includes themaps, boundaries and sections. After selecting the items, click the "OK" button to create the newproject. When the project has been created successfully, you can click the "Yes" button in the messagebox that appears to load the newly generated Hydromagic project. In case of problems, you can alwayscheck the content of the Activity View's "Processing" tab.
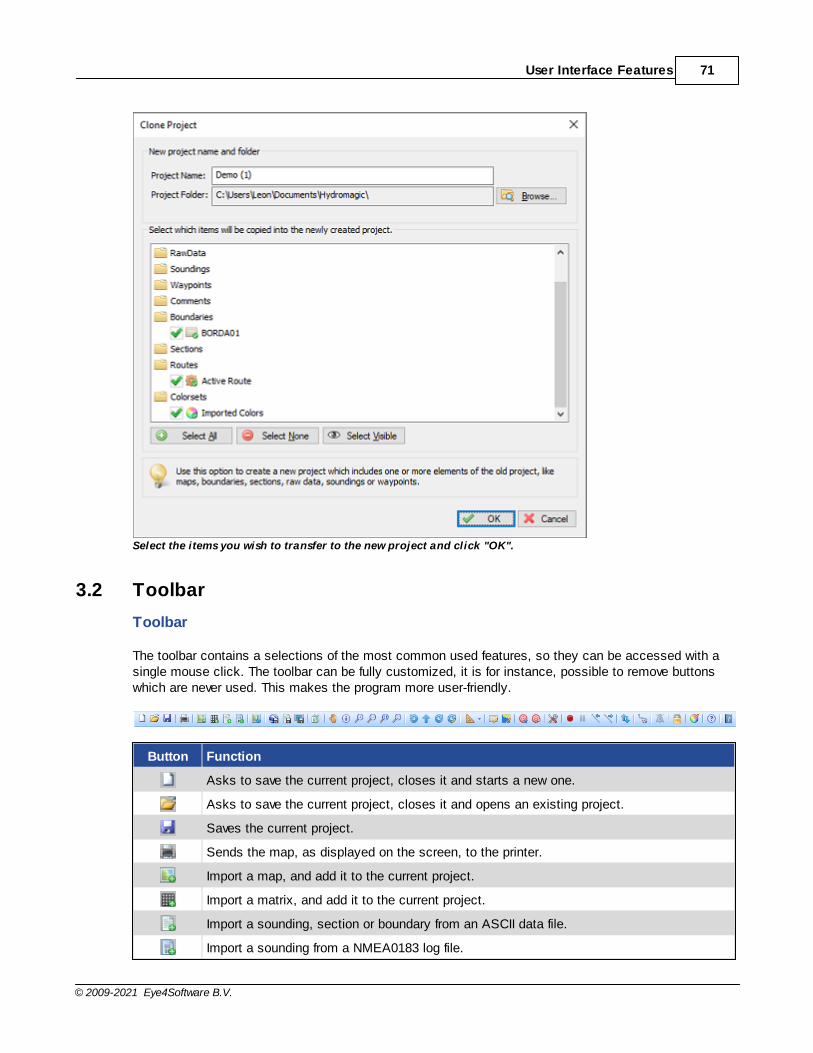
User Interface Features 71
© 2009-2021 Eye4Software B.V.
Select the items you wish to transfer to the new project and click "OK".
3.2 Toolbar
Toolbar
The toolbar contains a selections of the most common used features, so they can be accessed with asingle mouse click. The toolbar can be fully customized, it is for instance, possible to remove buttonswhich are never used. This makes the program more user-friendly.
Button Function
Asks to save the current project, closes it and starts a new one.
Asks to save the current project, closes it and opens an existing project.
Saves the current project.
Sends the map, as displayed on the screen, to the printer.
Import a map, and add it to the current project.
Import a matrix, and add it to the current project.
Import a sounding, section or boundary from an ASCII data file.
Import a sounding from a NMEA0183 log file.

Eye4Software Hydromagic 9.472
© 2009-2021 Eye4Software B.V.
Start the map downloading tool to download maps and add them to your project.
Exports a selection of the current project as KML file (Google Earth).
Exports a sounding, matrix, boundary or shoreline as an ASCII data file.
Saves the current view as an image file (JPG/GIF/PNG/TIF or BMP).
Adjust the drawing order of maps in the project.
Set cursor mode to "pan", allowing you to drag the map around using the mouse.
Set cursor mode to "info", click an object to show more information (vector maps only).
Set cursor mode to "zoom in", click the map to zoom in.
Set cursor mode to "zoom out", click the map to zoom out.
Set cursor mode to "zoom window", select a rectangle on the map to zoom.
Zoom to extends of all items in the project.
Rotate the map 15 degrees counter clockwise (CCW).
Undo rotation (north up).
Rotate the map 15 degrees clockwise (CW).
Rotate the map clockwise (CW) by specifying the rotation in degrees.
Measure area, perimeter, bearing or distance.
Boundary drawing tool. Starts drawing a boundary on the map. Right click to save.
Shoreline drawing tool. Starts drawing a shoreline on the map. Right click to save.
Draw the map in course up mode. Click again to switch back to north up.
Zoom to current location. Map will be zoomed to vessel's position.
Preferences. Open preferences window.
Start / Stop recording raw sensor data (starts a new raw data file).
Pause recording raw sensor data.
Activate previous cross-section or planned line (used for helmsman display).
Activate next cross-section or planned line (used for helmsman display).
Toggle between depth and elevation mode (only available when sounding has tideinformation).
Start the sounding generation wizard, allows you to convert raw data into soundings.
Reset position, sounder or speed alarm(s).
When active, the drag-and-drop feature will be disabled (locked).
Edit depth color and legend settings.
Show version and licensing information.
Display the offline user manual.
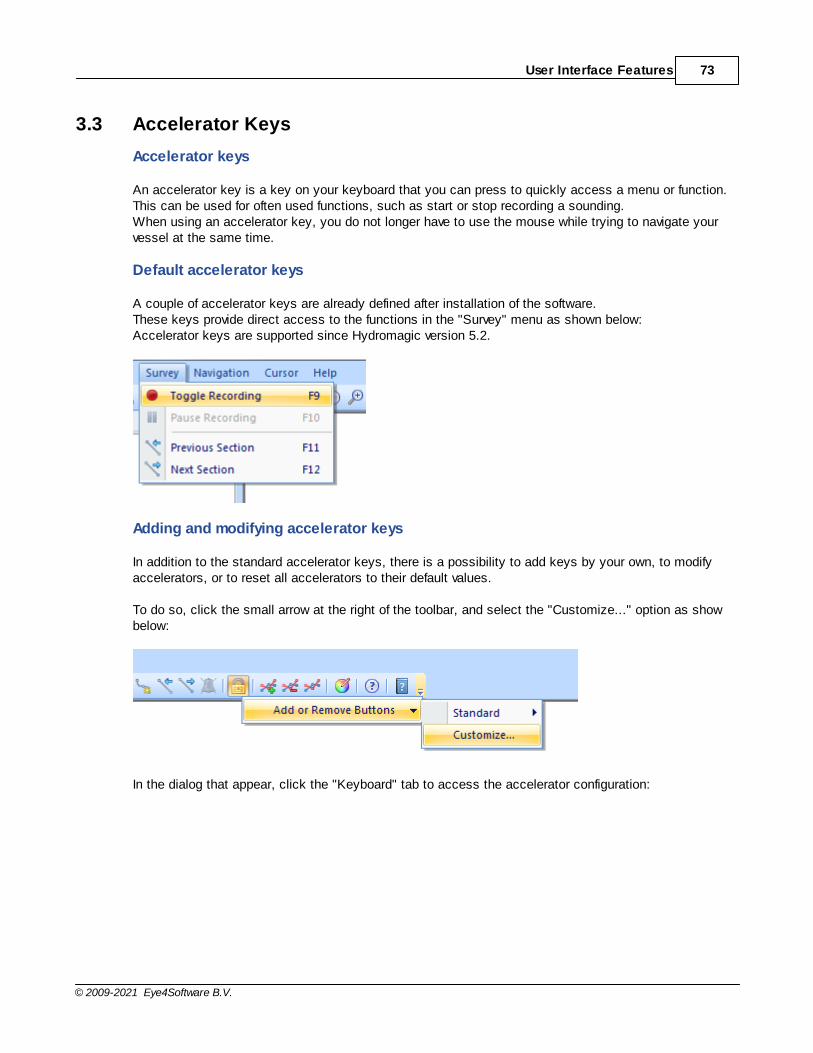
User Interface Features 73
© 2009-2021 Eye4Software B.V.
3.3 Accelerator Keys
Accelerator keys
An accelerator key is a key on your keyboard that you can press to quickly access a menu or function.This can be used for often used functions, such as start or stop recording a sounding.When using an accelerator key, you do not longer have to use the mouse while trying to navigate yourvessel at the same time.
Default accelerator keys
A couple of accelerator keys are already defined after installation of the software. These keys provide direct access to the functions in the "Survey" menu as shown below:Accelerator keys are supported since Hydromagic version 5.2.
Adding and modifying accelerator keys
In addition to the standard accelerator keys, there is a possibility to add keys by your own, to modifyaccelerators, or to reset all accelerators to their default values.
To do so, click the small arrow at the right of the toolbar, and select the "Customize..." option as showbelow:
In the dialog that appear, click the "Keyboard" tab to access the accelerator configuration:

Eye4Software Hydromagic 9.474
© 2009-2021 Eye4Software B.V.
To create a new accelerator, for instance, the F1 key to access the offline help program, select the menuitem you want to associate with the F1 key as described in the following steps:
· For the "Category" drop down box select "Help", and for "Commands" select "User Manual...";· Click the "Press New Shortcut Key" field with your mouse;· Now press the key you want to use, this can also be a combination of keys, for instance, CTRL + F9,
in this case we just press F1;· Click the "Assign" button to select the key;· Finished, you can now click the "Close" button to save your changes.
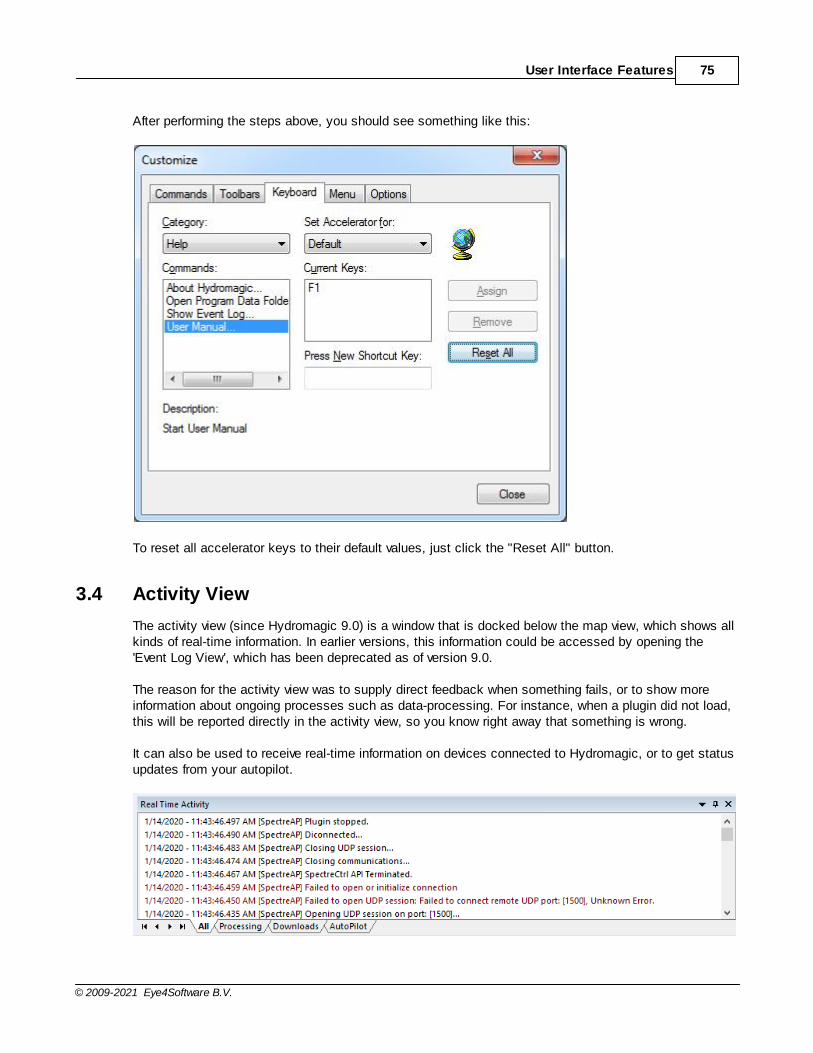
User Interface Features 75
© 2009-2021 Eye4Software B.V.
After performing the steps above, you should see something like this:
To reset all accelerator keys to their default values, just click the "Reset All" button.
3.4 Activity View
The activity view (since Hydromagic 9.0) is a window that is docked below the map view, which shows allkinds of real-time information. In earlier versions, this information could be accessed by opening the'Event Log View', which has been deprecated as of version 9.0.
The reason for the activity view was to supply direct feedback when something fails, or to show moreinformation about ongoing processes such as data-processing. For instance, when a plugin did not load,this will be reported directly in the activity view, so you know right away that something is wrong.
It can also be used to receive real-time information on devices connected to Hydromagic, or to get statusupdates from your autopilot.

Eye4Software Hydromagic 9.476
© 2009-2021 Eye4Software B.V.
Activity View Tabs
The activity view will always have three tabs. More tabs might be displayed depending on which plugin(s)you have loaded:
All
The 'All' tab will display all general information like plugins that were loaded, maps that have beenimported and all system errors.Sometimes more detailed information is sent to the 'Processing' tab, for instance when you are loading amap, the loading process will be displayed in the 'Processing' tab.
Processing
The 'Processing' tab will show information on all processing jobs like importing maps, parsing files,loading projects, post processing data and far more. When you process data and for some reason youdo not get the desired result, please consult this tab for more information on the problem.
Downloads
When downloading files from the web, such as background maps, nautical charts or geoid models, thedownload process will be displayed here. You can find the web URL's used to download the content, andin case of problems you can find the cause of the error here (i.e. website down, or document not found).
Autopilot
When an autopilot sends status updates (for instance waypoint reached or route uploaded), you can viewthem in the 'Autopilot' tab. This tab is hidden when no autopilot plugin has been loaded. Please refer tothis document for more info on using autopilots with Hydromagic.
Showing or hiding the activity view
By default, the activity view is docked at the bottom of the Hydromagic application, below the mapdisplay. Using the gripper just above the title bar of the activity view you can resize it so you can controlhow much vertical space it takes away from the map display.
When the activity view is hidden, or when you want to temporarily get rid of it (although notrecommended), you can toggle its visibility by clicking the "Activity View" menu item in the "View" menu(shown below).

User Interface Features 77
© 2009-2021 Eye4Software B.V.
Docking the view below the map display
When you enable the activity view and it is not properly docked below the map display (i.e. displayed asa floating window), just use the mouse and left click the mouse on the title bar of the activity viewwindow. While holding the left mouse button down, drag it into the 'down arrow' button as displayedbelow.
Copy text from the activity view

Eye4Software Hydromagic 9.478
© 2009-2021 Eye4Software B.V.
To copy text from the activity view, for instance when you need support on an error, hold down the 'CTRL'key when clicking one or multiple lines in the view. When you have selected all the text you want tocopy, right click on one of the selected items and choose the "Copy Text" option from the popup menuthat appears. Now you can use the "CTRL" + "V" key combination to paste the text in an email or textdocument.
Customizing text colors used in the activity view
Tracing information in the activity view uses distinct colors for error, success, warning, logging andinformation messages. For instance, errors are displayed in red, while success messages are coloredgreen. To change the color for each type of message, simply right click the activity view and choose the"Edit Color Settings..." menu item to start customizing.
3.5 Data View
Introduction
The data view is used to display all incoming data from the hardware.The data view is integrated in the Hydromagic environment as a docked window.
By default, it is displayed left of the map display.
The following information can be displayed in this view:

User Interface Features 79
© 2009-2021 Eye4Software B.V.
ü Current position in WGS84 latitude and longitude;ü Current position in UTM coordinates;ü Current position in the selected local grid;ü Altitude, course and speed;ü (D)GPS fix quality and used satellite(s) count;ü DGPS beacon ID and age;ü PDOP, HDOP and VDOP;ü Motion sensor data: heave, pitch and roll;ü Current Time;ü Navigation information;ü Dredging information.

Eye4Software Hydromagic 9.480
© 2009-2021 Eye4Software B.V.
Showing or hiding the data view
By default, the data view is displayed as a docked tabbed window. If you want to show or hide thiswindow, just select the "Navigation Data" option from the "View" menu. Sometimes the windows isalready displayed, but as a tabbed window. You have to select the "Navigation Data" tab to bring thewindow to the foreground. This tabs look like the image below:
Select items to display
You can easily modify the data view by showing and hiding items. By showing only the neededinformation, the display will become more well organized. To select the items to display, right-click onthe data view to show the following dialog. You can just select the items to display, by checking them.

User Interface Features 81
© 2009-2021 Eye4Software B.V.
Position - Latitude / Longitude
Your current GPS position in WGS84 latitude and longitude format. It is possible to change the displayformat used. The display format can be modified from in the "Units" tab in the preferences window( "Preferences..." from the "Options" menu ).
Position - Universal Transverse Mercator
Your current GPS position in UTM (Universal Transverse Mercator). The UTM zone is automaticallydetected using your current position, and will also be displayed. The UTM coordinates are displayed innorthing and easting meters.

Eye4Software Hydromagic 9.482
© 2009-2021 Eye4Software B.V.
Position - User Selected Grid
Your current GPS position displayed in either easting and northing or latitude and longitude, dependingon the local map grid used to display the current map. This projection is the same as the projectiondisplayed in the status bar at the bottom of the screen.
Altitude
Altitude of the GPS antenna. Depending on the GPS, this can be the altitude above sea level, or thealtitude above the geoid. The altitude can be displayed in meters or feet. The current altitude unit settingcan modified from in the "Units" tab in the preferences window ( "Preferences..." from the "Options"menu ).
Depth
Displays both the low and high frequency (if applicable) depths returned by the echosounder as well asthe depths corrected with the current (RTK) tide value.
Tide
Displays the current tide value. Depending on the settings, either the manual, RTK or tide receiver tidewill be displayed.
Course
Course calculated by the GPS. Also know as course over ground.
Speed
Speed calculated by the GPS. Also known as speed over ground. The speed can be displayed in milesper hour, meters per second, knots and kilometers per hour. The current altitude unit setting can bemodified from the "Units" tab in the preferences window ( "Preferences..." from the "Options" menu ).
GPS Statistics
This option can be selected to retrieve more information on the GPS fix. This section in the data viewincludes the quality of the GPS fix (no fix, GPS fix, DGPS fix, etc...), the number of satellites used andsome basic information on the DGPS reference station used (not available when using EGNOS/WAAS).
DOP
This option can be selected to enable the DOP (Dilution Of Precision) section in the data view. It showsPDOP (overall dilution of precision or position dilution of precision), HDOP (horizontal dilution ofprecision) and VDOP (vertical dilution of precision).
Dredging
Display information on the ongoing dredging process. When using the Hydromagic Dredging edition ofthe software, enabling this option will display dredging depth as well as position information on thedredging equipment used.

User Interface Features 83
© 2009-2021 Eye4Software B.V.
Motion
Display motion information received from a motion sensor, IMU or echosounder with built in motion orheave sensor.Enabling this option will display heave, roll and pitch information in the data view.
Clock
Just displays the current PC date and time in GMT (Greenwich Mean Time).
Navigation Info
When the software is used in waypoint-to-waypoint navigation, enabling this option will cause the dataview to show bearing and distance to waypoint.
3.6 Helmsman Display
Helmsman Display
The helmsman display (also known as LR-indicator) in Hydromagic can be used to display the crosstrack error (XTE) when navigating on planned survey lines. It provides you with information on in which direction to steer to follow the planned lines as accurate aspossible.
Activating the helmsman display
The helmsman display can be activated by selecting "LR Indicator" from the "View" menu. The displaywill be displayed. The display will now be displayed, however, it won't display any useful information until a valid GPSposition is available and a cross section or planned survey line has been selected.

Eye4Software Hydromagic 9.484
© 2009-2021 Eye4Software B.V.
Activating a survey line
Because the cross track error displayed is calculated from the position of your vessel relative to a line,you have to tell the software which planned survey line you want to follow.Please note that in Hydromagic, there is no difference between a planned survey line and a crosssection. Cross sections can be used in volume calculations, cross section displays and as plannedsurvey lines. There are several ways to select a cross section:
· Right click on the center of a cross section and select "Activate Section..." from the popup menu;· Select a cross section by selecting the previous or next section using the F11 and F12 function keys;· Right click a cross section in the project explorer and select "Set Active";
Using the display to steer
When a valid position is available, the difference in heading between the vessel and the line is less then45 degrees, and a cross section has been selected the helmsman display is indicating the distancebetween your vessel and the line, as well as the direction:

User Interface Features 85
© 2009-2021 Eye4Software B.V.
The value displayed is the distance to the line in the horizontal units selected in the current mapprojection.When the value is displayed in red, it means you are on the port side (left) of the line, and you have tosteer to the steer to the starboard side (right).When the value is displayed in green, it means you are on the starboard side (right) of the line, and youhave to steer to the port side (left).
The line that is used to calculate the calculate the cross track error (the line that is activated) ishighlighted in yellow on the chart display:

Eye4Software Hydromagic 9.486
© 2009-2021 Eye4Software B.V.
3.7 Area Measurements
Introduction
Eye4Software Hydromagic offers a variety of tools to calculate or measure the area covered by asounding, map feature or other object. The results of an area measurement are displayed using one ofthe following units:
· Acres;· Hectares;· Square Meters;· Square Kilometers;· Square Yards;· Square Feet.
Areas are calculated by converting all coordinates of the selected area to vectors. The calculated vectorsare passed to a cross-product formula used to calculate the total area of the object measured.
Setting area units
Before performing an area measurement, make sure your preferred area units have been set!
To specify the units used for area calculation, open the "Preferences" dialog, by selecting"Preferences..." from the "Options" menu. Now click on the "Units" tab. For more info on how to setunits, please refer to the "Unit settings" page.
Use the "Area Units" drop down box to select the preferred units, and click the "OK" button to store thenew setting.

User Interface Features 87
© 2009-2021 Eye4Software B.V.
Measuring the area of a map object
Areas of map objects can be calculated by selecting the corner coordinates of the polygon using themouse. To get the most accurate results, make sure that the object is zoomed in at the maximum zoomlevel.
Now select the "Area" cursor tool by selecting "Area" from the "Cursor" menu. All you have to do isselect all the corners of the object, as shown in the screen shot below:

Eye4Software Hydromagic 9.488
© 2009-2021 Eye4Software B.V.
You will notice a blue line drawn around the object. A dialog box appears on top on the map showing thecurrent area and perimeter of the map object. When you finished measuring, just click the right mousebutton to dismiss the dialog box, and return to the previous mouse mode.
3.8 Coordinate calculator
Introduction
Hydromagic has a built in coordinate calculator tool, which can be used to convert a single projected(easting/northing) or geographic (latitude/longitude) coordinate. This tool can, for instance, be used tocheck whether configured map grids and map datum are working correctly. All map datums, grids andellipsoids configured in Hydromagic can be used with this conversion tool.
The following calculations are supported:
§ Convert geographic coordinates to projected coordinates;§ Convert projected coordinates to geographic coordinates;§ Transform geographic coordinates between different map datums;§ Convert projected coordinates from one coordinate reference system to another;§ Convert geographic coordinates between different latitude and longitude formats.

User Interface Features 89
© 2009-2021 Eye4Software B.V.
Start the Coordinate Calculator
You can start the Coordinate Calculator by selecting "Coordinate Calculator..." from the "Tools" menu inthe main window. After selecting this option, the following window should appear:
The main screen of the "Eye4Software Coordinate Calculator".
Using the Coordinate Calculator
To perform a coordinate conversion, you have to enter the following information:
§ Source map datum or map grid;§ Destination map datum or map grid;§ Source coordinates, geographic or projected;§ The format used for the geographic source coordinates (optional);§ The source altitude (optional);
Source Coordinates section
Source grid
In this field, the name of the source map grid is displayed. When the source coordinate is in geographiccoordinates, the text: "Geographic Longitude / Latitude" is displayed here. To set the source coordinatesto geographic coordinates, you have to select a map datum instead of a map grid.

Eye4Software Hydromagic 9.490
© 2009-2021 Eye4Software B.V.
Source datum
In this field, the name of the source datum is displayed. When a map grid is selected, this field displaysthe map datum used in this map grid. To set the source coordinates to projected coordinates, you haveto select a map grid instead of a map datum.
Source coordinates (X)
Depending on whether you selected a map grid or not, this field is used to enter the source easting (X) orlongitude coordinate. When using a map grid, the units of the X-axis are displayed ( for instance: meters,feet, links etc... ). When using a map datum, geographic coordinates are displayed as specified with theradio buttons.
Source coordinates (Y)
Depending on whether you selected a map grid or not, this field is used to enter the source northing (Y)or latitude coordinate. When using a map grid, the units of the Y-axis are displayed ( for instance:meters, feet, links etc... ). When using a map datum, geographic coordinates are displayed as specifiedwith the radio buttons.
Map button
When you click the "Map..." button, the software will convert the source coordinates entered to aWGS84 geographic coordinates, and displays this position as a marker in a Google Maps web page.This way you can check whether the correct coordinates have been entered.
Source geographic format
When using geographic coordinates, 3 radio buttons are shown, you can use these buttons to select thegeographic format:
§ Decimal Degrees;§ Degrees, Decimal Minutes;§ Degrees, Minutes, Seconds.
When a map grid is selected, these buttons are hidden, and the coordinates are always displayed innorthing and easting (projected) units.
Destination Coordinates section
Destination grid
In this field, the name of the destination map grid is displayed. When the destination coordinate is ingeographic coordinates, the text: "Geographic Longitude / Latitude" is displayed here. To set thedestination coordinate to geographic coordinates, you have to select a map datum instead of a map grid.
Destination datum
In this field, the name of the destination geodetic datum is displayed. When a map grid is selected, thisfield displays the map datum used in this map grid. To set the destination coordinate to projectedcoordinates, you have to select a map grid instead of a map datum.
Destination coordinates (X)
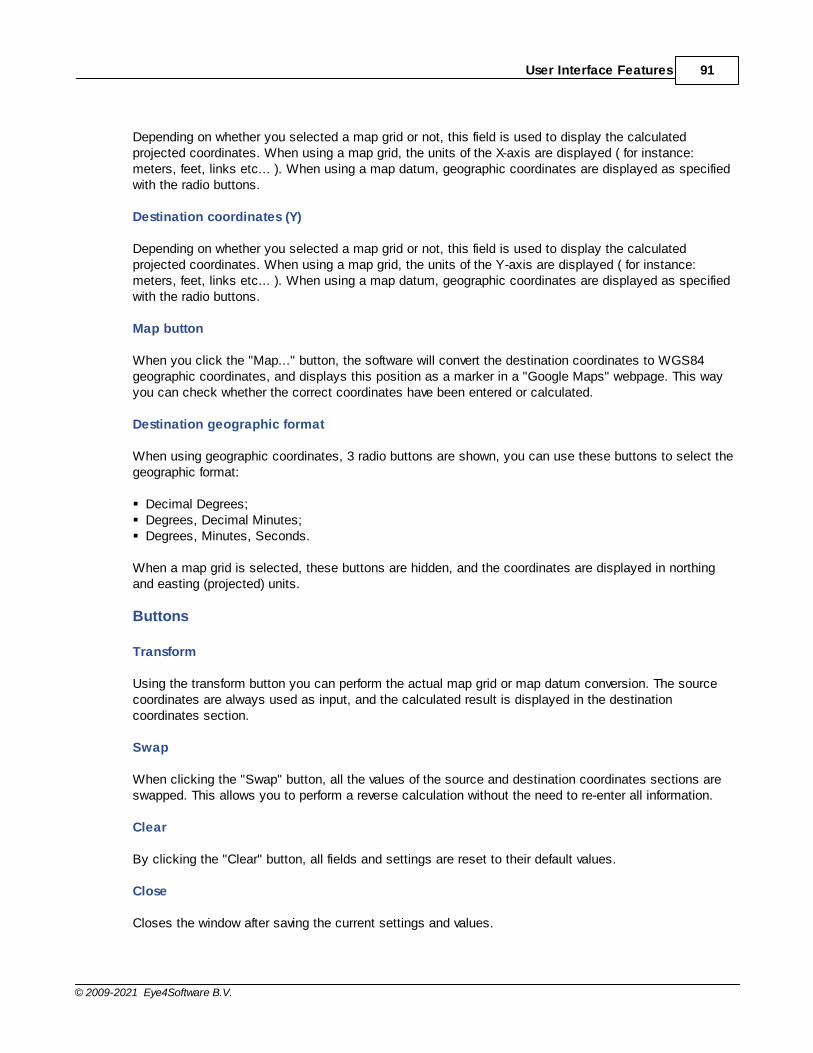
User Interface Features 91
© 2009-2021 Eye4Software B.V.
Depending on whether you selected a map grid or not, this field is used to display the calculatedprojected coordinates. When using a map grid, the units of the X-axis are displayed ( for instance:meters, feet, links etc... ). When using a map datum, geographic coordinates are displayed as specifiedwith the radio buttons.
Destination coordinates (Y)
Depending on whether you selected a map grid or not, this field is used to display the calculatedprojected coordinates. When using a map grid, the units of the Y-axis are displayed ( for instance:meters, feet, links etc... ). When using a map datum, geographic coordinates are displayed as specifiedwith the radio buttons.
Map button
When you click the "Map..." button, the software will convert the destination coordinates to WGS84geographic coordinates, and displays this position as a marker in a "Google Maps" webpage. This wayyou can check whether the correct coordinates have been entered or calculated.
Destination geographic format
When using geographic coordinates, 3 radio buttons are shown, you can use these buttons to select thegeographic format:
§ Decimal Degrees;§ Degrees, Decimal Minutes;§ Degrees, Minutes, Seconds.
When a map grid is selected, these buttons are hidden, and the coordinates are displayed in northingand easting (projected) units.
Buttons
Transform
Using the transform button you can perform the actual map grid or map datum conversion. The sourcecoordinates are always used as input, and the calculated result is displayed in the destinationcoordinates section.
Swap
When clicking the "Swap" button, all the values of the source and destination coordinates sections areswapped. This allows you to perform a reverse calculation without the need to re-enter all information.
Clear
By clicking the "Clear" button, all fields and settings are reset to their default values.
Close
Closes the window after saving the current settings and values.

Eye4Software Hydromagic 9.492
© 2009-2021 Eye4Software B.V.
3.9 Alarms
Alarms in Hydromagic
In Hydromagic, alarms can be configured to alert you, or stop recording a sounding, when specifiedconditions are (not) met. Alarms can be applied to GPS accuracy, position, speed, echo sounder depthand boundary (geofencing).
We recommend to use at least the alarm for the GPS accuracy to avoid recording invalid data for hours.For instance. when the RTK fix has been lost, you want to know this immediately to avoid recoding withinvalid tide values.
To setup alarms, first select the "Preferences..." item from the "Options" menu to open the preferencesdialog. In the preferences window, please select the "Alarms" tab to setup alarms:
GPS or RTK receiver alarms
To setup alarms on the GPS / RTK equipment, click the "Setup..." button in the "GPS Alarm" section.To enable alarms for GPS, check the "Enable alarm on invalid and inaccurate GPS positions" option.You will now be able to configure other options:

User Interface Features 93
© 2009-2021 Eye4Software B.V.
Minimum GPS quality value
Use this option to make sure only positions are recorded when the GPS is, for instance, in RTK Fixed ordifferential GPS mode.Possible values include:
§ No Fix§ GPS Fix§ DGPS Fix§ RTK Float§ RTK Fixed
When using tide corrections using RTK, it is recommended to use this option with "RTK Fixed" selected,so you will be notified when RTK tides are disabled.
Minimum GPS satellite count
This options can be used to use only position fixes with a minimum number of satellites in view to ensureaccuracy. For a valid 2D fix, at least 3 satellites are required, for a 3D fix, you need at least 4 satellites.It is recommended to set this value to 6 or higher.
Maximum HDOP value
Activates alarm when the HDOP (Horizontal Dilution of Precision) value exceeds a defined threshold.Recommended value is 2.0.
Maximum DGPS age
The DGPS age indicates the age of the correction data in seconds. When this value goes up, it oftenmeans that the differential GPS or RTK correction signal is temporary lost. In most scenario's this valuewill not exceed the value of 5-6. It is recommended to set this value to 10.

Eye4Software Hydromagic 9.494
© 2009-2021 Eye4Software B.V.
Require DGPS beacon id
This option can be used when a DGPS or RTK correction signal is used. When another beacon isreceived then the one that is expected, it may result in inaccurate positions, for instance when areference station is at a to great distance. Set this value to the beacon ID that is displayed directly at asuccessful setup of your reference station.
Sounder alarms
To setup alarms on the echo sounder equipment, click the "Setup..." button in the "Sounder Alarm"section. Sounder alarms are available in the Hydromagic Survey edition only.
To enable alarms for sounders, check the "Enable alarm on invalid and out-of-range soundings" option.You will now be able to configure other options:
Minimum Depth
Sets the minimum depth that is expected to be returned from the sounder. This value is not corrected,but compared to the raw depth returned.
Maximum Depth
Sets the maximum depth that is expected to be returned from the sounder. This value is not corrected,but compared to the raw depth returned.
Boundary alarms
To setup an alarm on the dredging area boundary, click the "Setup..." button in the "Boundary Alarm"section. Boundary alarms are available only in the Hydromagic Dredging edition.
To enable an alarm for boundaries, check the "Enable alarm on dredge head location" option. You willnow be able to configure other options:

User Interface Features 95
© 2009-2021 Eye4Software B.V.
Selected Boundary
The selected boundary is used to check the dredging position. When the dredge head is outside of theselected boundary, the alarm will be triggered.
Speed alarms
To setup an alarm on the speed of the vessel, click the "Setup..." button in the "Speed Alarm" section.Speed alarms are available in both the Hydromagic Survey and Dredging editions.
To enable an alarm for speed, check the "Enable alarm on speed limit" option. You will now be able toconfigure other options:
Maximum Speed
The maximum speed of the vessel during survey or dredging operations. Due to latency errors, therecommended maximum speed for performing surveys is 4 km/h.
Alarm options

Eye4Software Hydromagic 9.496
© 2009-2021 Eye4Software B.V.
Pause sounding recording
When the "Pause sounding recording" option is enabled, the recording of the current sounding issuspended when the alarm is activated.You have to press the record button again to resume recording.
Sound Alarm
When the "Sound alarm" option is enabled, then a sound is played when the alarm is activated. Inaddition to the sound, a big red banner with the text 'ALARM' is displayed in the map view.
You can reset the alarm by clicking the reset alarm button in the tool bar:
NOTE: When using sound alarm(s), make sure your sound hardware is enabled and the volumeis turned on.
3.10 Query objects
Introduction
Hydromagic allows you to use the mouse to select a map feature or coordinate on the map, and to returnmore information on objects found at this location.You can use this feature to get more information on a CAD or GIS feature, or to retrieve depth at anygiven location (within the boundaries of a loaded or generated matrix).
You can access this feature by clicking the button in the toolbar.
Querying depth values
In order to retrieve depth information using the mouse, make sure a matrix is loaded or generated, andset to active.You can activate (which means that is the matrix selected for operations) a matrix by right-clicking it inthe "Project Explorer" and selecting the "Set Active" option as shown below:

User Interface Features 97
© 2009-2021 Eye4Software B.V.
After selecting the matrix you want to use, set the cursor to "Query Object" by selecting the button inthe toolbar.You can now click anywhere within the boundaries of the matrix to retrieve depth information. The depth,interpolated from the four nearest cells, will be calculated and displayed as shown below:
When ready, right click on the map to dismiss the dialog and reset the mouse mode to "Pan".
Querying CAD or GIS features
In order to retrieve information on a object or feature on a CAD or GIS (vector) map, make sure the mapis visible. You can now click on the object you want to retrieve information for. When an object has beenfound near the cursor, the "Query Object Information" dialog will be displayed. In this example we arequerying a CAD object from a DXF file, so the DXF layer and handle are displayed.

Eye4Software Hydromagic 9.498
© 2009-2021 Eye4Software B.V.
Converting CAD or GIS features to shorelines or boundaries
As you may have noticed, the dialog contains a button with the caption: "Convert shape to boundary".This function will allow you to import the shape of a boundary directly from a loaded CAD or GIS file. Justselect the object you want to use, and select the "Convert shape to boundary" option.
3.11 Raw data manager
Raw data files manager
The "Raw data files manager" can be used to apply operations on more then one raw data file at a time.The manager window lists all raw data files recorded or imported in the project, and allows you to selectmultiple raw data files in order to toggle visibility, remove or export files. The list of raw data files alsoshows you the creation or recording date, the start time, the records count and file size.

User Interface Features 99
© 2009-2021 Eye4Software B.V.
The raw data files manager shows a list of raw data files in the project.
Opening the raw data files manager
The "Raw data files manager" can be opened from the "Project Explorer", which is normally situated onthe left side of the main program window. If not visible yet, select "Project Explorer" from the "View"menu, locate the "Raw Data" folder in the "Project Explorer", and right-click this folder with the mouse.From the context menu which appears, select the "Manage Files..." option as shown below:
Right click the "Raw Data" folder and select "M anage Files...".
Tool bar
The tool bar contains buttons for most of the options offered by the raw data files manager. First selectthe files in the list, by clicking multiple items while holding the CTRL button. Of course it is possible tojust select a single item. To select all items on a device with touch screen, simply press the "Select All"button.
The tool bar contains buttons for the most commonly used operations
Analyze File
Use the "Analyze File" button to show the contents of a single raw data file. With this option you canshow the depth, position, motion and other records along with their time stamps. This function can onlybe accessed when only one file has been selected. Please see the Analyzing recorded raw data manualpage for a detailed description of this function.

Eye4Software Hydromagic 9.4100
© 2009-2021 Eye4Software B.V.
Use the analyzer to view the contents of a raw data file.
Delete File
You can delete one or multiple raw data file(s) from your hydrographic survey by clicking the "Delete File"button. Before you can access this button you have to select either one or multiple files in the raw datafiles list. Before files are permanently deleted, you first have to confirm you want to delete the selectedraw data files by clicking the "OK" button in the confirmation dialog which will be shown:
You always have to confirm removal of raw data files.
Select All
With the "Select All" button the current selection will be reversed, which means that when none of thefiles has been selected, clicking this button will select all files. This button has been added to the toolbar to allow touch screen users to select or deselect all files by simply clicking a button.

User Interface Features 101
© 2009-2021 Eye4Software B.V.
Toggle Visibility
Use the "Toggle Visibility" button to toggle the visibility (show or hide) of the items selected in the rawdata file list. From the "Project Explorer" it is possible to toggle visibility of raw data files, but you have totoggle them one-by-one, since there is no way to select multiple items at once. If you want to, forinstance, hide all raw data files, the easiest method to do this, is to open the raw data files manager fromthe "Project Explorer", then click the "Select All" button followed by clicking the "Toggle Visibility"button.
Export RAW
The "Export RAW" button allows you to export the selected raw data files to another data format. At thismoment it is only possible to export the raw data files to HYPACK raw data format. This might be usefulin case you want to process the collected soundings in HYPACK.
Raw data files can be exported as HYPACK raw data files.
3.12 Sounding manager
Sounding Manager
The "Sounding Manager" can be used to apply operations on more then one sounding file at a time. Themanager window lists all sounding files generated or imported in the project, and allows you to selectmultiple sounding files in order to toggle visibility, remove or export files. The list of sounding files alsoshows you the creation or recording date, the start time, the records count and file size.

Eye4Software Hydromagic 9.4102
© 2009-2021 Eye4Software B.V.
The sounding manager shows a list of sounding files in the project.
Opening the sounding manager
The "Sounding Manager" can be opened from the "Project Explorer", which is normally situated on theleft side of the main program window. If not visible yet, select "Project Explorer" from the "View" menu,locate the "Soundings" folder in the "Project Explorer", and right-click this folder with the mouse. Fromthe context menu which appears, select the "Manage Soundings..." option as shown below:
Right click the "Sounding" folder and select "M anage Soundings...".

User Interface Features 103
© 2009-2021 Eye4Software B.V.
Tool bar
The tool bar contains buttons for most of the options offered by the sounding manager. First select thefiles in the list, by clicking multiple items while holding the CTRL button. Of course it is possible to justselect a single item. To select all items on a device with touch screen, simply press the "Select All"button.
The tool bar contains buttons for commonly used operations on sounding files.
Edit Sounding
The "Edit Sounding" button launches the sounding editor and loads the currently selected sounding file.This function can only be accessed when a single selection has been made. The "Sounding Editor"allows you to view sounding records (pings) in detail and it can be used to alter depth values or to removepings.
The sounding editor can be used to alter depth values or to remove pings.
Remove Sounding(s)
You can delete one or multiple sounding file(s) from your hydrographic survey by clicking the "RemoveSounding" button. Before you can access this button you have to select either one or multiple soundingsin the sounding files list. Before soundings are permanently deleted, you first have to confirm you want todelete the selected sounding files by clicking the "OK" button in the confirmation dialog which will beshown:

Eye4Software Hydromagic 9.4104
© 2009-2021 Eye4Software B.V.
You always have to confirm removal of sounding files.
Activate Sounding
When a sounding has been marked as "Active", this means that you can modify this sounding from themap display. You can right click pings in the active sounding and select the "Edit Sounding" data optionto modify the raw high and low frequency depths, you can drag pings to another position, or you canremove ping records from the sounding. You can only edit the sounding which has been set as activethis way, all other soundings will remain "Read-Only". To change the sounding which is currentlyselected, select the sounding and click the "Activate Sounding" button.
Extra options for the activated soundingin the map display window.
Select All
With the "Select All" button the current selection will be reversed, which means that when none of thesoundings has been selected, clicking this button will select all soundings. This button has been addedto the tool bar to allow touch screen users to select or deselect all soundings by simply clicking abutton.
Toggle Visibility
Use the "Toggle Visibility" button to toggle the visibility (show or hide) of the items selected in thesounding file list. From the "Project Explorer" it is possible to toggle visibility of sounding files, but youhave to toggle them one-by-one, since there is no way to select multiple items at once. If you want to, forinstance, hide all soundings, the easiest method to do this, is to open the sounding manager from the"Project Explorer", then click the "Select All" button followed by clicking the "Toggle Visibility" button.

User Interface Features 105
© 2009-2021 Eye4Software B.V.
Merge Soundings
When you want to merge (or join) multiple soundings into a single sounding file, select the soundings toinclude in the new sounding file and click the "Merge Soundings" button. The newly created sounding willbe displayed in the sounding list. The first available name will be assigned to this sounding, but you willbe able to change the name in the "Sounding Editor".
Show Echogram
Click the "Show Echogram" button to show all echograms for the currently selected sounding.Depending on the echo sounder used, the digitized depths and the echo envelope will be displayed forthe sounding. For more information on how to customize the echo envelope display, please have a lookat the "Echogram settings" manual page.
Use the "Show Echogram" button to show both the digitized and echo envelope data.
Export Echogram
The "Export Echogram" button opens the "Export Echograms" utility, which allows you to export theechogram containing the digitized depth data as an image file. In addition to the digitized data,depending on the echo sounder used, it can also be used to export an image of the full echo envelope forhigh or low frequency soundings or sub-bottom return signals.

Eye4Software Hydromagic 9.4106
© 2009-2021 Eye4Software B.V.
Export your digitized echogram and echo envelope data as image file(s).
Export ASCII
Using the "Export Soundings" tool, it is possible to store your filtered sounding data in plain ASCIIformat, so that sounding data can be imported in Microsoft Excel or other third party (GIS) software. Youcan export multiple sounding files at once, just select the soundings to export and click the "ExportASCII" button.

User Interface Features 107
© 2009-2021 Eye4Software B.V.
You can export the contents of your Hydromagic sounding files as plain ASCII.
3.13 Import raw data
3.13.1 Import NMEA0183 ASCII log files
NMEA0183 log files are files where NMEA0183 data is recorded from devices like GPS andechosounder.Instead of sending the data directly to Hydromagic in real time, the data was recorded on for instance aSD-Card.
This method is often used on USV's (unmanned survey vessels) when it is not possible to establish adirect link to the shore.In these cases the data is stored on an onboard SD-Card or any other removable storage device.
$GPGGA,222525.20,6804.42753000,N,16251.36499361,W,2,08,1.1,305.895,M,2.577,M,1.2,0029*6D $GPVTG,240.20,T,,M,0.24,N,0.44,K,D*3A $SDDBT,0.91,f,0.28,M,0.15,F*30 $SDDBT,0.91,f,0.28,M,0.15,F*30 $GPGGA,222525.40,6804.42750707,N,16251.36503441,W,2,08,1.1,306.227,M,2.577,M,1.4,0029*69 $GPVTG,236.70,T,,M,0.23,N,0.43,K,D*3E $SDDBT,0.91,f,0.28,M,0.15,F*30 $HCHDG,312.5,,,,*47

Eye4Software Hydromagic 9.4108
© 2009-2021 Eye4Software B.V.
$SDDBT,0.91,f,0.28,M,0.15,F*30 $GPGGA,222525.60,6804.42748134,N,16251.36507432,W,2,08,1.1,306.555,M,2.577,M,1.6,0029*64 $GPVTG,227.46,T,,M,0.24,N,0.44,K,D*3B $SDDBT,0.91,f,0.28,M,0.15,F*30 $SDDBT,0.91,f,0.28,M,0.15,F*30 $GPGGA,222525.80,6804.42746479,N,16251.36504080,W,2,08,1.1,306.793,M,2.577,M,1.8,0029*60 $GPVTG,222.82,T,,M,0.23,N,0.43,K,D*36 $SDDBT,0.91,f,0.28,M,0.15,F*30 $SDDBT,0.91,f,0.28,M,0.15,F*30 $HCHDG,312.5,,,,*47 $GPGGA,222526.00,6804.42745489,N,16251.36500786,W,2,09,1.1,306.908,M,2.577,M,2.0,0029*64
Content of a NM EA0183 log file (5 Hz position interval / 10 Hz depth interval)
Timing errors with NMEA0183 logs
However, there is a big drawback when it comes to using NMEA0183 log files: Because depth recordsaren't timestamped in NMEA0183, it is impossible to get the actual time difference between the positionand depth data which may cause the depth positions to be shifted. When the position update interval islow errors can be up to several meters which makes the data unusable.
When the data is processed by Hydromagic, you won't have this problem because the incoming datatimestamped as soon as the data comes in.
You can easily calculate the maximum error of the depth positions in NMEA0183 imports by dividing thespeed in meter per seconds by the position data interval. When your USV is going 5 kilometer per hour,this means the maximum error with a position update of 1 Hz can be:
5 Kmh = 3.1 Mph = 1.39 meter per second divided by 1 update per second (1Hz) = 1.39 meter maxposition error
To fix this issue, set the NMEA0183 sentences containing a time stamp to a higher output rate.Hydromagic can parse time synchronization data from either GGA or ZDA sentences. When one ofthese sentences is set to an output rate of for instance 10Hz, the error is becoming acceptable:
5 Kmh = 3.1 Mph = 1.39 meter per second divided by 10 updates per second (10Hz) = 0.139 metermax position error
Starting the raw data import wizard
All file formats which Hydromagic is able to convert to raw data files, can be imported through the rawdata import wizard.To start the wizard, right-click the 'Raw Data' folder in the 'Project Explorer' and select the 'Import DataWizard...' option.

User Interface Features 109
© 2009-2021 Eye4Software B.V.
Select file format
The first page of the wizard allows you to set the format of the file(s) we wish to import.Since this tutorial is about importing NMEA0183 data, we select the 'NMEA0183 ASCII Log Files (*.*)'option from the drop-down list.

Eye4Software Hydromagic 9.4110
© 2009-2021 Eye4Software B.V.
Select file(s) to import
In the second page of the wizard you can select which files to import.Click the 'Browse...' button to select the folder on your computer where the files are stored.
After changing the folder the file list is reloaded, and you can use the check boxes to select one or morefile(s) to import.

User Interface Features 111
© 2009-2021 Eye4Software B.V.
Import options
With some file formats, including NMEA0183, some additional options have to be set in order to importand interpret the data in the file correctly.This is shown in the optional third step of the import wizard. When no options have to be set, this thirdpage is skipped.
Projection and units
You can see the projection setting has been disabled, because position data in NMEA0183 is always inWGS84 geographic coordinates.Also there is no need to set the units used in the file, because the units are mentioned in the NMEA0183sentences and conversions are performed automatically.
NMEA0183 sentence
Use this settings to select the NMEA0183 sentence used to extract depth from the log file.Possible settings are: $SDDPT, $SDDBK, $SDDBS, $SDDBT and $SDXDR.

Eye4Software Hydromagic 9.4112
© 2009-2021 Eye4Software B.V.
Sentence Description
$SDDBK Depth below keel
$SDDBS Depth below surface
$SDDBT Depth below transducer
$SDDPT Depth and keel offset
$SDXDR Extended Transducer Information (may contain dual frequency depth)
Sounder offset
Use this box to set the transducer offset to be used. This is the distance between the bottom of thetransducer to the waterline.This settings is also called the static draft. If unknown, it is possible to leave this value zero and correctit later in the "Sounding Wizard".
Sounding date
To add correct date and time information to your sounding, you can use the "Date" and "Time zone"settings.The time of the positions is stored in the NMEA0183 data as GMT time, so the correct time zone isrequired to convert the times to local time.This settings are optional, however, if the sounding is going to be used with tide files, you will need thecorrect timestamps on your data !

User Interface Features 113
© 2009-2021 Eye4Software B.V.
Starting the import
When the format, the files and the additional options has been set, you can start the import process byclicking the 'Finish' button on the last page of the wizard.
The file currently processed is displayed in the statusbar at the bottom of the screen and the wizardshows a message box stating 'File(s) successfully imported as raw data file(s)' as soon as the processhas completed. Click 'OK' to close the dialog and the imported files will be centered in the map view(only when they contain position data).

Eye4Software Hydromagic 9.4114
© 2009-2021 Eye4Software B.V.
Checking the imported raw data file(s)
When the import has completed, you can right-click the generated raw data files, and select 'AnalyzeData...' to inspect the imported values and timestamps.
3.13.2 Import SEG-Y files
The SEG-Y (sometimes SEG Y) file format is one of several standards developed by the Society ofExploration Geophysicists (SEG) for storing geophysical data.It is an open standard, and is controlled by the SEG Technical Standards Committee, a non-profitorganization.
SEG-Y files are also suitable for storing bathymetric data, and some echosounder brands, includingInnomar, Knudsen and SyQwest,are using this file format to export position, depth and echogram data.

User Interface Features 115
© 2009-2021 Eye4Software B.V.
Starting the raw data import wizard
All file formats which Hydromagic is able to convert to raw data files, can be imported through the rawdata import wizard.To start the wizard, right-click the 'Raw Data' folder in the 'Project Explorer' and select the 'Import DataWizard...' option.
Select file format
The first page of the wizard allows you to set the format of the file(s) we wish to import.Since this tutorial is about importing SEG-Y data, we select the 'SEG-Y Files (*.seg)(*.segy)(*.sgy)(*.su)'option from the drop-down list.

Eye4Software Hydromagic 9.4116
© 2009-2021 Eye4Software B.V.
Select file(s) to import
In the second page of the wizard you can select which files to import.Click the 'Browse...' button to select the folder on your computer where the files are stored.
After changing the folder the file list is reloaded, and you can use the check boxes to select one or morefile(s) to import.

User Interface Features 117
© 2009-2021 Eye4Software B.V.
Import options
When the coordinate reference system used in the SEG-Y file is not equal to WGS84 geographiccoordinates,you can change the projection to convert from by clicking the 'Select...' button.

Eye4Software Hydromagic 9.4118
© 2009-2021 Eye4Software B.V.
Starting the import
When the format, the files and the additional options has been set, you can start the import process byclicking the 'Finish' button on the last page of the wizard.
The file currently processed is displayed in the statusbar at the bottom of the screen and the wizardshows a message box stating 'File(s) successfully imported as raw data file(s)' as soon as the processhas completed. Click 'OK' to close the dialog and the imported files will be centered in the map view(only when they contain position data).

User Interface Features 119
© 2009-2021 Eye4Software B.V.
Checking the imported raw data file(s)
When the import has completed, you can right-click the generated raw data files, and select 'AnalyzeData...' to inspect the imported values and timestamps.
3.13.3 Import CEE HydroSystems project files
CEE HydroSystems projects are loaded by selecting one or more .CSC file(s). When there is binarywater column sample data available, these are stored in one or multiple CSA files (usually 1.csa). TheseCSA files reside in a folder with the same name as the CSC file, which is located in the same folder asthe project file. You can find these folders in the 'logged_data' folder of your system's SD-Card.
All data is stored along with high precision timestamps. The digitized depths, NMEA0183 positionstrings and (optional) motion sensor data are stored in the CSC file, which is human readable since anASCII format is used. Some example data can be found below:
VER 3.0.10 3.0.3 3.0.3 "CEE-MB rev 3.0" TME 19/06/2018 22:56:50 LOCAL_TIME 0min

Eye4Software Hydromagic 9.4120
© 2009-2021 Eye4Software B.V.
DEV 0 NOV628 EXTERNAL CMR+ 0.00 "GNSS Novatel628" DEV 1 0.00 0.00 1500.0 m/s MANUAL "Echosounder A (HF)" DEV 2 0.00 0.00 1500.0 m/s MANUAL "Echosounder B (LF)" DEV 7 "EVENT Button" EOH HCP 10 82606707 :053D0B 0000U 0074 0110 ECH 2 82606721 009.92 ECH 1 82606721 010.03 MSG 0 82606724$GPGGA,225646.80,3341.8629,S,15106.9026,E,4,14,0.9,160.80,M,23.10,M,00,0000*70 HCP 10 82606754 :053D0B 0000U 0076 0109 ECH 2 82606780 009.93 ECH 1 82606780 010.03 HCP 10 82606801 :053D0B 0000U 0077 0109 ECH 2 82606838 009.92 ECH 1 82606838 010.04 HCP 10 82606841 :033D58 0000U 0078 0108 HCP 10 82606895 :033D58 0000U 0079 0107 ECH 2 82606897 009.92 ECH 1 82606897 010.04 MSG 0 82606921 $GPZDA,225647.00,19,06,2018,,*63 MSG 0 82606935$GPGGA,225647.00,3341.8629,S,15106.9026,E,4,14,0.9,160.80,M,23.10,M,01,0000*78
Content of a CEE HydroSystems .CSC project file (position, heave and dual frequency depths)
Starting the raw data import wizard
All file formats which Hydromagic is able to convert to raw data files, can be imported through the rawdata import wizard.To start the wizard, right-click the 'Raw Data' folder in the 'Project Explorer' and select the 'Import DataWizard...' option.

User Interface Features 121
© 2009-2021 Eye4Software B.V.
Select file format
The first page of the wizard allows you to set the format of the file(s) we wish to import.Since this tutorial is about importing CEE HydroSystems data, we select the 'CEE HydroSystemsProject Files (*.csc)' option from the drop-down list.
Select file(s) to import
In the second page of the wizard you can select which files to import.Click the 'Browse...' button to select the folder on your computer where the files are stored.
After changing the folder the file list is reloaded, and you can use the check boxes to select one or morefile(s) to import.

Eye4Software Hydromagic 9.4122
© 2009-2021 Eye4Software B.V.
Starting the import
When the format, the files and the additional options has been set, you can start the import process byclicking the 'Finish' button on the last page of the wizard.
The file currently processed is displayed in the status bar at the bottom of the screen and the wizardshows a message box stating 'File(s) successfully imported as raw data file(s)' as soon as the processhas completed. Click 'OK' to close the dialog and the imported files will be centered in the map view(only when they contain position data).

User Interface Features 123
© 2009-2021 Eye4Software B.V.
Checking the imported raw data file(s)
When the import has completed, you can right-click the generated raw data files, and select 'AnalyzeData...' to inspect the imported values and timestamps.
When binary water column sample data has been imported from one or more CSA files, this data can beviewed by right-clicking the raw data file and selecting the 'Digitize Echogram...' option.
3.13.4 Import Kongsberg Simrad raw data files
Starting the raw data import wizard
All file formats which Hydromagic is able to convert to raw data files, can be imported through the rawdata import wizard.To start the wizard, right-click the 'Raw Data' folder in the 'Project Explorer' and select the 'Import DataWizard...' option.

Eye4Software Hydromagic 9.4124
© 2009-2021 Eye4Software B.V.
Select file format
The first page of the wizard allows you to set the format of the file(s) we wish to import.Since this tutorial is about importing NMEA0183 data, we select the 'NMEA0183 ASCII Log Files (*.*)'option from the drop-down list.

User Interface Features 125
© 2009-2021 Eye4Software B.V.
Select file(s) to import

Eye4Software Hydromagic 9.4126
© 2009-2021 Eye4Software B.V.
Starting the import

User Interface Features 127
© 2009-2021 Eye4Software B.V.
3.13.5 Import ODOM raw data files
Use the 'Odom raw data files' option to import depth and water column data recorded with an Odomechosounder through Odom eChart.
Starting the raw data import wizard
All file formats which Hydromagic is able to convert to raw data files, can be imported through the rawdata import wizard.To start the wizard, right-click the 'Raw Data' folder in the 'Project Explorer' and select the 'Import DataWizard...' option.

Eye4Software Hydromagic 9.4128
© 2009-2021 Eye4Software B.V.
Select file format
The first page of the wizard allows you to set the format of the file(s) we wish to import.Since this tutorial is about importing Odom raw data, we select the 'Odom raw data files (*.dso)' optionfrom the drop-down list.
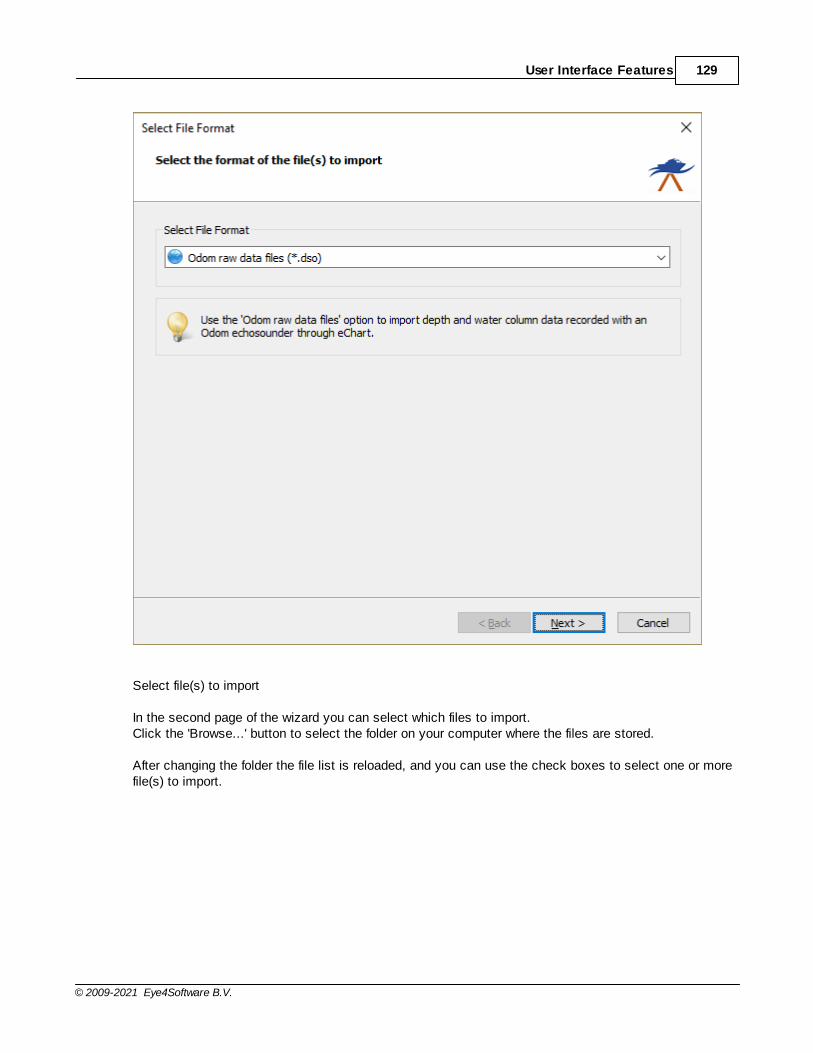
User Interface Features 129
© 2009-2021 Eye4Software B.V.
Select file(s) to import
In the second page of the wizard you can select which files to import.Click the 'Browse...' button to select the folder on your computer where the files are stored.
After changing the folder the file list is reloaded, and you can use the check boxes to select one or morefile(s) to import.

Eye4Software Hydromagic 9.4130
© 2009-2021 Eye4Software B.V.
Starting the import
When the format, the files and the additional options has been set, you can start the import process byclicking the 'Finish' button on the last page of the wizard.
The file currently processed is displayed in the statusbar at the bottom of the screen and the wizardshows a message box stating 'File(s) successfully imported as raw data file(s)' as soon as the processhas completed. Click 'OK' to close the dialog and the imported files will be centered in the map view(only when they contain position data).

User Interface Features 131
© 2009-2021 Eye4Software B.V.
Checking the imported raw data file(s)
When the import has completed, you can right-click the generated raw data files, and select 'AnalyzeData...' to inspect the imported values and timestamps.
3.13.6 Import Hydromagic raw data files
Hydromagic raw data files
The function of importing Hydromagic raw data files, is to be able to transfer Hydromagic raw data filesfrom one project to another. While transferring from one project to another, a coordinate and / or unitconversion will be performed when needed.
NAM RAW00001
CMT
VIS 0
HUN 9002
VUN 9002

Eye4Software Hydromagic 9.4132
© 2009-2021 Eye4Software B.V.
PRJ 3656
DTM 4759
ELL 0
PRM 0
DFT 0.000
ANT 0.000
VER 8.1
BLD 8.1.64.8220
DPT 00000002 00000001 1478695419.814 0.000 0.000 3.250
DPT 00000002 00000001 1478695419.865 0.000 0.000 3.217
DPT 00000002 00000001 1478695419.916 0.000 0.000 3.217
DPT 00000002 00000001 1478695419.968 0.000 0.000 3.184
TRC 00000000 00000001 1478695419.979 0.000 $GPGGA,164340.00,3208.4410895,N,08048.1634866,W,4,08,1.21,-1.9758,M,-32.0232,M,,
POS 00000007 00000001 1478695419.979 0.000 2061073.948 111897.838 -111.545 -6.482 -80.802724777 32.140684825
GPS 0000000F 00000001 1478695419.979 0.000 5 8 29 1
DOP 00000001 00000001 1478695419.979 0.000 1.21 0.00 0.00
DPT 00000002 00000001 1478695420.019 0.000 0.000 3.184
TRC 00000000 00000001 1478695420.016 0.000 $GNZDA,164340.00,09,11,2016,00,00*70
TRC 00000000 00000001 1478695420.026 0.000 $GNVTG,117.544,T,,M,0.6451,N,1.1947,K,D*18
SPD 00000000 00000001 1478695420.026 0.000 1.2
HDG 00000001 00000001 1478695420.026 0.000 117.54 0.00
DPT 00000002 00000001 1478695420.070 0.000 0.000 3.184
DPT 00000002 00000001 1478695420.122 0.000 0.000 3.184
Content of an Hydromagic raw data file
Starting the raw data import wizard
All file formats which Hydromagic is able to convert to raw data files, can be imported through the rawdata import wizard. To start the wizard, right-click the 'Raw Data' folder in the 'Project Explorer' andselect the 'Import Data Wizard...' option.
Start the import wizard from the "Project Explorer"
Select file format
The first page of the wizard allows you to set the format of the file(s) we wish to import. Since this tutorialis about importing Hydromagic data, we select the 'Hydromagic raw data file (*.*)' option from the drop-down list.

User Interface Features 133
© 2009-2021 Eye4Software B.V.
Select the 'Hydromagic raw data file' option to import Hydromagic data.
Select file(s) to import
In the second page of the wizard you can select which files to import. Click the 'Browse...' button toselect the folder on your computer where the files are stored.
After changing the folder the file list is reloaded, and you can use the check boxes to select one or morefile(s) to import.

Eye4Software Hydromagic 9.4134
© 2009-2021 Eye4Software B.V.
Use the check boxes to select the files you wish to import.
Starting the import
When the format, the files and the additional options has been set, you can start the import process byclicking the 'Finish' button on the last page of the wizard.
The file currently processed is displayed in the statusbar at the bottom of the screen and the wizardshows a message box stating 'File(s) successfully imported as raw data file(s)' as soon as the processhas completed. Click 'OK' to close the dialog and the imported files will be centered in the map view(only when they contain position data).

User Interface Features 135
© 2009-2021 Eye4Software B.V.
Click the "Finish" button to start the import process.
Checking the imported raw data file(s)
When the import has completed, you can right-click the generated raw data files, and select 'AnalyzeData...' to inspect the imported values and timestamps.
3.13.7 Import Hypack raw data files
HyPack raw data files
Raw data files in HyPack are used to store all incoming data with high precision timestamps.Hydromagic allows users to import projects previously recorded in HyPack.
FTP NEW 2
VER 11.1.6.15
INF "" "" "" "" 0.983268 0.000000 0.000000
ELL WGS-84 6378137.000 298.257223563
PRO TME -63.000000 0.999600 0.000000 0.000000 0.000000 500000.0000 0.0000
DTM 0.00 0.00 0.00 0.00000 0.00000 0.00000 0.00000
GEO ??? 0.000
HVU 1.0000000000 1.0000000000
TND 13:46:16 12/01/2010 300
DEV 0 276 "Simulation" 1 C:\HYPACK 2011\devices\testdev.dll 9.0.1.1
OFF 0 0.000000 0.000000 0.000000 0.000000 0.000000 0.000000 0.000000
LIN 2
PTS 454484.00 4945231.00

Eye4Software Hydromagic 9.4136
© 2009-2021 Eye4Software B.V.
PTS 455477.00 4942150.00
LBP 454484.00 4945231.00
LNN 1
LTP 0.00 0.00
LTP 500.00 60.00
LTP 2500.00 60.00
LTP 3000.00 0.00
EOL
EOH
TID 0 49573.654 0.776
EC1 0 49573.971 62.800
TID 0 49573.971 0.835
POS 0 49573.971 454468.123 4945274.185
TID 0 49573.971 0.835
POS 0 49574.590 454469.702 4945271.288
EC1 0 49574.590 62.900
TID 0 49574.590 0.886
EC1 0 49574.901 63.100
TID 0 49574.901 0.927
POS 0 49574.901 454472.047 4945266.988
TID 0 49574.901 0.927
POS 0 49575.525 454474.392 4945262.687
EC1 0 49575.525 63.200
TID 0 49575.525 0.960
EC1 0 49575.839 63.400
TID 0 49575.839 0.983
POS 0 49575.839 454476.784 4945258.299
TID 0 49575.839 0.983
POS 0 49576.461 454479.129 4945253.999
FIX 99 49576.534 1 454479.129 4945253.999
Example HyPack raw data file
Starting the raw data import wizard
All file formats which Hydromagic is able to convert to raw data files, can be imported through the rawdata import wizard. To start the wizard, right-click the 'Raw Data' folder in the 'Project Explorer' andselect the 'Import Data Wizard...' option.
Start the import wizard from the "Project Explorer"
Select file format
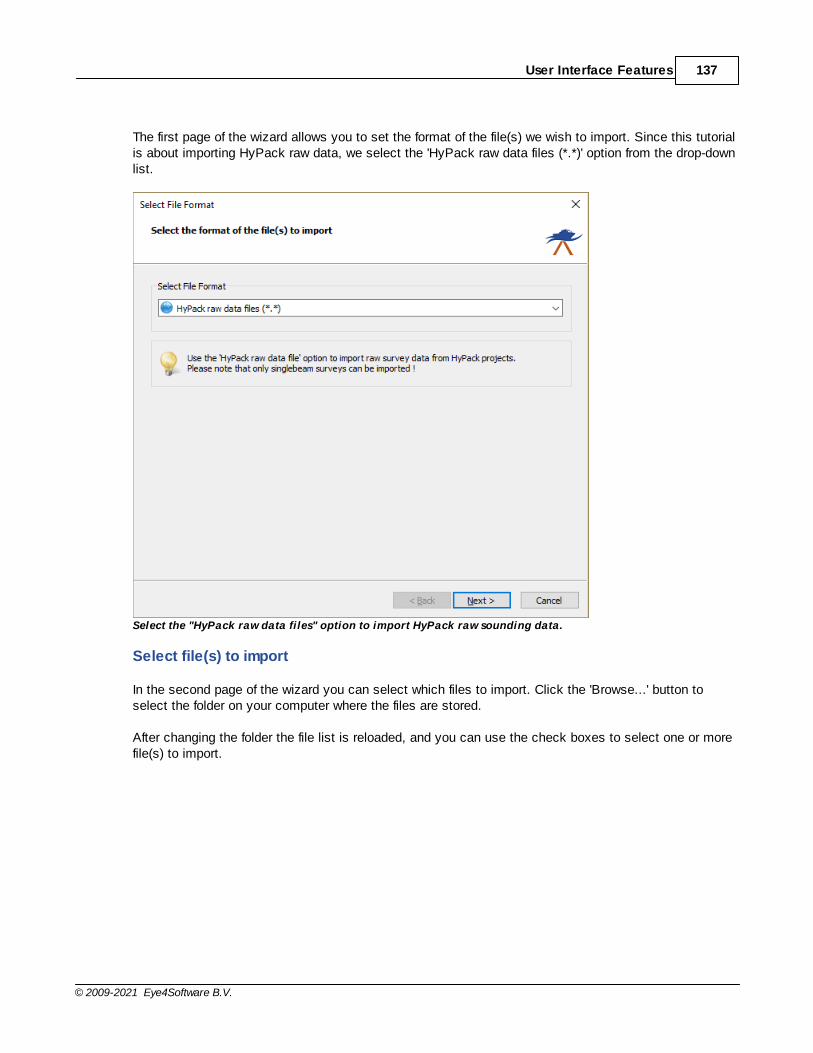
User Interface Features 137
© 2009-2021 Eye4Software B.V.
The first page of the wizard allows you to set the format of the file(s) we wish to import. Since this tutorialis about importing HyPack raw data, we select the 'HyPack raw data files (*.*)' option from the drop-downlist.
Select the "HyPack raw data files" option to import HyPack raw sounding data.
Select file(s) to import
In the second page of the wizard you can select which files to import. Click the 'Browse...' button toselect the folder on your computer where the files are stored.
After changing the folder the file list is reloaded, and you can use the check boxes to select one or morefile(s) to import.
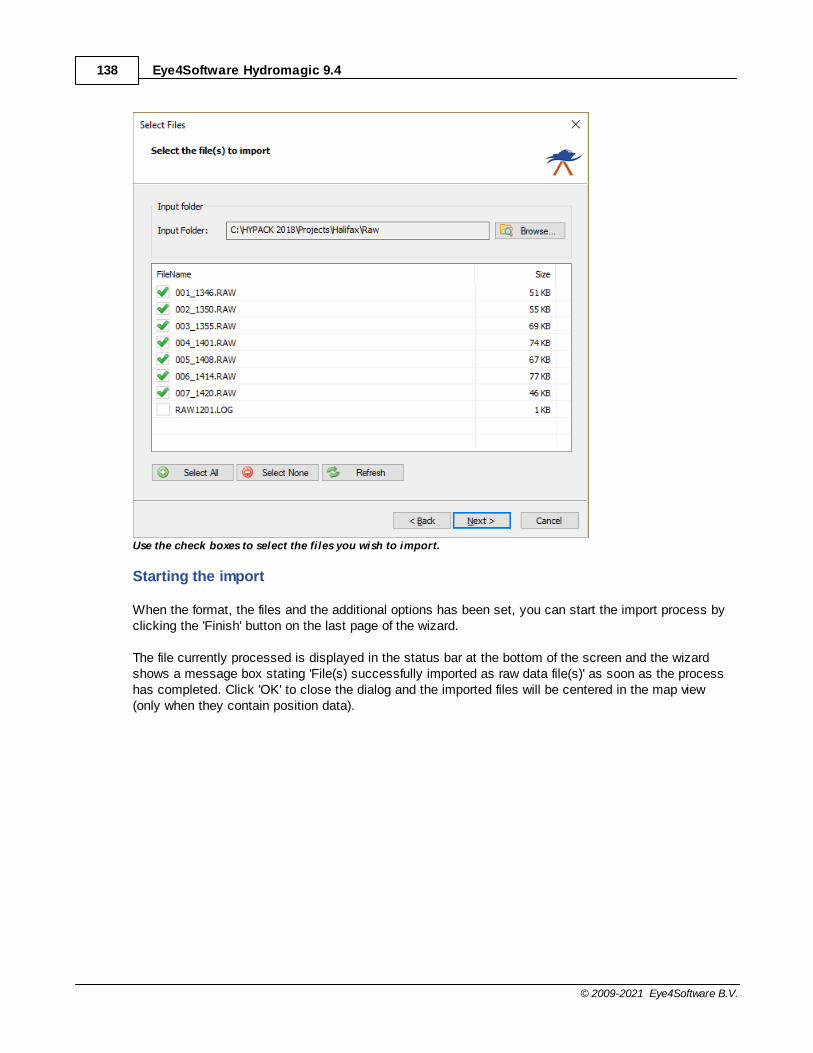
Eye4Software Hydromagic 9.4138
© 2009-2021 Eye4Software B.V.
Use the check boxes to select the files you wish to import.
Starting the import
When the format, the files and the additional options has been set, you can start the import process byclicking the 'Finish' button on the last page of the wizard.
The file currently processed is displayed in the status bar at the bottom of the screen and the wizardshows a message box stating 'File(s) successfully imported as raw data file(s)' as soon as the processhas completed. Click 'OK' to close the dialog and the imported files will be centered in the map view(only when they contain position data).

User Interface Features 139
© 2009-2021 Eye4Software B.V.
Click the "Finish" button to start the import process.
Checking the imported raw data file(s)
When the import has completed, you can right-click the generated raw data files, and select 'AnalyzeData...' to inspect the imported values and timestamps.

Eye4Software Hydromagic 9.4140
© 2009-2021 Eye4Software B.V.
4 Map display / Background maps
4.1 Map display customization
In Hydromagic, most of the screen space is taken up by the map display. This display shows, amongother things, the background map, the hydrographic data collected and the location of your vessel. Extrainformation can also be added such as waypoints, comments, boundaries and planned lines. In thisdocument we will go into more detail about how this display can be further adapted to our wishes.
The map display in Hydromagic showing the vessel position with distance rings and course line.
Select which items are shown
To select the items shown, open the global preferences dialog by selecting the "Preferences..." optionfrom the "Tools" menu. In the dialog that appears, open the map display options by clicking the "Map"tab.

Map display / Background maps 141
© 2009-2021 Eye4Software B.V.
Customize the map display using the "M ap" tab in the preferences dialog.
Distance Rings
With the "Ring Count" option set to any value higher then zero, a set of rings will be drawn around theship at fixed intervals. Use this function, for example, to see at a glance how far away the objects arefrom the boat. Another useful option is to set the interval to the distance between survey lines to getsome sort of guidance. In addition to setting the distance between the rings and the number of rings, it isalso possible to choose a drawing color for the rings, which is clearly visible against the background.

Eye4Software Hydromagic 9.4142
© 2009-2021 Eye4Software B.V.
Distance rings around your GNSS position at a specified interval.
Course Line
The course line can be used to see where the vessel is going. Please note that the course line isindicating the correct heading only when the NMEA0183 output of your GPS or RTK receiver outputs thisinformation and the vessel is moving. Alternatively, a compass or RTK heading sensor can be used todetermine the correct course.
To display the course line, simply enable the "Show course line" option. In addition, you can set the linecolor and width to improve visibility.
Show map scale
By checking the "Show map scale" check box, the scale indicator can be included at the bottom left ofthe screen. This scale indicator gives an idea of ??the zoom factor that is currently being used. This settingalso applies when printing the map display content. The distance shown in the scale indicator is in thehorizontal units associated with the selected map coordinate system.
The map scale will be drawn in the lower-left corner of the display.
Show north indicator
The "north indicator" shows the true north of the map display. By default, the map view is always to thenorth (rotated zero degrees), but changes when you rotate the map view using one of the tool bar buttonsbelow. To include this indicator in the map view, check the "Show north indicator" check box. Thissetting also applies when printing the map display content.

Map display / Background maps 143
© 2009-2021 Eye4Software B.V.
The map rotation buttons in the tool bar.
Show low frequency depths
In Hydromagic software versions earlier than 9.0, only the high frequency depth of the raw data orprocessed sounding was shown on the map. Now it is possible to display the low frequency measureddepths instead (when a dual frequency echo sounder is used). Please note that this setting does notaffect generated matrices as they are generated statically with only one frequency.
It is important to ensure that you disable this feature when loading a project that has been recorded witha single frequency echo sounder, as otherwise no depths will be visible
Map background color
With the background color setting, the color that can be seen behind objects, such as waypoints,depths, maps and other map attributes, can be chosen. However, this color cannot be seen behindraster maps that consist of image files such as maps downloaded with the map download tool.
However, when a vector map is used, such as an AutoCAD DXF file, it may sometimes be necessary tochoose a different background color to make the map more clearly visible. To adjust the color, click onthe downward pointing arrow next to the colored area.
M ap display background color set to yellow.

Eye4Software Hydromagic 9.4144
© 2009-2021 Eye4Software B.V.
Vessel shape color and offsets
When the GPS antenna and the echo sounder transducer are not directly above each other, it is veryimportant to indicate the locations of these sensors relative to the boat. This can be done with the help ofthe "vessel designer" tool, which is described in more detail on the "Vessel shape and offsets" page.
When this does not apply to your vessel, and you are happy with the default vessel shape, you canalways change the vessel shape color by clicking on the downward pointing arrow next to the coloredarea
Customizing the way raw data files, soundings and matrices are displayed
Since it is possible in Hydromagic to set the presentation of raw data files, soundings and matricesseparately, these settings cannot be found under the general map display settings. To set how these aredisplayed, right-click on the relevant folder and select the "Display Settings ..." option.
4.2 Loading Maps
Loading Maps
When starting a new project, it is recommended to load a map of the survey area. The map can then beused as guidance to setup your boundaries, cross sections and routes. Hydromagic supports a widerange of both vector and raster map formats, including:
§ S-57 Electronic Nautical Charts;§ S-63 Electronic Nautical Charts;§ ESRI Shape Files;§ ARC/INFO Export Files;§ ARC/INFO Generate Files;§ ARC/INFO binary coverage files;§ ARC/INFO ASCII grid files;§ Atlas BNA boundary files;§ BSB nautical maps (version 3);§ GeoTIFF files;§ AutoCad DXF files;§ Microstation DGN files;§ PNG,GIF,JPEG and BMP image files;§ USGS Digital Line Graph files;§ OpenStreetMap XML files;§ IDRISI vector files.
Downloading Maps
In case no map data is available for the area to be surveyed, you can download maps from web sourcesautomatically by entering the map's boundaries. How to do this is discussed in more detail in the chapter"Downloading Maps".
Creating a new project
Before you will be able to add background maps, you should have loaded an existing project, or you haveto create a new project. To do so, select the "New Project..." option from the file menu, fill out therequired fields and click "OK".

Map display / Background maps 145
© 2009-2021 Eye4Software B.V.
It is important to provide the correct projection for your new project, because you will not be able tochange this at a later time.
You have to create or open a project before you can import maps.
Importing maps
Maps are imported into the project, this means that the next time you open the project, the map will beloaded automatically. To import a map to the project, right click the "Maps" folder in the "ProjectExplorer" and select the "Import Map..." option. When the "Project Explorer" has been closed, you canalso import a map using the menu bar by selecting the "Import Map..." from the "File" => "Import" menu.You can also click the "Import Map" button in the tool bar.
Right click the "M aps" folder in the "Project Explorer"to add a new map to the project.
Selecting Files

Eye4Software Hydromagic 9.4146
© 2009-2021 Eye4Software B.V.
A file open dialog will be presented. By default all supported map formats are displayed. You can selectone or more maps and click "OK" to load them into the project. When you have selected a file which isnot already present in the "Maps" folder of your Hydromagic project on the disk, it will ask you whetheryou want it copied to the "Maps" folder. It is recommended to do this, otherwise you will loose thebackground maps when transferring the Hydromagic project to another computer.
Select the file format and file name(s) for the files you to import into the loaded Hydromagic project.
Loading the selected map(s)
After selecting one or more map files in the file selection dialog, click the "OK" button to load and addthe files to the project. When no file type has been set in the file open dialog, and the software doesn'tknow which format the map is, it will ask you as shown below. In this case select the correct file formatfor the selected files and click "OK".

Map display / Background maps 147
© 2009-2021 Eye4Software B.V.
When the file format isn't set and the file extension unknown,Hydromagic may ask you for the file format.
4.3 Loading IHO S-57 ENC's
Loading IHO S-57 ENC's
S-57 is a standard for electronic navigational charts defined by the IHO (International HydrographicOrganization). S-57 is used for most official hydrographic charts around. Hydromagic supports bothunencrypted and encrypted (S-63) charts. It is a vector format which contains features (lines, areas andpoints) and attributes like depth, symbol, lights etc.
Obtaining S-57 maps
S-57 charts are available online (for free) for the following countries:
§ United States (Inland and coastal waters);§ Austria (Inland);§ Belgium (Inland);§ Bulgaria (Inland);§ Croatia (Inland);§ Czech Republic (Inland);§ Germany (Inland);§ Hungary (Inland);§ Netherlands (Inland);§ Romania (Inland);§ Serbia (Inland);§ Slovakia (Inland);§ Swiss (Inland).
A more detailed list of sources for S-57 data can be found on our website:https://www.eye4software.com/hydromagic/documentation/download-s-57-encs/. For other countries,

Eye4Software Hydromagic 9.4148
© 2009-2021 Eye4Software B.V.
data can only be purchased in S-63 format. S-63 is the encrypted version of S-57 charts, also calledSENC's (System Electronic Navigational Charts). For more information on S-63, please refer to the nextchapter.
ENC Downloader
When you need navigational charts for the United States, you can also use the built in ENC downloaderfunction (from Hydromagic version 9.0). This map downloader can be launched by selecting the"Download ENC..." function from the "File" menu, or by clicking the "Download ENC" button in the toolbar.
For the United States, you can use the built in ENC download tool as well
Loading S-57 maps
IHO S-57 charts can be loaded into Hydromagic by right clicking the "Maps" folder in the "ProjectExplorer","and selecting the "Import Map..." option as shown in the screen shot below. The file extensionfor both S-57 and S-63 charts is ".000". The software will auto-detect whether the selected chart isencrypted (S-63) or not.

Map display / Background maps 149
© 2009-2021 Eye4Software B.V.
Right click the "M aps" folder in the "Project Explorer"to add a new ENC to the project.
4.4 Loading IHO S-63 ENC's
Introduction
IHO S-63 is a standard for encrypting, securing and compressing electronic nautical charts, also knownas ENC's. The standard is using CRC32, SHA1, DSA and Blowfish algorithms to ensure protecteddelivery of nautical charts. Most commercial ENC's on the market today are protected using the S-63standard.
Each software installation contains an unique hardware id which is encrypted and cannot be read by theuser. Charts purchased for this software will work on this installation of the software only. The hardwareid is encrypted using the OEM and manufacturer id forming the 'Userpermit' which is used to purchaseENC's.
Purchasing ENC's
S-63 ENC's can be purchased through your local marine supplies dealer, or online reseller. In order topurchase ENC's you need the 'Userpermit', and register it with the online chart store or your localreseller. Because the hardware id is encrypted in the Hydromagic registration code or hardlock, it is onlypossible to use S-63 ENC's in registered versions of the software. It is not possible to load these chartswhen using a trial version.
Obtaining the userpermit
To obtain the userpermit for your software installation, select the "S63 ENC Permits..." option from the"File" menu, as shown in the screenshot below:
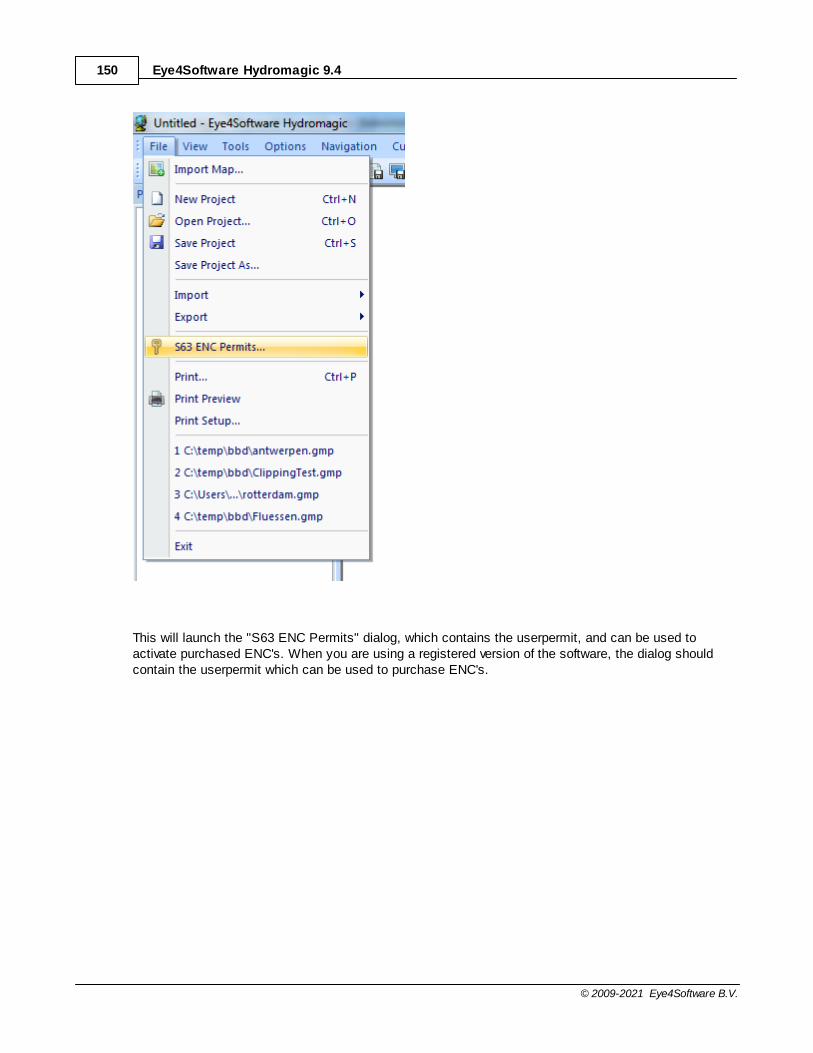
Eye4Software Hydromagic 9.4150
© 2009-2021 Eye4Software B.V.
This will launch the "S63 ENC Permits" dialog, which contains the userpermit, and can be used toactivate purchased ENC's. When you are using a registered version of the software, the dialog shouldcontain the userpermit which can be used to purchase ENC's.

Map display / Background maps 151
© 2009-2021 Eye4Software B.V.
Activation of purchased ENC's
When purchasing ENC's you will receive a "PERMIT.TXT" file from your reseller containing the 'Permits'for the purchased ENC's. After importing this file, you will be able to load these. To do so, relaunch thepermits dialog by selecting "S63 ENC Permits..." from the "File" menu.
You can now load the "PERMIT.TXT" file, by clicking the "Load Permits..." button, and selecting thereceived permit file. You only have to do this once, imported permits will be stored until the software isreinstalled.
When the file has been imported successfully, you will see something like this:

Eye4Software Hydromagic 9.4152
© 2009-2021 Eye4Software B.V.
In most cases the reseller can supply you with a "ENC Base CD" containing all the charts for yourregion. If not, you can download the charts, depending on your reseller, from Primar or IC-ENC.
When the ENC's and permits are correctly installed, just select "Import Map..." from the "File" menu,and select the ENC you want to load. When trying to load an enc that has not been purchased, you willreceive error SSE 11 as shown in the table below.
When an error occurs during the import of permits, or when loading an ENC, you will receive one of theerrors described in section 4.4.5. In case of an error, contact your ENC reseller.
Error Code Meaning
SSE01 Self Signed Key is invalid.
SSE02 Format of Self Signed Key file is incorrect.
SSE03 SA Signed Data Server Certificate is invalid.
SSE04 Format of SA Signed DS Certificate is incorrect.

Map display / Background maps 153
© 2009-2021 Eye4Software B.V.
Error Code Meaning
SSE05 SA Digital Certificate (X509) file is not available. A valid certificate can be obtained fromthe IHO website or your data supplier.
SSE06 The SA Signed Data Server Certificate is invalid. The SA may have issued a new publickey or the ENC may originate from another service. A new SA public key can be obtainedfrom the IHO website or from your data supplier.
SSE07 SA signed DS Certificate file is not available. A valid certificate can be obtained from theIHO website or your data supplier.
SSE08 SA Digital Certificate (X509) file incorrect format. A valid certificate can be obtained fromthe IHO website or your data supplier.
SSE09 ENC Signature is invalid.
SSE10 Permits not available for this Data Server. Contact your data supplier to obtain the correctpermits.
SSE11 Cell Permit not found. Load the permit file provided by the data supplier.
SSE12 Cell Permit format is incorrect. Contact your data supplier and obtain a new permit file.
SSE13 Cell Permit is invalid (checksum is incorrect) or the Cell Permit is for a different system.Contact your data supplier and obtain a new or valid permit file.
SSE14 Incorrect system date, check that the computer clock (if accessible) is set correctly orcontact your system supplier.
SSE15 Subscription service has expired. Please contact your data supplier to renew thesubscription license.
SSE16 ENC CRC value is incorrect. Contact your data supplier as ENC(s) may be corrupted ormissing data.
SSE17 Userpermit is invalid (checksum is incorrect). Check that the correct hardware device(dongle) is connected or contact your system supplier to obtain a valid userpermit.
SSE18 HW_ID is incorrect format.
SSE19 Permits are not valid for this system. Contact your data supplier to obtain the correctpermits.
SSE20 Subscription service will expire in less than 30 days. Please contact your data supplier torenew the subscription license.
SSE21 Decryption failed no valid cell permit found. Permits may be for another system or newpermits may be required, please contact your supplier to obtain a new license.
SSE22 SA Digital Certificate (X509) has expired. A new SA public key can be obtained from theIHO website or from your data supplier.
SSE23 Non sequential update, previous update(s) missing try reloading from the base media. Ifthe problem persists contact your data supplier.
SSE24 ENC Signature format incorrect, contact your data supplier.
SSE25 The permit has expired. This cell may be out of date and MUST NOT be used for PrimaryNAVIGATION.
SSE26 This ENC is not authenticated by the IHO acting as the Scheme Administrator.

Eye4Software Hydromagic 9.4154
© 2009-2021 Eye4Software B.V.
Error Code Meaning
SSE27 ENC is not up to date. A New Edition, Re-issue or Update for this cell is missing andtherefore MUST NOT be used for Primary NAVIGATION.
4.5 Supported Raster Formats
Raster maps
The software is shipped only with a couple of demo maps, because it is not doable to bundle it with allthe most recent and detailed maps all over the world. To make sure almost any map can be loaded, awide range of file formats is supported. This makes that Hydromagic can be used with the most commonused map formats. Two types of maps are supported: vector maps and raster maps. The list below showsome information on some of the raster map formats supported.
Supported Raster Maps
Raster maps are basically bitmap images. They only contain some image data, and in some cases(GeoTIFF) some geo-referencing information. These maps do not support high zoom levels, because theyare limited by the number of pixels the map is stored in. The following raster formats are supported:
§ Arc/Info ASCII Grid files;§ BSB nautical map files;§ GeoTIFF / TIFF files;§ Graphical Interchange Format (GIF) files;§ JPEG Image files;§ Microsoft Windows Bitmap (BMP) files;§ Portable Network Graphics (PNG) files;§ XYZ gridded elevation data (ASCII or binary);
You can import a vector map into your project by right clicking the "Maps" folder in the "Project Explorer"and selecting the "Import Map..." option from the context menu as shown in the screenshot below:
Right-click the "M aps" folder in "Project Explorer"to import a raster map.

Map display / Background maps 155
© 2009-2021 Eye4Software B.V.
GeoTIFF
GeoTIFF files are based on the TIFF (Tagged Image File Format) standard. This formatallows you to insert all sorts of tags into an image file. GeoTIFF uses this to storeinformation on calibration info and / or projection information in the file. When you tryto load a map that only contains the calibration info (X,Y boundaries and scaleinformation), you will be asked to set the projection parameters for the map.
JPG, GIF, TIF, BMP and PNG image files
It is possible to use your own images to project routes, waypoints, tracks and realtime position on. These images can be downloaded from the web (for instance, imagecreated with Google Earth or maps exported from "OpenStreetMaps.org", or createdby scanning paper maps. To use these images, they must have been geo-referencedcalibrated in order to be used. A map is geo-referenced when it is shipped withprojection and world files. When downloading an street map or satellite image from thebuilt-in map downloading tool, these files will be generated by the software.
BSB Nautical Charts
BSB map files are raster charts designed especially for nautical charts. They are usedby several authorities like NOAA. Nautical maps can often be downloaded for free inthe BSB format. When loading BSB files in Hydromagic, the map is displayeddirectly, because all geo-referencing and coordinate reference system info is includedin the map. BSB maps use Lambert Conformal Conic, Mercator and Polyconicprojection.
4.6 Supported Vector Formats
Supported Vector Maps
Vector maps are files that contain objects instead of image data. A typical example of an object can bea line, point, polyline, polygon and more. Sometimes these objects are also associated with someuserdata or a row in a datatable. Because the vector objects drawn at runtime, there is no limitation onthe zoomlevel like rastermaps.
You can load a rastermap into your project by selecting "File" => "Import" => "Import Map..." from themenu.
AutoCad DXF files
DXF stands for Drawing eXchange Format, and was developed by AutoDesk and isused in AutoCad software products. It is a vector format, this means the file containsobjects rather then just image information ( pixels ). AutoCad DXF files are notdesigned to store georeferencing information, so after loading a DXF map, you will beasked to set the projection parameters.
Microstation DGN files

Eye4Software Hydromagic 9.4156
© 2009-2021 Eye4Software B.V.
DGN is a vector format used in Microstation CAD software. The software currentlyonly supports the ISFF (Integraph Standard File Formats) DGN format. The newer V8DGN format is not supported yet. In ISFF format, all objects are stored as blocks intoa single file. Each Microstation design file starts with a TCB element, containingglobal information on the file, like scale, units and extends.
ESRI shape files
ESRI shapefiles are vector maps often used to exchange data between GIS and CADapplications. Like DXF files, it contains objects rather then image information. AnESRI shapefiles consists out of 3 parts, a .shp, .dbf and .idx file. The databse andindex files are ignored by GPS Mapping Studio, it only uses the .shp file whichcontains the map objects. The .dbf database file is only used by GIS applications.Map calibration info is extracted from the shp file. When loading an ESRI shapefile,you have to set the projection parameters by hand.
4.7 Downloading Maps
Downloading background maps
In circumstances where an Electronic Nautical Chart or CAD drawing of your survey area is not available,you can use the built-in background map download feature in Hydromagic. It allows you to use streetmaps or satellite imagery from Google, Bing or OpenStreetMaps as background (raster)image for yourproject.
The map tiles are downloaded from the provider of YOUR choice (Internet connection required, so it isrecommended to prepare this in advance when you are in the office), and combined to form a map(raster)image, and geo-referenced to the projection you use in your project. Therefore you must selectthe map projection you are going to use before downloading any maps (during the creation of theHydromagic project).
Please note that storing map tiles locally breaks the terms of service for a coupleof popular data providers like Google, Bing, and ArcGIS Online. Use this functionat your own risk !
Map downloading tool
To start the map downloading tool, right click the "Maps" folder in the "Project Explorer", and select the"Download Map..." option from the pop up menu, as shown in the image below. Alternatively, you canselect the "Download Map..." option from the "File" menu.

Map display / Background maps 157
© 2009-2021 Eye4Software B.V.
The map downloading tool can be started from the Project Explorer.
The background map download tool allows you to download street maps or satellite imagery from thefollowing providers:
§ OpenStreetMaps;§ Google;§ Bing (Virtual Earth);§ Nokia OVI maps;§ MapQuest maps;§ ArcGIS map service.
Setting area and options
In order to download maps, you have to select the area you need a map for, and which provider you wantto use. Use the "Information Source" selection box to select the provider and the type of map (street,satellite or hybrid).
The next step is to select the area. Select the smallest area as possible, because the smaller the area,the higher the zoom level and level of detail. You have to enter the upper-left and lower-right WGS84coordinates of the area you are surveying in.
Because the maps are downloaded as 256 x 256 pixel image tiles, it is likely that the actual downloadedarea is a bit larger then the requested area. You can obtain the coordinates by using a map viewer likeGoogle Earth or others, or use the "Area selection tool" which is discussed in the next paragraph.
Finally, select the name of the output file (the file where the map is stored) and whether to add the mapto the project directly. Depending on the type of map you are using, the image is stored as PNG(Portable Network Graphics) or JPG (JPEG-Compressed) file.

Eye4Software Hydromagic 9.4158
© 2009-2021 Eye4Software B.V.
The build-in background map downloading tool allows you to downloadand import a map for almost any location on the globe. .
Area selection tools
As an alternative to manually entering the coordinates, you can calculate the map boundaries from awaypoint, raw data file, sounding, boundary, current location or an address. To do so click the"Calculate..." button. The following dialog will appear:
The map downloading tool offers multiple options to determine the map area.
The first three options (GPS Position, Address and Waypoint) can be used to specify the center of themap. To calculate the map extends, you have to enter the map dimensions. When using one of the lastthree options (raw data file, sounding or boundary), the map dimension entries are disabled, and theboundaries are copied directly from the area covered by the selected file, sounding or boundary.

Map display / Background maps 159
© 2009-2021 Eye4Software B.V.
Please not that when using the "Find Address..." tool, make sure you are connected to the Internet inorder to perform a Geo-Coding lookup. When facing problems with the address lookup tool, click the"Show Log..." button to get more detailed information on the problem.
You can use a street address as center of the map download area.
Download
To start downloading, just click the "OK" button. Please note that you have to be connected to theInternet at this moment. The download progress is shown in the status bar. The download time varies perprovider, but should be between the 15 seconds and 2 minutes. Please be patient when the tool doesn'tseem to be responding, this can happen when data is coming in slowly.
First, the tiles are downloaded and merged into a larger images, which is geo-referenced using theprojection set. When downloading has been completed, and the "Add downloaded map to the currentproject when completed" option has been checked, the map will be added to the current Hydromagicproject and displayed.

Eye4Software Hydromagic 9.4160
© 2009-2021 Eye4Software B.V.
Example of downloaded satellite imagery loaded as background image.
Troubleshooting
When a map download fails, make sure that your Internet connection is working. If this is the case, trywhether you are able to download a map from a different data source. You click the "Download" tab ofthe Activity View to get more information on the issue:
Download progress and issues will be displayed in the activity view.
4.8 Downloading Electronic Navigational Charts
Downloading Electronic Navigational Charts (S-57)

Map display / Background maps 161
© 2009-2021 Eye4Software B.V.
Since version 9.0 of Hydromagic, a buit-in map downloader was added that enables you to downloadElectronic Navigational Charts (ENCs) in S-57 format directly from the internet. Make sure you downloadthis at the office since an internet connection is required or otherwise data costs can be charged.
At the moment only maps for the United States are available. In the future also other countries will beadded. All NOAA coastal (ENC) and USACE inland charts (IENC) can be downloaded using this feature.
Example of an IHO S-57 cell downloaded and imported in Hydromagic
Download ENC tool
To start the map downloading tool, right click the "Maps" folder in the "Project Explorer", and select the"Download ENC..." option from the popup menu as shown in the image below.

Eye4Software Hydromagic 9.4162
© 2009-2021 Eye4Software B.V.
Select "Download ENC..." from the "M aps" popup menu.
Selecting charts
In the dialog that appears, you can select the charts to download by checking the box in front of thechart number. You can use the search field to search by chart name, area or number. The list will befiltered while you type.
Select the charts from the IHO chart catalogue by checking the items you want to download.

Map display / Background maps 163
© 2009-2021 Eye4Software B.V.
Download charts
After selecting the charts to be included into the project, click "Download Cells..." to download the S-57cells. While the software is downloading and installing the maps, the current progress will be shown.
During the download, a window shows the progress of the downloading and installing process.
When the chart(s) has been downloaded and installed, click the "Close" button to close the progresswindow. The selected chart(s) will be automatically loaded now.
4.9 Managing Maps
Map Management Module
In Hydromagic, the map management module is a tool that allows you to quickly find the correct map forthe area you are working in. When downloading or importing maps, information about these maps, likeprojection and geo-referencing is automatically added to a database. When you need one of the maps inthis 'cache' later, you can add it to your new project by double-clicking.
When starting a project, you can refer to the map management module to open a map that is suitable forthe new project, which means that it should match the coordinate reference system which is used inyour new project.
Launching map management
The map management window can be opened by selecting "Map Management..." from the "Options"item in the main window menu. Depending on whether you already loaded or created projects, the list ofmaps will be empty or contain a couple of items.

Eye4Software Hydromagic 9.4164
© 2009-2021 Eye4Software B.V.
The map management window contains a collection of maps used earlier.
Adding maps manually
When maps are imported or downloaded, their information is automatically stored in the mapmanagement database. It is however possible to add a single or a collection of maps by hand.
To do so, click the "Add..." button and a file open dialog will appear. In this dialog, you can select one ormultiple map files to index and store into the database.
The following map formats can be indexed:
§ S-57 Electronic Nautical Charts;§ S-63 Electronic Nautical Charts;§ ESRI Shape Files;§ BSB nautical maps (version 3);§ GeoTIFF files;§ AutoCad DXF files;§ PNG,GIF,JPEG and BMP image files;§ Google Earth KML files;
After importing a collection of maps, the list may look like this:

Map display / Background maps 165
© 2009-2021 Eye4Software B.V.
The map management window contains a collection of imported maps.
Adding a map to your project
To add a recently loaded map to your project, just right click on the 'Maps' folder in the 'Project Explorer'and select the 'Choose...' map option. When the map management window shows up, just double clickthe map you want to include into your project.
Select a map from the map management window byselecting the "Choose..." option from the context menu.
Finding a map
When a valid GNSS position is available, and your vessel is displayed on the map view, you can try toload a map from the map management database automatically. When a map is available for the area youare in, it will be automatically added to the project and loaded. To search for a map, right cick in the mapview window and select the "Find Map" option from the context menu:

Eye4Software Hydromagic 9.4166
© 2009-2021 Eye4Software B.V.
Try finding a suitable map in the map management database.
4.10 Layer properties and display options
Layer properties and display options
In Hydromagic, each map or matrix has its own layer which contains the map itself, but also informationon the type of map, the boundaries, dimension, scale and other meta-data. The layer properties dialogallows you to view this information and to adjust display options for raster maps, like opacity andbrightness.
You can access this dialog by right-clicking on the map or matrix in the project explorer, and selectingthe "Map Properties" options from the context menu:
Select the "M ap Properties..." option from the context menu.

Map display / Background maps 167
© 2009-2021 Eye4Software B.V.
Layer Meta-Data
The first part of the dialog shows you some information on the layer, such as image size, scale, mapboundaries, file name and layer type:
The layer properties window shows map information and meta-data.
Layer Display Options
The layer display options allow you to adjust the display settings for raster and matrix map images. Thissetting will be disabled when you use this dialog on vector maps. Please be careful when using thebrightness option on matrix map images since it will distort colors, so the depth colors displayed will notmatch the color legend anymore.
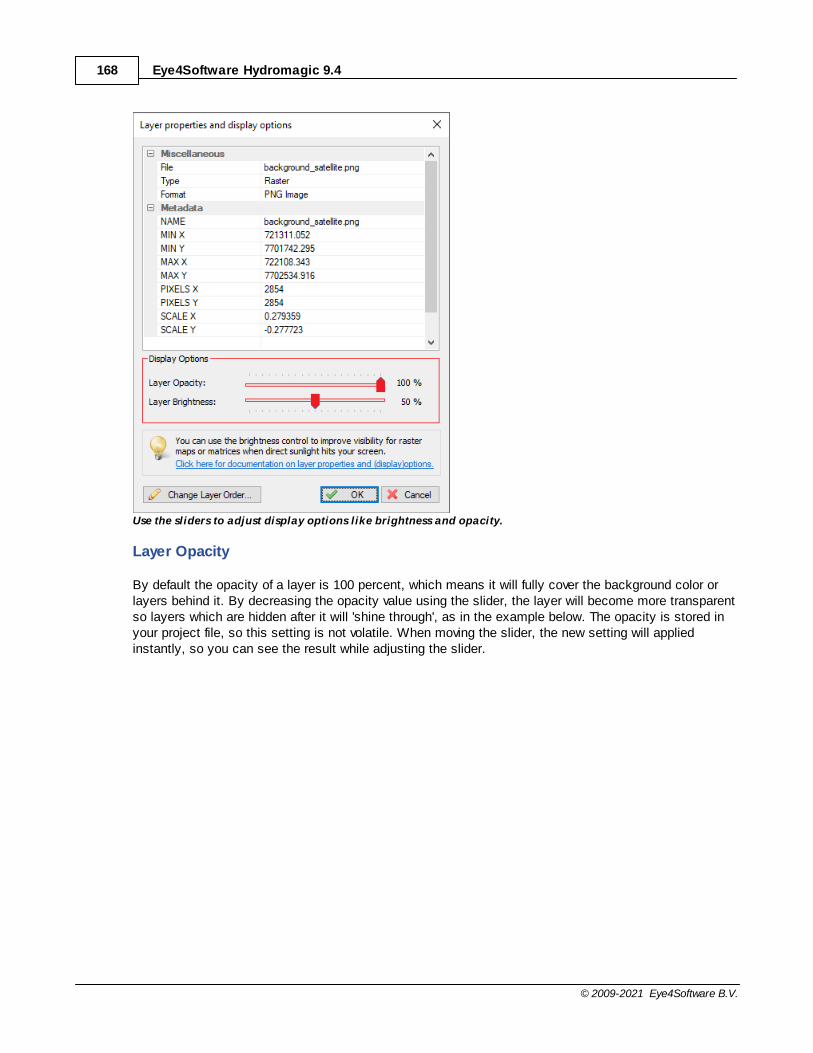
Eye4Software Hydromagic 9.4168
© 2009-2021 Eye4Software B.V.
Use the sliders to adjust display options like brightness and opacity.
Layer Opacity
By default the opacity of a layer is 100 percent, which means it will fully cover the background color orlayers behind it. By decreasing the opacity value using the slider, the layer will become more transparentso layers which are hidden after it will 'shine through', as in the example below. The opacity is stored inyour project file, so this setting is not volatile. When moving the slider, the new setting will appliedinstantly, so you can see the result while adjusting the slider.

Map display / Background maps 169
© 2009-2021 Eye4Software B.V.
Partially transparent satellite image over a street map Partiallytransparent satellite image over a matrix
Layer Brightness
The layer brightness option can be used to adjust the brightness for your background maps. This optionis provided mainly to improve the visibility of satellite images when you are using your laptop outside onthe boat when it is sunny weather. When you are using street maps, you can decrease brightness tohave a better view on overlays such as map boundaries and the active route. You can adjust brightnessvalue by using the brightness slider. When moving the slider, the new setting will applied instantly, soyou can see the result while adjusting the slider. The brightness setting will be stored in your project file.The default value for brightness is 50 percent.

Eye4Software Hydromagic 9.4170
© 2009-2021 Eye4Software B.V.
Satellite image with default brightness. Satelliteimage with increased brightness.

Map display / Background maps 171
© 2009-2021 Eye4Software B.V.
Street map image with default brightness. Street mapimage with decreased brightness.
Layer Order
In addition to setting the layer opacity to show multiple layers at once, you can adjust the layer drawingorder by clicking the "Change Layer Order..." button". By default the map that was imported, downloadedor generated the last will be displayed on top of other maps. You can change this order using this tool.

Eye4Software Hydromagic 9.4172
© 2009-2021 Eye4Software B.V.
To change the layer drawing order, click the "Change Layer Order..." button.
4.11 Changing drawing order
Changing map drawing order
In Hydromagic, the map or matrix which has been loaded or generated last, will be drawn on top of othermaps (layers). In cases where a map (partially) covers another map, you can control the order in whichthe maps are drawn to uncover the map. When using multiple maps, always draw vector maps on top ofraster maps (unless the raster maps have transparency). You can also use this option to place vectormaps on top of a matrix created by Hydromagic.
Map drawing order tool
To change the map order, select "Drawing Order..." from the "View" menu. Depending on your tool barconfiguration, you might also have the "Drawing Order" button which can be used as a shortcut for themenu item.

Map display / Background maps 173
© 2009-2021 Eye4Software B.V.
To change the map drawing order, select "Drawing Order..." from the "View" menu.
Select the map you want to move to the front or back and then click the "Move To Front" or "Move ToBack" buttons to change the drawing order. Changes will be applied to the map display directly. Toaccept the new drawing order, click "OK" to close the tool. To adjust the brightness or transparency ofthe selected map, click the "Layer Properties..." button to open layer properties and display options
Use the map drawing order tool to adjust the order in which maps are drawn.
The "check" icon in front of the layer names shows whether a map has been set to invisible in the"Project Explorer". The map drawing order, transparency, brightness and visibility settings are all storedin your project file.

Eye4Software Hydromagic 9.4174
© 2009-2021 Eye4Software B.V.
4.12 Placing waypoints
Placing waypoints
A waypoint can be defined as a marked position on a map, somewhere on the earth, with knowncoordinates. A waypoint can be part of a route. In GPS receivers, a waypoint is a point that can beselected as a coordinate to navigate to, or it can be used to just display a symbol on a map.
In Hydromagic, you can add a waypoint to the map to mark a position with a symbol and small text. Forlarger descriptions, you can place a comment. A waypoint can also be included in routes which can becreated using the built-in route planner.
Example of a waypoint placed on the background map.
Creating a waypoint
In Hydromagic, there are multiple ways to create a waypoint. You can create one manually from the"Waypoint Manager", using the "Project Waypoint" tool, or by right-clicking on the map. The easiest wayis by clicking on the map so the waypoint is placed directly at the position pointed by the mouse cursor.
Zoom and pan over the background map until you find the position where you want to place the waypoint.Place the mouse cursor at this position, and click the right mouse button. From the context menu whichappears, select the "Add Waypoint..." function to create and edit the new waypoint.
Select the "Add Waypoint..." option from the context menu.

Map display / Background maps 175
© 2009-2021 Eye4Software B.V.
In this window, you can set some additional information about the waypoint, like the name the symbol tobe drawn on the map. It is also possible to customize the way the text label is presented (backgroundcolor, text color and transparency). The "Attach Photo" section can be used to link a filename of a phototo the waypoint.
The positions are already set when you create the waypoint from the map. If you are creating thewaypoint from the "Waypoint Manager", the current GNSS position is used. You can toggle thecoordinate fields to display either the WGS84 or projected positions, by checking the "Show position inNorthing / Easting coordinates" check box. You may alter the positions before saving the waypoint byclicking "OK".
Use the dialog which appears to customize the waypoint presentation.
Modifying waypoints
To modify a waypoint after it has been placed on the map, select the waypoint with the mouse (themouse cursor should change from arrow to hand) and click the right mouse button, and select "EditWaypoint..." as shown below. You will be able to alter all it's properties including the waypoint location.To remove a waypoint from your map, you can select the "Remove Waypoint..." option from the menuinstead.

Eye4Software Hydromagic 9.4176
© 2009-2021 Eye4Software B.V.
Select the "Edit Waypoint..." option to modify an existing waypoint.
Moving waypoints
To move a waypoint, you can modify a waypoint's coordinates manually as described above, or you canuse the mouse to drag the waypoint to its new position. In order to move a waypoint, you have to makesure the "Lock Objects" function has been switched off first (version 9.0 and older only). You can find thisfunction on the toolbar and in the "Cursor" menu at the top of the screen. After switching off this function,select the waypoint symbol with the mouse, click and hold the left mouse button and drag the waypointto its new location.
Switch off to move waypoints.(version 9.0 and older only!)
Waypoints in the "Project Explorer" view
Each waypoint that is part of your project can be found in the "Project Explorer" view. When the "ProjectExplorer" is not visible, you can show it by selecting the "Project Explorer" option from the "View" menuat the top of the screen. The waypoints will be displayed when expanding the "Waypoints" folder in theproject tree. You can right-click a waypoint to show more option, or double-click it to center the map ona waypoint position.

Map display / Background maps 177
© 2009-2021 Eye4Software B.V.
Waypoints can be accessed from the "Project Explorer" view as well.
Waypoint Manager
To view a list off all the waypoints in your project, you can open the "Waypoint Manager", by rightclicking the "Waypoints" folder in the "Project Explorer" and selecting the "Manage Waypoints..." option.It can be used to toggle the visibility of multiple waypoints at once, or to delete a selection of waypoints.
The "Waypoint M anager" allows you to perform operations on multiple waypoints at once.
4.13 Projecting Waypoints
Projecting a waypoint
When projecting a waypoint, you basically create a waypoint on a certain distance and heading from aknown position. In Hydromagic, there are multiple ways to project a waypoint. You can project the

Eye4Software Hydromagic 9.4178
© 2009-2021 Eye4Software B.V.
waypoint from another waypoint, a position on the map, a manually entered position or the current GPSposition. In this example, we will project a waypoint, using another waypoint as a reference.
To open the "Project Waypoint" window, select the "Tools" => "Project Waypoint" option from the menu.The following window will appear:
Use the "Project Waypoint" tool to project a newposition with an existing waypoint as reference.
In this window, you will find 2 buttons, a "Select..." button, to select the source waypoint, and a "GPS"button which can be used to automatically enter the current GPS position as source location. For thisexample, we will use another waypoint, so we click the "Select..." button and choose a waypoint fromthe list. If there is no waypoint in the list, you can walk through the Creating Waypoints tutorial to createa one. Once you selected a waypoint, the coordinates of this waypoint are copied into the Latitude /Longitude fields. For this example, we will create a new waypoint at 100 meters and a 45 degrees coursefrom the selected waypoint. After we entered these values, we click "Project...".
When you want to place a new waypoint at a position projected from your current GNSS receiverposition, click the "GPS" button to copy your current position into the coordinate fields. These coordinatefields can also be used to enter a reference position manually. Depending on the state of the "Showposition in grid coordinates", you can enter the coordinate either in WGS84 or projected coordinates(your project's coordinate reference system will be used).
Saving the waypoint
An "Edit Waypoint" window will appear with the location of the projected waypoint already entered. Youcan now modify the waypoint's attributes such as waypoint name and symbol. Note that when a newwaypoint is created, by default the symbol and label properties are inherited from the last createdwaypoint. This might be very handy when creating multiple waypoints which should use the sameattributes.

Map display / Background maps 179
© 2009-2021 Eye4Software B.V.
A new waypoint will be created with the projected coordinates.
When done, click "OK" to save the waypoint. When looking at the map, you will find the new"PROJECTED" waypoint projected at an angle of 90 degrees and a distance of 25 meter from theselected waypoint.
An example of a projected waypoint.
4.14 Placing comments
Using comments in Hydromagic
In Hydromagic, it is possible to add comments or labels to your maps. You can use comments or labelsto, for instance, mark places, or to add extra text to the map before sending it to a printer or plotter. Youcan place comments using any color or Windows font, with or without background.
Comments can also be exported to AutoCAD DXF or Google Earth KML together with the other projectitems using either the "Export AutoCAD DXF" and "Export KML" tools.

Eye4Software Hydromagic 9.4180
© 2009-2021 Eye4Software B.V.
Example of a customized comment as map overlay.
Adding a comment
There are multiple ways to add a comment. You can create one manually from the "Comment Manager",or click on the map to place a comment at the current mouse position. The easiest way is by clicking onthe map. Zoom and pan over the map until you find the position you want to place a comment. Click theright mouse button, when pointing the mouse to the position, and select the "Add Comment..." option:
Right click the map and select the "Add Comment..."option to place a new comment.
You will notice that the position of the comment is already filled out. In this window, you can add acomment to store with the project. You can also change the fore- and background colors and the fontused to draw the comment on the map. In the preview area you can see an example of how yourcomment is going to display based upon the currently selected font name, font size and color settings.

Map display / Background maps 181
© 2009-2021 Eye4Software B.V.
Customize how the comment will look in the "New Comment" tool.
Moving Comments
To move a comment, you can modify a comment's coordinates manually as described above, or you canuse the mouse to drag the comment to its new position. In order to move a comment, you have to makesure the "Lock Objects" function has been switched off first. You can find this function on the toolbar andin the "Cursor" menu at the top of the screen. After switching off this function, select the commentsymbol with the mouse, click and hold the left mouse button and drag the comment to its new location.
Switch off to move comments. (Version 9.0 or older only!)
Comments in the "Project Explorer" view
Each comment that is part of your project can be found in the "Project Explorer" view. When the "ProjectExplorer" is not visible, you can show it by selecting the "Project Explorer" option from the "View" menuat the top of the screen. The comments will be displayed when expanding the "Comments" folder in theproject tree. You can right-click a comment to show more option, or double-click it to center the map ona comment position.

Eye4Software Hydromagic 9.4182
© 2009-2021 Eye4Software B.V.
Comments can be accessed from the "Project Explorer" view as well.
Comment Manager
To view a list off all the comments in your project, you can open the "Comment Manager", by rightclicking the "Comments" folder in the "Project Explorer" and selecting the "Manage Comments..."option. It can be used to toggle the visibility of multiple comments at once, or to delete a selection ofcomments.
The "Comment M anager" allows you to perform operations on multiple comments at once.
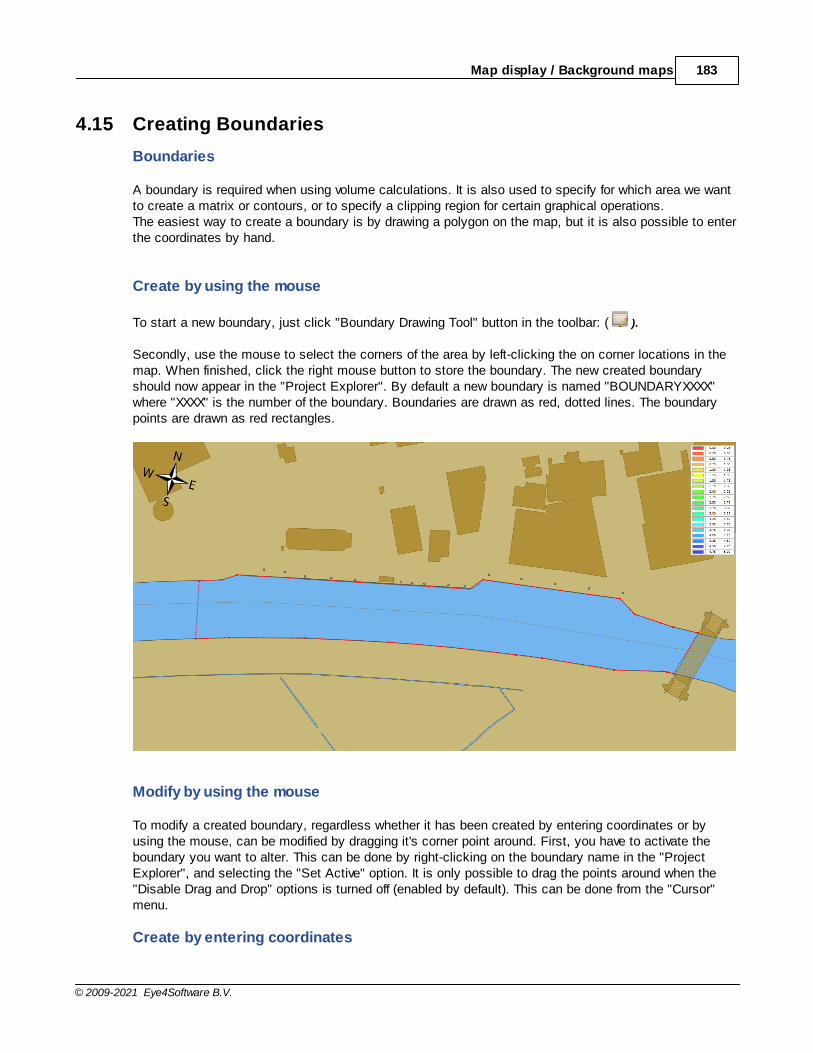
Map display / Background maps 183
© 2009-2021 Eye4Software B.V.
4.15 Creating Boundaries
Boundaries
A boundary is required when using volume calculations. It is also used to specify for which area we wantto create a matrix or contours, or to specify a clipping region for certain graphical operations. The easiest way to create a boundary is by drawing a polygon on the map, but it is also possible to enterthe coordinates by hand.
Create by using the mouse
To start a new boundary, just click "Boundary Drawing Tool" button in the toolbar: ( ).
Secondly, use the mouse to select the corners of the area by left-clicking the on corner locations in themap. When finished, click the right mouse button to store the boundary. The new created boundaryshould now appear in the "Project Explorer". By default a new boundary is named "BOUNDARYXXXX"where "XXXX" is the number of the boundary. Boundaries are drawn as red, dotted lines. The boundarypoints are drawn as red rectangles.
Modify by using the mouse
To modify a created boundary, regardless whether it has been created by entering coordinates or byusing the mouse, can be modified by dragging it's corner point around. First, you have to activate theboundary you want to alter. This can be done by right-clicking on the boundary name in the "ProjectExplorer", and selecting the "Set Active" option. It is only possible to drag the points around when the"Disable Drag and Drop" options is turned off (enabled by default). This can be done from the "Cursor"menu.
Create by entering coordinates

Eye4Software Hydromagic 9.4184
© 2009-2021 Eye4Software B.V.
When your client has supplied a list of coordinates for the area you have to survey, you can also create aboundary by manually entering these points. To do so, right-click the "Boundaries" folder in the "ProjectExplorer" and select the "Add Boundary..." option. The following dialog will appear:
The table shows the coordinates of the corners of the boundary. The toolbar at the bottom of the dialogallows you to insert, delete or alter the coordinates.This dialog can also be used to modify boundaries created by using the mouse, or to rename apreviously created boundary:
Button Function
Edit the selected coordinate.
Add a new coordinate to the list.
Insert a new coordinate before the selected coordinate.
Deletes the selected coordinate(s).
Clears the list (delete all coordinates).
Reload the list.
Show selected coordinate on the map.
Toggle coordinates between WGS84 and local grid.
Removing a boundary

Map display / Background maps 185
© 2009-2021 Eye4Software B.V.
A boundary can be removed by right-clicking on the boundary name in the "Project Explorer" and byselecting the "Remove Boundary..." option. After a confirmation, the boundary will be removed from theproject.
4.16 Cross Sections
Cross Sections
In Hydromagic, cross sections are used to create a theoretical 3D design of the area you want to use toperform volume calculations. The sections are in fact lines from shore to shore containing depth orelevation information relative to the distance from the shores or riverbanks.
By using a boundary, it is possible to auto generate cross sections from bank to bank (automaticplacement). It is also possible to place them by dragging the sections at the correct place by using themouse (manual placement).
Automatic placement
Using automatic placement, cross sections will be generated to fill a specified boundary. The directionof, and the distance between the sections can be selected. To use automatic placement, select the"Generate Sections" option, by right clicking the "Sections" folder in the "Project Explorer". The followingdialog will appear:
For the "Line Direction" you will normally specify the heading perpendicular to the shore or riverbank. Youcan measure the direction of the shore using the built in "Distance and Bearing" tool.
The "Line Distance" depends on the size of the area, in this example we leave it to the default value, 10.0meters.
Use the section name prefix when you have multiple sets of sections. The software will start the namesof the generated sections with this prefix, so it is more easy to determine to which set a section belongs.In this example, we will use "DK" as prefix for the section names.

Eye4Software Hydromagic 9.4186
© 2009-2021 Eye4Software B.V.
Finally, select the area you want to use as clipping area for the sections. To start generating crosssections, fill in the required fields and click "OK". The cross sections are now calculated and displayedon the map:
Manual placement
In some cases, the automatic placement will not suffice, for instance for irregular areas or at places theriver makes a turn. You can then make use of manual placement (eventually in combination withautomatic placement).To create a new section, right click the position of the new cross section, and the following dialog willappear:

Map display / Background maps 187
© 2009-2021 Eye4Software B.V.
Enter a name for the newly created section and click "OK" (we will discuss the other options of thisdialog in the next chapter). A new section will be created with a default length and azimuth. You can usethe mouse to rotate, resize and move the section in the right place.
Moving, resizing and rotating cross sections
After automatic or manual placement, you will notice that a single cross section is drawn as a dashedpurple line with 3 anchor points. You can select these points with the mouse to move or rotate the crosssection using the map.
By dragging the center point of the cross section, you can drag and drop it to the new position. In orderto rotate or resize it, use either one of the start and end points of the cross section.
Please note, that in order to drag and drop any objects on the map, you have to disable the "Disabledrag and drop" option from the "Cursor" menu.

Eye4Software Hydromagic 9.4188
© 2009-2021 Eye4Software B.V.
Delete cross sections
There are two ways to delete a single cross section:
1. Right-click the center anchor point of the cross section in the map, and select "Remove Section"from the popup menu;
2. Right-click the cross section name in the "Project Explorer" and select "Remove Section.
To delete all cross sections, right click the "Sections" folder in the "Project Explorer" and select"Remove All...". After confirmation, all cross sections will be removed from the project.
4.17 Cross Sections from CAD
Import cross sections from AutoCAD DXF file(s)
Instead of placing cross sections by hand or using a boundary, it is also possible to import them directlyfrom an AutoCad DXF drawing. To use this method, please make sure you use a separate layer inAutoCAD to store these lines.
Import dialog
To start importing the line data used to create sections, select the "Generate sections from DXF..."option by right clicking the "Sections" folder in the project view. If the project view is not visible, you canshow it by selecting "Project Explorer" from the "View" menu.

Map display / Background maps 189
© 2009-2021 Eye4Software B.V.
The generate cross sections from AutoCAD DXF file importing tool
Select the drawing file
First, you have to click the "Browse..." button to select an AutoCAD DXF file. If your AutoCAD file issaved in the DWG format, you can export it to DXF by using the 'DXFOUT' command in AutoCAD.
When a valid file has been selected, the layer names will be loaded and displayed in the dialog.

Eye4Software Hydromagic 9.4190
© 2009-2021 Eye4Software B.V.
Select the AutoCad layer(s) that contain the cross sections
Select layer(s)
After the AutoCAD file has been loaded, you have to select one or more layer(s) containing the line datato be used. You can select one or more layers, please note that only 'LINE', 'POLYLINE' and'LWPOLYLINE' entities can be converted into cross sections.
When the selected layers do not contain lines, or unsupported line entities , the following error messagewill be displayed when starting the import process:
When the selected layers do not contain lines in the correct format, Hydromagic will notify you.
Section name prefix

Map display / Background maps 191
© 2009-2021 Eye4Software B.V.
Normally, the name of a cross section consists of a number. To provide more clarity about a crosssection, or to group them, the section number can be preceded by a short text. This setting is optional.
Section name start
All section names are numbered. This optional setting allows you to specify which number to startnumbering with.
During numbering, Hydromagic will automatically check that there are no duplicate numbers generated. Ifthis is the case, a notification will be shown suggesting another initial number.
In case of numbering conflicts, Hydromagic will suggest another initial number
Clipping Area
When a clipping area is selected, all lines will be clipped within this area. When clipping area is set to"N/A" all lines will be loaded "AS IS". To use clipping, draw a boundary first.
Starting import
To start creating cross sections, just click "OK". After a few seconds you will see the imported lines inyour project. The dialog box will close automatically on successful cross sections generation.

Eye4Software Hydromagic 9.4192
© 2009-2021 Eye4Software B.V.
Sections generated from DXF file shown above
2D vs 3D lines
In Hydromagic you use cross sections for volume calculations or to define a channel design as well.When importing cross sections from an AutoCAD DXF file, Hydromagic will automatically detect whetherthe line contains different Z-Values. When this is the case the Z-Values are automatically stored into across section profile as shown below:

Map display / Background maps 193
© 2009-2021 Eye4Software B.V.
Example of an imported cross section with Z-values defined.
In order to set the Z-values of polyline vertices in AutoCAD, you need a version of AutoCAD that supports3D. This means that these lines cannot be generated with AutoCAD LT.
4.18 Channel Design
Channel Design
After placing cross sections, as discussed in the previous chapter (Cross Sections), we need to set thedepth or elevation information of a couple of coordinates along the cross section. These values are stored as pairs of distance and level data, where distance is the distance measuredfrom the start of the line. In order to create a theoretical DTM to be used in volume calculations, we need these values.
When the depth and the slope of the shore are known, it is possible to calculate depths on the crosssections automatically.
Calculating profiles
To alter a cross section's profile, just right click on the center anchor point, and select "Edit Section...".The following dialog ("Edit Cross Section") should now appear:

Eye4Software Hydromagic 9.4194
© 2009-2021 Eye4Software B.V.
When first editing a cross section, you will notice the graph display is empty, this is because no depthsare stored by default. In this example, we will create a channel with a depth of 5 meters and a slope of50 percent. This means, that for each 2 meters, the bottom depth increases with 1 meter. When thebottom depth increases with 1 meter for each 4 meter extra distance from the shore, the slope is 25%.To calculate profiles from this setting, click the "Auto..." button. The following dialog should now appear:

Map display / Background maps 195
© 2009-2021 Eye4Software B.V.
In the left section of the dialog, you can enter the channel design parameters, in the right section, youcan select the cross sections you want to apply these parameters to. In this example, the depth at theshoreline should be half a meter, at the waterway axis, the depth should be 5 meters. The slope used is50 percent. Click the "OK" button to apply these settings. The graph display will now look like this:
You can check the other sections by browsing through them using the next and previous buttons.
Manual editing
In cases where calculation is not usable, for instance when a different slope is used on either sides, orwhen a section is not placed between shores, you have to enter the distance and depth valuesmanually.
To do so, click the "Edit..." button to open the profile editor:

Eye4Software Hydromagic 9.4196
© 2009-2021 Eye4Software B.V.
The table at the left of the dialog allows you to alter, insert and delete the distance-depth pairs if theprofile. Changes made, are directly visible in the graphical display. When done, just click "OK"
Checking the profiles
The quickest way of checking whether al profiles have been created correctly, is by creating a matrixview using the cross sections. To do so, select the "Generate Matrix..." option from the "Sections" folderin the "Project Explorer".
Select the correct boundary (in most cases the boundary used for auto placement of the sections), afilename for the matrix, and the spacing used (can be larger for a test, for volume calculation, use thesame spacing as the matrix created from the sounding). Click "OK" and check the result.

Map display / Background maps 197
© 2009-2021 Eye4Software B.V.
4.19 Route Planner
Hydromagic Route Planner
In Hydromagic, the built in route planner can be used to combine sections and waypoints into a route.Routes can be used to program autopilots, or can be drawn as a map overlay to guide you duringsurveys.
At this moment only the CEE HydroSystems CEEPILOT and Dynautics SPECTRE autopilots aresupported for route uploads.In order to upload routes directly to this hardware, a plugin needs to be loaded. How to load the pluginwill be explained in the following paragraph.
It is also possible to upload routes using a 3rd party software package like Mission Planner.To allow the routes to be used in other software packages, Hydromagic can export routes in various fileformats:
· NMEA0183 ASCII Files;· GPX GPS Exchange Data Files;· GQC MavLink / Mission Planner Data Files;· ASCII Import / Export Files.
Loading the autopilot plugin
To load the auto pilot plugin for the CEEPILOT, open the preferences window by selecting"Preferences..." from the "Options" menu. In the window that appears, select the "Devices" tab. Nextclick the "Add..." button.

Eye4Software Hydromagic 9.4198
© 2009-2021 Eye4Software B.V.
A list of available plugins will be displayed. In this list, select the "Dynautics SPECTRE AutoPilot Plugin"and click "OK" to load and display the plugin's user interface.
Configuring the autopilot plugin
When the plugin loads, a dialog with some required settings will appear first. Since the CEEPILOT isconnected via WiFi, we have to enter the network settings (UDP).
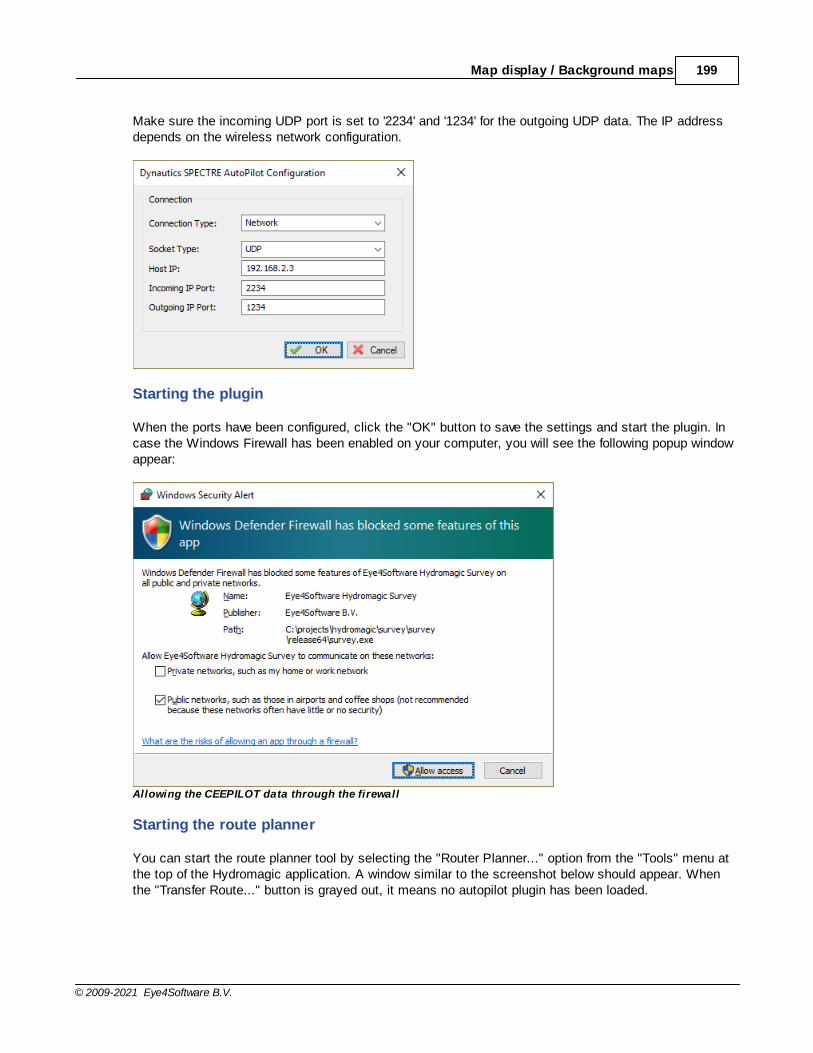
Map display / Background maps 199
© 2009-2021 Eye4Software B.V.
Make sure the incoming UDP port is set to '2234' and '1234' for the outgoing UDP data. The IP addressdepends on the wireless network configuration.
Starting the plugin
When the ports have been configured, click the "OK" button to save the settings and start the plugin. Incase the Windows Firewall has been enabled on your computer, you will see the following popup windowappear:
Allowing the CEEPILOT data through the firewall
Starting the route planner
You can start the route planner tool by selecting the "Router Planner..." option from the "Tools" menu atthe top of the Hydromagic application. A window similar to the screenshot below should appear. Whenthe "Transfer Route..." button is grayed out, it means no autopilot plugin has been loaded.

Eye4Software Hydromagic 9.4200
© 2009-2021 Eye4Software B.V.
Creating routes
A route can be created by adding sections and waypoints to the route list. For sections, first the startingpoint will be added followed by the ending point. You can reverse sections by right clicking the sectionscenter in the map, and select the 'Reverse' option from the popup menu.
To add a section, click the "Add Section(s)..." button. You can select one or multiple sections at once.To add a waypoint, click the "Add Waypoint(s)..." button. You can select one or multiple waypoints atonce.
To (re)move route points, just right click the list view for more options:

Map display / Background maps 201
© 2009-2021 Eye4Software B.V.
Importing and exporting route data
The tool offers a couple of options for importing or exporting route files. This functionality is offered toallow you to use other software for route creation or uploading. The import and export options can also beused to transfer routes between different Hydromagic projects.
When you created the route in other software, and you want to show or upload the route in Hydromagic,use the "Import Route..." button. Please note that any existing route will be overwritten when a route fileis imported.
When the route has been created, and you want to use a third party software tool to upload the route intoother hardware, use the "Export Route..." button. Please note that all exported coordinates are in theWGS84 coordinate reference system.
Exporting a route to Mission Planner (MavLink)
The route planner could also be used to create routes and send them to MavLink compatible hardwarevia Mission Planner. If you haven't installed a copy of Mission Planner already, you can download it fromthe ArduPilot website.
First create your route as explained in this document. After creating the route, click the "Export Route..."button and select the "Export QGC..." option from the dropdown menu. In the "Save As" dialog thatappear, choose a filename and save the file.

Eye4Software Hydromagic 9.4202
© 2009-2021 Eye4Software B.V.
Export the route as M avLink waypoints file
Now you can start the Mission Planner software, and select the "Flight Plan" mode in the toolbar on topof the screen. The software will now switch to planning mode and there should appear a new panel at theright hand of your screen.
Switch to planning mode by clicking the flight plan button
In this new panel, click the "Load WP File" button and select the QGC waypoints file you just createdwith Hydromagic.
Your route should now be visible as map overlay in Mission Planner. When you have connected aMavLink compatible autopilot, click the "Write WPs" button to store the waypoints in your autopilot.

Map display / Background maps 203
© 2009-2021 Eye4Software B.V.
Example of an exported route imported into M ission Planner
Uploading routes
After a route has been entered you can upload it into the autopilot. Please make sure that you have tospecify at least two points. Also make sure to program the point where the USV should return. You canuse a waypoint for this.
To start the upload process, just click the "Transfer Route..." button. When this button has been grayedout, it means that you have to load the "Dynautics SPECTRE AutoPilot Plugin" first.
After starting the upload the following progress dialog will be showed, stating which route or waypoint iscurrently being uploaded. When contacting support with upload issues, please send a screenshot of thisdialog.

Eye4Software Hydromagic 9.4204
© 2009-2021 Eye4Software B.V.
4.20 Depth colors and color legend
Depth Colors
In Hydromagic, depths or elevation values can be drawn in colors so it is easier to see, for instance,which areas are deeper then others. By defining a color set, you can create a mapping between depth (orelevation) values and colors which are used when matrices, raw data tracks or soundings are drawn. Youcan generate a single color set, or multiple, for instance to have a different color set for depth andelevation values. Color sets are defined per project, since depth ranges may be different for varioussounding locations.
Example matrix overlay with cell colors assigned via an user defined color set.
Manage color sets
To create or alter color sets, open the "Manage Color Sets" tool by selecting the "Depth Colors..." optionfrom the "Options" menu, or by clicking the "Depth Colors" in the tool bar (when tool bar is visible andbutton has been added to the collection of standard buttons):
Select the "Depth Colors..." option from the "Options" menu

Map display / Background maps 205
© 2009-2021 Eye4Software B.V.
to start defining color sets.
Creating (the first) color set
After creating a new project, the project does not contain any color sets. This means that depths will bedisplayed in black and matrices can be drawn in black text only. To create a color set, click the "..."button next to the color set selection drop down box. In the dialog which appears, click the "Add..."button.
Enter a descriptive name for the set, since it will be displayed in the header of the color legend as well.After clicking "OK" to set the name, select the newly created color set and click "Close". The newlycreated color set is now set to active. In case you ever want to rename the color set, use the"Rename..." button.
Click the "..." button to alter, remove or add color sets
Defining colors
To define or alter color ranges for a color set, first select the color set you want to modify by selecting itfrom the drop down box at the bottom of the screen. Once selected, the colors associated with the setwill be displayed in the color list. The easiest and fastest way to generate color ranges for the color setis by calculating them automatically. To do so, click the "Auto..." button.

Eye4Software Hydromagic 9.4206
© 2009-2021 Eye4Software B.V.
The colors for the selected color set are displayed in the list.
Using the "Generate Color Ranges" tool, you can just enter the minimum and maximum depths, aninterval and select which colors to use. In case you do not know the color range, you can detect theminimum and maximum values automatically by clicking the buttons with the 'magnifier glass' on it.These buttons will only work when a valid sounding has been generated or loaded.
Please note that a maximum of 30 colors can be used per color set. When an error is displayed statingthe generation of color ranges will result in more then 30 ranges, just increase the "Interval" value.Generated depth ranges can be altered or removed at any time.

Map display / Background maps 207
© 2009-2021 Eye4Software B.V.
Click the "Auto..." button to calculateranges for your color set.
Displaying a color legend
A legend for the defined color set can optionally be displayed in on of the corners of the map display.Use the drop down box to select the location. Possible values are:
§ Do not display color legend;§ Display in upper-left corner;§ Display in upper-right corner;§ Display in lower-right corner;§ Display in lower-right corner.
When using the "Final Product Editor" the legend might be displayed at another position. This settingonly controls the position of the legend in the map display.
Select the location of the color legend using the drop down box.
Exporting and importing color sets
Color sets can be backed up easily for archiving, or to import them into another project, which mightcome in handy if you use the same color set in different projects. To export the color sets defined in aproject, click the "..." button to open the list of color sets and click the "Export..." button to save thecolors. From the second project, open the same window and use the "Import..." function to import thecolor set file.

Eye4Software Hydromagic 9.4208
© 2009-2021 Eye4Software B.V.
Use the import and export functions to transfer color sets between projects.
The color importing and exporting functions can be used in the "3D Terrain Viewer" application as well.This allows you to display 3D terrains in the same colors as defined in your project.
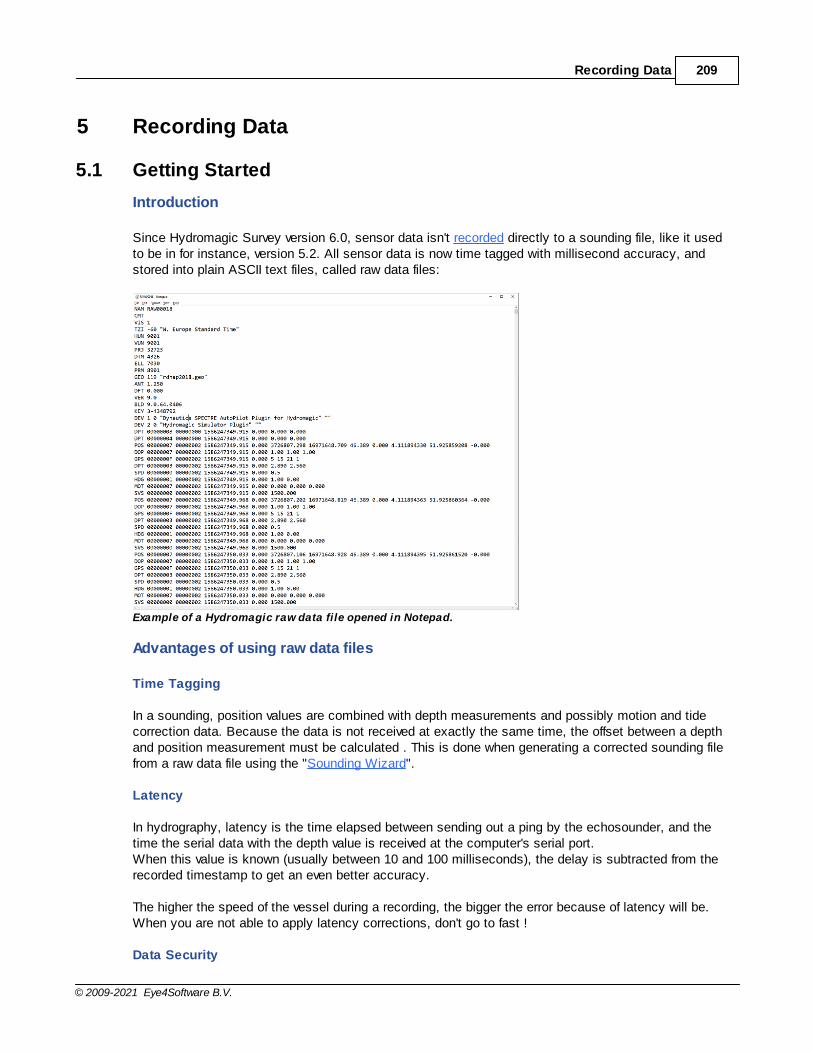
Recording Data 209
© 2009-2021 Eye4Software B.V.
5 Recording Data
5.1 Getting Started
Introduction
Since Hydromagic Survey version 6.0, sensor data isn't recorded directly to a sounding file, like it usedto be in for instance, version 5.2. All sensor data is now time tagged with millisecond accuracy, andstored into plain ASCII text files, called raw data files:
Example of a Hydromagic raw data file opened in Notepad.
Advantages of using raw data files
Time Tagging
In a sounding, position values are combined with depth measurements and possibly motion and tidecorrection data. Because the data is not received at exactly the same time, the offset between a depthand position measurement must be calculated . This is done when generating a corrected sounding filefrom a raw data file using the "Sounding Wizard".
Latency
In hydrography, latency is the time elapsed between sending out a ping by the echosounder, and thetime the serial data with the depth value is received at the computer's serial port.When this value is known (usually between 10 and 100 milliseconds), the delay is subtracted from therecorded timestamp to get an even better accuracy.
The higher the speed of the vessel during a recording, the bigger the error because of latency will be.When you are not able to apply latency corrections, don't go to fast !
Data Security

Eye4Software Hydromagic 9.4210
© 2009-2021 Eye4Software B.V.
Because the raw data is never altered after you complete recording data, you will never loose any databy performing invalid corrections to your data.Just use the "Generate Sounding Wizard" again to edit your original data and create a sounding filewhich can be used for further processing.
Data Editing
Eye4Software Hydromagic keeps two copies of the raw data files on file. One copy is the original data,which is never altered, and the second one is the modified data.You can alter the modified raw data over and over again until your satisfied, and create a sounding filefrom it. If the data becomes corrupted, just revert back to the original data.
5.2 Creating a new singlebeam sounding
Creating Soundings
Before you can create a new sounding it is recommended to perform the following checklist:
§ You have opened an existing or created a new project;§ Make sure the position is valid, and the GPS or RTK receiver has good reception;§ Check whether a depth is indicated in the "Data View";§ Check the echo sounder offset (also known as static or fixed draft);§ When using a motion sensor, make sure it is calibrated;§ Check the PC's time and date, this is important when using tide correction;§ When using real time RTK tide information, make sure the antenna offset and correct geoid model are
selected;

Recording Data 211
© 2009-2021 Eye4Software B.V.
§ Check the PC's time and date, this is important when using manual tide correction.§ It is recommended to enable the "auto save" function, please see below for more information.
The next step is to open or download a background map, although is not required, it can be used tocheck whether your GNSS position is still correct, and the software is still writing new records to the rawdata file.
Recording raw data
A sounding is created in two steps. First you are going to record raw data. All position, motion and depthdata is time stamped and stored into an ASCII file. The second step is to correct the raw data andgenerate soundings from it.
Example of a Hydromagic raw data file opened in Notepad.
Recording raw data files
When you are ready to start your survey, just click the "Record" button ( ) to start recording all sensordata to a newly created raw data file. Raw data files are generated every time you start a new recording.Raw files are named RAW0001, RAW0002, RAW0003 etc. You can record the complete area to a singlefile, or start a new data file for each surveyed line (we recommend the latter). To check the recording

Eye4Software Hydromagic 9.4212
© 2009-2021 Eye4Software B.V.
status, check the recording indicator right on the status bar, or check the "Recording" section in the"Data View" display as shown by the screen shots below.
To pause a recording without generating a new recording, just click the "Pause" button ( ) instead.When clicking the pause button again, the recoding will resume writing data to the same raw data file.
No raw data recording Data recording active Data recording paused
Displaying raw data files
During recording, recorded raw data will be displayed as map display overlay. Please note, that at thisstage, only the uncorrected raw depth (not elevation!) and position data is written to the display.Elevations and corrected values will only be displayed when the raw data has been converted to asounding. However, when you are recording data with RTK tides enabled, you can show corrected dataduring the survey by enabling the "Display elevations" option in the display options window (see below).
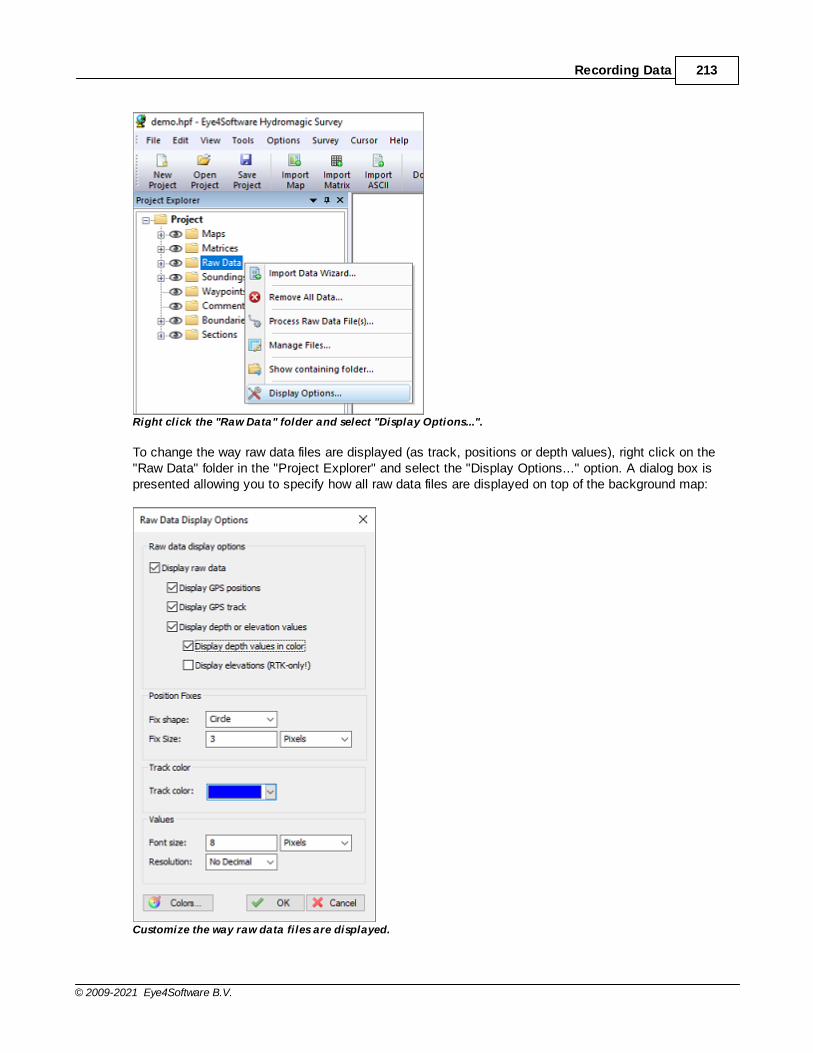
Recording Data 213
© 2009-2021 Eye4Software B.V.
Right click the "Raw Data" folder and select "Display Options...".
To change the way raw data files are displayed (as track, positions or depth values), right click on the"Raw Data" folder in the "Project Explorer" and select the "Display Options..." option. A dialog box ispresented allowing you to specify how all raw data files are displayed on top of the background map:
Customize the way raw data files are displayed.

Eye4Software Hydromagic 9.4214
© 2009-2021 Eye4Software B.V.
Auto save option
To prevent data loss, for instance due to a PC crash or AC power failure, it is recommended to use the"AutoSave" option. When this option is enabled all project data (including raw data and sounding files)will be saved to disk at the specified interval.
The auto save option is located at the "M iscellaneous" tab.
To change the auto save option, select "Preferences..." from the "Options" menu, and click the"Miscellaneous" tab. You will see an "Auto save" section at the bottom of this window. Now click the"Setup..." button in this section. Enable the check box when you want to use auto save, and enter aninterval (minimum 1 minute). Click the "OK" button to apply the changes.

Recording Data 215
© 2009-2021 Eye4Software B.V.
M ake sure you enable the auto save function to prevent data-loss.
Manually saving the raw data
Raw data can be saved at any time by just clicking the "Save" button in the toolbar ( ). It will be savedinto the "RawData" folder of your project.
5.3 Events and annotation
Using events and annotations
In Hydromagic, it is possible to mark places of special interest during surveys by sending an annotationmarker to the echosounder or built-in echogram display. There are also shortcuts to place a map overlay,such as a waypoint or comment at the current GPS or RTK position.
Accelerator Keys
To enable quick access to the functions described in the introduction above, we recommend you tosetup accelerator keys for them. By default, the following accelerator keys are already defined for someoperations during surveys:
§ F6 - Place comment at current GPS position;§ F7 - Place waypoint at current GPS position;§ F8 - Store event and annotate echosounder or echogram;§ F9 - Toggle recording (start/stop);
Please note that these functions can also be accessed through the main menu. Just click the 'Survey'item from the main menu which can be found at the top of the Hydromagic window.

Eye4Software Hydromagic 9.4216
© 2009-2021 Eye4Software B.V.
Access the event and annotation functions from the Survey menu.
When you are using a tablet, and do not have a full keyboard, you can associate some of thesefunctions with other keys (for instance tablet keys) as well. For more information on how to assignaccelerator keys (or keyboard shortcuts), please refer to the Accelerator Keys manual entry.
Use accelerator keys to quickly access event and annotation functions.
Placing a comment
By pressing the F6 key on your keyboard, or selecting the 'Place Comment' function from the 'Survey'menu, Hydromagic will create an empty comment with the current GPS position as center coordinate.This allows you to place a textual note on the map. Please note that this comment is not send to theechosounder, echogram or raw data file. Comments will be stored in XML format in the project file.Comments can also be exported as ASCII text using the "Export ASCII Data" tool.
Please see the 'Adding Comments' manual entry for more information on what map comments are andhow they can be used.

Recording Data 217
© 2009-2021 Eye4Software B.V.
Place a comment at the current GPS position.
Placing a waypoint
By pressing the F7 key on your keyboard, or selecting the 'Place Waypoint' function from the 'Survey'menu, Hydromagic will create an empty waypoint with the current GPS position as center coordinate.This allows you to place a symbolic note on the map. Please note that this waypoint is not send to theechosounder, echogram or raw data file. Waypoints will be stored in XML format in the project file.Waypoints can also be exported as ASCII text using the "Export ASCII Data" tool.
Please see the 'Adding Waypoints' manual entry for more information on what map waypoints are andhow they can be used.
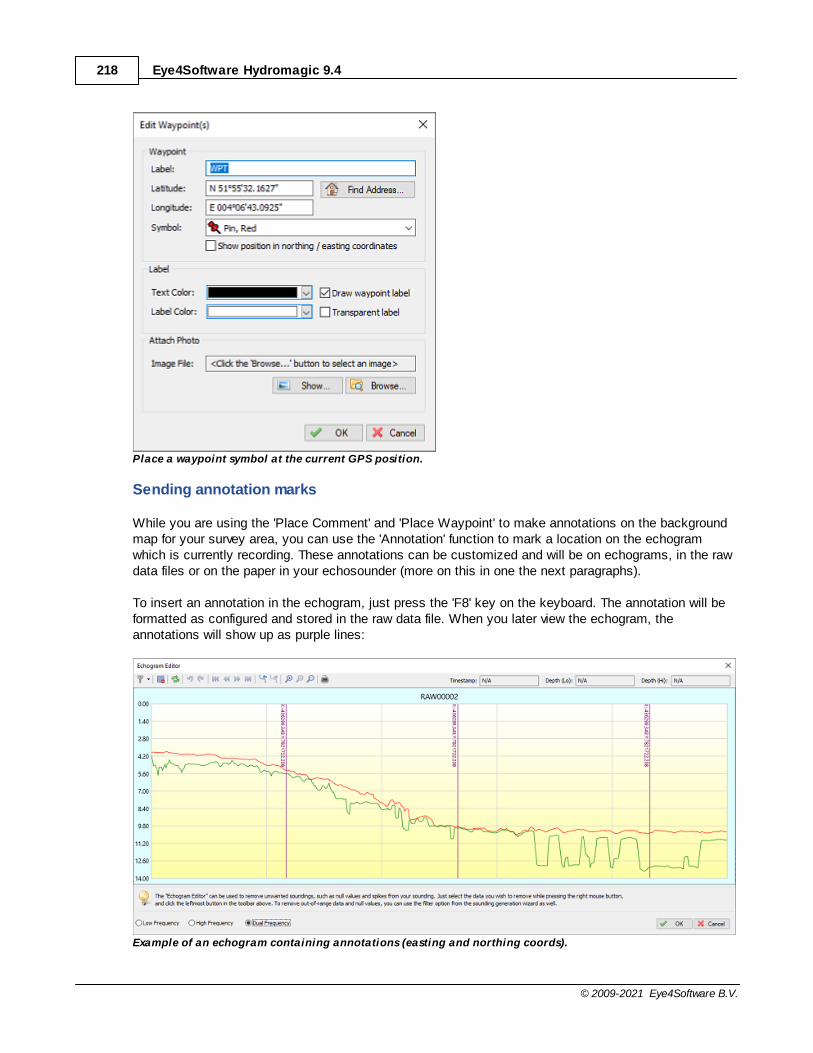
Eye4Software Hydromagic 9.4218
© 2009-2021 Eye4Software B.V.
Place a waypoint symbol at the current GPS position.
Sending annotation marks
While you are using the 'Place Comment' and 'Place Waypoint' to make annotations on the backgroundmap for your survey area, you can use the 'Annotation' function to mark a location on the echogramwhich is currently recording. These annotations can be customized and will be on echograms, in the rawdata files or on the paper in your echosounder (more on this in one the next paragraphs).
To insert an annotation in the echogram, just press the 'F8' key on the keyboard. The annotation will beformatted as configured and stored in the raw data file. When you later view the echogram, theannotations will show up as purple lines:
Example of an echogram containing annotations (easting and northing coords).

Recording Data 219
© 2009-2021 Eye4Software B.V.
Example of annotation data stored in a raw data file (easting and northing coords).
Customizing annotation text
When adding an annotation mark to your raw sounding, you can use a fixed text, empty line or formatthe text using placeholders, for instance when you want to insert real time data, like the current time,position, heading or speed.
To customize the annotation text, first select the "Preferences..." option from the "Options" menu. Thenclick the 'Miscellaneous" tab and click the "Setup..." button in the "Chart Annotation" section. Thefollowing dialog will now appear. To enable annotations to be stored, check the 'Enable chart annotation'option. This will allow you to insert annotation lines without labels.

Eye4Software Hydromagic 9.4220
© 2009-2021 Eye4Software B.V.
In Hydromagic you can use the above dialog to customize annotation text.
When you want to place labels along with the annotation lines, please check the 'Enable chartannotation label' box as well. You can use the label text line to customize the label. To use real timedata in your labels, click the 'Add Placeholder...' button to insert placeholders.
In the example above, when inserting an annotation mark, the current easting and northing position willbe displayed next to the marker line.
Combine static text with placeholders to add real time data to your labels.
Sending annotation markers to thermal paper
Some echo sounders which contain a thermal recorder have the ability to write annotation marks directlyon the thermal paper. Sometimes they can only print a line, and sometimes some label text as well.Most sounders will limit the maximum amount of text written to 80 characters.
There are also some modern sounders which have the ability to receive annotation data and display it ona built in screen. A couple of Hydromagic plugins have the ability to send out annotation data to an echosounder:
§ STN ATLAS Deso 11/14/15 Echosounder Plugin;§ STN ATLAS Deso 17 Echosounder Plugin;

Recording Data 221
© 2009-2021 Eye4Software B.V.
§ STN ATLAS Deso 20/22/25 Echosounder Plugin;§ Odom EchoTrac SBT/DBT Plugin§ Syqwest Hydrobox Plugin;§ Knudsen 320 Echosounder Plugin;§ ELAC LAZ4100 Echosounder Plugin;§ Reson NaviSound 200 Series Plugin;§ Simrad EA300 Plugin;§ Simrad EA500 Plugin.
An echosounder capable of writing annotation marks to thermal paper (Odom EchoTrack).
5.4 RTK tide corrections
Using RTK tide corrections
Using a RTK receiver in fixed mode, you have X, Y and Z coordinates with an high accuracy ( < 2 cm ).Using the Z coordinate (also known as ellipsoidal height), you can calculate the current tide level in real-time, making it no longer necessary to have a tide gauge connected to the software, or to correct thesounding afterwards.

Eye4Software Hydromagic 9.4222
© 2009-2021 Eye4Software B.V.
Requirements
n order to calculate tide levels in real-time, you need a RTK receiver with a valid correction signal. Thiscorrection signal can be provided by a GSM / GPRS ( NTRIP ) service provider, UHF base station or yourown base station on a known location. When your RTK receiver does not have a built in cellular modemto make connection to the Internet, but your computer does have an active Internet connection, you canuse the 'Hydromagic NTRIP Plugin' to feed RTCM correction data into your RTK receiver. When you aresurveying at a remote location without any data coverage, you can also use the "Post ProcessingKinematic" method.
You also need a local geoid model. This is a file containing geoid - ellipsoid separation values for thearea or country you are performing your survey.
Hydromagic ships with a couple of geoid models, including Belgium, the Netherlands and North America.Additional geoid models can be downloaded free of charge from the "geoid download page". If no geoidmodel is available for your area, please contact support for assistance.
To perform the calculation, you also need to know the exact distance between the receiving element ofyour RTK antenna and the water surface.
Receiver Output
To retrieve the ellipsoidal height from your RTK receiver, it should have an NMEA0183 data output,supporting either the $GPGGA or $PTNL,GGK sentence as shown in the examples below:
$PTNL,GGK,453049.0,0,3728.455440850,N,12215.253291068,W,3,9,2.0,EHT35.7424,M*
Trimble proprietary message for RTK position
$GPGGA,042629.00,3242.86076286,S,15133.15384408,E,4,12,1.1,6.573,M,26.799,M,1.0,0000*51
Standard NMEA0183 sentence for GPS or RTK fix data
When the Trimble proprietary NMEA0183 message is used, the ellipsoidal height is provided directly inthe sentence, in the example above it is in the ellipsoidal height (10) "EHT35.7424" field.
For standard NMEA0183, the ellipsoidal height is calculated from the M.S.L. (9) height and geoidalseparation (11) field. In this case the ellipsoidal height is calculated by using the formula below:In the example above, the ellipsoidal height is 6.573 + 26.799 = 33.372 meter.
Ellipsoidal Height = M.S.L. Height + Geoidal Separation
Formula for calculating ellipsoidal height from NMEA0183 GGA sentence

Recording Data 223
© 2009-2021 Eye4Software B.V.
Please note that the M.S.L. ( Mean Sea Level ) height value returned by the GPS is calculated using theglobal EGM96 geoid model, and isn't accurate enough to use for your surveys. This is why you have toprovide a local geoid model instead.
RTK Configuration
In order to configure Hydromagic to use RTK tides, open the preferences dialog by selecting"Preferences..." from the "Options" menu. To view the RTK configuration, click the "RTK" tab. Youshould see following dialog:
RTK settings tab in the preferences dialog.
To enable tide calculation, you have to check the "Use Real Time Kinematic (RTK) for real time tidecalculation" box. When checked, you can alter the other configuration options. First you have to enterthe height of the antenna above the water surface. Make sure to measure this distance as accurate aspossible, an error in this measurement is directly converted to an error in the tide level. Secondly, selectthe geoid model used in your area by clicking the "Select..." button.

Eye4Software Hydromagic 9.4224
© 2009-2021 Eye4Software B.V.
Click "Select" to choose a geoid model.
When finished configuring, just click "OK" to apply the settings.
Downloading additional geoid models
When selecting a geoid from the list, you may have noticed that some models are displayed in 'red' whileothers are displayed in 'black'. Geoid models that are displayed in 'black' are already installed becausethey were shipped with the Hydromagic installer. When you need to use a geoid model that is displayedin 'red', you have to download it first. To do so, right-click the model and select the 'Download and Install'option from the popup menu:
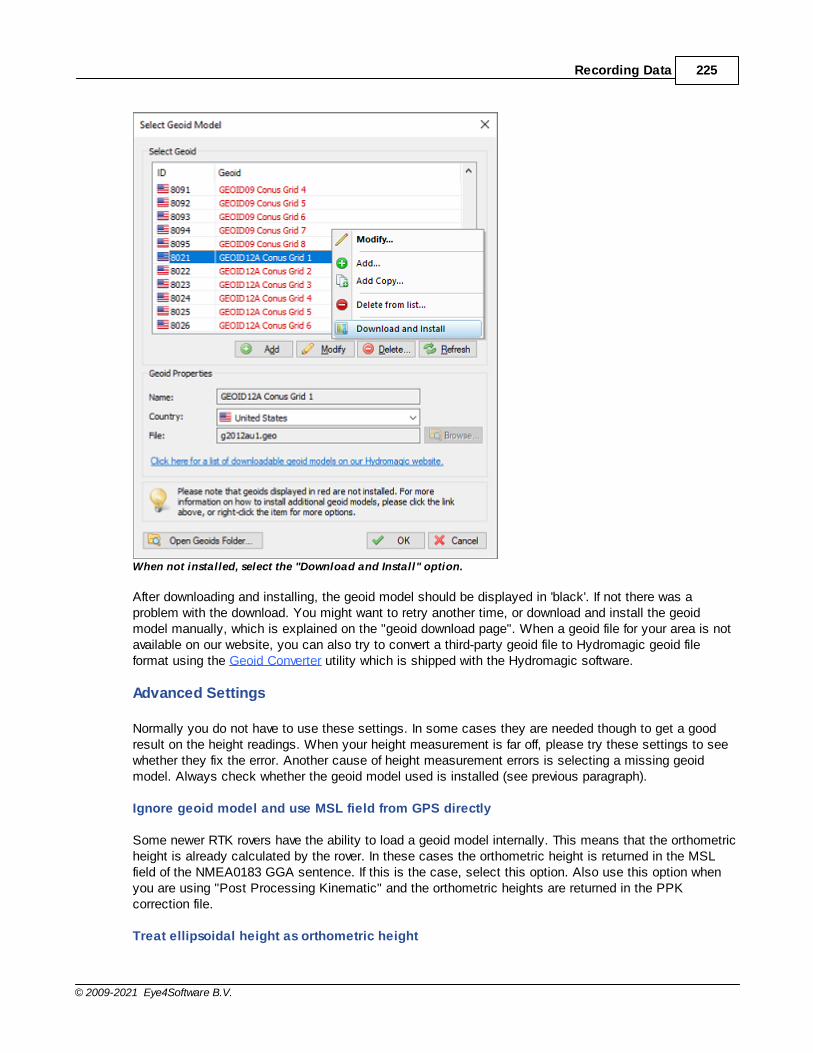
Recording Data 225
© 2009-2021 Eye4Software B.V.
When not installed, select the "Download and Install" option.
After downloading and installing, the geoid model should be displayed in 'black'. If not there was aproblem with the download. You might want to retry another time, or download and install the geoidmodel manually, which is explained on the "geoid download page". When a geoid file for your area is notavailable on our website, you can also try to convert a third-party geoid file to Hydromagic geoid fileformat using the Geoid Converter utility which is shipped with the Hydromagic software.
Advanced Settings
Normally you do not have to use these settings. In some cases they are needed though to get a goodresult on the height readings. When your height measurement is far off, please try these settings to seewhether they fix the error. Another cause of height measurement errors is selecting a missing geoidmodel. Always check whether the geoid model used is installed (see previous paragraph).
Ignore geoid model and use MSL field from GPS directly
Some newer RTK rovers have the ability to load a geoid model internally. This means that the orthometricheight is already calculated by the rover. In these cases the orthometric height is returned in the MSLfield of the NMEA0183 GGA sentence. If this is the case, select this option. Also use this option whenyou are using "Post Processing Kinematic" and the orthometric heights are returned in the PPKcorrection file.
Treat ellipsoidal height as orthometric height

Eye4Software Hydromagic 9.4226
© 2009-2021 Eye4Software B.V.
This options should be used when a total station is used which outputs XYZ data in a pseudoNMEA0183 GGA sentence. In this case no geoid model will be applied and the ellipsoid height field isused as orthometric height directly.
Testing RTK and geoid calculations
In order to test RTK tide calculations, connect and power on your RTK receiver and make sure you havea valid RTK fix. The next step is to check the values in the "Navigation Data" window. If this view isn'tvisible, you can activate it by selecting "Navigation Data" from the "View" menu.
You have to check the following:
§ The EHT (Ellipsoidal Height) is displayed in the data view. If missing, check the NMEA0183configuration of your RTK receiver.
§ When using the Trimble proprietary NMEA0183 sentence, the M.S.L. field can be 0.00.§ You should have RTK Fix in the GPS Information section.§ The RTK tide value is displayed in green.
Start recording

Recording Data 227
© 2009-2021 Eye4Software B.V.
When the conditions above match, you can just start a new recording and proceed with your survey.When generating a sounding from your raw data files, you will be able to correct the tide settings ifneeded.
5.5 Analyzing recorded raw data
Recording data
In Hydromagic all data coming in from devices (using plugins) is recorded into ASCII formatted, humanreadable raw data files. When performing a survey you might want to start with a single run and checkyour raw data first before collecting the rest of your data.
You can have a preview of the collected data using the data analysis window. When your sounder iscapable of recording the full echogram envelope (which is recorded as binary data for performancereasons), you might want to use the "Echogram Digitizer" tool to check this data as well.
Starting the data analysis window
The data analysis window does not have much more functionality then grouping data in separate tables.Data is displayed in a spreadsheet view and is provided with timestamps indicating the exact time thedata was received and stored (with one millisecond resolution).
To open a raw data file, to view its contents, locate the file by expanding the 'Raw Data' folder in the'Project Explorer' which should normally reside on the left part of the screen. Right-click the raw data fileyou want to analyze and select the 'Analyze Data...' option from the pop-up menu that appears at themouse cursor location.
Right click the raw file and select 'Analyze Data...' to view its contents.
Using the data analysis window - Depths
After starting the window, it first shows the collected echo sounder depth values. Please note thatHydromagic adds transducer draft before writing depths to the raw data file. This means that the depthsreported should be equal to the depth below the transducer with the static draft added to this value.

Eye4Software Hydromagic 9.4228
© 2009-2021 Eye4Software B.V.
Depth values recorded with a dual frequency echo sounder.
Please note, that when using a single frequency echo sounder, the low frequency column will containonly 'N/A' values.
At the bottom of the screen the name of the raw data file, raw data type as well as the recording date aredisplayed. To select other data to display, just click the 'Prev Data' and 'Next Data' buttons.
Using the data analysis window - Bottom Parameters
The second page which comes after the page containing the depth values contains bottom parameters.These parameters are recorded only by a couple of echo sounders, so you might notice that this screenmight contain no values.

Recording Data 229
© 2009-2021 Eye4Software B.V.
Bottom information values recorded with an Unabara Hydro-2F echo sounder.
Although this page isn't used by most customers, we decide it to place it directly after the depth pagebecause it is related to echo sounder information. Parameters that will be displayed here when availableinclude:
· Bottom Loss - High Frequency;· Bottom Loss - Low Frequency;· Reflectivity - High Frequency;· Reflectivity - Low Frequency;· Density - High Frequency;· Density - Low Frequency;· Porosity - High Frequency;· Porosity - Low Frequency;
Using the data analysis window - position data
The third page contains position information as recorded by your GNSS/RTK receiver or total station.When using RTK tides, you should have a valid Ellipsoid height value in the third column. If this field isempty or intermittent, please check your GPS configuration as your receiver is sending out incorrect, tooless or redundant NMEA0183 sentences.

Eye4Software Hydromagic 9.4230
© 2009-2021 Eye4Software B.V.
Position information containing height information recorded at 1Hz intervals.
The first two columns contain the position information like projected eastings and northings. Please notethat your raw data file contains geographic WGS84 positions as well. These are not displayed since theyare only used when reprojecting or importing the raw data file. Make sure that you have a valid position inthis table with an update rate of at least once per second.
Using the data analysis window - heading data
Heading information is required only when your echo sounder transducer is not at the exact horizontalposition as your GPS antenna. In this case it has to be present to be able to calculate the position offsetbetween the two sensors.
The first column shows true heading, which is in most times calculated by the GPS (only when moving )and send to the software using the VTG NMEA0183 sentence. When the second column is used, theheading is a magnetic heading provided by a (flux)compass, gyro or IMU.
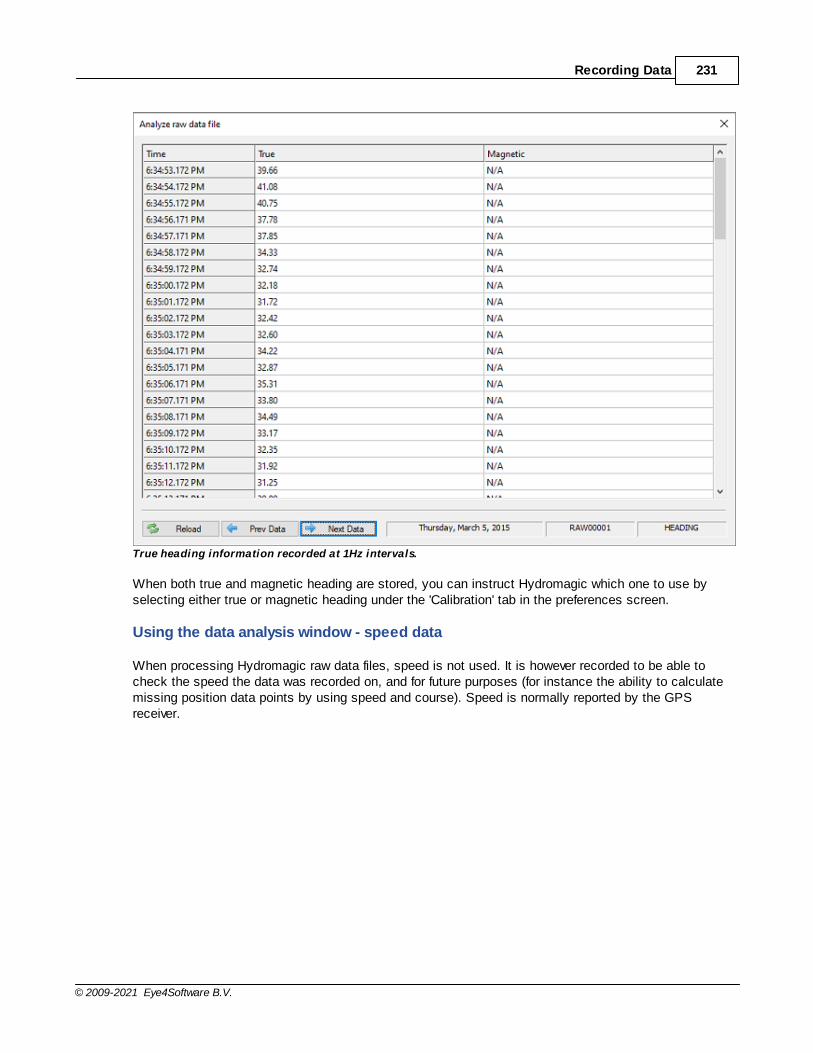
Recording Data 231
© 2009-2021 Eye4Software B.V.
True heading information recorded at 1Hz intervals.
When both true and magnetic heading are stored, you can instruct Hydromagic which one to use byselecting either true or magnetic heading under the 'Calibration' tab in the preferences screen.
Using the data analysis window - speed data
When processing Hydromagic raw data files, speed is not used. It is however recorded to be able tocheck the speed the data was recorded on, and for future purposes (for instance the ability to calculatemissing position data points by using speed and course). Speed is normally reported by the GPSreceiver.

Eye4Software Hydromagic 9.4232
© 2009-2021 Eye4Software B.V.
Speed information recorded at 1Hz intervals.
Using the data analysis window - GPS Quality
When using RTK to calculate tide levels, make sure that all GPS quality records have the 'RTK FIX'status before proceeding with your survey. When it switches between RTK FIX, RTK FLOAT and AUTO,it is possible that your radio link or cellular signal is lost sometimes, and you might want to fix this issuefirst.
This table also contains information on the number of satellites used in the position calculation, thedifferential beacon id used (for instance WAAS, EGNOS or LF Beacon) and the age of the correctiondata (in seconds). To have a look at the DOP data, you have to proceed to the next page by clicking the'Next Data' button.

Recording Data 233
© 2009-2021 Eye4Software B.V.
Check the GPS quality data for the fix status, especially when using RTK tides.
Using the data analysis window - DOP Values
DOP stands for Dilution Of Precision and is reported by a GNSS receiver to specify error propagation asa mathematical effect of navigation satellite geometry on positional measurement precision. Hydromagicstores three types of DOP values:
· HDOP - Horizontal Dilution Of Precision;· VDOP - Vertical Dilution Of Precision;· PDOP - Position Dilution Of Precision;
These three values are stored in the raw data file in order to have the ability to filter out erroneousposition records during data processing.

Eye4Software Hydromagic 9.4234
© 2009-2021 Eye4Software B.V.
Dilution Of Precision for the reported GPS position.
The horizontal dilution of precision is reported by the 'GGA' NMEA0183 sentence while all threesentences are reported by the 'GSA' sentence. This explains why there are sometimes records withoutthe VDOP/PDOP values in the example above (the records generated from the GGA sentence).
Using the data analysis window - Tide Data
Tide levels are in most cases calculated from the antenna elevation of a RTK receiver by using a fixedoffset and geoid model. When RTK tide is used, tide values are not stored inside the raw data file sincethey are calculated and applied when converting raw data to soundings.
When you have connected a tide receiver, or when you use the manual tide plugin to adjust the tide levelmanually during the survey, these values are written to the raw data file and will be displayed in the tidedata table.
Using the data analysis window - Motion Data
A motion sensor can be used to compensate for the motion of the vessel during the survey. The depthand position will be adjusted by using the heave, pitch and roll values received from the motion sensorduring post processing. Use this page to check the values sent by the motion sensor. Please note thatsome sensors only provide pitch and roll without heave.

Recording Data 235
© 2009-2021 Eye4Software B.V.
Heave, pitch and roll data reported by a motion sensor.
Using the data analysis window - Sound Velocity Data
By default echo sounders calculate the depth by using a speed of sound of 1500 meters per second. Insome cases, for instance at sea with salt water this value may differ. This can be corrected afterwardsduring post processing by using the sound velocity editor.
When connecting a sound velocity profiler or by using the Hydromagic Manual Sound Velocity pluginsound velocity corrections are stored into the raw data file. Sound velocity correction data collectedduring the survey will be displayed in this table.
Using the data analysis window - Annotation Marks
During a survey you can press the 'F8' key to store events or annotation marks in the raw data file. Thepurpose is to mark a special position on the map or echogram data.

Eye4Software Hydromagic 9.4236
© 2009-2021 Eye4Software B.V.
Annotation marks inserted into the echogram by the user.
Depending on the format defined for the annotation marks, an event with or without label is inserted intothe data. This table shows the times and labels for the annotation marks inserted.

Single beam processing 237
© 2009-2021 Eye4Software B.V.
6 Single beam processing
6.1 Getting Started
Single beam processing
In Hydromagic Survey version 6.0 and higher, recorded data is saved as 'raw data files'. To create filtered,corrected and synchronized sounding data, that can be used to calculate volumes, depth contours,digital terrain models and more, we need to process the previously recorded raw data files.
The sounding wizard
The sounding wizard is one of the most important tools in the Hydromagic Survey software. It allows youto convert one or more raw data files into (corrected) sounding files.
The sounding wizard leaves the original recorded data intact (in the "RawData" project folder) and createsa second set of data files to track all the changes you made (in the "Modified" project folder).
This method allows you to do corrections and filtering over and over again until you are fully satisfied withthe result. Might the data become corrupted, just instruct the wizard to start over with the original rawdata files.
Starting the sounding wizard
When you finished recording one or more raw data file(s)s, you can combine data from these files intosounding files. To do so, you have to select the "Generate Soundings..." option from the "Tools" menu.Alternatively, you can start this wizard by right clicking the "Raw Data" folder in the project tree andselecting the "Process Raw Data File(s)..." option from the pop up menu that appears as shown below:
Select the "Process Raw Data File(s)..." option from the pop up menu.
The introduction page of the sounding wizard

Eye4Software Hydromagic 9.4238
© 2009-2021 Eye4Software B.V.
You are now ready to create sounding files by performing a couple of steps which will be discussed inthe next chapters. The first page of the wizard tells you what to expect in the few next steps. Afterquickly reading this information, click "Next" to proceed to the raw data selection step.
The first page of the sounding wizard show some information on the steps to follow.
6.2 Selecting Files
Selecting Files
The next step in this process is selecting the raw data files you want to include in the process. Bydefault all visible files are selected. The first time you are running the sounding wizard on the raw datafiles, the "Start editing from original raw data" option is selected. This means that you want to startediting the files from scratch.
The second time you run the wizard, and you have made modifications, the "Continue editing modifiedraw data" option will be selected and you can further process your modified files. In case you want tostart over with the original raw survey data, just select the "Start editing from original raw data" option.
After selecting the files to process, click the "Next" button to proceed to the tide correction step.

Single beam processing 239
© 2009-2021 Eye4Software B.V.
Select which raw data set you want to process.
Modified Data
Please note that the original recorded raw data is never altered. All modifications are stored as a copy inthe "Modified" folder of your projects folder on the hard disk. When you choose to start editing theoriginal raw data, the modified data of the previous sessions will be overwritten, thus rolling back all yourprevious (modification and filtering) actions in this wizard.

Eye4Software Hydromagic 9.4240
© 2009-2021 Eye4Software B.V.
The original recorded data and modified data files are kept in separate folders.
6.3 Tide Correction
Tide correction settings
The next step in the conversion process is to specify whether and how the sounding needs to becorrected for tides. We will discuss the different tide options below. When you are not in a tidal area oronly depth values are required (not elevations), you can select the first option ("Do not use tidecorrections"), and click the "Next" button to proceed to the sound velocity and dynamic draft correctionspage.

Single beam processing 241
© 2009-2021 Eye4Software B.V.
On the third page of the wizard you can configure the tide or vertical datum settings.
Option #1 - Do not use tide corrections, do not alter depth values
When the survey data collected is not related to tidal fluctuations, and you do not have to measureagainst a local vertical datum such as NAVD88, you can use this option. With this option selected thesoundings will copied to the sounding file(s) as they are without tide correction. In your final products youcan only export depth values, not elevations.
Option #2 - Use tide gauge or manual measurements as stored in raw data file
If a tide gauge is used, you have to select the "Use tide gauge measurements" option. With this optionselected, Hydromagic will use tide adjustments recorded in the raw data file (by a plugin communicatingwith a tide gauge). You should also use this option when you did use the "Hydromagic Manual Tideplugin" to store tide measurements during your survey.
Use the second option when the "Hydromagic M anual Tide Plugin" has been used.

Eye4Software Hydromagic 9.4242
© 2009-2021 Eye4Software B.V.
Option #3 - Elevation from RTK receiver or total station are orthometric heights
When calculating the tide level with RTK, Hydromagic expects the elevation data stored in the raw datafile to be relative to the WGS84 ellipsoid. To convert this elevation to the local datum, a geoid model willbe applied when converting the raw data into a sounding file. In some cases this is unwanted behavior:
· When the RTK receiver is reporting elevation data relative to the local datum (when a geoid modelhas been loaded in the receiver);
· When a total station has been used, since they report the elevation relative to the local datum.
In these cases, you must select the third option in order to prevent from the geoid model to be appliedtwice. When this option has been selected, the geoid model configured in Hydromagic will be ignored.When set, the antenna height will still be applied.
When using this option, you have to let the software know which elevation from NMEA0183 data sent bythe RTK receiver or total station we need to use. More information about these fields can be found on theRTK Tide Corrections page.
You can have a look at the raw data files to see which of the fields contain the correct elevation value byusing the data analysis window:
Use the raw data analysis window to check which data field contains the correct elevation value.
Option #4 - Use tide correction file

Single beam processing 243
© 2009-2021 Eye4Software B.V.
When you want to use tide corrections without special hardware such as a RTK receiver or tide gauge,select this option.It allows you to create a tide correction file where you can enter the tide observations made during thesurvey manually, or use the tide prediction tool to generate a tide file.
You can start the tide file editor by clicking the "Editor..." button, or just select an existing Hydromagictide file by clicking the "Browse..." button.
Use the "Tide File Editor" to generate or modify a Hydromagic tide file.
Option #5 - Use geoid model
When using a RTK receiver the tide level of the water you are surveying is calculated by using the highprecision elevation data corrected by the selected geoid model and antenna height. This only workswhen your RTK receiver is in RTK fix mode, or when the collected position data is post-processed usingPPK.
When using this setting, the geoid model and antenna height as configured in the "RTK" tab of thepreferences window will be applied. These global RTK settings are also displayed on this wizard page(marked in red in the image below):

Eye4Software Hydromagic 9.4244
© 2009-2021 Eye4Software B.V.
When option #5 is selected, the global RTK settings will be used.
6.4 Tide File Editor
Tide File Editor
In Hydromagic, the tide observations file editor utility is used to create, alter or import tide files. Tide filesinclude time and tide level information, and can be used to correct soundings (or convert to a localvertical datum).
The tide observations file editor is part of the "Sounding Wizard", and can be found on the "TideCorrection" page. This is the third page in the wizard an lets you select the preferred tide method used togenerate tide corrected soundings.

Single beam processing 245
© 2009-2021 Eye4Software B.V.
To use a tide correction file, select the "Use tide correction file" option in the "Sounding Wizard".
Starting the tide file editor utility
To start the tide file editor, you have to set the tide method in the wizard to "use tide correction file". The"Editor..." and "Browse..." buttons will now be enabled. To start the editor, just click the "Editor..."button.

Eye4Software Hydromagic 9.4246
© 2009-2021 Eye4Software B.V.
Screenshot of the tide observations file editor with a tide file loaded.
Tide file editor toolbar
All functions of the editor can be accessed through the toolbar at the bottom of the window.The table below shows the function of the various buttons.
Button Function
Load tide observations from an existing Hydromagic tide file.
Save tide observations to a Hydromagic tide file.
Modify the selected tide observation.
Add a new tide observation to the table.
Insert a new tide observation to the table before the selected record.
Generate multiple tide observations with a specified level, interval, begin and endingtime.
Start the importing tool to import tide observation data from an ASCII file.
Remove the selected tide observation.
Remove all tide observations (clear data).
Undo the latest operation.
Redo the latest undone operation.
Reload the table and graph.
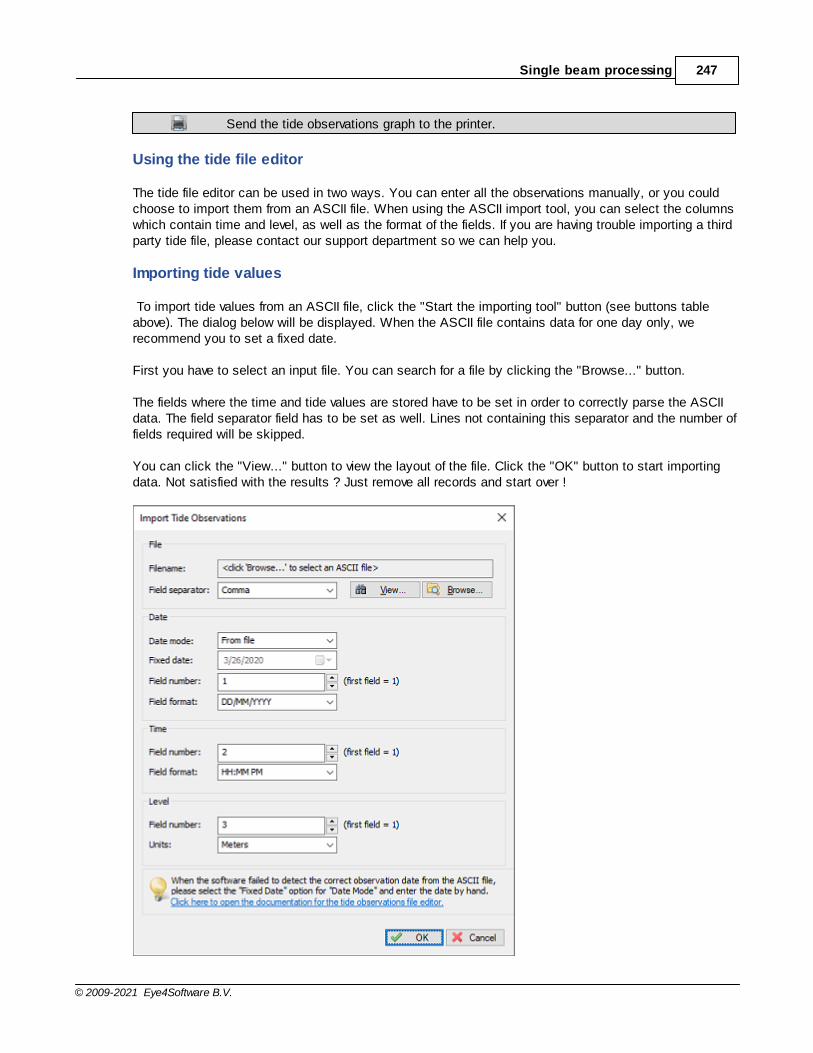
Single beam processing 247
© 2009-2021 Eye4Software B.V.
Send the tide observations graph to the printer.
Using the tide file editor
The tide file editor can be used in two ways. You can enter all the observations manually, or you couldchoose to import them from an ASCII file. When using the ASCII import tool, you can select the columnswhich contain time and level, as well as the format of the fields. If you are having trouble importing a thirdparty tide file, please contact our support department so we can help you.
Importing tide values
To import tide values from an ASCII file, click the "Start the importing tool" button (see buttons tableabove). The dialog below will be displayed. When the ASCII file contains data for one day only, werecommend you to set a fixed date.
First you have to select an input file. You can search for a file by clicking the "Browse..." button.
The fields where the time and tide values are stored have to be set in order to correctly parse the ASCIIdata. The field separator field has to be set as well. Lines not containing this separator and the number offields required will be skipped.
You can click the "View..." button to view the layout of the file. Click the "OK" button to start importingdata. Not satisfied with the results ? Just remove all records and start over !
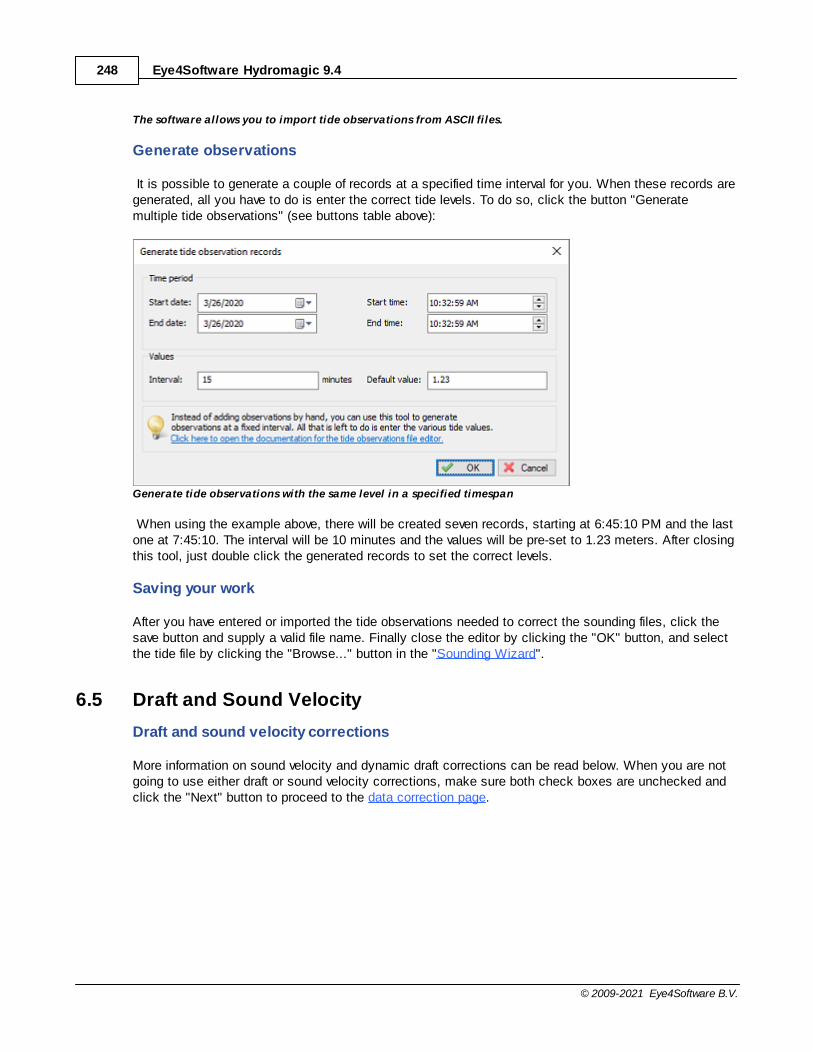
Eye4Software Hydromagic 9.4248
© 2009-2021 Eye4Software B.V.
The software allows you to import tide observations from ASCII files.
Generate observations
It is possible to generate a couple of records at a specified time interval for you. When these records aregenerated, all you have to do is enter the correct tide levels. To do so, click the button "Generatemultiple tide observations" (see buttons table above):
Generate tide observations with the same level in a specified timespan
When using the example above, there will be created seven records, starting at 6:45:10 PM and the lastone at 7:45:10. The interval will be 10 minutes and the values will be pre-set to 1.23 meters. After closingthis tool, just double click the generated records to set the correct levels.
Saving your work
After you have entered or imported the tide observations needed to correct the sounding files, click thesave button and supply a valid file name. Finally close the editor by clicking the "OK" button, and selectthe tide file by clicking the "Browse..." button in the "Sounding Wizard".
6.5 Draft and Sound Velocity
Draft and sound velocity corrections
More information on sound velocity and dynamic draft corrections can be read below. When you are notgoing to use either draft or sound velocity corrections, make sure both check boxes are unchecked andclick the "Next" button to proceed to the data correction page.

Single beam processing 249
© 2009-2021 Eye4Software B.V.
When applicable, setup sound velocity and dynamic draft corrections on this page.
Sound velocity corrections
An echosounder calculates depth by sending a pulse and measuring the time it takes to get to theocean floor and back. With this time and the speed of sound through the water, the depth is calculated.
For fresh water, the speed of sound is 1500 meters per second, however, for salt water this speeddepends on the salinity, temperature and depth (pressure). Using the sound velocity correction optionyou can correct your sounding for salt water. Please do not use this function if this correction is alreadyused in the echosounder. To generate a sound velocity correction file, click the "Editor..." button to startthe sound velocity file editor.

Eye4Software Hydromagic 9.4250
© 2009-2021 Eye4Software B.V.
Use the sound velocity editor to generate or alter sound velocity profile files when applicable.
Dynamic draft corrections
Dynamic draft corrections can be used to correct the downwards motion of the ship.
For instance, when using a speedboat, you may notice that when the speed increases, the rear of theship lowers while the front raises. This is what we call dynamic draft, and depends on the speed of thevessel. You can correct for this motions by creating dynamic draft correction table (speed versus draft).To generate a dynamic draft correction file, click the "Editor..." button to start the dynamic draftcorrection file editor.

Single beam processing 251
© 2009-2021 Eye4Software B.V.
Use the dynamic draft editor to generate or alter dynamic draft profile files when applicable.
6.6 Dynamic draft correction file editor
Dynamic Draft Correction Editor
The purpose of the dynamic draft correction editor is to alter or dynamic draft correction profile files whichcan be used by Hydromagic to correct soundings. When surveying using RTK tides, you don't have tocorrect for dynamic draft.
Dynamic draft corrections
After starting the dynamic draft correction editor, you will start with a blank profile. You can add newrecords to this profile or open an existing profile file for modification. You can open or save file via the"File" menu. When opening the example dynamic draft file which ships with the Hydromagic("example.dft"), the editor should look like this:
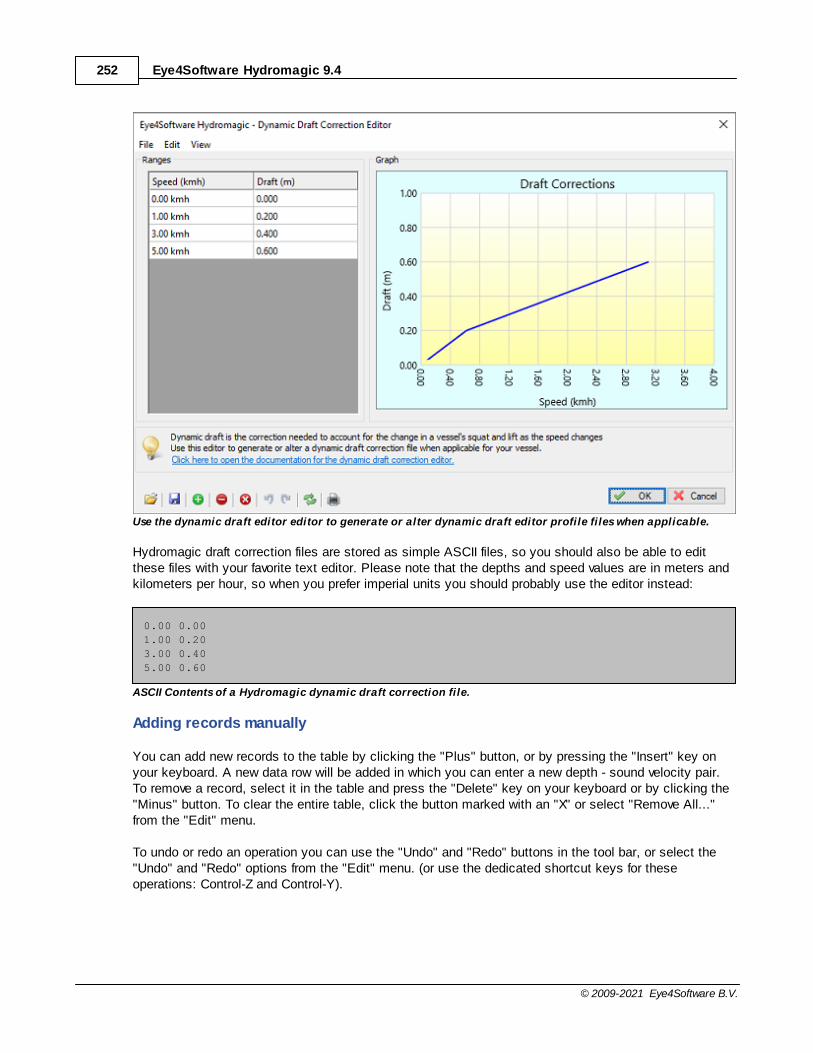
Eye4Software Hydromagic 9.4252
© 2009-2021 Eye4Software B.V.
Use the dynamic draft editor editor to generate or alter dynamic draft editor profile files when applicable.
Hydromagic draft correction files are stored as simple ASCII files, so you should also be able to editthese files with your favorite text editor. Please note that the depths and speed values are in meters andkilometers per hour, so when you prefer imperial units you should probably use the editor instead:
0.00 0.00
1.00 0.20
3.00 0.40
5.00 0.60
ASCII Contents of a Hydromagic dynamic draft correction file.
Adding records manually
You can add new records to the table by clicking the "Plus" button, or by pressing the "Insert" key onyour keyboard. A new data row will be added in which you can enter a new depth - sound velocity pair.To remove a record, select it in the table and press the "Delete" key on your keyboard or by clicking the"Minus" button. To clear the entire table, click the button marked with an "X" or select "Remove All..."from the "Edit" menu.
To undo or redo an operation you can use the "Undo" and "Redo" buttons in the tool bar, or select the"Undo" and "Redo" options from the "Edit" menu. (or use the dedicated shortcut keys for theseoperations: Control-Z and Control-Y).

Single beam processing 253
© 2009-2021 Eye4Software B.V.
Double-click on a table cell to alter its contents.
Saving the correction file
When all speed - draft correction pairs have been entered into the table, select the "Save..." option fromthe "File" menu. After saving the file, it can now be selected in the sound velocity and dynamic draftcorrections page.
6.7 Correcting Data
Correcting data
The sounding wizard offers a large collection of tools to correct your raw data files. It contains a datafiltering utility, echogram editor, position editor and much more. After correcting all raw data files, clickthe "Next" button to proceed to the final step.

Eye4Software Hydromagic 9.4254
© 2009-2021 Eye4Software B.V.
The data correction page of the sounding wizard offers multiple tools to correct your raw data.
Option #1 - Filter your data
Use the filtering utility to filter unwanted or out-of-range data from your raw data files by supplying a rangeof valid values for the different data types. It is recommended to use this function to remove peaks andzero's from your sounding data before you edit the sounding using the echogram editor.
Option #2 - Edit echogram(s)
The echogram editor allows you to remove spikes, null soundings and other errors directly from theechogram. All you have to do is select the invalid data and click the "remove selection" button.
Option #3 - Edit position data
The position editor can be used to remove invalid (GNSS) position fixes from the raw data. You can alsouse this tool to remove any data which is outside of a predefined boundary.
Option #4 - Other tools
By clicking the "Tools..." button, a second screen is displayed with a collection of miscellaneous tools,including: device latency correction, time correction, manual editing, PPK processing and offsets.
6.8 Filter Tool
Raw data filtering tool
Using the "Raw Data Filtering" tool should be your first step in order to clean your data. By removingobvious errors in measurement data, such as depth values lower then your static draft (echo sounder

Single beam processing 255
© 2009-2021 Eye4Software B.V.
offset), or position observations calculated when, for example, the RTK fix was lost, you save yourselfvaluable time in the next step of the data cleansing process.
Use the "Raw Data Filtering" tool to remove records with out of range values from your raw data file(s).
Position data
You can use this option to filter out unreliable position data. This is especially important when theelevation data reported by your GNSS receiver is used to calculate tide levels. To enable this filter, checkthe "Filter position data" check box first. When enabled, you can enter maximum values for the dilutionof precision data as well as the minimum satellite count and GNSS fix quality.
When your project relies on RTK-Fixed position data, you might want to delete all position records whichare generated while the RTK-fix was temporarily lost. If this is the case, it is recommended to select"RTK Fixed" option for the "minimum fix status" setting. Please do not use this filter when you plan tocorrect your positions with PPK (Post Processing Kinematic).
Depth data
It is recommended to use this option before the echogram editor, because you can use this to filter outspikes and zero values. Just check the "Filter depth data" checkbox and enter the minimum andmaximum expected depth for the low and high frequency soundings.
Motion data
You only need this feature when using a motion sensor for pitch, roll and heave. Check the "Filter motiondata" checkbox and enter the maximum angles for pitch and roll, and the expected range for the heave

Eye4Software Hydromagic 9.4256
© 2009-2021 Eye4Software B.V.
corrections received from either the echo sounder or motion sensor. Skip this option when no motionsensor was used during the survey.
Start Filtering
When all options have been configured, just click the "Apply" button to start the filtering process. Whenone of the filters has been applied, a new modified raw data file is written in the "Modified" folder in yourproject root.
6.9 Echogram Editor
Echogram editor
The echogram editor is the most powerful tool in Hydromagic to remove sounding errors by using anechogram. Because an echogram is displayed, which shows the relation between time and depth, youcan easily see which data does not make sense and take appropriate actions.
In the echogram editor you have the following tools to clean the echo sounder data:
· Range filter - similar to the one in the filter tool· Data selection and remove - select data to remove using the mouse;· Median filter - use a "median filter" to filter out small spikes and smooth the data;· Mean filter - use a mean filter to filter out small spikes and smooth the data;
The example below shows an echogram before filtering. In this example we will first filtered out the zerovalues using the range filter, then the largest spikes will be removed using the mouse and finally themedian filter will be applied to smooth the data.
Example of an echogram with lots of spikes and noise.
Range Filter
When you didn't apply this filter by using the filter tool, you can filter out of range data from within theechogram editor as well, otherwise you can skip this step and proceed to the removing of the spikesusing your mouse.

Single beam processing 257
© 2009-2021 Eye4Software B.V.
Looking at the example above, as you can see there are spikes starting at 0.00 meters, which areobviously measurement errors (the echo sounder couldn't detect the bottom so it returned zero depthinstead). To filter the data by range, click the small arrow next to the left-most button and select the first"Range Filter..." option, or the second to apply the filter to all selected raw data files.
Use the range filter tool to filter out spikes starting at zero.
Now enter the minimum and maximum allowed depths. Especially the minimum depth is important here:For the minimum depth value it is recommended to set the static draft (echo sounder offset) plusapproximately 0.3 meter (or 1 feet), since most echo sounders are unlikely to report (accurate) depthsbelow this value. For instance, when the distance between the transducer and the waterline is 0.60meter, add 0.90 meter as lowest possible value.
Select the minimum and maximum allowed depth values.
Click "OK" to apply the filter. Changes should be visible in the echogram immediately:

Eye4Software Hydromagic 9.4258
© 2009-2021 Eye4Software B.V.
Spikes starting at the water surface are now removed thanks to the range filter.
Removing the remaining spikes by hand
The remaining spikes can be removed by hand. Just remove spikes which are larger then a couple ofmillimeters on the screen: small spikes will be smoothed out when applying the median filter after thisstep. When using a dual frequency echo sounder, it is recommended to remove the spikes for onechannel at a time. You can switch between "Low Frequency", "High Frequency" and "Dual Frequency"by clicking the boxes at the bottom of the window. When dual frequency is selected, you can select bothlow and high frequency spikes or data for deletion, when working on a single channel, only the dataselection for this channel will be deleted.
When you accidentally removed too much data, just click the "Undo" button or press "Control"+"Z" onyour keyboard to undo the last step. In the unlikely scenario that everything has been lost beyond repair,just go to the file selection page and choose the "Start editing from original raw data" option to start fromthe original raw data.
To remove a single or a collection of spikes, click and hold the right mouse button and draw a rectanglearound the 'peaks' of the spikes. To make thinks easier, you can use the scroll wheel on your mouse tozoom in and out on the data, so you can select with more accuracy.
When the selection seems okay, just press the "DEL" key on your keyboard to remove the data, or clickthe second left-most button in the echogram editor's tool bar. Repeat this step until you are satisfied withthe result.
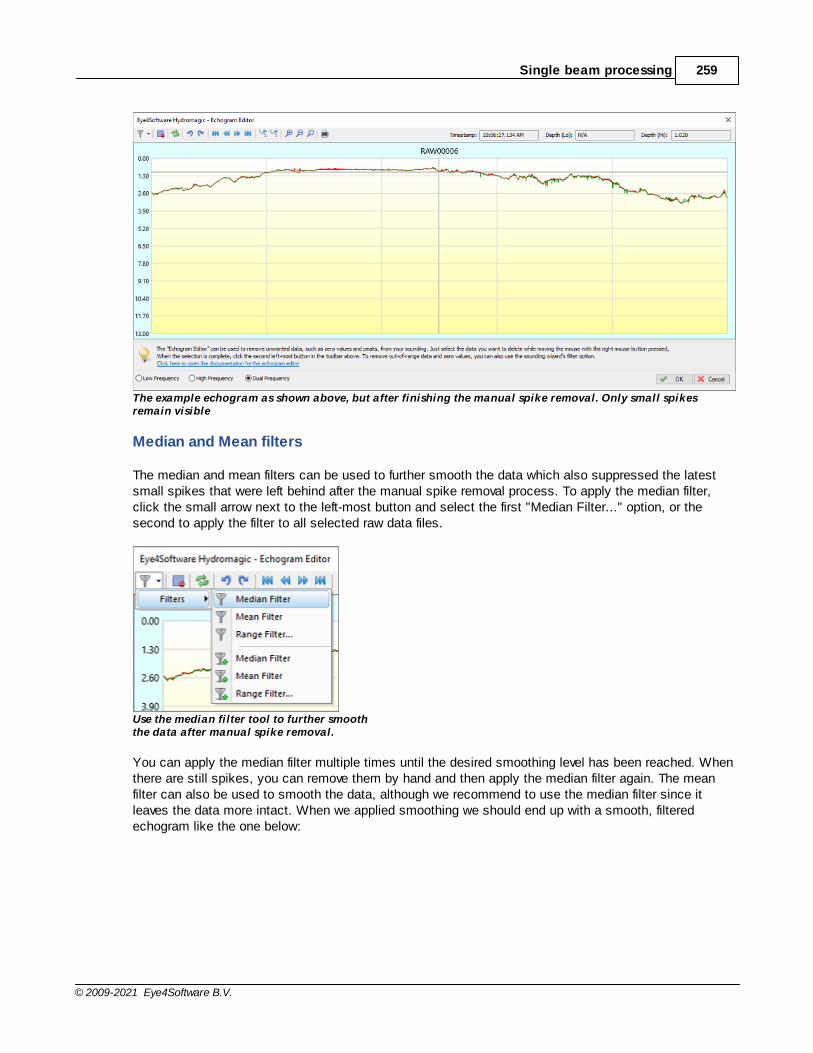
Single beam processing 259
© 2009-2021 Eye4Software B.V.
The example echogram as shown above, but after finishing the manual spike removal. Only small spikesremain visible
Median and Mean filters
The median and mean filters can be used to further smooth the data which also suppressed the latestsmall spikes that were left behind after the manual spike removal process. To apply the median filter,click the small arrow next to the left-most button and select the first "Median Filter..." option, or thesecond to apply the filter to all selected raw data files.
Use the median filter tool to further smooth the data after manual spike removal.
You can apply the median filter multiple times until the desired smoothing level has been reached. Whenthere are still spikes, you can remove them by hand and then apply the median filter again. The meanfilter can also be used to smooth the data, although we recommend to use the median filter since itleaves the data more intact. When we applied smoothing we should end up with a smooth, filteredechogram like the one below:

Eye4Software Hydromagic 9.4260
© 2009-2021 Eye4Software B.V.
Same echogram as the first example on this page, but after filtering, spike removal and smoothing.
Echogram editor tool bar
(a) - Remove Selection
To remove spikes and zero value, you can select the data by clicking and holding the right mousebutton.When the invalid data has been selected, click this button to remove it from the data file.
(b) - Filter echogram (remove spikes!)
Use one of the built in data smoothing and filtering to remove spikes and noise from the data.Supported filter algorithms include median and mean filtering.
(c) - Reload echogram
Reload the echogram from disk
(d) - Undo operation
Use this button when you removed data by accident. This button undoes the last operation.
(e) - Redo operation
Redo an operation which has been undone.
(f) - Scroll to begin
Scroll to the beginning of the echogram, only available when zoomed in.

Single beam processing 261
© 2009-2021 Eye4Software B.V.
(g) - Scroll back
Scroll back one screen, only available when zoomed in.
(h) - Scroll forward
Scroll forward one screen, only available when zoomed in.
(i) - Scroll to end
Scroll to the end of the echogram, only available when zoomed in.
(j) - Select the previous data file
Select to the previous raw data file in the collection of files you are currently editing.
(k) - Select the next data file
Select to the next raw data file in the collection of files you are currently editing.
(l) - Zoom In
Zoom in on the data which is currently visible.
(m) - Zoom Out
Zoom out on the data which is currently visible.
(n) - Zoom All
Reset all zoom operations, shows all data in the file.
(o) - Print echogram
Send the current echogram view to a printer or plotter.
6.10 Position Editor
Position editor
The position editor allows you to quickly remove any unwanted or erroneous position fixes from a rawdata file. You can also use this tool to quickly remove any data which is outside the project's boundariesand no longer needed.

Eye4Software Hydromagic 9.4262
© 2009-2021 Eye4Software B.V.
Use the position editor to remove unwanted or erroneous position data from a raw data file.
The position editor is part of the "Sounding Wizard" and can be found on the the data correction page. Tostart the position editor, just click the "Edit..." button in the "Edit position data" section shown below:

Single beam processing 263
© 2009-2021 Eye4Software B.V.
The position editor can be found on the data correction page of the "Sounding Wizard".
Using the position editor
Using the position editor is very easy. Just select the positions you want to remove with the mouse withthe right button pressed. When the selection is done, click the remove "selection button" to remove theunwanted positions from the raw data file.
When done editing the positions or GPS fixes, click the "OK" button to save your changes. To discard,click "Cancel". When positions has been removed, a new modified raw data file is written in the"Modified" folder in your project root.
Position editor toolbar
(a) - Remove Selection
To remove invalid or out of bounds GPS positions, you can select the data by moving the mouse whilepress and holding the right button.When the invalid data has been selected, click this button to remove it from the data file.
(b) - Reload positions
Reload the GPS positions from disk.
(c) - Undo operation

Eye4Software Hydromagic 9.4264
© 2009-2021 Eye4Software B.V.
Use this button when you removed data by accident. This button undoes the last operation.
(d) - Redo operation
Redo an operation which has been undone.
(e) - Select the previous data file
Select to the previous raw data file in the collection of files you are currently editing.
(f) - Select the next data file
Select to the next raw data file in the collection of files you are currently editing.
(g) - Toggle panning
When the panning mode has been selected, you can drag the map around with your mouse cursor whileholding the left mouse button.
(h) - Zoom in
Zoom in on the data which is currently visible.
(i) - Zoom out
Zoom out on the data which is currently visible.
(j) - Zoom all
Reset all zoom operations, shows all data in the file.
(k) - Print echogram
Send the current echogram view to a printer or plotter.
(l) - File indicator
Show the name of the file you are currently editing. To change the file, click the 'e' or 'f' button.
(m) - Position display
Displays the X or easting position of the mouse cursor.
(n) - Position Display
Displays the Y or northing position of the mouse cursor.
6.11 Miscellaneous Tools
Miscellaneous processing tools

Single beam processing 265
© 2009-2021 Eye4Software B.V.
The "data processing tools collection" can be opened by clicking the "Tools..." button in the datacorrection step of the "generate sounding wizard". A screen with an overview of the various processingtools is displayed and should look like the screenshot below:
The (advanced)processing tools collection part of the "Sounding Wizard".
Latency Adjustment
Use the latency utility to correct your raw data and sounding for latency errors after data has beencollected. You can set a latency for a device, or adjust a latency which has been set during the survey.Click the "Latency..." button to start the "Latency Adjustment Tool".
Fix latency errors with the latency adjustment tool.
Time Adjustment

Eye4Software Hydromagic 9.4266
© 2009-2021 Eye4Software B.V.
Use the time utility to correct the timestamps in your raw data file(s). This can be useful after surveyingwith an invalid time setting in your PC, or when transferring data into another timezone. Click the"Time..." button to start the "Time Adjustment".
Fix time(zone) setting errors with the time adjustment tool.
Offsets
Use the offsets utility to apply offset(s) to depth, elevation, tide or heave values for one or multiple rawdata files. Click the "Offsets..." button to start the "Offsets tool".

Single beam processing 267
© 2009-2021 Eye4Software B.V.
Use the offsets utility to apply various offsets to your raw data files.
Table Editor
Use the table editor to edit records manually, or to delete ranges of records. Because manual processingtakes a lot of time, this is the last option to use. Click the "Edit..." button to start the "Table Editor".

Eye4Software Hydromagic 9.4268
© 2009-2021 Eye4Software B.V.
Use the table editor to manually alter or delete data.
PPK Processing
The PPK Processing tool can be used to replace low-accuracy position data in your raw data files withsub-centimeter accuracy position data by applying "Post Processing Kinematic" files generated by forinstance the free "RTKLib" software package. Click the "Process..." button to start the "PPK ProcessingTool".
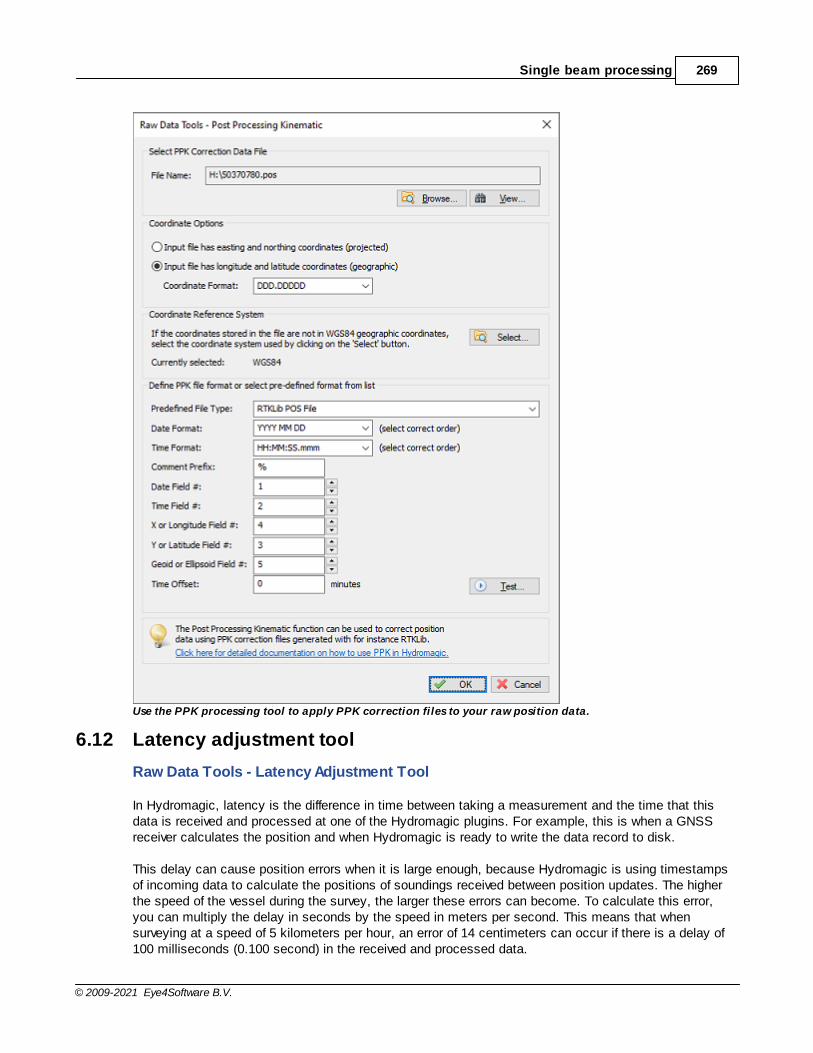
Single beam processing 269
© 2009-2021 Eye4Software B.V.
Use the PPK processing tool to apply PPK correction files to your raw position data.
6.12 Latency adjustment tool
Raw Data Tools - Latency Adjustment Tool
In Hydromagic, latency is the difference in time between taking a measurement and the time that thisdata is received and processed at one of the Hydromagic plugins. For example, this is when a GNSSreceiver calculates the position and when Hydromagic is ready to write the data record to disk.
This delay can cause position errors when it is large enough, because Hydromagic is using timestampsof incoming data to calculate the positions of soundings received between position updates. The higherthe speed of the vessel during the survey, the larger these errors can become. To calculate this error,you can multiply the delay in seconds by the speed in meters per second. This means that whensurveying at a speed of 5 kilometers per hour, an error of 14 centimeters can occur if there is a delay of100 milliseconds (0.100 second) in the received and processed data.

Eye4Software Hydromagic 9.4270
© 2009-2021 Eye4Software B.V.
When you have the option to measure this delay, you can enter it in the plugin settings. In case youdiscover the delay after the survey is completed, you can use the latency adjustment tool to correct itafterwards.
The latency adjustment tool is part of the "Sounding Wizard" and can be found on the raw dataprocessing tools page. To start the position editor, just click the "Latency..." button in the "Latency"section as shown below:
The latency adjustment tool can be found on the data correction page of the "Sounding Wizard".
Detecting latency for your GNSS receiver
Detecting latency for your GNSS receiver is the easiest. Make sure to enable the "ZDA" NMEA0183sentence and compare the time this message has been received with the time from your computer. Notethat this only works if your computer is synchronized with a time server. You can use the "Show Trace"button to view the incoming NMEA0183 data in the original raw data file:
3/18/2020|2:40:53.019 PM|$GPZDA,134053.020,18,03,2020,00,00*5E
3/18/2020|2:40:54.010 PM|$GPGGA,134054.00,5232.58150816,N,00602.11427370,E,1,7,1.3,3.852,M,46.917,M,,*5E
3/18/2020|2:40:54.026 PM|$GPZDA,134054.020,18,03,2020,00,00*59
3/18/2020|2:40:55.015 PM|$GPGGA,134055.00,5232.58224474,N,00602.11427476,E,1,6,2.0,4.391,M,46.917,M,,*54
3/18/2020|2:40:55.015 PM|$GPZDA,134055.020,18,03,2020,00,00*58
3/18/2020|2:40:56.006 PM|$GPGGA,134056.00,5232.58224721,N,00602.11427776,E,1,6,2.0,4.392,M,46.917,M,,*54
3/18/2020|2:40:56.022 PM|$GPZDA,134056.020,18,03,2020,00,00*5B
3/18/2020|2:40:57.012 PM|$GPGGA,134057.00,5232.58224632,N,00602.11428281,E,1,6,2.0,4.403,M,46.917,M,,*5B
Example of some ZDA NM EA0183 sentences recorded with a Trimble GNSS receiver.
As you can see in the example above, the difference between the GNSS clock and the PC clock is up to6 milliseconds (position error of 8 mm at 5 km / h). So you don't need to correct it. When you encounterhigher values, calculate the average and use it for GNSS latency. Note that there will be a larger errordue to time zone differences. Only compare the seconds values, as underlined in the example above !

Single beam processing 271
© 2009-2021 Eye4Software B.V.
Detecting latency for your echo sounder
The latency for an echo sounder may be more difficult to determine. The method often used is bysurveying a slope in two directions (forward and backward). When you record and display this on themap, the depth values for the forward and backward direction should match when latency is set correctly.Run this tool and increment the latency value for your sounder until you get the best results. It isimportant to check the generated soundings for the result.
Adjusting latency values
In Hydromagic raw data files, the timestamp and latency values are stored separately. This means thecurrent latency setting is known, and you can adjust it with the possibility to undo the setting. Thelatency adjustment tool allows you to set the latency for position, depth and motion data separately:
Fix latency errors with the latency adjustment tool.
You can click the "Prev" and "Next" buttons to step through the various raw data files to see the currentsettings. The second pair of "Prev" and "Next" buttons can be used to select the raw data type (position,depth or motion). If you want to apply the new latency setting to all raw data files, you must check the"Apply to all modified raw data" option.
In order to see the result of the correction, generate sounding(s) and check the results in the map viewer.When the result gets worse, decrease the latency, otherwise increase the latency. After changing thelatency values of one or more raw data files, the changes are saved in the "Modified" raw data folder. Thisdoes not affect your original survey data.

Eye4Software Hydromagic 9.4272
© 2009-2021 Eye4Software B.V.
Example Hydromagic raw data file with latency for echo sounder set to 25 milliseconds.
6.13 Time adjustment tool
Raw Data Tools - Time Adjustment Tool
The time adjustment tool can be used to shift the timestamps in the raw data files with a specifiedamount. You can apply the shift to a selection of raw data files or raw data types, like position, depth,motion, tide, heading, speed or sound velocity. Most probably, you are going to use this tool for one ofthe following scenarios:
· While recording data, the time or timezone of your computer was set incorrectly;· One of the devices used built in time stamps, but the time zone used was wrong;· After importing raw data files without setting the proper date.
When data has been shifted in time, it is impossible for the "Sounding Wizard" to combine the data togenerate soundings. This is especially true in cases where you want to apply a tide observation or postprocessing kinematic correction file on a dataset which has the timestamps wrong. This is where thetime adjustment tool comes to the rescue.
The Time adjustment tool is part of the "Sounding Wizard" and can be found on the raw data processingtools page. To start the position editor, just click the "Time..." button in the "Time" section as shownbelow:

Single beam processing 273
© 2009-2021 Eye4Software B.V.
The time adjustment tool can be found on the data correction page of the "Sounding Wizard".
Adjusting Time
To apply a time shift, just enter the values for hours, minutes, seconds and milliseconds and select thedirection (forward to add the selected amount of time to the timestamps, or backward to subtract). Withthe "Select..." buttons you can select the raw data file(s) and raw data type(s) to apply the timeadjustment to.
After changing the timestamp values of one or more raw data files, the changes are saved in the"Modified" raw data folder. This does not affect your original survey data.

Eye4Software Hydromagic 9.4274
© 2009-2021 Eye4Software B.V.
Fix time(zone) setting errors with the time adjustment tool.
6.14 Apply Offsets
The "Apply Offsets" tool can be used to apply fixed offsets to a couple of verticalmeasurements,including depth, tide, mean see level, ellipsoidal height and heave.
The tool can be used to correct or inverse motion sensor data as well.
To start applying offsets to your data, click the "Offsets" button from the "Data processing toolscollection" screen, which can be opened by clicking the "Tools..." button on page 5 of the soundingwizard.

Single beam processing 275
© 2009-2021 Eye4Software B.V.
Configuring offset options
Depth
Use the "Depth (Hi)" and "Depth (Lo)" fields to correct the measured depth. You can use this functionwhen you created a sounding without, or with an incorrect transducer offset.
Tide
Use the "Tide" field to apply a fixed offset to the tide values. This function can be used to apply a fixedtide, or to correct your tide receiver or RTK tide measurements.
Mean Sea Level
Eye4Software Hydromagic 9.4276
© 2009-2021 Eye4Software B.V.
Use the "Mean Sea Level" field when you use the MSL field from your GPS to calculate tide levels. Thisis only used in rare cases where a geoid has been programmed in the RTK receiver, and the MSL field isused to output the height relative to a vertical datum.
Ellipsoidal Height
Use the "Ellipsoidal Height" field to correct the height measured by a RTK receiver. This correction canbe useful when an incorrect antenna height was configured during surveys.
Heave
Use the "Heave" field to correct heave values in cases where the heave sensor wasn't correctly calibratedbefore performing a survey. You can calibrate the heave sensor in the "Calibration" tab of the"Preferences" dialog.
Roll and Pitch
Use the "Roll" and "Pitch" fields to correct these motion values when an IMU wasn't correctly calibratedbefore performing a survey. You can calibrate IMU sensors in the "Calibration" tab of the "Preferences"dialog.
Swap roll and pitch sign
Use this function to swap the angle direction of your IMU in cases where the following conventions arenot met:
Positive roll value => starboard up;Positive pitch value => stern up;Negative roll value => port up;Negative pitch value => bow up;
When your IMU works the other way around for one of the motion directions, check the box to invert thevalue before using it to correct your sounding data.
Data Selection
You can apply the offsets to a single or all raw data files. In most cases, when an invalid setting wasused during the entire survey, you have to apply the corrections to all files.
To start processing the data, click the "OK" button. This should not take longer then a couple ofseconds, depending on the size of the data.
6.15 Table Editor
Table editor
The table editor allows you to modify any value, except for timestamps, in a raw data file directly. It isrecommended to use this editor only in cases where any of the other tools can't be used. You can alsouse this editor to analyze and export raw data.

Single beam processing 277
© 2009-2021 Eye4Software B.V.
Use the table editor to manually alter raw data file content.
Using the table editor
Data in the table editor is sorted per sensor type:
· Depth· Position· Heading· Speed· GPS information· Tide· Motion· DOP· Sub Bottom information
You can use the buttons (c) and (d) to switch between the different tables.
To alter values in the table editor, just double click a cell in the data grid and type the new value. Pressenter, or click another cell with the mouse when done.
In addition to modifying values, it is also possible to delete one or more data rows using the toolbar.
When done editing raw data, click the "OK" button to save your changes. To discard, click "Cancel"When data has been altered, a new modified raw data file is written in the "Modified" folder in your projectroot.

Eye4Software Hydromagic 9.4278
© 2009-2021 Eye4Software B.V.
Table editor toolbar
(a) - Select the previous data file
Select to the previous raw data file in the collection of files you are currently editing.
(b) - Select the next data file
Select to the next raw data file in the collection of files you are currently editing.
(c) - Select the previous data table
Select to the previous table in the raw data file. This allows you to switch between data types.
(d) - Select the next data table
Select to the next table in the raw data file. This allows you to switch between data types.
(e) - Remove Selection
To remove one or multiple data rows, select the rows and click this button to remove them.This action can be undone by using the undo operation button.
(f) - Empty Table
Removes all values from a single table. For instance if you want to remove tide or motion information fromthe raw data file completely. This action can be undone by using the undo operation button.
(g) - Undo operation
Use this button when you removed data by accident. This button undo's the last operation.
(h) - Redo operation
Redo an operation which has been undone.
(i) - Reload
Reloads the table with data from disk.
(j) - Export
With this function, you can save the contents of the current data table directly to a human readableASCII file.
(k) - Table

Single beam processing 279
© 2009-2021 Eye4Software B.V.
Displays the name of the currently selected data table.
(l) - File
Displays the name of the file that is currently being edited.
6.16 PPK processing
Post Processing Kinematic is used when sub-centimeter position accuracy is required, but when there isno possibility to measure with this accuracy in real-time. Real Time Kinematic might not be possiblewhen you are surveying in a remote area, where you do not have access to Internet or a cellular networkto get correction data into your GNSS receiver. In these cases you record the raw satellite observationsusing your GNSS rover and corrections will be applied after the survey by downloading correction (RINEX)data from a nearby base station.
When using PPK in Hydromagic, make sure that, even when the accuracy is low and the raw satelliteobservations are recorded by your rover, you still continue to record the position data in Hydromagic.These position records will later be merged with the PPK position data generated by, for instance, theRTKPOST utility of RTKLib.
The PPK processing tool part of the "Sounding Wizard" and can be found in the tools collection page. Tostart the PPK processing tool, just click the "Process..." button in the "PPK Processing" section asshown below:
The PPK processing tool can be found in the tools collection of the "Sounding Wizard".
Using the PPK processing tool
In the PPK processing tool you have to select the PPK file to use. Since there are numerous differentPPK file formats, you have to specify the layout used in the file. By default the settings for RTKLib filesare loaded:

Eye4Software Hydromagic 9.4280
© 2009-2021 Eye4Software B.V.
The PPK processing tool can be found in the tools collection of the "Sounding Wizard".
The first step is to select an input file by clicking the "Browse..." button. After selecting the file, you canuse the "View..." button to inspect the contents of the file. This should look like the example below,when you did use the free RTKLib software to generate your PPK correction file(s):
% program : RTKPOST ver.2.4.3 b33
% inp file : H:\RINEX\50370790.20o
% inp file : H:\RINEX\nieu079l.20o
% inp file : H:\RINEX\50370790.20*
% obs start : 2020/03/19 11:48:39.0 GPST (week2097 388119.0s)
% obs end : 2020/03/19 11:53:43.0 GPST (week2097 388423.0s)
% pos mode : kinematic
% freqs : L1+L2
% solution : combined

Single beam processing 281
© 2009-2021 Eye4Software B.V.
% elev mask : 10.0 deg
% dynamics : off
% tidecorr : off
% ionos opt : broadcast
% tropo opt : saastamoinen
% ephemeris : broadcast
% amb res : fix and hold
% val thres : 3.0
% antenna1 : ( 0.0000 0.0000 0.0000)
% antenna2 : ( 0.0000 0.0000 0.0000)
% ref pos : 52.587204096 6.281890713 61.3318
%
% (lat/lon/height=WGS84/ellipsoidal,Q=1:fix,2:float,3:sbas,4:dgps,5:single,6:ppp,ns=# of satellites)
% GPST latitude(deg) longitude(deg) height(m) Q ns sdn(m) sde(m) sdu(m) sdne(m) sdeu(m)
2020/03/19 11:48:39.000 52.553810731 6.062372670 44.3737 1 8 0.0049 0.0032 0.0075 -0.0023 -0.0017
2020/03/19 11:48:40.000 52.553810753 6.062372617 44.3673 1 8 0.0050 0.0034 0.0079 -0.0023 -0.0016
2020/03/19 11:48:41.000 52.553810756 6.062372676 44.3731 1 8 0.0051 0.0035 0.0078 -0.0023 -0.0014
2020/03/19 11:48:42.000 52.553810713 6.062372680 44.3719 1 8 0.0051 0.0034 0.0079 -0.0024 -0.0015
2020/03/19 11:48:43.000 52.553810713 6.062372678 44.3759 1 9 0.0048 0.0030 0.0073 -0.0021 -0.0019
2020/03/19 11:48:44.000 52.553810728 6.062372678 44.3817 1 9 0.0054 0.0037 0.0085 -0.0022 -0.0018
2020/03/19 11:48:45.000 52.553810720 6.062372688 44.3844 1 9 0.0053 0.0036 0.0085 -0.0022 -0.0018
2020/03/19 11:48:46.000 52.553810696 6.062372709 44.3813 1 9 0.0053 0.0037 0.0085 -0.0022 -0.0018
2020/03/19 11:48:47.000 52.553810730 6.062372702 44.3882 1 9 0.0053 0.0037 0.0085 -0.0021 -0.0018
2020/03/19 11:48:48.000 52.553810723 6.062372714 44.3839 1 9 0.0053 0.0036 0.0085 -0.0021 -0.0018
2020/03/19 11:48:49.000 52.553810722 6.062372721 44.3861 1 9 0.0053 0.0036 0.0085 -0.0023 -0.0017
2020/03/19 11:48:50.000 52.553810710 6.062372722 44.3820 1 10 0.0067 0.0042 0.0100 -0.0029 -0.0034
Example of a PPK correction file as generated using RTKPOST.
We will explain the different settings by using the example above. In the Hydromagic PPK processingtool you have to specify the field indexes, as well as the coordinate, date and time field formats, so itknows which field represents which value. Looking at the example above, you can see that the date isthe first field, the time is the second field, the latitude coordinate in the third field, the longitudecoordinate in the fourth field and finally the elevation is in the fifth field. Configure this field order first.Please note that this setting may be different depending on the tool you are using to generate PPKcorrection files:
Set the field indexes according to the fieldassignment in the PPK correction file.
Some files are writing comments at the start of the file as well. You can see in the example above, thatthe RTKPOST utility uses a percent sign to mark comment lines. We have to tell Hydromagic to skipthose lines, so we enter a percent sign as "Comment Prefix" setting. Also make sure to set the "DateFormat" and "Time Format" settings, so they match the time and date format used in the correction file.This is a very important setting, since the records are matched with Hydromagic raw data file records byusing the time and date stamps.
Using files with projected coordinates
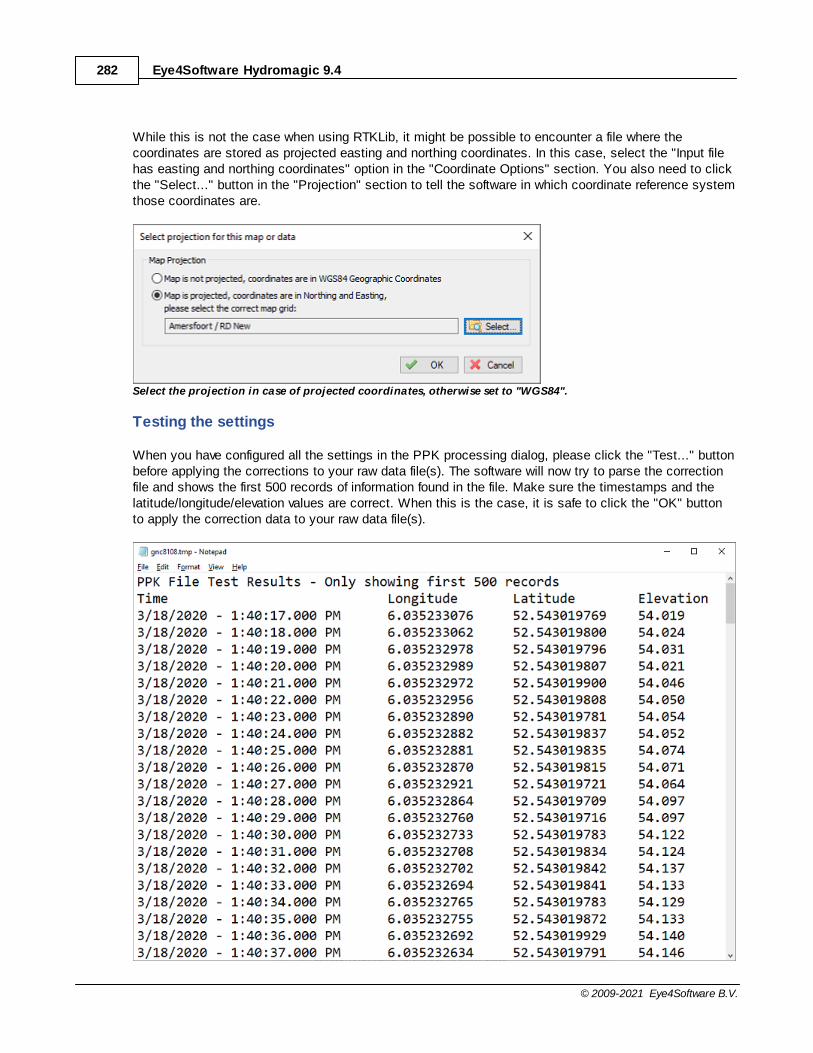
Eye4Software Hydromagic 9.4282
© 2009-2021 Eye4Software B.V.
While this is not the case when using RTKLib, it might be possible to encounter a file where thecoordinates are stored as projected easting and northing coordinates. In this case, select the "Input filehas easting and northing coordinates" option in the "Coordinate Options" section. You also need to clickthe "Select..." button in the "Projection" section to tell the software in which coordinate reference systemthose coordinates are.
Select the projection in case of projected coordinates, otherwise set to "WGS84".
Testing the settings
When you have configured all the settings in the PPK processing dialog, please click the "Test..." buttonbefore applying the corrections to your raw data file(s). The software will now try to parse the correctionfile and shows the first 500 records of information found in the file. Make sure the timestamps and thelatitude/longitude/elevation values are correct. When this is the case, it is safe to click the "OK" buttonto apply the correction data to your raw data file(s).

Single beam processing 283
© 2009-2021 Eye4Software B.V.
Test the settings before applying the corrections to your raw data files - Example test result file shown above.
Applying the corrections
After testing the settings, click the "OK" button to apply the settings. Please note that the correctionswill be applied to the modified raw data files only. Your original raw data files will stay intact, so you canalways roll back the PPK actions by starting the "Sounding Wizard" with the original data. The softwarewill open a notepad files that shows a report of the affected position records along with the shift inposition after correction.
After applying the correction data, a record showing the affected position records will be opened in notepad.
6.17 Generate Soundings
Generate Soundings
When you have corrected your data, configured tide settings and selected correction files for draft andsound velocity, the software has gathered all the information to combine all raw data records into asounding file. In a sounding file, depth, tide, motion and position information are synchronized by usingthe recorded timestamps, and written at fixed intervals. The "Sounding Wizard" will write a separatesounding file for each selected raw data file.
You can choose to write soundings at a fixed interval defined in seconds, use the position fix interval, oryou could use the moments at which a depth measurement has been received. The recommendedsetting is to use a fixed interval of one second.

Eye4Software Hydromagic 9.4284
© 2009-2021 Eye4Software B.V.
At the last page of the wizard, you will be setting the sounding file output options.
Generate sounding options
Name Prefix
When a raw file is converted to a sounding, it will keep the assigned number. Using the name prefixsetting, you can add a prefix to the file name. For instance, when the name prefix is set to 'SNDG', a rawfile named 'RAW0006' will be named 'SNDG0006' after conversion. The raw data file the new soundingoriginates from will be written in the "Description" field of the sounding.
Record interval
The interval at which soundings are calculated. You can use a fixed interval or use the same interval atwhich the GPS or echosounder sends its data. The interval depends on the resolution needed and thesize of the survey area. When a raw data file covers a very large area (>100.000 soundings) it isrecommended to use a lower interval, for instance one second. Using a very small interval on large datasets may slow down other post processing utilities.
Overwrite existing files
Using the wizard it is possible to generate a sounding file over and over again until you are fully satisfiedwith all settings and corrections. Checking the "Do not warn when about to overwrite existing files" boxwill omit a warning message when you are about to overwrite a previously generated sounding file.
Hide raw data files
When the "Hide raw data files from map after conversion has completed" option has been checked, rawdata files which have a sounding file counterpart will automatically be set to invisible to not interfere withthe sounding file drawn in the map display.

Single beam processing 285
© 2009-2021 Eye4Software B.V.
Reporting
When a lot of records seem to gone missing in the sounding files, select the "Generate and show areport with statistics of the sounding creation process" option. This report will give some insight on whycertain raw data records aren't processed, for instance because there are gaps in the data, GNSSsolution quality was low, PPK or tide data didn't cover the whole raw data file or incomplete geoid data.
Example of a sounding generation report with statistics on raw data to sounding conversion.
Generate sounding
When ready, click Finish. After a few seconds, depending on the amount of raw data, the wizard closesand the generated soundings will be visible in the project explorer. From now on, the sounding is alsoavailable as a human readable ASCII file in the "Soundings" folder of your project. In this example, withthe interval of the records set to one second, your sounding should look like this when opened in thesounding editor:

Eye4Software Hydromagic 9.4286
© 2009-2021 Eye4Software B.V.
Example of a sounding generated with fixed one second intervals.
To get more information on a single sounding record (we also call this a single ping in Hydromagic), justdouble click the row you want the details for. When sub-bottom data parameters are available, anadditional "Bottom..." button should appear which opens an additional dialog showing bottomparameters.

Single beam processing 287
© 2009-2021 Eye4Software B.V.
Double-click a data raw to see all the details for the record (ping).
Additional pop up dialog containing sub-bottommeasurements (only when available).
6.18 Import Soundings
Importing sounding data
The ASCII import function in Hydromagic allows you to import soundings written in ASCII format. Forinstance, to import a sounding exported from another Hydromagic project, or created with othersoftware.

Eye4Software Hydromagic 9.4288
© 2009-2021 Eye4Software B.V.
The import ASCII sounding dialog which allows you to import (amongst others) sounding data.
Open the "Import ASCII Data" dialog
The dialog can be opened by selecting "File"=>"Import"=>"Import ASCII Data..." from the main menu.Depending on your software configuration there could be a shortcut button in the toolbar as well.
One way to open the ASCII import tool is via the "File" => "Import" item in the main menu.
Select input file

Single beam processing 289
© 2009-2021 Eye4Software B.V.
Click the "Browse..." button to select the file to be imported. All files will be displayed, there is no fileextension filter applied. Some file extensions that are commonly used for ASCII files include: *.ASC,*.TXT, *.LOG and *.CSV.
Since version 9.1, Hydromagic supports reading of ASCII files saved as regular text files (ANSI), UTF8,UTF8-BOM or UNICODE encoding, since the software will automatically detect the file encoding used.When using an older version, make sure the ASCII file is saved as ANSI or UTF8 (which would be thecase in most scenarios).
The imported file is never modified by this software. This dialog can also be used to import boundaries,matrices and waypoints. Make sure that the "Import data as" option has been set to "Sounding" whenyou want to import a sounding.
To interpret the selected ASCII file as sounding data, select "Sounding".
Field Separator
This value is set to "Auto" by default, which means that the software will try to detect which character isused to separate the data fields in the ASCII file.In most cases you do not have to adjust this value. Use only when the automatic setting does not workfor you.

Eye4Software Hydromagic 9.4290
© 2009-2021 Eye4Software B.V.
Select the separator used between the values or use "Auto" to detect automatically.
Skipping lines and fields
In cases where the data does not start on the first line of the file (for instance, when header names arepresent), you can skip these lines by increasing the "Number of lines to skip from start of file" setting.
The "Number of fields to skip from start of line" option can be used in cases where there are fields beforethe actual XYZ data, for instance, record id's. You can use the "View" button to show the contents of theASCII file to see whether these options apply to your input file.
Coordinate field order
This option is to set the order of the fields in the file. The following is supported:
· Latitude, Longitude;· Longitude, Latitude;· Northing, Easting;· Easting, Northing;
When a third field is present in the file, it will be interpreted as depths. Most software stores soundings inXYZ format, so selecting "Easting, Northing" here would probably work in most cases.
Select the order of coordinate fields in the file.
Coordinate field format
When the input files contains values in geographic format (i.e. latitude and longitude), and thecoordinates are stored in degrees, minutes and seconds format, or degrees and minutes format, use thisoption to select the correct value.
When coordinates are stored in decimal values, leave the default "Decimal" option selected.
When importing geographic coordinates, select the format used.
Numeric values format

Single beam processing 291
© 2009-2021 Eye4Software B.V.
In most cases you will encounter files where floating point values are stored in a format where a dot isused as decimal separator. It is possible, that in some cases the data has been exported by third partysoftware using a different format. For instance a comma could be used as decimal separator, or theminus symbol is behind the value instead of in front of it.
Click the "Select..." button next to the "numeric value format" to change the locale.
To define another floating point number format to be used when parsing the ASCII file, click the"Select..." button next to the "Numeric field format" setting so select another format (also called locale).In the dialog box that appears, select the region or locale that was used to generate the file. Examples ofthe number format will be updated while you browse to the countries.
Use the numeric format dialog box to try out various formats.
Please note that you do not have to select the same locale as was used to generate the ASCII file. Assoon as the number format matches you should be good.
Projection and Units
The software needs to now which projection is used in the file (only when Northing and Eastingcoordinates are used instead of Latitude and Longitude), so it can be referenced to WGS84 coordinates.When altitude or depth values are present in the file, you also have to select the (vertical) units used.

Eye4Software Hydromagic 9.4292
© 2009-2021 Eye4Software B.V.
M ake sure to select the coordinate reference system used inthe file when different from the current project.
Importing the file
Just click "OK" to start processing the ASCII file. When all parameters were entered correctly, theimported sounding should appear in the "Project Explorer". In case of problems, you can always checkthe content of the Activity View's "Processing" tab.
6.19 Export soundings
Importing and exporting soundings
Using the sounding export function, it is possible to export soundings in ASCII format for use in otherapplications. It is also useful to backup separate sounding files from a project, for instance to importthem into another project or just for archiving.
The ASCII import function allows you to import soundings written in ASCII format. For instance, to importa sounding exported from another Hydromagic project, or created with other software.

Single beam processing 293
© 2009-2021 Eye4Software B.V.
Use the sounding export tool to backup or transfer soundings.
Exporting sounding data The sounding export function allows you to export your soundings in ASCII format. You can use thisfeature to create backups of your work, or when you want to use the data in other applications.
To start, open the "Export Sounding" dialog by selecting "File" => "Export" => "Export Sounding Data..."from the main menu.
The sounding export function can be found under the export menu.
Select output folder
Click the "Browse..." button to select the destination folder for the data to export.All selected soundings will be stored in the same selected folder.
Select the folder in which the output files will be written.
"Overwrite existing files without warning"
When this option has been enabled (checked), there will be no confirmation when you did export thesoundings before to the same folder.All existing ASCII sounding data in the selected folder will be overwritten by the new data directly.
"Merge all selected soundings into a single ASCII files"
By default, each sounding selected for export will be written as a separate file.When this option has been enabled, all sounding data will be merged into a single ASCII file instead.
Select soundings

Eye4Software Hydromagic 9.4294
© 2009-2021 Eye4Software B.V.
To select which soundings will be exported, click the "Select..." button in the "Select Soundings"section.A selection dialog containing all soundings will be displayed making it easy to make a selection.
Select the items to export by setting checks.
Select format options and field order
The output format is fully customizable, the following fields can be selected for export:
§ Longitude;§ Latitude;§ Easting;§ Northing;§ Depth (raw depth);§ Depth (corrected depth);§ Elevation;§ Ellipsoidal height;§ Orthometric height;§ Date;§ Tide;§ Time;§ Draft;§ Heading;§ Speed;§ Sound velocity correction.
To customize the exported fields, and the field order, click the "Select..." button. The following dialog will be shown allowing you to select the fields.
Click "OK" to confirm and return to the "Export ASCII" dialog.

Single beam processing 295
© 2009-2021 Eye4Software B.V.
The ASCII file can be customized by choosing the fields to include.
Select map projection and units
It is possible to store the file using another coordinate reference system then the one you are currentlyusing in your project. To change the output coordinate system, click the "Select..." button and select thecoordinate system, or select the WGS84 when using geographic coordinates. In this section you canalso specify in which units the depth should be written to the ASCII file.
Select the coordinate system to use for the output file.
Starting the export
Just click "OK" to start writing the file. When all parameters were entered correctly, the exported file(s)should appear in the folder you selected.

Eye4Software Hydromagic 9.4296
© 2009-2021 Eye4Software B.V.
7 Post Processing
7.1 Shoreline data
Shoreline data
The shoreline data option can be used to enter depth data for places you cannot reach using your vessel,for instance, because the water is to shallow.It can also be used to specify a line of equal depth, for instance where the water reaches the shore.
For instance, in the example below, you would set the depth for all points on the line to zero:
Drawing a shoreline
In order to draw a shoreline using hand, for instance when it is possible to use a accurate map, selectthe "Draw Boundary" option from the "Cursor" menu.Now you can click the points that make the line segments for the shoreline. When finished, just click theright mouse button to store the line.When you finished drawing the shoreline the "Edit Boundary" dialog box will appear. A shoreline isbasically a special type of boundary in Hydromagic.To store the line or area just drawn as a shoreline, select one or multiple options:
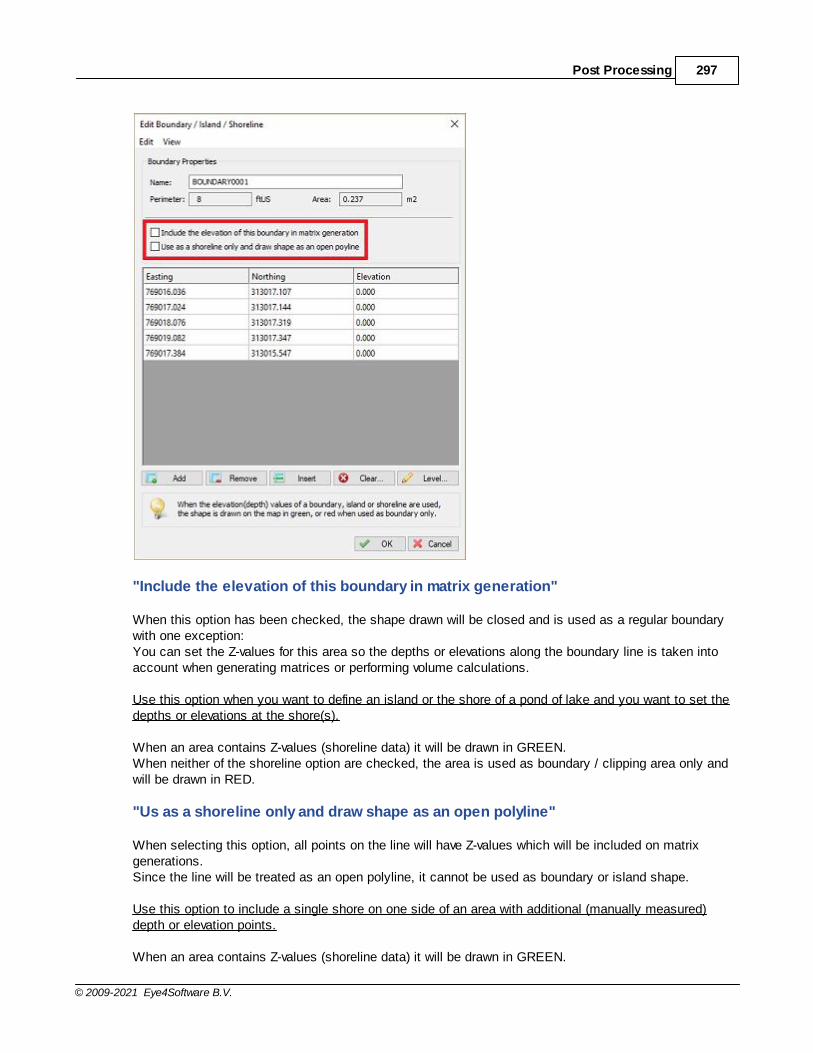
Post Processing 297
© 2009-2021 Eye4Software B.V.
"Include the elevation of this boundary in matrix generation"
When this option has been checked, the shape drawn will be closed and is used as a regular boundarywith one exception:You can set the Z-values for this area so the depths or elevations along the boundary line is taken intoaccount when generating matrices or performing volume calculations.
Use this option when you want to define an island or the shore of a pond of lake and you want to set thedepths or elevations at the shore(s).
When an area contains Z-values (shoreline data) it will be drawn in GREEN.When neither of the shoreline option are checked, the area is used as boundary / clipping area only andwill be drawn in RED.
"Us as a shoreline only and draw shape as an open polyline"
When selecting this option, all points on the line will have Z-values which will be included on matrixgenerations.Since the line will be treated as an open polyline, it cannot be used as boundary or island shape.
Use this option to include a single shore on one side of an area with additional (manually measured)depth or elevation points.
When an area contains Z-values (shoreline data) it will be drawn in GREEN.

Eye4Software Hydromagic 9.4298
© 2009-2021 Eye4Software B.V.
When neither of the shoreline option are checked, the area is used as boundary / clipping area only andwill be drawn in RED.
Entering manually
When you want to enter the shoreline manually, for instance when you have measured the shorelinecoordinates from the shore using a RTK rover, right click on "Boundaries" in the "Project View" and select "Add Shoreline".
The following dialog should now appear, allowing you to enter all measured coordinates in thespreadsheet. Click the "Add..." button to add new records.

Post Processing 299
© 2009-2021 Eye4Software B.V.
Setting depth values
When the shoreline connects points with the same depth value, for instance zero,you can set all Z values at once by clicking the "Level..." button and entering the value.
Please note that in cases where you are going to use the shoreline in calculations with elevations,you have to enter the elevation instead of depths here,
Modifying shoreline data
To modify the positions in shoreline data, you can use the mouse to drag and drop the positions on themap. When you want to modify positions manually, or you want to alter the depth values, you have to use the"Edit Boundary" dialog. To open this dialog, right click on the boundary you want to modify in the "Project View" and select the"Edit Boundary..." option.

Eye4Software Hydromagic 9.4300
© 2009-2021 Eye4Software B.V.
Applying shoreline data
Shoreline data can be used when generating matrices, and thus also calculating volumes (usingmatrices). When generating a matrix, you can specify which shorelines you want to include by clicking the"Select..." button. In the dialog that appears, check the boundaries (shorelines) you want to include and click "OK":
7.2 Generate and Display Matrix
Introduction
In Hydromagic, a matrix is a collection of regularly spaced depths, which can be projected over the mapas color or text.

Post Processing 301
© 2009-2021 Eye4Software B.V.
This is also known as a digital terrain model or DTM.
During the generation of a matrix from a sounding, the scattered data points are converted to regularlyspaced data using a TIN (Triangulated Irregularly Network). This TIN is generated using a Delaunay triangulationalgorithm.
All new data points are generated by "filling" the triangles, which have been formed from the scattereddata. The image below shows a color matrix which has been generated using TIN (data points at 0.25 meterinterval).
Example matrix generated from sounding and boundary data.
Generating a matrix
To generate a matrix, you must have loaded either a valid sounding or a shoreline containing depth orheight information. Without sounding or shoreline data, it is not possible to generate a matrix.
In order to generate the matrix, you have to specify some settings. To do so, open the "Generate Matrix" dialog by selecting "Generate Matrix..." from the "Tools" menu:
Use the "Generate M atrix" utility to generate a matrix by using a TIN algorithm.
Sounding data

Eye4Software Hydromagic 9.4302
© 2009-2021 Eye4Software B.V.
Select from which sounding(s) you wish to generate the matrix. By clicking the "Select..." button, youwill be able to select one or more soundings that will be used to calculate the triangulation from whichthe matrix or digital terrain model will be generated.
Select which sounding(s) to include in thematrix generation by checking boxes.
Boundaries or shoreline data
In Hydromagic, boundaries can be used do define a shoreline, a clipping area or an island. When aboundary is defined as a shoreline, including the boundary will automatically include the data pointsdefined on this line.
When an island or clipping boundary is selected, it will be used to determine which area's should be filledwith data and which are not. This can be used in cases when only a part of the sounding areas has to beinterpolated. When no boundary has been selected, the data points of the selected soundings will beused to determine the area that needs to be filed with data.

Post Processing 303
© 2009-2021 Eye4Software B.V.
Select which boundaries to include in thematrix generation by checking boxes.
Sounding channel
You can use this setting to select which data of the sounding is used to generate the matrix. This canbe one of the following values:
§ Depth recorded with the low frequency channel of your echo sounder;§ Depth recorded with the high frequency channel of your echo sounder;§ Elevation recorded with the low frequency channel of your echo sounder;§ Elevation recorded with the high frequency channel of your echo sounder;§ The difference in depth between the high and low frequency channel (Low - High);§ The difference in depth between the high and low frequency channel (High - Low);§ Bottom loss (low frequency);§ Bottom loss (high frequency);§ Bottom reflection (low frequency);§ Bottom reflection (high frequency);§ Bottom density (low frequency);§ Bottom density (high frequency);§ Bottom porosity (low frequency);§ Bottom porosity (high frequency);§ Sensor data channel 1;§ Sensor data channel 1;§ Sensor data channel 2;§ Sensor data channel 3;
When soundings contain tide information, the "Elevation (Hi Frequency)" option will be selected bydefault. If you want to generate the matrix using the corrected depth values, without tide correction,select the "Depth (Hi Frequency)" option instead. When the selected soundings don't contain tideinformation, the "Depth (Hi Frequency)" is selected by default.

Eye4Software Hydromagic 9.4304
© 2009-2021 Eye4Software B.V.
Please note that information on bottom loss, reflection, density and porosity will only be available oncertain types of echo sounders. The sensor data channels can be used to store for instancemagnetometer or temperature data.
Select the data source for the matrix cells from the drop down selection.
Matrix spacing
You can select the spacing of the regularly spaced data here. The same spacing is applied to both the Xand Y axis. The spacing has to be entered in the same units as used for the map projection.
Which spacing to use depends on the zoom scale you are using. For an overview of a large area, youcan use 2.5 meter. When zooming in on a smaller area, the best is to use values between 0.25 and 1.00meter.
Please note that when using a larger spacing, it will be generated and displayed faster then a moredense matrix.
Output file name
Enter the name of the file that is generated here. This setting is required. Use the browse button toselect the output folder and file name. The data will be added to the current project and stored in aseparate ASCII XYZ file at the desired location.
Generating the matrix
Finally, click the "OK" button to start the process. It should take a couple of second, you can watch theprogress in the status bar of the main window. After generation, you will notice the matrix has been added to the project. Depending on theconfiguration, the newly generated matrix will be drawn over the map.
Displaying the matrix
There are more ways of showing the matrix on the map. In the example near the top of this page, it isdisplayed at both colors and text at a 5x5 meter interval. It is also possible to not show it (and just use the matrix to export data), to show it with colors only(using the defined color ranges) or to show its depths as text.

Post Processing 305
© 2009-2021 Eye4Software B.V.
To change settings on how the matrix is shown, right click the "Matrices" folder in the "Project Explorer"and select the "Display Options" option from the popup menu.A dialog with all matrix settings will be displayed. It should look like the screenshot below:
The matrix display can be customized.
Display Matrices
Using this check box you can toggle the displaying of matrix files on the map. When matrix display isdisabled, all other options will be disabled.
Display matrix as colors
When enabling this option, the matrix is displayed as a color grid on top of the map. The "Colors..."button will also be enabled, so you can start creating the color ranges for your sounding.
Display matrix as depths
Instead of drawing the matrix as a color grid, you can also choose to draw depth values at fixed intervals.Depending on the size of the matrix, you have to adjust the text intervals in a way that the text's on themap do not intersect. The text spacing can be set in horizontal and vertical direction separately.
Display text as colors
When this option has been checked, text is drawn in color, indicating the depth range. You cannotcombine this option with the "Display matrix as colors" option.
Color Ranges

Eye4Software Hydromagic 9.4306
© 2009-2021 Eye4Software B.V.
In this dialog, you will be able to add, remove or modify color ranges by clicking one of the buttons at thebottom of the list. To change a range, just double click on it, and change the settings. In case you wantto store the color scheme you designed for other projects, you can store it in a separate XML file usingthe "Save..." button. Just use the "Load..." button in the other project to retrieve this scheme.
Display color legend
The second section contains the settings for the color legend which is displayed as map overlay whencolors are displayed. You can turn it on or off here.
Generate color ranges
It is also possible to create a color scheme using a min, max and step value.

Post Processing 307
© 2009-2021 Eye4Software B.V.
To do so, select the "Auto..." button, and select the lower and upper range, next specify the intervalbetween the ranges. This tool will generate max 30 ranges, so it is important to choose the correct interval.
7.3 Generate and display delta matrices
Generate and display a delta matrix
In Hydromagic, a matrix is a collection of regularly spaced depths, which can be projected over the mapas color or text. Such data is also referred to as a digital terrain model or DTM.
A matrix can be generated from a collection of soundings and boundaries, or by comparing two existingmatrices. The latter method can be used to visualize the difference between two matrices, for instance amatrix generated with a pre-dredging sounding and a matrix generated with a post-dredging sounding.You can also compare matrices generated from two regular soundings at a different time, so you canvisualize, for instance, sediment building up.
The new matrix is generated by comparing cell values in both matrices. Make sure the matrices overlapas much as possible and use the same cell spacing. To generate a matrix by comparing two existingmatrices, select the "Generate Matrix (Delta)..." option from the "Tools" menu in Hydromagic Survey:
To compare matrices, select the "Generate M atrix (Delta)..."option from the "Tools" menu.
Selecting the source data
In the delta matrix generation tool, you first have to select the two matrices you want to use to generatethe delta matrix. For matrix file 1, you select the sounding with the oldest time stamp (or pre-dredging)sounding and for matrix file 2 the newest matrix (or post-dredging matrix). The layer selection boxed willbe disabled when there is only one layer present in the matrix file. When a matrix file has been

Eye4Software Hydromagic 9.4308
© 2009-2021 Eye4Software B.V.
generated in Hydromagic Dredging, multiple layers can be used. For each layer, the type of data will beshown (in the screenshot below, both layers contain high frequency depth data).
Before generating a "delta matrix", you have to select the matrices to compare.
Selecting the output file
To select the location and file name for the output file to be generated, click the "Browse..." button. Youare allowed to select an existing file. In this case the software will ask you to confirm if you want tooverwrite the existing file. If the file is not already part of the project, it will be added to the project treeautomatically. Matrix files are written in binary format and are not human readable. To export thegenerated matrix file in ASCII format, use the Export ASCII file tool.

Post Processing 309
© 2009-2021 Eye4Software B.V.
Select an existing or enter a new file name in the "Save As" file dialog.
Generate a matching color set
If you want, you can generate a color set for the resulting matrix automatically. To do so, simply enablethe "Automatically generate and activate a color set" option by checking the checkbox in the "ColorOptions" section. You also have to enter a name for the new color set, so it can be identified in the list ofcolor sets. This newly generated color set will be saved with the project.
The color set is generated by detecting the minimum and maximum differences in the matrices which arebeing compared, and the minimum color interval is calculated to limit the number of colors to a maximumof 30. You can select the colors used using the "Color Selection" drop down box.
Generating the matrix
Finally, click the "OK" button to start the process. It should take a couple of seconds, you can watch theprogress in the status bar of the main window. The generated matrix will be added to your projectautomatically and it will be displayed using the colors of the generated color set (if this option wasenabled). When no colors are visible, please check the matrix display options as described in the nextparagraph.
Displaying the matrix as colors
To change the settings for displaying matrices, right click the "Matrices" folder in the "Project Explorer",and select the "Display Options..." option from the popup menu:

Eye4Software Hydromagic 9.4310
© 2009-2021 Eye4Software B.V.
Right click the "M atrices" folder and select the "Display Options..." option.
To show the matrix as colored cells, make sure the "Display matrix as colors (raster)" option has beenchecked. This will cause the matrix to be drawn using the selected or generated color set.
Select the "Display matrix as colors (raster)" option.

Post Processing 311
© 2009-2021 Eye4Software B.V.
7.4 Generate Matrix from Sections
Generating a reference matrix from sections
A reference matrix that can be used to perform volume calculations can be created from:
ü a recorded sounding;ü collection of sections, also known as channel design;ü a vector chart which contains 3D vectors.
Channel Design
When comparing the matrix created from a sounding with a matrix created from a channel design, wecan calculated the amount of material which has to be (re)moved in order to get the result as in thechannel design.
Generate the matrix
To start creating a matrix from the channel design, right click on the "Sections" folder in the "ProjectExplorer" and select the "Generate Matrix..." options as shown below:

Eye4Software Hydromagic 9.4312
© 2009-2021 Eye4Software B.V.
After selecting this option the "Generate Matrix from Sections" will be displayed, as shown in the imagebelow:
Sections
Select which sections you want to include in the matrix calculation. In most cases you select allsections, which can be done by clicking the "Select All" button.To deselect all sections, click the "Select None" button. To select only section that are set as visible inthe project, click "Select Visible".
Spacing
Set the required spacing. Please note that when using the volume calculation using matrices, thisspacing should be equal to the one used in the matrix generated from the sounding.
Clipping Area

Post Processing 313
© 2009-2021 Eye4Software B.V.
Select which area or boundary will be used to indicate the clipping area of the matrix generated from thesections. This value is required.
Filename
Click the "Browse..." button to select a folder and file name for the generated matrix. The matrix is savedas an ASCII file containing all the XYZ pairs calculated by this tool using TIN.
Projection
To save the XYZ data in a different projection then the current one, click the "Select..." button to changethe projection.Coordinates will be converted during saving to the output file.
Starting generation
When all parameters has been set, the matrix will be calculated and added to the project.During the generation process, a progress bar will be shown in the status bar.
When finished and loaded, you will see something similar to the image below:
7.5 Generate Matrix from CAD
Generating a reference matrix from CAD or vector maps
A reference matrix that can be used to perform volume calculations can be created from:
§ one or more soundings;§ shoreline information;§ collection of cross sections, also known as channel design;§ a vector chart which contains 3D vectors.
CAD drawing

Eye4Software Hydromagic 9.4314
© 2009-2021 Eye4Software B.V.
This is perhaps the easiest way to create a reference matrix (DTM or digital terrain model), provided thatan AutoCAD DXF or MicroStation design of the area is available (and of course, contains elevationinformation). From the vectors collected from the CAD file, a TIN model is generated from which heightsare calculated. When comparing the matrix created from a sounding, with a matrix created from a CADdrawing, we can calculate the amount of material which has to be removed or added in order to get theresult as defined in the CAD drawing (dredging volumes). A sample CAD design of how to construct abasin is displayed below:
Example of an AutoCAD DXF drawing containing elevation lines.
Starting the tool
To start the conversion, please make sure you have imported the CAD drawing (vector map) into theproject. When it displays correctly in the map view, right click on the loaded DXF or DGN CAD file in the"Project Explorer", and select the "Export to Matrix..." option. This will launch the "matrix from vector"tool."In this tool you can select the CAD file as well the name(s) of the layer(s) you want to include in thecalculation.
Select the "Convert to M atrix..." option from the context menu.

Post Processing 315
© 2009-2021 Eye4Software B.V.
Using the conversion tool
Use the drop-down box to select the map layer which contains the features which contain the elevationinformation you wish to use in the matrix generation. It is recommended to draw these lines in a separatelayer in your file. Click the "Select..." button to select the layers to include in the calculation.
Browse for an AutoCAD DXF file and select the DXF layers to include.
Matrix spacing
Set the required spacing. Please note that when using the volume calculation using matrices, thisspacing should be equal to the one used in the matrix generated from the sounding, otherwise it cannotbe used in volume calculations.
Clipping area
Select which area or boundary will be used to indicate the clipping area of the matrix generated from theAutoCAD file. You can for instance convert the outer polyline to a boundary. When you want to disableclipping, select the default option "NONE".
Output file
Click the second browse button to select a folder and file name for the generated matrix. The matrix issaved as a binary file containing all the XYZ pairs calculated by this tool using a TIN model.

Eye4Software Hydromagic 9.4316
© 2009-2021 Eye4Software B.V.
Starting generation
When all options have been set, click the "OK" button to start the matrix generation process. Thesoftware will collect all usable vertices (coordinates) from the AutoCAD drawing and creates a TIN modelof the data to calculate the matrix with fixed cell sizes. After generation, the matrix will be loaded andadded to the project.During the generation process, a progress bar will be shown in the status bar. Whenfinished and loaded, you will see something similar to the image below:
Vector Map
Use this control to select the vector map to generate the matrix from. Please note that only vector mapsare displayed here, raster maps do not contain elevation information. By default the "Active Layer" isselected in this control.
Layer Filter
Enter the names of the layers that should be included in the calculation. To enter multiple names, justseparate them using semicolons. This field is required, when left blank, there will be no generation ofmatrix data.
Spacing
Set the required spacing. Please note that when using the volume calculation using matrices, thisspacing should be equal to the one used in the matrix generated from the sounding.
Clipping Area
Select which area or boundary will be used to indicate the clipping area of the matrix generated from thesections. When you want to disable clicking, select the default option "<No Clipping>".
File
Click the "Browse..." button to select a folder and file name for the generated matrix. The matrix is savedas an ASCII file containing all the XYZ pairs calculated by this tool using TIN.
Starting generation
When all options have been set, click the "OK" button to start the matrix generation process. Thesoftware will collect all usable vertices (coordinates) from the AutoCAD drawing and creates a TIN modelof the data to calculate the matrix with fixed cell sizes. After generation, the matrix will be loaded andadded to the project.During the generation process, a progress bar will be shown in the status bar. Whenfinished and loaded, you will see something similar to the image below:
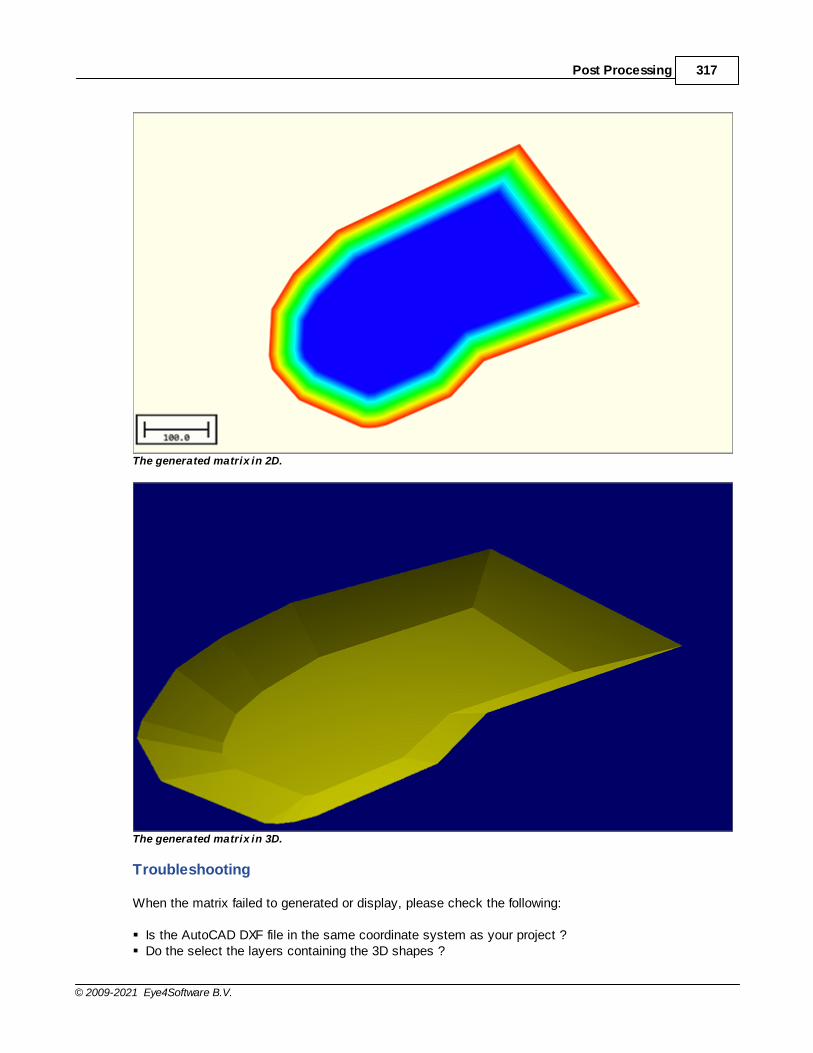
Post Processing 317
© 2009-2021 Eye4Software B.V.
The generated matrix in 2D.
The generated matrix in 3D.
Troubleshooting
When the matrix failed to generated or display, please check the following:
§ Is the AutoCAD DXF file in the same coordinate system as your project ?§ Do the select the layers containing the 3D shapes ?

Eye4Software Hydromagic 9.4318
© 2009-2021 Eye4Software B.V.
§ Is the generated matrix even visible in the "Project Explorer" ?§ Did you set the matrix color ranges ?§ Check the matrix display settings;§ Are there any errors in the "Processing" tab of the activity view ?
You can check the "Processing" activity view tab for errors.
7.6 Import Matrix from ASCII XYZ data
Import Matrix from ASCII XYZ data
In Hydromagic, a matrix is a collection of regularly spaced depths, which can be projected over the mapas color or text.Such data is also referred to as a digital terrain model or DTM.
The software allows you to import matrix data from other sources through an ASCII file.A 3rd matrix file can be imported for further processing in Hydromagic, as background map or for volumecalculation purposes.
The import tool allows you to import the data from various ASCII formats.During the import process it can perform coordinate conversion, unit conversion, resampling (up anddown sampling) and clipping.
Starting the importing tool
To start importing matrix data, start the tool by selecting "Import Matrix..." from the "File" => "Import"menu.Please note that a licensed version of Hydromagic is required in order to use this tool.

Post Processing 319
© 2009-2021 Eye4Software B.V.
Select and preview the source data
The first step is to select the data that is going to be imported. You can select the source file afterclicking the "Browse..." button.Next, you can click the "View..." button to analyze the data. Use this option to determine which datalayout is used inside the file. This info is required for the next step.
Looking at the source data, please determine which coordinate format is used, what the order of thefields is and which projection and units are used.

Eye4Software Hydromagic 9.4320
© 2009-2021 Eye4Software B.V.
Coordinate Options
While in most cases the data source will be in easting and northing coordinates, the data might be ingeographic coordinates sometimes.When this is the case, click the "Input file has longitude and latitude coordinates" and select the positionformat in the drop down list.
Field assignment
The field assignment options are used to indicate which field is what. You can determine the fieldnumbers by looking at the source data.Please note that the first field is field number one. A field number of zero indicates "Not in use" and canonly be selected for the tide level.
In the example above, you would select 'one' for easting, 'two' for nortingh and 'three' for the depth, or inthis particular case the elevation.
Projection and Units
When the projection of the imported data, or the depth units are different then the ones used in thecurrent project, please select them in this section.

Post Processing 321
© 2009-2021 Eye4Software B.V.
During the import, coordinates and depths will automatically be converted. When the source coordinatesare geographic, select WGS84 as projection.
Cell Spacing
The XYZ data will be converted to a regularly spaced grid or matrix. You have to specify the distancebetween the cells here.The cell spacing will be the same in both horizontal and vertical direction.
Hydromagic will generate a new grid using this setting by creating a so called TIN model of the inputdata.The TIN model is used to interpolate depth or elevation values at the cell positions.
Boundaries
In Hydromagic, boundaries can be used do define a shoreline, a clipping area or an island.When an island or clipping boundary is selected, it will be used to determine which area's should be filledwith source data and which are not.To select an area to fill with the source data, click the "Seclect..." button to select one or moreboundaries to use as clipping area.The setting is optional. When no boundary has been selected, all data will be imported.
Generating the matrix
Finally, click the "OK" button to start the process. It should take a couple of second,you can watch the progress in the status bar of the main window.
After generation, you will notice the matrix has been added to the project.Depending on the configuration, the newly generated matrix will be drawn over the map.

Eye4Software Hydromagic 9.4322
© 2009-2021 Eye4Software B.V.
7.7 Generate Depth Contours
Contour lines are lines connecting points with the same depth, elevation or other data. Contour lines are also known as iso-lines.
During the generation of contour lines from a sounding, the scattered points are converted to regularly spaced data using a TIN (Triangulated Irregularly Network).This TIN is generated using a Delaunay triangulation algorithm.
After this step, Hydromagic calculates the contour lines by determining the positions where the depth contour crosses the calculated triangles.
All these lines are connected to each other, and stored as a vector layer, which is saved as an AutoCAD DXF file and added to the current Hydromagic project.
In addition, the generated contours can be smoothed using a B-spline interpolation algorithm in cases where you do not want unnatural looking sharp edges in the contour lines.
Creating contours
To generate depth contours, you must have created a matrix first.A matrix can be generated from depth data, bottom information data or other sensor data liketemperature.
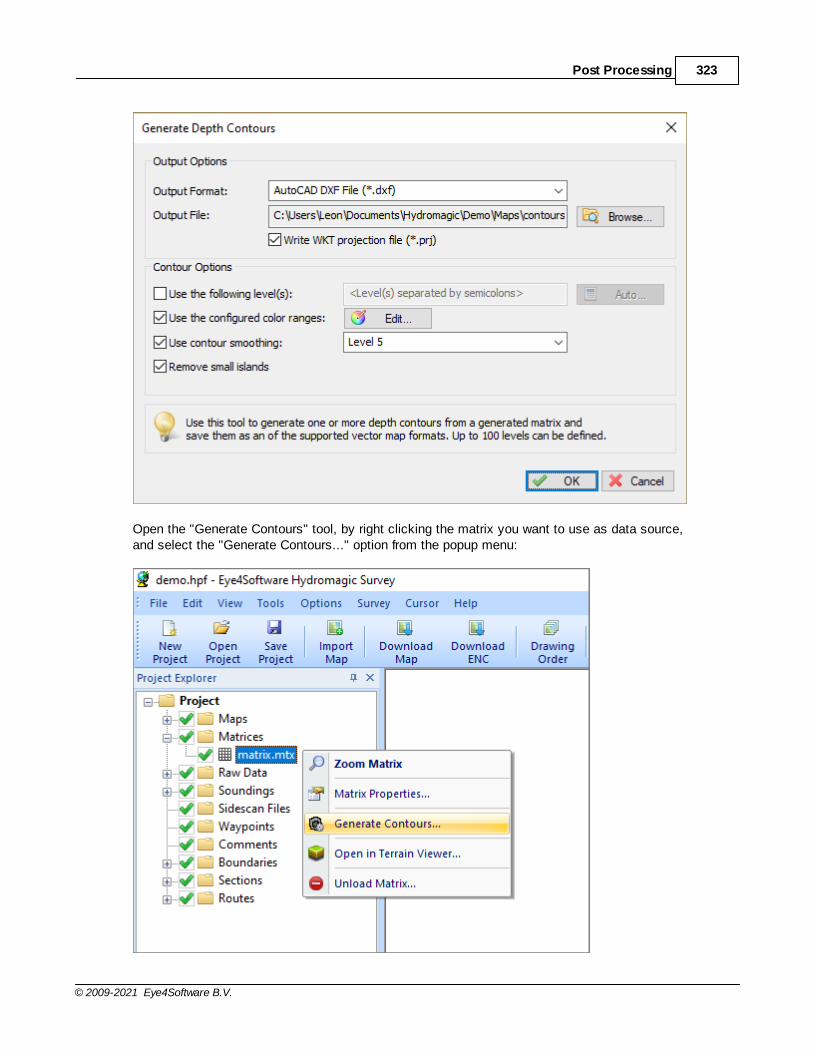
Post Processing 323
© 2009-2021 Eye4Software B.V.
Open the "Generate Contours" tool, by right clicking the matrix you want to use as data source,and select the "Generate Contours..." option from the popup menu:
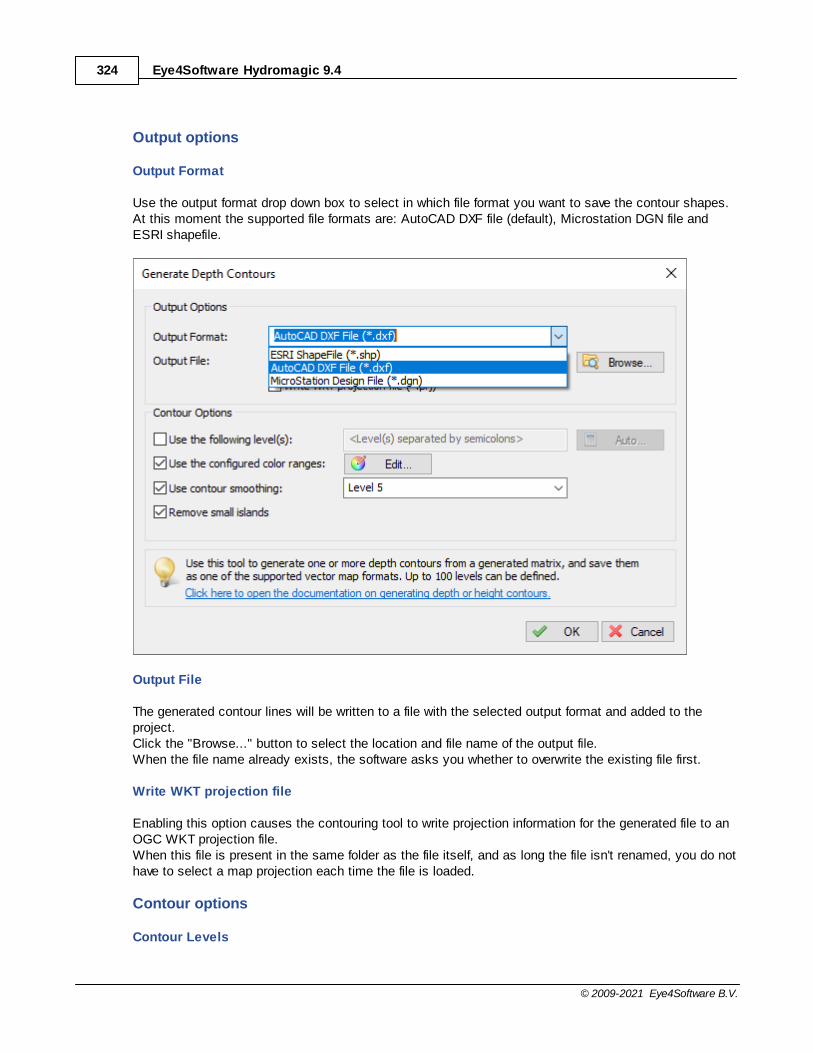
Eye4Software Hydromagic 9.4324
© 2009-2021 Eye4Software B.V.
Output options
Output Format
Use the output format drop down box to select in which file format you want to save the contour shapes.At this moment the supported file formats are: AutoCAD DXF file (default), Microstation DGN file andESRI shapefile.
Output File
The generated contour lines will be written to a file with the selected output format and added to theproject.Click the "Browse..." button to select the location and file name of the output file.When the file name already exists, the software asks you whether to overwrite the existing file first.
Write WKT projection file
Enabling this option causes the contouring tool to write projection information for the generated file to anOGC WKT projection file.When this file is present in the same folder as the file itself, and as long the file isn't renamed, you do nothave to select a map projection each time the file is loaded.
Contour options
Contour Levels

Post Processing 325
© 2009-2021 Eye4Software B.V.
You can generate contours using fixed level(s), or use color ranges. You can also combine the twooptions. Using a fixed level can be useful, to display a reference line (for instance the dredging depth) tosee what's above and below this line. You can enter multiple levels by separating them usingsemicolons. When using the color ranges, the levels displayed as colors will be accentuated.
Contour smoothing
When generating depth contours from a TIN model containing large triangles, it happens often that sharpedges appear in the contour lines. To make the lines look more pleasant for the eye, you can enable the"Use contour smoothing" option to use a B-Spline algorithm to smoothen the lines. Please note thatchoosing a higher smoothing level will slow down the contour generation process.
The level settings allows you to set the degree of smoothing. When using level 1, just a little bit ofsmoothing is applied, while level 9 applies the most. A good value to start with is level 5. When contoursare starting to cross, you might want to try a lower level.

Eye4Software Hydromagic 9.4326
© 2009-2021 Eye4Software B.V.
Finish
When all settings are correct, click the "OK" button to finish the process. The software will now createthe TIN model, and generate the contour lines. You will have to wait a couple of seconds, depending onthe number of records your sounding contains. When ready, the dialog will disappear, and the contoursare drawn on the screen.
Managing contours
Show / Hide contours
To temporary hide or show a collection of contour lines, just click the "eye" icon in front of the contourname.When hidden, the contour is still loaded, but just not shown on the screen.
Delete contours
To remove a collection of contour lines fopm your project, look for the name in the "Project Explorer" andright click on it.Please note that the contour map is only removed from the project. The file will not be deleted and stayin the project folder.
Select the "Remove Map..." option from the popup menu, and confirm the action.

Post Processing 327
© 2009-2021 Eye4Software B.V.
Export contours to Google Earth
Once the contours have been generated and added to the project, you can also export the contours asGoogle Earth KML file.You can open the "Export KML data" tool directly from the "File" => "Export" menu.

Eye4Software Hydromagic 9.4328
© 2009-2021 Eye4Software B.V.
7.8 Volume Calculation (Matrix)
Volume calculation using matrix
The matrix volume calculation tool can be used in two ways: to calculate the difference in volumebetween two matrices (for example: pre-dredge and post-dredge), or between a matrix and a fixed level.The latter option can be used to calculate the area and volume of a pond or basin or tank (you can alsouse staging volume calculations for this).
To use this option for volume calculation, you must first have generated a matrix from your correctedsounding(s). This tool calculates volumes by multiplying the difference between depth in the selectedmatrices with the dimensions of a single matrix cell. When comparing matrices, make sure that they areboth generated with the same matrix spacing (cell size) setting.
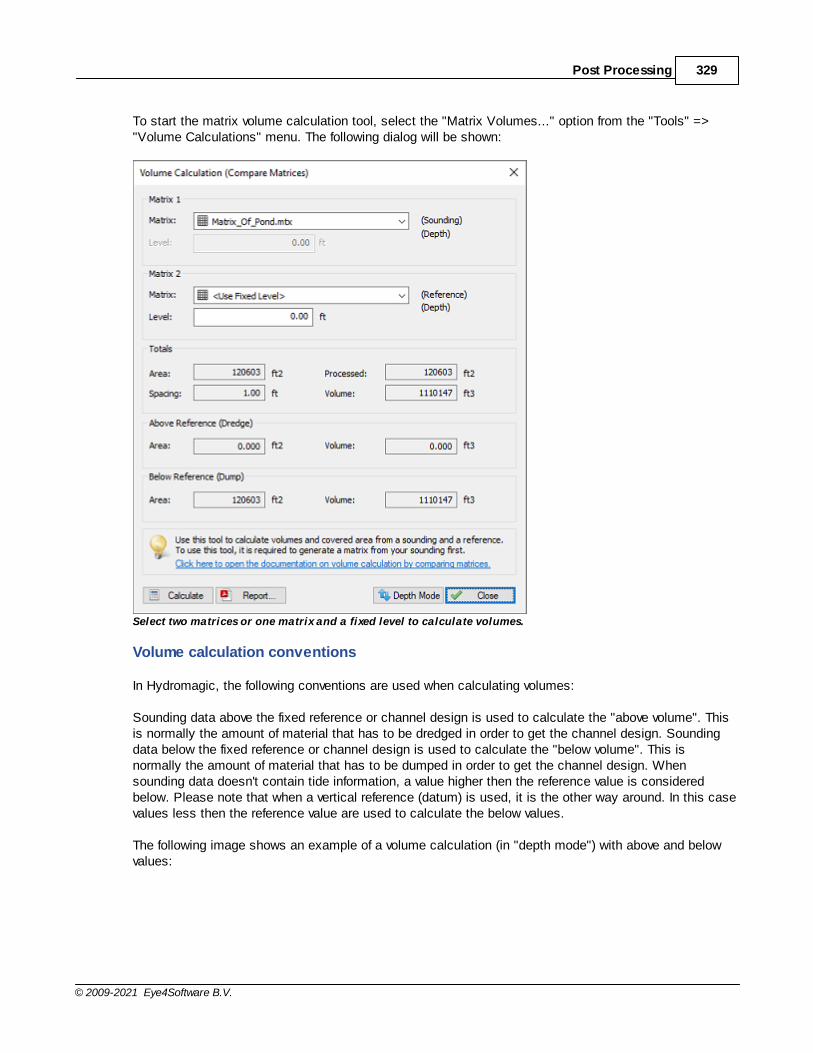
Post Processing 329
© 2009-2021 Eye4Software B.V.
To start the matrix volume calculation tool, select the "Matrix Volumes..." option from the "Tools" =>"Volume Calculations" menu. The following dialog will be shown:
Select two matrices or one matrix and a fixed level to calculate volumes.
Volume calculation conventions
In Hydromagic, the following conventions are used when calculating volumes:
Sounding data above the fixed reference or channel design is used to calculate the "above volume". Thisis normally the amount of material that has to be dredged in order to get the channel design. Soundingdata below the fixed reference or channel design is used to calculate the "below volume". This isnormally the amount of material that has to be dumped in order to get the channel design. Whensounding data doesn't contain tide information, a value higher then the reference value is consideredbelow. Please note that when a vertical reference (datum) is used, it is the other way around. In this casevalues less then the reference value are used to calculate the below values.
The following image shows an example of a volume calculation (in "depth mode") with above and belowvalues:

Eye4Software Hydromagic 9.4330
© 2009-2021 Eye4Software B.V.
This image shows the difference between "above" and "below" volume values.
Volume calculation tool
To start the matrix volume calculation tool, select the "Volumes (Matrix)" option from the "Tools" menu. The following dialog will be shown:
Selecting Matrices
Matrix 1
Use this setting to specify the matrix generated from your sounding, or when using two matrices, thematrix generated from the post-dredge sounding.
Matrix 2
Use this setting to specify the matrix generated from your pre-dredge sounding or a matrix generatedfrom a 3D CAD file or channel design. In case you are calculate the volume of a basin or pond, select the"<Use Fixed Level>" option, and enter the level of the water surface. When no tide correction is used,this value is 0.00.
Calculate Volumes
Click the "Calculate" button to calculate areas and volumes for the selected matrices. Calculated valuesare split in totals, above reference (Matrix 2) and below reference (Matrix 2).
Totals
This section will display the total area and volume for the whole sounding. The processed area meansthe amount of overlap between the two matrices used. When a fixed level is used, the overlap is always100% and the processed area will be the same as the total area.

Post Processing 331
© 2009-2021 Eye4Software B.V.
Below Reference
Area and volume below the level found in Matrix 2 (see volume calculation conventions paragraph)
Above Reference
Area and volume above the level found in Matrix 2 (see volume calculation conventions paragraph)
Reports
Click the "Report" button to calculate area's and volumes from the selected matrices. This functioncreates a PDF report containing the calculated areas and volumes. Please note that PDF readersoftware needs to be installed on your computer. In Windows 10 you can use the built in "Reader"application.
Click the "Report..." button to generate a PDF report for the volume calculations.
7.9 Volume Calculation (Stages)
Volume Calculation (Stages)

Eye4Software Hydromagic 9.4332
© 2009-2021 Eye4Software B.V.
This volume calculation method is used to calculate the volume under various stages (levels) of water in,for example, frac pits and other water reservoirs. To calculate stages, you must first generate a matrixfrom your processed sounding.
Start the tool
To start the staging volumes tool, select the "Volume Calculations" => "Staging..." from the "Tools"menu. Next, select the matrix you want to use for staging volume calculations from the "Matrix" dropdown control as shown below:
Staging volume calculations for pits and ponds in Hydromagic.
Adjust spacing
The spacing between the stages can be selected. The default value is 1.00 meter. The interval can beselected in the "Step" field and the minimum value is 0.1 meter. After changing the selected matrix orstep, click the "Calculate" button to update the results. The unit used for the step is the same as thevertical units for the coordinate reference system used (US Survey Feet in the example above).
Exporting to Microsoft Excel
To export the calculated stages to Microsoft Excel, click the "Export..." button. Next choose the filename of the exported data. The data is stored as comma separated values (CSV) file, which can be

Post Processing 333
© 2009-2021 Eye4Software B.V.
opened in most software including Microsoft Excel. Below is an example of the above data imported inMicrosoft Excel:
The staging volume calculations imported in Excel through the CSV file format.
Creating a report
In addition to Excel exports, it is also possible to generate a PDF report containing the calculatedstages. To create a PDF report, click the "Report..." button and supply the software with a valid PDF filename. By default PDF reports are generated under the "Reports" folder in your project folder. To viewreports, you should have a PDF Viewer installed like "Acrobat Reader" or FoxIt" reader. Windows 10users can use the build in "Reader" application as well.
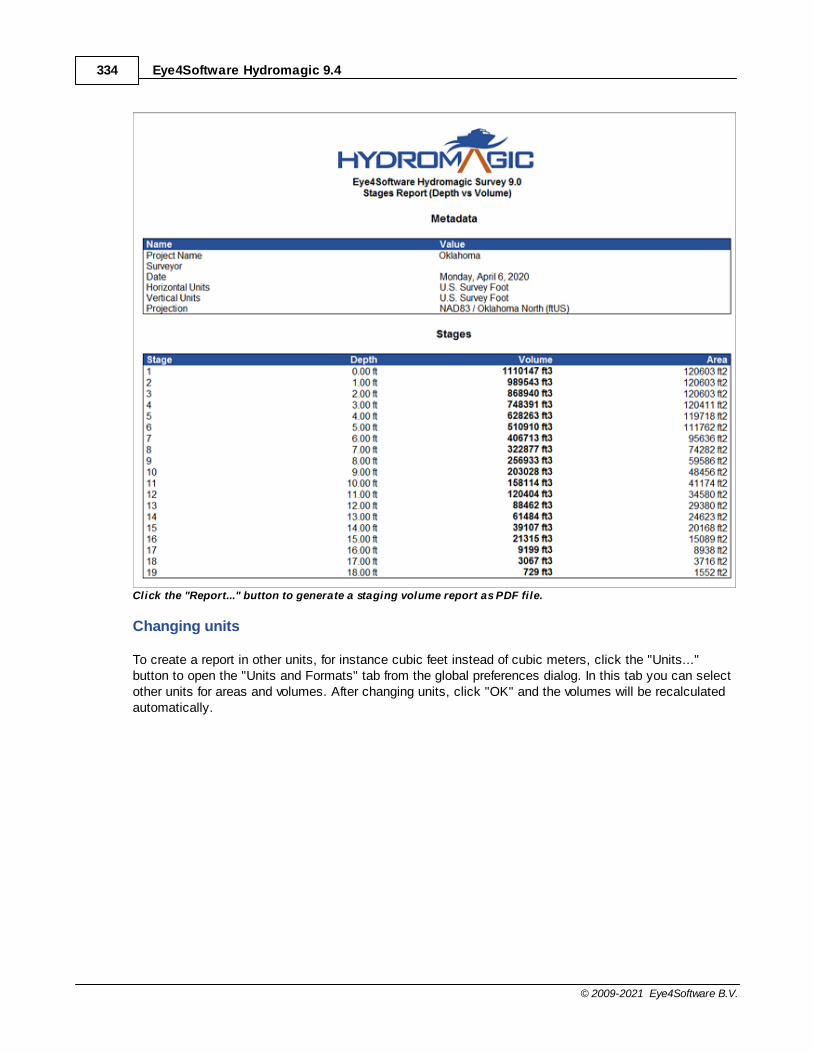
Eye4Software Hydromagic 9.4334
© 2009-2021 Eye4Software B.V.
Click the "Report..." button to generate a staging volume report as PDF file.
Changing units
To create a report in other units, for instance cubic feet instead of cubic meters, click the "Units..."button to open the "Units and Formats" tab from the global preferences dialog. In this tab you can selectother units for areas and volumes. After changing units, click "OK" and the volumes will be recalculatedautomatically.

Post Processing 335
© 2009-2021 Eye4Software B.V.
Change the units for volume and area in the unit settings tab.
7.10 Volume Calculation (Sections)
Volume Calculation using cross-sections
This volume calculation tool uses cross sections to calculate the total volume of a river section. Pleasenote that this method is only suitable in scenarios where the cross sections are almost the same lengthand have the same direction.
To calculate the volume, the difference between the depths or elevations is converted to an area andmultiplied with the distance between the cross sections.
To calculate volumes for frac pits, reservoirs or ponds, we recommend the use of the Stages method. Inorder to use this tool, you should already have generated soundings and cross sections.
This tool can be used to:
§ Calculate the total volume of a river section;§ Calculate the amount of sediment by comparing the same soundings at low and high frequency;§ Calculate the volume difference between two soundings, for instance, post- and pre dredging;§ Calculate the amount of volume to be removed compared to a channel design;§ Print graphical views of cross sections;§ Generate dredging volume reports.

Eye4Software Hydromagic 9.4336
© 2009-2021 Eye4Software B.V.
Volume calculation conventions
In Hydromagic, the following conventions are used when calculating volumes:
Sounding data above the fixed reference or channel design is used to calculate the "above volume". Thisis normally the amount of material that has to be dredged in order to get the channel design. Soundingdata below the fixed reference or channel design is used to calculate the "below volume". This isnormally the amount of material that has to be dumped in order to get the channel design. Whensounding data doesn't contain tide information, a value higher then the reference value is consideredbelow. Please note that when a vertical reference (datum) is used, it is the other way around. In this casevalues less then the reference value are used to calculate the below values.
The following image shows an example of a volume calculation (in "depth mode") with above and belowvalues:
This image shows the difference between "above" and "below" volume values.
Volume calculation tool
To start the matrix volume calculation tool, select the "Volumes (Sections)" option from the "Tools"menu. The following dialog will be shown:

Post Processing 337
© 2009-2021 Eye4Software B.V.
Use the cross sections volume calculation tool to determine dredging volumes.
Data selection
Which data has to be selected depends on how to use the tool. Use the pre- and post soundings toselect the soundings to use in the calculation.
When you want to calculate the amount of sediment, you select the same sounding in both input boxes,and select different frequencies. In case you end up with negative values, just swap the selectedfrequencies or the values selected in the "Pre-Sounding(s)" and "Post-Sounding(s)" fields.
For dredging volumes, select the soundings created before the dredging operations in the "Pre-Sounding(s)" field, and the soundings created after the dredging operations in the "Post-Sounding(s)"field.
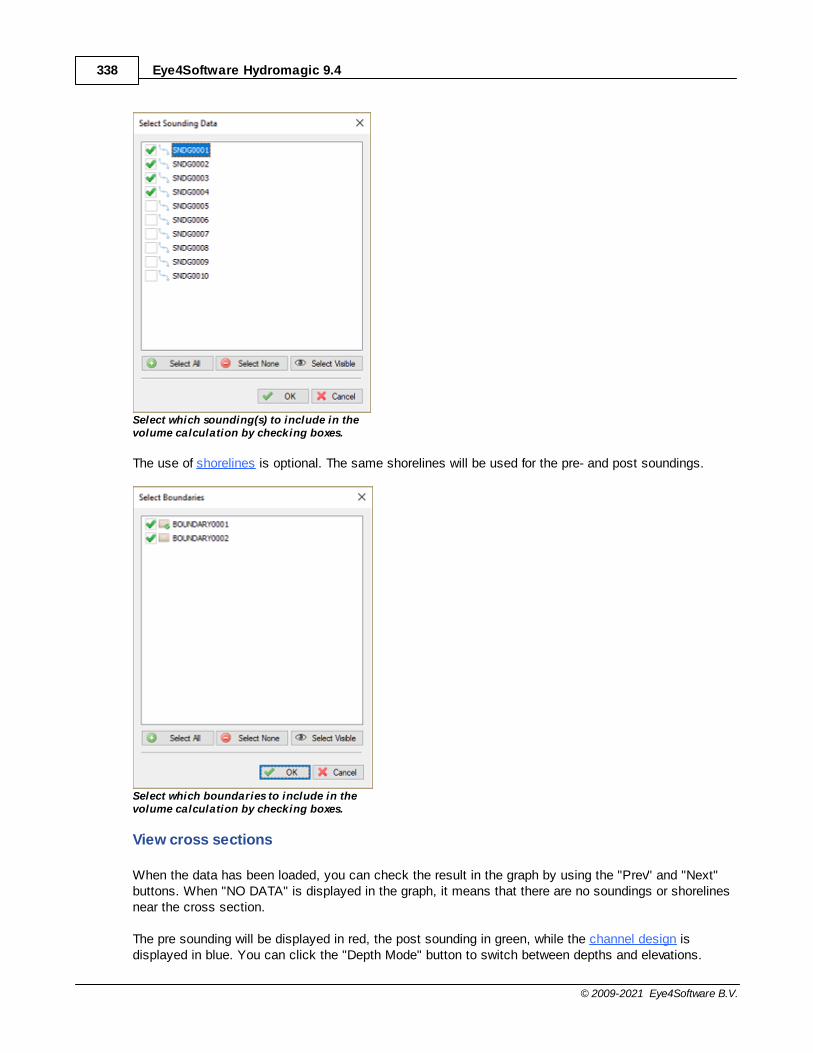
Eye4Software Hydromagic 9.4338
© 2009-2021 Eye4Software B.V.
Select which sounding(s) to include in thevolume calculation by checking boxes.
The use of shorelines is optional. The same shorelines will be used for the pre- and post soundings.
Select which boundaries to include in thevolume calculation by checking boxes.
View cross sections
When the data has been loaded, you can check the result in the graph by using the "Prev" and "Next"buttons. When "NO DATA" is displayed in the graph, it means that there are no soundings or shorelinesnear the cross section.
The pre sounding will be displayed in red, the post sounding in green, while the channel design isdisplayed in blue. You can click the "Depth Mode" button to switch between depths and elevations.

Post Processing 339
© 2009-2021 Eye4Software B.V.
Reporting
To generate a volumes report, click the "Report..." button. Please note that this function does not work inthe demo version of the software. Next, you have to provide a location and file name for the PDF report tobe generated. By default PDF reports are generated under the "Reports" folder in your project folder. Toview reports, you should have a PDF Viewer installed like "Acrobat Reader" or "FoxIt PDFViewer".Windows 8, 8.1 and 10 users can use the build in "Reader" application as well.
When clicking the print button, graphs for all sections will be send to the printer. Together with the PDFreport generated, you have a full report on for instance the performed dredging operations.
Save Images
To save all the graphs as image files, use the "Save Images..." option. This will generate image filescontaining 4 graph views each in the specified folder. These images can be used to include in otherdocuments.
7.11 Export to Google Earth
Export to Google Earth KML/KMZ files
KML (Keyhole Markup Language) is a XML format used by Google Earth to load overlays. KML cancontain point, polyline and polygon data, as well as one or more references to raster overlays (imagefiles). It is also possible to script complete Google Earth presentations into a KML file.
At this moment, Eye4Software Hydromagic supports point, line and polygon features, as well asattributes, styles and ground overlays. Eye4Software Hydromagic is able to both import and exportGoogle Earth KML files. This document describes how to export them.
Exporting Data
In Hydromagic, it is possible to convert soundings, vector maps, matrices, boundaries, comments,waypoints and cross section lines (planned lines) to Google Earth KML files. When exporting a matrix,depending on the options you select, an image file is generated and loaded in Google Earth as a socalled "ground overlay". A matrix can be exported using depth values as well. To start exporting data,select the "Export KML Data..." option from the "File" => "Export" menu as shown below:

Eye4Software Hydromagic 9.4340
© 2009-2021 Eye4Software B.V.
Select the "Export KM L Data..." option from the "File" => "Export" menu
Selecting data to export
In the dialog that appears, you will see a list of all items that can be converted to KML. Just check theitems you wish to export. By default, all visible items are selected. To reset the selection, click "SelectNone", to select all items, click "Select All".

Post Processing 341
© 2009-2021 Eye4Software B.V.
Select the Hydromagic project items you wish to export to the generated KM L or KM Z file.
Select output file
The next step is to select a location to store the exported data. You can save the data as a KML or(compressed) KMZ file. Click the "Browse..." button to open a save file dialog, and enter the name for thefile. In the save file dialog, you can also choose between the "KML" or "KMZ" formats. Please note thatyou must select "KMZ" when a matrix file is part of the selected items.

Eye4Software Hydromagic 9.4342
© 2009-2021 Eye4Software B.V.
Select the preferred file format. When exporting matrix data you M UST select KM Z.
KML Export Options
The KML export options instruct the software on how various Hydromagic project items are converted toGoogle Earth items. Since Google Earth may display items differently then Hydromagic, you can fullycustomize the way matrices, soundings and raw data are converted to KML data. To specify how depthvalues are exported as KML, just click the "Options..." button. In the dialog that appears you can adjustthe following preferences:
§ Matrix text interval in X direction;§ Matrix text interval in Y direction;§ Use colored text or black text;§ Number of decimals for matrix depths;§ Number of decimals for sounding depths;§ Number of decimals for raw data file depths;§ Whether to include the matrix image or not;§ Whether to draw the position track for soundings and raw data files.
KML export settings for matrix, soundings and raw data files are independent of how they are displayedon the screen. To alter these settings, click the "Options..." button at the bottom of the KML export tool.To configure how depths are drawn on your display, from the "Project Explorer", right click either the"Matrices", "Raw Data" or "Soundings" folder and select the "Display Options..." option.

Post Processing 343
© 2009-2021 Eye4Software B.V.
Configure how depth values are transformed into KM L data with the KM L Options dialog.
KML Format
When using the KML file format, a KML file is generated as well as an image file (PNG) for eachexported matrix. The image files are stored in the same folder as the location of the KML file. When notexporting matrices or large amounts of vector data, KML is probably the best option for you.
KMZ Format
If you are going to export matrices, or large amounts of vector data, KMZ is the best choice. A KMZ fileis a zipped archive containing a main KML file (doc.kml) and, in case of exporting image data such asmatrices, some image files. When using the KMZ file format, you can always transfer the data bydistributing a single KMZ file.
Starting the export
Just click "OK" to start the export. For small files, this takes only a couple of seconds, for large projectsit can take a couple of minutes. You can watch the progress in the status bar at the bottom of thescreen. When finished, you can view the details of the generation process in the "Processing" tab of theActivity View.
Examples of exported KML files
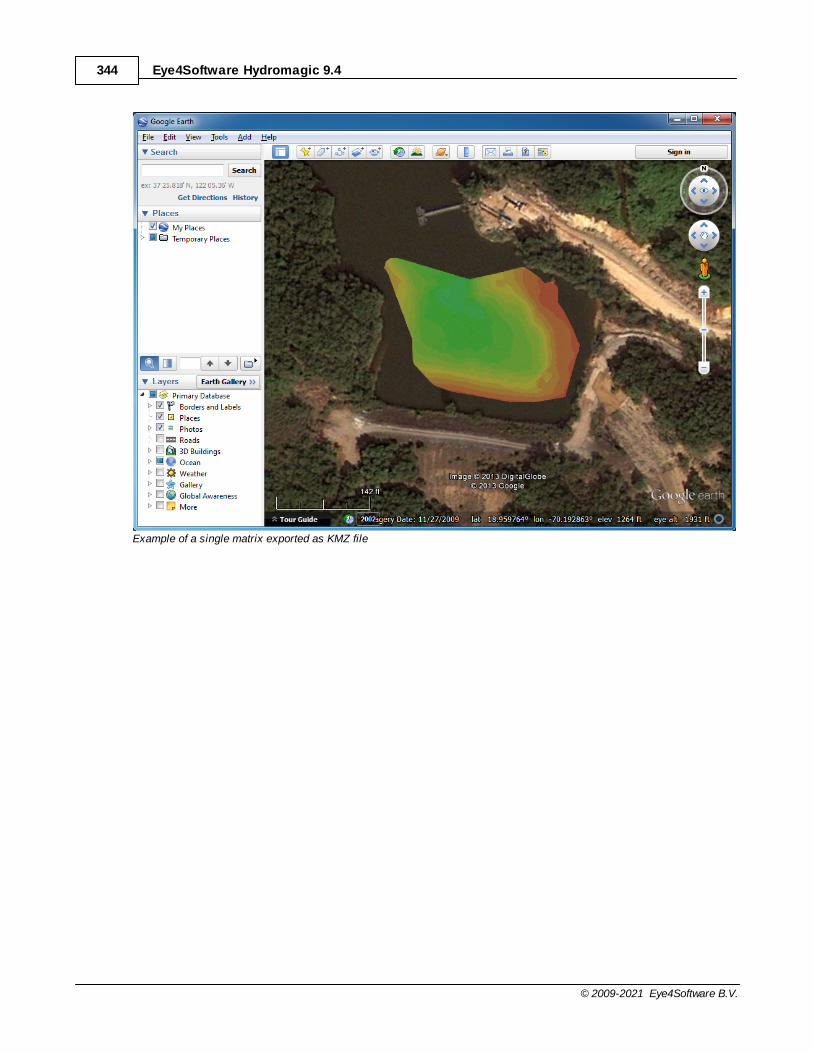
Eye4Software Hydromagic 9.4344
© 2009-2021 Eye4Software B.V.
Example of a single matrix exported as KMZ file

Post Processing 345
© 2009-2021 Eye4Software B.V.
Example of a single matrix with vector chart exported as KMZ file
7.12 Export to AutoCad
Introduction
After a sounding has been completed, it is possible to export both the background map (vector mapsonly), and the regularly spaced soundings (matrix) to an AutoCAD DXF file for further processing.
AutoCAD DXF files can be opened using AutoCAD, or you can use other CAD software such as QCad,or import the data in other GIS packages.
After you have created a matrix of your sounding, sections or map, you should have something like this:

Eye4Software Hydromagic 9.4346
© 2009-2021 Eye4Software B.V.
Starting the DXF Export tool
The DXF Exporting tool can be started by selecting the "Export" => "Export DXF Data" from the "File"menu.The following window should appear:

Post Processing 347
© 2009-2021 Eye4Software B.V.
Select Items
First, you have to select the items you wish to export as DXF features.The following Hydromagic objects can be exported to DXF:
· Vector Maps. · Matrices · Planned Survey Lines (Sections); · Soundings;· Raw data; · Boundaries (shorelines); · Comments; · Waypoints;
Just enable the checkbox in front of the objects you want to include in the final DXF file. To reset the selection, click the "Select None..." button, to select all objects, click "Select All...".

Eye4Software Hydromagic 9.4348
© 2009-2021 Eye4Software B.V.
Please note that only vector maps can be converted to DXF format. It is not possible to embed rastermaps into a DXF file.For a list of supported vector formats, please have a look at this document.
Output options
File name
Next, you have to select a file name for the DXF file. Click the "Browse..." button to select a file>If a file already exists, you will be prompted. If no extension has been supplied, .dxf will be appended.
Projection
It is possible to write the DXF data using another map projection then the one which is used in yourcurrent project.To do so, click the "Select..." button to choose the map projection for the output file.
Generate WKT projection file
When this option has been selected, an ESRI WKT compatible projection file will be written, allowing other software to set the correct map projection for the DXF file.
DXF Export (Text) Options
Some project items can only be exported to AutoCAD DXF files when they are converted to text.This is especially true for Hydromagic Matrix files. Since they are displayed in the software as an imagefile, only the textual part can be exported.
For raw data files and soundings, the track and the depth values can be displayed depending on theconfiguration made in this dialog box.
To specify how depth values are exported as DXF, just click the options button.In the dialog that appears you can adjust the following preferences:
· Matrix text interval in X direction;· Matrix text interval in Y direction;· Use colored text or not;· Display void or zero values or not;· Include Z-Values when drawing a track or not;· Display textual Z-Values for a sounding or raw data file or not.
DXF export settings for matrix, soundings and raw data files are independent of how they are displayedon the screen.To alter these settings, click the "Options..." button at the bottom of the DXF export tool.
To adjust how depths are drawn on your display, from the "Project Explorer", right clickeither the "Matrices", "Raw Data" or "Soundings" folder and select the "Display Options" option.

Post Processing 349
© 2009-2021 Eye4Software B.V.
Starting the export process
When all parameters are setup correctly, click "OK" to start the export. A progress indicator will appearat the bottom at the screen, and the window will close after a couple of seconds.You can now open the DXF file in most CAD programs, it is also possible to use the generated DXF fileas a background map in Hydromagic.
Opened in a CAD editor, the result will be (depending on your settings):
Opened in QCad

Eye4Software Hydromagic 9.4350
© 2009-2021 Eye4Software B.V.
Opened in Hydromagic
7.13 Export current view
Using Eye4Software Hydromagic, it is possible to save your current map view (including overlays likesoundings,boundaries, raw data, waypoints and comments) as an image file.
The software can also generate the world and projection files for you, so you will be able to load theimage file directly inother GPS or GIS mapping software, without the need to calibrate the map.
Exporting the view
In order to export the current map view as an image file, select "Export" => "Export Current View..." fromthe "File" menu.

Post Processing 351
© 2009-2021 Eye4Software B.V.
Export current view dialog
After a few seconds (time needed to capture the image), the following dialog should appear:
Output file format
Before selecting an output file, select the image format you want to use to save the image file.Hydromagic can store images in one of the following file formats:
· Graphics Interchange Format (*.gif);

Eye4Software Hydromagic 9.4352
© 2009-2021 Eye4Software B.V.
· Portable Network Graphics (*.png);· JPEG Image Files (*.jpg);· Tagged Image Format Files (*.tif);· Windows Bitmap Files (*.bmp).
Output file
First, you have to select the output format and the file name of the image file.After selecting the format, use the "Browse..." button to select the folder and file name.When you have selected a file that already exists, the software will ask whether you want to overwritethis file.

Post Processing 353
© 2009-2021 Eye4Software B.V.
Generate World File
In cases where you want to import the exported image file into another GPS or GIS mapping softwareproduct, you have to enable this option.The software stores the upper-left coordinates and the pixel sizes (scale) in the world file.
Depending on the image format you are using, the world file will have the following file extension:
· GIF World File - gfw;· PNG World File - pgw;· JPG World File - jgw;· TIF World File - tfw;· BMP World File - bpw;
3.726715
0
0
-3.726715
242435.599588
476855.346680
Example of a world file
Projection Files
The software can generate a ESRI WKT or PROJ.4 projection file for you. Together with a world file forgeo-referencing the image,this enables the screen shot to be imported in most GPS/GIS software packages.
The generated projection file will always have the ".prj" extension, irrespective of the selected format.

Eye4Software Hydromagic 9.4354
© 2009-2021 Eye4Software B.V.
PROJCS["Amersfoort / RD New",
GEOGCS["Amersfoort",
DATUM["Amersfoort",
SPHEROID["Bessel 1841",6377397.155,299.1528128,
AUTHORITY["EPSG","7004"]],
AUTHORITY["EPSG","6289"]],
PRIMEM["Greenwich",0,
AUTHORITY["EPSG","8901"]],
UNIT["degree",0.01745329251994328,
AUTHORITY["EPSG","9122"]],
AUTHORITY["EPSG","4289"]],
UNIT["metre",1,
AUTHORITY["EPSG","9001"]],
PROJECTION["Oblique_Stereographic"],
PARAMETER["latitude_of_origin",52.15616055555555],
PARAMETER["central_meridian",5.38763888888889],
PARAMETER["scale_factor",0.9999079],
PARAMETER["false_easting",155000],
PARAMETER["false_northing",463000],
AUTHORITY["EPSG","28992"],
AXIS["X",EAST],
AXIS["Y",NORTH]]
Example of an ESRI WKT projection file
Adding a map footer
It is possible to add a map footer to the exported image, which is also done when printing the screen.To select whether the map footer is included, and how the fields are filled, click the "Map FooterOptions..." button.
Exporting the map

Post Processing 355
© 2009-2021 Eye4Software B.V.
Just click "OK" to start the export. The software will now write the selected files. You can monitor theprogress in the status bar at the bottom of the screen.Depending on whether you checked the "Show image after export" the created image will be shown inthe Windows Photo Viewer.
7.14 Export echograms
Export echograms as images
After a sounding has been completed, it is possible to export echogram, water column information (alsocalled return echo envelope data) or sub bottom data (when available) as an image file. Multiple outputformats such as: PNG, JPG, GIF, TIF and BMP are supported. The resulting image files will be puttogether into a single folder (one file for each sounding). The files can be edited, or copied into yourreports directly.
NOTE: This feature was added in version 9.0 of Hydromagic Survey. If you encounter difficultiesgenerating these image files, please run the sounding wizard again as your sounding data might be in anolder format. Running the sounding wizard will update the soundings to version 9.0 compatible soundingfiles without altering the data.

Eye4Software Hydromagic 9.4356
© 2009-2021 Eye4Software B.V.
Example of a digitized depth echogram and return echo envelope combined in a single image file.
Echogram export tool
To start exporting echogram data as images, locate the "Soundings" folder in the "Project Explorer",which will be in most cases on the left side of the screen. Right click the folder and select the "ManageSoundings..." option from the popup menu that appears to launch the "Sounding manager".

Post Processing 357
© 2009-2021 Eye4Software B.V.
Click the "Export Echogram" button in the "Soundings M anager".
To start the echogram export tool, select the soundings you want to export and click the "ExportEchogram" button in the tool bar. The echogram export tool will now be displayed. In this tool you selectthe location for the exported images, the image format, soundings and the echograms you want toexport.
Configuring the export settings
Prior to exporting the images, there are some options to configure:
Output Folder
Click the "Browse..." button to select in which folder the image files will be written. This can be a folderunder your Hydromagic project root, any another location on your harddrive or even a network share.After selecting a new folder it will be displayed in the dialog. The dialog will also remember the filelocation for the next time you use this tool.
Select Soundings
By default, the soundings selected in the sounding list will be displayed here. Using the "Select..."button you will be able to alter this selection.
File Format
Select the file format of your choice for the creation of the image files. Supported image formats include:
§ Graphics Interchange Format (*.gif);§ Portable Network Graphics (*.png);§ JPEG Image Files (*.jpg);§ Tagged Image Format Files (*.tif);
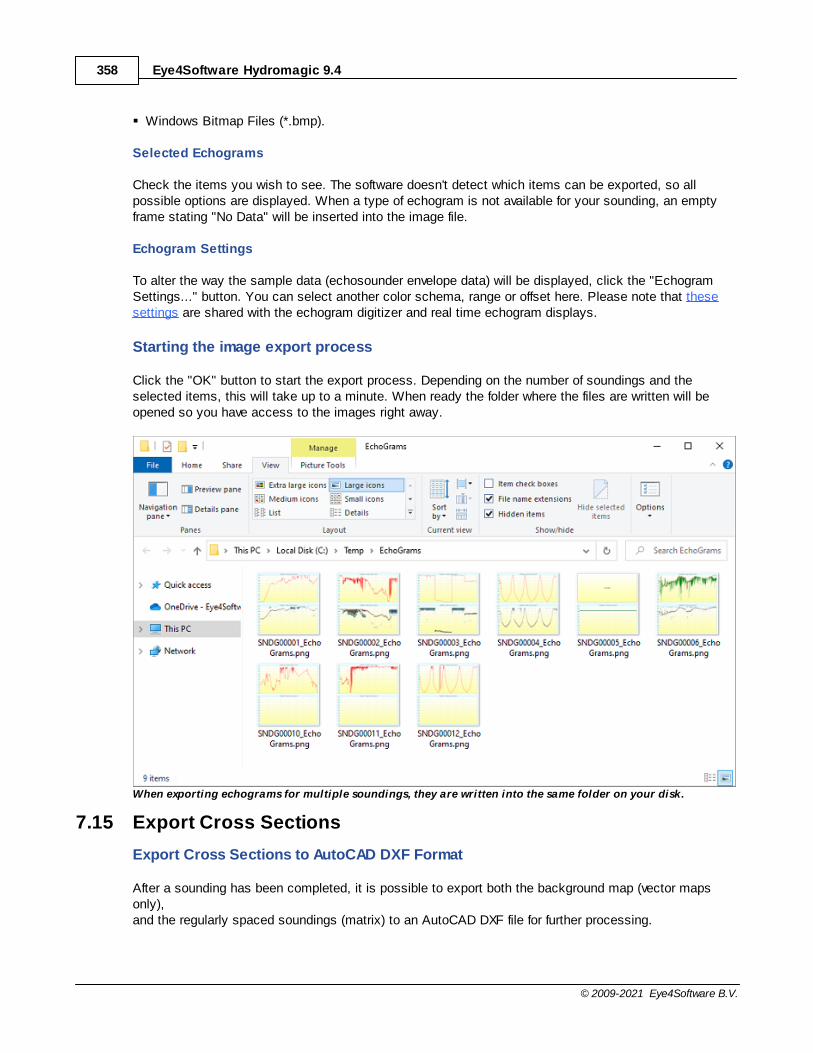
Eye4Software Hydromagic 9.4358
© 2009-2021 Eye4Software B.V.
§ Windows Bitmap Files (*.bmp).
Selected Echograms
Check the items you wish to see. The software doesn't detect which items can be exported, so allpossible options are displayed. When a type of echogram is not available for your sounding, an emptyframe stating "No Data" will be inserted into the image file.
Echogram Settings
To alter the way the sample data (echosounder envelope data) will be displayed, click the "EchogramSettings..." button. You can select another color schema, range or offset here. Please note that thesesettings are shared with the echogram digitizer and real time echogram displays.
Starting the image export process
Click the "OK" button to start the export process. Depending on the number of soundings and theselected items, this will take up to a minute. When ready the folder where the files are written will beopened so you have access to the images right away.
When exporting echograms for multiple soundings, they are written into the same folder on your disk.
7.15 Export Cross Sections
Export Cross Sections to AutoCAD DXF Format
After a sounding has been completed, it is possible to export both the background map (vector mapsonly),and the regularly spaced soundings (matrix) to an AutoCAD DXF file for further processing.
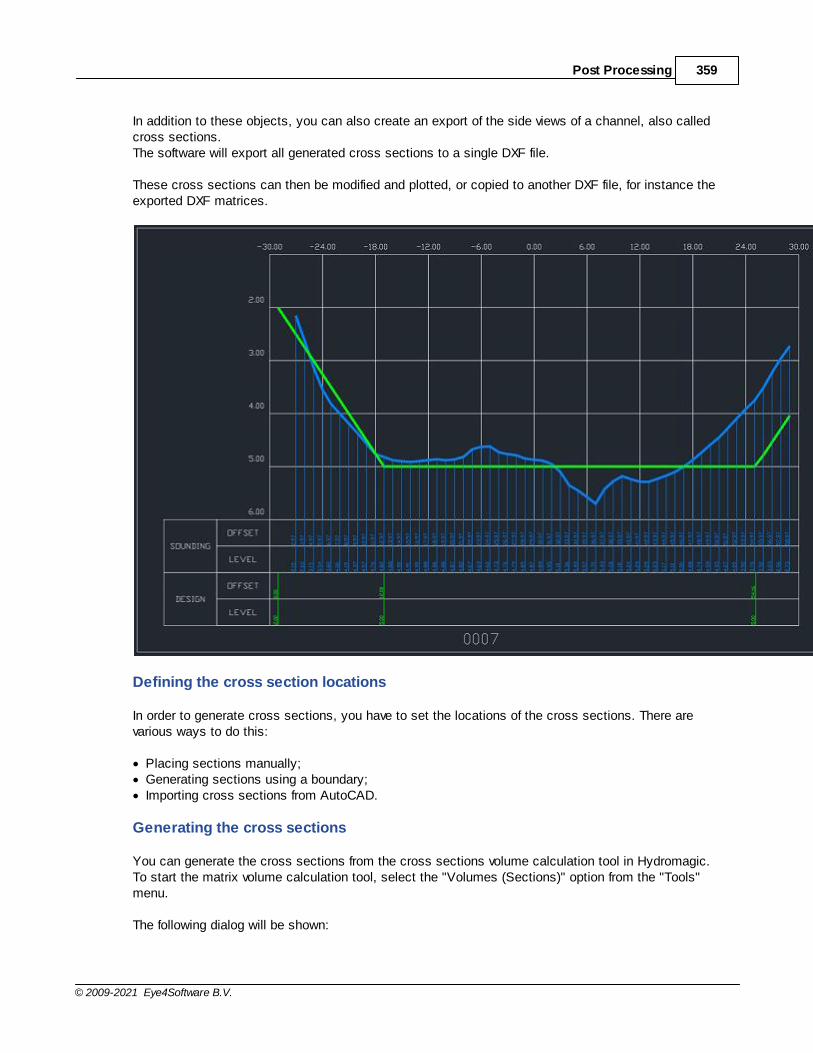
Post Processing 359
© 2009-2021 Eye4Software B.V.
In addition to these objects, you can also create an export of the side views of a channel, also calledcross sections.The software will export all generated cross sections to a single DXF file.
These cross sections can then be modified and plotted, or copied to another DXF file, for instance theexported DXF matrices.
Defining the cross section locations
In order to generate cross sections, you have to set the locations of the cross sections. There arevarious ways to do this:
· Placing sections manually;· Generating sections using a boundary;· Importing cross sections from AutoCAD.
Generating the cross sections
You can generate the cross sections from the cross sections volume calculation tool in Hydromagic.To start the matrix volume calculation tool, select the "Volumes (Sections)" option from the "Tools"menu.
The following dialog will be shown:

Eye4Software Hydromagic 9.4360
© 2009-2021 Eye4Software B.V.
Data selection
Which data has to be selected depends on how to use the tool.Use the pre- and post soundings to select the soundings to use in the calculation.
When you want to calculate the amount of sediment, you select the same sounding in both input boxes,and select different frequencies.In case you end up with negative values, just swap the selected frequencies or the values selected in the"Pre-Sounding(s)" and "Post-Sounding(s)" fields.
For dredging volumes, select the soundings created before the dredging operations in the "Pre-Sounding(s)" field,and the soundings created after the dredging operations in the "Post-Sounding(s)" field.
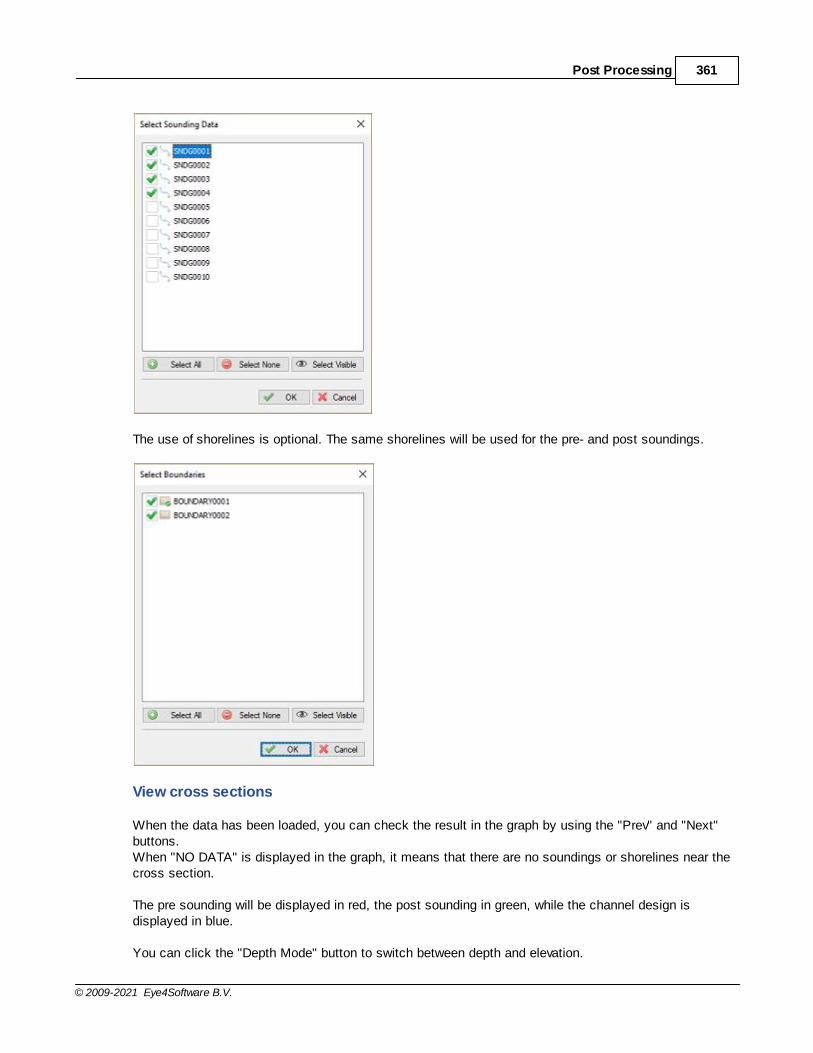
Post Processing 361
© 2009-2021 Eye4Software B.V.
The use of shorelines is optional. The same shorelines will be used for the pre- and post soundings.
View cross sections
When the data has been loaded, you can check the result in the graph by using the "Prev" and "Next"buttons.When "NO DATA" is displayed in the graph, it means that there are no soundings or shorelines near thecross section.
The pre sounding will be displayed in red, the post sounding in green, while the channel design isdisplayed in blue.
You can click the "Depth Mode" button to switch between depth and elevation.

Eye4Software Hydromagic 9.4362
© 2009-2021 Eye4Software B.V.
When all sections are displaying correctly, you are ready to export the data as AutoCAD DXF file.
Starting the export process
When everything has been setup correctly (included soundings and boundaries), you can export thecross sections data as CAD format.To do so, just click the "Save CAD" button and supply a valid DXF file name.
A popup will be shown whether the export was successfull. The DXF file can be opened in AutoCAD orother CAD programs supporting the DXF file format.

Dredging 363
© 2009-2021 Eye4Software B.V.
8 Dredging
8.1 Hydromagic Dredging
Monitoring and recording dredging progress
The Hydromagic Dredging package is a module shipped with Hydromagic that allows you to monitordredging progress. It needs a separate license, and can be purchased with or without the HydromagicSurvey software. The software can log the dredging file as a series of points or by updating a XYZ matrixfile. Please note that this feature needs additional sensors to be installed (inclino sensors). Currently thesoftware works for cutter, hopper and backhoe / excavator dredges.
Depth vs Elevation
Dredging data can be monitored in either depth or elevation mode. In depth mode, the absolute dredgingdepth below the waterline is recorded. This option must only be used when the water level is constant.When the water level is variable (tides), the dredging depth is no longer useful, since the tide level isn'tlogged with the depth (only in the log files, not the matrix).
When the water level isn't constant, always use elevation mode. In this mode the dredging depth isstored as an elevation relative to the local height datum (for instance NAVD88). To use this mode, thecorrect water level has to be entered, or measured with RTK. More information on how to determine thewater level with RTK can be found here. To enter the water level manually, select the "Set Tide Level..."option using the manual tide plugin.
Creating an empty matrix
When recording dredging data, data can be stored in a user defined log file as well as in a matrix. Amatrix is basically a file that contains XYZ coordinates with a fixed cell distance. During the dredgeprocess the cell's will be updated with the maximum dredging depth and displayed as map overlay.
Before we can update a matrix with our data, we have to create an empty one. To do so we first have tospecify the area to cover. This should be done by drawing a boundary first.
When the boundary has been created, make sure the "Project Explorer" is visible ("Project Explorer"from the "View" menu) and right click on the "Matrices" folder.

Eye4Software Hydromagic 9.4364
© 2009-2021 Eye4Software B.V.
Select the "Generate M atrix..." option from the popup menu to start a new matrix file.
From the popup menu, select the "Generate Matrix..." option. The "Generate Empty Matrix" dialogappears:
Generate an empty or pre-filled matrix file which can be used to record dredging depths or elevations
The matrix file used in Hydromagic has three layers. It is possible to set a preset value in one of thethree (pre dredge, dredge and post dredge) layers. To simply monitor dredge progress, just leave theboxes unchecked so all layers are filled with void values.
You can adjust the space of the cells. A cell spacing of 0.5 means that dredging data is stored in a 50 x50 cm grid. You also need to select a file name and the boundary you created to define the area for the
Dredging 365
© 2009-2021 Eye4Software B.V.
matrix. When you are happy with the settings, just press "OK" to proceed with matrix creation. Aftersuccessful creation the new matrix will be displayed in the project explorer.
Start recording
When you are ready to start recording, just click the "Record" button ( ) to start recording the XYZpositions of the dredge. Log data files are generated every time you start a new recording. Matrixupdating will be performed on the matrix which is set as "Active" in the "Project Explorer".
To pause a recording without generating a new log file, just click the "Pause" button ( ) instead. Whenclicking the pause button again, the recoding will resume writing data to the same log data file.
During recording, log files should increase in size, display depths on the map and the matrix file shouldupdate when the vessel is moving and the dredging depth increases. If nothing is logged, or no matrixupdates are visible, please perform the following checklist:
· Is the dredging layer of the matrix selected (button with the blue bar in the middle);· Is the dredging depth more then the minimum value to be logged in "Preferences" => "Dredging";· Is the dredging depth more then the preset value entered during the matrix creation (N/A when void
was selected);· Are any alarms triggered as this can pause the recording of data;· Is the dredging position outside the boundary used to generate the matrix;· Check the log and matrix display options in the "Project Explorer";· Are there color ranges defined for the dredging depths recorded;· Is the matrix used for recording set as active (right click => "Set Active" in project explorer);· Are the dredging depth and vessel position displayed in green in the "Data View";
Matrix Display Options
There are more ways of showing the matrix on the map. You can for instance display it as both colorsand text at a specified interval.
It is also possible to not show it (and just use the matrix to export data),to show it with colors only (using the defined color ranges) or to show its depths as text.
To change settings on how the matrix is shown,right click the "Matrices" folder in the "Project Explorer",and select the "Display Options..." option from the popup menu.
A dialog with all matrix settings will be displayed. It should look like the screen shot below:
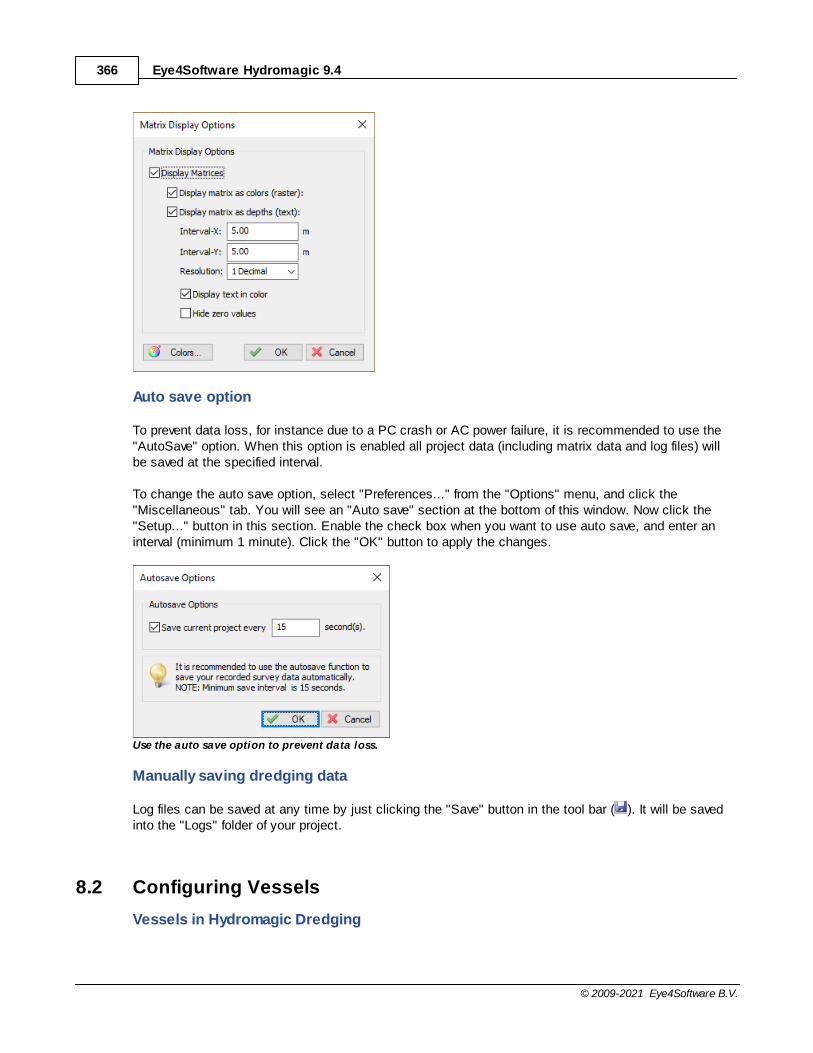
Eye4Software Hydromagic 9.4366
© 2009-2021 Eye4Software B.V.
Auto save option
To prevent data loss, for instance due to a PC crash or AC power failure, it is recommended to use the"AutoSave" option. When this option is enabled all project data (including matrix data and log files) willbe saved at the specified interval.
To change the auto save option, select "Preferences..." from the "Options" menu, and click the"Miscellaneous" tab. You will see an "Auto save" section at the bottom of this window. Now click the"Setup..." button in this section. Enable the check box when you want to use auto save, and enter aninterval (minimum 1 minute). Click the "OK" button to apply the changes.
Use the auto save option to prevent data loss.
Manually saving dredging data
Log files can be saved at any time by just clicking the "Save" button in the tool bar ( ). It will be savedinto the "Logs" folder of your project.
8.2 Configuring Vessels
Vessels in Hydromagic Dredging

Dredging 367
© 2009-2021 Eye4Software B.V.
In Hydromagic Dredging, a vessel object is used to represent a moving object like a dredger, barge or anexcavator. A moving object can be configured as a vessel when it has been equipped with its own(GNSS) positioning system. When configuring dredging equipment, like a suction tube, cutter ladder orbackhoe dredger, a vessel is used as a 'base' for this equipment.
Most of the time, for instance when you are configuring a trailing suction hopper dredger or cutterdredger, the dredging equipment is attached to the vessel, and you only have to configure the primaryvessel. In the event that an excavator is placed on a barge, and both the barge and excavator areequipped with a positioning system, you have to configure both vessels to show them both in thenavigation display. The images below show the difference between a single and dual vesselconfiguration:
Single vessel configuration. The dredging equipment is attached directly to the vessel or barge.

Eye4Software Hydromagic 9.4368
© 2009-2021 Eye4Software B.V.
Dual vessel configuration. The excavator (red) has its own positioning system and can move around the barge(blue).
Configuring Vessels
To change the description, shape, color or other map display settings of a vessel, select "Preferences..."from the "Options" menu and select the "Dredging" tab. On this tab, you will find two buttons labeled"Primary Vessel..." and "Secondary Vessel...". Click the "Primary Vessel..." button to setup your vesselor barge. The "Secondary Vessel..." button can be used to setup, for example, an excavator which is onthe barge.
NOTE: When two vessels are drawn in the display view despite of having only one vesselconfigured, just un-check all the data sources in the secondary vessel configuration screen to getrid of the second shape. See the "Selecting data sources" paragraph for more information.

Dredging 369
© 2009-2021 Eye4Software B.V.
Configure the vessel's from the "Dredging" tab.
Vessel Description
You can enter a vessel description in this field, for instance "Barge" or "Excavator". When configuringdredging equipment you can select the 'base' vessel by selecting this name. This is also the name whichis displayed when including the vessel name in user defined log files. It is not allowed to use specialcharacters here (except for spaces).
Enter a descriptive name for the vessel.
Selecting data sources (plugins)
By checking the check boxes, you can select which data sources (or plugin data) is used to set thevessel's position, heading, speed and motion (pitch and roll). When only one vessel needs to beconfigured, check all the boxes for the primary vessel and un-check all boxes in the secondary vessel'sconfiguration. No need to select dredging sensors here, unless they provide draft, pitch or rollinformation.

Eye4Software Hydromagic 9.4370
© 2009-2021 Eye4Software B.V.
Select the plugins used to position the selected vessel.
Heading sensor configuration
Some plugins for position can report both magnetic and true heading. For instance when data is comingin via a data combiner, or when a GNSS device contains a build in magnetic compass. True heading a aheading calculated by movement, for instance by calculating heading between the current and previousposition. When a magnetic compass or gyro has been installed, select the magnetic heading rather thena true heading, since a magnetic heading is also reliable when the vessel is not moving (or very movingslowly).
When using a RTK or GNSS heading sensor, it is sometimes needed to apply an additional offset. Forinstance when antenna's are placed next to each other instead of parallel to the vessels direction. In thiscase select a 90 or 270 degrees offset.
Select which heading sensor to use, either a compass or calculated heading.
Vessel shapes and color
In this section you must provide a shape file for the vessel. This can be the shape of a barge, vessel orexcavator. When you are configuring an excavator on a barge, where both the excavator and barge areequipped with their own positioning system, you have to select the barge shape for the primary vesseland the excavator shape for the secondary. Click the "Browse..." button to select a vessel shape.Hydromagic ships with a collection of vessel shapes which are installed in the "Vessel" folder. Byclicking the "Editor..." button you will launch the "Vessel Designer", which can be used to draw or modifyvessel shapes, or to import vessel shapes from AutoCAD DXF files.
You can select other vessel colors, for instance make sure the vessel contrasts with the backgroundmap (i.e. dark color when a street map or vector map is used, or yellow to improve visibility on a satelliteimage.
Select the vessel (top view) shape file to be used in the map view.
Distance rings
With the "Ring Count" option set to any value higher then zero, a set of rings will be drawn around theship at fixed intervals. Use this function, for example, to see at a glance how far away the objects arefrom the boat. Another useful option is to set the interval to the distance between survey lines to get

Dredging 371
© 2009-2021 Eye4Software B.V.
some sort of guidance. In addition to setting the distance between the rings and the number of rings, it isalso possible to choose a drawing color for the rings, which is clearly visible against the background.
Distance rings can be used to see how far away objects are.
Distance rings around your GNSS position at a specified interval.
Course Line
The course line can be used to see where the vessel is going. Please note that the course line isindicating the correct heading only when the NMEA0183 output of your GPS or RTK receiver outputs thisinformation and the vessel is moving. Alternatively, a compass or RTK heading sensor can be used todetermine the correct course.
Check the show bearing option to display a course line on the map display.
Saving the settings
Click the "OK" button to save your chances. When more then one vessel needs to be displayed on themap display, just repeat this step for the secondary vessel by clicking the "Secondary Vessel..." buttonon the "Dredging" tab in the global preferences window.

Eye4Software Hydromagic 9.4372
© 2009-2021 Eye4Software B.V.
An example vessel configuration using the first NM EA0183 plugin for positioning.
8.3 Configuring Dredging Equipment
Dredging Equipment

Dredging 373
© 2009-2021 Eye4Software B.V.
In Hydromagic Dredging, you can configure one or more pieces of dredging equipment depending on thelicense you have bought. Three different license models are available:
Single Head License
With the single head license you can monitor one dredge head only. This option will probably besufficient for most cutter and trailing suction hopper dredgers. This license limits the number of dredgeheads that will be recorded to just one. You are allowed to configure multiple pieces of equipment, butonly one can be used at a time.
Dual Head License
To monitor a trailing suction hopper dredger with two suction tubes, you need the dual head license to beable to monitor two dredge head positions at a time.
Excavator or Backhoe License
To monitor the position of an excavator or backhoe dredger, you need this license. It supports monitoringof the excavator position, rotation and you can display the barge and excavator independently.
Dredging Equipment Configuration
Dredging equipment can be configured by selecting a vessel, attachment position and by adding thesegments that make up the dredging equipment, for instance, when configuring a backhoe dredger, youselect the barge, position on the deck and the cabin, boom, stick and bucket segments. Because of thismodular approach, you can configure almost every type of equipment. For instance, when your excavatorcontains a second boom, you just load the standard excavator configuration and adapt it by just adding anew boom segment.
To start configuring dredging equipment, select the "Preferences..." option from the "Tools" menu andselect the "Dredging" tab. In the "Dredger Configurations" list, the already configured items will bedisplayed. You can remove the existing item(s) by selecting them one by one and clicking the"Remove..." button. Now you can add a new configuration item by clicking the "New..." button.

Eye4Software Hydromagic 9.4374
© 2009-2021 Eye4Software B.V.
Click the "New..." button to add a new dredging equipment configuration.
Adding new equipment
After clicking the "New..." button the "Dredge Equipment Configuration" dialog will be shown. In thismanual, we will call each suction tube, excavator or other tool "Dredge Equipment". First add a name forthe equipment. This is how we can select it in the data or digging views. This is also the name written tothe log file when the "Dredge Name" field is included. Since it could be written to a file, no specialcharacters other then alphanumeric characters and spaces are allowed. Good examples are: "HopperDredger (STBD)", "Hopper Dredger (PORT)", "Cutter" or "Excavator".
Use the "Type:" drop down box to select the type of equipment. Examples include: "Excavator","Backhoe", "Cutter" and "Hopper". It is important to set this option correctly, otherwise you wont be ableto confgure the dredge segments correctly.
Dredging equipment has to be associated with a 'Vessel' to which it has been attached. You can selecta vessel from the drop-down list. For all configurations other then excavators, you should choose the firstoption (Primary). You can read more on vessels in the "Configuring Vessels" document.
After selecting the vessel, click the "Vessel Configuration..." button to select the shape file used todisplay the vessel itself.

Dredging 375
© 2009-2021 Eye4Software B.V.
The first section of the dialog contains some important global settings.
Attachment Point Coordinates
The dredging equipment is always attached to the vessel. In order to calculate the correct easting andnorthing coordinates for the dredge head, you have to enter the coordinates of the attachment pointrelative to the vessel's center point. After importing a drawing of your vessel into the "Vessel Designer",you can place a pivot point at the attachment position to read out the XYZ coordinates of this point asshown in the image below.
Regarding the vessels center point, it doesn't really matter how you center your vessel around the (0, 0,0) coordinate in the vessel designer, as long as all sensors are relative to this point (attachment point,draft sensor and GNSS antenna).
The attachment points can be determined by analyzing a drawing of the vessel in the "Vessel Designer".

Eye4Software Hydromagic 9.4376
© 2009-2021 Eye4Software B.V.
Logging and display options
In the logging and display options section, you can select whether or not to use the dredge head positionto update the matrix or log file. You can also disable alarms for this dredge head. This can be usefulwhen you have two suction tubes on a hopper dredger and a sensor on one of the tubes ismalfunctioning. In this case, you can still log data from one dredge head only.
Various (logging) options for the selected dredge equipment.
Dredge Segments
In the dredge segments section, you can add all the segments that make up the dredge equipment. Thefollowing segments can be defined:
· Cutter Dredger: Ladder and cutter head;· Trailing Suction Dredger: Trunnion, ladder and dredge head;· Excavator: Base, cabin, boom, stick, quick attachment, dog bones and bucket;
Use the "Add..." button to start adding a new segment. With the "Edit..." button you can accesscalibration options or change the length or length of a segment. It is important to add the segments inthe correct order. The segment which is attached to the vessel comes first, and the dredge head orexcavator bucket last. You can change the order of the segments by selecting the item you want tomove, and clicking the up and down arrows to move the item up or down the list.
For more information on the types of segments, and how to configure them, please refer to the"Configuring Dredger Segments" manual page.
In the "Dredge Segments" section you can define
the segments of your dredge equipment.
8.4 Configuring Dredger Segments
Configuring Dredge Segments
In Hydromagic Dredging, dredging equipment is configured by adding dredge segments. A dredgesegment is any moving part of the dredger, for instance:
· Cutter Dredger: Ladder and cutter head;· Trailing Suction Dredger: Trunnion, ladder and dredge head;· Excavator: Base, cabin, boom, stick, quick attachment, dog bones and bucket;

Dredging 377
© 2009-2021 Eye4Software B.V.
·
This configuration method allows you to compose almost any dredger configuration by just addingsegments. Each set of segments is called dredging equipment. You can have multiple dredgingequipment items configured in Hydromagic Dredging. Dredging equipment can be connected to a vesselusing an attachment point.
Adding a segment
When adding a new segment, the "Configure Dredge Segment" dialog will be displayed. In this dialogyou select the type of segment to be added, the shape file used to visualize the segment on the screenand the data source which controls the movement of this segment (inclino sensor, bubble sensor,rotation sensor, etc...).
Adding a new segment to the dredge equipment definition.
Selecting the segment type
First you have to define the type of segment to be added. The different segment types are explained indetail below:
Base
The base of an excavator, the part where the wheels are attached to. This type can only be used whenconfiguring an excavator. When the excavator is attached directly to the vessel (i.e. a backhoe dredger),

Eye4Software Hydromagic 9.4378
© 2009-2021 Eye4Software B.V.
skip this segment and start with the 'Cabin'. Hydromagic assumes the base is always at a fixed positionon the vessel, which means you only have to define a shape for the base.
Cabin
The cabin of an excavator, which is where the operator controls it. This segment type can be used for anexcavator or backhoe dredger. If the cabin can rotate relative to the 'base', and it does not have its ownGNSS positioning system with heading, you have to define a rotational sensor in the data sourcesettings. Please note that the rotation of the cabin will not be displayed in 2-dimensional side views.
Boom
The 'boom' of an excavator is the first vertically moving segment attached to the cabin of the excavator orbackhoe dredger. This segment should be equipped with an inclino sensor to report the vertical angle ofthe segment.
Stick
The 'stick' of an excavator is the second vertically moving segment which is placed between the 'boom'and 'bucket'. This segment should be equipped with an inclino sensor to report the vertical angle of thesegment.
Bucket
The bucket can be attached to the stick directly or via a 'quick attachment. When a quick attachment isused, configure this segment before adding the bucket to the segment list. When the inclino sensor ismounted on one of the dog bone segments rather then on the bucket directly, click the "Settings..."button to enter the dimensions of the dog bone segments.
Trunnion
When a suction tube or ladder is connected to the side of the vessel, it is connect via a part called the'trunnion'. This parts adds an additional horizontal offset to the dredge position. When configuring ahopper dredger, add the trunnion segment first.
Ladder
A ladder can be a vertically (and sometimes horizontally) moving segment where the cutter head ordredge head is connected to. Some trailing suction hopper dredges, with a greater depth range, mighthave two or even three ladder segments between the vessel and the dredge head.
Dredge Head
Configure a dredge head to enter the dimensions of the dredge head. It is important to enter the correctwidth for the dredge head so the matrix can be updated accordingly. When the dredge head shape is inthe ladder shape file, just set the length of this segment to zero, and enter the head dimensions only byclicking the "Settings..." button.
Cutter Head
Configure a cutter head to enter the dimensions of the cutter head. It is important to enter the correctwidth for the dredge head so the matrix can be updated accordingly. When the cutter head shape is in

Dredging 379
© 2009-2021 Eye4Software B.V.
the ladder shape file, just set the length of this segment to zero, and enter the head dimensions only byclicking the "Settings..." button.
Segment Shape File
The segment shape file is a collection of lines which represent one of the dredger segments. This file isused to present the user with a top or side view of the dredger. For each moving segment you have tospecify a shape file. Hydromagic is shipped with a collection of files for different dredge segment types.Using the 'Vessel Editor' tool, you can draw your own shapes, or import shapes created in AutoCAD.
Segment Length
Data Sources
8.5 Dogbones configuration on excavators
Excavator dog bones configuration
To prevent the bucket sensor from being damaged, it is often placed above it on the so called dog bone.The dog bone is a piece of metal with the shape of a dog bone which is attached to the stick. When thesensor is placed here, additional calculations should be made to calculate the angle of the bucket.
The formula needed to calculate the bucket angle requires some additional parameters, like thedimensions of some parts, as well as the angles between them. Have a look at the image below to seewhat needs to be entered:

Eye4Software Hydromagic 9.4380
© 2009-2021 Eye4Software B.V.
Enter the dimensions of the 'Dog Bone' segments when sensor is not placed on the bucket
Entering the dog bone dimensions
To enter these variables, select the "Preferences..." option from the "Options" menu. Next click the"Dredging" tab and double-click the excavator in the dredging equipment list. In the list of segments,locate the "Bucket" and double click it. Now click the "Settings..." button next to the segment type.

Dredging 381
© 2009-2021 Eye4Software B.V.
The bucket settings can be found in the dredge segment configuration dialog.
You can now enter the dimensions and angles of the dog bones. You can enter the lengths in any unityou want, as long as the unit used is the same for all four length values. The angle values should beentered in degrees. To test the configuration, you can simulate the excavator sensors by using the"Excavator Simulator" plugin which is shipped with the product.

Eye4Software Hydromagic 9.4382
© 2009-2021 Eye4Software B.V.
Enter the dog bone lengths and angles in the Excavator Bucket Configuration dialog.
8.6 Excavator or backhoe calibration
Excavator or backhoe calibration
To determine the position of the various moving segments on an excavator (boom, stick, bucket etc...),angle or gravity sensors are mounted on these segments to tell the software there position. Since it isnot always possible to mount the sensors absolutely in line with the segment, or they can be a little of,you have to calibrate the sensors.
In Hydromagic Dredging, calibration can be done by adding an offset to all measurements. You coulduse a leveler and correct all values by hand, but since the segments off the excavator form a triangle, wecan use math to fix this problem.Preparation
Before starting the calibration process:
· Make sure all sensors are powered on and connected to the system;· Check whether the correct plugin for your dredging system has been loaded;· Check whether sensor values are coming in;· Make sure that the segment lengths are entered correctly;· Make sure the dog bone dimensions have been entered when the sensor is not placed on the
bucket itself.
To start the calibration tool, select the "Preferences..." option from the "Options" menu. Next click the"Dredging" tab and double-click the excavator in the dredging equipment list. When the equipment isconfigured as excavator or backhoe dredger, the "Calibrate Excavator..." button should be visible.

Dredging 383
© 2009-2021 Eye4Software B.V.
Click the "Calibrate Excavator..." button to open the calibration tool.
Positioning the excavator
Before starting the calibration, we have to position the excavator to form a triangle while the bucket isvertically and with the tooth at the same level as the barge deck or the ground. The image below shouldmake things more clear.
When the excavator is in the correct position, you have to do two measurements:
X1 Measurement
Measure the distance between the joint on the base to the joint on the bucket. Please note that thelength has to be measured between the center of the joints. If needed convert the length to meters andwrite it down.
D1 Measurement

Eye4Software Hydromagic 9.4384
© 2009-2021 Eye4Software B.V.
Measure the distance between the joint on the base and the ground or deck of the vessel. Please notethat you have to measure from the center of the joint. If needed convert the length to meters and write itdown.
M easure the D1 and X1 distances in order to calibrate your excavator or backhoe.
Starting the calibration tool
When measurements have been taken, the excavator is still in the correct position and the sensors aresending data, we can start the calibration tool. Please go back to the excavator settings and locate andclick the 'Calibration...' button.
The parameters needed for the calibration are the segment lengths as well as the X1 and D1 values wemeasured. The lengths are already filled in, you only have to supply the X1 and D1 value.
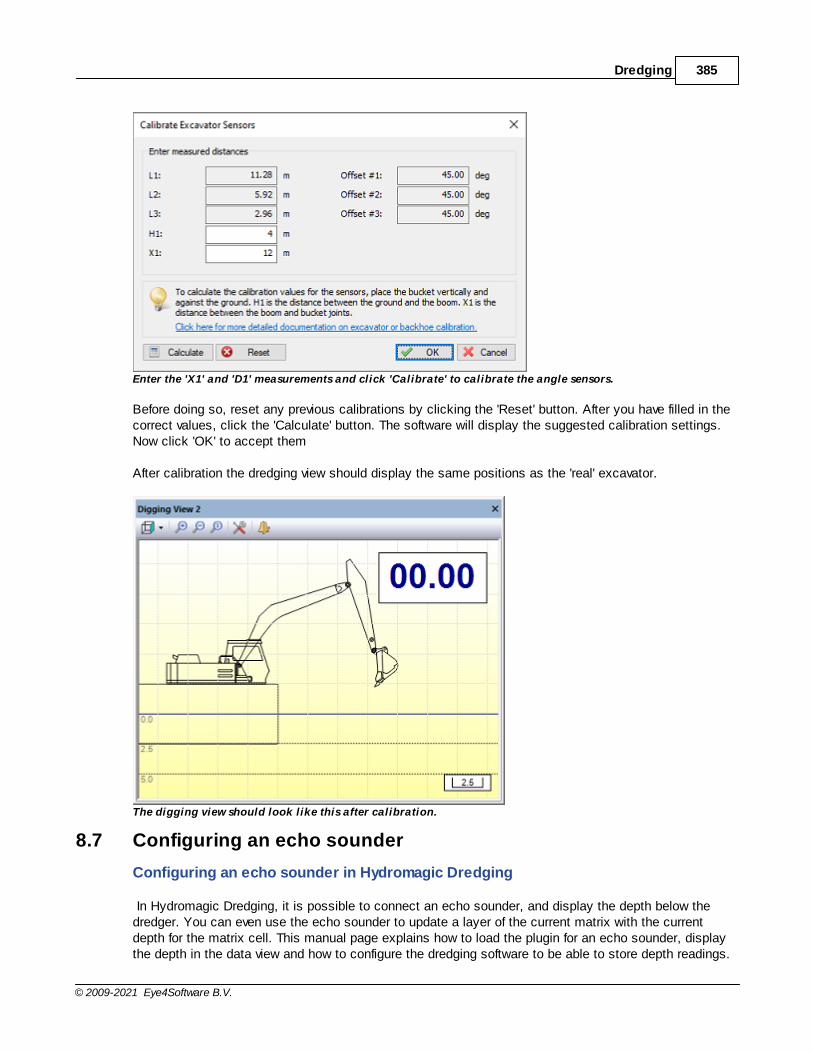
Dredging 385
© 2009-2021 Eye4Software B.V.
Enter the 'X1' and 'D1' measurements and click 'Calibrate' to calibrate the angle sensors.
Before doing so, reset any previous calibrations by clicking the 'Reset' button. After you have filled in thecorrect values, click the 'Calculate' button. The software will display the suggested calibration settings.Now click 'OK' to accept them
After calibration the dredging view should display the same positions as the 'real' excavator.
The digging view should look like this after calibration.
8.7 Configuring an echo sounder
Configuring an echo sounder in Hydromagic Dredging
In Hydromagic Dredging, it is possible to connect an echo sounder, and display the depth below thedredger. You can even use the echo sounder to update a layer of the current matrix with the currentdepth for the matrix cell. This manual page explains how to load the plugin for an echo sounder, displaythe depth in the data view and how to configure the dredging software to be able to store depth readings.

Eye4Software Hydromagic 9.4386
© 2009-2021 Eye4Software B.V.
Please note that the dredging software can not be used to perform hydrographic surveys. The resolutionof the sounding locations is limited by the cell size of the matrix and no post processing functions areoffered. You will not be able to perform sound velocity, motion and latency corrections on the soundings.To perform a high accuracy post-dredging survey, the Hydromagic Survey software should be used.
Loading an echo sounder plugin
In Hydromagic, a plugin is a piece of software between the actual hardware (RTK receiver, echo sounder,motion sensor etc) and the Hydromagic Survey or Hydromagic Dredging software. To be able to readdata from an echo sounder, an echo sounder plugin has to be loaded and configured first. To load aplugin, select the "Preferences..." option from the "Tools" menu and select the "Devices" tab:
Open the "Devices" tab in the "Preferences" dialogto load a plugin.
When a plugin for the echo sounder has not been loaded yet, click the "Add..." button to select a pluginto load. After selecting the plugin in the list, you have to configure the communication parameters for theserial port or Ethernet connection to start reading data. For more detailed information on loading andconfiguring plugins, please check the "General information on using plugins" page.

Dredging 387
© 2009-2021 Eye4Software B.V.
Select a plugin for your echo sounder when not already done so.
Displaying echo sounder depth measurements
When done loading and configuring the echo sounder plugin, the green check before the plugindescription in the "Devices" tab indicates that data is coming in and recognized as depth information.Now that data is coming in the depth(s) should be displayed in the "Data View" display. When the depthis not displayed in the data view, right click on the window and check the "Depth (Lo)" or "Depth (Hi)"items to enable depth display.
In case data is coming in, and no depth is displayed, make sure to check your vessel settings. Thevessel using the echo sounder should have the echo sounder plugin selected in its data source list.

Eye4Software Hydromagic 9.4388
© 2009-2021 Eye4Software B.V.
Check the "Depth" options to show echo sounder depth readings.
Dual frequency depth readings in the "Hydromagic Data View".

Dredging 389
© 2009-2021 Eye4Software B.V.
Updating a matrix layer with echo sounder readings
Another use of the echo sounder installed on the dredge, is to update matrix cells with the last echosounder reading. Please note that the last value is stored, since the echosounder probably should detectthat the depth of a cell has increased after dredging. To configure the echo sounder to perform matrix cellupdates, select the "Preferences..." option from the "Options" menu and select the "Sounder" tab.
Configure matrix updates in the "Sounder" tab.
Select layer to be updated
First of all, you have to enable this option by checking the "Store echo sounder readings into theselected matrix" check box. This enables the other settings in the dialog. By default the "Post Dredging"layer (layer #3) will be updated. You can however select layer 1 and 2 as well. Please note that layer 2 isalso updated by the dredge head. To show the matrix updates for the selected layer, you can switchbetween the different matrix views by clicking the appropriate button in the tool bar:
Select the correct matrix layer to show the matrix updates.
Select echo sounder data

Eye4Software Hydromagic 9.4390
© 2009-2021 Eye4Software B.V.
With the "Select Data" switch, you can selected which echo sounder readings are recorded. At thismoment, this switch can be used to toggle between high and low frequency echo sounder depths. Whenusing a single frequency sounder, set this to "Depth - Hi Frequency". With a dual frequency sounder youmight want to select the "Depth - Lo Frequency" option to record the depth of the bottom ignoring themud on top of it.
Echo sounder draft
If draft hasn't been set in the echo sounder, check the "Apply echo sounder offset" check box and enterthe absolute value of the distance between the bottom of the transducer and the water surface. This valuewill automatically be added to the depth reported by the echo sounder plugin.
Setting the horizontal transducer offset
When your echo sounder transducer is not directly below your GNSS antenna, make sure you configurethe horizontal offset. This can be done in the "Vessel Designer". When the matrix is being updated,double check that the cell updated is actually at the echo sounder's position.
It is important to make sure the echo sounder transducer locationhas been set in the "Vessel Designer".
Start Recording
Click the "Record" button to start recording data, this works the same as recording dredge head positiondata. Both echo sounder and dredge head data will be stored into the matrix simultaneously. With thematrix visible and the correct layer selected, the depth readings should be visible at the echo sounderlocation:

Dredging 391
© 2009-2021 Eye4Software B.V.
Example of recorded echo sounder data.
8.8 Dredger Configuration Examples
8.8.1 Trailing Suction Hopper Dredger
Trailing suction hopper dredger configuration
This document is a step-by-step tutorial on how to configure the Hydromagic Dredging software tomonitor the dredge head of a trailing suction hopper dredger. In this example we assume an angle sensor(inclinometer sensor) has been mounted to the suction tube. Hydromagic will also support hopperdredgers equipped with pressure or bubble sensors. When encountering any problems by following thisdocument, please contact our support department for assistance.
Loading plugins
First off all, you have to load the plugins which are going to be used to get data like vessel position,heading, suction tube angle and draft into the software. Which plugins to load depends entirely on thedredger type and the brand or type of sensors used. In any case you have to load a plugin to retrieveposition data from your GNSS receiver. This is usually one of the generic NMEA0183 plugins.

Eye4Software Hydromagic 9.4392
© 2009-2021 Eye4Software B.V.
When a plugin is providing data, there should bea green check in front of the plugin's name.
Configuring the vessel
For this type of dredger we only need to configure the primary vessel. First we have to disable thesecondary vessel by de-selecting it's data sources (if not already done). To do so, select "Preferences..."from the options menu and click the "Dredging" tab. Now click the "Secondary Vessel..." button, andremove the checks for all of the plugins listed.
De-select all data sources for the secondary vessel.
For the hopper, the primary vessel will be used. Go back to the dredging tab of the preferences windowand click the "Primary Vessel..." button. Make sure that all plugins which are required are loaded at this

Dredging 393
© 2009-2021 Eye4Software B.V.
point. In the data source section, check the boxes in front of all the plugins which provide positioninformation for the vessel. In most cases, this means all the plugins providing vessel position, vesselheading and the vessel's dynamic draft (pressure sensor). Sensors attached to the suction tube do nothave to be selected here.
Select all data sources used to positioning the primary vessel.
To display the hopper dredge in the map and digging views, the shape file for the vessel needs to be set.You can create or alter vessel shapes in the Vessel Designer. This tool can also be used to scale one ofthe shapes shipped with the software (located in "C:\ProgramData\Hydromagic\Vessel") to thedimensions of your own vessel. It is important to use accurate dimensions for all shapes used in thedredging software (vessel and dredge equipment shapes).
To select a shape for the vessel, click the "Browse..."button to locate a vessel XM L file.
For information on the other vessel settings in this dialog (like heading sensors, distance rings andcourse line options), please refer to the "Configuring Vessels" manual page.
Configuring the dredging equipment
We will now configure the dredging equipment by defining the shapes, dimensions and sensors for thedifferent parts that make up the suction tube. When the hopper dredger has been equipped with twosuction tubes, we will have to perform this step for both tubes.
Go back to the "Dredging" tab in the preferences screen, and remove any dredger configurations whichare already defined here. When the list is empty, click the "New..." button to create a new configuration.

Eye4Software Hydromagic 9.4394
© 2009-2021 Eye4Software B.V.
To create a new configuration, click the "New..." button.
Configuring global dredger options
Set the dredger type to "Hopper Dredger" and select the "Primary Vessel" as vessel.
Configuring dredger segments
In Hydromagic Dredging, dredging equipment is configured by combining so called "Segments" to form acomplete dredging system. General information on how this works, and which type of "segments" aresupported can be found in the "Configuring Dredger Segments" manual entry. A hopper dredger isconfigured by combining a "Trunnion", "Ladder" and "Dredge Head" segment as we will explain in thefollowing paragraphs. For each segment you add, you have to select the type ( "Trunnion", "Ladder" or"Dredge Head" ), and an optional "friendly name".
Trunnion Offset
On a trailing suction hopper dredger, the suction tube is connected to the vessel via a so called"Trunnion". This trunnion can be above the water line, like in this example, or a "Sliding Trunnion" couldbe used, which means the suction tube will slide downwards through the "Sliding Trunnion". In the lattercase the trunnion is located under the water surface. From the trunnion, the suction tube makes a ninetydegrees angle causing an extra horizontal offset. To calculate this offset, we start with adding a"Trunnion Segment".

Dredging 395
© 2009-2021 Eye4Software B.V.
Add a "Trunnion" segment to specify a horizontal offsetbetween trunnion and dredge head.
When configuring a "Trunnion Segment", only the exact distance from the hull till the center of thedredge head is entered in the "Segment Length" field. A shape or data source can not be entered here.

Eye4Software Hydromagic 9.4396
© 2009-2021 Eye4Software B.V.
The trunnion offset equals the distance betweendredge head center and the hull of the vessel.
Suction Tube
This is the most important segment of the dredging system. You can select it by changing the "Type"selection box to "Ladder". Make sure your shapes have the correct dimensions and the "SegmentLength" is measured as accurate as possible. You have to measure the tube length from the trunnioncenter to the end of the dredge head. When drawing a shape of the suction tube in the "VesselDesigner", make sure the shape originates at coordinates (0,0):

Dredging 397
© 2009-2021 Eye4Software B.V.
Dredger shapes should originate from the (0,0) coordinate in the Vessel Designer.
Depending on which views are required, you can draw the vessel and dredge segments for the variousviews. The "TOP" view will be used in the map display and is mandatory ! For the top view, you draw thesuction tube parallel to the Y-axis starting at (0,0) and facing upwards. For the side view you start at(0.0) and the shape will be parallel to the X-axis as shown in the examples below:

Eye4Software Hydromagic 9.4398
© 2009-2021 Eye4Software B.V.
Example of TOP view shapes for a suction tube
Example of RIGHT view shapes for a suction tube
You also have to select which sensor is providing position information for this segment. For a suctiontube, this should be an inclinometer sensor or pressure (bubbler) sensor. Make sure all plugins havebeen loaded as explained in the first paragraph, and click the "Add..." button to select the device. Whena plugin interface with more then one sensor, you can select the sensor from the second drop-down box.In most cases, only one data source will be used (except when using two separate sensors and pluginsto monitor horizontal movement as well).
Click the "Add..." button to select the plugin and sensor.
IMPORTANT: The most important setting is the "Segment Length". As soon this is measuredcorrectly (or lookup the dimensions using a CAD drawing), your dredging depth will be correct.Incorrect dimensions in the shapes only result in a top or side view drawing which is lessaccurate, but it will affect your depth reading !

Dredging 399
© 2009-2021 Eye4Software B.V.
Add a "Ladder" segment to define the shape and length of the suction tube itself.
Dredge Head
The dredge head segment is used only to configure the dimensions of the dredge head. Only when thedredge head moves independent from the suction tube, it should be configured with its own shape anddata source (plugin). When we finished adding the trunnion and one or more suction tubes, we add the"Dredge Head" segment. Just click the "Add..." button from the "Dredge Equipment Configuration"dialog, and set the "Type" setting to "Dredge Head". You will notice a "Settings..." button will becomevisible. Click this button and add the dredge head width and height.

Eye4Software Hydromagic 9.4400
© 2009-2021 Eye4Software B.V.
Dredge head dimensions are used to calculatewhich matrix cells need to be updated.
The dredge head dimensions are used to calculate the footprint size of the dredge head, so the matrixcan be updated accordingly.
Add a "Dredge Head" segment to define the dimensions of the dredge head.

Utilities 401
© 2009-2021 Eye4Software B.V.
9 Utilities
9.1 3D Terrain Viewer
Hydromagic 3D Terrain Viewer
The Hydromagic 3D Terrain Viewer is a stand alone utility which can be used to view generated matriceslike a 3D surface, point cloud or wire frame. The view generated by the terrain viewer gives an accurateimage of the bottom of the surveyed area, and you will see which area's need more filtering in the blink ofan eye. You can use the terrain viewer to view matrices generated in both Hydromagic Survey andHydromagic Dredging.
The main screen of the 3D Terrain Viewer shows a detailed image of the bottom.
Starting the Hydromagic Terrain Viewer
The tool is installed in the "Program" folder under the installation folder of the software. It can be startedusing Windows Explorer, or by locating the software under the Windows Start Menu. Alternatively, youcan start the "Terrain Viewer", by right clicking a generated or loaded matrix in the "Project Explorer",and selecting the "Open in Terrain Viewer..." option."

Eye4Software Hydromagic 9.4402
© 2009-2021 Eye4Software B.V.
Start the "Terrain Viewer" by right clicking a matrix.
Loading a matrix file
When opening the terrain viewer from the "Project Explorer", the selected matrix file is automaticallyloaded. When starting the software directly from the Windows start menu or Hydromagic program folder,no matrix will be loaded and you can open a matrix file (*.mtx) by clicking the "Open Matrix" button inthe tool bar, or selecting the "Open..." option from the "File" menu.
View Modes
A matrix file can be viewed in 3D in different view modes:
§ Fill - All matrix cells are divided in triangles and filled with a solid color;§ Wireframe - All matrix cells are divided in triangles and the outlines of the triangles are drawn;§ Pointcloud - All matrix cells are drawn as pixels with the associated color and offset;
When drawing the matrix as a wireframe or pointcloud, the line width and pixel size can be adjusted byclicking the "Global Settings" button in the tool bar. To change the current view mode, click the "ViewMode" button to select the desired mode from the drop down menu, as shown in the screen shot below:
Selecting a different view from the "View M ode" menu.
Rotating and zooming

Utilities 403
© 2009-2021 Eye4Software B.V.
The terrain can be viewed from different angles and distances. Just imagine a camera that is rotatedaround the object to view it from a different angle. By zooming in and out, basically this virtual cameramoves closer towards or further away from the object. You can control the rotation around the object bymoving the mouse while holding the right mouse button. To zoom in and out, use the scroll wheel onyour mouse. If you want to return the "Camera Position" to the start position, click the "Reset View"button in the tool bar.
Layers
Depending on which Hydromagic software is used to generated the matrix, it can contain only one ormultiple layers. In Hydromagic Survey only one layer will be created, while Hydromagic Dredging willcreate three layers by default (pre-dredging, dredging and post-dredging). To select which layer of thematrix is shown in the terrain viewer, click the "Select Layer" button to select the active layer from thedrop down menu as shown in the screen shot below:
Switch between different layers using the "Select Layer" menu.
Amplification (Z-Values)
By default, the matrix 3D model is scaled equally in all directions. In some cases, for instance, whenyou want to view a large area, it might be useful to adjust the Z scaling to exaggerate the depth orelevation levels to be more clearly visible. You can do this by using the "Increase Amp" and "DecreaseAmp" buttons in the tool bar. Alternatively, you can set the amplification level manually by clicking the"Global Settings" button and using the "Factor" setting in the "Amplification" section.
Inverse Values
When you load a matrix with elevation values instead of depth values, the terrain might be mirrored in Z-Direction. In these cases, just click the "Inverse Values" button to mirror the Z-Values of the model.
Color Settings
In the "Terrain Viewer", 3D terrains can be viewed in multiple colors or a single color. To switch betweensingle and multiple color mode, click the "Toggle Color" button. When in color mode, different depth orelevation levels will have different colors, just as you used to when displaying matrices in the survey ordredging program. To configure color ranges, click the "Color Settings" button. You can create multiplecolor ranges which can be set automatically. You can also import color schema's created in either thesurvey or dredging program.

Eye4Software Hydromagic 9.4404
© 2009-2021 Eye4Software B.V.
From the "Colors" tab, you can create, import or configure color sets.
Global Settings
Click the "Global Settings" button to change some global and miscellaneous settings, like backgroundcolor, amplification factor, view mode and more. Some of the settings can also be accessed directly bythe tool bar, including the "View Mode", "Miscellaneous" and "Amplification" settings. In this dialog, youcan also change the point size and line width for the "Wireframe" and "Pointcloud" view modes.
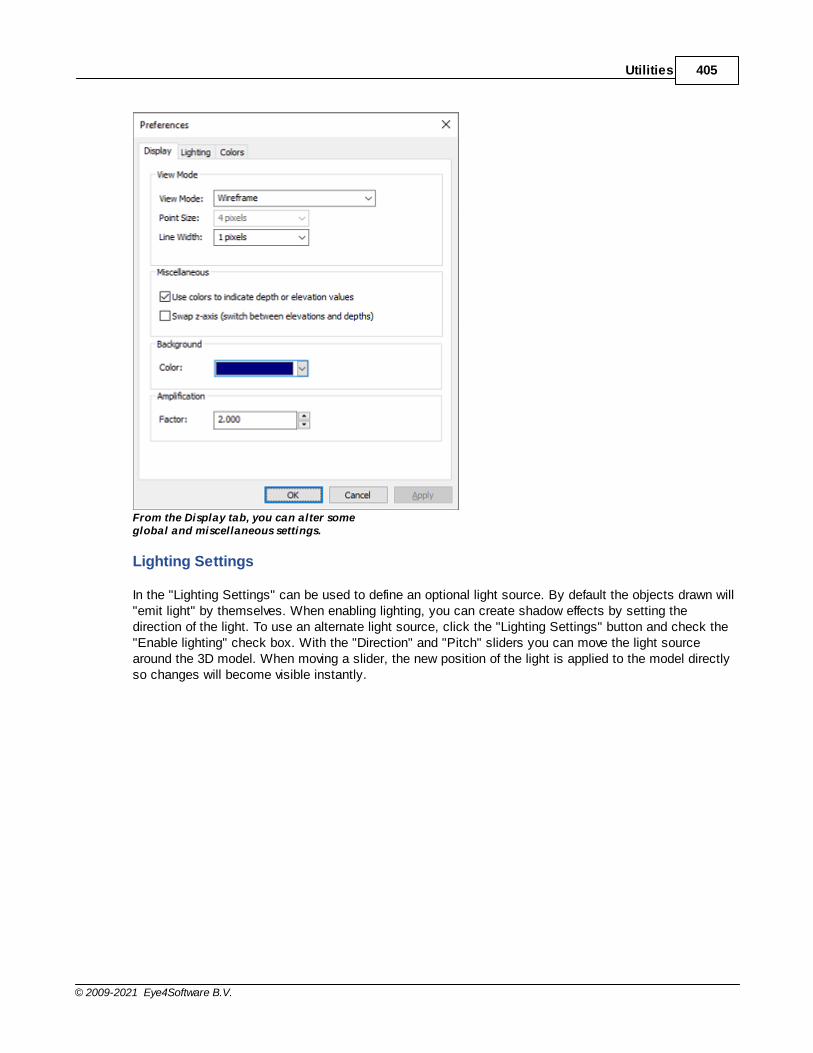
Utilities 405
© 2009-2021 Eye4Software B.V.
From the Display tab, you can alter someglobal and miscellaneous settings.
Lighting Settings
In the "Lighting Settings" can be used to define an optional light source. By default the objects drawn will"emit light" by themselves. When enabling lighting, you can create shadow effects by setting thedirection of the light. To use an alternate light source, click the "Lighting Settings" button and check the"Enable lighting" check box. With the "Direction" and "Pitch" sliders you can move the light sourcearound the 3D model. When moving a slider, the new position of the light is applied to the model directlyso changes will become visible instantly.

Eye4Software Hydromagic 9.4406
© 2009-2021 Eye4Software B.V.
Create shadow effects by setting an alternate light source.
9.2 Using the EGM2008 geoid model
Using the EGM2008 geoid model
EGM2008 is short for Earth Gravitational Model 2008. It is the successor of EGM96 and EGM84 and it issupplied by the U.S. National Geospatial-Intelligence Agency (NGA) EGM Development Team. The EGM2008 model has a cell size of 1.0 x 1.0 minute, resulting in a grid of 10801 rows x 21600columns containing 4 byte IEEE float values defining the difference between the WGS84 ellipsoid heightand Mean Sea Level (MSL).
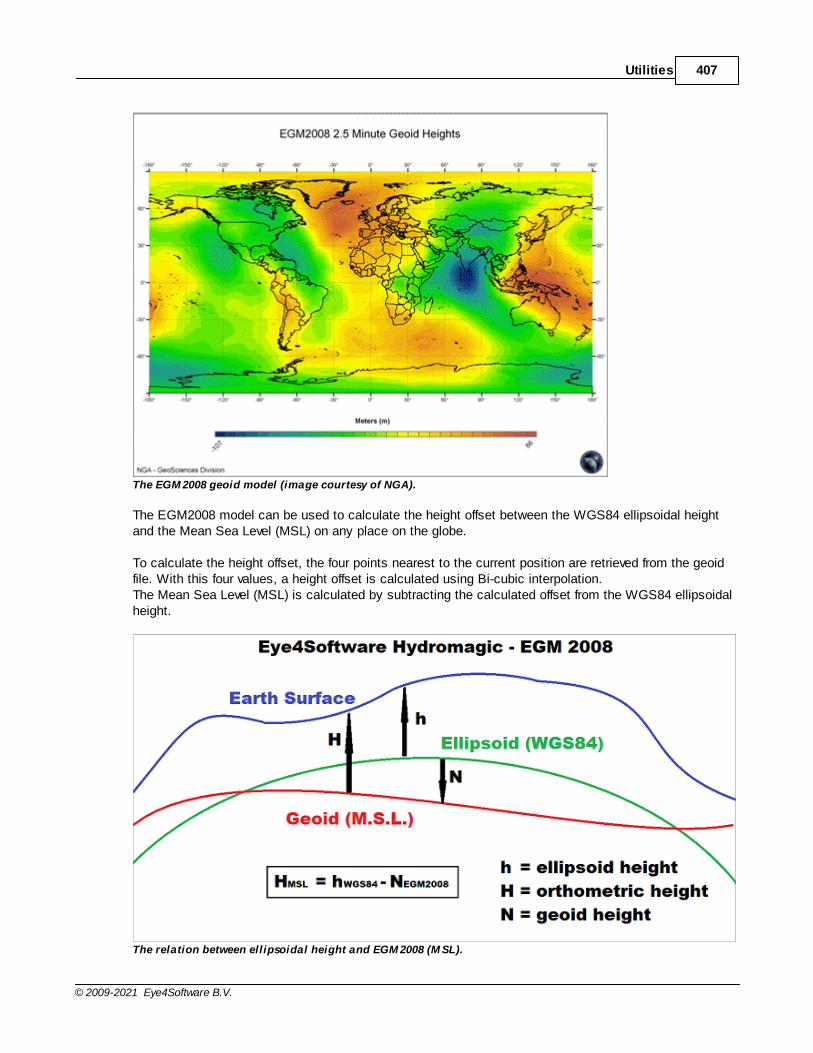
Utilities 407
© 2009-2021 Eye4Software B.V.
The EGM 2008 geoid model (image courtesy of NGA).
The EGM2008 model can be used to calculate the height offset between the WGS84 ellipsoidal heightand the Mean Sea Level (MSL) on any place on the globe.
To calculate the height offset, the four points nearest to the current position are retrieved from the geoidfile. With this four values, a height offset is calculated using Bi-cubic interpolation. The Mean Sea Level (MSL) is calculated by subtracting the calculated offset from the WGS84 ellipsoidalheight.
The relation between ellipsoidal height and EGM 2008 (M SL).

Eye4Software Hydromagic 9.4408
© 2009-2021 Eye4Software B.V.
Because the data file containing all grid values is very large (it contains about 233 million data points), itwould cause Hydromagic to consume 1 Gigabyte of additional memory.To solve this issue, Hydromagic is shipped with an utility called 'EGM2008Util' which allows you toextract a specified region from the EGM2008 data file, and convert it to an Hydromagic geoid file.
Downloading the EGM2008 data file
Before using the utility, you need to download the large EGM2008 data file from the NGA website. Youneed the following file:
Und_min1x1_egm2008_isw=82_WGS84_TideFree_SE.gz
This file name might change sometimes, but it is important that you use the 1x1 minute, small endian,WGS84 variant. At this moment the file can be downloaded using this link to the NGA website. After downloading, unzip the GZipped file, and copy the extracted file to a folder accessible to theEGM2008 Utility. Alternatively, you can find this file in the Hydromagic download archive as well.
Using the EGM2008 utility
The EGM2008 utility can be started from the Windows start menu. It can also be found in the 'Program'folder in the installation directory. After starting the utility, the following screen should appear:
The EGM 2008 geoid conversion utility is shipped with Eye4Software Hydromagic.
Input
Use the input section to specify the input data file as downloaded from the NGA website. The utility will check the file and return an error when the incorrect file is used. Please note that the utility only works when using the 1x1 minute data file.

Utilities 409
© 2009-2021 Eye4Software B.V.
Output
Specify the file name of the Hydromagic geoid file here. The file should be placed in the"/ProgramData/Hydromagic/Geoids/" folder, otherwise you won't be able to select it in Hydromagic. By default, this folder will be displayed in the "Save As..." dialog. The file written will have the sameformat as geoid files download directly from the Eye4Software website. Please remember the file name used for this part of the EGM2008 grid, you need it when importing it intoHydromagic.
Selection
In the "Selection" section, you can select the area which you want to export. Please note that themaximum area size is 2x2 degrees (equal to 14400 data points). To specify either a coordinate on the southern or western hemisphere, use the '-' (minus) sign. Thesoftware will warn you in case the selected area is too big.
Generating the geoid file
When ready, click the "Start" button to generate the geoid file. When this process has been completed,you can close the utility using the "Close" button. The last step is adding the geoid model in Hydromagic. To do so, please refer to the "Manage Geoids"chapter in the manual.
9.3 License Updater
Hydromagic Licensing
Licensed versions of the Hydromagic software are protected against unauthorized use with a dongle orhardlock device. When purchasing of the software, a dongle will be shipped to you containing licenses forthe products you bought, and for the most recent versions only.
When you decide to purchase an additional product later (for instance, adding a survey license to adredging package), an additional license has to be added to the dongle. To do so, the "License UpdatingTool" is required to add this license to the dongle remotely, so we do not have to provide you with awhole new dongle.
License Updater
The tool is installed in the "Program" folder under the installation folder of the software. It can be startedusing Windows Explorer, or by locating the software under the Windows Start Menu. Alternatively, youcan start the "License Updating Tool" by selecting "External Tools" => "License Updater..." option fromthe "Tools" menu in Hydromagic Survey or Hydromagic Dredging.

Eye4Software Hydromagic 9.4410
© 2009-2021 Eye4Software B.V.
Use the "License Updating Tool" to request or import a license update for a new version.
Adding a license
In order to add a new license to your existing Hydromagic dongle, purchase from your local reseller, orusing the sales page on our website. In case you want to upgrade the software you are using to thelatest version, all you need is a valid support contract.
After purchasing the license, you have to email a license request file to us. This request contains theencrypted contents of your dongle, and is needed to add licenses.
To generate a license request, select the "Generate a license request for us" option, and select anoutput file. It is recommended to store the file in the "My Documents" folder using the default name asdisplayed in the "Save As" dialog box. Click the "Save" button to select the file, and click the "Start"button to generate the license request file.

Utilities 411
© 2009-2021 Eye4Software B.V.
Save the license request file and email it to our support desk.
Emailing the license request
After the license request has been saved, you have to email the license request file ( .wibuCmRaCextension ) as an attachment to our support desk at [email protected]. You will receive thelicense after it has been processed by our staff. Please note that this is a manual process so it can takeup to 24 hours until you receive the email with the license update.
Applying the license update
After receiving the email with the license update file ( .wibuCmRaU extension ), please save theattachment to a folder accessible to the license updating software, for example your "My Documents"folder. If you have closed the application in the mean time, just start it again. This time you have toselect the "Import a new license which has been emailed to you" option.
Next, click the "Browse..." button to locate the received license file and click "Open" after you selectedthe received file. Now click the "Start" button to program the new license(s) in your Hydromagic dongle.
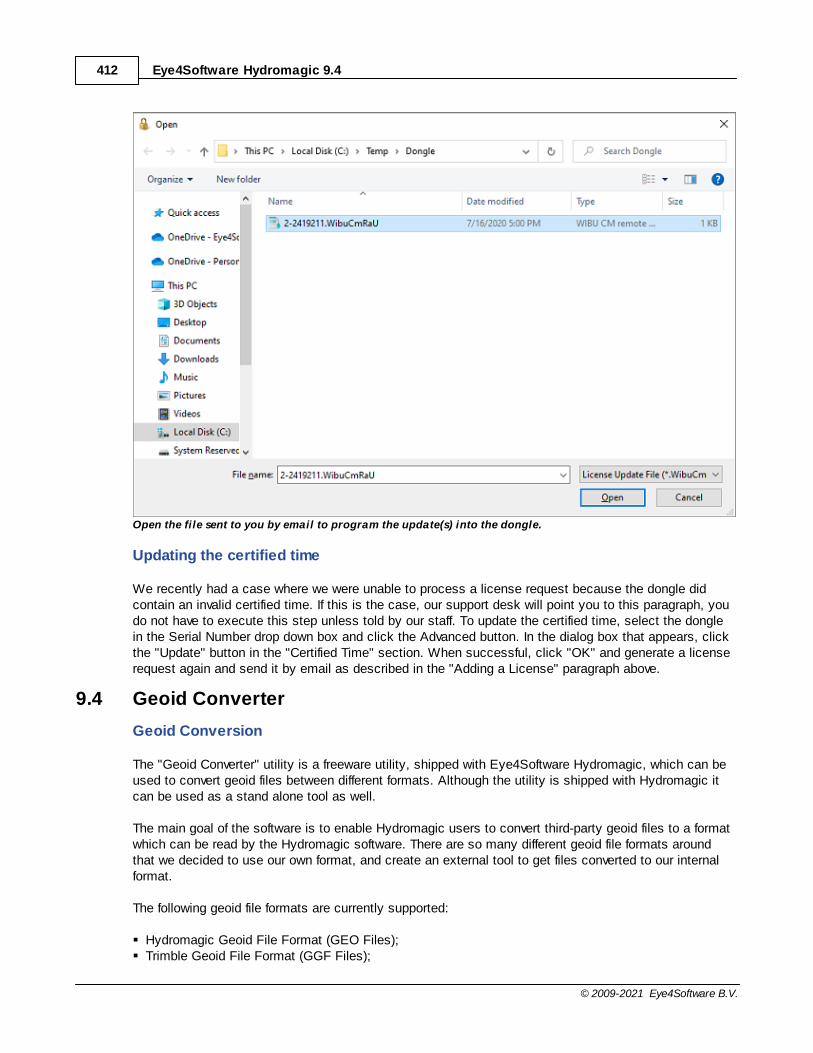
Eye4Software Hydromagic 9.4412
© 2009-2021 Eye4Software B.V.
Open the file sent to you by email to program the update(s) into the dongle.
Updating the certified time
We recently had a case where we were unable to process a license request because the dongle didcontain an invalid certified time. If this is the case, our support desk will point you to this paragraph, youdo not have to execute this step unless told by our staff. To update the certified time, select the donglein the Serial Number drop down box and click the Advanced button. In the dialog box that appears, clickthe "Update" button in the "Certified Time" section. When successful, click "OK" and generate a licenserequest again and send it by email as described in the "Adding a License" paragraph above.
9.4 Geoid Converter
Geoid Conversion
The "Geoid Converter" utility is a freeware utility, shipped with Eye4Software Hydromagic, which can beused to convert geoid files between different formats. Although the utility is shipped with Hydromagic itcan be used as a stand alone tool as well.
The main goal of the software is to enable Hydromagic users to convert third-party geoid files to a formatwhich can be read by the Hydromagic software. There are so many different geoid file formats aroundthat we decided to use our own format, and create an external tool to get files converted to our internalformat.
The following geoid file formats are currently supported:
§ Hydromagic Geoid File Format (GEO Files);§ Trimble Geoid File Format (GGF Files);

Utilities 413
© 2009-2021 Eye4Software B.V.
§ Carlson Geoid File Format (GSF Files);§ US National Geodetic Survey (NGS) File Format (BIN Files);§ Natural Resources Canada Files (BYN Files);§ Surfer V6 Binary Grid Files (GRD Files);§ NOAA VDATUM grid file (GTX Files);§ AusGeoid File Format (Australian Geoids);§ French ASCII Geoid Files (MNT Files);§ ASCII Geoid Files.
The "Geoid Converter" utility allows you to convert geoid data to another file format.
Geoid Converter
The tool is installed in the "Program" folder under the installation folder of the software. It can be startedusing Windows Explorer, or by locating the software under the Windows Start Menu. Alternatively, youcan start the "Geoid Converter" utility by selecting "External Tools" => "Geoid Converter..." option fromthe "Tools" menu in Hydromagic Survey or Hydromagic Dredging.
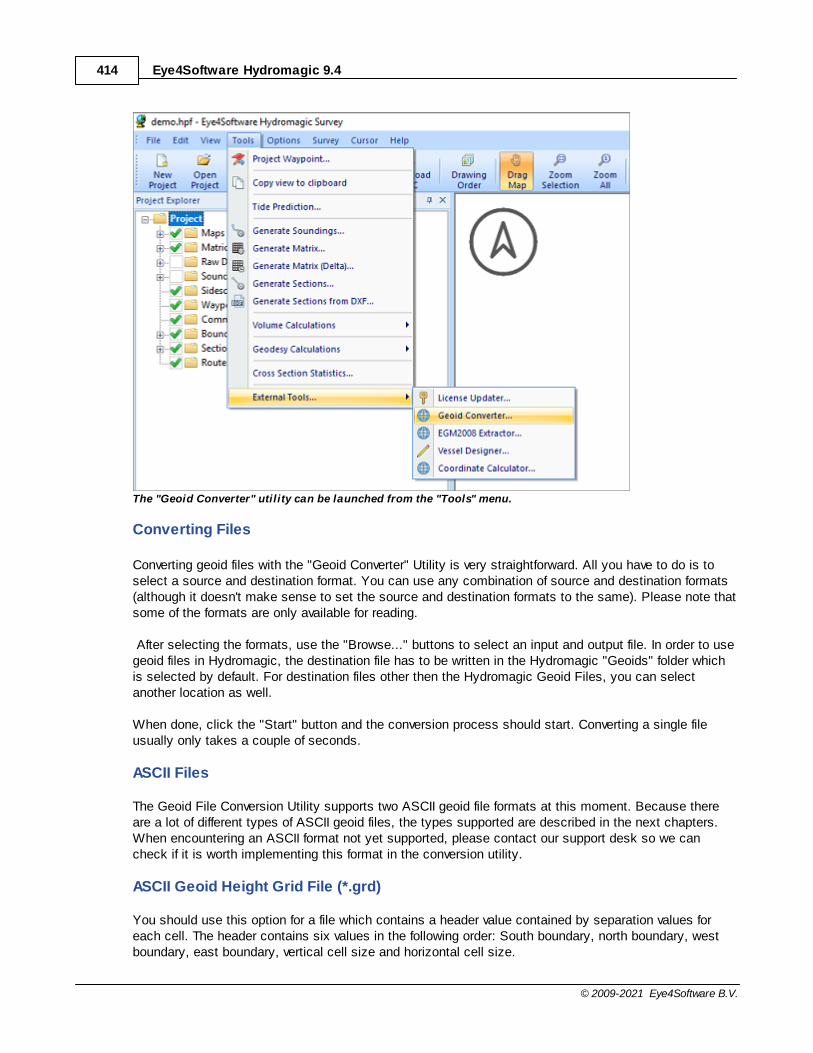
Eye4Software Hydromagic 9.4414
© 2009-2021 Eye4Software B.V.
The "Geoid Converter" utility can be launched from the "Tools" menu.
Converting Files
Converting geoid files with the "Geoid Converter" Utility is very straightforward. All you have to do is toselect a source and destination format. You can use any combination of source and destination formats(although it doesn't make sense to set the source and destination formats to the same). Please note thatsome of the formats are only available for reading.
After selecting the formats, use the "Browse..." buttons to select an input and output file. In order to usegeoid files in Hydromagic, the destination file has to be written in the Hydromagic "Geoids" folder whichis selected by default. For destination files other then the Hydromagic Geoid Files, you can selectanother location as well.
When done, click the "Start" button and the conversion process should start. Converting a single fileusually only takes a couple of seconds.
ASCII Files
The Geoid File Conversion Utility supports two ASCII geoid file formats at this moment. Because thereare a lot of different types of ASCII geoid files, the types supported are described in the next chapters.When encountering an ASCII format not yet supported, please contact our support desk so we cancheck if it is worth implementing this format in the conversion utility.
ASCII Geoid Height Grid File (*.grd)
You should use this option for a file which contains a header value contained by separation values foreach cell. The header contains six values in the following order: South boundary, north boundary, westboundary, east boundary, vertical cell size and horizontal cell size.

Utilities 415
© 2009-2021 Eye4Software B.V.
27.00000 36.97500 -14.00000 -0.02500 0.02500 0.02500
52.383 52.342 52.302 52.257 52.205 52.147 52.073 51.978
51.864 51.742 51.619 51.498 51.378 51.261 51.144 51.029
50.916 50.805 50.695 50.588 50.484 50.391 50.301 50.212
50.122 50.029 49.930 49.821 49.700 49.571 49.437 49.298
49.155 49.006 48.853 48.697 48.539 48.379 48.220 48.063
47.912 47.767 47.631 47.503 47.385 47.275 47.175 47.083
46.998 46.917 46.838 46.760 46.682 46.606 46.534 46.469
ASCII XYZ Geoid File (*.txt)
This option is used for geoid files which consist entirely out of ASCII XYZ pairs as shown in the examplebelow. These files do not have a header and calculate the number of rows, columns, boundaries and cellsizes directly from the XYZ records in the file.
41449.795 3845328.858 24.700
43449.799 3845328.878 24.613
45449.803 3845328.897 24.516
47449.807 3845328.916 24.429
49449.811 3845328.935 24.342
51449.815 3845328.954 24.255
53449.819 3845328.973 24.178
55449.823 3845328.992 24.091
57449.827 3845329.012 24.004
59449.831 3845329.030 23.917
61449.835 3845329.049 23.830
63449.839 3845329.068 23.743
French Geoid File (*.mnt)
The French MNT format is used by the IGN in France to store geoid models for the French mainland, aswell as French overseas territories like: Guadeloupe, Martinique, French Guiana, Mayotte and Reunion.The direction in which the ellipsoidal heights are stored differ and depends on the area. This direction isencoded in the file header. Below is an example of a MNT file:
44.910 45.405 -13.095 -12.420 0.045 0.045 4 1 1 1 0. Mayotte SHOM 1953
44.91 -13.095 -20.852 99
44.91 -13.05 -20.653 99
44.91 -13.005 -20.439 99
AusGeoid Files
AusGeoid files are ASCII files used to store Australian Geoid models like AUSGeoid93, AUSGeoid98,AUSGeoid09 and AUSGeoid2020. Although most of these models are already available in Hydromagicformat, you might want to convert files by your own. More information on the AUSGeoid can be found onthe "Geoscience Australia" website (http://www.ga.gov.au/ausgeoid/). Below is an example of aAUSGeoid file:
AUSGeoid09_GDA94_V1.01 www.ga.gov.au

Eye4Software Hydromagic 9.4416
© 2009-2021 Eye4Software B.V.
GEO -2.493 S39 0 0.000 E143 0 0.000 -6.19 -5.86
GEO -2.452 S39 0 0.000 E143 1 0.000 -6.24 -5.79
GEO -2.411 S39 0 0.000 E143 2 0.000 -6.19 -5.86
GEO -2.368 S39 0 0.000 E143 3 0.000 -6.30 -5.86
GEO -2.328 S39 0 0.000 E143 4 0.000 -6.24 -5.71

Plugins 417
© 2009-2021 Eye4Software B.V.
10 Plugins
10.1 General information on using plugins
n Hydromagic, a plugin is a small piece of software which is loaded when requested. In most cases,plugins are used to add compatibility for a piece of hardware such as an echo sounder, positioningdevice, motion sensor or a manual input like tide or sound velocity. By using separate plugins (WindowsDLL files), it is possible to add support for hardware or a new feature without having to re-install theHydromagic software, just copying a DLL file and restart the software will suffice.
Loading a plugin
To load any plugin, open the preferences window by selecting "Preferences..." from the "Options" menu.In the window that appears, select the "Devices" tab. Next click the "Add..." button.
A list of available plugins will be displayed. The list is sorted alphabetically and displays the name of theplugin, the DLL filename and the version number. All plugins are located in the "Plugins" folder under theinstallation folder, for instance: "C:\Program Files\Eye4Software\HydroMagic\Plugins". If you ever need toadd or replace a plugin DLL, this is the place to copy the received file to.

Eye4Software Hydromagic 9.4418
© 2009-2021 Eye4Software B.V.
Configuring a plugin
The configuration screen might be slightly different on the various plugins. However plugins which areused to connect to a device like an echo sounder or a position device always need some information onhow to connect to the device. Most plugins allow you to connect a device through a serial port (or USB toserial converter), or Ethernet using the TCP or UDP internet protocols.
When configuring a device which is connected to a serial port, via an USB to serial converter or Bluetoothyou have to use "Serial" as connection type. The software automatically detects all serial ports presentin Windows and you can select one using the "Serial Port" drop down.To switch between a serial and an Ethernet connection, just change the connection type from "Serial" to"TCP/IP". When the connection type is set to "TCP/IP" you can use the second drop down box to switchbetween the "TCP" and "UDP" internet protocols.
Plugin troubleshooting
After configuring the plugin it will be loaded and its status will be displayed in the list of loaded plugins:

Plugins 419
© 2009-2021 Eye4Software B.V.
The name of the plugin is displayed in the list, together with the port that is used, in this example"COM1". When using an Ethernet connection, TCP or UDP will be displayed here. The hourglass in frontof the plugin name indicates that the plugin was loaded, the serial port could be opened and it is runningsuccessfully.After connecting and switching on the device (echo sounder in this example), the hourglass should turninto a green icon which means that data is coming in. If this is not the case, please check whether thecable is connected to the correct port and try a different serial speed setting. You can also use putty tolog the incoming data and check for the correct serial speed setting.
When a red icon with an exclamation mark is displayed in front of the plugin name, there was a failureloading the plugin or opening the connection to the device. In this case the cause of the error will bedisplayed in the real-time activity view.
Unloading plugins
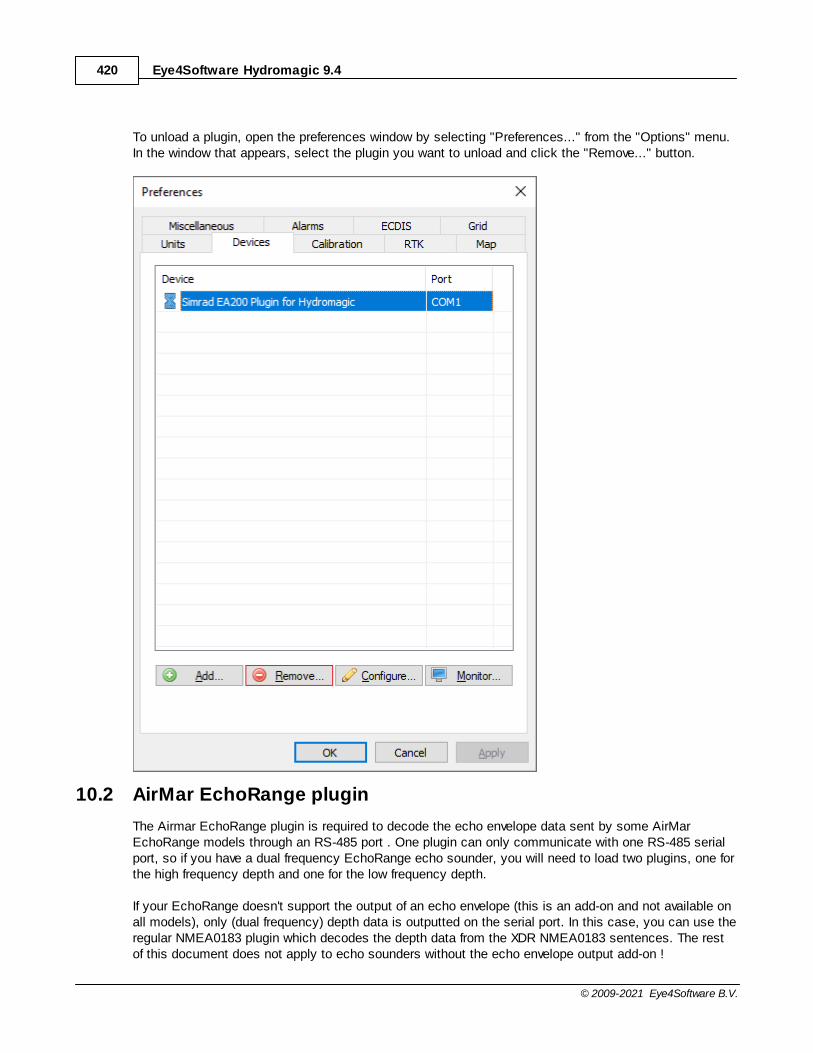
Eye4Software Hydromagic 9.4420
© 2009-2021 Eye4Software B.V.
To unload a plugin, open the preferences window by selecting "Preferences..." from the "Options" menu.In the window that appears, select the plugin you want to unload and click the "Remove..." button.
10.2 AirMar EchoRange plugin
The Airmar EchoRange plugin is required to decode the echo envelope data sent by some AirMarEchoRange models through an RS-485 port . One plugin can only communicate with one RS-485 serialport, so if you have a dual frequency EchoRange echo sounder, you will need to load two plugins, one forthe high frequency depth and one for the low frequency depth.
If your EchoRange doesn't support the output of an echo envelope (this is an add-on and not available onall models), only (dual frequency) depth data is outputted on the serial port. In this case, you can use theregular NMEA0183 plugin which decodes the depth data from the XDR NMEA0183 sentences. The restof this document does not apply to echo sounders without the echo envelope output add-on !

Plugins 421
© 2009-2021 Eye4Software B.V.
When you own an echo sounder with an echo envelope output, there is no need to load a NMEA0183plugin, since the depth value is reported on the echo envelope serial ports as well.
EchoRange(TM) Single Frequency Smart Transducer (Without echo envelope output)
This EchoRange model comes with a high frequency transducer only and can communicate withacquisition software using a RS-422 serial port only. The only protocol supported on this serial port isNMEA0183. When you own such a model, just use one of the NMEA0183 plugins to interface with thisecho sounder.
Connections on the EchoRange(TM ) Single Frequency Smart Transducer (Without echo envelope output)
EchoRange(TM) Single Frequency Smart Transducer (With echo envelope output)
This EchoRange model comes with a high frequency transducer only and can communicate withacquisition software over a RS-422 serial port using the NMEA0183 protocol. A second port, which is aRS-485 serial port, is supplied to broadcast the echo envelope using a propietary protocol with a serialspeed of 921600 bits per second. For this model, you only need to load the high frequency plugin inHydromagic ("Airmar EchoRange Plugin - Hi Frequency Channel").
Connections on the EchoRange(TM ) Single Frequency Smart Transducer (With echo envelope output)
EchoRange(TM) Dual Frequency Smart Transducer (With echo envelope output)
This EchoRange model comes with a dual frequency transducer and can communicate with acquisitionsoftware over a RS-422 serial port using the NMEA0183 protocol. A second and third port, which are RS-485 serial ports, are supplied to broadcast the echo envelope for the high and low frequencies using apropietary protocol with a serial speed of 921600 bits per second. For this model, you will need to load

Eye4Software Hydromagic 9.4422
© 2009-2021 Eye4Software B.V.
both the Hydromagic EchoRange plugins in order to get the echo envelope data for both channels intothe software.
Connections on the EchoRange(TM ) Dual Frequency Smart Transducer (With echo envelope output)
Loading the EchoRange (High Frequency) plugin
To load this plugin, open the preferences window by selecting "Preferences..." from the "Options" menu.In the window that appears, select the "Devices" tab. Next click the "Add..." button.
A list of available plugins will be displayed. In this list, select "Airmar EchoRange Plugin - Hi FrequencyChannel" and click "OK" to load and display the plugin's user interface.

Plugins 423
© 2009-2021 Eye4Software B.V.
Configuring the EchoRange plugin
When the plugin loads, a dialog with some required settings will appear first.In the dialog, please select the serial port the sounder is connected to. The default baudrate used totransmit echo envelope data is 921600 bps.
Loading the plugin for the second channel (Low Frequency)
When you own an AirMar EchoRange which is able to output an echo envelope for both high and lowfrequency, you need to load an additional plugin for the second (low frequency) channel. From the device

Eye4Software Hydromagic 9.4424
© 2009-2021 Eye4Software B.V.
list, click the "Add..." button and select the "AirMar EchoRange Plugin - Lo Frequency Channel from thelist.
When the configuration windows of the plugin appears, enter the serial port for the low frequency data.Please make sure you do not use the same serial port as the one configured in the high frequencyplugin. The default serial port speed for this second channel is also 921600 bps.
Testing the sounder
When the sounder has been connected and configured, click "OK" to store the settings and start theplugin.There should be a green icon in front of the plugin name when data is coming in successfully.
When no data is coming in, most of the times the incorrect serial port or speed has been selected.
10.3 CEESCOPE Plugin
The CEESCOPE plugin is a plugin with graphical user interface designed to connect your CEEHydroSystems CEESCOPE or CEE ECHO echo sounder device.It will transfer position, depth, motion and full water column echogram data to the Hydromagicapplication.

Plugins 425
© 2009-2021 Eye4Software B.V.
Configuring the Ethernet adapter
Since the CEESCOPE is connected via an Ethernet cable to your computer directly,you have to configure your network adapter to be able to communicate to the device directly.
By default, under Windows, network adapters are configured to contain a DHCP server to obtain theirconfiguration.Since no LAN network will be present, you have to enter a static IP (TCP/IPv4) address.

Eye4Software Hydromagic 9.4426
© 2009-2021 Eye4Software B.V.
Loading the CEESCOPE plugin
To load this plugin, open the preferences window by selecting "Preferences..." from the "Options" menu.In the window that appears, select the "Devices" tab. Next click the "Add..." button.

Plugins 427
© 2009-2021 Eye4Software B.V.
A list of available plugins will be displayed. In this list, select the "CEE HydroSystems CEESCOPEPlugin"and click "OK" to load and display the plugin's user interface.

Eye4Software Hydromagic 9.4428
© 2009-2021 Eye4Software B.V.
Configuring the CEESCOPE plugin
When the plugin loads, a dialog with some required settings will appear first.You have to set network (UDP) ports to use for the transfer of navigation and acoustic data packets.
In most cases, you can use the defaults. With factory settings, UDP port 1234 is used to transfer theRTK position data routed through the sounder to the client software. UDP port 1235 is used to transferthe acoustic data packets, containing the depth, range, draft and the echogram data.

Plugins 429
© 2009-2021 Eye4Software B.V.
Use CEESCOPE internal timestamps
When the position data is transferred via the echo sounder, and no other time critical plugins are loadedin Hydromagic, it is recommended to enable this option.When this option has been enabled, the CEESCOPE will time tag all depth and position data withinternal timestamps. When using these timestamps, you do not have to set the latency setting.
Starting the plugin
When the ports have been configured, click the "OK" button to save the settings and start the plugin.In case the Windows Firewall has been enabled on your computer, you will see the following popupwindow appear:

Eye4Software Hydromagic 9.4430
© 2009-2021 Eye4Software B.V.
Make sure you click the "Allow Access" button to allow Hydromagic to send and receive data on theconfigured UDP ports.When you click the "Cancel" button, access to the sounder will be blocked and you won't receive anydata from the sounder !
When the laptop is not connected to the Internet and is only used to communicate with the echosounder,you can decide to shut down the Windows Firewall entirely. It is also recommended to try this in case ofconnection issues.
After allowing the connection, there should be a green icon in front of the plugin, indicating data iscoming in successfully.
Testing the sounder
When data is received, you should be able to see the depth and position information in the data window.To have a look at the echogram data, select "Echogram(Hi)" or "Echogram(Lo") from the View menu.
10.4 Echologger Plugin
The Echologger plugin is a plugin with graphical user interface designed to control your EchologgerEU400 or D24 device.When loaded it also transfers depth, motion and echogram data to the Hydromagic application.
Loading the Echologger plugin
To load this plugin, open the preferences window by selecting "Preferences..." from the "Options" menu.

Plugins 431
© 2009-2021 Eye4Software B.V.
In the window that appears, select the "Devices" tab. Next click the "Add..." button.
A list of available plugins will be displayed. In this list, select the "Echologger Plugin" and click "OK" toload and display the plugin's user interface.

Eye4Software Hydromagic 9.4432
© 2009-2021 Eye4Software B.V.
Configuring the Echologger plugin
When the plugin loads, a dialog with some required settings will appear first.You have to set the communications options, echo sounder model and the data transfer protocol to use.

Plugins 433
© 2009-2021 Eye4Software B.V.
Communications settings
When using the default configuration, the echo sounder connects with the computer using an USB cable.When plugged in, a virtual serial port will be created in Windows and you have to select this serial port.
The serial speed is 115200 bps when factory settings are used.The Echologger also supports higher speeds like 230400, 460800 and 921600 bps.

Eye4Software Hydromagic 9.4434
© 2009-2021 Eye4Software B.V.
When a high sample and data interval is used it is recommended to use one of these higher speeds.We will discuss how to setup the sounder for this speeds in the next chapter.
Changing the Echologger's serial speed
To change the speed of the echologger's serial port, you need a piece of serial terminal software likePutty.A lot of serial terminal software packages can be downloaded free of charge from the Internet. In thisexample we will use Putty.
When you installed Putty, first open a serial connection to the echo sounder with the default serial portspeed which should be 115200 bps.Make sure Hydromagic has been closed or the plugin has been removed, otherwise the port will alreadybe opened.
First we have to set the echologger into command mode: When data comes in, press enter until the >sign appears on a new line and the data stops coming in.At this point enter one of the following commands, depending on the desired speed:

Plugins 435
© 2009-2021 Eye4Software B.V.
· #baudrate 115200 <ENTER>;· #baudrate 230400 <ENTER>;· #baudrate 460800 <ENTER>;· #baudrate 921600 <ENTER>;
When the command succeeds, the echo sounder will send back "OK" on a new line.To apply the new baudrate, issue the '#reset' command and disconnect the terminal software.
You should now be able to use the echo sounder with the plugin using the newly selected serial speed.
Select echo sounder model and serial protocol
At this moment we have tested the EU400 and D24 echo sounders, but other Echologger models shouldwork as well.Each model has another set of serial protocols that can be used. You have to select the desired protocolin the plugin configuration.
Which protocol you should use depends on which data you want to retrieve from the echo sounder.
Binary protocol
NOTE: Not supported yet. Recommended protocol when transferring echogram data. When not (yet)available use the ASCII protocol instead.

Eye4Software Hydromagic 9.4436
© 2009-2021 Eye4Software B.V.
ASCII protocol
When the ASCII protocol has been selected, all data will be transferred to the Hydromagic software. Thisincludes depth, motion, temperature and echogram data.The sampled return data can be sampled as 10 or 12 bit data values depending on this setting.
NMEA0183 protocol
When the NMEA0183 protocol has been selected, the echo sounder will transfer depth, motion andtemperature data to the Hydromagic software.Echogram data needed to display and store full water column data won't be available.When you do not the echogram data, use this option to reduce the amount of data transferred.
Simple altimeter protocol
This is the most simple data transfer protocol available. Only the digitized depth is transferred.There is no real need to use this option, when no echogram data is needed, use the NMEA0183 option.
Select echo sounder mode
This option is only needed when using a dual frequency model like the Echologger D24 revision 2.0 andhigher.You can select which frequency you want to use, or select dual frequency mode when supported by yoursounder.

Plugins 437
© 2009-2021 Eye4Software B.V.
Testing the sounder
When the sounder has been connected and configured, click "OK" to store the settings and start theplugin.There should be a green icon in front of the plugin name when data is coming in successfully.
When no data is coming in, most of the times the incorrect serial port or speed has been selected.Also make sure the correct protocol has been chosen. You can check the current port, speed andprotocol with the GUI application shipped with the sounder:

Eye4Software Hydromagic 9.4438
© 2009-2021 Eye4Software B.V.
When data is received, you should be able to see the depth and motion sensor information in the datawindow.To have a look at the echogram data, select "Echogram(Hi)" or "Echogram(Lo") from the View menu.
Controlling the echo sounder
When the plugin has been loaded and the communication with echo sounder has been established, youshould be able to modify some settings.For more information on the settings which can be modified, please refer to your Echologger manual.
Depending on the echo sounder model and the selected echo sounder mode, you will be able to controlone or two channels.Please note that applying the new settings can take a couple of seconds. During this time there will be asmall gap in the collected data.

Plugins 439
© 2009-2021 Eye4Software B.V.

Eye4Software Hydromagic 9.4440
© 2009-2021 Eye4Software B.V.
10.5 Garmin USB-GPS plugin
The Garmin USB GPS Plugin can be used to connect various Garmin hand-held GPS models withHydromagic. Most Garmin GPS models also support NMEA0183 output, but very often the data cable forthis is sold separately.
Position data from the hand-held is also available via the USB port using Garmin's proprietary 'PVTprotocol'. PVT stands for 'P'osition, 'V'elocity and 'T'ime. This Hydromagic plugin is able to connect to theUSB device driver and decode the PVT sentences sent by the Garmin GPS.
Supported Garmin GPS models
Although the list may not be complete, as new models come out on a regular bases, it contains some ofthe models that can be connected using the Garmin USB plugin:
· GPS 18x, GPS 18x LVC, GPS18x-5Hz;· eTrex series (old units such as the Legend H, Legend HCx, Summit Cx, Venture Cx or Vista HCx);· GPSMap 60CSx, GPSMap 60CS or GPSMap 60;· GPSMap 62stc, GPSMap 62st, GPSMap 62sc, GPSMap 62s or GPSMap 62 (firmware older than
3.40);· GPSMap 64st, GPSMap 64s or GPSMap 64;

Plugins 441
© 2009-2021 Eye4Software B.V.
· GPSMap 76CSx, GPSMap 76CS or GPSMap 76C;· GPSMap 78s, GPSMap 78sc or GPSMap 78 (firmware older than 3.40);· Oregon series;· Montana series;· Rino 6xx series;
NOTE: By default the GPS18 series will sent NMEA0183 sentences over the USB port. To switch toPVT mode, you will have to use the proprietary $PGRMC1 command. Please refer to the GPS18 usersmanual for more information.
Loading the Garmin USB GPS plugin
To load this plugin, open the preferences window by selecting "Preferences..." from the "Options" menu.In the window that appears, select the "Devices" tab. Next click the "Add..." button.
A list of available plugins will be displayed. In this list, select the "Garmin USB PVT plugin forHydromagic" plugin and click "OK" to load the plugin. Since this device has its own device driver underWindows, no serial port or speed has to be selected, so the plugin is loaded without showing aconfiguration dialog first.

Eye4Software Hydromagic 9.4442
© 2009-2021 Eye4Software B.V.
Unloading the Garmin USB GPS plugin
To unload the GPS heading plugin, open the preferences window by selecting "Preferences..." from the"Options" menu.In the window that appears, select the "Devices" tab. Next select the "Garmin USB PVT plugin forHydromagic" and click the "Remove..." button.

Plugins 443
© 2009-2021 Eye4Software B.V.
10.6 GPS heading plugin
Hydromagic GPS heading Plugin
The Hydromagic GPS heading plugin is a plugin which allows you to get very accurate heading readings.Accurate heading readings can significantly improve your survey or dredging accuracy. Please note thata single GPS or RTK receiver only outputs a valid heading when your vessel is moving at a certainspeed.
An exception would be when your RTK receiver is placed exactly above your echosounder transducer (onthe same pole). In this scenario using two GPS or RTK receivers does not contribute to a higher qualitysurvey since the heading information is not used at all.
Some receivers use two antennas to calculate the heading. In this case you do not need to use thisplugin since the heading is calculated in the receiver internally. Use this plugin only when you are usingtwo separate GPS (GNSS) or RTK receivers!
How does it work?

Eye4Software Hydromagic 9.4444
© 2009-2021 Eye4Software B.V.
When you have two GPS or RTK receivers placed in a line perpendicular or parallel to the vessel's length,the heading of the vessel can be calculated by using the vincenty's formula on the geographiccoordinates outputted by the GPS or RTK receivers. When the vessel turns, both the locations of theantenna's will change and a new heading is calculated.
GPS or RTK receiver?
Regular GPS receivers without correction signal should do fine. It is correct that they have a rather bigerror (up to three meters), but since the antennas are so close to each other, the factors that will lead toa position error are almost the same for both, making that the calculated heading is not far off.
However, in the scenario when using two separate receivers, at some moments one receiver could userother satellites then the other, or one is receiving a SBAS signal while the other is not. When you alsohave to take tides in account, you should definitly go for a RTK receiver.
Loading the GPS heading plugin
To load this plugin, open the preferences window by selecting "Preferences..." from the "Options" menu.In the window that appears, select the "Devices" tab. Next click the "Add..." button.
A list of available plugins will be displayed. In this list, select the "RTK heading plugin for Hydromagic"plugin and click "OK" to load and display the configuration dialog.

Plugins 445
© 2009-2021 Eye4Software B.V.
Configuring the GPS heading plugin
Serial Communications
First you must to configure the serial communications with the GPS receivers. For each GPS, select theserial port number and speed. The receivers can be connected via a serial port or Bluetooth serialconnection.
As you can see in the configuration dialog, there is a primary and secondary GPS. The primary GPS isthe one the software is going to use for the vessel's position. The secondary GPS will be used tocalculate the heading only. When you define the GPS position in the 'Vessel Designer', always use theposition of the primary GPS antenna.
Offset
This field allows you to enter an offset which will be applied to the calculated heading. When the GPSantennas are lined up in the length of the vessel, you can leave this settings on zero degrees. When theGPS antennas are positioned next to each other, you will notice that there is a difference of 90 degreesbetween the vessel and the calculated heading. In this case you must enter an offset of +90.0 or -90.0degrees.
Advanced Settings
Depending on the GPS system you are using (RTK or not), select the GPS quality to expect so headingis calculated when both receivers have the same fix state. When using RTK receivers, please set thisvalue to 'RTK Fixed' for the highest accuracy.
The smoothing option is optional, when you found the calculated heading to unstable, you can smooth itout with this function. Should not be needed when using RTK receivers though. When using a smoothinglevel, it might take somewhat longer to get a heading calculation (up to forty-five seconds).

Eye4Software Hydromagic 9.4446
© 2009-2021 Eye4Software B.V.
Unloading the GPS heading plugin
To unload the GPS heading plugin, open the preferences window by selecting "Preferences..." from the"Options" menu.In the window that appears, select the "Devices" tab. Next select the "RTK heading plugin forHydromagic" and click the "Remove..." button.

Plugins 447
© 2009-2021 Eye4Software B.V.
10.7 Generic echosounder plugin
The generic echo sounder plugin can be used to decode serial data from an echo sounder without adedicated plugin. In this generic plugin, you can define the data format which is expected to be receivedfrom the sounder.
By defining a header, a depth value offset, a depth value length and an optional scale, you should be ableto decode data from almost any echosounder (as long as the output is in ASCII).
Loading the generic echo sounder plugin for Hydromagic
To load this plugin, open the preferences window by selecting "Preferences..." from the "Options" menu.In the window that appears, select the "Devices" tab. Next click the "Add..." button.

Eye4Software Hydromagic 9.4448
© 2009-2021 Eye4Software B.V.
A list of available plugins will be displayed. In this list, select the "Hydromagic Generic Echosounder"plugin and click "OK" to load and display the configuration dialog.
Configuring the generic echo sounder plugin
Serial or Ethernet Communications

Plugins 449
© 2009-2021 Eye4Software B.V.
First you must to configure the serial or Ethernet communication with the echo sounder. This pluginsupports incoming data over a serial port, TCP or UDP. For more information on this, please see theGeneral information on using plugins document.
Configuring the data format
In this example we will show an example on how to configure a custom data format. Although there is adedicated plugin for the DESO25 data format, we will use it as an example here:
DA 32.08 m
DB 31.83 m
DA 32.04 m
DB 31.81 m
Frequencies
In the configuration you can check whether the sentences start with a fixed header, the start of the depthdata, the length of the depth data and whether a scale has to be applied (only when depth value isn't inmeters). The above sample data reports both high and low frequency depths so we check both the 'UseHi Frequency' and 'Use Lo Frequency' boxes.
To distinguish between the low and high frequency sentences we enter the headers, 'DA' for highfrequency, 'DB' for low frequency (this could be the other way around depending on transducerconfigurations). Now the software knows to treat the sentence containing the 'DA' header as highfrequency value and the sentence starting with 'DB' as low frequency value.
Depth Value
Now we need to tell the software where the actual depth is. Please note that this only will work when thedepth is sent as an ASCII (readable) value. Also note that the characters are zero indexed, which meansthat the first character is at index zero (D = 0, A = 1 etc..).
The depth value starts at index '3' and is '5' characters long. This is the same for both frequencies, so weenter 3 as start offset and 5 for length. For size always counter the number of digits including the dot (.).
Scale / Units
Use a scale only when the depth is not in meters. For instance, when the depth is in centimeters, pleaseuse 0.01, when the depth is in feet, used .3048 to convert to meters.

Eye4Software Hydromagic 9.4450
© 2009-2021 Eye4Software B.V.
Unloading the generic echo sounder plugin
To unload the generic echo sounder plugin, open the preferences window by selecting "Preferences..."from the "Options" menu.In the window that appears, select the "Devices" tab. Next select the "Hydromagic GenericEchosounder" and click the "Remove..." button.

Plugins 451
© 2009-2021 Eye4Software B.V.
10.8 Hydromagic ASCII output plugin
The Hydromagic ASCII output plugin allows you to send ASCII formatted data to a third party applicationusing a serial port, TCP or UDP connection. You can define the data messages by yourself, by includingplaceholders that will be replaced with the actual position, depth, motion, tide data or more.
Loading the ASCII output plugin
To load this plugin, open the preferences window by selecting "Preferences..." from the "Options" menu.In the window that appears, select the "Devices" tab. Next click the "Add..." button.

Eye4Software Hydromagic 9.4452
© 2009-2021 Eye4Software B.V.
Click the "Add..." button to load a new plugin.
A list of available plugins will be displayed. From this list, select the "ASCII Output Plugin forHydromagic" and click "OK" to load and display the plugin's configuration window.
Select "ASCII output plugin for Hydromagic" from the list and click "OK".
Configuring the communication settings
This plugin can send data over a serial port or an Ethernet or WiFi connection using TCP or UDP. Pleasenote that when sending data over a serial port to another computer, you will need a so called "null-

Plugins 453
© 2009-2021 Eye4Software B.V.
modem" cable (crossed rxd/txd wire pairs). For TCP and UDP you can use a WiFi access point or anEthernet switch.
When the data has to be send to another computer using TCP or UDP, make sure you enter the host IPaddress of the target computer. Use the 'connection type' drop down box to switch between serial portand TCP/IP communication.
Configure the serial or TCP/IP communication settings.
Configuring the output string
After setting how the data will be send, you need to define the string that will be sent each time theinterval timer expires. To do so, click the 'Define Output Format...' button. The example above sends outthe current timestamp followed by the x, y and z coordinate.
You can define the generated output string by using placeholders and custom text.
The output string is configured by adding placeholders separated with separators such as a comma,semi column, pipe symbol etc.. To add a placeholder, simply click the "Add Placeholder" button. Aselection dialog will be displayed which can be used to pick one.

Eye4Software Hydromagic 9.4454
© 2009-2021 Eye4Software B.V.
Select one of the placeholders from the list.
Please note, that you have to add the separator characters by yourself. When you want to separate thefields by tabs, please use the "Add Tab" button. When you completed adding all the required fields,please do not forget to terminate your string by adding a line-feed or carriage return. You can use the"Add Line Feed" or "Add Carriage Return" buttons to do so.
Testing the configuration
To test the configuration as well as the resulting output data, go back to the list of plugins and select the"ASCII Output Plugin for Hydromagic" plugin. Next, click the "Monitor" button to have a look at theoutgoing data. When there is no output data, or when there is a red exclamation icon in front of theplugin name, please consult the real-time activity view for more information on the problem.

Plugins 455
© 2009-2021 Eye4Software B.V.
Click "M onitor..." to launch the "Communications M onitor".
In the real-time communications monitor you can see at which interval the data is send as well as thecontent of the output data:
Use the "Communications M onitor" to test the configuration.

Eye4Software Hydromagic 9.4456
© 2009-2021 Eye4Software B.V.
Unloading the Hydromagic ASCII output plugin
To unload the generic echo sounder plugin, open the preferences window by selecting "Preferences..."from the "Options" menu. In the window that appears, select the "Devices" tab. Next select the "ASCIIOutput Plugin for Hydromagic" and click the "Remove..." button.
Plugins can be unloaded using the "Remove" button.
10.9 Hydromagic NMEA0183 output plugin
The Hydromagic NMEA0183 output plugin allows you to send NMEA0183 formatted data to a third partyapplication using a serial port, TCP or UDP connection. Position, depth, heading, speed and time will beincluded in the outgoing messages.
Loading the NMEA0183 output plugin
To load this plugin, open the preferences window by selecting "Preferences..." from the "Options" menu.In the window that appears, select the "Devices" tab. Next click the "Add..." button.

Plugins 457
© 2009-2021 Eye4Software B.V.
Click the "Add..."button to load a new plugin.
A list of available plugins will be displayed. From this list, select the "NMEA0183 OUT Plugin forHydromagic" and click "OK" to load and display the plugin's configuration window.
Select "NM EA0183 OUT Plugin for Hydromagic" from the list and click "OK".

Eye4Software Hydromagic 9.4458
© 2009-2021 Eye4Software B.V.
Configuring the communication settings
This plugin can send out data over a serial port or an Ethernet or WiFi connection using TCP or UDP.Please note that when sending data over a serial port to another computer, you will need a so called null-modem cable (crossed rxd/txd wire pairs). For TCP and UDP you can use a WiFi access point or anEthernet switch.
When the data has to be send to another computer using TCP or UDP, make sure you enter the host IPaddress of the target computer. Use the 'connection type' drop down box to switch between serial portand TCP/IP communication.
Configure the serial or TCP/IP communication settings.
Testing the configuration
To test the configuration as well as the resulting output data, go back to the list of plugins and select the"NMEA0183 Output Plugin for Hydromagic" plugin. Next, click the "Monitor" button to have a look at theoutgoing data. When there is no output data, or when there is a red exclamation icon in front of theplugin name, please consult the real-time activity view for more information on the problem.

Plugins 459
© 2009-2021 Eye4Software B.V.
Click "M onitor..." to launch the "Communications M onitor".
In the real-time communications monitor you can see at which interval the data is send as well as thecontent of the output data:
Use the "Communications M onitor" to test the configuration.

Eye4Software Hydromagic 9.4460
© 2009-2021 Eye4Software B.V.
Unloading the Hydromagic NMEA0183 output plugin
To unload the generic echo sounder plugin, open the preferences window by selecting "Preferences..."from the "Options" menu. In the window that appears, select the "Devices" tab. Next select the"NMEA0183 OUT Plugin for Hydromagic" and click the "Remove..." button.
Plugins can be unloaded using the "Remove" button.
10.10 Hydromagic Manual Sound Velocity plugin
The Hydromagic Manual Sound Velocity Plugin is a plugin with graphical user interface designed to letyou set the current sound velocity by hand.This allows you to enter sound velocity changes during thesurvey when no sound velocity profiler data is available.
Loading the manual sound velocity plugin
To load this plugin, open the preferences window by selecting "Preferences..." from the "Options" menu.In the window that appears, select the "Devices" tab. Next click the "Add..." button.

Plugins 461
© 2009-2021 Eye4Software B.V.
A list of available plugins will be displayed. In this list, select the "Hydromagic Manual Sound VelocityPlugin" and click "OK" to load and display the plugin's user interface.
Using the manual sound velocity plugin
As soon as the manual sound velocity plugin has been loaded it will add sound velocity measurementsto the raw data when recording has been started. The sound velocity value is written to the start and endof raw data files, and when the sound velocity level has been changed by the user.
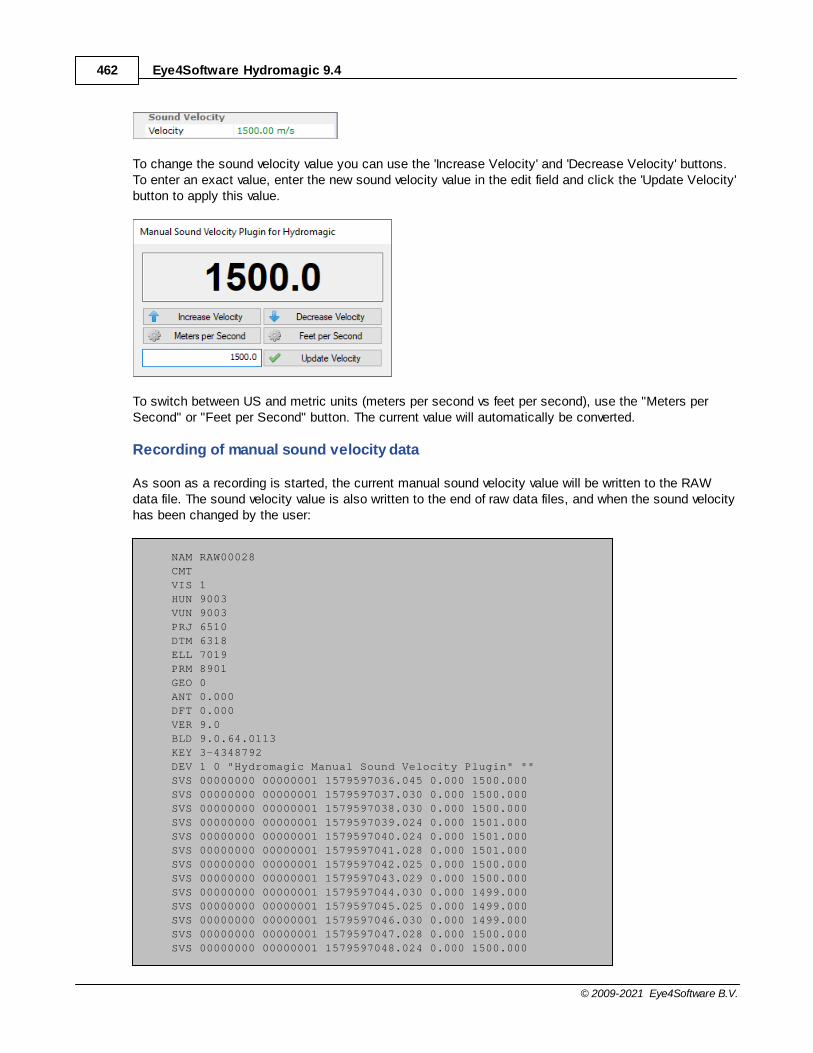
Eye4Software Hydromagic 9.4462
© 2009-2021 Eye4Software B.V.
To change the sound velocity value you can use the 'Increase Velocity' and 'Decrease Velocity' buttons.To enter an exact value, enter the new sound velocity value in the edit field and click the 'Update Velocity'button to apply this value.
To switch between US and metric units (meters per second vs feet per second), use the "Meters perSecond" or "Feet per Second" button. The current value will automatically be converted.
Recording of manual sound velocity data
As soon as a recording is started, the current manual sound velocity value will be written to the RAWdata file. The sound velocity value is also written to the end of raw data files, and when the sound velocityhas been changed by the user:
NAM RAW00028
CMT
VIS 1
HUN 9003
VUN 9003
PRJ 6510
DTM 6318
ELL 7019
PRM 8901
GEO 0
ANT 0.000
DFT 0.000
VER 9.0
BLD 9.0.64.0113
KEY 3-4348792
DEV 1 0 "Hydromagic Manual Sound Velocity Plugin" ""
SVS 00000000 00000001 1579597036.045 0.000 1500.000
SVS 00000000 00000001 1579597037.030 0.000 1500.000
SVS 00000000 00000001 1579597038.030 0.000 1500.000
SVS 00000000 00000001 1579597039.024 0.000 1501.000
SVS 00000000 00000001 1579597040.024 0.000 1501.000
SVS 00000000 00000001 1579597041.028 0.000 1501.000
SVS 00000000 00000001 1579597042.025 0.000 1500.000
SVS 00000000 00000001 1579597043.029 0.000 1500.000
SVS 00000000 00000001 1579597044.030 0.000 1499.000
SVS 00000000 00000001 1579597045.025 0.000 1499.000
SVS 00000000 00000001 1579597046.030 0.000 1499.000
SVS 00000000 00000001 1579597047.028 0.000 1500.000
SVS 00000000 00000001 1579597048.024 0.000 1500.000

Plugins 463
© 2009-2021 Eye4Software B.V.
SVS 00000000 00000001 1579597049.027 0.000 1501.000
SVS 00000000 00000001 1579597050.027 0.000 1501.000
M anual sound velocity data recorded in a Hydromagic RAW data file
Unloading the manual sound velocity plugin
To unload the manual sound velocity plugin window, open the preferences window by selecting"Preferences..." from the "Options" menu. In the window that appears, select the "Devices" tab. Nextselect the "Hydromagic Manual Sound Velocity Plugin", right-click and select "Remove Device..." fromthe popup menu.
When the plugin is unloaded (either when removed from the devices list, or when the software isstopped), the current sound velocity and window position are stored. The next time the plugin is loaded,the user interface will be on the same screen location and the last known manual sound velocity valuewill be displayed.

Eye4Software Hydromagic 9.4464
© 2009-2021 Eye4Software B.V.
10.11 Manual Tide Plugin
The Hydromagic Manual Tide Plugin is a plugin with graphical user interface designed to let you set thecurrent tide level by hand.This allows you to create soundings on tide waters even when no RTK receiver or tide receiver isavailable.
Loading the manual tide plugin
To load this plugin, open the preferences window by selecting "Preferences..." from the "Options" menu.In the window that appears, select the "Devices" tab. Next click the "Add..." button.
A list of available plugins will be displayed. In this list, select the "Hydromagic Manual Tide Plugin" andclick "OK" to load and display the plugin's user interface.
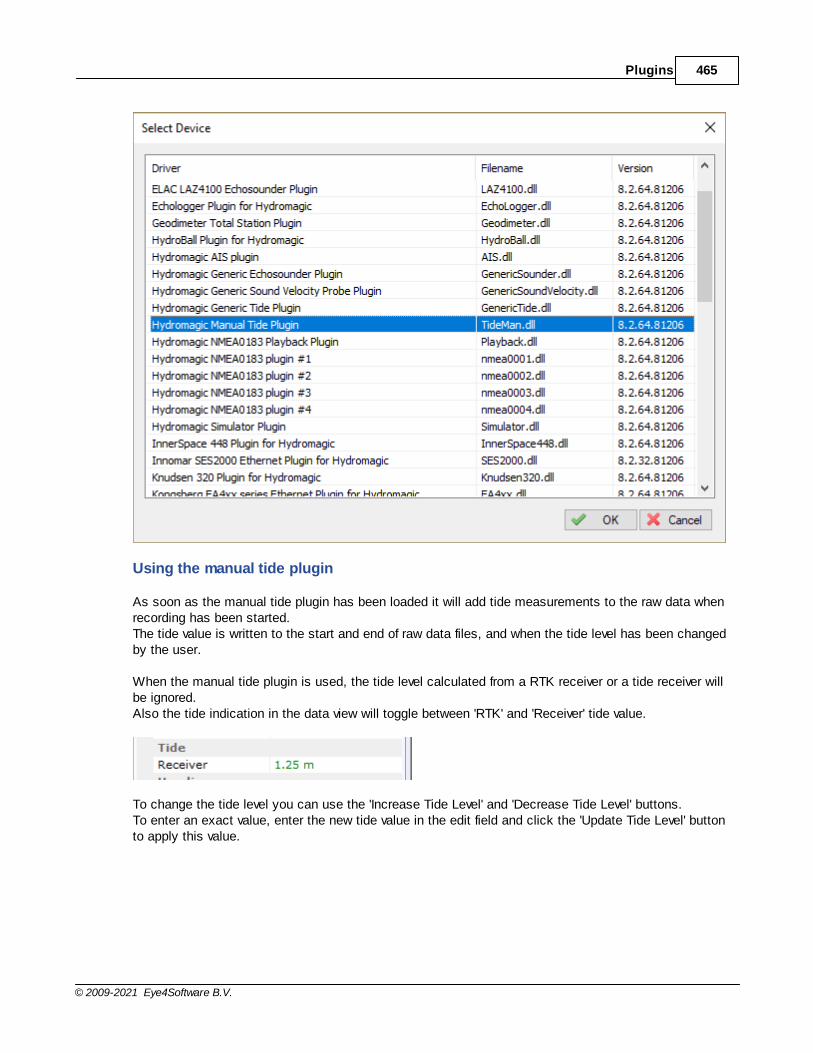
Plugins 465
© 2009-2021 Eye4Software B.V.
Using the manual tide plugin
As soon as the manual tide plugin has been loaded it will add tide measurements to the raw data whenrecording has been started. The tide value is written to the start and end of raw data files, and when the tide level has been changedby the user.
When the manual tide plugin is used, the tide level calculated from a RTK receiver or a tide receiver willbe ignored.Also the tide indication in the data view will toggle between 'RTK' and 'Receiver' tide value.
To change the tide level you can use the 'Increase Tide Level' and 'Decrease Tide Level' buttons.To enter an exact value, enter the new tide value in the edit field and click the 'Update Tide Level' buttonto apply this value.

Eye4Software Hydromagic 9.4466
© 2009-2021 Eye4Software B.V.
Recording of manual tide data
As soon as a recording is started, the current manual tide level will be written to the RAW data file.The tide value is also written to the end of raw data files, and when the tide level has been changed bythe user:
NAM RAW00002
CMT
VIS 1
HUN 9001
VUN 9001
PRJ 23090
DTM 4230
ELL 7030
PRM 8901
GEO 1
ANT 0.000
DFT 0.300
VER 8.2
BLD 8.2.64.81212
KEY 3-4157063
TID 00000001 00000001 1544982739.322 0.000 1.250
TID 00000001 00000001 1544982745.320 0.000 1.300
TID 00000001 00000001 1544982747.320 0.000 1.350
TID 00000001 00000001 1544982748.321 0.000 1.300
TID 00000001 00000001 1544982749.321 0.000 1.250
M anual tide data recorded in a Hydromagic RAW data file
Unloading the manual tide plugin
To unload the manual tide plugin window, open the preferences window by selecting "Preferences..."from the "Options" menu.In the window that appears, select the "Devices" tab. Next select the "Hydromagic Manual Tide Plugin",right-click and select "Remove Device..." from the popup menu.
When the plugin is unloaded (either when removed from the devices list, or when the software isstopped), the current tide level and window position are stored.The next time the plugin is loaded, the user interface will be on the same screen location and the lastknown manual tide value will be displayed.
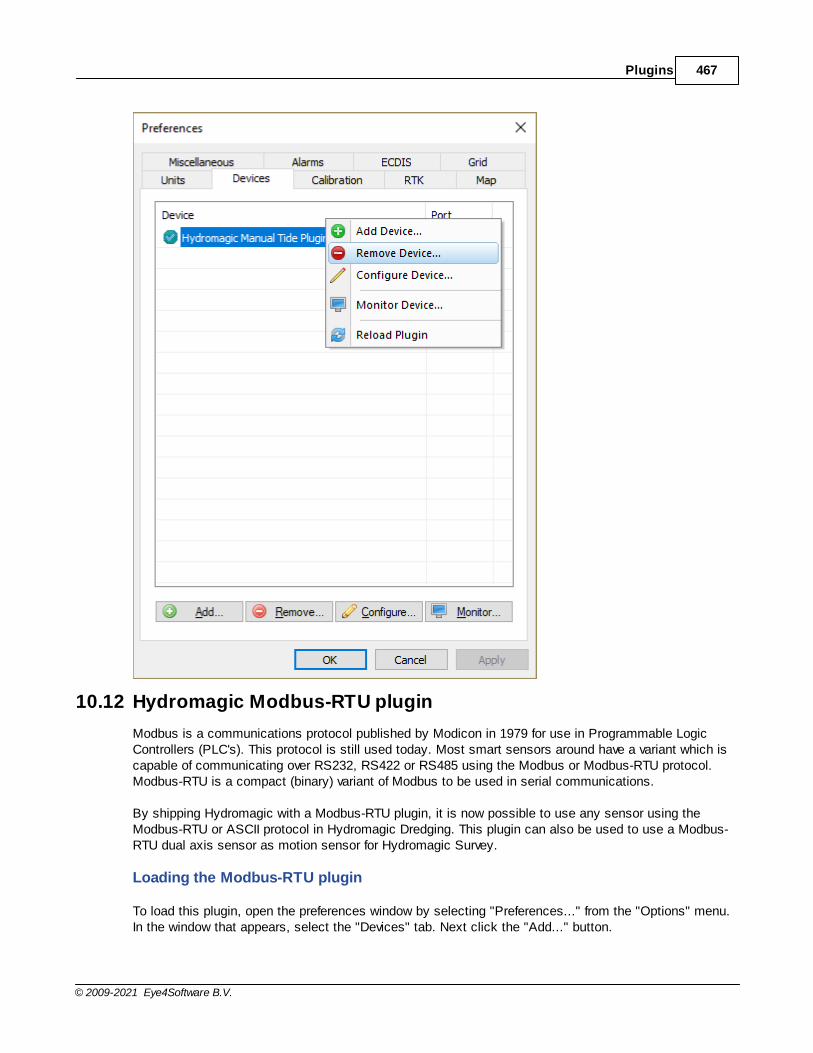
Plugins 467
© 2009-2021 Eye4Software B.V.
10.12 Hydromagic Modbus-RTU plugin
Modbus is a communications protocol published by Modicon in 1979 for use in Programmable LogicControllers (PLC's). This protocol is still used today. Most smart sensors around have a variant which iscapable of communicating over RS232, RS422 or RS485 using the Modbus or Modbus-RTU protocol.Modbus-RTU is a compact (binary) variant of Modbus to be used in serial communications.
By shipping Hydromagic with a Modbus-RTU plugin, it is now possible to use any sensor using theModbus-RTU or ASCII protocol in Hydromagic Dredging. This plugin can also be used to use a Modbus-RTU dual axis sensor as motion sensor for Hydromagic Survey.
Loading the Modbus-RTU plugin
To load this plugin, open the preferences window by selecting "Preferences..." from the "Options" menu.In the window that appears, select the "Devices" tab. Next click the "Add..." button.

Eye4Software Hydromagic 9.4468
© 2009-2021 Eye4Software B.V.
The devices tab in the "Preferences" dialog.
A list of available plugins will be displayed. In this list, select the "Modbus-RTU plugin for dredgingsensors" plugin and click "OK" to load and display the configuration dialog.
Select the Hydromagic M odbus-RTU plugin from the list of available plugins.

Plugins 469
© 2009-2021 Eye4Software B.V.
Configuring the Modbus plugin
Serial Communications
First you must to configure the serial communications with the Modbus device(s). For Modbus-RTU, thedefault serial speed is 19200 bps and the 8E1 serial data format is used. Make sure you select thisformat, the 8N1 format, which is most often used, does not work for Modbus. Not all Modbus devices canbe connected to a serial port directly. In some cases you will need a RS422/485 to RS232 converter inorder to communicate with the sensor(s).
Sensor Settings
With Modbus, sensor values are stored at register indices. For each sensor you have to configure thedevice address, start register, register length and a scale factor. In the first column, you have to map theregister value to a sensor:
§ N/A - Unused;§ P - Pitch value;§ R - Roll value;§ Y - Yaw value;§ V1 - Segment 1 vertical angle (ladder or boom);§ V2 - Segment 2 vertical angle (stick);§ V3 - Segment 3 vertical angle (bucket);§ H1 - Segment 1 horizontal angle;§ H2 - Segment 2 horizontal angle;§ H3 - Segment 3 horizontal angle;
You have to enter the register index and register length in the second and third field respectively. Youcan find the register indices for your sensor in the user manual. The values have to be entered ashexadecimal values. When the user manual list them as decimal values, you can use the WindowsCalculator in "Programmer Mode" to convert from decimal to hexadecimal. The length field is in words (aword is two bytes). The only valid values for this field are '01' and '02' (16 or 32 bit values).
Finally you have to enter a scale factor. Most sensors store angle values in hundreds of degrees, so thevalues stored in the registers have to be divided by 100. For instance a pitch roll sensor will report theangles in a -9000 ... +9000 range, so we enter a scale factor of 100 in such cases. Again, please refer tothe user manual of the sensor for more information.
The screen shot below shows an example configuration for a Tiltix dual-axis sensor. When using factorysettings, these sensors listen at device address "7F". This particular device stores the X-axis inhundreds of degrees at register 0x00, and the Y-axis angle value is stored at register 0x02. For bothvalues, the size of the values is two words (four bytes). Using this settings, you should be able toconfigure almost any Modbus-RTU enabled device in Hydromagic.
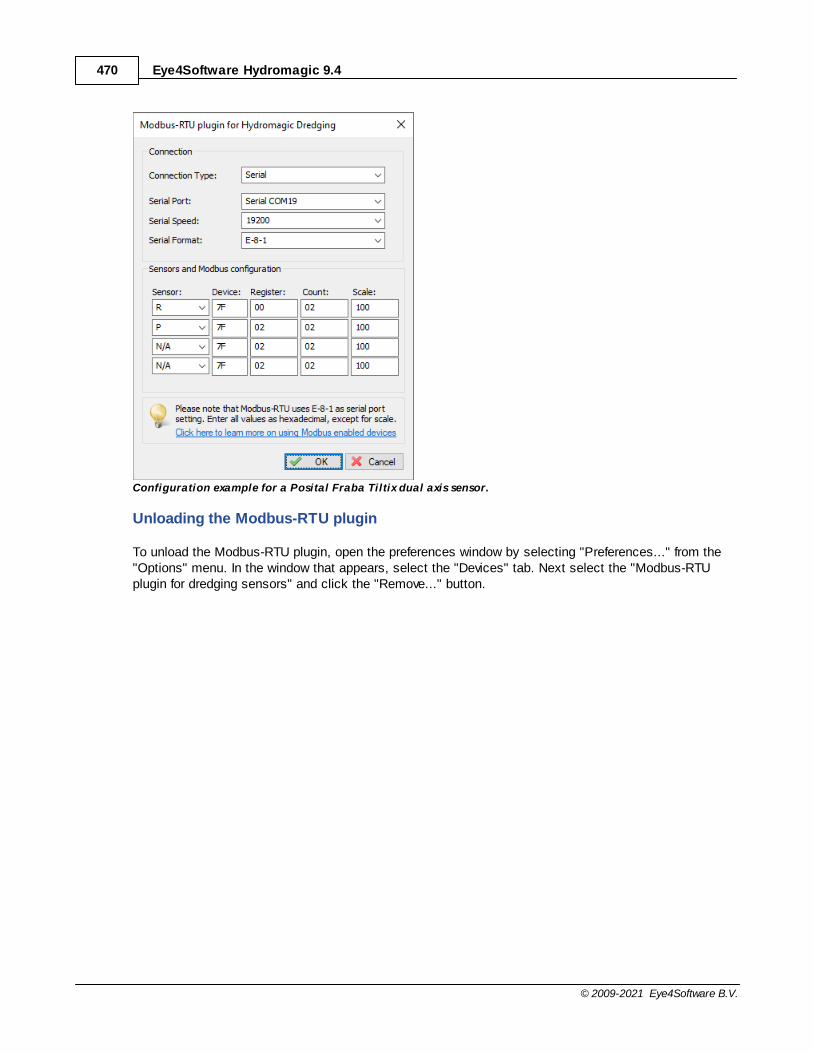
Eye4Software Hydromagic 9.4470
© 2009-2021 Eye4Software B.V.
Configuration example for a Posital Fraba Tiltix dual axis sensor.
Unloading the Modbus-RTU plugin
To unload the Modbus-RTU plugin, open the preferences window by selecting "Preferences..." from the"Options" menu. In the window that appears, select the "Devices" tab. Next select the "Modbus-RTUplugin for dredging sensors" and click the "Remove..." button.

Plugins 471
© 2009-2021 Eye4Software B.V.
Select the M odbus-RTU plugin and click the "Remove..." button to unload the plugin.
10.13 NMEA0183 Playback Plugin
The Hydromagic NMEA0183 Playback plugin is a plugin which allows you to send NMEA0183 data tothe software as if it were received in real time. You can use this functionality to re-record NMEA0183 data, demopurposes and testing.
The NMEA0183 data is fed to the plugin by selecting a text file that contains NMEA0183 sentences. The sentences supported are the same as the ones that are supported in the regular NMEA0183 plugins.It is possible to simulate tide as well, using the manual tide buttons in the main tool bar.
Loading the NMEA0183 Playback plugin
To load this plugin, open the preferences window by selecting "Preferences..." from the "Options" menu.In the window that appears, select the "Devices" tab. Next click the "Add..." button.

Eye4Software Hydromagic 9.4472
© 2009-2021 Eye4Software B.V.
A list of available plugins will be displayed. In this list, select the "Hydromagic NMEA0183 PlaybackPlugin" and click "OK" to load and display the playback plugin.

Plugins 473
© 2009-2021 Eye4Software B.V.
Using the playback plugin
In order to start pushing the simulator data into the application, you have to select a valid NMEA0183logfile first.To do so, click the 'Browse...' button and select the file to replay. You can check whether the file is validby clicking 'View...'.
When a file is loaded, the 'Start' button will be enabled and clicking this button will start reading theNMEA0183 file sentence by sentence. The data is decoded and send to the survey or dredging application as it was raw data received from realNMEA0183 hardware.
You can pause playback at any time by clicking the 'Stop' button, or start from the beginning by clickingthe 'Rewind' button. The playback speed can be controlled with the 'Default Speed', 'Increase Speed' and 'Decrease Speed'buttons. By default, the playback rate is one sentence per 250 milliseconds.
To change the NMEA0183 logfile, press the 'Stop' button first. This stops the simulator and the'Browse...' button will be enabled, allowing you to select a different file.

Eye4Software Hydromagic 9.4474
© 2009-2021 Eye4Software B.V.
Unloading the playback plugin
To unload the simulator, open the preferences window by selecting "Preferences..." from the "Options"menu.In the window that appears, select the "Devices" tab. Next select the "Hydromagic NMEA0183 PlaybackPlugin" and click the "Remove..." button.

Plugins 475
© 2009-2021 Eye4Software B.V.
10.14 Hydromagic NTRIP Plugin
NTRIP stands for 'Networked Transport of RTCM via Internet Protocol'.As the name already reveals, it allows the transport of RTCM correction data over the Internet.
The 'NTRIP Plugin for Hydromagic' is a plugin which allows you to transfer RTCM data received from aservice on the Internet(also called NTRIP caster) directly to your RTK rover via either a serial connection or a local TCP or UDPconnection.
The NTRIP forwards RTCM or CMR(+) messages without modification to your RTK equipment directly.All that is required is a (free) service that provides the RTCM104 or CMR(+) data.
Loading the NTRIP plugin
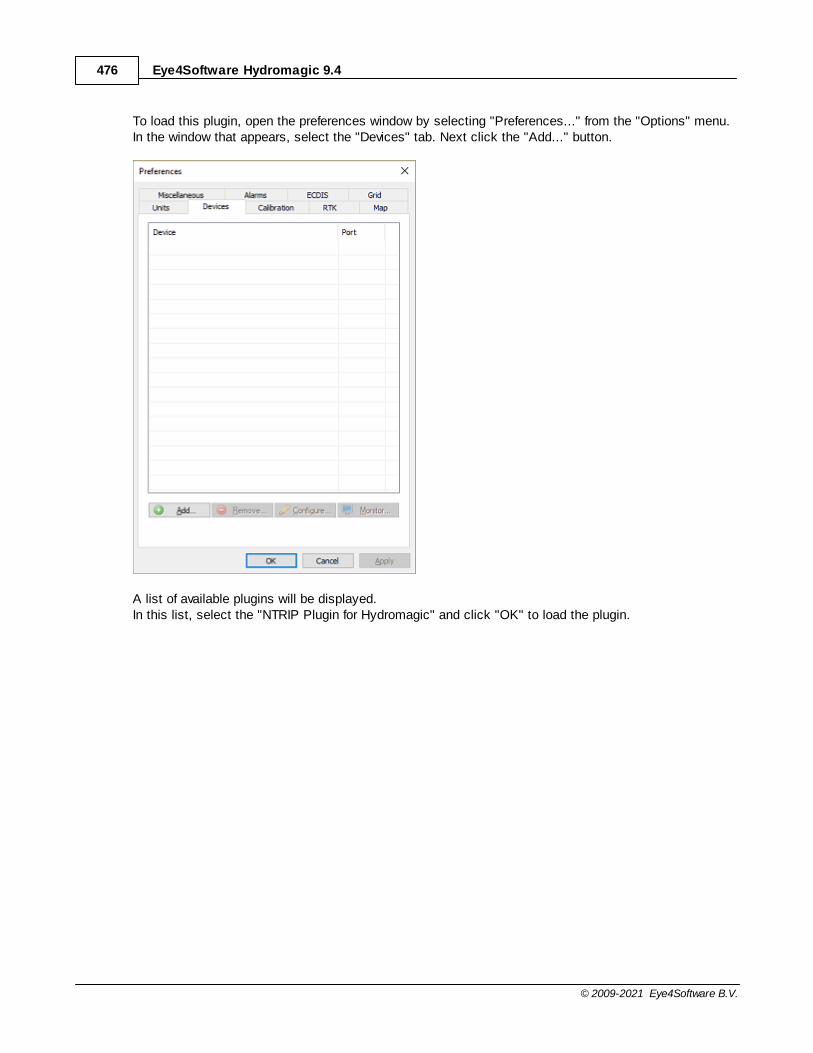
Eye4Software Hydromagic 9.4476
© 2009-2021 Eye4Software B.V.
To load this plugin, open the preferences window by selecting "Preferences..." from the "Options" menu.In the window that appears, select the "Devices" tab. Next click the "Add..." button.
A list of available plugins will be displayed.In this list, select the "NTRIP Plugin for Hydromagic" and click "OK" to load the plugin.

Plugins 477
© 2009-2021 Eye4Software B.V.
Configuring the NTRIP caster
In order to start forwarding RTCM data into the RTK rover using the NTRIP plugin,you have to configure the source of the data first.
These settings will be provided by your local NTRIP caster.
There are also some providers which you can try for free,although they might not always provide the same accuracy as paid services,but in some cases a free provider may provide enough accuracy for your application.

Eye4Software Hydromagic 9.4478
© 2009-2021 Eye4Software B.V.
When you have entered the IP address or host name and the authentication information,click the reload button to populate the drop-down list with the available streams and select the one thatmatches your application.Separate streams may exist per area or constellations used. Again refer to the provider for moreinformation on which stream to use.
When the plugin failed to populate the list, it may be because of a connection error.Please refer to the Hydromagic event log to find more information on the cause of the error.
Configuring the RTCM output
In this section you can configure the way the data is forwarded to the RTK rover.This can either be via a serial or an Ethernet connection.
How this is configured depends on the RTK rover used.Make sure that the RTK rover is configured to listen for RTCM data on the serial or network port as well.
Using VRS networks

Plugins 479
© 2009-2021 Eye4Software B.V.
VRS stands for 'Virtual Reference Station'. This means that a base station is simulated for your positionby interpolating correction data received by a network of multiple reference stations in your country orarea. In order to calculate the correction data for your location correctly, upon connection the plugin hasto send a single NMEA0183 GGA sentence containing your geographic position.
Other then a regular base station, which is often configured with TCP/IP port 2101, a VRS network issometimes on a separate TCP/IP port, in most cases 2102. If you want to use VRS, you might want tocheck the location of the VRS stream with your local provider.
When VRS is used, please check the 'Send position data to NTRIP caster' option. Without this optionset, it is not possible to use VRS networks. Please note that your actual position will be disclosed toyour provider.
10.15 Hydromagic Simulator Plugin
Hydromagic Simulator Plugin
The Hydromagic Simulator Plugin is a plugin with graphical user interface designed to simulate varioustypes of hardware.This allows you to test drive or demonstrate the software without the need to connect actual hardware.
With the simulator you will be able to simulate the following input values:
üGPS Position;ü Speed over ground;ü True heading;ü Echosounder depth (high frequency);ü Echosounder depth (low frequency);üMotion (heave, roll and pitch);ü Sound velocity;
It is possible to simulate tide as well, using the manual tide buttons in the main toolbar.The simulator can be used in both Hydromagic Survey and Hydromagic Dredging.
Loading the simulator plugin
To load this plugin, open the preferences window by selecting "Preferences..." from the "Options" menu.In the window that appears, select the "Devices" tab. Next click the "Add..." button.
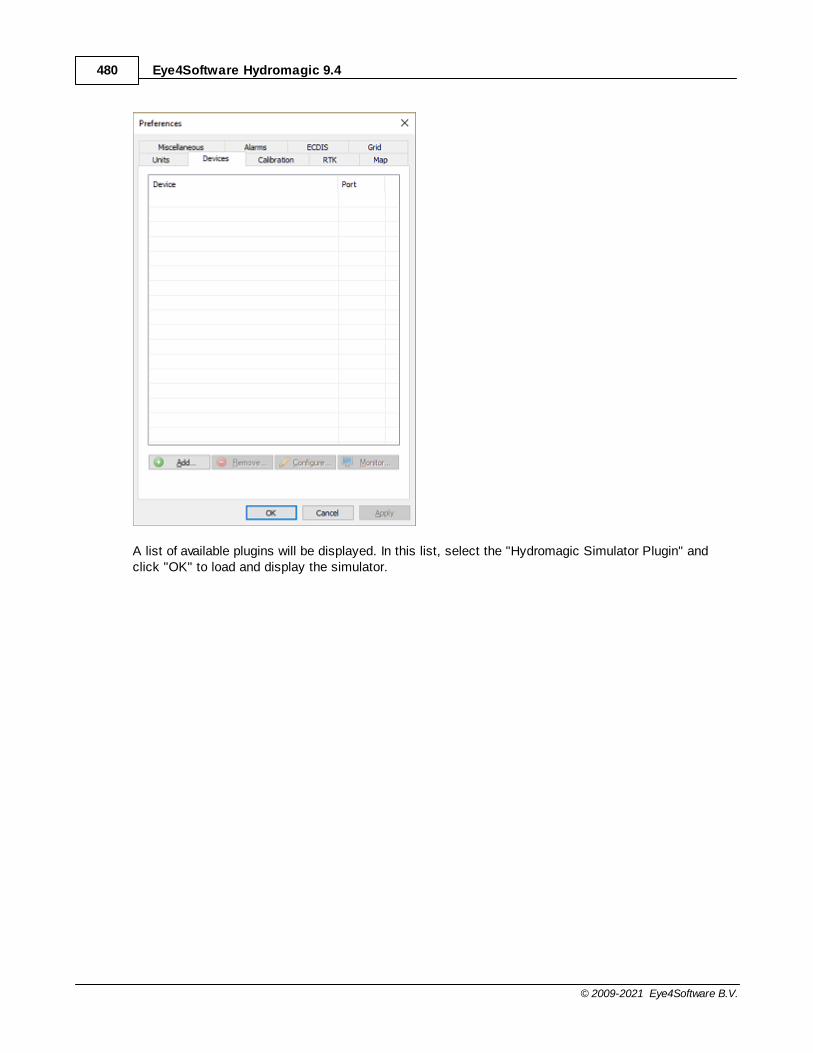
Eye4Software Hydromagic 9.4480
© 2009-2021 Eye4Software B.V.
A list of available plugins will be displayed. In this list, select the "Hydromagic Simulator Plugin" andclick "OK" to load and display the simulator.

Plugins 481
© 2009-2021 Eye4Software B.V.
Using the simulator
In order to start pushing the simulator data into the application, click the "Start" button.To stop the simulation press "Stop". When started, the simulator will send data with 500 millisecondintervals.

Eye4Software Hydromagic 9.4482
© 2009-2021 Eye4Software B.V.
Unloading the simulator
To unload the simulator, open the preferences window by selecting "Preferences..." from the "Options"menu.In the window that appears, select the "Devices" tab. Next select the "Hydromagic Simulator Plugin" andclick the "Remove" button.

Plugins 483
© 2009-2021 Eye4Software B.V.
10.16 Knudsen echo sounder plugin
The Knudsen echo sounder plugin allows you to connect one of the supported Knudsen echo soundersas listed below. Knudsen echo sounders communicate to third-party software via their SonarSuite USBsoftware. This software is a gateway between the USB connection on the sounder and client programs,including Knudsen's "EchoControlClient" software.
The Hydromagic plugin connects directly to the Knudsen "EchoControlServer" software to retrieve depthand the raw echo return envelope data. This connection is made via TCP using a (built-in) loopbackconnection (localhost or 127.0.0.1) on your computer or over a LAN or WiFi network when needed.
The following Knudsen echo sounders can be used with this Hydromagic plugin:
§ Knudsen sounder rack series 1602;

Eye4Software Hydromagic 9.4484
© 2009-2021 Eye4Software B.V.
§ Knudsen sounder rack series 1604;§ Knudsen 1612 portable echo sounder;§ Knudsen mini sounder;§ Knudsen ROVer sounder;§ Knudsen Pinger;§ Knudsen 320N.
The Knudsen 1602/1604 rack mounted echo sounder series.
Installing the Windows device driver manually (USB models only)
If your "SonarSuite" software package is already up and running, you can skip this chapter where wediscuss how to install the device driver for the USB echo sounder models. For Ethernet models there isalso no need for device driver installation, other than for your computer's network adapter itself, which ismost likely already installed.
Please note that when you have received a software installer called "SounderSetup.exe" from Knudsen(on the included CD-ROM), you can use this installer instead of installing the drivers manually.

Plugins 485
© 2009-2021 Eye4Software B.V.
The folder containing the USB device drivers on the Knudsen CD-ROM , USB stick or harddrive.
You can find the USB device drivers needed for installation on the CD-ROM shipped with the echosounder. Since the drivers are (likely) not digitally signed for Windows 8, 8.1 and Windows 10, anadditional step is required to allow them to be installed on your system. Please perform the followingsteps as explained in the "Installing unsigned device drivers under Windows 10" document beforeinstalling the drivers.
To install the drivers, go to the folder containing the driver files and right-click the "echousb.inf" or"echousb_x64.inf" when running a 64-bit version of Windows, and select "Install" from the popup menu.After a few moments a popup telling you that the operation has been completed will be shown. You cannow connect the sounder.
To check whether the driver installation was successfull, launch the "Device Manager" by right-clickingthe Windows start menu, and selecting "Device Manager". When the drivers are installed correctly, youshould see an "EchoSounder" item in the list:

Eye4Software Hydromagic 9.4486
© 2009-2021 Eye4Software B.V.
After installing the driver, an EchoSounder item should be present in the "Device M anager".
Starting the EchoControlServer
The "EchoControlServer" is used as "Gateway" software between the sounder and the local TCP/IPnetwork. It communicates with the sounder over USB and allows their "EchoControlClient" to establish anetwork or loopback connectionto it to control the echo sounder. The "EchoControlServer" is also usedby Hydromagic to access the measured depth and echo return envelope data.
When the device drivers are installed correctly, run the "EchoControlServer" program from the desktop orprogram installation folder. When there is no error communicating with the echo sounder over USB, theapplication will be started as a background application, but will visible as an icon in the notification area:
Knudsen notification area icon (in red or silver depending on software version).
Starting the EchoControlClient
The "EchoControlClient" connects to the "EchoControlServer" software, so you always have to start theserver software first. The "EchoControlClient" allows you to view the incoming data and to control thesounder. You have to use it to start and stop sending pings, adjust the range, gain settings and muchmore. For more information please refer to the "SonarSuite-USB" manual in the support section of theKnudsen website.

Plugins 487
© 2009-2021 Eye4Software B.V.
When using Hydromagic with a Knudsen sounder, you have to run the "EchoControlClient"simultaneously to control the echo sounder. Controlling the sounder is not possible via Hydromagic, itwill only read data.
Use the EchoControlClient to control the Knudsen echo sounder.
Loading the Knudsen echo sounder plugin
To load this plugin, open the preferences window by selecting "Preferences..." from the "Options" menu.In the window that appears, select the "Devices" tab. Next click the "Add..." button.

Eye4Software Hydromagic 9.4488
© 2009-2021 Eye4Software B.V.
Click "Add..." to load a plugin.
A list of available plugins will be displayed. In this list, select the "Knudsen SonarSuite echo sounderplugin" and click "OK" to load and configure the plugin.
Knudsen SonarSuite echo sounder plugin.
Configuring the plugin

Plugins 489
© 2009-2021 Eye4Software B.V.
When the plugin is selected and loaded, the configuration dialog for the plugin will be shown. In almostall cases you can accept the default settings. Just click "OK", unless the server has been configured onanother TCP port, or when the "EchoControlServer" is running on a different computer or echo sounder.
The default settings can be used in most cases.
Testing the plugin
When the Knudsen software has been configured you should see depth data displayed in the data view(please make sure you have started the sounder in the "EchoControlClient" software!). If not, you canperform the following steps to troubleshoot the problem:
First check whether the connection between Hydromagic and the "EchoControlServer" has beenestablished. Double click the Knudsen icon in the notification area to show the "EchoControlServer" log.When Hydromagic has been connected this will be shown in the log:
Check the EchoControlServer log to verify the connection has been established.
When no connection is established, most probably the software is using another TCP port, the IPaddress is incorrect, IPv4 is disabled or your firewall is blocking the request.
When a connection has been established and we still do not see any data appear, we can check thedevice monitor to check whether data is being sent to Hydromagic by the server: Open the preferenceswindow by selecting "Preferences..." from the "Options" menu. In the window that appears, select the"Devices" tab. Next select the "Knudsen SonarSuite echo sounder plugin for Hydromagic" and click the"Monitor..." button. The communication monitor appears, and should display packets coming in asshown below:

Eye4Software Hydromagic 9.4490
© 2009-2021 Eye4Software B.V.
When no data is coming in, and Hydromagic is connected, please double-check that the sounder hasbeen started from the "EchoControlClient" by clicking the "Global TX" button. If the sounder is workingcorrectly, the following should be displayed in the device monitor:
Incoming (TCP) data packets should be appear in the device monitor.
The window shows the number of incoming bytes, whether it is able to decode the data (MsgType andDataType) and which record type is used (record "D0" in this example). A DataType of 14 means thatreturn envelope and depth information is received from the server. The software currently supports recordtypes "D0" and "E0". When you encounter a different type, and no data is shown, please use the "Copyto Clipboard..." button to send the data to our support department for further assistance.
To check the incoming echogram data, select the 'Echogram (Hi)' or 'Echogram (Lo)' option from theView menu. The echogram should look like this:

Plugins 491
© 2009-2021 Eye4Software B.V.
M onitor incoming echo return envelope data
Unloading the plugin (optional)
To unload the plugin, open the preferences window by selecting "Preferences..." from the "Options"menu. In the window that appears, select the "Devices" tab. Next select the "Knudsen SonarSuite echosounder plugin" and click the "Remove..." button.

Eye4Software Hydromagic 9.4492
© 2009-2021 Eye4Software B.V.
Click the "Remove..." button to unload the plugin.
10.17 Kongsberg EA4xx Series Plugin
The Kongsberg EA4xx Series Plugin allows you to connect either the Kongsberg EA400 or EA440echosounder.The plugin listens on the UDP ports used by the sounder and converts the received data to depths andwater column data.
The following devices can be used with this plugin:
· Kongsberg EA400;· Kongsberg EA440;
Loading the Kongsberg EA4xx Series Plugin
To load this plugin, open the preferences window by selecting "Preferences..." from the "Options" menu.In the window that appears, select the "Devices" tab. Next click the "Add..." button.

Plugins 493
© 2009-2021 Eye4Software B.V.
A list of available plugins will be displayed. In this list, select the "Hydromagic Simulator Plugin" andclick "OK" to load and display the simulator.
Configuring the plugin
When the plugin is selected and loaded, the configuration dialog for the plugin will be shown. In almostall cases you can use the default settings.

Eye4Software Hydromagic 9.4494
© 2009-2021 Eye4Software B.V.
Sometimes UDP port 20000 is already in use. In these cases use a different port number (you have tochange this in the EA4xx software as well!).
Use the channel assignment to associated a transducer channel with either the Hi or Lo frequencydepth. How to set this up depends on the echosounder configuration. In most cases the first channel is connected to the high frequency transducer and the second channel tothe low frequency transducer.
Configuring the EA440 software (I/O)
In order to receive data from the sounder, the EA440 software has to be started and configured.Double click the "EA440" icon on your start menu, desktop or taskbar to start the software.
First we have to set the sounder to 'Inactive'. It is not possible to change output settings when thesounder is in 'Demo' or 'Active' mode. To do so, select the leftmost tab in the pane on the right side of the screen, and change the Operationsetting.
When done, select the tab in the middle (with the tools on it), and click the 'Installation' button.In the dialog that appears, select the 'I/O Setup' item on the left. The I/O Setup tab now appears. Click the "Add..." button directly below the list of ports in the "Lan Ports" section.

Plugins 495
© 2009-2021 Eye4Software B.V.
A new entry is created called 'LAN Port 2', with IP Address 127.0.0.1 and Port 20000.When Hydromagic is not running on the same computer, select the new entry, click "Setup" and changethe IP address to the one used by the computer running Hydromagic. When completed, click "Apply" and "OK" to save the changes.
Configuring the EA440 software (Echogram)
Next, return to the first tab, and change the Operation setting back to 'Normal' or 'Replay' when thesounder isn't connected. After doing so, the 'Output' button will be enabled. Click the 'Output' button to configure the outputformat.

Eye4Software Hydromagic 9.4496
© 2009-2021 Eye4Software B.V.
We will no configure the echogram output. Select the 'Processed Data Output' option in the screen thatappears. The only item in the 'Installed Outputs' list should be 'New' which can be used to add a new output. Select the 'New' item, and proceed to the section on the right. From the drop down box at the top of thissection, select the 'Echogram' option.
In the 'Output Destination' section, check the 'Port' radio and select the I/O port we created earlier, whichis most likely called 'LAN Port 2'. Select the channels you want to output. Please note that Hydromagic can only process one low frequency and one high frequency channel.When there are only one or two transducers listed, just check all.
For the TVG, select the '20 Log TVG' option. The other options just won't work. In the Range setting,click the buttons to set the range for the Surface and Bottom. Hydromagic will only use the surface samples (when bottom is not used, the surface samples will coverthe whole water column).
In the value section, set the number of samples for surface to 500 and the bottom sample count to 0. When finished, do not forget to click the 'Add' button to store this output profile. When starting thesounder or a simulation, the data should now be displayed in Hydromagic.

Plugins 497
© 2009-2021 Eye4Software B.V.
Configuring the EA440 software (Digitized Depth)
Next, return to the first tab, and change the Operation setting back to 'Normal' or 'Replay' when thesounder isn't connected. After doing so, the 'Output' button will be enabled. Click the 'Output' button to configure the outputformat.

Eye4Software Hydromagic 9.4498
© 2009-2021 Eye4Software B.V.
We will no configure the digitized depth output. Select the 'Depth Output' option in the screen thatappears. The only item in the 'Installed Outputs' list should be 'New' which can be used to add a new output. Select the 'New' item, and proceed to the section on the right. From the drop down box at the top of thissection, select the 'SimradBinary' option.
In the 'Output Destination' section, check the 'Port' radio and select the I/O port we created earlier, whichis most likely called 'LAN Port 2'. Select the channels you want to output. Please note that Hydromagic can only process one lowfrequency and one high frequency channel. When there are only one or two transducers listed, just check all.
Testing the plugin
When the EA440 software has been configured you should see depth data displayed in the data view. Ifnot, you can perform the following steps:
Open the preferences window by selecting "Preferences..." from the "Options" menu.
In the window that appears, select the "Devices" tab. Next select the "Kongsberg EA4xx Series EthernetPlugin for Hydromagic" and click the "Monitor..." button. The communication monitor appears, and should display two different packets coming in as shownbelow:

Plugins 499
© 2009-2021 Eye4Software B.V.
When the packet starting with 'Q1' or 'Q2' is received, it means that the echogram data has been setupcorrectly. When the packet starting with 'D1' or 'D2' is received, it means that the digitized depth data has beensetup correctly.
When neither of those two appear, most likely there is a problem with the configuration. In some casesyou have to select another UDP port for LAN Port 2 (for instance 20002).
To check the incoming echogram data, select the 'Echogram (Hi)' or 'Echogram (Lo)' option from theView menu. The echogram should look like this:
Unloading the plugin
To unload the plugin, open the preferences window by selecting "Preferences..." from the "Options"menu.In the window that appears, select the "Devices" tab. Next select the "Kongsberg EA4xx Series EthernetPlugin for Hydromagic" and click the "Remove..." button.

Eye4Software Hydromagic 9.4500
© 2009-2021 Eye4Software B.V.
10.18 MAVLink communication plugin
MAVLink is a communications used to communicate with a drone by using ground control software(GCS). The MAVLink protocol contains commands to instruct an AutoPilot to fly to a specific location,take-off or land. Also sensor values like motion, elevation, speed and GPS position are transferred usingthe MAVLink protocol. The Hydromagic MAVLink protocol plugin allows you to feed this sensorinformation directly into Hydromagic as raw data.
Loading the MAVLink plugin
To load this plugin, open the preferences window by selecting "Preferences..." from the "Options" menu.In the window that appears, select the "Devices" tab. Next click the "Add..." button.

Plugins 501
© 2009-2021 Eye4Software B.V.
The devices tab in the "Preferences" dialog.
A list of available plugins will be displayed. In this list, select the "MAVLink AutoPilot for Hydromagic"plugin and click "OK" to load and display the configuration dialog.
Select the "M AVLink AutoPilot for Hydromagic" plugin from the list of available plugins.

Eye4Software Hydromagic 9.4502
© 2009-2021 Eye4Software B.V.
Configuring the MAVLink plugin
After loading the plugin, you have to select the connection parameters first. Please note that a MAVLinkcan be connected using a serial connection or a TCP/IP connection (for instance WiFi). First select theconnection type from the drop down list and configure other connection parameters.
Configure communication settings for the M AVLinkconnection in the plugin window..
To define which MAVLink messages are decoded and handled by the Hydromagic software, click the"Select Messages..." button. Your version of the plugin might have more messages to choose from thendisplayed in the screenshot below. Please refer to the "Supported Messages" paragraph for more detailson these message types.
Select which M AVLink protocol messages are handled by the plugin

Plugins 503
© 2009-2021 Eye4Software B.V.
Unloading the MAVLink plugin
To unload the MAVLink plugin, open the preferences window by selecting "Preferences..." from the"Options" menu. In the window that appears, select the "Devices" tab. Next select the "MAVLinkAutoPilot Plugin for Hydromagic" and click the "Remove..." button.
Select the M AVLink plugin and click the"Remove..." button to unload the plugin.
Supported Messages
#24 - MAVLINK_MSG_ID_GPS_RAW_INT
The global position, as returned by the Global Positioning System (GPS). This is NOT the global positionestimate of the system, but rather a RAW sensor value. This packet has a length of 30 bytes andcontains WGS84 position, EGM96 altitude, HDOP/VDOP, fix type, satellite count and velocity andspeed over ground. When both message #24 and #33 are available, prefer to use this message only.
#30 - MAVLINK_MSG_ID_ATTITUDE

Eye4Software Hydromagic 9.4504
© 2009-2021 Eye4Software B.V.
The attitude message contains attitude information like pitch, roll and yaw. This is calculated from anIMU or motion sensor on board the drone or USV. The range for roll and pitch is +-90 degrees. When thismessage is not supported, message #31 could be used as alternative.
#31 - MAVLINK_MSG_ID_ATTITUDE_QUATERNION
The attitude message contains pitch and roll information encoded as a quaternion (x,y,z,w values).Hydromagic converts this to a pitch and roll value. The range for roll and pitch is +-90 degrees. When thismessage is not supported, message #30 could be used as alternative.
#33 - MAVLINK_MSG_ID_GLOBAL_POSITION_INT
Just like message #24 this message contains position information. However the difference with message#24 is, that this message only contains a geographic position and speed vectors in x,y and z direction.When #24 is present, disable message number 33.
10.19 Odom Echotrac Plugin
The Odom Echotrac plugin can be used to retrieve (dual frequency) depth data from your Odom Echotracecho sounder.Since the Odom Echotrac serial output protocol has been adapted by various echo soundermanufacturers,you can use this plugin for any other echo sounder supporting the Odom DBT or SBT protocol.
The Odom Echotrac plugin supports the following Odom echo sounders.Not listed are echo sounder from other brands which utilize the Odom DBT or SBT protocol:
· Odom Echotrac MK3;· Odom Echotrac CV100;· Odom Echotrac CV200;· Odom Echotrac CV300;· Odom Echotrac CVM;

Plugins 505
© 2009-2021 Eye4Software B.V.
· Odom Echotrac E20;· Odom Hydrotrac II;
This plugin can only be used when the sounder is connected to the computer via a serial (RS232)connection.
When your Odom Echotrac echo sounder connects to your computer via an Ethernet cable,you should use the "Odom Ethernet plugin" instead.
Odom Echotrac DBT protocol
DBT stands for "Dual Bottom Tracking" and can be used to transfer both single and dual frequency echosounder data to the computer over a serial (RS232) connection. The string contains an error and a fix mark flag, a frequency indicator and the depth value.
ET H 00016
ET H 00016
ET H 00017
ET H 00016
Example Echotrac DBT data in single frequency mode (freq = high, units = feet)
et B 00572 00576
et B 00577 00641
et B 00588 00645
et B 00580 00591
et B 00577 00592
et B 00574 00605
Example Echotrac DBT data in dual frequency mode (freq = both, units = centimeters)
Odom Echotrac SBT protocol
DBS stands for "Single Bottom Tracking" and can be used to transfer both single frequency echo sounder data to the computer over a serial (RS232) connection.The string contains an error and a fix mark flag, a frequency indicator and the depth value.
UPC,F, , 10.1,20,10,1.23,87, 10.3,18,13,1.32,82, 56.8
UPC,F, , 10.1,20,10,1.23,87, 10.5,18,13,1.31,83, 57.4
UPC,F, , 10.0,20,10,1.23,87, 10.4,18,13,1.32,82, 55.4
UPC,F, , 10.1,20,10,1.24,87, 10.5,18,13,1.31,83, 56.3
UPC,F, , 10.1,20,10,1.24,87, 10.3,18,12,1.30,83, 57.0
UPC,F, , 10.0,20,10,1.24,87, 10.3,18,13,1.32,82, 55.4
Example Echotrac SBT data (freq = single, units = centimeters)
Loading the Odom Echotrac plugin
To load this plugin, open the preferences window by selecting "Preferences..." from the "Options" menu.In the window that appears, select the "Devices" tab. Next click the "Add..." button.

Eye4Software Hydromagic 9.4506
© 2009-2021 Eye4Software B.V.
A list of available plugins will be displayed. In this list, select the "Odom Echotrac SBT/DBT plugin forHydromagic" pluginand click "OK" to load and display the plugins configuration dialog.

Plugins 507
© 2009-2021 Eye4Software B.V.
Configuring the Odom Echotrac plugin
When the plugin loads, a dialog with some required settings will appear first.In order to get the plugin to work correctly, you have to configure the protocol and communicationsettings.

Eye4Software Hydromagic 9.4508
© 2009-2021 Eye4Software B.V.
Communication settings
Since the echo sounder is most likely to be connected via a serial port, you have to select the serial portand its operating speed first.When using an USB-to-Serial adapter cable, a virtual serial port will be created in Windows and you haveto select this serial port.
The drop down box will be populated with all serial ports detected on the system.
To get more information on the ports available, please refer to the device manager.The device manager can be found via the Control Panel in Windows.

Plugins 509
© 2009-2021 Eye4Software B.V.
Selecting the protocol
Select the correct protocol depends on your sounder's configurations. In most cases the Echotrac DBTprotocol will be used.You can determine the protocol used by looking at the incoming data in the device monitor and compareit with the examples above.
Starting the plugin
When the required settings have been configured, click the "OK" button to save the settings and start theplugin.After a few seconds, there should be a green icon in front of the plugin, indicating data is coming insuccessfully.
Testing the sounder
When data is received, you should be able to see the depth and position information in the data window.To have a look at the echogram data, select "Echogram(Hi)" or "Echogram(Lo") from the View menu.
Unloading the Odom Echotrac plugin
To unload the Odom Echotrac plugin, open the preferences window by selecting "Preferences..." fromthe "Options" menu. In the window that appears,select the "Devices" tab. Next right-click the "Odom Echotrac SBT/DBT plugin for Hydromagic" pluginand select the "Remove Device..." option from the popup menu.

Eye4Software Hydromagic 9.4510
© 2009-2021 Eye4Software B.V.
10.20 Odom Ethernet Plugin
The Odom Ethernet plugin is a plugin with graphical user interface designed to connect your Odom echosounder using an Ethernet cable.It will transfer position, depth, motion and full water column echogram data to the Hydromagicapplication.

Plugins 511
© 2009-2021 Eye4Software B.V.
The Odom Ethernet plugin supports the following Odom echo sounders:
· Odom Echotrac MK3;· Odom Echotrac CV100;· Odom Echotrac CV200;· Odom Echotrac CV300;· Odom Echotrac CVM;· Odom Echotrac E20;· Odom Hydrotrac II;
When your echo sounder connects to your computer via a serial (RS232) cable, you should use the"Odom Echotrac SBT/DBT plugin" instead.This plugin can only be used when the sounder is connected to the computer via Ethernet.
Loading the Odom Ethernet plugin
To load this plugin, open the preferences window by selecting "Preferences..." from the "Options" menu.In the window that appears, select the "Devices" tab. Next click the "Add..." button.

Eye4Software Hydromagic 9.4512
© 2009-2021 Eye4Software B.V.
A list of available plugins will be displayed. In this list, select the "Odom MK3 Ethernet plugin forHydromagic"and click "OK" to load and display the plugins user interface.

Plugins 513
© 2009-2021 Eye4Software B.V.
Configuring the Odom Ethernet plugin
When the plugin loads, a dialog with some required settings will appear first.You have to set network (UDP) ports to use for the transfer of navigation and acoustic data packets.
In most cases, you can use the defaults. With factory settings, UDP port 1600 is used to output datalike depth, position and motion.UDP port 1601 is used to control the device. In Hydromagic the control port is only used to sendannotation data.
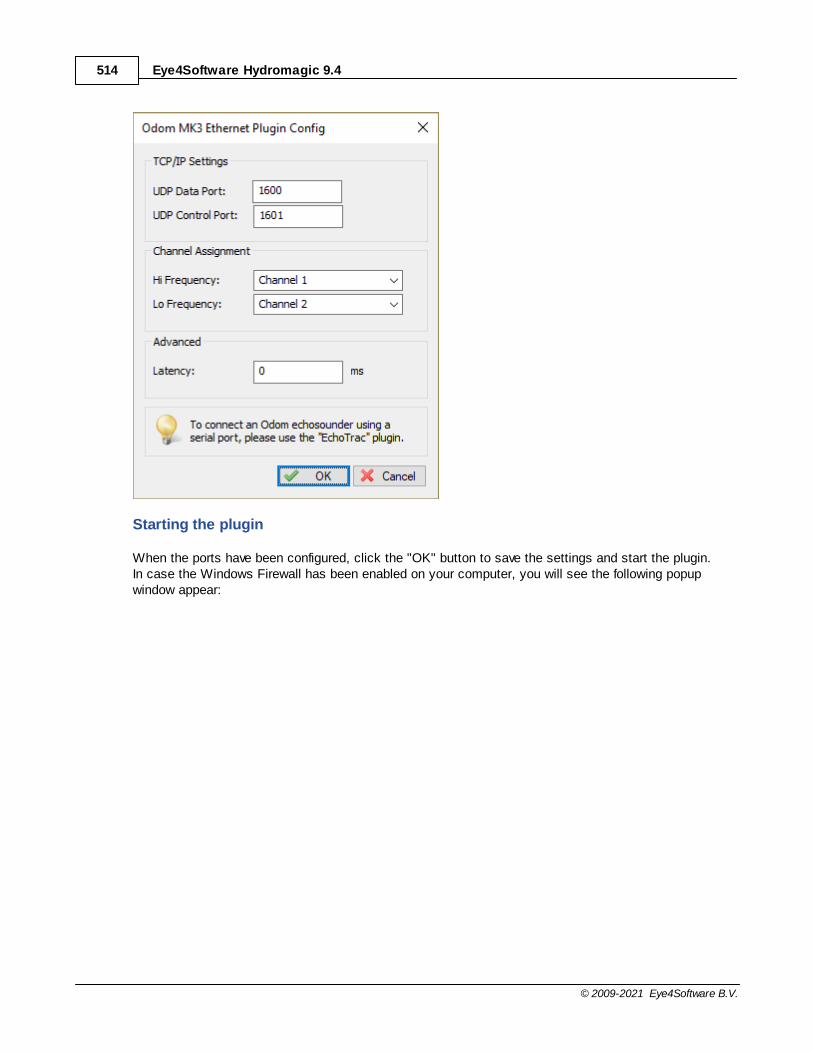
Eye4Software Hydromagic 9.4514
© 2009-2021 Eye4Software B.V.
Starting the plugin
When the ports have been configured, click the "OK" button to save the settings and start the plugin.In case the Windows Firewall has been enabled on your computer, you will see the following popupwindow appear:

Plugins 515
© 2009-2021 Eye4Software B.V.
Make sure you click the "Allow Access" button to allow Hydromagic to send and receive data on theconfigured UDP ports.When you click the "Cancel" button, access to the sounder will be blocked and you won't receive anydata from the sounder !
When the laptop is not connected to the Internet and is only used to communicate with the echosounder,you can decide to shut down the Windows Firewall entirely. It is also recommended to try this in case ofconnection issues.
After allowing the connection, there should be a green icon in front of the plugin, indicating data iscoming in successfully.
Testing the sounder
When data is received, you should be able to see the depth and position information in the data window.To have a look at the echogram data, select "Echogram(Hi)" or "Echogram(Lo") from the View menu.
Eye4Software Hydromagic 9.4516
© 2009-2021 Eye4Software B.V.
10.21 Unabara Hydro-2F Plugin
The Unabara Hydro-2F plugin is a which reads out dual frequency and bottom parameters and sends thisinformation as raw data to Hydromagic. The plugin is able to read and store the following data from theecho sounder:
· Bottom depth (high frequency;· Bottom depth (low frequency);· Bottom loss (high frequency);· Bottom loss (low frequency);· Bottom reflection (high frequency);· Bottom reflection (low frequency);· Bottom density (high frequency);· Bottom density (low frequency);· Bottom porosity (high frequency);· Bottom porosity (low frequency);
All the above parameters can be stored and processed in the Hydromagic software.
Loading the Unabara Hydro-2F plugin
To load this plugin, open the preferences window by selecting "Preferences..." from the "Options" menu.In the window that appears, select the "Devices" tab. Next click the "Add..." button.
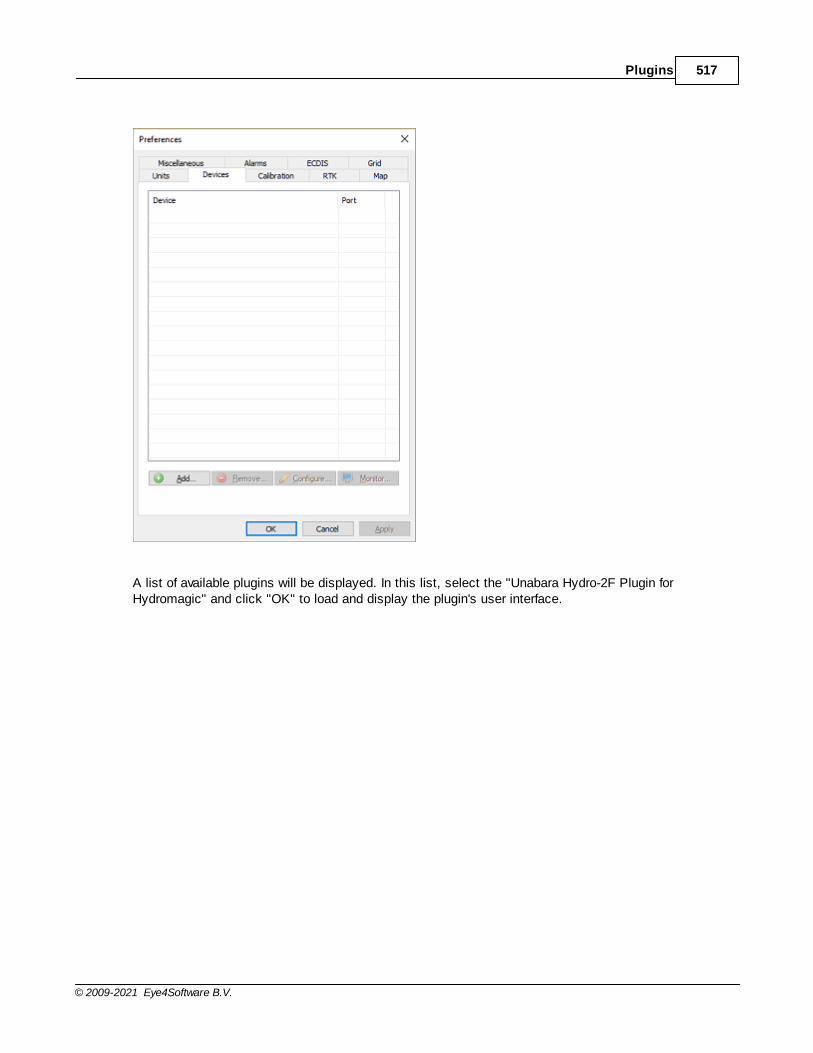
Plugins 517
© 2009-2021 Eye4Software B.V.
A list of available plugins will be displayed. In this list, select the "Unabara Hydro-2F Plugin forHydromagic" and click "OK" to load and display the plugin's user interface.

Eye4Software Hydromagic 9.4518
© 2009-2021 Eye4Software B.V.
Configuring the Unabara Hydro-2F plugin
When the plugin loads, a dialog with some required settings will appear first. You have to set thecommunications options and the latency to include in the time calculations (optional).

Plugins 519
© 2009-2021 Eye4Software B.V.
Communications settings
When using the default configuration, the echo sounder connects with the computer using an USB-to-Serial adapter cable. When plugged in, a virtual serial port will be created in Windows and you have toselect this serial port.
Also make sure you select the correct serial port speed for the device.
Selecting the correct output format
In order to retrieve the bottom information from the Hydro-2F, make sure the proprietary Hydro-2F dataformat has been selected. This format can be selected in the Hydro-2F application which is shipped withthe sounder.
When configured correctly, the data send over the serial port should look like this:(Tip: Use the build-in communications monitor in Hydromagic to check!)
UPC,F, , 10.1,20,10,1.23,87, 10.3,18,13,1.32,82, 56.8
UPC,F, , 10.1,20,10,1.23,87, 10.5,18,13,1.31,83, 57.4
UPC,F, , 10.0,20,10,1.23,87, 10.4,18,13,1.32,82, 55.4
UPC,F, , 10.1,20,10,1.24,87, 10.5,18,13,1.31,83, 56.3
UPC,F, , 10.1,20,10,1.24,87, 10.3,18,12,1.30,83, 57.0
UPC,F, , 10.0,20,10,1.24,87, 10.3,18,13,1.32,82, 55.4
Example of Unabara Hydro-2F serial data output.
In case you want to operate the sounder with either the DESO20 or Odom Echotrac output, you need touse either the "STN Atlas DESO 20/22/25" or "Odom Echotrac" plugin shipped with Hydromagic.
Testing the sounder
When the sounder has been connected and configured, click "OK" to store the settings and start theplugin. There should be a green icon in front of the plugin name when data is coming in successfully.
When data is received, you should be able to see the depth and motion sensor information in the datawindow. To have a look at the echogram data, select "Echogram(Sub)" from the view menu.
Displaying bottom parameters
Besides dual frequency depth data, this echo sounder is also capable of collecting bottom information.Hydromagic contains a set of features to process this data.
To check whether this bottom information is coming in, create a new project and record some data withthis echo sounder. How to setup a project and start recording data is discussed in this manual page.
After recording incoming data for a couple of seconds, bottom information already should have beenstored in the active raw data file. The currently active raw data file name is displayed in the lower-rightcorner of the software.
To view the data, locate the active raw data file name in the "Project Explorer", and right click on it toopen the context menu.

Eye4Software Hydromagic 9.4520
© 2009-2021 Eye4Software B.V.
Right click a raw data file to analyze its data.
In the context menu that appears, select the "Analyze Data..." option. Click the "Next Data" button onceto advance to the next page of data where the bottom information is displayed:
Example of bottom information collected with the Unabara Hydro-2F.

Index 521
© 2009-2021 Eye4Software B.V.
Index- A -Activation 10
Area Calculations 86
Area Measurements 86
- B -BMP Maps 154
Boundaries 183
Buttons 71
- C -CEE 424
CEE HydroSystems 424
CEESCOPE 424
Channel Design 193
Clipping 183
CMR 475
Comments 179
Contours 322
Coordinate Calculator 88
Coordinate Conversion 88
Countries 61
Cross Sections 185
- D -Data Display 78
Data Window 78
Depth Contours 322
Downloading Maps 156
- E -EchoLogger 430
EchoLogger D24 430
EchoLogger EU400 430
Echosounder Offset 20
Echosounders (supported) 6
Ellipsoids 48
Export BMP 350
Export georeferenced raster 350
Export GIF 350
Export JPG 350
Export PNG 350
Export TIF 350
Export to CAD 345
Export to DXF 345
Export to Google Earth 339
Export to KML 339
Export to KMZ 339
- G -Generate Depth Contours 322
Geoid File Formats 412
Geoid File Import 412
Geoid Model 412
Geoid Model (importing) 412
GeoTiff Maps 154
GIF Maps 154
Google Earth 156
Google Maps 156
GPS (NMEA0183) 13
GPS (supported) 6
- H -Hardware 6
Helmsman Display 83
Hydromagic Simulator Plugin 479
- I -Installation 9
Introduction 6
- J -JPEG Maps 154
- K -Kongsberg EA400 492
Kongsberg EA440 492

Eye4Software Hydromagic 9.4522
© 2009-2021 Eye4Software B.V.
- L -Licensing 409
Licensing (dongle) 409
Licensing (upgrading) 409
LR Indicator Display 83
- M -Map Datums 51
Map Grids 55
Map overlays 179
Matrix 300
- N -Navigation Window 78
NMEA0183 Playback 471
NMEA0183 Simulation 471
NTRIP 475
- O -Odom DBT 504
Odom EchoTrac 504
Odom Echotrac CV100; 510
Odom Echotrac CV200; 510
Odom Echotrac CV300; 510
Odom Echotrac CVM; 510
Odom Echotrac E20; 510
Odom Echotrac MK3; 510
Odom HydroTrac 504
Odom Hydrotrac II; 510
Odom SBT 504
Openstreetmaps 156
- P -PNG Maps 154
Profiles 193
Purchasing 10
- Q -Query Depth 96
Query Feature 96
Query Object 96
- R -Raster (export) 350
Raster Maps 154
Raw data files 238
RTCM 475
- S -S57 147
S63 149
Satellite Images 156
Screenshot 350
Simulator 479
Simulator Plugin 479
Sounding (create) 210
Sounding (export) 292
Sounding (import) 287
Sounding (record) 210
Sounding Wizard 238
Street Maps 156
Supported devices 6
- T -Tide 464
Tide (manual) 464
Tide correction 240
Tide observations 240
Toolbar 71
Trial Period 10
- U -Unabara 516
Unabara Hydro-2F 516
- V -Volume Calculation (comparing data) 328
Volume Calculation (matrix) 328
Volume Calculation (stages) 331
Volume Calculation (using cross sections) 335

Index 523
© 2009-2021 Eye4Software B.V.
- W -Waypoints 174
World File 350
Copyright © 2022 FDOKUMEN