Sardinian Center for Coastal Monitoring and Assessment in "Coastal erosion monitoring. A network of...
247
Coastal erosion monitoring A network of regional observatories Results from ResMar Project Edited by Luigi E. Cipriani
Transcript of Sardinian Center for Coastal Monitoring and Assessment in "Coastal erosion monitoring. A network of...

La Cooperazione al cuore del Mediterraneo
La Coopération au coeur de la Méditerranée
www.res-mar.eu
Libro.indb 2 10/05/2013 11.30.28
Coastal erosion monitoring A network of regional observatories
Results from ResMar Project
Edited by Luigi E. Cipriani
Libro.indb 3 10/05/2013 11.30.29
Coastal erosion monitoring A network of regional observatories
Results from ResMar Project
Edited by Luigi E. Cipriani
ResM
ar P
roje
ctCo
asta
l ero
sion
mon
itor
ing
- A
net
wor
k of
reg
iona
l obs
erva
tori
es
Libro.indb 3 10/05/2013 11.30.29

La Cooperazione al cuore del Mediterraneo
La Coopération au coeur de la Méditerranée
MarittiMo - it Fr - MaritiMetoscana liguria sardegna corse
Libro.indb 4 10/05/2013 11.30.31

Coastal erosion monitoring A network of regional observatories
Results from ResMar Project“Réseau pour l’environnement dans l’espace maritime“
Edited by Luigi E. Cipriani
Direzione Generale Politiche Ambientali, Energia e Cambiamenti Climatici Settore Protezione e Valorizzazione della Fascia Costiera e dell’Ambiente Marino
Libro.indb 1 17/05/2013 14.40.38

Published in May 2013 by Nuova Grafica Fiorentina, via Traversari 76, 50126 Florence, ItalyProject management: Luigi E. Cipriani, Andrea Boggiano and Rosanna Furnò - Regione ToscanaGraphic design, electronic page layout and prepress: Chiara LoiEnglish draft review: Lilian Wetzel and Vittoria Zichella
All rights reserved. No part of this book may be reprinted or reproduced or utilised in any form or by any electronic, mechanical, or other means, now known or hereafter invented, including photocopying and recording, or in any information storage or retrieval system, without the permission in writing from the editor and chapter authors.
Unless otherwise accredited, all illustrations have been provided by the chapter authors.
The print of this volume has been sponsored by:
www.maritimeit-fr.net
www.res-mar.eu
MarittiMo - it Fr - MaritiMetoscana liguria sardegna corse
Index.indd 2 17/05/2013 15.04.55

Dedicated to the memory of
Sergio Silenzi, a great coastal scientist, a genuine friend.
“When all is said and done, the journey is the reward”
Randy Komisar, The Monk and the Riddle
“Irrealtà di cose vedute;Sguardi non miei.
Nella solitudine del cielosento l’azzurro:
deserto di ombre, che piango.Talvolta un’arpa risuona,
ha qualcosa del mare.Ascolto, non io.
La mia vita è un sogno.”
Marco M. Bellandi, La mia vita è un sogno
Libro.indb 3 17/05/2013 14.40.40

Libro.indb 4 17/05/2013 14.40.40

5
ResMar Coastal erosion monitoring - A network of regional observatories
Contents
Coastal erosion monitoringA network of regional observatories
Foreword pg. 7Luigi E. Cipriani
The role of coastal evolution monitoring pg. 11Enzo Pranzini and Lorenzo Rossi
The Corsican coastal monitoring network pg. 57Yann Balouin, Alexis Stépanian, Rémi Belon, Patrick Bezert, Serge Calendini and Gregory Bellini
The Ligurian webcam network and database for coastal management pg. 79Chiara F. Schiaffino, Massimo Brignone, Nicola Corradi, Andrea Cevasco, M. Alessandra Iannotta, Carlo Cavallo and Marco Ferrari
The activity of “Osservatorio Coste e Ambiente Naturale Sottomarino” (OCEANS) and the implementation of a monitoring network and study methodology for sedimentological and morphodynamic processes of Mediterranean microtidal wave-dominated beaches (Sardinia) pg. 95Sandro DeMuro, Claudio Kalb, Nicola Pusceddu and Angelo Ibba
Sardinian Center for Coastal Monitoring and Assessment pg. 111Alessio Satta, Maurizio Costa and Stefano Renoldi
A coastal WebGIS for data sharing and distribution pg. 125Giovanni Vitale, Enrica Mori, Sandro DeMuro and Claudio Kalb
Coastal erosion in Tuscany: short vs. medium term evolution pg. 135Luigi E. Cipriani, Enzo Pranzini and Giovanni Vitale
Coastal monitoring through video systems: best practices and archi-tectural design of a new video monitoring network in Marina di Massa (Tuscany) pg. 157Renata Archetti, Matteo Vacchi, Laura Bertoncini, Roberto Conserva, Ste-fano Michela, Daniele Sigismondi and Luca Parlagreco
Biocenosis monitoring: the ecological role of defence structures along the Tuscany coast pg. 169Irene Ortolani, Stefano Cannicci and Claudia Becchi
Libro.indb 5 17/05/2013 14.40.41

6
Coastal erosion monitoring - A network of regional observatories
The shorelines of the Netherlands: Monitoring from the North Sea coast to the lakeshore of the IJsselmeer pg. 185Jelmer Cleveringa and Rob Steijn
The Atlantic Coast of New York Monitoring Program along New York’s Ocean Shoreline, USA pg. 191Henry Bokuniewicz
Coastal erosion monitoring in Colombia: overview and study cases on Caribbean and Pacific coasts pg. 199Camilo Botero, Giorgio Anfuso, Nelson Rangel-Buitrago and Ivan D. Correa
Community Participation in Coastal Monitoring: A Case Study from Western Australia pg. 215Chiara Danese and Ashley Robb
Lazio Region experience from Beachmed to Facecoast: “Working hypoth-esis for the feasibility of a European Network of Coastal Observatories” pg. 229Silvia Bellacicco, Alessandro Bratti and Paolo Lupino
Libro.indb 6 17/05/2013 14.40.41

7
ResMar Coastal erosion monitoring - A network of regional observatories
Foreword
ResMar “Coastal erosion monitoring - A network of regional observatories” is the natural sequel to previous results on Beach erosion monitoring published in 2008 within Project BEACHMED-e - Strategic management of beach protection measures for the sustainable de-velopment of Mediterranean coastal areas (INTERREG IIIC Regional Framework Operation). Operation BEACHMED-e (October 2005 - June 2008) has been signalled by the European Commission DG Regional Policy as an “example of project covering relevant aspects of risk reduction and adaptation to climate change” (July 2007), within the initiative Regions for Economic Change (Theme 4.1 Coastal zones management).
ResMar “Network for Environmental Protection in Maritime Space” (June 2010 – July 2013) is a Strategic Project, funded by the “Italy-France Maritime” cross-border co-operation Operational Programme. The project has been designed to improve monitoring systems, risk prevention, management of environmental issues and emergencies, and mitigation of pollution in the cross-border space of co-operation between France and Italy. It is com-posed of seven sub-projects and system actions designed to generate the best cross-border strategies for environmental protection in relation to water and soil.
Coastal erosion and the state of coastlines are treated primarily in system action A and sub-project B, which include activities such as:
- The creation by cross-border regions Corsica, Liguria, Tuscany and Sardinia of a coastal erosion monitoring network with a strategic view;
- The feasibility of establishing a cross-border centre for the study of coastal morpho-dynamics.
The publication of this book is contemporary with the official signing ceremony of the latest version of the Bologna Charter (BC 2012) European Regions Charter for the promo-tion of a common framework for strategic actions aimed at the protection and sustainable development of the Mediterranean coastal areas. Drawing from the experience acquired in the framework of the BEACHMED projects and European partnership, one of the main objectives of the Charter consists in establishing a network of existing coastal Observato-ries - EURIOMCODE proposal initiative (European Interregional Observatory for Mediter-ranean Coastal Defence). Such observatories will have the purpose of identifying common standards in coastal survey activities harmonised with the INSPIRE Directive; analysing coastal morphodynamics in the Mediterranean; sharing monitoring services and finding a common structure consistent with the principles of cost-effectiveness and efficiency, to suit the participant Public Administration bodies. In addition, and if needed at local and regional level, the initiative shall promote the establishment of specific structures for coastal monitoring, management of coastal zone risks and erosion phenomena, imple-
Libro.indb 7 17/05/2013 14.40.41

8
Coastal erosion monitoring - A network of regional observatories
mentation of defence interventions and management of sediment stocks in coastal areas.
With further relevance to the monitoring and observation mechanisms and networks, Article 16 of The Protocol on Integrated Coastal Zone Management in the Mediterranean (effective 24 March, 2011) states that “the Parties shall use and strengthen existing ap-propriate mechanisms for monitoring and observation, or create new ones if necessary. They shall also prepare and regularly update national inventories of coastal zones which should cover, to the extent possible, information on resources and activities, as well as on institutions, legislation and planning that may influence coastal zones”.
One of the key aims of this book is to underline the importance of monitoring and net-works aimed at a proactive and adaptive defence strategy for a resilient coastal zone. It urges all of us to understand and work in line with physical processes in order not to do today anything that could hinder future strategies and solutions.
For this reason, and in alignment with the EUROSION and OURCOAST initiatives, we are planning the following steps:
- Joining The European Dune Network - Sharing experience across borders, which aims at increasing knowledge and understanding of coastal dunes and promoting the sustainable use and management of coastal dunes in Europe.
- Implementing project-clustering initiatives like FACECOAST - Face the challenge of climate change in the Mediterranean coastal zones, launched within the Capitalisation process started by the European MED Programme, in order to strengthen coopera-tion among Regions, coastal administration bodies, universities and other stakehold-ers, thus maximising results and favouring potential synergies.
The partners of several European projects and initiative, including ResMar, gathered on 26 September 2012 at a joint meeting organised by the PAP RAC in Split, back-to-back with the Mediterranean 2012 Coast Day celebration. The objective of the gathering was to share information and achieve co-ordination of activities and exchange of project outputs so as to create better synergies and alignment among the major ongoing projects for the implementation of the Mediterranean ICZM Protocol. A joint declaration was agreed as follows: “Partners of the projects shall strive to upgrade the level of the existing co-oper-ation and explore fields in which co-operation can be additionally established to facilitate the achievement of the common objectives of sustainable development of coastal zones. In addition, we shall work to enhance the existing networks and search for new possibili-ties to foster co-operation”.
I sincerely hope that this book may present a “good practice” enabling us to share knowl-edge with the scientific and civil communities and increase our awareness of the actual state of the coastal zone for a better and wiser use of the territory in the future. It has been a great opportunity to edit this book and share experiences with international coast-al experts and new partners in the Mediterranean, in particular with cross-border Corsica, in light of the future co-operation opportunities in the field of coastal morphodynamics monitoring arising from the new project RESMARINE “Réseau transfrontalier pour la Stra-
Libro.indb 8 17/05/2013 14.40.41

9
ResMar Coastal erosion monitoring - A network of regional observatories
tégie Marine” within the “Italy-France Maritime” cross-border co-operation Operational Programme.
In line with the results presented in this book, future efforts in the implementation of the post-2013 Multiannual Financial Framework should focus chiefly on the promotion of a network of observatories across the Mediterranean and support the creation and maintenance of monitoring and adaptive strategies in coastal areas with a macro-regional approach.
Luigi E. Cipriani
Region of TuscanyDirectorate-General for Environmental Policies , Energy and Climate Changes
Section for the Protection and value enhancement of coastal and marine environments
Libro.indb 9 17/05/2013 14.40.41

Libro.indb 10 17/05/2013 14.40.41

11
ResMar Coastal erosion monitoring - A network of regional observatories
The role of coastal evolution monitoring
Enzo Pranzini* and Lorenzo Rossi
Department of Earth Sciences, University of Florence Borgo Albizi 28, 50122 Florence, Italy
Email: [email protected]
IntroductionThe coastal zone has long been attractive to menkind: this area concentrates better economic, social and recreational opportunities than does the hinterland (Goldberg, 1994), in spite of presenting higher risk of subsidence, tsunami, sea storms, flooding and coastal erosion (Nicholls, 2002). This pattern is a reality also in Italy, as shown by the percentage of coastal soil currently in use and the growing occupation of coastal areas in the past years.
Migration from the hinterland towards the coast and the development of coastal protec-tion structures (both processes being cause and effect of one another) started in Italy after
Figure 1 - Percentage of urbanised soil within 10 km from shoreline; representation at Provincia level (2006). Data processing by ISPRA (data from Lacoast Project, CLC 2006 Project and national soil usage monitoring network (ISPRA, 2010).
Figure 2 - Increase in urbanised surface between 2000 and 2006 within 10 km from shoreline. Data process-ing by ISPRA (data from Lacoast Project, CLC 2006 Project and national soil usage monitoring network (ISPRA, 2010).
Libro.indb 11 17/05/2013 14.40.45

12
Pranzini and Rossi Coastal erosion monitoring - A network of regional observatories
Figure 3 - Coastal erosion (red line) in Italy between 1859 and 1997 (Pranzini, 2013; data from Albani, 1933; De Marchi, 1968; CNR, 1997).
Libro.indb 12 17/05/2013 14.40.49

13
ResMar Coastal erosion monitoring - A network of regional observatories
the mid 1800’s, which coincides with the period when the effects of coastal erosion also began to be felt.The analysis of Italian coasts shows that erosion started to develop first on the northern shores, then proceeding onto central and southern parts of the coast, following to a certain extent the country’s economic and social development (Fig. 3).
Erosion processes progressed onto densely populated parts of the coast, where tourism in-terests are high, followed by the development of coastal defence structures (Fig. 4) and beach nourishment projects. Knowl-edge on the current status and evolution trends of the coast be-came thus became a key issue for public administration, private businesses and users in general.
Coastal monitoring therefore became an important and func-tional activity, essential to coast-al planning and management. In spite of that, monitoring often lacks standardised procedures and is frequently based on a time scale that is not compatible with the processes under act, failing to provide information that can effectively support decision-making.
Need for standardisationAlthough each coastal section - and each process responsible for shaping it - requires spe-cific procedures for surveying and for data analysis, minimum requirements for measure-ment accuracy and operation time scales must be set. This shall lead to a homogeneous level of knowledge, which will make data comparison and transfer/exchange of project and management experiences more effective. Up to date, it has not yet been possible to reach a minimum level of homogeneity in the information obtained, as one can see from data published by many parties involved in data acquisition and the study of coastal evolution trends.
Table 1 presents the percentage of beaches undergoing erosion in each of the Italian regions, according to data published by GNRAC in 2006 and by ISPRA in 2010. The total length of the beaches present in each region differs significantly; in addition, percentages of erosion and accretion seem in some cases to refer to different realities. How could one explain 2% (GNRAC) against 26.6% (ISPRA) erosion in Region of Friuli? In fact, data in these
Figure 4 - Distribution of coastal defence and port works, per re-gion (ISPRA, 2009).
Libro.indb 13 17/05/2013 14.40.49

14
Pranzini and Rossi Coastal erosion monitoring - A network of regional observatories
reports originate from different data processing: ISPRA report considered beaches that have retreated at least 25 m in the past 50 years, using a digital database elaborated over shorelines extracted from IGM 1:25.000 scale maps (from different periods) and from 2004 aerial photographs. GNRAC, on the other hand, performed a survey using heterogeneous data, though conducted by a body of 41 expert researches from the different regions in-volved. Two different scenes emerge from this, and it is evident that the reality described by each of them would imply different policies, strategies and even financing approaches.
Table 1 - Percentage of sandy shores undergoing erosion in each Region, according to GNRAC and ISPRA sources.
RegionGNRAC 2006
(% on 3612 km)ISPRA 2010
(% on 4863 km)Liguria 84 19.9Toscana 36 21.3
Lazio 33 23.3Campania 27 24.7Calabria 43 32.7Sicilia 40 28.3
Sardegna 23 13.6Basilicata 73 38.1
Puglia 48 18.5Abruzzo 29 28.3Molise 29 34.7Marche 35 38.8
Emilia Romagna 10 25.3Veneto 9 21.0
Friuli Venezia Giulia 2 26.6Italy 36 24.1
More often, the timeframe analysed is rather non-homogeneous: in some situations, his-torical trends (obtained from older geodetic maps and from confrontation with recent maps at scales that are often different) are compared to variations obtained from shoreline surveys performed in a few years’ time interval; in others, information obtained from in-stant surveys is used - which can be effective in showing certain processes (such as beach dune scarping) but is inappropriate for well-defined evolution dynamics.If evolution trends are linear, this would not represent a relevant issue, but in most of the cases they are not linear and may even present inversions. Therefore, coastal sections con-sidered to be stable from such data confrontation analyses could now be under erosion after an accretion phase, or vice-versa. One should consider that erosion in Italy began in the second half of the 1800’s and had a peak after the end of WWI, after which it started to be counteracted by a series of watershed management measures and the construction of coastal defence structures.The reduction in the number of coastal sections under erosion in northern Italy, such as in Liguria between 1930 and 1968 (Fig. 3), results from of the construction of coastal structures. That is why evolution trends based on long time period intervals can be highly
Libro.indb 14 17/05/2013 14.40.49

15
ResMar Coastal erosion monitoring - A network of regional observatories
misleading; on the other hand, the analysis performed over a short timeframe can be too sensitive to the most recent changes, which could have not yet been consolidated.Another problem refers to the type of calculations used in the evaluation of shoreline dis-placement: in some cases, measures from different parallel transects are used, whereas in others changes in beach area divided by shore length at a certain section are considered.A recent study (Pranzini and Simonetti, 2008) has shown how the analysis of shoreline displacement based on beach area variation at each section (Surface Variation Analysis/SVA) and that based on transects (Transect Based Analysis/TBA) can produce results that differ significantly (Fig. 5).
Figure 5 - Comparison between shoreline position displacement using SVA and TBA for sectors 50 m wide (left) and 400 m wide (right). Displacement of median points indicates the magnitude of differences between measurements obtained in different coastal sections.
Figure 6 - Follonica coast: frequency of classes of shoreline position displacement between 2000 and 2005 according to different sector lengths (Pranzini and Simonetti, 2008).
Libro.indb 15 17/05/2013 14.40.50

16
Pranzini and Rossi Coastal erosion monitoring - A network of regional observatories
Differences become relevant when the shoreline is not straight due to the presence of natural irregularities (rhythmic or non-rhythmic patterns) or coastal morphology induced by coastal defence structures.
In average, SVA and TBA data correlation decreases as section length and distance be-tween transects increase, but there is not a precise trend due to random distribution and the dimensions of the different irregularities.Different results can be obtained when unequal transect spacing or section lengths are used (Fig. 6). This is particularly evident on coasts that are characterised by the presence of mega-cusps, whose migration can lead to the conclusion that half the littoral is under accretion and half under erosion. Similarly, shoreline rotation in a pocket beach could be read as stability of the whole beach, but could also be read as erosion of 50% of the coast.
Shoreline proxiesOne of the main problems in coastal evolution monitoring concerns the indicator cho-sen for evaluating the process, a subject recently considered by Milli and Surace (2011). A shoreline indicator is a feature used as a proxy to represent the “true position” of the shoreline (Boak and Turner, 2005). A wide variety of indicators, or proxies, can be found in literature, but unfortunately the ones that can be most easily identified are also the ones that are less accurate.
Proxies mostly used are instantaneous water line, high water line, vegetation or debris line, and seaward dune edge (Fig. 7).
Water’s edge at Cavoli (Isola d’Elba) High Water’s Edge at Tavolara Island (Sardinia)
Debris line at Castiglione della Pescaia (Tuscany)
Seaward dune edge at Marina di Cecina (Tuscany)
Figure 7 - Different proxis for shoreline position.
Libro.indb 16 17/05/2013 14.40.58

17
ResMar Coastal erosion monitoring - A network of regional observatories
Shoreline evolution monitoring along the Tuscan coasts has been based on the zero iso-bath, frequently considering its displacement for the past 10 - 15 years. Isobaths are ele-ments that cannot be easily identified in situ, but which can be defined. In this case deter-mination is not influenced by the instant sea level. The zero isobath as defined above can be found - and usually is - under or above the instant sea level (Fig. 8). This shoreline position is certainly subject to variability at high, medium and low frequency; this should be taken into account if long term trends are to be described. However, its position does not depend on the conditions under which survey is performed, but relies solely on coastal sediment budget and beach morphology. Even if it is not an absolute reference for the “health status” of the coast, it can be considered to be independent from other variables that are not strictly linked to sediment budget.
The use of a RTK mode GPS is required for the identification of shoreline position; it is also necessary to obtain the x, y coordinate points (Lat., Long.) at the exact moment when the quote zero is read by the instrument (taking the reference ellipsoid into account).Whenever traditional instruments are used, points should be acquired in pairs, placed above and below the zero isobath. Shoreline position will then be obtained through linear
interpolation of these pairs; this is valid considering the hypoth-esis of the swash being a sloped plan surface (which is true in a first approach) (Fig. 9).In both cases survey is per-formed as if the sea did not ex-ist; in theory, one could use any other isobath as an indicator, such as + 1m or – 2m. The zero isobath is chosen only because of its position adjacent the end of the dry beach.Each proxy gives different as-sessments of shoreline evolu-tion (Fig. 10) and the rationale of each must be carefully con-sidered.
Figure 8 - Identification of shoreline position using zero isobath.
Figure 9 - Shoreline drawn using interpolation of points measured above and below chart datum.
Libro.indb 17 17/05/2013 14.40.58

18
Pranzini and Rossi Coastal erosion monitoring - A network of regional observatories
Rationale of beach monitoring Survey of the dry beachAcquisition of shoreline position is not the only topographic operation con-ducted on the dry beach. It is important that other points are acquired in order to reconstruct the surface and calculate the volume of sediments placed above sea level. Other morphological elements can provide useful information on coastal processes, such as the storm crest el-evation, somehow representative of the wave energy reaching each segment of the beach (see Fig. 22).Transects surveyed on the swashzone are extended to the upper parts of the beach, up to the dune toe or the first wall, road or other built elements. Ex-tending the profile over the whole dune system is indicated in case of long term monitoring, even if not in every single shoreline position survey. If beach is under erosion, the whole dune system undergoing this process should be sur-veyed.If a survey is conducted point by point,
the pole should be positioned in each slope break of the profile, being careful not to stick the base in the sand. Minor forms, such as ripple marks, should be filtered, which is pos-sible if the rod has a flat base of about 10 cm diameter; in this case a slight pressure should be made in order to flatten the 2 or 3 sand ripples intercepted.In cases when survey is extended to the nearshore, using single beam equipment, survey lines will be placed as an extension of those on the berm. This determines transversal oversampling on both parts of the beach when compared to longitudinal sampling, which makes interpolation between points and the creation of a Digital Terrain Model (DTM) a very complex issue. Nevertheless, most morphological features in the dry beach – and, as seen below, also on the nearshore – present transversal development mainly; cross-shore variability is therefore higher than changes that are observed alongshore. The different point densities in these directions are more an issue of theoretical interpolation than sub-stantial problems of form definition.Whenever high density of points is acquired on the seafloor (by multibeam) reaching a similar detail on the subaerial beach becomes a hard task, unless a different technique is used (such as Laserscan, airborne Lidar or photogrammetric techniques). The use of multibeam alone therefore may not present an optimal cost-benefit ratio, except when the whole coastal monitoring framework is taken into account.
Figure 10 - Displacement of shoreline and dune toe posi-tions south of Marina di Cecina from 1999 to 2008.
Libro.indb 18 17/05/2013 14.40.59

19
ResMar Coastal erosion monitoring - A network of regional observatories
Nearshore surveyThe beach is a sedimentary body that extends from the dune toe to the closure depth (beyond which morphological variations are insignificant as the wave energy does not produce substantial sediment transport; Fig. 11). Variations in the volume of this deposit are of most interest to those in charge of coastal monitoring. That is due to the fact that the material that remains in this area may return to shore, and also because bathymetric variations in the nearshore may induce variations in shoaling and thus on the wave energy reaching the shore. This is the reason why the sole analysis of shoreline position displace-ment is not able to provide an evaluation of the real “health status” of the coast.
However, as will be seen below, the accuracy of bathymetric data is not good enough to allow for the calculation of a reliable sediment budget on short and medium terms – when volumetric variations divided by the surface analysed are smaller than survey accuracy.We will not detail the varying existing survey instruments and technologies at this point; however, other than the traditional single beam surveys, we can point to other techniques
often used today: multibeam, interferometer and Lidar surveys, not to mention the unrivalled beach sled and its own technological evolutions into mobile structures (Fig. 12 and 13).
Figure 11 - Bathymetric profiles acquired along the same line over 11 consecutive years (courtesy of ENEL).
Figure 12 - Beach profiling sled (Ocean Survey, Inc.).
Figure 13 - Coastal Research Amphibious Buggy (CRAB) used for beach profile measurements at the U.S. Army Corps of Engineers Field Research Facility, Duck, North Carolina.
Libro.indb 19 17/05/2013 14.41.00

20
Pranzini and Rossi Coastal erosion monitoring - A network of regional observatories
Beach sled is probably the technique with the most adequate accuracy for sediment budg-et studies, especially under the presence of waves; however, it is not used in Italy and in spite of being an extremely simple instrument, it faces some operational problems.
Defining a monitoring programThe role of coastal evolution monitoring is to forecast the future status of the coast, under natural conditions or following the implementation of coastal protection works. However, it is essential to know the history of the coastal section to be monitored in or-der to verify if interventions in act have altered past trends – and to what extent. Data used in this historical analysis are not usually obtained for the scope of monitor-ing, and should normally be recovered from documents that were produced in different contexts, casual timeframes and often unknown accuracy.Topographic maps, aerial photographs taken at unknown oceanographic conditions, ca-dastral maps not aimed at delimiting the coast, and scientific studies developed for a wide myriad of objectives: these are all valuable and irreplaceable sources of informa-tion, but they are certainly not structured in the most appropriate form as required for shoreline positioning.Linking old to new data may show “jumps” in evolution trends, of arguable existence. Today the use of Geographic Information Systems (GIS) has speeded and simplified data recording, sorting and querying.The definition of a new monitoring plan should therefore be able to extract data from preceding data typologies, preparing them to be imported into a future database.It is necessary to identify the most appropriate survey and data analysis methodologies; caution should be taken not to oversample (space-wise and time-wise), which would bring unnecessary extra costs to monitoring. This is the most difficult part of the opera-tion: a larger amount of data certainly contributes to a better description of phenomena, but long-term economic sustainability, especially when a project has already reached its final phase, could make it unsuitable.That is why the cost of procedures becomes a crucial element in defining a monitoring plan. In fact, the high frequency of surveys required for short or medium term monitor-ing, and the possibility of eventually extending it in time, make it necessary to use a net of low frequency surveys, whereas the analysis of specific structure impacts requires data of high density, both in terms of space (microvariations in seabottom) and time (response to specific oceanographic events).The system should therefore permit acquisition of data in the timeframe expected or determined by events, without incurring in high mob-demob costs or waiting for specific environmental conditions (e.g., water transparency, as required for Lidar).Data accuracy, especially in the case of altimetry, is essential for calculating beach sedi-ment budget, its variation along time and, often, for dispersion studies that take into account sediments entering the costal system in an artificial manner. One should note that an error of 10 cm in quote, and thus up to 20 cm when comparing data, implies an error of 200 m3/m in beach volume if the closure depth is located at 1 km offshore. This volume may be comparable to that of a small artificial beach nourishment project. An issue that should not be overseen refers to the fact that accuracy is a problem of data repeatability. Conformity to international standards such as those from IHO (Internation-
Libro.indb 20 17/05/2013 14.41.00

21
ResMar Coastal erosion monitoring - A network of regional observatories
al Hydrographic Organization) should ensure that predetermined limits are followed. The use of Ground Control Points (GCP) can be of immense value in order to obtain accurate topographic positioning when surveys are repeated. Minor methodological variations regarding instruments or methods of data acquisition and processing, often seen among different companies or operators, have been seen to lead to consistent differences in final data. As a rule-of-thumb, one should favour repeti-tion of surveys under the most homogeneous conditions possible.Time variability on coastal environments requires surveys to be fast enough to be con-sidered as synoptic, especially if conducted in periods of frequent storms. Should one survey be interrupted and then resumed after a sea storm, data acquisition should start from the very beginning again, to avoid the use of data referring to different oceano-graphic conditions in the same coastal segment.Celerity is often also necessary for data elaboration: it may be required for decision-making in the different phases of the project, or when topographic surveys need to be followed by other field activities. Sediment sampling at specific coastal features (such as submerged bars) must be preceded by a topographic survey, but sampling should be carried before oceanographic conditions change. When monitoring focuses on the evaluation of beach response to defence interventions, both hard and soft, it is opportune to know the initial conditions, which is not an easy task due to inner system variability.At the “zero moment” of monitoring, beach survey is not able to identify the dynamics that will act on top of processes induced by the intervention and which could jeopardise the correct interpretation of data and evaluation of intervention efficacy. When an inter-vention is planned for a site where only long-term trends are known (and not short-term trends, such as seasonal) monitoring should begin well before the first works start, allow-ing the inner system variability to be identified upfront.Long-term monitoring, aimed at the identification of evolution trends, and thus at the planning of shore protection projects, should consider the whole physiographic unit, so that dynamics under act are well understood and eventual downdrift effects are evalu-ated ahead.Whenever monitoring is carried with the scope of evaluating coastal structure impacts (usually commercial ports or recreational marinas), surveys should have as study area a length of coast of at least one magnitude order higher than that of the structure, since the instant structure impact on coastal processes develops for a beach length between 1 and 3 times the largest dimension of the structure.In fact, the impact of the structure may first affect first the sediment dynamics of the beach segment immediately downdrift (and in cases also updrift, as demonstrated by Cappietti et al., 2003, for the port of Livorno). However it may progressively extend to the whole physiographic unit. With regard to the positive and eventually negative effects of coastal defence struc-tures, the beach segment to be analysed in detail may be reduced in length, though one should evaluate the impacts on the whole physiographic unit by means of long-term monitoring.
The available planimetric accuracy for surveys today is a few centimetres; lower accuracy
Libro.indb 21 17/05/2013 14.41.00

22
Pranzini and Rossi Coastal erosion monitoring - A network of regional observatories
makes it impossible to discriminate morphological features such as shoreline, dune crest, etc). Due to the limited relief energy of the beach, with the exception of dune areas, an error in point position of 1 ÷ 10 cm does not cause relevant deformations or inaccurate estimations of beach sediment volumes. A more important issue, as seen above, is the problem of altimetric measurement accu-racy. If the available accuracy of some centimetres is acceptable for the subaerial beach (below micromorphological beach features as ripple-marks), on the other hand accuracy for seafloor surveys is of 5 – 10 cm.
Extension of area to be monitoredTo calculate sediment budget for a certain beach, the observation area should extend from the inner primary dune toe to the depth of closure.Due to the limited accuracy of bathymetric data and the rather limited value of morpho-logical variations in deeper waters (which could be resolved by using more expensive technologies), the rapport between fictitious and real variations increases as the study area extends onto the offshore. In many cases volumetric variations recorded on areas that extend significantly onto the offshore are much larger than those in the nearshore: an “apparent” negative sediment budget may be recorded after an artificial beach nour-ishment of modest proportions.It is evident though that for long–term monitoring plans one must overpass the depth of closure calculated according to the significant wave height exceeded 12 hours per year, and use estimations for longer periods (over a decade; Tab. 2).
Table 2 - Depth of closure calculated for 1992-2004 period (De Filippi et al., 2008).
FOCE MAGRAdc50yr
[m]SUD 11,4 Madonna delle Grazie E 6,2
foce Magra 8,3 TOMBOLO DI CECINA Tombolo di C. Regio N 9,8
EST foce Magra 9,8 NORD 11,7Tombolo di C. Regio
Centro9,8
CENTRO 13,5 SUD 11,7Tombolo di C. Regio
SUD9,8
porto di Carrara NORD 13,5 MARINA DI BIBBONA foce Albegna NORD 9,8M.CARRARA NORD 11,9 foce Albegna SUD 9,8
NORD 13,5 CENTRO 11,9 Tombolo della Giannella 9,8SUD 13,5 SUD 11,9 S.Liberata NORD 9,5
M. MASSA TOMBOLO DI BOL-
GHERI S.Liberata SUD 9,5
Marina di Ronchi NORD 13,5 NORD 12,0 CALA GALERA 5,5 Marina di Ronchi SUD 13,5 CENTRO 12,0 TOMBOLO DI FENIGLIA
M.PIETRASANTA SUD 12,0 1 10,1Cinquale 13,5 DONORATICO 2 10,1
Forte dei Marmi 13,5 NORD 11,5 3 10,1Marina di Pietrasanta N 13,5 SUD 11,5 4 10,1
Marina di Pietrasanta SUD 13,5CASTAGNETO
CARDUCCI 5 10,1
Lido di Camaiore NORD 13,5 NORD 11,6 6 10,1
Libro.indb 22 17/05/2013 14.41.00

23
ResMar Coastal erosion monitoring - A network of regional observatories
6: Lido di Camaiore SUD 13,7 2: SUD 11,7 TAGLIATA-TORBA
porto di Viareggio NORD 13,7 SAN VINCENZO 1 10,5
M.VECCHIANO NORD 11,7 2 10,5porto di Viareggio SUD 13,5 SUD 11,7 3 10,5Torre del Lago NORD 13,5 TORRACCIA 4 10,5Torre del Lago SUD 13,5 NORD 11,7 5 10,5M.Vecchiano NORD 13,5 CENTRO 11,7 6 10,5
M.Vecchiano CENTRO 13,7 SUD 11,7 7 10,5M.Vecchiano SUD 14,0 BARATTI ISOLA D’ELBA foce Morto NORD 14,0 NORD 10,3 Biodola 11,2
F.ARNO SUD 7,6 Scaglieri 11,2foce Morto SUD 13,5 FOLLONICA Schiopparello 7,9
Gombo 13,6 Torre del Sale 10,6 Magazzini 7,5CENTRO 13,5 foce Cornia OVEST 10,6 Bagnaia 7,5
fiume Arno NORD 13,5parco della Sterpaia
OVEST10,6 Nisporto 7,5
TIRRENIA parco della Sterpaia
EST10,6 Nisportino 11,5
Marina di Pisa NORD 13,7 Torre Mozza 10,8 Cavo NORD 8,5Marina di Pisa SUD 13,7 Villaggio Svizzero 10,9 Cavo SUD 8,5
Tirrenia NORD 13,5 Follonica 10,8 Barbarossa 10,6Tirrenia SUD 13,5 Puntone 8,3 Naregno 7,9
Calambrone NORD 13,7 Cala Violina 10,6 Capoliveri OVEST 9,8Calambrone SUD 13,7 Punta Ala NORD 9,8 Capoliveri EST 9,8
Scolmatore 13,7 Punta Ala CENTRO 9,8 Margidore 10,4ROSIGNANO Punta Ala SUD 9,3 Lacona 10,4
NORD 11,8 ROCCHETTE Marina di Campo 10,6SUD 11,8 Roccamare 9,7 Cavoli ovest 8,3
VADA NORD 11,9 foce Tonfone 9,7 Cavoli est 8,3VADA SUD 11,9 C. Pescaia OVEST 9,7 Seccheto 10,8MAZZANTA C. Pescaia EST 9,7 Fetovaia 12,1
NORD 11,9 Le Marze 9,7 Sant’Andrea 7,5CENTRO-SUD 11,9 Principina 9,7 Spartaia 7,0
CENTRO-NORD 11,9 foce Ombrone 9,8 Procchio 8,2SUD 11,9 Marina di Alberese 9,8 ISOLA DEL GIGLIO
MARINA DI CECINA TALAMONE Cala delle Cannelle 8,5
NORD 11,4Madonna delle Grazie
W6,2 Giglio Campese 9,2
The extension of the coastal area to be surveyed becomes thus an inverse function of beach slope. This means that bathymetric surveys for the scope of monitoring will be-come much more expensive the smaller the beach slope is (Fig. 14), even if it is a fact that some operations are essential to all surveys, regardless how far the survey extends towards offshore.
Libro.indb 23 17/05/2013 14.41.01

24
Pranzini and Rossi Coastal erosion monitoring - A network of regional observatories
Duration of monitoringWhereas for long-term monitoring one cannot define a time limit (but only survey fre-quency), for medium-term monitoring addressing the implementation of a certain defence strategy, or the assessment of efficiency and impact of structures and nourishments, the time involved is relatively short.In the first case (implementation of defence strategies within the scope of a regional plan rather than urgent interventions) it is understood that data to be collected should be able to represent not only the status at a certain moment, but also the inner beach variability (morphological changes that occur frequently after single storms or periods of extremely variable oceanographic conditions). This is important not only to set an uncertainty value for instant measurements, but also to predict dynamic boundaries within which the shore-line may move in the future (without considering it to be under erosion) so that risk limits for coastal structures may be defined.In this case, six-monthly measurements along 5 or 10 years would constitute an excellent database for the description of coastal evolution and inner beach variability.For studies on the efficiency of hard defence structures, one must consider that major vari-ations in beach shape occur after the first sea storms, arriving at structures that are able to modify incident waves (be the works concluded or not). Rather, this is the most delicate phase of the intervention, as the beach is being defended by incomplete structures whose impact (negative or positive) has not been studied during the design phase. If execution
Figure 14 - Profile of three significant sections of the Tuscan coast.
Libro.indb 24 17/05/2013 14.41.02
25
ResMar Coastal erosion monitoring - A network of regional observatories
of works is not fast enough – and this may happen due to technical, economical or legal problems - lit-toral response to the first phases of the intervention may be extremely violent and could condition the continuation of works, even imposing technical ad-aptations to the project (Fig. 15).
Although interruptions in the construction of defence structures cannot be foreseen, we can see based on several years’ experience that they occur rather frequently, and therefore one should plan intermediate surveys - although hoping never to do them. It may happen that new surveys, not initially planned to be carried within the monitoring plan, become necessary in order to evaluate the effect of extreme storms both over the beach and over the structure itself. It is therefore necessary that resources be allocated for eventual emer-gency monitoring situations.
5. Shoreline vs. seafloor evolution Easier access to shoreline and lower survey costs have often led to monitoring being re-stricted to subaerial beach only, thus covering only a minor part of the coastal system (Fig. 16). In addition, this part of the beach is a visible feature often disputed by stakeholders, and monitoring the shoreline adds a special political interest to this. Were this feature is a clear indicator of the coastal status, this approach would be reason-able and economically advantageous. However, it would only apply to cases where mor-phological evolution of the beach meant a parallel displacement of its profile. For that to happen, all events that shape the beach should affect all the section between the dune toe and the depth of closure with the same efficiency for both erosion and deposition processes; in addition, longshore sediment flow should be homogeneous along the whole profile (but different at entrance and exit points of the study area) whereas cross-shore
Figure 15 - Marina di Pisa. Above: works executed on 19 05 1999 (Photo: DST-UNIFI archives); Right: structure status on 13 03 2000 (Photo: Corpo delle Capitanerie di Porto, Luni - Sar-zana). Although the structure was designed with a submerged crest, during the contruction - interrupted due to legal prob-lems, it induced changes on beach morphology that had not been predicted by the project.
Libro.indb 25 17/05/2013 14.41.02

26
Pranzini and Rossi Coastal erosion monitoring - A network of regional observatories
sediment flow should be null, to avoid concentrated deposition or erosion at any given point. Sediment texture characteristics should also not change at the different parts of the profile, influencing the slope. This situation is clearly quite far from reality, especially when monitoring is set to evaluate the stability of artificial nourishments, either distributed along the profile or concentrated on the dry aerial beach (beach nourishment) or on the submerged profile (nearshore nour-ishment). Whenever hard structures are later built on the beach, modifying morphology either di-rectly or indirectly, translation of the original profile becomes absolutely impossible.Therefore, beach evolution monitoring should not be restricted to shoreline position mon-itoring in all protection projects (both hard and soft strategies). The survey of the whole beach up to closure depth is essential for defining sediment budget and the evolution of coastal defence project efficiency.When seafloor morphology is under study (with no interest on sediment budget) surveys may be limited to the parts of the profile undergoing morphological changes (such as development, migration or disappearance of bars); this does not refer to the outer parts where evolution implies only minor variations, mostly vertical oscillations.
The coastal response to new defence structures may be indicated by scouring at the toe of structures, increased scouring depth at the head of groins, increased depth in front of de-tached breakwater gaps, and seaward bar migration. All these elements may be monitored by bathymetric survey methods of moderate accuracy.
Guidelines for coastal monitoringBased on the theoretical considerations above, and on the experience gained in monitor-ing natural and structure-induced coastal evolution, a few guidelines can be pointed which could constitute a common ground and thus grant the minimum homogeneity required for comparing results.Monitoring techniques will not be referred, as data acquired should be independent from the technologies available today. What can maybe be achieved by acoustic multibeam sur-veys, could in the near future have better quality and be more economic if acquired with Lidar or other techniques still to be developed. Therefore, available methodologies shall not be detailed here but rather introduced in general terms.
Figure 16 - Sections of the beach subject to monitoring.
Libro.indb 26 17/05/2013 14.41.03

27
ResMar Coastal erosion monitoring - A network of regional observatories
Definition of standard techniques could in fact limit research and experimentation of new technologies, as these would be hardly accepted by the public administration if not con-templated in shared protocols.However, it is necessary to compose a framework of the technologies that are more fre-quently used in coastal surveys, which makes it possible to understand the criteria pro-posed and to read example data and images. On the other hand, it is clear that in the future it might be irrelevant to speak of profile spacing should acquisition techniques focus completely on the generation of new points, which would make precision a function of pixel size or resolution cell. These guidelines will focus on aspects related to data accuracy, their temporal and spatial frequency, modes of processing and comparison, and finally on methods of data interpre-tation. Due to the issues explained above, “metadata” shall have almost the same value as “data’, as different acquisition and analysis procedures may lead to opposite conclusions.The indications below refer to coastal monitoring focussed on the identification and quan-tification of morphology and volume variations, to infer the evolution trend and evaluate the efficiency of defence and restoration strategies. Accuracies are suggested according to this understanding.Higher accuracy in land may be obtained with geodetic instrumentation, which makes survey much slower. Cases of morphology changing during the execution of surveys could then occur, with different parts of the beach profile referring to different oceanographic conditions. In any case a similar accuracy value could be obtained for the submerged part of the beach, which represents the largest beach area as seen.The scope of this chapter is to present an overview the most problematic aspects of coastal monitoring and indicate major guidelines; readers interested in a more detailed descrip-tion of instruments and procedures should find it in specific technical literature.For hydrography, for example, International Hydrographic Organization (IHO) recommen-dations may be followed (IHO S-44 5th Edition February 2008).
Reference systemsThe choice of specific cartographic reference systems for coastal topographic/bathymetric surveys depends usually on each local or regional reality, being determined by the several public administration agencies involved. Even if different systems are used by countries as their official national datum, GPS tech-nology is leading to a wide use of WGS84 system, in UTM coordinates. This system is based on a network of static points which becomes updated according to Earth surface defor-mation and has the advantage of having a very precise global datum, free from problems related to local geodetic networks.A very important aspect of GPS is that many countries today have permanent stations, or rather, a detailed and accurate GPS-based network which provides the necessary correc-tions in real time and in processing by operators and users of the systems.The use of permanent stations caused many improvements in GPS system to be devel-oped: through a phone connection, for instance, it is possible to receive corrections in real time and thus work with centimetre accuracy using only one instrument. The continuous increase in the number of cover points makes the creation of local benchmarks along the coast unnecessary and rather superfluous.
Libro.indb 27 17/05/2013 14.41.03

28
Pranzini and Rossi Coastal erosion monitoring - A network of regional observatories
In those cases when benchmarks are needed, these should be adequately described and verified.The above applies to land topography, but not for bathymetry, where reference is usually made to the mean sea level elevation (0.00 m orthometric height). This usually corre-sponds to a mean value that considers measurements along the years, and is updated by the public agencies concerned.Conversion between WGS84 coordinates and a specific national or local system (as be-tween ellipsoidal and orthometric heights) may not be performed through the use of a simple mathematical equation. Instead, very complex operations and local parameters are required. Coordinates are obtained searching for the best local correspondence possible between ellipsoid and geoid surfaces, using roto-translation parameters and a scale factor. These parametres can be obtained from calculations that use coordinates of at least three points in both systems. Points should be located at kilometric distance, and on the border of the study area. Parameters however can be easily obtained with the use of specific soft-ware, such as “Verto” by Istituto Geografico Militare Italiano. When WGS84 planimetric coordinates are used to calculate the orthometric height only, it is necessary to know the difference between both heights. This value is often available in the internet today, usually provided by services related to a network of permanent stations.
AccuracyThe accuracy desired in each case is a function of the survey and monitoring scope. Mil-limetre accuracy is required for geodetic positioning, whereas centimetre accuracy is suf-ficient for volumetric calculations (as for nourishment monitoring, for example). Lower accuracy, especially in position, could reveal to be sufficient for cartographical description of the beach. Usually precision is defined as a function of the scale of maps to be produced, although this has lost some of its significance after the introduction of digital maps and CAD, which give non-dimensional outputs. This is still a valid praxis for clarifying the differ-ent requests: for instance, an error of 10 cm may be accepted for 1:500 maps.In DEM volume difference calculations, for example, simple equations put into evidence how instrument accuracy which determines the precision of model may have a net weight that is smaller regarding the absolute error in altimetric reference; this will also prove to have a larger weight regarding the difference in calculations that are due to the varying section spacing (Aminti, 1999). In addition to accuracy limitations resulting from instrumental factors, a series of variables that often reduce the quality of the data should be considered, as human error, reference system error, sensor movements, time-latence and off-set errors, etc. This could however be reduced through the adoption of special procedures or instrument calibrations.
Accuracy of planimetric dataInstruments that are available today provide centimetric accuracy with short, concise surveys that are definitely sufficient when coastal morphological variations are taken into account.It is considered that slopes rarely exceed 4-5% on subaerial beach profile if fine sediments are present, except at erosion steps that may form at the upper swash zone. Therefore, an error of 10 cm in the position of a certain point produces an error of 1 mm in elevation, a value that is well below ripple-mark dimensions. Important scarps form following nourish-
Libro.indb 28 17/05/2013 14.41.03

29
ResMar Coastal erosion monitoring - A network of regional observatories
ment when sediments are placed directly onto the subaerial beach, particularly when the level of the area is consistently raised. For gravel beaches, slopes are quite higher, and often reach the sediment angle of repose (and in certain cases even exceed it if grains are flat and imbricated) and reduced planimetric accuracy could lead to more consistent errors when volumes are calculated. Swash steps may show a difference in level of a few decimetres, but a position error of 10 cm will not represent more than 0.1 m3 per metre of coastline. For topographic surveys, accuracy should be higher than 3 cm, and not exceed 5 cm in ex-peditious ones. Such values should be maintained even in surveys of the nearshore beyond the step, as slopes may still be significant.For hydrographical surveys beyond and along all the submerged profile, planimetric ac-curacy should be limited to 1 m, considering that the extremely mild slopes in the seafloor determine errors in elevation that are below-ripple mark dimensions. These considerations are valid only for sandy seabeds and single beam surveys.
Accuracy of altimetric dataThe monitoring accuracy required for topographic and bathymetric surveys is usually the maximum accuracy that can be obtained from real time instruments (without further data processing): for both GPS-RTK and professional echosounders, this means a few centi-metres. However, accuracy may be reduced due to other errors. Even in such a case, the maximum IHO standard indicates uncertainty should not exceed 25 cm of the bathymetric value, which is often halved in the strictest tender technical specifications. In fact, as seen, an error of 10 cm in quote may lead to wrong beach volume calculations, amounting up to the volume of medium-sized artificial nourishments.To ensure that standards are maintained and that the desired accuracy is respected, bathy-metric surveys may even be certified by specific agencies, such as the Italian Navy Hydro-graphic Institute. Many data processing software provide this type of control automatically.
CharacteristicsMonitoring is constituted by a series of surveys, each being characterised by several phas-es. The main phases are: activity planning; organisation of the field campaign; execution of the survey itself; control of acquired data; processing, restitution and analysis of data. A survey project should include the acquisition of all useful and necessary information for its development: available maps at different scales (both topographic and nautical, cur-rent and historical); satellite imagery; orthophotographs and other similar materials should therefore be obtained. Existing studies and surveys should also be analysed, field trips should be conducted and a series of restrictions and bureaucratic requirements should be verified in order to acceler-ate and improve the development of the survey campaign.The project should then be able to indicate the survey method that is most appropriate ac-cording to the desired accuracy, size and characteristics of the zone to be studied in terms of time and costs.
ExtensionThe analysis of all material available will also allow determining the correct extension of
Libro.indb 29 17/05/2013 14.41.03

30
Pranzini and Rossi Coastal erosion monitoring - A network of regional observatories
monitoring areas, which usually coincide with a physiographic unit or the zone of a certain defence structure or nourishment. In such cases longitudinal extension should extend if possible to the whole unit, or at least to a length equal to both sides of the survey area. The cross-shore extension of the beach should extend from the upper limit of the subae-rial beach to the closure depth (in Italian beaches, usually around –10 m). Surveys should be extended at least beyond the last bars present (within the most dynamic band of the seafloor).
Survey line spacingFor single beam surveys, spacing between sections depends on the accuracy desired as well as on morphological variability of the seafloor. For detailed surveys, such as those carried with the purpose of volume calculations, sections could be 10 m distant. In some cases, resolution is increased through the use of a net planned with the same distance between points. Shorter distances become inappropriate and favour the use of multibeam for a complete cover of the area. In such cases the survey becomes a function of the density of the produced DTM grid (which can vary from 0.1 x 0.1 m to 2 x 2 m in coastal water surveys). Longer distances between single beam survey sections are used when monitoring should address the morphological description of the seafloor. In these cases (and also according to the extension of the study area) lines up to 250 m distant can be planned, especially if coastal morphology develops mostly “alongshore” (absence of cusps and in the presence of straight bars). It is good practice to repeat surveys using the same distance as previous
surveys, unless the scope of moni-toring at a given site has changed. Sections extend from the dune toe (or first construction/building) to the depth of closure. Whenever morphological irregular-ities or hard defence structures are present, the addition of other sec-tions to monitoring plans is highly recommended to allow for a better description of beach morphology (Fig. 17).
Immediately after the end of the survey planning phase, the follow-ing question should be posed: “how will points be interpolated in this zone?” The answer may be difficult,
but some aspects that have not yet been exhaustively analysed will then be taken into consideration. In some cases, it might be necessary to include a multibeam survey within the single beam net, so that attention is driven from more homogeneous seafloor sections to an area where structures are able to produce morphological variations at a smaller scale (Fig. 18).
Figure 17 - Number of project survey lines increasing near groins. In this case bar morphology will be continuous.
Libro.indb 30 17/05/2013 14.41.04

31
ResMar Coastal erosion monitoring - A network of regional observatories
Profile surveysFigure 18 refers to a section of sandy coast of circa 6 km length, located in Tuscany, Italy. It can be noted how sea-floor morphology is well described in the central part of the survey, where sections have been spaced at 25 m, and how it progressively loses detail on the right side (sections at 50 m distance) and even more on the left, where sec-tions are 100 m distant.On the central part, one can also note more details arising from a multibeam survey of a limited seafloor area, which highlights a submerged groin, built with geocontainers, that is not identifiable by any discrete survey.
Survey durationFor single beam surveys, considering the instrument moves at circa 3 knots (circa 5 km/h), for a 1 km long beach with 50 m spaced sections survey will take approximately four hours to be completed.For multibeam, considering an aperture of 120°, the area of seafloor to be scanned (A) is a function of depth (D) as: A= 2(D* tan 60°) = D* 3.46
This means that the bottom coverage equals circa 3.5 times the depth. We should consider though that in multibeam surveys it is often necessary to obtain an overlap of at least 30%, and thus a good estimate could consider the coverage of the survey area to equal 2.5 times depth. For example, if a certain coastal monitoring plan establishes that a beach of circa 1 km2 should be monitored down to 10 m depth, we could simplify the calculations considering an average depth of 5 m, considering that under 2 m it is difficult to operate multibeam instrumentation as it requires the use of boats of a certain minimum tonnage. As surveys are conducted at an average speed of 5 km/h and that in this case spacing of 12.5 m would be acceptable, it can be said that in one hour 62.500 m2 (5000 m * 12.5 m) of beach can be surveyed. This means that 16 hours (2 working days) will be necessary to survey an area of 1 km2 (1.000.000 m2).
Figure 18 - Multibeam data nested inside a single beam survey in correspondence to a submerged groin.
Libro.indb 31 17/05/2013 14.41.04

32
Pranzini and Rossi Coastal erosion monitoring - A network of regional observatories
As the extension of the scanned area increases with depth when surveys are carried per-pendicularly to the shoreline, a few empty spaces will be found near the coast where-as oversampling is expected towards offshore. It is thus more adequate to operate with routes that are parallel to the shoreline, more spaced towards the offshore (for example, 25 m at –10 m) and less spaced near the coast (12.5 m at -5 m, for example).
FrequencyMonitoring campaigns which focus on the study of seafloor morphology should be car-ried in winter and summer (or, rather, after storm and swell conditions) so that maximum system variations are identified.It is though not economically possible (and it is scientifically questionable!) to conduct two bathymetric surveys per year in a coastal segment where there are no defence interven-tions (which could indeed produce fast beach response).Surveys should be more frequent following the construction of a defence structure or nourishment works. In such cases, monitoring should start before the defence interven-tion begins to be built. In such manner, the information necessary for the design phase, as well as metric calculations (pre- and post-work) in case of volumetric control, can be acquired. It is often necessary to allocate resources in the plan to cover an eventual rep-etition of surveys, such as after a severe storm event that can cause significant morpho-logical changes on sandy shores. Shoreline survey can be repeated even more frequently, as they are far cheaper. If pre-existing surveys have been conducted, the new monitoring plan should predict a frequency similar to that of earlier surveys, allowing data to be comparable.The timeframe of surveys could be defined according to the following:
- 5 years for evaluating the efficiency of a specific defence structure; - 10 years for executing a coastal defence project; - 30 years (or longer) for executing a coastal planning project.
Clearly, longer studies need be supported by archive data.In addition, surveys should consider the wave climate which characterised the study area at the time when survey took place. Data should therefore be obtained from existing wave buoys or inferred from models. In some cases wavemeters can be installed specifically for this purpose.Once all phases are defined, a schedule should be set for the programmed activities (Tab 3).
Table 3 - Example of monitoring schedule for evaluating the efficiency of a specific coastal defence structure.
Pre-
inte
rven
tion
End
of w
orks
6 m
onth
s
12 m
onth
s
18 m
onth
s
24 m
onth
s
36 m
onth
s
60 m
onth
s
Single beam topographic surveyMultibeam survey near the structuresLaser scanner survey of the structure
Libro.indb 32 17/05/2013 14.41.04

33
ResMar Coastal erosion monitoring - A network of regional observatories
MethodsA short overview on technologies mostly used in coastal monitoring is given below. Topo-graphic surveys for coastal monitoring usually use GPS (subaerial beach) and single beam echosounder (seafloor). However, new technologies become progressively more used, such as laser scanner or non-conventional photogrammetry (subaerial), satellite imagery and video systems (shoreline), multibeam and interferometres (bathymetric surveys). Surveys usually focus on the following activities:
- Geodetic positioning and installation of GPS Ground Control Points; - Installation of vertices of echosounder scanning sections (if required); - Shoreline position survey; - Subaerial topographic survey; - Bathymetric survey.
The major phases of data processing, restitution and graphical presentation are: - Baseline calculations for static GPS measurements; - Subaerial GPS relief editing; - Extraction of digital data and profile restitution; - Compilation of GPS Ground Control Points identification sheet; - Elaboration of carthography; - Illustrated report covering survey modes and processing.
Working proceduresWork methodology for the main activities included in a survey is described below. The final report delivered to the public administration (in Italy, to the Direction of Works/DL) should include indication of instruments used according to the type of survey (positioning system, MRU, data acquisition and navigation system), software used for data acquisition and pro-cessing, and tests and calibration procedures applied to the instruments used.In some cases, before the survey begins, the contractor should present warranty certifi-cates for the instruments used, and must communicate to DL the list of controls followed in laboratory or to be compiled with on board, as well as test and calibration procedures to be followed according to guidelines indicated by the manufacturer and in accordance to the quality procedures of the contractor. GPS is often used for positioning. Differential double frequency GPS (L1-L2) is used for higher accuracy, with code and phase registration. “On the fly” RTK GPS is also used espe-cially on coastal surveys when differential corrections may be received by GSM or radio. This instrument is able to provide extremely high accuracy values (10 mm + 2 ppm rms in real time and 3 mm + 0.5 ppm rms in static mode).One GPS instrument is indicated as “Reference” and another as “Rover”; both are linked through a modem radio or GSM. The Reference GPS is left at a benchmark of known coor-dinates (Fig. 19), described with an accurate datasheet (Fig. 20) while survey is performed using the Rover GPS, which receives coordinate corrections from the first GPS (Fig. 21). Services provided today by the permanent GPS station networks make it possible to use only one instrument (Rover), as corrections are received via GSM. In addition to bathymetric and topographic surveys, GPS is often used for positioning known points in static mode, controlled by quotes using Total Station or precision levelling.
Libro.indb 33 17/05/2013 14.41.04

34
Pranzini and Rossi Coastal erosion monitoring - A network of regional observatories
This technology has strong advantages: calculation of absolute quotes in real time with centimetre precision; its high acquisition frequency allows automatically correction of all oscillations in sea surface (tide, wave, setup), combining data received from the echo-sounder. There are specific advantages for subaerial surveys as exposed above.In order to use these functions, it is necessary to perform a coordinate transformation, from WGS84 coordinates (mostly used in satellite technologies) to the desired coor-dinate system. This requires local transformation parametres to be available. The type of coordinate transformation chosen is important to ensure high precision results are obtained.
Geodetic positioningTo define coordinate transformation in the GPS, a series of points whose coordinates are known in national or regional reference systems are retrieved. Their position is chosen in the way to better delimit the zone under study.Points that are not marked on the ground are retrieved using GPS static mode after bench-marks from the existing geodetic net.Geodetic network vertices and support benchmarks should be linked through at least two bases and two points from the network, though it is not necessary to have the exact con-figuration of a geodetic network.All measurement sessions shall be performed with double frequency GPS receivers (L1/L2), with sampling interval of usually 10 seconds and a filter over the minimum satellite eleva-tion angle of 15°. This should eliminate satellites that are too low over the horizon and that could reduce precision.It is a good practice to use at least three receivers, operating simultaneously, to ensure productivity, precision and celerity to operations.The quote is then corrected from geoid variations, using specific software. Wherever nec-essary, quotes are also obtained using high precision levelling.
Figure 19 - GPS station on a benchmark.
Figure 20 - GPS benchmark data sheet.
Figure 21 - Operator with a GPS Rover.
Libro.indb 34 17/05/2013 14.41.05

35
ResMar Coastal erosion monitoring - A network of regional observatories
Known points are identified through the insertion of a pin on the ground and are eventu-ally described.Regarding the implementation of echosounder sections, once coordinates of start point vertices are loaded into the GPS, according to instructions on the palm top, it is possible to retrieve points on the terrain with precision under the centimetre. Once found (using GPS stakeout mode) they can be materialised.
Topographic land surveyShoreline surveyShoreline surveys should be performed under calm sea conditions and with a number of points sufficient for their precise configuration. Due to this fact points can be quite distant at straight sectors of the coast, whereas points should be closer at coasts presenting small cusps or salients. For swash zone surveys, RTK GPS is often used. Here the elevation of the pole base is constantly reported to the operator. The survey is conducted walking along the desired quote, usually the “zero” from the local Datum. In this context, tide levels do not have to be considered.If RTK mode geodetic GPS instruments are not used (which allow walking along the swash zone, over the correct quote, in real time), the operator should take at least two points, one above and one below the hypothesised shoreline, in order to obtain, with tidal corrections, the effective relative shoreline position, or rather, the ensemble of “zero quote” points.Alternatively, the shoreline may be surveyed using kinematic GPS. Here two surveys are carried, one during high tide conditions and one during low tide; shoreline position is later identified by interpolation, always hypothesising an intertidal zone of constant slope.
Dry beach surveyAll coastal structures and the subaerial beach topography are surveyed along the landward extension of the bathymetric profiles.Differential GPS is of much help to the operator also in this case. It is possible to download to the palm top the routes of sections to be surveyed. The GPS guides the operator along the route through a graphical interface, indicating also the distance to the off-route. It is thus possible to follow the line and record the (X, Y, Z) coordinates of the points visited. This survey starts at the landward vertex of the section and goes to the first bathymetric quote surveyed by the echosounder, ensuring a complete coverage of the beach. Survey points must be aligned along the project transects corresponding to those at sea, and should be acquired at 5 m spacing maximum (1 m for kinematic survey), with denser cover-age at specific points and in case of more berm crests. These should though be surveyed, not only through sections, but also along their contour (Fig. 22). The same should apply to all irregular features whenever these are present.It is a good practice to give different codes to recorded points that refer to different ele-ments and discontinuities surveyed during the field campaign. Photographs become use-ful tools for relief reconstruction in the office and visual record of the survey.Planimetric and altimetric records of storm berm crests are of special interest when sur-veyed after extreme storm events. They can provide information on extreme run-up values, determined mainly by the existing defence structures rather than by wave characteristics.
Libro.indb 35 17/05/2013 14.41.05

36
Pranzini and Rossi Coastal erosion monitoring - A network of regional observatories
The efficiency of struc-tures can be evaluated from the quote that reaches the berm crest. It is possible to identify points of energy concen-tration, littoral drift con-vergence zones, and also overwash fans which may indicate erosion hotspots where coastal areas may be flooded.For the scope of verify-ing the congruence of measurements, survey should overlap bathym-etric survey for at least 10 m. Wherever this is not planned, it is a good practice to extend the topographic survey to the – 1m quote. This allows identifying the slope and step, where present.To extend the survey to the wading depth, it is
possible to use Total Station and Prism, avoiding risks and water damage to the GPS in-strument.
Detailed surveys for structures and beach volume calculation The presence of artificial structures characterises many shorelines. They may present dif-ferent typologies, such as groins, submerged breakwaters, protected artificial nourish-ment, etc. In such cases, a first approach should consider the safety of survey operators and the difficulty in determining stable or reachable positions for land-based topographic operations. Due to the introduction of measurement systems based on high frequency laser pulses it became possible to take measurements from a distance. In addition to auto-reflective laser total stations, the use of laser scanners has been increasing lately. These instruments allow acquiring thousands of points per second, up to kilometric distances, with precision that equals that of traditional topographic techniques.In addition to a terrestrial scanner fixed on a tripod, this technology may be transported on board of a plane (Stockdon et al., 2002) or placed on a boat combined, for example, with a multibeam echosounder. This makes it possible to acquire detailed measurements of a structure (both emerged and submerged parts) over large areas and short times (Fig. 23). Laser scanner has also the advantage of retrieving information on the colour of acquired
Figure 22 - Cavo (Elba Island - Italy). Survey after a storm event . The berm crest is lower near the groins than in the centre of the beach, where wave energy is higher. Profiles following the berm crest in the three cells.
Libro.indb 36 17/05/2013 14.41.05

37
ResMar Coastal erosion monitoring - A network of regional observatories
points. This method allows high precision monitoring to be performed when traditional topographic techniques cannot be used. Especially when maritime structures are being built, and natural boulders or concrete elements are put into place, only an approximate estimation of the material used can be reached by GPS or total station surveys, since an insufficient number of points is recorded. This is due to intrinsic characteristics of the method and to difficulty in access during the survey.It has been shown how laser scanner, operating from a distance and potentially measuring millions of points, retrieves the object geometry with high accuracy even for the purpose of precise metric calculations; its combination to a detailed multibeam survey of the near-shore completes reconstruction (Fig. 24).
Figure 23 - Laser scanner survey of a beach (by Geocoste for Politecnico di Bari).
Figure 24 - Laser Scanner and MBES combined surveys.
Libro.indb 37 17/05/2013 14.41.05

38
Pranzini and Rossi Coastal erosion monitoring - A network of regional observatories
Results similar to those obtained in laser scanner surveys have been obtained lately with non-conventional photogrammetry. Due to the development of innovative software in the field of digital photogrammetry, it is possible to automatically obtain DTM and DSM models, with the corresponding orthophoto mosaic, at centimetric accuracy. A notice-able advantage is represented by the possibility of using any photo camera, which can be mounted on top of small radio controlled drones, and by the fact it requires very few targets on land (Fig. 25).
Bathymetric surveyPositioningIn bathymetric surveys, a digital automatic data acquisition system is used, positioning the vessel in real time using GPS technology with coordinate correction by modem radio. This allows the survey to be followed without any need for alignment; neither is it necessary to position at the head of the section which would require instantaneous quote correction.The “Reference” GPS station is positioned on a benchmark whereas the “Rover” is placed on board with the receiver antenna in axis with the echosounder.The GPS on board transmits coordinates (East, Nord and elevation) to the navigation soft-ware, in real time, and in a wide band of acquisition frequency. The operator aboard guides the boat according to indications on the computer screen, which indicates the planned line to be surveyed and the instant position of the vessel.Once the boat is aligned with the section to be surveyed, the operator follows, with maxi-mum precision, the project line that is visualised, and data being to be acquired. Other parameters can be seen, such as off-route, velocity (knots), azimuth, distance from the beginning and end of route; event number and other values that are useful to the survey.This technology offers significant advantages. In addition to Gauss Boaga coordinates, GPS calculates the absolute quote of the echo transducer in real time and with centimetre pre-cision; it thus becomes possible to, in combination with echosounder data, automatically
Figure 25 - Aerial photographic survey of a port with a small drone (Menci software).
Libro.indb 38 17/05/2013 14.41.07

39
ResMar Coastal erosion monitoring - A network of regional observatories
correct all oscillations in sea surface (tides, waves, wind set-up) during the bathymetric survey. Tide and atmospheric pressure corrections therefore are not required for data re-duction to mean sea level; all vertical oscillations are automatically considered. Centimetric x-y accuracy is not always necessary for positioning in single beam surveys, especially on sandy floors. Often sub-metric precision DGPS instruments are sufficient for excellent results to be obtained. In this case the value of tide during survey is usually meas-ured using a rod, levelled according to a benchmark of known quota, which is positioned in a calm sea area. Alternatively, tide gauge values can be used.
Single beamProfile lines for single beam echosounder bathymetric surveys are set according to the project. They are usually positioned orthogonal to the coast, and are further integrated by routes perpendicular to those which act as control.Surveys are usually carried under completely calm sea conditions, in the absence of winds. The vessel moves along sections at constant low speeds, following a predetermined route (Fig. 26). Usually small vessels of low draught are used for this type of survey, as they need to approach the coast as much as possible.
Echosounders are hydrographical and have 1-2 cm precision. Frequency used is normally about 200 kHz, which is a good value to ensure an accurate survey of the seafloor, with little interference from the water column. The beam width of the instrument is usually narrow in order to grant high geometric resolution. A frequency of at least one pulse (beam) per second is required. To ensure congruency between planimetric and bathy-
Figure 26 - Example of bathymetric survey software.
Libro.indb 39 17/05/2013 14.41.08

40
Pranzini and Rossi Coastal erosion monitoring - A network of regional observatories
metric measurement data, the echosounder is positioned in line to the position receiver or alternatively corresponding offsets are calculated. Echosounders are calibrated before and after the survey. Water sound velocity on the instrument is set through the “bar check” method (measur-ing the depth of a bar or metallic disk placed below the transducer and suspended by a threaded rod).Digital correction of eventual errors is then performed on navigation software. Due to economic factors, motion sensor for roll and pitch correction, are seldom used in this type of survey. The same is true for variations in quota of the transducer. If the survey is carried under calm sea conditions and in the usual low depths (which attenuates the problem from the geometric point of view), error is considered to be acceptable. If the survey is directly performed in digital format, all data are recorded on the PC on board.
MultibeamMultibeam “MBES” (MultiBeam EchoSounding) technology is quite sophisticated and is able to provide information of high quantitative and qualitative standards. The method here changes from single point acquisition (single beam) along the navigation route (traditional echosounder) to continuous acquisition of a high number of concomi-tant pulses (beams), covering a stripe that equals 2-4 times the survey depth.Resolution is extremely high and therefore seafloor features, even of small dimensions, can be identified, and their continuity can be followed.In this case, navigation is also aided by RTK mode precision GPS. To grant the potential instrument accuracy, motion compensator (MRU) and high precision gyro are required for data correction.In addition to saving time on larger areas, this type of acquisition allows investigating the real morphology of the seafloor with higher precision. Bathymetric quotes can also be detailed, using direct measurements and not (as in single beam products) by means of interpolation of points acquired along the route and during side routes.
Figure 27 - Submerged groin survey using Multibeam Reson 8125 (top) and Odom ES3 (below).
Libro.indb 40 17/05/2013 14.41.09

41
ResMar Coastal erosion monitoring - A network of regional observatories
Surveys usually plan for a full coverage of the study area, scanning along parallel transects and considering an overlap.For specific applications, multibeam transducers can be placed in a laterally inclined mode, in order to cover the relief of defence structure slopes (from their toe to near the water surface), for example.In spite of higher costs, multibeam surveys are used wherever seafloor features must be detailed, or if a full cover is necessary to calculate volumetric variations of the sediment budget with high precision.Technology is undergoing constant evolution. Lately, multibeam instruments of smaller dimensions have been appearing on the market, with reduced costs that will extend their use to seafloor morphological surveys, now frequently surveyed by single beam (Fig. 27).
Data processing and quality controlThe major operations regarding survey data processing are listed below, and their general aspects are highlighted.
GPS data processingAs seen, it may be necessary at times to plan one or more benchmarks of known coordi-nates, departing for instance from points that belong to a national net or, more recently, to permanent GPS station nets.It has also been shown how the method takes long measurements in static mode. GPS data are then post-processed with specific software.Once concomitant readings from the stations are uploaded, calculations allow data pro-cessing which will resolve eventual ambiguities.It becomes therefore possible to retrieve coordinates in the desired system, with even mil-limetre precision. Later it is verified if values for standard deviation and quality factors are appropriate. RTK (Real Time Kinematic) GPS is used instead for topographic surveys of the dry aerial beach, which do not require post-processing. In addition, it allows searching the terrain and record vertices at the beginning of each route. Having set a coordinate transformation system, data are already recorded by the instrument in the coordinate system chosen, with absolute quotes. Once downloaded from the GPS internal memory, data are exported in CAD format, as 3D coordinate (x, y, z) points.
Single beamThe processing of data acquired during the bathymetric survey leads to the drawing of the profile and isobaths. Such operations can be performed by cartographic modules of the in-strument software. They also permit export of data in different ASCII or AutoCAD formats.Also in this case, recorded data consist of 3 values (x, y, z) of seafloor points, the latter be-ing corrected according to mean sea level and vertical oscillations.In the first processing operations, corrections are made with a graphical editor for errors (in elevation or plan) which were due to temporary malfunctioning of GPS instruments or, for example, false echo reflections due to external causes.In addition, all quotes in the points of intersection between transversal sections and lon-gitudinal sections used as control are verified. This control allows verifying if a specific
Libro.indb 41 17/05/2013 14.41.09

42
Pranzini and Rossi Coastal erosion monitoring - A network of regional observatories
point surveyed at different times gives the same depth value.Using the due methodology, deviates may be ex-tremely low, even under 5 cm, and mainly due to echosounder errors and vessel oscillations that were hardly or not compensated at all (Fig 28).When verification is over, data are ready in their final version. Once the right corrections have been made, each section becomes linked to the surveyed parts of the dry beach and the submerged beach (down to the first echosounder data). Data must be verified in the overlapping points.
It is possible to project the points of each section on a straight line using specific algo-rithms. Graphs may then be obtained for sections of fictitious profiles that are precisely orthogonal (to have real slopes) or which overlap other data acquired on slightly different routes (Fig. 29).Points are usually resampled to reduce their number, allowing them to be represented on profiles or maps with their actual value (DTM/Digital Terrain Model).
MultibeamData acquired by the processor are rather rough and lack corrections, but quality controls are performed once they are transmitted through a serial or LAN cable to the acquisition software.Processing software are able to calculate total error for every single measurement, based on the errors estimated for every single sensor used (TPE). At the end of such calculations, all measurements not considered to be sufficiently accurate in the IHO Special Order sur-vey class (for hydrographical survey classification) are eliminated.Finally, the software produces a final report with the full statistics from the whole survey, where survey classes are highlighted for each measurement.
Figure 29 - Projection of two real routes (A and B) over a fictitious route, orthogonal to shore, for comparing purpouses and to obtain the real slope of the varying nearshore sections.
Figure 28 - Histograms of differences in abso-lute value of depths surveyed in route cross-ing points, according to 0.025 m classes.
Libro.indb 42 17/05/2013 14.41.09

43
ResMar Coastal erosion monitoring - A network of regional observatories
Data are filtered and only those that conform to IHO Special Order class are used in the production of digital models. Data acquired can also be later compensated according to the variation in sound speed along the entire water column, through a SVP instrument. Noise filters may also be applied.Bathymetric data are processed according to the following operative phases:
- processing and quality control; - creation of 3D models for data; - creation of contour lines; - preparation of final maps.
In most data processing software, modules are conceived to help operators identify even-tual problems, correct and remove errors and correlate in time all associated data records, calculating refraction corrections to determine the effective impact point of each acoustic “beam” on the seafloor.Data processing follows successive operative phases:
- Phase 1: the user can verify navigation routes, heave-pitch-roll information, tide, draft, and sound velocity information. Different filters can be applied in order to eliminate data that are not statistically valid, or which are of inadequate quality or come from non-established depths. It is also possible to apply a quality control filter, defined by the user. In addition, navigation routes can be modified; whereas tides can be recalcu-lated using adequate modules.
- Phase 2: Editing. The user can examine details of the seafloor using a specific viewer (Fig. 30). In this phase automatic geometric filters can be used to eliminate errors.
Figure 30 - Example of multibeam data editing.
Libro.indb 43 17/05/2013 14.41.09

44
Pranzini and Rossi Coastal erosion monitoring - A network of regional observatories
In addition, errors can be manually corrected and data may be viewed in different modes: tridimensional, longitudinal, or perpendicular to the route followed.
- Phase 3: Points are regrouped into cells, and statistic filters can be applied according to the distribution of “z” values in each cell. Specific filters can also be applied to elimi-nate vegetation and take the quote to the real bottom. This phase allows reducing data and creating the DTM according to the chosen cell – this is also function of the density of points. Data are then saved usually as x, y, z.
CalibrationCalibration is essential for the reduction of errors in instrumental data acquisition.It is necessary to make a proper distinction between calibration of the instrument and methodological calibration: this is able to correct the error caused by external factors, such as inadequate alignment of instrument or delay of data from the instruments. This can be improved due to a particular signal, the PPS (pulse per second) which has the function of aligning time between each single instrument and on-board bathymetric survey instru-ments.Instrumental calibration of navigation GPS, for example, compares instrument coordinates to those of benchmarks of known coordinates. Gyrocompass calibration corrects the angle with that from a topographic measure. Calibration of bathymetric instruments compares data to those that can be really measured using traditional techniques.Methodological calibration, on the other hand, compares bathymetric profiles acquired in opposite directions or at different velocity along the same route, especially where sudden changes in seafloor slope are present. This is essential for multibeam surveys, being often
disregarded in single beam surveys (where due to practical and economic reasons MRUs are neither required nor used).
Time delay calibration – This calibration refers to time delay, or the delay of position and depth data fusion; such an offset is de-termined using the same line in the same direction twice (Fig. 31). One of the two ac-quisitions must be performed at a reasonably higher velocity. Whenever a delay is verified to exist, both profiles should be longitudinally shifted; such shift, and thus the offset to be corrected, would be directly proportional to
the difference of velocity between the two profiles acquired.
Pitch calibration – Similar calculations apply to the offset to be used in pitch calibration. In this case the same line should be acquired in different directions, though at the same velocity. Offset is calculated according to the two longitudinal profiles acquired; in the case of offset, they will be longitudinally shifted. For appropriate offset determination it is advisable that those lines be surveyed in zones characterised by high seafloor slope or by evident outcrops.
Figure 31 - Multibeam time delay calibration.
Libro.indb 44 17/05/2013 14.41.09

45
ResMar Coastal erosion monitoring - A network of regional observatories
Roll calibration – For roll calibration the two lines acquired for pitch calibration can be used. However, in this case offset is determined by comparing the two transversal profiles acquired in the same point; offset will be determined from the angle eventually present between them.
Data restitutionOnce digital data have been acquired and processed, magnetic and optical support must be given. Data will be made available in different formats according to the instruments used and depending on the type of restitution required, such a Dxf, Txt, Shape, Asc, Seg-Y, XTF, GeoTiff, etc. Lists of benchmark coordinates, section vertices and their identification sheet are also produced.
CartographyFor cartographic restitution of bathymetric data, tables are prepared with the survey key map at different scales, presenting navigation lines, single beam position of bathymetric sections, quoted plan of points, Ground Control Points used, section vertices, isolines and isobaths at (usually) 0.5 m, position of eventual sampling points (Fig. 32).
Usually automatic processing software are used for drawing bathymetric lines. Due to the particular distribution of data, especially on parallel section surveys, automatic drawing may not prove to be adequate. Level curves are drawn after the DTM is created, which is often produced by triangulation of surveyed points. Due to the linear distribution of data, many software are not able to solve this problem, favouring the creation of triangles along transects instead of between transects parallel to the beach. Level curves are usually af-fected by this distribution and may have an unrealistic aspect. In addition to this trend (distribution mainly along transects), model calculations tend to
Figure 32 - Example of hydrographic chart in CAD.
Libro.indb 45 17/05/2013 14.41.10

46
Pranzini and Rossi Coastal erosion monitoring - A network of regional observatories
attribute to isobaths the indentations caused by different data weights, as acquired data are not homogeneous along the survey area. The problem becomes evident on sandy floors, where isobaths should have a smooth shape.Even if it may be possible to attenuate such characteristic (Fig. 33) by means of smoothing, the problem is often evident and a solution must be achieved by hand drawing.
Some software allow setting specific parameters to account for anisotropic distribution of points. This serves to direct choice towards the most adequate options according to the development of the coast. On straight coasts, results may be satisfactory at times - but very seldom when the coast is irregular or continuously variable, such as in small gulfs. Another problem is verified when there are coastal defence structures. In this case, if the survey is carried with parallel transects, even if closer points have also been surveyed, the lack of a sufficient number of data and the effective discontinuity of the seafloor often prevent correct isobaths from being drawn (Fig. 34).
Figure 33 - Automatic and manual (smoothed) interpretation of contour lines for a bathymetric SB survey.
Figure 34 - Example of the difficulty in interpreting contour lines near beach defence structures. Red (inter-polated), Blue (possibly correct).
Libro.indb 46 17/05/2013 14.41.11

47
ResMar Coastal erosion monitoring - A network of regional observatories
The problem of point interpolation is extremely complex. The manual of many software, such as Surfer® e Origin®, allow choosing the interpolation strategy even if the opera-tor does not know the issue deeply. However, this can lead to grotesque mistakes, which, fortunately, are quite evident in the case of bathymetric data.Deeper understanding of interpolation techniques will allow choosing the most adequate according to available data (density, homogeneity, anisotropy); it will also lead to better quality maps of the seafloor morphology.In any case, reconstruction of isobaths must always be corrected by hand and smoothed (Fig. 35).
A professional with high expertise in coastal geomorphology is required for that job - one who has preferably participated of the survey phase, so that eventual blanks generated by automatic processing may be correctly interpreted. In restitution of section profiles, tables are usually created in 1:1000 (horizontal), and 1:200 (vertical) scales. Vertical variations are put into evidence due to the 1/5 rapport, especially on low slope seafloors, such as sandy seabottoms. Progressive distances and the relative quote of each single point (Fig. 36) are informed.
Even the routes should be reported to the appropriate table.
Figure 35 - Automatic generation of contour line for a SB survey. Normal (a), smoothed (b). Golfo di Campo (Elba Island - Italy).
Figure 36 - Example of bathymetric profile.
a b
Libro.indb 47 17/05/2013 14.41.13

48
Pranzini and Rossi Coastal erosion monitoring - A network of regional observatories
Profiles are created from the projection of points surveyed along the routes over project lines. Alternatively, these can be derived from the DTM, generating points regularly spaced along the axe of the project profile, but will be associated to interpolated values (rather than original values).On full coverage surveys such as Lidar or multibeam, a DTM is created (Fig. 37) with a grid that is inversely proportional to the degree of accuracy obtained or required, from which it is possible to obtain 3D views. In this case distribution of points is rather more homogeneous: interpolation of points does not incur in the same problems as occurs for points surveyed along separate routes.
Data analysisIn this chapter we provide an example of data management for the evaluation of coastal erosion trends and the efficiency of defence strategies according to traditional coastal monitoring frameworks. Procedures may vary according to the typology of data acquired and the scope of the study.
Analysis of bathymetric chartsLevel curves (isobaths) are reported to bathymetric charts (with 0.25 - 1.0 m interval, ac-cording to survey accuracy). Important information on the survey area may be drawn from this chart. Dynamics and energy are deduced, for example, from the presence, number, position and morphology of submerged bars.Information on the efficiency of defence interventions is obtained according to the accu-mulation or erosion of nearby sediments. Isobaths may indicate reflection or low energy zones; channelling due to strong current flows at breakwater gaps for the reflow of water masses may also be evident after sea storms (Fig. 38).
Figure 37 - Multibeam 3D view.
Libro.indb 48 17/05/2013 14.41.14

49
ResMar Coastal erosion monitoring - A network of regional observatories
Analysis of shoreline evolutionFor shoreline evolution monitored with the scope of identifying erosion trends, one of the mostly used methods divides the coast into sectors, within which subaerial beach area variation will be measured; mean shoreline displace-ments are then calculated for the different time intervals.Data obtained will be time-normalised to calculate the mean shoreline displacement ratio (m/year) in the varying coastal sectors (Fig. 39).
Figure 38 - Greater depth out of the reef channel due to currents induced by piling-up behind the structures.
Figure 39 - Example of shoreline segmentation with different displacement rates (m/year).
Libro.indb 49 17/05/2013 14.41.15

50
Pranzini and Rossi Coastal erosion monitoring - A network of regional observatories
Graphs are then produced for com-paring evolution trends in the differ-ent periods; persistent accumulation or erosion conditions may then be verified (Fig. 40).Data from this graph will be summa-rised in an analysis table for shore-line displacement transition. Alterna-tively, as stated in the Introduction, a TBA may be performed; this is an extremely fast operation but proves inadequate for coasts characterised by cusps and defence structures.Generic software for digital vector-based drawing, such as Autocad©, or specific for GIS, such as Arcview©, are able to easily perform these op-erations. Alternatively, other soft-ware are designed ad-hoc, as Digital Shoreline Analysis System (DSAS; Thieler et al., 2009), which is free for download from the United States Geological Survey website.
Variations in beach morphologyFor detailed coastal evolution analyses, data from previous surveys are also investigated and adapted to recently acquired data, allowing them to be compared. The following information must be known for all surveys: data acquisition mode, reference quote, accuracy of each single measurement, and eventual interpolation and extrapolation method applied, especially when only isobaths (and not points) are available. For older data, such as those from Istituto Idrografico della Marina, it is important to obtain the
“scanning graphs”, much richer in points than the nautical charts that derive from them (Fig. 41).Accuracy heterogeneity, both ba-thymetric and planimetric, is usually present on surveys carried out at different times. One of the reasons for that is the evolution of instru-ments used.Consistent variations in seafloor morphology offshore from the es-timated closure depth may indicate that some documents should not be used.
Figure 40 - Example of comparison between evolution trends of varying sectors along the different time intervals analysed. Sectors that maintain their evolution trend are located on the 1° (++) and 3° (--) quadrants; Sectors that have changed from accretion to erosion conditions (+-) are found on the 2° quadrant whereas those that changed from erosion to accre-tion (-+) are located on the 4° quadrant.
Figure 41 - Part of scan graph no. 8362 from 1976 (Calam-brone) in 1:25.000 scale (left) and nautical chart no. 120 from Istituto Idrografico della Marina Militare (Livorno coast) in 1:25.000 scale derived from the same graph. 150% image en-largement.
Libro.indb 50 17/05/2013 14.41.15

51
ResMar Coastal erosion monitoring - A network of regional observatories
It is important that the same operators work with the same instruments in all surveys car-ried out within a monitoring plan. Volumetric variations of subaerial and submerged beach are calculated for the area under survey; coastal segments that have undergone interventions or that present defence struc-tures are considered separately. In terms of time, monitoring should consider time intervals according to the date when that protection work was built or executed, to avoid mixing periods with different trends caused by different factors.Profiles from differences periods are compared (Fig. 42), to verify the “closure” of profiles and analyse variations in form, bar position, and slopes along the profile.
Using all profiles surveyed, it is possible to calculate volumes by applying the cross-section method, avoiding interpolation problems between different survey lines.It is important to note that profiles are most often drawn with a certain vertical exag-geration (often 1:5 or 1:10) and that some calculation procedures may “disregard” such an aspect.Thanks to specific software, in addition to planimetric and 3D representation of the sea-floor, it is also possible to compare “survey pairs” and the corresponding volume calcula-tion for the whole sector or for pre-determined sectors (Fig. 43). This may be represented using colour maps, where the different depth variation intervals are identified.
Figure 42 - Comparison of different beach profiles.
Figure 43 - Bathymetric variation chart.
m
Libro.indb 51 17/05/2013 14.41.16

52
Pranzini and Rossi Coastal erosion monitoring - A network of regional observatories
For accumulated/eroded sediment volumes it is important to note how accuracy of each survey may significantly influence the results. If the accuracy of each survey is estimated in 10 cm, comparison between two surveys may generate a variation of 20 cm in depth for a stable point. Along extensive areas, this thickness may lead to apparent volumetric vari-ations of hundreds of thousands of cubic meters. Along one kilometre of beach length a volume of 200.000 m3 is estimated, which amounts to a small nourishment. This aspect should be duly considered in graphical representation, where the inaccuracy range should be clearly represented. In Figure 44 areas where depth variation is smaller
Figure 44 - Comparison of hydrographical surveys for Cavo beach monitoring (Elba Island – Italy). Note the short colour scale range (20 cm).
Libro.indb 52 17/05/2013 14.41.18

53
ResMar Coastal erosion monitoring - A network of regional observatories
than comparison accuracy are represented in white; the chromatic scale defines 0.5 m in-tervals, to indicate the confidence interval used in the comparison. However, calculations of eroded/accumulated volumes cannot take this aspect into account and even small vari-ations will influence the global value.
When data from such a comparison are interpreted, it is important to take into considera-tion all the procedures adopted during the survey and in the processing phase; this allows conclusions to be compatible to the accuracy of the information available.Errors from data acquisition or processing may sometimes occur in this phase, such as larger or smaller bathymetric variation along stripes orthogonal to the beach (often due to the effect of “Time delay”) or parallel to the shore (at the point of contact with land- and sea-based surveys). Such problems are evident when the interval of variations used equals or overcomes the interval of comparison accuracy.Usually, the major morphological variations are those associated to cross-shore migration of bars, which determines deepening and accumulation sites that develop almost parallel to the coast. Although such displacements should in theory compensate, they constitute the most important bathymetric variations for surveys that are repeated at a reasonably short time interval; they make the “effective variations” (which are of interest to us) much less significant.
ConclusionsMonitoring the morphological evolution of the coast is an essential phase within the ICZM framework and should be put into practice with strong determination (and allocation of the appropriate resources) by public administration agencies in charge of land planning and protection. It can be set to evaluate its “state of health” or to analyse the beach re-sponse to defence strategies such as structures or artificial renourishment. The cost of monitoring is many times smaller than the value of the beach itself or the cost of defence projects; in spite of that, until recently it had hardly been put into place.Our coasts are full of defence structures, all built separately and disconnected from an organic project. They have been often modified, removed or enlarged because the ex-pected effect would not materialise. However, at the time there was no availability of data to understand the reason for such malfunctioning and to guide the optimisation of works.In the past, monitoring meant a single survey of the coast; there was no articulated plan, nor were new and historical data compared and interpreted by experts.If monitoring is well set and well executed, it may highlight eventual negative responses of the coast, preventing problems from reaching insurmountable levels, from both an eco-nomic and technical point of view. Good quality monitoring may prove to be useful in legal battles between the contracting agency and the contractor responsible for the execution of defence works. Stakeholders also benefit from it, as an updated and objective picture of the “health state” of the coast can be obtained. This can identify the high or low efficiency of the projects developed.Reliable data, obtained with shared methods, will allow results from different areas to be compared. The need for interventions (and financing) in the different levels (municipal and regional) can also be correctly evaluated, so that resources may be transparently and objectively allocated.
Libro.indb 53 17/05/2013 14.41.18

54
Pranzini and Rossi Coastal erosion monitoring - A network of regional observatories
It is important to note that data produced in monitoring allows researchers to deepen knowledge in this field: if the cost of surveys is minimal in the scale of defence structure values, it can very seldom be bore by normal research funds. In the case of Tuscany, there has always been an important collaboration between universi-ties and public agencies in charge of coastal studies. This illustrates how such a rapport can produce innovative research that is internationally recognised. Many foreign researchers are indeed attracted to our coasts.The creation of the Regional Centre for the Study of Coastal Dynamics (Centro regionale per lo Studio della Dinamica dei Litorali/CreStDiL), merging research and staff from coastal Tuscan provinces and universities, meets such demand for data acquisition and sharing; Project ResMar allowed the Centre to be consolidated and extended into a wider territory of action.
ReferencesAlbani D., (1933) - Ricerche sulle variazioni delle spiagge italiane: Indagine preventiva sulle
recenti variazioni della linea di spiaggia della coste italiane. Anonima Romana Edito-riale 25 pp.
Aminti P. et al., (1999) - L’accuratezza dei rilievi batimetrici per il monitoraggio del volume di spiaggia. Studi Costieri Vol.1.
Boak E.H. and Turner I.L., (2005) - Shoreline Definition and Detection: A Review. Journal of Coastal Research 21 (4) 688–703.
Cappietti L., Cammelli C., Farrell E. , Ferri S., Aminti P.L. e Pranzini E., (2003) - A case of updrift erosion induced by a harbour breakwater. Medcoast 2003, Ravenna, pp. 1707-1718.
CNR, (1997) - Atlante delle Spiagge Italiane. Scala 1:100.000. S.El.Ca, Firenze.Commissione De Marchi, (1970) - Commissione Interministeriale per lo Studio della Sis-
temazione Idraulica e della Difesa del Duolo. Atti della Commissione, Relazione con-clusiva 1970. Capitolo VII - Difesa dal mare dei territori litoranei, a cura del Presidente della sottocommissione, Guido Ferro, pp. 513-562.
De Filippi G.L., Duchini E., Pranzini E., (2008) - Closure Depth estimation along the Tuscan coast aimed at short and long term coastal monitoring. In: Beach Erosion Monitoring, a cura di E. Pranzini e L. Wetzel, BeachMed-e/OpTIMAL Project, Nuova Grafica Fioren-tina, Firenze, pp 33-50
GNRAC (2006) - Lo stato dei litorali italiani. Studi costieri, 10: 3-174.Goldberg E.D., (1994) - Coastal Zone Space: Prelude to conflict? UNESCO, Paris.http://annuario.isprambiente.it/content/schedaindicatore/?id_ind=1964&id_
area=A04&id_tema=T17International Hydrographic Organization (IHO), (2008) - IHO Standards for Hydrographic
Surveys, 5th Edition, Special Publication No. 44 (S-44), International Hydro-graphic Bureau, 27 pp.
ISPRA (2009) - Annuario dei dati ambientali. http://www.isprambiente.gov.it/it/pubblica-zioni/stato-dellambiente/annuario-dei-dati-ambientali-edizione-2009.
ISPRA, (2010) - Annuario dei dati ambientali, Edizione 2010.Milli M. e Surace L., (2011) - Le linee della costa. Definizioni, riferimenti altimetrici e modalità
di acquisizione. ALINEA Editrice, Firenze.Nicholls R.J., (2002) - Rising sea levels: potential impacts and responses. In Hester R. e Har-
Libro.indb 54 17/05/2013 14.41.18

55
ResMar Coastal erosion monitoring - A network of regional observatories
rison R.M. Ed., Global Environmental Changes. Issues in Environmental Science and Technology, Royal Soc. of Chemistry, Cambridge, 17: 83-107.
Pranzini E. and Williams T. A. Eds., (2013) - Coastal erosion and protection in Europe. Rout-ledge, London, 468 pp.
Pranzini E., Simonetti D., (2008) - Beach evolution monitoring: Surface Variation Analysis vs. Transept Based Analysis. In: Beach Erosion Monitoring, a cura di E. Pranzini e L. Wetzel, BeachMed-e/OpTIMAL Project, Nuova Grafica Fiorentina, Firenze, pp 25-31.
ResMar, (2012) - Formulazione e sviluppo di indicatori sintetici idonei a descrivere lo stato ambientale e le tendenze evolutive dei litorali della Toscana e valutazione della loro idoneità. http://www.res-mar.eu/upload_docs/Attività%203.4.1.pdf
Stockdon H.F., Sallenger Jr. A.H., List J.H., and Holman R.A., (2002) - Estimation of shoreline position and change using airborne topographic lidar data. Journal of Coastal Research, 18(3), 502-513.
Thieler E.R., Himmelstoss E.A., Zichichi J.L., and Ergul A., (2009) - Digital Shoreline Analysis System (DSAS) version 4.0 - An ArcGIS extension for calculating shoreline change: Unit-ed States Geological Survey Open-File Report 2008-1278. Available online at http://pubs.usgs.gov/of/2008/1278/.
Libro.indb 55 17/05/2013 14.41.18

Libro.indb 56 17/05/2013 14.41.18

57
ResMar Coastal erosion monitoring - A network of regional observatories
The Corsican coastal monitoring network
Yann Balouin1*, Alexis Stépanian1, Rémi Belon1, Patrick Bezert2, Serge Calendini2, Gregory Bellini2
1BRGM Corsica, Immeuble Agostini, Z.I. de Furiani, 20200 Bastia, FranceTel. : +33 495 58 04 33, Fax : +33 495 30 62 10
2Office de l’Environnement de la Corse, Avenue Jean Nicoli, 20250 Corte, FranceTel.: +33 495 45 04 00 Fax : +33 495 45 04 01
E mail: [email protected]
AbstractThe littoral of Corsica is composed by rocky shorelines separating sandy beaches in a wide variety of environments: pocket beaches, open beaches, river mouth, lagoon inlets. This sandy coastline is suffering from coastal erosion and a coastal monitoring network was implemented at the end of the 90’s to quantify and understand this coastal retreat and provided the coastal managers with an information and prospective tool. Fifteen representative and regional sites are monitored annually to obtain quantitative indicators on coastal retreat and shoreface behaviour. Evolution of two sites, the Tavignano and the Taravo, is presented here to illus-trate the evolution observed and the new insight on coastal processes driving this evolution. The entire monitoring network permits to evaluate the state of the littoral zone of Corsica, to provide the scientific community with quantitative datasets on coastal evolution, and to anticipate coastal response and consequent management strategies. All results and gathered datasets are processed and share via a regional web-GIS tool in process that will permit to visualize and obtain metadata and data on the evolution of the Corsican sandy coast.
IntroductionThe littoral of Corsica suffers from coastal retreat due to both natural (decreasing sediment budget, storms) and anthropogenic (coastal urbanisation, coastal infrastructures) factors. In this very attractive area, such erosion trend may be responsible for important economic and/or environmental consequences. The development of coastal facilities in the past dec-ades aggravated the vulnerability of the coast to sea storms and their consequences in terms of coastal erosion and flooding.Within this context, BRGM and OEC (Office de l’Environnement de la Corse, with the sup-port of l’Agence de l’Eau Rhône Méditerranée & Corse AE RM&C), have initiated a pluri-annual programme to provide data for improving knowledge on coastal evolution and coastal processes as support to coastal management strategies.A monitoring programme has been developed in Corsica since 1999 by BRGM, OEC, AERM&C and the Conseil Général de Haute-Corse (CG2B) to evaluate erosion processes on
Libro.indb 57 17/05/2013 14.41.18

58
Balouin et al. Coastal erosion monitoring - A network of regional observatories
the sandy beaches of the island. This program, called Réseau d’Observation du Littoral de la Corse (ROL), is based on the monitoring of « regional » sites which are representa-tive of natural coastal evolution and “sensitive” sites where critical evolution of the coast currently threatens economic issues.ROL has three main objectives:
- to promote coastal evolution monitoring, in order to provide reliable data for char-acterising coastal changes and sediment budget;
- to be an information tool, able to gather and share the information and knowledge acquired;
- to be a prospective tool, to anticipate important coastal evolution events and pro-vide stakeholders with information to facilitate the decision-making process.
Fifteen sandy beaches are currently being monitored in Corsica as part of ROL. This in-cludes pocket beaches, open beaches, coastal barriers, and river outlets presenting a wide range of geological or morphological settings: gravel to fine sand, dissipative to reflective beaches, barred coast, as well as urbanised and natural shorelines. Survey of these areas is carried out once a year (Palvadeau and Nay, 2002, Durand et al., 2003, 2004 ; Balouin et al., 2005a, 2005b, 2006a, 2006b, 2007a, 2008, 2009 ; Stépanian et al., 2010).The network provides stakeholders with comprehensive, representative monitoring of coast-al evolution and allows more sensitive sites to be integrated, if requested by local/public administrations. This was the case of Porticciolo and Tavignano, two sensitive sites that are surveyed by the Conseil Général de Haute-Corse (Balouin et al., 2005a, 2006a, 2007b, 2008; Stépanian et al., 2009, 2010, 2011). In 2012, two additional sites were surveyed by the Com-munauté d’Agglomération du Pays Ajaccien: the beaches of the Gulf of Ajaccio and Lava.
Data acquisition and processingThe monitoring network of Corsica is mainly focussed on data acquisition at representative and sensitive sites. “Representative” or “regional” sites are beaches which present morpho-logical features common along the coastline of Corsica, allowing the global state of Corsican shores to be analysed. “Sensitive” sites are beaches marked by coastal erosion and where coastal infrastructure or environmental assets are currently exposed. Fifteen sites are pres-ently being surveyed on a yearly basis. That represents approximately a 45 km-long shore-line, and includes approximately 33 topographic/bathymetric profiles (Tab. 1 and Fig. 1).
Table 1 - Sites monitored within ROL. Remarks: local settings and main issue at sensitive sites. PP: number of beach profiles per beach. TC: coastline length. In bold, sites where surveys started after 2002.
Sites Dept. Remarks PP TC
Regional sitesTARAVO-TENUTELLA 2A Sand and pebble 2 3 km
GALERIA 2B Sand and pebble 2AREGNO 2B High energy coastline (pebble) 2BALISTRA 2A Sand spit 2 1 kmALISTRO 2B Sandy coast 2 8 km
PALU POND 2B Coastal barrier 2 3 kmLIDO OF MARANA 2B Coastal barrier 2 16 km
Libro.indb 58 17/05/2013 14.41.19

59
ResMar Coastal erosion monitoring - A network of regional observatories
Sensitive sites
CAMPOLORO NORD 2BEroding sandy beach (interception of littoral drift
by the harbour of Taverna)2 5 km
CAMPOLORO SUD 2BAccreting sandy beach (interception of littoral drift
by the harbour of Taverna)2 2 km
CALVI 2B Eroding sandy beach + breakwaters 2 3 km
SANTA-GIULIA 2AEroding coastal barrier
with exposed coastal facilities2 2 km
SAGONE 2A Eroding sandy beach with facilities 3 1 km
PORTIGLIOLO 2A Eroding high energy sandy beach 2 3 km
TAVIGNANO 2B Eroding sandy beach, river mouth 3 4 km
PORTICCIOLO 2B Eroding sandy beach with exposed coastal road 3 0,4 km
TOTAL 15 33 ~ 45 km
Figure 1 - Sites monitored within ROL in 2010.
Libro.indb 59 17/05/2013 14.41.20

60
Balouin et al. Coastal erosion monitoring - A network of regional observatories
Morphological indicatorsThe complete morphological characterisation of Corsican coastal zone is time-consuming and would require significant budget. In this context, and after an analysis of erosion haz-ards along the entire Corsican coastline, two main morphological indicators were selected to be used in the analysis of coastal evolution (figure 3):
- Cross-shore topographic and bathymetric profiles; - Shoreline and dune toe surveys.
Topography surveys are carried out in dry beach areas using a kinematic DGPS TRIMBLE R6 with an accuracy of a few centimetres. Bathymetry surveys of the shoreface are performed with a single-beam echo sounder TRITECH installed on a zodiac whose high frequency acquisition is coupled in real time with kinematic DGPS, using HYPACK software. Accuracy of bathymetry measurements is approximately 10 cm. Simultaneous measurements of to-pography and bathymetry allow obtaining a complete profile from the dune system (if present) to 10 m water depth.
Longshore surveys are undertaken using a RTK GPS deployed on a quad or carried by the operator (depending on local morphology). Two indicators are used:
- Swash zone (or berm of the lower beachface) that corresponds to the mean shoreline (in absence of tidal range) ;
- Dune toe (or the lower limit of vegetation).
These two lines delimit the active area of dry beach under wave action and indicate beach
Figure 2 - Sites monitored within ROL.
Libro.indb 60 17/05/2013 14.41.22

61
ResMar Coastal erosion monitoring - A network of regional observatories
Figure 3 - Methods used within the ROL monitoring program. a: typical Corsican beach profile ; b : Dry beach monitoring ; c: Shoreface monitoring ; d: Shoreline and dune toe monitoring.
Libro.indb 61 17/05/2013 14.41.22

62
Balouin et al. Coastal erosion monitoring - A network of regional observatories
width which is also an important parameter to evaluate the sensitivity to both long term erosion trends and storm events. The accuracy of these surveys depends on how the oper-ator interprets beach morphology rather than being linked to GPS accuracy; only changes in shoreline position of 5 m or above are considered to be significant.From a morphological point of view, the berm of the lower beachface is similar to the mean shoreline detected on past or recent aerial photographs (SHOM and/or IGN). Past shore-line positions from 1948 to 1996 were analysed in the 90’s (Oliveros, 1998 ; Oliveros and Delpont et al., 1998, 1999 ; Oliveros et al., 1996 ; 1998) for the entire coastline of Corsica. Their use together with ROL surveys allow long term erosion trends to be assessed. All datasets correspond to the national coordinate system Lambert 93. The altimetric refer-ence used is the Zero NGF (Nivellement Général de la France, IGN78) that corresponds to the mean sea level measured at the harbour of Ajaccio.The coastal evolution analysis is performed using several techniques to obtain both vol-ume and spatial variations of erosion/accretion areas.
Figure 4 – Example of cross-shore profile analysis at the site of Alistro Sud: Altimetric variations along the cross-shore profile (top) and comparison of successive cross-shore profiles (bottom).
Libro.indb 62 17/05/2013 14.41.25

63
ResMar Coastal erosion monitoring - A network of regional observatories
The analysis of morphology evolution (trends, topographic and volume variations) is per-formed using SURFER© (Golden Software Inc.). The methodology developed allows the following parameters to be obtained and analysed:Altimetric variations between successive surveys that give the magnitude of evolution and indicate eventual sediment transport from one part of the profile to another, or from one profile to the other;Volume variations computed for the entire profile, for dry beach and shoreface. The vol-ume is expressed in m3/m ;Shoreline displacement derived from the intersection between beach profiles and mean sea level (zero NGF). This information is particularly important to understand the processes involved in shoreline displacement at a larger spatial scale.An example of cross-shore profile analysis is given in figure 4.
Lidar surveyIn addition to these yearly morphological indicators, a complete Digital Terrain Model (DTM) of the eastern Corsican plain was produced in 2010 using Lidar techniques (Light detection and ranging). Recent developments of these techniques have allowed surveying a wide range of coastal environments (Revell et al., 2002 ; Sallenger et al., 2003, White & Wang, 2003) and improved the understanding of coastal morphology evolution (Stockdon et al., 2002 ; Gares et al., 2006, Deronde et al., 2006, Balouin & Heurtefeux, 2007).Hydrographic Lidar can be used in shallow waters to perform bathymetric surveys (Guen-ther et al., 2000). In the 90’s, the first operational systems were deployed in Australia (LADS) (Setter & Willis, 1994 ; Nairn, 1994), in the USA (SHOALS) (Lillycrop et al., 1994, 1997) and in Sweden (Hawk Eye) (Steinvall et al., 1994). This technique is particularly adequate for surveys of large areas, up to 70 m water depth (more commonly, 3 times Secchi depth). Survey of the eastern plain was undertaken using the Hawk Eye system (operated by Blom Aerofilms). This system uses two laser wavelengths: one red (532 nm), reflected by the wa-ter surface, and one green (1064 nm), which penetrates the water column and is reflected by the seafloor (figure 5). Even if the technique is known to be highly limited by water turbidity, sea surface agita-tion and algae blooms, tests operated along the Corsican coastline proved to be very successful, and high detail bathymetric measurements were obtained up to approxi-mately 20 m water depth. After a first evaluation in 2006, the survey of the entire coastal plain of Corsica was launched in March 2010. The main objectives were to obtain complete and very accurate altimetric measurements of both coastal topography (including dune systems) and bathymetry up to 10 m water depth.
Figure 5 - Principle of hydrographic Lidar.
Libro.indb 63 17/05/2013 14.41.25

64
Balouin et al. Coastal erosion monitoring - A network of regional observatories
The density of points obtained was: - 8 points per 5*5 m² in bathymetric surveys; - 6 points per 1*1 m² in topographic surveys.
The validation of this dataset by classical field surveys (using GPS) indicates that the mean standard deviation of the survey is approximately 20 cm.A DTM and a DEM were produced from these highly accurate datasets (see figure 6).
Figures 7 and 8 illustrate the results obtained during this Lidar survey on several areas of the eastern coastal plain. Coastal infrastructure and nearshore morphology can be clearly observed in these DTMs. One particular point of interest was the characterisation of coastal morphological features. Well-developed nearshore bars were identified, presenting an im-portant longshore variability and a large sediment volume. Nearshore deltas are also well identified, which allows their role in the sediment budget to be assessed (Golo and Tavig-nano and Solenzara rivers mouths, see figures 7 and 8).
Figure 6 - Example of DTM (left) and DEM (right) obtained in the area of Solenzara. The digital models are covered by the Orthophoto (© IGN 2007).
Libro.indb 64 17/05/2013 14.41.25

65
ResMar Coastal erosion monitoring - A network of regional observatories
Figure 8 - Examples of Digital Terrain Models in the area from Tavignano river mouth to the inlet of Diane lagoon (left) and at the harbour of Solenzara (right).
Figure 7 - Examples of Digital Terrain Models in the area of La Marana (left) and at the Golo river mouth (right).
Libro.indb 65 17/05/2013 14.41.26

66
Balouin et al. Coastal erosion monitoring - A network of regional observatories
Photography databaseIn order to obtain a more quantitative evaluation of coastal evolution, including changes in both human and environmental assets, a photographic database was implemented. This database contains information on beach surveys (wave and weather conditions), as well as on beach management projects and storm impacts, particularly useful for understanding the evolution factors dominant at each site.
Coastal evolution since the beginning of ROLROL was launched in 1999, when beaches were selected for monitoring (Palvadeau and Nay, 2000); for most sites, surveys have been conducted since 2001-2002.In the following section, evolution of two sites which are particularly representative of coastal dynamics in Corsica will be presented: the beach of Taravo and the beach of Tavig-nano at Marina d’Aleria. An analysis of evolution trends on the Corsican shoreline will follow.
Evolution of Taravo beachThe beach of Taravo- Tenutella is located at Serra-di-Ferro and Olmeto (figures 9 and 10) in the Gulf of Valinco. This large sandy pocket beach is cut by Taravo river mouth. This area is considered to be a « regional site », sensitive to natural hazards and exposed to hydrodynamic conditions from West and SouthWest. Taravo is a small river with a very steep basin of 331 km², and can be characterised by flash floods, such as the one from 1996, able to feed the coast with a significant amount of sediment. The river outlet is highly dynamic and migrates laterally follow-ing the littoral drift (figure 10). The river enters the sea with an incised valley; the canyon head is located at a few hundred meters from the shoreline.
Figure 10 - Historic aerial photographs of Taravo beach illustrating evolution in the past decades (orthopho-tos © IGN).
Figure 9 - Location of Taravo beach in the Gulf of Valinco.
Libro.indb 66 17/05/2013 14.41.27

67
ResMar Coastal erosion monitoring - A network of regional observatories
The main assets in the area are Natura 2000 wetlands, in the Northwestern part of the beach, and an urbanised area at Olmeto, in the Southeastern part of the bay.Two cross-shore profiles have been monitored since 2001 (figure 11): one on the northern part of the bay, and one in front of the river mouth. Shoreline position has been monitored since 2009, following a storm event in 2008 that indicated longshore variability of morpho-logical impacts by storms.The analysis of historical photographs from 1951 to 1996 demonstrated high variability in shoreline position, erosion trend in the northern part of the bay, dynamic equilibrium in the river mouth area and shoreline accretion in the Southeastern area. However, in the past decade, this apparent historical transfer of sediment from NW to SE seemed to decrease, in favour of general retreat between 1996 and 2009 (figure 11). Moreover, in spite of its high variability, migration of the river mouth during the past years suggests a SE to NW longshore transport, thus contrasting to the historical trend.The beach is very narrow (below 20 m width) with a low-lying dune system (see figure 12). The shoreface slope is very low (around 2%) up to 600 m offshore, where it increases sharply
to reach 15%, leading to water depths over 30 m. On profile S, in front of the river mouth, this rup-ture in shoreface slope is situated 300 m offshore. In the northern area, the dry beach presents a very concave shape, a slope of about 20% and 20 m width. In the southeast, the beach is wider and the sand volume, associ-ated to the river spit, is much more important.
Evolution in these two areas is not driven by the same processes (figure 12). In the NW part, beach profile evolution indicates the role of storm events in evolution (figure 13). The dune front is retreating, associated with sand deposition in the nearshore. Since 2002, re-treat of the dune front has been low but progressive, and no recovery has been observed. Shoreline retreat between 2009 and 2010 was particularly important (8 m, figure 12). In the SE part of the beach, the berm volume is important, and no significant trend has been ob-served since 2002. Evolution in the South is more balanced; the beach has marked natural rebuilding capacity but presents large retreat at the dune toe, due to winter storm impacts which play an important role in beach evolution.
Evolution of nearshore bathymetry in front of Taravo river mouth (figure 15) indicates loss of sediment in the nearshore (between 0 and -6 m), but also shows the development of an accretionary prism in the old Taravo canyon. A significant amount of sediment was ap-parently transferred to the canyon and deposited in water depths between -20 and -30 m.
Figure 11 - Location of beach profiles at Taravo, and shoreline evolution from 1996 to 2009.
Libro.indb 67 17/05/2013 14.41.27

68
Balouin et al. Coastal erosion monitoring - A network of regional observatories
Figure 13 - Storm impacts on Taravo beach. 2000 (left), 2008 ( right).
Figure 12 - Evolution of Taravo beach profiles from 2002 to 2010, N (left) and S (right).
Libro.indb 68 17/05/2013 14.41.27

69
ResMar Coastal erosion monitoring - A network of regional observatories
The reason for this accumulation in the canyon is not fully understood yet. However, the main hypothesis is the direct transfer from the Taravo river basin to the nearshore during flash floods. This could lead to absence of sediment supply to the shoreline during such events and to the probable loss of coastal sediment by the breaching of the sand spit that closes the river mouth.
TavignanoThe Tavigano river mouth and its adjacent shoreline represent an erosion hotspot along the eastern coast of Corsica (Figure 16). This 4 km-long sandy stretch has been affected by chronic shoreline retreat for 50 years. In order to investigate and quantify this phenom-enon and prevent it from affecting tourist assets, this site was integrated to the Corsican Coastal Monitoring Network in 2001.
Shoreline retreat between 1948 and 2007 ranges from 60 m to 100 m in this area (Stépa-nian et al., 2011).
Figure 14 - Erosion in front of the urbanised section (Tenutella beach).
Figure 15 - Evolution of nearshore bathymetry in front of Taravo river mouth.
Libro.indb 69 17/05/2013 14.41.28

70
Balouin et al. Coastal erosion monitoring - A network of regional observatories
Data Three topographic/bathym-etric profile surveys are con-ducted on a yearly basis to explore cross-shore altimet-ric variability of beach mor-phological features (dune, beachface, berm, submarine bars) (Fig. 17): 1) central pro-file on Padulone beach (since 2001), 2) Northern profile on the sandy spit between the inlet of Diane lagoon (since 2008) and 3) Southern profile close to Tavigano river mouth (since 2008). Shoreline and dune toe position are also surveyed by RTK DGPS to de-termine longshore beach dy-namics on this timescale.
Figure 17 - Location of topograph-ic/bathymetric profile surveys at Tavignano (©IGN-SCAN25). DGPS monitoring concerns the section between Tavignano river mouth and the inlet of Diane lagoon.
Figure 16 – Coastal erosion trends at Tavignano. a) Beach restaurants endangered by shoreline retreat (Oc-tober 2007); b) Engineering solutions executed to protect a camping site and economic activities on the backshore (September 2010).
Libro.indb 70 17/05/2013 14.41.28

71
ResMar Coastal erosion monitoring - A network of regional observatories
Main cross-shore profile evolution since 2002The cross-shore profile (figure 18) allows morphological features to be characterised, as well as their evolution. It can be divided in three parts:
- The backshore-dry beach system, with vertical dune front, steep beach-face, and epi-sodic presence of a low berm close to the water-line;
- Inner shoreface, from the shoreline to 5 m water depth, with several nearshore bars. Three bars could be observed in 2011 (figure 18): the inner bar (Zc=-1m), the outer bar (Zc=-5m), and a low-amplitude bar which developed in an intermediate location (Zc=-4 m);
- The outer shoreface, from 850 m to 1500 m seawards, where the seafloor is charac-terised by chaotic bathymetry corresponding to rocky outcrops and Posidonia sea-grasses. Variability of the profiles in this area therefore does not reflect evolution of the seabottom.
During the 2002-2011 period, profile evolution (figure 18) indicates important stability of both outer and inner shoreface areas. The recent evolution (2010-2011) is character-ised by the development of a low amplitude intermediate bar, stability of the inner bar and a significant positive evolution of the dry beach concomitant to a +11 m shoreline accretion.
Figure 18 - Main cross-shore profile variability since 2002. Entire profile from dune to Posi-donia seagrass and zoom on short profile of beach-shoreface system.
Long-shore morphological variabilityMonitoring this area since 2002 allowed the contrasting evolution of northern and south-ern parts to be characterised.In the northern part, a clear rhythmic behaviour was observed (Stépanian et al., 2009, 2010). There are “nodes” where evolution is very limited (below 10 m), and intermediate areas where successive erosion/accretion phases are observed with an amplitude reaching 40-50 m (figure 19). The successive erosion/accretion phases have approximately the same
Libro.indb 71 17/05/2013 14.41.28

72
Balouin et al. Coastal erosion monitoring - A network of regional observatories
amplitude, resulting in a comprehensive medium term «dynamic stability». This behaviour is clearly associated to the presence of rhythmic nearshore bars (figure 8) presenting a cus-pate shape. The shoreline is stable in front of the bar horns, while oscillations are observed in front of the bay. In the southern part of the site, a very different behaviour is observed. Here, the shoreline has been retreating very rapidly, with mean erosion rates near the river mouth reaching 10 m/year. Even if the processes involved in this accelerated retreat are not fully under-
Figure 19 - Shoreline evolution at Tavignano evidenc-ing the contrasting behaviour of northern and south-ern parts. Black arrows indicate nodes where erosion is limited, while red arrows indicate the very high erosion rates in the south.
Libro.indb 72 17/05/2013 14.41.32

73
ResMar Coastal erosion monitoring - A network of regional observatories
stood, the relationship with the river mouth and river delta is obvious. In this area the mean longshore drift is towards N, but wave refraction on the cuspate delta results in a localised southward longshore transport immediately north of the mouth. The subsequent divergence of sand transport directions increases the erosion trend in this particular area of high tourist value. Synthesis of Coastal Evolution in CorsicaThe examples of beach evolution at Taravo and Tavignano illustrate the complexity of coastal dynamics in Corsica. Evolution is driven by oceanographic factors (wave heights, storm events), but may also be caused by local factors including degree of exposure to the dominant wave climate, presence or absence of nearshore morphological features, decrease in sediment supply caused by natural or anthropic interception of longshore drift. This results in different behaviours occurring along the Corsican shoreline (table 2 and figure 20).Several areas can be considered to be stable. This does not mean that inter-annual dy-namics are absent. In several places, oscillation in shoreline position from one year to the other can reach 50 m following a storm event, but at decadal timescale, recovery processes exist and the mean erosion rate remains very low. Monitoring these sites is particularly important to fully understand the inter-annual variability and impacts caused by coastal hazard events. These often have high environmental and/or tourist value that can be affected by the rapid winter erosion, even if the shoreline is reasonably stable at decadal time scale.Some specific areas present moderate erosion trend. These beaches are usually exposed to dominant storm waves (Balistra, Portigliolo). Here, evolution can be very rapid and lead to significant erosion, followed by recovery periods that limit the medium term trend. This is valid for instance in the case of Porticciolo, where the medium term trend is moderate but the coastal road has already been impacted by storms (in 2003).Other areas are retreating very rapidly. Their evolution is usually driven by the intercep-tion of longshore transport, which can be caused by natural (river mouths, as Tavigano) or anthropic ( jetties at Campoloro harbour) factors. In specific places, as Taravo, other processes such as seaward sediment transport might be involved, explaining poor beach recovery, and the increasing risk faced by environmental and human assets.
Table 2 – Evolution of coastal areas monitored within ROL.
Coastal evolution Short term (annual) Medium term (decadal)
Stable/AccretionTaravo-Tenutella N, Galeria,
Aregno, Sagone, Campoloro S, Balistra, Palu, Porticciolo
Taravo-Tenutella S, Galeria, Aregno, Sagone, Tavignano N,
Campoloro S, Alistro, Palu, Santa Giulia
Low erosionCampoloro N, Alistro, Calvi,
Santa GiuliaCalvi, Porticciolo,
Campoloro N, Balistra
Moderate erosionTaravo-Tenutella N,
Portigliolo S, MaranaSevere erosion Taravo-Tenutella S Tavignano S
Libro.indb 73 17/05/2013 14.41.32

74
Balouin et al. Coastal erosion monitoring - A network of regional observatories
Figure 20 – Synthesis of coastal evolution in Corsica.
A regional Centre for data acquisition, processing and distributionThe coastal monitoring network of Corsica produces an important amount of data includ-ing those produced by GPS surveys, Lidar soundings, DTM and DEM, photographs, and hydrodynamic models outputs.One of the main objectives of ROL is to acquire, gather and share all this information to promote better understanding of coastal processes and the creation of more integrated coastal management strategies. The development of a specific web tool was launched in 2010 within this context.A feasibility study was undertaken to define the needs and objectives of such tool, the type and format of datasets, and the interoperability of metadata required.A workshop carried with stakeholders defined the main objective of the web tool. It was set
Figure 21 - Example of webGIS that is currently being developed for viewing and sharing data gathered by ROL.
Libro.indb 74 17/05/2013 14.41.32

75
ResMar Coastal erosion monitoring - A network of regional observatories
as promoting public information on the actions developed to support management strate-gies, with special regard to the improvement of knowledge on coastal evolution and risks in Corsica. The web tool, temporary called PROLiCo, will allow the public to access scientific information gathered within ROL. An interactive map will give access to the database and views of coastal evolution. Metadata will be available online, and databases will be avail-able after agreeing on the use of such data.PROLiCo will contain the following functionalities:
- Management of contents (news, synthesis of actions and results); - Cataloguing of metadata (interoperable xml according to INSPIRE Directive); - Online cartography (webGIS, spatial research of metadata).
The development is still in progress; figure 21 indicates the format of the webGIS that will be available online in the next few months. ReferencesBalouin Y., Palvadeau E., et Bodéré G. (2005a) - Réseau d’observation du littoral de la Corse.
Sites sensibles à évolution forte et problématique. Note d’avancement. Lecture et ex-ploitation des données des sites du Tavignano et de Porticciolo. Année 2005. Rapport BRGM/RP-54259-FR., 34 p., 15 ill.
Balouin Y., Palvadeau E., et Bodéré G. (2005b) - Réseau d’observation du littoral de la Corse. Rapport d’observation 2004. Rapport BRGM/RP-54016-FR, 160 p.
Balouin Y., Palvadeau E., et Bodéré G. (2006a) - Réseau d’observation du littoral de la Corse. Sites sensibles à évolution forte et problématique. Rapport d’avancement, année 2006. Rapport BRGM/RP-54997-FR, 37 p.
Balouin Y., Palvadeau E., et Bodéré G. (2006b) - Réseau d’observation du littoral de la Corse. Rapport d’observation 2005. Rapport BRGM/RP-54647-FR, 153 p., 107 ill.
Balouin Y., Palvadeau E., et Bodéré G. (2007a) - Réseau d’observation du littoral de la Corse. Rapport d’observation 2006. Rapport BRGM/RP-55617-FR, 143 p., 102 ill.
Balouin Y., Palvadeau E., et Bodéré G. (2007b) - Réseau d’observation du littoral de la Corse. Sites sensibles à évolution forte et problématique. Rapport d’avancement, année 2007. Rapport BRGM/RP-55931-FR, 31 p.
Balouin Y., Palvadeau E., et Bodéré G. (2008) - Réseau d’observation du littoral de la Corse. Sites sensibles à évolution forte et problématique. Rapport d’avancement, année 2006. Rapport BRGM/RP-56849-FR, 51 p.
Balouin Y., Palvadeau E., Bodéré G., et Hennequin, V. (2009) - Réseau d’observation du littoral de la Corse. Rapport d’observation 2008. Rapport BRGM/RP-57521-FR, 153 p., 111 ill.
Balouin Y., Belon R., Lamy M. et Bodéré G., (2011) - ROL : Etude complémentaire sur l’impact des tempêtes sur le littoral de la Plaine Orientale de Corse. Cartographie de la sub-mersion marine, de la sensibilité à l’érosion côtière et de l’exposition des enjeux. RP-59724-FR, 39 p. + volume cartographique.
Delpont G., et Oliveros C. (1999) - Littoral oriental corse : évolution du trait de côte de 1948 à 1996 de Bastia-Furiani à Cervione et de l’embouchure du Travo (Solaro) à Solenzara. Rapport BRGM/RR-40504-FR, 22 p.
Delpont G., Robelin C., et Oliveros C. (1998) - Littoral septentrional et sud-oriental corse : évolution de 1948 à 1996. Etude de 40 plages des Agriates au Golfe de Sant’Amanza. Rapport BRGM/RR-40290-FR, 173 p.
Libro.indb 75 17/05/2013 14.41.32

76
Balouin et al. Coastal erosion monitoring - A network of regional observatories
Deronde B., Houthuys R., Debruyn W., Fransaer D., Van Lancker V. and Henriet J.-P., (2006) - Use of airborne hyperspectral data and laserscan data to study beach morphodynamics along the Belgian coast. Journal of Coastal Research, 22(5):1108-1117.
Durand N., Palvadeau E., et Nay K.M. (2003) - Réseau d’observation du littoral de la Corse. Rapport d’observation 2002. Rapport BRGM/RP-52348-FR, 156 p.
Durand N., Palvadeau E., et Nay K.M. (2004) - Réseau d’observation du littoral de la Corse. Rapport d’observation 2003. Rapport BRGM/RP-53361-FR, 179 p.
Gares P.A., Wang Y. And White S.A., (2006) - Using LIDAR to monitor a beach nourish-ment project at Wrightsville Beach, North Carolina, USA. Journal of Coastal Research, 22(5):1206-1219.
Guenther G.C., Cunningaham A.G., LaRocque P.E. and Reid D.J., (2000) - Meeting the ac-curacy challenge in airborne LIDAR bathymetry. Proc. EARSeL-SIG Workshop LIDAR, Dresden/FRG, June 16-17, 2000.
Hickman G.D. and Hogg J.E., (1969) - Application of an airborne pulsed laser for nearshore bathymetric measurements. Remote Sens. Of Env., 1:47-58.
Lillycrop W.J., Parson L.E., Estep L.L., LaRocque P.E., Guenther G.C., Reed,M.D. and Truitt C.L., (1994) - Field testing of the US Army Corps of Engineers airborne Lidar hydrographic survey system. Proc. US Hydro Conf’94, The Hydrographic Society, April 18-23, Nor-folk, VA, special pub. 32, 144-151.
Lillycrop W.J., Irish J.L. and Parson L.E., (1997) - SHOALS system: Three years of operation with airborne lidar bathymetry – Experiences, capability andtechnology advancement, Sea Technology, 38(6):17-25.
Nairn, R., (1994) - Royal Australian Navy Laser Airborne Depth Sounder, the first year of operations. Int’l Hydro. Rev., Monaco, LXXI(1), 109-119.
Oliveros C. (1998) - Cartographie des trois grands étangs corses : évolution des rivages des étangs de Chirluniu (Biguglia), Diana et Urbino de 1948 à 1996. Rapport BRGM/RR-40195-FR, 22 p. + annexes.
Oliveros C., et Delpont G. (1998) - Littoral occidental Corse – Evolution du trait de côte de 1951 à 1996 Agriates au Golfe de Ventilègne. Rapport BRGM/RR-39480-FR, 107 p.
Oliveros C., Delpont G., Rouzeau O. (1996) - Littoral oriental corse : évolution du trait de côte de 1948 à 1996 de l’embouchure de l’Alesani (commune de San Giuliano) à l’embouchure du Fium’Orbu (Ghisonaccia). Rapport BRGM/RR-38922-FR, 31 p.
Palvadeau E., et Nay K.M. (2000) - Réseau d’observation du littoral de la Corse. Choix et im-plantation des sites. Rapport BRGM/RR-40965-FR, 72 p.
Palvadeau E., et Nay K.M. (2002) - Réseau d’observation du littoral de la Corse. Rapport d’observation 2001. Rapport BRGM/RR-51503-FR, 89 p.
Populus J., Barreau G., Fazilleau J., Kerdreux M., and L’Yavanc J., (2001) - Assessment of the Lidar topographic technique over a coastal area. CoastGIS’01 : Managing the interfaces, 18-20 June in Halifax, Canada.
Revell D.L., Komar P.D. and Sallenger A.H., (2002) - An application of LIDAR to analyses of El Nino erosion in the Netarts littoral cell, Oregon. Journal of Coastal Research, 18(4):792-801.
Sallenger Jr. A.H., Krabill W.B., Swift R.N., Arens J., List J.H., Hansen M., Holman R.A., Mani-zade S., Sontag J., Stockdon H., (2003) - Evaluation of airbone topographic LIDAR for quantifying beach changes. Journal of Coastal Research, 19(1):125-133.
Libro.indb 76 17/05/2013 14.41.32

77
ResMar Coastal erosion monitoring - A network of regional observatories
Setter C., and Willis R.J., (1994) - LADS - From development to hydrographic operations. Proc. US Hydro Conf’ 94, The Hydrographic Society, April 18-23, Norfolk, VA, special pub. 32, 134-139.
Steinvall O., Koppari K., and Karlsson U., (1994) - Airborne laser depth sounding: system aspects and performance, Proc. SPIE Ocean Optics XII, 2258:392-412.
Stépanian A., Bodéré G., Hennequin V., et Palvadeau E. (2009) - Réseau d’observation du lit-toral de la Corse. Sites sensibles à évolution forte et problématique. Note d’avancement. Lecture et exploitation des données des sites de Tavignano et de Porticciolo. Année 2009. Rapport BRGM/RP-57768-FR, 64 p., 35 ill.
Stépanian A., Balouin Y., Bodéré G., Hennequin V., et Palvadeau E. (2010a) - Réseau d’Observation du Littoral de la Corse. Rapport d’observations 2009. Rapport BRGM/RP-58563-FR, 168 p., 114 ill.
Stépanian A., Bélon R., et Bodéré G. (2010b) - Réseau d’Observation du Littoral de la Corse. Sites sensibles à évolution forte et problématique. Sites de Tavignano et de Porticciolo. Année 2010. Rapport final BRGM/RP-59114-FR., 56 p., 30 ill.
Stépanian A., Balouin Y., Belon R. et Bodéré G., (2011) - ROL - Etude complémentaire sur le littoral de la Plaine Orientale de Corse - Etat des connaissances sur les impacts des tempêtes sur le littoral. Rapport final. Rapport BRGM RP-59058-FR, 137 p., 64 ill., 4 ann..
Stockdon H.F., Sallenger Jr. A.H., List J.H., Holman R.A., (2002) - Estimation of shoreline posi-tion and change using airborne topographic LIDAR data. Journal of Coastal Research, 18(2):502-513.
White,S.A. and Wang Y., (2003) - Utilizing DEMs derived from LIDAR data to analyse mor-phological change in the North Carolina Coastline. Remote sensing of Environment 85:39-47.
Libro.indb 77 17/05/2013 14.41.32

Libro.indb 78 17/05/2013 14.41.33

79
ResMar Coastal erosion monitoring - A network of regional observatories
The Ligurian webcam network and database for coastal management
Chiara F. Schiaffino1, Massimo Brignone3, Nicola Corradi1, Andrea Cevasco1 M. Alessandra Iannotta1, Carlo Cavallo2 and Marco Ferrari1*
1DiSTAV, University of Genoa, Corso Europa 26, 16132 Genoa, Italy2 Regione Liguria, Via D’Annunzio 111, 16121 Genoa, Italy
3DIMA, University of Genoa, via Dodecaneso 35, 16146 Genoa, Italy*Corresponding author: Tel.: +390103538275; Fax: +39010352169;
Corso Europa 26, 16132 Genoa, Italy. E-mail: [email protected]
Abstract Littoral erosion has serious repercussions on coastal landscape and socio-economy. The interplay between natural trends and anthropic impact factors complicates its study - and the same is true for planning appropriate solutions. From the point of view of environmen-tally-aware beach management, it is of primary importance that information concerning littoral morphodynamics should be constantly available.Action System A of ResMar (Reseau pour l’environnement dans l’espace maritime) Project aims at implementing a monitoring network, i.e. a webcam network for coastal monitor-ing, based on the processing of images obtained from webcams or digital video cameras already installed, usually for commercial purposes. This rationalises resources employed by reducing management costs of coastal monitoring; moreover, by creating centres for raw data (snapshot image) collection and processing, it supplies information relating to beach morphology with temporal continuity and spatial homogeneity.If a similar coastal monitoring network is kept active for a long term, it will provide for more accurate and rational planning and design of littoral interventions, and will represent an effective instrument for proper coastal management. Another useful activity developed in ResMar Project was the enhancement of instruments for littoral data cataloguing, and the improvement of technical and planning procedures for environmental restoration, protection and monitoring of coastal systems. Standardised catalogues of coastal data, gathered from analyses and tests performed, are currently being produced. They will be hosted by informative systems based on official databases from the public administration (Partner Regions). At the same time, the implica-tions of planning, building, managing and maintaining pre-existing coastal defence works are being assessed. Technical papers and guidelines will be drafted with the purpose of supporting and regulating coastal usage, management and monitoring.
Libro.indb 79 17/05/2013 14.41.33

80
Schiaffino et al. Coastal erosion monitoring - A network of regional observatories
IntroductionCoastal studies involve methods such as physical and morphodynamic modelling and field surveys, which are useful even if somewhat limited in their applicability. Laboratory model-ling offers an insight on beach behaviour on a large time scale in a defined environment, but does not provide for an overview of the evolution trend in the coastal zone, since it considers only some of the global aspects that could influence it. Field campaigns are still among the most used coastal monitoring techniques, in spite of being time consuming; in addition, it does not provide for an even coverage of the beach in terms of space and time or for the collection of continuous datasets, due to excessive costs and logistic problems (Aarninkhof et al, 2005). Only a tool that is equipped for uniform data-recording could provide exhaustive informa-tion on beach trends. Video monitoring systems are an alternative method, developed in the last decades. This method allows coastal environments to be studied in continuous and automatic terms, proving to be a very useful tool for the analysis of nearshore processes over a wide temporal range (Aarninkhof and Roelvink, 1999; Davidson et al, 2004; Holland 1998). Many parameters of interest can be acquired in real time with this method, such as longshore and cross-shore evolution of the shoreline and submerged bars, wave direction, storms impacts and beach seasonal changes (Ojeda and Guillén 2008; Kroon et al, 2007; Smith and Pearce, 1997; Turner et al, 2004). In order to evaluate the efficiency of interven-tions, it is usually necessary to analyse not only shoreline displacement, but also shoreline morphological variations which can provide additional information on beach response to storm events and man-made structures.All these parameters and information will trace the evolution trend of coastal systems, al-lowing the efficiency of intervention projects to be evaluated.In 2007, Coast View project (Van Koningsveld et al, 2007) pointed out the usefulness of a similar tool for coastal monitoring. However, at the same time and in the very same project, problems arose concerning scientific data communication, due to the different goals of researchers and end users. Video monitoring, as it is presently conceived, lacks data communicability and actual appli-cability. As Van Koningsveld et al. (2003) suggested, it is necessary to create a compromise and adopt an approach where the different aims can be considered, providing scientific information which end users can also easily read and utilise. Therefore, rather than the method itself, we should change the manner in which it is applied and put to use, and the form in which data are presented.An innovative and useful method for video systems was presented in ResMar (Reseau pour l’environnement dans l’espace maritime) Project. Video monitoring was applied simultane-ously on different sites granting wide spatial coverage and creating a network for the study and management of concomitant beach images, ensuring adequate temporal coverage. For this purpose, a video monitoring software initially developed in Beachmed-e Project (Brignone et al 2008) and later implemented (Brignone et al, in press) was used. Software Beachkeeper plus, differently from others currently in use, allows users to work with any type of images regardless of the corresponding acquisition system. In this study, webcams previ-ously installed for commercial purposes were used without modifying their primary purpose. This rationalisation of resources reduces littoral monitoring management costs; moreover, by creating centres for raw data (snapshot image) collection and processing, it supplies in-
Libro.indb 80 17/05/2013 14.41.33

81
ResMar Coastal erosion monitoring - A network of regional observatories
formation related to beach morphology with temporal continuity and spatial homogeneity.The acquired information was also made available for download on certain websites.A second useful innovation developed in the ResMar Project was the enhancement of in-struments for informative cataloguing of data from Ligurian littoral. Coastal zones are considered difficult to manage because of the several factors to which they are subject: a few examples are weather conditions (as tides and seasons), and local, national and regional government agencies responsible for different sectors (fishing, ag-riculture, transport) in the same area (Longhorn, 2005). Moreover, at the end of the 19th century, the coast started to be an important source of economic, social and landscape re-sources, causing its high and vulnerable geological and biological values to be overlooked.For some years, methodologies to deal with the aforementioned factors were developed by different institutions like UNESCO and European Commission (EUROSION, 2004; Coast-al Zone Management Program, 2005) to efficiently address the need for sustainable littoral management. Geographic Information Systems (GIS) appeared to be the most appropriate tool, able to integrate and elaborate all coastal factors (Rodriguez et al., 2009) and support national and local decision-making systems.GIS techniques were preferred to the traditional paper-based reports, due to the larger amount of data involved (coming from different sources, which could be stored and pro-cessed with advanced analysis), and because it provided a wider audience with tools for easy access to data and thematic cartography generation (Pan, 2005). While simple soft-ware are able to gather, elaborate and display information related to the different disci-plines of interest, Geographyc Information Systems (GIS) manage and analyse data with geometric shape (spatial element) and of known position in relation to the Earth surface (georeferenced data). GIS software describe reality through two types of elements: thematic attributes (statisti-cal data elements) and geographical/spatial data. Attributes represent elements that are not geometrical, such as names, measures and properties, i.e. any alphanumeric element. Geographical and spatial features, instead, are the geometrical elements, and though of-ten employed to describe the same data, reveal some differences. While spatial attributes could consist of any information about multidimensional location, including engineering projects, remote sensing or cartography, geographical data are strictly linked to the in-formation about Earth surface on real-world scale and in real-world space (Frank, 1988). Geographical features are displayed through vector and raster data: whereas the first use basic elements such as points, lines and areas, the later discretise geographical features either in a matrix or in a grid cell. Every element in a vector model is defined by Cartesian coordinates and can include not only the geometry of the point but also the topology or neighbourhood relations. A raster cell is often also referred to as a pixel (picture element) holding data values within the specified range or colour depth of a raster image or raster geodata set. By specifying the raster origin coordinates and the spatial resolution of a raster cell, the spatial position of each cell within the raster grid can be easily calculated (Neuman et al, 2010).
Data acquisition and processing: a coastal video monitoring networkState of the artArgus Video Monitoring System was the first video monitoring system ever developed. It
Libro.indb 81 17/05/2013 14.41.33

82
Schiaffino et al. Coastal erosion monitoring - A network of regional observatories
was created by the Coastal Imaging Lab from Oregon State University at the beginning of the ‘90s. That system is still the most complete of its kind, managing image acquisition and elaboration. In particular, webcams automatically collect real time beach images at specified intervals. Collected images are then elaborated by software tools to obtain four different types of images (Holman and Stanley, 2007; Alexander and Homan, 2004; Holman et al, 2003): Snapshot, Time Exposure, Variance and Day Timex.A snapshot photograph is a simple photo of the beach site where webcams are installed. It is used to document site environmental conditions and offers low quantitative information (Zikra, 2007).Time Exposure (or timex) images are obtained by digitally averaging image intensity over a fixed amount of minutes of image acquisition. It is created by processing and superimposing snapshot images of one acquisition cycle. This process eliminates random momentary sea conditions and removes variability in run-up height. This image processing increases pixel colour intensity, making it possible to distinguish morphological features that would other-wise be difficult to see. The timex image is an excellent tool to underline submerged sand bar topography (Lippmann and Holman, 1989), shoreline (Quartel et al, 2006; Kroon et al, 2007), intertidal beach profile (Plant and Holman, 1997), intertidal beach slope (Madsen and Plant, 2001), and morphology formations in beach face (Holland, 1998; Almar et al, 2008).Variance images are acquired at the same time as Time Exposure images, but they also enhance the contrast achieved by timex processing. This allows for better recognition of submerged foreshore structures and of regions that are changing during acquisition time (a surf zone is brighter than other parts) as well as of unchanging regions (a dry beach is darker than other parts).The so-called Day Timex image is obtained through the averaging of all images acquired in one day. This elaboration removes the effects of tidal variation and variation in light inten-sity due to the changing angle of the sun during the day (Morris et al, 2001). In addition to these four image types, it is possible to generate Time-Stack images (Zhang and Zhang, 2008; Takewaka and Nakamura, 2000; Kuo et al, 2009; Ojeda et al, 2008), by extracting a line of pixels along a predefined array in a video frame and pasting the lines of pixels side by side. The same set of pixels is extracted from consecutive images and stacked vertically to create an image with time on the vertical axis and cross-shore distance on the horizontal axis. This is used to investigate hydrodynamic characteristics of the beach under study as well as wave orientation and wave length (and their modification approaching the shore), cross-shore variation and run-up.Due to the evolution in video cameras and video technologies, several systems have been developed in the past years for coastal monitoring purposes and coastal zone manage-ment (Lippmann and Holman, 1989). A few examples are Cam-Era1, Kosta System (Archetti et al, 2008), Coastal Watch2, Erdman Video System3, Sirena4, Horus5 and many others. The development of these systems was initially based on Argus utilities and software. With such software, a fixed number of webcams, installed on a set elevation above water level,
1 http://www.niwa.co.nz2 http://www.coastalwatch.com3 http://www.video-monitoring.com4 http://imedea.uib-csic.es/tmoos/sirena/5 http://www.horusvideo.com/
Libro.indb 82 17/05/2013 14.41.33

83
ResMar Coastal erosion monitoring - A network of regional observatories
automatically collect real time littoral images at specified intervals. For all these systems, it is necessary to set laboratory accuracy for image acquisition system, in order to perform georeferenciation. The mathematical relation between 3D coordinate systems (xyz) and 2D image coordinates (U,V) involves intrinsic camera parameters, i.e. focal length of lenses, aspect ratio of pixels and pixel location on the optical centre (Holman and Stanley, 2003) as well as extrinsic parameters depending on camera location, i.e. azimuth, tilt and roll angle, camera location coordinates (Aarninkhof et al, 2003) and ground topography.
Material and methodsIn this project, nine webcams previously installed for commercial purposes along the Ligu-ria coast were selected to compose the video monitoring network (Fig. 1). Webcams were selected according to specific technical requirements: photo framing to select the most interesting for the study; and the possibility of high image acquisition frequency. To ensure adequate temporal coverage, images were acquired with 5-second frequency for a period of 10 minutes every hour from 9 a.m. to 20 p.m. Two of those webcams (Moneglia and Ospedaletti) allow raw images from municipal websites to be developed. For the remaining webcams, the management software imple-mented downloads images directly from the single server belonging to Savona provincial administration.Images obtained and stored in the central platform were processed with Beachkeeper plus
Figure 1 - Study sites.
Libro.indb 83 17/05/2013 14.41.35

84
Schiaffino et al. Coastal erosion monitoring - A network of regional observatories
software (Brignone et al, in press) through photogrammetric techniques, image rectifica-tion and digital analysis. This software allows beach morphological traits to be determined and mapped according to the coordinate metric system chosen. In order to georeference webcam images and to ensure the correct functioning of this tool Ground Control Points (GCPs) were surveyed on the beach with a DGPS. GCPs points were spread over the beach so as to cover as many image sectors as possible. Beachkeeper plus georeferenciation tool, differently from others currently in use, bypasses any a-priori laboratory analysis for camera calibration and reduces significant errors caused by camera distortion effects em-ploying the regularisation theory proposed by Landweber (1951).
Results and discussionThe webcam network architecture is formed by nine webcams, and its main operations and procedures are based on a management software linked to host servers and web pages containing raw images, and to the Beachkeeper plus software (Brignone et al, in press). This structure allows all images collected in real time to be downloaded and elaborated, creating an extensive image database consisting of raw data and elaborated images. The primary image elaboration consists of computing Timex, Variance and Day timex images (Fig. 2). Furthermore, detection of Ground Control Points allowed also image rectification and shoreline detection to be carried out (Fig.2).
Figure 2 - Example of four types of images obtained through Beachkeeper plus elaboration in Pietra Ligure: a) Snapshot image, February 5, 2012, 9 a.m.; b) Time Exposure image, February 5, 2012, 9 a.m.; c) Variance image, February 5, 2012, 9 a.m.; d) Rectified image February 5, 2012, 9 a.m.
Libro.indb 84 17/05/2013 14.41.39

85
ResMar Coastal erosion monitoring - A network of regional observatories
The managing software is also linked to the website http://beachcam.ResMar.eu , espe-cially created for this purpose, where all data obtained are uploaded.This website is a portal for the ResMar Project - Action A. The portal provides data about the morphological state of beaches, of great use for beach management, and weather conditions in real time, extremely valuable for the tourism industry. The scope of this web-site is to upload data from the video monitoring network, allowing end users to view and download them.On the menu located on the left, items link to different articles. A website browser can find information on the main goal of the project and the research group members and activi-ties. Sub-menus can be opened from the main menu, allowing a beach site to be selected and the respective images to be viewed: oblique, rectified or shoreline. In order to select the type of images to be displayed (Snapshot, Timex, Variance and Day Timex) the site also has a “top menu” with a calendar, from where a specific day can be selected (Fig. 3).
The website structure, and its netsurfing and communication logic, can easily host new users, therefore the network architecture can be expanded if new webcams are installed or used.
ConclusionsThe webcam network created in the ResMar Project is the first example of an international monitoring network. It allows information concerning beach morphology to be acquired with temporal continuity and spatial homogeneity, making it possible to use economic re-sources more rationally. If this coastal monitoring network is maintained active, in the long term littoral interventions may be more accurately and rationally planned and designed, and will represent an effective instrument for proper coastal management. A permanent
Figure 3 - Web page example.
Libro.indb 85 17/05/2013 14.41.41

86
Schiaffino et al. Coastal erosion monitoring - A network of regional observatories
monitoring network, available for all interested coastal municipalities, will offer the opportu-nity to fully frame any phenomenon and underline its temporary features; it will also allow emergency levels to be consistently, rationally and homogeneously evaluated in the entire territory, with the necessary awareness. In fact, data acquired by the beach video-monitoring network are uploaded in real time. This feature is interesting not only for scientific purposes, but also for other uses, since this tool is available to all professionals working in this area. The network configurations are simple enough for an easy end-user experience, and the absence of further management costs allows human and economic resources to be spared. With this tool, coastal managers can monitor beach evolution in real time and may promptly intervene if needed. Moreover, such a high acquisition frequency provides an overall view of the beach and its evolution trend, which is more accurate than what can be obtained by other methods; it therefore minimises the inaccurate interpretation of coastal conditions caused by less precise methods of data acquisition. Moreover, this web server will have positive effects on tourism as well: tourists will be able to check not only beach status but also weather and sea conditions.
The “status” of the regional coastState of the artThe Liguria region coastline extends for 350 km, 140 of which are made of high rocky coast, 94 km of beaches and 116 km of artificial coasts (AA.VV., 2006). As for the geomorphologi-cal development of Liguria littoral, the region shows a very short continental platform de-fined by deep canyons leading sediments towards the bathyal plain (Fanucci et al., 1976). Mountains are remarkable and situated close to the sea, to where irregular and rough solid sediment is carried by the few existing rivers of significant dimensions (Magra, Roya, Centa, Entella). The Liguria coast is highly fragmented in several physiographic units, with an alternation of high coasts (enclosing pocket beaches), and littoral plains with rather long beaches (Fanucci et al.1990, Ferrari et al., 2008). Climate is characterised by winds from the southbound sector. Libeccio, the dominant South-Western wave driving force, with a fetch over 800 km, determines the main longshore detritic flow towards east. From the opposite direction, Scirocco, the South-East wind (with a fetch of 200 km), causes a secondary sedi-ment drift (IIM, 1978; AA.VV., 1997). Liguria shoreline conditions remained unchanged until the 1990s; data collected from 2000s demonstrated 80% of beaches to undergo erosion (Fanucci et al., 1990; Ferretti et al., 2003a). The coastal railway line, built in the second half of 19th century, was decisive in the loss of shoreline equilibrium and the reduction of beach surface (Bensa et al., 1979; Ferretti et al., 2003b). Coastal urbanisation increased enormously, with the construction of hotels and other tourism facilities as well as defence works to protect them, altering the already fragile equilibrium of the Liguria littoral in permanent terms (Ferrari et al. 2008).Whether due to natural or to anthropogenic reasons, coastal erosion has today become an important socio-economic problem, difficult to handle by national, regional and local authorities. The answer is sustainable territory management, which can be obtained by mixing different approaches to the same subject. National, regional and local institutions can make use of research to rebalance the condi-tions of endangered coastlines and avoid causing, or at least mitigate, erosion in nearby areas - a problem already seen in the past (Pranzini, 2004).
Libro.indb 86 17/05/2013 14.41.41

87
ResMar Coastal erosion monitoring - A network of regional observatories
Longtime collaboration between regional Liguria government and University of Genoa made it possible to undertake studies aimed at identifying and monitoring erosion in the entire Liguria coast. Within the European programme BeachMed, the analysis of five mor-phosedimentary parameters (Ferrari et al., 2004) sampled during field work, collected from bibliographic studies and integrated in a geo-database (Ferrari et al., 2005), provided for an erosion index and littoral classification according to the type of maintenance needed (Ferrari et al., 2008) Recently, the Liguria littoral has been monitored as part of ResMar European project, where GIS proved to be a flexible system particularly useful for the identification of coastal vul-nerability (Doukakis, 2005) especially in view of its important function in the comparison of previously georeferenced cartographic data. The product was the creation of standardised catalogues of coastal data, which were sub-sequently stored and elaborated by a geographical information system based on official databases belonging to the public administration of Partner Regions. The raw data of a relational database included in GIS software comprises: shorelines from different years; bathymetric data sampled with Single and Multi Beam ecosounder methodology; and granulometric analyses resulting from surveys carried out along the entire Liguria coast.Most data came from monitoring new defence works and marinas built up in the past decade. In fact the Dipartimento Ambiente of Regione Liguria introduced a law in 2003 (D.G.R. 222/2003), with a corresponding technical note (D.G.R. 1793/2005), requesting a monitoring plan for each defence work, considering a period of 3 or 5 years. Thus, a large amount of recent local morphological and sedimentological data has been collected by Regione Liguria.The graphic and statistical analyses carried out by GIS could represent a useful tool for the elaboration of a regional plan that could work as a decision support system to regulate beach management and monitoring in the future.
A Regional Centre for data acquisition, processing and distribution DiSTAV Dipartment (University of Genoa) and the Environmental Department (Ligurian Region) worked together in Action A of ResMar European project, joining forces for the creation of a monitoring network able to provide an accurate assessment of coastal ero-sion. Shoreline equilibrium, depending mainly on environmental conditions and anthropic actions (EUROSION, 2005, Ferrari et al., 2008; Ferretti et al., 2003a) and its eventual erosion rates could be controlled and estimated by GIS as it was possible for shoreline position from different periods and sources to be acquired.The geographic information system used to analyse and manage data was MapInfoâ., pri-marily for its mapping desktop function (Vertical Mapper) which allows tri-dimensional land models to be easily managed and volumetric comparison grid and sections to be created. The software analyses digital maps in relation to alphanumerical data. Both spatial and at-tribute elements are organised in layers which are displayed through the following files:
- *.tab is the text file describing the layer structure; - *.dat is the file collecting the attribute table; - *.map is the file describing the graphic objects with their original geometric coordinates; - *.id is the file necessary to link the object to its relative attribute.
The raw bathymetric data corresponding to X, Y, Z (latitude, longitude and depth) point
Libro.indb 87 17/05/2013 14.41.41

88
Schiaffino et al. Coastal erosion monitoring - A network of regional observatories
coordinates, relating to different littoral sites and monitored during several years, were converted into the same projection system (Gauss Boaga, Roma 1940) and uploaded to MapInfo. Bathymetric grids and the corresponding depth contour lines were created using the Vertical Mapper analysis T.I.N. interpolation based on the triangulation method (Fig. 4).
The comparison of bathymetric maps based on subsequent monitoring and on further data coming from the digitalisation of historic maps (from the end of 19th century, pro-vided by Hydrographic Marine Institute - I.I.M.) (Fig. 5), proved to be very useful for calcu-lating erosion and/or accretion(Fig. 6). Also raw data (X,Y,Z) referring to sediments sam-pled on dry beach and nearshore areas were uploaded and displayed as graphic data in MapInfo (Fig. 7).
Figure 4 - Levanto and Bonassola sites. Grid and depth contour lines calculated from x,y,z data of bathymetric survey of 2010.
Figure 5 - Levanto and Bonassola sites. Depth values extrapolated and georeferenced from cartography of 1885.
Libro.indb 88 17/05/2013 14.41.42

89
ResMar Coastal erosion monitoring - A network of regional observatories
Figure 6 - Levanto and Bonassola sites. Grid comparison deriving from bathymetric survey of 1885 and 2010.
Moreover, a specific *.dat file (STATION.dat) with sediment characteristics was created: a table including data on sampling distance from the shoreline, information about sampling sites, matrix characteristics and methodology used to analyse sediments were all loaded on the regional information system shared by ARPAL and Ligurian Region (SIRA) (Fig. 8). Each sampling was assigned a code subsequently employed in a new window (ANALYSIS.dat) where results of the analysis are linked to this parameter, which was examined with a specific method and linked to a characteristic environmental matrix (PMC).PMCs and their codes, used to classify the results of granulometric analyses according to Wentworth classification (Wentworth, 1922) are shown in Fig. 9.
Figure 7 - The Ligurian coast among Punta Baffe and Punta Mesco. Sampling of sediment during bathymetric survey of 2010.
Libro.indb 89 17/05/2013 14.41.44

90
Schiaffino et al. Coastal erosion monitoring - A network of regional observatories
Figure 8 - Example of STATION.dat file loaded in SIRA database.
Figure 9 - Creation of PMC (parameter-method-compartment) and its respective codes.
Libro.indb 90 17/05/2013 14.41.48

91
ResMar Coastal erosion monitoring - A network of regional observatories
The scope of SIRA database is the management of information relating to any marine monitoring programme carried out in Liguria Region. Shoreline coordinates (X,Y raw data) have been sampled with GPS systems in all monitor-ing studies, and were also compared to data deriving from photogrammetric rendering of aerial ortophotos from years 1944, 1973, 1983, 1993 and 2003. By overlapping data deriving from the different sources and years, MapInfo displays the shoreline evolution trend with the accretion and erosion zones of the dry beach (Fig. 10). Dividing the littoral into several beach profiles and considering the mean sea level as the seaward edge, it was possible to calculate and compare dry beach volumes in successive monitoring years.As conclusion, the system has proved to be a very useful tool to monitor and manage the littoral. Although only the Ligurian coastline has benefited of such continuous survey until the present date, the evolution of this technique should lead to the creation of a unique Geo-graphic Information System including standardised data related to the coast and shared by all components of ResMar project.
ReferencesAA.VV. (1997) - Atlante delle spiagge italiane, a cura di Giuliano Fierro, CNR-MURST, S.EL.
CA., pp 4 tavv 108.AA.VV (2006) - Lo stato dei litorali italiani. Liguria. Studi Costieri n.10, pp.9-14, a cura di
GNRAC. Aarninkhof S.G.J. and Roelvink J.A. (1999) - Argus-based monitoring of intertidal beach mor-
phodynamics, Coast. Sed.: 2429-2444.Aarninkhof S.G.J., Turner I.L., Dronkers T.D.T., Caljouw M., and Nipius L. (2003) - A video
based technique for mapping intertidal beach bathymetry. Coast. Eng., 49: 275-289.
Figure 10 - The littoral of Borgio Verezzi (SV). Variation of the shoreline from 2007 to 2010.
Libro.indb 91 17/05/2013 14.41.49

92
Schiaffino et al. Coastal erosion monitoring - A network of regional observatories
Aarninkhof S.G.J., Ruessink B.G. and Roelvink J.A. (2005) - Nearshore subtidal bathymetry from time-exposure video images, J. Geoph. Res., 110: 13.
Alexander P.S. and Holman R.A. (2004) - Quantification of nearshore morphology based on video imaging, Mar. Geol., 208: 101-111.
Almar R., Coco G., Bryan K.R., Huntley D.A., Short A.D. and Senechal N. (2008) - Video obser-vations of beach cusp morphodynamics. Mar. Geol., 254(3-4): 216-223.
Archetti R., Schiaffino C.F., Ferrari M., Brignone M., Rihouey D. and Gauffres P. (2008) - Video systems for the coastal monitoring, in Beach erosion monitoring, Firenze. pp. 101-109.
Bensa F., La Barbera E. and Taggiasco F. (1979) - Particoalri aspetti evolutivi delle spiagge liguri. In Ed. SAGEP Sestri Levante (GE). pp 1-63.
Brignone M., Corradi N., Ferrari M. and Schiaffino C.F. (2008) - Evaluation of a nourishment programme with a webcam: the case of Levanto (La Spezia, Italy). Chem. Ecol., 24(1): 207-214.
Brignone M., Schiaffino C.F., Ferrari M. (2012) - A system for beach video-monitoring: Beach-keeper plus, COMPUTERS & GEOSCIENCES, vol. 49, p. 53-61, ISSN: 0098-3004.
Coastal Zone Management Program, 2005. - http//www.ocrm.nos.noaa.gov/czm/Davidson M.A., Aarninkhof S.G.J., Van Koningsveld M. and Holman R.A. (2004) - Developing
coastal video monitoring system in support of coastal zone management (Special Issue), J. Coast. Res., 39.
Doukakis E. (2005) - Identifying coastal vulnerability due to climate changes, J. Mar. Environ. Eng., 8, 155-160.
EUROSION program (2004) - http://www.eurosion.org/EUROSION program (2005) - Vivir con la erosión costera en Europa. Sedimentos y Espacios
para la Sostenibilidad. Resultados del estudio de EUROSION. Oficina para las publica-ciones Oficiales de las Comunidades Europeas, Luxemburg.
Fanucci F., Fierro G. and Rehault J.P. (1976) - Evoluzione quaternaria della piattaforma con-tinentale ligure, Mem. Soc. Geol. It., 13, 233-240.
Fanucci F., Corradi N., Firpo M., Piccazzo M. and Tucci S (1990) - Les cotes de la Mer Ligure: morphologie, dynamique et evolution, Littoral, 1990, Comptes rendus du Ier sympo-sium international de l’Association Europèenne EUROCOAST. Marsiglia 9-13 Luglio, 82-86.
Ferrari M., Balduzzi I., Bozzano A., Bolens S. (2004) - Valutazione dello stato di erosione dei litorali e stima del fabbisogno di sediment per i ripascimento delle spiagge liguri, In: La ricerca delle sabbie nel Mar Ligure, Regione Liguria, 61-71.
Ferrari M., Balduzzi I., Bozzano A. and Artom C. (2005) - The use of a GIS to evaluate the erosion of the Ligurian Littoral, International Cartographic Conference, A Coruna, 2005.
Ferrari Balduzzi I., Bozzano A. and Artom C. (2008) - Valutazione dello stato erosive delle spiagge liguri: applicazione di un Sistema Informativo Geografico, Atti 12a Conferenza Nazionale ASITA, Aquila, 21-24 Ottobre 2008.
Ferretti O., Delbono I., Furia S., Barsanti M. and Bozzano A. (2003a) - Elementi di ges-tione costiera., Difese costiere rigide., Distribuzione e valutazione delle tipologie., ENEA RT/2003/44/CLIM., 4 (3), 1-140. Ferretti O., Delbono I., Furia S. and Barsanti M. (2003b) - Elementi di gestione costiera., Difese costiere morbide: ripascimenti artificiali., Rasseg-na tipologica., ENEA RT/2003/45/CLIM., 4 (4), 1-183.
Frank A.U. (1988) - Requirements for a database management system for a GIS. Photogram.
Libro.indb 92 17/05/2013 14.41.49

93
ResMar Coastal erosion monitoring - A network of regional observatories
Eng. Rem. S. 54:1557-1564.Holland K.T. (1998) - Beach cusp formation and spacings at Duck, USA, Cont. Shelf Res. 18,
1081-1098.Holman R.A., Stanley J. and Ozkan-Haller T. (2003) - Applying video sensor networks to near-
shore environment monitoring, IEEE Pervasive Computing, 2(4): 14-21.Holman R.A. and Stanley J. (2007) - The history and technical capabilities of Argus, Coast.
Eng., 54: 477-491. IIM-Istituto Idrografico della Marina (1978) - I venti e lo stato del mare, I.I.M. Genova, 5:1-14.Kroon A., Davidson M.A., Aarninkhof S.G.J., Archetti R., Armaroli R., Gonzalez M., Medri S.,
Osorio A., Aagaard T., Holman R.A. and Spanhoff R. (2007) - Application of remote sens-ing video system to coastline management problems, Coast. Eng., 54: 493-505.
Kuo C.A., Hwung H.H. and Chien C.H. (2009) - Using time-stack overlooking images to sepa-rate incident and reflected waves in wave flume. Wave Motion, 46: 189-199.
Landweber, L. (1951) - An iteration formula for Friedholm integral equations of the first kind. Am. J. Math., 73: 615-624.
Longhorn A.J. (2005) - Coastal spatial data infrastructure. In: GIS for coastal zone. Bartlett D. and Smith J. Eds. (Chapter 1).
Lippmann T.C., Holman R.A. (1989) - Quantification of sand bar morphology: a video tech-nique based on wave dissipation, J. Geoph. Res., 94(c1): 995-1011.
Madsen A.J. and Plant N.G.P. (2001) - Intertidal beach slope predictions compared to field data. Mar. Geol., 173: 121-139.
Morris B.D., Davidson M.A. and Huntley D.A. (2001) - Measurements of the response of a coastal inlet using video monitoring techniques. Mar. Geol., 175: 251-272.
Neuman A., Freimark H. and Wherle A. (2010) - Geodata structures and data models. htt-ps://geodata.ethz.ch/geovite/ -Version September 2010.
Ojeda E., Ruessink B.G. and Guillén J. (2008) - Morphodynamic response of a two-barred beach to a shoreface nourishment. Coast. Eng., 55: 1185-1196.
Ojeda E. and Guillén J. (2008) - Shoreline dynamics and beach rotation of artificial embayed beaches. Mar. Geol., 253: 51-62.
Pan P.S.Y.(2005) - Monitoring coastal environments using remote sensing and GIS. In: GIS for coastal zone. Bartlett D. and Smith J. Eds. (Chapter 4).
Plant N.G. and Holman R.A. (1997) - Intertidal beach profile estimation using video images. Mar. Geol., 140: 1-24.
Pranzini E. (2004) - La forma delle coste. Geomorfologia costiera, impatto antropico e difesa dei litorali., Ed. Zanichelli. pp: 1-256.
Quartel S., Addink E.A. and Ruessink B.G. (2006) - Object-oriented extraction of beach mor-phology from video images. Int. J. Appl. Earth Obs., 8(4): 256-269.
Rodriguez I., Montoya I., Sanchez M.J. and Carreno F. (2009) - Geographic Information Sys-tem applied to Integrated Coastal Zone Management, Geomorphology, 107: 100-105.
Salmon S.A., Bryan K.R. and Coco G. (2007) - The use of video system to measure run-up on beaches. J. Coast. Res., 50: 211-215.
Smith R.C.G. and Pearce A.F. (1997) - A bibliography of research into satellite remote sensing of land, sea and atmosphere conducted in western Australia, J. R. Soc. West. Aust., 80: 29-39.
Takewaka S. and Nakamura T. (2000) - Surf Zone imaging with a moored video system. In:
Libro.indb 93 17/05/2013 14.41.49

94
Schiaffino et al. Coastal erosion monitoring - A network of regional observatories
Proc. of the 27th Int. Conf. Coastal Eng. Sydney, Australia. pp. 151-155.Turner I.L., Aarninkhof S.G.J., Dronkers T.D.T. and McGrath J. (2004) - CZM applications of
Argus Coastal Imaging at the gold Coast Australia, J. Coast. Res., l20(2): 739-752.Van Koningsveld M., Stive M.J.F., Mulder J.P.M., de Vriend H.J., Ruessink B.G. and Dunsber-
gen D.W. (2003) - Usefulness and effectiveness of coastal research: a matter of percep-tion? J. Coast. Res., 19(2): 441-461.
Van Koningsveld M., Davidson M., Huntley D., Medina R., Aarninkhof S., Jiménez J.A., Ridgewell J. and de Kruif A. (2007) - A critical review of the CoastView project: Recent and future developments in coastal management video systems. Coast. Eng., 54: 367-376.
Wentworth C.K. (1922) - A scale of grade and class terms for clastic sediments. J. Geol., 30: 377–392.
Zhang S. and Zhang, C. (2008) - Application of ridgelet transform to wave direction estima-tion. In: Proc. of the Congress on Image and Signal Processing, Comp. Soc., Sanya, China. pp. 690-693.
Zikra M. (2007) - Wave Speed Estimation using Video Coastal Imagery. Neptunus, 14(1): 1-7.
Libro.indb 94 17/05/2013 14.41.49

The activity of “Osservatorio Coste E Ambiente Naturale Sottomarino” (OCEANS) and the
implementation of a monitoring network and study methodology for sedimentological and morphodynamic processes of mediterranean
microtidal wave-dominated beaches (Sardinia)
Sandro De Muro, Claudio Kalb, Nicola Pusceddu and Angelo Ibba
Coastal and Marine Geology Group Osservatorio Coste E Ambiente Naturale Sottomarino (OCEANS)
University of Cagliari, Department of Chemical and Geological Sciences Via Trentino 51, 09127 Cagliari, Tel/Fax 0706757733,
e-mail: [email protected]
AbstractThe monitoring network, set up in 2005 for Project “Gestion intègrèe de l’environnement à haute risque d’èrosion” (Interreg IIIA GERER), was initially based on 4 sample beaches in Corsica and Sardinia, and was later extended, including other 31 beaches over a 6 year-period. A methodology for the study of sedimentary processes and morphodynamics of microtidal wave-dominated beaches in a Mediterranean environment was also imple-mented. A database was created by the “Coastal and Marine Geology Group” using the monitoring network and study methodology. Data from aerial photographs and satellite images, and on bathymetry-topography (DTM), sedimentology, wind and wave energy and hydrodynamics of the beach systems were collected, catalogued, archived and ana-lysed. A cross-border centre for the study of littoral dynamics (“Centro Transfrontaliero per lo studio della dinamica dei litorali”) has been recently developed as part of the P.O. Marit-timo Res.Mar “Rete per l’ambiente nello spazio marittimo” – Sub-project B.Data flow is originated at Osservatorio Coste E Ambiente Naturale Sottomarino - OCEANS from where it is made available to the centre (“Centro Transfrontaliero per lo studio della dinamica dei litorali”). Free use of OCEANS lighthouse has been granted to the university, which has been using it for institutional objectives, mainly by researchers from the Coastal and Marine Geology Group, coordinated by Prof. Sandro DeMuro.Research results are available in scientific publications, popular publications and on a webgis (www.osservatoriocostesardegna.eu).
95
ResMar Coastal erosion monitoring - A network of regional observatories
Libro.indb 95 17/05/2013 14.41.49

IntroductionThe beaches of Gallura and Sardinia in general, undergo strong infrastructural pressure which increases during the summer due to tourism.The response of the beach systems to this increment of “workload” is influenced by ongo-ing global climate change. As a result of this well-known situation of climatic instability the equilibrium of the beach-dune systems is even more delicate and critical. Signs of environmental distress are already evident in many beaches such as: changes to sedimen-tary systems, withdrawal, reduction or fragmentation of dune habitats caused mainly by the lack of efficient management. The extraordinary quality of the Sardinian beaches and the beaches of Gallura is also attributable to the unique composition and structure of the sands. These sands are dis-appearing and being eroded due to the incorrect use of the resource. The negative ex-perience of Poetto‘s beach nourishment (Cagliari) is a good example showing that these materials are not artificially reproducible. The Sardinian beaches are an invaluable resource and should be protected as such.In 2008, the Osservatorio Coste E Ambiente Naturale Sottomarino (OCEANS), well aware of this serious emergency situation, began a detailed study to understand and use a new monitoring method. It was created by the Coastal and marine Geology Group of Cagliari University and based on scientific knowledge acquired.Efficient management practice inspired by sustainable development was experimented and promoted on the foundations of this new knowledge.In this sense, the use of scientific data is of fundamental importance for planning; the database is constantly updated and constitutes a valid support instrument for town coun-cils, PULs (Littoral Use Plans) and good management practices in general. Regional Law DGR 29/15, from 22.05.2008, has given directions for the elaboration of a Coastal Usage Plan, and regulated uses in the territorial sea and in the public maritime domain (owned by the state).This policy regulates the local authority functions related to the use of National maritime property and areas of territorial sea, as well as recreational use of Nation-owned areas by tourists, regulated by PULs. The scientific knowledge acquired so far shows that a thorough and urgent review of this policy is urgently required, as it does not consider the extreme dynamism of beaches and dunes (also related to the climatic variations underway and the impact of incorrect use of resources).The creation of this database, aimed at sample beaches, was possible due to to the ex-perience that OCEANS researchers have acquired in implementing the European Project “Gestione Ambientale Integrata in Località ad Elevato Rischio d’Erosione GERER” (INTERREG III A ) and from the experience gained from the study and monitoring of dune systems in the project Life+ Nature & Biodiversity PROVIDUNE, which OCEANS is coordinating on a national scale.These two projects, INTERREG IIIA-GERER and LIFE+ PROVIDUNE, are ‘pilot projects’ based on solid scientific knowledge, providing a concrete contribution on the complex issues related to the dynamics of coastal sand bodies and the management and use of beach systems, for the use of the local authorities directly involved.The following phases were carried out to create the Database on Coastal Observations:
- reorganization and integration of existing data, using the laboratories, means and
96
De Muro et al. Coastal erosion monitoring - A network of regional observatories
Libro.indb 96 17/05/2013 14.41.50
advanced instruments available to OCEANS for the monitoring of beach systems; - enlargement of the cognitive framework regarding the functional mechanisms of beach systems;
- elaboration of monitoring information from sample beaches to highlight the main criticality and to formulate management proposals for the use of coastal resources according to sustainable development guidelines;
The aim was to obtain a basic computerized picture of the 35 beaches studied that is easy to consult and implement, allowing the following (Fig. 1):
- preparing documents and preliminary research activities required to define a Pilot Project for integrated management of the coastal zone;
- planning and testing a database on Sardinian beaches; - providing management support and guidelines for local authorities; - continuing information exchange between the University (institution for research and higher education) and intermediate local government bodies in charge of territorial control (institutions for management).
The first objective reached by the Observatory was to contribute towards a deeper un-derstanding of the historical-geographical evolution of sample beaches located along the entire Sardinian coast. The collection and analysis of these initial data constituted an essential basis required for reaching a second objective: construction of an experimental database containing basic and easily readable information related to the beaches studied, whereas offering the necessary statistics for setting up a model for an integrated coastal zone environmental management programme (see www.osservatoriocostesardegna.eu website).An important third objective (management orientation) was reached by charting the main threats and criticality of the dune areas of the 35 sample beaches monitored and studied by OCEANS. The fourth and possibly the most difficult objective aimed at establishing a continuous and regular exchange of information between the world of research and the world of local authorities; it has been partially reached. The different hydrodynamic and morpho-bathymetric responses in the bars-and-trough zone (the most dynamic area of the beach above and below sea-level) of all 35 beaches were studied according to the main wind directions included in the onshore wind sections. Slope variations and changes in volume and the position of the shoreline were studied; numerical models based on high pre-cision measurement techniques were created. Measurement was carried out seasonally (bathymetrical-topographical and sedimentological surveys at dry beach and nearshore were integrated, on some sites, using webcams and weather stations.
The coastline and continental platform of Gallura have been subject of numerous geo-morphological, sedimentological, geophysical and geological studies, carried out spo-radically since the 1970s, mainly by the University of Cagliari, as part of national and international projects. The launching of OCEANS, located at Punta Sardegna Lighthouse, centre of the database, the laboratories and Scuola di Geologia Ambientale Subacquea (school of underwater environmental geology) (Fig. 2), have provided a new input of re-search activity through the development and management of national and international projects. Through the Coastal Marine Geology Group, OCEANS has also worked on the
97
ResMar Coastal erosion monitoring - A network of regional observatories
Libro.indb 97 17/05/2013 14.41.50

renovation and organisation of Punta Sardegna Lighthouse (Fig. 2), on the preparation of two research boats and on supporting and promoting good management practices (www.osservatoriocostesardegna.eu).The “Coastal and Marine Geology Group” used, tested and implemented a series of pro-tocols and methodological standards for the study and monitoring of 35 beaches. The network was based on three beaches in the north of Sardinia and one in the south of Corsica: Cala di Trana, La Sciumara, Venalonga (Palau) and Paragan (Bonifacio) [3] [4] [5]
Figure 1 - Position of the 35 nodes of the Monitoring Network maintained by Coastal and Marine Geology Group.
98
De Muro et al. Coastal erosion monitoring - A network of regional observatories
Libro.indb 98 17/05/2013 14.41.50

[7] [8] [9] [11]. It was created in 2005, for the Interreg IIIA GERER Project “Gestion intègrèe de l’environnement à haute risque d’èrosion”, and was extended in 2006 to the beaches of Solanas (Sinnai) and Santa Margherita di Pula [7] [8] [10] [17] as part of the project “Sistema di controllo Ambientale e gestione territoriale del Golfo di Cagliari”, funded by Research, University and Instruction Ministry (M.I.U.R./Ministero Istruzione Università e Ricerca) (Fig. 1). In 2009, the network was further extended, thanks to Project LIFE+ Providune, to 8 other beaches in the south of Sardinia: Piscinnì, Su Giudeu, Campana, Sa Colonia (Domus de Maria) and Porto Giunco, Simius, Is Traias and Punta Molentis (Villasimius) [6] [12] [16] [17]. Finally, in 2010, 4 more beaches were added (Is Arenas in Narbolia, La Cinta (San Teodoro), Cala Budoni and Poetto (Cagliari) [1] [2] [20] [21] [22] [23]), thanks to the con-tribution of research projects and scholarships funded by the Sardinian Regional Govern-ment through Regional Law L.R. 7/2007 (RIsposta e Adattamento dei sistemi costieri della Sardegna alle variazioni climatiche globali – RI.A.S. and Beach Environment, management
Figure 2 - Picture of Punta Sardegna Lighthouse and OCEANS headquarters.
99
ResMar Coastal erosion monitoring - A network of regional observatories
Libro.indb 99 17/05/2013 14.41.51

And Coastal Hazard – B.E.A.C.H.). Later, the framework for the running of OCEANS permit-ted the network to include 17 other beaches: Lu Litarroni (Aglientu), Rena Majori (Aglien-tu), Badesi (Badesi, Trinità d’Agultu e Vignola), La Colba (Santa Teresa di Gallura), Porto Liscia (Santa Teresa di Gallura, Palau), Porto Pollo (Palau), Le Saline (Palau, Arzachena),
Figure 3 - Plan of the Lighthouse, ground floor and first floor.
Figure 4 - Punta Sardegna Lighthouse, operating headquarters for OCEANS and the “Centro Transfrontaliero per lo Studio della Dinamica dei Litorali” (cross-border centre for the study of coastal dynamics), before and after renovation.
100
De Muro et al. Coastal erosion monitoring - A network of regional observatories
Libro.indb 100 17/05/2013 14.41.52

Cala Ciaccaro (La Maddalena), Cala Portese (La Maddalena), Cala Corsara (La Maddalena), Cala Majore (La Maddalena), Cavalieri (La Maddalena), Grande Pevero (Arzachena), Ca-priccioli (Arzachena), Cala Sassari (Golfo Aranci), Le Saline (Olbia) and Cala Brandinchi (San Teodoro) [19]. Today we have a total of 35 beaches being monitored.
All data are stored into the database situated in Punta Sardegna Lighthouse (OCEANS headquarters), created and managed by the Coastal and Marine Geology Group (Fig. 4 and Fig. 5). The beaches are studied seasonally with the aim to evaluate sedimentary and morpho-dynamic processes, anthropic impact, criticality and evolution trends, and also to provide management guidelines.
Figure 5 - Punta Sardegna Lighthouse, inside before and after renovation.
101
ResMar Coastal erosion monitoring - A network of regional observatories
Libro.indb 101 17/05/2013 14.41.53

MethodologyThe studies are carried out according to the chart in Fig. 6. This illustrates the configura-tion of instrumentation used, the work performed and the data obtained [7] [9].
The historical reconstruction of evolution in the area is carried out for each beach using the interpretation of aerial photographs, in order to identify “macroindicators” [19] such as: extension of the dune area, position of the shoreline, distribution of marine phanero-gams (e.g. Posidonia etc.), anthropological elements (buildings and coastal infrastructure,
Figure 6 – Methodological chart created with Interreg IIIA GERER Project [7] and implemented with project LIFE+ Providune [13] [14].
102
De Muro et al. Coastal erosion monitoring - A network of regional observatories
Libro.indb 102 17/05/2013 14.41.54

for example) and hydrography. This allows evaluating the evolution in the area in short and medium term studies. All the data acquired are linked to the geodetic network points created on all the beaches (Fig. 7).
The topographical data are acquired using DGPS or GNSS and/or StarFire systems with a point sampling frequency of 1Hz. An Echosounder/DGPS system is used for the beach below sea level together with a navigation software with a sampling frequency of 5Hz. All results are referred to the UTM – WGS84 Datum coordinating system (Fig. 8).
The sediments collected from the morpho-sedimentological units (dune, emerged and submerged beach) (Fig. 9 a, b) are dealt with according to standard sedimentological methods (texture, composition and facies analysis - Fig. 9 c, d).Current direction and speed are simultaneously verified and measured (Fig. 10) and me-teorological and video data from the sample sites are collected using a remote control system of video cameras and meteorological stations (Fig. 11).
Figure 7 - Implementation of geodetic network.
Figure 8 – Morpho-bathymetrical and topographical findings in the study sites.
103
ResMar Coastal erosion monitoring - A network of regional observatories
Libro.indb 103 17/05/2013 14.41.54

This allows video-monitoring of the areas, evaluating for example: movement of the shoreline, areas affected by overwashing, duration of stranded seagrass (Posidonia) depo-sition and elimination processes, etc.
Meteorological stations collect and record other important data (wind direction, intensity and persistence, etc.) directly at the study area.Models of beach wave and hydrodynamics are created from the wind direction and inten-sity detected in the study area (Fig. 12).
Figure 10 - Current speed and direction survey.
Figure 9 - Collection of sediment samples using the Van Veen grab (a, b); analysis of sediments in labora-tory (c, d).
104
De Muro et al. Coastal erosion monitoring - A network of regional observatories
Libro.indb 104 17/05/2013 14.41.54

They are based on Digital Terrain models (DTM), built from bathymetric-topographical data, and from the results of sedimentological analyses and meteorological-climatic and current speed/direction analyses. The methodology described in projects Life+ Providune and Res.Mar “Centro Transfron-taliero” was implemented through the construction of a database infrastructure formed by Server and SAN (Storage Area Network) for archiving purposes. The territorial geographical, aerial-photogrammetric, satellite images, cartographical, bathymetrical-topographical (DTM), sedimentological, wind, wave and hydrodynamic (in raster and vectorial format) data was constructed, archived and indexed in GIS format, in accordance with EU INSPIRE normative and Italian Law D.L.g.s. 32/2010.
Through the elaboration and interpretation of all data, scientific results are obtained, pro-viding the basis for applications and evaluations such as: detection of evolution trends, seasonal sequences, dune vulnerability (DVI/GAVAM checklist [15]), erosion vulnerability, physical load capacity, pressure and impact on the beach system. The method provides information for the elaboration of management guidelines and for the planning of conservation works. The results are available to a wide public of potential users in scientific publications and journals and in a WebGIS (www.osservatoriocostesardegna.eu).
Figure 11 - Remote control system with Video-Meteo centre (a); acquisition software screen for video im-ages (b); meteorological data acquisition software screen (c).
a b
c
105
ResMar Coastal erosion monitoring - A network of regional observatories
Libro.indb 105 17/05/2013 14.41.55

ConclusionsThe Osservatorio Coste E Ambiente Naturale Sottomarino, OCEANS, was created thanks to the work of the Coastal and Marine Geology Group – University of Cagliari, at Punta Sardegna Lighthouse (OCEANS). The numerous research projects carried out since 2000 have provided information to create a network for the study and monitoring of 35 beach-es in Sardinia. A new methodology has been experimented and implemented since 2005. This has focused on the study of sedimentological and morphodynamic processes of wave-dominated microtidal beaches in a Mediterranean environment. The study began in 2005 as part of the Interreg IIIA GERER Project, and was applied and developed within Project Progetto LIFE+ Providune. In 2010, the network was extended to include a total of 35 sites under study and monitoring, as part of projects L.R. 7/2007 RI.A.S. and B.E.A.C.H., and ResMar Sottoprogetto B “Centro Transfrontaliero studio dinamica dei litorali”.The extension of the methodology used, permitted OCEANS to create a database for collecting, cataloguing, archiving and analysing aerial-photogrammetric, satellite image, cartographical, bathymetrical-topographical, sedimentological, wind, wave and current data related to the beach systems studied by the “Coastal and Marine Geology Group” from University of Cagliari.
Figure 12 – Examples of wave refraction and hydrodynamics: a) vectors of the wave front; b) vectors of the hydrodynamic flow; c) representation of energy associated to hydrodynamic flows; d) representation of bar-and-trough area (surf zone).
106
De Muro et al. Coastal erosion monitoring - A network of regional observatories
Libro.indb 106 17/05/2013 14.41.55

The data collected, catalogued, archived and analysed has been published in the usual scientific channels and also on a WebGIS platform on the OCEANS website (www.osserva-toriocostesardegna.eu) and are stored in a server, created by and housed in the Depart-ment of Chemical and Geological Sciences of the University Cagliari. Data flow is made available from OCEANS to the “Centro Transfrontaliero per lo studio della dinamica dei litorali” (cross-border centre for the study of coastal dynamics).Together, the methodology, database system and publication through WebGIS allow pro-viding, for a large number of beaches in Sardegna guidelines for management and plan-ning of conservation works, accessible to a wide public of potential users.
AcknowledgementsWork carried out with project funding:Interreg III A “It, Fr, Isole” “Gestione ambientale integrata in località ad alto rischio d’erosione” GERER; LIFE+ NATURE & BIODIVERSITY – PROVIDUNE (LIFE07NAT/IT/000519), “Conservazione e ripristino di habitat dunali nei siti delle Province di Cagliari, Matera e Caserta”. Progetto RIAS - RIsposta e Adattamento dei sistemi costieri della Sardegna alle variazioni climatiche globali. Legge regionale 7 Agosto 2007, N. 7: “Promozione della ricerca scien-tifica e dell’innovazione tecnologica in Sardegna”- Annualità 2008.Programma Operativo di Cooperazione Territoriale Transfrontaliera Italia-Francia “Marit-timo” - ResMar. “Rete per l’ambiente nello spazio marittimo” – Sottoprogetto B) Centro Transfrontaliero studio dinamica dei litorali. Progetto B.E.A.C.H, – Beach Environment, management And Coastal Hazard (ambiente spiaggia, gestione e rischio costiero). Legge regionale 7 Agosto 2007, N. 7: “Promozione della ricerca scientifica e dell’innovazione tecnologica in Sardegna” - annualità 2009
References[1] Batzella T., Pusceddu N., Kalb C., Ferraro F., Ibba A., DeMuro S. – Bars and troughs
dynamic and evolution trend of La Cinta beach (San Teodoro OT) - NE Sardinia, Rend. Online Soc. Geol. It., Vol. 17 (2011), 17-23 (DOI 10.3301/ROL.2011.13).
[2] Batzella T., Pusceddu N., Kalb C., Ibba A, Ferraro F., DeMuro S. – Bars and troughs dynamic and short-term evolution of two beaches on NE Sardinia: La Cinta (San Teo-doro, OT) and Budoni (OT), in: Abstract 28th IAS Meeting of Sedimentology, Zarago-za, Spain - July 5-8th 2011 (Eds. B. Bàdenas, M. Aurell and A.M. Alonso-Zarza), p.145. ISBN 978-84-615-1755-8.
[3] De Falco G., Simeone S., Batzella T., Cancemi G., Cancemi M, DeMuro S. –Arretra-mento della linea di riva e rimozione della banquette di Posidonia oceanica nella spiaggia di Paragan (Corsica meridionale), Atti del “84° Congresso Nazionale della Società Geologica Italiana” 15-17 Settembre 2008, Sassari - Rend.online Soc. Geol. It., 3 (2008), 296-297. ISSN 2035-8008.
[4] De Falco G., Simeone S., DeMuro S. - Analisi della dinamica deposizionale delle ban-quette di Posidonia oceanica nella spiaggia di Cala di Trana (Palau) mediante video-monitoraggio, in De Muro S. e De Falco G. (A cura di) - Manuale per la gestione delle spiagge - Studi, indagini ed esperienze sulle spiagge Sarde e Corse, University press – Scienze Costiere e Marine, CUEC (2010), 136-150. ISBN 978-88-8467-629-0.
107
ResMar Coastal erosion monitoring - A network of regional observatories
Libro.indb 107 17/05/2013 14.41.55
[5] De Falco G., Simeone S., Solinas G., Batzella T., Cancemi G., Cancemi M., DeMuro S. – Relazione tra arretramento della linea di riva e rimozione delle banquette di Posidonia oceanica nella spiaggia di Paragan (Corsica meridionale), in De Muro S. e De Falco G. (A cura di) - Manuale per la gestione delle spiagge - Studi, indagini ed esperienze sulle spiagge Sarde e Corse, University press – Scienze Costiere e Marine, CUEC (2010), 151-163. ISBN 978-88-8467-629-0.
[6] De Muro S., Ibba A., Ferraro F., Ferrara C., Batzella T., Pusceddu N., Kalb, C. - Mor-pho-sedimentological map of Chia beaches - SCI ITB042230 “Porto Campana” (SW Sardinia, Mediterranean Sea - Italy), Atti del “29th IAS Meeting of Sedimentology Schladming, Austria 10th-13th September 2012, p.243.
[7] DeMuro S., De Falco G. (a cura di) – Manuale per la gestione delle spiagge - Studi, indagini ed esperienze sulle spiagge sarde e corse, University press – Scienze Costiere e Marine, CUEC. ISBN 978-88-8467-629-0 (2010), pp. 368.
[8] DeMuro S., Batzella T., Kalb C., Pusceddu N. – Processi sedimentari, idrodinamica e modellizzazione delle spiagge di Santa Margherita, Solanas, Cala di Trana e La Sciu-mara (Sardegna – Italia), Atti del “84° Congresso Nazionale della Società Geologica Italiana” 15-17 Settembre 2008, Sassari - Rend.online Soc. Geol. It., 3 (2008), 308-309. ISSN 2035-8008.
[9] DeMuro S., Dore G.P. – Dove inizia il mare. Buone pratiche per lo studio, la salvaguar-dia e la gestione delle spiagge sarde, (Documentario) Atti scientifici e divulgativi del Progetto Interreg IIIA GERER “Gestion intègrèe de l’environnement à haute risque d’èrosion” (2008), Università degli Studi di Cagliari.
[10] DeMuro S., Kalb C.– Distribuzione sedimentaria, moto ondoso e monitoraggio della spiaggia di Solanas (Sinnai - Sardegna Sud-Orientale), in De Muro S., De Falco G. (A cura di) - Manuale per la gestione delle spiagge - Studi, indagini ed esperienze sulle spiagge Sarde e Corse, University press – Scienze Costiere e Marine, CUEC (2010), 260-288. ISBN 978-88-8467-629-0.
[11] DeMuro S., Kalb C., Batzella T., Pusceddu N. – Morfologia, idrodinamica e sedimento-logia dei sistemi di spiaggia di Cala di Trana, La Sciumara e Venalonga (Palau - Sarde-gna Nord Orientale), in De Muro S., De Falco G. (A cura di) - Manuale per la gestione delle spiagge - Studi, indagini ed esperienze sulle spiagge Sarde e Corse, University press – Scienze Costiere e Marine, CUEC (2010), 103-135. ISBN 978-88-8467-629-0.
[12] DeMuro S., Kalb C., Ferraro F., Batzella T., Pusceddu N., Ferrara C., Ibba A. – Sedimen-tary and morphodynamic processes of microtidal wave dominated mediterranean beaches (Villasimius - SE Sardinia), Riassunti del “Quarto Simposio Internazionale - Il monitoraggio costiero Mediterraneo: problematiche e tecniche di misura” Livorno 12-13-14 Giugno 2012, pp. 107-108.
[13] DeMuro S., Kalb C., Ferraro F., Batzella T., Pusceddu N., Ferrara C., Ibba A. – Develop-ment of monitoring network and methodology for the study of sedimentary and morpho-dynamics processes of microtidal wave dominated mediterranean beaches (Sardinia), Atti del “Quarto Simposio Internazionale - Il monitoraggio costiero Medi-terraneo: problematiche e tecniche di misura” Livorno 12-13-14 Giugno 2012, pp. 229-236. ISBN 978-88-95597-13-3.
[14] DeMuro S., Kalb C., Ferraro F., Batzella T., Pusceddu N., Ibba A. (2012) – Attività dell’Osservatorio Coste E Ambiente Naturale Sottomarino (O.C.E.A.N.S.) e implemen-
108
De Muro et al. Coastal erosion monitoring - A network of regional observatories
Libro.indb 108 17/05/2013 14.41.55

to della rete di monitoraggio e delle metodologie per lo studio dei processi sedimen-tari e morfo-dinamici di spiagge mediterranee microtidali dominate da moto ondoso (Sardegna). Atti della Giornata di Studio “La tutela del mare dagli inquinamenti di tipo accidentale” 18/05/2012 – Scuola Sottufficiali Marina Militare “MOVM Domenico Bastianini” - Litografia Mariscuola La Maddalena – pp. 31-55.
[15] DeMuro S., Kalb C., Ibba A., Batzella T., Pusceddu N., Ferrara C., Ferraro F. – Coastal dunes vulnerability. GAVAM checklist method used at three mediterranean microtidal wave dominated beaches (Gulf of Cagliari), Rend. Online Soc. Geol. It., Vol. 17 (2011), 77-82 (DOI: 10.3301/ROL.2011.26).
[16] DeMuro S., Kalb C., Ibba A., Ferraro F., Ferrara C. – Sedimentary processes, morpho-dynamics and sedimentological map of Porto Giunco-Simius-Is Traias beaches (Vil-lasimius - SE Sardinia), Atti del Convegno GeoSed 2010, Torino, 25-26.
[17] DeMuro S., Kalb C., Ibba A., Ferraro F., Ferrara C. – Sedimentary processes, morpho-dynamics and sedimentological map of “Porto Campana” SCI beaches (Domus de Maria - SW Sardinia), Rend.online Soc. Geol. It., 11(2010), 756-757. ISSN 2035-8008.
[18] DeMuro S., Lai A., Pusceddu N., Kalb C. - Relazione tra idrodinamica e processi di sedimentazione nella spiaggia di Santa Margherita di Pula (Golfo di Cagliari – Sarde-gna Sud-Occidentale), in DeMuro S., De Falco G. (A cura di) - Manuale per la gestione delle spiagge - Studi, indagini ed esperienze sulle spiagge Sarde e Corse, University press – Scienze Costiere e Marine, CUEC (2010), 225-259. ISBN 978-88-8467-629-0.
[19] DeMuro S., Pusceddu N. (A cura di) - Atlante delle spiagge della Gallura – evoluzione recente, regime, assetti, tendenza e criticità di dieci sistemi di spiaggia campione, University press – Scienze Costiere e Marine, CUEC (2012), p. 237. ISBN 978-88-8467-732-7 (in press).
[20] DeMuro S., Pusceddu N., Batzella T., Ibba A., Ferraro F., Kalb C. – Evolution trend of La Cinta beach (San Teodoro) after the flooding on 24th September 2009, Atti del Convegno GeoSed 2010, Torino, 27.
[21] Ferrara C., Ibba A, Usai A., Onnis A., Kalb C., DeMuro S. - Dati preliminari sulla dinam-ica di due sistemi costieri sardi: Is Arenas di Narbolia (sardegna Centro-occidentale) e Villasimius (Sardegna Sud Orientale), in DeMuro S. e De Falco G. (A cura di) - Manuale per la gestione delle spiagge - Studi, indagini ed esperienze sulle spiagge Sarde e Corse, University press – Scienze Costiere e Marine, CUEC (2010), 289-323. ISBN 978-88-8467-629-0.
[22] Pusceddu N., Batzella T., Kalb C., Ferraro F., Ibba A. & DeMuro S. – Short-term evolu-tion of Budoni beach on NE Sardinia, Rend. Online Soc. Geol. It., Vol. 17 (2011), 155-159 (DOI: 10.3301/ROL.2011.45).
[23] Pusceddu N., Batzella T., Kalb C., Ferraro F., Ibba A., DeMuro S. – Medium and short-term evolution of two beaches on NE Sardina: La Cinta (San Teodoro, OT) and Budoni (OT), Proceedings of the “34th International Geological Congress 2012”, Brisbane, Australia, 5–10 August 2012, p.1319 ISBN 978-0-646-57800-2.
109
ResMar Coastal erosion monitoring - A network of regional observatories
Libro.indb 109 17/05/2013 14.41.55

Libro.indb 110 17/05/2013 14.41.55

111
ResMar Coastal erosion monitoring - A network of regional observatories
Sardinian Center for Coastal Monitoring and Assessment
Alessio Satta1, Maurizio Costa2; Stefano Renoldi3
1Agenzia Conservatoria delle coste della Sardegna, via Mameli 96, 09123 Cagliari, Italy. Email: [email protected]
2Criteria srl, via Cugia 14, Cagliari, Italy. Email: [email protected]
3CRENOS, via S. Giorgio 12, 09124 Cagliari, Italy.Email: [email protected]
AbstractArticle 16 of the ICZM Protocol identifies the functional tools for integrated management as appropriate mechanisms for coastal monitoring and observation, existing or newly es-tablished. The sardinian governamental agency Conservatoria delle coste within its insti-tutional mandate for the coordination of ICZM activities in Sardinia has set up a Sardinian Center for Coastal Monitoring and Assessment. As in many other Mediterranean countries the coastal areas observation and monitoring activities in Sardinia are performed by sever-al institutional stakeholders. The main objective of the Center is to provide coordination of the different stakeholders including evaluation and monitoring of the implementation and development of integrated coastal management policies. To this aim the Center provides information needed to assess main impacts generated by natural and human activities on marine and coastal environments, as referred to the objectives of ICZM, throught the use of a significant set of monitoring indicators. At the same time the Center proposes con-crete solutions for adaptation according to ICZM objectives acting as a decision support system for policy making at regional and local level. The methodological approach behind the implementation of the Center for Coastal Monitoring and Assessment recognises the coordination role that Conservatoria may have regarding local authorities and regional stakeholders responsible for the management of coastal areas.
IntroductionThe contents of this document aim at the identification and definition of the principles and conceptual background needed for the construction of the Sardinian Center for Coastal Monitoring and Assessment, which shall be named the “Centre”, consistent with the Inte-grated Coastal Zone Management criteria.The document is organised as follows:
- the strategic and institutional framework, which identifies the basic ICZM principles
Libro.indb 111 17/05/2013 14.41.55

112
Satta et al. Coastal erosion monitoring - A network of regional observatories
and criteria and the minimum requirements for coastal monitoring and observation, considered in the ICZM Protocol;
- the framework of competences in the field of territorial observation and monitoring articulated by various institutional levels in Sardinia;
- the aims and objectives proposed for the setting up of a regional Coastal Zone Obser-vatory, named as “Centre”;
- the thematic fields of observation that structure the scope of the Centre, based on ICZM principles and criteria;
- the minimum requirements of the different fields of view considered to be the func-tional structure of the Centre, part of which is proposed as an initial list of indicators and spheres of relationships in support of the evaluation of the ICZM implementation status in the regional context .
Institutional strategic frameworkICZM is widely considered the most efficient approach for achieving sustainable develop-ment of coastal areas. ICZM recognizes an approach to environmental, socio-cultural and territorial planning, and integrated resource planning, in relation to their different uses. In this sense, the integrated management is conducted with the overall objective of achieving sustainable development of the coastal area, through a strategic approach that is based on sustainable management of natural resources on a long-term perspective, respect for socio-cultural issues, involvement of local communities and a better coordination of activi-ties and institutional responsibilities.ICZM in the Mediterranean refers to two types of policy drivers, which come from the Unit-ed Nations and the European Commission. The United Nations Environment Programme (UNEP) has been active in the Mediterranean since 1975, with the adoption of the Mediter-ranean Action Plan (MAP), that was introduced by the Barcelona Convention (Convention on the Protection of the Mediterranean Sea against Pollution), by which Integrated Coastal Zone Management (ICZM) initiatives have been brought forward. Since 1995 the European Commission (EC) launched a Demonstration Programme on ICZM in order to assess the state of the art in the coastal areas of the member states. The work of the European Parlia-ment and of the Council has finally led to the publication of the Recommendation from 30 May 2002 concerning the implementation of Integrated Coastal Zone Management in Europe (2002/413/EC), which determines the principles and national strategies that Mem-ber States should achieve, in cooperation with regional and interregional authorities, to promote and implement integrated management.Italy, already a party to the Barcelona Convention, has also signed the Protocol on Inte-grated Coastal Zone Management (ICZM Protocol), adopted under the Plenipotentiary Diplomatic Conference held in Madrid on 20 and 21 January 2008 and “Since furthering knowledge of coastal systems is a key condition for the development of management policies, the Protocol includes an article on monitoring and observation mechanisms and networks” (Billé and Rochette, 2010). Article 16 of Part Three of the Protocol, in particular, identifies the functional tools for inte-grated management as appropriate mechanisms for coastal monitoring and observation, existing or newly established. In detail, it highlights the need to maintain regularly updated national inventories of coastal zones regarding information on resources, activities, insti-
Libro.indb 112 17/05/2013 14.41.56
113
ResMar Coastal erosion monitoring - A network of regional observatories
tutions, legislation and planning tools. In this context, the monitoring and observation of coastal areas must be developed within a network of cooperation and organisation along the Mediterranean, scientifically and institutionally. To this end, the Protocol refers to the need to identify, between the Contracting Parties, tools and reference procedures for the standardisation of the information contained in the national inventory.The observation of coastal zones is interpreted as a structured repertoire of available in-formation regarding the status and trends of coastal areas, so as to be made accessible to local communities and all relevant territorial stakeholders, both public and private.
Overview of competences on coastal zone observation in SardiniaRegional Law n. 9, from 12 June 2006 (LR 9/2006), represents the first effort to transfer powers from Sardinia Region to Local Authorities, implementing Legislative Decree no. 234 (17 April 2001), in accordance with the principles laid down in Articles 118 and 119 of the Constitution, as well as Article 10 of the Constitution Act (18 October 2001), no. 3 (Amend-ments to Title V of Part II of the Constitution).With particular regards to the functions of the Region in the field of environmental protec-tion, art. 43, paragraph 1, a) of the same LR 9/2006 states that the Region concentrates all duties and functions related to, among other things, the “definition of general criteria for interventions on the protection and observation of the coastal zone.”For this purpose the preservation, protection and enhancement of coastal ecosystems is a specific competence of the “Conservatoria delle coste della Sardegna” (the Sardinian coastal conservation agency), established by article 16 of Regional Law no. 2/2007. The Statute reports the institutional purposes (Article 2 of the Statute), and establishes the need for preservation, protection and enhancement of coastal ecosystems, and integrated management of coastal zones of particular landscapes and environments. Among the functions (article 3, paragraph 1 of the Statute), stands the coordination of re-gional initiatives on integrated management of coastal zones from other Italian regions (a), the elaboration of guidelines and criteria for interventions on protection and observation of coastal areas (d), as well as the exercise of powers of the Regions in the field of public maritime domain adjacent to the coastal conservation areas entrusted to the Agency (g), and the determination of forms and tools for collaboration and exchange of information with the local government system and with other institutions and organisations responsi-ble for land management (l).In the light of these regulatory provisions concerning the “Assignment of Functions and Responsibilities to Local Authorities”, contained in LR 9/2006, Art. 44 paragraph 1, a), the region has attributed to local authorities the functions of environmental protection (“pro-tection and observation of coastal areas within the province”). Article 5, paragraph 1 of this Regional Law sets out the functions conferred to the province, such as:a. gather and coordinate proposals from municipalities, for the purpose of assessing Re-gional economic, territorial and environmental impact;b. contribute to the determination of acts of regional planning in accordance with rules dictated by regional law;c. formulate and adopt, with reference to the provisions and objectives of the regional programme acts, its multi-annual programmes, both general and sectorial, and promote the coordination of activities in the municipalities;
Libro.indb 113 17/05/2013 14.41.56

114
Satta et al. Coastal erosion monitoring - A network of regional observatories
In particular, the following paragraph 3 stipulates that the Province takes on the functions and tasks that affect large inter-municipal areas or the entire province, whose materials are included in “soil conservation, protection and enhancement of the environment and prevention of disasters “and” protection of flora and fauna, parks and nature reserves.” Therefore, in carrying out protection and observation activities coastal provinces must comply with the guidelines and criteria defined by the Conservatoria delle coste.
Observation of coastal zones: aims and objectivesThe preliminary analysis of the Sardinian context shows that currently coastal areas obser-vation and monitoring activities are performed by several institutional stakeholders.The main objective of the Centre is to provide coordination of the different stakeholders including evaluation and monitoring of the implementation and development of integrat-ed coastal management policies. In order to steer integrated management on the Sardinian coastal zones in the right direc-tion, the centre has, the following key tasks:
- to promote the integration of planninq and policy of the sectors and policy-making levels by monitoring new developments in planning and policy, and by playing a part, in an advisory capacity, during the realization thereof.
- to foster cooperation between the policy-making levels and sectors via consultative meetings, and by citing, as much as possible, initiatives at other levels or in other sec-tors and by actively encouraging cooperation.
- to act as an point of contact for lntegrated Coastal Zone Management for the various levels of government and other key players on the coast and to offer every private individual, agency or government body the opportunity, via a centralized forum, to ask coast-related questions.
- to monitor Mediterranean and European developments in Integrated Coastal Zone Mangement by participating in coastal forums or other consultative platforms on coastal zone management.
In addition to these four key tasks, the centre will also: - monitor significant activities that serve to develop the coast and try and shed light on the motives thereof within an overall strategy of sustainable development;
- keep a record of the data and then, out of that, distil a set of effective sustainability indicators for the coastal zone;
- keep an up-to-date inventory of ongoing and new projects and initiatives in the coast-al zone;
- commission others to make goal-oriented studies; - communicate about integrated management at the Sardinian coastal zones.
These issues require the definition of: - a framework to coordinate data acquisition and collection, and the construction of a structured database;
- the definition of interpretative models and their systems of functional indicators to monitor the status of the development and implementation of integrated manage-ment of the Sardinian coast.
The conceptual model behind the activation of the Centre recognises the coordination
Libro.indb 114 17/05/2013 14.41.56

115
ResMar Coastal erosion monitoring - A network of regional observatories
role that Conservatoria may have regarding local authorities and regional stakeholders responsible for the management of coastal areas.The contribution of the Conservatoria delle coste, with specific expertise in the field of in-tegrated coastal management, should therefore address the selection of relevant informa-tion fields (thematic dataset) as well as the acquisition, processing and eventual promotion of initiatives aimed at the production of new data.The final aim is to make an assessment of the implementation state of sustainable devel-opment policies and at the same time to monitor the status and evolution of integrated coastal management processes in the regional context.
Conceptual background Integrated coastal zone management is developed with the overall objective of achieving sustainable development in the coastal zone, through a strategic approach that is based on sustainable management of natural resources on a long-term perspective, respecting socio-cultural development of local communities and promoting better coordination of activities and institutional competences.According to the proposed approach the following principles will inspire the activities of the Centre:a. coherence between actions and regulatory instruments within the same territorial ju-risdiction field (the coast) of European, national and regional policies. In this context, it should be supported by the monitoring of all the legal and administrative acts for the transfer of functions and tasks related to the various levels of government. Based on need and function surveys, the Conservatoria delle coste promotes specific corrective actions for the institutions involved;b. coherence between planning instruments and planning at different institutional levels, both vertical (Regions, Provinces, Municipalities) and horizontal (including regional). These aspects should be implemented through the use of tools provided by law (e.g. Strategic Environmental Assessment) with the aim of verifying the external coherence between local and supra-local planning instruments. However, in this context it is worth checking that the degree of coherence can direct the action of the Conservatoria delle coste to the proposi-tion of corrective activities on two levels of intervention: Operational (definition of sus-
tainability criteria for different coastal contexts in the region) and strategic (proposal of incentives aimed at pro-moting integration);c. in view of the evaluation model se-lected (eg. DPSIR model), the Conserv-atoria processes the most appropriate models of interpretation for the evalu-ation of the relationships between fac-tors of pressure and state of resources, in order to verify the implementation status of integrated coastal zone man-agement processes;d. assessment of the degree of partici-
Figure 1 - Level of correlation between different thematic fields of observation.
Libro.indb 115 17/05/2013 14.41.56

116
Satta et al. Coastal erosion monitoring - A network of regional observatories
pation of local stakeholders involved in the process of selecting strategic options imple-mented at different institutional levels.The level of correlation between the different thematic fields of observation declines through an iterative and cyclic process so that the cognitive elements developed within each field of analysis are, at least in part, useful and influenced by the findings of its other thematic fields. The system of relation is graphically represented below.
Minimum requirements for field of observationA fundamental prerequisite for the definition and implementation of the minimum re-quirements related to the fields of observation is the definition of the spatial reference. In this regard, it is believed that the coast as identified by the Regional Landscape Plan (PPR) represents the appropriate context of reference. On this basis, in order to take into account the specificities of the different naturalistic, en-vironmental, socio-economic and urban contexts in relation to the state and the evolution dynamics of the coastal zone, the analysis is referred to the Physiographic Units defined in the PPR. The spatial unit of reference can be represented by the Watersheds underlying the Physi-ographical Unit and extended at least to the border defined by the setback zone according to the PPR.For the purpose of observation of the marine zone the reference unit can be extended to include Posidonia oceanica or the territorial sea (12 nautical miles from the coast).It should be noted, moreover, that such spatial reference units pose the need to carry out an analysis of the information available on administrative scale related to the same unit. These are generally re-lated to the factors of human pressure detectable in the community (for exam-ple, demographics, tourist flows, pro-duction activities, etc.). While the acqui-sition and processing of data is carried out on the basis of local and supra local administrative areas (municipalities and provinces), the evaluation analysis and its results will be related to the scale of the Physiographic Unit.The following lists the minimum re-quirements for the acquisition and anal-ysis of information in the different fields of observation:a. the purpose of monitoring the state of horizontal (same institutional level) and vertical (different institutional level) coordination of programming and planning actions at the regional level,
Figure 2 - Example of Physiographic Unit in the central-western coast of Sardegna, and limit of setback zone ac-cording to PPR.
Libro.indb 116 17/05/2013 14.41.56

117
ResMar Coastal erosion monitoring - A network of regional observatories
the issues considered relevant are: - assessing the level of consistency between plans and programmes of the same and higher levels, with particular reference to reports and inference;
- assessing the level of coherence between the objectives of plans and programs and environmental sustainability criteria promoted by sustainable development policies in coastal areas;
- recognising the implementation of monitoring activities within implementation of plans and programmes and their effects on the coastal and marine environments.
These minimum requirements are functional on the one hand to check the implementation status of ICZM processes by means of territorial government, and secondly to refine the objectives of ICZM as a trade-off between regional and local needs.In this context, the observation of the regulatory framework is embodied in the creation of a structured repertoire of functions and institutional capacity for the analysis and evalua-tion of existing relations in the fields of:
- marine and coastal area protection; - maritime domain management; - urban settlement; - aquaculture or fisheries related activities; - agriculture and zootechnics; - industrial activities; - maritime infrastructures and ports; - tourism; - historical, archaeological, cultural and landscape assets; - energy resources.
On this basis, local and regional institutions that are the subject of monitoring activities in their respective areas of responsibility are, as a priority, identified as:
- Environmental Protection Department, Nature Conservation and Soil Protection De-partment;
- Department of Local authorities, Finance and Planning, Directorate-General for Local authorities and Finance (Regional Property and assets) and Directorate-General for Planning and supervision of construction (Planning, Information System and Territorial transformations);
- Department of Industry; - Department of Public Works and Services, roads and transport infrastructure and ser-vice operations in the territory;
- Department of Transportation; - Department of Tourism and handcrafts; - Regional Agency for Environmental Protection of Sardinia (ARPAS); - Regional agency for the implementation of programs in the field of agriculture and rural development (Laore);
- Basin Authority, River Basin District Agency of Sardinia; - Regional Forests Agency.
b. The Centre intends to provide the basic information needed to identify main impacts generated by the action of natural processes and human activities on marine and coastal
Libro.indb 117 17/05/2013 14.41.56

118
Satta et al. Coastal erosion monitoring - A network of regional observatories
environments and at the same time to propose concrete solutions for adaptation accord-ing to ICZM objectives. In this sense, the activity of the Centre is more complex than a mere collection and update of information. The most ambitious aim of the Centre is to become a decision support system for policy making at regional and local level.In this context, the acquisition of information and control of their evolution status can be directed to:
- the analysis of relationships between ecosystems, urban and socio-economic devel-opment, in order to assess the current or potential conflicts between different uses for the sustainability of environmental resources in the coastal area. In particular, the as-sessment of current or potential interference should go through knowledge, analysis and processing of cognitive data regarding the natural and anthropogenic pressures and the related impacts in the coastal area, to this extent; in addition to the creation of the environmental matrix, the analysis of pressures cannot be separated from the recognition of the existing projects in terms of works and infrastructure projects in marine and coastal areas (roads, defence works, harbour works, etc.);
- the evaluation of the relationship systems which are activated at contextual and mul-tiple uses of marine and coastal resources. In this sense, it would be appropriate to proceed to the analysis of cumulative impacts on the environment as well as the inter-ference generated, in terms of conflicts or synergies, which are activated in the same multiple uses of environmental resources.
c. The reconstruction of the strategic debate conducted in the area, as part of institutional initiatives that promote a widespread participation of local stakeholders, is an essential element for the verification and assessment of how the participatory processes have gen-erated shared lines of action with the common aim of achieving a more sustainable devel-opment of the coastal areas.The minimum requirements for an effective monitoring of participation activities related to the implementation of sustainable coastal processes are identified as:
- research and classification of participatory processes on the basis of legal and admin-istrative procedures, developed or voluntary;
- research and classification of participatory processes according to stakeholder in-volvement methodologies;
- verification of the level of participation of local stakeholders according to their typol-ogy (stakeholder, public, public-private partnerships, etc.)
- checking the level of consistency between policy options shared in participatory pro-cesses and type of actions actually implemented at the local level.
The system of indicatorsThe assessment of the state of the environmental components and the effects generated by uses and activities, as referred to the objectives of ICZM, is related to the identification of a significant set of monitoring indicators. In particular, in the selection of indicators it is desirable to consider the following characteristics:
- Relevance: relevance of the indicator to the criteria and principles of ICZM; - Significance: the ability of the indicator to represent the issues, clearly and effectively;
Libro.indb 118 17/05/2013 14.41.56

119
ResMar Coastal erosion monitoring - A network of regional observatories
- Indicators: data availability; - Upgradability: possibility of new values of the same series that allow updating the indicator;
- Cost-effectiveness: balanced use of resources for the retrieval of data useful for indica-tor definition in relation to information contained in the same indicator;
- Highest level of significant detail: ability to represent the spatial distribution of the geo-referenced information;
- Communicability: immediate comprehension by an audience composed of technical and non-technical participants; ease of interpretation and representation through the use of tools such as tables, charts or maps;
- Sensitivity: the ability to record significant changes in environmental components in-duced by uses and activities,
- response time sufficiently short: so as to reflect changes resulting from uses and ac-tivities on the components;
- spatial footprint: in order to represent the performance space of the phenomena to which it refers (if geo-referenced information is available, GIS maps can be used for a better explanation of the process).
The choice of indicators can be assessed from indicators of sustainable development (Sus-tainable Development Indicators) proposed by the “Indicators and Data” Working Group (WG-ID) of the European Union and those adopted by the Environmental Action Strategy for Sustainable Development in Italy, defined by the Ministry of Environment. The WG-ID was created by the European ICZM expert group to draw up a list of indicators and to provide assistance and coordination to member states and candidate countries on how to create databases. The indicators proposed by WG-ID at the end of 2003 are divided into two types:
- Progress indicators - indicators identified to measure progress in the implementation of ICZM;
- Indicators of Sustainable Development (ISD) - a set of 27 indicators, made in 46 sizes for monitoring sustainable development in coastal areas.
However, with respect to the lists of indicators for sustainable development adopted by the Ministry of Environment for the “Environmental Action Strategy for Sustainable Development in Italy”, they have been defined for the four different thematic priority areas in which the Strategy was articulated (the same indicated by the Sixth Environmental Action Plan of the EU) in line with the indicators of the Report on the State of the Environment in Italy in 2000.
The system of relations between uses and activities in coastal areasThe analysis of the interference generated between the different uses of the marine and coastal environmental resources must highlight the conflicting relationships or synergies that are activated between uses and activities in coastal areas. The minimum requirements for the relation analysis must have the following activities:
- Conservation of habitats and species - Preservation of cultural heritage - Tourism - Yachting and Cruising - Fishing - Aquaculture
Libro.indb 119 17/05/2013 14.41.56

120
Satta et al. Coastal erosion monitoring - A network of regional observatories
- Agriculture - Shipping - Maritime Infrastructure - Industry - Production of energy - Coastal Defence - Urbanisation
Conservation of habitats and species can have a positive impact on the development of tourism in coastal areas when the protection is directed also to the enhancement of coastal ecosystems, as is often pursued in Natura 2000 sites, where many economical activities are compatible with the need for conservation. Tourism development, characterised by a strong demand for accommodation, often close to coastal ecosystem services (such as beaches and wetlands), frequently opposes the needs of environmental conservation, cre-ating significant impacts on the natural environment, sometimes with irreversible effects.Industrial activities and intensive agriculture, on the other hand, may experience specific negative interference on the development of productive activities related primarily to the potential growth of tourism (attracted by the enhancement of environmental quality in the coastal area) and aquaculture (e.g., because of nitrate contamination of water bodies - surface and underground).
Table 1 - Relation Matrix between activities and uses.
Coas
tal h
abita
t co
nser
vatio
n
Cultu
ral h
erita
ge
cons
erva
tion
Tour
ism
Yach
ting
and
Crui
sing
Fish
ing
Aqua
cultu
re
Agric
ultu
re
Ship
ping
Mar
itim
e In
fras
truc
ture
Indu
stry
Ener
gy
prod
uctio
n
Coas
tal D
efen
ce
Urb
anis
atio
n
Coastal habitat conservation X X X X X X X X X X X
Cultural heritage conservation X X X X
Tourism X X X X X X X X X
Yachting and Cruising X X X X X X
Fishing X X X X X
Aquaculture X X X X X
Agriculture X X X X X
Shipping X X X
Maritime Infrastructure X X X X
Industry X X X X X X X X X X
Energy production X X X
Coastal Defence X X X X X X
Urbanisation X X X X X X
Libro.indb 120 17/05/2013 14.41.57

121
ResMar Coastal erosion monitoring - A network of regional observatories
Coastal defence interventions, in particular those realised through soft techniques, that respect natural coastal dynamics, can have a positive impact on the conservation of coastal habitats, while at other times the need for action for mitigating coastal erosion contrasts with the need to establish or expand port facilities (existing or new).Finally, the widespread urbanisation in the coastal zone can cause significant interference on the conservation and protection of marine and coastal natural resources and environmental systems, both directly, with the removal of soil and permanent occupation of ecosystems, and indirectly, with the alteration of spontaneous evolution processes of environmental components, which may occur through flooding, coastal erosion and slope instability.Below there is a summary of possible interference relationships (positive or negative) that can be activated between different activities and resource uses.
Management of the centreThe contents emerged so far point to the need of defining a hypothesis of technical-functional operational management tools and procedures for the Centre. In detail, a list of minimum required fields and their professional roles is presented:
- regulatory and administrative and legal aspects (lawyers); - issues concerning urban and regional planning (engineers and architects); - issues concerning environmental matters, with competence in the physical processes and abiotic environmental components of coastal and marine systems (geologists, geomorphologists, environmental scientists);
Figure 3 - Management structure of the Centre.
Libro.indb 121 17/05/2013 14.41.57

122
Satta et al. Coastal erosion monitoring - A network of regional observatories
- issues concerning environmental matters, with expertise on biological processes and biotic characteristics of the coastal and marine systems (biologists, naturalists);
- aspects of hydraulics and maritime infrastructure (sea and coastal engineering); - aspects of economic and social issues, with expertise in local and sustainable develop-ment (economists);
- aspects of digital mapping and processing techniques using GIS/Geographic Informa-tion Systems and Management (engineers, naturalists, geologists, etc.).
A first draft of the Centre management structure is presented in the following chart.
As part of its activities, the Centre has the opportunity of representing in a concise and practical way the state of Sardinian coastal areas with reference to environmental conser-vation and economic development within a framework of integrated coastal zone manage-ment.A periodic publication (a “Regional Report on the State of Sardinian Coastal Zones”) will be prepared by the Conservatoria delle coste as the result of the analysis and evaluation carried out by the Centre. These reports will include:
- • a snapshot of the current and previous processes taking place in coastal areas; - • proactive actions, strategic options to support territorial policies, corrective actions in line with the ICZM Protocol.
Reports must first address regional and local Public Administrations, in order to promote strategies and policies aimed at achieving a balance between use and conservation of resources. Secondly, the reports can be oriented to increase public awareness of local communities, in particular by providing a section for the non-technical summary of the findings. Reports can be produced on a yearly basis.The following is an example of articulation of minimum contents as required for the re-ports.
- Aims and objectives- Principles and conceptual aspects for ICZM - international level - regional level
- State of coastal resources - Acts and legislative instruments - Projects and planning - Environment
- Biotic and abiotic characteristics - Levels of protection and preservation
- Rural and urban development - Socio-demographic or - Economic activities
- Evaluation of potential or existing conflicts between uses and resources - pressure - impacts - risks, weaknesses, threats and trends
- Progress of the strategies and policies at different institutional levels - Region - Province
Libro.indb 122 17/05/2013 14.41.57

123
ResMar Coastal erosion monitoring - A network of regional observatories
- Municipalities - Needs and proposals for action
- cognitive gap - regulatory and institutional gap (skills, functions, etc.). - procedural (ownership, decision support systems, etc.). - prevention and mitigation of pressures and impacts - strategies and innovative actions
- Attachments (cartography, graphic and text documents, methods and models used) - Non-technical summary.
ConclusionsThis paper proposes a conceptual and strategic framework for the definition and the im-plementation of the Sardinian Observatory of Coastal Zones, laying the groundwork for the design of a methodological approach for the definition of operational functions and structure of the instrument background consistent with the principles and criteria of ICZM. In these terms, the contribution defines the thematic fields of observation and the mini-mum requirements necessary for the implementation of a tool for monitoring, control and evaluation of integrated coastal management implementation processes with respect to the regional context. Therefore, the contents proposed are functional to the elaboration of a technical project and operational tools and procedures pertinent to the achievement of a Sardinian Ob-servatory of Coastal Zones. This project will necessarily meet the minimum requirements drawn here by defining criteria and guidelines consistent with the provisions of the regula-tory provisions in force. In particular, it is noted that the process of selecting indicators and their characteristics should be closely related to the evaluation model defined at the planning stage. In this regard, the list of indicators hereby proposed is consistent with the structure of analysis and evaluation considered to be representative, and therefore non-exhaustive. In a similar manner the identification of competences of the different government levels, regarding the acquisition, observation and monitoring of the processes influencing the coastal zone suggests that stakeholders may become part of the coastal zone observa-tion network. This network system highlights the need to identify not only the objects of observation but also the tools and procedures for the definition of acquisition modes and protocols that govern the flow and exchange of data.
ReferencesBreton F. (2006) - Report on the use of the ICZM indicators from the WG-ID. A contribution
to the ICZM evaluation.European Parliament and Council (2002) - Recommendation 2002/413/CE concerning the
implementation of the integrated management of coastal zones. http://ec.europa.eu/environment/iczm/home.htm
Hannelore M., Belpaeme K., Lescrauwaet A.K. and Mees J. (2006) - Indicators as guides for Integrated Coastal Zone Management.
Henocque Yves (2003) - Development of process indicators for coastal zone management assessment in France.
Libro.indb 123 17/05/2013 14.41.57

124
Satta et al. Coastal erosion monitoring - A network of regional observatories
Martí X., Lescrauwaet A.K., Borg M., Valls M. (2007) - Indicators Guidelines to adopt an indicators-based approach to evaluate coastal sustainable development prepared in the framework of the DEDUCE project.
Rochette J., du Puy-Montbrun G., Wemaëre M., Billé R. (2010) - Coastal setback zones in the Mediterranean: A study on Article 8-2 of the Mediterranean ICZM Protocol.
Rochette J., Billé R. (2010) - Analysis of the Mediterranean ICZM Protocol: At the crossroads between the rationality of provisions and the logic of negotiations.
UNESCO (2006) - A handbook for measuring the progress and outcomes of integrated coast-al and ocean management. (IOC Manuals and Guides, 46, ICAM Dossier, 2). Paris: UN-ESCO.
Ward J. C. (1997) - Monitoring and indicators of the coastal and estuarine environment - a literature review.
Libro.indb 124 17/05/2013 14.41.57

125
ResMar Coastal erosion monitoring - A network of regional observatories
A coastal WebGIS for data sharing and distribution
Giovanni Vitale1, Enrica Mori2, Sandro DeMuro3, Claudio Kalb3
1Università di Firenze - Dipartimento di Scienze della Terra; Borgo Albizi 28, 50122 Firenze; Email: [email protected];
2Provincia di Livorno - Difesa e Protezione del Territorio; Via Galilei 40, 57123 Livorno; Email: [email protected]
3Università di Cagliari - Dipartimento di Scienze Chimiche e Geologiche, Via Trentino 51, 09127; Email: [email protected], [email protected]
AbstractIn accordance to the goals of ResMar subproject B, the two partners, Provincia di Olbia Tempio and Provincia di Livorno, through their cross-border centreoffices (OCEANS and CReStDiL) have developed a data sharing system in the form of two Web-based Geograph-ical Information Systems (Web-GIS). Because of the different morphology of Sardinian (a large number of small pocket-beaches) and Tuscan (200 km of relatively wide beaches) coasts, the two platforms were structured differently. Provincia di OlbiaTempio developed an Atlas of Gallura beaches as a set of test sites; the contents are cartographic data derived from an aerial photogrammetric historical set (from 1954 to 2006), sedimentological and geomorphological data and hydrodynamic, wave and sedimentological models. Provincia di Livorno used a platform known as GEO-T, where users can frame any stretch of the Tuscan coast to view the different layers, and interact to obtain additional information as available from the database. Because of the considerable length of most Tuscan beaches, Provincia di Livorno developed a Web-GIS where there is no data gap between the north-ern and southern borders (with Liguria and Lazio, respectively).The landscape background is created using orthophotos andCTRs, and the shorelines drawn are replaced by lines from surveys and photo-interpretation, from 1938 until today. Each physiographic unit has been divided into 250 m long sectors, with a colour line showing shoreline evolution from 1984 to 2005. Another relevant layer is represented by the database containing data on coastal defence structures and ports, while territorial information is completed with data on the regional ecological network, hydrography and coastal dunes. The aim of both centres is to standardise other available data in order to permit their publication, and collect further data to allow for continuous monitoring.
IntroductionResMar subproject B is based on the creation of a cross-border centre for the study of littoral dynamics. At this moment the centre includes two offices in Italy, one located in Sardinia and one located in Tuscany. The Tuscan center has been developed by Provincia di Livorno and
Libro.indb 125 17/05/2013 14.41.57

126
Vitale et al. Coastal erosion monitoring - A network of regional observatories
is called CReStDiL (Regional Centre for the Study of Littoral Dynamics), whereas the Centre in Sardinia is managed by Coastal and Marine Geology Group of Cagliari University, through the Coastal and Natural Submarine Environment Observatory (Osservatorio Coste E Ambi-ente Naturale Sottomarino - OCEANS), with the financial support of the Provincia di Olbia-Tempio. According to the cross-border cooperation programme, partners have developed a data-sharing system that allows external users to gain access to the information. Both Provincia di Livorno and Provincia di Olbia-Tempio developed two Web-based Geographical Information Systems (WebGIS) fed with data collected on field, and platforms will be avail-able on the official website of project Res.Mar (according with INSPIRE EU protocol [1][2]).
Shared databaseThere are many differences between the territories studied by the two partners: the Tus-cany coast has approximately 200 km of relatively wide beaches interrupted by headlands that subdivide them into ten physiographic units. The Olbia-Tempio province, on the other hand, is mainly formed by pocket-beaches, as does the Tuscan archipelago. Therefore, the WebGIS developed by the Sardinian partner is considered as a set of test sites composed by the beaches studied, and it is possible to reach the page dedicated to the point of interest without needing to get through the global map. Because of the considerable length of most Tuscan beaches the map was organized as a dataset without a gap between the northern border (with Liguria) and the southern one (with Lazio). Moreover, some themes that may be significant at Tuscan coasts, such as the description of existing coastal defense structures or strategies are irrelevant in Sardinia, where their presence is negligible. These and other differences led to the decision of keeping two separately managed platforms with a mini-mum common content, though both partners are free to add all data they have collected.
The Sardinian WebGIS platformThe Olbia-Tempio Province has been supported by the Coastal and Marine Geology Group (CMGG) of Università degli Studi di Cagliari, which founded and developed the Coastal
Figure 1 - Map index of sample sites.
Libro.indb 126 17/05/2013 14.41.58

127
ResMar Coastal erosion monitoring - A network of regional observatories
and Natural Submarine Environment Observatory (Osservatorio Coste E Ambiente Naturale Sottomarino - OCEANS). The CMGG developed an Atlas of Gallura beaches[9], which repre-sents an experimental dataset with information on the historical-geographic evolution and trend of ten beaches [6][8](Fig.1).The Atlas is proposed as a support tool for local governments since it offers essential ele-ments, required to start a successful integrated environmental management programme.The contents of this Atlas are cartographic data derived from an aerial photogrammetric historical set (from 1954 to 2006), sedimentological and geomorphological data and hydro-dynamic, wave and sedimentological models[3][4][5][7][10].Part of these data have been converted to GIS format and published on a WebGIS platform, currently posted on the www.osservatoriocostesardegna.eu website (Fig.2).
Figure 2 - Section of the Sardinian WebGIS platform (example: Cala di Trana beach).
Figure 3 - Shoreline evolution at Porto Liscia beach.
Libro.indb 127 17/05/2013 14.41.59

128
Vitale et al. Coastal erosion monitoring - A network of regional observatories
The system uses an open source software platform named GeoSuite. This enables man-agement and display of several information layers, using a navigation software called GeoExplorer.
WebGIS will be also reachable from the ResMar website and, consistent with the project specifications, will enable the display of information layers concerning:
- shoreline position (by aerial photography interpretation) (Fig. 3); - shoreline evolution trend; - bathymetry; - location of sedimentological samples; - layers of information from Sardegna Regional agency “Regione Autonoma della
Figure 4 - Geological information layers at La Colba beach.
Figure 5 - Dune area evolution at Rena Maiori beach.
Libro.indb 128 17/05/2013 14.42.00

129
ResMar Coastal erosion monitoring - A network of regional observatories
Sardegna” RAS (Eg.SCIs, SPAs, geology, orthophotos etc.) (Fig. 4); - extent of the dune area (Fig. 5); - main hydrography.
The GeoExplorer navigator allows viewing different layers superimposed on orthophotos from several years. These aerial orthophotos are available from the “Regione Autonoma della Sardegna” database.
Data come from new surveys and from the interpretation of historic aerial photographs, available from the “Regione Autonoma della Sardegna” (RAS).The aerial photography interpretation was performed using CAD and GIS software on geo-referenced orthophotos from different years. Positioning is referenced, in accordance to RAS database, to Gauss-Boaga Roma40 datum, but positioning of all data is also available on UTM WGS84 datum.
The Tuscan WebGIS platformProvincia di Livorno used a platform known as GEO-T, elaborated by a private company; at the centre of the architecture there is a map server (Map Guide Open Source) that in-teracts, usingFDO technology, with heterogeneous geographic data sources, file-systems and database servers.It’s possible to access the platform trough an authentication, in administrator or read-only mode. The homepage of the application shows a map of Italy zoomed on Tuscany; in this way it is possible to see almost all upload layers, although at this scale most of them are hardly dis-cernible (Fig. 6). Users can frame any stretch of the Tuscan coast to view the different lay-ers, and interact with them to obtain additional information as available from the database.
The landscape background is created using CTRs (Regional Technical Maps from Regione Toscana, and by orthophotos taken by AGEA in 2010 at the scale 1:10000. These were
Figure 6 - Homepage of the Tuscan coast map.
Libro.indb 129 17/05/2013 14.42.00

130
Vitale et al. Coastal erosion monitoring - A network of regional observatories
provided, as other datasets, by Re-gione Toscana through the Geoscopio WMS system. The CTRs are opportune-ly cut with a buffer at 2 km from the sea; shorelines drawn over them are replaced by lines obtained from sur-veys and photo-interpretation. A large amount of coastline data has been col-lected by the Dipartimento di Scienze della Terra dell’ Università di Firenze, from the digitization of 1938 maps un-til recent surveys[12].Figure7 presents an example related to the zone of Viareggio Harbour.
The datasets of 1954, 1973, 1984 and 2005 covers the entire length of beach-es on continental Tuscany, and they have been used for a report on shoreline evolution during the past decades[11].Each physiographic unit has been divided, obstacles such as harbours and headlands per-mitting, into 250 m long sectors. These are symbolized by colour lines(Fig. 8) that represent shoreline evolution during the period from which we have the most recent complete data-set on the Tuscan territory (1984-2005). Selecting a sector, or any object on the map, prop-erties are displayed and it is possible to read values from the other periods investigated.
Figure 8 - Shoreline evolution in the Gulf of Baratti.
Figure 7 - Shoreline position in different years, south of Viareggio Harbour.
Libro.indb 130 17/05/2013 14.42.00

131
ResMar Coastal erosion monitoring - A network of regional observatories
The Tuscan coast is often interrupted by coastal defense structures and ports, and it is useful to maintain an atlas that represents them, followed by an information sheet pre-senting their main characteristics. An inventory of coastal defense structures, published by Regione Toscana in 2007[13], has been reviewed and updated as part of this study, adding new structures and correcting information related to old structures that had been destroyed or reshaped. Each structure was represented by a polygonal shape digitized from orthophotos and CTRs, and described in a database containing several pieces of
information: - Site - Position, identified by the coordi-nates of the centroid - Type of structure (groyne, breakwater, etc.) - Length
These data can be reached, as can all layers, by selecting a single element (Fig. 9) or by opening a separate in-formation sheet. Further information concerning characteristics and history of the structure, as well as aerial and ground photographic documentation, are still being updated, and will be ac-cessed through hyperlinks.
Bathymetric and granulometric data from one of the test sites[14] has been loaded to show a possible development of the WebGIS. Figure10 presents two maps of the beach of Marina
Figure 9 - Coastal defense structures at Marina di Pisa. The selection of the object allows to display the information.
Figure 10a - Bathymetric map of the beach of Marina di Campo (Elba island).
Libro.indb 131 17/05/2013 14.42.01

132
Vitale et al. Coastal erosion monitoring - A network of regional observatories
di Campo (Elba island) that indicate bathymetry and the average size of the sediment.The aim is to align the product to the one edited by Provincia di Olbia-Tempio, where map-ping of the seabed was published for each beach. This type of data is currently widely avail-able in Tuscany but still requires standardization before data can be shared in the WebGIS.Regione Toscana gave permission to share other layers of information which are relevant to the management of the coastal zone, such as the databases from the website of the re-gional ecological network, and on hydrography and coastal dunes.
Future DevelopmentsThe amount and range of the information contained in the two WebGIS should not to be considered as definitive and should not be restricted to the duration of the ResMar project. Some layers could become obsolete in a short time, because of the speed of changes to the coastal territory, and the intention of both centres is to keep collecting data so that monitoring can be continuous. Development of new contents may also be possible; for the Tuscan platform, for instance, the available sedimentological and bathymetric data could be published, whereas worksheets could be completed for each work of coastal defence structure, adding information on the technical and structural characteristics and uploading project documents and photographs.Regarding Sardinian study area a data increasing is foreseen by new sedimentological data, extent of Posidonia oceanic seagrass meadow, mapping seabed etc.
References[1] European Commission (2007) - “INSPIRE - Infrastructure for spatial information in the
European Community” - http://inspire.jrc.ec.europa.eu/.[2] D.Lgs. 32/2010 - “Attuazione della direttiva 2007/2/CE, che istituisce un’infrastruttura per
l’informazione territoriale nella Comunita’ europea (INSPIRE)”.
Figure 10b - Average size of sediments in the beach of Marina di Campo (Elba island).
Libro.indb 132 17/05/2013 14.42.01

133
ResMar Coastal erosion monitoring - A network of regional observatories
[3] Batzella T., Pusceddu N., Kalb C., Ferraro F., Ibba A., DeMuro S. – Bars and troughs dy-namic and evolution trend of La Cinta beach (San Teodoro OT) - NE Sardinia, Rend. Online Soc. Geol. It., Vol. 17 (2011), 17-23 (DOI 10.3301/ROL.2011.13).
[4] Batzella T., Pusceddu N., Kalb C., Ibba A, Ferraro F., DeMuro S. - Bars and troughs dy-namic and short-term evolution of two beaches on NE Sardinia: La Cinta (San Teodoro, OT) and Budoni (OT), in: Abstract 28th IAS Meeting of Sedimentology, Zaragoza, Spain - July 5-8th 2011 (Eds. B. Bàdenas, M. Aurell and A.M. Alonso-Zarza), p.145. ISBN 978-84-615-1755-8.
[5] De Falco G., Simeone S., DeMuro S. - Analisi della dinamica deposizionale delle ban-quette di Posidonia oceanica nella spiaggia di Cala di Trana (Palau) mediante video-monitoraggio, in De Muro S. e De Falco G. (A cura di) - Manuale per la gestione delle spiagge - Studi, indagini ed esperienze sulle spiagge Sarde e Corse, University press - Scienze Costiere e Marine, CUEC (2010), 136-150. ISBN 978-88-8467-629-0.
[6] DeMuro S., De Falco G. (a cura di) – Manuale per la gestione delle spiagge - Studi, in-dagini ed esperienze sulle spiagge sarde e corse, University press – Scienze Costiere e Marine, CUEC. ISBN 978-88-8467-629-0 (2010), pp. 368.
[7] DeMuro S., Kalb C., Batzella T., Pusceddu N. – Morfologia, idrodinamica e sedimentolo-gia dei sistemi di spiaggia di Cala di Trana, La Sciumara e Venalonga (Palau - Sardegna Nord Orientale), in De Muro S., De Falco G. (A cura di) - Manuale per la gestione delle spiagge - Studi, indagini ed esperienze sulle spiagge Sarde e Corse, University press – Scienze Costiere e Marine, CUEC (2010), 103-135. ISBN 978-88-8467-629-0.
[8] DeMuro S., Kalb C., Ferraro F., Batzella T., Pusceddu N., Ferrara C., Ibba A. – Development of monitoring network and methodology for the study of sedimentary and morpho-dynamics processes of microtidal wave dominated mediterranean beaches (Sardinia), Atti del “Quarto Simposio Internazionale - Il monitoraggio costiero Mediterraneo: problematiche e tecniche di misura” Livorno 12-13-14 Giugno 2012, (in press).
[9] DeMuro S., Pusceddu N. (A cura di) - Atlante delle spiagge della Gallura – evoluzione recente, regime, assetti, tendenza e criticità di dieci sistemi di spiaggia campione, Uni-versity press – Scienze Costiere e Marine, CUEC (2012), p. 237. ISBN 978-88-8467-732-7 (in press).
[10] Pusceddu N., Batzella T., Kalb C., Ferraro F., Ibba A., DeMuro S. – Medium and short-term evolution of two beaches on NE Sardina: La Cinta (San Teodoro, OT) and Budoni (OT), Proceedings of the “34th International Geological Congress 2012”, Brisbane, Australia, 5–10 August 2012, p.1319 ISBN 978-0-646-57800-2.
[11] RES - MAR - Sottoprogetto B Centro Transfrontaliero per lo Studio della Dinamica dei Litorali (2012). Azione 3.3 – Attività 3.3.3: Aggiornamento sulla dinamica erosiva o ac-cretiva dei litorali toscani.
[12] RES - MAR - Sottoprogetto B Centro Transfrontaliero per lo Studio della Dinamica dei Litorali (2012). Azione 3.3 - Attività 3.3.1 - Raccolta dei dati già sviluppati nei territori toscani interessati dal progetto. Atlante delle linee di riva (scala 1:25.000).
[13] Regione Toscana (2007). Studio e ricerca per l’implementazione del quadro conoscitivo della costa toscana nell’ambito del Piano Regionale di Gestione integrata della Costa.
[14] RES - MAR - Sottoprogetto B Centro Transfrontaliero per lo Studio della Dinamica dei Litorali (2012). Azione 3.3 - Attività 3.3.3. Bilancio sedimentario dei siti pilota.
Libro.indb 133 17/05/2013 14.42.01

Libro.indb 134 17/05/2013 14.42.01

135
ResMar Coastal erosion monitoring - A network of regional observatories
Coastal erosion in Tuscany: short vs. medium term evolution
Luigi E. Cipriani1, Enzo Pranzini2* and Giovanni Vitale2
1Regione Toscana, D.G. Politiche Ambientali, Energia e Cambiamenti climaticiSettore Protezione e Valorizzazione della Fascia Costiera e dell’Ambiente Marino
Via di Novoli, 26 – 50127 Firenze; Email: [email protected] di Scienze della Terra, Università di Firenze
Borgo Albizi, 28 – 50122 Firenze; Email: [email protected], [email protected]
AbstractPast (1981/85 - 2005) and recent (2005 - 2010) shoreline evolution trends in the coastal sediment cells of the Tuscany coast have been compared.Although data for the two periods do not have the same accuracy, a general framework of its behaviour was retrieved, confirmed by several site inspections and higher accuracy data available for some coastal sectors.Most of the coast maintained in 2005 - 2010 period the same behaviour kept from 1981/85 to 2005, especially for those sectors experiencing severe erosion. Shifting from erosion to accretion, and vice versa, occurred in few coastal sectors, where shoreline dis-placement rates were limited, with the exception of the Albegna river cell, which passed from accretion to severe erosion. Only on the northern side of the Arno river an erosive trend of more than 5 m/yr was strongly reduced or even reversed by a shore protection project.Some documented sediment bypass are responsible for accretion and/or erosion of a few beaches.The different data accuracy prevents an effective knowledge of the behaviour of nearly stable beaches, which is necessary for their management.
IntroductionThe first studies on coastal erosion at regional scale are dated mid 1980’s, when the Region of Tuscany commissioned the Earth Sciences Department of the University of Florence a 1:5.000 scale map containing the shoreline position of the years 19381, 1954, 19672, 1976 and 1984/85 to be extracted from air photographs (Bartolini et al., 1989).On a second stage, a complete study of the entire Tuscany coast was performed in 2005, when the Regional administration commissioned an updating of the existing data (Cipriani
1 1938 shoreline is not available for the Province of Grosseto coast2 1967 shoreline is available for the Northern Tuscany coast only.
6a_Toscana_Enzo.indd 135 04/06/2013 14.22.58

136
Cipriani et al. Coastal erosion monitoring - A network of regional observatories
and Regoli, 2008). However, in the period 1984 - 2012 the morphologic and sedimento-logic evolution of the Tuscany coast was studied in detail, but not synchronously, through researches performed in each physiographic unit or at specific sites experiencing severe erosion or where some shore protection projects were executed. Here, information is ex-tremely detailed, with up to twenty shorelines available for the period 1984 – 2012; on the other hand, where the beach was stable or accreting, information is less detailed.Shoreline evolution data, referred to the period 1984-2005, were recently revisited as part of the activities of ResMar project, changing and standardizing the sectors used for the analysis (ResMar, 2012).In 2010 a photogrammetric survey was performed by the Region of Tuscany in order to up-date the regional cartography, thus providing us a new shoreline for all the Tuscany coast.To produce a synchronous study extended to all the regional coast, we must exclude data covering single coastal sectors, thus reducing temporal resolution.Being interested in the recent evolutionary trend, we analyze here the shoreline displace-ment occurred between 2005 and 2010, thus comparing results with those characterizing the previous period 1984-2005.For this purpose, the coast was divided in 821 sectors approximately 250-m-long, for which beach surface variation (m2) was measured, retrieving mean shoreline displacement (m) and displacement rate (m/yr). This last parameter, for the two studied periods, is reported in separate graphs for each physiographic unit.Due to the different time span of the two periods, shoreline evolution is expressed as displacement rates (m/yr), although this does not eliminate the problem related to the reliability of data representing different time span. Within a longer period several erosion/accretion phases can be present and the resulting figure may be not related to the actual trend, while short period data can be strongly influenced by seasonal variability (Bowman and Pranzini, 2008). In addition, 2010 shoreline comes from aerial-photo interpretation and does not include tidal correction (max. tidal range 30 cm). This can affect the accuracy of the data, especially where the shoreface is characterized by gentle slope.The availability of higher spatial resolution data acquired on some beaches in 2010 and several inspections performed along the coast in the same year allow to estimate the reli-ability of those data.When interpreting such data, another important aspect must be considered: some shore protection works were executed in different coastal sectors in the two periods. For ex-ample, from 1984 to 2005 a few groins were built along the coast at San Rossore Regional Park; other groins were extended with submerged extensions at Marina di Cecina, and detached breakwaters were modified at Follonica; gravel beaches constructed at Marina di Pisa and between Vada and Marina di Cecina.In the most recent period works went on at Marina di Pisa and new restoration projects started at Marina di Carrara, Follonica, Punta Ala and Capalbio.
Northern Tuscany cellThe coastline that stretches from Punta Bianca to Monti Livornesi (Fig. 1) is a physiographic unit (Aiello et al., 1976) approximately 63.5 km long and administratively divided between the Region of Tuscany, in whose territory fall 60.9 km of coastline, and the Region of Ligu-ria, where fall only the northernmost 2.6 km.
6a_Toscana_Enzo.indd 136 04/06/2013 14.22.58

137
ResMar Coastal erosion monitoring - A network of regional observatories
Starting from North, the first 12 km of coastline are characterized by numerous hard de-fence structures built, and often changed several times, in recent decades, as well as by the Marina di Carrara Port, which amplifies the effects of downdrift sediment deficit due to
Figure 1 - Coastal sediment cells boundaries for Tuscany.
6a_Toscana_Enzo.indd 137 04/06/2013 14.22.59

138
Cipriani et al. Coastal erosion monitoring - A network of regional observatories
the reduction from bed load inputs of the Magra River. The port of Viareggio once had a similar effect for the sediments of the Arno River coming from the south, however, today northward longshore sediment transport naturally bypass the harbor.
The stretch of coast between the Viareggio Port and the mouth of the Arno River has a high level of naturalness as it is part of the Migliarino San Rossore Massaciuccoli Region-al Park , with very few tourist facilities and coastal defence works limited to 5 detached breakwaters placed to defend the Presidential villa at Gombo and the jetties located at the mouth of the Arno and Morto Nuovo Rivers. Between 2000 and 2001 the Region of Tuscany financed a coastal restoration project made by a set of 9 groins (partly emerged and partly submerged) north of the Arno River delta in order to protect the natural reserve and wetlands called “Le Lame”. The asymmetry of the present Arno river delta induced the construction of a jetty on the northern side almost 600 m-long.The southern part of the physiographic unit, ranging between the Arno River delta and the Port of Livorno, is characterized by an intermediate level of anthropogenic use which is concentrated in the coastal village of Marina di Pisa, protected by a double set of detached breakwaters and seawall, and in the seaside resort at Tirrenia. Between the two locations, there is a series of small coastal defences (mainly shallow water detached breakwaters), which follow each other without interruption for approximately 2 km in a chaotic manner.
Figure 2 - Beach evolution in the northern Tuscany physiographic unit in the two studied periods.
6a_Toscana_Enzo.indd 138 04/06/2013 14.23.00

139
ResMar Coastal erosion monitoring - A network of regional observatories
Marina di Pisa coastline is experiencing a restoration project characterized by detached breakwaters lowering to – 0.50 m (MSL datum) and a beach fill using gravel and pebbles. The project time span embraces the two periods under study.Significant changes occurred in this coastal segment in during five years (Fig. 2), although the main evolutionary trends were confirmed, like at Marina di Massa and between Gombo and Serchio River mouth, as retreating sites, or at Marina di Pietrasanta, as accreting site. This is shown in Figure 3, where most of the points fall either in +/+ or in -/- Quadrants.
The beach at Marina di Massa, where the coastal defence system is based on submerged detached breakwa-ters and groins, shifted from erosion to deposition. Even more relevant is the change occurring north of the Arno River mouth, where ero-sion rates of approximately 5 to 6 m/yr from 1984 to 2005 reversed to stability, if not accretion, in the last period (2005 – 2010). This change results to be more relevant consid-ering that the shift from erosion to accretion started in 2001, as a con-sequence of the construction of the groin set at San Rossore.South of Tirrenia the coast is unsta-ble, as a consequence of the Livorno Port expansion, with sectors shifting from deposition to erosion and vice versa.
Cecina River cellThe northern sector of the coastline that stretches from Punta Lillatro to Torre Nuova (Fig. 1) is fed by the Fine river, and, at least in the past, quite significantly from calcareous sands released into the sea from Solvay chemical plant at Rosignano Solvay. Both the groin pres-ent at Pietrabianca and the Solvay harbor breakwater reduce southward longshore sedi-ment transport thus inducing erosion at Vada; as a consequence, in Vada three detached breakwaters were built in order to reduce shoreline retreat in front of the coastal village.The squat headland of Punta del Tesorino – Capo Cavallo separates this sub-physiographic unit from the next which extends to Torre Nuova, fed mainly by the Cecina River and par-tially, in the southernmost stretch, from small streams draining the metalliferous hills.The northern beaches, up to Marina di Bibbona, have been experiencing an erosive pro-cess that had its focal point on the coastline of Cecina and whose main cause was the sand and gravel extraction from the Cecina river lower course.A set of groins were constructed during the 1970’s and ‘80s in a chaotic manner both north and south of the Cecina river mouth in order to limit shoreline retreat, however, it was only
Figure 3 - Mean shoreline displacement in each sector of the northern Tuscany physiographic unit in the two studied periods.
6a_Toscana_Enzo.indd 139 04/06/2013 14.23.00

140
Cipriani et al. Coastal erosion monitoring - A network of regional observatories
in the early ‘90s, that existing groins were modified with submerged extensions and the beach was filled artificially with sand and gravel coming from local authorized quarries in the Cecina river alluvial plain.The San Vincenzo marina, as it was in the original configuration of the 1970’s, had trig-gered an erosion process along the southern beach which gradually faded over time. On the other hand, the potential impacts of the recent marina expansion on the natural coastal dynamics are not yet known.In the first study period considered, in addition to the works carried out along the coast at Marina di Cecina, some restoration interventions in order to protect the natural reserve of Tombolo di Cecina were performed at Punta del Tesorino in 2001 including submerged groins and breakwater and beach fill with gravel.
New data for the 2005 – 2010 period show an erosion rate reduction from Rosignano Solvay to Marina di Cecina, with an expansion of the beach north of the Pietrabianca groin and at Vada (Fig. 4). The cause of the evolution can be attributed to the textural change of sediments delivered to the coast by the Solvay chemical plant, and secondarily as a conse-quence of the construction of a third detached breakwater in front of Vada carried out at the end of the first study period.The beach south of Marina di Cecina is experiencing severe erosion, which is balanced by
Figure 4 - Beach evolution in the Cecina River cell in the two studied periods.
6a_Toscana_Enzo.indd 140 04/06/2013 14.23.00

141
ResMar Coastal erosion monitoring - A network of regional observatories
beach accretion at Marina di Bibbona. However, south of this site the coastline as far as San Vincenzo, which was stable or in ac-cretion in the past, is now retreating.Shoreline position changes are evi-dent along both sides of the new marina at San Vincenzo, however since coastal defence structures in the lee side of the marina are still un-der construction, at the moment any interpretation could be premature.The southern part of the physio-graphic unit, previously subject to a period of stability, seems to experi-ence larger positive and negative changes.As a whole, changes are faster in eroding sectors than in accreting ones and several sectors shifted from one condition to the other (Fig. 5); this beach behavior is induceded by megacusps longshore movement.
Baratti cellBaratti Bay is a 2-km-long pocket beach located on the promontory separating the previ-ous physiographic unit from the Follonica Gulf (Fig. 1). Open only to the west, the bay is protected by the SW dominant waves not only by the Piombino Headland, but also by the presence of Elba Island. In addition, a shore parallel beach-rock outcrops in the nearshore in the central part of the bay creating one of the best natu-ral harbors of the antiquity.Most of the coast is backed by a bluff comprising slag derived from the iron melting activities performed here by the Etruscans and by the Romans, be-ing now this material the main source of sediment for the beach.The beach expanded in the 1930’s, when the Etruscan necropolis was excavated and part of the resulting material was deposited in the vicin-ity of the beach.On the south-western side of the bay, sheltered by the headland and
Figure 5 - Mean shoreline displacement in each sector of the Cecina River cell in the two studied periods.
Figure 6 - Beach evolution in the Baratti cell in the two stud-ied periods.
6a_Toscana_Enzo.indd 141 04/06/2013 14.23.01

142
Cipriani et al. Coastal erosion monitoring - A network of regional observatories
by a boulder shoal (possibly created in the 20th Century when iron was shipped from this point), a mooring site for small boats was created too. A botched low crested jetty was later added, which is currently trapping sand from the central beach, increas-ing erosion and reducing functional-ity in the mooring area.
The Province of Livorno is coordi-nating a shore protection project financed by the Region of Tuscany based on beach nourishment and on the closure of the head of two near-shore canyons in the beach-rock, re-sponsible of the offshore sediment dispersion. In November 2011 while waiting for the realization of this
project, a line of geo-containers has been placed as a temporary seawall in order to pro-tect the archaeological site. New data confirm the limited but chronic erosion of this pocket beach (Figs. 6 and 7). The main problem here, in addition to the risk of collapse of valuable ancient building on the border of the bluff, is the progressive sediment coarsening of the beach, once comprising medium to fine sand, and now characterized by gravel and pebbles in many places.
Follonica cellMost of the 21-kilometer-long beach bordering the Follonica Gulf experienced a wide-spread slow rate beach erosion since the beginning of the past century, driving to the con-struction of hard defences (mostly detached breakwaters) which exacerbated the problem in the adjacent beaches. All the authors who studied this coast (Albani et al. 1940; Bartolini et al., 1977; Aiello et al., 1980; Aminti et al. 2002) agree that river diversion for coastal marsh reclamation, per-formed in the 19th - early 20th Century (Barsanti and Rombai, 1986), was the first cause of beach erosion in the bay. When water courses where further redirected to the sea, soil ero-sion reduction due to agriculture abandonment and river bed quarrying made them un-able to efficiently feed the beach (Pranzini, 1995). Land subsidence is an additional cause of shoreline retreat for the western side of the gulf (Bartolini et al., 1988).At the two extremities of the gulf both old and recent coastal structures (a jetty at the north-western end and a marina at the south-eastern one) attract sediments from the adjacent coastal sectors, thus inducing erosion. The marina was completed at the end of the first study period.In the 2005-2010 period, coastal restoration projects characterized by existing hard de-fences reduction have been implemented by Regional and Local Authorities in order to
Figure 7 - Mean shoreline displacement in each sector of the Baratti cell in the two studied periods.
6a_Toscana_Enzo.indd 142 04/06/2013 14.23.01

143
ResMar Coastal erosion monitoring - A network of regional observatories
restore a more natural coastal envi-ronment. The most important change oc-curred in the period 2005 – 2010 is the shoreline retreat in the vicinity of the marina at Scarlino (southern tip of the coastal cell), which is very likely the effect of nearshore sand extraction in order to clear the en-trance channel to the marina (Fig. 8); sediments were dumped to feed the western beach from where this sand originally came. Except for Pratoran-ieri, where the beach was previously accreting due to the presence of the breakwater and is now eroding, de-position seems to prevail over ero-sion in most of the gulf, as is shown in Figure 8.
Figure 8 - Beach evolution in the Follonica cell in the two studied periods.
Figure 9 - Mean shoreline displacement in each sector of the Follonica cell in the two studied periods.
6a_Toscana_Enzo.indd 143 04/06/2013 14.23.02

144
Cipriani et al. Coastal erosion monitoring - A network of regional observatories
Punta Ala cellThe southern sector of the coast at Punta Ala has been experiencing erosion at least since the 1940’s, thus it should be excluded any responsibility to the marina constructed in the ‘70’s and located on the headland at the southern end of the bay. The shoreline evolves increasingly taking the form of a logarithmic spiral with the point of diffraction located at Punta Hidalgo; this configuration would make the coastline more stable because the beach during severe storms would be reached by waves at any point approximately parallel to the shoreline and therefore not capable of inducing a consistent longshore drift.The achievement of this coastal configuration would however induce a shoreline retreat of several tens of meters in the southern sector and a relatively modest accretion in a long stretch of the northern beach (Pranzini and Rossi, 2000).An additional cause of beach erosion of the southern sector has been identified in some gaps which are present in the beach-rock outcropping in the nearshore and that naturally protects the sheltered sectors of the beach; during storms, behind the beach-rock there is an accumulation of water (set-up) which could exit then from these gaps in a sort of rip-currents carrying out the sand that occasionally cause the marina entrance siltation.As part of the Regional coastal restoration Plan, the Province of Grosseto has recently real-ized a coastal defence project which provides the closure of these gaps; the monitoring sur-veys in order to evaluate the response of the coast to this intervention are now in progress.
Figure 10 - Beach evolution in Punta Ala cell in the two studied periods.
6a_Toscana_Enzo.indd 144 04/06/2013 14.23.02

145
ResMar Coastal erosion monitoring - A network of regional observatories
Except for the accretion at Cala le donne, north of the Alma River out-let, and in the central part of the bay, erosion is the main process charac-terizing this beach, with values over 1 m/yr near the Alma River mouth and in the southern part, where ero-sion was severe also in the previous period (Figs. 10 and 11). Here shoreline retreat reach val-ues greater than 1 m/yr, in spite of the small nourishment (10.000 m3) performed in June 2009 with sedi-ments coming from the Po River al-luvial plain and with approximately 14.000 m3 of sand dredged south of the marina at Punta Ala in June 2010.
Ombrone River cellThis physiographic unit is mostly fed by the Ombrone River, whose cuspate delta occupies the southern part of the coastline. In the northern part a minor sediment input is given by the Bruna River, empting onto the Tyrrhenian Sea after hosting the Castiglione della Pescaia small harbor in his lower portion. Beach erosion is severe at the Ombrone River mouth, where more than 1 km of coast was lost since 1880’s. Sediments eroded at the delta apex are the main feeder of rest of the coastal cell.Wetlands were reclaimed in the coastal plain from 16th to 19th Century (Barsanti and Rom-bai, 1986) through river diversion for delivering sediments to the settling ponds, resulting to be the first cause of beach erosion in this area (Milano et al., 1986). Changes in land use, reforestation, river bed quarrying, and dam construction are further factors which have been inducing a drastic reduction in sediment input to the coast, from the late 19th Century to present days.A 400-meter-long obsolete rip-rap built to prevent inland flooding is defending the apex of the southern delta lobe; shoreline retreat is considered acceptable in this protected area, since no infrastructure or buildings are present along this stretch of coast. The only limita-tion to this solution is the maintenance of the artificial draining system to collect water and pump it onto the river in order to allow for agriculture and forestry activities in this subsiding lowland (1 cm/yr according to Salvioni, 1957). Following these considerations, a managed realignment project has been recently designed, allowing shoreline retreat of approximately 150 m. The existing and obsolete rip-rap will be abandoned, whereas a new dyke has been built 150 m inland as a major protection measure against extreme storm events (Cipriani et al., in press).Seven low crested detached breakwaters protect the beach at Castiglione della Pescaia, south of the marina jetty built on the left side of the Bruna River outlet. Other structures
Figure 11 - Mean shoreline displacement in each sector of Punta Ala cell in the two studied periods.
6a_Toscana_Enzo.indd 145 04/06/2013 14.23.02

146
Cipriani et al. Coastal erosion monitoring - A network of regional observatories
present in this costal unit are the marina at Marina di Grosseto and the small jetties at the river mouth of two creeks empting in the northern part of the coast.New data (2005 – 2010) show a very strong erosion at the Ombrone river mouth, with rates up to 40 m/yr (Fig. 12), however neighbouring beaches to the north are experiencing accretion. This is the results of mega-cusps and sand bars moving alongshore, inducing alternate phases of erosion and accretion.
Figure 13 - Mean shoreline displacement in each sector of the Ombrone River cell in the two studied periods.
Figure 12 - Beach evolution in Ombrone River cell in the two studied periods.
6a_Toscana_Enzo.indd 146 04/06/2013 14.23.03

147
ResMar Coastal erosion monitoring - A network of regional observatories
Scatter plots in Figure 13 show that many sectors, in accretion from 1984 to 2005, are now eroding; most of them are located between Collelungo and Cala Rossa, a beach sector which had been in accretion from 1954 to 1984.The northern part of the physiographic unit, from Punta delle Rocchette to Marina di Gros-seto is experiencing very low changes, positives and negatives.
Albegna River cellThe stretch of coast to the south of the Gulf of Talamone is primarily fed by the Albegna River which outflows near the transition between the floodplain and the Tombolo della Giannella which, with an average width of approximately 400 m borders the northern part of the Orbetello Lagoon. The coastline follows a broad bending set on two points of wave diffraction, Talamone promontory and Monte Argentario.With the exception of those in the Talamone Gulf (the marina and the jetties at the mouth of eastern Collettore) the coastal cell is protected by two groins in each side and two detached breakwaters on the south side of the Albegna River; in addition, 4 detached breakwaters are present in Santa Liberata, where the effluent of the Orbetello Lagoon is protected by two jetties.The beaches of this physiographic unit have not suffered intense erosion between 1984 and 2005, however latest data show a completely different situation (Fig.14).
Almost all of the beaches are experiencing shoreline retreat, with rates even higher than 3 m/yr. This phenomenon is particularly intense on the southern side of the Talamone
Figure 14 - Beach evolution in Albegna River cell in the two studied periods.
6a_Toscana_Enzo.indd 147 04/06/2013 14.23.03

148
Cipriani et al. Coastal erosion monitoring - A network of regional observatories
Gulf (which belongs to the same physio-graphic unit), at Campo Regio – Voltonci-no, at the mouth of Albegna River and at Santa Liberata, in a stretch of coast expe-riencing accretion in the previous period.Figure 15 shows that no sector of those experiencing accretion during the older period have maintained this trend (Quad-rant +/+). Most sectors have shifted from conditions of accretion to conditions of erosion (Quadrant +/-).Given the short duration of the latest period under analysis, the significance of the data cannot be considered high, however, some morphological indica-tors confirm the existence of the erosive process. According to available data, be-tween 2005 and 2010, the physiographic unit would lose approximately 100761
m2 of beach area, with an average shoreline retreat of approximately 6 m.This is the physiographic unit which experienced higher changes between the two peri-ods: mostly in accretion (+ 34317 m2), except for the bay of Talamone and midway from La Montagnola and the Albegna River mouth, from 1984 to 2005, is now experiencing a strong and widespread erosion (-100760 m2), threatening the dune system, almost pristine in this area.
Feniglia cellThe Tombolo di Feniglia consists of a sand barrier less than 1 km-wide which connects Monte Argentario to the prom-ontory of Cosa. This coastal cell experienced conditions of relative stability since the days for which data are available, however un-derwent a limited erosion process along its western side after the construction of the marina of Cala Galera, whose breakwater inter-cepted sediments from adjacent sectors. After that accretion, near Poggio Pertuso, had filled the beach, the process had gradually attenuated.Present changes are limited and generally within the inaccuracy value, although most of them are
Figure 16 - Beach evolution in the Feniglia cell in the two studied periods.
Figure 15 - Mean shoreline displacement in each sec-tor of the Albegna River cell in the two studied periods.
6a_Toscana_Enzo.indd 148 04/06/2013 14.23.04

149
ResMar Coastal erosion monitoring - A network of regional observatories
negative (Figs. 16 and 17). The differ-ences with the previous period must be considered as a result of the dif-ferent survey methods and the differ-ent time span.
Fiora River cellThe coastline ranging between An-sedonia and the Chiarone mouth (Tuscany southern border) consists of dune belts which, at times, border coastal ponds partially reclaimed. The nourishment of this stretch of coast-line is guaranteed by the Fiora River, which outflows some 12 km south of the regional border, in Latium territo-ry. There are very few defence struc-tures along the shore, which has al-ways shown reverse trends, with areas experiencing retreat or accretion at
Figure 17 - Mean shoreline displacement in each sector of the Feniglia cell in the two studied periods.
Figure 18 - Beach evolution in the Fiora River cell in the two studied periods.
6a_Toscana_Enzo.indd 149 04/06/2013 14.23.04

150
Cipriani et al. Coastal erosion monitoring - A network of regional observatories
different times, but with a clear trend to a moderate erosion.In 2010 at Macchiatonda a coastal restoration project was implemented, comprising the construction of 4 sub-merged groins using geo-containers filled with sand, plus a later (2011) one built near the mouth of the Chiarone River. The works included a beach nourishment with sand taken from a neashore bar located to the south of the restoration site. The alternating behavior of this coastal stretch is confirmed by the data of the last period; as shown in the graphs in Figures 18 and 19 it is evident a good distribution of points on the diagonal of the Quadrants -/+ and +/-. However, there are several sectors falling in Quadrant -/-, indi-cating an erosion trend now well es-
tablished. Very few areas have experienced accretion during the two periods, moreover with very low values.
State of the Tuscany coastShoreline displacement values distribution has a mode in the positive range for both study periods, however, mean values are -0.1 m/yr in 1981/85 – 2005 and -0.4 m/yr in 2005 – 2010. Standard deviations resulted to be different as well, respectively 1.5 and 2.7.Values over +/- 5 m/yr are quite infrequent; positive values for sand accumulation at coast-al structures; negative values in the lee side of structures or at river outlets.
Figure 19 - Percentage of Tuscan beaches in erosion, equi-librium and accretion for each study period.
Figure 20 - Shoreline displacement values (grouped in 0,5 m/yr classes) for the 250 m-long sectors of the Tus-cany coast. Two segments fall out of the range here represented on the 2005 – 2010 histogram ( -40,3 and – 21 m/yr), both at the Ombrone river mouth, where in that period reshaping involved a mega-cusp migration.
6a_Toscana_Enzo.indd 150 04/06/2013 14.23.05

151
ResMar Coastal erosion monitoring - A network of regional observatories
Between 1981/85 and 2005 approximately 98 km of coastline resulted to be stable3 (107 km if artificial stretches of coast are considered), while 51 km were experiencing accre-tion, with an areal expansion of the beach of approximately 1401525 m2, equivalent to an average growth of 27.2 m. On the other hand 46 km of coastline were experiencing retreat, with an erosion of approximately 1800432 m2 of beach, resulting in an average shoreline retreat of approximately 39.4 m.Ultimately in this period the surface of the Tuscany beaches has been reduced by approxi-mately 398906 m2.
Table 1 - Surface variation (m2), mean shoreline displacement (m) and mean shoreline displacement rate (m/yr) for accreting and eroding coastal sectors along the Tuscany coast.
Accreting Eroding Netm2 m m/yr m2 m m/yr m2 m m/yr
1981/85 - 2005 1401525 27.2 1.3 -1800432 -39.4 -1.9 -398906 -4.1 -0.2
2005 - 2010 405155 8.5 1.7 -792588 -9.9 -2 -387432 -3.0 -0.6
In the most recent period (2005 – 2010) stability char-acterises 65 km of coastline, whereas 48 km are accret-ing for a surface of approximately 405155 m2, with a mean beach expansion of 8.5 m.Approximately 79 km of coastline are eroding, and here we lost approximately 792588 m2 of beach, with a mean shoreline retreat of 9.9 m.
3 Stable sectors are considered those with evolution annual rates included in +/- 0.5 m/yr, and their contribution in terms of beach width variations are evaluated as null.
Figure 21 - Percentage of Tuscan beaches in erosion, equilibrium and accretion for each study period.
6a_Toscana_Enzo.indd 151 04/06/2013 14.23.06

152
Cipriani et al. Coastal erosion monitoring - A network of regional observatories
Figure 22 - The state of Tuscany coast.
6a_Toscana_Enzo.indd 152 04/06/2013 14.23.06

153
ResMar Coastal erosion monitoring - A network of regional observatories
In the last five years beaches in Tuscany lost a surface of approximately 387432 m2.Considering the rates of average shoreline displacement, data show that coastal stretches in balance (+/- 0.5 m/yr) shifted from 48.3% to 32.5%, those in moderate erosion (- 0.5/-1.5 m/yr) from 12.7% to 24.7%, while those in moderate accretion (+0.5/+1.5 m/yr) from 18.5% to 15% (Fig. 21).
Figure 23 - Erosive hotspot along the Tuscany coast.
Ronchi (MS) Gombo (PI)
Marina di Cecina (LI) Punta Ala (GR)
Marina di Alberese (GR) Campo Regio (GR)
6a_Toscana_Enzo.indd 153 04/06/2013 14.23.12

154
Cipriani et al. Coastal erosion monitoring - A network of regional observatories
Significantly are also coastal sectors where shoreline evolution, either positive and nega-tive, range between 1.5 and 3 m/yr: 5.2% vs. 6.4% those experiencing accretion, and 5.4% vs. 9.1% those experiencing erosion (Fig. 21).Larger shoreline displacements are less frequent, however it is interesting the change from 1.7% to 3.6% of the stretches of coastline where shoreline retreat is more than 5 m/yr.
ConclusionsData available to study the evolution of the Tuscany coast in the most recent years confirm the presence of a widespread erosion process affecting this part of the territory of remark-able ecological and economic value.Most of the 821 sectors, in which the regional coast was sub-divided in order to study its evolution, maintained in 2005 – 2010 period the same behaviour kept from 1981/85 to 2005, and this is particularly true where erosion was severe. Only on the northern side of the Arno river an erosion trend of more than 5 m/yr was strongly reduced or even reversed by a coastal restoration/protection project.In the same coastal cell, deposition increased south and north of Viareggio harbor; on the northern side due to a sediment bypass performed from the nearshore in front of the harbor breakwater and entrance channel.A similar work was done on the eastern side of the marina at Scarlino, in the Follonica Gulf, producing a relevant accretion of the beach previously eroded by waves diffracted by the marina breakwater.Where negative changes are significant, and previously unexpected, is along the Albegna river cell, where a positive sedimentary budget (+ 34.317 m2) in the first period, although not uniformly distributed, resulted in severe erosion of almost all the sectors (-100.760 m2) in the second period. All these changes have morphological indicators assessing their existence, proving that a “coarse” monitoring can show the main processes reshaping the coast.Where changes are minor, ancillary data (higher temporal and spatial resolution surveys and morphological indicators) show that 2010 shoreline is not effective in analysing beach evolution, both for the acquisition methodology and for the limited temporal distance from the more accurate 2005 survey.Although minor, these changes are important to be monitored in order to set up proactive and adaptive strategies, since it is proved that adaptation is cheaper than stand still; late interventions call for more expensive and impacting solutions.The setting up of the Regional Cross-border Centre for the Study of Coastal Dynamics (CreStDiL) and the implementation of the network of coastal monitoring centres, within the ResMar project, meet these needs.
ReferencesAiello E., Bartolini C., Caputo C., D’Alessandro L., Fanucci F., Fierro G., Gnaccolini M., La
Moni-ca G.B., Lupia Palmieri E., Piccazzo M. e Pranzini E. (1976) - Il trasporto litoraneo lungo la costa toscana tra la foce del Fiume Magra ed i Monti dell’Uccellina. Boll. Soc. Geol. It., 94: 1519-1571.
Aiello E., Bartolini C., Conedera C., Pranzini E., Taccini S. (1980) - Il litorale della Provincia di Livorno tra Marina di Castagneto e Follonica. Amm. Prov.le Livorno. 44 pp.
6a_Toscana_Enzo.indd 154 04/06/2013 14.23.12

155
ResMar Coastal erosion monitoring - A network of regional observatories
Albani D., Griselli A., Mori A. (1940) - Ricerche sulle variazioni delle spiagge italiane. II. Le spiagge toscane. Tipogr. del Senato, 155 pp.
Aminti P., Cipriani L.E., Iannotta P. and E. Pranzini (2002) - Beach erosion control along the Golfo di Follonica (Southern Tuscany): actual hard protection vs. potential soft solutions. Proceedings of the International Conference on the Changing Coast, Littoral 2002, 22-26 September, 2002, Porto, Portugal. Volume 1, 355-363.
Barsanti D. and Rombai L. (1986) - La “guerra delle acque” in Toscana. Edizioni medicea, Firenze, 169 p.
Bartolini C., Palla B., Pranzini E. (1988) - Studi di geomorfologia costiera: X - Il ruolo della subsidenza nell’erosione litoranea della pianura del Fiume Cornia. Boll. Soc. Geol. It., 108: 635-647.
Bartolini C., Pranzini E., Lupia Palmieri C., Caputo C. (1977) - Studi di geomorfologia costiera: IV - L’erosione del Golfo di Follonica. Boll. Soc. Geol. It., 96, 87-116.
Bartolini C., Cipriani L.E., Pranzini E., e Sargentini M. (1989) - Le linee di riva dei litorali to-scani fra il 1938 e il 1985. In: Coste toscane – Studi sull’erosione, sui venti, sul moto ondoso. Regione Toscana - Giunta Regionale, 16 Tavv.
Bowman D. and Pranzini E. (2008) - Shoreline monitoring: review and recommendations. In: Beach Erosion Monitoring, edited by E. Pranzini e L. Wetzel, BeachMed-e/OpTIMAL Project, Nuova Grafica Fiorentina, Firenze, pp 15-24.
Cipriani L.E. and Regoli C. (2008) - Il Piano di Gestione Integrata della Costa ai fini del Ri-assetto Idrogeologico - L’implementazione del Quadro conoscitivo. Regione Toscana, Firenze, pp. 60
Cipriani L.E. , Pranzini E., Vitale G. and Wetzel L. (2013) - Adaptation to beach erosion at Maremma Regional Park (Tuscany, Italy). GeoEcoMarina 19/2013, in press
Milano V., Ceciarini A., Falini A., Migliorini P. (1986) - Studio sui processi evolutivi in atto lungo il litorale Grossetano tra T.re Rocchette e Cala di Forno. Unpublished report, Co-mune di Grosseto, 205 p.
Pranzini E. (1995) - Cause naturali ed antropiche nelle variazioni del bilancio sedimentario del litorali. Riv. Geogr. It., n.s. 1: 47-62.
Pranzini E. and Rossi S. (2000) - L’erosione del litorale di Punta Ala: un caso di naturale ri-equilibrio morfologico. Studi costieri, 3: 3-27.
ResMar - Sottoprogetto B - Centro Transfrontaliero per lo Studio della Dinamica dei Litorali (2012). Azione 3.3 - Attività 3.3.3: Aggiornamento sulla dinamica evolutiva dei litorali toscani, 54 pp.
Salvioni G. (1957) - I movimenti del suolo nell’Italia centro-settentrionale. Dati preliminari dedotti dalla comparazione di livellazioni. Boll. Geod. Sc. Aff., 19, p.1-50.
6a_Toscana_Enzo.indd 155 04/06/2013 14.23.12

6a_Toscana_Enzo.indd 156 04/06/2013 14.23.12

157
ResMar Coastal erosion monitoring - A network of regional observatories
Coastal monitoring through video systems: best practices and architectural design of a new
video monitoring network at Marina di Massa (Tuscany)
Renata Archetti1,2*, Matteo Vacchi2, Laura Bertoncini3, Roberto Conserva3, Stefano Michela3, Daniele Sigismondi4 and Luca Parlagreco5
1DICAM-University of Bologna, Viale Risorgimento 2, Bologna, Italy.2CIRI-EC, Fluid dynamics Unit, University of Bologna, Via del Lazzaretto 15/5, Bologna, Italy.
3Provincia di Massa-Carrara, Settore difesa del Suolo, Via Marina Vecchia 78, Massa, Italy.4SVM srl, Via Provinciale 418, 19021 Romito Magra (SP), Italy.
5ISPRA, via Vitaliano Brancati 60, Roma, Italy.*Corresponding author: Tel.: +390512093756, Fax: +390512093263;
Viale Risorgimento 2 - 40136 Bologna, Italy. E-mail: [email protected]
AbstractAs part of Action System A of ResMar Project (Reseau pour l’environnement dans l’espace maritime), a new video monitoring network was developed in the administrative province of Massa-Carrara (Northern Tuscany). The entire costal area had been experiencing severe problems of coastal erosion in the last decades. A large beach nourishment was recently carried out in Marina di Massa, and a new video monitoring network was required to as-sess its evolution. This paper focuses on best practices to be adopted in the creation of a new video monitoring network. It describes technical features as well as mitigation meas-ures that could minimise the impacts on the coastal area. Once active, the ResMar video monitoring network of Marina di Massa will allow information concerning beach morphol-ogy to be acquired with temporal continuity and spatial homogeneity. It will particularly monitor the evolution of this new beach nourishment, which is considered to be economi-cally vital for the future of this entire coastal area.
IntroductionMeasuring the location of the shoreline and monitoring foreshore changes through time represent a fundamental task for correct coastal management at many sites around the world. Several authors (Takewaka and Nakamura , 2000; Davidson et al., 2004; Kroon et al., 2007; Van Koningsveld et al., 2007, Archetti, 2009) demonstrated video systems to be an essential tool for increasing the amount of data available for coastline management. These systems typically sample at least once per hour (Plant and Holman, 1997; Holman and Stanley, 2007) and they can provide long-term datasets showing variations over days,
Libro.indb 157 22/05/2013 14.54.03

158
Archetti et al. Coastal erosion monitoring - A network of regional observatories
events, months, seasons and years. In the past few years, due to the wide diffusion of video cameras at relatively low price, the use of video cameras and of video images in analyses for environmental control has increased significantly (Archetti et al., 2008, Archetti and Za-nuttigh, 2010). Even if video monitoring systems are often used in the research field (Morris et al., 2001; Alexander and Holman, 2004; Salmon et al., 2007; Almar et al., 2008), they are most often applied with practical purposes including: i) identification and quantification of shoreline erosion, ii) assessment of coastal protection structure and/or beach nourishment performance, and iii) basic input to engineering design in the coastal zone (Davidson et al., 2004, Turner et al., 2004; Archetti and Romagnoli, 2011).Here we present the guidelines for the creation of a new video monitoring network in Marina di Massa (Tuscany, Italy), developed in the framework of the ResMar (Reseau pour l’environnement dans l’espace maritime) project. The highly urbanised northernmost sec-tor of the Tuscany coastline is situated between the harbours of Carrara (mostly used for cargo shipping) and Viareggio (used for recreational and fishing activities). This 30 km-long tourist district connecting Marina di Carrara, Marina di Massa, Forte dei Marmi and Viareggio consists mainly of summer residences, hotels and other recreational structures available to fulfil the local demand from tourists, including people who move temporar-ily to the coast during summer, and other more occasional visitors (Anfuso et al., 2011). In recent decades, several engineering structures were built in order to solve urgent local erosion problems. As a result, almost all types of protection structures were built along this coast: groynes, detached breakwaters and artificial islands, seawalls and rip-rap revet-ments, and jetties (Anfuso et al., 2011). More recently, alternative measures were carried out, such as nearshore scraping (Cipriani et al., 1999), construction of submerged geotex-tile groynes (Aminti et al., 2004) and creation of gravel beaches (Cammelli et al., 2006).The area of Marina di Massa experienced severe problems of coastal erosion in the past decades (Cipriani, 1999, Morelli and Cipriani, 2011). A large beach nourishment has been recently planned in the area, and a new video monitoring network was required to assess its evolution. This was developed within the framework of ResMar Project.This paper focuses on best practices to be adopted in the creation of this new video moni-toring network. We describe the architectural design of the network and the mitigation measures to be carried out to minimise impacts on the coastal area. Thus, the aim of this study is to provide a robust protocol for the creation of a video monitoring system network which could couple effectiveness with minimal impact on coastal landscape.
MethodsStudy areaMarina di Massa is located in northern Tuscany (Fig.1). The study area is part of a larger physiographic unit that stretches for approximately 63 km, from Sarzana to Livorno. In the study area, prevailing winds blow from W and SW during spring and summer, while in autumn and winter NNE winds progressively increase their frequency. Major storm waves arrive from SW (Aminti et al., 2004; Anfuso et al., 2011). In this coastal section, a potential southward longshore net sediment transport of 150.000 m3/yr was estimated to occur (Aminti et al., 1999). The Magra River provides the main sediment input for the beach of Marina di Carrara and Marina di Massa, discharging at the northern edge of the physiographic unit and feeding beaches down to Forte dei Marmi (18
Libro.indb 158 22/05/2013 14.54.03

159
ResMar Coastal erosion monitoring - A network of regional observatories
km southwards), as demonstrated by sediment petrography (Gandolfi and Paganelli, 1975). The construction of an industrial harbour at Marina di Carrara in the early 1920’s caused the interception of the southward longshore drift, inducing rapid accretion updrift and erosion downdrift. The beach of Marina di Carrara experienced circa 300 m shoreline accretion after harbour construction, even if in recent years (1985-1998) this trend has changed (Cipriani and Pranzini, 1998) and the shoreline retreated due to significant reduc-tion in the sediment load of Magra River (Pranzini, 1995).However, Marina di Massa, which is located downdrift, has been experiencing severe ero-sion phenomena since the early 1930’s, even if in those years the harbour updrift jetty was 400 m long (instead of the current 900 m length). In 1930 the first seawall barrier was built to protect the coast, and in 1957 a series of breakwaters were added, even if the beach had already vanished along 2 km south of the harbour (Morelli and Cipriani, 2011). In the meantime, shoreline retreat gradually shifted southwards, and a series of hard struc-tures, such as seawalls, breakwaters, groins and submerged breakwaters were built along the coast by the Ministry of Public Works, following a demand from bathing establish-ment concession holders to the Municipality of Massa - even if there was proof that these structures would induce erosion at the neighbouring beach of Forte dei Marmi, one of the most popular and trendy beach resorts in Italy. As a consequence, a 6.7 km-long stretch of coast south of the harbour was protected by 9.3 km of hard structures (1.4 km of hard structures per km of coast). At the end of the 1990’s, the shift of competencies to the regional government directed re-search from public institutions (such as Universities) to identify the causes of beach erosion and failure of “archaeostructures”; in addition, Regione Toscana promoted new studies and projects at a smaller scale. The first example is the “General study of the Northern Tuscany Physiographic Unit - Defi-
nition of general guidelines for coastal defence between Bocca di Magra and Viareggio - Preliminary and Experimental projects for the restoration of Marina di Massa beach”. The study was financed by Regione Toscana for approximately 1 Million Euro during the summer of 1997 and lasted for 2.5 years. It was coordinated by Regione Tos-cana and the Regional Agency for the Protection of the Environment in Tuscany, and implemented by three research Institutes (Consor-zio Pisa Ricerche, Dipartimento di Scienze della Terra dell’Università di Firenze and Centro Studi Prato Ingegneria). Within this project, an experimen-tal geotextile submerged groin
Figure 1 - Topographic sketch of the study area “Ronchi”. Ar-rows indicate the location of the 4 beach resorts (courtesy of SVM srl).
Libro.indb 159 22/05/2013 14.54.04

160
Archetti et al. Coastal erosion monitoring - A network of regional observatories
was built and monitored for two years and three similar structures were later added and monitored with funding from Municipality of Massa. As a result shoreline retreat of 4 m/year was halted in the test area located downdrift of the hard shore protection structures of Marina di Massa (Pranzini and Farrell, 2006). In view of these results, a preliminary project for the restoration of the stretch of coast lo-cated between Marina di Carrara harbour and the Versilia river outlet was designed.The area of Marina dei Ronchi represented the major focus of the ResMar Project. This coastal tract (including four beach bathing establishments: VV.FF., Stefania, Villa Freschi, Merida, see Figure 1) develops for approximately 2400 m and is located between the mouths of River Frigido and River Poveromo.
Video monitoring networkA 3-year monitoring programme for the coastal area between the mouths of River Frigido and River Poveromo was conceived within the framework of Project ResMar. The video monitoring network should consist of a sufficient number of video monitoring stations (“video-stations”) allowing the whole area (~2400 m) to be covered without gaps.Each video-station is composed of multiple devices (i.e. webcams and video cameras) placed at a different elevation and distance from the shoreline. This allows achieving de-tailed images of the whole coastal section subject to monitoring. Image analysis will allow monitoring beach response to different oceanographic events and in particular:
- Variations and width of the beach; - Variations in nearshore sand bar topography; - Wave run-up; - Dispersion of suspended sediments.
A single image is not able to provide this information. Thus, image post-processing should be carried out to provide for the quantitative information listed above (Holman and Stan-ley, 2007). Four different types of images are usually used for such purposes: Snapshot, Time Exposure, Variance and Day Timex (Holman and Stanley, 2007, 7 Kuo et al., 2009). A snapshot image is a simple photo of the beach site where the video-station is installed. It is used to document environmental conditions at the site and offers low quantitative infor-mation (Brignone et al., 2012). Time Exposure (or timex) images are obtained by digitally averaging image intensities over fixed time duration (amount of minutes) of image acqui-sition. It is created by processing and superimposing snapshot images of an acquisition cycle. This process eliminates random transitory sea conditions and removes variability in run-up height (Aarninkhof et al., 2005; Brignone et al., 2012). This image processing increases pixel colour intensity, making it possible to distinguish peculiar beach features such as sand bar topography (Lippmann and Holman, 1989), shoreline (Quartel et al, 2006; Kroon et al, 2007), intertidal beach profile (Plant and Holman, 1997, Archetti, 2009), inter-tidal beach slope (Madsen and Plant, 2001), and morphology formations in beach face (Holland, 1998; Almar et al, 2008). Variance images are acquired at the same time as Time Exposure images, but they also enhance the contrast achieved by timex processing. This al-lows for better recognition of submerged foreshore structures and identification of regions that are changing/not changing during acquisition time. Day Timex images are obtained by averaging all images acquired in one day. This elaboration eliminates the effects of tidal
Libro.indb 160 22/05/2013 14.54.04

161
ResMar Coastal erosion monitoring - A network of regional observatories
variation and variation in light intensity due to sun angle changes during the day (Brignone et al., 2012; Morris et al, 2001).Detailed fieldwork of the coastal section was carried out in order to define the total number of video-stations to be installed as well as their correct location according to the guidelines described above. In addition, the presence of pre-existing structures (i.e. bathing establish-ments; flagpoles, etc.) able to host video-stations was evaluated. This usually avoids build-ing new structures which could affect coastal landscape. When necessary, detailed analysis of the environmental impact of new structures was performed according to legal require-ments. In addition, landscape impact analysis was carried out in order to minimise changes to the original coastal landscape.
Results and discussionCreation of the video-monitoring network.According to technical features of the devices used in this work, we divided the study area into sections not exceeding 350 m. The minimal elevation was set in 16 m to ensure useful images are obtained from each video-station. The analysis of existing infrastructure did not identify any buildings suitable for installation of video-stations. For this reason, it was de-cided to use four temporary poles. The spatial framework of this video monitoring network (consisting of four video-stations) is shown in Fig. 2.
Three of the four video-stations have two recording devices each, whereas one is composed by only one recording device.
Figure 2 - Explicative scheme of the video monitoring network (modified from Google Earth).
Libro.indb 161 22/05/2013 14.54.04

162
Archetti et al. Coastal erosion monitoring - A network of regional observatories
Each video-station is equipped with the following devices (Fig. 3): - 1 reflex digital camera (10.1 Mega pixel (3.648 x 2.736)) with 18 - 55 or 75-300 optical zoom;
- 1 USB CCD Video Camera (2 Mega pixel) with CMOS 1/3” sensor and 10X optical zoom (8.0-80.0 mm)
- Both devices are kept in waterproof cases and can be connected to the hosting struc-ture (i.e. bathing establishment roofs, flagpoles, etc.) through a 400 mm arm.
Figure 3 - Technical scheme of the video monitoring station.
Libro.indb 162 22/05/2013 14.54.05

163
ResMar Coastal erosion monitoring - A network of regional observatories
In addition, two video-stations (1 and 4, Fig. 3) will also be equipped with a wireless weath-er station which will acquire data on wind, rain, air pressure and temperature. A “biscuit” management module (Computer Control Unit 1.6 Mhz - HD 160 Gbite; network interface controller Ethernet, Modem UMTS/GSM/GPRS) completes the set-up of each video-station. This allows systems to be remotely monitored and settings to be changed on-line. The software package is composed of three modules:
- VM95 Software for system management. It controls image acquisition (from all de-vices of the video-station) and their processing and uploading on the web-server using FTP protocol.
- VMView Software for remote connection and on-line services (setting changes, etc.). It allows real time monitoring of camera/video camera and of the images captured. It also allows the setting of the system to be modified on-line.
- VMR Software for relocating the images on the web-server. This software is installed on the web-server. It allows downloading images from the data repository. The VMR (Video Monitoring Rectification) performs image rectification. It consists of projecting the entire image captured, or a portion of it, from the image reference system on a user-specified horizontal plane. By image rectification we mean the transformation from image coordinates to world coordinates of the entire scene captured - or a por-tion of it. A projective transformation of a plane at the sea water level is normally used. It is based on a matrix of transformation from image coordinates (U, V) to geographic coordinates (x, y, z mswl). The process involves establishing pairs of Ground Control Points (GCPs) which are visible in the images and in the real world.
In order to extract useful information, ground control surveys should be carried out. They include identification and location of permanent and temporary GCPs placed on the beach and in the sea (i. e., poles showing roundhead structures) in the field of view of each camera.In summary, the technological architecture of this video monitoring system is composed of three modules (Fig. 4): acquisition, management and publication. Wire connection op-erates between acquisition and management modules whereas connection between the management module and the publication server is UMTS based.
Figure 4 - Technological architecture of the video monitoring station (courtesy of SVM srl).
Libro.indb 163 22/05/2013 14.54.05

164
Archetti et al. Coastal erosion monitoring - A network of regional observatories
System settingThe system setting procedure follows the following steps:
- Video camera setting for variance images: - 1 image 4 times per day. Each image is composed of 1400 frames (acquisition speed 2.5 frames/second) in about 10 minutes.
- Video camera setting for time-exposure images: - 1 image 4 times per day. Each image is composed of 1400 frames (acquisition speed 2.5 frames/second) in about 10 minutes.
- Camera setting for single snap images - 1 image (3.888 X 2.592 pixel) 4 times per day. - Weather station setting - 1 complete scanning of all parameters 4 times per day - Automatic system reboot - A reboot of the system is automatically scheduled at the end of each operative day.
Video stations will operate from 8 am to 6 pm and, according to the steps above, daily monitoring will provide 4 variance images, 4 time exposure images, 4 snap images and 4 scans of wheatear parameters. Relocation of images on the web-server will be carried out at the end of the day. Images will then be post-processed (i.e. rectification and geo-referencing, see section 3.1).
Technical and scientific supportThe whole operative period of the video monitoring network will be technically supported on-line and on-site. As stated in section 3.1., both hardware and software can be remotely monitored. This makes it very simple to check the correct functioning of each video-station as well as setting modifications. A further on-site check-up of all network components should be scheduled once a year. Data analysis will be implemented by scientific experts from the University of Bologna. They will also participate in the calibration phase which should be performed soon after network installation. In particular, the following preliminary activities will be carried out.
- DGPS positioning of at least 3 GCPs. - DGPS shoreline position mapping. - correction of camera distortion effects - lens calibration - VMR software calibration
Coastal landscape impact analysisThe construction of the new 16 m-long temporary poles will modify the coastal land-scape. Coastal landscape impact analysis identified four suitable locations for pole instal-lation (Fig.5). The whole coastal area has been severely modified in the past 60 years and several flagpoles, antennas and electricity poles can be currently observed in the wide beach area. For this reason, we tried to minimise the negative impacts caused by the installation of another four poles. Locations were selected as far as possible from the shoreline and in areas not showing peculiar cultural heritage. We decided to place the poles near existing infrastructures such as bathing establishments or other similar structures.
Libro.indb 164 22/05/2013 14.54.05

165
ResMar Coastal erosion monitoring - A network of regional observatories
This allows reducing the visual impact on coastal landscape, as poles are clustered with other structures that are already present. In addition, video-station poles are not perma-nent and will be completely removed after the end of the monitoring period.A rendering of the final impact of poles on the coastal landscape is shown in fig 6. Con-struction will conform to current environmental legislation.
Figure 6 - Rendering of the visual impact of each video monitoring system on the surrounding environment (courtesy of SVM srl).
Figure 5 - Environmental framework of the selected location of the new temporary poles hosting the video-stations (courtesy of SVM srl).
Libro.indb 165 22/05/2013 14.54.08

166
Archetti et al. Coastal erosion monitoring - A network of regional observatories
ConclusionsThe new video monitoring network planned for Marina di Massa within the framework of Project ResMar represents a significant balance between effectiveness and minimal im-pacts on coastal landscape. In this paper, we coupled the technical description of video-stations with the guidelines for their correct management. The ResMar video monitoring network of Marina di Massa will allow information on beach morphology to be acquired with temporal continuity and spatial homogeneity. It will particularly monitor the evolution of a recent beach nourishment, considered to be of vital economical importance for the future of this entire coastal area.Once active, this monitoring system will provide a significant input for the planning and design of littoral interventions, becoming a fundamental tool for proper coastal manage-ment and rationalisation of economic resources.
ReferencesAarninkhof S.G.J., Ruessink B.G. and Roelvink J.A. (2005) - Nearshore subtidal bathymetry
from time-exposure video images, J. Geoph. Res., 110: 13.Alexander P.S. and Holman R.A. (2004) - Quantification of nearshore morphology based on
video imaging, Mar. Geol., 208: 101-111.Almar R., Coco G., Bryan K.R., Huntley D.A., Short A.D. and Senechal N. (2008) - Video obser-
vations of beach cusp morphodynamics. Mar. Geol., 254(3-4): 216-223.Aminti P.L., Cammelli C., Cappietti L., Jackson N.L., Nordstrom K.F., Pranzini E., (2004) -
Evaluation of beach response to submerged groin construction at Marina di Ronchi, Italy, using field data and a numerical simulation model. J. Coast. Res. 33, 99–120.
Aminti P., Iannotta P., Pranzini E. (1999) - Morfodinamica di un sistema costiero intensamente protetto: il litorale di Marina di Massa. Atti della Conv. Lincei, 154, 263 - 270.
Anfuso G., Pranzini E., Vitale G., (2011) - An integrated approach to coastal erosion problems in northern Tuscany (Italy): Littoral morphological evolution and cell distribution. Geo-morphology 129 (3–4), 204–214.
Archetti R. (2009) - Study of the evolution of a beach protected by low crested structures us-ing video monitoring. Journal of Coastal Research . 25(4). 884 – 899.
Archetti R., Zanuttigh B. (2010) - Integrated monitoring of the hydro-morphodynamics of a beach protected by low crested detached breakwaters. Coastal Engineering 57, (10), 879-891.
Archetti R. and Romagnoli C. (2011) - Analysis of the effects of different storm events on shoreline dynamics of an artificially embayed beach. Earth Surf. Proc. Land., doi: 10.1002/esp.2162.
Archetti R., Schiaffino C.F., Ferrari M., Brignone M., Rihouey D. and Gauffres P. (2008) - Video systems for the coastal monitoring, in Beach erosion monitoring, Firenze. pp. 101-109.
Brignone M., Schiaffino C.F., Isla F.I., Ferrari M. (2012) - A system for beach video-monitoring: Beachkeeper plus. Comp. Geosc. In press.
Cammelli C., Jackson N.L., Nordstrom K.F., Pranzini E. (2006) - Assessment of a gravel nour-ishment project fronting a seawall at Marina di Pisa, Italy. J. Coast. Res. S.I. 39, 770–775.
Cipriani L.E. (2004) - Marina di Massa-Marina di Pisa, Toscana (Italy). Eurosion cases. Fire-nze. 19 pp.
Cipriani L.E., Pranzini E. (1998) - Erosione Costiera ed evoluzione recente delle spiagge. In
Libro.indb 166 22/05/2013 14.54.08

167
ResMar Coastal erosion monitoring - A network of regional observatories
“Rapporto sullo stato dell’ambiente in Toscana -1997”. Regione Toscana - ARPAT, 177-183.
Cipriani L.E., Pelliccia F., Pranzini E. (1999) - Beach nourishment with nearshore sediments in a highly protected coast. MEDCOAST’99, Antalya, Turchia, pp. 1579–1590.
Davidson M.A., Aarninkhof S.G.J., Van Koningsveld M. and Holman R.A. (2004) - Developing coastal video monitoring system in support of coastal zone management (Special Issue), J. Coast. Res., 39.
Gandolfi G., Paganelli L. (1975) - Il litorale toscano fra Piombino e la Foce dell’Ombrone (area campione Alto Tirreno); Composizione, provenienza e dispersione delle sabbie. Boll. Soc. Geol. It., 94: 1811-1832.
Holland K.T. (1998) - Beach cusp formation and spacings at Duck, USA, Cont. Shelf Res. 18, 1081-1098.
Holman R.A., Stanley J. and Ozkan-Haller T. (2003) - Applying video sensor networks to near-shore environment monitoring, IEEE Pervasive Computing, 2(4): 14-21.
Holman R.A. and Stanley J. (2007) - The history and technical capabilities of Argus, Coast. Eng., 54: 477-491.
Kroon A., Davidson M.A., Aarninkhof S.G.J., Archetti R., Armaroli R., Gonzalez M., Medri S., Osorio A., Aagaard T., Holman R.A. and Spanhoff R. (2007) - Application of remote sens-ing video system to coastline management problems, Coast. Eng., 54: 493-505.
Kuo C.A., Hwung H.H. and Chien C.H. (2009) - Using time-stack overlooking images to sepa-rate incident and reflected waves in wave flume. Wave Motion, 46: 189-199.
Lippmann T.C., Holman R.A. (1989) - Quantification of sand bar morphology: a video tech-nique based on wave dissipation, J. Geoph. Res., 94(c1): 995-1011.
Madsen A.J. and Plant N.G.P. (2001) - Intertidal beach slope predictions compared to field data. Mar. Geol., 173: 121-139.
Morris B.D., Davidson M.A. and Huntley D.A. (2001) - Measurements of the response of a coastal inlet using video monitoring techniques. Mar. Geol., 175: 251-272.
Morelli M., Cipriani L.E. (2011) - Converting seawalls into gravel beaches, Marina di Pisa, Tuscany – IT. OURCOAST report. 4 pp.
Plant N.G. and Holman R.A. (1997) - Intertidal beach profile estimation using video images. Mar. Geol., 140: 1-24.
Pranzini E. (1995) - Cause naturali ed antropiche nelle variazioni del bilancio sedimentario del litorali Riv. Geogr. Ital., 1: 47-62.
Pranzini E., Farrel E.J. (2006) - Shoreline Evolution and Protection Strategies Along the Tus-cany Coastline, Italy. J. Coast. Res., 39: 842-847.
Quartel S., Addink E.A. and Ruessink B.G. (2006) - Object-oriented extraction of beach mor-phology from video images. Int. J. Appl. Earth Obs., 8(4): 256-269.
Takewaka S. and Nakamura T. (2000) - Surf Zone imaging with a moored video system. In: Proc. of the 27th Int. Conf. Coastal Eng. Sydney, Australia. pp. 151-155.
Turner I.L., Aarninkhof S.G.J., Dronkers T.D.T. and McGrath J. (2004) - CZM applications of Argus Coastal Imaging at the gold Coast Australia, J. Coast. Res., l20(2): 739-752.
Van Koningsveld M., Davidson M., Huntley D., Medina R., Aarninkhof S., Jiménez J.A., Ridgewell J. and de Kruif A. (2007) - A critical review of the CoastView project: Recent and future developments in coastal management video systems. Coast. Eng., 54: 367-376.
Libro.indb 167 22/05/2013 14.54.08

Libro.indb 168 22/05/2013 14.54.08

169
ResMar Coastal erosion monitoring - A network of regional observatories
Biocenosis monitoring: the ecological role of defence structures along the Tuscany coast
Irene Ortolani, Stefano Cannicci* and Claudia Becchi
BIO, Department of Biology, University of Florence, via Madonna del Piano 6, Sesto F.no (Firenze), Italy.
*Corresponding autor: Tel.: +390554574722; Fax: +39055222565via Madonna del Piano 6, Sesto F.no (Firenze), Italy.
e-mail: [email protected]
AbstractThe worldwide threat of coastal erosion has led to widespread usage of armouring infra-structure. Recent studies have demonstrated that such artificial habitats can cause sev-eral ecological impacts on marine assemblages of shallow waters. The present study is a comparative analysis of the artificial barriers in Tuscany, based on the monitoring of the most important biotic assemblages (epibenthos, ichthyofauna and macrobenthic infauna); it evaluates the ecological implications of such structures, aiming at the creation of new tools for management policies. Rocky and geotextile breakwaters act as fish attractors and appear to be highly colonised by epibenthic species, even if most are typical of disturbed environments. Conversely, the ecological effects of barriers on soft bottom fauna are neg-ligible. Our results highlight the importance of targeted monitoring programs, calibrated according to specific local features, and provide important suggestions in the perspective of integrated management.
IntroductionCoastal defence structures ( jetties, groynes and breakwaters) have the primary function of preventing floods by preventing erosion of sedimentary beaches. Coastal erosion is a phenomenon that has been increasing worldwide, and threats have led to widespread implementation of armouring infrastructure along the world’s coasts. Such transformation of coastal landscapes will probably accelerate in the future, in response to the exponential growth of human populations and to global changes, such as sea-level rise and increased frequency of extreme climatic events. The proliferation of defence structures can affect over 50% of shorelines in some regions and may result in dramatic changes to the coastal environment (Airoldi and Beck 2007).In recent years there has been growing interest on the ecological implications of such changes on shallow water habitats and their assemblages of marine organisms.The construction of artificial structures in intertidal areas and shallow waters can lead to fragmentation and loss of natural habitats and to their replacement with artificial ones (Bulleri and Chapman 2010, Bacchiocchi and Airoldi 2003).
Libro.indb 169 17/05/2013 14.42.13

170
Ortolani et al. Coastal erosion monitoring - A network of regional observatories
Several studies have shown that assemblages living on artificial structures can differ from those on adjacent natural rocky reefs (Chapman and Underwood 2011) in terms of epi-benthic composition (Airoldi et al. 2005, Martin et al. 2005, Bulleri and Chapman 2004) and mobile fauna (Chapman 2003), especially where the natural native habitat is formed by sandy bottom. The provision of novel hard habitats along sedimentary shores can modify natural patterns of species dispersal, or facilitate the spread and establishment of non-native species, altering local and regional biodiversity (Bulleri and Chapman 2010).In addition to the provision of new habitats for benthic assemblages, artificial structures can also attract many species of reef fishes (Rilov and Benayahu 2000, Clynick et al. 2008) and contribute to increase fish biomass (Fabi et al. 2004). The novel habitats are often colo-nised by fish species that are also common in nearby rocky reefs (Rilov and Benayahu 2000, Chapman and Clynick 2006), whereas fish assemblages can show higher or lower diversity and abundance, depending on the local context (Rilov and Benayahu 2000, Clynick 2006, Clynick et al. 2008).Moreover, coastal defence structures may determine substantial changes to benthic as-semblages inhabiting the surrounding soft bottoms, due to their effects on physical pa-rameters, such as water circulation, sediment dynamics (Cuadrado et al., 2005; Martin et al., 2005), bottom topography and granulometry (Dugan and Hubbard 2006), and organic content in sand (McLachlan and Brown 2006).Higher species richness and different community structure were found in macrobenthic assemblages inhabiting the sand at sheltered sides of breakwaters in the Adriatic Sea, as compared to the exposed and partially exposed sides (Bertasi et al. 2007). Similarly, mac-rofauna associated to the depositional side of a groyne in Southern Queensland, Australia, showed significantly higher abundance than the macrofauna inhabiting the erosional side (Walker et al. 2008).As described above, there are large evidences of the ecological effects of artificial struc-tures: the introduction of novel habitats and fragmentation of the original ones; colonisa-tion by phytobenthos, zoobenthos and ichthyofauna that are typical of rocky shores; in-duced changes on the infauna of surrounding sandy bottoms. The role of these structures is strongly dependent on coastline morphology and topography as well as on the original habitats; they can act as surrogate for rocky shores (Clynick et al. 2008) when local context allows migration from nearby natural rocky areas, or create real novel habitats with pecu-liar assemblages (Chapman and Underwood 2011).The awareness that most coastal structures cannot be removed led to an increase in re-search efforts towards the definition of new forward-looking policies for the construc-tion of artificial structures. The main objective is to define criteria that meet engineering requirements, but it also aims at an increase of the ecological value of artificial structures as peculiar habitats, as stated by Airoldi and Bulleri (2011). In this context, many attempts have been carried out to increase the ecological potential of these artificial habitats, such as changing the slope of walls, enhancing their overall complexity, or adding different types of microhabitats (Chapman and Underwood 2011). Another study evaluated the feasibility of using coastal defence structures for the conservation of threatened marine species through the transplantation of macroalgal key-species (Perkol-Finkel et al. 2012). The incorporation of several natural elements, such as wetland vegetation, seagrass, coarse woody debris, or shellfish reefs into projects of shoreline stabilisation has also been tested.
Libro.indb 170 17/05/2013 14.42.13

171
ResMar Coastal erosion monitoring - A network of regional observatories
This kind of solutions can reduce the ecological impacts of structures without impinging on their efficacy in halting erosion (Bulleri and Chapman 2010).The modern approach of integrated management policies needs to consider such synergy between engineering requirements and ecological characteristics, for a more comprehen-sive analysis of the cost-benefit trade-off (Airoldi and Bulleri 2011). However, the biological responses to environmental changes are often site-specific, depending on a great variety of local factors and dynamics (Martin et al. 2005). For this reason, the definition and im-plementation of monitoring plans is becoming increasingly important for an adequate management of coastal environments.
The BiBAT projectThe project “Artificial reefs along Tuscan coasts: their role within costal biodiversity man-agement - Bi.B.A.T.”, sponsored by Regione Toscana (POR-ESF 2007-2013 funds, Axis 4 Objective 2), aims at developing an action plan for the monitoring and management of artificial barriers in Tuscany (Fig. 1) for the sake of protecting coastal biodiversity. The goal of this plan is to implement a management system for the coasts of Tuscany, by means of careful monitoring of the biocenosis inhabiting the artificial structures: it will compare the features of different barriers with their impact on biotic communities, in order to create tools for integrated assessment.
The monitoring of communities has been performed on artificial defence structures (rocky and geotextile; Fig. 2 and 3), sampling on the barriers and surrounding sandy bottoms. Natural undisturbed rocky areas have also been sampled to perform comparisons and as-sess the impact of barriers on biotic communities.Data collected will be used to estimate the effects of various barriers on biotic communi-ties, as well as their ecological functions in different morphological, topographical and geological contexts; this will be used to propose new arguments (in terms of E.I.A.) useful for the planning of interventions on the coast. The comparative study between rocky and geotextile artificial structures will also provide new elements to evaluate their degree of impact, providing useful guidance for coastal management in the future.The project has lasted for three years (April 1st 2010 – March 31st 2013), with the following objectives:
- Characterisation of biological communities inhabiting the structures. In particular, we have studied phyto- and zoobenthic assemblages present on breakwaters, and fish fauna that colonise the surrounding area.
- Comparison between communities on artificial and natural substrates (natural rocky reefs and beachrock along the shore). Such comparison will improve knowledge on
Figure 1 - Panoramic view of artificial barriers in Tuscany (Gombo, Pisa).
Libro.indb 171 17/05/2013 14.42.14

172
Ortolani et al. Coastal erosion monitoring - A network of regional observatories
Figure 2 - Emerged artificial breakwater made of limestone blocks at Gombo (Pisa).
Figure 3 - Submerged artificial breakwater made of geotextile at San Vincenzo (Livorno).
Libro.indb 172 17/05/2013 14.42.14

173
ResMar Coastal erosion monitoring - A network of regional observatories
differences between these new coastal habitats and habitats that are naturally present in the area, in terms of biodiversity, species composition and relative abundance. This will make it possible to assess the ecological role of these structures, and identify their potential ecosystem functions (e.g. nursery-role, restocking, stepping stone effect).
- Spatial evaluation of the impact determined by artificial structures on surrounding sandy bottoms. The sandy bottom fauna is closely dependent on sediment charac-teristics, which could be altered by the presence of breakwaters. Thus, the presence and extent of this type of impact have been evaluated through comparison of assem-blages sampled at increasing distances from the barriers.
The results of Bi.B.A.T. project are currently being processed and are still under analysis. In this chapter we present an overview of the principal lines of research, with preliminary results and conclusions on the impact of coastal infrastructures on intertidal and subtidal assemblages, and the potential role of management in increasing their ecological value.
Materials and methodsStudy areaThe Tuscan coast is naturally composed by sandy beaches and rocky reefs. Tuscan shores are faced by two seas face: Ligurian Sea to the north and Tyrrhenian Sea to the south. As detailed in Figure 4, sampling has been carried out during the past three years on natural reefs (rocky shores and beachrock), artificial substrates (breakwaters, geotextiles) and sur-
Figure 4 - Sampling sites along the Tuscan coast. The nature of substrates and the names of localities are reported in the legends.
Libro.indb 173 17/05/2013 14.42.15

174
Ortolani et al. Coastal erosion monitoring - A network of regional observatories
rounding soft bottoms, for a total of sixteen sampling sites at thirteen localities.Four locations with breakwaters, similar in exposure to wave energy, distance from the coast (30-50 meters), water depth (2-4 meters) and shading extent, were chosen along the coast: Gombo, Mazzanta, Follonica and Castiglione della Pescaia (Fig. 4, red lines). Four locations with natural rocky reefs were chosen as control for breakwater sites: Ca-lafuria, Baratti, Punta Ala and Talamone; each control site was located within 30 km from its corresponding experimental site (Fig. 4, green lines).Beachrock outcrops in the intertidal zone were individuated at three localities, all chosen as sampling sites: Baratti, Follonica and Castiglione della Pescaia (Fig. 4, blue lines).Sampling was carried out on different geotextile coastal interventions, at five localities: Marina di Carrara, Ronchi, San Vincenzo, Salivoli and Capalbio (Macchiatonda) (Fig. 4, yel-low lines).
Collection of data on epibenthic assemblagesRelative abundance of phytobenthos and the presence of macrozoobenthos were record-ed at four artificial barrier sites, four sites presenting natural rocky shores, three beachrock sites and five sites presenting geotextile interventions (see Fig. 4). Data were recorded by scuba divers through visual census methods using 25 cm x 25 cm quadrats (Fig. 5), with an adequate number of replicates. Data about turbidity (Secchi disk), pH and sedimentation rate were also recorded at artificial barriers and rocky shores.
Figure 5 - Epibenthic coverage data collection on geotextile breakwaters.
Libro.indb 174 17/05/2013 14.42.15

175
ResMar Coastal erosion monitoring - A network of regional observatories
Phytobenthos data were recorded as functional groups according to literature (Steneck and Dethier 1994), and these well-known groups were then adapted to our data. The func-tional groups considered in this study were filamentous algae (FG2), foliose algae (FG3), corticated foliose algae (FG3.5), corticated macrophytes algae (FG4), leathery macrophytes (FG5), articulated calcareous algae (FG6), crustose algae (FG7) and crustose coralline algae (FG7.5). Acetabularia acetabulum, a unicellular macroalgae, was recorded separately.
Collection of data on fish assemblagesData on the presence and abundance of ichthyofauna were collected by scuba divers through visual census method (Fig. 6) at localities with artificial barriers and natural rocky shores, along 20 m long and 2 m wide transects, with an adequate number of replicates. All fish recorded were also classified according to their typical environment: reef-associated, benthopelagic and demersal (data from FishBase.org, Froese and Pauly (2009)).
Collection of data on infauna from sandy bottomsAt two breakwater sites, Follonica and Castiglione della Pescaia, macrobenthic assemblag-es inhabiting the surrounding sandy bottoms were sampled using a Van Veen grab (0,1 m2 ; about 15 l volume, Fig. 7). Samples were collected laterally to the breakwaters and in parallel to the beach, at four increasing distances (5, 15, 50, 100 m) from the structures at both exposures (upstream and downstream the main alongshore current).
Figure 6 - Visual census of fish assemblages at natural sampling site (Talamone, Grosseto).
Libro.indb 175 17/05/2013 14.42.16

176
Ortolani et al. Coastal erosion monitoring - A network of regional observatories
Assemblages were evaluated considering their ecological quality status, through M-AMBI index (Muxica et al. 2007).
ResultsEpibenthic assemblagesTuscan artificial breakwaters, in spite of showing abundant algal coverage, host benthic assemblages with less biodiversity than natural reefs. As shown in Figure 8, based on benthic assemblages colonising the substrates, breakwaters resulted markedly different from natural rocky reefs, but they partially overlapped beachrock distribution. Breakwa-ters are highly colonised by turf, while we recorded very low percentages of “habitat-forming algae”, mainly belonging to FG4, FG5 and FG6, that are abundant on rocky shores and beachrock instead. Particularly, natural reefs were characterised by a high number
of taxa and functional groups; beachrock showed a predomi-nance of Halopithys incurva, habitat-forming algae, and Hali-ptilon virgatum (FG4 and FG6, respectively).The morphological character-istics of barriers (block shape, water turbidity and depth) led to reduced availability of microhab-itats and overgrowth of those algal species that are typical of disturbed environments.In particular, water turbidity and sedimentation rate, both high-er near breakwaters than next to rocky reefs (Fig. 9), resulted highly correlated to the compo-sition of benthic assemblages.
Figure 7 - Soft-bottoms infauna: Van Veen grab (left) and sorting (right) of the samples.
Figure 8 - Benthic coverage in natural and artificial substrates. The PCO ordination plot shows rocky reefs, beach rocks and breakwaters discriminated on the basis of phyto- and zooben-thos coverage; the explained variation of the axes is reported.
Libro.indb 176 17/05/2013 14.42.17
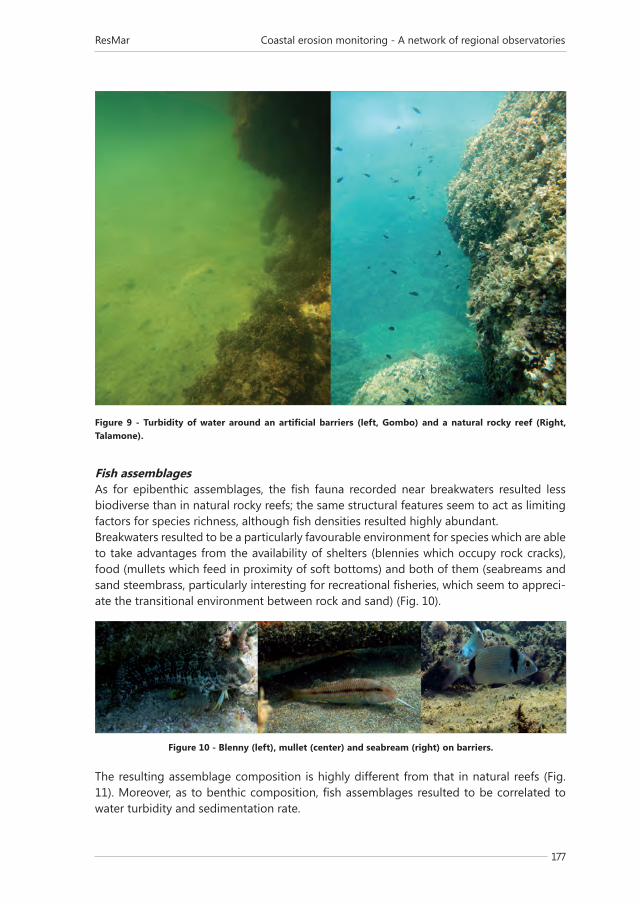
177
ResMar Coastal erosion monitoring - A network of regional observatories
Fish assemblagesAs for epibenthic assemblages, the fish fauna recorded near breakwaters resulted less biodiverse than in natural rocky reefs; the same structural features seem to act as limiting factors for species richness, although fish densities resulted highly abundant.Breakwaters resulted to be a particularly favourable environment for species which are able to take advantages from the availability of shelters (blennies which occupy rock cracks), food (mullets which feed in proximity of soft bottoms) and both of them (seabreams and sand steembrass, particularly interesting for recreational fisheries, which seem to appreci-ate the transitional environment between rock and sand) (Fig. 10).
The resulting assemblage composition is highly different from that in natural reefs (Fig. 11). Moreover, as to benthic composition, fish assemblages resulted to be correlated to water turbidity and sedimentation rate.
Figure 10 - Blenny (left), mullet (center) and seabream (right) on barriers.
Figure 9 - Turbidity of water around an artificial barriers (left, Gombo) and a natural rocky reef (Right, Talamone).
Libro.indb 177 17/05/2013 14.42.18

178
Ortolani et al. Coastal erosion monitoring - A network of regional observatories
Soft-bottoms macrobenthic assemblagesThe local context, in terms of sediment physical characteristics, coastal morphology and nearshore currents, proved to be important in determining the composition of macroben-thic infauna in soft bottoms around the artificial barriers studied. Only in a few sampling stations breakwaters demonstrated to have weak influence on benthic fauna, downstream the main alongshore current. Where present, these effects were limited to an area of a few tens of meters. However, in general soft bottom stations were characterised by a “Good” or “High” ecological quality status through M-AMBI index (Fig. 12), showing clear predomi-nance of sensitive species, typical of undisturbed environments.All benthic assemblages belonged to the “fine sands in very shallow waters” reference biocenosis. A total of 4493 individuals detected were distributed among 88 taxa, with clear
Figure 11 - Fish assemblages composition around natural rocky reefs and breakwaters, using the FishBase-classification of spatial distribution.
Figure 12 - Ecological Quality Ratio of benthic assemblages at Castiglione della Pescaia (above) and Follonica (below) in relation to the increasing distance from the breakwaters. Respective boundaries of Ecological Quality Status are reported on the right.
Libro.indb 178 17/05/2013 14.42.19

179
ResMar Coastal erosion monitoring - A network of regional observatories
dominance made up of Anellida, Mollusca and Crustacea (respectively 30, 26 and 24 taxa, Fig. 13); only a few taxa were identified as Echinodermata, Nemertea, Phoronida, Entero-pneusta and Cnidaria. In particular, the site in Castiglione della Pescaia was dominated by Mollusca and Crustacea, while Anellida was the main group found in Follonica.
Geotextile epibenthic assemblagesThe geotextile monitoring was conducted on coastal structures that differed in terms of age and orientation, making it impossible to perform any comparative analysis. Assem-blages belonged to “infralittoral algae” reference biocenosis Fig. 14, left), even if they
Figure 13 - Some of the most abundant macrobenthic infaunal taxa from soft bottom sampling. From the top left to the bottom right: Bathyporeia sp., Chamelea gallina, Eurydice sp. and Aricidea simonae.
Figure 14 - Epibenthos on geotextiles: algal colonization (left) and Mytilus galloprovincialis (right).
Libro.indb 179 17/05/2013 14.42.19

180
Ortolani et al. Coastal erosion monitoring - A network of regional observatories
showed some differences in composition and abundance, probably in relation to their different wave exposure and age.Moreover, geotextiles appeared to act as recruitment sites for the Mediterranean mussel, Mytilus galloprovincialis, which was highly abundant at almost all sampling stations (Fig. 14, right). Geotextiles appeared to attract mobile fauna (fish, cephalopods, crabs, shrimps) and were inhabited by diverse sessile zoobenthic fauna (Fig. 15).
ConclusionsOur study revealed differences between benthic assemblages inhabiting artificial and natural substrates. Rocky breakwaters, as well as geotextile structures, appeared to be dominated by species that are typical of disturbed environments, and particularly by spe-cies belonging to the algal turf complex (FG2). Conversely, natural substrates showed high abundance of “habitat-forming algae” as Halopithys incurva, and FG4, FG5 and FG6 groups, which contribute to enhance the availability of microhabitat for fauna and, consequently, the biodiversity of benthic assemblages.The high abundance of turf on artificial barriers could be determined by the physical fac-tors that characterise these artificial habitats (such as turbidity and sedimentation rate). Particularly, suspended materials and sediments could represent important limiting factors for the establishment of some less tolerant taxa, due to their abrasive and light-filtering actions.
Figure 15 - Zoobenthos inhabiting geotextiles: mullets and seabreams (top, to the left), seahorse (top, to the right), spirographs (bottom, to the left) and a tunicate surrounded by spirographs (bottom, to the right).
Libro.indb 180 17/05/2013 14.42.20
181
ResMar Coastal erosion monitoring - A network of regional observatories
The beachrocks monitored, outcropping on sandy bottoms, are also highly exposed to sand abrasion; nevertheless, they showed high abundance of Halopithys incurva, an im-portant habitat-forming algae. This record suggests that the establishment of rich and biodiverse assemblages is also possible on substrates highly exposed to sand abrasion, supporting the hypothesis that the age of structures is another important factor in deter-mining assemblage composition. Indeed, artificial substrates should need a longer time to host more complex communities.
Tuscan artificial structures also seem to act as fish attractors for ichthyofauna that is typi-cal of rocky substrates, as shown also in other studies (Rilov and Benayahu 2000, Clinick et al. 2008, Chapman and Underwood 2011). Nevertheless, their fish assemblages were different from the ones found on natural reefs, being composed by species with peculiar spatial behaviour. In fact, the difference between fish assemblages on natural and artificial substrates seems to be due to their use of those structures, or rather to the microhabitat availability, as offered by the structures themselves (Charbonnel et al. 2002).Interestingly enough, breakwaters resulted to be a particularly advantageous environment for species like mullets, blennies, seabreams and sand steembrasses. Thus, the abundance of these taxa could enhance the recreational use of the areas studied, as some are par-ticularly exploited for recreational fisheries. Moreover, these assemblages could have an important ecological role in terms of restocking for nearby natural rocky reefs.
Breakwaters were found to have little impact on the benthic fauna inhabiting the surround-ing sandy bottom, with very short spatial extent, if present. Moreover, the M-AMBI index has assigned “good” or “very good” ecological quality status to the entire sandy area in-vestigated, highlighting the absence of substantial sources of environmental disturbance. Macrobenthic assemblages were mainly composed by sensitive species, with just a small percentage of tolerant species, showing the typical features of undisturbed environments.
The preliminary monitoring conducted on geotextile substrates showed that they were colonised by flora and fauna that are typical of hard substrates, and seemed to attract several marine species.
The characteristics of the Tuscan coast appeared to be crucial in determining the ecological role of the artificial structures: along the coasts of Tuscany, soft and hard bottom coasts are interspersed, and the artificial reefs placed to defend sandy beaches are never far from the natural rocky shores. The artificial structures monitored harbour only non-native spe-cies that are already well established on natural reefs too (e.g. the ubiquitous Caulerpa racemosa), and did not seem to have a relevant role as stepping stones among suitable habitats: this was true for native and non-native species. This could be mainly determined by the morphology of the Tuscan coast, where rocky shores already support connectivity among natural populations and facilitate their dispersal. Moreover, the coast is character-ised by the presence of natural beachrock outcrops which show similar characteristics to artificial barriers. The breakwaters monitored were poor in benthic and fish species, and this is probably due to their limited availability of microhabitats. On the other hand, they could potentially mimic the beachrock environment, if built in natural rock and not in con-
Libro.indb 181 17/05/2013 14.42.20

182
Ortolani et al. Coastal erosion monitoring - A network of regional observatories
crete. We could also determine a trend where the number and abundance of species in-creases as age increases, as stated in a previous study (Ortolani et al., 2012). In this context, transplantation of Halopithys incurva, abundant in natural beachrock when surrounded by sandy bottom, could accelerate the natural process of ecological climax establishment and increase biodiversity of benthic and fish assemblages, ultimately enhancing the availability of microhabitat.
In the Tuscan context, it could be possible to apply forward-looking policies, sinergically developed between authorities, engineers and ecologists. Careful selection of structure type and construction material, minimisation of their maintenance, and experimental transplantation of habitat-forming algae, are strategies that could be integrated to man-agement policies in order to minimise the impact of coastal structures and increase their ecological value.The evaluation of project risks and effects is mostly performed by engineers (as opposed to ecologists). In spite of that, monitoring the ecological effects induced by artificial struc-tures is especially important since the available data are not fully suitable to modelling, and considering that such a continuous control may be useful for statistical analysis. Previous studies showed that impacts on marine organisms are different from place to place, with local effects at some areas and more general rules at others. This is probably due to a combination of ecology and environmental conditions. Structure impacts may be different at each location, making it difficult to provide designs that may be universally applicable (Chapman and Underwood 2011).In view of the new “ecological engineering” science, accurate monitoring of the biocenosis inhabiting artificial structures represent a crucial step in evaluating the ecological response to engineering practices, in order to provide consistent indications to management poli-cies.
ReferencesAiroldi L, Abbiati M, Beck MW, Hawkins SJ, Jonsson P, Martin D, Moschella PS, Sundelöf A,
Thompson RC, Åberg P (2005) - An ecological perspective on the deployment and de-sign of low-crested and other hard coastal defence structures. Coast Eng 52:1073–1087.
Airoldi L, Beck MW (2007) - Loss,status and trends for coastal marine habitats of Europe. Oceanogr Mar Biol Annu Rev 45:345–405.
Airoldi L, Bulleri F (2011) - Anthropogenic disturbance can determine the magnitude of op-portunistic species responses on marine urban infrastructures. PLOS ONE 6:1–9.
Bacchiocchi F, Airoldi L (2003) - Distribution and dynamics of epibiota on hard structures for coastal protection. Estuar Coast Shelf S 56:1157–1166.
Bertasi F, Colangelo MA, Abbiati M, Ceccherelli VU (2007) - Effects of an artificial protection structure on the sandy shore macrofaunal community: the special case of Lido di Dante (Northern Adriatic Sea). Hydrobiologia 586:277–290.
Bulleri F, Chapman MG (2004) - Intertidal assemblages on artificial and natural habitats in marinas on the north-west coast of Italy. Mar Biol 145:381–391.
Bulleri F, Chapman MG (2010) - The introduction of coastal infrastructure as a driver of change in marine environments. J Appl Ecol 47:26–35.
Chapman MG (2003) - Paucity of mobile species on constructed seawalls: effects of urbaniza-
Libro.indb 182 17/05/2013 14.42.20

183
ResMar Coastal erosion monitoring - A network of regional observatories
tion on biodiversity. Mar Ecol Prog Ser 264:21–29.Chapman MG, Clynick BG (2006) - Experiments testing the use of waste material in estuaries
as habitat for subtidal organisms. J Exp Mar Biol Ecol 338:164–178.Chapman MG, Underwood AJ (2011) - Evaluation of ecological engineering of “armoured”
shorelines to improve their value as habitat. J Exp Mar Biol Ecol 400:302–313.Charbonnel E, Serre C, Ruitton S, Harmelin J-G, Jensen A (2002) - Effects of increased habitat
complexity on fish assemblages associated with large artificial reef units (French Medi-terranean coast). ICES J Mar Sci 59:S208–S213.
Clynick BG (2006) - Assemblages of fish associated with coastal marinas in north-western Italy. J Mar Biol Assoc UK 86:847–853.
Clynick BG, Chapman MG, Underwood AJ (2008) - Fish assemblages associated with urban structures and natural reefs in Sydney, Australia. Austral Ecol 33:140–150.
Cuadrado DG, Gómez EA, Ginsberg SS (2005) - Tidal and longshore sediment transport as-sociated to a coastal structure. Estuar Coast Shelf S 62:291–300.
Dugan JE, Hubbard DM (2010) - Ecological effects of coastal armoring: a summary of recent results for exposed sandy beaches in southern California. In: Shipman H, Dethier MN, Gelfenbaum G, Fresh KL, Dinicola RS (eds) Puget Sound Shorelines and the Impacts of Armoring - Proceedings of a State of the Science Workshop, May 2009: U.S. Geological Survey Scientific Investigations Report 2010.p 187–194.
Fabi G, Grati F, Puletti M, Scarcella G (2004) - Effects on fish community induced by installa-tion of two gas platforms in the Adriatic Sea. Mar Ecol Prog Ser 273:187–197.
Froese F, Pauly D (2009) - FishBase. www.fishbase.org (accessed 13 Nov 2012).Martin D, Bertasi F, Colangelo MA, Vries M De, Frost M, Hawkins SJ, Macpherson E, Mos-
chella PS, Satta MP, Thompson RC, Ceccherelli VU (2005) - Ecological impact of coastal defence structures on sediment and mobile fauna: Evaluating and forecasting conse-quences of unavoidable modifications of native habitats. Coast Eng 52:1027–1051.
McLachlan A, Brown A C (2006) - The Ecology of Sandy Shores. Academic Press, Burlington, MA, USA.
Muxika I, Borja A, Bald J (2007) - Using historical data, expert judgement and multivariate analysis in assessing reference conditions and benthic ecological status, according to the European Water Framework Directive. Mar Pollut Bull 55:16–29.
Ortolani I, Giovacchini M, Becchi C (2012) - Associazioni biocenotiche su opere di difesa costiera parallele emerse :uno studio preliminare. Studi Costieri 20:59–72.
Perkol-Finkel S, Ferrario F, Nicotera V, Airoldi L (2012) - Conservation challenges in urban seascapes: promoting the growth of threatened species on coastal infrastructures (M Cadotte. Ed.). J Appl Ecol 49:1457–1466.
Rilov G, Benayahu Y (2000) - Fish assemblage on natural versus vertical artificial reefs: the rehabilitation perspective. Mar Biol 136:931–942.
Steneck RS, Dethier MN (1994) - A functional group approach to the structure of algal-dominated communities. OIKOS 69:476–498.
Walker SJ, Schlacher TA, Thompson LMC (2008) - Habitat modification in a dynamic envi-ronment: The influence of a small artificial groyne on macrofaunal assemblages of a sandy beach. Estuar Coast Shelf S 79:24–34.
Libro.indb 183 17/05/2013 14.42.20

Libro.indb 184 17/05/2013 14.42.20

185
ResMar Coastal erosion monitoring - A network of regional observatories
The shorelines of the Netherlands: Monitoring from the North Sea coast
to the lakeshore of the IJsselmeer
Jelmer Cleveringa1 and Rob Steijn2
1Water Division, ARCADIS Netherlands. Hanzelaan 286, 8017 JJ Zwolle, the Netherlands - Email: [email protected]
2Water Division, ARCADIS NetherlandsHanzelaan 286, 8017 JJ Zwolle, the Netherlands - Email: [email protected]
ARCADIS
Abstract The Netherlands have a long history of monitoring coastal erosion. The yearly (since 1965) monitoring of the North Sea shoreline has provided insight in the causes for coastal ero-sion in the Netherlands and this insight has led the way to a successful coastal manage-ment strategy. Dedicated monitoring of projects, for instance the Zandmotor, is part of the development of new measures for coastal management. The requirements of project monitoring has inspired various innovative techniques. The results from the North Sea shore are now adapted for other parts of the Netherlands, such as the Dutch large lakes.
Introduction Coastal erosion has threatened The Netherlands since the dawn of history. In combination with early coastal protection schemes, measurements and registration of the position of the high and low waterlines have been taken place over more than a century. The long-term registration of the shoreline position allows for the analysis of large-scale and long-term developments (see for instance Wijnberg & Terwindt, 1995). This has provided poli-cymakers and coastal managers with valuable insights in the mechanisms behind coastal erosion. Today’s coastal policy to maintain the shoreline at its position with the use of sand nourishments, has evolved from those insights (Mulder et al, 2011). The techniques to de-liver the sand to the shores also benefit from the long-term monitoring and this has led to innovations as the Zandmotor and nourishments of the slopes of tidal channels. In conjunction with the insights in the causes for coastal erosion, the understanding of beaches and dunes as safeguards against flooding has evolved. For a major part of the North Sea coast of the Netherlands the dunes act as defences against storm surges (Fig. 1). Over the last decade engineering schemes to strengthen the sea defences have increas-ingly incorporated dunes and beaches as part of the solution. Such engineering schemes
Libro.indb 185 17/05/2013 14.42.20

186
Cleveringa and Steijn Coastal erosion monitoring - A network of regional observatories
have now extended to the defences against flooding along the large lakes IJsselmeer and Markermeer. Full sandy defences against flooding and hybrid schemes that combine dike and beach are now investigated for the lake shores. Additionally pilot nourishments and alternative schemes have been implemented along the lake shores to determine their po-tential for ecological en recreational development. In addition to the annual monitoring for the management of the shoreline and the dunes and dikes, project based monitoring takes place. Various innovate techniques have been (further) developed for specific tasks. And more and more ecological monitoring is an intrinsic part of the monitoring campaigns. Each situation (beach, tidal channel, lake) and project (goal, funds) requires a dedicated monitoring scheme. In this contribution some of the monitoring techniques are presented.
Regular monitoring of the North Sea coastThe North Sea coast stretches from the southwest to northeast of the Netherlands. In the south-west the geometry of the shoreline is still largely determined by the former islands, that are now connected by dams and storm-surge barriers. The central Holland coast forms a long stretched uniform shore, interrupted by two man-made harbour en-trances. In the north the Wadden coast is interrupted by natural tidal inlets. Each year since 1965 the entire coastline is measured at fixed cross-sections perpendicular to the shore. The interval of these cross-sections is typically 250 m. The spatial extent of the cross sec-tions has increased over the years and currently runs from a water depth around NAP -10
m (note that NAP is Dutch ord-nance, around mean sea level) up to the most seaward row of dunes. Depths are meas-ured using vessel-based sin-gle-beam echo sounders and state-of the art positioning technology for the ‘wet’ parts of the cross- sections. The height is measured with air-borne LIDAR.
These so-called Jarkus meas-urements allow for detailed analyses of the position of the waterline and dune foot, the evolution of troughs and bars, and the evolution of the sedi-ment volumes of the coast. The measurements are used annually to determine the need for sand nourishments, and every five years to deter-mine the safety against flood-
Figure 1 - The Netherlands, with major flood protection scheme. The numbers denote the projects indicated the text.
Libro.indb 186 17/05/2013 14.42.20

187
ResMar Coastal erosion monitoring - A network of regional observatories
ing. The need for sand nourishments is based on the volume of sediment in a fixed height interval. The safety against flooding is calculated by means of dune-erosion models.
In addition to the yearly measurements of the coast, parts of the North Sea and of the tidal basins (Wadden Sea, Eems-Dollard, Oosterschelde and Westerschelde) are measured with different intervals, to provide the so-called ‘vaklodingen’. The ebb-tidal deltas of the Wadden Sea are for instance measured in 3 year intervals, to obtain insight in the relative fast migration of tidal bars and channels. The tidal basins of the Wadden sea are measured in 6 year intervals, because the changes within the basins are relatively slow. The Western Scheldt estuary is measured yearly. For nautical purposes including maintenance dredg-ing, frequent depth soundings of the navigation channels are obtained. The ‘vaklodingen’ consist of single-beam depth soundings along prescribed cross-sections with an interval of 200 m in the subtidal reaches and Airborne LIDAR height-measurements of the intertidal flats. The ‘vaklodingen’ allow for the analysis of the development of the sediment volume of the entire coast. Today’s coastal policy is to maintain the current water volume with respect to the rising sea level, from the North Sea at – 20 m to the dunes. This requires sand nourish-ments to supplement the sediment stock of the Netherlands. Careful monitoring of the sediment volume of the entire coast is required to determine whether the coastal manage-ment is successful. This national policy is possible thanks to the abundant quantities of good sand in the adjacent North Sea basin.
Monitoring of specific stretches of the shore and specific nourishments have some history (Hamm et al, 2002; Sonneville & van der Spek, 2012). The first shoreface nourishment for instance sparked a lot of monitoring, partly as part of the EU NOURTEC project (Kroon et al., 1994). The monitoring encompassed detailed (i.e. closely spaced cross sections ) and intensive(i.e. frequent) measurements of the morphology. The NOURTEC shoreface nour-ishment was successful and led the way for many more. Similarly the Coast 3D project and its follow ups resulted in much information on disturbed and undisturbed development of beaches and breaker bars, partly with the aid of ARGUS-video monitoring (van Duin et al., 2004; Reussink et al, 2012). Increasing attention to the ecological impact of nourish-ments resulted in monitoring of the ecology of the shoreface, beaches and dunes. The first campaigns took place at Texel and currently a more intensive monitoring takes place at Ameland.
Today’s hotspot for monitoring is the Zandmotor at Ter Heijde (Fig. 2). The Zandmotor is a mega nourishment of 21,5 x 10⁶ m3 that initially has resulted in 128 hectares of beach and dunes and that should in time results in 35 ha of new beaches and dunes. The sandy protrusion rapidly evolves under the on-going wave action and tides that fill and drain the lagoon (Fig. 3). Various techniques are employed ( jet-ski based depth-sounding, Argus) in addition to regular monitoring techniques. New techniques are being developed to follow the evolu-tion of the morphology and the ecology of the Zandmotor. Ultimately the gathered data and knowledge will provide the (im-)possibilities of mega nourishments for coastal man-agement in the Netherlands and abroad.
Libro.indb 187 17/05/2013 14.42.20

188
Cleveringa and Steijn Coastal erosion monitoring - A network of regional observatories
Project-based monitoring along the IJsselmeer and Markermeer The concepts for coastal management and the protection against flooding that have been developed for the North-Sea coast of the Netherlands are being adapted for other parts of the country. The two large fresh-water lakes IJsselmeer and Markermeer (Fig. 1) are bounded by dikes that provide protection against floods. Increasingly, full or partly sandy solutions are being favoured over classic solutions (raising the dike) to improve the safety
Figure 2 - Zandmotor under construction, may 2011 (https://beeldbank.rws.nl, Rijkswaterstaat / Joop van Houdt; location indicated with 1 in figure 1).
Figure 3 - Zandmotor july 2012 (https://beeldbank.rws.nl, Rijkswaterstaat / Joop van Houdt; location indicated with 1 in figure 1).
Libro.indb 188 17/05/2013 14.42.21

189
ResMar Coastal erosion monitoring - A network of regional observatories
against flooding. Locally sandy solutions are used to improve the ecological conditions. Two pilots are presented in figure 4, an ecodam (1) and a shoreface nourishment (2). Both measures aim to improve the conditions for aquatic vegetation by decreasing the turbu-lence and turbidity. The nourishment also improves the conditions through the reduction of the depth. The changes in the morphology are monitored with the use of a glass-fibre grid. In contrast to this sophisticated technology, the vegetation is sampled with a rake. The monitoring before (2011) and after (2012) the implementation of the measures, has already indicated that differences occur in the development of underwater vegetation. The 2013 monitoring will have to reveal whether the observed differences are structural and due to the measures, or not.
ConclusionsLong-term monitoring of the shoreline has provided insight in the causes for coastal ero-sion in the Netherlands and led the way to today’s coastal policy and successful coastal management strategy. Dedicated monitoring of projects is part of the development of new measures for coastal management. The requirements for project monitoring has further led to the development of innovative costs-saving techniques. The results derived for the North Sea coast are now adapted for application along other shores of the Netherlands, including monitoring.
Acknowledgements Belinda Kater (ARCADIS) is kindly thanked for providing the photographs and information on the IJsselmeer monitoring.
Figure 4 - Measures (left) and monitoring scheme (right) of pilot measures to improve the ecological quality of shore of Lake IJssel (location indicated with 2 in figure 1).
Libro.indb 189 17/05/2013 14.42.21

190
Cleveringa and Steijn Coastal erosion monitoring - A network of regional observatories
ReferencesHamm, L. M Capobianco, H.H Dette, A Lechuga, R Spanhoff, & M.J.F Stive (2002) - A sum-
mary of European experience with shore nourishment, Coastal Engineering, Volume 47, Issue 2, Pages 237-264.
Mulder, J.P.M., S. Hommes & E. M. Horstman (2011) - Implementation of coastal erosion management in the Netherlands, Ocean & Coastal Management, Volume 54, Issue 12, Pages 888-897.
Kroon, A., P. Hoekstra, K. Houwman & G. Ruessink (1994) - Morphological monitoring of a shoreface nourishment NOURTEC Experiment at Terschelling, The Netherlands. Pro-ceedings of 24th Conference on Coastal Engineering, Kobe, Japan, 1994.
Ruessink, B.G., Van der Grinten, R.M., Vonhögen-Peeters, L., Ramaekers, G. and Lodder, Q.J. (2012) - Nearshore evolution at Noordwijk (NL) in response to nourishments, as in-ferred from Argus video imagery. In: W.M. Kranenburg, E.M. Horstman & K.M. Wijnberg (eds.), Crossing Borders in Coastal Research, Jubilee Conference Proceedings, 20th NCK-days, Enschede, 13-16 March 2012, p. 179-183.
Sonneville, B. & A.J.F. van der de, Spek (2012) - Sediment and morphodynamics of shore-face nourishments along the North-Holland coast, Proceedings of 33rd Conference on Coastal Engineering, Santander, Spain, 2012.
Van Duin, M.J.P., Wiersma, N.R., Walstra, D.J.R., Van Rijn, L.C., & Stive, M.J.F. (2004) - Nourish-ing the shoreface: observations and hindcasting of the Egmond case, The Netherlands. Coastal Engineering, 51, 813-837.
Wijnberg, K.M. & J. H.J. Terwindt (1995) - Extracting decadal morphological behaviour from high-resolution, long-term bathymetric surveys along the Holland coast using eigen-function analysis, Marine Geology, Volume 126, Issues 1–4, Pages 301-330.
Libro.indb 190 17/05/2013 14.42.22

The Atlantic Coast of New York Monitoring Program along New York’s Ocean Shoreline, USA
Henry Bokuniewicz
School of Marine and Atmospheric Sciences (SoMAS)Stony Brook University Stony Brook, New York 11794-5000 - USA.
Email: [email protected]
AbstractThe Atlantic Coast of New York Monitoring Program (ACNYMP) collected seasonal beach profiles and aerial photography along the south shore of Long Island, New York, USA be-tween 1995 and 2004. Beach profiles were measured twice a year at 426 stations about 0.6 km apart all along the south shore of Long Island. Forty-four parameters were tabulated for each profile. Analysis of ACNYMP data showed reasonable trends related to regional geomorphology. Beach widths, for example were found to increase from the western end of the study area until midway along the coast to the east. Further east, beach width de-creased. Dune volumes increased to the east and are generally above the Federal criteria for adequate protection against a 100-year storm surge. A combination of properties was used to delineate areas of vulnerability to storm events or persistent erosion. Thirteen ar-eas of consistent high vulnerability were identified.
IntroductionAlong New York’s coast, the “Great Nor’easter” of December 1992 was both a memora-ble and alarming event. A nor’easter is not a hurricane but rather an extratropical storm characterized by strong winds from the northeast across along New York’s ocean shore-line, the south shore of Long Island, New York. Nor’easters can persist for days producing historic, coastal flooding over several high tides. The event in 1992 lasted three days from December 11, to December 14, 1992. Sustained winds reached 70 knots off the New York coast. Thousands of people were evacuated from coastal areas and the barrier beach was breached in two places (Terchunian, 1995). In 1989 a series of workshops had been held to identify management strategies for the south shore (Tanski and Bokuniewicz, 1990). The assembled experts recommended a pro-gram of coastal monitoring. In the aftermath, of the Great Nor’easter, a task force was formed by the Governor of New York (Erosion Task Force, 1994). Subsequently, the Atlantic Coast of New York Monitoring Program (ACNYMP) was initiated. Measurements began in spring of 1995 and continued to 2004.
Study AreaLong Island lies in the Coastal Plain province of the eastern seaboard of the United States
191
ResMar Coastal erosion monitoring - A network of regional observatories
Libro.indb 191 17/05/2013 14.42.22

(Taney, 1961). The ocean beaches of Long Island cut into relict, outwash of the Wisconsin glacier in the Late Pleistocene (Wolff, 1989) or formed as barrier beaches. The south shore of Long Island is divided into two distinct physiographic provinces, the headland and the barrier beach (Taney, 1961). The headland extends 53 kilometers westward from the ex-treme southeast tip of the island, Montauk Point. Dunes crest above six meters along this strand; small bay-mouth barriers fronting coastal ponds (Taney, 1961). Barrier beaches form the remainder of the south shore of Long Island. Six inlets break the shoreline into five islands; all inlets have been stabilized with stone jetties (Kassner and Black, 1983). The sandy shoreline is fairly straight, although GPS surveys found shoreline undulations with dominant wavelengths ranging of 1 km to 24 km (Gravens, 1999; Seiver et al., 2007). Beaches typically exhibit seasonal cycles in width and volume related to increased stormi-ness in winter months. However, Long Island is a storm dominated coast and the seasonal cycle has a relatively small amplitude compared to changes due to episodic events. The seasonal cycle was calculated to account for 15% of the total variation of the beach profile (Johnston and Bokuniewicz, 2001). Depending on the timing of storm events and other processes, seasonal extremes were observed to occur independently of yearly maxima and minima (Johnston and Bokuniewicz, 2001).
The ACNYMP was organized into nine geographic reaches, consisting of six segments along the barrier islands and two segments, called the “Ponds” and “Montauk” reaches, in the headlands section on the east end (Figure 1). Coney Island, Rockaway and Long Beach at the western end on the south shore are urban areas with high-density housing. Jones Beach is primarily an undeveloped, public beach. Undeveloped areas of Fire Island form a National Seashore. Low-density housing interspersed along this stretch along the barrier beach. Development at the eastern shoreline consists of low-density residential housing, although some of these houses could be called “palatial”.
The tides along this coast are semi-diurnal with a mean tidal range of 0.6 m in the east increasing to 1.4 m at the western terminus. One-meter waves with approximately seven-second periods typically come from the southeast; maximum wave heights of between
Figure 1. Geographic reaches for the south shore of Long Island as defined by the ACNYMP.
192
Bokuniewicz Coastal erosion monitoring - A network of regional observatories
Libro.indb 192 17/05/2013 14.42.22

3 and 3.5 m with 12 to 14 second periods have been observed during storm conditions (Buonaiuto, 2003). Mean sea level is rising at a rate of about 2.7 mm/yr.
MethodsThe ACNYMP established 426 stations along the shore about 0.6 km apart. Two bench-marks were set at each location. Surveys were started from the seawardmost benchmark which was typically located on the landward slope of the dune. A second benchmark was established further landward to aid in re-locating the profile line if the seaward benchmark was lost. Many of these stations were on private property and special arrangements were needed to allow access. Sub-aerial surveys and aerial photography were intended to be completed twice a year, in the spring and in the winter. Data included select, long-range profiles offshore beyond the closure depth. Profiles were measured by standard techniques using a digital total station. Offshore data were collected with a sea-sled. Data were analyzed using the Beach Morphology Analysis Package (BMAP) produced by the U.S. Army Corps of Engineers. In addition to the profile surveys, the ACNYMP collected color aerial photography seasonally along the entire south shore of Long Island. Imagery was usually collected simultaneously with the ground surveys.
ResultsEach profile collected under the ACNYMP was evaluated for a total of 44 parameters (Table 1). The “profile id” a three-part identifier consisting of reach name, transect number, and survey date for each profile. Each profile was classified into one of three types: “short” (sub-aerial), “long” (sea-sled survey past depth of closure), and “do not use” (failure of quality control). The parameters and analysis protocols were fully described by Batten et al. (2002). The profiles and aerial photographs themselves can be examined at < http://dune.seagrant.sunysb.edu/nycoast/ > accessed on 26 March, 2013. In this section, the beach width, dune volume and shoreline vulnerability will be briefly discussed as examples of the analyses conducted (Batten, 2003). The complete analysis can be found in Batten (2003).
Beach width became wider to Jones Beach then gradually decreased towards Montauk (Fig. 2). These conditions were thought reflective of the slope of the outwash plain and distance from the moraines. Beach width increases from Coney Island to Jones Beach as the ambient coastal slope decreases under fairly uniform wave conditions. Further east, beach width decreased, as a higher energy wave climate was encountered. Spatial trends in beach volume followed similar trends.Dune crest elevation tended to increase in height to the east. Dune volume was measured above the 100-year still water surge elevation (SWL) to give an indication of frontal dune reservoir (Fig. 3). For adequate, erosion protection, the Federal Emergency Management Agency’s (FEMA) rating curve requires a minimum cross-sectional area of 20 yd3/ft (about 51 m3/m) above the 100-year Still-Water Level (Morang et al. 1999). The fact that most of the Long Island ocean shoreline exceeds the FEMA 100-year storm criteria (Fig. 3) does not necessarily mean that protection against coastal flooding was also adequate. Isolated spots of low dune elevation, at, for example, vehicle crossover points or areas of previous washovers, would still be vulnerable to future breaches.
193
ResMar Coastal erosion monitoring - A network of regional observatories
Libro.indb 193 17/05/2013 14.42.22

Table 1 - List of Parameters evaluated for ACNYMP Data.
1 Depth of Closure, distance from shoreline 2 Depth of Closure, below NGVD*3 Beach Volume, monument to NGVD4 Beach Width, distance from monument to NGVD5 NGVD Shoreline Position, Easting & Northing6 Bar I, Crest Depth, below NGVD7 Bar I, Volume8 Bar I, Crest distance from monument9 Bar I, Crest distance from NGVD10 Bar I, Maximum Height11 Bar I, Maximum Height Location, distance from monument12 Bar I, Width of Bar13 Bar II, Crest Depth, below NGVD14 Bar II, Volume15 Bar II, Crest distance from monument16 Bar II, Crest distance from NGVD17 Bar II, Maximum Height18 Bar II, Maximum Height Location, distance from monument19 Bar II, Width of Bar20 Bar III, Crest Depth, below NGVD21 Bar III, Volume22 Bar III, Crest distance from monument23 Bar III, Crest distance from shoreline24 Bar III, Maximum Height25 Bar III, Maximum Height Location, distance from monument26 Bar III, Width of Bar27 Dune Toe Location, distance from monument28 Dune Toe Elevation above NGVD29 Beach Volume, from dune toe to NGVD30 Beach Width, from dune toe to NGVD31 Beach Volume, from monument to dune toe above NGVD32 Beach Volume, from dune toe to -24 foot** depth contour33 Beach Volume, from monument to –24 foot depth contour34 Dune Crest Location, distance from monument35 Dune Crest Elevation above NGVD36 Maximum Dune Crest Elevation above NGVD37 Dune Volume, from dune crest to dune toe above NGVD38 Frontal Dune reservoir above 100 year Still-Water Level39 Landward Dune Toe Location, distance from monument40 Dune Volume, from landward dune toe to seaward dune toe above NGVD41 (+5)foot contour location, distance from monument42 (-5)foot contour location, distance from monument43 Beach Slope, (+5/-5)foot contours 44 Geomorphic Unit (barrier, headland, inlet)
194
Bokuniewicz Coastal erosion monitoring - A network of regional observatories
Libro.indb 194 17/05/2013 14.42.22

* National Geodetic Vertical Datum**US customary units were used. One foot=0.3048 meters
Coastal VulnerabilityStatistical clustering analysis (e.g. Faber, 1994) was used to assess the overall “health” of the beach profile at each station (Batten, 2003). Three model profiles were selected as type-
Figure 2 - Average beach width to 2002 by geographic reach.
Figure 3 - Frontal dune reservoir volume above the 100 year SWL.
195
ResMar Coastal erosion monitoring - A network of regional observatories
Libro.indb 195 17/05/2013 14.42.24

sections in order to “supervise” the clustering (Fig. 4). A low-risk profile category was taken to be a wide beach with a large beach volume and well-developed dune field. A moderate-risk profile was judged to have sufficient beach width and volume to withstand an intense storm, and dune volume above the FEMA 100-year Still-Water Level. A high-risk profile was expected to be one with a narrow, low volume beach, a small, deep offshore bar, if any bar is present at all, and a dune with a volume below the FEMA 100-year Still-Water Level criteria.
Along the south shore of Long Island, 57% of the profiles fell into the moderate risk cat-egory, 24% (fell within the high risk category and 15% fell within the low risk category.
Figure 4 - Model profiles for clustering analysis.
Figure 5 - Example supervised clustering results for the Spring 2002 survey.
196
Bokuniewicz Coastal erosion monitoring - A network of regional observatories
Libro.indb 196 17/05/2013 14.42.25

Thirteen areas of consistent high vulnerability were found to occur in isolated locations (Fig. 5). One of the areas of vulnerability was found in western Fire Island. Houses had been lost and overwash occurred here in the nor’easter of December, 1992.
EpilogueDespite limitations, the ACNYMP provided a wealth of comprehensive data used to dis-tinguish conditions along the coast. The majority of trends were attributed to an increase in wave energy to the eastern end of Long Island superimposed on increasing nearshore slopes (Zarillo and Liu, 1988) and changes in shoreline orientation. The cost and effort, however, was very difficult to maintain. Although several significant storms occurred in the study period, none captured public attention like the Great Nor’easter had in 1992. After a final few years of tenuous existence, the ACNYMP was allowed to lapse in 2004. Then, on October 30, 2012, Hurricane Sandy produced a record storm surge along the Long Island coast. Along the western barrier islands, the water level reached 3.6 m above the National Geodetic Vertical Datum (NGVD), over a meter higher than the previous storm of record. Sea water flooded coastal properties, streets, tunnels, and subway lines. Shore and dune erosion was extensive and three inlets were opened along the ocean shoreline. Damage estimates put the cost of Hurricane Sandy at approximately $70 billion, the sec-ond costliest storm in U.S. history after Hurricane Katrina in 2005. Planning is underway to revive the ACNYMP.
ReferencesBatten, B., Salgado, G., Mclaughlin, E., Bokuniewicz, H., & Cheng, P. (2002) - Atlantic Coast
of New York Monitoring Project, Beach Profile Analysis and Database Development. Report to the New York Department of State, Division of Natural Resources. Marine Sciences Research Center, Working Paper #1232: 30 pp.
Batten B.K. (2003) - Morphologic typologies and sediment budget for the ocean shoreline of Long Island, New York. Ph.D. Dissertation, Stony Brook University: 126pp.
Buonaiuto, F.S. (2003) - Morphological evolution of Shinnecock Inlet, NY. Ph.D. Dissertation. Stony Brook University. 84 pp. + appendices.
Erosion Task Force (1994) - Governor’s coastal erosion task force, final report, v.2, long-term strategy. Variously paginated.
Faber V. (1994) - Clustering and the continuous k-means algorithm. Los Alamos Science, (22), p.138-144.
Gravens M.B. (1999) - Periodic shoreline morphology, Fire Island, New York. Proceedings of Coastal Sediments, 1999. p. 1613-1626.
Johnston S. and Bokuniewicz H. (2001) - Seasonal beach on Long Island’s ocean shorelines (New York). Shore and Beach, 69(4), p. 3-6.
Kassner J. and Black J.A. (1983) - Inlets and barrier beach dynamics: a case study of Shin-necock Inlet, NY. Shore and Beach, 51(3), p. 22-26.
Morang A., Rahoy D. S., & Grosskopf W. G. (1999) - Regional geologic characteristics along the south shore of Long Island, New York. Proc. of Coastal Sediments 1999. p. 1568-1583.
Seaver K., Bokuniewicz H. J., Buoniauto F. (2007) - Evolution of erosional hot spots on a barrier island: Fire Island, New York. Coastal sediments ’07, N.C. Kraus and J.D. Rosati,
197
ResMar Coastal erosion monitoring - A network of regional observatories
Libro.indb 197 17/05/2013 14.42.25

editors. Amer. Soc. Civil Engs. Vol. 3 pp1722-1730Taney N. E. (1961a) - Geomorphology of the south shore of Long Island, New York. U.S. Army
Corps of Engineers, Beach Erosion Board, TM No. 128, 67 pp.Tanski and H. Bokuniewicz (1990) - A preliminary assessment of erosion management strat-
egies for the south shore of Long Island, New York. New York Sea Grant Program. Spe-cial Report No. 105: 31 pp.
Terchunian A. V. and C. L. Merkert (1995) - Little Pikes Inlet, Westhampton, New York. Journal of Coastal Research 11: pp. 697-703
Wolff M.P. (1989) - An environmental assessment of human interference on the natural processes affecting the barrier beaches of Long Island, New York. Northeastern Environ-mental Science. v. 8, p. 119-134.
Zarillo G. A. and Liu J. T. (1988) - Resolving bathymetric components of the upper shoreface on a wave-dominated coast. Marine Geology, 82, 169-186.
198
Bokuniewicz Coastal erosion monitoring - A network of regional observatories
Libro.indb 198 17/05/2013 14.42.25

Coastal erosion monitoring in Colombia: overview and study cases on Caribbean and Pacific coasts
Camilo Botero1, Giorgio Anfuso2,3, Nelson Rangel-Buitrago2,3 and Ivan D. Correa3
1Grupo de Investigación en Sistemas Costeros, Playascol Corporation E.U., Calle 57 # 7-50 int.103, Bogota, Colombia
2Departamento de Ciencias de la Tierra, Facultad de Ciencias del Mar y Ambientales, Universidad de Cádiz, Polígono Río San Pedro s/n, 11510 Puerto Real, Cádiz, Spain.
3Área de Ciencias del Mar, Universidad EAFIT, Carrera 49 Nº 7 Sur - 50, Medellín, Colombia.E-mail: [email protected]
AbstractTourism is one of the fastest growing activities in Colombia; the coast represents the fa-vourite destination for both national and foreign visitors. However, coastal erosion is an ac-tual problem, with high erosive rates in some areas. This chapter shows a general overview of the coastal erosion problem in Colombia and emphasizes the institutional framework used in monitoring. Four study cases are included to present a wide diagnosis of relevant erosive processes, both on Caribbean and Pacific coasts. Findings show erosive rates due to human interventions in all coastal departments on the Caribbean Sea; highest values were recorded in Cordoba (3.3 m/yr), Magdalena (5.3 m/yr) and La Guajira (3.2 m/yr). In addition, monitoring of barrier islands indicated that erosive processes on the Pacific coast are essentially due to natural phenomena, i.e. tsunami and El Niño events. In conclusion, long-term coastal erosion monitoring is urgently required in order to make adequate deci-sions and assess their effectiveness, with special concern to the correct location of coastal infrastructure and the management of coastal risks.
IntroductionHuman occupation along the world’s coastlines has been increasing in the past decades especially due to coastal tourism-related activities, which emerged as one of the largest industries in the world (Jones and Phillips, 2011).Spain plus Italy, France, Greece and Turkey account for ’the most significant flow of tour-ists…. a sun, sea and sand (3S) market’ (Dodds and Kelman 2008); tourism is expected to grow at a rate of 4.0 % per year over the next ten years.In the Caribbean countries, tourist arrivals have increased fivefold, from 166 million in 1970 to 935 million in 2010. Cruise arrivals grew more rapidly over the same period increasing from 1.3 in 1970 to 20 million in 2010 (CTO, 2011). Barbados beaches are an example, where cruises contributed to the local economy with more than US$13 million in 2010 (Dharmaratne & Braithwaite, 1998).
199
ResMar Coastal erosion monitoring - A network of regional observatories
Libro.indb 199 17/05/2013 14.42.25

On the other hand, despite the fact that Colombia has been affected by a number of social, political and security problems that have limited coastal tourism development, it currently record an average revenue per arrival of 1,500 US$/per tourist (UNWTO, 2008). Hence, due to the actual degree of coastal tourism development and its continuous growth, all environmental impacts on coastal areas are very important and may acquire further significance in future years especially when associated to climatic change process-es, e.g. increase in storminess and sea level rise (Jones and Phillips, 2011). Despite causes of coastal erosion, littoral retreat always corresponds to flooding and/or beach and dune erosion. Such processes do not only affect or threat beaches, which are worth billions of tourist dollars (Clark, 1996), but also human activities and infrastructure, becoming in this sense natural hazards. Characterising natural coastal dynamics, behaviour and trend are a basic preliminary step in order to minimise beach erosion. Shoreline position fluctuates in a variety of time scales, a behaviour that introduces many difficulties when reconstructing medium-term coastal trends. In fact, variability in coastline position may be the response to a single factor or to a combination of factors. Main causes of coastal erosion or accretion include individual large storm events or tsunamis, seasonal variability in wave energy, multiyear to decadal-scale variations in storminess, wave energy and coastal morphodynamics, and long-term varia-tions in the relationship between climate and sediment supply (Forbes et al., 2004; Zhang et al., 2002; Orford et al., 2002). In this sense, coastal studies and particularly monitoring programmes acquire the utmost importance. Specifically, coastal changes are surveyed using a wide variety of methods and datasets according to the time spans of the study. Studies on short-term shoreline dynamics are usually carried out at small spatial scales, in a time span less of than 10 years (Crowell et al. 1993). The most common technique used is beach topographical profiling or 3D survey, repeated at regular intervals, in order to measure daily to annual variations in shoreline position and beach volume. Most used tools are the theodolite, total station, DGPS and terrestrial LIDAR (“Light Detection and Ranging”).Vertical aerial photographs, satellite imageries, maps and charts all represent a very useful tool to reconstruct coastline changes at long (>60 years) and medium (between 60 and 10 years) temporal scales (Crowell et al., 1993), and large and medium spatial scales; in addition, they also display coastal type distribution, land uses and dune field evolution. The precision and accuracy of aerial photogrammetric measurements depend on their own characteristics (Moore, 2000) and on the difficulties of locating shoreline position, typically taken as the high water line or identified in mesotidal environments as being the seaward vegetation limit, dune toe or cliff top. Over the last two decades, airborne laser (“LIDAR”) surveys have been largely developed and used in coastal morphological studies (Robertson et al., 2007). This remote sensing technique, usually carried out from a small aeroplane, allows detailed 3D surveys to be undertaken, but its application is limited due to rather expensive costs.
Institutional framework of beach erosion monitoring in ColombiaCompetences in Colombia concerning coastal erosion monitoring are not very clearly dis-tributed and there are several institutions in charge of this issue. The main bodies are the Maritime General Direction (DIMAR - its acronym in Spanish), the Colombian Oce-
200
Botero et al. Coastal erosion monitoring - A network of regional observatories
Libro.indb 200 17/05/2013 14.42.25

anic Commission (CCO) and the Ministry of Environment and Sustainable Development (MADS). Despite the existence of these authorities, advances in coastal erosion monitoring started only five years ago and results are still partial, especially considering the magnitude of erosive processes recorded in the Caribbean and Pacific coasts.The main institution with competences in coastal issues is DIMAR, which was created in 1984 as the national maritime authority, according to Law 2324. In spite of the new chal-lenges in coastal management, administration of common goods in coastal areas is among the DIMAR responsibilities that have not changed during the past 28 years. In fact, several themes as climate change, sea level rise, coastal erosion and beach tourism are not yet among the responsibilities of DIMAR. With regard to the decision making process DIMAR is supported by two research centres, one on the Pacific coast (CCCP) and one on the Caribbean coast (CIOH). Both of them have research programmes in coastal management and geomorphologic issues but unfortu-nately most of the results obtained are published only in Spanish or are not accessible at all. Another important effort made by this institution was the use of LIDAR technology to scan all the coastline of Colombia during 2005 to 2007; unfortunately, access to this information is not possible, due to national security restrictions. Finally, DIMAR is part of the Navy and thus a highly centralised organisation; this point favoured the protection of the coast from short-term developments, but on the other hand they often took too much time in decision-making (Avella et al, 2009). A second institution deeply related to coastal issues is the Colombian Oceanic Commis-sion (CCO). It is composed by 14 ministries and 4 national level institutions, leaded by the Vice-president of the Republic; it is therefore the highest level arena for decision-making on oceanic and coastal themes. The more remarkable achievement of CCO was the Na-tional Oceanic and Coastal Areas Policy, approved in 2008, although its implementation is currently less effective than expected. The highest level of this commission is a consultancy and advisory board and its decisions constitute only guidelines that can be easily disre-garded (Avella et al, 2009).The third institution is the Ministry of Environment and Sustainable Development (MADS) which was created in 1993 and underwent two structural reorganisations (in 2003 and 2011). Since its creation, this ministry has never been a single division or department in charge of oceanic and coastal issues. Only in 2012, after the last reorganisation, a depart-ment of marine environment was established in the third hierarchical level. In spite of that, the Integrated Coastal Management Policy was approved in 2000, and was economically supported by a specific budget established by National Government; unfortunately, this Policy is currently much less applied than expected. Within this institutional framework, the coastal erosion monitoring has been a frequent is-sue, but no one has legal responsibility for its implementation. The main development has been the National Programme for Research, Prevention, Mitigation and Control of Coastal Erosion in Colombia (Guzman et al., 2008), established for the 2009 – 2019 period and leaded by INVEMAR, a national research centre in marine issues linked to MADS. In this programme there are five clear goals for coastal erosion monitoring, three of which were to be reached before 2011 - no information is available to check their level of implementation.The importance of coastal erosion monitoring in Colombia relates to four main issues: Tourism, Risk Management, Urban Population and Infrastructures. Tourism is of increasing
201
ResMar Coastal erosion monitoring - A network of regional observatories
Libro.indb 201 17/05/2013 14.42.25

interest in Colombia, as the country aims at developing the “3S” market as an engine to local economies. In 2010, the Ministry of Trade, Industry and Tourism created the public position of ‘National Beach Manager’, who should be in charge of developing a National Policy of Beach Tourism; this effort has been joined by several projects financed by the Na-tional Tourism Fund (Botero and Sosa, 2011). However, coastal erosion is never mentioned in such initiatives, forgetting that it constitutes the main threat for the “3S” market. The other three issues have a similar axis: contingency. Unfortunately, initiatives to control coastal erosion in Colombia have been triggered by emergencies, as the well-known “km 19” case in the highway between Barranquilla and Santa Marta, two of the biggest cities on the Caribbean coast. In 2010 storm waves reached a line just a few meters from the highway and a multimillionaire public work was urgently approved to control increasing erosion; concrete blocks were emplaced in front of the highway to reduce wave impact, although public knowledge about the success of this project is still unknown. It is a precise example of coastal erosion management within an institutional framework where nobody is directly in charge of it.It is also important to underline the existence of a monitoring programme carried out by IN-VEMAR from April 2009 to April 2011 in the Caribbean and Pacific littorals of Colombia. The main objective was to understand geomorphologic, tectonic and in general terms geologic and climatic characteristics of the littoral in order to review and adjust the existing legal reg-ulations to coastal management. The main achievements have been the realisation of eight workshops, the elaboration of a basic legal regulation document and a conclusive report.
Coastal trend in the Caribbean Sea and in the Pacific OceanA total amount of 4.5 million inhabitants (DANE, 2010), e.g. 11% of national population, lives along coastal areas of Colombia. This includes 46 coastal municipalities: 30 along the Caribbean Sea and 16 along the Pacific Ocean, grouped in thirteen territorial units called ‘Departments’ (Figure 1). Such municipalities have significant land resources and natural ecosystems which represent the base of important economic activities. In spite of that, development of many coastal towns was not in accordance to natural resource distribution and coastal processes. This led to high environmental impact of natural processes (coastal erosion, flooding, etc.) on the quality and availability of marine and coastal resources, qual-ity of human life and economic development of coastal areas (CONPES, 2002).The study and understanding of coastal erosion in order to control, counteract, prevent and mitigate its negative effects on the littoral should have therefore become an impera-tive issue, of national importance, in Colombia. Specific studies carried out by government authorities and universities have demonstrated that erosion processes have increased sig-nificantly in past three decades. Representative cases are observed in the Department of Cordoba and in the Urabá Gulf. At Urabá many square kilometres of land devoted to ag-ricultural and livestock areas were lost at Turbo River mouth (CORPOURABA-UNAL, 1998) and at Arboletes, between the Departments of Cordoba and Antioquia (Correa et al., 2007).Close to Cartagena city, coastal erosion degraded marine seaweeds and coral reefs (CARDIQUE, 1997; INVEMAR, 2005). In the Department of Atlantico, coastal erosion was enhanced by the contraction of a jetty at the mouth of River Magdalena and natural eco-systems were largely damaged at Mallorquin coastal lagoon and in the littoral spit of Gal-erazamba (Correa et al., 2005; INVEMAR, 2006).
202
Botero et al. Coastal erosion monitoring - A network of regional observatories
Libro.indb 202 17/05/2013 14.42.25
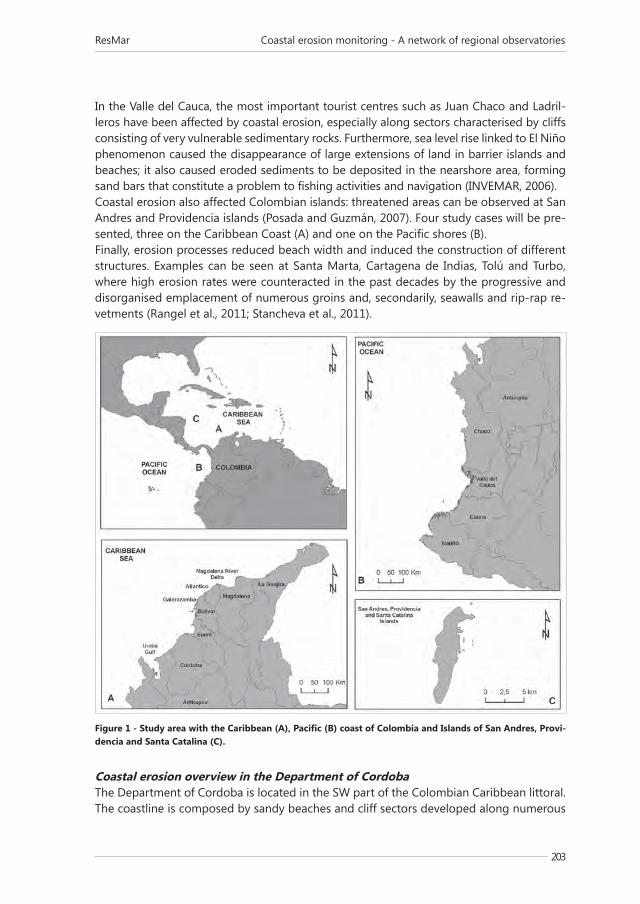
In the Valle del Cauca, the most important tourist centres such as Juan Chaco and Ladril-leros have been affected by coastal erosion, especially along sectors characterised by cliffs consisting of very vulnerable sedimentary rocks. Furthermore, sea level rise linked to El Niño phenomenon caused the disappearance of large extensions of land in barrier islands and beaches; it also caused eroded sediments to be deposited in the nearshore area, forming sand bars that constitute a problem to fishing activities and navigation (INVEMAR, 2006).Coastal erosion also affected Colombian islands: threatened areas can be observed at San Andres and Providencia islands (Posada and Guzmán, 2007). Four study cases will be pre-sented, three on the Caribbean Coast (A) and one on the Pacific shores (B).Finally, erosion processes reduced beach width and induced the construction of different structures. Examples can be seen at Santa Marta, Cartagena de Indias, Tolú and Turbo, where high erosion rates were counteracted in the past decades by the progressive and disorganised emplacement of numerous groins and, secondarily, seawalls and rip-rap re-vetments (Rangel et al., 2011; Stancheva et al., 2011).
Coastal erosion overview in the Department of CordobaThe Department of Cordoba is located in the SW part of the Colombian Caribbean littoral. The coastline is composed by sandy beaches and cliff sectors developed along numerous
Figure 1 - Study area with the Caribbean (A), Pacific (B) coast of Colombia and Islands of San Andres, Provi-dencia and Santa Catalina (C).
203
ResMar Coastal erosion monitoring - A network of regional observatories
Libro.indb 203 17/05/2013 14.42.26

“log spiral” bays formed downdrift of rocky headlands linked to structural faults and/or diapiric volcanoes (Correa et al., 2007).The analysis of shoreline changes clearly evidenced severe erosive processes (Figure 2).
In the southern part, e.g. the Arboletes-Puerto Rey sector, land loss recorded average re-treat values of 60-100 m during the past 80 yrs, with peak values of 1.5 km at Puerto Rey where the morphological point of Arboletes totally disappeared (INVEMAR, 2003; Mazorra, 2004; Correa et al., 2007). Mazorra (2004) and Correa et al., (2007) identified high erosion rates between Puerto Rey and Punta Brava linked to retreat values of 93 m (for the period 1938 – 2005), at the Los Cordobas river mouth and values of 220 m (for the 1938-2005 period) close to Punta Brava, e.g. retreat rates of 1.4 m/yr and 3.3 m/yr respectively. In the central sector of the Depart-ment, between the coastal villages of Puerto Escondido and Cristo Rey, retreat values of 63 m between 1938 and 2005 (e.g. 0.97 m/yr) were observed. Similar values were observed by Mazorra (2004), Correa et al., (2007) and Gonzáles (2007) at Puerto Escondido (0.62 m/yr). In the northern part of the Department, between the coastal villages of La Rada and Paso Nuevo, along a sector of circa 8.5 km long, about 138 m of land (2.12 m/yr) were lost between 1938 and 2003 (Rangel & Posada, 2005)
Figure 2 - Erosion examples at Cordoba department (Caribbean coast). Vegetation destruction at Paso Nuevo and La Rada villages (A and B). Cliff erosion at Los Cordobas (C).
204
Botero et al. Coastal erosion monitoring - A network of regional observatories
Libro.indb 204 17/05/2013 14.42.28

Coastal erosion overview in the Department of MagdalenaThe coastline of the Department of Magdalena is essentially formed by cliffs located at the base of the Sierra Nevada de Santa Marta (SNSM), a mountain chain limited northward by the Oca fault and composed by different geological units ranging in age from the Precam-brian to the Neocene. Shoreline variations were obtained by means of aerial photographs from different years (1954, 1978, 1991, 1995 and 2004). At the city of Santa Marta, retreat recorded maximum values of 23 m, e.g. 1.7 m/yr (between 1991 and 2004). Maximum retreat values (61 m, 2.53 m/yr) were recorded between 1954 and 1978; during the 1978-1991 period, maximum retreat was recorded south of Punta Gloria, with values of 77 m, or 5.3 m/yr (Figure 3). There are no data available for the sector between San Juan and Punta Betín, but erosion, particularly affected rocky headlands along the coastline of Tayrona Natural National Park (Figure 3). The Guachaca - Cabo San Juan sector recorded, during the 1958-2004 period, maximum erosion of 10 m (0.4 m/yr) at the Piedra River mouth (Rangel & Anfuso, 2009a).Coastal changes along the sector between Los Muchachitos and Palomino were investi-gated through the use of 1958, 1979 and 2004 aerial photographs. Maximum erosion (3.2 m/yr) was recorded east of Palomino, at San Salvador, and maximum accretion (0.16 m/yr) was observed west of San Agustin headland. Specifically, in the 1958-1979 period, maxi-mum retreat occurred at San Salvador (almost 100 m coastal retreat, e.g. c. 4.6 m/yr). In the 1979-2004 period, maximum erosion was 73 m at Palomino coastal village. No quantitative data are available for the Los Muchachitos cliff sector but there is plenty of evidence of a severe coastal retreat process (Figure 3).
Figure 3 - Coastal erosion at Magdalena department (Caribbean coast). Cliff erosion and house collapsing at Los Muchachitos area (A) and erosion rates at Palomino (B).
205
ResMar Coastal erosion monitoring - A network of regional observatories
Libro.indb 205 17/05/2013 14.42.31

Coastal erosion overview in the Department of La GuajiraThis Department is located in the northeastern part of Colombia; it consists mainly of a peninsula with beaches, dunes, cliffs and coastal lagoons at sites used for salt harvesting. From an administrative perspective, it includes the coastal municipalities of Dibulla, Rioha-cha, Manaure and Uribia.Maximum erosion and accretion rates were respectively recorded west of Dibulla (3.23 m/yr) and at Ancho River (1 m/yr). Considering the 1958-1979 period, 65 and 13 m of coastal erosion were respectively observed. For the 1979-2004 period, maximum erosion was near 40 m, with erosion rates of 1.5 m/yr (Rangel & Anfuso, 2009b).At Riohacha municipality, which includes a deltaic system and coastal lagoons, erosive rate of 1.85 m/yr were recorded, e.g. c. 105 m in 57 years (Figure 4).
In the municipality of Manaure, the beach accreted 34 m in 32 years (e.g. c. 1.5 m/yr) and a similar trend (c. 95 m in 32 years, e.g. 2 m/yr) was recorded at Puerto Lopez village (Rangel & Anfuso, 2009b).
Coastal erosion monitoring of barrier islands along the Pacific coastLocated just eastwards of the subduction zone of the Nazca plate under the South Ameri-can plate, the Pacific coast of Colombia is a humid tropical region with mean temperatures
Figure 4 - Erosion at La Guajira department (Caribbean coast). Collapsing of human structures (A) and ero-sion of a natural beach (B) at Riohacha. Collapsed structure at Manaure (C).
206
Botero et al. Coastal erosion monitoring - A network of regional observatories
Libro.indb 206 17/05/2013 14.42.33

about 27°C and annual rainfalls between 3 and 10 m/yr (West, 1957; Velez et al., 2001; Correa and Restrepo, 2002; Correa and Morton, 2011a, 2011b). It is a tectonically active, high-seismic risk region with a present coastline of circa 1300 km, between Punta Ardita (Colombia-Panama border) and Cabo Manglares (at the Ecuadorian border) (Duque-Caro, 1990; Paris et. al, 2000; Cediel et al., 2003). The Pacific coast is mostly a low-developed, dif-ficult access and relatively pristine region, proverbial for its luxuriant vegetation and natu-ral beauties, and with a high potential for future development, including touristic activities. High water discharges and sediment supplies derived from the adjacent Andes of Co-lombia combined with meso- to macro-tidal ranges and medium wave energy in the late Holocene caused the formation of numerous, extensive fluvio-deltaic plains dominated by sandy barrier islands and ebb tidal deltas, funnel-shaped coastal lagoons/estuaries and wide muddy tidal flats vegetated by species of mangrove ecosystem penetrating in some places up to 30 km landward from the present coastlines (Martínez et al., 1995, 2000; Cor-rea and Morton 2011a, 2011b). Detailed studies of the geomorphology and historical evolution of the Pacific coast of Colombia began in the past two decades and were driven in part by the urgency of as-sessing the medium term morphological response of the littoral zone to the effects of shallow-depth, historical high magnitude seisms. – from which the most famous were the 31 January 1906 (M 8.8) and the 12 December 1979 (M 6.5) Tumaco earthquakes (West, 1957; Herd et al., 1981, González and Correa, 2001). The 31 January 1906 event is considered as one of the six strongest seisms in the world (M 8.8) and affected around 300.000 km2 of the (at the time) almost undeveloped coastal zones of northeast Ecuador and southern Colombia; there were approximately 400 hu-man casualties related to the impact of a 5 m high wave tsunami that barred the littoral zone and penetrated the coastal land as a wave bore, reaching further than 15 km inland, through the interconnected tidal channels and creeks (Ramírez, 2004). The 12 December 1979 earthquake (M 6.5) had its epicentre 50 km northwest of Tumaco and generated at least 3 tsunami waves that hit the southern Colombian Pacific coast killing approximately 150 persons at San Juan de la Costa Village, a developing centre located on a frontal bar-rier island 60 km north of the Tumaco bay (Herd et al., 1981). Coseismic subsidence values estimated along the littoral zone for above seisms range between 20 and 160 cm, well enough for accelerating pre-existing erosion trends or triggering erosion in new sites, along the southern Pacific coast of Colombia. Tumaco city (at the southern tip of the Tu-maco bay) has had double fortune: it is fronted by extensive offshore sandy barriers that caused tsunamis waves to break some hundreds of meters offshore and these waves ar-rived during low tide, in a zone where a tidal range is 3.5 m. Events like the above mentioned (and more recent coseismic subsidence related to non tsunamigenic, modern seisms) have strongly influenced the progressive erosion and rapid thinning of the longest barrier islands of the Pacific Coast of Colombia considered appro-priate for future coastal and tourism development. The largest barrier islands on the Pacific coast are typically multiple beach ridge sandy-muddy deposits, currently 12-14 km long and 4-5 km wide, whose formation began around 500 yr B.P. according to radiocarbon dates obtained at the El Choncho barrier island, San Juan River delta (González and Correa, 2001; Correa and Restrepo, 2002) (Figure 5). Both this barrier spit and the spit of San Juan de la Costa (Patia River delta, Figure 6a) were
207
ResMar Coastal erosion monitoring - A network of regional observatories
Libro.indb 207 17/05/2013 14.42.33

studied in detail to establish the possible causes of their definitive rupture (breaching) that took place between June and September of 1996 (Morton et al., 2000). Based on the
Figure 5 - Geomorphological map of the southern lobule of the San Juan River delta and location of El Chon-cho barrier island.
208
Botero et al. Coastal erosion monitoring - A network of regional observatories
Libro.indb 208 17/05/2013 14.42.35

inventory of coastline changes, elaborated further to aerial photographs, radar images and planimetric surveys dated 1968 – 2004, we conclude that breaching and segmentation of these barrier islands result from the combined actions of three different natural processes that included, in sequential order:
- the progressive starvation of sand in the central shores of both barriers islands due to the formation of extensive sandy intertidal deltas along updrift areas, which reduced significantly the longshore transport of sand to the distal parts of the islands and consequently triggered net erosional trends of approximately 1m/yr in these shores.
- the coseismic subsidence of the islands, associated to the December 12 earthquake in the San Juan de la Costa barrier island (1.5 m subsidence) and to the November 12, 1998 earthquake in the El Choncho barrier island (estimates subsidence of 0.3 m at the central part of the island). Coastal subsidence of both islands caused a sharp increase in the number of yearly inundations of its central segments (coinciding with the highest annual tidal amplitudes in March and October) that rose from 2 to 14 (ap-proximately one flooding per month) at the El Choncho barrier island. A rapid increase in the already existing shoreline erosion trends was also observed.
- positive mean sea level anomalies of 20-30 cm along the Pacific coast of Colombia caused by temperature anomalies of 3 to 4ºC during the El Niño 1997-1998 event. High water and wave levels during the highest tides of this period caused extensive overwash events along the central parts of the islands and determined their definitive segmentation by widening the pre-existing small channel formed in June 1996 which rapidly evolved to a conspicuous tidal channel tens of meters wide and over 5 m depth.
Further observations and research based on comparisons of historical remote sensing ma-terials have evidenced similar rupture patterns for other barrier islands of the Pacific coast
Figure 6a - Aerial photograph showing the rupture zone of El Choncho barrier island (August 1998).
209
ResMar Coastal erosion monitoring - A network of regional observatories
Libro.indb 209 17/05/2013 14.42.35

of Colombia, namely several islands located between the border with Ecuador and Tumaco bay. New elements related to littoral hazards and vulnerability have thus emerged and enhanced the importance of considering medium to long term evolution of barrier islands, particularly when future sea level rise is considered. Of special interest has been the positive response of barrier island inhabitants to the relocation of coastal villages land-ward from the actual beaches and pro-moting their adaptability to changes by constructing their houses entirely in wood materials (Figure 6b).
ConclusionsAccording to the findings of this study, it is evident that Colombian beaches are being widely impacted by coastal dynamics and in many cases locally by the inadequate devel-opment of different kinds of human structures constructed in the past decades. However, coastal tourism is currently one of the fastest growth economic activities in Colombia, as this is the fifth country in Latin America with the maximum average revenue per arrival.The four study cases shown in this document give a clear overview of the intense erosive processes that occur along the Caribbean and Pacific littorals of Colombia. Nevertheless, the causes of coastal erosion on each coast are different. On the Caribbean coast, several studies carried out by universities and research institutes evidence coastal retreats of 1.5 km in the last 50 years in points as Punta Rey (Department of Cordoba), with maximum erosion rates ranging from 3.2 m/yr to 5.3 m/yr. Human interventions, such as jetties, breakwaters and groins, become the main reasons for current erosive processes.On the Pacific coast erosion processes are essentially caused by natural reasons. In spite of environmental impacts due to Buenaventura and Tumaco cities (which sum together almost half million inhabitants), human impacts along the Pacific littoral are not important because of the small human pressure. The main causes of coastal erosion are due to natu-ral progressive sand starvation, coseismic subsidence and sea level anomalies.Concerning the response of policy-makers and managers in Colombia to coastal erosion, short-term and punctual human interests prevailed on long-term strategic goals despite the fact that ICZM general principles should prevail over local ones. Many examples on the Caribbean coast prove that coastal infrastructures have been more of a problem than a solution. Furthermore, the relationship between scientists and managers is very weak in Colombia; The National Program for Research, Prevention, Mitigation and Control of Coastal Erosion is hardly in its first stages of implementation.Stable and long-term coastal erosion monitoring does not exist and for this reason is not possible to evaluate the consequences of the decisions adopted. Nowadays, some im-provement can be seen due to the development of environmental studies, collaborations with research entities and the elaboration of general ICZM guidelines at a regional and na-tional level. Information already obtained with ‘LIDAR’ technology could be a crucial input
Figure 6b - The New Choncho village, relocated inland of his former location, on the Santa Barbara beaches, an ancient barrier.
210
Botero et al. Coastal erosion monitoring - A network of regional observatories
Libro.indb 210 17/05/2013 14.42.35

for future monitoring, but first a harmonic institutional framework should be developed to support data acquisition and analysis.
AcknowledgementsThis work is a contribution to the Andalusia Research Group RNM-328 and the Ibero-American Network of Beach Management and Certification – PROPLAYAS.
ReferencesAvella, F., Burgos, B., Osorio, A., Parra, E., Vilardy, S., Botero, C., Ramos, A., Mendoza, J., Si-
erra, P., López, A., Alonso, D., Reyna, J., and Mojica, D. (2009) - Gestión del litoral en Co-lombia. Reto de un país de tres costas. In: Manejo Costero Integrado y Política Pública en iberoamérica: Un Diagnóstico. Necesidad de cambio. Editores Arenas P., y Chica, A. Red Iberoamericana en Manejo Costero Integrado (CYTED). Cadiz, Spain. pp. 175-209.
Botero, C. and Sosa, Z. (2011) - Propuestas para la gestión litoral de un país con tres cos-tas: Colombia. En: Barragán, J.M. (coord.) Manejo costero integrado y política pública en Iberoamérica: propuestas para la acción. Red Iberoamericana en Manejo Costero Integrado (CYTED), Cádiz, pp. 139-157.
CARDIQUE (1997) - Diagnostico y zonificación de las áreas de manglar del departamento de Bolívar. Corporación Autónoma Regional del Canal del Dique. Cartagena. pp.228.
CTO (2011) - Caribbean tourism - State of the industry. Caribbean Tourism Organization. St. Michael. Pp.20.
Cediel, F., Shaw, R. P. and Cáceres, C. (2003) - Tectonic Assembly of the Northern Andean Block. In: C. Bertolini, R.T. Buffer and J. Blickwede, eds, The circum-Gulf of Mexico and the Caribbean: Hydrocarbon hábitats, basin formation, and plate tectonics. AAPG Memoire 79: 815-848.
Clark, J. R. (1996) - Coastal zone management handbook. CRC Press/Lewis Publishers. Boca Raton, Florida. Pp 722.
CONPES (2002) - Plan de Acción 2002-2004 de la Política Nacional Ambiental para el De-sarrollo Sostenible de los espacios oceánicos y las zonas costeras en insulares de Colom-bia. Consejo Nacional de Política Económica y Social – 3164. Bogota. pp.27.
CORPOURABA –UNAL (1998). Informe final sobre la “Evaluación de zonas de erosión critica en el litoral Caribe antioqueño”. Corporación para el Desarrollo Sostenible del Uraba - Universidad Nacional de Colombia. Posgrado en Aprovechamiento de Recursos Hi-dráulicos. Medellín. pp.199.
Correa, I.D. and González, J.L. (2000) - Coastal erosion and village relocation: a colombian case study. Ocean&Coastal management. 43(1): 51-64.
Correa I.D. and Restrepo, J.D. (eds) (2002) – Geología y Oceanografía del Delta del Río San Juan, Litoral Pacífico colombiano. Fondo Editorial Universidad Eafit, Medellín, Colom-bia. pp.221.
Correa, I. D., Acosta, S. and Bedoya, G. (2007) - Análisis de las Causas y Monitoreo de la Erosión Litoral en el Departamento de Córdoba. In: Convenio de transferencia hori-zontal de Tecnología No. 30. Corporación Autónoma de los Valles del Sinú y del San Jorge e CVS y Universidad EAFIT. Fondo Editorial Universidad EAFIT. Medellín. pp.128.
Correa, I. and Morton, R. A. (2011a) - Coasts of Colombia. In: http://coastal.er.usgs.gov/coasts-colombia/index.html. Web page of the Coastal and Marine Geology Program,
211
ResMar Coastal erosion monitoring - A network of regional observatories
Libro.indb 211 17/05/2013 14.42.35

St. Petersburg Coastal and Marine Science Center, United States Geological Survey. Consulted July 26, 2012.
Correa, I. D. and Morton, R. A. (2011b) - Pacific Coast of Colombia. In: Eric C.F. Bird (Editor) The Encyclopedia of Worlds Coastal Landforms. Dordrecht, 139 – 199.
Crowell M., Leatherman S.P., Buckley, M. (1993) - Shore-line change rate analysis: long term versus short term data. Shore and Beach, 61 (2): 13-20.
DANE (2010) - Censo general de la República de Colombia. Departamento Administrativo Nacional de Estadística. Bogota. pp.501.
Dharmaratne, G. S. and Braithwaite, A. E. (1998) - Economic valuation of the coastline for tourism in Barbados. Journal of Travel Research, 37(2): 138-144.
Doods, R. and Kelman, I. (2008) - How climate change is considered in sustainable tourism policies: a case of the Mediterranean islands of Malta and Mallorca. Tourism Review International, 12, 57-70.
Duque-Caro, H. (1990) - Neogene stratigraphy, paleoceanography and paleobiogeography in northwest South America and the evolution of the Panamá Seaway. Paleogeography, Paleoclimatology, Paleoecology 77: 203-214.
Forbes, D., G. Parkers, G. Manson, and Ketch, K. (2004) - Storms and shoreline retreat in the southern Gulf of St. Lawrence. Marine Geology 210 (1-4), 169-204.
González, J. (2007) - Erosión litoral del sur del departamento de Córdoba (Minuto de Dios – Santander de la Cruz): Magnitudes, factores y estrategias de control y mitigación. Tesis Geol. Univ. EAFIT. Medellín. pp.86.
González, J.L. and Correa, I.D. (2001) - Late Holocene Coseismic subsidence on the San Juan delta, Pacific Coast of Colombia. Journal of Costal Research, 17 (2): 459-467.
Guzman W., Posada B. Guzman G. and Morales, D. (2008) - Programa nacional de inves-tigación para la prevención, mitigación y control de la erosión costera en Colombia – PNIEC: Plan de Acción 2009-2019. Invemar Ed., Santa Marta pp. 72.
Herd, D. G.; Youd, T. L.; Meyer, H.; Arango, J. L.; Person, W. J. and Mendoza, C. (1981) - The great Tumaco, Colombia earthquake of 12 December 1979. Science 211: 441-445.
INVEMAR, (2003) - Definición de la vulnerabilidad de los sistemas bio-geofísicos y socio-económicos debido a un cambio en el nivel del mar en la zona costera colombiana (Caribe, Insular y Pacífico) y medidas para su adaptación. Informe Final. Instituto de Investigaciones Marinas y Costeras. Santa Marta. pp.102.
INVEMAR (2005) - Informe del estado de los ambientes marinos y costeros en Colombia: año 2004. Serie de Publicaciones periódicas Nº 8. Instituto de Investigaciones Marinas y Costeras. Santa Marta. pp.210.
INVEMAR, (2006) - Proyecto BPIN: Diseño e implementación de un programa de prevención y propuestas para la mitigación de la erosión costera en Colombia. Instituto de Investi-gaciones Marinas y Costeras. Santa Marta. pp.35.
Jones A. and Phillips M. (2011) - Disappearing destinations: recognizing problems – meet-ing expectations – delivering solutions. In Climate Change and Future Challenges for Coastal Tourism, Jones A, Phillips M (eds). CABI: Preston, United Kingdom. 254–273.
Martinez, J.O., González, J.L., Pilkey, O.H. and Neal, W. (1995) – Tropical barrier islands of Colombia’s Pacific Coast. Journal of coastal Research 11: 4232-453.
Martinez, J.O., González, J.L., Pilkey, O.H. and Neal, W. (2000) - Barrier Island evolution on the subsiding central Pacific Coast of Colombia. Journal of Coastal Research 16 (2): 663-684.
212
Botero et al. Coastal erosion monitoring - A network of regional observatories
Libro.indb 212 17/05/2013 14.42.35

Mazorra, J. (2004) - Geomorfología y dinámica de la franja costera entre Punta Arboletes y Cristo Rey, Departamento de Córdoba. Tesis Geol., Univ. Nacional de Colombia - IN-VEMAR, Bogota. pp.143.
Moore, L. (2000) - Shoreline mapping techniques. Journal of Coastal Research, 16(1):111–124.Morton, R. A., González, J. L., López, G. and Correa, I.D. (2000) - Frequent Non-Storm washo-
ver of Barrier Islands, Pacific Coast of Colombia. Journal of Coastal Research 16. 82-87Orford J.D., Forbes D.L. and Jennings S.C. (2002) - Organisational controls, typologies and
time scales of paraglacial graveldominated coastal systems. Geomorphology, 48: 51–85.Paris, G., Machette, R. L, Dart, R. L and Haller, K. M. (2000) - Map and Database of Quater-
nary Faults and Folds in Colombia and its Offshore Regions. United States Geological Survey, Open File Report 00-284. Denver, Pp. 66.
Posada B. and Guzman, W. (2007) - Diagnostico de la erosión costera en las islas de San Andrés, providencia y Santa Catalina. Recomendaciones generales para el manejo y control de la erosión. Santa Marta, pp.102.
Ramírez, J. E., (2004). Actualización de la Historia de los terremotos en Colombia (1904-1981). Instituto Geofísico Universidad Javeriana: Jorge Alonso Prieto Salazar et al. (ed). Bogotá. Editorial Pontificia Universidad Javeriana. 186 pp.
Rangel, N. and Anfuso G. (2009 a). Assessment of Coastal vulnerability in La Guajira Penin-sula, Colombia Caribbean Sea. Journal of Costal Research, SI 56: 792-796
Rangel, N. and Anfuso G. (2009 b) - Medium-term evolution and vulnerability of a littoral sector of the Colombia Caribbean sea. Comptes rendus de l´Académie bulgare des Sci-ences, 62 (9): 1131 – 1140.
Rangel, N. and Posada, B. (2005) - Geomorfología y procesos erosivos en la costa norte del departamento de Córdoba, Caribe colombiano (sector Paso Nuevo-Cristo Rey). Bol. In-vest. Mar. Cost. 34: 101-119.
Rangel N., Anfuso G. and Stancheva M. (2011) - Effects of coastal armouring in the Bolivar department (Caribbean Sea of Colombia). Problems of Geography, 1-2: 97-108.
Stancheva M., Rangel N., Anfuso G., Palazov A., Stanchev H., and Correa I. (2011) - Expand-ing level of coastal armouring: case studies from different countries. Journal of Costal Research, SI 64: 1815 – 1819.
Robertson, W., K. Zhang, and Whitman, D. (2007) - Hurricane-induced beach change derived from airborne laser measurements near Panama City, Florida. Marine Geology, 237: 191-205.
UNWTO (2008) - Tourism highlights, 2008 edition. United Nations World Tourism Organi-zation. Madrid, Pp 12.
Vélez, M. I., Wille, M., Hooghiemstra, H., Metcalfe, S., Vanderberghe, J. and Van der Borg, K. (2001) - Late Holocene environmental history of Southern Chocó region, Pacific Colom-bia; sediment, diatom and pollen analysis of core El Caimito. Paleogeography, Paleocli-matology, Paleoecology 173: 177-214.
West, R. (1957) - The Pacific Lowlands of Colombia: a Negroid area of the American Tropics. Louisiana State University Press, Baton Rouge.Pp. 278
Zhang, K., Huang, W. K., Douglas, B.C. and Leatherman, S.P. (2002) - Shoreline position variability and long-term trend analysis. Shore and Beach, 70: 31-36.
213
ResMar Coastal erosion monitoring - A network of regional observatories
Libro.indb 213 17/05/2013 14.42.35

Libro.indb 214 17/05/2013 14.42.35

215
ResMar Coastal erosion monitoring - A network of regional observatories
Community Participation in Coastal Monitoring: A Case Study from Western Australia
Chiara Danese1 and Ashley Robb2
1Director, Coastal Focus, Geraldton, WA 6530; PhD Candidate Curtin University Sustainability Policy (CUSP), Fremantle, Western Australia.
2 Coastal Program, Northern Agricultural Catchments Council, Lester Avenue, Geraldton, WA 6531. E-mail: [email protected], [email protected]
AbstractThe Western Australian coast is under increasing pressure from population growth and ur-ban development, partly fuelled by the recent mining boom. Many towns located immedi-ately north of the Perth metropolitan area were established on highly dynamic sandy land-forms which are particularly prone to inundation by flooding and storm surge. The majority of studies commissioned in Western Australia to assess coastal changes are undertaken in settlements with larger population densities where financial resources are more readily available. Consequently major data gaps exist in the coastal datasets of smaller and often more vulnerable coastal settlements. This chapter describes some of the challenges that coastal managers face when making planning and management decisions and demon-strates the importance of engaging local communities in coastal management. The chap-ter also provides examples of how some coastal managers in the Northern Agricultural Region (NAR) of WA have involved the local community to help overcome skill, knowledge and data shortages prevalent within their region, specifically through community beach monitoring programs and coastal management discussion seminars.
IntroductionThis final chapter aims to describe the challenges faced by coastal managers in the North-ern Agricultural Region of Western Australia (WA). The chapter describes how variables within the physical and socio-economic environments of the region have created signifi-cant barriers to coastal management. These barriers are replicated in other similarly vast regions of the Australian continent. The authors have worked for almost a decade within the Natural Resource Management (NRM) sector, specifically focusing on coastal manage-ment in this remote region of WA. This chapter attempts to share their knowledge of and experience in the coastal governance system, and describes some of the challenges of, and successes in overcoming significant shortages in technical skills, knowledge and data, by engaging local communities in coastal management. This chapter focuses on two initia-tives to address these shortcomings: community beach monitoring programs and coastal management discussion seminars.
Libro.indb 215 17/05/2013 14.42.35

216
Danese and Robb Coastal erosion monitoring - A network of regional observatories
Western Australia’s Northern Agricultural Region (NAR)The Northern Agricultural Region of Western Australia has a coastline that stretches for over 500 kilometres north of Western Australia’s capital city of Perth. Many of the coastal
Figure 1 - Copyright to the Commonwealth of Australia (2006) and the Department of Environment and Conservation (2009). Map produced by Emma Jackson (NACC GIS Officer).
Libro.indb 216 17/05/2013 14.42.36

217
ResMar Coastal erosion monitoring - A network of regional observatories
towns in the region have grown from fishing settlements (Cervantes, Lancelin, Port Greg-ory), around natural harbours (Geraldton and Dongara) and at the mouth of rivers (Guil-derton, Dongara and Kalbarri). Some ungazetted squatter villages made of small fishing shacks still remain (Wedge and Grey). Most of the towns have been established on highly dynamic sandy landforms such as cuspate forelands, tombolos and mobile sand dunes particularly prone to inundation by flooding and storm surge (Henessy et al. 2007). The NAR has largely been isolated from the state’s major population centre in the Perth metropolitan area. Until recently the region relied on traditional economic activities such as fishing and farming. However, today the mining sector is becoming a significant eco-nomic driver in the region. Such mining developments are designed to help meet the insatiable resource demands of China’s economic growth. Subsequently large public and private investments are spent on infrastructure developments such as road, rail, ports, and energy. The abundance of natural minerals and export activities is luring people to the region attracted not only by financially rewarding job opportunities but also by a desirable beach lifestyle. Eighty five percent of the population in Western Australia resides within 50 kilometers of the coastline (ABS 2010).
The NAR is characterised by a Mediterranean climate with mild, wet winters and hot, dry summers, interspersed with the influence of tropical cyclones during the summer months (BoM 1998). Coastal landforms are shaped by the strong prevailing southerly to south-southwesterly summer winds (sea breezes) that blow parallel to the coastline, high energy waves with large fetch generated in the Indian Ocean and by locally generated wind waves.
Figure 2 - Cervantes, Western Australia. Photo courtesy of Paul Robb.
Libro.indb 217 17/05/2013 14.42.39

218
Danese and Robb Coastal erosion monitoring - A network of regional observatories
High wave energy is dissipated by offshore reefs and islands protecting much of the coast; however higher water levels associated with La Niña over the past two years have caused an unusual acceleration of erosion rates of coastal landforms across the region. Sea level rise will only exacerbate this phenomenon (Commonwealth, 2009; Preston and Kay 2009; IPCC 2007). This biophysical environment creates significant challenges for coastal manag-ers in the NAR.
Data GapsThe majority of studies commissioned to assess the local biophysical environment are mainly undertaken in settlements with larger population densities where financial resourc-es are more readily available due to a larger rate-paying base (such as Geraldton). Such studies are usually commissioned by local government and carried out by external consult-ants or universities, often for the construction and maintenance of harbours, marinas and
Figure 3 - Erosion at Port Denison, Western Australia. Photo courtesy of Chiara Danese.
Libro.indb 218 17/05/2013 14.42.41

219
ResMar Coastal erosion monitoring - A network of regional observatories
Figure 4 - Coastal Compartments of Western Australia: Physical Framework for Marine & Coastal Planning. Image courtesy of Department of Environment and Conservation DEC WA.
Libro.indb 219 17/05/2013 14.42.45

220
Danese and Robb Coastal erosion monitoring - A network of regional observatories
other boating facilities. Consequently major data gaps still exist in the coastal datasets of smaller coastal settlements (Oceanica, 2009). Meteorological, ocean and estuarine data is currently acquired, analysed and managed by regional Port Authorities and the WA Department of Transport. Tide gauge measurement is available from 1896 along the West Australian coast, although only the Fremantle tide gauge has a history that is sufficient for establishing long-term patterns of sea level change (Lambeck & Chappell 2001). Other tide gauge stations have records of only 30 to 50 years long (Belperio 1993).Wind records, water levels, tide records and storm records are available from 1971. How-ever, between 1971 and 1994 measurements were sporadic in nature, typically through comparatively short term distributions of one to four years. Consequently, observations are unevenly distributed around the state and have varied lengths of recording history. Instrumentation has also varied in frequency and accuracy. Aerial photography is available from 1950 and the analysis of imagery using the vegeta-tion line as an indicator of shoreline position movement is still common practice where LiDAR terrestrial mapping is not available. Offshore bathymetry data is mainly available in the proximity of ports and marinas. This is still a major gap in regional areas of WA while bathymetric LiDAR has only been undertaken for highly developed coastal areas (Perth to Cape Naturaliste).The State Government has recently commissioned a study to map coastal stability and susceptibility to change in the coastal zone of Western Australia. This will be a useful tool for local scale coastal management and planning decision-making, vulnerability and risk assessments, and marine conservation planning (Eliot et al 2011). Similar frameworks have been used in the United Kingdom and in the USA. Such data shortages combined with a challenging biophysical environment creates significant challenges for coastal managers in the NAR.
Coastal GovernanceAustralia has a federal system of government, involving six states and two territories. Three layers of government include Federal, State and Local, who all play varying roles in manag-ing the coast of the NAR. The Federal Government’s responsibilities with regard to coastal management are somewhat limited due to Australia’s constitutional arrangements. For instance there is no overarching national coastal policy or legislation despite numerous recommendations since 1975 (1975 – Australian Advisory Committee on the Environment, Coastal Land Report No.5; 1980 – Management of the Australian Coastal Zone, Report House of Representatives Standing Committee on Environment and Conservation; 1991 – The Injured Coastline, Report House of Representatives Standing Committee on Environ-ment, Recreation and the Arts. 1993 – Coastal Zone Inquiry, Resource Assessment Commis-sion; 2010 - Federal Government’s inquiry into Climate Change and Coastal Communities). State governments exercise statutory powers in relation to coastal planning and manage-ment through a range of legislation and agencies. The State Government through the Western Australia Planning Commission (WAPC) prepares and adopts coastal policies and advises local government on strategic land use planning, town planning schemes, subdivision and development approvals. The State Government also provides funding for coastal management and coastal protection works to local government through funding programs. Applicants are often required to match State grant funding on a 50:50 ratio.
Libro.indb 220 17/05/2013 14.42.45

221
ResMar Coastal erosion monitoring - A network of regional observatories
There is no specific coastal management legislation in WA. Instead, the State Government involves itself in coastal management through the functions of its government depart-ments: such as land use planning, land management, environmental protection, transport, infrastructure development, primary industry and mining.Generally much of the responsibility for coastal management resides with local govern-ment authorities (Harvey and Caton 2010). Local government is responsible for the day-to-day maintenance of beaches, coastal facilities and foreshore reserves, and shares with the State Government the task of shoreline protection. In recognition of the need for whole of catchment approaches to natural resource manage-ment, in 2002 the Australian Government supported the establishment of 56 not-for-profit natural resource management organisations across the country. These organisations re-ceive funding to facilitate integrated approaches to natural resource management (NRM) and play a significant role in supporting government and the community to manage natu-ral resources, including those in the coastal zone. Other parties such as Aboriginal groups, research institutions, community groups and pri-vate enterprise also play a key role and have a strong influence on decision-making pro-cesses that affect coastal management. State and local government departments in WA typically provide public services to ex-tremely low population densities, resulting in significant service delivery challenges and strains on government resources. Recent cuts to State Government spending by the West-ern Australian Government have caused further strain on government departments who are responsible for meeting the increased demand for new infrastructure and services caused by the growing mining sector. Western Australia’s unemployment rate of 3.5% (ABS 2011) demonstrates a high demand for skilled labour to service the state’s growing econ-omy. Like other sectors in the NAR, coastal management remains relatively under-skilled and under-resourced.
Community based coastal management In 2006 the Framework for a National Cooperative Approach to Integrated Coastal Zone Management (ICZM) was endorsed by the Federal Government (Commonwealth of Aus-tralia 2006). Of note is that very little national integration has been achieved since the devel-opment of the Framework or as a consequence of the numerous national coastal inquiries (Harvey & Caton 2003, Sorensen 1997), resulting in a fragmented approach to ICZM in Aus-tralia. This is reflected in the variety of coastal legislations, policies, funding programs and most particularly the varying sea level rise factors for policy guidance adopted by each state. Nevertheless, the adoption of the Framework resulted in a positive trend across Austral-ia toward greater community involvement in coastal management and increased public awareness of coastal issues. The Framework recommended the participation of all stake-holders in determining how coastal resources are managed, and specifically encouraged coastal managers to involve the community in management of the coast. However, gener-ally speaking governments remain cautious about public involvement, particularly where management involves sensitive economic or political issues. Participatory approaches can also be perceived as costly and time-consuming processes with little value. A growing pub-lic awareness about the value of the natural environment has also encouraged increased community involvement in decision-making processes. This is often the case where deci-
Libro.indb 221 17/05/2013 14.42.46

222
Danese and Robb Coastal erosion monitoring - A network of regional observatories
sions may have negative environmental consequences and partly as a result of planning policy developments. Between 1997 and 2003 the West Australian government commissioned a series of in-quiries and reforms to assess the effectiveness of the coastal management and planning system (DPI 2002, WAPC 2002). These inquiries identified the need for a more integrated planning framework that would allow decision-making to be more transparent to the com-munity, hopefully encouraging community participation throughout decision-making pro-cesses. As a result, provisions for community consultation, participation and engagement in coastal management and strategic planning were incorporated into the State Coastal Management Policy for Western Australia (WAPC 2003; Section 5.1):
- Ensure that adequate opportunity is provided to enable the community to participate in coastal planning and management including the support and guidance of activities undertaken by voluntary coast care groups (WAPC, 2003).
- The coastal planning strategy or foreshore management plan should be developed in consultation with the broad community and relevant public authorities, and achieve the approval of the local land manager and the WAPC if appropriate (WAPC, 2003).
- Community involvement in coastal zone management and planning in Western Aus-tralia has also been encouraged through the development of funding programs such as ‘Coastwest’. Since its establishment in 2004 the Coastwest program has been dis-tributing small grants to community groups for implementing recommendations made within coastal management plans, through coastal restoration, community edu-cation, monitoring, and conservation projects.
With these programs and policies in place, there is now a significant expectation on coastal managers to involve the community throughout various components of coastal manage-ment and planning. The following sections provide examples of how some coastal manag-ers in the NAR involved the local community to help overcome the aforementioned skill, knowledge and data shortages prevalent within their region, specifically through commu-nity beach monitoring programs and coastal management discussion seminars.
Community Beach Monitoring ProgramThe WA Coastal Protection Policy (WAPC 2006) recommends that ‘local coastal processes are understood’ and that ‘adequate monitoring’ is undertaken prior to any coastal protec-tion works taking place. However a range of land managers with varying levels of technical skills, knowledge, datasets and access to financial resources means that elaborate coast-al protection works are often constructed despite a poor understanding of local coastal processes. While State Government funding provides financial assistance for monitoring programs through the Coastal Protection Grants (50:50 requirements), the skill, knowl-edge, data and resource shortages make a consistent and coordinated approach to beach monitoring across the state and even within a region difficult to achieve. As a result, coastal managers are deprived of sound baseline information and long-term, reliable datasets. Due largely to limited resources stemming from small population densities, employees within local governments are often responsible for a range of duties, of which coastal management is usually a minor role. Subsequently local governments often lack specialist knowledge and skills and therefore have a limited ability to interpret and translate infor-mation and data relevant to coastal management. Despite this, independent peer review is
Libro.indb 222 17/05/2013 14.42.46

223
ResMar Coastal erosion monitoring - A network of regional observatories
yet to be adopted as a necessary mechanism for ensuring a high standard of quality and accuracy. A gap analysis report undertaken for the NAR in early 2010 identified a lack of information on long-term coastal change, creating significant challenges for evaluating coastal hazards (Oceanica 2010). Consequently, coastal hazards are often discounted within local decision making processes. A community study conducted at the same time found considerable concern for the condition of the coastal environment (Beckwith Environmental Planning 2010). To overcome these barriers and increase community engagement in coastal man-agement, the Geraldton Volunteer Beach Monitoring Program was designed in 2010 as a pilot beach monitoring program. Geraldton is the region’s largest coastal settlement and is located on low-lying sandy coastal compartments. Geraldton’s coastal zone is under increasing pressure from pop-ulation growth, urban development, and subsequent commercial and recreational use. Widespread beach and dune erosion is already placing private and public property and infrastructure at risk from coastal erosion and inundation. Subsequently, the Geraldton Volunteer Beach Monitoring Program was developed by the region’s natural resource management body, the Northern Agricultural Catchments Council (NACC), in collabora-tion with local government and coastal engineers from the WA Department of Transport. The program was primarily funded through the WA Department of Planning’s coastal com-munity grants program: Coastwest.The aim of the program was to develop a method for utilizing community skills and re-sources in order to create a long term photographic record of coastal change, that would complement other datasets such as ocean current, wave and sediment distribution data, and be transferable to other local government areas in the NAR and across WA. It was im-portant for the program to learn and integrate methods and lessons learnt from previous state, national and international programs. Following the design of the programa team of community volunteers was identified and trained to take digital photos at key beach monitoring sites, at varying intervals depending on the season, and then upload to an online photo-sharing repository. Uploaded photos are labeled according to date, time, and monitoring site, and geotagged to permit the fu-ture production of an interactive, virtual aerial map for use by coastal managers as well as the community. At each site, volunteers are asked to include field-of-view reference points to ensure the same image profile is captured at each site. Increased pressures on coastal land from urban development, commercial and recreational use and climate variability means that gathering information to understand coastal pro-cesses is a high priority. This complimentary dataset will help scientists and coastal manag-ers better understand how and why local beaches are changing. Additionally, the region’s nearshore environment is habitat to significant seagrass meadows. Therefore this dataset will also provide important information to coastal managers regarding the movement of seawracks1 along the region’s coastline.Implementing the program has not been without its challenges though. The important link between taking site photos and uploading them to the online repository has been identified by volunteers as a somewhat arduous task and has been one of the most signifi-
1 Seawracks are composed largely of seagrasses and seaweeds.
Libro.indb 223 17/05/2013 14.42.46

224
Danese and Robb Coastal erosion monitoring - A network of regional observatories
Figure 5 and 6 - Beach monitoring photos taken by Geraldton volunteers. 21st June 2012 (5) and 1st June 2011 (6). Photo courtesy of Tom Brady.
Libro.indb 224 17/05/2013 14.42.47

225
ResMar Coastal erosion monitoring - A network of regional observatories
cant barriers to developing consistent datasets at each monitoring point. Advancements in digital technology have created an opportunity for program coordinators to develop a smartphone application that will allow volunteers to automatically upload photos to the database immediately after taking the photos on site.Despite this and other challenges, to date over 1,000 photos covering 28 sites have been uploaded online since the program’s inception by up to 20 volunteers (photos available at http://www.flickr.com/groups/gbmp/). This has encouraged the NACC and Department of Transport to support the program’s expansion from Geraldton to across a range of coastal settlements within the NAR, adding valuable coastal datasets to the relatively poor pool of data available for coastal managers within the NAR.
The Coastal Conversations Series The 2009 and 2011 Coastal Conversations Series were two series of coastal management discussion seminars developed by practitioners at the NACC to address a range of factors that included:
- Vast distances from coastal settlements in the NAR to Perth, which created barriers for coastal managers and decision makers who were looking to increase their coastal planning and management skills and knowledge;
- No university or coastal research institute in the region; - Skill shortages created by the mining sector; - Employees of local governments within the NAR who are often responsible for a range of duties, of which coastal management is usually a minor role and one that they have no or very little training in;
- An increasing expectation of coastal managers to involve the community throughout various components of coastal management and planning processes, and,
- An understanding that participatory approaches to coastal management and planning can be of higher value when participants are well informed about local level issues.
In response to these factors, the NACC identified a need to better understand commu-nity and coastal manager learning requirements. A community study and a survey to lo-cal government staff helped identify key coastal planning and management topics where knowledge and skill levels were deemed relatively low compared to the duties and decision making responsibilities of the surveyed respondents. Subsequently, in 2009 the NACC de-veloped a series of coastal management discussion seminars, aimed at raising awareness of key coastal planning and management issues that provided opportunities for learning and discussion with coastal planning and management specialists from other areas of WA, Australia and internationally. The result was a series of 24 seminar events held over 3 years, delivered with a variety of partners and coastal specialists in coastal towns throughout the NAR, with funding sup-port from Coastwest. Sessions averaged 25 participants covering a diverse cross-section of the community including: support staff and executives from government departments (lo-cal government, planning, environment, fisheries); education sectors (schools and universi-ties); industry groups, community groups and general community members. Topics includ-ed geology and geomorphology, coastal ecosystem services, impacts of climate change on the coast, coastal risk assessment, legal and liability issues of coastal development and sea level rise, methods for protecting coastal infrastructure, climate change impacts in the
Libro.indb 225 17/05/2013 14.42.47

226
Danese and Robb Coastal erosion monitoring - A network of regional observatories
marine environment, coastal biodiversity, and others. Each conversation event included a 45 minute presentation from the technical specialist and a 20 minute discussion time hosted by a facilitator who helped to ensure discussions stayed on topic. Participants were encouraged to stay for a light meal after each event in order to encourage informal discussion and networking activities. Events were held dur-ing lunch times for professional staff and repeated in the early evenings to accommodate other sections of the community.Participants at each event were requested to complete feedback forms in order to gauge appropriateness of the topic, the event format, changes in the participants’ perceived knowledge levels before and after each event, and any other comment participants wished to make. Feedback analyses of the two series reflected a 35% or better increase in the perceived knowledge levels of attendees across all topics presented. Other outcomes ob-served included more informed and active community comment within local level planning processes and public comment periods, strengthened coastal management networks and relationships, and an increased community understanding of the complexity of a variety of coastal planning and management issues. A series of videos of the events were developed to ensure content was available to a wider audience. These videos have been uploaded online and are frequently referred to by coastal managers and community throughout the region (videos available at http://nacc.com.au/pages/4851/videos). The series format has since been adopted by other regions within Western Australia.While these outcomes have been extremely encouraging, assessing their impact on coastal management in the region is much more difficult to measure. Some recent coastal projects and coastal management decisions that have been made since the two series occurred seem contrary to certain content provided by specialists throughout the series. Of course,
Figure 7 - Session 1 of the 2011 Coastal Conversations Series in Geraldton, Western Australia. Photo courtesy: NACC.
Libro.indb 226 17/05/2013 14.42.50

227
ResMar Coastal erosion monitoring - A network of regional observatories
despite available information, decisions made that affect the coastal zone will always be subject to political prioritizations. In saying this, anecdotal evidence suggests that the two series have had a largely positive impact on coastal management in the region.
ConclusionsWhile coastal management of the Northern Agricultural Region remains a significant chal-lenge for coastal managers, our experience demonstrates valuable potential to utilize community interest and resources to help overcome some barriers currently inhibiting the management of the region’s coastal zone. It is important to note that these are comple-mentary activities that need to be supported by other key activities that may also help to overcome significant barriers being experienced by coastal managers in the NAR. Some of these activities may include:
- Collaboration with other regions within and outside of Australia. This would help to strengthen support networks for coastal managers working in isolated regions, and ensure lessons learnt and new methodologies are shared across regions. Rapid devel-opments in digital technology provide many opportunities for these possibilities to be realised.
- The development of a centralised regional depository for coastal data to help ensure greater consistency in coastal monitoring across a region, support joint monitoring strategies and programs, allocating resources (expertise) and finances to the task of monitoring, maintain networks and partnerships and improve data knowledge and management.
- Continue to involve the community in coastal management in more meaningful and transparent ways.
Acknowledgments Dr. Michael Payne who reviewed the document, Dr Ian Eliot who helped initiate the pro-gram, Riki Porteus, Department of Transport, Coastwest and the City of Greater Geraldton.
ReferencesAustralian Bureau of Statistics: ABS (2010) - Regional Population Growth, Australia 2008-
2009. Canberra. Australian Bureau of Statistics: ABS (2012) - Labour Force, Australia. Labour Force, Australia
(cat. no. 6202.0). June 2012. Canberra. Beckwith Environmental Planning (2010) - Geraldton-Greenough Coastal Communities
Study. Prepared for the Northern Agricultural Catchments Council (NACC). Belperio A. P. (1993) - Land subsidence and sea level rise in the Port Adelaide estuary:
Implications for monitoring greenhouse effect. Australian Journal of Earth Science, 40: 359-368. Berendsen, HJA
Bureau of Meteorology: BoM. (1998) - Gascoyne-Murchison Climatic Survey Western Aus-tralia. Department of the Environment and Heritage. October 1998. Canberra.
Commonwealth of Australia: CoA. (2006) - National Cooperative Approach to Integrated Coastal Zone Management - Framework and Implementation Plan. Report to the Natu-ral Resource Management Ministerial Council prepared by the Department of Environ-ment and Heritage Community Information Unit. Australian Government, Canberra.
Libro.indb 227 17/05/2013 14.42.50

228
Danese and Robb Coastal erosion monitoring - A network of regional observatories
Commonwealth of Australia: CoA. (2009) - Climate Change Risks to Australia’s Coast: a First Pass National Assessment, National Climate Change. Adaptation Framework, Austral-ian Government, Canberra.
Department for Planning and Infrastructure: DPI. (2002) - Review of the Structural Arrange-ments for Coastal Planning and Management in Western Australia. Western Australian Planning Commission.
Eliot I, Nutt C, Gozzard B, Higgins M, Buckley E & Bowyer J. (2011) - Coastal Compartments of Western Australia: A Physical Framework for Marine & Coastal Planning. Report to the Departments of Environment & Conservation, Planning and Transport. Damara WA Pty Ltd, Geological Survey of Western Australia and Department of Environment & Conservation, Western Australia.
Government of Western Australia (2010) - Western Australian employment trends and pros-pects. Report prepared for the Department of Training and Workforce Development. Canberra.
Harvey N. and Caton B. (2010) - Coastal Management in Australia. Second edition. Pub-lisher: University of Adelaide Press with a new Foreword by Nick Harvey.
Harvey N. and Caton B. (2003) - Coastal Management in Australia. Oxford. 342 pp.Hennessy K., Fitzharris B., Bates B.C., Harvey N., Howden S.M., Hughes L., Salinger J. and
Warrick R. (2007) - Australia and New Zealand. Climate Change 2007: Impacts, Adapta-tion and Vulnerability. Contribution of Working Group II’, in Fourth Assessment Report of the Intergovernmental Panel on Climate Change, eds. M.L. Parry, O.F. Canziani, J.P. Pa-lutikof, P.J. van der Linden and C.E. Hanson, Cambridge University Press, Cambridge, UK.
House of Representatives: HoR. (2009) - Proof Committee Hansard Transcript. Edited by House of Representative Standing committee on Climate Change, W., Environment, and the Arts: Commonwealth of Australia. Canberra.
IPCC. (2007) - Summary for Policymakers. In Climate Change 2007: Impacts, Adaptation and Vulnerability. Contribution of Working Group II to the Fourth Assessment Report of the Intergovernmental Panel on Climate Change, Parry ML, Canziani OF, Palutikof JP, van der Linden PJ and Hanson CE, (eds.), edited by Cambridge University Press, C., UK.
Lambeck K. and Chappel J. (2001) - Sea Level Change Through the Last Glacial Cycle. Sci-ence 27 April 2001: Vol. 292 no. 5517 pp. 679-686.
Oceanica (2010) - Coastal Hazards of the Northern Agricultural Region Review of informa-tion sources and gap analysis. Report prepared for the Northern Agricultural Catch-ments Council (NACC).
Preston B. L. and Kay R. C. (2009) - Managing Climate Risk in Human Settlements; in Cli-mate Risk in Human Settlements. Submitted to Greenhouse 2009. CSIRO Marine and Atmospheric Research.
Sorensen J. (1997) - National and international efforts at integrated coastal management: definitions, achievements, and lessons. Coastal Management 25, pp. 3–41.
Western Australian Planning Commission (2002) - Coastal Planning Program - Status of Coastal Planning in Western Australia 2001/02.
Western Australian Planning Commission (2003) - State Coastal Planning Policy - State-ment of planning policy no. 2.6.
Western Australian Planning Commission (2006) - Coastal Protection Policy for Western Australia. A Department for Planning and Infrastructure Operational Policy.
Libro.indb 228 17/05/2013 14.42.50

229
ResMar Coastal erosion monitoring - A network of regional observatories
Lazio Region experience from Beachmed to Facecoast:“Working hypothesis for the feasibility
of a European Network of Coastal Observatories”
Silvia Bellacicco1, Alessandro Bratti1 and Paolo Lupino2
1Regione Lazio-Direzione Ambiente, Viale del Tintoretto 432, 00142 Rome, Italy2Assessorato alle infrastrutture, alle politiche abitative e all’ambiente
ARDIS Agenzia Regionale Difesa del SuoloE-mail: [email protected]
AbstractRegion Lazio, together with many other Mediterranean coastal administration bodies, has been sharing experiences in coastal defence and adaptation policies according to ICZM principles for 10 years. From BEACHMED (2002-2004) to the most recent initiatives, a series of best practices have been set up not only in the framework of technical solutions (mod-els, data processing, maps, etc.) but also in the context of governance issues, such as new administrative procedures, and agreements. Aware of the need for new and more powerful tools to face future challenges, including climate change effects, Mediterranean cohesion, blue growth and economic crisis, a series of initiatives are being developed in order to outline and launch “BEACHMED-3 Macro-Project” - a sort of multi-sectoral and multi-level Mediterranean mini-programme to be funded by an array of sources. One of these initiatives is FACECOAST (“Face the challenge of climate change in the med coastal zones” - www.facecoast.eu), a cluster formed by European projects that focus on coastal issues, including ResMar. This cluster has already promoted a project proposal called COASTGAP, gathering the experiences of 9 European projects, which was launched in the last MED programme call. EURIOMCODE (European Interregional Observatories for Mediterranean Coastal Defence) is a network of observatories that is part of this well-structured process; it is an initiative committed to concretely help administrations monitor their coasts. Shar-ing methodologies and even coastal services (remote sensing surveys, protocols, models, dataset, etc.) directly among the public bodies involved in coastal management, is the best way to improve their knowledge and thus develop their governance skills. This paper analyses objectives, aims and organisational aspects as well as the next steps for the crea-tion of a Network of Mediterranean Observatories.
From Beachmed to FACECOASTLazio Region, together with many other Mediterranean coastal regions, has been involved for 10 years in a series of European initiatives dealing with coastal risk management against climate change effects and other natural/anthropogenic threats.
Libro.indb 229 17/05/2013 14.42.50

230
Bellacicco et al. Coastal erosion monitoring - A network of regional observatories
From the EU-funded Beachmed pro-ject “Environmental Recovery and Maintenance of Eroding Littorals with the Use of Marine Sandy De-posits” (2002-2004), to Beachmed-e “Strategic management of beach protection for sustainable develop-ment of Mediterranean coastal zones” (2005-2008), to COASTANCE “Regional action strat-egies for coastal zone adaptation to climate change” (2009-2012), to MAREMED “MAritime REgions cooperation for the MEDiterranean” (2010-2013), this long list of European pro-jects represents one of the most organic and coherent actions in this field, undertaken by 12 Mediterranean coastal administrative bodies directly involved in coastal management. This unique feature of the partnership and the longstanding collaboration brought to a significant capitalisation and many effective actions on the coastal zone.The will to consolidate and improve this experience led to the cluster FACECOAST “Face
the challenge of climate change in the med coastal zones”, a grouping of 14 Eu-ropean projects, founded in November 2011, and currently including more than 100 partners (Fig. 1).It aims to gather and capitalise the con-tributions of European projects dealing with coastal defence against natural and anthropogenic risks (such as erosion, flooding, salt water intrusion, subsid-ence) in the framework of policies on the adaptation to climate change (sea level rise, increase of extreme phenomena, etc.) and sustainable development.The target is to promote and create a space to exchange experiences on Med-
iterranean coastal defence against erosion and flooding hazards and subsequent risks, taking into account the Integrated Coastal Zone Management approach as well as non-Mediterranean experiences.
The main cluster activities can be summarised as follows: - exchange different governance approaches to go beyond territorial fragmentation; - exchange different approaches to involve policymakers; - develop synergies between different sectors and different policies (eco-innovation, transports, tourism, agriculture, urban growing, etc.) for facing coastal adaptation to climate change according to ICZM principles;
- raise awareness on natural/human coastal risks for Mediterranean areas at European level;
- avoid/reduce overlaps and repetition among project activities; - design, on the grounds of past and current experiences, an organic and coherent set of
Figure 1 - FACECOAST cluster meeting, 20th June 2012, Lazio Region offices.
Libro.indb 230 17/05/2013 14.42.51

231
ResMar Coastal erosion monitoring - A network of regional observatories
initiatives (preparatory, planning, structural and monitoring) able to influence and cope with the issue concerned in the Mediterranean area at a large scale (Macro-project).
Therefore the main issue (coastal defence) is open to other interdisciplinary and multi-sectoral contributions (projects, clusters, etc.) as “link units” through which exchange with other interlaced issues.FACECOAST membership is open not only to the MED Programme projects but also to the other cooperation programmes (ENPI CBC, IPA-Adriatic, Cross Border MARITIME Italy-France, INTERREGIVB, etc.) or sectoral pro-grammes (FP7, LIFE+, etc.).The cluster formula already produced outputs like COASTGAP, a project proposal gathering the best practices of 9 European projects, which has been recently submitted in the context of the MED Programme call on Capitalisation (October 2012).This report on “Working hypothesis for the feasibility of a European Network of Coast Observatories” represents another initiative of the FACECOAST cluster, developed as a con-crete collaboration between the project MAREMED and ResMar.
Towards a European Network of Coastal ObservatoriesThis objective had already been outlined in Project Beachmed-e by a specific sub-project (OBSEMEDI) which designed the structure of a “European Interregional Observatory of the Mediterranean for Coastal Defence (EURIOMCODE)”. In that study, the widespread aware-ness of the need to monitor coastal hazards phenomena as a whole - given their Mediter-ranean scale and structural nature - was clearly proved by questionnaires and meetings and it was endorsed by a specific political act: the Bologna Charter.In Project COASTANCE, the hypothesis of a European Grouping for Territorial Cooperation (Regulation EC No 1082/2006) as a possible structure for the network was analysed, and EURIOMCODE was mentioned in its Final Declaration, signed by 9 Mediterranean coastal administration bodies. This declaration stated the will “to build a network of the exist-ing coastal Observatories (EURIOMCODE proposal) aimed to identify common standards in coastal survey activities (INSPIRE), analyze coastal morphological dynamics in the Mediter-ranean and share monitoring services even by creating a European grouping of territorial co-operation (EGTC)”. Moreover, the European Commission and the Committee of the Regions decided to propose a reform of the currently long process for the creation of the EGTCs and simplify it, making the rules more flexible and promoting EGTC as the preferred instru-ment for territorial cooperation in European policies. The upcoming revision of the Regula-tion might improve the legal aspects of EGTC, thus giving local and regional authorities a good reason to exploit this instrument. One of the main objectives of MAREMED Project (within its “Adaptation to Climate Change in coastal areas” theme) is to set up a network of observatories at Mediterranean level “to monitor coastline changes and extreme climate events, to be shared by the different levels of governance”.Also ResMar project is working on a specific task concerning a “Cross-Border Centre for the
Libro.indb 231 17/05/2013 14.42.51

232
Bellacicco et al. Coastal erosion monitoring - A network of regional observatories
study of littoral dynamics” to be carried out by a “network of stakeholders to allow them to confront each other, develop shared methodologies about data gathering and analysis on current coastal dynamics … in the perspective of ICZM”.It clearly appears that a “critical mass” of EU projects, going towards a network of Mediter-ranean observatories, has been created and that it is now time to try to join together the current individual initiatives in order to step forward.Nevertheless a structured and functional network of observatories must be considered a medium-term objective, in view of the difficulties (administrative, technical, economic, etc.) associated with its real accomplishment. Only a multi-level action can cope with it.Starting from the simplest type of administrative agreement (Memorandum of Under-standing, Protocol, etc.), the network can grow and take also into account more advanced administrative solutions like EGTC (European Grouping for Territorial Cooperation), if the conditions are suitable.The technical opportunities and reasons for establishing a network are getting more and more evident thanks to the increasing performances of the remote sensing monitoring systems (satellite, Lidar, etc.) which could surely be managed in an easier and cheaper way by an associated group of users. However tangible and documented proposals in this regard are yet to be set up. Finally, it is necessary to create the economic conditions for network subsistence, starting from a low-cost solution (using only existing funds already allocated by the partners), then using episodic funding (funds from European projects), and finally using more structured solutions (funds from EU DGs, POR-ERDF, international bodies like MAP, UfM, etc.).Given such an articulated path, the network idea should be included into strategic pro-grammes like POR-ERDF or even in specific Macro-Projects in order to be managed in a more profitable and coordinated manner.Thanks to the joint efforts of FACECOAST cluster, the Macro-Project BEACHMED-3 has been presented in the last Capitalisation call of the MED Programme (October 2012) within the project proposal “COASTGAP”. The network was described as follows:
WP4- Ph4.1/A - Design of the Macro-Project “BEACHMED-3”. The first action will concern a preliminary sketch of the Macro-Project “BEACHMED-3” where some specific topics will be analyzed in order to individuate the best fitting sub-projects able to get concrete steps ahead towards EU, MED countries and regions. The topics are strictly related to many of the COAST-GAP BPs undergoing capitalization, which hints and spurs will be gathered from. The main concerned topics of the action will be developed to respond to the following aims:……
d) Launch a network of public organization (preferably coastal administrations) for Med-iterranean coastal survey and transferable priority pilot work for the adaptation to CC and the sustainable protection of Mediterranean coastal stretches;
This multiple action must be constantly fed by contributions of any kind in order to sup-port, enrich and integrate this pathway.The collaboration between MAREMED and ResMar projects, on the grounds of previous remarkable works, can thus be a very important opportunity to step ahead in the process of creating a network.
Libro.indb 232 17/05/2013 14.42.51
233
ResMar Coastal erosion monitoring - A network of regional observatories
For this network to exist, one main point must be borne in mind: no one will join the network (or will actively participate of it) until the usefulness of the network is concretely proved.So the strategy for improving this initiative is to let potential members understand what the network could offer in the future (like coordinated coastal monitoring campaigns). But, before conditions are suitable for carrying out such engaging activities, the core of the network must be based on the tools and advantages that are available at present, such as useful coastal management applications, information published on Web-GIS, etc.Therefore the rationale of the network is first based on “what the network can do for its members” and then “what the members are expected to do for the network”.
Beachmed-e/OBSEMEDI resultsThe feasibility study carried out in sub-project OBSE-MEDI (Beachmed-e project, 2005-2008) showed it is preferable not to focus on a single centralised observa-tory but rather on a “Network of Observatories” com-posed of existing or potential organisations (Fig. 2).The organisational units, which are already experi-enced in coastal morphological monitoring, play a key role, in particular if they are already integrated in the related administrative structures in charge of coastal protection or in structures with competences in this field.Indeed, the strategy is to prefer the administrative structures directly in charge of coastal defence, so that the link between the “Network of Observatories” and the planning activity can be effective and ensured (due to clear structural reasons).Therefore the working method used for the development of sub-project OBSEMEDI in-cluded the necessary contribution from experts and the scientific community, and focused on what already existed or could potentially be developed in public administration bodies in charge of spatial planning and coastal protection management. In addition, OBSEMEDI included the following activities:
- CURRENT STATUS: census and analysis of the bodies that carry out coastal monitor-ing activities, in particular regarding morphological aspects and dynamics, and cli-mate phenomena
- NEEDS: investigation on the information needed by the bodies in charge of coastal protection and its supply
- METHODOLOGY: proposals for the network of observatories in terms of organisation and operation (aggregation structure, possible activities to perform, costs, etc.).
- RESOURCES: estimation (in terms of costs and organisation) of the costs currently paid for coastal monitoring and the potential costs to be paid by public and private stakeholders interested in supporting monitoring activities
As detailed below, the “Network of Observatories” can effectively be made of a network of independent monitoring units, directly linked to each competent Administrative Authority, and other Mediterranean extra-territorial units in charge of more specific activities.The necessary relation between the “Network of Observatories” and the scientific com-munity or other entities in charge of this matter will be developed through links to other networks, in order to promote a suitable flow of information and possibly share products and services. For this reason, and particularly to establish wider links, it is important to
Libro.indb 233 17/05/2013 14.42.52

234
Bellacicco et al. Coastal erosion monitoring - A network of regional observatories
collaborate with other European projects, especially those developed mainly in scientific contexts, like VIIFP, aided by FACECOAST cluster.The outputs of OBSEMEDI are available on the website www.beachmed.eu, and a Web-GIS draft version of the censed observatories is already online at www.facecoast.eu.The updating of the dataset on the Observatories is currently being carried out by the MAREMED project and results are expected to come out by mid 2013.
In the following chapters the list of monitoring services individuated by OBSEMEDI is com-mented, while the upgrade of each service record elaborated during OBSEMEDI is ex-pected as an accomplishment by MAREMED in collaboration with other European projects.
Coastal monitoring servicesFor the establishment of a “Network of Observatories”, the monitoring needs or services required to this aim must be outlined. According to provisions like the Flood Directive 2007/60/EC, ICZM Protocol and Maritime Spatial Planning, when the main objective is spatial planning, records about coastal mor-phological alterations, anthropogenic factors, climate changes, flood risk, overlapped uses, etc. are to be gathered in the medium-long term (20-500 years) whereas the results to be achieved must be obtained at a territorial scale (regional, national and international).This task belongs to the coastal administration bodies which, by the essential help of sci-entists and technicians, have to deploy programmes, plans and policies on coastal zones in practical terms. Should their full involvement as protagonist in this process lack, monitor-ing activities are going to remain a theoretical exercise without practical utility. Consequently one of the main points of the Network is its linkage to coastal administration bodies at different levels.
Figure 2 - List of coastal Observatories identified by OBSEMEDI sub-project.
Libro.indb 234 17/05/2013 14.42.52

235
ResMar Coastal erosion monitoring - A network of regional observatories
Other reasons that can be associated to the need of a main objective are linked to the definition of quality standards for local monitoring activities, in order to allow control and analysis of coastal erosion phenomena to be easier and more reliable. Many administration bodies share the same need, but it is undeniable that different lev-els of requirements exist according to the specific geographical and geo-morphological features of beaches and associated interests (tourism, environment, infrastructure, etc.).On a preliminary basis, the expected needs can be summarised as follows:
- Classification of coastal stretches at local 1:50.000/1:10.000 scale according to the Sea Region Data Specification of INSPIRE and according to the Corine-Eurosion clas-sification (which now includes only attributes up to 1:100.000 scale).
- Characterisation of coastal areas in relation to shoreline changes in the medium-long term (morphological dynamics, hazard assessment, etc.), morphological, sedi-mentological and environmental characteristics (typical slope, dune systems, Posi-donia seabed, vegetation line, size of sediments, etc.), social and economic factors (exposed assets) in order to introduce elements of an ecosystemic approach.
- Quantitative assessment of erosion/flood phenomena (in terms of areas affected by erosion/flood, risk assessments, volume for beach nourishment, etc.)
- Research and definition of methodologies, protocols and certifications for a correct monitoring and its efficient application.
The needs are also different in terms of time priority because some administration bod-ies are already prepared to perform systematic and integrated monitoring and can thus focus immediately on more advanced thematic details, while other administration bodies in general still need to define the phenomenon.In MAREMED a pilot project, leaded by Liguria Region, is currently making progress on DATA MANAGEMENT. A first attempt to set up a homogeneous or at least compatible dataset at a local scale (1:50.000/1:10.000), consistent with the Sea Regions Data Specifica-tions of INSPIRE, shall be proposed.As for future objectives, the Network of Observatories will be interested in joining experi-ences currently in progress, like the PEGASO ICZM PLATFORM, in order to “facilitate the application of the ecosystem approach to the Mediterranean and Black Sea coasts - linking the knowledge and information of the different elements that are required for the equitable and sustainable management of both coastal land and waters”. Moreover this kind of activities have now found a new opportunity linked to the Ma-rine Strategy Framework Directive (2008/56/CE) which is involving all European countries in gathering coastal-marine data, defining homogenous monitoring methodologies and finding ecosystemic indicators such as the assessment of the cost of marine environment degradation.In Italy a first assessment of the cost of degradation elaborated by ISPRA and based on the costs afforded to prevent and contrast degradation (concerning pollution, fishery stocks, marine litter, etc.), shows that in relation to the global annual amount of 1.5 billion € (2009), the cost of coastal defence represents the most expensive item (30%). It is therefore undoubtedly worthy to develop a Network of Observatories based on coast-al defence and ICZM that should carry out mainly two types of activities, as the following:
- Operational services: services mainly based on data gathering (by remote sensing activities, specific devices and even the simple gathering of paper documents) and the
Libro.indb 235 17/05/2013 14.42.52

236
Bellacicco et al. Coastal erosion monitoring - A network of regional observatories
related processing required for their presentation (post-processing, data base inser-tion, etc.)
- Consultative services: services mainly based on the elaboration and development of methodologies and standards useful for a homogeneous and worldwide comparable monitoring dataset about marine-coastal zones, and indicators for Decision Support Systems, planning activities, governance tools for ICZM and MPS.
The Operational ServicesSome of the operational services, from the simplest to the more complex ones, that a “Network of Observatories” should be able to provide in order to meet the needs de-scribed in this preliminary phase, can be listed as follows:
- Collection of information by local stakeholders (administration bodies, public and private stakeholders, etc.). The information on local phenomena contributes to sup-port the analysis on the territory while detailing them (reports, papers, published ad-ministrative documents, etc.).
- Collection of photographs both from the ground (manual or automatic photos taken by web-cams) and aerial photos or satellite images, for the historical memory of the coasts involved;
- Census of the public works and interventions on the coast; - Identification of the Exposed Values (EVs) on the coastal zone, as environmental assets, productive areas, tourist establishments, populated areas with infrastructures, etc. The identification of the EVs is required to calculate the risk according to an eco-systemic approach.
- Ground survey of the shoreline by manual systems (GPS) or by automatic local sys-tems (e.g. rectification of images from the web-cam). The survey of the shoreline ena-bles to perform quick monitoring and assessment at a local level for rapidly changing areas and, more generally, it enables to perform assessments at territorial level.
- Sedimentological and mineralogical characterisation by periodic sampling on the sub-aerial beach and nearshore. This characterisation is paramount for reading mod-els and defining project intervention parameters (compatibility range).
- Definition of the network of coastal benchmarks through the check of existing benchmarks and building those required to perform accurate surveys. The reference network is a fundamental element to guarantee the due accuracy of surveys and their effective comparability.
- Bathymetric and topographical surveys of coastal morphology using precision sys-tems (multibeam, singlebeam, GPS RTK, etc.). This is vital for the project activities and for verifying assessments at a territorial level. This kind of survey should be extended to the whole coastal zone but, being onerous, it should concern at least the coasts under erosion, and under accretion (situated upstream of coastal works, deltas of channels and natural rivers, etc.).
- Bathymetrical and sonar surveys of the seabed of the continental shelf for the monitoring of sand deposits and their surrondings (exploitation check, environmental survey, etc.)
- Acquisition of new coastal aerial photos and satellite imagery for territorial moni-toring. This type of survey represents the most diffused system for verifying, at ter-
Libro.indb 236 17/05/2013 14.42.52

237
ResMar Coastal erosion monitoring - A network of regional observatories
ritorial scale, the evolution of the shoreline and coastal elements coastal (soil use, settlements, upper limit of Posidonia, etc.)
- Systematic comparison of shorelines using manual and mathematical systems to assess or update the estimations on littoral changes in terms of area or volume. This service represents the most diffused system for a territorial assessment of shoreline dynamics.
- Collection and elaboration of climate data using wave meter buoys or hind casting systems. Not only are climate statistics vital for modelling applications, but they also allow comprehensive and more accurate assessments on erosion phenomena to be made by relating them to specific climate periods.
- Use of models for the assessment of future scenarios at territorial scale. The use of duly simplified calculation matrixes according to the assessment scale, makes it pos-sible to plan interventions taking into account their dynamics (different sequences of interventions, different climate scenarios, etc.).
- Acquisition of interferometric data for assessing the subsidence phenomenon along the coasts. This service provides a more detailed assessment of the phenom-enon in terms of time and space on the territory, compared to the levelling campaigns - which are important for checking accuracy. It provides an effective contribution to individuate the areas more exposed to salt water intrusion risks and to plan interven-tions at a regional scale.
Certainly, many of the operational technical services mentioned above will not be provided directly by the Observatories of the Network. All Observatories are usually supported by spe-cialised structures (Universities, survey companies, technical consultants, etc.) but they carry out the fundamental role of coordination providing them with the necessary specifications to obtain appropriate and useful results and gathering data for their historical databases.The Network can improve the standards by reciprocal comparison and reach a better mon-itoring performance by joint collaboration.
The Consultative Services The second type of services (consultative technical services) consists in providing meth-odologies and information related to the coastal monitoring system in general. Some of them can be listed as below:
- Definition of evaluation criteria, compliant with international regulations, to represent and analyse coastal erosion/flooding phenomena;
- Individuation of the most significant geo-indicators, at watershed scale, for coastal monitoring, and definition of protocols;
- Individuation of the most significant indicators for monitoring social and economic aspects of the coastal zone and definition of a specific protocol;
- Data certification procedures (aerial photographs, satellite images, campaign sur-veys) to feed the databases of the administrations bodies involved;
- Elaboration and testing of methodologies to define vulnerability, hazard, risk and the main coastal adaptation options in line with resources, needs and expectations of the different coastal areas;
- Optimisation of the resources made available by different participants (acquisition of data, images, services, etc.) in exchanging activities.
Libro.indb 237 17/05/2013 14.42.52

238
Bellacicco et al. Coastal erosion monitoring - A network of regional observatories
Next steps for the NetworkThe next steps for a better characterisation of the network and its practical take-off, can be resumed as follows:
- Updating the census of observatories managed by coastal administration bodies (directly/indirectly), their characterisation (services offered, typology of data gathered, degree of interoperability);
- Updating and deepening coastal monitoring services characterisation in order to write a “coastal monitoring book” where observatories can compare, share and adapt their activities;
- Launching European initiatives to finance/promote the start-up of the Network. In the following chapters the current activities related to the next Network steps are briefly illustrated.
Census of the observatoriesThe census of observatories is currently in progress with MAREMED project (Book n.3), with the help of FACECOAST cluster. A new layout has been adopted for the form of the database (Fig. 3), so that consultation of observatory information can be more clear and immediate. The form is divided into five different sections, reporting:
- General information on the observatory; - List of coastal survey activities performed and information on them;
Figure 3 - New layout of observatory database form - example for Lazio Region.
Libro.indb 238 17/05/2013 14.42.53

239
ResMar Coastal erosion monitoring - A network of regional observatories
- Information on the availability of coastal data; - List of EU projects carried out; - List of publications, articles, etc.
The database has been implemented through the FACECOAST Web-GIS (Fig. 4).
The Final Report on the “Option for coastal information systems”, commissioned by DG En-vironment to Thetis S.p.a. (2011), is another important source of information for a census and update of Coastal Information Systems.
Coastal monitoring servicesThe updating and further analysis of coastal monitoring services – which had already been carried out in its first version by Beachmed-e/OBSEMEDI (“COASTAL SERVICES - Operative and consultative services for the Coastal Monitoring”) - is currently being developed in two European projects: ResMar and MAREMED. The challenge is to compare definition and assessment of the main monitoring services and merge them in a report shared by MAREMED and ResMar.Each service will be widely illustrated according to the following template:
Topobathymetric surveying of littoral morphologythe survey should aim at the morphological description of the coast in order to identify its morphodynamic characteristics and allow the analysis of variations in the area of the sub-aerial beach and in the volume of both sub-aerial beach and the nearshore - up to the depth of closure.
Optimal* area of referenceThe scale of acquisition depends on the extent of the survey area, its morphologic char-
Figure 4 - Observatory database on FACECOAST Web-GIS.
Libro.indb 239 17/05/2013 14.42.54

240
Bellacicco et al. Coastal erosion monitoring - A network of regional observatories
acteristics and the method used. For the analysis of evolution trends in the medium and long term, the reference area is the physiographic unit. If monitoring is carried in order to evaluate the impact of coastal structures such as ports, the study zone should consider a length of beach that is one order of magnitude larger than that of the structure. Carto-graphic representation may vary in scale from 1:1000 to 1:5.000. Survey profiles may be 10 m equidistant, near the structures up to 250 m in longer morphologically homogene-ous areas. In order to calculate the sediment budget of a beach, the area of observation should go from the dune toe to the depth of closure related to events that have a similar return period to the time interval that is being considered. This interval can be synthesised in the following: 3-5 years in order to evaluate the effects of a coastal defence structure; 5-10 years for medium-term monitoring in order to plan for defence strategies; 30 years to evaluate secular trends for the scope of coastal planning.
Optimal* acquisition frequency(ies)the optimal frequency depends on the scope of monitoring. For general monitoring at lo-cal level the position of the shoreline should be surveyed at least once a year, always under the same oceanographic conditions. Regarding the evaluation of the effects of a specific defence structure, it is important to perform an initial survey before the construction fol-lowed by at least monthly surveys after the construction. For monitoring at the scale of physiographic units, it is advisable to perform the survey every 3-5 years.
COST(S) PER MEASURE UNITSub-aerial beach
(Required planimetric and altimetric accuracy: from 1 (*) to 10 (**) cm)
Considered survey density
Survey times
(km/days)
Indicative costs (***)
Remarks
Total Station (*) 50 m section 3 € 1100/kmGeodetic GPS (*) 50 m section 5 € 1100/km
Laser Scanner (*) DTM 1x1 dm 1 € 1100/kmOnly for limited
zones or structures Airborne LIDAR (**) DTM 1x1 m 50 € 1100/km Only for wide areas
Aerial photogrammetry (**) 1 m section 30 € 1100/km Needs “markers” Nearshore
(Required planimetric and altimetric accuracy:
from 10 (*) to 30 (**) cm)
Considered survey density
Survey times
(km/days)
Indicative costs (***)
Remarks
Single-beam (*) 100 m section 5 1100
Multibeam (*) DTM 1x1 m 3 3300Difficult to survey
between 0 m and – 2 m
ALB/LIDAR (**) DTM 2x2 m 40 4400
Surveys also sub-aerial beach
but is affected by water turbidity
Side-Scan Sonar (SSS) 3 1100 Morphological survey
Sub-bottom profiler (SBP) 100 m section 4 1100Stratigraphic
survey
Libro.indb 240 17/05/2013 14.42.54

241
ResMar Coastal erosion monitoring - A network of regional observatories
OTHER INDICATIONSType of Operat-ing/Consultative Technical Service
Optimal* Area of reference (Max scale: regional)
Optimal* Acquisition
Frequency(ies)
Cost(s) per Measure Unit/frequency
Other Indications
Operative Service 6:
Topobathymetric coastal survey
Coastal length at least one order of magnitude higher than that of the
structure (to mon-itor the effects of a specific coastal
defence structure) or Physiographic
unit (to evalu-ate the evolution trends at medium and long terms)
For general moni-toring at least once a year, always under the same oceano-graphic conditions.
To evaluate the effects of coastal
defence structures, survey before the construction and
afterwards at least monthly. To monitor at the physiograph-
ic unit level, it is advisable to survey
every 3-5 years.
SUB-AERIAL BEACH
Surveys must be
performed in the same season of the year.
Total Station €1100/kmGeodetic GPS €1100/kmLaser Scanner €1100/km
Airborne €1100/kmLIDAR €1100/kmAerial
photogrammetry€1100/km
SUBMERGED BEACH
Single-beam €3300/km Multibeam €4400/km ALB/LIDAR €1100/km
SSS SBP €1100/km
The services will be compared and discussed by the FACECOAST partners concerned.
European initiativesThe implementation of the Network is one of the specific tasks of the COASTGAP proposal and many of the partners involved will be called to join it by signing a simple MoU (Fig. 5).The future development of the Network can be outlined in the Macro-Project BEACHMED-3 (general task of COASTGAP) and the hypothesis of a more structured shape will be explored. For instance in the European project COASTANCE, a specific report about a European Grouping for Territorial Cooperation (EGTC) for a Network of Observatories (EURIOMCODE - European Interregional Observatories for Mediterranean Coastal Defence) was discussed. The feasibility of this kind of organisation and its suitability for such a purpose were thor-oughly analysed.
Figure 5 - Partners of CAOSTGAP project proposal.
Libro.indb 241 17/05/2013 14.42.54

242
Bellacicco et al. Coastal erosion monitoring - A network of regional observatories
In order to foster the topics concerning the Network and lay the ground for a wide and suitable sharing of data and methods, projects like COASTANCE and MAREMED, as well as the FACECOAST cluster, proposed to set up an INSPIRE Spatial Data Interest Community (SDIC) called “FACECOAST INSPIRE - Littoral Administrations grouping to face the challenge of climate change and natural/anthropogenic risks in the Med coastal zones”. According to INSPIRE, “SDICs bundle the human expertise of users, producers and trans-formers of spatial information, technical competence, financial resources and policies, with an interest to better use these resources for spatial data management and the development and operation of spatial information services”.The SDIC participants are expected to “drive the demand for spatial data and spatial infor-mation services” and “environmental monitoring, reporting and development of applications and services for environmental management are among the main driving forces behind the natural formation of SDICs”. The main tasks of the members of a thematic SDIC are:
- To propose experts to participate in Drafting Teams working on the preparation of detailed implementing rules of INSPIRE;
- To propose reference material for the development of INSPIRE implementing rules; - To propose pilot projects to feed or test INSPIRE implementing rules; - To provide comments on draft Implementing Rules.
This initiative aims at making the activities carried out during the projects dealing with coastal data specifications official and profitable, so that they can feed the INSPIRE infra-structure. Indeed about 500 SDICs have been created so far, and some of them can be mentioned due to their relevance on coastal monitoring:
SubCoast: A collaborative project aimed at developing a GMES-service for moni-toring and forecasting subsidence hazards in coastal lowland areas around Europe
SubCoast
MarCoast ESA GSE Stage 2 Project MarCoastEUCC-INSPIRE pan-European Coastal Information Interest Group EUCC-CIIG
Geo-Information Community in Coastal LANdscape GI-CLAN
SubCoast is mainly focused on coastal subsidence, MarCoast concerns marine environ-mental and oceanographic aspects at very large scale (oil spills, algal blooms, climate, water quality, etc.), GI-CLAN is a consortium of universities and companies interested in the Mediterranean coastal landscape (urbanism, natural assets, waterfront, etc.) and EUCC-CIIG is a very large purpose SDIC, at European scale, with many objectives concerning ICZM and interested in fostering collaborations with local and regional authorities.FACECOAST INSPIRE therefore complements them, considering the leading role of the coastal administration bodies at regional/departmental scale, its peculiar mandatory body (cluster of European projects), the topics concerned and the Mediterranean relevance.The report on “Coastal Services”, as mentioned above, could profitably be one of the docu-ments to be submitted in the next proposal for a SDIC.
ReferencesISPRA Paper Report for Marine Strategy - 8 2 Mediterraneo_Costi del degrado
Libro.indb 242 17/05/2013 14.42.54

243
ResMar Coastal erosion monitoring - A network of regional observatories
Regulation (EC) No 1082/2006 of the European Parliament and of the Council of 5 July 2006 on a European grouping of territorial cooperation (EGTC)
Trifiletti M.L. (2012) - Pre-feasibility Study of a European Grouping for Territorial Cooperation (EGTC). European Academy for education and social research for COASTANCE Project. pp. 32.
Thetis S.p.a (2011) - Options for coastal information systems. European Commission-DG Environment. pp. 477.
Network Projects’ websites:www.beachmed.euwww.coastance.euwww.maremed.euwww.facecoast.euwww.pegasoproject.euwww.res-mar.eu www.cmgizc.info
Libro.indb 243 17/05/2013 14.42.54

Printed in Florence by Nuova Grafica FiorentinaMay 2013
Libro.indb 244 17/05/2013 14.42.54

La Cooperazione al cuore del Mediterraneo
La Coopération au coeur de la Méditerranée
www.res-mar.eu
Libro.indb 2 10/05/2013 11.30.28
Coastal erosion monitoring A network of regional observatories
Results from ResMar Project
Edited by Luigi E. Cipriani
Libro.indb 3 10/05/2013 11.30.29
Coastal erosion monitoring A network of regional observatories
Results from ResMar Project
Edited by Luigi E. Cipriani
ResM
ar P
roje
ctCo
asta
l ero
sion
mon
itor
ing
- A
net
wor
k of
reg
iona
l obs
erva
tori
es
Libro.indb 3 10/05/2013 11.30.29