
Monitoring water quality in the coastal area of Tripoli (Lebanon) using high-resolution satellite...
8
ISPRS Journal of Photogrammetry & Remote Sensing 63 (2008) 488–495 www.elsevier.com/locate/isprsjprs Monitoring water quality in the coastal area of Tripoli (Lebanon) using high-resolution satellite data Nijad Kabbara a,1 , Jean Benkhelil b , Mohamed Awad c , Vittorio Barale d,* a National Council for Scientific Research, Marine Research Centre, P.O. Box 189, Jounieh, Lebanon b Universit´ e de Perpignan, 52 avenue de Villeneuve, 66860 PERPIGNAN Cedex, France c National Council for Scientific Research, Remote Sensing Centre, P.O. Box 11-8281, Beirut, Lebanon d European Commission, Joint Research Centre, Institute for Environment and Sustainability, TP272, 21027 Ispra, Italy Received 24 May 2007; received in revised form 26 November 2007; accepted 21 January 2008 Available online 6 May 2008 Abstract Water quality in the coastal area of Tripoli (Lebanon) was assessed using Landsat 7 ETM+ data, to provide a first baseline for coastal resources management. The data were geometrically rectified to a standard geographical grid and brightness values were converted to reflectance through radiometric correction. Sea-truth data, collected in the field within 6 hours before/after the time of the satellite overpass, were used to derive empirical algorithms for chlorophyll-a concentration, Secchi disk depth and turbidity. Then, maps of the distribution of the selected water quality parameters were generated for the entire area of interest, and compared with analogous results obtained from SeaWiFS data. The maps indicate that the Tripoli coastal area is exposed to moderate eutrophic conditions, along most of its shoreline (in particular along the northern stretch), in correspondence with fluvial and wastewater runoff sources. The Landsat 7 ETM+ data proved useful for the intended application, and will be used to start a national database on water quality in the Lebanese coastal environment. c 2008 International Society for Photogrammetry and Remote Sensing, Inc. (ISPRS). Published by Elsevier B.V. All rights reserved. Keywords: Coast; Monitoring; Colour; High resolution; Multisensor 1. Introduction Ocean colour radiometry has been successfully ap- plied to the retrieval of phytoplankton biomass indices, such as chlorophyll-a concentration, and other water quality parameters, in various geographical locations and environmental settings. In general, this is done by * Corresponding author. Tel.: +39 0332 789274; fax: +39 0332 789034. E-mail addresses: [email protected] (N. Kabbara), [email protected] (J. Benkhelil), [email protected] (M. Awad), [email protected] (V. Barale). 1 Tel.: +961 9 918 570; fax: +961 9 934 763. virtue of empirical bio-optical algorithms — based, for example, on the inverse dependence of pigments con- centration on the ratio between water-leaving radiance, or reflectance, measured in the blue and green parts on the light spectrum — for deriving a chlorophyll-a esti- mate (see e.g. Robinson, 2004). Measurements in the red and near-infrared may also be involved, in appli- cations where the water quality parameter of interest is water transparency and/or turbidity (see e.g. Jensen, 2000). A number of dedicated orbital sensors — such as the historical Coastal Zone Color Scanner (CZCS, 1978–1986) or the currently operational Sea-viewing 0924-2716/$ - see front matter c 2008 International Society for Photogrammetry and Remote Sensing, Inc. (ISPRS). Published by Elsevier B.V. All rights reserved. doi:10.1016/j.isprsjprs.2008.01.004
Transcript of Monitoring water quality in the coastal area of Tripoli (Lebanon) using high-resolution satellite...

ISPRS Journal of Photogrammetry & Remote Sensing 63 (2008) 488–495www.elsevier.com/locate/isprsjprs
Monitoring water quality in the coastal area of Tripoli (Lebanon)using high-resolution satellite data
Nijad Kabbaraa,1, Jean Benkhelilb, Mohamed Awadc, Vittorio Baraled,∗
a National Council for Scientific Research, Marine Research Centre, P.O. Box 189, Jounieh, Lebanonb Universite de Perpignan, 52 avenue de Villeneuve, 66860 PERPIGNAN Cedex, France
c National Council for Scientific Research, Remote Sensing Centre, P.O. Box 11-8281, Beirut, Lebanond European Commission, Joint Research Centre, Institute for Environment and Sustainability, TP272, 21027 Ispra, Italy
Received 24 May 2007; received in revised form 26 November 2007; accepted 21 January 2008Available online 6 May 2008
Abstract
Water quality in the coastal area of Tripoli (Lebanon) was assessed using Landsat 7 ETM+ data, to provide a first baselinefor coastal resources management. The data were geometrically rectified to a standard geographical grid and brightness valueswere converted to reflectance through radiometric correction. Sea-truth data, collected in the field within 6 hours before/after thetime of the satellite overpass, were used to derive empirical algorithms for chlorophyll-a concentration, Secchi disk depth andturbidity. Then, maps of the distribution of the selected water quality parameters were generated for the entire area of interest,and compared with analogous results obtained from SeaWiFS data. The maps indicate that the Tripoli coastal area is exposed tomoderate eutrophic conditions, along most of its shoreline (in particular along the northern stretch), in correspondence with fluvialand wastewater runoff sources. The Landsat 7 ETM+ data proved useful for the intended application, and will be used to start anational database on water quality in the Lebanese coastal environment.c© 2008 International Society for Photogrammetry and Remote Sensing, Inc. (ISPRS). Published by Elsevier B.V. All rights reserved.
Keywords: Coast; Monitoring; Colour; High resolution; Multisensor
ra
1. Introduction
Ocean colour radiometry has been successfully ap-plied to the retrieval of phytoplankton biomass indices,such as chlorophyll-a concentration, and other waterquality parameters, in various geographical locationsand environmental settings. In general, this is done by
∗ Corresponding author. Tel.: +39 0332 789274; fax: +39 0332789034.
E-mail addresses: [email protected] (N. Kabbara),[email protected] (J. Benkhelil), [email protected] (M. Awad),[email protected] (V. Barale).
1 Tel.: +961 9 918 570; fax: +961 9 934 763.
0924-2716/$ - see front matter c© 2008 International Society for PhotogAll rights reserved.doi:10.1016/j.isprsjprs.2008.01.004
virtue of empirical bio-optical algorithms — based, forexample, on the inverse dependence of pigments con-centration on the ratio between water-leaving radiance,or reflectance, measured in the blue and green parts onthe light spectrum — for deriving a chlorophyll-a esti-mate (see e.g. Robinson, 2004). Measurements in thered and near-infrared may also be involved, in appli-cations where the water quality parameter of interestis water transparency and/or turbidity (see e.g. Jensen,2000).
A number of dedicated orbital sensors — suchas the historical Coastal Zone Color Scanner (CZCS,1978–1986) or the currently operational Sea-viewing
mmetry and Remote Sensing, Inc. (ISPRS). Published by Elsevier B.V.
N. Kabbara et al. / ISPRS Journal of Photogrammetry & Remote Sensing 63 (2008) 488–495 489
Wide Field-of-view Sensor (SeaWiFS, since 1997),Moderate Resolution Imaging Spectroradiometer(MODIS), Terra and Aqua versions (since 1999 and2002, respectively), and MEdium Resolution ImagingSpectrometer (MERIS, since 2002), to name just someof those most widely used — have been designedfor monitoring the optical properties of marine waters.However, their spectral coverage and resolution (rang-ing primarily from 400 to 800 nm, with bandwidths ofthe order of 20 nm), as well as their spatial coverage andresolution (respectively of the order of 1000 to 2000 kmswaths, and of 200 to 1200 m pixel size, or even morefor derived data products), are mostly useful to coverbroad expanses of open waters, where colour varia-tions chiefly depend on the presence and abundance ofplanktonic pigments (in particular for the oligotrophicMediterranean Sea, of interest in here; see, for example,D’Ortenzio et al. (2002)). Conversely, coastal and estu-arine systems are often characterized by optically com-plex waters, with high concentrations of highly reflec-tive water constituents, the colour of which is due also todissolved organic matter and suspended sediments, andby much smaller geographical scales. Sensors originallydesigned for land observations, like Landsat’s ThematicMapper (TM) and Enhanced Thematic Mapper Plus(ETM+), have proven to be more useful for assessingthese systems, in spite of their radiometric limitations(bandwidths of 60 to 80 nm, in the visible, lower sensi-tivity in comparison to the instruments cited above), pri-marily because of their higher spatial resolution (30 m,or half that in panchromatic mode; see Baban (1997),Zhang et al. (2003) and Chang et al. (2004), for appli-cation examples).
The use of high-resolution optical remote sensingdata is of particular value in those cases where no orlittle historical information exists for a certain coastalregion. In the present study, an attempt has been madeto describe the general conditions of coastal waters inthe area of Tripoli (Lebanon), using synoptic satellitedata. Since no other data of similar nature are available,at the present time, the aim is to provide a first baselinefor coastal environmental assessment and managementof this region. To this end, the mapping of waterquality parameters in the study area was undertakenusing Landsat 7 ETM+ data, calibrated by concurrentfield data collected at sea. Also, a comparison ofthe results obtained with analogous SeaWiFS-deriveddata, with lower spatial resolution, highlighted themain advantages of the high-resolution approach takenhere, and placed the current findings into a regionalperspective.
The main reasons for the changes in the coastaland marine ecosystem observed in the study areaare (a) discharges of municipal sewage and non-pointloading from agriculture, which causes eutrophication,turbidity and oxygen deficiencies; (b) input of materialsfrom the river indicated in the following as NahrAbou-Ali, consisting mainly of dissolved nutrients andsuspended solids; (c) contamination from the majoropen dump for solid waste and wastewater dischargeof Tripoli, which is located in the same area. Themain indicators of water quality chosen for this area,in line with the what reported in the literature citedabove, are essentially chlorophyll-a, water transparencyand turbidity. The first is an assimilation pigment ofplanktonic algae: its concentration in coastal waterscan be considered, to a certain degree, a reliableindicator of phytoplankton biomass and production, aswell as, more in general, of the level of eutrophication.Localized areas of high production are in some casesrelated to pollution from anthropogenic activities. Watertransparency, often described in a simple – but effective– manner by Secchi Disk depth, or turbidity can alsobe used as an indicator of water quality, but is affectedby many factors, such as the presence of phytoplanktonand zooplankton, solid substances from coastal areas orrivers, and resuspended sediments.
In the following, the results of an in situ campaignconducted in the study area will be described, andcompared with concurrent remotely sensed data, ofthe same area and of the eastern Mediterranean Seaat large. All of the parameters introduced abovewere measured at sea and then computed also fromthe satellite measurements, by virtue of statisticalregression models. The inter-comparison of these datasets was used to derive a set of thematic maps for thecoastal waters of Tripoli, showing the distribution ofthe selected water quality indicators. This case studyprovides an example of the current methodologicalinnovations that are applicable to exploit the synergyof different kinds of data collection, in order to derivecoastal water quality information in an area where noneis available, using a combination of optical remotesensing techniques and a minimal amount of in situmeasurements.
2. Materials and methods
2.1. Study area
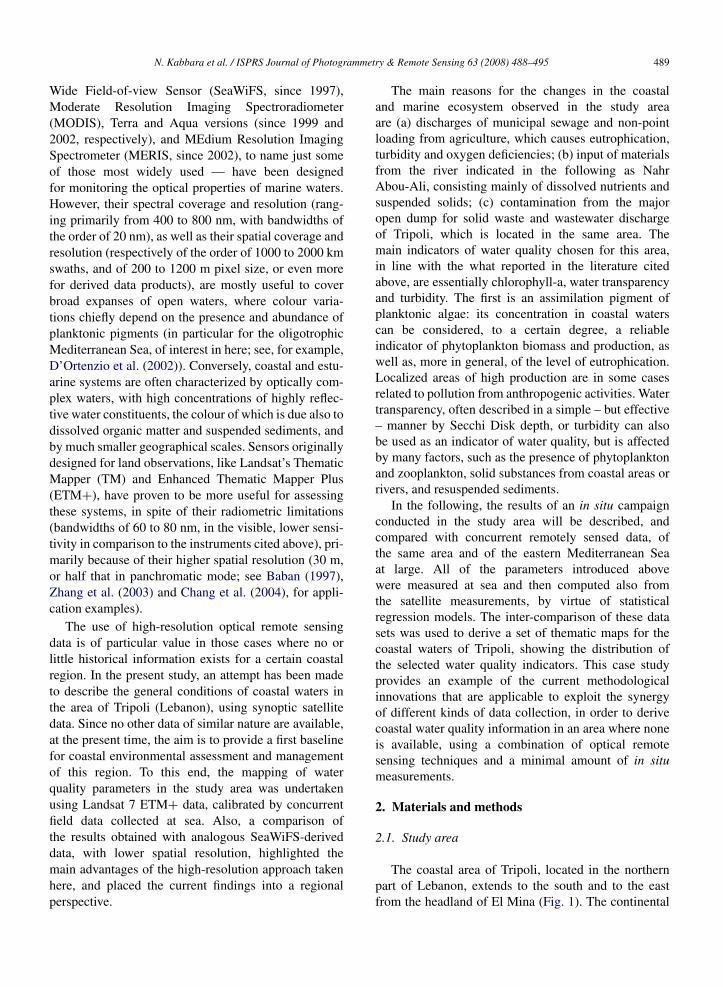
The coastal area of Tripoli, located in the northernpart of Lebanon, extends to the south and to the eastfrom the headland of El Mina (Fig. 1). The continental
490 N. Kabbara et al. / ISPRS Journal of Photogrammetry & Remote Sensing 63 (2008) 488–495
Table 1Landsat 7 ETM+ bands, spectral interval and spatial resolution
ETM+ band Name Spectral interval (µm) Spatial resolution (m)
Panchromatic band 0.52–0.90 15
Visible bandsB1a ETM+ 1 (blue) 0.45–0.51
30B2a ETM+ 2 (green) 0.525–0.605B3a ETM+ 3 (red) 0.63–0.69
NIR band ETM+ 4 0.75–0.90 30
Mid-infrared bands ETM+ 5 1.55–1.75ETM+ 7 2.09–2.35 30
TIR band ETM+ 6 10.40–12.50 60
a Identifier used in the following.
Fig. 1. Map of the Tripoli coastal area and sampling stations.
shelf in this area has a width of about 12 km. Theaverage depth over the shelf is roughly 20 m, but thebathymetry is quite variable, especially off El Mina,where many shallow reefs and small islands occur(Goedicke, 1972). The Tripoli coastal area receivesa sizeable freshwater input from the Nahr Abou-Ali(369 Mm3/year). The major open dump for solidwaste and wastewater discharge of Tripoli are locatedin the same area. The Council for Development andReconstruction (CDR) of Lebanon is currently buildinga plant for primary treatment of sewage, to serve thecity of Tripoli and surrounding areas, directly nearthe mouth of the Nahr Abou-Ali. However, at present,raw domestic and industrial wastewaters, from varioussewer pipelines and drainage channels, are released atsea without treatment (200 Ml/day, in the year 2000).Due to the high nutrient input associated with thisrunoff, the Tripoli coastal/shelf zone plays an importantrole in supporting abundant marine life. The area ofPalm Island (5 km offshore) is one of the few marinenatural reserves in Lebanon.
2.2. Satellite data
Several studies have explored the possibility ofexploiting high resolution satellite images, like TMdata, for the determination of coastal water quality, withvarying degrees of success (Bagheri and Dios, 1990;Tassan, 1993; Pattiaratchi et al., 1994). A Landsat 7ETM+ image (path: 174, row: 36), dated 27 March2003, was used for the present study. The imagewas acquired under clear sky and calm conditions. Inaddition to a panchromatic band, with 15 m spatialresolution, the Landsat 7 ETM+ includes 7 spectralbands, with 30 m spatial resolution for all except band6, which is a thermal infrared band, with 60 m spatialresolution (Table 1).
A geometric correction was applied to the acquiredLandsat ETM+ image, using ERDAS Imagine 9.0, adigital image processing and GIS software developedby Leica Geosystems, Atlanta, USA. First, the imagewas geometrically rectified to a Universal TransverseMercator (UTM) projection (Zone 36; Datum: WGS84)using USGS 7.5 min quadrangle topographic maps.More than 35 Ground Control Points (GCPs) wereselected from both the image and the topographic map.For the special interpolation portion of the geometriccorrection, a first-order, affine transformation was used.The RMS error was less than 0.5 pixel. The nearestneighbor resampling techniques was chosen as the laststep in the rectification process, in order to assign thebrightness values to the pixels in the output image(Jensen, 2005). According to the original data supplier(RADARSAT International, Canada), an atmosphericcorrection was applied, by performing a dark objectsubtraction, and an illumination correction by dividingall Digital Number (DN) values by the cosine of the sunelevation. In the present case, a radiometric correctionof the Landsat ETM+ image was performed based onthe Chavez (1996) COST method.

N. Kabbara et al. / ISPRS Journal of Photogrammetry & Remote Sensing 63 (2008) 488–495 491
Table 2Range of environmental variables measured in the Tripoli coastal area (N indicates the total Number of stations used, SD the Standard Deviation)
Variable N Mean Maximum Minimum SD
Chlorophyll-a (mg m−3) 34 0.82 3.07 0.30 0.46Secchi disk depth (m) 36 6.16 11.00 2.00 2.50Turbidity (FTU) 45 2.34 8.43 0.58 1.86Temperature (◦C) 47 17.95 19.93 16.76 0.87
Table 3Predictive algorithms derived from the matching in situ and Landsat 7 ETM+ data
(1a) Ln(CHLA) = 1.67–3.94 Ln(B1) + 3.78 Ln(B2) N = 34 R2= 0.723
(1b) Ln(CHLA) = 6.92274–5.75815[Ln(B1)/Ln(B3)] N = 34 R2= 0.719
(2) Ln(SECCHI) = −7.27 + 4.84 Ln(B1) − 2.95 Ln(B2) N = 35 R2= 0.54
(3) Ln(TURB) = 10.6823–5.6838 Ln(B1) + 3.5418 Ln(B2) N = 45 R2= 0.57
Because of possible residual errors in the remapping,and in order to take into account local uncertainties dueto water dynamics, a window of 3 × 3 pixels aroundeach pixel corresponding to a sampling station (seebelow) was considered for further processing. Then, themean reflectance of the 3 × 3 window, instead of thecentral pixel, was extracted and used to derive empiricalalgorithms for water quality parameters, according to atechnique widely used in similar works reported in theliterature (see e.g. Baban (1997), Woodruff et al. (1999)and Braga et al. (2003)).
Additional satellite data, collected by SeaWiFS inMarch 2003, where also considered in the presentstudy, for comparison with the available Landsat 7ETM+ image. In this case, the processor used tocompute chlorophyll-a concentration, using the OC4v4algorithm, was the SeaWiFS Data Analysis System(SeaDAS), version 4.8 (see details in Gregg andCasey (2004), for bio-optical algorithms, and in Baithet al. (2001), for the software package, respectively).The atmospheric correction scheme adopted in thisprocessor is based on the work by Gordon and Wang(1994) and subsequent developments (see e.g. Wanget al. (2005), and references therein). The comparisonwith the Landsat 7 ETM+ data involved SeaWiFS-derived chlorophyll-a maps for the same day, the daybefore and the day after the Landsat 7 overpass (i.e.26, 27 and 28 March 2003), for the entire easternmostMediterranean region, as well as the correspondingmonthly mean map (i.e. March 2003), for the Lebanesecoastal area.
2.3. In situ data collection
The acquisition of sea truth data, near-simultaneouswith the Landsat 7 ETM+ image, was carried out in
the coastal region under investigation. A group of 45locations (shown in Fig. 1) was monitored within 6hours before/after the time of the Landsat 7 overpasson 27 March 2003. The sampling stations were selectedso as to represent the full range of environmentalconditions expected in the study area. All stationswere located by GPS (Trimble Geoexplorer), and allwater quality parameters were determined in situ (theaccuracy of the GPS measurements being 2 m and withdifferential <0.3 m). Weather conditions were optimal,with a cloudless sky. The spreading of river dischargeswas seen to be eastwards along the coastline, and drivenby the dominant westerly and southwesterly winds.
Chlorophyll-a concentration was measured nearthe surface and below the surface, at 30–50 cmdepth, using a Seapoint Chlorophyll Fluorometer(Oceano Instruments), with a measured sensitivityof 0.001 mg m−3 and a minimum detectable level0.02 mg m−3 of chlorophyll-a. In order to avoid theinterference of strong sunlight with the sensor, for themeasurements at less than 1 m depth, the sensor wasshaded from direct sunlight by a black disk put on thesea surface over the sensor. Secchi depth was measuredwith a 20 cm diameter black and white quadrate disk.Turbidity was measured near the surface and below thesurface, at 50–60 cm depth, using a Seapoint TurbidityMeter (Oceano Instruments). Table 2 gives the rangeand some basic statistics of the environmental variablesmeasured below the water surface over the wholeTripoli coastal area.
The mean chlorophyll-a concentration of the 34sampling stations was 0.82 mg m−3. A relativelyhigh standard deviation (0.46 mg m−3) was recorded,underlining the pronounced spatial variability ofchlorophyll-a concentration. Higher concentrationswere found along the coast. The highest concentration,
492 N. Kabbara et al. / ISPRS Journal of Photogrammetry & Remote Sensing 63 (2008) 488–495
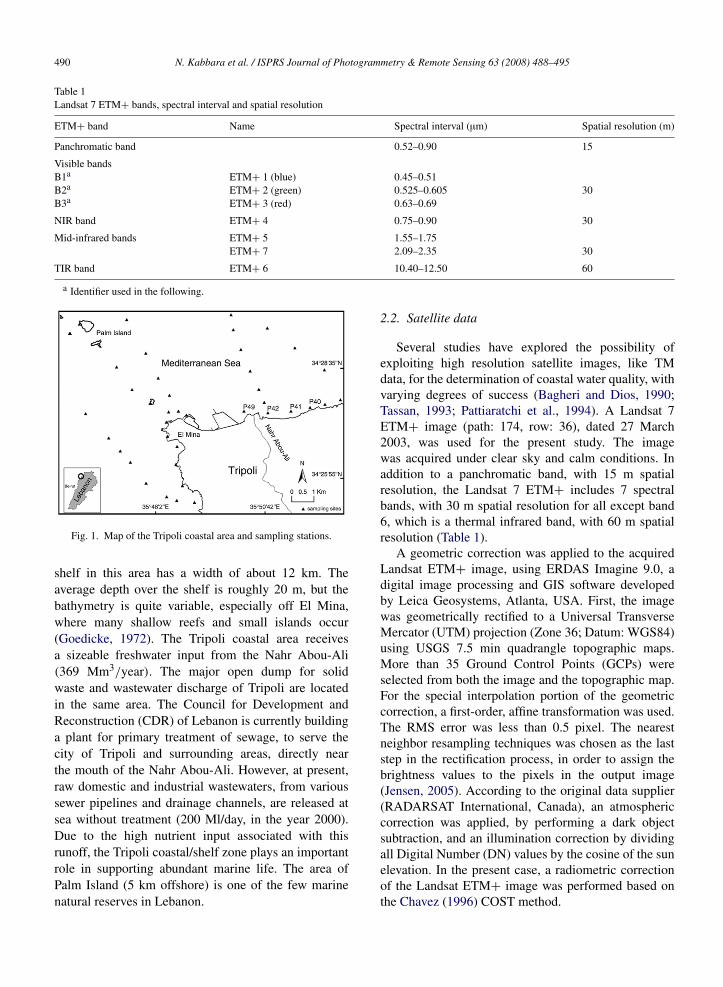
Fig. 2. Comparison between the surface chlorophyll-a concentrations derived from the predictive algorithms in Table 3, using (a) equation 1a and(b) equation 1b, and the in situ values.
3.07 mg m−3, was recorded at station P40 (seeFig. 1), at the location of the El Baddawi sewageoutfall. Relatively high concentrations, of 1.8 mg m−3,1.41 mg m−3 and 1.42 mg m−3, were recorded atstations P41, P42, and P49, respectively (see Fig. 1), inthe area where nutrients brought in by the Nahr Abou-Ali tend to have their maximum impact.
2.4. Statistical analysis and regression models
The rationale behind the development of ad hocstatistical algorithms, such as those developed for thepresent study area, is that – even when using datafrom high spatial resolution sensors like the Landsat7 ETM+, characterized by wide spectral bandwidthand low sensitivity – the scattering and absorptioncharacteristics of optical indicators can be assessedby means of a multispectral approach (Dekker et al.,1991). For example, previous studies have indicatedthat the optimal wavelength range for characterizingchlorophyll-a is between 0.4 µm and 0.9 µm. Inthis range, the prominent scattering/absorption featuresof chlorophyll-a are reflectance minima in the blue,between 0.4 and 0.5 µm, and in the red, at 0.68 µm,as well as reflectance maxima in the green, at 0.55 µm,and near-infrared, at 0.7 µm (Han, 1996). The basicprinciple of using band ratios, to estimate chlorophyll-a, is to select spectral bands that are representative ofits absorption/ scattering features (Gin et al., 2002).Therefore, the four bands which are mostly associatedwith chlorophyll-a estimators are the blue, green, red,and near-infrared bands above (as in Han et al. (1994),Han and Rundquist (1997) and Gin et al. (2002)). Thetwo bands which have the most penetration power, i.e.the blue one and the green one, can also be used toestimate Secchi disk depth and turbidity.
The analysis of the in situ data, collected on 27March 2003 at the stations shown in Fig. 1, wascarried out through statistical correlation and regression
procedures. Logarithmically transformed chlorophyll-a, Secchi disk depth and turbidity were used as thedependent variables for the regression models, whilethe logarithmically transformed Landsat 7 ETM+ bandswere used as the independent variables. The finalselection of models was based on R2, probability of agreater F-value for the overall model, and significanceof the t-test for the regression parameters. A significantlevel of 0.05 was used for all models and regressionparameters. The empirical algorithms reported inTable 3 (where B1, B2 and B3 correspond to the Landsat7 ETM+ bands as indicated in Table 1) were foundto be the best predictors of the natural log of theenvironmental parameters labeled CHLA (chlorophyll-a), SECCHI (Secchi disk depth) and TURB (turbidity).Water quality spatial maps were produced on the basisof the established regression models, using Modeler,a facility available in ERDAS Imagine. The relatedprocessing is based on a macro language defined asSpatial Modeler Language (SML).
Concerning the performance of the predictors, Fig. 2shows a comparison between the surface chlorophyll-aconcentrations derived from the algorithms, accordingto equations (1a) and (1b), and the correspondingin situ measurements. The values predicted from thealgorithms show a reasonable amount of scatter againstthe observed values. In both cases, the results appear tobe statistically significant. However, it is worth notingthat the algorithm based on B1 (blue) and B2 (green)performed slightly better than that based on B1 (blue)and B3 (red). The results obtained for Secchi disk depthand turbidity, with algorithms based again on B1 andB2, appear to be less significant. Once the obviouslimitations of a single-date approach to the generationof the empirical algorithms is taken into account, theCHLA, SECCHI and TURB spatial maps derived fromthe Landsat 7 ETM+ image provide an expanded,novel view of the water quality parameters distribution

N. Kabbara et al. / ISPRS Journal of Photogrammetry & Remote Sensing 63 (2008) 488–495 493
Fig. 3. Chlorophyll-a (algorithm 1a, Table 3) map of the Tripolicoastal area. From Landsat 7 ETM+ data, at 30 m resolution, 27March 2003.
that can be obtained using the simple, yet effective,methodology above.
3. Results and discussion
The chlorophyll-a map of the area under investiga-tion, generated using algorithm (1a), is shown in Fig. 3,while the water transparency (Secchi disk depth) mapgenerated using algorithm (2) and the turbidity mapgenerated using algorithm (3) are shown in Figs. 4 and5, respectively. These color-coded maps represent a firstsynoptic view of water quality parameters for the Tripolicoastal area viable to date, albeit they only describe thestate of surface waters on 27 March 2003. Plumes of tur-bid waters, where transparency is low and chlorophyll-a relatively high, can be observed at several hotspotsadjacent to the shoreline, in particular along the north-ern coastal stretch. Sewage outfalls, at various locations(indicated in Figs. 3–5), as well as the Nahr Abou-Ali,may be at least partly responsible for such conditions,due to their abundant release of pigmented materials(and nutrients). The main gradients are sloping in theoffshore direction, where the surface patterns seem tobe oriented toward the north-east, possibly in line withthe prevailing current (Alhammoud et al., 2005; Kab-bara et al., 2006).
The chlorophyll-a levels are above 0.6 mg m−3 formost of the coastal area considered. These values com-pare well with typical values (ranging between 0.5and 1.0 mg m−3), reported for other Mediterraneannear-coastal regions exposed to moderate eutrophica-tion (UNEP-WHO, 1988). The hotspots along the north-ern coastal stretch, where water Secchi depths fall below
Fig. 4. Secchi disk depth (algorithm 2, Table 3) map of the Tripolicoastal area. From Landsat 7 ETM+ data, at 30 m resolution, 27March 2003.
Fig. 5. Turbidity map (algorithm 3, Table 3) of the Tripoli coastalarea. From Landsat 7 ETM+ data, at 30 m resolution, 27 March 2003.
the critical values of 2 to 3 m (UNEP-WHO, 1982), dis-play concentrations up to and above 2.0 mg m−3.
The comparison of the chlorophyll-a map withthe concurrent (±1 day) SeaWiFS-derived imagery,covering the entire eastern Mediterranean region(Fig. 6), shows that in both cases offshore waters presentconcentrations up to approximately 0.4 mg m−3 (exceptfor a number of large-scale coastal plumes, where theconcentration can be twice that value). Inshore waters,in the images of Fig. 6, present concentrations aroundor above 1.0 mg m−3, but the innermost coastal pixelsappear to be systematically masked out. This, of course,because the algorithms used to estimate chlorophyll-a, for a sensor with narrow spectral bandwidth andhigh sensitivity such as SeaWiFS, become generallyunreliable in optically complex waters, where the

494 N. Kabbara et al. / ISPRS Journal of Photogrammetry & Remote Sensing 63 (2008) 488–495
Fig. 6. Chlorophyll-a maps of the eastern Mediterranean Sea. Black pixels represent clouds, points contaminated by signal noise or near-coastalareas where the processing algorithm failed to derive a significant chlorophyll-a value. The white arrows indicate the area of Tripoli. From SeaWiFSdata, at 2 km resolution; 26, 27 and 28 March 2003.
concentration of other optically active material suchas dissolved organic matter and suspended inorganicparticles is significantly high (IOCCG, 2000). Theproblem cannot be solved even by constructing longterm mean images, such as the monthly mean forMarch 2007 shown in Fig. 7. While clouds and othertransient features disappear in such a composite, theinnermost coastal stretch continues to be masked out,testifying the persisting high concentrations of waterconstituents in these waters. Indeed, it is precisely thestrong reflectivity, due to these high concentrations, thatrenders the application of land-observing sensors likethe Landsat 7 ETM+ possible for the assessment ofwater optical properties in coastal zones.
4. Conclusions
Ocean colour radiometry of the coast around Tripoliindicates that this area is exposed to the risk ofdeveloping eutrophic conditions, along most of itsshoreline (in particular along the northern stretch, dueeast of the headland of El Mina). This appears tobe linked to the presence of fluvial and wastewaterrunoff sources. The combination of spectral and spatialresolution of the Landsat 7 ETM+ proved useful forthe intended application, which generated a first set
Fig. 7. Monthly mean chlorophyll-a map of Lebanese waters. Whitepixels along the coast represent areas where the processing algorithmfailed systematically to derive significant chlorophyll-a values. Theblack arrow indicates the area of Tripoli. From SeaWiFS data, at 5 kmresolution; March 2003.
of thematic maps showing the distribution of selectedwater quality parameters. The maps can be comparedwith large scale assessments of analogous parameters,derived from SeaWiFS data, to place the local resultsobtained from the Landsat 7 ETM+ into a regionalperspective. This information, still to be evaluated at
N. Kabbara et al. / ISPRS Journal of Photogrammetry & Remote Sensing 63 (2008) 488–495 495
seasonal and interannual scales in future studies, willbe used to start a national database on water quality forthe Lebanese coastal environment.
Acknowledgements
This research was supported by the LebaneseNational Council for Scientific Research. Thanksare due to Elie Najjar for his assistance with thecollection of the ground-truth data. The SeaWiFSimagery was provided by the Regional Archives ofthe Joint Research Centre, European Commission, viathe Environmental Marine Information System, or emis(http://emis.jrc.ec.europa.eu/).
References
Alhammoud, B., Beranger, K., Mortier, L., Crepon, M., Dekeyser,I., 2005. Surface circulation of the Levantine Basin: Comparisonof model results with observations. Progress in Oceanography 66(2–4), 299–320.
Baban, S.M.J., 1997. Environmental monitoring of estuaries;estimating and mapping various environmental indicators inBreydon Water Estuary, UK, using Landsat TM imagery.Estuarine, Coastal, and Shelf Science 44 (5), 589–598.
Bagheri, S., Dios, R., 1990. Chlorophyll-a estimation in New Jersey’scoastal waters using Thematic Mapper data. International Journalof Remote Sensing 11 (2), 289–299.
Braga, C.Z.F., Vianna, M.L., Kjerfve, B., 2003. Environmentalcharacterization of a hypersaline coastal lagoon from Landsat-5Thematic Mapper data. International Journal of Remote Sensing24 (16), 3219–3234.
Baith, K., Lindsay, R., Fu, G., McClain, C.R., 2001. SeaDAS,a data analysis system for ocean-color satellite sensors. EOSTransactions AGU 82 (18), 202.
Chang, K.W., Shen, Y., Chen, P.C., 2004. Predicting algal bloom inthe Techi reservoir using Landsat TM data. International Journalof Remote Sensing 25 (17), 3411–3422.
Chavez Jr., P.S., 1996. Image-based atmospheric corrections —revisited and revised. Photogrammetric Engineering and RemoteSensing 62 (9), 1025–1036.
Dekker, A.G., Malthus, T.J., Seyhan, E., 1991. Quantitative modellingof inland water quality for high-resolution MSS systems. IEEETransactions on Geoscience and Remote Sensing 29 (1), 89–95.
D’Ortenzio, F., Marullo, S., Ragni, M., Ribera d’Alcala, M., Santoleri,R., 2002. Validation of empirical SeaWiFS algorithms forchlorophyll-α retrieval in the Mediterranean Sea. A case study foroligotrophic seas. Remote Sensing of Environment 82 (1), 79–94.
Gin, K.Y., Koh, S.T., Chan, E.S., 2002. Application of spectralsignatures and colour ratios to estimate chlorophyll in Singapore’scoastal waters. Estuarine, Coastal and Shelf Science 55 (5),719–728.
Goedicke, T.R., 1972. Submarine canyons on the Central ContinentalShelf of Lebanon. In: Stanley, D.J. (Ed.), The MediterraneanSea: A Natural Sedimentation Laboratory. Dowen, Hutchington& Ross, Stroudsburg, PA.
Gordon, H.R., Wang, M., 1994. Retrieval of water-leaving radiance
and aerosol optical thickness over the oceans with SeaWiFS: apreliminary algorithm. Applied Optics 33 (3), 443–452.
Gregg, W.W., Casey, N.W., 2004. Global and regional evaluationof the SeaWiFS chlorophyll data set. Remote Sensing ofEnvironment 93 (4), 463–479.
Han, L., 1996. Spectrometry of turbidity in surface water. In:Proceedings, International Geoscience and Remote SensingSymposium (Library of Congress No. 95-80706), vol. 2,1395–1397.
Han, L., Rundquist, D.C., 1997. Estimating algal-chlorophyllconcentration in a reservoir using surface spectral reflectance.Remote Sensing of Environment 62 (3), 253–261.
Han, L., Rundquist, D.C., Liu, L.L., Fraser, R.N., Schalles, J.F., 1994.The spectral responses of algal chlorophyll in water with varyinglevels of suspended sediment. International Journal of RemoteSensing 15 (18), 3707–3718.
IOCCG, 2000. Remote sensing of ocean colour in coastal, andother optically complex, waters. In: Sathyendranath, S.(Ed.), Reports of the International Ocean Colour Co-ordinating Group, No. 3. IOCCG, Dartmouth, Canada,http://www.ioccg.org/reports ioccg.html#Reports (accessed20.02.08).
Jensen, J.R., 2000. Remote Sensing of the Environment: an EarthResource Perspective. Prentice Hall, Upper Saddle River, NJ.
Jensen, J.R., 2005. Introductory Digital Image Processing, A RemoteSensing Perspective. Prentice Hall, Upper Saddle River, NJ.
Kabbara, N., Sorgente, R., Natale, S., Daniel, H., Zodiatis, G.,2006. High-resolution nested model for the Lebanese basin,East Levantine, eastern Mediterranean Sea: Implementation andclimatological runs. Ocean Science Discussions 3 (3), 373–396.
Pattiaratchi, C., Lavery, P., Wyllie, A., Hick, P., 1994. Estimates ofwater quality in coastal waters using multidate Landsat ThematicMapper data. International Journal of Remote Sensing 15 (8),1571–1584.
Robinson, I., 2004. Measuring the Oceans from Space: the Principlesand Methods of satellite Oceanography. Praxis Publishing Ltd,Chichester, UK.
Tassan, S., 1993. An improved in-water algorithm for the determina-tion of chlorophyll and suspended sediment concentration fromThematic Mapper data in coastal waters. International Journal ofRemote Sensing 14 (6), 1221–1229.
UNEP-WHO, 1982. Waste Discharge into Marine Environment —Principles and Guidelines for the Mediterranean Action Plan.Pergamon Press, Oxford.
UNEP-WHO, 1988. Eutrophication in the mediterranean sea:Receiving capacity and monitoring of long term effects.Mediterranean Action Plan Technical Reports Series 21. UNEP,Athens.
Wang, M., Knobelspiesse, K.D., McClain, C.R., 2005. Study ofthe Sea-viewing Wide Field-of-view Sensor (SeaWiFS) aerosoloptical property data over ocean in combination with oceancolor products. Journal of Geophysical Research 110, D10S06.doi:10.1029/2004JD004950.
Woodruff, D.L., Stumpf, R.P., Scope, J.A., Paerl, H.W., 1999. Remoteestimation of water clarity in optically complex estuarine waters.Remote Sensing of Environment 68 (1), 41–52.
Zhang, Y., Koponen, S.S., Pulliainen, J.T., Hallikainen, M.T., 2003.Application of empirical neural networks to chlorophyll aestimation in coastal waters using remote optosensors. IEEESensors Journal 3 (4), 376–382.


![Travels of Ali Bey [pseud.] in Morocco, Tripoli, Cyprus, Egypt ...](https://static.fdokumen.com/doc/165x107/6333e93b3108fad7760f46d2/travels-of-ali-bey-pseud-in-morocco-tripoli-cyprus-egypt-.jpg)

