
The constructal law of organization in nature: tree-shaped flows and body size
Upload
independentCategory
view
2download
0
Geomorphology 114 (2010) 276–283
Contents lists available at ScienceDirect
Geomorphology
j ourna l homepage: www.e lsev ie r.com/ locate /geomorph
Sand size versus beachface slope — An explanation based on the Constructal Law
A. Heitor Reis a,⁎, Cristina Gama b
a Department of Physics and Geophysics Centre of Evora, University of Évora, R. Romão Ramalho 59, 7000-671 Evora, Portugalb Department of Geosciences and Geophysics Centre of Evora, University of Évora, R. Romão Ramalho 59, 7000-671 Evora, Portugal
⁎ Corresponding author. Tel.: +351 967324948; fax:E-mail address: [email protected] (A.H. Reis).
0169-555X/$ – see front matter © 2009 Elsevier B.V. Adoi:10.1016/j.geomorph.2009.07.008
a b s t r a c t
a r t i c l e i n f oArticle history:Received 19 February 2009Received in revised 21 July 2009Accepted 24 July 2009Available online 3 August 2009
Keywords:Beachface dynamicsSediment sizeBeach slopeConstructal Law
The relationship between beachface slope and sand grain size has been established based on multipleobservations of beach characteristics in many parts of the world. We show that this observational result maybe understood in the light of the Constructal Law (Bejan, 1997). A model of wave run-up and run-downalong the beachface (swash) was developed to account for superficial flows together with flows through theporous sand bed of average porosity 0.35, the permeability of which may be related to grain diameter andsphericity (0.9 for sand grains) through the Kozeny–Carmán equation. Then, by using the Constructal Law,we minimized the time for completing a swash cycle, under fixed wave height and sand grain diameter. Asthe result, a relationship involving sand grain size, beachface slope and open ocean wave height has beenobtained, and then discussed and validated against experimental data. In addition, this relationship has alsobeen used to illuminate beachface dynamic processes, namely the reshaping of sandy beachfaces in responseto changes in wave height. Though the model used in this work may be improved further, the results appearto show, as with other natural systems, that beachface morphing in time may be understood based on aunifying principle — the Constructal Law.
© 2009 Elsevier B.V. All rights reserved.
1. Introduction
The beachface is the sub-aerial beach sector, below the berm, thatpresents the steepest slope. This sector is exposed to wave swash thatis responsible for sediment transport. Beachface gradient in relation tosediment transport and beach profile evolution has been studied fromdifferent perspectives: (i) by considering the beachface sedimentcharacteristics, sediment grain size and sorting (Bagnold, 1940;Bascom, 1951; Wiegel, 1964; Turner, 1995; Wilson et al., 2008);(ii) or by accounting for swash infiltration/exfiltration effects on theequilibrium beachface profile in the cross-shore sediment transport(Grant, 1948; Kemp, 1975; Quick, 1991; Turner, 1995; Hughes et al.,1997; Masselink and Hughes, 1998; Turner and Masselink, 1998; Buttand Russell, 1999; Hughes and Turner, 1999; Puleo et al., 2000; Buttet al., 2001; Masselink and Li, 2001; Baldock and Hughes, 2006;Masselink and Puleo, 2006); and (iii) beach groundwater flow in theswash zone (Hegge and Masselink, 1991; Turner, 1993; Kang andNielsen, 1996; Turner, 1998; Nielsen, 1999; Li et al., 2002; Horn,2006).
The relationship between beach grain size and beach statesranging from those with steep reflective slopes to those with shallow,dissipative slopes has been examined by Wright and Short (1984) interms of the dimensionless sediment fall velocity parameter,X = Hb =WsT , where Hb = breaker height; Ws = sediment fall
+351 266745394.
ll rights reserved.
velocity and T = wave period (Gourlay, 1968). The sediment fallvelocity parameter has been judged as a rather crude estimator ofbeach morphodynamic states (e.g. Anthony, 1998; Levoy et al., 2000;Masselink and Pattiaratchi, 2001; Jackson et al., 2005), and may,therefore, be considered as inadequate in reliably characterisingbeachface types within the reflective–dissipative beach continuum.Anthony (1998) has suggested that beach parameters based on slope,such as the Iribarren number (see Section 2), are better indicators ofbeach morphodynamic type than sediment size.
The proportionality between beachface gradient and sediment sizewas described by several authors (e.g. Bascom, 1951; McLean andKirk, 1969; Dubois, 1982; Sunamura, 1984; Komar, 1998) who relatedthis aspect to swash infiltration and hydraulic conductivity (perme-ability). If swash infiltration is significant, the water that infiltrateswill not participate in the backswash (Kemp, 1975), and this controlsbeachface slope in relatively coarse sand beds (Bagnold, 1940; Quick,1991). Swash infiltration depends on the permeability of thesediments bed which increases with grain size and sorting (Bascom,1951; Shepard, 1963; Pryor, 1973; Selley, 1988; Masselink and Li,2001). In coarse sand beaches (N1 mm) where swash infiltration isvery important the beachface slope tends to increase with perme-ability (Quick, 1991; Komar, 1998; Masselink and Li, 2001).
With respect to importance of infiltration and exfiltration in theswash zone sediment transport and beach profile evolution, Butt et al.(2001) suggested that in coarse sand beds onshore sedimenttransport due to the effects of swash infiltration/exfiltration becomesimportant. These authors pointed out that a critical grain size might
277A.H. Reis, C. Gama / Geomorphology 114 (2010) 276–283
exist below which infiltration/exfiltration promotes offshore trans-port and above which it promotes onshore transport. Additionally,Masselink and Li (2001) concluded that infiltration augments onshoretransport and berm formation. A number of studies have indicatedthat infiltration in the swash zone is only important for profileevolution on coarse-grained beaches (e.g. Bagnold, 1940; Packwood,1983; Quick, 1991). On the other hand, simulations carried out byMasselink and Li (2001) showed that swash infiltration on coarsebeaches produced steeper gradients than on fine-grained beaches.
In the present paper we focus on the relationships betweenbeachface slope, sand grain size andwave forcing.With the purpose ofdeveloping a comprehensive framework of these relationships, anddrawing from the body of works cited above, we build a model of theswash process that takes into account uprush and downrush togetherwith infiltration/exfiltration. In this model, the morphology of thesand bed is accounted for through sand grain size and sphericity, andbed porosity.
Wewill use the Constructal Law (Bejan, 1997) as the principle thatgoverns flow processes in relation to beachface morphodynamics.This law has proven to be an important principle for flowarchitectures that evolve in time in systems out of equilibrium (seeBejan, 1997, ch.13) in that: “Flow systems morph in time in order toprovide easier and easier flow access to the currents that flow throughit, under the system constraints”. Said another way, the beachfaceslope will change in time such as to maximize the global currents(swash flows) that flow over and inside it”. The Constructal Law hasproven to be successful in describing evolving flow architectures inmany natural and engineered systems (see reviews by Bejan, 2000;Bejan and Lorente, 2004; Reis, 2006a). With respect to naturalsystems, it has been applied successfully to biological flow architec-tures (see for example Reis et al., 2004; Bejan and Marden, 2006;Miguel, 2006), and inanimate flow systems (Bejan and Reis, 2005;Reis, 2006b; Reis and Bejan, 2006).
2. Swash flow modelling
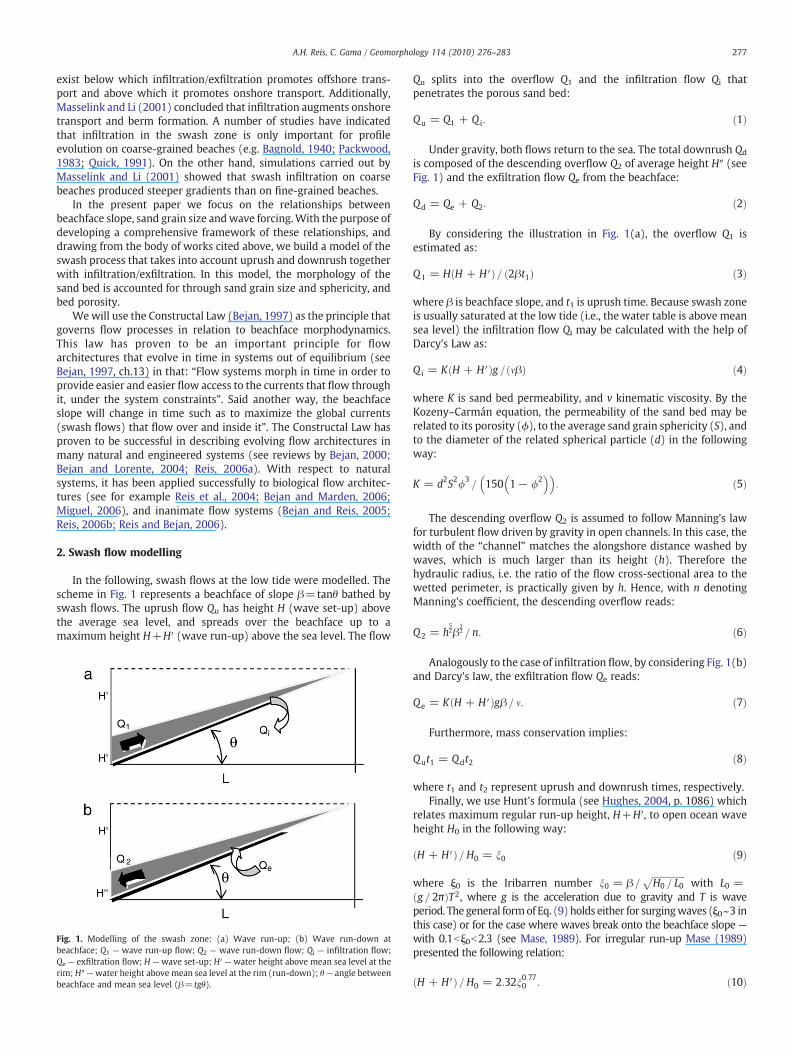
In the following, swash flows at the low tide were modelled. Thescheme in Fig. 1 represents a beachface of slope β=tanθ bathed byswash flows. The uprush flow Qu has height H (wave set-up) abovethe average sea level, and spreads over the beachface up to amaximum height H+H′ (wave run-up) above the sea level. The flow
Fig. 1. Modelling of the swash zone: (a) Wave run-up; (b) Wave run-down atbeachface; Q1 — wave run-up flow; Q2 — wave run-down flow; Qi — infiltration flow;Qe — exfiltration flow; H —wave set-up; H′ —water height above mean sea level at therim; H″ —water height above mean sea level at the rim (run-down); θ— angle betweenbeachface and mean sea level (β= tgθ).
Qu splits into the overflow Q1 and the infiltration flow Qi thatpenetrates the porous sand bed:
Qu = Q1 + Q i: ð1Þ
Under gravity, both flows return to the sea. The total downrush Qd
is composed of the descending overflow Q2 of average height H″ (seeFig. 1) and the exfiltration flow Qe from the beachface:
Qd = Qe + Q2: ð2Þ
By considering the illustration in Fig. 1(a), the overflow Q1 isestimated as:
Q1 = H H + HVð Þ= 2βt1ð Þ ð3Þ
where β is beachface slope, and t1 is uprush time. Because swash zoneis usually saturated at the low tide (i.e., the water table is above meansea level) the infiltration flow Qi may be calculated with the help ofDarcy's Law as:
Q i = K H + HVð Þg = mβð Þ ð4Þ
where K is sand bed permeability, and v kinematic viscosity. By theKozeny–Carmán equation, the permeability of the sand bed may berelated to its porosity (ϕ), to the average sand grain sphericity (S), andto the diameter of the related spherical particle (d) in the followingway:
K = d2S2/3= 150 1− /2
� �� �: ð5Þ
The descending overflow Q2 is assumed to follow Manning's lawfor turbulent flow driven by gravity in open channels. In this case, thewidth of the “channel” matches the alongshore distance washed bywaves, which is much larger than its height (h). Therefore thehydraulic radius, i.e. the ratio of the flow cross-sectional area to thewetted perimeter, is practically given by h. Hence, with n denotingManning's coefficient, the descending overflow reads:
Q2 = h52β
12 = n: ð6Þ
Analogously to the case of infiltration flow, by considering Fig. 1(b)and Darcy's law, the exfiltration flow Qe reads:
Qe = K H + HVð Þgβ = m: ð7Þ
Furthermore, mass conservation implies:
Qut1 = Qdt2 ð8Þ
where t1 and t2 represent uprush and downrush times, respectively.Finally, we use Hunt's formula (see Hughes, 2004, p. 1086) which
relates maximum regular run-up height, H+H′, to open ocean waveheight H0 in the following way:
H + HVð Þ=H0 = n0 ð9Þ
where ξ0 is the Iribarren number n0 = β =ffiffiffiffiffiffiffiffiffiffiffiffiffiffiffiH0 = L0
pwith L0 =
g = 2πð ÞT2, where g is the acceleration due to gravity and T is waveperiod. The general formof Eq. (9) holds either for surgingwaves (ξ0~3 inthis case) or for the case where waves break onto the beachface slope —
with 0.1bξ0b2.3 (see Mase, 1989). For irregular run-up Mase (1989)presented the following relation:
H + HVð Þ=H0 = 2:32n0:770 : ð10Þ
278 A.H. Reis, C. Gama / Geomorphology 114 (2010) 276–283
On the other hand, for moderately steep beaches H is approxi-mately given by (see Guza and Thornton, 1981):
He0:17H0 ð11aÞ
while for dissipative beaches with spilling waves (ξ↓0b0.3) thefollowing relationship holds (see Stockdon et al., 2006):
H = 0:35n0H0: ð11bÞ
The relationships (11a) and (11b) were derived as the best fits ofexperimental data. However, it is commonly recognized that everyrelation of this kind carries significant uncertainties due to the manyfactors that may influence wave breaking.
Eqs. (9)–(11) allow run-up height to be referred to the nearshorewave “climate” that is characteristic of each beach. The modeldeveloped here is appropriate for describing waves with regularrun-up (see Fig. 1). Therefore, in the following we will use Eq. (9).
3. Beachface morphing under fixed constraints
The model presented here implicitly assumes that wave height,beachface slope and mean sand grain diameter are interrelated.However, Eqs. (1)–(11) aremerely constitutive and say nothing aboutbeachface slope evolution under the existing constraints. Amongthese constraints, which may vary from time to time, are the wave“climate” — that may be represented by the characteristic offshorewave height H0 — and characteristic sand grain diameter, d. Then, theonly free parameter is beachface slope.
The Constructal Law offers the theoretical basis for determiningbeachface slope evolution so as to adjust in time to the actual existingconstraints, i.e. the beachface slopewill morph in time so as to provideglobally easier and easier access to both the uprush and downrushflows. The equilibrium slope will be the one that simultaneouslymaximizes both flows. Equivalent to flow maximization is minimiza-tion of total time for a fixed amount of water to complete a swashcycle. In terms of non-equilibrium physics, the Constructal Law in thepreceding formulation corresponds to the statement that in thepresence of constraints the time for transition between twoequilibrium states is the shortest. For a more detailed analysis onthe physical grounds of the Constructal Law the reader is directed toReis (2006a). We will use this last formulation of the Constructal Lawfor determining the equilibrium slope of a beachface of fixed sandgrain size, washed bywaves of fixed height. The result will provide theslope to which the actual beachfaces would evolve if they were toreach the respective equilibrium flow architecture.
Then, according to the Constructal Law, for a fixed amount of waterV resulting from a breaking wave of fixed offshore height H0, the timeneeded to perform a swash cycle on a sand bed of grain diameter dmust be the shortest one that matches the existing constraints. Themathematical formulation reads:
d t1 + t2ð ÞH0;d = 0: ð12Þ
The amount of water involved in the swash cycle is also fixed, andfollowing Eq. (8), is given by V=Qut1=Qdt2, which allows theexpression of t1 and t2 as:
t1 = V =Qu; t2 = V =Qd: ð13Þ
Therefore, by using Eqs. (3)–(10) and (13), one obtains:
t1 = Vβ − Að Þ= ad2� �
ð14Þ
where
a = n0H0S2/3g = 150m 1− /2
� �� �ð15aÞ
and
A = 0:085n0H20 : ð15bÞ
Analogously, one obtains t2 in the following form:
t2 = V = Bβ12 + ad2β
� �ð16Þ
with
B = h52 = n: ð17Þ
We assumed that h = H = 2, and H″=H′ as the acceptableapproximations. This later approximation means assuming that theaverage height of the downrush is of the same order of that of uprush.With respect to the first one, if v̄denotes the average downrush speed,we have: mht2 = H H + HVð Þ= 2β and mt2 = H + HVð Þ= sinθ (seeFig. 1), which leads to h = H cosθ = 2eH = 2.
Eqs. (14) and (16) enable to explicitly develop Eq. (12) in terms ofthe free variable β, and the fixed constraints d and H0. The result is the4th-order algebraic equation with d as the unknown,
ab − b2β2� �
d4 − 2bBβ32 − a
B2
� �β− 1
2
� �d2 − B2β = 0 ð18Þ
the unique real and positive solution of which is:
d = B 2β32− 1
2
� �β− 1
2
� �+ B 2β
32− 1
2
� �β− 1
2
� �2+ 4β 1−β2
� �� �12
=2a 1−β2� �( )1
2
:
ð19Þ
Eq. (19) relates the slope to which the beachface would evolve intime to the existing constraints, here represented by d and H0.
The curves in Fig. 3 show sand grain diameter against beachfaceslope (Eq. (19)) for various characteristic wave regimes. In thisdetermination, we used S=0.9 for the sand grain sphericity (whichcorresponds to the mean sphericity of objects from cube toicosahedron), Ø=0.35 for the porosity of the sand bed (Soulsby,1991), and ν=10−6 m2/s as the kinematic viscosity of water.Manning's coefficient n, is about 0.02 for a sand bed of grain diameterclose to 1 mm. As n varies with grain diameter, we used the formulan=0.015+0.2(d−0.0003), which represents the variation, withinthe range of interest, of Manning's coefficient. The validation of theseresults against experimental data will be the subject of the nextsection.
However, we should note that the exact result of Eq. (6) may bepresented in a simplified but fairly accurate form. In reality, the termthat contains d in the denominator of the 2nd member of Eq. (16) ismuch smaller than the other term by several orders of magnitude.This aspect allows us to neglect it not only in this equation but also inthe first derivative of t2 with respect to β. Therefore, a resultapproximate (with relative error smaller than 1/1000) to that of Eq.(19) is:
β = a=2ð Þ23B− 43d
43: ð20Þ
Eq. (20) is much simpler than Eq. (19) and may be used forpractical purposes. However, we note that some restrictions emergefrom the fact that Eq. (20) was derived under the assumptions of fixedbed porosity, sorting and grain sphericity.
279A.H. Reis, C. Gama / Geomorphology 114 (2010) 276–283
4. Data analysis and discussion in the light of the model
4.1. Data collection
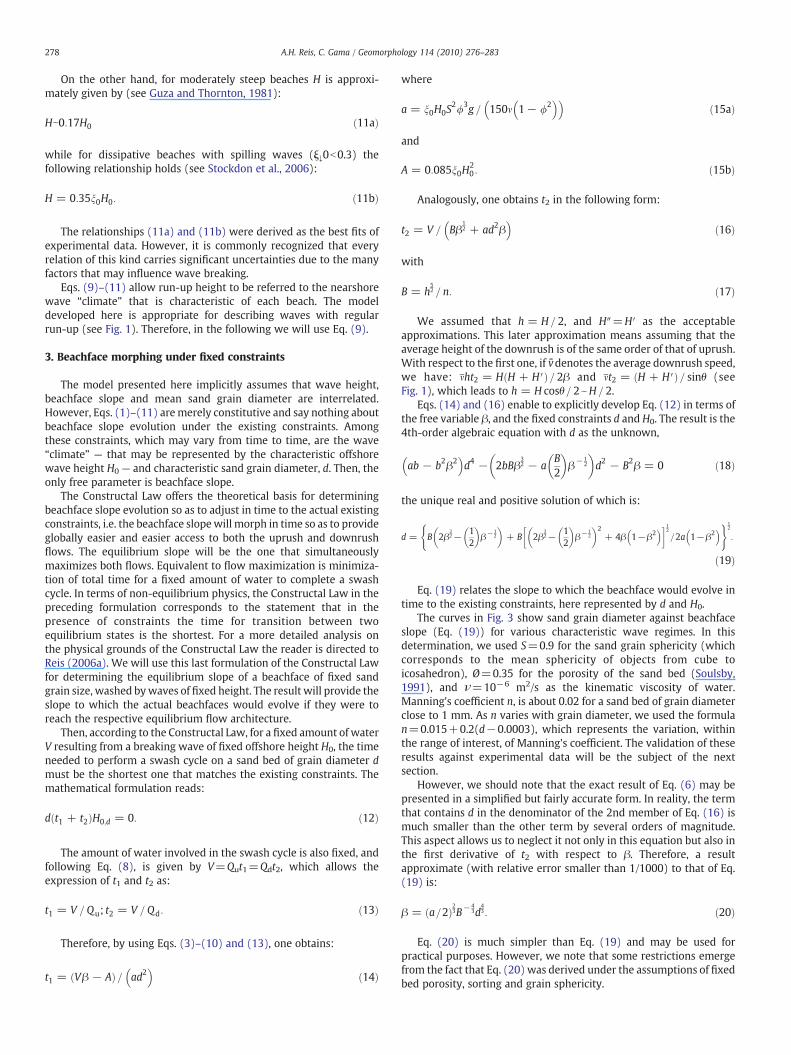
Data of characteristic sand grain sizes together with local beach-face slopes have been collected on the southwestern coast of Portugalon a seasonal basis over two and a half years (see Fig. 2).
Topographic beach profiles were obtained by using classicalmethods (e.g. theodolite) for describing shore-normal transectsbetween the dune/sea-cliff base and the surf zone. In each fieldsurvey, a beachface slope together with a mean sand grain size hasbeen assigned to each beach. Sampling of superficial beach sedimentsand beach profiles has been carried out during the monthly springtides and at the lower tide level. For all the beaches considered in thisstudy, the field data have been collected under a broad range of waveconditions during a 2.5-year period (May 1998 to July 2001).
Beachface slopes were estimated by using a graphical method thatadjusts a straight line to the beachface segment of each profile, at themid-tide level reference (“reference point”) as described by Bascom(1951). The slope of the line obtained in this way was assumed todefine the beachface slope. In each of the field surveys only superficialbeach sediments were collected.
Beach sediments were studied from the perspective of texturalanalysis by using classical sieving methods (dry-sieved at 1/2 ϕintervals). The textural parameters used for describing the grain size
Fig. 2. Chart of the southwestern coast of Portugal showing location of the beachesunder study.
distribution (mean grain size, sorting and skewness) were obtainedthrough the logarithmic graphical method (Folk and Ward, 1957)applying the software GRADISTAT® package (Blott and Pye, 2001),and by considering the logarithmic Folk and Ward (1957) graphicalmeasures (Gama, 2005). In this study, only the mean grain size wasconsidered.
We covered two different sectors the southwestern Portuguesecoast: the Tróia–Sines sandy embayed coast (northern sector of 60 kmlength, that includes Tróia, Comporta, Aberta Nova, Santo André andRibeira de Moinhos beaches), and the Southwest Alentejo–Vicentinarocky coast (sector of 95 km length that comprises São Torpes, Furnas,Odeceixe, Amoreira, Monte Clérigo and Arrifana beaches).
The offshore wave climate characteristic of this coast was studiedby Costa et al. (2001). These authors used the offshore wave climaterecorded by the Sines directional wave rider (37° 55′ 16″ N, 8° 55′ 44″W, placed at 98 m water depth) during an 11-year period. Thedeepwater data indicated a mean annual significant wave height (Hs)of 1.7 m and peak period (Tp) of 10.8 s. The wave directions associatedwith Tp are distributed by a dominant NW sector (77.3%), followed byaW sector (20%), SW sector (2.4%) and S sector (0.2%). Tidal range forthe southern Portuguese coast varies from 3.9 m on spring tides to0.2 m on neap tides, with a semidiurnal meso-tidal regime.
4.1.1. Tróia–Sines sandy embayed coastIn this sector of the coast, 102 pairs of data (beachface slope and
mean sand grain size) have been collected during the above-mentioned period of two and a half years. Gama (2005), based onthe morphodynamic classification proposed by Wright and Short(1984) andWright et al. (1985), classified four of these five beaches ofthe Tróia–Sines sandy embayed coast as “intermediate”, between the“transverse bar and rip” and “rhythmic bar and beach” stages. Ribeirade Moinhos beach is the only exception and was found to be betterdescribed as “reflective”. The same author also recognized plungingwaves to be dominant at Aberta Nova, Santo André and Ribeira deMoinhos beaches. At Comporta beach, whenever a submarine sandbar was present it was possible to observe a combination of spillingand plunging waves. At Tróia beach, waves are of small amplitude andof spilling type during the low tide.
The obtained mean grain size variations revealed longshoreprogressive coarsening southwards (from fine sand on Tróia beachto very coarse sand on Ribeira de Moinhos beach). The beachfacegradient ranged from 0.06 to 0.18. The seasonal analysis of thelongitudinal textural parameters indicated that together with ageneral increase in the mean grain size in the southward direction,sorting also increased frommoderately to very well sorted sediments.
4.1.2. Southwest Alentejo–Vicentina rocky coastIn total, 87 data of beachface slope and mean sand grain size have
been collected in this coastline. The five beaches on the Sines–SãoVicente rocky coast, which are distributed between the Sines and SãoVicente capes, are of the sandy pocket type (Gama, 2005). Followingthe classification by Wright and Short (1984) all these beaches areintermediate and have a low tide terrace with a ridge and runnelsystem. The beachface gradient varies from 0.03 to 0.14. The sedimentmean grain size ranges frommedium to fine sand. The sands analysedranged from well to moderately sorted. In these five beaches, the surfzone is wide and in the low tide the nearshore waves are reformedwaves—mainly of spilling type— that result fromwaves that broke atthe seaward limit of the ridge and runnel system.
4.2. Analysis
4.2.1. Data clusteringData of the mean grain size versus beachface slope from various
beaches along the Tróia–Sines sandy embayed coast are shown inFig. 3.
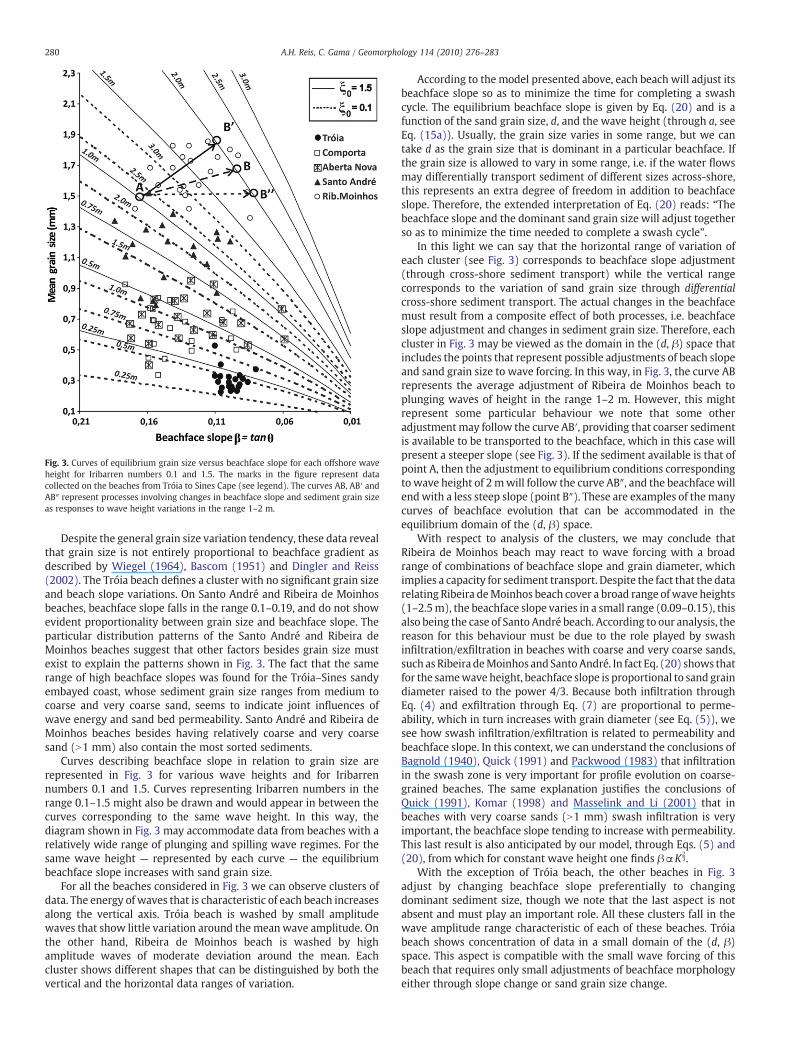
Fig. 3. Curves of equilibrium grain size versus beachface slope for each offshore waveheight for Iribarren numbers 0.1 and 1.5. The marks in the figure represent datacollected on the beaches from Tróia to Sines Cape (see legend). The curves AB, AB′ andAB″ represent processes involving changes in beachface slope and sediment grain sizeas responses to wave height variations in the range 1–2 m.
280 A.H. Reis, C. Gama / Geomorphology 114 (2010) 276–283
Despite the general grain size variation tendency, these data revealthat grain size is not entirely proportional to beachface gradient asdescribed by Wiegel (1964), Bascom (1951) and Dingler and Reiss(2002). The Tróia beach defines a cluster with no significant grain sizeand beach slope variations. On Santo André and Ribeira de Moinhosbeaches, beachface slope falls in the range 0.1–0.19, and do not showevident proportionality between grain size and beachface slope. Theparticular distribution patterns of the Santo André and Ribeira deMoinhos beaches suggest that other factors besides grain size mustexist to explain the patterns shown in Fig. 3. The fact that the samerange of high beachface slopes was found for the Tróia–Sines sandyembayed coast, whose sediment grain size ranges from medium tocoarse and very coarse sand, seems to indicate joint influences ofwave energy and sand bed permeability. Santo André and Ribeira deMoinhos beaches besides having relatively coarse and very coarsesand (N1 mm) also contain the most sorted sediments.
Curves describing beachface slope in relation to grain size arerepresented in Fig. 3 for various wave heights and for Iribarrennumbers 0.1 and 1.5. Curves representing Iribarren numbers in therange 0.1–1.5 might also be drawn and would appear in between thecurves corresponding to the same wave height. In this way, thediagram shown in Fig. 3 may accommodate data from beaches with arelatively wide range of plunging and spilling wave regimes. For thesame wave height — represented by each curve — the equilibriumbeachface slope increases with sand grain size.
For all the beaches considered in Fig. 3 we can observe clusters ofdata. The energy of waves that is characteristic of each beach increasesalong the vertical axis. Tróia beach is washed by small amplitudewaves that show little variation around the mean wave amplitude. Onthe other hand, Ribeira de Moinhos beach is washed by highamplitude waves of moderate deviation around the mean. Eachcluster shows different shapes that can be distinguished by both thevertical and the horizontal data ranges of variation.
According to the model presented above, each beach will adjust itsbeachface slope so as to minimize the time for completing a swashcycle. The equilibrium beachface slope is given by Eq. (20) and is afunction of the sand grain size, d, and the wave height (through a, seeEq. (15a)). Usually, the grain size varies in some range, but we cantake d as the grain size that is dominant in a particular beachface. Ifthe grain size is allowed to vary in some range, i.e. if the water flowsmay differentially transport sediment of different sizes across-shore,this represents an extra degree of freedom in addition to beachfaceslope. Therefore, the extended interpretation of Eq. (20) reads: “Thebeachface slope and the dominant sand grain size will adjust togetherso as to minimize the time needed to complete a swash cycle”.
In this light we can say that the horizontal range of variation ofeach cluster (see Fig. 3) corresponds to beachface slope adjustment(through cross-shore sediment transport) while the vertical rangecorresponds to the variation of sand grain size through differentialcross-shore sediment transport. The actual changes in the beachfacemust result from a composite effect of both processes, i.e. beachfaceslope adjustment and changes in sediment grain size. Therefore, eachcluster in Fig. 3 may be viewed as the domain in the (d, β) space thatincludes the points that represent possible adjustments of beach slopeand sand grain size to wave forcing. In this way, in Fig. 3, the curve ABrepresents the average adjustment of Ribeira de Moinhos beach toplunging waves of height in the range 1–2 m. However, this mightrepresent some particular behaviour we note that some otheradjustmentmay follow the curve AB′, providing that coarser sedimentis available to be transported to the beachface, which in this case willpresent a steeper slope (see Fig. 3). If the sediment available is that ofpoint A, then the adjustment to equilibrium conditions correspondingto wave height of 2mwill follow the curve AB″, and the beachface willendwith a less steep slope (point B″). These are examples of themanycurves of beachface evolution that can be accommodated in theequilibrium domain of the (d, β) space.
With respect to analysis of the clusters, we may conclude thatRibeira de Moinhos beach may react to wave forcing with a broadrange of combinations of beachface slope and grain diameter, whichimplies a capacity for sediment transport. Despite the fact that the datarelating Ribeira deMoinhos beach cover a broad range of wave heights(1–2.5m), the beachface slope varies in a small range (0.09–0.15), thisalso being the case of Santo André beach. According to our analysis, thereason for this behaviour must be due to the role played by swashinfiltration/exfiltration in beaches with coarse and very coarse sands,such as Ribeira deMoinhos andSantoAndré. In fact Eq. (20) shows thatfor the samewave height, beachface slope is proportional to sand graindiameter raised to the power 4/3. Because both infiltration throughEq. (4) and exfiltration through Eq. (7) are proportional to perme-ability, which in turn increases with grain diameter (see Eq. (5)), wesee how swash infiltration/exfiltration is related to permeability andbeachface slope. In this context, we can understand the conclusions ofBagnold (1940), Quick (1991) and Packwood (1983) that infiltrationin the swash zone is very important for profile evolution on coarse-grained beaches. The same explanation justifies the conclusions ofQuick (1991), Komar (1998) and Masselink and Li (2001) that inbeaches with very coarse sands (N1 mm) swash infiltration is veryimportant, the beachface slope tending to increase with permeability.This last result is also anticipated by our model, through Eqs. (5) and(20), from which for constant wave height one finds β~K
23.
With the exception of Tróia beach, the other beaches in Fig. 3adjust by changing beachface slope preferentially to changingdominant sediment size, though we note that the last aspect is notabsent and must play an important role. All these clusters fall in thewave amplitude range characteristic of each of these beaches. Tróiabeach shows concentration of data in a small domain of the (d, β)space. This aspect is compatible with the small wave forcing of thisbeach that requires only small adjustments of beachface morphologyeither through slope change or sand grain size change.
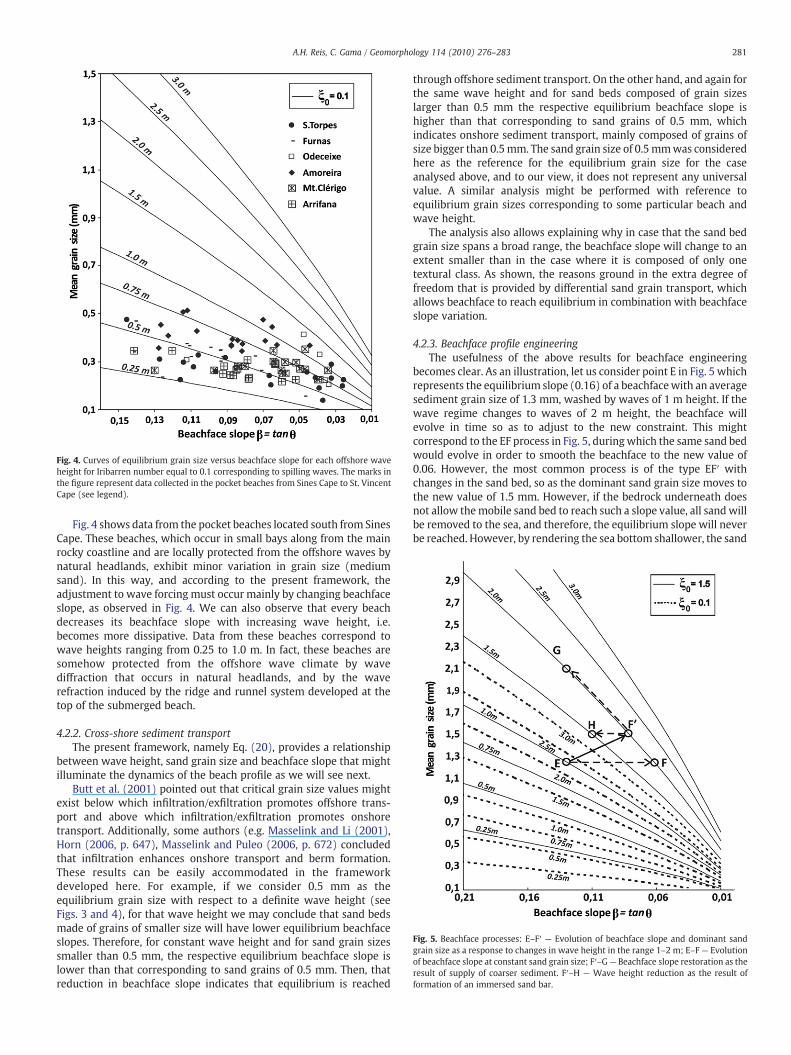
Fig. 4. Curves of equilibrium grain size versus beachface slope for each offshore waveheight for Iribarren number equal to 0.1 corresponding to spilling waves. The marks inthe figure represent data collected in the pocket beaches from Sines Cape to St. VincentCape (see legend).
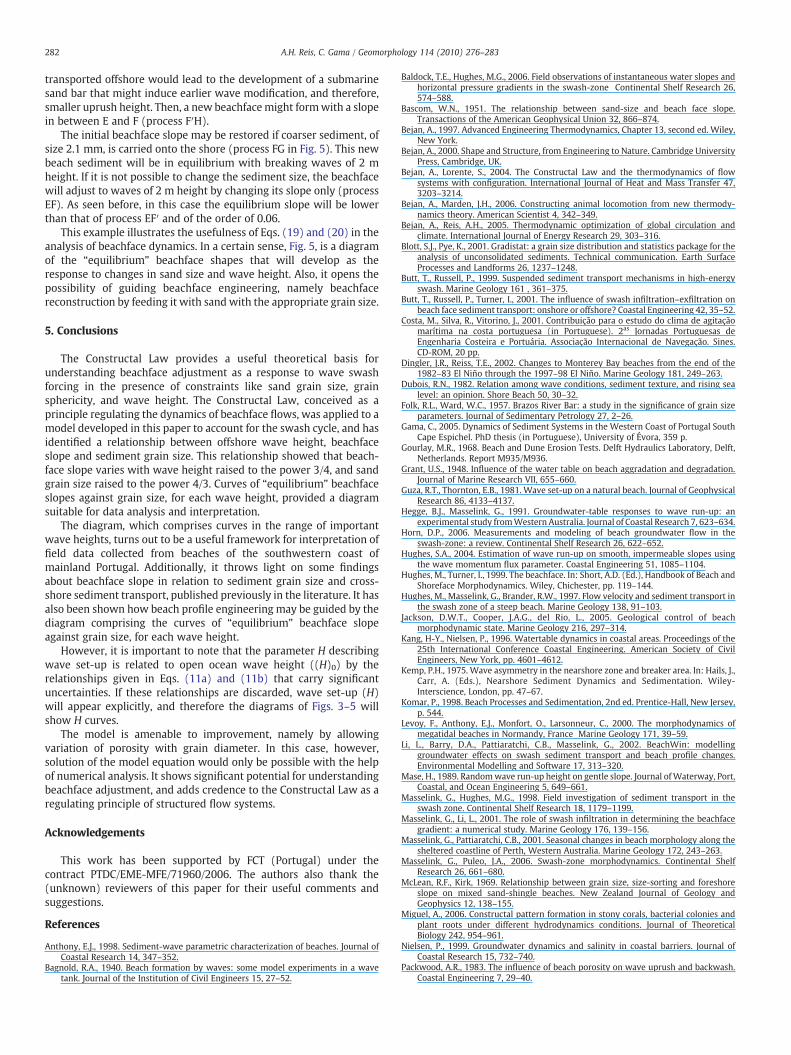
Fig. 5. Beachface processes: E–F′ — Evolution of beachface slope and dominant sandgrain size as a response to changes in wave height in the range 1–2 m; E–F — Evolutionof beachface slope at constant sand grain size; F′–G— Beachface slope restoration as theresult of supply of coarser sediment. F′–H — Wave height reduction as the result offormation of an immersed sand bar.
281A.H. Reis, C. Gama / Geomorphology 114 (2010) 276–283
Fig. 4 shows data from the pocket beaches located south from SinesCape. These beaches, which occur in small bays along from the mainrocky coastline and are locally protected from the offshore waves bynatural headlands, exhibit minor variation in grain size (mediumsand). In this way, and according to the present framework, theadjustment to wave forcing must occur mainly by changing beachfaceslope, as observed in Fig. 4. We can also observe that every beachdecreases its beachface slope with increasing wave height, i.e.becomes more dissipative. Data from these beaches correspond towave heights ranging from 0.25 to 1.0 m. In fact, these beaches aresomehow protected from the offshore wave climate by wavediffraction that occurs in natural headlands, and by the waverefraction induced by the ridge and runnel system developed at thetop of the submerged beach.
4.2.2. Cross-shore sediment transportThe present framework, namely Eq. (20), provides a relationship
between wave height, sand grain size and beachface slope that mightilluminate the dynamics of the beach profile as we will see next.
Butt et al. (2001) pointed out that critical grain size values mightexist below which infiltration/exfiltration promotes offshore trans-port and above which infiltration/exfiltration promotes onshoretransport. Additionally, some authors (e.g. Masselink and Li (2001),Horn (2006, p. 647), Masselink and Puleo (2006, p. 672) concludedthat infiltration enhances onshore transport and berm formation.These results can be easily accommodated in the frameworkdeveloped here. For example, if we consider 0.5 mm as theequilibrium grain size with respect to a definite wave height (seeFigs. 3 and 4), for that wave height we may conclude that sand bedsmade of grains of smaller size will have lower equilibrium beachfaceslopes. Therefore, for constant wave height and for sand grain sizessmaller than 0.5 mm, the respective equilibrium beachface slope islower than that corresponding to sand grains of 0.5 mm. Then, thatreduction in beachface slope indicates that equilibrium is reached
through offshore sediment transport. On the other hand, and again forthe same wave height and for sand beds composed of grain sizeslarger than 0.5 mm the respective equilibrium beachface slope ishigher than that corresponding to sand grains of 0.5 mm, whichindicates onshore sediment transport, mainly composed of grains ofsize bigger than 0.5mm. The sand grain size of 0.5mmwas consideredhere as the reference for the equilibrium grain size for the caseanalysed above, and to our view, it does not represent any universalvalue. A similar analysis might be performed with reference toequilibrium grain sizes corresponding to some particular beach andwave height.
The analysis also allows explaining why in case that the sand bedgrain size spans a broad range, the beachface slope will change to anextent smaller than in the case where it is composed of only onetextural class. As shown, the reasons ground in the extra degree offreedom that is provided by differential sand grain transport, whichallows beachface to reach equilibrium in combination with beachfaceslope variation.
4.2.3. Beachface profile engineeringThe usefulness of the above results for beachface engineering
becomes clear. As an illustration, let us consider point E in Fig. 5 whichrepresents the equilibrium slope (0.16) of a beachfacewith an averagesediment grain size of 1.3 mm, washed by waves of 1 m height. If thewave regime changes to waves of 2 m height, the beachface willevolve in time so as to adjust to the new constraint. This mightcorrespond to the EF process in Fig. 5, duringwhich the same sand bedwould evolve in order to smooth the beachface to the new value of0.06. However, the most common process is of the type EF′ withchanges in the sand bed, so as the dominant sand grain size moves tothe new value of 1.5 mm. However, if the bedrock underneath doesnot allow themobile sand bed to reach such a slope value, all sandwillbe removed to the sea, and therefore, the equilibrium slope will neverbe reached. However, by rendering the sea bottom shallower, the sand
282 A.H. Reis, C. Gama / Geomorphology 114 (2010) 276–283
transported offshore would lead to the development of a submarinesand bar that might induce earlier wave modification, and therefore,smaller uprush height. Then, a new beachfacemight formwith a slopein between E and F (process F′H).
The initial beachface slope may be restored if coarser sediment, ofsize 2.1 mm, is carried onto the shore (process FG in Fig. 5). This newbeach sediment will be in equilibrium with breaking waves of 2 mheight. If it is not possible to change the sediment size, the beachfacewill adjust to waves of 2 m height by changing its slope only (processEF). As seen before, in this case the equilibrium slope will be lowerthan that of process EF′ and of the order of 0.06.
This example illustrates the usefulness of Eqs. (19) and (20) in theanalysis of beachface dynamics. In a certain sense, Fig. 5, is a diagramof the “equilibrium” beachface shapes that will develop as theresponse to changes in sand size and wave height. Also, it opens thepossibility of guiding beachface engineering, namely beachfacereconstruction by feeding it with sand with the appropriate grain size.
5. Conclusions
The Constructal Law provides a useful theoretical basis forunderstanding beachface adjustment as a response to wave swashforcing in the presence of constraints like sand grain size, grainsphericity, and wave height. The Constructal Law, conceived as aprinciple regulating the dynamics of beachface flows, was applied to amodel developed in this paper to account for the swash cycle, and hasidentified a relationship between offshore wave height, beachfaceslope and sediment grain size. This relationship showed that beach-face slope varies with wave height raised to the power 3/4, and sandgrain size raised to the power 4/3. Curves of “equilibrium” beachfaceslopes against grain size, for each wave height, provided a diagramsuitable for data analysis and interpretation.
The diagram, which comprises curves in the range of importantwave heights, turns out to be a useful framework for interpretation offield data collected from beaches of the southwestern coast ofmainland Portugal. Additionally, it throws light on some findingsabout beachface slope in relation to sediment grain size and cross-shore sediment transport, published previously in the literature. It hasalso been shown how beach profile engineering may be guided by thediagram comprising the curves of “equilibrium” beachface slopeagainst grain size, for each wave height.
However, it is important to note that the parameter H describingwave set-up is related to open ocean wave height ((H)0) by therelationships given in Eqs. (11a) and (11b) that carry significantuncertainties. If these relationships are discarded, wave set-up (H)will appear explicitly, and therefore the diagrams of Figs. 3–5 willshow H curves.
The model is amenable to improvement, namely by allowingvariation of porosity with grain diameter. In this case, however,solution of the model equation would only be possible with the helpof numerical analysis. It shows significant potential for understandingbeachface adjustment, and adds credence to the Constructal Law as aregulating principle of structured flow systems.
Acknowledgements
This work has been supported by FCT (Portugal) under thecontract PTDC/EME-MFE/71960/2006. The authors also thank the(unknown) reviewers of this paper for their useful comments andsuggestions.
References
Anthony, E.J., 1998. Sediment-wave parametric characterization of beaches. Journal ofCoastal Research 14, 347–352.
Bagnold, R.A., 1940. Beach formation by waves: some model experiments in a wavetank. Journal of the Institution of Civil Engineers 15, 27–52.
Baldock, T.E., Hughes, M.G., 2006. Field observations of instantaneous water slopes andhorizontal pressure gradients in the swash-zone Continental Shelf Research 26,574–588.
Bascom, W.N., 1951. The relationship between sand-size and beach face slope.Transactions of the American Geophysical Union 32, 866–874.
Bejan, A., 1997. Advanced Engineering Thermodynamics, Chapter 13, second ed. Wiley,New York.
Bejan, A., 2000. Shape and Structure, from Engineering to Nature. Cambridge UniversityPress, Cambridge, UK.
Bejan, A., Lorente, S., 2004. The Constructal Law and the thermodynamics of flowsystems with configuration. International Journal of Heat and Mass Transfer 47,3203–3214.
Bejan, A., Marden, J.H., 2006. Constructing animal locomotion from new thermody-namics theory. American Scientist 4, 342–349.
Bejan, A., Reis, A.H., 2005. Thermodynamic optimization of global circulation andclimate. International Journal of Energy Research 29, 303–316.
Blott, S.J., Pye, K., 2001. Gradistat: a grain size distribution and statistics package for theanalysis of unconsolidated sediments. Technical communication. Earth SurfaceProcesses and Landforms 26, 1237–1248.
Butt, T., Russell, P., 1999. Suspended sediment transport mechanisms in high-energyswash. Marine Geology 161 , 361–375.
Butt, T., Russell, P., Turner, I., 2001. The influence of swash infiltration–exfiltration onbeach face sediment transport: onshore or offshore? Coastal Engineering 42, 35–52.
Costa, M., Silva, R., Vitorino, J., 2001. Contribuição para o estudo do clima de agitaçãomarítima na costa portuguesa (in Portuguese). 2as Jornadas Portuguesas deEngenharia Costeira e Portuária. Associação Internacional de Navegação. Sines.CD-ROM, 20 pp.
Dingler, J.R., Reiss, T.E., 2002. Changes to Monterey Bay beaches from the end of the1982–83 El Niño through the 1997–98 El Niño. Marine Geology 181, 249–263.
Dubois, R.N., 1982. Relation among wave conditions, sediment texture, and rising sealevel: an opinion. Shore Beach 50, 30–32.
Folk, R.L., Ward, W.C., 1957. Brazos River Bar: a study in the significance of grain sizeparameters. Journal of Sedimentary Petrology 27, 2–26.
Gama, C., 2005. Dynamics of Sediment Systems in the Western Coast of Portugal SouthCape Espichel. PhD thesis (in Portuguese), University of Évora, 359 p.
Gourlay, M.R., 1968. Beach and Dune Erosion Tests. Delft Hydraulics Laboratory, Delft,Netherlands. Report M935/M936.
Grant, U.S., 1948. Influence of the water table on beach aggradation and degradation.Journal of Marine Research VII, 655–660.
Guza, R.T., Thornton, E.B., 1981. Wave set-up on a natural beach. Journal of GeophysicalResearch 86, 4133–4137.
Hegge, B.J., Masselink, G., 1991. Groundwater-table responses to wave run-up: anexperimental study fromWestern Australia. Journal of Coastal Research 7, 623–634.
Horn, D.P., 2006. Measurements and modeling of beach groundwater flow in theswash-zone: a review. Continental Shelf Research 26, 622–652.
Hughes, S.A., 2004. Estimation of wave run-up on smooth, impermeable slopes usingthe wave momentum flux parameter. Coastal Engineering 51, 1085–1104.
Hughes, M., Turner, I., 1999. The beachface. In: Short, A.D. (Ed.), Handbook of Beach andShoreface Morphodynamics. Wiley, Chichester, pp. 119–144.
Hughes, M., Masselink, G., Brander, R.W., 1997. Flow velocity and sediment transport inthe swash zone of a steep beach. Marine Geology 138, 91–103.
Jackson, D.W.T., Cooper, J.A.G., del Rio, L., 2005. Geological control of beachmorphodynamic state. Marine Geology 216, 297–314.
Kang, H-Y., Nielsen, P., 1996. Watertable dynamics in coastal areas. Proceedings of the25th International Conference Coastal Engineering. American Society of CivilEngineers, New York, pp. 4601–4612.
Kemp, P.H., 1975. Wave asymmetry in the nearshore zone and breaker area. In: Hails, J.,Carr, A. (Eds.), Nearshore Sediment Dynamics and Sedimentation. Wiley-Interscience, London, pp. 47–67.
Komar, P., 1998. Beach Processes and Sedimentation, 2nd ed. Prentice-Hall, New Jersey,p. 544.
Levoy, F., Anthony, E.J., Monfort, O., Larsonneur, C., 2000. The morphodynamics ofmegatidal beaches in Normandy, France Marine Geology 171, 39–59.
Li, L., Barry, D.A., Pattiaratchi, C.B., Masselink, G., 2002. BeachWin: modellinggroundwater effects on swash sediment transport and beach profile changes.Environmental Modelling and Software 17, 313–320.
Mase, H., 1989. Randomwave run-up height on gentle slope. Journal ofWaterway, Port,Coastal, and Ocean Engineering 5, 649–661.
Masselink, G., Hughes, M.G., 1998. Field investigation of sediment transport in theswash zone. Continental Shelf Research 18, 1179–1199.
Masselink, G., Li, L., 2001. The role of swash infiltration in determining the beachfacegradient: a numerical study. Marine Geology 176, 139–156.
Masselink, G., Pattiaratchi, C.B., 2001. Seasonal changes in beach morphology along thesheltered coastline of Perth, Western Australia. Marine Geology 172, 243–263.
Masselink, G., Puleo, J.A., 2006. Swash-zone morphodynamics. Continental ShelfResearch 26, 661–680.
McLean, R.F., Kirk, 1969. Relationship between grain size, size-sorting and foreshoreslope on mixed sand-shingle beaches. New Zealand Journal of Geology andGeophysics 12, 138–155.
Miguel, A., 2006. Constructal pattern formation in stony corals, bacterial colonies andplant roots under different hydrodynamics conditions. Journal of TheoreticalBiology 242, 954–961.
Nielsen, P., 1999. Groundwater dynamics and salinity in coastal barriers. Journal ofCoastal Research 15, 732–740.
Packwood, A.R., 1983. The influence of beach porosity on wave uprush and backwash.Coastal Engineering 7, 29–40.

283A.H. Reis, C. Gama / Geomorphology 114 (2010) 276–283
Pryor, W.A., 1973. Permeability–porosity patterns and variations in some Holocenesand bodies. Bulletin of the American Association of Petroleum Geologists 57,162–189.
Puleo, J.A., Beach, R.A., Holman, R.A., Allen, J.S., 2000. Swash zone sediment suspensionand transport and the importance of bore-generated turbulence. Journal ofGeophysical Research 105, 17021–17044.
Quick, M.C., 1991. Onshore–offshore sediment transport on beaches. Coastal Engineer-ing 15, 313–332.
Reis, A.H., 2006a. Constructal theory: from engineering to physics, or how flow systemsdevelop shape and structure. Applied Mechanics Reviews 59, 269–282.
Reis, A.H., 2006b. Constructal view of scaling laws of river basins. Geomorphology 78,201–206.
Reis, A.H., Bejan, A., 2006. Constructal theory of global circulation and climate.International Journal of Heat and Mass Transfer 49, 1857–1875.
Reis, A.H., Miguel, A.F., Aydin, M., 2004. Constructal theory of flow architectures of thelungs. Medical Physics 31, 1135–1140.
Selley, R.C., 1988. Applied Sedimentology. Academic Press, London, p. 446.Shepard, F.P., 1963. Submarine Geology, 2nd ed. Harper and Row, New York.Soulsby, R.L., 1991. Dynamics of Marine Sands. Thomas Telford Publ., London, UK, p. 249.Stockdon, R.A., Holman, P.A., Howd, Sallenger Jr., A.H., 2006. Empirical parameterisation
of setup, swash, and run-up. Coastal Engineering 53, 573–588.
Sunamura, T., 1984. Quantitative predictions of beachface slopes. Geological Society ofAmerica Bulletin 95, 242–245.
Turner, I.L., 1993. Water table outcropping onmacro-tidal beaches: a simulation model.Marine Geology 115, 227–238.
Turner, I.L., 1995. Modelling the time-varying extend of groundwater seepage on tidalbeaches. Earth Surface Processes and Landforms 20, 833–843.
Turner, I.L., 1998. Monitoring groundwater dynamics in the littoral zone at seasonal,storm, tide and swash frequencies. Coastal Engineering 35, 1–16.
Turner, I.L., Masselink, G., 1998. Swash infiltration–exfiltration and sediment transport.Journal of Geophysical Research 103, 30813–30825.
Wiegel, R.L., 1964. Oceanographical Engineering. InPrentice-Hall, Englewood Cliffs, N.J.,p. 532.
Wilson, A.M., Huettel, M., Klein, S., 2008. Grain size and depositional environment aspredictors of permeability in coastal marine sands. Estuarine, Coastal and ShelfScience 80, 193–199.
Wright, L.D., Short, A.D., 1984. Morphodynamic variability of surf zones and beaches: asynthesis. Marine Geology 56, 93–118.
Wright, L.D., Short, A.D., Green, M., 1985. Short-term changes in the morphodynamicsstate of beaches and surf zones, an empirical predicative model. Marine Geology 62,339–364.
Copyright © 2022 FDOKUMEN