San Onofre, Units 2 & 3 - Annual Corporate Financial Reports.
229
SOUTHERN CALIFORNIA EDISON' An EDISON INTERNATIONALI Company A. Edward Scherer Manager of Nuclear Regulatory Affairs September 13, 2006 U.S. Nuclear Regulatory Commission Attention: Document Control Desk Washington, D. C. 20555 Subject: Docket Nos. 50-361 and 50-362 Annual Corporate Financial Reports San Onofre Nuclear Generating Station Units 2 and 3 Dear Sir or Madam: In accordance with the requirements of 10 CFR Part 50, Section 50.71(b) enclosed are copies of the annual financial reports for the licensees of the San Onofre Nuclear Generating Station, Units 2 and 3, who do not submit a Form 1 0-Q with the Securities and Exchange Commission or a Form I with the Federal Energy Regulatory Commission, the City of Riverside, California (for the fiscal year ending June 30, 2005); and the City of Anaheim, California (for the fiscal year ending June 30, 2005). Each report includes the appropriate certified financial statement required by Section 50.71(b). If you have any questions or need additional information regarding this matter, please feel free to contact me. Sincerely, Enclosures cc: B. S. Mallett, Regional Administrator, NRC Region IV N. Kalyanam, NRC Project Manager, San Onofre Units 2, and 3 C. C. Osterholtz, NRC Senior Resident Inspector, San Onofre Units 2 and 3 P.O. Box 128 San Clemente, CA 92672 949-368-7501 Fax 949-368-7575 f4o
-
Upload
khangminh22 -
Category
Documents
-
view
1 -
download
0
Transcript of San Onofre, Units 2 & 3 - Annual Corporate Financial Reports.

SOUTHERN CALIFORNIA
EDISON'An EDISON INTERNATIONALI Company
A. Edward SchererManager ofNuclear Regulatory Affairs
September 13, 2006
U.S. Nuclear Regulatory CommissionAttention: Document Control DeskWashington, D. C. 20555
Subject: Docket Nos. 50-361 and 50-362Annual Corporate Financial ReportsSan Onofre Nuclear Generating Station Units 2 and 3
Dear Sir or Madam:
In accordance with the requirements of 10 CFR Part 50, Section 50.71(b) enclosed arecopies of the annual financial reports for the licensees of the San Onofre NuclearGenerating Station, Units 2 and 3, who do not submit a Form 1 0-Q with the Securitiesand Exchange Commission or a Form I with the Federal Energy RegulatoryCommission, the City of Riverside, California (for the fiscal year ending June 30, 2005);and the City of Anaheim, California (for the fiscal year ending June 30, 2005). Eachreport includes the appropriate certified financial statement required by Section50.71(b).
If you have any questions or need additional information regarding this matter, please
feel free to contact me.
Sincerely,
Enclosures
cc: B. S. Mallett, Regional Administrator, NRC Region IVN. Kalyanam, NRC Project Manager, San Onofre Units 2, and 3C. C. Osterholtz, NRC Senior Resident Inspector, San Onofre Units 2 and 3
P.O. Box 128San Clemente, CA 92672949-368-7501Fax 949-368-7575
f4o

CITY OF RIVERSIDE, CALIFORNIACOMPREHENSIVE ANNUAL FINANCIAL REPORTFOR FISCAL YEAR ENDED JUNE 30, 2005
Prepared by the Finance DepartmentPaul C. Sundeen, Chief Financial Officer
3900 Main Street, Riverside, California 92522 (951) 826-5660
This report was printed on recycled stock

I-
11 C-od *.N=mwmmwm
- I I-

CITY OF RIVERSIDECOMPREHENSIVE ANNUAL FINANCIAL REPORT
YEAR ENDED JUNE 30,2005
TABLE OF CONTENTSPage
INTRODUCTORY SECTIONLetter of T ransm ittal .............................................................................................................................. vGFOA Certificate of Achievement ............................................................................................................. xLegislative and City Officials .................................................................................................................. xiO rgan ization C hart ............................................................................................................................... xi
FINANCIAL SECTIONIndependent Auditor's Report .................................................................................................................. 1Management's Discussion and Analysis .................................................................................................... 3Basic Financial Statements:
Government-wide Financial Statements:Statement of Net Assets .............................................................................................................. 19Statement of Activities .............................................................................................................. 20
Fund Financial Statements:Balance Sheet - Governmental Funds ................................................................................................ 21Reconciliation of the Balance Sheet of Governmental Funds to Statement of Net Assets .................................... 22Statement of Revenues, Expenditures and Changes in Fund Balances - Governmental Funds ............................. 23Reconciliation of the Statement of Revenues, Expenditures, and Changes in Fund Balances of Governmental
Funds to the Statement of Activities ........................................................................................... 24Statement of Revenues, Expenditures and Changes in Fund Balances - Budget and Actual - General Fund ............. 25Statement of Net Assets - Proprietary Funds ....................................................................................... 26Statement of Revenues, Expenses and Changes in Fund Net Assets - Proprietary Funds .................................... 28Statement of Cash Flows - Proprietary Funds ..................................................................................... 29Statement of Fiduciary Net Assets - Fiduciary Fund - Agency Fund ........................................................... 31
Notes to Financial Statements ........................................................................................................... 32Combining and Individual Fund Statements and Schedules:
Combining Balance Sheet - Nonmajor Governmental Funds ................................................................... 57Combining Statement of Revenues, Expenditures and Changes in Fund Balances - Nonmajor Governmental
Funds .............................................................................................................................. 60Schedule of Revenues, Expenditures and Changes in Fund Balances - Budget and Actual - Nonmajor
Governmental Funds ............................................................................................................. 63Combining Statement of Net Assets -Nonmajor Enterprise Funds ............................................................ 67Combining Statement of Revenues, Expenses and Changes in Fund Net Assets - Nonmajor Enterprise Funds ........... 69

CITY OF RIVERSIDECOMPREHENSIVE ANNUAL FINANCIAL REPORT
YEAR ENDED JUNE 30,2005
TABLE OF CONTENTSPage
FINANCIAL SECTION (CONTINUED)Combining Statement of Cash Flows - Nonmajor Enterprise Funds ........................................................... 70Combining Statement of Net Assets - Internal Service Funds .................................................................. 73Combining Statement of Revenues, Expenses and Changes in Fund Net Assets - Internal Service Funds ................ 74Combining Statement of Cash Flows - Internal Service Funds .................................................................. 75Combining Statement of Changes in Assets and Liabilities - Fiduciary Fund ................................................ 77Capital Assets Used in the Operation of Governmental Funds:
Schedule by Source .............................................................................................................. 79Schedule by Function and Activity ............................................................................................ 80Schedule of Changes by Function and Activity .............................................................................. 81
STATISTICAL SECTIONTable1 General Governmental Expenditures by Function - Last Ten Fiscal Years ................................................... 832 General Governmental Revenues by Source - Last Ten Fiscal Years .......................................................... 843 General Governmental Tax Revenues by Source - Last Ten Fiscal Years ..................................................... 854 Property Tax Levies and Collections - Last Ten Fiscal Years ................................................................... 865 Assessed and Estimated Actual Value of Taxable Property - Last Ten Fiscal Years ......................................... 876 Property Tax Rates - Direct and Overlapping Governments - Last Ten Fiscal Years ........................................ 887 Computation of Direct and Overlapping General Obligation Debt ............................................................ 898 Computation of Legal Debt Margin for City General Obligation Bonds ....................................................... 909 Ratio of Net General Obligation Bonded Debt to Assessed Value and Bonded Debt per Capita - Last Ten Fiscal
Y ears ................................................................................................................................. 9110 Ratio of Annual Debt Service Expenditures for General Obligation Bonded Debt to Total General Governmental
Expenditures - Last Ten Fiscal Years .......................................................................................... 9211 Revenue Bond Coverage - Last Ten Fiscal Years ................................................................................. 9312 Special Assessment Collections - Last Ten Fiscal Years ......................................................................... 9413 Principal Taxpayers ................................................................................................................... 9514 Miscellaneous Statistical Data ....................................................................................................... 9615 Demographic Statistics - Last Ten Fiscal Years .................................................................................... 9816 Construction, Bank Deposits, and Property Value - Last Ten Fiscal Years ................................................... 99

CITY O
September 30, 2005
To the Honorable Mayor, Members of the City Council and Citizens of the City of Riverside:
It is our pleasure to submit the Comprehensive Annual Financial Report (CAFR) of the City of Riverside (the City) for the fiscal yearended June 30, 2005.
This report consists of management's representations concerning the finances of the City. Consequently, management assumes fullresponsibility for the completeness and reliability of all of the information presented in this report. To provide a reasonable basis formaking these representations, management has established a comprehensive internal control framework that is designed both toprotect the City's assets from loss, theft, or misuse and to compile sufficient reliable information for the preparation of the City'sfinancial statements in conformity with accounting principles generally accepted in the United States of America. Because the cost ofinternal controls should not outweigh their benefits, internal controls have been designed to provide reasonable rather than absoluteassurance that the financial statements will be free from material misstatement. As management, we assert that, to the best of ourknowledge and belief, this financial report is complete and reliable in all material respects.
The City's financial statements have been audited by McGladrey & Pullen, LLP, a firm of certified public accountants. Theindependent auditor concluded, based on the audit, that there was a reasonable basis for rendering an unqualified opinion on the City'sfinancial statements for the fiscal year ended June 30, 2005. The independent auditor's report is presented as the first component ofthe financial section of this CAFR.
The independent audit of the financial statements of the City was part of a broader, federally mandated "Single Audit" designed tomeet the special needs of federal grantor agencies. The standards governing Single Audit engagements require the independentauditor to report not only on the fair presentation of the financial statements, but also on internal controls and compliance with legalrequirements, with emphasis on those involving the administration of federal awards. These reports are available in the City'sseparately issued Single Audit Report.
V

Management has provided an overall analysis of the financial statements in the form of Management's Discussion and Analysis(MD&A). This letter of transmittal is designed to complement MD&A and should be read in conjunction with it. The City's MD&Acan be found immediately following the report of the independent auditors.
Profile of the City of Riverside
The City of Riverside, incorporated on October 11, 1883, is located in the western portion of Riverside County about 60 miles east ofLos Angeles. The City currently occupies a land area of 85.6 square miles.
The City operates under the council-manager form of government, with a seven-member council elected by ward for four-yearoverlapping terms. The mayor is elected at large for a four-year term and is the presiding officer of the Council, but does not have avote except in the case of a tie. The City Council is responsible, among other things, for passing ordinances, adopting the budget,appointing committees, and hiring the City Manager, City Attorney and City Clerk. The City Manager is responsible for carrying outthe policies and ordinances of the Council, for overseeing the day-to-day operations of the City, and for appointing the heads ofvarious departments. The Council is elected on a non-partisan basis.
The City provides a full range of services which include general government, public safety (police, fire, disaster preparedness andbuilding inspection), construction and maintenance of highways and streets, economic development, culture and recreation, electric,water, airport, refuse, sewer, and senior citizen/handicap transportation. In addition to general City activities, the Council isfinancially accountable for the Riverside Redevelopment Agency, Riverside Public Financing Authority and the Riverside MunicipalImprovements Corporation; therefore, these entities are included as an integral part of the City's financial statements. Additionalinformation on these legally separate entities can be found in Note 1.A in the notes to the financial statements.
The annual budget serves as the foundation for the City's financial planning and control. The City Manager presents the proposedbudget to the City Council for review at least thirty-five calendar days prior to the beginning of each fiscal year. The Council isrequired to hold public hearings on the proposed budget and to adopt a final budget no later than June 30, which is the close of theCity's fiscal year. The appropriated budget is prepared by fund and department. Department heads may make transfers ofappropriations within a department. Transfers of appropriations between departments, however, require the approval of the Council.Budget-to-actual comparisons are provided in this report for each individual governmental fund for which an appropriated annualbudget has been adopted. For the general fund, this comparison is presented on page 25 as part of the basic financial statements for thegovernmental funds. For governmental funds other than the general fund, with appropriated annual budgets, this comparison ispresented in the governmental fund subsection of this report, which begins on page 63.
vi

Local economy. The City is located in the Inland Empire, which consists of Riverside and San Bernardino Counties. The populationof the Inland Empire at 3.66 million people is larger than 21 states. The City leads the Inland Empire in most measures of economicpower, including population, income, employment, bank deposits, assessed valuations, office space and college enrollment. Thepopulation of the City is 285,537, which places the City as the seventh largest in Southern California behind the City of Bakersfield.
The Inland Empire has a very strong economic environment, as does the City. This area is expected to add about 30,000 jobs duringcalendar year 2005. The City owned electric utility gives it a competitive advantage at this time when energy costs and reliability areissues. Riverside's challenges include a lack of available space for manufacturing and industrial development within its currentboundaries.
America's Most Livable Communities Award was conferred upon the City of Riverside in 2004. This award is conferred once eachdecade to those communities whose innovations have brought vitality and growth to their regions, a marked improvement in thequality of life, and are taking major strides to prepare for the new global economy.
Grubb and Ellis, a national real estate broker, ranked the Riverside metro area as one of the top five in all four national markets (retail,office, industrial and apartment) in their 2003 Global Forecast: U.S. Market Strength Forecast 2002-2007.
Priorities for the future: A Citywide Strategic Planning document has been developed through a series of meetings, workshops, andsurveys with the community, elected officials, and City employees. The plan, as updated, sets forth four goals as follows:
* Economic Development" Growth and Annexation* Transportation• Liveable Communities and Neighborhoods
Long-term financial planning. Annually, the City updates a six (6) year capital improvement program; planned capital expendituresduring fiscal years 2004/2005 through 2009/2010 (except for the Park and Recreation Department which only plans projects as fundsbecome available) total $402 million, a 6% decrease over the prior 6 year plan. Electric, Water and Sewer fund projects make up 63%of the $402 million, while transportation-related projects (traffic signal and streets) comprise 19 percent. Major inputs to the CIPinclude a new power generation plant (the second for the City), the major and minor street rehabilitation and construction program,recurring and system improvements to the electric program, water and main replacements, sewer plant primary system upgrade, andAgricultural Park cleanup.
Vii

Cash management policies and practices. Cash temporarily idle during the year was invested principally in federal agencysecurities and the State of California Local Agency Investment Fund. The maturities of the investments do not exceed five (5) years,with the average maturity not exceeding three (3) years. All securities are held in third party safekeeping by Union Bank of Californiaas agent for the City. The money market sweep account is held by Bank of America. All transactions originated and authorized bythe City are transacted on a delivery versus payment (DVP) basis in order to perfect delivery. The average yield on the investmentswas 2.77% for the fiscal year.
Risk management. Risk exposures to the assets of the City are managed through a combination of self-insured retention andinsurance coverage. The City believes they have current assets adequate to cover the actuarially determined liability for generalliability and workers' compensation claims, including estimated claims incurred but not reported. The City maintains excess liabilityinsurance to provide coverage beyond a self-insured retention of $3,000,000 per occurrence for general liability and $4,000,000 forworkers' compensation.
Pension benefits. The City provides pension benefits for all employees through a statewide plan managed by the California PublicEmployees Retirement System (CalPERS). The City has no obligation in connection with employee benefits offered through this planbeyond its annual contractual payment to CalPERS. Additional information on the plan can be found in Note 13 in the notes to thefinancial statements.
Awards and Acknowledgements
The Government Finance Officers Association (GFOA) awarded a Certificate of Achievement for Excellence in Financial Reportingto the City of Riverside for its comprehensive annual financial report (CAFR) for the fiscal year ended June 30, 2004. This was theeighteenth consecutive year that the City has received this prestigious award. The City received this award for publishing an easilyreadable and efficiently organized CAFR that satisfied both GAAP and applicable legal requirements.
This award is valid for a period of one year only. We believe that our current CAFR continues to meet the Program's requirements andwe are submitting it to the GFOA again this year.
The preparation of this report would not have been possible without the efficient and dedicated services of the entire staff of theFinance Department, particularly the leadership of Brent Mason, Assistant Finance Director and Laura Nomura, Controller. We wouldlike to express our appreciation to all members of the Department who assisted and contributed to its preparation. Credit also must begiven to the Mayor and the City Council for their unfailing support for maintaining the highest standards of professionalism in themanagement of the City's finances.
viii

Respectfully submitted,
City ManagerPaul C. SundeenAssistant City Manager/CFO/Treasurer
ix

Certificate ofAchievementfor Excellence
in FinancialReporting
Presented to
City of Riverside,California
The Government Finance Officers Association of the United States
and Canada (GFOA) awarded a Certificate of Achievement for
Excellence in Financial Reporting to the City of Riverside for our
Comprehensive Annual Financial Report for the fiscal year ended
June 30, 2004.
For its Comprehensive AnnualFinancial Report
for the Fiscal Year EndedJune 30, 2004
A Certificate of Achievement for Excellence in FinancialReporting is presented by the Government Finance Officers
Association of the United States and Canada togovernment units and public employee retirementsystems whose comprehensive annual financial
reports (CAFRs) achieve the higheststandards in government accounting
and financial reporting.
In order to be awarded a Certificate of Achievement, a governmental
unit must publish an easily readable and efficiently organized
Comprehensive Annual Financial Report, whose contents conform to
program standards. Such reports must satisfy both generally
accepted accounting principles and applicable legal requirements.
A Certificate of Achievement is valid for a period of one year only.
We believe our current report continues to conform to Certificate of
Achievement Program requirements, and we are submitting it to
GFOA to determine its eligibility for another certificate.
a'-
7 Pre siden
President
Executive Director
x

ORGANIZATION CHART LEGISLATIVE OFFICIALS
city Council&Mo mew
I City Clerk I-
Ronald 0. Loverldge ............................................. MayorDoa Betro ................................ Councilmember-Ward iAmeal Moore ............................ Councilmember- Ward 2Art Gage ................................... Councilmember - Ward 3Frank Schiavone ........... Councilmember - Ward 4Ed Adkison ............................... Councilmember - Ward 5Nancy Hart ............................... Councilmember- Ward 6Steve Adams ............................. Councilmember - Ward 7
CITY OFFICIALS
Bradley J. Hudson ................................... City Manager*Michael Beck ............................... Assistant City ManagerTom DeSantis .............................. Assistant City ManagerPaul C. Sundeen ................... Assistant City Manager/CFO
Colleen J. Nicol .............................................. City Clerk*Gregory P. Priamos .................................... City Attorney*Tom Boyd ................................................. City EngineerRuss Leach .............................................. Chief of PoliceSteve Reneker ........................... Chief Information OfficerScott Barber ................. Community Development DirectorBelinda Graham ............................. Development DirectorTedd Laycock .................................................. Fire ChiefKris Martinez ................. Interim General Services DirectorRhonda Strout ............ Interim Human Resources DirectorJudith Auth ............................................. Library DirectorVince Moses .......................................... Museum DirectorRalph Nuflez ......................... Park and Recreation DirectorDavid Wright ................................ Public Utilities DirectorSiobhan Foster ................... Interim Public Works Director
*Appointed by City Council
Note: All department heads officially report to the City Manager
xi

II II -
-0

McGladrey& PullenCertified PRubi Accountants
Independent Auditor's Report
The Honorable Mayor and Membersof the City Council
City of RiversideRiverside, California
We have audited the accompanying financial statements of the governmental activities, the business-type activities, each major fund and the aggregate remainingfund information of the City of Riverside, California, (the City) as of and for the year ended June 30, 2005, which collectively comprise the City's basic financialstatements, as listed in the table of contents. These financial statements are the responsibility of the City's management. Our responsibility is to express opinionson these financial statements based on our audit
We conducted our audit in accordance with auditing standards generally accepted in the United States of America and the standards applicable to financial auditscontained in Government Auditing Standards, issued by the Comptroller General of the United States. Those standards require that we plan and perform the auditto obtain reasonable assurance about whether the financial statements are free of material misstatement. An audit includes examining, on a test basis, evidencesupporting the amounts and disclosures in the financial statements. An audit also includes assessing the accounting principles used and significant estimatesmade by management, as well as evaluating the overall financial statement presentation. We believe that our audit provides a reasonable basis for our opinions.
In our opinion, the financial statements referred to above present fairly, in all material respects, the respective financial position of the governmental activities, thebusiness-type activities, each major fund and the aggregate remaining fund information of the City of Riverside, California, as of June 30, 2005, and the respectivechanges in financial position and cash flows, where applicable, thereof and the respective budgetary comparison for the general fund for the year then ended, inconformity with accounting principles generally accepted in the United States of America.
In accordance with Government Auditing Standards, we have also issued our report dated September 30, 2005 on our consideration of the City's internal controlover financial reporting and our tests of its compliance with certain provisions of laws, regulations, contracts, grant agreements and other matters. The purpose ofthat report is to describe the scope of our testing of internal control over financial reporting and compliance and the results of that testing, and not to provide anopinion on the internal control over financial reporting or on compliance. That report is an integral part of an audit performed in accordance with GovernmentAuditing Standards and should be considered in assessing the results of our audit.
The Management's Discussion and Analysis, as listed in the table of contents, is not a required part of the basic financial statements but is supplementaryinformation required by accounting principles generally accepted in the United States of America. We have applied certain limited procedures, which consistedprincipally of inquiries of management regarding the methods of measurement and presentation of the required supplementary information. However, we did notaudit the information and express no opinion on it.
McGladrey & Pulen, LLP Is a member firm ofRSM Intemadonal,an affilation of separate and Independent legal entities.
1

Our audit was conducted for the purpose of forming opinions on the financial statements that collectively comprise the City's basic financial statements. Thecombining and individual nonmajor fund financial statements and other schedules, listed in the table of contents as supplementary information, are presented forpurposes of additional analysis and are not a required part of the basic financial statements. Such information has been subjected to the auditing proceduresapplied in the audit of the basic financial statements and, in our opinion, is fairly stated in all material respects in relation to the basic financial statements taken asa whole.
The accompanying introductory and statistical sections, as listed in the table of contents, are presented for the purpose of additional analysis and are not arequired part of the basic financial statements. This information has not been subjected to the auditing procedures applied In the audit of the basic financialstatements and, accordingly, we express no opinion on it.
Riverside, CaliforniaSeptember 30, 2005
2

Management's Discussion and Analysis
As management of the City of Riverside (the City), we offer this narrative overview and analysis of financial activities for the fiscalyear ended June 30, 2005. We encourage readers to consider the information presented here in conjunction with additional informationfurnished in our letter of transmittal, which can be found on page v. of this report. All amounts, unless otherwise indicated, areexpressed in thousands of dollars.
Overview of the Financial Statements
This discussion and analysis are intended to serve as an introduction to the City's basic financial statements, compromised of threecomponents: 1) government-wide financial statements, 2) fund financial statements, and 3) notes to the financial statements. Thisreport also contains certain supplementary information.
Government-wide financial statements. The government-wide financial statements are designed to provide readers with a broadoverview of the City's finances, in a manner similar to a private-sector business.
The statement of net assets presents information on all of the City's assets and liabilities, with the excess of assets over liabilitiesreported as net assets. Over time, increases or decreases in the net assets may serve as a useful indicator of whether the financialposition of the City is improving or deteriorating.
The statement of activities presents information showing how the City's net assets changed during the most recent fiscal year. Allchanges in net assets are reported as soon as the underlying event giving rise to the change occurs, regardless of the timing of relatedcash flows. Thus, revenues and expenses are reported in this statement for some items that will only result in cash flows in futurefiscal periods (e.g., uncollected taxes and earned but unused vacation leave).
The government-wide financial statements distinguish functions of the City that are principally supported by taxes andintergovernmental revenues (governmental activities) from other functions that are intended to recover all or a significant portion oftheir costs through user fees and charges (business type activities). The governmental activities of the City include generalgovernment, public safety, highways and streets, and culture and recreation. The business type activities of the City include Electric,Water, Sewer, Refuse, Public Parking, Airport and Transportation services.
3

The government-wide financial statements include the City and it's component units. The City's component units are the RiversideRedevelopment Agency, Riverside Public Financing Authority, and the Riverside Municipal Improvements Corporation. Althoughlegally separate, these entities function for all practical purposes as departments of the City and therefore have been blended as part ofthe primary government.
Both the Governmental Activities and the Business Type Activities are presented on the accrual basis of accounting, a basis ofaccounting that differs from the modified accrual basis of accounting used in presenting governmental fund financial statements. Note1.C. of the Notes to the Basic Financial Statements fully describe these bases of accounting. Proprietary funds, discussed below, alsofollow the accrual basis of accounting.
The government-wide financial statements can be found on pages 19-20 of this report.
Fund financial statements. A fund is a grouping of related accounts that is used to maintain control over resources that have beensegregated for specific activities or objectives. The City, like other state and local governments, uses fund accounting to ensure anddemonstrate compliance with finance-related legal requirements. All of the funds of the City can be divided into three categories:governmental, proprietary, and fiduciary.
Governmental funds. Governmental funds are used to account for the same functions reported as governmental activities in thegovernment-wide financial statements. However, unlike the government-wide financial statements, governmental fund financialstatements focus on near-term inflows and outflows of spendable resources as well as on balances of spendable resources available atthe end of the fiscal year.
It is useful to compare the information presented for governmental funds with similar information presented for governmentalactivities in the government-wide financial statements. Reconciliations to facilitate this comparison are provided for both thegovernmental fund balance sheet and the governmental fund statement of revenues, expenditures, and changes in fund balances. Themajor reconciling items relate to capital assets and debt. In the Governmental Funds, acquisitions of capital assets are treated as"expenditures" because upon purchase of a capital asset, cash used for the acquisition is no longer available for other purposes. Theissuance of debt provides cash, which is now available for specified purposes. Accordingly, at the end of the fiscal year, theunreserved fund balances of the Governmental Funds reflect spendable resources available for appropriation by the City Council.Spendable balances are not presented on the face of the government-wide financial statements.
The City maintains seventeen individual governmental funds. Information is presented separately in the governmental fund balancesheet and in the governmental fund statement of revenues, expenditures, and changes in fund balances for the General Fund and theRedevelopment Agency Debt Service Fund, both of which are major funds. Data from the other fifteen governmental funds are
4

combined into a single, aggregated presentation. Individual fund data for each of these non-major governmental funds is provided inthe form of combining statements and can be found on pages 57-66 in this report.
The City adopts an annual appropriated budget for its General Fund. A budgetary comparison statement has been provided todemonstrate compliance with this budget.
The basic financial statements can be found on pages 19-55 of this report.
Proprietary funds. The City maintains two different types of proprietary funds, enterprise and internal service funds. Enterprise fundsare used to report the same functions presented as business type activities in the government-wide financial statements. The City usesenterprise funds to account for Electric, Water, Sewer, Refuse, Parking, Airport and Transportation services. Internal service funds arean accounting device used to accumulate and allocate costs internally among the City's various functions. The City uses internalservice funds to account for self-insured insurance programs, central stores and its fleet of vehicles. Because these servicespredominantly benefit governmental rather than business type functions, they have been included within governmental activities in thegovernuent-wide financial statements. Internal service funds are presented as proprietary funds because both enterprise and internalservice funds follow the accrual basis of accounting.
Proprietary funds provide the same type of information as the government-wide financial statements (business type activities), only inmore detail. The proprietary fund financial statements provide separate information for the Electric, Water and Sewer operations, allof which are considered to be major funds of the City. The four remaining proprietary funds noted above are combined into a single,aggregated presentation. All internal service funds are also combined into a single, aggregated presentation in the proprietary fundfinancial statements. Individual fund data for the non-major proprietary funds and the internal service funds is provided in the form ofcombining statements and can be found on pages 67-71 in this report.
The basic proprietary fund financial statements can be found on pages 26-30 of this report.
Agency funds. Agency funds are used to account for situations where the City's role is purely custodial. Agency funds are notreflected in the government-wide financial statement because the resources of those funds are not available to support the City's ownprograms. All assets reported in Agency funds are offset by a liability; the accrual basis of accounting is used to recognize receivablesand payables.
The Agency fund financial statement can be found on page 31 of this report.
Notes to the financial statements. The notes provide additional information that is essential to a full understanding of the dataprovided in the government-wide and fund financial statements. The notes to the financial statements begin on page 32 of this report.
5

Government-wide Financial Analysis
The following table presents a summarization of the City's assets, liabilities and net assets for its governmental and business typeactivities. As noted earlier, a government's net asset position may serve over time as a useful indicator of its fimancial position.
Governmental Business typeActivities Activities Total
2005 2004 2005 2004 2005 2004Current and other assets $571,535 $483,015 $ 396,346 $453,186 $ 967,881 $ 936,201Capital assets, net 543,970 507.243 809,277 693,448 1,353.247 1.200.691
Total assets 1,115,505 990,258 1,205.623 1.146.634 2,321.128 2.136.892
Current liabilities 72,940 60,284 87,797 85,075 160,737 145,359Long-term liabilities 418,673 349.417 431,447 453,514 850,120 802,931
Total liabilities 491,613 409,701 5 538.589 1,010,857 948,290
Net assets:Invested in capital assets,
net of related debt 515,354 484,784 402,377 341,041 917,731 825,825Restricted 154,957 137,126 54,540 49,242 209,497 186,368Unrestricted (46.419) 41353• 229,462 217.762 183.043 176,409
Total net assets S623.822 $580.557 S6§.32 60.02 $1,188.602
The City's assets exceeded liabilities by $1,310,271 at June 30, 2005, an increase of $121,669 from June 30, 2004.
By far the largest portion of the City's net assets (70 percent) reflects its investment in capital assets (i.e., land, buildings, machinery,equipment and infrastructure), net of any related debt that is still outstanding used to acquire those assets and net of unspent bondproceeds and cash held in bond reserve accounts. The City uses these capital assets to provide services to citizens; consequently, theseassets are not available for future spending.
An additional portion of the City's net assets (16 percent) represents resources that are subject to external restrictions on how theymay be used. The remaining unrestricted net assets (14 percent) may be used to meet the government's ongoing obligations to citizensand creditors. Of this amount, $229,462 is held by the business type activities; the governmental activities reflect a negative $46,419.The Riverside Redevelopment Agency (the Agency), a blended component unit of the City, represents $116,932 of negative
6

unrestricted net assets for 2005 and was a negative $108,865 in the prior year. The remaining governmental activities of the City havepositive unrestricted net assets of $70,513 in 2005 and $67,512 in 2004, mostly attributable to the City's General Fund.
The Agency exists to finance improvements that serve to remediate blight within the City. Often these activities do not result in aresidual asset, but rather underwrite the cost of a development activity deemed beneficial in meeting the Agency's objectives. Theresulting statement of net assets reflects the debt obligation to be repaid through future tax revenues, without an offsetting asset.While this is the routine functioning of such an entity, when blended with the City, its negative unrestricted net assets causes thegovernmental activities to report a negative position.
The government's total net assets increased by $121,669 during the current fiscal year, which reflects the growth in both thegovernmental ($43,335) and business type ($78,334) activities. This is primarily due to continued investment by the City in itsinfrastructure, which is largely funded by grants and dedicated revenue sources. Lastly, business type unrestricted assets grew basedon municipal service charges for service exceeding the current years operating expenditures.
The following condensed summary of activities of the City's governmental and business type operations for the period ended June 30,2005 shows total net assets increasing by $121,669. The prior fiscal year is also presented for comparative purposes. Also included inthe following analysis are revenue and expense graphs to aid the reader in their understanding of the results of the current year'sactivities.
7

Governmental Business TypeActivities Activities Total
2005 2004 2005 2004 2005 2004Revenues:
Program Revenues:Charges for services $ 63,087 $ 57,001 $327,032 $304,911 $ 390,119 $ 361,912Operating Grants and Contributions 16,140 12,935 2,261 1,723 18,401 14,658Capital Grants and Contributions 5,292 1,136 32,317 26,390 37,609 27,526
General Revenues:Sales taxes 53,348 46,624 - 53,348 46,624Property taxes 61,553 39,211 - 61,553 39,211Other taxes and fees 32,237 41,364 - 32,237 41,364Grants and contributions not
restricted to specific programs 15,220 18,710 - 15,220 18,710Other 13,571 6,760 14,910 9,569 28,481 16,329
Total revenues 260,448 223,741 376,520 342,593 636.968 566,334
Expenses:General government 69,520 63,000 - 69,520 63,000Public safety 105,131 102,500 105,131 102,500Highways and streets 17,983 22,017 17,983 22,017Culture and recreation 23,512 22,988 23,512 22,988Interest on long-term debt 15,885 10,996 - 15,885 10,996Electric - 200,030 196,727 200,030 196,727Water - 36,709 33,921 36,709 33,921Sewer - 26,108 23,273 26,108 23,273Refuse - 12,841 11,510 12,841 11,510Airport - 1,185 1,088 1,185 1,088Transportation - 2,557 2,286 2,557 2,286Public Parking - - 824 1.389 824 1,389
Total expenses 232,031 221,501 280,254 270,194 512.285 491,695Increase in net assets beforeSpecial item and Transfers 28,417 2,240 96,266 72,399 124,683 74,639Special item - canal abandonment - (3,014) - (3,014)
Transfers 14,918 10.302 (14.918) (10.302_ -Increase in net assets 43,335 12,542 78,334 62,097 121,669 74,639Net assets - beginning 580.557 568.015 608.045 545.948 1.188.602 1.113.963
Net assets - ending 62390 $686.379 6i0
8

Governmental activities. Governmental activities increased the City's net assets by $43,335, accounting for 36 percent of the totalgrowth in net assets. The net assets in the prior fiscal year increased by $12,542. Key elements of this year's activity in relation to theprior year are as follows:
* Charges for services increased by approximately $6,000 primarily as a result of increased revenues from building and related feesfrom new development within the City.
" Operating and capital grants and contributions increased approximately $7,400 in 2005 primarily due to increased grant fundingfor capital projects, public safety items, and housing projects.
" Sales and property taxes increased approximately $29,000 in 2005, principally because of the strong local economy and theexpansion of redevelopment project areas and activities, plus the reclassification of vehicle licenses fees, as described below.
* Other taxes and fees decreased about $9,000 because the majority of vehicle license fee revenue is now received in the form ofproperty taxes.
" Other revenues increased approximately $6,800 mainly due to an increase in investment income resulting from an unrealizedmarket value adjustment required for financial statement reporting purposes.
" While significant variances between years exist for the various expense functions, the total net increase was approximately $11million. The more significant items are: (1) increased salaries and benefits, coupled with costs associated with substantialtechnological improvements and increased training for police officers; (2) increased interest expense arising from the issuance of$75,400 of new debt (net of debt refinancing and bond premiums) during 2005; and (3) increased costs associated with capitalprojects and development activities. These increases are partially offset by a decrease in depreciation expense in the current yearin the highways and streets category due to an adjustment in fiscal year 2004 associated with a new accounting pronouncement.
" Transfers to governmental funds increased $4,616 primarily due to increased operating revenue realized by the Electric and Waterfunds (transfers are a percentage of gross revenues, as defined).
9

Expenses and Programs Revenues - Governmental Activities - Fiscal Year Comparison 2005 vs. 2004
$120,000
$100,000
$80,000
$60,000
$40,000
$20,000
$0General Public safety Highways and Culture and Interest on
government streets recreation long-term debt
10

Revenues by Source - Governmental Activities - Fiscal Year Comparison
2005 2004
Operating grants andcontributions
6%
Capital grants andcontributions
2%Operating giants and
contribuio6% n
Capital grants andcontributions
1%
Property taxesK 16%Charges for services
24%Property taxes
24% Charges for services26%
Grants andcontributions not
restricted to specificprograms
6%
Miscellaneousj -Investment incomeIIvsm3% mcm Utility Franchis
-J users taxes Francies
Intergovernmental, Prue rs 2%
unrestricted 1%
1%
Grants and contributions notrestricted to specific programs
8%
Miscellaneous
2%%Investment incomeI% lntewo•a % _Other
unresricted 1%6%
es taxes21%
Franchise taxesI 2SUtility users taxes
10%/0
11

Business type activities. Business type activities increased the City's net assets by $78,334, accounting for 65 percent of the totalgrowth in net assets. The change in net assets of business type activities increased from the prior fiscal period by $16,237. Keyelements of this year's increase in relation to the prior year are as follows:
" In 2005, charges for services increased $22,121 to $327,032 from $304,911 in 2004 primarily due to an increase in the volume ofelectric and water sales, in conjunction with a 2.2% electric rate increase and an 8.5% water rate increase.
* Capital grants and contributions increased $5,927 in the current year to $32,317 from $26,390 in the prior year. The increase ismainly due to contributions in aid related to a CALTRANS project.
" Other general revenues increased due to an increase in investment income due to an unrealized market value adjustment requiredfor financial statement reporting purposes and the sale of surplus land.
" Although operating revenues in the Water fund increased, capital grants and contributions decreased, leading to an overalldecrease in program revenues in this fund.
" The total net increase in expenses in Business type activities was approximately $10 million. Significant items include: increasesin personnel and public benefits expenses in the Electric fund; increased maintenance and repair of the City's water mains, and;increased personnel and operational costs associated with the Sewer and Refuse funds.
Expenses and Program Revenues - Business Type Activities - Fiscal Year Comparison 2005 vs. 2004
$275,000 S16,000
S250,000- $15,0000'05 Expenses S14,000
S225,000 - '04 Expenes $13,000 AO0 Expenses
S ,.P r m v sS12,000 M'04 Expenses$200,000 Program revenues $11,000 '06 Program revenues
S175,000- 12'04 Program revenus $101,000 I 1'04 Program revenues
$150,000 - S9,000
$125,000- $7,000'
$100,00 $60000
$7$5,000 iii: i, ', $4,000 • ;
$50,000 0•$3,000
$25,00 $2,00$1,9000$
Soltri 1ater A cwer Retua -i4r rasotdo aElectric Water Sewer 12 Refuse Airport Treasportation P~arig

Revenues by Source - Business Type Activities - Fiscal Year Comparison
2005 2004
Operating grants andcontributions
1%
Capital grants andcontributions
90/0
Operating grants andcontributions
1%
Charges for service87%
kInvestment IncomeMiscell ous1%
Charges for services890/0
Capital grants andcontributions
8%
Investmnt income1%
-Misc~ellaneousIV1%
13

Financial Analysis of the City's Funds
Governmental funds. The focus of the City's governmental funds is to provide information on near-term inflows, outflows, andbalances of spendable resources. Such information is useful in assessing the City's financing requirements. In particular, unreservedfund balance may serve as a useful measure of a government's net resources available for spending at the end of the fiscal year.
The following table sunmarizes the balance sheet of the City's General Fund, Redevelopment Debt Service Fund, and TotalGovernmental Funds. As noted earlier, the City uses fund accounting to ensure and demonstrate compliance with finance related legalrequirements.
General Fund2005 2004
S 55.849 S 58,151
Total assets
Total liabilities
RedevelopmentDebt Service
2005 2004
S27,61 $28.139
13,499 11,517
13,499 11,517122" ~ a
Total GovernmentalFunds
2005 2004
S!26.757 S117,833
Fund balancesReservedUnreservedTotal
Total liabilities and fund balances
44,487
153,753S209,602
17,268117,259134.527
S 19Z67
92,164223,487315,651i42.A08
52,445227,160279,605
L3ULM3
As of the end of the current fiscal year, the City's governmental funds reported combined ending fund balances of $315,651, anincrease of $36,046 in comparison with the prior year. About 29% of this amount ($92,164) is reserved to indicate funds are notavailable for new spending because it has already been committed for a variety of restricted purposes. The remainder of the fundbalance is unreserved, meaning it is available for spending at the City's discretion. Of that amount, $184,348 has been designated forspecific capital projects and economic contingencies, leaving $39,139 without a commitment; at June 30, 2004 the comparable amountwas $40,728. The decrease in uncommitted, unreserved fund balance is due principally to an increase in the amount designated forspecific capital projects.
The General Fund is the principal operating fund of the City. At the end of the current fiscal year, the unreserved fund balance was$109,266, of which $92,993 was designated for future operations, economic contingencies and liability insurance, leaving $16,273unreserved and undesignated; at June 30, 2004 the comparable number was $15,693. The General Fund realized higher than
14

anticipated taxes and permit fees due to continued significant development within the City, which resulted in the General Fund nothaving an operating deficit, exclusive of capital expenditures, as originally anticipated. The total fund balance reached $153,753, anincrease of $19,226 over the prior year.
The Redevelopment debt service fund has a total fund balance of $13,499, all of which is reserved for the payment of debt service. Anet increase in the fund balance occurred during the current year ($1,982) mainly due to the issuance of new bonds.
Proprietary funds. The City's proprietary funds provide the same type of information found in the government-wide financialstatements, but in more detail.
Unrestricted net assets of the Electric, Water and Sewer operations at the end of the year amounted to $118,880, $15,870, and$69,795, respectively. The total growth in net assets for these funds was $57,454, $5,141 and $3,478, respectively, demonstrating theadequacy of the current rate structure for these funds.
General Fund Budgetary Highlights
Final budgeted revenues increased from the amount originally budgeted to the final as a result of grant related programs.
Total budgeted expenditures increased from $238,648 to $270,370 or $31,722. The increases can be generally summarized as follows:
o The General Services department added appropriations of $4,900 for construction of the Magnolia Street Police Precinct and otherCity-wide capital improvement projects.
o The Police department added appropriations of $13,000 primarily for grant funded operational charges as well as negotiated salaryand benefit increases.
o The Fire department added appropriations of $5,400 primarily for grant funded operational charges as well as negotiated salaryand benefit increases.
u The Park and Recreation department added appropriations of $3,900 primarily for grant funded improvement projects.
o Other miscellaneous appropriations were added in other departments throughout the year of approximately $4,500.
15

Actual amounts differed from those budgeted as follows:
o Actual total revenues were more than the amount budgeted principally as a result of greater than anticipated development activityand sales and property taxes associated therewith.
u Budgeted expenditures exceeded actual amounts by $78,000. As in prior years, the principal reason is associated with capitalprojects not completed at year-end. Such projects and related amounts are continued to the next fiscal year.
u Other financing sources (uses) exceeded the final amount budgeted by $54,232. The major event causing this variance is theissuance of $60 million of pension obligation bonds to fund the unfunded actuarial accrued liability (UAAL) associated with theCity's miscellaneous employees.
o The net effect of all of the above was a favorable variance from the amounts budgeted of 107,219.
Capital Asset and Debt Administration
Capital assets. The City's investment in capital assets for its governmental and business type activities as of June 30, 2005 amountedto $1,353,247 (net of accumulated depreciation). This investment includes land, buildings and improvements, machinery andequipment, park facilities, roads, highways, and bridges. The total increase in the City's net investment in capital assets for the currentfiscal year was $152,556 ($36,727 for governmental activities including internal service funds and $115,829 for business typeactivities).
Major capital improvements during the current fiscal year included: new infrastructure, consisting primarily of street improvements($27,462); Riverside Canal ($8,415); replacement of the water transmission main at the 60/215 interchange ($4,160); Sewerdepartment upgrades ($12,456), Electric Utility upgrades ($32,464); and Water Utility system upgrades ($20,446).
Construction in progress totaled $172,136 at June 30, 2005. Some of the major projects in process are the Riverside Energy ResourceCenter, the downtown power upgrade project, the water system expansion, an upgrade to the electric distribution system, theMagnolia Street Police Precinct, the Janet Goeske Center and the Airport Fire Station. Depreciation expense during the fiscal yearwas $18,039 for governmental activities and $27,420 for business type activities.
16

City of Riverside's Capital Assets(net of depreciation)
GovernmentalActivities
Business TypeActivities Total
LandBuildingsImprovements other than
BuildingsMachinery and equipmentInftastructureConstruction in progressTotal
2005$124,475
42,933
20,30312,176
304,81239,271
S54U97
2004$116,925
52,826
20,67512,883
286,78917,145S507,241
2005$ 31,262
140,513
492,80411,833
1309286
2004$ 32,725
135,062
2005$ 155,737
183,446
449,683 513,1079,074 24,009
- 304,81266904136
$12144a
2004$ 149,650
187,888
470,35821,957
286,78984,049
SI1200.691
Additional information on the City's capital assets can be found in note 5 on page 40 of this report.
Long-term debt. At the end of the current fiscal year, the City had total debt outstanding of $850,120, which includes bonded debt of
$789,501.
City of Riverside's Long-Term Debt
GovernmentalActivities
Business TypeActivities Total
Lease/Revenue BondsGeneral Obligation BondsPension Obligation BondsCertificates of ParticipationNotes PayableCapital LeasesCompensated AbsencesWater Acquisition RightsTotal
2005$144,024
20,280148,28057,33610,6457,431
30,677
2004$131,590
20,28589,54058,70611,0578,938
29,301
$3492417
2005 2004 2005$419,581 $440,970 $563,605
S- 20,280S- 148,280S- 57,336
10,459 11,066 21,104392 439 7,823
- 30,6775L039 1O15$431,447 $85S4 g0,120
2004$572,560
20,28589,54058,70622,123
9,37729,3011.039
17

The City's total debt increased by $47,189 (6 percent) during the current fiscal year due to the issuance of $60,000 in PensionObligation bonds and $25,693 in Redevelopment Agency debt; these were offset by scheduled debt service payments.
The City's Electric and Water Utilities maintain an "A+" and "AA-", respectively, from Standard & Poors and Fitch for their revenuebonds. The City's general obligation bond ratings are "AA-" and "AA".
State statutes limit the amount of general obligation debt a governmental entity may issue to 15 percent of its total assessed valuation.The legal debt margin for the City is $1,880,200, after deducting the general obligation debt of $220,710.
Additional information on the City's long-term debt can be found in note 7 beginning on page 41 of this report.
Economic Factors and Next Year's Budget and Rates
El The assessment roll for the City increased 9.8% between fiscal year 2004 and fiscal year 2005.O Property taxes increased between fiscal year 2004 and 2005 by 58.4% primarily as a result of the State's swapping of Property Tax
revenue for Vehicle License fees as well as new development and the expansion of redevelopment activity.O Employment in Riverside County is 3.4% over the prior year and unemployment is down to 5.9% as compared to 6.2% for 2004.E The required contribution rates as a percentage of payroll for the City's retirement program, including the employee portion which
is paid by the City, will be changing effective July 1, 2006 as follows:" Miscellaneous Plan - 22.80% to 22.89%" Safety Plan - 27.41% to 30.54%
At the time of budget preparation for fiscal year 2006, the economic outlook for the City was considered to be very good. The GeneralFund Budget for fiscal year 2006 of $192 million contemplates the use of approximately $7 million of the beginning fund balance.
Request for information
This financial report is designed to provide a general overview of the City's finances for all those with an interest in the City'sfinances. Questions concerning any of the information provided in this report or requests for additional financial information shouldbe addressed to the City Manager's Office, Finance Division, 3900 Main Street City of Riverside, CA 92522.
18

City of RiversideStatement of Net AssetsJune 30, 2005(amounts expressed In thousands)
GovernmentalAssets ActiviiesCash and investments $ 218,094Receivables, net 55,546Inventory 4,743Nuclear material InventoryPrepaid items 4,535Deferred charges 126,310Internal balances 18,752Land and improvements held for resale 6,386Restricted assets:Cash and cash equivalentsCash and investments at fiscal agent 110,019Other
Capital leases receivable 27,150Land and other capital assets not being depreciated 163,746Capital assets (net of accumulated depreciation) 380,224Total assets 1,115,505
LiabilitiesAccounts payable and other current liabilitiesAccrued interest payableUnearned revenueDepositsCurrent liabilities payable from restricted assetsClaims and judgments payableDecommissioning liabilityLandfill cappingNoncurrent liabilities:Due within one yearDue In more than one year
Total liabilities
Net AssetsInvested in capital assets, net of related debtRestricted forCapital projectsDebt serviceOther purposesPrograms
UnrestrictedTotal net assets
21,1654,0591,540
28,627
17,549
20,844397.829491,613
515,354
118,3098,442
28,206
(46,419)$ 623,892
Business-typeActivities
$ 170.19947,699
1,3116,631
58,538(18,752)
61,45568.661
606
164,127645,150
1,205,623
31,406
5023,9644,172
44,0303,723
23,037408,410519,244
402,377
46,4593,2174,864
229,462$ 686,379
Total388,293103,245
4,7431,311
11,166184,846
6,386
61,455178.680
60627,150
327,8731,025,3742,321,128
52,5714,0592,042
32,5914,172
17,54944,0303,723
43,881806,239
1,010,857
917,731
118,30954,90131,4234,864
183,043$ 1,310,271
19The notes to the financial statements are an integral part of this statement.

City of RiversideStatement of ActivitiesFor the fiscal year ended June 30,2005(amounts expressed In thousands)
Not (Expense) Revenue andChanges In Net AssetsProgram Revenues
FunctionslProgramsGovernmental activities:
General governmentPublic safetyHighways and streetsCulture and recreationInterest on long-term debt
Total governmental activities
Business type activities:ElectricWaterSewerRefuseAirportTransportationPublic parkingTotal business type activities
Total
IndirectExpenses
Expenses Allocation
$ 58,460 $ 11,060110,969 (5,838)20,364 (2,381)26,353 (2,841)15,885
232,031
Charges forServices
$ 25,9956.982
23,1087,002
OperatingGrants and
Contributions
$ 9.9234,577
2291,411
CapitalGrants and
Contributions
$ 1,946472
1,2241,650
GovernmentalActivities
$ (31,656)(93,100)
6,578(13,449)(15,885)
(147,512)
Business typeActivities
63,087 16,140 5,292
Total
$ (31,656)(93,100)
6,578(13,449)(15,885)
(147,512)
69,0089,119
(626)1,830
122(234)
2,13781,356
(66,156)
200,03036,70926,10812,841
1,1852,557
824280,254
$ 512,285
252,32234,00221,96714,492
1,088200
2.961327,032
S 390,119
1822,079
2,261$ '18,401
16,71611,826
3.515179
3744
32,317$ 37,609
$ 69,0089,119
(626)1,830
122(234)
2,13781.35681,356(147,512)
General revenues:Taxes:
SalesPropertyUtility usersFranchiseOther
Intergovernmental, unrestrictedGrants and contributions not restricted to specific programsInvestment incomeMiscellaneous
SubtotalSpecial item - canal abandonmentTransfers, net
Total general revenues, special items, and transfersChange in net assets
Net assets - beginningNet assets - ending
53,34861,55322,133
4,4813,8281,795
15,2207,8155,756
175,929
14,918190,84743,335
580,557$ 623.892
53,34861,55322,133
4,4813,8281,795
15,2207,548 15,3637,362 13,118
14,910 190,839(3,014) (3,014)
(14,918)(3,022) 187,825
78,334 121,669608,045 1,188,602
$ 686,379 $ 1,310,271
The notes to the financial statements are an integral part of this statement20

City of RiversideBalance Sheet
Governmental Funds
June 30, 2008(amounts expressed In thousands)
Assets
Cash and InvestmentsCash and Investments at fiscal agent
Receivables (net of allowance for uncollectbles):
InterestProperty taxes
Sales taxUtiliy bledAccounts
Intergovernmental
Notes
Capital lease receivable
Prepal Items
Due from other fundsAdvances to other funds
Land & improvements held for resale
Total assets
Uabilities and fund balances
UaIties:Accounts payable
Accrued payrol
RetWng payableIntergovemmental
Unearned revenue
Deposits
Due to other funds
Advances from other funds
Total liabilities
Fund balances:
ReservedUnreserved, designated for economic contingencies
Unreserved, designated for liability Insurance
Unreserved, designated for future operations:
General fund
Special revenue funds
Capital project funds
Permanent fund
Unreserved, undesignated:
General fund
Special revenue funds
Capital project fundsTotal fund balances
Total lablities and fund balances
GeneralFund
S 78,36663.165
9228,4389,103
5523,1105.066
70
1766,921
33,715
209,602
$ 4,2347,908
382138
12,42728.564
502,146
55,849
Raedevelopsk nt Other
Debt Governmental
Service Funds
$ 5,982 $ 113,610
7,430 39,424
59
261
27,150
228
$ 41,110
1,096
382
173
8,937
17,124
4,352
232
6,386
$ 191.696
Total
GovernmentalFunds
197,958
110,019
2,0778,798
9,103
5523,544
14.003
17,19427,150
4,528
6.92134,175
6,386
$ 442,408
$ 432 $ 6,144 $ 10,8107,908
1,484 1.866
138
27,179 18,622 58,228
44 28.608
2,001 2,051
15,002 17,148
27,611 43.297 126,757
44,48727,000
6,400
59.593
13,499 34,178
19,54471,684
127
92,16427,000
6,400
59,593
19.544
71,684127
16.273
153,753
$ 209.602
13,499
$, 41,110
5,44717,419
148,399
$ 191,696
16,2735.447
17,419
315.651
$ 442.408
The notes to the financial statements are an Integral part of this statement.
21

CITY OF RIVERSIDERECONCILIATION OF THE BALANCE SHEET OF GOVERNMENTAL FUNDSTO THE STATEMENT OF NET ASSETSJune 30, 2005(amounts expressed In thousands)
Total fund balances - governmental funds
Amounts reported for governmental activities In the Statement of Net Assets aredifferent because:
Capital assets net of accumulated depreciation used in governmental activities that are notcurrent financial resources and, therefore, are not reported in the funds.
Issuance costs from issuing debt are expenditures at the fund level but are deferred andsubject to capitalization and amortization in the Statement of Net Assets.
Special item, pension contribution, is a use of current financial resources and an expenditureat the fund level, is deferred and recognized as a deferred charge on the Statement of NetAssets.
Revenues that do not meet the "availability" criteria for revenue recognition and therefore, aredeferred in the funds.
Long-term liabilities, as listed below, are not due and payable in the current periodand therefore are not reported in the funds.
Bonds PayableAccrued Interest PayableCertificates of Participation PayableNotes PayableCapital Leases PayableBond PremiumsCompensated Absences
Internal service funds are used by management to charge the costs of insurance, centralizedpurchasing and fleet management to individual funds. The assets and liabilities of the internalservice funds are included in the governmental activities in the Statement of Net Assets.
$315,651
540,383
4,105
120,548
56,688
$ (307,999)(4,059)
(57,336)(10,645)
(7,431)(4,585)
(30,052)(422,107)
8,624
$623,892Net assets of governmental activities
The notes to the financial statements are an integral part of this statement22

City of RiversideStatement of Revenues, Expenditures, and Changes In Fund B
Governmental Funds
For the fiscal year ended June 30, 2005
(amounts expressed In thousands)
Revenues
Taxes
Licenses end permits
Intergovernmental
Charges for services
Fines and forfeitures
Special assessments
Rental and Investment Income
Miscellaneous
Total revenues
Expenditures
Current:
General government
Public safety
Highways and streets
Culture and recreation
Capital outlay
Debt service:
Principal
Interest
Bond Issuance costs
Total expenditures
Deficiency of revenues under expenditures
Other financing sources (uses):
Transfers in
Transfers out
Proceeds from Issuance of long term obligations
Premiums on bonds issued
Sale of capital assets
Total other financing sources before special item
Special Item - pension contribution
Net change in fund balances
Fund balances - beginning
Fund balances - ending
Redevelopment Other
Debt GovernmentalGeneral Fund Service Funds
$ 116,018 $ 16,994 $ 9,044
7,374 7,015
15,366 200 27,002
11,291 - 81,783 223
4,118 2,154
4,251 2,486 4,178
4,749 591 4,656
164,950 20,271 54,280
21,351119,036
13,44626,198
261 7,188
7,982
48,366
Total
Governmental
Funds
$ 142,056
14,389
42,568
11,299
2,006
6,272
10,915
9,996
239,501
28,800
119,036
13,446
34,180
48,366
17,766
15,025
1,538
278,157
(38,656)
49,944(35,026)
85,578
113
6,230
106,839
(32,141)
36,042
279,605
$ 315,647
3,522 13,674 570
8,337 6,377 311487 1,051
192,377 21,363 64,417
(27,427) (1,092) (10,137)
22,846(8,076)60,000
8,575(17,068)11,454
113
18,523
(9,882)
14,124
92 6,138
74,862 3,074 28,903
(28,213) (3,928)
19,222 1,982 14,838
134,527 11,517 133,561
$ 153,749 $ 13,499 $ 148,399
The notes to the financial statements are an integral part of this statement.23

CITY OF RIVERSIDERECONCILIATION OF THE STATEMENT OF REVENUES,EXPENDITURES, AND CHANGES IN FUND BALANCES OF GOVERNMENTAL FUNDSTO THE STATEMENT OF ACTIVITIESFor the Year Ended June 30, 2005(amounts expressed In thousands)
Net change in fund balances-total governmental funds $36,042
Amounts reported for governmental activities in the statement of activities aredifferent because:
Governmental funds report capital outlays as expenditures. However, in the statement of activities the cost ofthose assets is allocated over their estimated useful lives and reported as depreciation expense. This is theamount by which capital outlays exceeded depreciation in the current period, as listed below.
Capital Outlay 53,797Depreciation Expense (17,273) 36,524
Revenues In the statement of activities that do not meet the *avallability" criteria for revenue recognition andtherefore are not reported as revenue in the funds. 4,085
Special Item, Pension Contribution that is deferred and amortized in the statement of activities. 32,141
The issuance of long-term debt (e.g., bonds, leases, notes) provides current financial resources togovernmental funds, while the repayment of the principal of long-term debt consumes the current financialresources of governmental funds. Neither transaction, however, has any effect on net assets. Also,governmental funds report the effect of issuance costs, premiums, discounts and similar items when debt isfirst issued, whereas these amounts are deferred and amortized in the statement of activities. The net effect ofthese differences in the treatment of long-term debt and related items Is listed below:
Principal repayments 17,634Deferred Charges 1,251Compensated Absences (1,211)Interest (910)Proceeds from LTD (85,693)Other 182 (68,747)
Internal service funds are used by management to charge the costs of insurance, centralized purchasing andfleet management to individual funds. The net revenue of certain activities of internal service funds is reportedwith governmental activities. 3,290
Change in net assets of governmental activities $ 43,335
The notes to the financial statements are an integral part of this statement
24

City of RiversideStatement of Revenues, Expenditures and Changes in Fund Balances - Budget and Actual
General FundFor the year ended June 30. 2005
(amounts expressed in thousands)
Budgeted Amounts Actual Variance with
Original Final Amounts Final Budget
Budgeted Amounts Actual Variance with
Original Final Amounts Final Budget
RevenuesTaxesUcenses and permitsIntergovernmental
Charges for servicesFines and forfeitures
Special assessmentsRental and investment Income
Miscellaneous
$ 110,5946,735
15,9438,1292,045
3,7553,0152,155
$ 110,5946,735
22,1028,1912,045
3,7553,0575,264
$ 116,018
7,37415,36611,291
1,7834,1184,251
4,749
$ 5,424639
(6,736)3,100
(282)363
1,194(515)
Public safety:PoliceFireAnimal regulation
Building and zoning inspection
Street lightingTotal public safety
Highways and streets
74,68561,381
2,8702,0613,859
144,856
87,81686,8392.8702,5243,859
163,908
75,97434,6882,1192,4333.822
119,036
11,84232,151
7519137
44,872
13,442 15,247 13,446 1.801
32,248 36,116 26,198 9,918Total revenues 152,371 161,743 164,950 3,207 Culture end recreation
ExpendituresGeneral government
MayorCouncilManagerAttorneyClerkPlanningHuman Resources
General ServicesFinanceInformation SystemNon-departmental
SubtotalAllocated expenditures
Total general government
53678
769179208
5,0583.928
26,0076,633
13,58014.946
653143
1,031391284
5,663
4,29230,907
6,10613,48615,083
49897
76798
1954,990
3,58713,561
3,10311,11410,728
15546
264293
89673705
17.3463.0032,372
4,335
Debt service:PrincipalinterestBond issuance costs
Total debt service
Total expenditures
7502,416
1,5382,528
3,5228,337
48712,346
(1,984)(5,809)
(487)(8,280)3,166 4,066
238,648 270.370 192,377 77,993
Deficiency of revenue under expenditures (88,277) (108,627) (27,427) 81.200
71,922 78.019 48,738 29,281
(26,986) (26,986) (27,387) 401
44,936 51,033 21,351 29.882
continued
Other financing sources (uses)Transfers inTransfers outProceeds from issuance of long-term debtSale of capital assets
Total other financing sourcesbefore special item
Special item - pension contribution
Net change in fund balances
23,522(3,450)
0100
26,325(5,798)
0100
22,540(8.076)60,000
92
(3,48U)(2.278)60.000
(8)
20,172 20,630 74,862 54,232
0 0 (28,213) (28,213)
The notes to the financial statements are an integral part of this statement, (66,105) (87,997) 19,222 107.219
Fund balance, beginning
Fund balance, ending
134,527 134,527 134,527 0
68,422 $ 46,530 $ 153,749 $ 107,219mm;m===
25

City of RiversideStatement of Net AssetsProprietary FundsJune 30, 2005(amounts expressed in thousands)
Business-type Activities - Enterprise Funds
OtherEnterprise
Funds
TotalEnterprise
Funds
GovernmentalActivities-
InternalService FundsAssets
Current assets:Cash and InvestmentsReceivables (net of allowances for uncollectibles)
InterestUtility billedUtility unbilledAccountsIntergovernmental
Nuclear materials inventoryInventoryPrepaid itemsDue from other fundsRestricted assets:
Cash and cash equivalentsCash and investments at fiscal agentPublic benefit programs receivableConservation & reclamation programs receivable
Total current assets
Non-current assets:Advances to other fundsDeferred chargesCapital assets:
LandBuildingsAccumulated depreciation-buildingsImprovements other than buildingsAccumulated depreciation-improvements other than buildingsMachinery and equipmentAccumulated depreciation-machinery and equipment
Construction in progress
Total non-current assets
Total assets
Electric Water Sewer
$ 88,292 $ 15,911 $ 58,794 $ 7,202 $ 170,199 $ 20,136
94111,33210,8138,6373,1331,311
6,62850
50,00364.474
595
2171,5912,1521,713
396
4,3394,187
11
720568782690491
98428596271
2,130
I
1,97613,91914,34311,3116,1501,311
6,63150
61,45568,661
59511
213
656
4,7437
3,896 3,217
246,209 30,518 65,942 13,943 356,612 25,161
340,015
6,84812,243(3,051)
473,765(215,853)
14,609(11,423)98,385
415,541
661,750
487,135
12,55214,787(2,280)
293,244(92,356)
8,672(5.576)
12,656
248,882
279,400
10,7283,922 7,464
2,698173,947(57,173)37,471(7,628)6,126(4,269)
257
166.079
232,021
9,1644,509
(2,469)7,178(3,017)
10,676(6,982)21,567
48,090
62,033
10,77958,536
31,262205,486(64,973)811,658(318,854)
40,083(28,250)132,865
878,592
1,235,204
2,5061,657
1,488(32)
9,335(7,204)
7,750
32,911
continued
26

City of RiversideStatement of Net AssetsProprietary FundsJune 30,2005(amounts expressed In thousands)
Business-type Activities - Enterprise Funds
LiabilitiesCurrent liabilities:
Accounts payableAccrued payrollRetainage payableIntergovernmentalClaims and judgments
Unearned revenueDepositsDue to other fundsCapital leases-currentWater stock acquisitions-current
Current liabilities payable from restricted assets:
Revenue bondsAccrued interestOther payables
Total current liabilities
Non-current liabilities:Revenue bondsNotes payableCapital leasesAdvances from other funds
Decommissioning liabilityWater stock acquisitionsLandfill capping
Total non-current liabilities
Total liabilities
Net AssetsInvested in capital assets, net of related debt
Restricted for debt serviceRestricted for other purposes
Restricted for programsUnrestrictedTotal net assets
Electric Water Sewer
16,2604,7081,273
43
2,599
15,0152,678
10842,684
306,144
13,69044,030
363,864
406,548
97,20734,383
4,732118,880
$ 255,202
1,3832,027
645
87
1.365
150
1,2381,158
26
196
42
OtherEnterprise
Funds
1,740905
219
94117
3,822
4,075610
110,343
62,819
5,890
865
69,574
79,917
175,0418,440
13215,870
$ 199,483
3,120775618
7,173
TotalEnterprise
Funds
20,6218,7981,944
43
5023,964
94159
150
22,2104,063
72764,022
397,3719,841
33328,64044,030
8653,723
484,803
548,825
402,37746,459
3,2174,864
229,462$ 686,379
GovernmentalActivities-
InternalService Funds
397624
47
17,549
19
3,979
22,615
1,672
1.672
24,287
3,587
5,037$ 8,624
28,4089,841
1163.768
2175,292
42,133
49,306
3,7239,232
13,054
109,2843,636
20,845
3,217
69,795 24,917$ 182,715 $ 48,979
The notes to the financial statements are an Integral part of this statement.
27

City of RiversideStatement of Revenues, Expenses, and Changes In Fund Net Assets
Proprietary Funds
For the fiscal year ended June 30, 2006
(amounts expressed In thousands)
Business-type Activities - Enterprise Funds
OtherEnterprise
Funds
TotalEnterprise
Funds
GovernmentalActivities.Internal
Service Funds
Operating revenues:Charges for services
Operating expenses:Personal servicesContractual servicesMaintenance and operationGeneralMaterials and suppliesInsuranceDepreciation and amortization
Total operating expenses
Operating income (loss)
Nonoperating revenues (expenses):Operating grantsInterest incomeOtherGain (loss) on retirement of capital assetsCapital improvement feesInterest expense and fiscal charges
Total nonoperating revenues (expenses)
Income (loss) before capital contributions,transfers and special item
Capital contributionsTransfers inTransfers out
Total before special item
Special Item . canal abandonmentChange in net assets
Electric
$ 252,322
13,274
2,849
145.82010,165
454834
15,116
188,512
63,810
5,1831,255
217
(11,518)
(4,863)
58,947
16,716363
(18.572)
57,454
57,454
197,748
$ 255,202
Water
$ 34,002
7,5432,105
7,948
7,937422628
6,314
32,897
1,105
5821,171
620
(3,812)
(1,439)
(334)11,826
150
(3,487)8,155
(3,014)5,141
194,342
$ 199,483_
Sewer
$ 21,967 $ 18,741 $ 327,032 $ 17,373
7,169837
6,4513,4351,394
3784,715
24,379
(2,412)
1.4961,809
6273,494
(1,729)
5,697
3,28521
172
3,478
4,815
3,6634,807
1,509
815436
1,275
17,320
1,421
2,261287
1,998
(335)
(87)
4,124
5,545260
6,456
12,261
32,8019,454
165,026
23,046
3,0852,276
27,420
263,108
63,924
2,2617,5486,2331,129
3,494(17,146)
3,519
67,44328,823
7.141(22,059)81,348
2,96662
1,3241,606
1297,738
767
14,592
2,781
688(279)
89
(15)
483
3,26426
3,290
-- (3,014) _
3,478 12,261 78,334 3,290
Total net assets - beginning
Total net assets - ending
179,237
$ 182,715
36,718
$ 48,979
608,045
$ 686,379
5,334
$ 8,624
The notes to the financial statements are an integral part of this statement.28

City of RiversidePropdetary FundsStatement of Cash FlowsFor the fiscal year ended June 30, 2005(amounts expressed In thousands)
Business-type Activities. Enterprise Funds
OtherEnterprise
Funds
GovernmentalTotal Activities-
Enterprise Internal
Funds Service FundsElectric Water SewerCash flows from operating activities:
Cash received from customers and usersCash paid to employees for servicesCash paid to other suppliers of goods or servicesOther receipts (payments)Canal abandonment
Net cash provided (used) by operating activities
Cash flows from noncapital financing activities:Transfers inTransfers outOperating grantsAdvances from interfund receivablesPayments on interfund receivablesAdvances to other funds
Net cash provided (used) by noncapital financingactivities
Cash flows from capital and related financing activities:Purchase of capital assetsPurchase of nuclear fuelProceeds from the sale of capital assetsPrincipal paid on long-term obligationsInterest paid on long-term obligationsCapital Improvement feesCapital contributions
Net cash used for capital and relatedfinancing activities
Cash flows from Investing activities:Purchase of InvestmentsIncome from investments
Net cash provided by investing activities
Net Increase (decrease) in cash and cash equivalents
Cash and cash equivalents, beginning (including $110,029 for Electric,$10,100 for Water, $3,809 for Sewer and $3,333 for other enterprise fundsIn restricted accounts)
Cash and cash equivalents, ending (including $50,003 for Electric,$4,339 for Water, $3,896 for Sewer and $3,217 for other enterprise fundsin restricted accounts)
245,314(13,415)
(150,200)1,255
82.954
$ 38,702
(7,679)(20,287)
1,171
(1.147)81760
$ 22,529(7,390)
(12,404)2,071
4.806
$ 18.764(4,871)
(12.057)(4,283)
$ 323,309
(33,355)(194,948)
214(1,147)
94,073
$ 17,768
(3,149)(12,465)
(280)
1.874(2.447)
363 150(18,572) (3,487)
172 8,458
1,9668,749
1,000
(839)
7,141(22,059)
1,9658,7491,024
(3,836)24
(2.997)560
560(18,209) (3,313) (2,825) 17,331 (7.016)
(95,562)(984)274
(14,555)(11,259)
12,864
(17,242) (12,691)
999(4,069)(2,548)
1,014(3,619)
(1,817)
(13,690) (139,185)- (984)5 2,292
(4) (22,247)(65) (15,689)
3,49444 22,629
(930)
76
3,4949,721
(109,222) (13,139) (13,619) (13,710) (149,690) (854)
(2,803)
4,939
2,136
(42,341)
(3)543
540
(7,152)
1,480
1.460
(10,178)
274
274
1,448
(2,808)7,216
4,410
(58,223)
653
653
2233
180,636 27,402 72,888 8,971 289,877 17,903
$ 138,295 $ 20,250 $ 62,690 $ 10,419 $ 231,654 $ 20,136: = ý X s continued
29

City of RiversideProprietary FundsStatement of Cash Flows
For the fiscal year ended June 30, 2005
(amounts expressed In thousands)
Business-type Activities - Enterprise Funds GovernmentalActivities.Other
EnterpriseFunds
Total
Electric Water SewerEnterprise Internal
Funds Service Funds
Reconciliation of operating income (loss) to net cash provided
(used) by operating activities:
Operating Income (loss)
Other receipts (payments)Canal abandonment
Adjustments to reconcile operating income (loss) to
net cash provided (used) by operating activities:
Depreciation and amortization
Amortization of nuclear fuel(Increase) decrease in utility billed receivables
Decrease (increase) in utility unbilled receivables
(Increase) decrease in accounts receivable
(Increase) decrease In Intergovernmental receivables
Decrease in notes receivable
(increase) decrease in prepaid items
Decrease in nuclear materials inventory
(Increase) in inventory
Increase (decrease) in accounts payable
(Decrease) In accrued payroll
Increase (decrease) in retainage payable
Decrease in intergovernmental receivables
(Decrease) in unearned revenue
Increase (decrease) in deposits
Increase (decrease) in due to other funds
Increase In claims and judgmentsIncrease in decommissioning liabilitity
Decrease in landfill capping
Net cash provided (used) by operating activities
Noncash financing and Investing activities:
Capital contributionsAdvance from other funds - pension obligation bonds
Canal abandonmentThe notes to the financial statements are an integral part of this statement
63,8101,255
15,1164,331
(651)(855)267
(1,832)
(2,044)(82)
688(142)
1,08827
(683)(212)
2,873
82,954
$ 1,1051,171
(1,147)
6,314
105(283)440
1,467
$ (2,412)1,809
$ 1,4211,998
$ 63.9246,233(1,147)
4,71
73
(2333
(992)(136)(77)
(178)971
(22
(7j
15 1,275
i3 23
5 (24)
W8 29
30) (1.661)
3711 (1)
72 (656)
21) (56)4
75) (18)
(4,378)
(399)
56 $ (2,447)
27,4204,331(470)
(1,157)1,474
(2,256)337
(2,034)(82)
(888)(555)
1,01527
(954)759
(4,378)
2,873(399)
$ 94,073
$ 2,781(280)
767
(6)391
(1,849)(283)
(15)
(34)
137265
$ ,1,874$ 8,760 $ 4,80
$$$
3,85213,690
$$$
2.1055.890(1.867)
$$$
213,768
$$$
2162,532
$$$
6,19425,880(1,867)
$$$
261,672
30

City of Riverside
Statement of Fiduciary Net Assets
Fiduciary Fund
June 30, 2006
(amounts expressed In thousands)
Assets:
Cash and investments
Cash and investments at fiscal agent
Interest receivable
Property tax receivables
Total assets
Liabilities:
Accounts payable
Due to other funds
Held for bond holders
Total liabilities
AgencyFunds
$ 2,99113,996
48166
$ 17,201
$ 1
617,194
$ 17,201
The notes to the financial statements are an integral part of this statement
31

CITY OF RIVERSIDENOTES TO BASIC FINANCIAL STATEMENTSFiscal Year Ended June 30. 2005 (amounts expressed in thousands)
1. Summary of Significant Accounting Policies
The City of Riverside (City) was incorporated on October 11, 1883 as aCharter City and operates under a Council-Manager form of Government.The more significant accounting policies reflected in the financial statementsare summarized as follows:
A. Reporting Entity
These financial statements present the City and its component units, entitiesfor which the City is financially accountable. Blended component units arelegally separate entities, but in substance are part of the City's operationsand their data is combined with that of the City's. The City has no componentunits that meet the criteria for discrete presentation. All of the City'scomponent units have a June 30 year end.
Blended Component Units
Riverside Redevelopment Agency (Redevelopment Agency) was establishedin 1971 by the City. The Redevelopment Agency's primary purpose is toeliminate blighted areas in the City by encouraging commercial development.City Council members serve as the Redevelopment Agency's directors andhave full accountability for fiscal matters.
Riverside Public Financing Authority (Public Financing Authority) wasorganized in December 1987 by the City and the Redevelopment Agency.The purpose of the Public Financing Authority is to provide financing forpublic capital improvements to the City or the Redevelopment Agency. CityCouncil members serve as the Public Financing Authority's directors andhave full accountability for fiscal matters.
Riverside Municipal Improvements Corporation (Municipal ImprovementsCorporation) was created in 1978 and operates under provisions of theNonprofit Public Benefit Corporation Law of the State of California. TheMunicipal Improvements Corporation's primary purpose is to providefinancing assistance by obtaining land, property and equipment on behalf ofthe City. Three members of the City Council serve as the MunicipalImprovements Corporation's directors and have full accountability for fiscalmatters.
Complete financial statements for each of the individual component unitsexcept the Riverside Municipal Improvement Corporation (which does not
generate a financial statement) may be obtained from the City's FinanceDepartment, 3900 Main Street, Riverside, California, 92522.
B. Government-wide and Fund Financial Statements
The govemment-wide financial statements (i.e., the statement of net assetsand the statement of activities) report information on all of the nonfiduciaryactivities of the City and its component units. Interfund activity has beenremoved from these statements except for utility charges, as this woulddistort the presentation of function costs and program revenues.Governmental activities, which normally are supported by taxes andintergovemmental revenues, are reported separately from business typeactivities, which rely to a significant extent on fees and charges for support.
The statement of activities demonstrates the degree to which the directexpenses of a given function or segment are offset by program revenues.Direct expenses are those that are clearly identifiable with a specific functionor segment. Program revenues include 1) charges to customers orapplicants who purchase, use, or directly benefit from goods, services, orprivileges provided by a given function or segment and 2) grants andcontributions that are restricted to meeting the operational or capitalrequirements of a particular function or segment. Taxes and other items notproperly included among program revenues are reported instead as generalrevenues. Indirect expenses are allocated to the various functions based ona proportionate utilization of the services rendered. Such allocations consistof charges for accounting, human resources, information technology andother similar support services.
Separate financial statements are provided for governmental funds,proprietary funds, and fiduciary funds, even though the latter are excludedfrom the govemment-wide financial statements. Major individualgovernmental funds and major individual enterprise funds are reported asseparate columns in the fund financial statements.
C. Measurement Focus, Basis of Accounting, and FinancialStatement Presentation
The govemment-wide financial statements are reported using the economicresources measurement focus and the accrual basis of accounting, as arethe proprietary fund and fiduciary fund financial statements. Revenues arerecorded when earned and expenses are recorded when a liability isincurred, regardless of the timing of related cash flows. Property taxes are
32

CITY OF RIVERSIDENOTES TO BASIC FINANCIAL STATEMENTSFiscal Year Ended June 30. 2005 (amounts expressed in thousands)
recognized as revenues in the year for which they are levied on the property.Grants and similar items are recognized as revenue as soon as all eligibilityrequirements have been met. An allowance for doubtful accounts ismaintained for the utility and other miscellaneous receivables. Agency fundsreport only assets and liabilities, therefore have no measurement focus.
Governmental fund financial statements are reported using the currentfinancial resources measurement focus and the modified accrual basis ofaccounting. Revenues are recognized as soon as they are both measurableand available. Revenues are considered to be available when they arecollectible within the current period or soon enough thereafter to pay liabilitiesof the current period. For this purpose, the government considers revenuesto be available if they are collected within 60 days of the end of the currentfiscal period, except for sales tax revenue which is seven (7) months, asdescribed below. Expenditures generally are recorded when a liability isincurred, as under accrual accounting. However, debt service expenditures,as well as expenditures related to compensated absences and claims andjudgments, are recorded only when payment is due.
Effective with the current fiscal year, the State temporarily began toexchange 25% of sales taxes for an equal amount of property taxes tosecuritize a short-term State bond issue. The State bond issue will remainoutstanding for an uncertain number of years, but is currently estimated notto exceed eight (8) years. These in-lieu sales taxes will be paid to the City bythe State on a different calendar than sales taxes, which are paid monthly,three months in arrears. The vast majority of the in-lieu amount will be paidduring the applicable fiscal year; however, the final payment of the in-lieusales taxes will not be paid until the January following the end of theapplicable fiscal year. The City has budgeted this final payment in thecurrent fiscal year and will continue this practice during this temporary period,effectively extending the availability period to seven (7) months for the in-lieusales taxes and thus provide consistency in the reporting of sales taxrevenue.
Property taxes, special assessments, sales taxes, franchise taxes, licenses,charges for services, amounts due from other governments and interestassociated with the current fiscal period are all considered to be susceptibleto accrual. Other revenue items such as fines and permits are considered tobe measurable and available only when the govemment receives cash, andare therefore not susceptible to accrual.The government reports the following major governmental funds:
The General fund is the governments primary operating fund. It accountsfor all financial resources of the general government, except thoserequired to be accounted for in another fund.
The Redevelopment Agency's debt service fund accounts for theresources accumulated and payments made for principal and interest onlong-term obligation debt of the Redevelopment Agency.
The government reports the following major proprietary funds:
The Electric fund accounts for the activities of the City's electricdistribution operations.
The Water fund accounts for the activities of the City's water distributionoperations.
The Sewer fund accounts for the activities of the City's sewer systems.
Additionally, the government reports the following fund types:
Internal service funds account for the central stores, central garage, andthe three self-insured risks of workers compensation, unemployment andpublic liability on a cost reimbursement basis.
The agency fund is used to account for special assessments that serviceno-commitment debt
The permanent fund is a fiduciary fund that is used to report resourcesthat are legally restricted to the extent that only earnings, and notprincipal, may be used for purposes that support the City's Libraryprograms.
Pronouncements regarding accounting and financial reporting issued by theFinancial Accounting Standards Board prior to December 1, 1989 generallyare followed in both the government-wide and proprietary fund financialstatements to the extent that those standards do not conflict with orcontradict guidance of the Governmental Accounting Standards Board.Governments also have the option of following subsequent private-sectorguidance for their business-type activities and enterprise funds, subject tothis same limitation. The City has elected not to follow subsequent private-sector guidance.
33

CITY OF RIVERSIDENOTES TO BASIC FINANCIAL STATEMENTSFiscal Year Ended June 30. 2005 (amounts expressed in thousands)
Significant interfund activity has been eliminated from the government-widefinancial statements with the exception of charges between the City'selectric, water, sewer and refuse functions and various other functions of theCity. Elimination of these charges would distort the direct costs and programrevenues reported for the various functions concerned.
Amounts reported as program revenues include 1) charges to customers forgoods, services, or privileges provided, 2) operating grants and contributions,and 3) capital grants and contributions, including special assessments.Internally dedicated resources are reported as general revenues rather thanas program revenues. Likewise, general revenues include all taxes.
Proprietary funds distinguish operating revenues and expenses from non-operating items. Operating revenues and expenses generally result fromproviding services and producing and delivering goods in connection with aproprietary fund's principal ongoing operations. The sewer fund alsorecognizes as operating revenue the portion of connection fees intended torecover the cost of connecting new customers to the system. Operatingexpenses for enterprise funds and internal service funds include the cost ofsales and services, administrative expenses, and depreciation on capitalassets. All revenues and expenses not meeting this definition are reportedas non-operating revenues and expenses.
D. Cash and Investments
The City values its cash and investments in accordance with the provisionsof Government Accounting Standards Board (GASB) Statement No. 31,"Accounting and Financial Reporting for Certain Investments and ExternalInvestment Pools (GASB 31)," which requires governmental entities,including governmental external investment pools, to report certaininvestments at fair value in the statement of net assets/balance sheet andrecognize the corresponding change in the fair value of investments in theyear in which the change occurred. Fair value is determined using publishedmarket prices.
Cash accounts of all funds are pooled for investment purposes to enhancesafety and liquidity while maximizing interest earnings. Investments arestated at fair value. All highly liquid investments (including restricted assets)with a maturity of 90 days or less when purchased are considered cashequivalents. Cash and investments held on behalf of proprietary funds bythe City Treasurer are considered highly liquid and are classified as cashequivalents for the purpose of presentation in the Statement of Cash Flows.
E. Restricted Cash and Investments
Certain proceeds of Enterprise fund revenue bonds, as well as certainresources set aside for their repayment, are classified as restricted assets onthe statement of net assets because their use is limited by applicable bondcovenants. Additionally, unspent proceeds received from the City's landfillcapping surcharge are also recorded as restricted assets.
F. Land and Improvements Held for Resale
Land and improvements held for resale are generally acquired underDeveloper Disposition Agreements in the normal course of RedevelopmentAgency activity. The Developer Disposition Agreements provide for transferof property to developers after certain redevelopment obligations have beenfulfilled. This property is carried at cost until an event occurs to indicate alower net realizable value.
G. Inventory
Supplies are valued at cost using the average-cost method. Costs arecharged to user departments when consumed rather than when purchased.
H. Prepaid Items
Payments to vendors for services benefiting future periods are recorded asprepaid items and expenditures are recognized when items are consumed.
I. Capital Assets and Nuclear Fuel
Capital Assets
Capital assets, which include property, plant, equipment, and infrastructureassets ( e.g., roads, bridges, sidewalks, right of way, and similar items), arereported in the applicable governmental or business-type activities columnsIn the government-wide financial statements. The government defines capitalassets as assets with an initial, individual cost of more than five thousanddollars and an estimated useful life in excess of one year. Such assets arerecorded at historical cost or estimated historical cost if purchased orconstructed. Costs include: labor, materials; interest during construction;allocated indirect charges such as engineering, construction andtransportation equipment, retirement plan contributions and other fringe
34

CITY OF RIVERSIDENOTES TO BASIC FINANCIAL STATEMENTSFiscal Year Ended June 30, 2005 (amounts expressed In thousands)
benefits. Donated capital assets are recorded at estimated fair market valueat the date of donation.
The costs of normal maintenance and repairs that do not add to the value ofthe asset or materially extend asset lives are not capitalized. Capital assetsother than land are depreciated using the straight-line method.
Nuclear Fuel
The Electric Utility amortizes the cost of nuclear fuel to expense using the "asburned" method. In accordance with the Nuclear Waste Disposal Act of1982, the Electric Utility is charged one dollar per megawatt-hour of energygenerated by the City's share of San Onofre Nuclear Generating Station'sUnits 2 and 3 to provide for estimated future storage and disposal of spentfuel. The Electric Utility pays this fee to its operating agent, SouthernCalifornia Edison Company, on a quarterly basis.
J. Compensated Absences
City employees receive 10 to 25 vacation days a year based upon length ofservice. A maximum of two years' vacation accrual may be accumulated andunused vacation is paid in cash upon separation.
City employees generally receive one day of sick leave for each month ofemployment with unlimited accumulation. Upon retirement or death, certainemployees or their estates receive a percentage of unused sick leave paid ina lump sum based on longevity. The General, Library, RedevelopmentAgency Capital Projects and the Housing and Community DevelopmentSpecial Revenue funds have been used to liquidate such balances.
The liability associated with these benefits is reported in the government-wide statements. Vacation and sick leave of proprietary funds is recorded asan expense and as a liability of those funds as the benefits accrue toemployees.
K. Long-Term Obligations
Long-Term Debt
In the government-wide financial statements and proprietary fund types in thefund financial statements, long-term debt and other long-term obligations arereported as liabilities in the applicable governmental activities, business-type
activities, or proprietary fund type statement of net assets. Bond premiumsand discounts, as well as issuance costs, are classified as deferred chargesand amortized over the life of the bonds using the effective interest method.Bonds payable are reported net of the applicable bond premium or discount.
In the fund financial statements, government fund types recognize bondissuance costs as expenditures during the current period. The face amountof debt issued is reported as other financing sources. Premiums received ondebt issuances are reported as other financing sources while discounts ondebt issuance are reported as other financing uses.
Decommissioninq
Federal regulations require the Electric Utility to provide for the futuredecommissioning of its ownership share of the nuclear units at San Onofre.The Electric Utility established a trust account to accumulate resources forthe decommissioning of the nuclear power plant and restoration of thebeachfront at San Onofre. Each year the Electric Utility recognizes anexpense in the amount of the contribution to the trust account. The fundingwill occur over the useful life of the generating plant.
Amounts held in the trust account are classified as restricted assets in theaccompanying balance sheet. To date, the Electric Utility has set aside$44,030 in cash and investments with the trustee as Riverside's estimatedshare of the decommissioning cost of San Onofre. Based on a cost estimatecompleted by Southern California Edison and approved by the CaliforniaPublic Utilities Commission, the Electric Utility plans to set asideapproximately $1,600 per year to fund this obligation. Decommissioning isexpected to commence around the year 2014.
L. Claims and Judgments Payable
Claims and judgments payable are recognized when it is probable that aliability has been incurred and the amount of loss can be reasonablyestimated. Such claims, including an estimate for claims incurred but notreported at year end, are recorded as liabilities in the appropriate internalservice fund.
M. Fund Equity
In the fund financial statements, reserves represent those portions of fundequity not available for appropriation or legally segregated for a specific
35

CITY OF RIVERSIDENOTES TO BASIC FINANCIAL STATEMENTSFiscal Year Ended June 30. 2005 (amounts expressed in thousandsl
future use. Designated fund balances represent amounts identified bymanagement or the governing board for the future use of financial resources.
N. Net Assets
Net assets represent the difference between assets and liabilities. Netassets invested in capital assets, net of related debt, consists of capitalassets, net of accumulated depreciation, reduced by the outstandingbalances of any borrowings used for the acquisition, construction orimprovement of those assets. Net assets invested in capital assets, net ofrelated debt excludes unspent debt proceeds. Net assets are reported asrestricted when there are limitations imposed on their use either throughlegislation adopted by the City or through external restrictions imposed bycreditors, grantors or laws or regulations of other governments. Restrictedresources are used first to fund appropriations.
0. Interfund Transactions
Interfund transactions are accounted for as revenues and expenditures orexpenses. Transactions, which constitute reimbursements, are eliminated inthe reimbursed fund and accounted for as expenditures or expenses in thefund to which the transaction is applicable.
During the year, transactions occur between individual funds for goodsprovided or services rendered. Related receivables and payables areclassified as "due from/to other funds" on the accompanying fund levelstatements. The noncurrent portion of long-term interfund loans receivableare reported as interfund receivables/payables and, for governmental fundtypes, are equally offset by a fund balance reserve to indicate that thereceivable does not constitute available expendable financial resources.Interfund payables also include accrued interest, which has been offset bydeferred revenue.
Any residual balances outstanding between the governmental activities andbusiness-type activities are reported in the government-wide financialstatements as "internal balances".
P. Unearned Revenues
Governmental and proprietary funds report unearned revenue on thestatement of net assets. Unearned revenues arise in governmental fundswhen potential revenue does not meet both the "measurable" and "available"
criteria for recognition in the current period. Unearned revenues also arisewhen the government receives resources before it has a legal claim to them,as when grant monies are received prior to meeting all eligibilityrequirements. In subsequent periods, when both revenue recognition criteriaare met, or when the government has a legal claim to the resources, revenueis recognized. The majority of the City's governmental fund unearnedrevenue for June 30, 2005 relates to unearned revenue on a capital lease.See Note 4.
Q. Property Tax Calendar
Under California law, general property taxes are assessed for up to 1% of theproperty's assessed value. General property taxes are collected by thecounties along with other special district taxes and assessments and voterapproved debt. General property tax revenues are collected and pooled bythe county throughout the fiscal year and then allocated and paid to thecounty, cities and school districts based on complex formulas prescribed byState statutes.
Property taxes are calculated on assessed values as of January 1 for theensuing fiscal year. On July 1 of the fiscal year the levy is placed and a lienis attached to the property. Property taxes are due in two installments. Thefirst installment is due November 1 and is delinquent on December 10. Thesecond installment is due February 1 and is delinquent on April 10. Propertytaxes receivable represent current and prior years' uncollected tax levies,adjusted for uncollectable amounts.
R. Use of Estimates
The preparation of financial statements in conformity with accountingprinciples generally accepted in the United States of America requiresmanagement to make estimates and assumptions that affect the reportedamounts of assets and liabilities, disclosure of contingent assets andliabilities at the date of the financial statements, and the reported amounts ofrevenue and expenditures. Specifically, the City has made certain estimatesand assumptions relating to the collectability of its receivables, the valuationof property held for resale, the useful lives of capital assets and the ultimateoutcome of claims and judgments. Actual results may differ from thoseestimates and assumptions.
36

CITY OF RIVERSIDENOTES TO BASIC FINANCIAL STATEMENTSFiscal Year Ended June 30. 2005 (amounts expressed in thousands)
S. Implementation of new accounting principles
The City adopted Governmental Accounting Standards Board (GASB)Statement No. 46, Net Assets Restricted by Legislation- an amendment ofGASB Statement No. 34. GASB 34 requires that limitations on the use of netassets imposed by enabling legislation be reported as restricted net assets.GASB 46 clarifies that a legally enforceable enabling legislation restriction isone that a party external to a government - such as citizens, public interestgroups, or the judiciary - can compel a government to honor. Statement 46further requires that legal enforceability of an enabling legislation restrictionbe reevaluated if any of the resources raised by the enabling legislation areused for a purposes not specified by the enabling legislation or if agovernment has other cause for reconsideration. This statement requiresgovernments to disclose the portion of total net assets that is restricted byenabling legislation. Accordingly, net assets restricted by legislation havebeen reported to conform to the provisions of GASB Statement No. 46.Currently, the City has no such restrictions.
GASB has issued several pronouncements prior to June 30, 2005 (for yearsending after June 30, 2005) that have effective dates that may impact futurefinancial presentations. Management has not currently determined what, ifany, impact implementation of the following statements may have on thefinancial statement of the City of Riverside.
, GASB Statement Number 42, "Accounting and Financial Reportingfor Impairment of Capital Assets and Insurance Recoveries.
" GASB Statement Number 44, *Economic Condition Reporting: TheStatistical Section" which amends portions of previous guidancerelated to the preparation of a statistical section when presented as arequired part of a comprehensive annual financial report (CAFR).
2. Legal Compliance - Budgets
Budgets are adopted on a basis consistent with accounting principlesgenerally accepted in the United States of America. Annual appropriatedbudgets are adopted for all departments within the general, special revenueand capital project funds. Formal budgets are not employed for debt servicefunds because debt indenture provisions specify payments. The permanentfund is not budgeted.
During the period December through February of each fiscal year,department heads prepare estimates of required appropriations for the
following fiscal year. These estimates are compiled into a proposedoperating budget that includes a summary of proposed expenditures andfinancial resources and historical data for the preceding fiscal year. Theoperating budget is presented by the City Manager to the City Council forreview. Public hearings are conducted to obtain citizen comments. The CityCouncil generally adopts the budget during one of its June meetings.The City Manager is legally authorized to transfer budgeted amountsbetween divisions and accounts within the same department. Transfer ofappropriations between departments or funds and increased appropriationsmust be authorized by the City Council. Expenditures may not legally exceedbudgeted appropriations at the departmental level within a fund.
3. Cash and Investments
Cash and investments at fiscal year end consist of the following:
InvestmentsCash and investments at fiscal agent
$413,194225,685
638,8796.536
MAMIE41Cash on hand and in transit
The amounts are reflected in the government-wide statement of net assets:
Cash and investmentsRestricted cash and cash equivalentsRestricted cash and investments at fiscal agent
Total per statement of net assetsFiduciary fund and investments
$388,29361,455
178,680628,428
16,987
The City follows the practice of pooling cash and investments of all fundsexcept for funds required to be held by outside fiscal agents under theprovisions of bond indentures, which are administered by outside agencies.
Interest income earned on pooled cash and investments is allocated monthlyto funds based on the beginning and month-end balances. Interest incomefrom cash and investments held at fiscal agents is credited directly to therelated account Bank deposits are covered by federal depository insurancefor the first $100 or by collateral held in the pledging bank's trust departmentin the name of the City.
37

CITY OF RIVERSIDENOTES TO BASIC FINANCIAL STATEMENTSFiscal Year Ended June 30, 2005 (amounts exoressed in thousands)
Authorized Investments
Under provisions of the City's investment policy, and in accordance withCalifornia Government Code Section 53601, the City Treasurer may invest ordeposit in the following types of investments:
Securities of the U.S. Gov't.and its sponsored agencies
Repurchase AgreementsReverse Repurchase AgreementsNegotiable Certificates of DepositBankers AcceptancesCommercial Paper of *prime' qualityLocal Agency Investment Fund (State Pool)Mutual FundsMedium-Term Corporate Notes
MaxMaturity
5 Years1 Year90 Days5 Years180 Days270 DaysN/AN/A5 Years
Max % ofPortfolio
100%100%20%30%40%25%100%20%30%
Investments in money market funds rated in the single highestclassificationMunicipal obligations rated Aaa/AAA or general obligations of states with
ratings of at least A2/A or higher by both Moody's and S&PInvestment Agreements
No maximum percentage of the related debt issue or maximum investment in
one issuer is specified.
Disclosures Relating to Interest Rate Risk
Interest rate risk is the risk that changes In market interest rates willadversely affect the fair value of an investment Generally, the longer thematurity of an investment, the greater the sensitivity of its fair value tochanges in market interest rates. The City's investment policy requires thatthe Interest rate risk exposure be managed by purchasing a combination ofshorter term and longer term investments and by timing cash flows frommaturities so that a portion of the portfolio is maturing or coming close tomaturity evenly over time as necessary to provide the cash flow and liquidityneeded for operations.
Information about the sensitivity of the fair values of the City's investments(including investments held by fiscal agent) to market interest ratefluctuations is provided by the following table that shows the distribution ofthe City's investments by maturity:
Investments in Medium Term Corporate Notes may be invested in securitiesrated A or better by Moody's or Standard and Poor's rating services and nomore than 15% of the market value of the portfolio may be invested in onecorporation.
The City's investment policy provides two exceptions to the above; one is forinvestments authorized by debt agreements (described below) and the otherfor funds reserved in the San Onofre Nuclear Generating StationDecommissioning Account for which the five-year maturity limitation may beextended to the term of the operating license.
Investments Authorized by Debt Agreements
Provisions of debt agreements, rather than the general provisions of theCalifornia Government Code or the City's investment policy, governinvestments of debt proceeds held by bond fiscal agents. Permittedinvestments are specified in related trust agreements and include thefollowing:
Securities of the U.S. Government and its sponsored agenciesBankers' Acceptances rated in the single highest classificationCommercial Paper rated in the single highest classification
Remaining Maturity (in Months)12 Months 13 to 24 25 to 60 More than
or Less Months Months 60 MonthsInvestment TI=e
Money Market FundsFederal Agency SecuritiesCorp Medium Term NotesMunicipal SecuritiesState Investment PoolHeld by Fiscal Agent
Money Market FundsInvestment ContractsState Investment PoolCertificates of DepositFed Agency Securities
Total
$66,831250.16169,969
1,19025,043
9,473100,23042,7325,528
67.722
$66.8319.968
24.551
25,043
9,473403
42,7325,32821.597
173.19735,436
30,424
26,968
$ -
66,9969.982
40.308
20019,157
$ -
1,190
29,095
285ZS
The City assumes that callable investments will not be called.
38

CITY OF RIVERSIDENOTES TO BASIC FINANCIAL STATEMENTSFiscal Year Ended June 30. 2005 (amounts expressed in thousands)
Disclosures Relating to Credit Risk
Generally, credit risk is the risk that an issuer of an investment will not fulfillits obligation to the holder of the investment. This is measured by theassignment of a rating by a nationally recognized statistical ratingorganization. Presented below is the actual rating as of year-end for eachinvestment type:
Rating as of Year End
M 6a.a A United
Money Market FundsFederal Agency SecuritiesCorp Medium Term NotesMunicipal SecuritiesState Investment PoolHeld by Fiscal Agent
Money Market FundsInvestment ContractsState Investment PoolCertificates of DepositFed Agency Securities
Total
$ 66,831250,16169,969
1,19025,043
9,473100,23042,7325,528
67-72221138
$ -
250,16140,460
9,47399,362
5,52867,722
$ -
17,984
1
11,545
$66,831
1,19025,043
42,732
its investment or collateral securities that are in the possession of anotherparty. The City's investment policy requires that a third party bank trustdepartment hold all securities owned by the City. All trades are settled on adelivery vs. payment basis through the City's safekeeping agent. The Cityhas no deposits with financial institutions; bank balances are swept daily intoa money market account.
Investment in State Investment Pool
The City is a voluntary participant in the Local Agency Investment Fund(LAIF) that is regulated by California Govemment Code Section 16429 underthe oversight of the Treasurer of the State of California. The fair value of theCity's investment in this pool Is reported in the accompanying financialstatements at amounts based upon the City's pro-rata share of the fair valueprovided by LAIF for the entire LAIF portfolio (in relation to the amortized costof that portfolio). The balance available for withdrawal is based on theaccounting records maintained by LAIF, which are recorded on an amortizedcost basis.
4. Capital Lease Receivable
The Redevelopment Agency has a direct financing lease arrangement withthe State of California (the State) for a twelve-story office building. The leaseterm Is for thirty years and the State takes ownership of the facility at theconclusion of that term. The lease calls for semi-annual payments not lessthan the debt service owed by the Redevelopment Agency on the leaserevenue bonds issued for the purchase and renovation of the building. Thefuture minimum lease payments to be received are as follows:
8W8
Concentration on Credit Risk
The investment policy of the City contains no limitations on the amount thatcan be invested in any one issuer beyond that stated above. Investments inany one issuer that represent 5% or more of total City investments are asfollows:
FHLBFHLMCFNMA
Investment ToyeFederal Agency SecuritiesFederal Agency SecuritiesFederal Agency Securities
Reported Amount$183,654
39,06057,785
20062007200820092010Thereafter
Total DueLess: amount applicable to interest
Total capital lease receivable
$2,2492,2732,2982,3242,35538,990
50,489(23.339)W2Z7 l0
Custodial Credit Risk
Custodial credit risk for deposits is the risk that, in the event of the failure of adepository financial institution, a government will not be able to recover itsdeposits or will not be able to recover collateral securities that are in thepossession of an outside party. The custodial credit risk for investments isthe risk that, in the event of the failure of the counterparty (e.g., broker-dealer) to a transaction, a govemment will not be able to recover the value of
39

CITY OF RIVERSIDENOTES TO BASIC FINANCIAL STATEMENTSFiscal Year Ended June 30. 2005 (amounts expressed in thousands)
5. Capital Assets
The following Is a summary of changes in the capital assets during the fiscalyear ended June 30, 2005.
Governmental activities:
Capital assets, not being depreciated:LandConstruction In progress
Total capital assets not beingdepreciated
Capital assets being depreciated:BuildingsImprovements
other than BuildingsMachinery and EquipmentInfrastructure
Total capital assets beingdepreciated
Less accumulated depreciation for.BuildingsImprovementsother than Buildings
Machinery and EquipmentInfrastructure
Total accumulated depreciation
Total capital assets beingdepreciated, net
Governmental activitiescapital assets, net
Business type activities:
Capital assets, not beingdepreciated:LandConstruction in progress
Total capital assets not beingdepreciated
Capital assets being depreciated:BuildingsImprovementsother than Buildings
Machinery and EquipmentTotal capital assets beingdepreciated
BeginningBalance
$116,92517.145
134O070
$7,61724.760
32.377
1,4103,683
28.454
Deletions/Tansfers
$ (67)(2.634)(271z1
Ending
$124,47539.271
1163346
Business type activities (cont):
Less accumulated depreciation forBuildingsImprovementsother than Buildings
Machinery and EquipmentTotal accumulated depreciation
Total capital assets beingdepreciated, net
Business type activitiescapital assets, net
(298,352) (20,677)(1L974)
175_2.10
2,275
BeginningBalance Additions
Deletions/ EndingTransfers Balance
(64,973)(60,404) (4,569)
(318,854)(4128,25
593,819 51.826 (495) 645.150
a1092M
77,813 (8,422) 69,391 Estimated useful lives used to compute depreciation are as follows:
45,08854,020
438.800
615.721
(2,902)
(5,897)
46,49854,801461,357
632.047
Buildings and ImprovementsImprovements other than BuildingsMachinery and EquipmentInfrastructure
30-50 years20-99 years3-15 years20-100 years
(24,987) (1,599) 128 (26.458)
(24,413) (1,782) - (26,195)(41,137) (4,227) 2,739 (42,625)
(1201 (041 5,897 (156.5451
(2248 8.764 (251.8231
373,173 15Q0 (8.487) 380.224
Depreciation expense was charged to functions of the government asfollows:
BeginningBalance
$ 32,72566.904
99.629
195,466
748,03537.450
980,951
Deletions/ EndingAddtilons Transfers Balance
Governmental activities:General governmentPublic safetyHighways and streets, including depreciation of
general infrastructure assetsCulture and recreation
Total depreciation expense - governmental activities
Business type activities:ElectricWaterSewerRefuseSpecial TransportationAirportPublic Parking
Total depreciation and amortization expense -business type activities
$ 7902,780
11,8062,663
$15,1166,3144,715
664301242
68
$ 1,051150.679
10,020
63,8665,160
$ (2,514)
(87.232)
(243)
(2,527)(2,7701
$31,262132.865
205,486
811,65840.083
1,57227
40

CITY OF RIVERSIDENOTES TO BASIC FINANCIAL STATEMENTSFiscal Year Ended June 30, 2005 (amounts expressed in thousands)
6. Risk Management Changes in Long-Term Obliqations: The following is a summary of changesin long-term obligations during the fiscal year.Governmental Activities:The City is exposed to various risks of loss related to torts; theft of, damage
to, and destruction of assets; errors and omissions; injuries to employees;and natural disasters. Property insurance coverage has a limit of $100,000,with a deductible of $50. Earthquake and flood insurance coverage has alimit of $15,000, with a deductible of 5% for earthquake and 2% for flood.Workers' compensation insurance coverage has a limit of $25,000, with adeductible of $4,000 per occurrence. The City carries commercial insuranceup to $23,000 for general and auto liability claims greater than $3,000 peroccurrence. There were no claims settled in the last three fiscal years thatexceed insurance coverage. Internal service funds have been established toaccount for and finance the uninsured risks of loss.
All funds of the City participate in the Risk Management program and makepayments to the Internal Service Funds based on actuarial estimates of theamounts needed to fund prior and current year claims and incidents thathave been incurred but not reported. Interfund premiums are accounted foras quasi - external transactions and are therefore recorded as revenues ofthe Internal Service funds in the fund financial statements.
BeginningBalanceDue
Ending WithinBalance One YearAdditions Reductions
RedevelopmentAgency bonds
General ObligationBonds
Pension ObligationBonds
Certificates ofParticipation
Capital leasesNotes PayableCompensated
AbsencesTotal
$131,590 $25,693 $13,259 $144,024
20,285 5 20,280
89,540 60,000 1,260 148,280
$ 3,695
410
1,810
1,7151,764
458
58,7068,938
11,057133
1,3701,640
412
57,3367,431
10,645
29Q0 12.936 11,560 30o677 10.992762O 19J=~
Business type activities:Changes in the funds' claims liability amounts are:
Unpaid Claims,June 30, 2003
Incurred claims
Claim payments
Unpaid Claims,June 30, 2004
Incurred claims(including IBNR's)
Claim payments
Unpaid claims,June 30, 2005
Workers'Comoensation
$10,353
3,442
UnemploymentCompensation
PublicLiability
$ 76 $7,936 $18,365
3,762 7,204
Revenue BondsNotes PayableCapital LeasesWater Stock
AcquisitionRightsTotal
BeginningBalance$440,970
11,066439
1.039
Additions Reductions$21,389
60747
EndingBalance$419,581
10,459392
DueWithin
One Yer$22,210
61859
(2,678)
$11,117
3,083
(3.053)
24- A1 ,01 150
$ 76 $6,091 $17,284
- 3,886 6,969
- (3651) (6704)
L .. a .i £IZIW
Current Refunding:
On November 30, 2004, the City of Riverside Redevelopment Agency sold$24,115 of Housing Set-Aside Tax Allocation and Refunding Bonds with atrue interest cost of 4.65% to provide project funds and to refund $10,200 ofpreviously outstanding Housing Set-Aside Tax Allocation Bonds. TheAgency completed the current refunding to reduce aggregate debt servicepayments over the next 20 years by $3,276 and to obtain an economic gain(difference between present value of the old and new debt service payments)of $1,493.
7. Long-Term Obligations
41

CITY OF RIVERSIDENOTES TO BASIC FINANCIAL STATEMENTSFiscal Year Ended June 30. 2005 (amounts expressed in thousands)
In prior years the City defeased certain Revenue and Tax Allocation Bondsby placing the proceeds of the new bonds in an irrevocable trust to providefor all future debt service payments on the old bonds. Accordingly, the trustaccount assets and the liability for the defeased bonds are not included in theCity's financial statements. At fiscal year end $2,385 of bonds outstandingare considered defeased.
Long-Term Obligations at June 30, 2005:
PrincipalOutstandinq
Water
Revenue Bonds:
Electric
$98,730 1998 Electric Revenue Bonds (partialrefunding issue); $63,165 serial bonds, 4.25% to5.38%, due in annual installments from $4,650 to$7,085 through October 1, 2013; $35,565 term bonds,5%, due October 1, 2022
$47,215 2001 Electric Revenue Bonds; 2.9% to 5.25%,due in annual installments from $2,855 to $4,750through October 1, 2016.
$75,405 2003 Electric Revenue Bonds; 2.0% to 5.0%,due in annual installments from $1,035 to $8,535through October 1, 2013.
$27,500 2004 Electric Revenue Bonds; Series A fixedrate bonds, 4.0% to 5.25%, due in annual installmentsfrom $2,615 to $3,695 through October 1, 2014.
$82,500 2004 Electric Revenue Bonds; Series BAuction Rate Securities, variable rate subject to weeklyrepricing (rate at June 30, 2005 was 2.0%), due inannual installments from $1,250 to $7,000 throughOctober 1, 2029.
PrincipalOutstanding
$ 89,085
44,360
67,665
27,500
$69,840 1991 Water Revenue Bonds; $25,050 serialbonds, 4.25% to 9.0%, due in annual installments from$675 to $3,100 through October 1, 2002; $25,900Capital Appreciation Bonds, due in annual Installmentsfrom $3,235 to $3,240 from October 1, 2003 to October1, 2010; (partially advance refunded in 1998)
$4,710 1994 Water Revenue Bonds (FARECAL Pool);$2,420 serial bonds, 4.75% to 5.90%, due in annualInstallments from $135 to $255 through June 1, 2010;$2,290 term bonds, 6.0%, due June 1, 2017
$30,965 1998 Water Revenue Bonds (partial refundingissue); $15,055 serial bonds, 4.0% to 5.38%, due inannual installments from $205 to $4,055 throughOctober 1, 2013; $15,910 term bonds, 5%, dueOctober 1, 2027
$20,000 2001 Water Revenue Bonds; 2.6% to 5.0%,due in annual installments from $345 to $1,230through October 1, 2031SubtotalLess: Unamortized bond discount
Sewer
$49,145 1993 Sewer Revenue Refunding Serial Bonds;4.0% to 7.0%, due in annual installments from $335 to$4,745 through August 1, 2012Add: Unamortized bond premium
3,425
$19,425
29,230
18,93571,015(4.121)
$66,894
$ 31,270258
31,528
Subtotal 311,110
10,049$321,159
Total Revenue Bonds
Add: Unamortized bond premium Remaining revenue bond debt service payments will be made from revenuesof the Electric, Water, and Sewer Utility Enterprise funds. Annual debtservice requirements to maturity are as follows:
42

CITY OF RIVERSIDENOTES TO BASIC FINANCIAL STATEMENTSFiscal Year Ended June 30, 2005 (amounts expressed in thousands)
Fiscal Year2006
20072008200920102011-20152016-20202021-20252026-20302031-2035Premium(Discount)Total
Fiscal Year200620072008200920102011-2015PremiumTotal
Electric Utility FundPrini Interest Total$ 15,015 $ 13,353 $ 28,368
18,215 12.728 30.94318,935 11,983 30,91819,795 11,133 30,92820,725 10,197 30,92298,580 35,840 134,42049,935 17.536 67,47137,460 8,814 46,27432,450 2.701 35,151
Water Utility FundPrincal Interest$4,075 $ 2,565
4,115 2.5304.155 2,4924,190 2,4514,245 2,407
23,370 9,77710.245 5.0216,955 3,3207,265 1,4272,400 122
Total$ 6,640
6,6456,6476.6416,652
33,14715,26610.2758.6922,522
1004- 10,049 (4,111$124=g
Principal$3,120
3,2853,5153,7604,020
13,570258
Sewer Utility FundInterest$1,780
1,5841,3461.092
8191,040
(4,1211
$4,9004,8694,8614,8524,839
14,610258
$6,055 1999 University Corridor/Sycamore CanyonMerged Project Area, Subordinate Tax AllocationBonds, Series B; $1,900 serial bonds, 4.5% to 5.5%due in annual installments from $35 to $190 throughSeptember 1, 2013; $1,135 term bonds at 5.5% dueSeptember 1, 2018; and $3,020 term bonds at 5.625%due September 1, 2027
$20,395 1999 Casa Blanca Project Area, TaxAllocation Bonds, Series A; $8,925 serial bonds, 3.4%to 4.7% due in annual installments from $455 to $780through August 1, 2014; $2,565 term bonds at 4.75%due August 1, 2017; $4,035 term bonds at 4.75% dueAugust 1,2021; and $4,870 term bonds at 5.0% dueAugust 1, 2025.
$4,550 Arlington Redevelopment Project, 2004 TaxAllocation Bonds, Series A; $420 term bonds at 3.8%due August 1, 2014; $615 term bonds at 4.6% dueAugust 1, 2024; and $3,515 term bonds at 4.7% dueAugust 1, 2034
$2,975 Arlington Redevelopment Project, 2004 TaxAllocation Bonds; Series B: 5.5% due in annualinstallments from $85 to $235 through August 1, 2024
$26,255 State of California Department of GeneralServices Project, 2003 Lease Revenue RefundingBonds, Series A; 2.0% to 5.0% due in annualinstallments from $545 to $2,230 through October 1,2024
$4,810 State of California Department of GeneralServices Project, 2003 Lease Revenue RefundingBonds, Series B; $310 serial bonds 1.20% to 1.42%through October 1, 2004; $620 term bonds at 3.090%due Oct. 1, 2008; $1,110 term bonds at 4.340% dueOct. 1, 2014 and $2,770 term bonds at 5.480% dueOct. 1, 2024
PrincipalOutstanding
5,575
17,965
Redevelopment Agency Bonds:Principal
OutstandinM
4,550
2,975$13,285 1991 Public Financing Authority RevenueBonds, Series A, Multiple Project Areas; $1,470 serialrevenue bonds 7.15% to 7.6%, due in annualinstallments from $100 to $145 through February 1,2003; and $4,175 term bonds, 8.0%, due in annualinstallments from $155 to $450 through February 1,2018 (portion not refunded)
$17,025 1999 University Corridor/Sycamore CanyonMerged Project Area, Tax Allocation Bonds, Series A;$6,205 serial bonds, 3.4% to 4.7% due In annualinstallments from $40 to $570 through August 1, 2014;$4,810 term bonds at 4.75% due August 1, 2021; and$6,010 term bonds at 5.0% due August 1, 2027
24,965$ 200
15,550 4,500
43

CITY OF RIVERSIDENOTES TO BASIC FINANCIAL STATEMENTSFiscal Year Ended June 30. 2005 (amounts expressed in thousands)
$40,435 Merged Project Area, 2003 Tax Allocation andRefunding Bonds; $32,720 serial bonds 2.0% to 5.25%due in annual Installments from $1,220 to $1,955through August 1, 2023; and $7,715 term bondsat 5.0% due in annual installments from $195 to $2,060through August 2034
$24,115 2005 Housing Set-Aside Tax Allocation Bonds;$17,025 serial bonds 3.0% to 4.625% due in annualinstallments from $505 to $1,165 through August 1,2025; $2,425 term bonds at 5.0% due August 1, 2028;and $4,665 term bonds at 4.85% due August 1, 2034
$1,465 California Statewide Communities DevelopmentAuthority 2005 Taxable Revenue Bonds, Series A(CRA/ERAF Loan Program); 3.87% to 5.01% due inannual Installments of $105 to $180 through August 1,2015SubtotalAdd: Unamortized bond premiumTotal Redevelopment Agency Bonds
PrincipalOutstanding
39,215
24,115
General Obligation Bonds:Principal
Outstanding
$20,000 Fire Facility Projects, Election of 2003 GeneralObligation Bond; 3.0% to 5.5%, due in annualinstallments from $410 to $1,740 through August 1,2024Add; Unamortized bond premiumTotal General Obligation Bonds
$20,000280S20. 280
Remaining general obligation bond debt service payments will be made fromunrestricted revenues of the General fund. Annual debt service requirementsto maturity are as follows:
1,465141,075
2,949
Fiscal Year2006200720082009200102011-20152016-20202021-2025PremiumTotal
$ 410515545
590625
3,9205,6007,795
280$g0.280
Interest$ 886
873857840819
3,6742,6981,097
Total$1,296
1,3881,4021,4301,4447,5948,2988,892
280E32 02Remaining debt service will be paid by the Redevelopment Agency DebtService Funds from future property tax revenues. Annual debt servicerequirements to maturity are as follows:
Fiscal Year200620072008200920102011-20152016-20202021-20252026-20302031-2035PremiumTotal
Principal$ 3,695
3,9704,1454,3054,485
25,74031,90539,83016,0256,9752,949
Interest$6,514
6,2336,1025,9615,807
26,07919,72410,7653,282
745
Total$10,209
10,20310,24710,26610,29251,81951,62950,59519,3077,7202.949
Pension Obligation Bonds:Principal
Outstandinag
$89,540 California Statewide Community DevelopmentAuthority (Public Safety) 2004 Taxable PensionObligation Bond; 2.65% to 5.896%, due in annualinstallments from $1,125 to $10,715 through June 1,2023
$30,000 2005 Taxable Pension Obligation BondsSeries A4 3.85% to 4.78%, due in annual installments$630 to $3,860 through June 1,2020
$88,280
30,000
44

CITY OF RIVERSIDENOTES TO BASIC FINANCIAL STATEMENTSFiscal Year Ended June 30, 2005 (amounts expressed in thousands)
$30,000 2005 Taxable Pension Obligation BondsSeries B (Auction Rate Securities); variable rate subjectto weekly repricing (rate at June 30, 2005 was 2.0%),due in annual installments from $1,475 to $6,750through June 1, 2025.Total Pension Obligation Bonds
PrincipalOutstandina
30,000
Remaining certificates of participation debt service payments will be madefrom unrestricted revenues of the Debt Service funds. Annual debt servicerequirements to maturity are as follows:
Remaining pension obligation bond debt service payments will be made fromunrestricted revenues of the General fund. Annual debt service requirementsto maturity are as follows:
Fiscal Year200620072008200920102011-20152016-20202021-20252026-20302031-2035PremiumTotal
$1,7151,7851,8701,9502,0456,8408,460
10,19010,58510,5401,356
Interest$2,658
2,5852,5052,4192,319
10,5678,8796,5544,0101,086
$43-582ý
Total$ 4,373
4,3704,3754,3694,364
17,40717,33916,74414,59511,626
1,356$10.91
Fiscal Year200620072008200920102011-20152016-20202021-2025Total
Principal$ 1,810
2,0202,4802,9853,535
27,66550,00057,785
Interest$ 7,553
7,7197,6427,5397,406
33,82524,3537,941
Total$ 9,363
9,73910,12210,52410,94161,49074,35365,726
PrincipalOutstandinaContracts - Enterprise Funds:
PrincipalOutstandinaCertificates of Participation:
$6,360 1999 Municipal Improvements CorporationCertificates of Participation; 6.0% to 7.6%, due inannual installments from $310 to $815 through April 1,2010
$53,185 2003 Riverside Public Financing AuthorityCertificates of Participation; 2.0% to 5.0%, due inannual installments from $755 to $2,830 throughSeptember 1,2033SubtotalAdd: Unamortized bond premiumTotal Certificates of Participation
$3,550
Water stock acquisition rights payable ondemand to various water companies,renewable through 2004
Notes Payable - Redevelopment Agency:
These notes payable have been issued to promotedevelopment and expansion within the City'sredevelopment areas.
Pepsi Cola Bottling Company of Los Angeles, 10.5%,payable in net annual installments of $341,including principal and interest through June 2020
HUD Section 108 loan for University Village,5.36% to 7.66%, payable in semi-annualinstallments beginning August 1, 1996 of$272 to $425 through August 1, 2015
2,98852,43055,980
1,57363,075
45

CITY OF RIVERSIDENOTES TO BASIC FINANCIAL STATEMENTSFiscal Year Ended June 30, 2005 (amounts expressed In thousands)
HUD Section 108 loan for Mission VillageProject. 6.15% to 6.72%, payable insemi-annual installments beginningAugust 1, 1999 of $110 to $420through August 1, 2018
PrincipalOutstanding
3,965
Sewer fund loan from State of California for Headworksproject, 1.803%, payable in net annual installments of$477,387, beginning November 6, 1999 throughNovember 6, 2018
PrincipalOutstanding
Note payable to California Housing Finance Agency,interest at 3%, payable in annual installments of $88through 2013, for housing projects.
Total notes payable - Redevelopment Agency
Remaining notes payable debt service paymentsunrestricted revenues of the Redevelopment Agency.requirements to maturity are as follows:
617
Total notes payable - Sewer Fund
Remaining notes payable debt service payments will be made fromunrestricted revenues of the Sewer fund. Annual debt service requirementsto maturity are as follows:
willAnn
Fiscal Year200620072008200920102011-20152016-20202021-20252026-2030Total
Redevelopment AgencyPrincipal Interest$ 458 $ 798
488 769523 738559 704600 667
3,575 2,6562,386 1,464
777 9321,279 430
be made fromual debt service
Total$ 1,256
1,2571,2611,2631,2676,2313,8501,7091.709
PrincipalOutstanding
Fiscal Year200620072008200920102011-20152016-20202021-2023Total
Principal$ 618
630642654666
3,5243,392
333ilgQd~a
Sewer FundInterest
$199187175163151560214
7S1LSM
Total$ 817
817817817817
4,0843,607
339$1231§
Capital Leases:
The City leases various equipment through capital leasing arrangements inthe governmental and proprietary fund types. These activities are recordedfor both governmental and business-type activities In the government-widefinancial statements. The assets and related obligations under leases ingovernmental funds are not recorded in the fund statements. For proprietaryfunds, the assets and their related liabilities are reported directly in the fund.Amortization applicable to proprietary assets acquired through capital leasearrangements is included with depreciation for financial statementpresentation. The assets acquired through capital leases are as follows:
Notes payable - Sewer Fund:
Sewer fund loan from State of California forCogeneration project, 2.336%, payable in net annualinstallments of $339,474, beginning January 29, 2003through January 29, 2022 $4,455
46

CITY OF RIVERSIDENOTES TO BASIC FINANCIAL STATEMENTSFiscal Year Ended June 30. 2005 (amounts expressed in thousands)
AssetBuildingsEquipment
SubtotalLess: Accumulated
DepreciationTotal
GovernmentalActivities
$8,6605,825
14,485
Business-TypeActivities
$868
Following are required debt service ratios for the year ended June 30, 2005.The ratio measures operating income in relation to debt service. The City isin compliance with these ratios.
1.658) Electric fundWater fundSewer fund
Minimum Debt ServiceRatio Required
1.101.251.25
The future minimum lease obligations as of June 30, 2005 were as follows:
Years Endinq June 30,
200620072008200920102011-2012Total Minimum lease paymentsLess: Amount representing interest
(rates ranging from 2.5% to 9%)Total capital lease payable
GovernmentalActivities
$1,9551,8831,7231,469
535517
8,082
(651)
Business-typeActivities
$8673927551
428
(36)
The following are legally required debt service cash reserves. Theseamounts, at a minimum, are held by the City or fiscal agents at June 30,2005:
General Iona-term obligqations:
There are also a number of limitations and restrictions contained inAssessment Bond indentures. The City believes they are in compliance withall significant limitations and restrictions.
8. Other Long-Term Obligations
Assessment Districts Bonds (Not obligations of the City)
As of June 30, 2005, the City has several series of Assessment DistrictBonds outstanding in the amount of $59,944. Bonds issued forimprovements in certain special assessment districts, in accordance with theprovisions of the Municipal Improvements Acts, are liabilities of the propertyowners and are secured by liens against the assessed property. The CityTreasurer acts as an agent for the property owners in collecting theassessments, forwarding the collections to bondholders and initiatingforeclosure proceedings, if applicable. Since the debt does not constitute anobligation of the City, it is not reflected as a long-term obligation of the Cityand is not reflected in the accompanying basic financial statements.
Conduit Debt Obligations
Mortgage Revenue Bonds outstanding of $15,785 and IndustrialDevelopment Revenue Bonds of $11,275 are not included in theaccompanying financial statements. These bonds are special obligations ofthird parties and payable solely from and secured by a pledge of the receiptsreceived from the acquired mortgage loans and certain other reserve fundsand related monies. The bonds are not payable from any other revenues orassets of the City or Redevelopment Agency. Neither the faith and credit northe taxing power of the City, the Redevelopment Agency, the State ofCalifornia or any political subdivision thereof is pledged to the payment of theprincipal and interest on the bonds.
Redevelopment AgencyCertificates of Participation
Total
Enterprise funds:ElectricWaterSewer
Total
$ 7,0324,148
$20,4434,907
S 350
47

CITY OF RIVERSIDENOTES TO BASIC FINANCIAL STATEMENTSFiscal Year Ended June 30, 2005 (amounts expressed in thousands)
9. Reserved Fund Balances:
Reserved fund balances at June 30, 2005 for the General Fund and theRedevelopment Debt Service Fund consist of the following:
Advances To/From Other Funds: These balances consist of advances usedto fund capital projects in advance of related financing/assessments and forother long-term borrowing purposes.
The following table shows amounts advanced from funds within the City toother funds within the City at June 30, 2005:
Reserved for:EncumbrancesInterfund receivableDebt servicePrepaid itemsNotes receivablePolice Asset ForfeitureFire bond
Total reserved fund balance
GeneralFund
$8,91833,715
17670
5231.085i4.A Q Z
RedevelopmentDebt Service
Fund$ -
13,499
Receivable Fund
General
Payable Fund
ElectricWaterSewerNonmajor governmental
fundsNonmajor enterprise fundsWorkers' compensation *
Central stores *Central garage *
Amount
$13,6905,8903,768
5,1633,532
247259
1,16610. Interfund Assets, Liabilities and Transfers
Due From/To Other Funds: These balances resulted from expendituresbeing incurred prior to receipt of the related revenue source.
The following table shows amounts receivable/payable between funds withinthe City at June 30, 2005:
Redevelopment debtservice
Electric
Water
General
General
General
228
3
48
Receivable FundGeneral
Payable FundNonmajor governmental
fundsNonmajor enterprise fundsCentral stores *
Amount
$2,001941
3,979
Sewer GeneralNonmajor governmentalfunds
Nonmajor enterprise funds
968
8,0001,760
Electric General 50Nonmajor govermental
funds
Workers' compensation *
General 232
667Total GeneralNonmajor governmental
funds* Internal service funds
Total
* Internal service funds
48

CITY OF RIVERSIDENOTES TO BASIC FINANCIAL STATEMENTSFiscal Year Ended June 30. 2005 (amounts expressed in thousands)
Transfers In/Out: Transfers are used to (1) move revenues to the fund thatstatute or budget requires to expend them, (2) move receipts restricted todebt service from the funds collecting the receipts to the debt service fund asdebt service payments become due, (3) move the remaining fund balancesof closed funds to the General fund and (4) use unrestricted revenuescollected in the General fund to finance various programs accounted for inthe other funds in accordance with budgetary operations.
The following table shows amounts transferred to/from funds within the Cityas of June 30, 2005:
Transfer In Fund
General
Redevelopment debtService
Transfer Out Fund
ElectricWaterNonmajor governmental funds
Nonmajor governmental funds
Amount
$18,5723,487
787
8,575
363
150
12. Litigation
The City is a defendant in various lawsuits arising in the normal course ofoperations. City management, based in part on the opinion of outside legalcounsel, does not believe that the ultimate resolution of these matters willhave a material affect on the financial position or results of operations of theCity. Management also believes that adequate reserves exist in the internalservice funds to cover outstanding lawsuits.
On January 1, 2003, the City became a Participating Transmission Ownerwith the California Independent System Operator (ISO), entitling the City toreceive compensation for use of its transmission facilities committed to theISO's operational control. The compensation is based upon the City'sTransmission Revenue Requirement (TRR) as approved by the FederalEnergy Regulatory Commission (FERC). The California Investor OwnedUtilities (IOU's), the California Department of Water Resources (CDWR), andthe CPUC, among others, objected to various aspects of the City's TRR atthe FERC. The City and the objecting parties submitted a settlementagreement for filing. The settlement agreement disposes of all City TRRissues except for CDWR's and CPUC's contention that the City is not entitledto its TRR for the majority of the transmission facilities committed to theISO's control. After trial on this issue, the FERC Administrative Law Judgerendered a decision in favor of the City in March 2005. The objecting partiesare appealing this decision to the full Commission. It is unknown when theCommission will render its decision. If the objecting parties prevail uponappeal, the City may have to refund to the ISO up to $26,600 collectedthrough June 30, 2005.
13. City Employees Retirement Plan
(A) Plan Description. The City of Riverside contributes to the California PublicEmployees Retirement System (CalPERS), an agent multiple employerpublic employee defined benefit pension plan. CalPERS provides retirementand disability benefits, annual cost-of-living adjustments, and death benefitsto plan members and beneficiaries. CaIPERS acts as a common investmentand administrative agent for participating public entities within the State ofCalifornia. Benefit provisions and all other requirements are established bystate statute and City ordinance. Copies of CalPERS annual financial reportmay be obtained from their executive office: 400 P Street, Sacramento, CA95814.
Electric
Water
Sewer
General
General
General 172
Nonmajor governmentalfunds
Nonmajor enterprise funds
GeneralRedevelopment debt serviceNonmajor governmental funds
93517,068
520
General
Total
11. Deficit Fund Balance
A deficit fund balance of $55 exists in the Library fund at fiscal year end.This deficit will be recovered through the normal course of business in theupcoming year
49

CITY OF RIVERSIDENOTES TO BASIC FINANCIAL STATEMENTSFiscal Year Ended June 30. 2005 (amounts expressed in thousands)
(B) Funding Policy. Participants are required to contribute 8% (9% for safetyemployees) of their annual covered salary. The City makes the contributionsrequired of City employees on their behalf and for their account. The City isrequired to contribute at an actuarially determined rate; the fiscal year 2004-2005 rate was 12.340% for non-safety employees, and 31.248% for safetyemployees, of annual covered payroll. The contribution requirements of planmembers and the City are established and may be amended by CalPERS.
(C) Annual Pension Cost. For 2005, the City's annual pension cost of$28,948 for CalPERS was equal to its annual required contribution of$29,056 less the effect of amortization of the net pension asset of $108. Therequired contribution was determined as part of the June 30, 2002 actuarialvaluation using the entry age normal actuarial cost method. The actuarialassumptions included (a) 8.25% Investment rate of return (net ofadministrative expenses), (b) projected salary increases of 3.75% per yearcompounded annually, attributable to inflation, and (c) 3.5% expected longterm inflation. The actuarial value of CalPERS assets was determined usingtechniques that smooth the affects of short-term volatility in the market valueof investments over a four-year period (smoothed market value). CalPERSunfunded actuarial accrued liability is being amortized as a level percentageof projected payroll on a closed basis over 20 years.
Three-year trend information for CalPERS:
Schedule of funding for CalPERS (unaudited):
EntryAge
NormalActuarialAccrued
Liability(AALU
Unfunded/(Overfunded)
ActuarialAccrueduability(UAALl
ActuarialValuation
Plan Date
ActuarialValue of
AssetsFunded
M2~
AnnualCovered
Payroll
UAAL asa % of
CoveredParoll
Misc. 6130/02 $498,057 507,610Safety 6130/02 381,311 328,395
Misc. 6W30/03 568,712 511,281Safety 6/30/03 413,125 329,673
Misc. 6130/04 611,841 537,352Safety 6/30104 454,795 440,172
(9,553) 101.9 72,257 (13.2)52,916 86.1 41,038 128.9
57,431 89.9 75,838 75.783,451 79.8 44,611 187.1
74,488 87.8 77.960 95.514,623 96.8 48,635 30.1
During the year, the City issued Pension Obligation Bonds (POB) in theamount of $60,000 in order to partially fund the unfunded actuarial accruedliability (UUAL) for non-safety employees. The projected actuarial certifiedunfunded liability for non-safety employees at June 30, 2005 was $73,400.Proceeds from the bonds of $59,434 were deposited with CalPERS which isrecorded as a special item in the Statements of Changes in Revenues,Expenditures and Changes in Fund Balances for the funds affected. A totalof $147,842 of net pension assets, which includes the 2004 POB sourceddeposit of $88,300, are included as a deferred charge in the Government-wide Statement of Net Assets. The deferred charge relating to the netpension assets will be amortized over 19 years in accordance with themethod used by CalPERS for calculating actuarial gains and losses.
14. Commitments and Contingencies
Fiscal YearJune 30.200320042005
Annual PensionCost (APC)
12,19620,05128,948
Percentage ofAPC Contributed
100%540%305%
Net PensionObligation
(Asset)$0
($88,300)($147,842)
A. Long-Term Electric Utility Commitments
Intermountain Power Aaency
The City's Electric Utility has entered into a Power Purchases Contract withthe Intermountain Power Agency (IPA) for delivery of electric power. TheCity's share of IPA power is equal to 7.6%, or approximately 137.1megawatts, of the generation output of IPA's 1,800 megawatt coal-fueledgenerating station, located in Central Utah. The contract expires in 2027 andthe debt fully matures in 2024.
50

CITY OF RIVERSIDENOTES TO BASIC FINANCIAL STATEMENTSFiscal Year Ended June 30, 2005 (amounts exoressed in thousands)
The contract constitutes an obligation of the Electric Utility to make paymentssolely from operating revenues and requires payment of certain minimumcharges, which are based on debt service requirements. Such payments areconsidered a cost of production and are quantified below.
IPA
Southern California Public Power Authority
FiscalYear
20062007200820092010ThereafterTotal
Inter-mountain
PowerProiect
$ 22.53222,36122,84722,08723,026269.997
LUZ=
Palo VerdeNuclear
GeneratingPreiect
$ 830825825825688
4,812
Trans-missionSystem
$ 6,9687,1926,6936,5756,329
1005.86
The Electric Utility is a member of the Southern California Public PowerAuthority (SCPPA), a joint powers agency. SCPPA provides for the financingand construction of electric generating and transmission projects forparticipation by some or all of its members. To the extent the Electric Utilityparticipates in projects developed by SCPPA, the Electric Utility is obligatedfor its proportionate share of the project cost The projects and the ElectricUtility's proportionate share of SCPPA's obligations are as follows:
SCPPA
HooverDam
Upratina
$ 708704704704703
Mead-Phoenix
Trans-mission
$ 1322592602592592,871
Mead-Adelanto
Trans-
$1,3882,8162,8192,8142,818
30,744
Total
$32,55834,15734,14833,26433,823
414.579
Take-or-pay commitments expire upon final maturity of outstanding bonds foreach project. Final fiscal year maturities are as follows:
ProiectPalo Verde Nuclear Generating StationSouthern Transmission SystemHoover Dam UpratingMead - Phoenix TransmissionMead - Adelanto Transmission
Terms of Take or Pay Commitments
Percent Share5.40%
10.20%31.91%4.00%
13.50%
Entitlement11.7MW
195.0MW30.0MW12.0MW
118.0MW
ProietIntermountain Power ProjectPalo Verde Nuclear Generating SystemSouthern Transmission SystemHoover Dam UpratingMead-Phoenix TransmissionMead-Adelanto Transmission
Final Maturity Date202420172023201720202020
As part of the take or pay commitments with IPA and SCPPA, the ElectricUtility has agreed to pay its share of current and long-term obligations.Payment for these obligations will be made from operating revenues receivedduring the year that payment is due. A long-term obligation has not beenrecorded on the accompanying financial statements for these commitments.Interest rates on the outstanding debt associated with the take or payobligations range from 3.0% to 6.125%. The following schedule details theamount of principal and interest, which is due and payable by the ElectricUtility for each project in the fiscal year indicated.
In addition to debt service, Riverside's entitlement requires the payment forfuel costs, operating and maintenance, administrative and general and othermiscellaneous costs associated with the generation and transmissionfacilities discussed above. These costs do not have a similar structuredpayment schedule as debt service and vary each year. The costs incurredfor 2004 and 2005 fiscal years are as follows:
Fiscal Yea IPA EY2005 21,362 1,906 1,714
MAP MPP Hoover Total212 43 90 25,327
B. Other Commitments
Power Purchase Agreements:
The City has executed five firm power purchase agreements for non-renewable power. The agreements are with Deseret Generation andTransmission Cooperative (Deseret) of Murray, Utah; CDWR; and BonnevillePower Administration (BPA). The minimum annual obligations under each ofthese contracts are shown in the table below.
51

CITY OF RIVERSIDENOTES TO BASIC FINANCIAL STATEMENTSFiscal Year Ended June 30. 2005 (amounts expressed in thousands)
Minimum Obligations 2005-2006
SuoolierDeseretCDWR IIICDWR IVBPA
Caoaaitv$3,463
523682
1.810
Enerav$1,839
Total$5,302
523682
1.810
The agreement with Deseret is for five megawatts of capacity and associatedenergy from January 1, 1992, through December 31, 1994, then increasingto 52 megawatts of capacity and associated energy through December 31,2009. A notice of termination of the power purchase agreement wasprovided to Deseret effective March 31, 1998, resulting in litigation that wassettled on July 31, 1999. Under the terms of the settlement agreement, thenotice of termination was rescinded and the power purchase agreement wasamended to reflect substantial price reductions after fiscal year 2002 throughthe term of the agreement in 2009. In exchange, the Electric Utility paidDeseret $25 million from reserves, which is reflected on the Statement of NetAssets as unamortized purchase power. On July 1, 2002, the Electric Utilitybegan to amortize the related price reductions, and will continue to amortizethe remaining balance over the term of the agreement using the straight-linemethod. As of June 30, 2005, unamortized purchased power was $15,034and the Electric Utility had recorded amortization of $3,341.
There are two separate agreements with CDWR. The two agreements,CDWR III and IV are for the purchase of 23 and 30 megawatts of capacityand associated energy from May through October. CDWR III and CDWR IVare for a period of 15 years beginning June 1, 1996, subject to termination. Inearly 2005, CDWR and the City disagreed upon whether the Power SaleAgreements III and IV were still in effect as of December 31, 2004. WhileCDWR believed the agreements were terminated, the City contended thatCDWR did not provide proper notification under the terms of the power saleagreements. During May and June, CDWR continued to provide powerunder the original terms of the contracts, pending staff's resolution of thedispute. On September 13, 2005, in order to maintain the City's long-termrelationship with CDWR and to avoid costly litigation, City Council approvedthe contract amendments, effectively terminating the contract in 2007 andreducing the final two years of the contracts to a period of May throughSeptember.An agreement with Bonneville Power Administration (BPA) is for a purchaseof firm capacity and associated energy of 23 megawatts in the summer and16 megawatts in the winter for a period of twenty years ending February 1,
2011. A second agreement with BPA was executed in 1996 and is for thepurchase of firm capacity (50 megawatts during the summer months and 13megawatts during the winter months) and associated energy beginning April30, 1996 for twenty years. Effective May 1, 1998, these summer and wintercapacity amounts increased to 60 and 15 magawatts, respectively, for theremainder of the second agreement
On July 8, 2003, and June 6, 2003, the City Council and Public UtilitiesBoard, respectively, adopted the Renewable Portfolio Standard to increaseprocurement of renewable resources to reach a target of 20 percent of theUtility's energy from renewable sources by 2015. The contracts in thefollowing table were executed as part of compliance with this standard. TheElectric Utility has agreements with Bonneville Power Administration for thepurchase of energy credits that add to the total renewable portfolio. In thecurrent year, renewable resources provided approximately 14 percent of theretail energy requirements, approximately 10 percent of the total powersupply.
Long-term renewable power purchase agreements:
SupplierMilliken GencoMid Valley GencoRiverside County(Badlands Landfill)WintecSalton SeaTotal
I=eLandfill GasLandfill Gas
Landfill GasWind
Geothermal
MaximumContract
2.3MW2.3MW
1.2MW1.3MW20.0MW
ContractExoiration12/31/200712/31/2007
12/31/20084/30/20185/31/2013
EstimatedAnnual Cost
for 2006$825
943
255162
9.619$11-80
Under the terms of the renewable power purchase agreements, Riverside'sfinancial obligation is only for actual energy delivered.On August 23, 2005, the City Council approved an amendment to the PowerSales Agreement between Salton Sea and the City. The agreementincreases the amount of renewable energy available to the City from thecurrent 20 MW to 46 MW effective June 1, 2009 through May 31, 2020, atthe same price under the current contract until 2013, with escalationthereafter based on an inflationary type index. Similar to other renewablepower purchase agreements, the City is only obligated for purchases ofenergy delivered to the City.
52

CITY OF RIVERSIDENOTES TO BASIC FINANCIAL STATEMENTSFiscal Year Ended June 30, 2005 (amounts expressed in thousands)
Construction Commitments:
As of June 30, 2005, the Electric Utility had major construction commitmentsof approximately $28,100 with respect to unfinished capital projects, of which$21,300 is for construction of an $85 million, 100 megawatt power plant Ofthese commitments, $1,400 is expected to be funded by others, $24,600funded by bonds and $2,100 funded by rates.
As of June 30, 2005, the Water Utility had major construction commitmentsof approximately $648 with respect to unfinished capital projects, which isexpected to be funded by rates.
C. Jointly Governed Organizations
On November 1, 1980, the City of Riverside joined with the cities of LosAngeles, Anaheim, Vernon, Azusa, Banning, Colton, Burbank, Glendale,Pasadena, and Imperial Irrigation District to create the Southern CaliforniaPublic Power Authority (SCPPA) by a Joint Powers Agreement under thelaws of the State of California. As of July 2001, the cities of Cerritos and SanMarcos were admitted as members of SCPPA. In August 2003, the Authorityrescinded the membership of the City of San Marcos, as the City no longermet the criteria for membership. The primary purpose of the Authority is toplan, finance, develop, acquire, construct, operate and maintain projects forthe generation and transmission of electric energy for sale to its participants.The Authority is governed by a Board of Directors, which consists of onerepresentative for each of the members. During the 2005 fiscal year, theElectric Utility paid approximately $13,032 to SCPPA under various take-or-pay contracts, which are described in greater detail in Note 14A. Thesepayments are reflected as a component of purchased power in the financialstatements.
On July 1, 1990, the City of Riverside joined with the cities of Azusa, Banningand Colton to create the Power Agency of California (Agency) by a JointPowers Agreement under the laws of the State of California. The City ofAnaheim joined the Agency on July, 1 1996. The primary purpose of theAgency is to take advantage of economies of scale resulting from the fivecities acting in concert. The Agency has the ability to plan, finance, develop,acquire, construct, operate and maintain projects for the generation andtransmission of electric energy for sale to its participants. The Agency isgoverned by a Board of Directors (the Board), which consists of onerepresentative for each of the members. The term of the Joint PowersAgreement is fifty years. On April 5, 2001 the Board placed the Agency in an
inactive status, effective June 30, 2001. It can only be reactivated withauthorization from the Agency Board.
On July 1, 1993, the City of Riverside joined with the cities of Anaheim,Colton, Compton, Healdsburg, Los Angeles, Palo Alto, Pasadena, Redding,the North Marin Water District, the Northern California Power Agency, theSacramento Municipal Utility District, and Turlock Irrigation District to createthe Financing Authority for Resource Efficiency of California (FARECal). TheCity of Santa Cruz joined in 1994, Trinity Public Utility District joined in 1996,and the cities of Azusa and Victorville joined in 2002. The primary purpose ofFARECal is to issue bonds and use the proceeds to promote, advance,encourage and participate in conservation, reclamation and other programsthat are designed to utilize energy or water resources more efficiently.FARECal is administered by a Board of Directors currently represented bythe cities of Anaheim, Colton, Palo Alto, Pasadena, Azusa, Riverside andTrinity Public Utility District
D. Jointly-Owned Utility Project
Pursuant to the Settlement Agreement with Southern California Edison(SCE) dated August 4, 1972, the City was granted the right to acquire a1.79% ownership interest in San Onofre Nuclear Generating Station(SONGS) Units 2 and 3. Pursuant to the Settlement Agreement, SCEagreed to provide the necessary transmission service to deliver the output ofSONGS to Riverside. SCE and the City entered into the SONGSParticipation Agreement which sets forth the terms and conditions underwhich the City, through the Electric Utility, participates in the ownership andoutput of SONGS. Other participants in this project include SCE, 75.05percent; San Diego Gas and Electric Company, 20.00 percent; and the Cityof Anaheim, 3.16 percent Maintenance and operation of SONGS remainsthe responsibility of SCE, as operating agent for the City.
SCE, as operating agent, has declared an *operating impairment' due todeterioration of the steam generators ("SGse), which would likely result inpermanent shutdown of the plant in the 2009-2010 timeframe. The estimatedcost to replace the SGs is $680 million, of which approximately $12.2 millionwould represent the City's share. The replacement is expected to enableplant operations through at least 2022, and perhaps beyond if NuclearRegulatory Commission approval is obtained. Although the City Council hasapproved participation in the replacement of the SGs, both the City ofAnaheim and San Diego Gas and Electric Company have opted not toparticipate. As a result, upon replacement of the SGs, Riverside will retain its
53

CITY OF RIVERSIDENOTES TO BASIC FINANCIAL STATEMENTSFiscal Year Ended June 30, 2005 (amounts expressed in thousands)
1.79 percent share and SCE will assume the interest of those entities optingout, for a combined 98.21 percent interest in both units 1 and 2 at SONGS.
There are no separate financial statements for the jointly-owned utility plantsince each participants interest in the utility plant and operating expenses isincluded in their respective financial statements. The Electric Utility's shareof the capitalized construction cost and operating expenses is included in thefinancial statements. As of June 30, 2005, Riverside's 1.79% share of thecapitalized construction costs for SONGS totaled $132,912 with accumulateddepreciation of $97,647. The Electric Utility made provisions during fiscalyear 2005 for nuclear fuel bum of $991 and for future decommissioning costof $1,581 (See Note 1). The Electric Utility's portion of current and long-termdebt associated with SONGS is included in the accompanying financialstatements.
As a participant in the SONGS, the Electric Utility could be subject toassessment of additional insurance premiums in the event of a nuclearincident at San Onofre or any other licensed reactor in the United States.
E. Contingencies
To comply with certain State and local regulations, the City is funding thecosts of closure and "final capping" of the Tequesquite landfill located in theCity. This area, comprised of approximately 120 acres, operated as a "ClassII Sanitary Landfill" until its closure in 1985. During its operation, the landfilldid not accept hazardous waste and no clean up and abatement or ceaseand desist orders have been issued to the City.
The estimated costs as determined by an independent consultant andupdated by the City's Engineering Department are associated with floodcontrol upgrades, remediation of possible ground water contamination andcontrol of methane gas. There Is the potential for these estimates to changedue to inflation, deflation, technology, or change In application laws orregulations. To fund the cost, the City imposed a landfill capping surchargeon customers effective August 1, 1988. The minimum unamortizedestimated cost of $4,955 is recorded as a deferred charge in theaccompanying financial statements of the Refuse fund and is beingamortized on a straight-line basis over the remaining post closure period,currently 26 years. The estimated cost of meeting the State's requirementswas increased by 2.2 million during 2002 based on the engineer's annualreview of closure and post-closure maintenance costs. Additionally,payments made during the year of $399 reduced that liability to its
June 30, 2005 balance of $3,723 as reflected in the balance sheet of theRefuse fund.
15. Special Item
In 1984 the City Council adopted a report by and recommendations of theRiverside Canal Abandonment Task Force, which outlined abandoning thoseportions of the Riverside Canal (*canalo) that do not serve any agriculturalwater conveyance purposes. One critical component of the abandonmentrequired significant construction of new storm drain facilities to carry waterthat would otherwise be carded in the canal. During the current fiscal year,the required construction by the Water Fund has been completed. Theremaining portions of the storm drain will be constructed in conjunction with adevelopment project planned adjacent to the canal, and upon completion, thewater fund will then abandon it's portions of the canal. These new facilitieswill be owned and operated by the Riverside County Flood Control District.As a result, the water fund has recorded a charge against operations in thecurrent period of $3,014, comprising $1,147 in current period and $1,867 inprior period construction costs.
16. Subsequent Event
On September 13, 2005, the City Council authorized the issuance of up to$130,000 Electric ($65,000 Series A and $65,000 Series B) and $65,000Water, variable rate, Revenue and Refunding bonds, in the form of AuctionRate Securities, to finance capital improvement programs and refund certainexisting Electric and Water bonds. $60,000 of Electric and $30,000 of Waterrevenue bonds will be used to finance the costs of certain improvements tothe City's Electric and Water System as part of the Capital ImprovementProgram. The remaining portion will be used to refund all the outstanding1994 Farecal bond issue and a portion of the outstanding 1998 and 2001Electric and Water bond issues.
The City Council also approved entering into synthetic interest rate swapagreements on the entire not-to-exceed $130,000 Electric and $65,000Water issuances. Under the swap agreements, the City pays thecounterparty a fixed rate of 3.201% on the Electric 2005 Series A, 3.204% onthe Electric 2005 Series B, and 3.2% on the Water 2005 Revenue andRefunding bonds. In exchange the City receives a floating rate index equalto 62.68% of the London Interbank Offered Rate (LIBOR), plus 12 basispoints.
54

CITY OF RIVERSIDENOTES TO BASIC FINANCIAL STATEMENTSFiscal Year Ended June 30. 2005 (amounts expressed in thousands)
Also on September 13, 2005. the City Council authorized a similarlystructured synthetic rate swap agreement for the outstanding $82,500Electric 2004 Series B, Auction Rate Securities. Under the swapagreement, the City pays the counterparty a fixed rate of 3.111% and inexchange the City receives a floating rate index equal to 62.68% of LIBOR,plus 12 basis points.
Although pricing has been determined, the actual issuance and closing forthe 2005 Revenue and Refunding bonds will occur on October 6, 2005.
Various risks associated with these derivative instruments (including credit,counterparty, basis, and tax risk) have been identified and analyzed, and areconsidered acceptable by management, in order to hedge against risinginterest rates and better manage the Electric and Water Utility's balancesheets.
55

-I I-

City of RiversideCombining Balance ShootNonmajor Governmental Funds
June 30, 2005
(amounts expressed in thousands)
Assets
Cash and investments
Cash and investments at fiscal agent
Receivables (net of allowances
for uncollectibles):
Interest
Property taxes
Accounts
Intergovernmental
Notes
Land & Improvements held for resale
Total assets
Liabilities and Fund Balances
Liabilities
Accounts payable
Retainage payable
Unearned revenue
Deposits
Due to other funds
Advances from other funds
Total liabilities
Fund balances (deficits):
Reserved for encumbrances
Reserved for notes receivable
Reserved for land and improvements
held for resale
Unreserved. designated for future operations
Unreserved, undesignated
Total fund balances (deficits)
Total liabilities and fund balances
Special RevenueHousing & Redevelop- NPDES
Air Quality Community ment Special Storm
Ubrary Gas Tax improvement Development Agency Designation Drain Total
$ 2,568 $ 9,430 $ 439 $ 133 $ 4,243 $ 1,666 $ - $ 18,479
- 6 12,702 12,708
362
12
$ 2,942
101
492
4
22,3045,662
31
7.240
16
315
$ 10,023 $ 443 $ 8,107
106
$ 24.322 $ 1,682 $ 315
152362
2
3,123
12,902
106
$ 47,834
$ 1,088
753
13,260
10
1,445
3,170
19,726
141 $ 379
745
308
3 $ 5488
5,798
$ 16 $
7,154
10
- S 1
2,548
2,997
111
1.565
(1,731)
(55)
$ 2,942
- - 1,131- .622
1,124 3 8,107
- 314
7,180 315
1,368 1 710 73487
2,92487
3,861 1343,670 305 (710)8,899 440
$ 10,023 $ 443 $ 8.107
106 106
13,984 19,544
2,231 1,682 5,447
17,142 1,682 28,108
$ 24,322 $ 1,682 $ 315 $ 47,834
continued
57

City of RiversideCombining Balance SheetNonnmajor Governmental Funds
June 30, 2005(amounts expressed In thousands)
AssetsCash and investmentsCash and investments at fiscal agentReceivables (net of allowances
for uncollactibles):
InterestAccounts
IntergovernmentalPrepaid Items
Advances to other funds
Land & improvements held for resaleTotal assets:
Debt ServiceRiversideMunicipal
Debt ImprovementsService Corporation
$ 47 $ 92642
capital Projects
Total$ 139
642
CapitalOutlay
$ 44.419
Special
capitalImprovement
$ 22.1006.434
stormDrain
$ 4,336Transportation$
I 1 43852
5,026
235
165523
4513
4
118
$ 47 $ 735 $ 782m210 WEMMNM
$ 49,935 $ 29,457 $ 4,398 $ 118
Uabillties and Fund BalancesUabilites
Accounts payable
Retalnage payableUnearned revenue
Due to other fundsAdvances from other funds
Total liabilities
S . $ - $ $ 1,26192
1,396
$ 126611
23
507
1,267
$ $ 2
25 2749
5,000
7,749 25 78
Fund balances
Reserved for encumbrancesReserved for Interfund receivable
Reserved for debt serviceReserved for prepaid Items
Unreserved, designated for future operationsUnreserved, undesignated
Total fund balancesTotal liabilities and fund balances
14,351 1.207 374
4
47 735 782
47 735
$ 47 $ 735I |MMNMM
782$ 782
27.467
36842.186
$ 49,935
523
13,18313,277
28.190$ 29,457
3.289706
4.373$ 4.398
4040
$ 118
58

City of Riverside
Combining Balance SheetNo o Gowesnmena Funds
June 30, 2005
(amounta expressed In thousand)
Capiaprojects
Redevelop.ment
Agency TotaW$ 22.937 $ 93.792
19.640 26.074
Penmanent
Fund
special$ 1,200
Asset
Cash and invesbnents
Cash end investments at fiscal agentReceivables (net of llowances
for uncolctibles):
Interest
Property Taxes
AccountsIntergovemmental
Notes
Prepald itemsAdvances to other funds
Land & Improvements held for resale
Total easets:
~iabliitie and Fund Balances
LiabilitesAccounts payable
Retanage payableUnearned revenue
Deposits
Due to other fundsAdvances from other funds
Total iabilites
Fund balancesReserved for encumbrances
Reserved for interfund receivable
Reserved for debt serviceReserved for library services
Reserved for prepaid Items
Reserved for notes receivableReserved for land and Improvements
held for resale
Unreserved. designated for future operations
Unreserved, undesignated
Total fund balances
Total Ilab"*es and fund balances
225
106505
4.222
3.829
2286.280
$ 57.972
943
171
5.814
4=222
4.352
232
8.280
$ 141,880 $ 1,200I-
Total
NoninworGoveonmentai
Funds
$ 113,610
39.424
1.096
382
173
8.937
17,124
4,352
232
6.386$ 191.696
$ 3.67 $ 5.058 $
28 731
3.891 5.38234 34
5566,832 11,832
14.452 23.571
$ 6.144
1.484
18.622
1,983
228
3.829
427
6.280
27.745
3.028
43,520
$ 57.972
17.915
232
4,352427
6.280
71,684
17.419
118.309
S 141,880
1.073
127
1.200
1 1,200
2.001
15,002
43.297
20.639
232
7821.073
4.352
614
6.38691,355
22868148,399
$ 191.696
59

City of RiversideCombining Statement of Revenues, Expenditures, and Changes In Fund BalancesNonmajor Governmental FundsFor the fiscal year ended June 30, 2005(amounts expressed in thousands)
Special RevenueHousing and Redevelop-Community mentDevelopment AgencyUbrary Gas Tax
Air QualityImprovement
SpecialDesignation
NPDESStormDrain
RevenuesTaxesIntergovernmentalCharges for servicesFines and forfeituresSpecial assessmentsRental and investment incomeMiscellaneous
Total revenues
Expenditures
Current:General governmentCulture and recreation
Capital outlayTotal expenditures
Excess (deficiency) of revenues over (under) expenditures
Other financing sources (uses)
Transfers inTransfers outProceeds from issuance of long-term obligationsSale of capital assets
Total other financing sources (uses) before special item
Special item - pension contribution
Net Change in fund balances
Fund balances (deficits) - beginningFund balances (deficits) - ending
$ 4,796
191
8210
15
25
5,245
7,820
7,820
(2,575)
$
5.708
$ - $ - $ 4,248 $
331 8,984 -$
178
24
5,910
1,168
4,379
5,547
363
8
339
63
1,998
11,045
167 953
21188
151
9,47510,428
617
297
317
4,862
860
941
1,801
3,061
200
(2,517)
12,700
(170)
10,213
13,274
33
127
160
2C
735
59
59
Total
- $ 9,044
15,214
8
210
i5 595
594
2,491
95 28,156
10 3,348
7,820
5 14.931
15 26,099
0 2,057160
(657)
(657)
(497)
11
31
28
497
1,232
(2,524)
(3.807)
3,812
$ (55)
363
8,536$ 8,899
(617)
280
935
(3.174)
12,700
327
10,788
(3,141)
9,704
18,404
$ 28,108
continued
151
289$ 440
3,868 2.179 (280)
$ 17,142 $ 1.682
60

City of RiversideCombining Statement of Revenues, Expenditures, and Changes In Fund BalancesNonmajor Governmental FundsFor the fiscal year ended June 30,2006(amounts expressed in thousands)
DebtService
RevenuesTaxes $Ucenses and permitsIntergovernmental
Charges for servicesFines and forfeituresSpecial assessmentsRental and investment incomeMiscellaneous
Total revenues
ExpendituresCurrent
General governmentCulture and recreation
Capital outlayDebt service:
PrincipalInterest
Total expenditures
Excess (deficiency) of revenues over (under) expenditures
Other financing sources (use")Transfers inTransfers outProceeds from issuance of long-term obligationsSale of capital assets
Total other financing sources (uses)
Net Change in fund balances
Fund balances (deficits) - beginning 4Fund balances - ending $ 4
Debt ServiceRiversideMunicipal
improvementsCorporation Totals
Capital Projects
SpecialCapital CapitalOutlay Improvement
Storm TransportationDrain Projects
$ - $ $ $5,961 1.054
10,519
1 898 899
1 898 899
1,527811
23613.093
525162
6,648
328279
1,247
352
352
7 7 56 38
6,656 920 29016,506
570 570311 311888 888
1 10 11
16,562
(3,469)
6,694
(46)
520(130)
920
327
(520)
(520)
(193)
4.566$ 4.373
290
62
62
(22)$ 40
continued
1 10 11
6 725 771$7 735 $ 782
382382
(3,087)
45,273
$ 42.186
390
344
27,846$ 28,190
61

City of RiversideCombining Statement of Revenues, Expenditures, and Changes in Fund BalancesNonmajor Governmental FundsFor the fiscal year ended June 30, 2005(amounts expressed in thousands)
Capital ProjectsRedevelop-
ment
Agency TotalRevenues
Taxes
Licenses and pennitsIntergovernmentalCharges for servicesFines and forfeituresSpecial assessmentsRental and investment incomeMiscellaneous
Total revenues
ExpendituresCurrent
General government
Culture and recreationCapital outlayDebt servne:
PrincipalInterest
Total expenditures
Deficiency of revenues under expenditures
Other financing sources (uses)Transfers inTransfers outProceeds from issuance of long-term obligations
Sale of capital assetsTotal other financing sources before special item
Special Item - pension contribution
Net Change in fund balances
Fund balances - beginningFund balances - ending
917
13
1,2401,572
3,742
3,739
9,063
12802
(9,060)
17,068
(6,058)1,4245,429
17,863
(787)
8,016
35,504$ 43.520
7,01511,788
131,5592,6582,049
25,082
3,833
33,435
37,268
(12,186)
17,588
(6,708)1,4245,811
18,115
(787)
5,142
113,167$ 118,309
PermanentFund Total
NonmajorLibrary GovernmentalSpecial Funds
$ $ 9,044
7,01527,002
8
2232,154
27 4,178116 4,656143 54,280
1627,1887,982
48,366
570311
162 64.417
(19) (10,137)
(19)
1,219
S 1,200
18,523
(9,882)14.1246.138
28,903
(3,928)
14,838
133,561$ 148,399
62

City of RiversideSchedule of Revenues, Expenditures and Changes In Fund Balances -Budget and Actual
Nonmajor Governmental Funds
For the fiscal year ended June 30, 2005
(amounts expressed In thousands)
Special Revenue
Library Gas Tax Air Quality ImprovementVariance
RevenuesTaxesUcenses and permitsIntergovernmentalCharges for servicesFines and forfeituresSpecial assessmentsRental and Investment IncomeMiscellaneous
Total revenues
ExpendituresCurrentGeneral governmentCulture and recreation
Capital outlay
Total expenditures
Excess (deficiency) of revenues over (under) expenditures
Other financing sources (uses)Transfers InTransfers outSale of capital assetsTotal other financing sources
Special Item - pension contribution
Net change in fund balances
Fund balances, beginningFund balances, ending
FinalBudget
4,468
2769
200
14115
5,082
9,606
9,606
(4,524)
735
735
(3,789)
3,812$ 23
Varianceto Final Final
Actual Budget Budgetto Final Final
Actual Budget Budgetto Final
Actual Budget
Variance
$ 4,796
1918
210
1525
5,245
7.820
7,820
(2,575)
735
4971,232
(2,524)
(3,867)
3,812
T (55)
$ 328 $
(85) 5,050(1)
10
1 250(90)
163 5,300
1,1791,786
- 10,785
1,786 11,9864
1,949 (6,664)
497497
(2,524)
(78) (6,664)
8,536
$ (78) $ 1,872
63
$
5,708
$
658
$
473
$
331
17824
5,910
(72)24
610
1,168 11
4,379
5,547
363
363
8,536$ 8.899
6,406
6,417
7,027
7,027
7,027
473
289
102
391
82
82
289$ 371
8
339
167
21
188
151
151
289$ 440
$
(142)
8
(134)
122
81
203
69
69
$ 69
continued

City of RiversideSchedule of Revenues, Expenditures and Change" in Fund Balances -Budget and ActualNonmajor Governmental FundsFor the fiscal year ended June 30, 2006(amounts expressed In thousands)
Special RevenueHousing & Community Development
VarianceRedevelopment Agency
VarianceSpecial Designation
VarianceFinal
Budgetto Final Final
Actual Budget Budgetto Final Final
Actual Budget Budgetto Final
Actual Budget
RevenuesTaxesLicenses and permitsIntergovernmentalCharges for servicesFines and forfeituresRental and investment income
Miscellaneous
Total revenues
ExpendituresCurrent
General government
Capital outlay
Total expenditures
Excess (deficiency) of revenues over (under) expenditures
Other financing sources (uses)
Transfers inTransfers outProceeds from issuance of long-term obligations
Sale of capital assets
Total other financing sources (uses) before special item
Special item - pension contribution
Net change In fund balances
Fund balances, beginningFund balances (deficits), ending
$ - $
17,058 8,984
19 632,044 1,998
19,121 11,045
1.072 95318,078 9,475
19,150 10,428
(29) 617
- (617)
(29) -
$ (29) $
$
(8,074)
44(46)
(8,076)
1198.603
8,722
646
(617)
29
$ 29
64
$ 3.360 $ 4.248 $ 888 $ - $ $
5765
3,482
98814,998
15,986
(12,504)
200(2,517)12,700
10,383
(2,121)
3,868$ 1,747
297317
4,862
860941
1,801
3,061
200(2,517)12,700
(170)10,213
13,274
3,868$ 17,142
240252
1,380
12814,057
14,185
15,565
(170)(170)
15,395
$ 15,395
35
35
35
(657)
(657)
(622)
2,179$ 1,557
33127
160
160
(657)
(657)
(497)
2,179$ 1,682
(2)127
125
125
125
$ 125

City of RiversideSchedule of Revenues, Expenditures and Changes in Fund Balances -Budget and ActualNonmajor Governmental FundsFor the fiscal year ended June 30, 2005(amounts expressed in thousands)
Special Revenue Capital ProjectsNPDES Storm Drain Capital Outlay Special Capital improvements
FinalBudget
Varianceto Final
Actual BudgetFinal
Budget
Varianceto Final Final
Actual Budget Budget
Varianceto Final
Actual Budget
RevenuesLicenses and permitsIntergovernmentalSpecial assessmentsRental and investment IncomeMiscellaneous
. $
595397
- $- 24,656
198 350- 500
157
10,5191,527
811236
$ $ $ 5.961(14,137) 365
1,177311 52579 22 162
$ 5.961(365)
525140
Total revenues 397 595 198 25,663 13,093 (12,570) 387 6,648 6,261
ExpendituresCurrent
General governmentCapital outlay
Total expenditures
Excess (deficiency) of revenues over (under) expenditures
447 200 247 123 5693 115 (22) 66.306 16,506
540 315 225 66.429 16,562
6749,800
49,887
21,120
21.120
386,656
6,694
(38)14,464
14,426
(143) 280 423 (40,766) (3,469) 37.297
Other financing sources (uses)Transfers inTransfers outSale of capital assets
Total other financing sources
Net change in fund balances
Fund balances (deficits), beginningFund balances (deficits), ending
(20,733) (46) 20,687
520 520
- (130) (130)
520 390 (130)* -382 382* -382 382
(143) 280 423 (40,766) (3,087) 37,679 (20,213) 344 20,557
(280)$ (423)
(280)$
45,273 45,273 27,846 27.846$ 423 $ 4,507 $ 42,186 $ 37,679 $ 7,633 $ 28,190 $ 20.557
- -MM1MX- = MMM1==M -
65
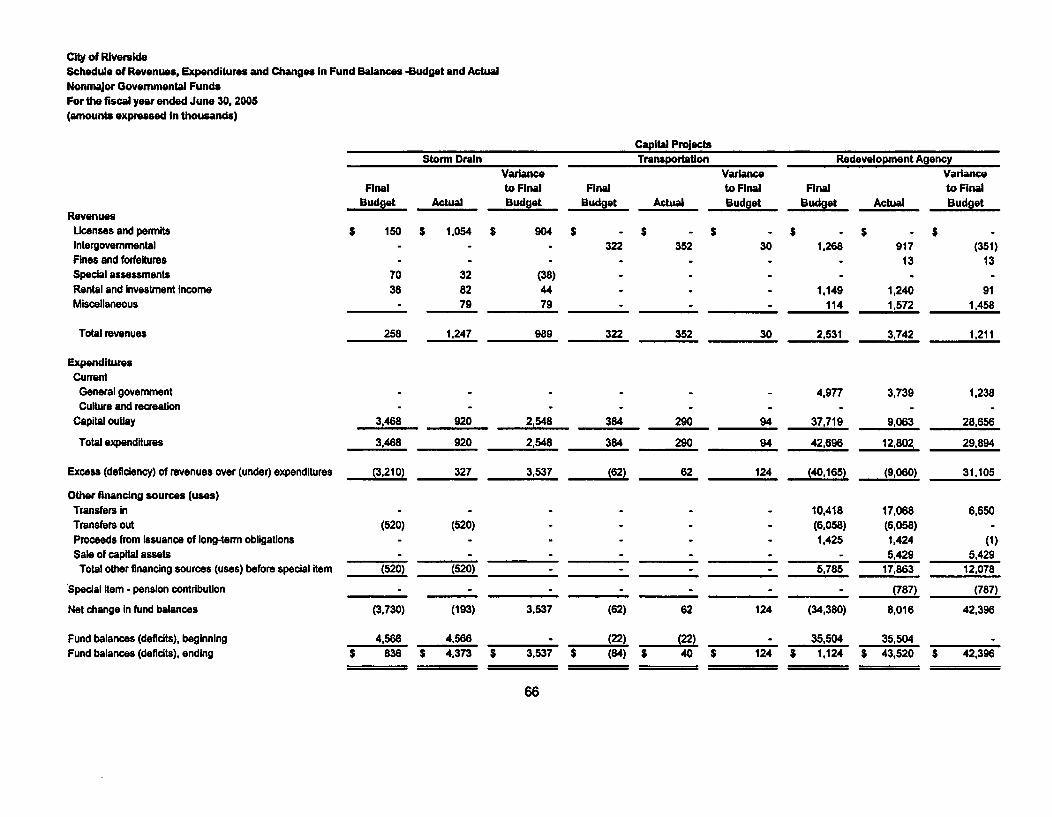
City of RiversideSchedule of Revenues, Expenditures and Changes In Fund Balances -Budget and Actual
Nonmajor Governmental FundsFor the fiscal year ended June 30, 2005(amounts expressed in thousands)
Capital ProjectsStorm Drain Transportation
RevenuesLicenses and permitsIntergovernmentalFines and forfeituresSpecial assessmentsRental and investment incomeMiscellaneous
Total revenues
FinalBudget
$ 150
7038
258
Actual
$ 1.054
328279
1,247
Varianceto FinalBudget
$ 904
(38)4479
989
FinalBudget
$322
322
Actual
Varianceto FinalBudget
Redevelopment AgencyVariance
Final to FinalBudget Actual Budget
$ - $ $352 30
352 30
ExpendituresCurrent
General government
Culture and recreationCapital outlay
Total expenditures
Excess (deficiency) of revenues over (under) expenditures
Other financing sources (uses)Transfers inTransfers outProceeds from Issuance of long-term obligations
Sale of capital assetsTotal other financing sources (uses) before special item
'Special item - pension contribution
Net change in fund balances
Fund balances (deficits), beginningFund balances (deficits), ending
3,468 920 2,548 384 290 94
3,468 920 2,548 384 290 94
(3,210) 327 3,537 (62) 62 124
1.268
1.149114
2,531
4,977
37,719
42.696
(40,165)
10,418(6,058)1,425
5,785
(34,380)
35,504$ 1,124
91713
1,2401,572
3.742
3,739
9,063
12.80Z
(9,060)
17,068(6,058)1,424
5,42917,863
(787)
8,016
35,504$ 43,520
(351)13
911,458
1,211
1,238
28,656
29,894
31,105
6,650
(1)5,429
12,078
(787)
42,396
$ 42,396
(520)
(520)
(3,730)
(520) -
(520) - -(62) 62.124
(193) 3,537 (82) 62 124
4,586 4,566 - (22) (22) e
$ 838 $ 4,373 $ 3.537 $ (84) $ 40 $ 124
66

City of RiversideCombining Statement of Not AssetsNonmajor Enterprise FundsJune 30, 2006(amounts expressed In thousands)
Trans- Publicportation ParklngAssets
Current assets:Cash and investmentsReceivables (net of allowances for uncollectibles)InterestUtility billedUtility unbilledAccountsIntergovernmental
Prepaid itemsRestricted assets:
Cash and cash equivalentsTotal current assets
Non-current assets:Deferred chargesCapital assets:
LandBuildingsAccumulated depreciation-buildingsImprovements other than buildingsAccumulated depreciation-Improvements other than buildingsMachinery and equipmentAccumulated depreciation-machinery and equipmentConstruction in progressTotal non-current assets
Airport Refuse Total
$ 123 $ 4,778 $ $ 2,301 $
4 9442859667
7,202
98428596271
2,1301
161431,664 466
1
_ 3,217 3,2171,834 9,180 467 2,462 13,943
256
7,0612,114(770)
6,853(2,692)
276(117)
4,89317,874
6,349 671
22(6)
188
2,1032,373(1,693)
325(325)422(416)
16,66619,643
8,325(5,555)
1,653(894)
7,464
9,1644,509(2,469)7,178(3,017)10,676(6,982)21,56748,090
62,033
continued
89,119 1,454
Total assets 19,708 18,299 1,921 22,105
67

City of RiversideCombining Statement of Net AssetsNonmajor Enterprise FundsJune 30,2005(amounts expressed In thousands)
Liabilities
Current liabilities:Accounts payableAccrued payrollUnearned revenueDue to other fundsCapital leases-current
Total current liabilities
Airport RefuseTrans-
portationPublicParking
Noncurrent liabilities:Capital leasesAdvances from other fundsLandfill cappingTotal noncurrent liabilitiesTotal liabilities
71756
101
17891
217508
7251,616
14,221
3,871$ 18.092
508675
12142117284
1,183 555 1,193
50332
1657
Total
1,74090521994117
3,822
2175,2923,7239.232
13,054
20,8453,217
24,917$ 48,979
2.9173.7236,6407,823
1,2613,2175,998
$ 10,476
677
6771,232
1,190
1,1902,383
Net assetsInvested In capital assets, net of related debtRestricted for other purposesUnrestricted
Total net assets
783 4,580
(94) 15,142$ 689 $ 19,722
68

City of RiversideCombining Statement of Revenues, Expenses, and Changes In Fund Not Assets
Nonmajor Enterprise Funds
For the Year Ended June 30, 2005(amounts expressed in thousands)
Trans-Portatson
Operating revenues:Charges for services
Operating expenses:
Personal servicesContractual services
Maintenance and operation
GeneralMaterials and supplies
InsuranceDepreciation and amortization
Total operating expenses
Operating income (loss)
Nonoperating revenues (expenses):
Operating grants
Interest IncomeOther
Loss on retirement of capital assets
Interest expenses and fiscal charges
Total nonoperating revenues
Income (loss) before capital contributions
and transfers
Capital contributionsTransfers in
Change In net assets
Total net assets - beginning
Total net assets - ending
Airport
$ 1,088
447
23186222
13
27242
1,160
(72)
182
1,829
(275)
(25)
1,711
1,639
37
99
1,775
16,317
18.092
Refuse
$ 14,492
2,6862,944
4,1131,625
608147
664
12,787
1,705
150169
(54)
265
1,970
179
193
2,342
8,134
$ 10,476
Public Parking Totals
$ 200 $ 2,961
1.36024
3291568191188301
2,551
(2,351)
2,079
(60)(6)
2,013
322672179
(496)3
7468
822
2,139
137
(2)
135
$ 18,741
4,8153,663
4,8071,509
815436
1,275
17,320
1,421
2,261
2871.998
(335)
(87)
4,124
5,545
260
6,456
12.261
36.718
$ 48,979
(338) 2.274
(294)
983
689
6.164
8,438
11,284
$ 19,722
69

City of RiversideCombining Statement of Cash FlowsNonmajor Enterprise FundsFor the fiscal year ended June 30, 2005(amounts expressed in thousands)
Airport RefuseTrans- Public
portation Parking
Cash flows from operating activities:Cash received from customers and usersCash paid to employees for servicesCash paid to other suppliers of goods or services
Other receipts (payments)
Net cash provided (used) by operating activities
Cash flows from noncapital financing activities:
Transfers InOperating grantsAdvances from interfund receivablesPayments on Interfund receivables
Advances to other fundsNet cash provided (used) by noncapital financing activities
Cash flows from capital and related financing activities:Purchase of capital assetsProceeds from the sale of capital assets
Principal paid on long-term obligationsInterest paid on long-term obligationsCapital contributions
Net cash used for capital and related financing activities
Cash flows from investing activities:Income from investments
Net cash provided by investing activities
Net increase (decrease) in cash and cash equivalents
Cash and cash equivalents, beginning
Cash and cash equivalents, ending
1,107(437)(5O4)
(3,063)
$ 14,533(2,697)
(10,271)169
$ 200(1,412)
(617)
2,924(325)(665)
(1,389)
Totals
$ 18,764(4,871)
(12.057)(4,283)
(2,897) 1,734 (1,829) 545 (2,447)
99182
2,913
193 - 6,1641,783
5,8361,000
1,783 13,000
6.4561.9658,7491,000(839)
17,331(88) (751)
3,106 (558)
(1,283)
(4)(24)
(866)
(41)
(159)5
(11,382) (13,690)5(4)
(65)
(1,311I) (907)44 - 44
(110) (11,382) (13,710)
(1,102)
1,225
123
136
136
405
7,590
$ 7,995
138
138
2,301(156)
274
274
1,448
8,971
$ 10,419
continued
156
-$ 2,301
70

City of RiversideCombining Statement of Cash Flows
Nonamajor Enterprise FundsFor the fiscal year ended June 30, 2005
(amounts expressed in thousands)Trans. Public
Airport Refuse portation Parking Totals
Reconciliation of operating Income (loss) to net cash provided(used) by operating activities:
Operating Income (loss)Other receiptsAdjustments to reconcile operating income (loss) to
net cash provided (used) by operating activities:
Depreciation and amortizationIncrease In utility billed receivableIncrease in utility unbilled receivable(Increase) decrease in accounts receivableDecrease in intergovernmental receivable
(Increase) in prepaid items(Decrease) in accounts payable
Increase (decrease) In accrued payrollIncrease (decrease) in deferred revenueIncrease (decrease) in due to other fundsDecrease In landfill capping
Net cash provided (used) by operating activities
Noncash financing and Investing activities:
Capital contributionsAdvance from other funds - pension obligation bonds
(72) $ 1,705 $1,829 169
(2,351) $
301
2,139 $ 1.4211,998
242
19
66423(24)47
68 1,27523
(24)29(37)
(1,661) -- (1,661)(1) (1)
(15) (398) (10) (233) (656)
10 (11) (52) (3) (56)
24 (42) (18)
(3,273) - 284 (1.389) (4,378)
(399) - (399)
$ (2,897) $ 1.734 $ (1,829) $ 545 $ (2,447)
$ 37 $258
179 $1,407
- $677
S$ 216190 2,532
71

-I I-
-4I II4-l

City of Riverside
Combining Statement of Net AssetsInternal Service FundsJune 30,2005(amounts expressed In thousands)
Assets
Current assets:Cash and InvestmentsReceivables (net of allowances for uncollectibles):
InterestAccountsIntergovernmental
InventoryPrepaid items
Total Current assetsDeferred chargesAdvances to other fundsCapital assets:
BuildingsAccumulated depreciation-buildingsMachinery and equipmentAccumulated depreclation-machinery and equipment
Capital assets (net of accumulated depreciation)
Total assets
Liabilities
Current liabilities:Accounts payableAccrued payrollRetainage payableClaims and judgmentsDepositsDue to other funds
Total current liabilities
Advances from other fundsTotal liabilities
Net AssetsInvested in capital assets, net of related debtUnrestictedTotal net assets
Workers'Compensation
$ 8.683
90
52
8,825245
2,506
7(7)
11.576
Self InsuranceUnemploymentCompensation
Public Central CentralLiability Stores Garage Totals
524 $ 9,419 $
6 103
. $ 1.510 $ 20.136
24.369
7
1462
374
530 9,522
9.522
4,378257
180(134)
46
4,681
1,906
1,155
1.488(32)
9,148
(7,063)
3,541
6,602530
2136
564,743
725,161
1.6572,506
1,488(32)
9.335(7,204)
3,587
32.911
397624
4717,549
193,979
22,615
1.67224,287
3.5875,037
$ 8,624
8-96-
11,147 7619 -
11,270 76
247 -
11,517 76
59 454
$ 59 $ 454
64 18594
14043447
6,326
- 3,979
6.390 4.258
- 259
6.390 4,517
621
1.1661,787
3,5411,274
$ 4,8153.132
$ 3,132
46118
$ 164
73

City of RiversideCombining Statement of Revenues, Expenses, and Changes in Fund Net AssetsInternal Service FundsFor the fiscal year ended June 30, 2005(amounts expressed In thousands)
Operating revenues:Charges for services
Operating expenses:Personal servicesContractual servicesMaintenance and operationGeneralMaterials and suppliesInsuranceDepreciation and amortization
Total operating expenses
Operating income (loss)
Nonoperating revenues (expenses):Interest incomeOtherGain (loss) on retirement of capital assetsInterest expense and fiscal charges
Total nonoperating revenues (expenses)
Income (loss) before capital contributionsCapital contributions
Change in net assetsTotal net assets - beginningTotal not assets - ending
Workers'
Compensation
$ 3,205
446
5055
342
4
3,2564
4,157
(952)
371
(1)(2)
368
Self insuredUnemployment Public Central CentralCompensation Liability Stores Garage Totals
$ 64 $ 7,140 $ 2.484 $ 4,480 $ 17,373
487 2,033 2,9666 6 62
- 1 24 1,244 1,3249 350 335 570 1,606- - 10 115 129
92 4,333 12 45 7,738- - 14 749 767
101 4,690 882 4,762 14,592
(37) 2,450 1,602 (282) 2.781
18 251 48 688- (279) (279)
-- 90 89
(2) (11) (15)
18 251 (2) (152) 483
(584) - (19) - 2,701 - 1,600 - (434) 3,264- 26 26
(584) (19) 2,701 1,600 (408) 3.290643 473 431 (1,436) 5.223 5,334
$ 59 $ 454 $ 3,132 $ 164 $ 4,815 $ 8,624
74

City of RiversideCombining Statement of Cash FlowsInternal Service FundsFor the fiscal year ended June 30, 2005(amounts expressed in thousands)
Self Insured
Workers'Compensation
UnemploymentCompensation
Public Central CentralUability Stores Garage Total
Cash flows from operating activities:Cash received from customers and usersCash paid to employees for servicesCash paid to other suppliers of goods or servicesOther (payments)Net cash provided (used) by operating activities
Cash flows from noncapital financing activities:
Payments on Interfund receivables
Net cash provided by noncapital financing activities
Cash flows from capital and related financing activities:Purchase of capital assetsProceeds from the sale of capital assetsNet cash provided (used) for capital and relatedfinancing activities
Cash flows from Investing activities:Income from investments
Net cash provided by Investing activities
Net increase (decrease) in cash and cash equivalents
$ 3,175 $(453)
(3,760)
64 $ 7,140 $ 2,484- - (489)
(101) (4,571) (1,994)(1)
(37) 2,569
$ 4,905(2,207)(2,039)
(279)380
$ 17,768(3,149)
(12,465)(280)
1,874(1,038)
547547
13 560
13 560
1 -
I * -
(930) (930)75 76
(855) (854)
366
366
(124)
8,807
$ 8,683
17
17
(20)
544
$ 524
220
220
2,802
6,617
$ 9,419
5050
(425)
653
653
2,233
17.903
$ 20,136continued
Cash and cash equivalents, beginning
Cash and cash equivalents, ending
1,935
$ - $ 1,510
75

City of RiversideCombining Statement of Cash FlowsInternal Service FundsFor the fiscal year ended June 30, 2005(amounts expressed in thousands)
Self Insured
Reconciliation of operating Income (loss) to net cashprovided (used) by operating activities:
Operating Income (loss)Other (payments)
Adjustments to reconcile operating Income (loss) tonet cash provided (used) by operating activities:Depreciation and amortization(Increase) in accounts receivable(increase) decrease In Intergovernmental receivables(increase) in Inventoryincrease (decrease) In accounts payable(Decrease) in accrued payroll(Decrease) in unearned revenueIncrease in due to other fundsIncrease in claims and judgments
Net cash provided (used) by operating activities
Noncash financing and Investing activities:Capital contributionsAdvance from other funds - pension obligation bond
Workers'Compensation
UnemploymentCompensation
Public Central CentralLiability Stores Garage Total
$ (952) $ (37) $ 2,450 $ 1,602(1)
$ (282) $(279)
2,781(280)
4 14
(30)
(83)(7)
(116)(1,786)
36(2)
137
749(6)
421(63)
(120)(6)
(34)
$ 380
767(6)
391(1,849)
(283)(15)(34)137265
$ 1,874
$ 261.672
30(1,038) $ (37)
235
$ 2,569 $
$ 24$247
. $ - S - $ 26259 1,166
76

City of Riv 9rscIdeFrciuatary Fumd - Agency Fun diCarmb~ning Statemeant afClhanges In Assets and LrablflllesFor the Fiscal Year Ended J tne 30~, 2005(aiouistasi epressed ina thousands)
Balance BalanaceJuly 1. June 30,2004 Add~itins DeOductiosts 1006
Ass ets:Cash and investmentasCash and Invesinlerbis at fiscal' agentk~teuesi. ieooivableRoperfy iaxes rsceiwatfeTot-alI a s els
5 4,952 $ 9,9309,395 11.520
34 297205 168
14,586 $ 21,913
$ 11,6916,91-9
283205
$ 19,29a
$ 2. W
$ 17,201
Liabilities:Accounts payableDue to olier kundf9Held to r bond hold easTotal liabilities
S1 $ 134 $ 134 $ 10 6 0 6
14,585 12,811 10,202 17,194$ 14,586 $ 12,951 $ W0,336 $ 17,201
77

I .....
- I I-

city of RiversideCapital Assets Used In the Operation of Governmental Funds
Schedule By Source
June 30, 2005
(amounts expressed in thousands)
Governmental funds capital assets:LandBuildings and improvementsImprovements other than buildingsMachinery and equipmentInfrastructureConstruction in progress
Total governmental funds capital assets
$ 124,475
69,391
46,497
54,802
461,357
39,271
$ 795,793
Investments In governmental funds capital assets by source:Certificates of participation $ 24,818Gifts 32,707Operating revenue 114,457General obligation bonds 4,536Revenue bonds 21,104County contracts and grants 218State grants 29,035Asset forfeiture - state 264Asset forfeiture - federal 657Housing and community development grants 14,678Other federal grants 14,987'Community facilities bonds 1,026Assessment district bonds 397Capital leases 9,616RDA tax Increment bonds 2.279Capital projects funds 525,014
Total governmental funds capital assets $ 795,793
79

City of RiversideCapital Assets Used in the Operation of Governmental FundsSchedule By Function and ActivityJune 30, 2005(amount expressed In thousands)
Land
Construction InProgress/Buildings
andImprovements
$ 18,42827,33414,05978,516
370
Construction inProgress/
ImprovementsOther thanBuildings
$ 2,9782,441
011,032
0
Machineryand
Equipment Infrastructure Total
General governmentPublic safetyHighways and streetsRecreation and culture
Community development
2,8291,913
97,10421,340
1,289
6,052
29,760
14,549
4,158
284
$ 0 $ 30,2870 61.448
461,357 587,069
0 115,046
0 1,943
Total governmental funds capital assets $ 124,475 $ 138,707 $ 16,451 $ 64,803 $ 461,357 $ 795,793
80

City of RiversideCapital Assets Used In the Operation of Governmental FundsSchedule of Changes By Function and ActivityFor the fiscal year ended June 30, 2005(amount expressed in thousands)
GovernmentalFunds Capital
AssetsJuly 1, 2004 Additions
GovernmentalFunds Capital
Deductions and Assets
Transfers June 30,2005
General governmentPublic safety
Highways and streets
Recreation and culture
Community development
$ 23,16653,628
556,499106.14010,358
$ 8,2429,017
37,53711.482
7
$ 1,1201,1976,9682,5768,422
$ 30,28861,448
587.068
115,0461.943
Total governmental funds capital assets $ 749,791 $ 66,285 $ 20,283 $ 795,793
81

-I
b -

Table 1City of RiversideGeneral Governmental Expenditures by FunctionLast Ton Fiscal Years LastTenFiscl Yars(in thousands)
Fiscal General Public Highways & C1Year Government Safety Streets RE
1996 $ 65.226 $ 69,545 $ 20.608 $1997 41,894 72,329 16,7261998 37,579 70,116 15,3891999 40,279 72,687 21,2322000 47,934 76,386 16,2612001 52,388 84,134 17,3002002 46,028 91,245 20,5172003 45,300 96.487 23,4832004 56,574 107,637 27,4332005 48,394 119,036 35.562
1. The table Includes all general governmental types of expenditures from the General Fund, SpecialRevenue Funds, Debt Service Funds and Capital Projects Funds.
2. The table Includes all component units.
3. Capital outlay expenditures and lease payments have been recorded in functions.
4. Source: City of Riverside Annual Financial Report.
iture &wcreatlon
29,36926,14217,47218,04720,77523,27736,64731,95928,00940,836
DebtService
$ 15,79217,02432,57518,55223,29617,48013,95912,25571.97434,329
Total
$ 200,540174.115173,131170.797184,652194,579208.396209,484291,627278,157
83

Table 2City of RiversideGeneral Governmental Revenues by SourceLast Ten Fiscal Years (in thousands)
FiscalYear
1996199719981999200020012002200320042005
Taxesand
Special Assessments
$ 72,57072,65776,95481,67791,03193,37999,299
108,610123,377148,328
Ucensesand
Permits
$ 5,4616,0626,3317,854
12,27313,23212.31714,39411,34314,389
Inter-governmental
Revenue
$ 38,09739,85835,53444,05542.25948,95047.41043,82942,60942,568
Chargesfor
Services
$ 4,9804,9865,4996,9227,1607,8797,8668,878
10,04611.299
Use ofFines and Money andForfeitures Property
$ 886964872
1,7022,2262,3302,3462.0952,1882,006
$ 9,5069,289
11,87811,85612,47022,32913,01711,25510,58710,915
MiscellaneousRevenue
$ 5.50510,4184,8284,5037,9006.3254.8165,0427,1339,996
Total
$ 137,005144,234141,896158.569175.319194,434187,071194,103207.283239,501
1. The table includes all general governmental types of revenues from the General Fund,Special Revenue Funds, Debt Service Funds and Capital Projects Funds.
2. The table includes all component units.
3. Source: City of Riverside Annual Financial Repor.
84

Table 3City of RiversideGeneral Governmental Tax Revenues by SourceLast Ten Fiscal Years (in thousands)
General Transient Special
Fiscal Property Sales and Property utility Street Light Occupancy Assessments Total
Year Tax Use Tax Transfer Tax Users Tax Excise Tax Franchises Tax Levied Taxes
1996 $ 22.322 $ 25.395 $ 508 $16,267 $ 221 $ 2,902 $ 1,359 $ 3,596 $ 72,570
1997 21,410 25,415 708 16,569 234 2.833 1,437 4,051 72,657
1998 21,743 28.101 694 17,392 269 3,085 1,652 4,018 76,954
1999 22,629 30.481 936 17,552 312 3,787 1,920 4,060 81,677
2000 24,444 34.571 1,087 18,479 336 3,464 2,064 6,586 91,031
2001 24.973 35,850 1,213 19,613 382 3,746 2,344 5,258 93,379
2002 27,685 39,271 1,568 18,510 36 4,070 2,739 5,420 99,299
2003 31,561 41,995 2,024 19,928 99 3,811 2,868 6,324 108,610
2004 34,250 47,608 2,424 21,362 43 4,261 3,170 6,023 119,141
2005 54,252 54,483 3,279 22,135 9 4.480 3.418 6,272 148,328
1. The table Includes all component units.
2. Source: City of Riverside Annual Financial Report.
85

Table 4City of RiversideProperty Tax Levies and CollectionsLast Ten Fiscal Years (In thousands)
FiscalYear
1996199719981999200020012002200320042005
Total TaxLevy
$ 23,08622,20222,42923,11324,24125,20525,23726,05031.95437,144
Percent ofCurrent Tax Current TaxesCollections Collected
$ 21,78720,75021,05521.88823,43124,43623.09825,18631,09236,004
94.4%93.5%93.9%94.7%96.7%96.9%91.5%96.7%97.3%96.9%
DelinquentTax
Collections
$ 535569584537626370513603966706
Ratio ofTotal Tax
Total Tax Collections toCollections Total Tax Levy
$ 22,32221,31921,63922,42524,05724,80623,61125,78932,05836,710
96.7%96.0%96.5%97.0%99.2%98.4%93.6%99.0%
100.3%98.8%
OutstandingDelinquent
Taxes
$ 8,1359,0199.810
10,4979,994
11,08112,70711.71511,61212,046
Percent ofDelinquent Taxes
to Total TaxLevy
35.2%40.6%43.7%45.4%41.2%44.0%50.4%45.0%36.3%32.4%
1. The table Includes the City of Riverside Redevelopment Agency.
2. Source: Riverside County Auditor Controller's Office.
3. Total tax collections Include supplemental tax levies not Included inthe total tax levy column.
86

Table 5City of RiversideAssessed and Estimated Actual Value of Taxable PropertyLast Ton Fisc~al Years (in thousands)Last Ten Fiscal Yearn (in thousands)
FiscalYear
SecuredRoll
1996199719981999200020012002200320042005
$ 10,347,38410.135,21610,188,88510,158,74710,557.52311,269,87712,103,17913,071,41614.188,65815,540,982
UnsecuredRoi
$ 557,258548,897540,358576,029632,940686,215799,323980,529845,8568951,211
TotalSecured andUnsecured
$ 10,904,64210,684,11310,729,24310,734,77611,190,46311,956,09212,902,50214,051,94515,034,51616,492,193
ExemptionsVeteran,
Church, etc.
$(1,634,835)(1.574,851)(1.598,304)(1,580,501)(1,685,818)(1,784,167)(1,894,558)(2,166,760)(2,264,397)(2,486,126)
TotalAssessed
Value
Net TotalExemptions AssessedHomeowners Value
EstimatedActualValue
$ 9,269,8079,109,2629,130,9399,154,2759,524,645
10,171,92511.007,94411,885,18512,770,11914,006,067
S (243.489)(242,473)(241,776)(238,588)(233,807)(233,376)(234,557)(240,201)(262,106)(265,718)
$ 9,026,3188,866.7898,889,1638.915,6879,290,8289,938,549
10,773.38711,644,98412,508.01313,740,349
$ 9,269,8079,109,2629,130,9399,154,2759,524,645
10,171,92511,007,94411,885,18512,770,11914.006,067
1. Assessed valuations are based on 100 percent of estimated actual value and do not IncludeRiverside Redevelopment Agency.
2. Source: Riverside County Assessor's Office.
87

Table 6City of RiversideProperty Tax Rates-Direct and Overlapping GovernmentsLast Ten Fiscal Years
Fiscal Basic School County ofYear Levy City Districts Riverside Other Total
1996 1.00 0.00000 0.00000 0.00000 0.02262 1.022621997 1.00 0.00000 0.00000 0.00000 0.02306 1.023061998 1.00 0.00000 0.00000 0.00000 0.02179 1.021791999 1.00 0.00000 0.00000 0.00000 0.00890 1.008902000 1.00 0.00000 0.00000 0.00000 0.00890 1.008902001 1.00 0.00000 0.00000 0.00000 0.00890 1.008902002 1.00 0.00000 0.00000 0.00000 0.00770 1.007702003 1.00 0.00000 0.05000 0.00000 0.00670 1.056702004 1.00 0,00000 0.04993 0.00000 0.00610 1.056032005 1.00 0.01092 0.04048 0.00000 0.02380 1.07520
1. Information above is taken from the districts that exist within the City of Riverside.
2. If taxes become delinquent, the underlying property may be deeded to the state and sold by thecounty tax collector for taxes due plus 11/2% per month redemption fee after the thirdmonth of being delinquent.
3. All property taxes are collected by the County of Riverside with 1/4 of 1% of the assessment
going to the County for collection fee.
4. Rates are based on $100 of assessed valuation.
Source: Riverside County Auditor-Controller's Office.
88

Table 7City of RiversideComputation of Direct and Overlapping General Obligation DebtAs of June 30, 2005 (in thousands)
Direct Debt:City of Riverside
Overlapping Debt:School Districts:
Riverside UnifiedOther Districts:
Metropolitan Water District
Total Overlapping Debt
Total Direct and Overlapping Debt
Total GeneralObligation
Debt
$ 220,710
53,590
419,390
472,980
$ 693,690
PercentageApplicable to
City of Riverside*City of Riverside
Share of Debt
100.00% $ 220,710
84.38% 45,221
1.03% 4,320
49,541
$ 270,251
-Determined by ratio of assessed valuation of property subject to debt servicetaxation in overlapping agency to valuation of property subjectto taxation in the City of Riverside.
Source: Riverside County Auditor-Controllers Office and Other District Offices.
89

Table 8City of RiversideComputation of Legal Debt Margin For City General Obligation BondsAs of June 30, 2005 (in thousands)
Total Assessed Value. June 30. 2005
Debt limit: 15.00% of Total Assessed Value
Amount of debt applicable to debt limit:Total bonded debt
Less amount available for repayment
of general obligation bonds
Other deductions allowed by law:
Revenue bondsRedevelopment Agency tax
allocation bonds
Certificates of participation
Total deductions
Total General Obligation Debt Applicable to Debt Limit
Legal Debt Margin
$ 14,006.067
$ 2.100,910
784,915
0
449,245
111,410
3.550
$ 564.205
220,710
$ 1,880.200
Debt limit set by City Charter at 15% of total assessed value for general obligation bonds.
Source: Riverside County Assessors Office and City of Riverside Annual Financial Report.
90

Table 9City of RiversideRatio of Net General Obligation Bonded Debt to Assessed Value and Bonded Debt per CapitaLast Ten Fiscal Years (in thousands)
FiscalYear
1996199719981999200020012002200320042005
Population
243242251254260262266274277285
AssessedValue
$9,269,8079,109,2629,130,9399,154,2759,524,645
10,171.92511,007.94411,885,18512,770,11914,006,067
GrossBonded Debt
162,725220,710
LessDebt Service
Fund
$.
NetBonded Debt
$
162,725220,710
Ratio of NetBonded DebtTo Assessed
Value
0.00%0.00%0.00%0.00%0.00%0.00%0.00%0.00%1.27%1.58%
Net BondedDebt perCapita
S
587.45774.42
1. Population figures supplied by the State of California Finance Departmnent.
2. Assessed value is from Table 5.
3. Gross bonded debt consists of general obligation bonds only.
4. Debt service fund is the amount available for repayment of general obligation bonds.
91

Table 10City of RiversideRatio of Annual Debt Service Expenditures for General Obligation Bonded Debt
to Total General Governmental ExpendituresLast Ten Fiscal Years (in thousands)
FiscalYear Principal
1996199719981999200020012002200320042005
$20
2,015
Interest
$75
7,594
Total DebtService
9,609
TotalGeneral
GovernmentalExpenditures
Ratioof Debt Service
to GeneralExpenditures
$ 200,540174,115173.131170,797184,652194.579208,396209,484291,627278,157
0.00%0.00%0.00%0.00%0.00%0.00%0.00%0.00%0.00%3.45%
1. Table includes all component units.
2. Source: City of Riverside Annual Financial Repor.
92

Table 11City of RiversideRevenue Bond CoverageLast Ten Fiscal Years (in thousands)
FiscalYear
Electric
1996199719981999200020012002200320042005
Water
1996199719981999200020012002200320042005
Sewer
1996199719981999200020012002200320042005
Net RevenueGross Operating Available for
Revenues Expenses Debt Service
Debt Service Requirements
173,112183.932207,934180,171197,842271.828229.529211,553239,842271,987
24,94226,64326,12630.73933,32736,25943,21536,83747,09345,626
20,68421,31521,53021,32223,85125,05623,87224,29724,17625.444
132,172137,964143,828145,402150,175227,081190,426157,450168,162169,064
15,14915,01314.77615,65916,39718,64319,24419,92823,76726,583
11,93711,89411,90112,11712,30012,45112,38713,43317,00619,163
40,94045,96864,10634,76947,66744,74739,10354,10371,680
102,923
9,79311,63011,35015,08016,93017,61623,97116,90923,32619,043
8,7479,4219,6299,205
11,55112,60511,48510,8847,1706,281
Principal
5,8656,1906,6356,5556,6106,9307,3857,840
10,78014,555
1,9002,0152,2652,7802,7552,9553,2153,8454,0104,045
1.8601,9602,0752,2002,3302,4352,5502,6652,8002,970
Interest
10,2329,891
10,37110,70110,66910,3509,841
10,96610,18312,143
2,7122,5992,6422,6672,5912,3642,9412,7202,6222,591
3,0302,9172,7922,6622,5572,7292,4232.1652,3412,081
Total Coverage
16,09716,08117,00617,25617,27917,28017,22618,80620,96326,698
4,6124,6144,9075,4475,3465,3196,1566,5656,6326,636
4,8904,8774,8674,8624,8875,1644,9734,8305,1415,031
2.542.863.772.012.762.592.272.883.423.86
2.122.522.312.773.173.313.892.583.522.87
1.791.931.981.892.362.442.312.251.391.25
1. Gross revenues include operating, interest, and other revenues. Gross revenues also Include the cash portion of impact fees.
2. Operating expenses are net of depreciation. Operating expenses are also net of nuclear fuel bum in the Electric Fund.Beginning with 2003, operating expenses are also net of the Deseret amortization charge in the Electric Fund.
3. Debt service requirements are the principal and interest expense for the same period.
4. Source: City of Riverside Annual Financial Report.
93

Table 12City of RiversideSpecial Assessment CollectionsLast Ten Fiscal Years (in thousands)
FiscalYear
1996199719981999200020012002200320042005
SpecialAssessments Billed
120124107107757678000
Current AssessmentsCollected
11713011173747683000
Percentageof Collections
to Amount DueTotal Outstanding
Assessments
97.5%104.8%103.7%68.2%98.7%
100.0%106.4%0.00%0.00%0.00%
650540480285245195135
000
1. Street Light Assessment District collections are not Included.
2. Source: City of Riverside Assessment Register and Annual Financial Report.
94

Table 13City of RiversidePrincipal TaxpayersJune 30, 2005
Taxpayer
Tyler Mall LTD Partnership
Riverside Healthcare System
State Street Bank &Trust Co. of California
BRE Prop Inc.
Calif State Teachers Retirement System
Pepsi Bottling Group
Press Enterprise
Rohr/Goodrich
Mission Grove Park Apartments
Ralphs Grocery Company
Type of Business
Regional Shopping Center
Healthcare
Realty Investment
2005AssessedValuation
$144,601
101,878
78,581
Realty Investment
Realty Investment
Manufacturer
Newspaper
Manufacturer
Apartments
Grocery
66,543
56,482
50,607
47,893
47,007
45,051
41,064
$679,707
(in thousands)
Percentage ofTotal Assessed
Valuation
0.8%
0.6%
0.4%
0.4%
0.3%
0.3%
0.3%
0.3%
0.3%
0.2%
3.8%
Source: Riverside County Assessors Office.
95

Table 14Mlscellanous Statistical DataJune 30, 2005
Geographic Location - In Southern California approximately 50 mileseast of Los Angeles and 90 miles north of San Diego, contiguous todesert and mountain regions.
Elevation - Varies from 800 to 1200 feet.
Area and Population:Year Area, Square Miles2005 (January) 79.652000 79.051990 77.041980 71.951970 71.521960 43.59
-1950 39.201940 39.201930 39.201920 39.201910 39.201900 56.001890 56.001883 56.00
2005 population per square mile = 3,585
Average Rainfall - 10.22 inches
Climate, Average Minimum and Maximum:Spring 50-76 DegreesSummer 62-92 DegreesFall 54-83 DegreesWinter 43-69 Degrees
Date of Incorporation - 1883
Form of Government - Council/Manager
City Charter Adopted - 1952
Number of Budgeted Positions (full time equivalents):
General Government DepartmentsPolice DepartmentFire DepartmentPublic Works DepartmentLibrary DepartmentPark and Recreation DepartmentMuseumPublic Utilities DepartmentAirport Department
Page I of 2
Population285.537259.738218,499165,087140,089
83,71446,39934,69630,64519,34115,2127,7934,6832.000 est.
Taxable Retail Sales:(In thousands)
2005 $5,293,3472000 3,219,8941990 . 2,148,3991980 994,2641970 307,3781960 137,326
Miles of Streets - 838
Miles of Sewers - 755
Number of Street Lights - 28,581
Traffic Signals - 322
Municipal Services and Facilities (budgeted positions shown in full timeequivalents);
Police Budgeted positions
Fire
Library
Museum
StationsSubstationsHelicopters
Budgeted positionsStationsActive apparatusReserve apparatusTraining Facilities
Budgeted PositionsLibrary branches
Budgeted positionsFixed exhibitsSpecial exhibitsReference library volumes
Budgeted positionsCommunity centersPlaygroundsPublic swimming poolsSoftball and baseball diamondsTotal parks acreage
568.83724
221.11133051
97.065
18.9481
5,224
184.9211267
352,534
Parks andRecreation
331.88568.83221.11329.84
97.06184.9218.94
435.606.00
2,194.1896

Table 14Miscellanous Statistical DataJune 30, 2005 Page 2 of 2
Auditorium andExhibit Hall
Municipal Utilities
Municipal auditorium seatingcapacity
Exhibit HallMeeting and showrooms (300 to20,800 square feet each)
Assembly capacity
Budgeted positions - Electric- Water
Number of Accounts - Electric- Water
Miles of overhead distijbutionsystem
Miles of underground systemAnnual consumption:
Electric (kwh)Water (ccf)
Number of fire hydrants
1,776
740 to 2,000
305.6130.0
103,46362,492
531.0622.0
1.962,000.00027.697,000
6.926
Education - Riverside includes portions of Riverside Unified SchoolDistrict and Alvord Unified School District
Riverside Unified School District:Senior High SchoolsEnrollmentMiddle School (7-8)EnrollmentElementary Schools (Klndergarten-6)Enrollment
Alvord Unified School District:Senior High Schools
EnrollmentMiddle School (6-8)
EnrollmentElementary Schools (Kindergarten-5)
Enrollment
1013.686
66,660
3121.965
35,485
44.869
129,610
Source of supply:Electric- Intermountain Power Project
Palo Verde Nuclear Generating StationSan Onofre Nuclear Generating StationDeseret Generation and TransmissionHoover Power PlantSouthern Califomia Edison and others
Water - City owned sources, supplemented asnecessary by Metropolitan Water Districtof Southern California
Riverside Community College District:Riverside City College
Enrollment
State of CalifomraUniversity of California, Riverside
EnrollmentSchool for the Deaf
EnrollmentUnited StatesSherman Institute (Government School for
Indians)Enrollment
Other SchoolsCalifomla Baptist College
EnrollmentLa Sierra University, Riverside
Enrollment.
Private or Parochial Schools (Kindergarten-12)
31,081
17,104
470
633 (est)
2.718
1,908
50
Source: Various City Departments and School Districts.
97

Table 15City of RiversideDemographic StatisticsLast Ten Fiscal Years
Fiscal Per Capita Median UnemploymentYear Population Income Age Rate
(1) (2) (3) (4)
1996 243,421 12,497 31.3 9.1%1997 241.630 12,567 31.6 7.8%
1998 250.799 13,481 31.8 7.0%1999 254,300 14,093 32.0 6.2%2000 259,738 13,825 32.2 5.3%2001 262,335 14,241 32.4 5.2%2002 265,700 13,687 31.6 6.5%2003 274,100 14,137 32.1 6.8%
2004 277,030 14,928 30.0 6.2%2005 285,537 15,070 29.7 5.9%
Sources:
1. State Department of Finance
2. Sales & Marketing Management - 2005 Survey of Buying Power
3. ESRIBIS Business Solutions
4. State of California, Employment Development Department
98

Table 16City of RiversideConstruction, Bank Deposits. and Property ValueLast Ten Fiscal Years (values in thousands)
Commercial Construction(1)
Residential Construction(1)
Bank Deposits(2)
Property Values(3)
FiscalYear
1996199719981999200020012002200320042005
Number ofUnits
1,8041,5991.6211.7101,5731,7181,8991,9822,1531,923
Value
70.44856,69144,19454,80547,83582,00991,027
134.945262,704126,278
Number ofUnits
2,4172,6543,0533,0743,6943,7474,0994,4444,1454,542
Value
69.37883,550
100,611147,977278,035273,389264.995316.394189,004388,845
1,448,0212,337,6912,700,3522,488,0492,634,5972,559,80W2,702,0183,007,7193.475,359NA
Commercial
4,237,6134,239,9804,139,3024.323,4693,939.5304,163.9344,799,8484.933,9885,195,6235,281,154
Residential
5,844,6205,889,1695,948,4796.160,6946,665.7547,219,9237,960,1678,471,4699,336,641
10,667,343
Sources:
1. City Planning Department
2. Available from Federal Deposit Insurance Corporation after January 1, 2006.
3. County Land Use Statistical Recap Report
99

YEAR ENDED JUNE 30. 2005

PREPARED BY DEPARTMENT OF FINANCE
WILLIAM G. SWEENEYFinance Director

02&14ý'


CITY OF ANAHBIM
Comprehensive Annual Financial ReportTable of ContentsJune 30,2005
PulpINTRODUCTORY SECTION
Letter of Transmittal 1GFOA Certificate of Achievement for Excellence in Financial Reporting 5CSMFO Certificate of Award for Outstanding Financial Reporting 6Organization Chart 7Administrative Personnel 8
FINANCIAL SECTIONIndependent Auditors' Report 9Management's Discussion and Analysis (Unaudited) 11Basic Financial Statements
Government-wide Financial StatementsStatement of Net Assets 21Statement of Activities 23
Fund Financial StatementsBalance Sheet - Governmental Funds 25Reconciliation of the Governmental Funds Balance Sheet to the Statement of Net Assets 26Statement of Revenues, Expenditures and Changes in Fund Balances - Governmental Funds 27Reconciliation of the Statement of Revenues, Expenditures and Changes in Fund Balances of Governmental Funds to the Statement of Activities 28Statement of Revenues, Expenditures and Changes in Fund Balance - Budget and Budgetary Basis Actual - General Fund 29Statement of Revenues, Expenditures and Changes in Fund Balance - Budget and Actual - Housing Authority 30Statement of Fund Net Assets - Proprietary Funds 31Statement of Revenues, Expenses and Changes in Fund Net Assets - Proprietary Funds 33Statement of Cash Flows - Proprietary Funds 34Statement of Fiduciary Assets and Liabilities - Agency Fund - Mello-Roos 36
Notes to the Financial Statements 37Combining Individual Fund Statements and Schedules
Nonmajor Governmental FundsCombining Balance Sheet - Nonmajor Governmental Funds by Fund Type 65Combining Statement of Revenues, Expenditures and Changes in Fund Balances - Nonmajor Governmental Funds by Fund Type 66Combining Balance Sheet - Nonmajor Special Revenue Funds 67Combining Statement of Revenues, Expenditures and Changes in Fund Balances (Deficit) - Nonmajor Special Revenue Funds 69Combining Balance Sheet - Nonmajor Debt Service Funds 71Combining Statement of Revenues, Expenditures and Changes in Fund Balances - Nonmajor Debt Service Funds 72
(continued)

CiTY OF ANAHEIM
Comprehensive Annual Financial ReportTable of ContentsJune 30, 2005 (continued)
pape
Combining Balance Sheet - Nonimajor Capital Projects Funds 73Combining Statement of Revenues, Expenditures and Changes in Fund Balances - Nonniajor Capital Projects Funds 74
Internal Service FundsCombining Statement of Fund Net Assets - Internal Service Funds 75Combining Statement of Revenues, Expenses and Changes in Fund Net Assets - Internal Service Funds 76Combining Statement of Cash Flows - Internal Service Funds 77
Other Supplementary SchedulesSchedule of Revenues, Expenditures and Changes in Fund Balances (Deficit) - Budget and Budgetary Basis Actual - Nonmajor Special Revenue Funds 79Schedule of Revenues, Expenditures and Changes in Fund Balances - Budget and Actual - All Debt Service Funds 82Schedule of Revenues, Expenditures and Changes in Fund Balances - Budget and Budgetary Basis Actual - All Capital Projects Funds 83Capital Assets Used in the Operation of Governmental Funds - Schedule by Source 85Capital Assets Used in the Operation of Governmental Funds - Schedule by Function and Activity 86Capital Assets Used in the Operation of Governmental Funds - Schedule of Changes by Function and Activity 87Statement of Changes in Fiduciary Assets and Liabilities - Agency Fund - Mello-Roos 88
STATISTICAL SECTON (Unaudited)General Governmental Expenditures by Function - Last Ten Fiscal Years 899General Governmental Revenues by Source - Last Ten Fiscal Years 89Assessed Values of All City Property - Last Ten Fiscal Years 90Current Tax Levies and Tax Collections - Last Ten Fiscal Years 90Property Tax Rates - All Direct and Overlapping Governments - Last Ten Fiscal Years 91Ratio of Annual Debt Service Expenditures for General Bonded Debt to Total General Governmental Expenditures - Last Ten Fiscal Years 91Schedule of Direct and Overlapping Bonded Debt 92Schedule of Debt Ratios - Last Ten Fiscal Years 93Statement of Legal Debt Margin 93Schedule of Revenue Bond and Certificates of Participation Coverage - Electric Utility Fund 94Schedule of Revenue Bond Coverage - Water Utility Fund 94Schedule of Revenue Bond and Certificates of Participation Coverage - Convention, Sports and Entertainment Venues Fund 95Demographic Statistics 9Construction and Bank Deposit Activity - Last Ten Fiscal Years 97Principal Taxpayers 97Schedule of Insurance in Force 98Miscellaneous Statistical Information 99City of Anaheim Map 100

City of Anaheim, CaliforniaFinance Department
December 16, 2005
To the Honorable Mayor and City CouncilCity of AnaheimAnaheim, California
In accordance with the Charter of the City of Anaheim (City), we are submitting theComprehensive Annual Financial Report (CAFR) for the fiscal year ended June 30,2005. Responsibility for both the accuracy of the data and the completeness and fairnessof the presentation, including all disclosures, rests with the City. We believe the data, aspresented, is accurate in all material aspects; that it is presented in a manner designed tofairly set forth the financial position and results of operations of the City, as measuredby the financial activity of its various funds; and that all disclosures necessary to enablethe reader to gain maximum understanding of the City's financial activities have beenincluded.
The CAFR is presented in three sections: Introductory, Financial, and Statistical. TheIntroductory Section includes the table of contents, this transmittal letter, certificates ofachievement, the City's organization chart, and a list of administrative personnel. TheFinancial Section includes the report of the independent auditors, Management'sDiscussion and Analysis (MD&A), the basic financial statements including thegovernment-wide financial statements comprised of the Statement of Net Assets, theStatement of Activities and the accompanying notes to the financial statements. TheFinancial Section also includes the fund financial statements including thegovernmental funds financial statements, the proprietary funds financial statements andthe fiduciary fund financial statements, and the combining individual funds financialstatements for the nonmajor governmental funds and the internal service funds. TheStatistical Section includes selected pertinent financial and demographic information,on a multi-year basis. This transmittal letter is designed to complement and should beread in conjunction with the MD&A.
In addition to the financial audit, the City is required to undergo an annual Single Auditin conformity with the provisions of the Single Audit Act Amendments of 1996 and theU.S. Office of Management (OMB) and Budget Circular A-133, Audits of State, LocalGovernments, and Non-Profit Organizations. The information related to the SingleAudit, including the schedule of expenditures of federal awards, schedule of findingsand questioned costs, and auditors' reports on internal control and compliance, is notincluded with this report and is issued as a separate document.
This CAFR includes all funds of the City. The City provides a full range of services,including: police and fire protection, highways and streets, public improvements,planning and zoning, utilities (electric and water), sanitation and solid waste, stadium,convention center, golf courses, street and park maintenance, recreational and culturalprograms for citizen participation, and general administrative services. In addition togeneral governmental activities, the City Council is financially accountable for theAnaheim Housing Authority, Anaheim Redevelopment Agency, Community CenterAuthority, Anaheim Public Improvement Corporation, and Anaheim Public FinancingAuthority; therefore, these activities are included in the reporting entity.
ECONOMIC CONDION AND OUTLOOK
The City is located in northwestern Orange County, about 28 miles southeast ofdowntown Los Angeles and 90 miles north of San Diego. The City lies on a coastal plain,which is bordered by the Pacific Ocean on the west and the Santa Ana Mountains on theeast. The City is the oldest and second most populous city in Orange County. Anaheim ishome to the Disneyland Resort, the Anaheim Convention Center, and two major leagueprofessional sports teams--the Anaheim Angels American League Baseball team thatutilizes the Angel Stadium of Anaheim and the Anaheim Mighty Ducks National HockeyLeague team that utilizes the Arrowhead Pond of Anaheim.
Anaheim and Orange County are home to a wide spectrum of industries-more than4,600 manufacturing plants are located in the county, most notably aerospace,electronics, machinery, computers, and food product manufacturers. Unionization isprevalent in manufacturing, construction, hotels, trucking, warehousing, grocery stores,drug stores, and some larger retail outlets. High-tech businesses are typically nonunion.
As the City continues to attract population growth and economic expansion, its municipalservices are constantly being improved to serve residential and business needs. Thisgrowth in City service demand presents the City with significant challenges; and if thehigh level of service is to be maintained, the City will need to continue to explore newmethods of obtaining financial resources and more efficient methods to deliver services.
1

CITY OF ANAHEIM
The unemployment rate in the Orange County, California area for June 2005 was 3.9%/,which remains below both the state (5.4%) and national (5.01/6) averages. Increases in theprofessional and business services sectors have provided an overall increase in OrangeCounty job creation over the last twelve months.
Tourism related spending provides significant discretionary revenue to the City ofAnaheim, and the City closely monitors and projects trends related to this market.Revenue from tourism was very strong in fiscal year 2005, and local economic forecastsindicate continued strength well into fiscal year 2006. The City's revenue from sales anduse taxes continues to be a solid source of revenue, supported by a diversified base thatis also expected to perform well.
MAJOR INITIATIVES
The Anaheim City Council has provided policy and direction to lead the City on a pathof long-term investment and improvement for the future. Four major themes have beenidentified to focus and guide the efforts of the City's overall workplan:
" A unified, inspirational vision for our City• A fiscally responsible course for our highly valuable assets" A sense of pride instilled in neighborhoods" A dedication to deliver unparalleled service to our customers
The vision for our City was recently codified by the City Council's adoption of the mostambitious planning effort in City history, the updated General Plan and Zoning Code.As a result of extensive public input, the City created an opportunities based, long-rangeplanning tool created to address the livability of Anaheim's neighborhoods,beautification efforts, and new land use options for commercial properties, as well asthe corresponding infrastructure and transportation needs. The new General Plan is acomprehensive guide for future development and associated City services and facilities.It addresses the preservation and enhancement of neighborhoods and maximization ofopen space and recreational opportunities, as well as the continued development of TheAnaheim Resort and Stadium Area. It also anticipates the completion of the DowntownAnaheim Revitalization Project, a vibrant City center and activity hub. In addition tothe General Plan, the City Council also adopted a new overlay zone for theapproximately 800 acre Platinum Triangle. When completed, the Platinum Triangle willbe a vibrant 24-hour, high density, mixed-use, urban environment unique to OrangeCounty that could include up to 9,175 dwelling units, 5 million square feet of officespace and over 2 million square feet of commercial uses. The introduction of mixed-useopportunities into this area will be the catalyst for realizing the development potentialof The Platinum Triangle's strategic location and surrounding amenities including AngelStadium of Anaheim, the Arrowhead Pond of Anaheim, The Grove of Anaheim and theAmtrak/Metrolink Station and proposed Anaheim Regional Transportation IntermodalCenter (ARTIC).
The City continues to draw from and build on its fiscal responsibility as it maximizesthe assets under its control and direction which include the Angel Stadium of Anaheim,the Arrowhead Pond, the Anaheim Convention Center, the City's golf courses, and itsAnaheim-owned, Anaheim-focused water and electric utilities. Through sound fiscalmanagement, the City continues to operate these economic engines at optimal levels toassist in better providing for the many other necessities of the community.
The re-dedication to neighborhood pride is another important facet of the City'splanning and operations. Various programs were established in the Other CapitalImprovements Fund upon the completion of the Anaheim Resort Revitalization Projectto direct increased revenues received from the City's investment in resort improvementstoward continued improvements in our community. This and other resources contributetoward infrastructure maintenance including roads, sidewalks, and sewers, new and/orenhanced parks and open space, increased sports fields and gymnasiums, facilities suchas the West Anaheim Police Sub-station and Youth Center, the East AnaheimGymnasium, Anaheim Hills Golf Clubhouse, Haskett Library in Maxwell Park, and theTiger Woods Learning Center at Dad Miller Golf Course.
The City's commitment to deliver unparalleled service continues to show Anaheim'scommitment to being one of the finest municipal workforces in the nation. Anaheim hasbuilt a reputation on its consistent delivery of outstanding service that residents,businesses and guests have come to expect. The Anaheim Service Initiative, based onexamples of the City's outstanding service delivery leaders, was developed to reinforceand train others the corporate service culture's best practices.
FINANCIAL INFORMATION
Management of the City is responsible for establishing and maintaining internal controldesigned to ensure that the assets of the government are protected from loss, theft, ormisuse, and to ensure that adequate accounting data are compiled to allow for thepreparation of financial statements in conformity with accounting principles generallyaccepted in the United States of America. Internal control is designed to providereasonable, but not absolute, assurance that these objectives are met. The concept ofreasonable assurance recognizes that: (i) the cost of a control should not exceed thebenefits likely to be derived; and (2) the valuation of costs and benefits requiresestimates and judgments by management.
This report consists of management's representations concerning the finances of theCity. As a result, management assumes full responsibility for the completeness andreliability of all of the information presented in this report. Management asserts that, tothe best of their knowledge and belief, this financial report is complete and reliable inall material respects.
2

C1TY OF ANAHEIM
SINGLE AUDIT. As a recipient of federal awards, the City is also responsible forensuring that adequate internal control is in place to ensure compliance with applicablelaws and regulations related to those programs. This internal control is subject toperiodic evaluation by management and the internal audit staff of the City.
As a part of the City's Single Audit, tests are made to determine the adequacy of internalcontrol related to federal award programs, as well as to determine that the City hascomplied with applicable laws and regulations. No significant instances ofnoncompliance or internal control weaknesses were identified in the Single Audit forfiscal year ended June 30, 2005.
BUDGETARY CONTROLS: The City maintains budgetary controls, the objective ofwhich is to ensure compliance with legal provisions embodied in the annualappropriated budget approved by the City Council. Activities of the General Fund,special revenue funds, debt service funds, capital projects funds, and all the proprietaryfunds are included in the annual appropriated budget The level of budgetary control(that is, the level at which expenditures cannot legally exceed the appropriated amount)is established at the departmental level. The City also maintains an encumbranceaccounting system as one technique of accomplishing budgetary control. Encumbrancesgenerally are reappropriated as part of the following year's budget.
Regarding long-term financial planning, as of June 30, 2005, the City Council adoptedthe fiscal year 2006 budget. Additionally, as a companion to approving the budget plan,a five-year Capital Improvement Plan was presented to the City Council. The five-yearplan links anticipated expenditures for infrastructure development with communityneeds and desires and provides a citywide perspective of recommended projects andproposed funding sources. The Capital Improvement Plan was finalized in May 2005,and totaled $678.5 million for the five-year fiscal period ending June 30, 2010. Thefive-year Capital Improvement Plan has been submitted and annually updated, in itspresent form, since 1982, for effective long-range planning purposes. It is CityManagement's belief that these two plans give City Council members an expandedopportunity to set policy and provide direction for implementation, resulting inimproved management efficiency and improved financial results.
DEBT ADAINSTRA770N: At June 30, 2005, the City had a number of debt issuesoutstanding, as shown in detail in the notes to the financial statements.
The City's ratio of net bonded debt to assessed valuation and the amount of net generalbonded debt per capita are useful indicators of our debt position to management,citizens, and investors.
As of June 30, 2005, the City has $6.6 million in authorized, outstanding tax-supportedgeneral obligation bonds with no authorized but unissued general obligation bonds. Thislevel of general obligation debt was well below the legal limit of $3.5 billion, or 15% ofassessed valuation. The City's general obligation bonds are rated Aa2 by Moody'sInvestors Services and rated AA by Standard and Poor's.
CASH MANAGEMENT." The City Treasurer invests temporarily idle funds inaccordance with the Government Code and a formal investment policy approved by theCity Council and the Investment Advisory Commission. During fiscal year 2005, fundswere invested in such instruments as U.S. Treasury notes, federal agency or U. S.Government-sponsored enterprise obligations, commercial paper, corporate mediumterm notes, money market mutual funds, and the Local Agency Investment Fund (StatePool). The average maturity of the portfolio as of June 30, 2005 was I year and 3months. Interest earnings for the fiscal year were approximately $13.4 million with anaverage earned yield of 2.48%. Bond proceeds are not commingled with the portfoliobut are invested pursuant to the bond indentures. Consequently, earnings and yield onbond proceeds are not reflected in the previously stated figures.
RISK MANAGEMENT: Through the utilization of professional risk managementtechniques of risk identification, risk control, risk transfer, and risk financing, the Cityhas a comprehensive risk management program designed to protect the City's assets andresources from accidental loss. In the risk financing area, the City utilizes a combinationof fully funded, actuarially based, self-insurance programs, an excess risk-sharing pool,an industry-captive excess insurer, and commercial insurers. Operational expenses andreserves are maintained in the General Benefits and Insurance Fund. The City's RiskManagement Division continues to be very successful with programs that generatematerial cost savings while, at the same time, eliminating or transferring risk to themaximum extent
OTHMR INFORMATION
THE INDEPENDENT AUDIT: The City Charter requires an annual audit of thefinancial statements of the City by an independent certified public accountant.Accordingly, this year's audit was completed by KPMG LLP. In addition to meeting therequirements set forth in the City Charter, the audit was also designed to meet therequirements of the Single Audit Act Amendments of 1996 and related OMB CircularA-133. The auditors' report on the basic financial statements is included in the financialsection of this report. The auditors' reports related specifically to the single audit arepresented as a separate document.
3

CITY OF ANAHEIM
GOVERNMENT FINANCE OFFICERS ASSOCTATION OF THE UNITED STATESAND CANADA (GFOA) CERTIFICATE OF AHIEMWENT AWARD: The GFOAawarded a Certificate of Achievement for Excellence in Financial Reporting to the Cityof Anaheim, California, for its comprehensive annual financial report for the fiscal yearended June 30, 2004. This was the 29th consecutive year that the City has achieved thisprestigious award (fiscal years ended 1976 - 2004). In order to be awarded a Certificateof Achievement, a government must publish an easily readable and efficiently organizedcomprehensive annual financial report. This report must satisfy both accountingprinciples generally accepted in the United States of America and applicable legalrequirements.
A Certificate of Achievement is valid for a period of one year only. We believe ourcurrent comprehensive annual financial report continues to conform to the Certificateof Achievement Program's requirements and we are submitting it to GFOA to determineits eligibility for another certificate.
CALIFORNIA SOCIETY OF MUNICIPAL FINANCE OFFICERS (CSMFO)CERTIFICATE OF AWARD FOR OUTSTANDING FINANCIAL REPORTING: TheCSMFO awarded a Certificate of Award for Outstanding Financial Reporting to the Cityfor its CAFR for fiscal year ended June 30, 2004. The certificate is issued in recognitionof meeting professional standards and criteria in reporting which reflect a high level ofquality in the annual financial statements and in the underlying accounting system fromwhich the reports were prepared. This was the 29th consecutive year that the City hasreceived this prestigious State of California award. We believe our current reportcontinues to conform to the Certificate of Award for Outstanding Financial ReportingProgram requirements, and we are submitting it to CSMFO.
ACKNOWLEDMEN
The preparation of this report on a timely basis could not have been accomplished bythe Finance Director alone without the efficient and dedicated service of the entire staffof accountants in the Finance Department led by Edward Zacherl, Assistant FinanceDirector. Appreciation is also expressed to Council Members Bob Hernandez and HarrySidhu, and Assistant City Manager Tom Wood for their significant contributions asmembers of the Audit Committee.
In closing, without the leadership and support of the City Council, preparation andresults of this report would not have been possible. Its leadership has made possible theimplementation of these important and innovative concepts in fiscal management by thecity.
Respectfully submitted,
David M. MorganCity Manager
William G. SwteneyFinance Director
4

CITY OF ANAHEIM
Certificate ofAchievementfor Excellence
in FinancialReporting
Presented to
City of Anaheim,California
For its Comprehensive AnnualFinancial Report
for the Fiscal Year EndedJune 30,2004
A Cetificate of Achievemen for E in FinancialReporting is prosenned by the Glovernment Finance Officers
Associaion of the United states and Canada togovernment units and public enmployee retirenatsystens whoe cmrtrebensive annual financial
reposts (CAFR&) achieve the h4heststandas igovernment accounting
and financisa repoting
The Government Finance Officers Association of the UnitedStates and Canada (GFOA) awarded a Certificate of Achievementfor Excellence in Financial Reporting to the City of Anaheim,California for its Comprehensive Annual Financial Report for thefiscal year ended June 30, 2004. The Certificate of Achievementis a prestigious national award recognizing conformance with thehighest standards for preparation of state and local governmentfinancial reports.
In order to be awarded a Certificate of Achievement, agovernmental unit must publish an easily readable and efficientlyorganized Comprehensive Annual Financial Report, whosecontents conform to program standards. Such reports must satisfyboth generally accepted accounting principles and applicablelegal requirements.
A Certificate of Achievement is valid for a period of one yearonly. We believe our current report continues to conform toCertificate of Achievement program requirements, and we aresubmitting it to GFOA.
President
Executive Director
5

CITY OF ANAHEIM
California Society ofJ 4lunicipal 5i nance Officers
Certificate of Award
Outstanding Financial Reporting 2003-04Presented to the
City of AnaheimThus ceftificate is issued in recognition of uusetingprofessional standards and ciltera In reporting
which reflect a high level of quality in the annualfinanciul statem&etsand in th. underlying accounting system from which the reports were prepared.
February24, 2005
mW Thaa,* CawrProfaidiawaI Te~ackl Standrel Coanmutt
Dedicated to Excellence in Municipal Financial Manmgement
6

CITY OF ANAHEIM
DýT Legend0 Esdwkm"w 1*O-fV-
*- w.UN
7

CITY OF ANAHEIM
Administrative Personnel
City Manager
Assistant City Manager
Deputy City Manager
Chief of Police
City Attorney
City Clerk
City Treasurer
Community Development Executive Director
Community Services Director
Convention, Sports & Entertainment Executive Director
Finance Director
Fire Chief
Human Resources Director
Planning Director
Public Utilities General Manager
Public Works Director
David M. Morgan
Thomas J. Wood
Joel H. Fick
John Welter
Jack L. White
Shleyll A. Schroeder
Charlene C. Parker
Elisa Stipkovich
Terry Lowe
Gregory L. Smith
William 0. Sweeney
Roger E. Smith
David H. Hill
Sheri Vander Dussen
Marcie L. Edwards
Gary E. Johnson
8


I KkyP',w M,, !W600 Anton Boulevard
Suite 700
Costa Mesa, CA 92626-7651
Telephone 714 850 4300
Fax 714 850 4488
Independent Auditors' Report
The Honorable Mayor and City CouncilCity of Anaheim, California:
We have audited the accompanying financial statements of the governmentalactivities, the business-type activities, each major fund, and the aggregate remainingfund information of the City of Anaheim, California (City), as of and for the yearended June 30, 2005, which collectively comprise the City's basic financialstatements as listed in the table of contents. These financial statements are theresponsibility of the City's management Our responsibility is to express opinions onthese financial statements based on our audit.
We conducted our audit in accordance with auditing standards generally accepted inthe United States of America and the standards applicable to financial auditscontained in Government Auditing Standazis, issued by the Comptroller General ofthe United States. Those standards require that we plan and perform the audit toobtain reasonable assurance about whether the financial statements are free ofmaterial misstatement. An audit includes consideration of internal control overfimancial reporting as a basis for designing audit procedures that are appropriate inthe circumstances, but not for the purpose of expressing an opinion on theeffectiveness of the City's internal control over financial reporting. Accordingly, weexpress no such opinion. An audit includes examining, on a test basis, evidencesupporting the amounts and disclosures in the financial statements, assessing theaccounting principles used and significant estimates made by management, as well asevaluating the overall financial statement presentation. We believe that our auditprovides a reasonable basis for our opinions.
In our opinion, the financial statements referred to above present fairly, in all materialrespects, the respective financial position of the governmental activities, the business-type activities, each major fund, and the aggregate remaining fund information of theCity of Anaheim, California, as of June 30, 2005, and the respective changes infinancial position and cash flows, where applicable, thereof and the respectivebudgetary comparison for the General and Housing Authority Funds for the year thenended in conformity with accounting principles generally accepted in the UnitedStates of America.
Management's discussion and analysis on pages 11 through 19 and the pension planrequired supplementary information on page 58 are not a required part of the basicfinancial statements but are supplementary information required by accountingprinciples generally accepted in the United States of America. We have appliedcertain limited procedures, which consisted principally of inquiries of managementregarding the methods of measurement and presentation of the requiredsupplementary information. However, we did not audit the information and expressno opinion on it.
In accordance with Government Auditing Standards, we have also issued a reportdated December 16, 2005 on our consideration of the City's internal control overfinancial reporting and on our tests of its compliance with certain provisions of laws,regulations, contracts and grant agreements and other matters. The purpose of thatreport is to describe the scope of our testing of internal control over financialreporting and compliance and the results of that testing, and not to provide an opinionon the internal control over financial reporting or on compliance. That report is anintegral part of an audit performed in accordance with Government A tingStandards and should be considered in assessing the results of our audit.
Our audit was conducted for the purpose of forming opinions on the financialstatements that collectively comprise the City's basic financial statements. Thecombining individual fund statements and schedules listed in the table of contents arepresented for purposes of additional analysis and are not a required part of thefinancial statements. The combining individual fund statements and schedules havebeen subjected to the auditing procedures applied in the audit of the basic financialstatements and, in our opinion, are fairly stated in all material respects in relation tothe basic financial statements taken as a whole. The introductory section andstatistical section have not been subjected to the auditing procedures applied in theaudit of the basic financial statements and, accordingly, we express no opinion onthem.
December 16, 2005
9

(This page left blank intentionally)
10


CITY OF ANAEM
Management's Discussion and Analysis(Unaudited)
As management of the City of Anaheim (City), we offer readers of the City's basicfinancial statements this narrative overview and analysis of the financial activities of theCity as of and for the fiscal year ended June 30, 2005. We encourage readers to considerthe information presented here in conjunction with additional information that we havefurnished in our letter of transmittal, which can be found in the introductory section ofthis report and the City's basic financial statements in the financial section of this reportAll amounts, unless otherwise indicated, are expressed in thousands of dollars.
OVERVIEW OF TIM BASIC FINANCIAL STATBMMMTS
This discussion and analysis are intended to serve as an introduction to the City's basicfinancial statements. The City's basic financial statements are comprised of threecomponents: 1) government-wide financial statements, 2) fund financial statements, and3) notes to the financial statements. This report also contains other supplementaryinformation in addition to the basic financial statements themselves.
COMPONENTS OFTHE ANNUAL FINANCIAL REPORT
managementea Basic Financial Reqi 1eIt_
[Discussion and [ tatieminaO [ Supplementary
Government-wide Fes eFinancial1
StaemetsStatements Financial Statement
cash flows. Thus, assets, liabilities, revenues and expenses are reported in these statementsfor some items that will only result in cash flows in future fiscal periods (e.g. uncollectedrevenues and accrued but unpaid interest expense).
The Statement of Net Assets presents information on all of the City's assets and liabilities,including capital assets and long-term liabilities, with the difference between the tworeported as net assets. Over time, increases or decreases in net assets may serve as a usefulindicator of whether the financial position of the City as a whole is improving ordeteriorating.
The Statement of Activities presents information showing how the City's net assetschanged during the most recent fiscal year. Functional activities are highlighted in thisstatement whereby direct and indirect functional costs are shown net of related programrevenue. This statement shows the extent to which the various functions depend ongeneral taxes and non-program revenues for support
Both the government-wide financial statements distinguish functions of the City that areprincipally supported by taxes and intergovernmental revenues (governmental activities)from other functions that are intended to recover all or a significant portion of their coststhrough user fees and charges (business-type activities). The governmental activities ofthe City include general government police, fiur, community development planning,public works, community services, public utilities (street lighting), convention, sports andentertainment (Visitor and Convention Bureau and the Arrowhead Pond of Anaheim), andinterest on related long-term debt. The business-type activities of the City include anelectric and water utility, solid waste and sanitation, golf courses, and convention, sportsand entertainment venues (Anaheim Convention Center, Angel Stadium of Anaheim, andThe Grove of Anaheim) operations.
The government-wide financial statements include not only the City itseli but also theAnaheim Housing Authority, Anaheim Redevelopment Agency, Community CenterAuthority, Anaheim Public Improvement Corporation, and Anaheim Public FinancingAuthority. Although these entities are legally separate, they function for all practicalpurposes as a part of the City, and therefore have been included as blended componentunits as an integral part of the primary government.
The government-wide financial statements can be found on pages 21-23 of this report
Fund finial statements. The fund financial statements focus on current availableresources and are organized and operated on the basis of funds, each of which is definedas a fiscal and accounting entity with a self-balancing set of accounts, established for thepurpose of carrying on specific activities or attaining certain objectives in accordance withspecial regulations, restrictions or limitations. All of the funds of the City can be dividedinto three categories: governmental funds, proprietary funds, and fiduciary funds.
Summary 4 PP Detail
Government-wide financial statement&. The government-wide financial statements arecomprised of the Statement of Net Assets and the Statement of Activities. These tvostatements are designed to provide readers with a broad overview of the City's financesutilizing the full accrual method of accounting, in a manner similar to a private-sectorbusiness. Under the full accrual method of accounting, transactions are reported as soonas the underlying event giving rise to the change occurs, regardless of the timing of related
11

CITY OF ANAHEIM
Govenmental funds. Governmental funds ar used to account for essentially the samefunctions reported as governmental activities in the government-wide financialstatements. However, unlike the government-wide financial statements, the governmentalfunds financial statements utilize the modified accrual basis of accounting, which focuseson near-term inflow and outflow of spendable resources, as w:l1 as on balances ofspendable resources available at the end of the fiscal year. Such information may be usefulin evaluating a government's near-term financial requirements.
Because the focus of the governmental funds is narrower than that of the government-widefinancial statements, it is useful to compare the information presented for thegovernmental funds with similar information presented for governmental activities in thegovernment-wide financial statements. By doing so, readers may better understand thelong-term impact of the government's near-term financing decisions. Both thegovernmental funds Balance Sheet and the governmental funds Statement of Revenues,Expenditures and Changes in Fund Balances provide a reconciliation to facilitate thiscomparison between governmental funds and governmental activities.
The City maintains nineteen individual governmental funds. Information is presentedseparately in the governmental funds Balance Sheet and in the governmental flmdsStatement of Revenues, Expenditures and Changes in Fund Balances for the General Fundand Housing Authority Special Revenue Fund, both of which are considered to be majorfunds. Data for the other seventeen governmental funds are combined into a single,aggregated presentation. Individual fund data for each of these nonmajor governmentalfunds is provided in the form of supplementary combining statements on pages 65-74 ofthis report
The City adopts an annually appropriated budget for all governmental and proprietaryfunds. Budgetary comparison statements for the General Fund and all major specialrevenue funds (Housing Authority) are required to be presented and are included in thebasic financial statements on pages 29-30 of this report. Additionally, budgetaryschedules for the other governmental funds have been provided to demonstrate compliancewith the budget and can be found as part of other supplementary schedules on pages 79-83 of this report.
The governmental funds financial statements can be found on pages 25-28 of this report
Proprietary fund& The City maintains tme different types of proprietary funds.Enterprise funds are used to report the same functions presented as business-type activitiesin the government-wide financial statements. The City uses its enterprise funds to accountfor its electric and water utility, solid waste and sanitation, golf courses, and convention,sports and entertainment venues operations. Internal service funds are an accountingdevice used to accumulate and allocate costs internally among the City's various functions.The City uses internal service funds to account for its general benefits and insurance,
motorized equipment, duplicating and printing, information services, and officemaintenance and equipment operations. Because these services predominantly benefitgovernmental rather than business-type functions, they have been included withgovernmental activities in the government-wide financial statements.
Proprietary funds provide the same type of information as the government-wide financialstatements, only in more detail. The proprietary funds financial statements provideseparate information for all of the enterprise funds, which are considered to be major fundsof the City. Conversely, all of the internal service funds are combined into a single,aggregated presentation in the proprietary funds financial statements. Individual fiud datafor the internal service funds is provided in the form of combining statements elsewherein this report.
The proprietary funds financial statements can be found on pages 31-35 of this report
Fiduciary finds. Fiduciary funds awe used to account for resources held for the benefitof parties outside the government Fiduciary funds are not reflected in the government-wide financial statements because the resources of those funds are not available to supportthe City's own programs.
The fiduciary fund financial statements can be found on page 36 of this report
Notes to the financial statments. The notes provide additional information that isessential to a full understanding of the data provided in the government-wide and fundfinancial statements. The notes to the financial statements can be found on pages 37-63of this report
Other supplementay information. In addition to the basic financial statements andaccompanying notes, this report also presents combining individual fund statementsreferred to earlier in connection with nonmajor governmental funds and internal servicefunds. Also included are the budgetary comparison Schedules of Revenues, Expendituresand Changes in Fund Balances for all nonmajor special revenue funds, all debt servicefunds, and all capital projects funds. These statements and schedules can be found onpages 79-83 of this report.
FINANCIAL HIGHLIGHTS (Amounts in thousands)
* The City's net assets increased as a result of this year's operations. Net assets of theCity's governmental activities increased $15,372 (2%) and business-type activities netassets increased $13,234 (1%).
12

CITY OF ANAEMM
At the close of the current fiscal year, the City's governmental funds reported totalending fund balances of $205,469, an increase of $3,634. More than half of endingfund balances, $119,009, is available for spending at the City's discretion (unreservedfund balance).
" At the end of the current fiscal year, unreserved undesignated fund balance for theGeneral Fund was $39,179, or 20% of the total General Fund expenditures.
" The City's total long-term liabilities decreased by $6,705 (less than 1%) during thecurrent fiscal year.
GOVERNIMNT-WIDE FINANCIAL ANALYSIS
NET ASSETSJUNE 30,2005 AND 2004
GovernmentalActivities
2005 2004
Business-typeActivities
2005 2004
TotalGovernment
2005 2004
Current and other assetsCapital assets
Total assets
Other liabilitiesLong-term liabilities outstanding
Total liabilities
Net assets:invested in capital assets, net of related debtRestrictedUnrestricted (deficit)
Total net assets
$ 449,0541,177,304
1,626,358
74,517907,110
981,627
605,34695,459
(56,074)
$ 644,731
$ 426,6381,150,311
1,576,949
54,350893,240
947,590
576,92291,291
(38,854)
$ 629,359
$ 635,0311,172,3941,807,425
80,986770,886
851,872
645,80280,700
229,051
$ 955,553
$ 650,4121,156,750
1,807,162
73,382791,461
864,843
621,50777,924
242,888
$ 942,319
$1,084,0852,349,698
3,433,783
155,5031,677,996
1,833,499
1,251,148176,159172,977
$1,600,284
$1,077,0502,307,0613,384,111
127,7321,684,7011,812,433
1,198,429169,215204,034
$1,571,678
By far the largest portion of the City's net assets (78%) reflects its investment in capitalassets (e.g. land, buildings, utility plant, machinery, equipment, and infrastructure), net ofany related debt used to acquire those assets that is still outstanding. The City uses theseassets to provide services to citizens; consequently, these assets are not available for futurespending. Although the City's investment in capital assets is reported net of related debt,it should be noted that the resources needed to repay this debt must be provided from othersources, since the capital assets themselves cannot be used to liquidate these liabilities.
An additional portion of the City's net assets (11%) represents resources that are subjectto external restrintion on how they may be used. The remaining unrestricted net assets of$172,977 may be used to meet the City's ongoing obligations to citizens and creditors. Ofthe unrestricted net assets, $229,051 is attributable to business-type activities, which
offsets the governmental activities deficit unrestricted net assets of $56,074. The AnaheimRedevelopment Agency (Redevelopment Agency), a blended component unit of the City,represents $129,715 of the deficit in unrestricted net assets. The Redevelopment Agencywas established for the purpose of promoting economic revitalization and eliminatingblight within the designated project area of the City. Often these activities do not result inresidual assets, but rather underwrite the cost of a development activity deemed beneficialin meeting the Redevelopment Agency's objectives. The resulting Statement of Net Assetsreflects the debt obligation to be repaid through future tax revenues, without an offsettingasset While this is a routine function of such an entity, when blended with the City, itsdeficit of unrestricted net assets causes the governmental activities to report a consolidateddeficit position.
13

CITY OF ANAHEIM
CHANGE IN NET ASSETSYEARS ENDED JUNE 30,2005 AND 2004
Governmental Business-type TotalActivities Activities Government
2005 2004 2005 2004 2005 2004
REVENUESProgram revenues:
Charges for services $ 42,581 $ 39,454 $407,453 $417,895 $ 450,034 $ 457,349Operating grants and contributions 77,870 81,877 2,473 1,471 80,343 83,348Capital grants and contributions 20,906 11,904 11,513 7,468 32,419 19,372
General revenues:Taxes;
Property taxes 78,620 57,239 78,620 57,239Sales and use taxes 61,779 56,566 61,779 56,566Transient occupancy taxes 67,141 63,268 67,141 63,268Motor vehicle license fees 2,113 21,143 2,113 21,143Other taxes 10,175 9,561 10,175 9,561
Unrestricted investment earnings 8,071 3,991 16,592 6,120 24,663 10,111Other 1,499 928 418 1,917 928Gain (loss) on sale of capital assets (722) 169 (1,164) 1,723 (1,886) 1,892
Total revenues 370,033 346,100 437,285 434,677 807,318 780,777
EXPENSESProgram activities:
Governmental activities:General government 8,221 7,582 8,221 7,582Police 91,713 77,541 91,713 77,541Fire 46,596 37,610 46,596 37,610Community Development 83,183 86,542 83,183 86,542Planning 13,206 12,628 13,206 12,628Public Works 39,463 41,672 39,463 41,672Community Services 28,314 27,050 28,314 27,050Public Utilities 1,557 1,566 1,557 1,566Convention, Sports and Entertainment 7,703 7,536 7,703 7,536Interest on long-term debt 47,105 48,503 47,105 48,503
Business-type activities:Electric Utility 274,622 280,878 274,622 280,878Water Utility 41,313 42,949 41,313 42,949Sanitation 45,429 41.431 45,429 41,431Golf Courses 4,062 4,278 4,062 4,278Convention, Sports and Entertainment Venues 46,225 43,406 46,225 43,406
Total expenses 367,061 348,230 411,651 412,942 778,712 761,172
Excess (deficiency) before transfers 2,972 (2,130) 25,634 21,735 28,606 19,605Transfers in (out) 12,400 11,534 (12,400) (11,534)
Increase in net assets 15,372 9,404 13,234 10,201 28,606 19,605Net as tsat beginning of year 629,359 619,955 942,319 932,118 1,571,678 1,552,073
Net assets at end of year $644,731 $629,359 $955,553 $942,319 51,600,284 $1,571,678
14

CITY OF ANAHBEIM
REVENUES BY SOURCE -GO UAL ACTIVITIES
mwinv ml CK16u OtherOdierajte 2% 1
3%
Motor veltido 11kcese floes
'rrnsumt occupane laxes19%
Cluges for leAmls11%
Op ting grants/-Wand1cc enm
Sales nd u txes17%
C itgrants and contnbution6%
Govvwmment activilim. The most significant revenues of the governmental activitiesare general taxes (59%), which include property taxes (21%), sales and use taxes (17%),transient occupancy taxes (18%), other taxes (3%) motor vehicle license fees (VLF) (lessthan 1%). Program revenues are 39% of the total revenues of the governmental activities,which include charges for services (12%), operating grants and contributions (2 1%), andcapital grants and contributions (6%).
Public safety (police and fie) expenses are most significant (38%) of all governmentalactivities expenses, followed by community development (23%), interest on long-termdebt (13%), public works (11%), and various other programs (15%). Included in theseamounts is depreciation expense, which is 6% of the total expenses for governmentalactivities.
Governmental activities revenues increased $23,933 (7%) in the current fiscal year.Capital grants and contributions increased $9,002 (76%) primarily due to funding for theBurlington Northern Santa Fe (BNSF) Soundwall project. The soundwall isapproximately 13,000 feet long extending from Imperial Highway (SR-90) to Yorba LindaBoulevard/Weir Canyon Road. Property taxes increased $21,381 (37%), primarily as aresult of the effect of shifling revenue from motor vehicle license fees to property taxes($15,818) as part of the State of California 2004 Budget Act. The overall strength in theeconomy also contributed to the increase in property taxes, as well as the sales and usetaxes increase of $5,213 (9%) and the transient occupancy taxes (TOT) increase of $3,873(6%). Additionally, investment earnings increased $4,080 (102%), primarily due to thereduction in the change in unrealized investment losses.
Governmental activities expenses increased $18,831 (5%) in the current fiscal year. Themost significant change in program expenses was the increase in police expenses of$14,172 (18%), primarily due to increased costs for benefits, including retirement andworker's compensation costs of $9,399. Additionally, fire expenses increased $8,986(24%) primarily due to increased costs for benefits, including retirement and workers'compensation costs. These increases were partially offset by various decreases in otherprograms expenses.
There were no other programs with significant or unusual changes.
rop taxes21%
EXPENSES AND PROGRAM REVENUES -GOVERNMENTAL ACTIVITIES
SIM-
slowa
570=
SIGA.
so
/ $
/ liI,
/U Program rUeM U Eapaes.
15

CITY OF ANAHEIM
REVENUES BY SOURCE -BUSINESS-TYPE ACTIVITIES
Unresticted
Capital grants and contributions3%
operating grantsand conrbutons------
\ aargoa for sevicea93%
EXPENSES AND PROGRAM REVENUES -BUSINESS-TYPE •AIVITIE
BuWAinuyp aciviti. Business-type activities increased the City's net assets byS 13,234. Key elements of this change are as follows:
Charges for services of $407,453 decreased $10,442 (3%). The most significant decreasein charges for services is due to the Electric Utility decrease of $6,983 (2%) as a result ofa decrease of 3% in megawatt hours sold.
Investment earnings of $16,592 increased $10,472 (171%) primarily due to the reductionin the change in unrealized investment losses and $134 million in Electric Utility bondproceeds received at the end of the prior fiscal year that were available for investmentduring fiscal year 2005.
Program expenses of $411,651 decreased $1,291 (less than 1%). The most significantchange in program expenses is the decrease in the Electric Utility of $6,256 (2%). This isprimarily due to the decrease in the cost of purchased powe due to decreases in demand.This decrease was offset by the increase in Sanitation expenses of $3,998 (10%M) primarilyrelated to the implementation of a flow monitoring project as a requirement of the NationalPollutant Discharge Elimination System (NPDES) permit and the increase in Convention,Sports and Entertainment Venues expenses of $2,819 (7%) primarily due to increasedlabor and professional services expenses.
FINANCIAL ANALYSIS OF THI CITY'S FUNDS
Governmwatal funds. The focus of the City's governmental funds is to provideinformation on near-term inflows, outflows, and balances of spendable resources. Suchinformation is useful in assessing the City's financing requirements. In particular,unreserved fund balance may serve as a useful measure of a government's net resourcesavailable for spending at the end of the fiscal year.
As of the end of the current fiscal year, the City's governmental funds reported total endingfund balances of $205,469, an increase of $3,634 in comparison with the prior fiscal year.More than half of the total ending fund balances ($119,009) constituted unreserved fundbalances, which are considered available for appropriation. The remainder of the fundbalances is reserved to indicate that it is not available for new spending because it hasalready been committed 1) to pay debt service ($34,872), and 2) to offset non-currentfinancial resources that arc not anticipated to be liquidated in the near term ($51,588).
General Fund revenues were $25,023 (13%) greater than in the prior fiscal year primarilydue to the increases in property taxes, sales taxes and in transient occupancy taxes asdiscussed in the government-wide financial analysis of governmental activities.Expenditures increased $11,347 (16%) for police and $7,491 (21%) for fire as discussedin the government-wide financial analysis of governmental activities. There were no othersignificant expenditure variances.
*-h f
&MM I
tszom 4--
Sim= 4--
Mass I-l
Wd- L'" 110b.!!_.ebs~so J--
U Program rs M UM M XP"n
16

CITY OF ANAREHIM
The Housing Authority revenues and other financing sources decreased by $7,100 (11%)and expenditures and other financing uses decreased by $6,784 (11%) primarily due to adecrease in the number of units leased for the Section 8 Rental Assistance Program.
Propriotary funds. The City's proprietary funds provide the same type of informationfound in the government-wide financial statements, but in more detaiL
The Electric Utility's fund net assets increased $13,301 (4%) in the current fiscal year.The most significant factors of the changes in fund net assets are discussed in thegovernment-wide financial analysis of business-type activities.
The Water Utility's fund net assets decreased $1,960 (less than 1%) in the current year.There ware no significant or unusual changes.
Sanitation's fund net assets increased $39 (less than 1%) in the current fiscal year. Thereware no significant or unusual changes, other than that previously discussed in thegovernment-wide financial analysis of business-type activities.
The Golf Courses' fund net assets decreased $221 (3%) in the current year. There wereno significant or unusual changes.
The Convention, Sports and Entertainment Venues fund net assets increased $3,432 (1%)in the current year. There were no significant or unusual changes.
GENERAL FUND BUDGBTARY H[GHIOUHTS
During the year the original budget was amended to increase appropriations by $9,280(5%). Following are the main components of the increase:
* $2,539 for carryover of prior year expenditure appropriations* $2,046 for additional public warks expenditures for a landslide* $1,769 for additional police workers' compensation expenditures* $1,769 for additional fire warkers' compensation expenditures* $750 for additional police expenditures related to the addition of new swom officers
and participation in special events that were not budgeted
The increase in appropriations was to be funded from additional revenues, primarilyproperty taxes, of $5,879 and the remaining $3,401 from fund balance.
General Fund revenues of $223,138 exceeded budgeted revenues of $210,992 by $12,146(6%). The excess was primarily due to property taxes ($2,860), sales and use taxes($4,317) and transient occupancy taxes ($2,947) due to the overall strength in theeconomy.
General Fund expenditures were less than budgeted. Of the total appropriations of$201,581 approximately two percent, or $3,982 went unspent. There were no significantvariances.
CAPITAL ASSETS AND DEBT ADMINISTRATION
CAPITAL ASSETS(net of accumulated depreciation)
JUNE 30,2005 AND 2004
GovernmentalActivities
2005 2004
Business-typeActivities
2005 2004
TotalGovernment
2005 2004
LandConsuction in progressNuclear fuel at amortized costBuildings, structures and improvementsUtility plantMachinery and equipmentInfastr ureTotal
$ 495,00646,105
141,587
33,950460,656
$1,177,304
$ 490,91719,597
145,125
25,329469,343
$1,150,311
S 36,28127,9512,197
350,518741,354
14,093
$ 31,53845,9502,730
360,361707,339
8,832
$ 531,28774,056
2,197492.105741,35448,043
460,656$2,349,698
$ 522,45565,547
2,730505,486707,339
34,161469,343
$2,307,061$1,172,394 $1,156,750
17

MYr OF ANALEIM
Capital assets. The City's investment in capital assets for its governmental and business-type activities at June 30, 2005, amounted to $2,349,698 (net of accumulateddepreciation). This investment in capital assets included land, construction in progress,nuclear fuel at amortized cost, buildings, structures and improvements, utility plant,machinery and equipment, and infrastructure. The total increase in the City's investmentin capital assets resulted from many various projects throughout the City. The total
increase over the prior fiscal year was two percent, of which governmental activitiesincreased two percent and business-type activities increased one percent
Additional information on the City's capital assets can be found in note 5 of the notes tothe financial statements, on pages 47-48 of this report.
LONG-TERM LIABIITIESJUNE 30,2005 AND 2004
GovernmentalActivities
2005 2004
Business-typeActivities
2005 2004
TotalGovernment
2005 2004
General obligation bondsRevenue bondsTax allocation bondsCertificates of participationCapital lease obligationsNotes and loans payableSelf-insranceRetired medicalDecommissioning provision
Total
S 6,625569,016164,13433,174
1,52328,66929,92074,049
$907,110
S 7,060562,118168,36036,107
2,00122,74726,38268,465
$893,240
$528,130
132,952180
15,842
93,782
$770,886
$543,780
140,355349
16,678
90,299
$791,461
$ 6,6251,097,146
164,134166,126
1,70344,51129,92074,04993,782
$1,677,996
$ 7,0601,105,898
168,360176,462
2,35039,42526,38268,465
90,299$1,684,701
LoAg-term liabilities, The City's outstanding long-term liabilities, including bonds,certificates of participation, capital leases, notes and loans payable, self-insurance, retiredmedical, and the provision for decommissioning costs totaled $1,677,996 at June 30,2005. Of this total, $907,110 (54%) was in governmental activities and $770,886 (46%)was in business-type activities. The City's outstanding long-term liabilities decreased$6,705 (less than 1%) in fiscal year 2005. The decrease is primarily due to the repaymentof principal on long-term liabilities.
Additional information on the City's long-term liabilities can be found in note 7 of thenotes to the financial statements, on pages 49-57 of this report.
ECONOMIC FACTORS AND NEXT YEAR'S BUDGETS AND RATES
" The unemployment rate in the Orange County, California area for June 2005 was3.9%9, which remains below both the state (5.4%) and national (5.0%) average.Increases in the professional and business services sectors have provided an overallincrease in Orange County job creation over the last twelve months.
" TOT revenue continues to be the City's largest General Fund revenue source. TOT wasbudgeted at $64.2 million for the current fiscal year and actual TOT revenue was $67.1million. The City has budgeted a continuation of this increased hotel demand in fisalyear 2006 and has budgeted $70.8 million for the 2006 fiscal year.
18

CITY OF ANABEIM
For the 2006 fiscal year, the City appropriated $222.7 million of the budgeted $251.6 REQUESTS FOR INFORMATIONmillion in estimated available fund balance in the General Fund for spending. Thisleaves $28.9 million in estimated available reserves, which is 13% of General Fund This financial report is designed to provide a general overview of the City's finances forappropriations. The City's long-standing policy is to maintain General Fund reserves all those with an interest in the government's finances. Questions concerning any of theof at least 7% to 10% of annual appropriations, information provided in this report or requests for additional information should be
addressed to the Office of the Finance Director, City of Anaheim, 200 South Anaheim" The City annually reviews all of its fees as part of the budget adoption process. Boulevard, Suite 643, Anaheim, California, 92805.
Developer, construction, and other fees applicable to residents and developers doingbusiness with the City were adjusted in June 2005, generally by the average of CPI(3.7%). This is consistent with the City's policy of recovering costs withoutbecoming an undue financial burden on existing tax and rate payers.
" In fiscal year 2006, cities and counties will contribute $700 million ($350 million forcities and $350 million for counties) as part of an effort to assist the State balance itsbudget (ERAF II). The City's share of the contribution is $3,750 and has beenincluded in the City's fiscal year 2006 budget. The contribution will come from areduction in the City's secured property taxes.
19

(This page left blank intentionally)
20


MTY OF ANAIHIM
Statement of Net AssetsJune 30, 2005 (in thousands)
Govetrmental Buuinass-yActivities Activitie Total
ASSTSCash and cash equivalents $ 42,930 $ 33,164 S 76,094Inestments 243,633 192,477 436,110Accounts receivable, net 9,134 45,671 54,805Accrued interest receivable 2,562 3,865 6,427Internal balances, net (675) 675Due from othe governments 26,312 26,312Notes receivable, net 44,097 44,097Inventories 796 7,460 8,256Land held for resale, net 27,866 27,866Restricted cash and cash equivalents 32,793 8,619 41,412Restricted investments 17,594 292,968 310,562Unamortizod debt issuance costs 1I 7,680 7,691Bond payment receivable 19,542 19,542Pipeline receivable 405 405Prepaids and oher assets 2,001 22,505 24,506Capital assets, net:
Nondepreciable 541,111 66,429 607,540Depreciable 636,193 1,105,95 1 42158
Total assets 1,626,358 1,807,425 3,433,783
IJABUJT[ESAccounts payable 20,500 22,808 43,308Wages payable 22,075 1,348 23,423Due to other governments 5,734 5,734Interest payable 13,217 8,831 22,048Arbitrage rebate liability 183 183Deposits 4,713 10,142 14,855Regulatory credits 36,659 36,659Unearned revenues 8,278 1,015 9,293Noncurrent liabilities:
Due within one year 30,937 23,950 54,887Due in more than one year 876,173 746,936 1,623,109
Total liabilities 981,627 851,872 1,833,499
NETAS8ET8Invested in capital assets, net of related debt 605,346 645,802 1,251,148Restricted fo.
Debt service 12,602 57,252 69,854Capital projects 12,561 18,631 31,192Community development 45,602 45,602Streets and roads 20,443 20,443Other purposes 4,251 4,817 9,068
Unresricted (deficit) (56,074) 229,051 172,977Total netassets $ 644,731 $ 955,553 $1,600,284
The accompanying notes are an integral part of these financial statements 21

(This page left blank intentionally)
22

CITY OF ANAHEIM
Statement of ActivitiesYear Ended June 30, 2005 (in thousands)
-R " Allocation
_________________Ne& ~) Reveuie andProrni Revnus NiotAnct
Operating CapitalChaiuq for Grants and Grants and Govenumental Busns-type
Servioe Contributions Contributions Acfiviu Activitics TotalFunationalProgramsGovernmental activities:
General governmentpolice
FireCommunity DevelopmentPlanningPublic WorksCommunity ServicesPublic UtilitiesConvention, Sports and EntertainmentInterest on long-term debt
Total governmental activities
Business-type activities:Electric UtilityWater UtilitySolid Waste and SanitationGolf CoursesConvention, Sports and Entertainment Venues
Total business-type activitiesTotal government
$18,35789,86545,45682,39712,69338,70227,774
1,5577,703
47,105371,609
272,59440,44445,118
3,93145,016
407,103$778,712
$(10,136)1,8481,140
786513761540
$ 1,442 $ 1209,840 4,1647,909 4944,667 57,1356,994 1,2426,544 13,6114,985 1,104
200
(4,548) 42,581 77,870
$ 15214722
17,324579
2,682
20,906
1,7971,402
8,31411,513
$32,419
$ (6,659)(77,557)(38,046)(21,359)
(4,970)(1,984)
(21,646)(1,557)(4,821)
(47,05)(225,704)
$ (6,659)(77,557)(38,046)(21,359)
(4,970)(1,984)
(21,646)(1,557)(4,821)
(47,105)(225,704)
2,028869311131
1,2094,548
284,740 3443,42746,480 1,276
5,39427,412 1,163
407,453 2,473$450,034 $80,343
General revenues:Taxes:
Property taxesSales and use taxesTransient occupancy taxesMotor vehicle license fees (unrestricted intergovernmental)Other hs
Unrestricted investment earningsOtherLoss on sale of capital assets
TransfersTotal general revenues and transfers
Change in net assetsNet assets at beginning of yearNet assets at end of year
$ 11,949 11,9493,516 3,5162,327 2,3271,332 1,332
(9,336) (9,336)9,788 9,788
(225,704) 9,788 (215,916)
78,620 78,62061,779 61,77967,141 67,141
2,113 2,11310,175 10,1758,071 16,592 24,6631,499 418 1,917(722) (1,164) (1,886)
12,400 (12,400)241,076 3,446 244,522
15,372 13,234 28,606629,359 942,319 1,571,678
$644,731 $955,553 $1,600,284
The accompanying notes are an integral part of these financial statements 23

(This page left blank intentionally)
24

CITY OF ANAHEIM
Balance SheetGovernmental FundsJune 30, 2005 (in thousands)
Nonmajor TotalHousing Guvconuntal Gowamoutal
General Authority Fund FundsASSETSCash and cash equivalents $ 4,972 $ 2,181 S 14,856 $ 22,009lnvesunents 28,598 9,786 84,841 123,225Accounts receivable, net 8,484 111 8,595Accrued interest receivable 293 99 1,035 1,427Notes receivable 16,446 31,804 48,250Interfimd receivable 10,272 12,145 22,417Due from other governments 14,466 322 11,524 26,312Inventories 164 164Land held for resale, net 27,866 27,866Prepaids and other assets 168 1,814 1,982Restricted cash and cash equivalents 32,776 32,776Restricted investnents 17,121 17,121
Total assets $67,417 $28,834 $235,893 $332,144
LIABILHI1BS AND FUND BALANCESLiabilities:
Accounts payable $ 3,218 $ 478 $ 11,397 S 15,093Wages payable 4,043 101 276 4,420Deposits 3,659 71 983 4,713lnterfind payable 104 27,012 27,116Due to other governments 5,734 5,734Deferred liabilities 7,322 16,768 45,509 69,599
Total liabilities 18,346 23,152 85,177 126,675
Fund balances:Reserved for noncurrent intcrftmd receivable 9,560 12,016 21,576Reserved for inventories 164 164Reserved for debt service 34,872 34,872Reserved for land held for resale 27,866 27,866Reserved for prepaids and other assets 168 1,814 1,982Unreserved - designated for debt service, reported in Debt Service Funds 1,457 1,457Unreserved - designated for capital projects, reported in:
Special Revenue Funds 14,974 14,974Capital Projects Funds 36,497 36,497
Unreserved - undesignated, reported in:General Fund 39,179 39,179Special Revenue Funds 5,682 25,955 31,637Capital Projects Funds (4,735) (4,735)
Total fund balances 49,071 5,682 150,716 205,469Total liabilities and fund balances $67,417 $28,834 $235,893 $332,144
The accompanying notes are an integral part of these finacial statements 25

CITY OF ANAHEIM
Reconciliation of the Governmental Funds Balance Sheetto the Statement of Net AssetsJune 30, 2005 (in thousands)
Total fund balances - governmental funds $ 205,469
Amounts reported for governmental activities in the Statement of Net Assetsare different because:
Capital assets used in the operation of governmental funds are not financialresources and, therefore, are not reported in the funds. These assets consist of:
Land $ 495,006Construction in progress 39,239Buildings, structures and improvements 214,399Machinery and equipment 31,298Infiastructure 713,165Accumulated depreciation (344,189)
Total capital assets, net 1,148,918
Other long-term assets are not available to pay for current-periodexpenditures and, therefore, are deferred in the funds. 57,764
Internal service funds are used by management to charge the costs of certainactivities, such as insurance, employee benefits, and fleet services, toindividual funds. The assets and liabilities of the internal service fundsare included in governmental activities in the Statement of Net Assets. 47,148
Compensated absences, not otherwise included in the internal service funds, arenot due and payable in the current period and, therefore, ar not reported in the funds. (362)
Long-term liabilities of governmental funds, including bonds, certificates ofparticipation, and notes and loans payable ($801,035), and accrued interestpayable ($13,171), are not due and payable in the current period and,therefore, are not reported in the funds. (814,206)
Net assets of governmental activities S 644,731
The wccompanying notes are an integral part of these financial statements 26

CITY OF ANABEIM
Statement of Revenues, Expenditures and Changes in Fund BalancesGovernmental FundsYear Ended June 30, 2005 (in thodusads)
No=mjo TOWaGenra AthriyGund Farunaids
Revenues: Gnr ud ud
Property taxes S 42,878 $ 39,071 S 81,949Sales and use taxe 59,976 59,976Transient occupancy taxes 67,141 67,141Other taxes 7,542 7,542Licenses, fees and permits 17,315 S 73 1,361 18,749Integovenmental revenues 9,511 53,116 38,820 101,447Charges for services 12,130 12,130Fines, forfeits and penalties 3,454 3,454Use of money and property 2,554 382 6,208 9,144Other 637 1,356 4,150 6,143
Total revenues 223,138 54,927 89,610 367,675Expendiurs
City Council 306 306City Administration 2,261 2,261City Attorney 3,627 120 3,747City Clerk 536 536Human Resources 1,207 1,207Finance 3,711 3,711City Treasurer 508 508Police 82,721 3,808 86,529Fire 43,760 422 44,182Community Development 363 54,651 28,370 83,384Planning 11,024 1,289 12,313Public Works 15,609 6,639 22,248Community Services 24,495 1,229 25,724Public Utilities 1,557 1,557Convention, Sports and Entertainment 4,967 173 5,140
Capital outlay 676 953 39,672 41,301Debt service:
Principal retirement 206 9,928 10,134Interest and fiscal agent charges 65 38,616 38,681
Total expenditures 197,599 55,604 130,266 383,469
Excess (deficiency) of revenues over (under) expenditures 25,539 J67) (40,656) (15,794)Other financing sources (uses).
Transfers in 25,974 1,000 72,192 99,166Transfers out (48,668) (291) (39,318) (88,277)Issuance of debt 125 7,164 7,289Litigation claim settlement proceeds 1,250 1,250
Total other financing sources (uses) (21,444) 834 40,038 19,428
Net change in fund balances 4,095 157 (618) 3,634Fund balances at beginning of year 44,976 5,525 151,334 201,835Fund balances at end of year S 49,071 $ 5,682 $150,716 $205,469
The accompanying notes are an integral part of these financial statements 27

CITY OF ANAHEAIM
Reconciliation of the Statement of Revenues, Expenditures and Changesin Fund Balances of Governmental Funds to the Statement of ActivitiesYear Ended June 30,2005 (in thousands)
Net change in fund balances - total governmental funds $ 3,634
Amounts reported for governmental activities in the Statement of Activitiesare different because:
Governmental funds report capital outlays as expenditures. However,in the Statement of Activities the cost of those assets is allocatedover their estimated useful lives and reported as depreciation expense.This is the amount by which capital outlays ($41,301) exceededdepreciation ($23,803) in the current period. 17,498
Transfers of capital assets between governmental funds and proprietary fundsdo not provide current financial resources and are not reported as transfersin the funds. 1,511
The net effect of other miscellaneous transactions involving capital assets(i.e., sales, trade-ins, and donations) is to increase net assets. 1,540
Revenues that provide current financial resources in the governmental fundsbut have been reported in the Statement of Activities in prior fiscal years. (3,731)
Proceeds from long-term debt provide current financial resources to governmental funds,but the issuing of debt increases long-term liabilities in the Statement of Net Assets. (7,289)
Repayment of principal on long-term debt is an expenditure in the governmental funds,but the repayment reduces long-term liabilities in the Statement of Net Assets. 10,134
Certain expenses reported in the Statement of Activities do not require the useof current financial resources and, therefore, are not reported as expendituresin governmental funds. (6,644)
Internal service funds are used by management to charge the costs of certainactivities, such as insurance, employee benefits, and fleet services, toindividual funds. The net expense of the internal service fundsis reported with governmental activities. (1,281)
Change in net assets of governmental activities $15,372
The accompanying notes are an integral part of these financial statements 28

CITY OF ANAHBEIM
Statement of Revenues, Expenditures and Changes in Fund BalanceBudget and Budgetary Basis Actual - General FundYear Ended June 30, 2005 (in thousands)
Varianoll WithBudgetal Amounts Fia nBe -
Oriowna Final Actual Over/(Under)Revenues:
Property taxes $ 21,724 S 40,018 $ 42,878 $ 2,860Sales and use taxes 55,659 55,659 59,976 4,317Transient occupancy taxes 64,194 64,194 67,141 2,947Other taxes 7,142 7,142 7,542 400Licenses, fees and permits 17,076 17,412 17,315 (97)Intergovernmental revenues 21.601 8,625 9,511 886Charges for services 12,437 12,230 12.130 (100)Fines, forfeits and penalties 2,896 2,896 3,454 558Use of money and property 2,318 2,316 2,554 238Other 66 500 637 137
Total revenues 205,113 210,992 223,138 $12,146
Expenditures:City Council 309 309 306 (3)City Administration 2,416 2,422 2,267 (155)City Attorney 3,627 3,627 3,627 (0)City Clerk 547 551 536 (15)Human Resources 1,215 1,215 1,207 (8)Finance 3,833 3,837 3.711 (126)City Treasurer 580 580 508 (72)Police 80,488 83,329 83,252 (77)Fire 41,598 44,264 43,773 (491)Community Development 313 363 363 0Planning 11,324 11,770 11,024 (746)Public Works 14,001 16,421 15,655 (766)Community Services 25,617 26,326 24,846 (1,480)Public Utilities 1,592 1,592 1,557 (35)Convention, Sports and Entertainment 4,841 4,975 4,967 (8)
Total expenditures 192,301 201,581 197,599 (3,982)
Excess of revenues over expenditures 12,812 9,411 25,539 16,128
Other financing sources (uses):Transfers in 26,557 26,557 25,974 (583)Transfirs out (42,621) (48,024) (48,668) (644)Litigation claim settlement proceeds 1,250 1,250
Total other financing uses (16,064) (21,467) (21,444 23
Net change in fund balance (3,252) (12.056) 4,095 16,151
Fund balance at beginning of year 44,976 44,976 44,976Fund balance at end of year $ 41,724 S 32,920 $ 49,071 $16,151
The accomp•nying notes are an integral part of these financial statements 29

CITY OF ANAHEIM
Statement of Revenues, Expenditures and Changes in Fund BalanceBudget and Actual - Housing AuthorityYear Ended June 30, 2005 (in thousands)
Vanaane withB_ _ _ _t__Amounts Finl Budget -
Original Final ActUal Over/(Under)Revenues:
Licenses, fees and permits $ 80 $ 80 $ 73 $ (7)Intergovernmental revenues 60,116 62,950 53,116 (9,834)Use of money and property 263 263 382 119Other 797 797 1,356 559
Total revenues 61,256 64,090 54,927 (9,163)
Expenditures:Community Development 68,346 72,077 55,604 (16,473)
Total expenditures 68,346 72,077 55,604 (16,473)
Deficiency of revenues under expenditures (7,090) (7,987) (677) 7,310
Other financing sources (uses):Transfers in 150 150 1,000 850Transfers out (1,216) (303) (291) 12Issuance of debt 1,920 1,920 125 (1,795)Sales of capital assets 3,165 3,165 (3,165)
Total other financing sources 4,019 4,932 834 (4,098)
Excess (deficiency) of revenues and other sourcesover (under) expenditures and other uses (3,071) (3,055) 157 3,212
Fund balance at beginning of year 5,525 5,525 5,525Fund balance at end of year $ 2,454 S 2,470 S 5,682 $ 3,212
The accompanying notes ame an integral part of these fmancial statements 30

CrrY OF ANAhEIM
Statement of Fund Net AssetsProprietary FundsJune 30, 2005 (in thousands)
Businuayp Aadvtie - Enterprise Minds
ASSETSCurrent assets:
Cash and cash equivalentsInvestmentsRestricted cash and cash equivalentsRestricted investmentsAccounts receivable, netAccrued interest receivableInterfund receivableInventoriesBond payment receivablePrepaids and other assets
Total current assets
Noncurrent assets:Restricted cash and cash equivalentsRestricted investmentsUnamortized debt issuance costsBond payment receivable, less current portionPipeline receivableInterfund receivable, less current portionPrepaids and other assetsCapital assets:
LandBuildings, structures and improvementsUtility plantMachinery and equipmentConstruction in progress
Less accumulated depreciationNuclear fuel, at amortized cost
Capital assets, netTotal noncurrent assets
Total assets
Electri& Water GolfUtility Utility Sanitation Counes
S 19,742 $ 4,711 $ 3,993 $ 49115,015 27,443 23,247 288
6,824 1,0009,714 2,140
31,726 5,918 6,860 1062,605 324 236 1
2807,274 178
349 343193,529 42,057 34,336 444
261,655 3,6865,993 222
405700
21,811
Conv"i4Sports and
EntertainmentVanua
$ 4,66926,484
1,061699
81,260
234,183
GovammetalActivites -IntenalServic
Total Funds
14,308 1,573 31648
1,94915,581
79515,773
1,46518,282
10,699
18,135462,005
25,557996
506,693(133,956)
372,737419,751453,934
$ 33,164192,477
7,82411,85445,671
3,865280
7,4601,260
694304,549
795281,114
7,68018,282
40511,39921,811
36,281477,634
1,152,32930,44327,951
1,724,638(554,441)
2,1971,172,3941,513,8801,818,429
$ 20,921120,408
539
1,135
632
19143,654
17473
11
104
6,603
47,7706,866
61,239(32,853)
28,38628,991
172,645
863,555 288,7744,116 770
2 4 , 3 0 5 2 , 6 5 0 _ _ i _ 4 8 _ 1 8 ,3 0902,168 292,997 4,480 18,300
(335,674) (75,301) (3,721) (5,789)2,197
568,691 217,696 759 12,511858,850 222,009 759 12,511
1,052,379 264,066 35,095 12,955
(contiWed) 31

CiTY OF ANAHEBIM
Statement of Fund Net AssetsProprietary FundsJune 30, 2005 (n thousands) (continued)
Busniess-typ Activities - Enterprise Funds
Electric WaterUtilty Uay
GooSantaton Golf. EntertakinentSanitaion Corses aes
GowvenentalAcfiviti-
Internalservice
Total FundsLIABUTI, ESCurrent liabilities (payable from current assets):
Accounts payableWages payableInterest payableCompensated absencesLong-term obligationsUnearned revenuesDepositsInterfund payableRegulatory credits
Total current liabilities (payable from current assets)
Current liabilities (payable from restricted assets):Accounts payableWages payableInterest payableArbitrage rebate liabilityLong-term obligations
Total acrrent liabilities (payable from restricted assets)Total current liabilities
Noncurrent liabilities:Interflnd payable, less current portionLong-term obligations, less current portionProvision for decommissioning costs
Total noncurrent liabilitiesTotal liabilities
FUND NET ASSETSInvested in capital assets, net of related debtRestricted for.
Debt serviceCapital projectsOther purposes
Unrestricted (deficit)Total fund net assets
$ 11,492680
3,546
5,479
$ 5,419 S 3,511157 96
$ 7413
180
$ 1,930373
2,134
7,8371,0151,622
280
15,191
2,236
36,497 16257,694 8,154
800 5548
4,407 640
38229
6,347181
9,59916,53874,232
501,98193,782
595,763669,995
3502
2,7883,140
11,294
24,483
24,48335,777
4,407 640
5,556
15,191
700126,690
127,390142,581
264,319
$ 22,4261,3192,134
11,5631,015
10,142828
36,65986,086
38229
6,697183
12,38719,678
105,764
6,256653,154
93,782753,192858,956
645,802
57,25218,631
4,817232,971959,473
$ 5,4071,071
4616,22216,398
596
39,740
4,4075,5566,196
39,740
89,677
89,677129,417
26,291
446
16,491$ 43,228
177,746 190,467 759 12,511
43,62310,8444,817
145,354$ 382,384
4,2972,177
31,348$228,289
9,3325,610
29,929 (5,752) 32,092$30,688 $ 6,759 $311,353
Adjustment to reflect the consolidation of internal service fund activities related to enterprise funds.Net assets of business-type activities
The accompanying notes are an integral part of these financial statements
(3,920)$955,553
32

CITY OF ANAHEIM
Statement of Revenues, Expenses and Changes in Fund Net AssetsProprietary FundsYear Ended June 30, 2005 (In thousads)
Bwsinea-yp Activitiesa- Enterpriae Fundh
Operating revenues:Sales of light and powerTransmission revenuesSales of waterSanitation feesGreen fees and cart rentalsFacilities rentalConcession feesOther
Total operating revenues
Operatin e=pPnsesFuel and generation of powerCost of purchased waterTreatment and pumping of waterMaintenance, operations and administationInsurance premiums and claimsCompensated absences and other benefitsDepreciation and amortization
Total operating expensesOperating income (loss)
Nonoperating income (expenses):Intergovernmental revenuesInterest incomeDebt service recoveryOther nanoperating incomeInterest expenseGain/(loss) from disposal of capital assets
Total nonoperating income (expenses)
Income (loss) before contributions and transfers
Capital contributionsTransfers inTransfers out
Change in fund net assets
Fund net assets at beginning of yearFund net assets at end of year
ElectricUtility
$257,40624,085
Water
Ut$ 2ty
S 42,336
Sports andGolf Entertainment
Sanitation Courses Vmuea
$45,156
GoverimentalAcivitie -InternalSeviceFunds
$ 5,013
1813,249 1,091 1,324 200
284,740 43,427 46,480 5,394
146,47237,114
34,976
29,764248,326
36,414
3412,669
(25,730)
(13,027)
23,387
2,2773,248
(15,611)13,301
369,083$382,384
17,7593,401
12,152
6,53939,851
3,576
1,057
418(1,010)
465
4,041
1,402
(7,403)(1,960)
230,249$228,289
44,928
38845,316
1,164
1,276658
(38)1,896
3,060
(3,021)39
30,649$30,688
3,342
5793,9211,473
5
(141)
(136)
1,337
142(1.700)
(221)
6,980$ 6,759
$ 23,2533,1071,052
27,412
25,555
12,37637,931
(10,519)
2,2031,163
(8,068)(1,126)(5,828)
(16,347)
8,31411,465
3,432
307,921$311,353
Total
$257,40624,08542,33645,1565,013
23,2533,2886,916
407,453
146,47237,11417,7593,401
120,953
49,646375,34532,108
1,31016,592
1,163418
(34,949)(1,164)
(16,630)
15,478
11,99314,855
(27,735)14,591
(1,357)$ 13,234
$112,990112,990
29,66211,69173,592
3,788118,733
(5,743)
3,167
(149)87
3,105
(2,638)
2,183
(455)
43,683$ 43,228
Adjustment to reflect the consolidation of internal service fund activities related to enterprise funds.Change in net assets of business-type activities
The accompanying notes are an integral part of these financial statements33

CITY OF ANAhEIM
Statement of Cash FlowsProprietary FundsYear Ended June 30, 2005 (In thousads)
Businea-type Ativities - Enterprise Funds
Electric WaterUtilty Uiity
Sports andGolf Entertainment
Sanitation Coursit -Vaues
GovernmmalActivities-InternalService
Total FundsCash flows fiom operating activities:
Receipts from customers and usersReceipts from interfund services providedPayments to suppliersPayments to employeesPayments for interfund services usedPayments for insurance premiums and claimsOther receipts (payments)
Net cash provided by operating activities
Cash flows from noncapital financing activities:Receipt (payment) of interfund balancesTransfers inTransfers outOperating grant receipts
Net cash provided by (used in) noncapitalfMnancing activities
Cash flows from capital and telated financing acivities:Proceeds from sale of capital assetsCapital contributionsCapital purchasesNuclear fuel purchasesDebt service recoveryPrincipal payments on long-term debtInterest paymentsReceipt (payment) of interfund balances for capital purposes
Net cash used in capital and related financing activities
Cuah flar fiom investing aWivities:Purchase of investment securitiesProceeds from sale and maturity of investment securitiesInterest receivedCollection of note receivable
Net cash provided by investing activities
Increase (decrease) in cash and cash equivalentsCash and cash equivalents at beginning of the year
Cash and cash equivalents at end of the year
$ 297,0241,691
(186,831)(26,323)
(8,429)
$ 43,037270
(21,941)(8,924)(3,634)
$43,99234
(38,326)(3,745)(2,415)
$5,161
(2,894)(458)(211)
S 27,961
(7,842)(14,482)
(1,938)
$ 417,1751,995
(257,834)(53,932)(16,627)
$112,975(16,644)(75,044)
(2,332)(7,792)
(89)11,074
368
418 1,290 20077,132 9,226 830 1,798
280
1,9083,699 92,685
43411,465
(15,216) (2,417)34
(14,902) (2,417)
(3,021) (1,700)1,276
(1,745) (1,700) 11,899
1,527(46,179)
(966)
(15,875)(25,008)
(86,501)
(982,349)989,558
14,822
22,031
(2,240)28,806
$ 26,566
16287
(8,618) (44) (1,766)
(2,401)(993)
(11,763)
(80,751)85,771
1,47873
6,571
1,6174,094
$ 5,711
(continued)
(124)(144)(312)
(58,845)60,001
943
2,099
1,1842,809
$ 3,993
(546)743II
208
(6)55
$ 49
2,338(7,565)(7,357)
(280)(14.630)
(110,629)108,506
2,519
396
1,3644,100
$ 5,464
71411,465
(22,354)1,310
(8,865)
1621,614
(56,607)(966)
2,338(25,841)(33,482)
(424)(113,206)
(1,233,120)1,244,579
19,77373
31,3051,919
39,864
$ 41,783
368
105
(10,250)
(485)
(153)
(10,783)
(309,909)311,573
4,571
6,235
6,89414,044
$ 20,938
34

CITY OF ANAHEIM
Statement of Cash FlowsProprietary FundsYear Ended June 30, 2005(In thousands) (continued)
Business-ype Activitie - Enterris Funds
Electric Water
utiity Utility Sanitation
$36,414 $ 3,576 $1,164
Conveion.sports and
Golf EntortainmentCourm Venues
GovernmentalActivities-
LAterMiService
Total FundsReconclation of operating income los) to net cashprnided by operating activites:
Operating income (loss)Adjustment to reconcile operating income (loss)
to net cash provided by operating activities:Depreciation and amortizationAmortization of nuclear fuelIncrease in provision for decommissioning costsOther nonoperating income
Changes in assets and liabilities:Accounts receivableInventoriesPrepaids and other assetsAccounts payableWages payableUnearned revenuesCompensated absences post retirement and self-insurance liabilitiesDepositsRegulatory credits
Total adjustmentsNet cash provided by operating activities
Schldle of noncash investing, capital and finamin activities:Capital contributionsTransfers in (out) of capital assetsTransfers in (out) of other assetsDecrease in fair value of investments
Reconciliation of cash and cash equivalents:Cash and cash equivalentsRestricted cash and cash equivalents, current portionRestricted cash and cash equivalents, noncurrent portion
Total cash and cash equivalents
$1,473 $(10,519)
12,37629,7641,4993,483
5,113(1,099)(4,300)(2,677)
73
(516)9,378
40,718$77,132
$ 27085
3,248(2,223)
$19,7426,824
$26,566
6,539 388 579
418
57(14)(79)
(1,030)(64)
(177)
5,650$ 9,226
$ 1,315(1,738)(3,248)
(414)
$ 4,7111,000
$ 5,711
(1,248)
4402
84
(334)$ 830
(37)
(221)
4
325$1,798
$ 142
(4)
$ 49
$ 49
2162
1,322(29)47
284
14,218$ 3,699
$ 8,314
(354)
$ 4,669
795$ 5,464
$32,108
49,6461,4993,483
418
4,101(1,111)(4,379)(2,166)
(18)47
(321)9,378
60,577$92,685
$ 9,899(1,511)
(3,311)
$33,1647,824
795$41,783
S(5,743
3,788
91(100)
712,182
34031
10,414
16,817
$11,074
$ 2,183
(1,476)
$20,921
17$20,938
$ (316)
$33,993
$33,993
The accompanying notes are an integral part of these financial statements 35

CITY OF ANAHEIM
Statement of Fiduciary Assets and LiabilitiesAgency Fund - Mello-RoosJune 30, 2005 (in thousands)
ASSEISRestricted cash and cash equivalentsDue from other governments
Total assets
$3,55443
$3,597
LIABIIUTIESDue to bond holders $3,597
The accompanying notes are an integral part of thwe financial sttements 36

CITY OF ANAHEIM
Notes to Financial Statements(Amounts in thousands)
NOTE 1 -SUMMARY OF SIGNIFICANTACCOUNTINO POLICIES:
The financial reporting entity
As defined by accounting principles generally accepted in the United States of America(GAAP) that are established by the Governmental Accounting Standards Board (GASB),the financial reporting entity consists of the primary government, as well as its componentunits, which are legally separate organizations for which the elected officials of theprimary government are financially accountable. Financial accountability is defined asappointment of a voting majority of the component unit's board, and either a) the abilityto impose will by the primary government, or b) the possibility that the component unitwill provide a financial benefit to or impose a financial burden on the primarygovernment.
The accompanying financial statements present the City of Anaheim (City), the primarygovernment, and its component units. The fimancial data of the component units areincluded in the City's reporting entity because of the significance of their operational orfinancial relationships with the City.
The component units described below are each legally separate from the City, but are sointertwined with the City that they are, in substance, the same as the City. They arereported as part of and accountable to the City and blended into the government-wide andfund financial statements.
Anaheim Housing Authorbv (lHousing Authoritlv is a separate entity primarily funded bythe US. Department of Housing and Urban Development to administer funds receivedunder the Federal Housing Assistance Payments program. City Council members, inseparate session, serve as the governing board of the Housing Authority, and allaccounting and administrative functions are performed by the City. The financial activityof the Housing Authority has been blended into the City's Comprehensive AnnualFinancial Report (CAFR) in the government-wide governmental activities and in the fundfinancial statements as the Housing Authority Special Revenue Fund.
Anaheim Redevelopment Azencv (Redevelopment Agencvy is a separate governmententity created to develop and execute plans for improvement, rehabilitation andredevelopment of blighted areas within the City. City Council members, in separatesession, serve as the governing board of the Redevelopment Agency, and all accountingand administrative functions are performed by the City. The financial activity of theRedevelopment Agency has been blended into the City's CAFR in the government-wide
governmental activities and in the fund fimancial statements as the RedevelopmentHousing Set-Aside Special Revenue Fund, the Redevelopment Agency Debt Service Fund,and the Redevelopment Agency Capital Projects Fund. For a copy of separate financialstatements, contact the Finance Director of the City.
Community Center Authoritv (CCA), a joint powers authority, was created primarily tofinance the initial construction of the Anaheim Convention Center. A five-member boardappointed by the City Council governs the CCA. The City has entered into a noncancelablelong-term lease with the CCA, which provides for lease payments in amounts sufficient tomeet the annual debt service requirements on the certificates of participation issued by theCCA to fimance the construction of the facility. The lease is a financing arrangement,which transfers the ownership of the facility to the City at the end of the lease term, andthe sole activity of the CCA is to provide financing for the City. As such, the financial datafor the CCA has been blended into the City's CAFR in the government-wide business-typeactivities and in the fund fimancial statements with the City's Convention, Sports andEntertainment Venues Fund, as all activity related to the Anaheim Convention Center isaccounted for in this enterprise fund. The capital lease has been eliminated in the financialstatements. For a copy of separate f'mancial statements, contact the Finance Director of theCity.
Anaheim Public Improvement Corporation (APIC. a non-profit corporation, was createdprimarily to finance several construction projects in the City. City Council members, inseparate session, serve as the governing board of APIC. The City has entered intononcancelable long-term leases with APIC, which provide for lease payments in amountssufficient to meet the annual debt service requirements on the certificates of participationissued by APIC to friance these construction projects. The leases are financingarrangements, which transfer ownership of the constructed assets to the City at the end ofthe lease terms. The fimancial data of APIC has been blended into various governmentaland business-type activities and funds of the City as applicable, and the capital leases havebeen eliminated.
Anaheim Public Financing Authori (Authority), ajoint powers authority, was establishedas a vehicle to reduce local borrowing costs and promote greater use of existing and newfinancial instruments and mechanisms. City Council members, in separate session, serveas the governing board of the Authority. Financial activity of the Authority has beenblended into the City's CAFR into various governmental and business-type activities andfunds of the City as applicable.
The City is a participant in four joint ventures and jointly-owned properties (see note 10),which am not considered part of the financial reporting entity, as the City does not haveany significant equity interests in the joint ventures and jointly-owned properties.
37

CY OF ANAHEIM
Baske financa statemmt
In accordance with GASB Statement No. 34 - Basic Financial Statements andManagemvntý Discussion and Analysis for State and Local Govemments, the basicfinancial statements include both government-wide and fund financial statements.
The government-wide financial statements (Statement of Net Assets and Statement ofActivities) report on the City and its component units as a whole, excluding fiduciaryactivities. Governmental activities, which normally are supported by taxes andintergovernmental revenues, are reported separately from business-type activities, whichrely to a significant extent on fees and charges for support. All activities, bothgovernmental and business-type, are reported in the government-wide financialstatements using the economic resources measurement focus and the accrual basis ofaccounting, which includes long-term assets and receivables as well as long-term debt andobligations. The government-wide financial statements focus more on the sustainability ofthe City as an entity and the change in aggregate financial position resulting from theactivities of the fiscal period.
Generally, the effect of interfund activity has been removed from the government-widefinancial statements. Net interfund activity and balances between governmental activitiesand business-type activities are shown in the government-wide financial statements. The"doubling up" effect of internal service fund activity has been eliminated from thegovernment-wide financial statements with the expenses shown in the various functionsand programs on the Statement of Activities.
The government-wide Statement of Net Assets reports all financial and capital resourcesof the City (excluding fiduciary funds). It is displayed in a format of assets less liabilitiesequal net assets, with the assets and liabilities shown in order of their relative liquidity. Netassets are required to be displayed in three components: 1) invested in capital assets, netof related debt, 2) restricted, and 3) unrestricted. Invested in capital assets, net of relateddebt is capital assets net of accumulated depreciation and reduced by outstanding balancesof any bonds, mortgages, notes or other borrowings that are attributable to the acquisition,construction, or improvement of those assets. Restricted net assets are those withconstraints placed on their use by either. 1) externally imposed by creditors (such asthrough debt covenants), grantors, contributors, or laws or regulations of othergovernments, or 2) imposed by law through constitutional provisions or enablinglegislation. All net assets not otherwise classified as restricted, are shown as unrestricted.Generally, the City would first apply restricted resources when an expense is incurred forpurposes for which both restricted and unrestricted net assets are available.
The government-wide Statement of Activities demonstrates the degree to which bothdirect and indirect expenses of the various functions and programs of the City are offsetby program revenues. Direct expenses are those that are clearly identifiable with a specific
function or program. Indirect expenses for administrative overhead are allocated amongthe functions and programs using a full cost allocation approach and are presentedseparately to enhance comparability of direct expenses between governments that allocatedirect expenses and those that do not. Interest on general long-term debt is not allocatedto the various functions. Program revenues include: i) charges to customers or users whopurchase, use or directly benefit from goods, services or privileges provided by aparticular function or program and 2) grants and contributions that are restricted tomeeting the operational or capital requirements of a particular function or program. Taxes,unrestricted investment income and other revenues not identifiable with particularfunctions or programs are included as general revenues. The general revenues support thenet costs of the functions and programs not covered by program revenues.
Also, part of the basic financial statements are fund financial statements for governmentalfunds, proprietary funds and fiduciary funds, even though the lat are excluded from thegovernment-wide financial statements. The focus of the fund financial statements is onmajor funds, as defined by GASB Statement No. 34. Although this reporting model setsforth minimum criteria for determination of major funds (a percentage of assets, liabilities,revenues, or expenditures/expenses of fund category and of the governmental andenterprise funds combined), it also gives governments the option of displaying other fundsas major funds. Other nonmajor funds, as well as the internal service funds, are combinedin a single column on the fund financial statements.
The City reports the following major governmental funds:
The General Fund is the City's primary operating fund. It accounts for all financialresources of the general government, except those required to be accounted for inanother fund.
The Housing Authority Special Revenue Fund accounts for the providing of housingassistance to low and moderate-income families in the Anaheim area. Financing isprovided primarily from Federal Section 8, US. Department of Housing and UrbanDevelopment (HUD) receipts.
The City reports the following major enterprise funds:
The Electric Utility Fund accounts for the operation of the City's electric utility, a self-supporting activity, which renders services on a user charge basis to residents andbusinesses located in Anaheim.
The Water Utility Fund accounts for the operation of the City's water utility, a self-supporting activity, which renders services on a user charge basis to residents andbusinesses located in Anaheim.
38

CITY OF ANAHEIM
The Sanitation Fund accounts for the operation of the City's solid waste and sanitationprogram, a self-supporting activity, which provides for the collection and disposal ofsolid waste, street sweeping, and sanitary sewer cleaning on a user charge basis toresidents and businesses located in Anaheim.
The Golf Courses Fund accounts for the operation of the Anaheim Municipal ("DadMiller") Golf Course and the Anaheim Hills Golf Course, a self-supporting activity thatrenders services on a user charge basis.
The Convention, Sports and Entertainment Venues Fund accounts for the operations ofthe Anaheim Convention Center, Stadium (Angel Stadium of Anaheim, home to theAnaheim Angels of the American Baseball League), and The Grove of Anaheim. Seenote 11 for further discussions of the Stadium and The Grove of Anaheim.
The internal service funds, which provide services to the other funds of the City, arepresented in a single column in the proprietary funds fnmancial statements. Because theprincipal users of the internal service funds are the City's governmental activities, theassets and liabilities of the internal service funds are consolidated into the governmentalactivities column of the government-wide Statement of Net Assets. The costs of theinternal service fund services are spread to the appropriate function or program on thegovernment-wide Statement of Activities and the revenues and expenses within theinternal service funds are eliminated from the government-wide financial statements toavoid any doubling effect of these revenues and expenses.
Mesurcmt focsw and bask of accounting
The governmental fund financial statements are prepared on a current financial resourcesmeasurement focus and modified accrual basis of accounting. To conform to the modifiedaccrual basis of accounting, certain modifications must be made to the accrual method.These modifications are outlined below:
A. Revenue is recorded when it becomes both measurable and available (receivedwithin 60 days after year-end). Revenue considered susceptible to accrual includes:property taxes, sales and use taxes, transient occupancy taxes, licenses, fees andpermits, intergovernmental revenues (including motor vehicle license fees),charges for services, fines, forfeits and penalties, and interest
B. Expenditures are recorded when the related fund liability is incurred. Principal andinterest on general long-term debt are recorded as fund liabilities when due orwhen amounts have been accumulated in the debt service fund for payments to bemade early in the following year.
C. Disbursements for the purchase of capital assets providing future benefits areconsidered expenditures. Bond proceeds are reported as an other financing source.
With this measurement focus, operating statements present increases and decreases in netcurrent assets and unreserved fund balance as a measure of available spendable resources.
This is the traditional basis of accounting for governmental funds and also is the mannerin which these funds are normally budgeted. This presentation is deemed most appropriateto: 1) demonstrate legal and covenant compliance, 2) demonstrate the sources and uses ofliquid resources, and 3) demonstrate how the City's actual revenues and expendituresconform to the annual budget. Since the governmental funds financial statements arepresented on a different basis than the governmental activities column of the government-wide financial statements, a reconciliation is provided immediately following each fundstatement. These reconciliations briefly explain the adjustments necessary to transform thefund financial statements into the governmental activities column of the government-widefinancial statements.
The proprietary funds financial statements are prepared on the same basis (economicresources measurement focus and accrual basis of accounting) as the government-widefinancial statements. Therefore, most lines for the total enterprise funds on the proprietaryfunds financial statements will directly reconcile to the business-type activities column onthe government-wide financial statements. Because the enterprise funds are combined intoa single business-type activities column on the government-wide financial statements,certain interfimd activities between these funds are eliminated in the consolidation for thegovernment-wide financial statements, but are included in the fund columns in theproprietary funds financial statements. The net costs of the internal service funds are alsopartially allocated to the business-type activities column on the government-wide financialstatements. A reconciliation of the total enterprise funds on the fund financial statementsto the business-type activities column on the government-wide financial statements isprovided on the face of the fund financial statements.
Enterprise funds account for operations where the intent of the City is that the costs ofproviding goods or services to the general public on a continuing basis be financed orrecovered primarily through user charges and space rentals. Under GASB Statement No.34, enterprise funds are also required for any activity whose principal revenue sourcesmeet any of the following criteria: 1) any activity that has issued debt backed solely bythe fees and charges of the activity, 2) if the cost of providing services for an activity,including capital costs such as depreciation or debt service, must legally be recoveredthrough fees and charges, or it is the policy of the City to establish activity fees or chargesto recover the cost of providing services, including capital costs.
On the proprietary funds financial statements, operating revenues are those that flowdirectly from the operations of the activity, Le. charges to customers or users who purchaseor use the goods or services of that activity. Operating expenses are those that are incurredto provide those goods or services. Non-operating revenues and expenses are items suchas investment income and interest expense that are not a result of the direct operations ofthe activity.
39

CITY OF ANAHEIM
Under GASB Statement No. 20, Accounting and Financial Reporting for ProprietaryFunds and Other Governmental Eatities That Use Propnetary Fund Accountmn the Cityhas elected for enterprise funds not to apply Financial Accounting Standards Board(FASB) statements issued after November 30, 1989.
The Utility funds follow the uniform system of accounts prescribed by the Federal EnergyRegulatory Commission (Electric Utility) and the California Public Utilities Commission(Water Utility). The Utilities are not subject to the regulations of these commissions.
Fiduciary funds account for assets held by the City in a trustee or agency capacity onbehalf of others and, therefore, are not available to support City programs. The reportingfocus is upon net assets and changes in net assets and employs accounting principlessimilar to proprietary funds. Fiduciary funds are not included in the government-widefinancial statements as they are not an asset of the City available to support City programs.The City currently maintains an agency fund to account for the monies collected and paidon behalf of the Mello-Roos Districts located in the City.
Cash and Ineshoents
The City pools available cash from all funds for the purpose of increasing income throughinvestment activities. Investments in U.S. government and agency securities and corporatenotes are carried at fair value based on quoted market prices. Participating guaranteedinvestment contracts and flexible repurchase agreements are carried at fair value based onnet realizable value. Money market mutual funds am carried at fair value based on thefund's share price. The City's investment in the State of California Local AgencyInvestment Fund (LAIF) is carried at fair value based on the value of each participatingdollar as provided by LAIF LAW is authorized by California Government Code Section16429 under the oversight of the Treasurer of the State of California. Commercial paper,non-participating guaranteed investment contracts and negotiable certificates of depositare carried at amortized cost (which approximates fair value). Interest income, whichincludes changes in fair value, on investments is allocated to all funds on the basis of dailycash and investment balances. See note 2 for further discussion.
For purposes of the basic financial statements, the City considers cash equivalents to behighly liquid short-term investments that are readily convertible to known amounts of cashand mature within three months of the date they are acquired. Cash and cash equivalentsare included in the City's cash and investments pool and in accounts held by fiscal agents.
Notes reeivable
In the government-wide financial statements, notes receivable includes accrued interestreceivable of $9,324 ranging from 3% to 10% interest rate per annum, net of allowances of$13,477 for uncollectible accounts at June 30, 2005. Allowances for uncollectible accounts%tre estimated based on certain assumptions; therefore, actual results could differ from theestimates.
In the governmental funds fmancial statements, due to the extended period of time overwhich notes receivable ame to be collected and the contingent nature of certain sources ofrepayment, the City has generally not recorded the related accrued interest and has recordeddeferred revenue equal to the outstanding principal balance of the notes receivable.
Inventories, as determined by annual physical counts, are stated at average cost.Inventories in the General Fund are recorded as expenditures when used and are reportedunder the consumption method of accounting.
Land held for reasl
The Redevelopment Agency has acquired parcels of land as part of their primary purposeto develop or redevelop blighted areas. The Redevelopment Agency records these parcelsas land held for resale in their financial records. The properties held for resale are recordedat the lower of cost or estimated net realizable value. At June 30, 2005, land held for resalewith a cost of $57,212 was recorded net of the allowance for decline in value of $29,346and totaled $27,866, with this amount offset by a reservation of fund balance in thegovernmental funds financial statements.
Rtatricted assets
Certain proceeds of the City's bonds, as well as certain resources set aside for theirrepayment, are classified as restricted on the Statement of Net Assets, Balance Sheet, orStatement of Fund Net Assets, because they are maintained in separate bank accounts andtheir use is limited by applicable debt covenants. Additionally, resources set aside by theElectric Utility for future decommissioning of its ownership share of the units at SanOnofre Nuclear Generating Station, Units 2 and 3 (SONGS) are classified as restrictedon both the government-wide Statement of Net Assets and proprietary funds Statement ofFund Net Assets.
Capital assets
Under GASB Statement No. 34, all capital assets, whether owned by governmentalactivities or business-type activities are recorded and depreciated in the government-widefinancial statements. No long-term capital assets or depreciation are shown in thegovernmental funds financial statements.
Capital assets, including public domain infrastructure (e.g., roads, bridges, sidewalks andother assets that are immovable and of value only to the City) are defimed as assets withan initial, individual cost of more than $5 ($50 for infrastructure) and an estimated usefullife greater than one year. Capital assets are recorded at cost or estimated historical cost ifpurchased or constructed. Donated capital assets are recorded at the estimated fair marketvalue at the date of donation. 40

CrrY OF ANAHBEIM
The costs of normal maintenance and repairs that do not add to the value of the capitalasset or materially extend capital assets lives are not capitalized Major improvements arecapitalized and depreciated over the remaining useful lives of the related capital assets.
Major outlays for capital assets and improvements are capitalized as the projects areconstructed. Interest incurred during the construction phase of projects is reflected in thecapitalized value of the asset constructed for proprietary funds. For the year ended June30, 2005, business-type activities capitalized net interest costs of $1,702 in thegovernment-wide and fund financial statements. Total interest expense incurred by thebusiness-type activities (and the enterprise funds on the proprietary funds statements)before capitalization was $36,651.
Capital assets are depreciated using the straight-line method over the following estimateduseful lives:
Buildings, structures and improvementsUtility plantMachinery and equipmentInfrastructure
5 to 85 years5 to 75 years2 to 40 years
25 to 75 years
Capital assets transferred between funds are transferred at their net book value (cost lessaccumulated depreciation), as of the date of the transfer.
Debt cots
Debt issuance costs in the amount of $7,691 are included in noncurrent assets at June 30,2005. Unamortized discounts includes unamortized loss on refundings of S 1,312 and hasbeen reduced by unamortized premiums net of unamortized discounts of $8,071, and arereflected in net long-term obligations. Both debt issuance costs and discounts areamortized over the lives of the related bond issues using the effective interest method.
Accwtion.
Accretion is an adjustment of the difference between the price of a bond or certificate ofparticipation (COP) issued at an original discount and the par value of the bond or COP.For the governmental activities debt, the accreted value is recognized as it accrues by fiscalyear. For the business-type activities debt, the accreted value at maturity is recognized atthe time of issuance with an offset to bond or COP discount.
Regulatory codits
The Electric Utility's rates, rules and regulations provide for a power cost adjustment billingfactor to reflect variations in the cost of power to the Electric Utility. This billing factorprovides increased flexibility by allowing the adjustment of revenues from the sale of
electricity for differences between the Electric Utility's actual cost of power and the amountbilled to customers through standard rates. The over or under collections are recorded asregulatory credits until they are refunded to or recovered from utility customers. The ElectricUtility obtained Council approval to change the rate from $0.00 to approximately $0.0049for all retail kilowatt (kWh) sales of electricity except residential lifeline usage beginningApril 1, 2001. At June 30, 2005, the liability recorded for regulatory credits totaled $36,497for the Electric Utility.
The Water Utility's rates, rules and regulations provide for a water rate stabilization accountto reflect variations in the cost of water to the Water Utility. This stabilization accountprovides increased flexibility by allowing the adjustment of revenues from the sale of waterfor differences between the Water Utility's actual cost of water and the amount billed tocustomers through standard rates. The account is funded through expense reimbursementssuch as water supply cost refiuds received from the Metropolitan Water District and OrangeCounty Water District and other miscellaneous credits and revenue. At June 30, 2005, theliability recorded for regulatory credits totaled $162 for the Water Utility.
Deferrd liabilities
Deferred liabilities arise in governmental funds when revenue does not meet both the"measurable" and "available" criteria for recognition in the current period. Deferredliabilities also arise, in both governmental and proprietary funds, when resources are receivedby the government before it has a legal claim to thean, as when grant monies are received priorto incurring qualifying expenditures (unearned). In subsequent periods, when both revenuerecognition criteria are met, or when the government has a legal claim to the resources,revenue is recognized Deferred liabilities in the governmental funds amounted to $69,599at June 30, 2005. Of this amount, $48,250 represents notes receivable that did not meet theavailable criterion, $13,667 represents various other revenues that did not meet the availablecriterion, and $7,682 represents resources for which the City did not have legal claim.
Compensate absomce
Compensated absences, vacation and sick pay, for all City employees are generally paidby the General Benefits and Insurance Fund, an internal service fund. The GeneralBenefits and Insurance Fund is reimbursed through payroll charges to all other fundsbased on estimates of benefits to be earned and used during the fiscal year. It is the policyof the City to pay all accumulated vacation pay when an employee retires or terminates.Accumulated sick pay in excess of 175 hours per employee is paid to employees at theirthen current rate of pay in January each year or upon termination from the City. Employeesare paid for all accumulated sick pay when they retire from the City. Vested vacation andsick pay benefits are accrued when incurred in the General Benefits and Insurance Fundand at June 30, 2005, totaled $16,222. Also included in the statement ofNet Assets at June30,2005, is compensatory time liability of $362. The total compensated absences liabilityof $16,584 is included in wages payable in the Statement of Net Assets at June 30, 2005.
41

CITY OF ANAHEIM
Changes in the City's compensated absences liability in fiscal year 2005 were as follows:
Compensated absences liability at beginning of yearCurrent year compensated absences benefits earnedCurrent year compensated absences usedCompensated absences liability at end of year
$ 15,25417,940
(16,610$ 16,584
Nuclea fhio and decom1ssoningr co-Ats
The Electric Utility amortizes the cost of nuclear fuel to expense using the "as burned"method. In accordance with the Nuclear Waste Disposal Act of 1982, the Electric Utilityis chaiged a fee for the disposal of nuclear fuel at the rate of one mill per kWh on theElectric Utility's share of electricity generated by SONGS. The Electric Utility pays the feequarterly to Southern California Edison Company (SCE), which is acting as the agent forSONGS participants. Federal regulations also require the participants to provide for thefuture costs of decommissioning SONGS. Decommissioning costs are charged tooperating expenses and are provided for over the remaining life of the plant. At June 30,2005, the provision for decommissioning costs totaled $93,782.
Pension plan
Full-time City employees are members of the State of California Public Employees'Retirement System (System). The City's policy is to fund all pension costs accrued; suchcosts to be funded are determined annually as of July I by the System's actuary. See note9 for further discussion.
Fund balaams
In the fund financial statements, governmental funds report reservations of fund balancesfor amounts that are not available for appropriation or are legally restricted by outsideparties for use for a specific purpose. Designations of fund balance represent tentativemanagement plans that are subject to change.
The accumulated deficit fund balances at June 30, 2005, for the Workforce Development,Community Development Block Grant and Grants funds included in nonmajorgovernmental funds in the amount of $183, $52, and $229, respectively, will be eliminatedin future years by the receipt of reimbursements for grant expenditures.
Budgetary principl
The City is required by its charter to adopt an annual budget on or before June 30 for theensuing fiscal year. The General, special revenue, debt service, and capital projectsgovernmental fund types and proprietary fund types have legally adopted budgets
approved by City Council. The level of budgetary control (that is, the level at whichexpenditures cannot legally exceed the appropriated amount) is established at thedepartment level. From the effective date of the budget, the amounts stated therein asproposed expenditures/expenses become appropriations to the various City departments.Throughout the fiscal year the budget was amended to add supplemental appropriations.All amendments to the budget which change the total appropriation amount for anydepartment require City Council approval and all increases in appropriations must beaccompanied by an increase in revenue sources of a like amount to maintain a balancedbudget. The City Manager has the authority to change individual budget line items withina department as long as the total department's appropriation amount is not changed.
The City utilizes an encumbrance system as a management control technique to assist incontrolling expenditures. All appropriations lapse at the end of the fiscal year, except forcapital projects (other than the Redevelopment Agency Capital Projects Fund), which arecarried forward until such time as the project is completed or terminated and forencumbered balances that are re-appropriated in the next year.
GASB Statement No. 34 requires that budgetary comparison statements for the GeneralFund and major special revenue funds be presented in the basic financial statements.These statements must display original budget, amended budget and actual results (on abudgetary basis).
Budgeted revenue amounts represent the original budget modified by City Council-authorized adjustments during the year, which %ere contingent upon new or additionalrevenue sources. Budgeted expenditure amounts represent original appropriationsadjusted for supplemental appropriations during the year. Budgets are prepared inconformity with GAAP using the modified accrual basis of accounting, with the exceptionof the capital lease in the General Fund and land held for resale in the RedevelopmentAgency funds, which are budgeted on a cash basis.
Property taxes
Property taxes attach as an enforceable lien on property as of January 1. Taxes are leviedon July 1 and are payable in two installments due on November 1 and February 1 andbecome delinquent after December 10 and April 10. The County of Orange, California(County) bills and collects the property taxes and remits them to the City in installmentsduring the year. City property tax revenues are recognized when levied to the extent thatthey result in current receivables collectable within 60 days after year-end.
The County is permitted by State law (Proposition 13) to levy taxes at 1% of full marketvalue (at time of purchase) and can increase the property tax rate no more than 2% peryear from the full market value at the time of purchase. The City receives a share of thisbasic levy proportionate to what it received in the 1976 and 1978 periods.
42

CITY OF ANAHEIM
Enfitiement shazed triwnues and Pants Deposits and investments is comprised of the following at June 30, 2005:
Entitlements and shared revenues are recorded at the time of receipt or earlier if thesusceptible to accrual criteria are met. Expenditure-driven grants are recognized asrevenue when the qualifying expenditures have been incurre4 all eligibility requirementshave been met, and reimbursement is received within the availability period.
kevane recognition for Eetric Utility, Water Utility and Sauitation d
Revenue is recorded in the period in which services are provided As such, revenue isrecorded as billed to customers on a cyclical basis. Residential and smaller commercialcustomers are billed bimonthly and all other customers monthly. At June 30, 2005 unbilledbut earned service charges recorded in accounts receivable for the Electric Utility, WaterUtility, and Sanitation Funds amounted to S 13,555, $3,197, and $3,075 respectively.
Use of estimat
The preparation of financial statements in conformity with GAAP requires managementto make estimates and assumptions that affect the reported amounts of certain assets andliabilities and disclosures of contingent assets and liabilities at the date of the financialstatements and the reported amounts of revenues and expenditures/expenses during thereporting period. As such, actual results could differ from those estimates.
NOTE 2 - DEPOSITS AND INVESTMENTS:
The City maintains a cash and investment pool, which includes the cash balances of allfunds, and is invested by the City Treasurer to enhance interest earnings. The pooledinterest earned, net of administrative fees, is allocated to each fund based on daily cashbalances.
The City's Investment Policy further limits the permitted investments in Government CodeSections 53600 et al, 16429.1 and 53684 to the following: obligations of the U.S.government, federal agencies, and government sponsored enterprises; medium -termcorporate notes; certificates of deposit; bankers acceptances; commercial paper rated A-Iby Standard and Poor's Corporation (S&P), P-I by Moody's Investors Service (Moody's)or F-I by Fitch Ratings (Fitch); LAIF; repurchase agreements; reverse repurchaseagreements; and money market mutual funds.
The City has been actively managing short-term treasuries to enhance revenues. Thisprogram has involved buying and selling of up to 10% of the operating portfolio in short-term treasuries, which are short-term investments of the highest quality. These securitiesmeet the City's investment parameters and can be held to maturity.
Governmental activities;General FundHousing AuthortyNonmajor governmental fundsInternal service funds
Total governmental activitiesBusiness-type activities:
Electric UtilityWater UtilitySolid Waste and SanitationGolf CoursesConvention, Sports and
Entertainment VenuesTotal business-type activities
Government-wide totalsFiduciary fund
Total cash andinvestments
Cash andCash
Equivalents
$ 4,722,181
14,85620,92142,930
Cash andCash
Investmnents EquivalentsRestrcted
Investmnents Total
$ 28,5989,786
84,841
243,633
$ 33,57011,967
$32,776 S 17,121 149,59417 473 141,819
3L29 17,594 336950
6,824 271,369 412,9501,000 5,826 38,980
27,240337
19,742 115,0154,711 27,4433,993 23,247
49 288
4_669 26,48 795 15,773 47,72133,164 192477 8,619 292, 527,276,094 436,110 _IL 310,562 864,17
3,554 3,554
$76,094 4 .44966 $310,52 867.732
Deposits at June 30, 2005, consist of bank balances of $7,878 that mere maintained invarious federally regulated financial institutions. The bank balances, with no carryingvalue at June 30, 2005, represent deposits in transit, outstanding checks, and otherreconciling items. Deposits with a bank balance of $395 are insured by the FederalDepository Insurance Corporation. For deposits with a bank balance of $7,483, Californiastate statutes require federally regulated financial institutions to secure a city's deposits bypledging collateral consisting of either government securities with a value of 1100/. of acity's total deposits or by pledging frst trust deed mortgage notes having a value of 150%of a city's total deposits. The collateral is required by regulation to be held by thecounterparty's agent in the name of the City.
The City Treasurer prepares an Investment Policy Statement annually, which is presentedto the Investment Advisory Commission for review and the City Council for approval. Theapproved Investment Policy is submitted to the California Debt and Investment AdvisoryCommittee in accordance with State Law
The policy provides the basis for the management of a prudent, conservative investmentprogram. Public funds are invested for the maximum security of principal, to meet dailycash flow needs, while providing a return. All investments are made in accordance withthe California Government Code and, in general, the Treasurer's policy is more restrictive
43

CITY OF ANAHEIM
than State law. The City did not have any violations of its policy during the current fiscalyear. Section 53607 of the California Government Code allows the Council to delegate itsinvestment authority to the Treasurer and requires that the Treasurer provide a monthlyreport to Council of investment transactions. The annual delegation of authority isincorporated in the investment policy. The Treasurer's Report meets the requirements formonthly investment reporting.
Investments Authorized by the California Government Code and the City's Investment
The table below identifies the investment types that are authorized for the City by itsInvestment Policy which is more restrictive than State Code. The table also identifiescertain provisions of the City's Investment Policy that address interest rate risk, credit risk,and concentration of credit risk. This table does not address investments of debt proceedsheld by bond trustees that are governed by the provisions of debt agreements of the City,rather than the general provisions of the California Government Code or the City'sInvestment Policy.
authorized for investments held by bond trustees. The table also identifies certainprovisions of these debt agreements that address interest rate risk, credit risk, andconcentration of credit risk.
Authorized Investment Tyne
US. agency securitiesGuaranteed investment contractsCollateralized Investment contractsFlexible repurchase agreementsMutual fundsLAIF
MaximumMaturity
NoneNoneNoneNoneNoneNone
MaximumPercentage
of Portfolio*NoneNoneNoneNoneNoneNone
MaximumInvestment
in One IssuerNoneNoneNoneNoneNoneNone
Authorized Investment I=p
US. Treasury obligationsUS. agency securitiesBankers acceptancesCommercial paperNegotiable certificates of depositRepurchase agreementsReverse repurchase agreementsMedium term corporate notesMoney market mutual fundsLAIFTine certificates of deposit (TCD)
MaximumMatuty5 years5 years
18o days270 days3 years90 days92 days3 yearsN/AN/A
5 years
MaximnumPercentage
of Portfolio*None75%25%25%15%75%20%15%20%
80 Million30%
MaximumInvestment
in One IssuerNone20%5%5%5%
NoneNone5%10%
None5%
At June 30, 2005 the investments controlled by fiscal agents exceeded five percentconcentration in the following Federal agency and guaranteed investment securities:Federal Home Loan Bank $75,896 (25%) and Transamerica Life $124,294 (409/6). Allguaranteed investment securities have downgrade language that requires collateral shouldcredit ratings drop below certain levels.
Custodial Credit Risk
Custodial credit risk for investments is the risk that the City will not be able to recover thevalue of investment securities that are in the possession of an outside party. All securitiesowned by the City with the exception of LAIF and money market mutual funds aredeposited in trust for safekeeping with a custodial bank different from the City's primarybank. Securities are not held in broker accounts. Funds held by LAIF and money marketmutual funds are held in the City's name.
Custodial credit risk for investments held by bond trustee is the risk that the City will notbe able to recover the value of investment securities that are in the possession of an outsideparty. All securities held by bond trustee are in the name of the bond issue in trust forsafekeeping with the bond trustee which is different from the City's primary bank.
InerstRate Risk
Interest rate risk is the risk that changes in interest rates will adversely affect the fair valueof an investment The Treasurer mitigates this risk by investing in longer-term securitiesonly with funds that are not needed for current cash flow purposes and holding thesesecurities to maturity. The Treasurer uses the segmented time distribution method toidentify and manage interest rate risk. In accordance with its Investment Policy, theTreasurer monitors the segmented time distribution of its investment portfolio and analysisof cash flow demand.
*Excluding amounts held by bond trustees that are not subject to California GovernmentCode restrictions
At June 30, 2005 the City exceeded five percent concentration in the following Federalagency securities: Federal Farm Credit Bank $88,438 (16%), Federal Home Loan Bank$95,148 (17%) and Federal Home Loan Mortgage Corporation $49,077 (9%).
Investments Authorized bX Debt Agreements
Investment of debt proceeds held by bond trustees are governed by provisions of the debtagreements, rather than the general provisions of the California Government Code or theCity's Investment Policy. The table below identifies the investment types that are
44

ciTyOF ANAEIUM
Interest rate risk for investments held by bond trustees is offset by the fact that the longterm investments are for the reserve funds with the semi-annual interest payments used topay a portion of the debt service. These are long term securities which are not adverselyaffected by interest rate changes. Investment contracts for construction funds are usuallylimited to three years or less. Money market funds are used to accumulate monthly orsemi-annual debt service payments.
Information about the sensitivity of the fair values of the City's investments (includinginvestments held by bond trustees) to market interest rate fluctuations is provided by thefollowing table. The distribution of the City's investments by maturity at June 30,2005, isas follows:
NOTE 3 - ACCOUNTS RECEIVABLE DUB FROM OTHER GOVERNMENTS,AND CERTAIN INTERFUND TRANSACTIONS, RECEIVABLE AND PAYABLEBALANCES:
Accounts receivable for the City's governmental and business-type activities including theapplicable allowance for uncollectible accounts at June 30, 2005, are as follows:
Less:Accounts Allowance for
Receivable Uncollectibles
FairCredit ValueRating 6/30/2005
12Months
or
13to24
Months
25to36
Months
37to60
Months
MoreThan60
MonfhsbIvenatsTrmsurerý Pooled Investments:US. Treasury notesFederal agency securitiesMedumat notesCommercial paperMutua fiaxlsLAIFTotal inestments controlled
by CityTreasurerl nt ts Contmlled by Fscal AgentFederal agency securitiesGuaranteed investment agreementCollaterized investment contractsFlexible repurchase agreementsMutual fimdsLAIFTotal investments controlled
by fiscal agentsTotal Investments
Governmental activities:General FundNonmajor governmental fundsInternal service funds
Total governmental activitiesBusiness-type activities:
Electric UtilityWater UtilitySolid Waste and SanitationGolf CoursesConvention, Sports and Entertainment Venues
Total business-type activitiesTotal accounts receivable
S 9,048115539
9,702
31,7815,9226,987
1061,061
45,857$55,559
$(564)(4)
(568)
(55)(4)
(127)
_(L86)S(75J4
Total
$ 8,484III539
9,134
31,7265,9186,860
1061,061
45,671$54,805
ExemptAAA
Aa2-AA-PI-AI+AAA
Unated
AAAUrratedUratedUrmadAAA
Unrated
$204,403242,952
14,98544,87121,76525,682
S 15,316 $ 93,519 $ 80,781 514,78799,522 85,801 57,62914,98544,87121,76525,682
554,658 222,141 179,320 138,410 14,787 Due from other governments for the City's governmental activities at June 30, 2005, areas follows:
91,843135,07119,07428,45029,2799,357
38,376 47,525124,294
2,30629,279
9,357
S 5,94210,77719,074
2,396 23,748
Taxes Grants Other TotalGovernmental activities:
General FundHousing AuthorityNonmajor governmental funds
Total due fromother governments
$13,767
999
$14,766
$ 94322
10,525
$10,941
$605 $14,466322
11,524
313,074 79,318 171,819 %2,3% 59,541$867,732 $301,459 T35-1,139 $138,410 $17,183 $59,54
$605 $26,312
Revenues are reported net of uncollectible amounts. Total uncollectible amounts related torevenues of the current period are as follows:
General FundElectric UtilityWater UtilitySanitationOtheia
Total
$15329238
1233
$609
Net internal balances between governmental activities and business-type activities of $675are included in the government-wide financial statements at June 30, 2005.
45

CrTY OF ANAHEIM
The following interfund receivables and payables are includstatements at June 30, 2005:
,d in the fund financial Other Capital Improvements Capital Projects Fund from the nonmajor governmentalfunds (Redevelopment Agency Capital Projects Fund). The Redevelopment Agencyentered into a Cooperation Agreement with the City on April 1, 2003 whereby the City
lnterfind Interfund will assist the Redevelopment Agency with the development of Westgate utilizingReceivable Payable $10,000 of funds from the HUD Section 108 loan program. The Redevelopment
$10,272 S 104 Agency is obligated to pay the City for the repayment of the HUD 108 loan fromproperty tax increment and certain project revenues generated by Westgate. As of June
12,145 27012 30, 2005, the Redevelopment Agency has utilized $9,423 of HUD 108 funds to acquire22,417 27,116 certain properties.
Governmental funds:General FundHousing AuthorityNonmajor governmental funds
Total governmental fundsEnterprise funds:
Electric UtilityGolf CouresConvention, Sports and Entertainment Venues
Total enterprise fundsInternal service funds
Total
980
11,679104
$34,200
6,104980
7,084
$34,200
There are interfund balances at June 30, 2005 that are generally short-term loans to covertemporary cash deficits in various funds. The following interfund balances are expectedto be repaid in more than one year.
Genera Fund
Of the total intcrfund receivable in the General Fund, $3,313 is due from nonmajorgovernmental funds (Redevelopment Agency Capital Projects Fund). On September 3,2002, the City loaned the Redevelopment Agency $3,388 in order to acquire twoproperties for redevelopment The properties are located at 1234 and 1300 SouthAnaheim Boulevard. The loan is to be amortized over 30 years and is repayable overfive years with the first annual payment due on August 1, 2003, and the final lump sumpayment due on August 1, 2007. The loan bears interest at the City's average annualinvestment yield.
Of the total interfund receivable in the General Fund, $855 is due from nonmajorgovernmental funds (Redevelopment Agency Capital Projects Fund). The balance isexpected to be repaid from future proceeds of the Anaheim Westgate Center (Westgate).
Of the total interfund receivable in the General Fund, $6,104 is due from the GolfCourses Fund, On September 24, 2002, the City Council approved a loan up to $6,400from the General Fund to the Golf Courses Fund for construction of the Anaheim HillsGolf Clubhouse. The loan is payable in annual amounts of not less than $548 beginningin July 2004 until July 2023 and bears interest at the City's investment yield as of June30th of each year.
Nonmior Governmental Funds
Of the interfund receivable in the nonmajor governmental funds, $9,423 is due to the
Of the interfund receivable in the nonmajor governmental funds, $2,394 is due to theRedevelopment Agency Capital Projects Fund from nonmajor governmental funds(Other Capital Improvements Capital Projects Fund). On March 15, 1999, theRedevelopment Agency entered into a Cooperation Agreement with the City where theRedevelopment Agency and the City will share in the cost of the west Lincoln AvenueStreet improvement project. The Agreement also provides that the RedevelopmentAgency will receive transportation fee credits in the amount of its contribution to theproject
Electric Utility Fund
The interfund receivable of $980 in the Electric Utility Fund is due from the Convention,Sports and Entertainment Venues Enterprise Fund for the installation of energy efficientHVAC equipment, and building envelope improvements. The loan is payable inmonthly installments of $23 beginning January 2004 until December 2008.
Convention, Sports and Entertainment Venues Fund
The interfund receivable of $10,699 in the Convention, Sports and EntertainmentVenues Fund is due from nonmajor governmental funds (Redevelopment AgencyCapital Projects Fund). The City entered into a Cooperation Agreement with theRedevelopment Agency on May 14, 1996, for the renovation of the Stadium. TheRedevelopment Agency ageed to reimburse the City for $10,000 of renovation costsplus 5% simple interest on the unpaid balance. The Agencys reimbursement obligationis payable from the Stadium Project Area (SPA) property tax increment revenue. Anyoutstanding balance ceases to be an obligation of the Redevelopment Agency on August9,2039, the expiration of the SPA. It is expected that the balance will be repaid prior tothe expiration of the SPA.
The net transfers of $12,400 from the business-type activities to the governmentalactivities on the government-wide Statement of Activities are primarily comprised ofoperational subsidies to the General Fund that are offset by debt service subsidies to theConvention, Sports and Entertainment Venues Fund and the transfer of capital assets fromthe business-type activities to governmental activities in the amount of $1,511.
46

CITY OF ANAHEIM
The following interfund transfers are reflected in the fund financial statements at June 30,2005:
NOTE 5 - CAPITAL ASSETS:
Capital asset activities for the year ended June 30, 2005 are as follows:
Beginning EndingBalance Additions Deletions BalanceGovernmental funds:
General FundHousing AuthorityOther governmental funds
Total governmental fundsEnterprise funds:
Electric UtilityWater UtilitySolid Waste and SanitationGolf CoursesConvention, Sports and Entertainment Venues
Total enterprise fundsTotal
Transfers In Transfers Out
S 25,974 $ 48,6681,000 291
72192 39,3199,166 88,277
3,248 15,6117,4033,021
142 1,700
14,855 27,735$114,021 i116,012
Governmental activities:Nondepreciable assets:
LandConstruction in progress
TotalDepreciable assets:
Buildings, structuresand improvements
Machinery and equipmentInfirastructure
TotalTotal assets
S 490,91719,597
510,514
219,17666,726
705,956991,858
1,502,372
S 5,10932,46737,576
1,99214,9907,209
24,19161,767
(5,523)(6,172)
(15,896
(27,591
$ 34,176
Less accumulated depreciation forThe net difference of transfers in the amount of $1,991 is due to a transfer of capital assetsfrom the Electric Utility and Water Utility funds to governmental funds.
The interfund transfers generally are made for the purpose of debt service payments madefrom a debt service fund but funded from an operating fund or subsidy transfers. Therewere no significant transfers during the fiscal year that were either non-routine in natureor inconsistent with the activities of the fund making the transfer.
NOTE 4 - BOND PAYMENT RECEIVABLE:
On August 3, 1995, the Los Angeles Rams Football Company, currently the St. LouisRams (Rams), exercised its right to terminate its lease under the Fourth Amendment to theExhibition Agreement between the Rams and the City (Rams Agreement). Under theRams Agreement, the Rams became obligated to repay the City for the debt service on the1979 Anaheim (California) Stadium Inc. Lease Revenue Bonds in the principal amount of$28,110, which obligation is supported by an irrevocable standby letter of credit withDresdner Bank AG and will be repaid by August 15, 2015. The 1979 Anaheim (California)Stadium Inc. Lease Revenue Bonds were subsequently refunded, and are no longeroutstanding, by a portion of the Convention, Sports and Entertainment Venues Fund 1993Refunding Projects Certificates of Participation. At June 30, 2005, there remainedprincipal outstanding of $19,542 on that portion of the Convention, Sports andEntertainment Venues Fund 1993 Refunding Projects Certificates of Participation. Duringfiscal year 2005, the Rams reimbursed the City $2,338 (representing $1,175 for principaland $1,163 for intest) for the current portion of their debt service obligation. The Cityaccounted for the termination of the lease by recording a bond payment receivable fromthe Rams and a contribution to the Convention, Sports and Entertainment VenuesEnterprise Fund in the amount of the debt obligation assumed by the Rams under theRams Agreement
Buildings, strtreand improvements
Machinery and equipmentInfiasuctue
Total accumulateddepreciation
Total governmental activitiescapital assets, net
Business-type activities:Nondepreciable assets:
LandConstruction in progressNuclear fuel at
amortized costTotal
Depreciable assets:Buildings, structures
and improvementsUtility plantMachinery and equipment
TotalTotal assets
(74,051)(41,397)
(236,613)
(352,061)
$1,150,311
$ (1,020)(5,959(6,979)
(166)(2,648)
(2,814)(9,793)
1592,451
2,610
$L(7,183)
$(75,582)
(1.499(77,081)
(327)(2,787)(4,799)(7,913)
(85,994)
2141,9613,749
5,924
$(79,070)
$ 495,00646,105
541,111
221,00279,068
713,1651,013,2351,554,346
(79,415)(45,118)
(252,509)
(377,042)
$1,177,304
S 36,28127,951
2,19766,429
477,6341,152,329
30,4431,660,4061,726,835
(127,116)(410,975)
(16,350)
(554,441,
$1,172,394
$ 31,538 $ 4,74345,950 57,583
2,730 96680,218 63,292
476,8041,083,972
26,4751,587,2511.667,469
Less accumulated dereciatian forBuildings, structures
and improvements (116,443)Utility plant (376,633)Machinery and equipment (17,643)
Total accumulateddepreciation (510,719
Total business-type activitiescapital assets, net $1,156,750
1,15771,144
8,76781,068
144,360
(10,887)(36,303)(2,456)
(4966
$ 95,714
47

CITY OF ANAHEIM
Depreciation expense was charged to fumctions/programs of the City as follows:
Governmental activities:General governmentPoliceFireCommunity DevelopmentPlanningPublic WorksCommunity ServicesConvention, Sports and EntertainmentCapital assets held by the City's internal service funds are charged
to the various functions based on their usage of the assetsTotal depreciation expense - governmental activities
Business-type activities:Electr UtilityWater UtilitySolid Waste and SanitationGolf CoursesConvention, Sports and Entertainment Venues
Total depreciation expense - business-type activities
RodcwlopmentAgawcy
At June 30, 2005, the Redevelopment Agency earned revenues as lessor from certainparking structure property and retail spaces, carried at cost of $7,861, less accumulateddepreciation of $5,848, under operating leases. The following is a schedule of minimumfuture rentals on noncancelable operating leases at June 30, 2005:
$ 2721,500
3011,113
15416,302
1,5982,563
3,788U27,591
29,7646,539
388579
12,376$49,646
Fiscal Year Ending 6/30
20062007200820092010
201 1-20152016-20202021-20252026-20302031-2034
Total minimum future rentals
$ 332342346338304
1,3091,3381,2651,173
938$7,685
NOTE 6 - GENERAL BENEFITS AND INSURANCE FUND:
Capital leases
Included in the capital assets amounts listed above are the following capitalized leasedassets:
Machinery and equipmentLess acctunulated amortizationCapitalized leased assets, net
$3.217__(711)$2,506
operating loame
Hawing Aithority
At June 30, 2005, the Housing Authority earned revenues as the lessor of land, carried atcost of $25,486 in the government-wide financial statements, under three operatingground leases. These leases to developers are noncancelable. Two of the leases are for aterm of 55 years, expiring in 2055 and 2057. The term of the third lease is 57 yearsexpiring in 2060. The total base rent amounts to be collected over the terms of the leasesare $12,400, $8,700 and $7,505, respectively, with simple interest accruing on unpaidportions at a rate of 4.0%, 4.5% and 4.00/% respectively. Minimum lease payments arecalculated annualy, based on residual receipts, as defined in the lease agreements. It isestimated that the full amounts of the leases are collectible. At June 30,2005, the HousingAuthority has recorded notes receivable due from developers related to these transactionsof $7,162 in both the government-wide and fund financial statements.
The General Benefits and Insurance Fund, an internal service fund, is used to account foremployee compensated absences, retirement and health benefits, workers' compensationrelated benefits, self-insurance, commercial insurance purchases, and alternative riskfinancing activities. Revenues of the General Benefits and Insurance Fund are derivedfrom charges to City departments using estimates of benefits earned and cost allocationcharges established at the beginning of the year and from interest income on reserves.
At June 30, 2005, the City was fully funded for self-insured workers' compensation andgeneral liability claims (self-insured retention levels of $1,000 per occurrence, $750 inprevious years, for workers' compensation claims and $1,000 per occurrence for generalliability claims). Above these self-insured retention levels, the City's potential liability iscovered through various commercial insurance and intergovernmental risk poolingprograms. Settled claims have not exceeded insurance coverage in any of the past threeyears, nor does management believe that there are any pending claims that will exceedinsurance coverage.
The unpaid claims liability included in the General Benefits and Insurance Fund is basedon the results of actuarial studies and includes amounts for claims incurred but notreported, allocated loss adjustment expenses, and unallocated loss adjustment expenses.Claims liabilities are calculated using a discount of three percent and consider the effectsof inflation, multi-year loss development trends, and other economic and social factors. Itis the City's practice to obtain full actuarial studies biennially for general liability andworkers' compensation coverages. Premiums are charged by the General Benefits andInsurance Fund using various allocation methods that include actual costs, trends in claimsexperience, exposure base, and number of participants. Revenues of the General Benefitsand Insurance Fund, together with funds to be provided in the future, are expected toprovide adequate resources to meet liabilities as they come due.
48

CITY OF ANAHEIM
Changes in the General Benefits and Insurance Fund's claims liability in fiscal years 2005and 2004 were as follows: Beginning Additions/ Reductions/
Balance Proceeds Payments
DueEnding WithinBalance One Year
Claims liability at beginning of yearCurrent year claims and changes in estimatesClaims paymentsClaims liability at end of year
2005$26,382
9,741(6,203)
$29,920
2004$24,878
7,134(5,630)
$26,382
Current year incurred losses increased primarily due to (i) increased workers'compensation costs coupled with unrealized cost savings from legislation, which mereincluded in prior year actuarial assumptions, and (ii) an increase in self-insured retentionfrom $750 to $1,000 per occurrence for workers' compensation in the current fiscal year.
Above the self-insured retention of $1,000 per occurrence for workers' compensationlosses, the City purchases pooled and commercial excess insurance to $75,000 peroccurrence. Above the self-insured retention of $1,000 per occurrence for liability losses,the City purchases pooled and commercial excess insurance to $43,000 for all Cityoperations, excluding (i) Utilities operations for which the City purchases pooled andcommercial excess insurance to $68,000, and (ii) helicopter operations for which the Citypurchases $50,000 of commercial excess insurance (on a first-dollar basis). This excessliability coverage is procured through the Authority for California Cities Excess Liability(ACCEL), a joint powers insurance authority pooling catastrophic general, automobile,personal injury, and public officials errors and omissions liability losses among twelveCalifornia cities, through both risk-sharing and joint purchase arrangements. In addition,the City continues to maintain some limited excess liability risk sharing exposure directlywith ACCEL. This pooled coverage has exposure (i) from the run-out periods from prioryears in which commercial excess insurance was not obtained, (ii) from losses, which arecovered under ACCEUs Memorandum of Coverage but not covered under the commercialexcess liability policies, and (iii) from an ACCEL retained layer of $2,000 in excess of$1,000. Each ACCEL member's share of pooled losses is based on a risk-sharing formulawhich includes, but is not limited to, exposure and loss experience factors.
In order to provide funds to pay claims, ACCEL collects a deposit from each member. Thedeposits are credited with investment income at the rate earned on ACCEIs investments.At June 30, 2005, ACCEns cash and investments totaled $20,834 of which $4,002 consistsof deposits provided by the City. The City has no specific equity interest in ACCEL.Deposits provided to ACCEL by the City are expensed when paid by the General Benefitsand Insurance Fund.
ACCEL is responsible for deciding the risks it will underwrite, monitoring the handling oflarge claims, and arranging financial programs. ACCEL does not have any debt outstanding.For a copy of separate financial statements for ACCEL, contact the Finance Director of theCity.
NOTE 7 - LONG-TERM LIABILITIES:
The following is a summary of changes in long-term liabilities reported in thegovernment-wide financial statements for the year ended June 30, 2005:
Governmental activities:Bonds Payable:
Geneial obligationCity lease revenueRedevelopment AgencyAccretion (note 1)
TotalCOPs:
city copsMotorized EquipmentUnamortized COP discount
TotalCapital lease
cityDuplicating and PrintingInformation Services
TotalNotes and loans payable:
cityRedevelopment AgencyHousing Authority
TotalSelf-insurance (note 7)Retired medical (note 10)
Governmental activities total
Busirss-type activities:Bonds payable:
Electric UtilityWater UtilityConvention, Sports and
Entertainment VenuesUnamortized bond
premium/discountTotal
COPs:Electric UtilityConvention, Sports and
Entertainment VenuesAccretion (note I)Unamortized COP discount
TotalCapital lease obligation:
Water UtilityNotes and loans payable:
Water UtilityUnamortized note discount
TotalDecommissioning
provision (note I)Business-type activities totalGovernment-wide total
$ 7,060509,022162,10859,348
737,538
34,0482,062(3)
36,107
1,4701773542,001
11,9908,8571,900
22,7472638268 465
893,240
510,225
13M65
23,160
(2,870)543,780
22,125
112,4767,372
(1,6 18)140,355
349
17,212(534)16,678
791,461
$ (435)(2.590)(3,014)
$10147 (1,971)10147 (7,910
(2,721)(213)
(2,933)
(206)(86)
(16)(478)
5,289 (829)1,875 (538)
125
1,441 (7,85740,618 (26,748
(15,380)(i,340)
(70)
____ (15,650)
(495)
(5,792)(1,703)
587_ _ (7,403)
______ (169
(892)56
3.4833,43 (24,058
$4,101 $(50,
$ 6,625506,432159,09467,624739,775
31,3271,849
33,174
1,26491
1681,523
16,45010,1942,02528,669
29,92074,049
90711O
494,845
11,925
23,090
(1.730528,130
21,630
106,6845,669
(1,031)132,952
180
16,320(478)
15,42
93,782770,886
$ 4553,9552,97619735
2,881227
23652
168456
1,529534
2,0638.0947,85730.937
12,6251,870
75
520
5,9621,800
8,282ISOS180
918
918
$54,887
49

CITY OF ANAHEIM
GOVERI LACTWIV1T[ES:
BONDS PAYABLE
At June 30, 2005, bonds payable consisted of the following:
bond insurer to enable the issuer to obtain municipal bond insurance, resulting in thebonds receiving an AAA rating from S&P and an Aaa rating from Moody's. LPMR beganon January 1, 2001, with the first payment made to the trustee on July 7, 2001, for theLPMR generated during the period January through June 2001. Subsequent to that date,LPMR is collected and remitted to the trustee monthly. During the fiscal year ended June30, 2005, $25,447 was remitted to the trustee.
Debt service requirements to maturity for the 1993 General Obligation Refunding Bondsand the 1997 Anaheim Lease Revenue Bonds to be paid by the Municipal ImprovementsDebt Service Fund from future property tax revenues and by the Anaheim ResortImprovements Debt Service Fund from future LPMR, respectively, are as follows:
Date FinalIssued Maturity
Range ofInterest Ratesat Issue Date
Authorizedand
Issued
Out-standing6/30/05
City1993 General ObligationRefunding Bonds 11/01/93
1997 Anaheim LeaseRevenue Bonds 2/01/97
AccretionTotal City bonds
RedeWlopnentAgamcy1992 Project AlphaTax Allocation Bonds 2/01/02
Accretion1997 Project AlphaTax Allocation Bonds,Series A 6/01/97
2000 Project AlphaTax Allocation Bonds,Series A & B 12/01/00
Total Redevelopment Agency bondsTotal governmental activities bonds
10/01/16 4.00/%-7.0%
3/01/37 4.5%/-6.9%
12128/18 4.00/6-6.45%
2/01/18 4.4/-5.33%
2/01/18 4.1%-7.7%
$ 10,055 $ 6,625
510,427 506,43262,584
575,641
134,433 107,7195,040
27,905 21,025
Fiscal Year Ending 6/30
20062007200820092010
2011-20152016-20202021-20252026-20302031-20352036-2037
Total bonds
Principal
S 4,4105,7607,0508,2409,615
72,96077,81968,08983,784
103,27072,060
$513,057
Interest
$ 22,86922,60922,27421,83621,29094,827
114,153153,254172,133192,38998,258
$935,892
Total
$ 27,27928,36929,32430,07630,905
167,787191,972221,343255,917295,659170,318
$1,448,94931,850
$714,670
30,350164,134
$739,775 Included in interest is $62,584 related to accretion on capital appreciation bonds.
Bonds Psyable - City Bonds Payable - developmaent Agancy
Loa payment meas"umat Zrnues
In February 1997, the Anaheim Public Financing Authority sold $510.4 million of leaserevenue bonds to construct public improvements in The Anaheim Resort The Bonds arespecial obligations of the Authority payable solely from lease payments to be made by theCity to the Authority for the use and occupancy of the leased premises. Debt servicerequirements to maturity for these lease revenue bonds are paid from lease paymentmeasurement revenues (LPMR) defined as: 1) 3% of the 15% transient occupancy taxes(TOT) (i.e. 20% of the total transient occupancy taxes) for all hotel properties in the City,excluding Disney properties, and 2) 100% of the incremental TOT, sales, and property taxrevenues from all Disney properties over the 1995 base, adjusted each year by theConsumer Price Index (CPI) change, with a minimum 2% increase annually. The City isnot required to pay any additional sums should the LPMR fall short of the amount requiredto pay debt service on the bonds. The Walt Disney Company provided a guarantee to the
Debt service requirements to maturity for the Redevelopment Agency Tax Allocationbonds are to be paid by the Redevelopment Agency Debt Service Fund from future taxincrement revenue are as follows:
Fiscal Year Ending 6/30
20062007200820092010
2011-20152016-2019
Total bonds
Principal
$ 2,9763,9837,7908,260
10,68564,33061,070
$159,094
Interest
$11,72713,417
9,4099,3738,365
30,6657,966
$90,922
Total$ 14,703
17,40017,19917,63319,05094,99569,036
$250,016
Included in interest is $5,040 related to accretion on capital appreciation bonds.
50

CrTY OF ANAHEIM
CERIIFICATES OF PARTICIPATION CAPITAL LEASE OBLIGATIONS
At June 30, 2005, certificates of participation consisted of the follov
Range ofDate Final Interest Rates
Issued Maturity at Issue DateCity1993 Refunding Projects 1/14/93 8/01/19 5.47%.1993 Police FacilitiesRefinancing Project 7/15/93 8/01/08 4.47%
1993 Arena LandRefinancing 11/01/93 11/01/19 6.00/9-7.505%
Total City
Motorized Equipment1993 Refunding Projects 1/14/93 8/01/11 5.470/a
Unamortized COP discountTotal Motorized Equipment
Total governmental activities COPs
Awing: The City has a long-term noncancelable lease with Motorola, Inc. to finance theOut- acquisition of certain software utilized by the City's Police Department. The lease
and standing qualifies as a capital lease for accounting purposes as defined under the FASB StatementIssued 6/30/05 No. 13, Accounting for Leases, and therefore has been recorded at the present value of
future minimum lease payments at the date of inception of the lease. Future minimumS 9,696 $ 6,207 lease payments to be made from unrestricted revenues of the General Fund under the
26,000 8,400 capital lease are as follows:
21,210 16,720 Fiscal Year Ending 6/3031,327 2006
20074,584 1,849 2008
(2) 20091,847 2010
S 296296296296247
1,431(167)
$1,264
$61,490 $33,174 TotalLess amount representing interest, variablePresent value of future minimum lease paymentsCertiiates of Participatiou Payable - City
Certificates of participation debt service payments are to be paid fium unrestrictedrevenues of the Certificates of Participation Debt Service Fund. COP debt servicerequirements to maturity are as follows:
Fiscal Year Ending 6/30
20062007200820092010
2011o20152016-2020
Total COPS
Principal$ 2,881
3,0403,2043,3881,2087,462
10,144$31,327
Interest$ 1,761
1,6071,4451,2731,1494,4421,682
$13;359
Total
$ 4,6424,6474,6494,6612,357
11,90411,826
$44,686
The City has long-term noncancelable leases with Xerox Corporation and Cannon FinanceService, Inc. to finance the acquisition of a Xerox Copier and a Canon Digital ColorCopier. The leases qualify as capital leases for accounting purposes as defined under theFASB Statement No. 13, Accounting for Leases, and therefore have been recorded at thepresent value of future minimum lease payments at the date of inception of the leases.Future minimum lease payments to be made from unrestricted revenues of the Duplicatingand Printing Internal Service Fund under these capital leases are as follows:
Fiscal Year Ending 6/30
20062007
TotalLes amount representing interest, variablePresent value of future minimum lease payments
$593695
$91Certificates of Partic4ip Payable - Motorizd Bquint
Debt service requirements to maturity for Motorized Equipment certificates ofparticipation are to be paid by the Motorized Equipment Internal Service Fund from futurerevenues are as follows:
Fiscal Year Ending 6/3020062007200820092010
2011-2012Total
Unamortized COP discountTotal COPS
Ptrincipal
$ 227240251261274596
1,849__L,)$1,847
Interest$ 100
8772584234
393
Total$ 327
327323319316630
2,242(__2)
$2,24M
The City has a long-term noncancelable agreement with EDS Corporation to finance theacquisition of the City's mainframe computer system. The agreement qualifies as a capitallease for accounting purposes as defined under the FASB Statement No. 13, Accountingfor Leases, and therefore has been recorded at the present value of future minimum leasepayments at the date of inception of the lease. Future minimum lease payments to be madefrom unrestricted revenues of the Information Services Internal Service Fund under thecapital lease are as follows:
Fiscal Year Ending 6/30
2006Less amount repesenting interest, variablePresent value of future minimum lease payments
$175
$16851

CITY OF ANAHEIM
NOTES AND LOANS PAYABLE
At June 30, 2005, notes and loans payable are as follows:
Homer Street land acquisition
In July 1995, the Redevelopment Agency executed an installment note secured by a deedof trust with the County for acquisition of land at 1133 Homer Street and 1170 AnaheimBoulevard. The land will be developed by the Community Services Department as part ofLa Palma Park. The amount of the note is $500 and bears interest at 7.25% per annum fora term of 15 years. Based on a cooperative agreement between the Redevelopment Agencyand the Community Services Department, principal and interest on the note will be paidby the Community Services Department At June 30, 2005, the outstanding balance on thenote was $211. Note debt service requirements to maturity are as follows:
5.97% and is payable over 20 years beginning on February 1, 2004 until August 1, 2023.Loan debt service requirements to maturity are as follows:
Fiscal Year Ending 6/3020062007200820092010
2011-20152016-20202021-2024
Total notes and loans
Principal$ 156
162169175272
2,1823,4313,453
$10,000
Interest$ 521
518513508499
2,2341,509
397$6,699
Total$ 677
680682683771
4,4164,9403,850
F16,699
Fiscal Year Ending 6/3020062007200820092010
Total notes and loans
Principal$ 37
39424548
$211
Interest
$15131073
$48
Total$ 52
52525251
$259
ComputerAided Dispatch and Records Manag-ment System (CAD/RMS) loanpayable
In December 2004, the City entered into an agreement with Suntrust to finance theacquisition and implementation of the CAD/RMS system. The amount of the loan is$5,289 and bears interest at 3.30% per annum for aterm of 5 years. Principal and interestpayments of $578 are due semiannually beginning on June 30, 2005 until December 31,2009. The outstanding balance at June 30, 2005 was $4,799. Loan debt servicerequirements to maturity are as follows:
HUD Section 108 guaranteed l"m payable
In May 1999, the City entered into an agreement with HUD, making available $3,000 tofinance the acquisition of certain property for park use. The loan bears interest rangingfrom 6.56% to 7.22% and is payable over a nine-year period beginning on August 1, 2000until August 1, 2008. The outstanding balance at June 30, 2005, was $1,440. Loan debtservice requirements to maturity to be paid from the Community Development BlockGrant Special Revenue Fund are as follows:
Fiscal Year Ending 6/30
20062007200820092010
Total notes and loans
Principl$1,006
1,0401,0741,110
569$4,799
Interest$150
1178246
9i4O4
Total$1,156
1,1571,1561,156
578$5,203
Fiscal Year Ending 6/302006200720082009
Total notes and loans
Principa$ 330
350375385
$1,440
Interest
$92674114
S214
Total$ 422
417416399
$1,654
Redevelopment Agenc notes payable
In July 1989, the Redevelopment Agency executed a note with Savi Ranch Associates, aCalifornia general partnership. The amount of the note is $2,707 and bears interest at 9.5%per annum. The note is payable from net property tax increment as defined in theRedevelopment Agency note. If there is insufficient property tax increment to pay forprincipal and interest at the termination of the River Valley project area plan, the noteceases to be an obligation of the Redevelopment Agency.
In February 2003, the Redevelopment Agency executed a balloon payment promissorynote with Suzanna Luiso, a property owner, for the purchase of a commercial developmentsite. The amount of the note is $450 and bears simple interest at 6% per annum. The noteis payable at $3 monthly over 10 years, with a balloon payment of $379 in March 2013.At June 30, 2005, the outstanding balance of the note is $437.
In May 2003, the City entered into an agreement with HUD, making available $10,000 toprovide financial assistance related to the development of Westgate on a former landfillsite located at the northeast comer of Beach Boulevard and Lincoln Avenue. The loan ispayable from sales tax revenue generated by Westgate, from Community DevelopmentBlock Grant yearly entitlement, and from the Redevelopment Agency's property taxincrement and project participation revenues generated by Westgate. The outstandingbalance at June 30, 2005 was $10,000. The loan bears interest ranging from 1.74% to
52

CrrY OF ANAHERIM
In November 2004, the Redevelopment Agency executed a promissory note with theOrange County Transportation Authority for the acquisition of various parcels forcommercial development The amount of the note is $1,225 and bears 5% interest perannum. The note is payable at $70 quarterly over 5 years. At June 30, 2005, theoutstanding balance of the note is $1,116.
In January 2005, the Redevelopment Agency executed a promissory note with Robert andBetty Williams, co-trustees of the Williams Family Trust, for the acquisition of a certainproperty for commercial development The amount of the note is $650 and bears 3.5%interest per annum. The note is payable over 6 years. At June 30, 2005, the outstandingbalance of the note is $617.
Redeiwvokmet Agency conkactual commitments
As part of the Redevelopment Agency's economic development program to attract andretain businesses in the City, the Redevelopment Agency has entered into variouscontractual commitments. Generally, the Redevelopment Agency reimburses the businessfor its tenant improvement costs from property tax increment revenues received by theRedevelopment Agency. At June 30, 2005, the outstanding balance of these commitmentstotaled $702.
The Redevelopment Agency has entered into an agreement, dated December 15, 1992,with California State Teachers Retirement System (CALSTRS) to share in thedevelopment costs of the Plaza Redevelopment Project. In March 2004, CALSTRSassigned the agreement to the new owners, Pan Pacific Retail Properties, Inc. (PPRP).ThePPRP participation note bears 7% simple interest rate and has a maximum term of 25years. The Redevelopment Agency's obligation to repay the note is entirely contingent onthe revenues generated by the project. The note will be forgiven at the end of the termwhether or not the entire amount has been repaid. At June 30, 2005, the outstandingbalance of the participation note is $4,615.
Debt service requirements to maturity for the Redevelopment Agency notes andcontractual commitments to be paid from future revenues are as follows:
Housing Authority CHFA loan agpenemnt
In October 2003, the Housing Authority entered into a loan agreement for an amount up to$1,800 with the California Housing Finance Agency (CHFA), to provide funding for first-time homebuyers down payment assistance. The note bears 3% simple interest, withprincipal and interest due in October 2013. At June 30, 2005, the outstanding balance of thisloan is $375.
In November 1999 and April 2000, the Housing Authority entered into separate loanagreements totaling S 1,650 with CHFA to provide funding to several property owners for therehabilitation of properties to provide affordable housing. The notes bear 3% simple interest,with principal payments in the amount of $1,150 and $500 due in November 2009 and April2010, respectively.
BUSINESS-TYPE ACTIVITIES:
BONDS PAYABLE
Date FinalIssued Maturity
Eactrio Utility1993 Revenue Bonds1998 Revenue Bonds1999 Revenue Bonds2002 Revenue Bonds2003 Revenue Bonds2004 Revenue Bonds
TotalUnamortized bond discount
Total Electric Utility
Waer Utility1992 Revenue Bonds2004 Revenue Bonds
TotalUnamortized bond discount
Total Water Utility
6/01/935/01/989/01/992/15/024/01/036/01/04
10/01/0710/012810/01/2710/01/3110/01/2210/01/34
Range ofInterest Ratesat Issue Date
3.50/-5.1%4.75%-5.0%
4.625%3.3%-5.25%3.00/&-5.0%2.5Y-5.0%
Authorizedand
Issued
$ 60,70065,00045,000
178,70560,415
131,265
Out-standing6/30/05
$ 19,10560,35545,000
178,70560,415
131,265494,845
(1,000)493,845
3/15/92 7/01/05 3.1%-6.1%5/01/04 10/01/16 4.0/-4.5%
Fiscal Year Ending 6/3020062007200820092010
2011-20152016-2020
2021Total notes and contractual commitments
prmcipalS 534
439464607488
1,4354,3961,831
$10,194
Interest$ 687
662647619593
2,6941,657
136$7,695
TotalS 1,221
1,1011,1111,2261,0814,1296,0531,967
$17,889
5,740 60012,105 11,325
11,925(496)
11,429
26,260 23,090(234)
22,856$585,190 $528,130
Counvatio, sports and Entertainment VW=e2002 Revenue Bonds 7/02/02 8/01/23
Unamortized bond discount3.0'/,-5.5%
Total Convention, Sports and Entertainment VenuesTotal business-type activities bonds
53

CIY OF ANAHEIM
Bonds Payable - Electri uUIl Boada Payable - Conwatidon, Sports and Entcxtalument Wnemm
Bond debt service requirements to maturity for the Electric Utility to be paid fromrevenues are as follows:
Bond debt service requirements to maturity for the Convention, Sports and EntertainmentVenues to be paid from revenues are as follows:
Fiscal Year Ending 6/3020062007200820092010
2011-20152016-20202021-20252026-20302030-2035
TotalUnamortized bond discount
Total bonds
Bonds Payable - Water Utility
PrincipalS 12,625
13,31513,92014,73515,25581,62597,16595,42594,67556,105
494,845
$493,845
Interest$ 23,903
23,35122,73522,10221,43996,12173,82249,83725,809
4,497363,616
$363,616
Total$ 36,528
36,66636,65536,83736,694
177,746170,987145,262120,48460,602
858,461(1,000)
$857,461
Fiscal Year Ending 6/302006200720082092010
2011-20152016-20202021-2024
TotalUnamortized bond discount
Total bonds
Principal$ 75
7580
3,2153340
15,815270220
23,090
$22,856
Interest$1,133
1,1311,1291,071
9441,945
9024
7,467
$7,467
Total
S 1,2081,2061,2094,2864,284
17,760360244
30,557(234)
$30,323
Out-standing6/30/05
CERTIFICA.TE OF PARTICIPATION
Bond debt service requirements to maturity for the Water Utility to be paid from revenuesare as follows:
Range ofDate Final Interest Rates
Issued Maturity at Issue Date
5/01/97 4/01/27 4.5%-6.0%
Authorizedand
IssuedFiscal Year Ending 6/30
20062007200820092010
2011-20152016-2017
TotalUnamortized bond discount
Total bonds
Principal$ 1,870
1,3251,3751,4351,4903,840
59011,925
(4962$11,429
Interest
S 450380324269211477
132,124
$2,124
Total
S 2,3201,7051,6991,7041,7014,317
60314,049
(496$$13,553
mWrio Utliy1997 Distribution Plant
Unamortized COP discountTotal Electric Utility
Coavention, Sports and Entertainment Veues1992 Convention Center
Financing Project 1/01/92 8/01/23 3.9%-6.4%Accretion
1993 Refunding Projects 1/14/93 8/01/19 5.47%Unamortized COP discount
Total Convention, Sports and Entertainment VenuesTotal business-type activities COPs
$ 25,000 $ 21,630(349)
21,281
92,777 41,8405,669
114,564 64,844(682)
S111,671
$232,341 $132,952
54

CITY OF ANAHEIM
Certifica of Participation Payable - Elecic Utiit
Certificates of participation debt service requirements to maturity for the Electric Utilityto be paid from revenues are as follows:
defined under FASB Statement No. 13, Accounting for Leases, and therefore, has beenrecorded at the present value of the future minimum lease payments at the date ofinception ofthe lease. Future minimum lease payments to be paid from unrestricted WaterUtility revenues under the terms of this capital lease are as follows:
Fiscal Year Ending 6/30
20062007200820092010
2011-20152016-20202021-20252026-2027
TotalUnamortized COP discount
Total COPs
Principal$ 520
545575610645
3,8455,0456,6303,215
21,630(349)
$21,281
InterestS 1,229
1,2021,1731,1381,1024,8913,6932,105
28016,813
$16,813
Total$ 1,749
1,7471,7481,7481,7478,7368,7388,7353,495
38,443(349)
$38,094
Fiscal Year Ending 6/302006
I.ss amount representing interest variablePresent value of future minimum lease payments
189(9)
$180
Certificates ofParticipation Payable- Coawation. Sports and Enterntaimet Venues
Certificates of participation debt service requirements to maturity for the Convention,Sports and Entertainment Venues Fund to be paid from unrestricted revenues are asfollows:
NOTES AND LOANS PAYABLE
At June 30, 2005, notes and loans payable are as follows:
Orange County Water District Promissory Note
In April 1990, the Water Utility executed a Well Construction Program Agreement withthe Orange County Water District to assist in financing the construction of three superwells to be located within the City. Advances totaling $2,177 at an interest rate of 3.5% fora period of 15 years were for wells 46, 47 and 49. The outstanding balance on this note atJune 30, 2005, totaled $740.
State of C"nifomia Realvig Fund Note Payable
In June 2001, the Water Utility executed a note payable to the State of CaliforniaRevolving Fund at a rate of 2.8% in the amount of $18,063. There are semi-annualpayments of principal and interest in the amount of $592 through June 12, 2021. Theoutstanding balance on this note at June 30, 2005, totaled $15,580.
Notes and Loans Payable- Water Utility
Notes and loans debt service requirements to maturity for the Water Utility are as follows:
Fiscal Year Ending 6/30
20062007200820092010
2011-20152016-20202021-2024
TotalUnamortized COP discount
Total COPS
priNipal$ 5,962
6,1436,3275,3965,669
28,27639,9119,000
106,684(682
$106,002
Interest
$ 7,7647,5827,3785,0964,774
19,1418,201
44060,376
$60,376
Total
$ 13,72613,72513,70510,49210,44347,41748,112
9,440167,060
(6826$166,378
Included in interest is $5,669 related to accretion on capital appreciation certificates.
CAPITAL LEASE OBLIGATION
The City has a long-term noncancelable lease with the Municipal Water District of OrangeCounty to finance the acquisition of a 3.002% share in the capacity of the Allen-McColIoch Pipeline. Such lease qualifies as a capital lease for accounting purposes as
Fiscal Year Ending 6/3020062007200820092010
2011-20152016-2020
2021Total
Unamortized note discountTotal notes and loans
PrMin l$ 918
945941935962
4,6195,2701,730
16,320(478)
sis,942
Interest$ 454
427400373346
1,33865549
4,042
$4,042
Total$ 1,372
1,3721,3411,3081,3085,9575,9251,779
20,362(478)
$19,884
55

CiTY OF ANAHEIM
ARBITERAG CONDUIT FWNANCINGS
The Tax Reform Act of 1986 (Act) substantially revised the treatment to be afforded toearnings on the proceeds of tax-exempt debt, and now requires the City to calculate andremit rebatable arbitrage earnings to the Internal Revenue Service. Certain of the City'sdebt and interest earned on the proceeds thereof are subject to the requirements of the Act.The City has accrued a liability for estimated rebatable arbitrage earnings and has set asidesuch earnings as restricted cash. At June 30, 2005, the arbitrage rebate liability forgovernmental and business-type activities was zero and $183, respectively.
COMPLANCE WITH DEBT COVENANTS
There are various limitations and restrictions contained in the City's bond and certificatesof participation indentures. The City believes they are in compliance with all significantlimitations and restrictions.
DEBT DEFEASED
Certain bonds and certificates of participation defeased by the City prior to June 30, 2005,are summarized below:
Outstanding6/30/05
Redwovast AgancyLocal Government Finance Authority Revenue Bonds, 1986 Issue A $38,410
Electric Utility FundElectric System Certificates of Participation, Issue of 1989 2,840Electric System Revenue Bonds, Issue of 1993 275Electric System Authority Revenue Bonds, First Issue of 1993 61,375Electric System Authority Revenue Bonds, Second Issue of 1993 58,495Electric System Revenue Bonds, Issue of 1994 2,145
Water Utty FundWater System Authority Revenue Bond, Issue of 1994 20,000
In each of these refundings, the proceeds of the refunding issues mere placed inirrevocable escrow accounts and invested in government securities that, together withinterest earnings thereon, will provide amounts sufficient for future payments of interestand principal on the issues refunded. Refunded debt is not included in the City'saccompanying financial statements as the City has satisfied its obligation through the in-substance defeasance of these issues.
city
The City has entered into two conduit financings on behalf of community care providerfacilities and one to facilitate the management agreement for the Arrowhead Pond ofAnaheim. In accordance with applicable agreements, the City has no obligation for debtservice payments and therefore, the debt is not reflected in the accompanying financialstatements. Bonds payable and certificates of participation related to conduit financingsoutstanding at June 30, 2005, are as follows:
DateIssued
1985 West AnaheimConvalescent Home 12/30/85
1993 Anaheim MemorialHospital Association 10/15/93
2003 Anaheim Arena Financing Project 12/i 1/03Total
Final Amount OutstandingMaturity Issued 6/30/05
12/01/05 $ 3,204 $ 2,349
5/15/20 46,6906/01/23 42,600
$92,494
34,16041,500
$78,009
Anaheim ousing Authoity
The Anaheim Housing Authority has entered into 13 conduit debt financings on behalf ofvarious developers to assist with the acquisition, construction, equipping, rehabilitationand refinancing of multifamily residential rental projects within the City of Anaheim. Inaccordance with the bond documents, neither the City nor the Housing Authority has anobligation for debt service payments and therefore, the debt is not reflected in theaccompanying financial statements. Housing Authority revenue bonds related to conduitfinancings outstanding at June 30, 2005, are as follows:
1985 West Anaheim Royale1990 Bel Age Apartments1992 Heritage Village Park1997 Monterey Apartments1997 Port Trinidad Apartments1997 Casa Granada Apartments1998 Sage Park Project2000 Founins at Anaheim2000 Cobblestone Apartments2000 Seawinds Apartments2000 Park Vista Apartments2001 Solara Court Apartments
Total
DateIssued
12/01/858/01/90
11/12/925/15/975/15/975/15/97
11/01/987/03/007120/007/20/007/24/001/01/01
FinalMaturity12/01/158/01/20
11/12/075/15/275/15M275/15M27
11/01/282/15/333/15/337/15/337/01/33
12/01/34
AmountIssued
$ 4,66410,0008,4854,5452,1403,7955,5W
20,2443,9807,000
27,1808,200
$105,733
Outstanding6/30/05
$ 3,4397,0005,4854,2451,9403,4955,500
20,2443,8806,900
27,1806,260
$95,568
56

CITY OF ANAHEIM
Mdlio-Roos Community Faclhii Dutbi
In June 1989, the City issued $26,620 in special tax bonds to finance a portion of the costof acquisition and construction of facilities in East Anaheim Hills. The bonds mereauthorized pursuant to the Mello-Roos Community Facilities Act of 1982. In April 1995,$15,389 of the 1989 bonds were advance refunded through the Anaheim Public FinancingAuthority and in June 2004, $11,160 of the 1995 bonds were refunded through theAnaheim Public Financing Authority. In December 1999, $7,720 of the 1989 bonds wererefunded by the City. The 2004 and the 1999 bonds are payable from a special assessmenttax and are non-recourse bonds secured by the properties. Neither the faith and credit northe taxing power of the City, the State of California or any political subdivision of eitherof the foregoing is pledged to the payment of the bonds. The bonds are not general orspecial obligations of the City, nor do they contain any credit enhancements thatsecondarily pledge existing or future resources of the City, accordingly they are notreflected in the accompanying financial statements. The City is acting as agent only forthe property owners in collecting the special assessments and forwarding the collectionsto the fiscal agent. This activity is recorded in an agency fund in the financial statements.At June 30, 2005, the 2004 Anaheim Public Financing Authority bonds outstandingamounted to $11,210, and the 1999 Mello-Roos bonds outstanding amounted to $6,620.
NOT 8 - ITBMREST RATE SWAPS:
Objective of the interest rate swaps. As a means to lower its borrowing costs, whencompared against fixed-rate bonds at the time of issuance, the City entered into interestrate swap agreements for certain COPs. The intention of the swaps was to effectivelychange the City's variable interest rate on the COPs to a synthetic fixed rate.
Terms and fair values. The terms and fair values of the outstanding swaps at June 30,2005, are as follows. The City's swap agreements contain scheduled reductions tooutstanding notional amounts that are expected to approximately follow scheduled oranticipated reductions in the associated COPs payable category.
then-existing market conditions, mauld enable the remarketing agent to sell suchCOPs.
Fair Wdua Because interest rates have declined since execution of the swaps, the swaps hada negative fair value of $12,060 at June 30, 2005. The swaps' negative fair value may becountered by a reduction in total interest payments required under the variable-rate COPs,creating a lower synthetic interest rate. Because the coupons on the City's variable-rateCOPs adjust to changing interest rates, the COPs do not have a corresponding fair valueincrease. The fair values were estimated using the present value of expected cash flows.
Credit Risk At June 30, 2005, the City was not exposed to credit risk because the swapshad negative fair values. However, should interest rates change and the fair values of theswaps become positive, the City would be exposed to credit risk in the amount of thederivatives' fair values. The swap counterparty was rated AAA by S&P and Aan byMoody's at June 30, 2005. To mitigate the potential for credit risk, if the counterparty'scredit quality falls below AA-/Aa3, the fair value of the swaps will be fully collateralizedby the counterparty with cash or securities. Collateral would be posted with a third-partycustodian.
Termination Risak The City or the counterparty may terminate the swaps if the other partyfails to perform under the terms of the contracts. The swaps may be terminated by the Cityif the counterparty's credit quality rating falls below "A-" as issued by S&P or "A3" asissued by Moody's. Additionally, the swaps may be terminated by the counterparty if theCity's credit quality rating falls below "BBB-" as issued by S&P or "Baa" as issued byMoody's or if the COPs' credit quality ratings fall below "AA-" as issued by S&P or "Aa3"as issued by Moody's. If the swaps are terminated, the variable-rate COPs would no longercarry synthetic interest rates. Also, if at the time of termination the swaps had negativefair values, the City would be liable to the counterparty for a payment equal to the swaps'fair values.
NOTE 9 - RlElREMENT PLANS:
The City contributes to the California Public Employees' Retirement System (PERS), anagent multiple-employer public employee defined benefit pension plan. PERS providesretirement and disability benefits, annual cost-of-living adjustments, and death benefits toplan members and beneficiaries. PERS acts as a common investment and administrativeagent for participating public entities within the State of California. Benefit provisions andall other requirements are established by State statute and City ordinance. A copy ofPERS' annual financial report may be obtained from its executive office at 400 P Street,Sacramento, California 95814.
COP Issues1993 Refunding Projects1993 Police FacilitiesRefmancing Project
NotionalAmounts$67.800
VariableEffective Fixed Rate Rate
Date Paid Received1/1/1993 5.47% 2.21%t
SwapFair Termination
Values DateS( 1,719) /11/2019
(~341 811/2008U(12,060J
6,450 6/1/1993$74,250
4.47% 2.21%0"
tVariable rate received effective at June 30, 2005. The variable rate received is aweekly interest rate determined by the remarketing agent on the determination date tobe the minimum interest rate, which, in the opinion of the remarketing agent under
57

CITY OF ANAHEIM
Funding Policy: Participants are required to contribute 7.0% (9.0% for safety employees)of their annual covered salary. The City pays participant contributions for miscellaneousemployees, while contributions for safety employees are paid by the employees throughpayroll deductions. In addition, the City is required to contribute at an actuariallydetermined rate applied to annual covered payroll; the current rates are 2.364% formiscellaneous employees, 25.494% for fire safety employees and 28.680% for policesafety employees. The contribution requirements of plan members and the City areestablished and may be amended by PERS.
Annual Pension Cost For fiscal year 2005, the City's annual pension cost of S29,591 forPERS was equal to the City's required and actual contributions. The required contributionwas determined as a part of the 2004 actuarial valuations, using the entry age normalactuarial cost method. The actuarial assumptions included: (a) 7.75% investment rate ofreturn (net of administrative expenses), (b) projected annual salary increases that vary byduration of service, and (c) 2% per year cost-of-living adjustments. Both (a) and (b)included an inflation component of 3.0%. The actuarial value of PERS assets wasdetermined using techniques that smooth the effects of short-term volatility in the marketvalue of investments over a 15-year period (smoothed market value). The PERS unfundedactuarial accrued liability is being amortized as a level percentage of projected payroll ona closed basis. The remaining amortization periods at June 30, 2004, were 19 years for themiscellaneous plan and 32 years for safety fire and police plans for years of serviceunfunded.
Retirement Medical Benefits
In addition to the pension benefits described above, the City provides postretirementmedical benefits to eligible retirees (hired prior to January 1, 2002, and Anaheim PoliceAssociation employees hired prior to July 6, 2001) in accordance with City PersonnelResolutions and various Memoranda of Understanding. Depending upon the employee'sdate of hire and employee group, eligibility requirements may be age 50 and five years ofCity service or age 50 and ten years of City service.
In all cases, eligible retirees may participate in any health plan made available to activeCity employees. The contribution made by the City toward the cost of the plan isdetermined by Personnel Resolution or Memorandum of Understanding. At June 30,2005,1,204 retirees or surviving spouses met the various eligibility requirements and werereceiving benefits.
The City has several plans with different contribution levels and benefit provisions. Citycontributions vary up to 100% of annual premium cost, depending on the employee'sstatus (single, two-party, family, Medicare participant) and employee group.
The most recent actuarial valuation was as of July 1, 2004, using the Projected Unit Creditcost method to determine reserving requirements. The valuation was based on thefollowing assumptions:
THEEYARTRED IFOMTINFO EM
Fiscal YearEnding6130/036130/046/30/05
AnnualPension Cost (APC)
$10,92420,07229,591
Percentage ofAPC Contributed
100%100100
Net PensionObligation
$000
Discount rateIncrease in future payrollMedical trend
Non-economic
4.5% annual4.0% annual9.0% increase in 2005, declining to 5.0%increase by 2010System-wide PERS assumptions
RF1JRDSPLMNAYIFRMATION (Uwa nadtd)
ActuarialValuation
Date6/30V26/30/036/3/04
(A) (B) (C)Excess/
Entry Age (Deficiency)Actuarial Accrued Over
Asset Liability AALValue (
S950,992 $ 931,633 $ 19,359954,147 1,020,648 (66,501)998,831 1,129,864 (131,033)
(D) (E) (F)Excess/
(Deficiency)Funded Annual of CoveredRatio Covered Payroll
(AY(B) Payroll (CY102.1 S135,360 14.393.5 142,034 (46.8)88.4 145,210 (90.2)
The July 1, 2004, actuarial valuation estimated the current normal cost of the benefit at3.27% of payroll. An additional 3.34% of payroll was estimated as the cost of amortizingprior service obligations over a 30-year perkL Currently, the accrued liability is estimatedat $205,551 of which $74,049 is funded, available, and reserved for future obligations and$131,502 is unfunded. The City's contribution to the postrfirement medical plan for theperiod July 1, 2004 to June 30, 2005 was $5,584.
The City provides postretirement medical benefits in the form of defimed contributionretiree medical plans to eligible retirees in accordance with City Personnel Resolutionsand various Memoranda of Understandings for all newly hired employees as of January 1,2002 (July 6, 2001 for the Anaheim Police Association). Under the plans, the City isrequired to make one-time contributions ranging from $3 to $8 per employee. The City'stotal contribution to the plans for the period July 1, 2004 to June 30, 2005, was $468.
58

CITY OF ANAHEIM
NOTE 10 - JOINT VENTURES AND JOINTLY-OWNED PROPERTIES:
Authoiy for Oanm County - City Hazardous Mateniab Emrgcy Respowse
The City participates in a joint powers authority, the Authority for Orange County-CityHazardous Materials Emergency Response (Hazmat), for the purposes of responding to,assessing the nature of, and stabilizing any emergency created by the release or threatenedrelease of hazardous materials.
The following entities are members of Hazmat: City of Anaheim, Orange County FireAuthority, City of Santa Ana, and the City of Huntington Beach. Members of the Boardof Directors consist of one voting Board member and an alternate appointed by thegoverning body from the City of Anaheim, Orange County Fire Authority, City of SantaAna, and the City of Huntington Beach.
Distribution of fair share contributions to reimburse the provider agencies are as follows:City of Anaheim, 27.30/a; Orange County Fire Authority, 27.3%; City of Santa Ana,27.30/c; City of Huntington Beach, 18.1/.
At the direction of the Board, revenues are disbursed to the provider agencies at the end ofeach preceding quarter. Audited financial information for the joint powers authority as ofand for the year ended June 30, 2005, is as follows:
The following entities are members of the Fire Authority: City of Anaheim, City ofFountain Valley, City of Fullerton, City of Garden Grove, City of Huntington Beach, Cityof Newport Beach, and the City of Orange.
Public entities in Orange County may receive services from the Fire Authority byexecuting an agreement and paying a fair share contribution. Audited financialinformation for the Fire Authority as of and for the year ended June 30, 2005, is as follows:
Total assetsTotal liabilitiesMembers' equityTotal revenuesTotal expensesRevenues over expenses
$1,191375816
3,7213,711
10
Total assetsTotal liabilitiesMembers' equityTotal -evenuesTotal expensesRevenues over expenses
S 674522
149141
8
The City has no significant equity interest in the Fire Authority, and accordingly neitherassets nor liabilities of the Fire Authority have been recorded in the City's basic financialstatements. For a copy of separate financial statements, contact the Finance Director of theCity.
Jointly-own utfi plants
The City's Electric Utility owns a 10.04% ownership interest in the coal-fired San JuanGenerating Station, Unit 4, located near Waterflow, New Mexico. The other participantsin Unit 4 and their respective ownership include: Public Service of New Mexico, 45.48%;City of Farmington, New Mexico, 8.4 80/9; County of Los Alamos, New Mexico, 7.20%;and M-S-R Public Power Agency, 28.800a There are no separate financial statements forthis venture, as each participant's interest in the utility plant is included in their respectivefinancial statements. The City's cumulative share of construction costs included in theutility plant at June 30, 2005, amounted to $60,237. The City's bonded indebtednessincurred to finance the purchase of the 10.04% ownership interest is also included in theaccompanying financial statements.
In addition, the City's Electric Utility owns a 3.16% interest as a tenant in common inSONGS. The other participants and their respective ownership interests in SONGS are:SCE, 75.05%; San Diego Gas and Electric Company, 20.00%0 and the City of Riverside,California, 1.79%. There are no separate financial statements for this venture, as eachparticipant's interests in the utility plant and operating expenses are included in theirrespective financial statements. At June 30, 2005, the Electric Utility's carrying value(participating share) of the SONGS was $71,261, net of accumulated depreciation of$139,331, which is included in utility plant. The Electric Utility recorded depreciationrelated to the SONGS of $7,495 for the year ended June 30, 2005. The City's bondedindebtedness incurred to finance its portion of the construction costs is also included inthe accompanying financial statements.
Hazmat does not have any debt outstanding at June 30, 2005.
The City has no significant equity interest in Hazmat, and accordingly neither assets norliabilities of Hazmat have been recorded in the City's basic financial statements. For acopy of separate financial statements, contact the Finance Director of the City.
Metro CWt Fire At rity
The City participates in a joint powers authority, Metro Cities Fire Authority (FireAuthority), for the purpose of providing a central communication network and recordkeeping system to support fire suppression, emergency medical assistance, rescue service,and related services provided by the members of the Fire Authority.
59

CrrY OF ANA]HEDM
The operation and maintenance of SONGS is the responsibility of SCE. The five-memberSan Onofre Board of Review (Board) approves the joint venture's budgets for capitalexpenditures and operating expenses. SCE has two participants on the Board, including thechairman; the City and the other participants each have one representative on the Board.
On June 22, 2004, SCE, as operating agent for the SONGS Nuclear Power Plant gavenotice that SCE had, pursuant to Section 16 of the Second San Onofre OperatingAgreement (Agreement), declared an Operating Impairment As a result of SCE's action,on October !1, 2004, the Anaheim Public Utilities (City) exercised its option, pursuant toSection 16 of the Agreement, not to participate in the restoration work related to theimpairment and to have its ownership share reduced per provisions of the Agreement TheCity believes the result will be termination of the City's Ownership Share in fiscal year2010. The potential termination of the City's Ownership Share is contingent upon certainregulatory approvals obtained by SCE and the City obtaining approval from City Council,which had not been obtained at June 30,2005. The City cannot predict the outcome and/orschedule of this matter.
NOT 11 - COM[TMENTS AND CONMhNGENCIES:
bitermountain Pwmt Agen ,
The Electric Utility has entered into a power purchases contract with the IntermountainPower Agency (EPA) for delivery of electric power. The share of IPA power is equal to13.225% of the generation output of IPA'S two coal-fueled generating units located inDelta, Utah. The City is obligated for the following percentage of electrical facilities atIPA:
it is obligated for its proportional share of the cost of the project. The City is obligated forthe following percentage of electrical facilities owned by SCPPA:
TransmissionSouthern Transmission System (STS)Mead-Adelanto Project (MAP)Mead-Phoenix Project (MPP)
GenerationHoover Dam Upating (Hoover)Magnolia Generating Station (Magnolia)
Entitlement17.6%13.5%
24.2%
Entitlement42.6%38.0%
Expiration202720302030
Expiration20182036
Take or pav commitments
As part of the take or pay commitments with IPA and SCPPA, the Electric Utility has agreedto pay its share of current and long-term obligations. Payment for these obligations will bemade from the operating revenues received during the year that the payment is due. A long-term obligation has not been recorded in the accompanying fmancial statements for thesecommitments. The following schedule details the amount of debt service that is due andpayable by the Electric Utility for each project and the final maturity date.
Fiscal Year Ending 6/30 IPA STS2006 S 39,700 $ 12,2652007 38,383 12,7402008 39,574 12,5622009 36,853 12,1332010 39,460 12,220
2011-2015 206,824 69,1192016-2020 158,714 69,4502021-2025 61,852 40,7962026-20302031-20352036-2037
MAPS 2,852
2,8562,8522,8572,928
14,53214,513
MPPS 1,586
1,5911,5891,5861,8228,4907,778
Hoover Magnolia Total$ 959 $ 7,162 S 64,524
957 7,444 63,971958 7,443 64,978958 7,444 61,831957 7,442 64,829
4,787 37,213 340,9652,871 37,215 290,541
37,213 139,86137,212 37,21237,211 37,21120,588 20,588
$12,447 $243,587 $1,186,511
GenerationIntermountain Powvr Project
Entitlement13.2%
Expiration2027
The contract constitutes an obligation of the Electric Utility to make payments fromrevenues and requires payment of certain minimum charges. These minimum chargesinclude debt service requirements on the financial obligations used to construct the plantThese requirements are considered a cost of purchased power and are quantified below.
Southern California Public Poemr Authority
The Electric Utility is a member of the Southern California Public Power Authority(SCPPA), a joint powers agency. SCPPA provides for the financing and construction ofelectric generating and transmission projects for participation by some or all of itsmembers. To the extent the Electric Utility participates in projects developed by SCPPA,
Total $621,360 $241,285 $43,390 $24,442
In addition to debt service, the City's entitlement requires the payment for fuel costs,operations and maintenance (O&M), administration and general (A&G) and othermiscellaneous costs associated with the generation and transmission facilities discussedabove. These costs do not have a similar structured payment schedule as debt service,however, prior experience indicates that annual costs are generally consistent from year toyear. The fiscal year 2006 budget for fuel, O&M, A&G and other costs at these projectsare as follows:
Fiscal Year IPA STS MAP MPP Hoover Magnolia Total2006 $41,880 $2,705 $225 $120 $78 $43,708 $88,716
60

CITY OF ANAHEIM
The Electric Utility has prepaid purchased power costs for the following take or paycontracts at June 30, 2005:
SCPPA - Stabilization fund prepayment $17,978SCPPA - Magnolia required prepayment 3,833SCPPA - Hoover required prepayment 291San Juan - Fuel acquisition prepayment 58
Prepaid purchased power $22,160
Sports and Entertainment Arena
The City entered into agreements with Ogden Facility Management Corporation ofAnaheim (OFM), a subsidiary of Ogden Corporation, now known as Covanta EnergyCorporation (Ogden) regarding the construction and operation of a 19,500-seat Sports andEntertainment Arena (Arrowhead Pond of Anaheim), which was completed in June 1993.
The grand opening of this facility occurred on June 18, 1993, and shortly thereafter Ogdenannounced that it was able to secure a National Hockey League (NHL) expansionfranchise, "The Mighty Ducks," as a major tenant in the facility, which actually began itsfirst year of operation in September 1993. The agreement with the NHL team runs for 30years, subject to termination by the tenant after the 1998-99 season, on certain conditions.As a result of negotiations between the City, Ogden and the owner of the Mighty Ducks,now known as Mighty Ducks Hockey Club, Inc., it was agreed to increase the size of theoriginal $103,500 debt issue which financed construction of the facility by $23,000 toreimburse Ogden for the $12,500 Hockey Franchise Fee and additional enhancements tothe Sports and Entertainment Arena for such items as completing the team locker rooms,the restaurant, and a $3,000 state-of-the-art scoreboard (the 1993 Issue). Finalnegotiations resulted in elimination of the City's contingent liability for the first threeyears. Since there was one professional franchise signed during this period, the maximumcontingent liability to the City was $1,500 for years four through eight. A $1,500 paymentwas made during fiscal years 1998, 1999, 2000, 2001 and 2002 resulting in theelimination of the City's obligation at June 30, 2002.
On November 5, 2003, pursuant to a termination agreement between OFM, Ogden andthe City, OFM agreed to the termination and rejection by OFM of the Second Amendedand Restated Arena Management Agreement (the Management Agreement) datedDecember 1, 1993, whereby OFM had the exclusive right to operate and maintain thefacility. OFM and Ogden were subject to the jurisdiction of the United States BankruptcyCourt under a Chapter 11 proceeding. On December 8, 2003, the United StatesBankruptcy Court approved the rejection of certain existing operating contracts,termination of the Management Agreement and settlement of certain claims under a bankagreement whereby $40,000 was paid to Credit Suisse First Boston (which issued the
credit enhancement supporting the 1993 Issue) from the proceeds of Taxable LeaseRevenue Bonds issued by the Anaheim Public Financing Authority in the aggregateamount of $42,600. Effective December 16, 2003, the City and Anaheim ArenaManagement LLC (AAM) entered into a Facility Management Agreement (FMA)whereby AAM has the exclusive right and license to manage, maintain and operate allaspects of the facility in accordance with the FMA through June 30, 2023 with an optionto extend the term for an additional period not to exceed 10 years. Annual distributionsto the City, AAM and the County of Orange are required for their respective share ofadjusted net revenues, as defined in the FMA. In the event that cash on hand isinsufficient to pay operating expenses, debt service, distributions to the City, the Countyof Orange, or other amounts payable, AAM shall make or cause an affiliate or third-partylending institution to make loans for such purposes, as defined in the FMA. Such fundswill be repaid from gross revenues or adjusted net revenues, if any, as defined in and inaccordance with disbursement priorities established in the FMA. At June 30, 2005, theoutstanding conduit debt on the Arrowhead Pond of Anaheim totaled $41,500. The debt isnon-recourse, payable from revenues generated by the facility. Neither the faith and creditnor the taxing power of the City is pledged to the payment of the debt. The debt is not ageneral or special obligation of the City, nor does it contain any credit enhancements thatsecondarily pledge existing or future resources of the City (other than revenues generatedby the facility), and accordingly it is not reflected in the accompanying financialstatements.
On January 26, 1999, the City entered into a series of lease transactions for the ArrowheadPond of Anaheim. Under these transactions, the City leased the Arrowhead Pond ofAnaheim to a third party trustee acting for the benefit of an equity investor for a term ofapproximately 39.2 years. The trustee sublet the facility back to the City for 20 years,which is shorter than the remaining term of the management agreement between themanager and the City in consideration of an advance rental payment for the entire leaseterm. At the end of the sublease, the City has a purchase option to purchase the trustee'srights under the lease for a fixed amount. The advance rent payments to the City weredeposited into a trust fund and invested. The cash scheduled to be available from this trustfund is sufficient to pay the City's rent payments for the term of the sublease and toexercise the City's purchase option at the end of the sublease. The excess of the amount ofthe advance rent payment made by the trustee to the City over the deposit to the trustfunds, after the payment of transaction expenses and payment to Ogden for agreeing topledge its interest as manager under the Management Agreement and agreeing toundertake certain additional obligations to the transaction, was approximately $4,000.This amount was recognized by the City as deferred revenue and is being amortized overthe sublease term. The City has secured its obligations to the other parties to these leasetransactions by a pledge of its respective interest in revenues from the facility, subordinate(with certain exceptions) to any interests of the debt holders of the facility. The City'sobligations under these lease transactions are considered to be defeased in substance, and
61

CITY OF ANAHEIM
therefore the related liabilities as well as the trust assets have been excluded from theCity's financial statements. AAM has pledged its interest as manager under the FMA andassuned certain of Ogden's obligations pursuant to separate agreements with the partiesto the lease transactions.
Stadium
On May 14, 1996, the City and the California Angels, LP (Team) (renamed AnaheimAngels), was then managed by Disney Sports Enterprises, Inc. (subsequently known asAnaheim Sports, Inc.), entered into an agreement to provide for the operation andrefurbishment of the Stadium. Pursuant to the agreement, the Team assumed responsibilityfor the operation of the Stadium on October 1, 1996. The agreement runs for 33 years(subject to a limited Team option to cancel at 20 years and the Team's right to extend theterm).
In addition to operational control, the agreement provides for a minimum $100,000renovation to the Stadium, which was funded by the City ($20,000) and Disney SportsEnterprises, Inc. ($80,000 plus overruns). This renovation, which commenced on October1, 1996, was substantially complete by the opening of the 1998 baseball season.
Under the terms of the agreement, the Team assumed full responsibility for all Stadiumoperations and maintenance, including capital maintenance. The Team books all Stadiumand parking lot events (except for ten annual City events), pays all expenses, and retainsall revenue (subject to the City's rights to share in certain net revenues) except that the Citycredits the Team up to $500 per year adjusted annually for CPI for a capital reserve,calculated on the basis of property taxes. The City's participation in net revenues includesamounts received by the Team above certain thresholds including paid admissions ($2.00per paid admission in excess of 2.6 million admissions per year), net income from non-game events (in excess of $2,000 per year adjusted annually for CPI), and parking lot netincome (25% in excess of $4,000 per year adjusted annually for CPI). Additionally, asindicated above, the City retained the right to book and retain all revenue from ten parkinglot events per year. Major League Baseball consented to the transfer of the Team in fiscalyear 2003 to interests controlled by Arte Moreno. No changes in the terms of theagreement with the Team were made in connection with that transfer.
This agreement ensured the retention of the Team under a long-term agreement (the prioragreement with the California Angels expired in 2001), accomplished a major overhaul ofthe Stadium at minimum cost to the City, and provided for the privatization of Stadiumoperations and shift of operating risL
The Agreement also provided that the City had the right to develop its Sportstowncomplex on approximately 42 acres of the parking lot. In 1998 a land sale of $1,000 for a
1.25 acre site was approved with an affiliate of Ogden for the construction of an 1,100-seat theatre called "Tinseltown Studios" (now known as "The Grove of Anaheim"). InNovember 2002, the City purchased the facility and the land for $6,700 from SMG, aPennsylvania partnership, an affiliate of Aramark Entertainment, Inc., the successor toOgden Entertainment, Inc. Concurrent with the purchase, the City granted toNederlander-Grove LLC (Nederlander) a license to operate the facility for three years withthe right to extend another five years, which Nederlander has exercised. Under the termsof the agreement, Nederlander receives a management fee of $150. Additionally, The Cityand Nederlander each participate 50% in the annual net profits and net losses fromoperations, as defimed in the management agreement. Nederlander is responsible for100% of losses in excess of $400, thereby limiting the City's share of net losses to amaximum of $200 in any given year. Upon expiration of the term of the agreement, theCity may elect to extend the term or pay the unamortized balance of capital assetspurchased during the term to Nederlander.
In May 1999, the City approved the sale to Summit Commercial Properties of a 1.5 acrebuilding site on the Sportstown site for $4,190. The transaction closed in March 2000, andthe owner, HPMC Stadium Gateway Associates, LLC, constructed a 250,000 square foot,six-story office building on the parcel. The "Stadium Gateway Anaheim" office buildingopened for business on October 1, 2001. In April 2003, the building was sold to PrincipalFinancial Group and is now operated by Stadium Gateway LLC, who has reported 100%occupancy. The owner pays the City $160 per year for parking and common areamaintenance. The City is continuing to pursue other opportunities for future developmentof the Sportstown site.
Ttigation
A number of claims and suits are pending against the City for alleged damages to personsand/or property and for other alleged liabilities arising out of matters usually incident to theoperation of a city such as Anaheim. Although the aggregate amount asserted for suchlawsuits and claims is significant, in the opinion of City management, the City has strongdefenses against such claims, and thus the ultimate loss, if any, relating to these claims andsuits not covered by insurance, will not materially affect the financial position of the City.
Granta
Amounts received or receivable from grant agencies are subject to audit and adjustmentby grantor agencies. Any disallowed claims, including amounts already collected, mayconstitute a liability of the applicable funds. The amount, if any, of expenditures that maybe disallowed by the grantor cannot be determined at this time, although the City expectssuch amounts, if any, to be immaterial.
62

CITY OF ANAHEIM
Conkmtmcion and other &ignfw;ant commitments NOTE 12- SUBSEQUENT EVBNTS
At June 30, 2005, the City had the following commitments with respect to unfinished Change to Post Emploiyment Benefitscapital projects:
Automotive Equipment AcquisitionsBNSF Railroad Corridor SoundwallEast St/Santa An St to South StHaskctt LibrayKatella Avel9th Street to HumorKatella Frontage Lighting and LandscapeLincoln - State College IntersectionPark 69/12KV "GIS" Substation &
Roosevelt Park FacilitiesParking StructureSouth St/State College to East StTechnology DevelopmentYouth Center and Police Station
RemainingConstructionCommitment
$ 1,5802,537
5412,3971,045
633999
13,83718,786
5182,1416,449
ExpectedCompletion
Date06/0604/0608/0501/0608/0707/0507/05
06/0612/0608/0512/05
05/06
In August 2005, the City restructured employee benefits for its miscellaneous (non-safety)employees. A pension enhancement (2.7% @ 55) wias adopted in connection with areduced retir medical benefit This reduced benefit for miscellaneous employees otherthan members of the International Brotherhood of Electrical Workers (IBEW), 1) freezesservice credit as of December 31, 2005, for employees with no less than ten years ofservice, and 2) transfers over 300 employees that did not meet such criteria from thedefimed benefit program to the existing defined contribution program. The same pensionenhancement was adopted for IBEW members whereby benefits for members retiring onor after October 1, 2005, wvre transferred into the IBEW's benefit plan. This plan isprovided solely through the terms of a Trust Fund established and maintained by theIBEW. The Trust is responsible for determining benefit eligibility and benefit schedules.
SONGS Nuclear Povwr Plant
As discussed in note 10, the potential termination of the City's Ownership Share inSONGS is contingent upon certain regulatory approvals obtained by SCE and the Cityobtaining approval from City Council. On December 15, 2005, the California PublicUtilities Commission (CPUC) announced its decision finding the restoration work to becost effective, but imposing a cap on the amount that SCE may recover from its ratepayerswithout further CPUC approval. The City remains unable to predict the outcome and/orschedule of this matter.
63

(This page left blank intentionally)
64

&

Nonmajor Governmental FundsSPECIAL REVENUE FUNDS are used to account for revenue derived from specific taxes or other earmarked revenue sources (other than for major capital projects) thatare restricted by law or administrative action to expenditures for specified purposes.GAs TAX AND ROADS FUND - Established to account for the construction and maintenance of the road network system of the City. Financing is primarily provided by theCity's share of Federal, State, and local gasoline taxes. Federal, State, and local regulations require that these gasoline taxes be used to improve and maintain streets,and includes programs that improve the air quality of the region.WORKFORCE DEVELOPMENT FUND - Established to account for the City's involvement in Federal, State, and local programs to create jobs for the unemployed citizens inthe Anaheim area.COMMUNITY DEVELOPMENT BLOCK GRANT FUND - Established to account for financing of rehabilitation of privately held homes and government infrastructure.Financing is provided by the Federal Housing and Community Development Act.COMMUNITY SERVICES FACILITES FUND - Established to account for the development of new parksite, playground, and other community facilities. Financing is providedby State and Federal reimbursement programs in conjunction with fees charged to residential and commercial developers.SEWER AND STORM DRAIN CONSTRUCTION FUND - Established to account for the construction of the City's sewer and storm drain system. Financing is provided by feescharged to residential and commercial developers.GRANTS FUND - Established to account for miscellaneous grants requiring segregated fund accounting. Financing is provided by Federal. State, and local agencies.ANAHEIM RESORT MAINTENANCE DISTRICT FUND - Established to account for the levy and collection of special assessments to pay the cost of annual maintenance andimprovements within the maintenance district, for those parcels which specifically benefit from the maintenance and improvements.NARCOTIC ASSET FORFEITURE FUND - Established to account for funds received from Federal and State agencies which are derived from monies and property seized bythe Police Department in drug related incidents. These funds are used to supplement existing resources of the City's law enforcement activities.REDEVELOPMENT HOUSING SET-ASIDE FUND - Established for the purpose of increasing and improving the community's supply of low and moderate income housing inaccordance with the California Community Redevelopment Law. Financing is provided from property tax increment.DEBT SERVICE FUNDS are used to account for the accumulation of resources and the payment of principal and interest on general debt of the City and related entities.MUNICIPAL IMPROVEMENTS FUND - Established to accumulate resources for the payment of principal and interest on general obligation bonds of the City. Debt service isfinanced by property tax revenues.REDEVELOPMENT AGENCY FUND - Established to accumulate resources for payment of principal and interest on Redevelopment Agency tax allocation bonds. Debt serviceis financed by property tax revenues.CERTIFICATES OF PARTICIPATION FUND - Established to accumulate resources for payment of the principal and interest on the certificates of participation for the ParkingFacility Project, Police Facilities Projects, Arena Land Acquisition, and other various acquisitions and capital improvements.ANAHEIM RESORT IMPROVEMENTS FUND - Established to accumulate resources for payment of the principal and interest on the lease revenue bonds for The AnaheimResort improvements.CAPITAL PROJECTS FUNDS are established to account for resources used for the acquisition and construction of capital facilities by the City, except for those financed byproprietary funds.MELLO-Roos PROJECTS FUND - Established to account for road, sewer, and water improvements and the construction of a police sub-station. Financing was providedby the sale of special tax bonds which are secured by and payable from the proceeds of an annual special assessment tax on the property within the district.REDEVELOPMENT AGENCY FUND - Established to account for the acquisition, relocation, demolition, and sale of property for those portions of Anaheim earmarked as inneed of redevelopment related activities. Financing is provided by property tax increment and bond proceeds.OTHER CAPITAL IMPROVEMENTS FUND - Established to account for miscellaneous capital projects as determined by the City Council. Currently, financing is provided byfees from developers for infrastructure improvements and subsidies from the General Fund.ANAHEIM RESORT IMPROVEMENTS FUND - Established to account for the public improvements in The Anaheim Resort. Financing was provided by the sale of leaserevenue bonds.

CITY OF ANAHEIM
Combining Balance SheetNonmajor Governmental Funds by Fund TypeJune 30, 2005 (In thousands)
Nowmwjor Nonmjor TotalSpecial Nonmajor Capital Nonmajor
ROVuO Debt Service Pje Gove ktalFunds Funds Fn Funds
ASSETSCash and cash equivalents $ 6,325 $ 1,200 $ 7,331 $ 14,856Investments 35,825 6,737 42,279 84,841Accounts receivable, net 71 40 111Accrued interest receivable 309 346 380 1,035Notes receivable 22,621 9,183 31,804Interfund receivable 83 12,062 12,145Due from other governments 11,188 336 11,524Land held for resale, net 9,170 18,696 27,866Prepaids and other assets 709 72 1,033 1,814Restricted cash and cash equivalents 3,600 12,017 17,159 32,776Restricted investments 17,121 17,121
Total assets $89,901 $37,829 $108,163 $235,893
IJABUITrS AND FUND BALANCESLiabilities:
Accounts payable $ 5,795 $ 1,428 $ 4,174 $ 11,397Wages Payable 192 84 276Deposits 226 757 983Interfund payable 328 26,684 27,012Deferred liabilities 32,469 13,040 45,509
Total liabilities 39,010 1,428 44,739 85,177
Fund balances:Reserved for noncurrent interfund receivable 83 11,933 12,016Reserved for debt service 34,872 34,872Reserved for land held for resale 9,170 18,696 27,866Reserved for prepaids and other assets 709 72 1,033 1,814Unreserved - designated for debt service 1,457 1,457Unreserved - designated for capital projects 14,974 36,497 51,471Unreserved - undesignated 25,955 (4,735) 21,220
Total fund balances 50,891 36,401 63,424 150,716Total liabilities and fund balances $89,901 $37,829 S108,163 $235,893
65

CITY OF ANAhBEIM
Combining Statement of Revenues, Expenditures and Changesin Fund Balances - Nonmajor Governmental Funds by Fund TypeYear Ended June 30, 2005 (in thousands)
No:ar Nonmajor TotalSpecial Nonajor CaRital Nonmajor
RGVwuc Debt eiviomm talFunds Funds PFuds Funds
Revenues:
Property taxes $10,326 $28,745 $ 39,071Licenses, fees and permits 1,301 $ 60 1,361Intergovernmental revenues 38,288 8 524 38,820Use of money and property 1,394 1,325 3,489 6,208Other 2,259 1,891 4,150
Total revenues 53,568 30,078 5,964 89,610
Expenditures:Current:
City Attorney 120 120Police 3,794 14 3,808Fire 422 422Community Development 9,352 5,609 13,409 28,370Planning 1,185 104 1,289Public Works 6,188 451 6,639Community Services 932 297 1,229Convention, Sports and Entertainment 173 173
Capital outlay 22,663 17,009 39,672Debt service:
Principal retirement 524 9,099 305 9,928Interest and fiscal agent charges 107 37,431 1,078 38,616
Total expenditures 45,287 52,139 32,840 130,266
Excess (deficiency) of revenues over (under) expenditures 8,281 (22,061) (26,876) (40,656)
Other financing sources (uses):Transfers in 2,105 33,115 36,972 72,192Transfers out (8,758) (24,294) (6,266) (39,318)Issuance of debt 7,164 7,164
Total other financing sources (uses) (6,653) 8,821 37,870 40,038
Net change in fund balances 1,628 (13,240) 10,994 (618)
Fund balances at beginning of year 49,263 49,641 52,430 151,334Fund balances at end of year $50,891 $36,401 $63,424 $150,716
66

CITY OF ANAHEIM
Combining Balance Sheet
Nonmajor Special Revenue FundsJune 30, 2005 (in thousands)
GaS Tax Comm"Any Communty Sewer andand Wozk-rce Dewlopmont Szvicas Storm Dain
Roads Dewlopmeat Block Gankt Facilitfis ConstructionASSETSCash and cash equivalents $ 1,424 $ 4 $1,168 S 446Investments 8,192 $ 1 23 6,803 2,597Accounts receivable, net 3 2 5Accrued interest receivable 66 6 58 27Notes receivable 4,016Interfund receivableDue from other governments 8,703 296 74 483Land held for resale, netPrepaids and other assets 139 11 52Restricted cash and cash equivalents
Total assets $18,527 $ 310 $4,128 $8,564 $3,070
LIABIuTIES AND FUND BALANCESLiabilities:
Accounts payable $ 3,393 $ 85 $ 104 $ 339 S 78Wages payable 64 32 8 7 6Deposits 1Interfund payable 129 199Deferred liabilities 7,262 247 4,068 299
Total liabilities 10,719 493 4,180 845 84
Fund balances (deficits):Reserved for noncurrent interfund receivableReserved for land held for resaleReserved for prepaids and other assets 139 11 52Unreserved - designated for capital projectsUnreserved - undesignated 7,669 (194) (52) 7,667 2,986
Total fund balances (deficits) 7,808 (183) (52) 7,719 2,986Total liabilities and fund balances $18,527 $ 310 $4,128 $8,564 $3,070
(continued) 67

CITY OF ANAHEIM
Combining Balance SheetNonmajor Special Revenue FundsJune 30, 2005 (In thousands) (continued)
AnaheimResort Narcotic RedewlcpMznt
Maiznisnance Asset HousMingGrants District Forfeitue Set-Aside Total
ASSETSCash and cash equivalents $ 194 $ 806 $ 481 $ 1,802 $ 6,325Investments 417 4,632 2,751 10,409 35,825Accounts receivable, net 23 38 71Accrued interest receivable 6 43 29 74 309Notes receivable 18,605 22,621Interfund receivable 83 83Due from other governments 1,521 31 80 11,188Land held for resale, net 9,170 9,170Prepaids and other assets 503 4 709Restricted cash and cash equivalents 3,600 3,600
Total assets $2,641 $5,535 $3,261 $43,865 $89,901
LIABIITIES AND FUND BALANCESLiabilities:
Accounts payable $ 861 $ 149 $ 17 $ 769 $ 5,795Wages payable 21 13 6 35 192Deposits 225 226Interfund payable 328Deferred liabilities 1,988 18,605 32,469
Total liabilities 2,870 162 $ 23 19,634 39,010
Fund balances (deficits):Reserved for noncurrent interfund receivable 83 83Reserved for land held for resale 9,170 9,170Reserved for prepaids and other assets 503 4 709Unreserved - designated for capital projects 14,974 14,974Unreserved - undesignated (732) 5,373 3,238 25,955
Total fund balances (deficits) (229) 5,373 3,238 24,231 50,891Total liabilities and fund balances $2,641 $5,535 $3,261 $43,865 $89,901
68

CITY OF ANAHEIM
Combining Statement of Revenues, Expenditures and Changesin Fund Balances (Deficits) - Nonmajor Special Revenue FundsYear Ended June 30, 2005 (in thousands)
Gas Tax Commuiommunmmht S r andand Workorce opmct Sovc Storm Drai
Roads DowlopneatBlock rat FadIlities ConstructionRevenues:
Property taxesLicenses, fees and permits $ 130 $1,080 $ 91Intergovernmental revenues 22,957 $2,389 $4,627 1,485 419Use of money and property 81 138 202 81Other 176 749
Total revenues 23,344 2,389 5,514 2,767 591
Expenditures:Current
City Attorney 120Police 1,700FireCommunity Development 2,657 1,542Planning 1,185Public Works 1,901 331Community Services 591 237
Capital outlay 16,222 1,456 483Debt service:
Principal retirement 34Interest and fiscal agent charges 20
Total expenditures 18,123 2,657 5,138 1,747 814
Excess (deficiency) of revenuesover (under) expenditures 5,221 (268) 376 1,020 (223)
Other financing sources (uses):Transfers in 55Transfers out (4,649) (428)
Total other financing sources (uses) (4,594) _(428)
Net change in fund balances 627 (268) (52) 1,020 (223)
Fund balances at beginning of year 7,181 85 6,699 3,209Fund balances (deficits) at end of year $ 7,808 $ (183) $ (52) $7,719 $2,986
(confined) 669

CITY OF ANAHEIM
Combining Statement of Revenues, Expenditures and Changesin Fund Balances (Deficits) - Nonmajor Special Revenue FundsYear Ended June 30,2005 (in thousands) (continued)
AnaheimResort Narcotic Roed lomn
M t nAsset EGrant District Foreitum Set-Askc Total
Revenues:Property taxes $3,329 $ 6,997 $10,326Licenses, fees and permits 1,301Intergovernmental revenues $ 5,114 $1,297 38,288Use of money and property 27 68 78 719 1,394Other 2 4 1,328 2,259
Total revenues 5,143 3,401 1,375 9,044 53,568
Expenditures:Current:
City Attorney 120Police 1,643 451 3,794Fire 422 422Community Development 5,153 9,352Planning 1,185Public Works 23 3,933 6,188Community Services 104 932
Capital outlay 3,976 499 16 11 22,663Debt service:
Principal retirement 490 524Interest and fiscal agent charges 87 107
Total expenditures 6,168 4,432 1,044 5,164 45,287
Excess (deficiency) of revenuesover (under) expenditures (1,025) (1,031) 331 3,880 8,281
Other financing sources (uses):Transfers in 200 1,850 2,105Transfers out (290) (3,391) (8,758)
Total other financing sources (uses) (290) 200 (1,541) (6,653)
net change in fund balances (1,315) (831) 331 2,339 1,628
Fund balances at beginning of year 1,086 6,204 2,907 21,892 49,263Fund balance (deficits) at end of year $(229) $5,373 $3,238 $24,231 $50,891
70

CITY OF ANAHEIM
Combining Balance SheetNonmajor Debt Service FundsJune 30,2005 (In thousands)
Municipal Redwlopmunt Certficates of Anaheim RortImpmwenbtm Agenc Participation ImprMM taB Total
ASSETSCash and cash equivalents S 1,200 $ 1,200Investments 6,737 6,737Accrued interest receivable $ 4 293 $ 49 346Due from other governments 16 320 336Prepaids and other assets 72 72Restricted cash and cash equivalents 95 518 181 $11,223 12,017Restricted investments 552 2,306 5,292 8,971 17,121
Total assets $667 $11,446 $5,522 $20,194 $37,829
LIABUIBS AND FUND BALANCESLiabilities:
Accounts payable $ 1,423 $ 5 $ 1,428Total liabilities 1,423 5 1,428
Fund balances:Reserved for prepaids and other assets 72 72Reserved for debt service $667 8,494 5,517 $20,194 34,872Unreserved - designated for debt service 1,457 1,457
Total fund balances 667 10,023 5,517 20,194 36,401Total liabilities and fund balances $667 $11,446 $5,522 $20,194 $37,829
71

CITY OF ANAHEIM
Combining Statement of Revenues, Expenditures and Changesin Fund Balances - Nonmajor Debt Service FundsYear Ended June 30, 2005 (n thousands)
Munidpd Redewvlopmnnt Certifiae of Anaheim RaoaImpwwunm Agcopy Partiipadton Impruvemn Total
Revenues:Property taxes $758 $ 27,987 $ 28,745Intergovernmental revenues 8 8Use of money and property 11 871 S 347 $ 96 1,325
Total revenues 777 28,858 347 96 30,078
Expenditures:Current
Community Development 5,609 5,609Debt service:
Principal retirement 435 3,353 2,721 2,590 9,099Interest and fiscal agent charges 302 12,452 1,906 22,771 37,431
Total expenditures 737 21,414 4,627 25,361 52,139
Excess (deficiency) of revenues over (under) expenditures 40 7,444 (4,280) (25,265) (22,061)
Other financing sources (uses):Transfers in 2,763 4,288 26,064 33,115Transfers out (24,294) (24,294)
Total other financing sources (uses) (21,531) 4,288 26,064 8,821
Net change in fund balances 40 (14,087) 8 799 (13,240)
Fund balances at beginning of year 627 24,110 5,509 19,395 49,641Fund balances at end of year $667 $10,023 $ 5,517 $ 20,194 $ 36,401
72

CITY OF ANAHEIM
Combining Balance SheetNonmajor Capital Projects FundsJune 30, 2005 (In thousands)
Mello-Roos Radevelopmant Other capital Anaheim ReortPjeocta Agmwy Impsomnenta Implummenta Total
ASSETSCash and cash equivalents $ 1,924 $ 3,866 $ 1,541 $ 7,331Investments 11,193 22,228 8,858 42,279Accounts receivable, net 40 40Accrued interest receivable 62 215 103 380Notes receivable 9,183 9,183Interfund receivable 2,639 9,423 12,062Land held for resale, net 18,696 18,696Prepaids and other assets 1,001 32 1,033Restricted cash and cash equivalents 9,671 5,980 1,508 17,159
Total assets $54,409 $41,744 $12,010 $108,163
LIABILITIES AND FUND BALANCESLiabilities:
Accounts payable $ 2,639 $ 1,469 $ 66 $ 4,174Wages payable 68 12 4 84Deposits 757 757Interfund payable 24,290 2,394 26,684Deferred liabilities 9,183 3,857 13,040
Total liabilities 36,937 7,732 70 44,739
Fund balances:Reserved for noncurrent interfund receivable 2,510 9,423 11,933Reserved for land held for resale 18,696 18,696Reserved for prepaids and other assets 1,001 32 1,033Unreserved - designated for capital projects 24,557 11,940 36,497Unreserved - undesignated (4,735) (4,735)
Total fund balances 17,472 34,012 11,940 63,424Total liabilities and fund balances $54,409 $41,744 $12,010 $108,163
73

CITY OF ANAIEIM
Combining Statement of Revenues, Expenditures and Changesin Fund Balances - Nonmajor Capital Projects FundsYear Ended June 30, 2005 (in thousd)
Moflo-Row RedOlopma= Other Capital Anahaem ResortProjeds Agency Impowments Impwanents Total
Revenues:Licenses, fees and permits $ 25 S 35 $ 60Intergovernmental revenues 524 524Use of money and property $ 2,652 544 293 3,489Other 1,720 112 59 1,891
Total revenues 4,372 1,205 387 5,964
Expenditures:Current:
Police 14 14Community Development 13,409 13,409Planning 104 104Public Works 124 327 451Community Services $57 240 297Convention, Sports and Entertainment 173 173
Capital outlay 17 8,503 8,095 394 17,009Debt service:
Principal retirement 305 305Interest and fiscal agent charges 580 498 1,078
Total expenditures 74 22,492 9,276 998 32,840
Deficiency of revenues under expenditures (74) (18,120) (8,071) (611) (26,876)
Other fimancing sources (uses):Transfers in 25,891 11,081 36,972Transfers out (6,245) (21) (6,266)Issuance of debt 1,875 5,289 7,164
Total other financing sources (uses) 21,521 16,370 (21) 37,870
Net change in fund balances (74) 3,401 8,299 (632) 10,994
Fund balances at beginning of year 74 14,071 25,713 12,572 52,430Fund balances at end of year $ - $17,472 $34,012 $11,940 $63,424
74


Internal Service FundsINTERNAL SERVICE FUNDS are used to account for the financing of centralized services to City departments on a cost-reimbursement basis (including depreciation).GENERAL BENEFITS AND INSURANCE FUND - Established to account for employee compensated absences, retirement and health benefits, and self-insurance programs.MOTORIZED EQUIPMENT FUND - Established to account for motorized equipment used by City departments.DUPLICATING AND PRINTING FUND - Established to account for central duplicating, printing and mailing services provided to City departments.INFORMATION SERVICES FUND - Established to account for data processing services to City departments.OFFICE MAINTENANCE AND EQUIPMENT FUND - Established to account for City office maintenance services and equipment used by City departments.

CITY OF ANAUEIM
Combining Statement of Fund Net AssetsInternal Service FundsJune 30, 2005 (in thousands)
Generd OffieBenefiD Eqplicang Mantenane
and Motorized and Inrmation andInurance Equipment Printing SOMriM Equipment TotalASSETS_
_
Current assets:Cash and cash equivalents S 18,031 $ 1,693 $ 161 S 268 S 768 S 20,921Investments 103,700 9,735 937 1,560 4,476 120,408Accounts receivable, net 510 20 9 539Accrued interest receivable 945 III 9 29 41 1,135Interfwud receivableInventories 632 632Prepaids and other assets _F23__ 19 19
Total current assets 123,186 12,210 1,107 1,866 5,285 143,654Noncurrent assets:
Interfind receivable, less current portion 104 104Restricted cash and cash equivalents _17 17Restricted investments 473 473Unamortized debt issuance costs II 11Capital assets:
Buildings and improvements 3,230 3,373 6,603Equipment 81 39,221 552 6,229 1,687 47,770Construction in progress 6,808 58 6,866Less accumulated depreciation (40) (25,485 (424) (3,127) _,777) (32,853)
Capital assets, net 41 16,966 128 9,910 1,341 28,386Total noncurrent assets 145 17,467 128 9,910 -T9 28,991
Total assets 123,331 29,677 1,23. 5 11,776 6 172,645LIABIIELESmCurrent liabilities:
Accounts payable 1,125 2,903 62 1,035 282 5,407Wages payable 901 77 8 15 70 1,071Interest payable 44 1 1 46Compensated absences 16,222 16,222Self-insurance liability 8,094 8,094Long-term debt 227 52 168 447Post retirement employment benefits 7,857 7,857Unearned revenues 5%9 5%
Total current liabilities 34,795 3,251 123 1,219 352 39,740Noncurrent liabilities:
Self-insurance liability, less current portion 21,826 21,826Long-term debt, less current portion 1,620 39 1,659Post retirement employment benefits, less current portion 66,192 66,192Total noncurrent liabilities 88,018 1,620 39 89,677
Total liabilities 122,813 4,871 162 1,219 352 129,417FUWD NT ASSETSInvested in capital assets, net of related debt 41 15,130 37 9,742 1,341 26,291Restrict for debt service 446 446Unrestricted 477 9,230 1,036 815 4,933 16,491
Total find net assets r_518 $ 24,806 $1,073 $10,557 $'6,274 $ 43,22875

CITY OF ANAHEIM
Combining Statement of Revenues, Expenses and Changesin Fund Net Assets - Internal Service FundsYear Ended June 30, 2005 (in thousands)
Genral OfficeBenefits Duplicing Maintenance
and Motorizod and Information andInsurance Equipment Ptinting Services Equipmont Total
Operating revenues:Charges for services $84,357 $ 9,119 $1,739 $ 9,978 $7,782 $112,975Other 2 4 9 15
Total operating revenues 84,359 9,119 1,739 9,982 7,791 112,990
Operating expenses:Salaries and wages 2,116 3,282 336 409 2,450 8,593Maintenance and operations 2,201 4,004 1,322 8,595 4,947 21,069Insurance premiums and claims 11,691 11,691Compensated absences and other benefits 73,592 73,592Depreciation 2 2,565 83 1,006 132 3,788
Total operating expenses 89,602 9,851 1,741 10,010 7,529 118,733
Operating income (loss) (5,243) (732) (2) (28) 262 (5,743)
Nonoperating income (expenses):Interest income 2,615 327 27 76 122 3,167Interest expense (111) (15) (23) (149)Gain (loss) from disposal of capital assets 89 (2) 87
Total nonoperating income 2,615 305 10 53 122 3,105
Income (loss) before capital contributions (2,628) (427) 8 25 384 (2,638)
Capital contributions 2,183 2,183
Change in fund net assets (2,628) (427) 8 2,208 384 (455)
Fund net assets at beginning of year 3,146 25,233 1,065 8,349 5,890 43,683Fund net assets at end of year $ 518 $24,806 $1,073 $10,557 $6,274 $ 43,228
76

CITY OF ANABEIM
Combining Statement of Cash FlowsInternal Service FundsYear Ended June 30, 2005 (in thousands)
Cash flows fiom opeating activities:Receipts from interfund services providedPayments to suppliersPayments for salaries and wages to employeesPayments for interfimd services usedPayments for insurance premiums and claimsPayments for compensated absences and other benefitsOther receipts (payments)
Net cash provided by operating activities
Cash flows fom. noncapital finaning activities:Payment of interfimd balances
Net cash used in noncapital financing activities
Cash flows from capital and related financin activities:Proceeds from sale of capital assetsCapital purchasesPrincipal payments of long-term debtInterest payments
Net cash used in capital and related financing activities
Cash flows from ietng activitsPurchase of investment securitiesProceeds from sale and maturity of investment securitiesInterest received
Net cash provided by investing activities
Increase (decrease) in cash and cash equivalentsCash and cash equivalents at beginning of the yearCash and cash equivalents at end of the year
GeneralBenefits
andInsurance
$ 84,357(1,593)(1,799)
(855)(7,792)
(66,791)17
5,544
368368
DaplicatingsMotorized andEqulpment Printing
OffineMainfenance
Informiation andServics -Equipiaxat Total
S 9,119(1,062)(3,280)
(357)
(120)4,300
$1,739(944)(336)(440)
19
$ 9,978(8,541)
(404)(226)
4811
S 7,782 $ 112,975(4,504) (16,644)(2,434) (8,253)
(454) (2,332)(7,792)
(66,791)10 (89)
400 11,074
368368
105(318) (10,250)
(485))(153
(318) (10,783)
105(42) (5,831)
(213)(42)___ (113)(42) (6,052)
(270,771)267,497
3,869595
6,46511,566
S 18,031
(24,636)26,320
4492,133
3811,329
S 1,710
(18)(86)
__(15)(119)
(2,269)2,386
26143
43
118S 161
(4,041)(186)
(4,252)
(893)3,972
1093,188
(253)521
$ 268
(11,340)11,398
118176
258510
$ 768
(309,909)311,573
4,5716,235
6,89414,044
$ 20,938
(contnued) 77

MY OF ANAHEIM
Combining Statement of Cash FlowsInternal Service FundsYear Ended June 30, 2005 (in thousands) (continued)
Geneal officeBenefits Diqfficating Maintenance
and Motorized and Information andInsurance Equipment Printing Services Equipment Total
ReconUiliaon of operating inome (loss) to net cashprovided by operating •a•tivitimOperating income (loss) S(5,243) S(732) $ (2) $(28) $262 S(5,743)Adjustment to reconcile operating income (loss)
to net cash provided by (used in) operating activities:Depreciation 2 2,565 83 1,006 132 3,788
Changes in assets and liabilities:Accounts receivable 119 (20) (9) 1 91Inventories (100) .(100)Prepaids and other assets 30 41 71Accounts payable (126) 2,544 (62) (163) (11) 2,182Wages payable 317 2 5 16 340Unearned revenues 31 31Compensated absences 1,292 1,292Self-insurance liability 3,538 3,538Post retirement employment benefits 5,584 5,584
Total adjustments 10,787 5,032 21 839 138 16,817Net cash provided by operating activities S 5,544 $4,300 $ 19 $ 811 $400 $11,074
Schedule of noncash investing& capital and noncapital fiancin activities:Decrease in fair value of investments S(1,348) $ (128) $(1,476)Transfers in of capital assets $2,183 2,183
Reconciliation of cmah and cash equivalents:Cash and cash equivalents $18,031 $1,693 $161 $ 268 $768 $20,921Restricted cash and cash equivalents 17 17
Total cash and cash equivalents $18,031 $1,710 $161 S 268 $768 $20,938
78


CITY OF ANAHEIM
Schedule of Revenues, Expenditures and Changesin Fund Balances (Deficits) - Budget and Budgetary Basis Actual - Nonmajor Special Revenue FundsYear Ended June 30, 2005 (In thousands)
Gu Tax Workfoion Commuinit Developmentand Roads Development Block Gant
Budget Actual Budget Budgt AtualRevenues:
Property taxesLicenses, fees and permits S 200 $ 130Intergovernmental revenues 55,596 22,957 $3,074 $2,389 $10,092 $4,627Use of money and property 82 81 68 138Other 139 176 360 749
Total revenues 56,017 23,344 3,074 2,389 10,520 5,514
Expenditures:City Attorney 120 120Police 1,700 1,700FireCommunity Development 3,025 2,657 5,492 1,542Planning 1,192 1,185Public Works 55,357 18,123 643Community Services 816 591
Total expenditures 55,357 18,123 3,025 2,657 9,963 5,138
Excess (deficiency) of revenues over (under) expenditures 660 5,221 49 (268) 557 376
Other financing sources (uses):Transfers in 55 55Transfers out (4,649) (4,649) (469) (428)Sales on capital assets
Total other financing sources (uses) (4,594) (4,594) (469) (428)
Net change in fund balances (3,934) 627 49 (268) 88 (52)
Fund balances at beginning of year 7,181 7,181 85 85Fund balances (deficits) at end of year $ 3,247 7,808 $ 134 (183) $ 88 (52)
Adjustments to reconcile to GAAP:Purchases of land held for resaleDecline in value of land held for resaleProceeds on sale of land held for resaleGain on sale of land held for resale
Ending fund balance (deficits)-GAAP basis $ 7,808 $ (183) $ (52)
(continued) 79

CITY OF ANABEIM
Schedule of Revenues, Expenditures and Changesin Fund Balances (Deficits) - Budget and Budgetary Basis Actual - Nonmajor Special Revenue FundsYear Ended June 30, 2005 (In thou d) (continued)
Community Sewr and Storm DrainSurvos Facilitim Constuction Grants
Budget ActUa Budget Actual Budget ActualRevenues:
Property taxesLicenses, fees and permits $ 1,413 $1,080 $ 240 $ 91Intergovernmental revenues 8,025 1,485 419 $29,124 $5,114Use of money and property 61 202 65 81 2 27Other 2
Total revenues 9,499 2,767 305 591 29,126 5,143
Expenditures:City AttorneyPolice 21,215 3,997Fire 753 631Community Development 1,000P•lningPublic Works 6,502 422 1,208 814 5,705 1,436Community Services 8,737 1,325 1,014 104
Total expenditures 15,239 1,747 1,208 814 29,687 6,168
Excess (deficiency) of revenues over (under) expenditures (5,740) 1,020 (903) (223) (561) (1,025)
Other financing sources (uses):Transfers inTransfers out (245) (290)Sales on capital assets 1,400
Total other financing sources (uses) 1,400 (245) (290)
Net change in fund balances (4,340) 1,020 (903) (223) (806) (1,315)
Fund balances at beginning of year 6,699 6,699 3,209 3,209 1,086 1,086Fund balances (deficits) at end of year $ 2,359 7,719 $2,306 2,986 $ 280 (229)
Adjustments to reconcile to GAAP:Purchase of land held for resaleDecline in value of land held for resaleProceeds on sale of land held for resaleGain on sale of land held for resale
Ending fund balance (deficits)-GAAP basis (continued) $7,719 $2,986 $ (229)80

CIMY OF ANAHEIM
Schedule of Revenues, Expenditures and Changesin Fund Balances (Deficits) - Budget and Budgetary Basis Actual - Nonmajor Special Revenue FundsYear Ended June 30, 2005 (in thousands) (continued)
Anahalm ResorMaintenance District
Budget Actual
$3,417 $ 3,329
NarcoAicAneB orMt Acu
Budget Actua
RedevelopmentHousing Set-Aside
$Budgt Actual
$ 6,767 $ 6,997Revenues:
Property taxesLicenses, fees and permitsIntergovernmental revenuesUse of money and propertyOther
Total revenues
Expenditures:City AttorneyPoliceFireCommunity DevelopmentPlanningPublic WorksCommunity Services
Total expenditures
Excess (deficiency) of revenues over (under) expenditures
Other financing sources (uses):Transfers inTransfers outSale of capital assets
Total other financing sources (uses)
Net change in fund balances
Fund balances at beginning of yearFund balances (deficits) at end of year
Adjustments to reconcile to GAAP:Purchase of land held for resaleDecline in value of land held for resaleProceeds on sale of land held for resaleGain on sale of land held for resale
Ending fund balance (deficits)-GAAP basis
1674
3,588
684
3,401
$1,328
1,328
$1,29778 483
11,4001,375 18,650
7194,598
12,314
1,738 1,044
6,552
6,552
(2,964)
4,432
4,432
(1,031)
1,738
(410)
1,044
331
200 200
18,532
18,532
118
303(2,618)
(2,315)
(2,197)
21,892$19,695
200
(2,764)
6,204$ 3,440
200
(831)
6,2045,373
(410)
2,907$2,497
331
2,9073,238
7,462
7,462
4,852
1,850
(3,391)
(1,541)
3,311
21,89225,203
3,035(737)
(3,298)28
$24,231$ 5,373 $3,238
81

CITY OF ANAHEIM
Schedule of Revenues, Expenditures and Changesin Fund Balances - Budget and Actual - All Debt Service FundsYear Ended June 30, 2005 (in thousands)
MunicipalImpBge
Budget Ata
RedvelopmvatAgean
Budget Acua
Certificaot ofPardcipaton
Budget ARevenues:
Property taxesIntergovernmental revenuesUse of money and property
Total revenues
$739
739
$7588
11777
$ 27,070
73927,809
$27,987
87128,858
Anaktm ResortImprovwnent
Budget Actual
$ 9696
Expenditures:FinancePoliceCommunity DevelopmentPublic WorksConvention, Sports and Entertainment
Total expenditures
739
739
737
737
40Excess (deficiency) of revenuesover (under) expenditures
Other financing sources (uses):Transfers inTransfers out
Total other financing sources (uses)
Net change in fund balances
Fund balances at beginning of yearFund balances at end of year
21,916
21,916
5,893
2,891(10,759)(7,868)
(1,975)
24,110$ 22,135
21,414
21,414
7,444
2,763(24,294)(21,531)
(14,087)
24,110$10,023
$ 2,031269627
1,7004,627
(4,627)
4,627
4,627
5,509$ 5,509
$ 347347
2,031269627
1,7004,627
(4,280)
4,288
4,288
8
5,509$ 5,517
25,365 25,361
$ 25,365
(25,365)
24,946
24,946
(419)
19,395$18,976
(25,265)
26,064
26,064
799
19,395$ 20,194
25,361
40
627$627
627S667
82

CITY OF ANAHEIM
Schedule of Revenues, Expenditures and Changesin Fund Balances - Budget and Budgetary Basis Actual - All Capital Projects FundsYear Ended June 30, 2005 (in thousands)
M6U1-RoosB Pud octs
Budget Actual
RadeviuopmcntAgency
-Budget Actual
Othe capitalImplummenta
Budget AtaRevenues:
Licenses, fees and permitsIntergovernmental revenuesUse of money and propertyOther
Total revenues
Expenditures:PoliceCommunity DevelopmentPlanningPublic WorksCommunity ServicesConvention, Sports and Entertainment
Total expenditures
Deficiency of revenuesunder expenditures
Other financing sources (uses):Transfers inTransfers outIssuance of debt
Total other financing sources (uses)
Net change in fund balances
Fund balances at beginning of yearFund balances at end of year
Adjustments to reconcile to GAAP:Purchases of land held for resaleDecline in value of land held for resaleProceeds on sale of land held for resaleLoss on sale of land held for resale
Ending fund balance-GAAP basis
$ 1,8436,9008,743
37,624
$ 2,6522,0234,675
18,891
$ 80039525
1,220
5,300815
$ 74 $ 74
37,624
(28,881)
21,2713,672
18,891 31,058
(14,216) (29,838)
$ 25524544112
1,205
964803
7,191318
9,276
(8,071)
11,081
5,28916,370
8,299
25,71334,012
(74) (74)
Anaheims ResortImprovements
Budgt Actual
$ 35
29359
387
$ 125751
8411,717
(1,717)
(1,717)
12,572$10,855
13,857
(74)
74$-
(74)
74
13,857
(15,024)
14,071$ (953)
25,891(6,245)1,875
21,521
7,305
14,07121,376
1,426(5,024)
(303)
$17,472
9,523(2,500)7,789
14,812
(15,026)
25,713$10,687
104721
173998
(611)
(21)
(21)
(632)
12,57211,940
$11,940$34,012
83

(This page left blank intentionally)
84

CITY OF ANAHEIM
Capital Assets Used in the Operation of Governmental FundsSchedule by SourceJune 30,2005 (in thousands)(With comparative totals for June 30, 2004)
2005 2004Governmental funds capital assets:
Land $ 495,006 $ 490,917Buildings, structures and improvements 214,399 212,820Machinery and equipment 31,298 26,529Infrastructure 713,165 705,956Construction in progress 39,239 16,013
Total governmental funds capital assets $1,493,107 $1,452,235
Investments in governmental funds capital assets by source:General Fund $ 50,087 $ 50,566Special revenue funds 1,153,451 1,133,043Capital projects funds 154,400 138,129Contributed capital 135,169 130,497
Total investments in governmental funds capital assets by source $1,493,107 $1,452,235
85

CITY OF ANAHEIM
Capital Assets Used in the Operation of Governmental FundsSchedule by Function and ActivityJune 30, 2005 (In thousands)
General government:City AdministrationCity AttorneyCity ClerkHuman ResourcesFinanceCity TreasurerGeneral government buildings
Total general government
Public safety:PoliceFire
Total public safety
Community Development
Planning
Public Works
Community Services
Convention, Sports and Entertainment
Total governmental funds capital assets
Buldinaa MachineStructunn and and
Land Impmowents Equipment
$ 142250
617809
Const ion,in Total
Ianfrestructum Progms 2005
$ 142250
617809
14,99715,501
$ 1,1201,120
2,5773,0865,663
43,551
396,764
24,549
23,359
$495,006
$ 13,871 613,871 510
23,0278,377
31,404
36,985
1,962
39,858
90,319
$214,399
11,6321,877
13,509
209
215
3,751
3,588
9,516
$31,298
$713,165
S 97470
1,044
7,213
26,143
4,748
91
$39,239
38,21013,41051,620
87,958
215
1,141,785
72,743
123,285
$1,493,107$713,165
86

CITY OF ANAHEIM
Capital Assets Used in the Operation of Governmental FundsSchedule of Changes by Function and ActivityYear Ended June 30, 2005 (in thousands)
General governmentCity AdministrationCity AttorneyCity ClerkHuman ResourcesFinanceCity TreasurerGeneral government buildings
Total general government
Public safety:PoliceFire
Total public safety
Community Development
Planning
Public Works
Community Services
Convention, Sports and Entertainment
Total governmental funds capital assets
Bala=ce atJuly , 2004
$ 99250
617809
14,99715,458
37,50113,51751,018
79,516
289
1,117,768
67,582
120,604
$1,452,235
Addios
S 43
RetawmwAt andtlansfem not
Balane atJune 30,2005
$ 142250
617809
14,99715,50143
1,297393
1,690
8,473
28,191
6,034
3,817
$48,248
$ 588500
1,088
31
74
4,174
873
1,136
$ 7,376
38,21013,41051,620
87,958
215
1,141,785
72,743
123,285
$1,493,107
87

CITY OF ANAHEIM
Statement of Changes in Fiduciary Assets and LiabilitiesAgency Fund - Mello-RoosYear Ended June 30, 2005 (i thousands)
Beginning EndingBalane Additioaw Deduction Balawe
ASSETSRestricted cash and cash equivalents $2,507 $2,839 $(1,792) $3,554Due from other governments 47 2,830 (2,834) 43
Total assets $2,554 $5,669 $(4,626) $3,597
LIABuxT1BSDue to bond holders $2,554 $5,669 $(4,626) $3,597
88


Statistical SectionThe Statistical Section is included to provide detailed data on the physical, economic, social and political characteristics of the reporting government. It is intended toprovide the user with a broader and more complete understanding of the government and its financial affairs than is possible from the basic financial statements andsupplementary information included in the Financial Section.

CITY OF ANABEIM
General Governmental Expenditures by FunctionLast Ten Fiscal Years (In thousands)(Unaudited)
Fiscal General Public CommunityYear Govonument Safety Development
Convention,Public CommMui Public Sports andWorks Services Utilities Entertainment
1996199719981999200020012002200320042005
$13,5409,011
18,23413,51212,39412,92612,40312,82311,37012,276
$ 83,50682,60885,00988,51991,26895,967
102,925110,202110,633130,711
$52,82642,37748,05845,46943,84867,49372,49291,93387,77883,384
Plannin
$ 6,3826,9967,7029,0969,471
10,14510,46310,28511,90412,313
$ 29,83649,11776,404
129,406126,70072,96437,37721,42525,22422,248
$13,79119,82220,91222,52622,94924,29626,01125,93825,20325,724
$1,6993,0393,5323,5304,2862,6122,6511,8111,5661,557
$ 3344,6056,4826,3226,2466,7386,0034,6775,3535,140
capital Outlaand DebtService
$ 27,21736,87693,475
125,790107,41975,91981,18887,23180,21690,116
Total
$229,131254,451359,808444,170424,581369,060351,513366,325359,247383,469
NOTE: Includes all governmental fund typs.
Source: City Finance Department
General Governmental Revenues by SourceLast Ten Fiscal Years (in thousands)
(Unaudited)
TransientFiscal Property Sales and OccupancyYear Taxes Use Taxes Taxes
19%199719981999200020012002200320042005
$34,85438,00039,49241,13149,47853,86053,01857,15160,56381,949
$37,67640,06842,21443,21046,91550,73352,36854,06655,40959,976
$44,70344,99244,76745,15546,18358,11257,78056,19963,26867,141
OtherTaxes
$4,7425,2475,4925,7555,8316,3656,4606,5707,0957,542
Feew andPermits
$11,85811,76415,67723,11016,29816,29915,80615,73115,57818,749
Race,Forfeits and
Penlties
$1,5831,5181,5562,8073,1873,1182,7692,6732,8123,454
Intel-governmental
$ 61,91465,08878,61774,22582,18685,500
104,434107,973108,673101,447
Charg•s for MiscellaneousServices RDveu
$14,20821,12711,51510,85110,57511,71214,29914,56915,24112,130
$13,82516,25835,91230,70036,09921,35018,53215,79011,89815,287
Total
$225,363244,062275,242276,944296,752307,049325,466330,722340,537367,675
NOTE: Includes all governmental fund types.
Source: City Finance Department
89

CITY OF ANAHEIM
Assessed Values of All City PropertyLast Ten Fiscal Years (In thousands)(Unaudited)
PercentFiscal Common AwsedFu IncraseYear Pnlpexty Public Utility Unecured Madket Valuation (eea)
1996 $13,467,399 $12,304 $ 868,647 $14,348,350 (1)%1997 13,506,138 13,557 816,859 14,336,554 -1998 13,690,399 15,235 937,993 14,643,627 21999 14,216,632 13,546 1,040,586 15,270,764 42000 15,025,480 15,623 969,070 16,010,173 52001 16,348,803 13,432 1,141,173 17,503,408 92002 18,376,992 12,050 1,086,486 19,475,528 112003 20,136,261 9,503 2,641,697 22,787,461 172004 20,816,660 9,572 1,287,967 22,114,199 (3)2005 22,278,532 9,971 1,162,358 23,450,861 6
Source: Orange County Assessor's Office
Current Tax Levies and Tax CollectionsLast Ten Fiscal Years (in thousands)
(Unaudited)
Total Total Percent ofFiscal Current Current LevyYear Levy Collection Collected
1996 $19,471 $19,379 99.5%1997 19,291 18,905 98.01998 19,854 20,338 102.41999 19,333 19,850 102.72000 24,915 24,690 99.12001 26,860 26,661 99.32002 29,203 28,690 98.22003 32,856 32,554 99.12004 32,326 31,923 98.82005 30,868 49,915 161.7
NOTE: The increase in fiscal year 2000 and subsequent years is primarily due to the formation of the Anaheimn Resort Maintenance District.
The increase in Total Current Collection in fiscal year 2005 is due to the effect of shifting revenue from the VLF category to the property tax category, part of the State ofCalifornia 2004 budget act
Sources: City Finance Department and Orange County Assessors Office 90

CITY OF ANAHEIM
Property Tax Rates - All Direct and Overlapping GovernmentsLast Ten Fiscal Years (Per $100 Assessed Valuation)
(Unaudited)
FisnalYear
1996199719981999200020012002200320042005
Basic County,city, school
Levy
1.00001.00001.00001.00001.00001.00001.00001.00001.00001.0000
City
0.00410.00490.00470.00450.00380.00380.00350.00290.00350.0030
Orngecounty
0.00010.0001
ElementarySchoolDistrict
0.02850.02500.0264
High North MetropolitanSchool Orange County FloodDistrict Community College Control
0.02570.02370.0277
0.01570.01590.0144
0.0004
WaterDistrict
0.00890.00890.00890.00890.00880.00880.00770.00670.00610.0058
Total
1.01351.01391.01361.01341.01261.01261.01121.07951.07421.0773
NOTE: Based upon a "representative" tax rate area
Source: Orange County Auditor/Controller's Office
Ratio of Annual Debt Service Expenditures forGeneral Bonded Debt to Total General Governmental ExpendituresLast Ten Fiscal Years (in thousds)(Unaudited)
FiscalYear Principal
1996 S2151997 2251998 2451999 2702000 3152001 3302002 3552003 3902004 4002005 435
NOTE: Includes all governmental fund types.
Source: City Finance Department
Interest
$488473456438419396373345322302
Total DebtService
$703698701708734726728735722737
Total GeneralGovernmentalExpenditures
$229,131254,451359,808444,170424,581369,060351,513366,325359,247383,469
Ratio of Debt Service toGeneral Governmental
Expeaditures
0.3%0.30.20.20.20.20.20.20.20.2
91

CITY OF ANAHEIM
Schedule of Direct and Overlapping Bonded Debt (In thousands)
(Unaudited)
9MM11= % Applicable Bonded DebtDIRECTADOVRAPNTAADASSSHT •T
Orang County Teete Plan Obligations 1.359% S 10,342Metropolitan Water District 1.763 7,394North Orange Joint Community College District 28.851 71,185Rawnh Santiago Community College District 15.520 33,012Anaheim Union High School District 70.809 84,127Placentia -Yorba Linda Unified School District 12.109 11,833Anaheim School District 99.805 61,942Magnolia School District 76.167 7,487Other School Districts Various 2,587City of Anaheim 100.000 6,625City of Anaheim Community Facilities Districts 100.000 17,830Orange Unified School District Community Facilities Districts 100.000 9,905
TOTAL DIRECT AND OVERLAPPING TAX AND ASSESSMENT DEBT S 324,269DIRECT AND OVERLAPPING GENERAL FUND OBLIGATION DEBT:
Orange County General Fund Obligations 8.359% S 73,267Orange County Pension Obligations 8.359 9,343Orange County Board of Education Certificates of Participation 8.359 1,663Orange County Transit Authority 8.359 310Orange County Sanitation District Certificates of Participation 11.399 16,224Municipal Water District of Orange County Water Facilities Corporation 0.002 1Yorba Linda County Water District Ctifcates of Participation 1.094 115Orange Unified School District Certificates of Participation 30.457 15,934Placentia-Yorba Linda Unified School District Certificates of Participation 12.109 636Anaheim Union High School District Certificates of Participation 70.809 28,929Fullerton Joint Union High School District Crtificates of Participation 0.297 11Centalia School District Cartificates of Participation 12.436 443Fullerton School District Certificates of Participation 0.074 6City of Anaheim General Fund Obligations 100.000 669,383
TOTAL GROSS DIRECT AND OVERLAPPING GENERAL FUND OBLIGATION DEBT 816,265Less: Orange County Transit Authority (80% self-supporting) 248
City of Anaheim Convention Center, Stadium Inc., and Parking Facilities Certificates of Participation (100% self-supporting) 106,684City of Anaheim Public Financing Authority (100% selfsupporting) 529,522MWDOC Water Facilities Corporation (100% self-supaorting)
TOTAL NET DIRECT AND OVERLAPPING GENERAL FUND OBLIGATION DEBT $ 179,810GROSS COMBINED TOTAL DEBT $1,140,534 (I)NET COMBINED TOTAL DEBT S 504,079
(1) Excludes tax and revenue anticipation notes, enterprise revenue, mortgage revenue, and tax allocation bonds and non-bonded capital lease obligations.
Ratios to 2005 Assessed ValuationrDirect Debt ($6,625) 0.03%Total Direct and Overlapping Tax and Assessment Debt 1.22%
Ratios to AdiusteAlAssssd AValaion
Gross Combined Direct Debt ($676,008) 2.88%Net Combined Direct Debt ($39,801) 0.17%Gross Combined Total Debt 4.86%Net Combined Total Debt 2.15%
State Scdnl Building_ Aid Renayable as of 6/30/051 $092
Source: California Municipal Statistics, Inc.

CITY OF ANAHEIM
Schedule of Debt RatiosLast Ten Fiscal Years (in thousands)
(Unaudited)
FisndYear
1996199719981999200020012002200320042005
Net GeondBonded
Debt
$ 9,5909,3659,1208,8508,5358,2057,8507,4607,0606,625
AmaessedValuation
$14,348,35014,336,55414,643,62715,270,76416,010,17317,503,40819,475,52822,787,46122,114,19923,450,861
Ratlo toAssessedValuation
.07%
.07
.06
.06
.05
.05
.04
.03
.03
.03
Populaidon
293295301306328330335337343345
Net GenadBonded DebtPer Capita
S32.7331.7530.3028.9226.0224.8623.4322.1420.5819.20
Source: City Finance Department
Statement of Legal Debt MariJune 30, 2005 (in thousands)
(Unaudited)
Assessed Valuation
Charter Debt Limit 15% of Assessed ValuationAmount of Debt Applicable to Limit
Legal Debt Margin
Percent of Charter Debt Limit Authorized and Issued
Source: City Finance Department
$23,450,861
$ 3,517,6296,625
$ 3,511,004
.19%
93

CITY OF ANAHEIM
Schedule of Revenue Bond and Certificates of Participation CoverageElectric Utility Fund (In thousands)
(Unaudited)
FiscalYear
1996199719981999200020012002200320042005
Grow
$253,548249,135251,929262,336287,132345,615308,329280,471295,988297,443
Dhvd
$180,594196,242191,306194,012205,699292,395238,124216,841232,050218,562
Net RownueAvailable forDebt Service
$72,95452,89360,62368,32481,43353,22070,20563,63063,93878,881
Debt Service RAquirementaInterest
$12,70413,49017,71618,54315,46215,73114,77915,56614,84015,875
$19,11717,21816,12518,35618,08217,58616,45022,62520,10224,780
Total
$31,82130,70833,84136,89933,54433,31731,22938,19134,94240,655
Coverage
2.31.71.81.92.41.62.21.71.81.9
NOTES: (1) Gross revenue includes operating revenue plus interest income.(2) Direct operating expenses includes operating expenses less depreciation and amortization.
Source: City Public Utilities Department
Schedule of Revenue Bond CoverageWater Utility Fund (In thousands)
(Unaudited)
FiscalYear
1996199719981999200020012002200320042005
GrowRevenue (1)
$37,60338,96637,64040,48943,53943,99543,94443,66944,65944,484
DirectOperating
$24,47124,24022,67026,90030,19326,47931,10329,77535,60233,312
Net RenwueAvailable forDebt Service
$13,13214,72614,97013,58913,34617,51612,84113,8949,057
11,172
Debt Service Requit"mets
Principal
$1,0551,1201,1801,2601,3301,4001,4651,5401,6251,340
Intelet
$2,4402,3792,3132,2342,1662,094
990906819485
Total
$3,4953,4993,4933,4943,4963,4942,4552,4462,4441,825
Coverage
3.84.24.33.93.85.05.25.73.76.1
NOTES: (1) Gross revenue includes operating revenue plus interest income.(2) Direct operating expenses include operating expenses less depreciation and amortization.
Source: City Public Utilities Department94

CITY OF ANAHEIM
Schedule of Revenue Bond and Certificates of Participation CoverageConvention, Sports and Entertainment Venues Fund (n thousands)
(Unaudited)
FiscalYeao
1996199719981999200020012002200320042005
GrossRevmae (1)
$39,77135,02731,64629,87333,33540,43538,63841,94743,80242,243
$20,17417,62015,30913,63615,24817,47918,43022,17422,98125,555
Net RaevnueAvailable forDebt Service
Debt Service RequitementsInterest
$19,59717,40716,33716,23718,08722,95620,20819,77320,82116,688
$5,6995,9476,2856,4826,7847,1796,9947,1267,5855,862
$10,87810,56010,2269,8709,4979,1008,6987,5257,6619,061
Total
$16,57716,50716,51116,35216,28116,27915,69214,65115,24614,923
Coverage
1.21.11.01.01.11.41.31.31.41.1
NOTES: (1) Gross revenue includes operating revenue, interest income, allocated transient occupancy taxes (transfer), and beginning in 1996, debt service recovery.(2) Direct operating expenses include operating expenses less depreciation and amortization.
Source: City Finance Department
95

CITY OF ANAHEIM
Demographic StatisticsJune 30,2005
City of Anahoimu
SchoolSquare Median EnrollmentMiE Age (000)
MedianBuying
Inoome PerHousehold
($000)Year
1900191019201930194019501960197019801990200020012002200320042005
3.703.703.703.703.704.40
27.3433.1042.0545.0349.7949.7949.7949.8049.9049.90
Population(000)
36
1111
15104167219266328330335337343345
AMangeAnnual
PopulationPercentChange
20.0%10.08.3
3.659.36.13.12.12.3
.61.5.6
1.80.6
OrangeCounty
Population(000)
203461
119131216704
1,4201,9322,4112,8462,8802,9392,9793,0173,057
cityPopulationPercent of
County
5.0%/o8.89.89.28.46.9
14.811.811.311.011.511.511.411.311.411.3
Rank inSin, of
califomiacities
51664244
N/A6812889
101010101010
OragCounty
UnemploymentRate
4.3%2.42.83.04.04.03.63.9
29.034.030.330.330.330.330.332.3
2535626263636564
$2533434849414242
NOTE: Statistics pertaining to Median Age, School Enrollment, Buying Income per Household & Orange County Unemployment Rate prior to 1980 are not available.
Public School Enrollment includes grades Kindergarten through Sixth, Junior High School and High School.
Source: U.S. Bureau of Census, California Department of Finance, State of California Employment Development Department, Sales & Marketing Management Survey of BuyingPower, Center for Demographic Research, California State University, Fullerton, City Planning Department
96

CrrY OF ANAHEIM
Construction and Bank Deposit ActivityLast Ten Fiscal Years (in thousds)
(Unaudited)
FiscalYear
1996199719981999200020012002200320042005
Number of
Permits Ise
5455454553
PercentChange
25%(20)25
(20)25
(20)25
EstimatedValuation
$191,556227,413337,638491,296214,862255,042205,750202,114190,488228,374
PerentChauge
13%194846
(56)19
(19)(2)(6)20
BankDeposits
$2,320,2732,431,0862,407,6592,859,5832,973,0783,197,3933,599,5274,121,1975,900,644
PercentChange
(12)%5
(1)1947
131443
(40)
NOTE: Bank deposit statistics for 2005 are not available at the present time.
Source City of Anaheim Planning and Building Divisions and the Findley Reports on California Financial Institutions.
Principal Taxpayers (in thousands)
(Unaudited)
Taxpoer
Walt Disney World CompanyAllstate Life Insurance CompanyReef America REIT IIPan Pacific RetailBoeing North AmericaAngeli LLCJoan M TR SchlundLennar Platinum TriangleOTRFairfield Resorts, Inc.
Type of Buuimas
Family RecreationInsurance IndustryProperty ManagementProperty ManagementAircraft and Navigation SystemsAnaheim Marriott HotelGround LessorProperty ManagementPension Fund (Ohio Teachers Retirement)Timeshare Apartments
2005 Full MarketValuation of Poperty
$3,169,133111,282108,431
87,51882,68373,77372,41470,50166,76359,102
$3,901,600
Percent of 2005Total City Full
Market Valuation
13.51%0.470.460.370.350.310.310.300.280.25
16.61%
Sources: Orange County Assessor's Office and City Finance Department
97

CITY OF ANAHIMM
Schedule of Insurance in ForceJune 30,2005(Unaudited)
Name of Company
PROPERTYLexington Insurance Co.
(Lead Underwriter)
Lexington Insurance Co.(Lead Underwriter)
BONDSHartford Fire Insurance Co.
Hartford Fire Insurance Co.
Policy Number
RKMI03900344
RKMI03900344
Policy Prod
7/1/04-7/1/05
7/I/04-7/1/05
Type ofCofrage
All Risk Blanket Property,including Flood
Boiler and Machinery
$750,000,000 All-Risk Property$50,000 All Risk Property Ded.S250,000 Flood Deductible (A&Z)$100,000 Flood Deductible (other)
$100,000,000 per Accident(includes Business Interruption/Extra Expense) Deductibles vary
Great American West Insurance
LIABILITYAuthority for California CitiesExcess Liability/Insurance Companyof the State of Pennsylvania/Lexington Insurance Company/Axis SpecialtyInsurance/Arch Specialty Insurance
Energy Insurance Mutual(Utility Department only)
72B5BCW5216
72BSBCT'9180
GVT375664004
ACCO405ANAIOI
8/9/04-8/9/05
7/1/04-7/1/05
7/!/04-7/1/05
7/1/04-7/1/05
Public Officials(Finance Director)
Public Officials(City Treasurer)
Commercial Blanket Bond,Commercial Crime
Excess Comprehensive General/Auto/Public Officials Liability
Excess Comprehensive Generaland Auto Liability
Helicopter Liability (Aviation)
Heliport Liability (Airport)
Excess Workers! Compensation
$100,000
$100,000
$5,000,000 Faithful PerformanceBlanket Bond$250,000 Loss Inside/Loss Outside$2,000,000 Depositors Forgery$5,000,000 Computer Fraud
$42,000,000 Excess of $1,000,000Self-Insured Retention
$25,000,000 Excess of $43,000,000Underlying
$50,000,000 per Occurrence
$20,000,000 per Occurrence
$75,000,000, Excess of $1,000,000Self-Insured Retention
Old Republic Insurance Group
Old Republic Insurance Group
WORKEIRS' COMPBNSATIONAuthority for California CitiesExcess Liability
501435-03GL
HL 000706-01
ORPR00230901
CPEIA04EWC-04
12/31/04-7/1/05
6/30/04-6/30/05
6/30/04-6/30/05
7/1/04-7/1/05
Source: Finance Department-Risk Management Division
98

CITY OF ANAEDM
Miscellaneous Statistical Information(Unaudited)
Founded - October5, 1857
- January 14,1965Charter City approved by State Legislature and became effective
Government - Council-Manager Form
Municipal Water Plant - 63,500,000 Gallons Daily Average Distribution94,000,000 Gallons Peak Daily Distribution7,848 Hydrants133,035 Gallons per Minute: System Supply Capacity747 Miles of Mains62,205 Customers
Municipal Electric Plant - 110,635 Customers1,490 Circuit Miles of Line1,860,204 KVA Distribution Capacity
Police Protection - 4 Stations572 Full-time Employees94 Part-time Employees
- 12 Stations279 Full-time Employees18 Part-time Employees
Fire Protection
Sources: City Finance and Public Utilities Departments and City Manager's Office
99

CITY OF ANAHEIM
PARKS
1. HANSEN PARK1300 S. Knott St
2. REID PARK3100 W. Orange Ave.
3. SCHWEITZER PARK238 S. Bel Air SL
4. MAXWELL PARK2660 W. Orange Ave.
5. PETER MARSHALL PARK801 N. Magnola Ave.
6. BROOKHUPRST COMMUNITY PARK2271 W. Creeent Ave.
7. JOHN MARSHALL PARK2066 Falimouth Ave.
I. MODJESKA PARK1331 S. Nutwood St.
9. CLARA BARTON PARK1926 Clearbiook Ln.
10. CHAPARRAL PARK1770 2. Broadway
11. WILLOW PARK1625 W. Crone Ave.
12. PALM LANE PARK1595 Peals Rd.
13. SAGE PARK1313 Lido PL
14. STODDARD PARK901 S. Ninth St
15. MANZANITA PARK1260 Riaere St
16. LA PALMA PARK & STADIUM1161 La Palms Park Way
17. PEARSON PARK400 N. Harbor Blvd
18. LIMTLE PEOPLES PARK220 W. Elm St
19. JULIANNA PARK309 E. Julans St.
20. GEORGE WASHINGTON PARK2502 E Cypress St.
21. COLONY PARK210 E. Lincoln Ave.
22. WALNUT GROVE PARK905 S. Anaheim Blvd.
23. CITRUS PARK104 S. Atchison St
24. PONDEROSA PARK2100 S. Hlestr St
25. LINCOLN PARK1440 E. Licoln Ave.
28. EDISON PARK1145 Baxer St
27. BOYSEN PARK951 State Colleg Blvd.
25. JUAREZ PARK841 S. Sunlst St.
29. PIONEER PARK2566 . UnderMl Ave.
30. RIO VISTA PARK201 N. Parkvisa St
31. OLIVE HILLS PARK4200 NoN Ranch Rd.
32. RIVERDALE PARK4645 2. RIlverdale Ave.
33. PERALTA CANYON PARK115 N. Pbmey or.
34. PELANCONI PARK222 . Avwnlda Margaits
38. IMPERIAL PARK450 S. ITe•tl Hwy.
36. EUCALYPTUS PARK100 N. Qulnlana Dr.
37. OAK PARK6400 E. NoN Ranch Rd.
38. YORSA REGIONAL PARK7600 E. La PaIlm Ave.
38. OAK CANYON NATURE CENTER6700 Wakrit Canyon Rd.
40. SYCAMORE PARK8268 Monte Vista Rd.
41. CANYON RIM PARK730 E. Canyon Rim Rd.
42. WEIR CANYON REGIONAL PARK
43. TOYON PARK945 S.WeWr Canyon Rd.
44. CHINO HILLS STATE PARK4195 Chino Hills ParkwayChino Kitls, CA 91709
100

!l: