L'obituaire du chapitre de Saint-Materne à la cathédrale Saint ...
Upload
khangminh22Category
view
0download
0
December 29, 2003
Document of the World Bank
Report No. 25185-LCR
Saint Kitts and NevisOECS Fiscal Issues
Caribbean Country Management UnitPoverty Reduction and Economic Management UnitLatin America and the Caribbean Region
Report N
o. 25185-LCR
Saint Kitts and N
evis OEC
S Fiscal Issues
Policies to Achieve Fiscal Sustainability andImprove Efficiency and Equity of Public Expenditures
Pub
lic D
iscl
osur
e A
utho
rized
Pub
lic D
iscl
osur
e A
utho
rized
Pub
lic D
iscl
osur
e A
utho
rized
Pub
lic D
iscl
osur
e A
utho
rized
IOCR MDGs MIS MoF MoH MOW MTESP NHC NIA OECD OECS PAC PRGF PSIP PSIP oc PSIP PCC RGSM SEDU SELF SIGFIS SIGTAS SOEs SSMC sss UDC UK UNESCO VAT WAEMU WBI
Institutional and Organizational Capacity Review Millennium Development Goals Management information systems Ministry of Finance Ministry of Health Ministry of Communications, Works, Public Utilities and Posts Medium-Term Economic Strategy Paper National Housing Corporation Nevis Island Administration Organization for Economic Cooperation and Development Organization of Eastern Caribbean States Public Accounts Committee Poverty Reduction Growth Facility Public Sector Investment Program Public Sector Investment Program Operating Committee Public Sector Investment Program Project Cooperating Committee Regional Government Securities Market Small Enterprise Development Unit Student Education and Learning Fund Standardized Integrated Government Financial Information System Standardized Integrated Government Tax Administration System State-owned enterprises St. Kitts Sugar Manufacturing Company Social Security Scheme Urban Development Corporation United Kingdom United Nations Educational, Scientific, and Cultural Organization Value-added tax Western Africa Economic and Monetary Union World Bank Institute
Preface
This report was completed in June 2003 and reviews St. Kitts and Nevis public expenditures until the year 2002. The proposed policy recommendations reflect the situation o f the country at the time o f the completion of the report.
Acknowledgments
T h i s report i s based on the contributions o f a team consisting o f Lorraine Blank (social protection), Andreas Blom (education), Patrick Grady (public sector investment program and public sector employment and compensation), Ted Paterson (budget management), Helen Saxenian (health), and Claudia Sepdlveda (fiscal sustainability and fiscal and business cycles). As Task Manager, Claudia Sepdlveda was responsible for the overall preparation of the report. Shahrokh Fardoust and David Rosenblatt were peer reviewers.
The team would l i ke to thank Antonella Bassani and Mauricio Carrizosa for their helpful comments and their invaluable collaboration to improve this report. The report also benefited from the accomplished research assistance o f Laura dos Reis and Kevin Tomlinson and the excellent assistance of Anne Pillay.
The assistance, cooperation, and input o f many Government departments in St. Kitts and Nevis-too numerous to mention individually-is gratefully acknowledged. In particular, extensive assistance was received from the Budget and Planning Unit o f the Ministry o f Finance. The report also benefited from the assistance and cooperation o f the Eastern Caribbean Central Bank, the Caribbean Development Bank, and the International Monetary Fund. Without their help, preparation o f th is report would not have been possible.
Table of Contents
EXECUTIVE SUMMARY .............................................................................................................................. i 1 . I . I1 . I11 .
2 . I . I1 .
3 . I . I1 . I11 .
4 . I .
I1 . 5 . I .
I1 .
6 . I . I1 . I1 .
7 . I . I1 . I11 .
8 . I . I1
I11
FISCAL DEFICIT. PUBLIC DEBT. AND FISCAL SUSTAINABILITY ............................... 1 ST . KITTS AND NEVIS FISCAL PERF~RMANcE. 1990-2002 ............................................................. 2 DOES ST . KIPS AND NEVIS FACE A FISCAL SUSTAINABILITY PROBLEM? ..................................... 4 FISCAL CONSOLIDATION IN ST . KITTS AND NEVIS’S PUBLIC SECTOR .......................................... 11
FISCAL POLICY AND BUSINESS CYCLES ......................................................................... 17 TRENDS AND CYCLES IN ST . KIPS AND NEVIS FISCAL ACCOUNTS. 1980-2001 .......................... 18 THE STRUCTURAL BUDGET SURPLUS IN ST . KlTTS AND NEVIS .................................................... 23
BUDGET MANAGEMENT ....................................................................................................... 27 CONSTITUTIONAL AND LEGAL FRAMEWORK ................................................................................ 29 BUDGET PREPARATION. EXECUTION. AND MONITORING .............................................................. 30 BUDGET ACCOUNTABILITY ........................................................................................................... 37
THE PUBLIC SECTOR INVESTMENT PROGRAM ............................................................ 41 ST . KITTS AND NEVIS FEDERAL GOVERNMENT PSP: PREPARATION. EXECUTION. AND MONITORING .................................................................................................................................. 43 SIZE AND COMPOSITION OF THE NEVIS ISLAND ADMINISTRATION PSIP ...................................... 51
PUBLIC SECTOR EMPLOYMENT AND COMPENSATION ............................................. 53 RECENT TRENDS IN EMPLOYMENT AND COMPENSATION IN THE ST . KIPS AND NEVIS
RECENT TRENDS IN PUBLIC SECTOR EMPLOYMENT AND COMPENSATION IN THE NEVIS FEDERAL GOVERNMENT ................................................................................................................ 54
ISLAND ADMINISTRATION ............................................................................................................. 63
THE HEALTH SECTOR ........................................................................................................... 67 HEALTH OUTCOMES IN ST . K ITTS AND NEVIS ............................................................................... 68 THE HEALTH SYSTEM: COVERAGE AND DELIVERY ...................................................................... 72 USES OF HEALTH SPENDING IN ST . KIrlYrS AND NEVIS. 1995-2002 ............................................... 75
THE EDUCATION SECTOR .................................................................................................... 79 THE EDUCATIONAL SYSTEM IN ST . KITTS AND NEVIS .................................................................. 81 EDUCATION OUTCOMES IN ST . KITTS AND NEVIS ......................................................................... 82 USES OF EDUCATION EXPENDITURES IN ST . KITTS AND NEVIS. 1994-2002 ................................. 84
SOCIAL PROTECTION PROGRAMS .................................................................................... 93 ST . KITTS AND NEVIS SOCIAL PROTECTION STRATEGY AND PROGRAMS .................................... 95 COMPOSITION AND EVOLUTION OF SOCIAL PROTECTION SPENDING IN ST . KITTS AND
SOCIAL PROTECTION AND RISK MANAGEMENT IN ST . KITTS AND NEVIS ................................. 102 NEVIS. 1996-2001 ....................................................................................................................... 101
BIBLIOGRAPHY ..................................................................................................................................... 107
APPENDICES .......................................................................................................................................... 111 Appendix A The Hodrick-Prescott Detrending Procedure .......................................................... 111 Appendix B Structural Fiscal Balance Methodology ................................................................. 112
Appendix C Social Protection Programs in St . Kitts and Nevis .................................................. 1 15 ANNEXES .............................................................................................................................................. 117
Table A1 Central Government Fiscal Acounts in St . Kitts and Nevis 1980-2002 (In millions EC$) .......................................................................................................... 120
Table A2 Central Government Fiscal Acounts in St . Kitts and Nevis 1980- 2002 (In millions EC$ 95) ..................................................................................................... 123
Table A3 Central Government Fiscal Acounts in St . Kitts and Nevis 1980-2002 (As percentage o f GDP) ............................................................................................... 126
Table A4 Main Economic Indicators St . Kitts and Nevis 1980-2002 ......................................... 126
Table A6 Social Protection Recurrent Expenditures by Ministries and Programs Table A5 Operations o f Public Enterprises in St . Kitts and Nevis 1995-1998 ............................ 128
(In Thousands EC$) ..................................................................................................... 129
List of Tables
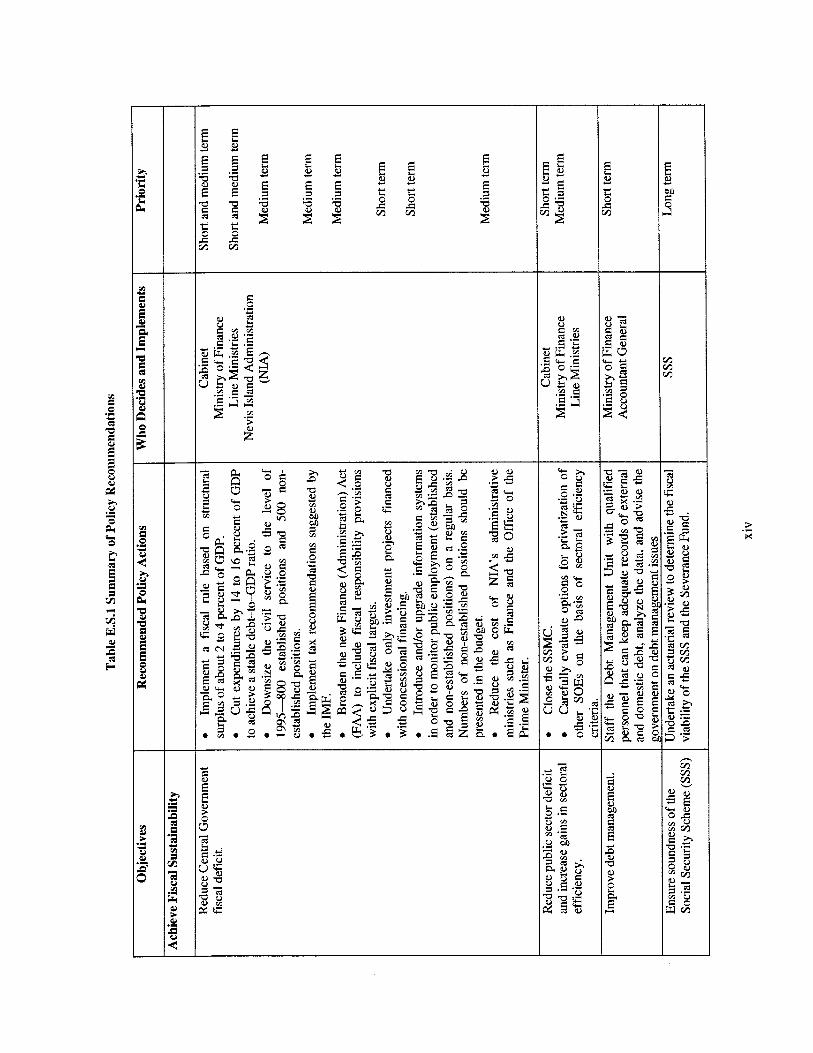
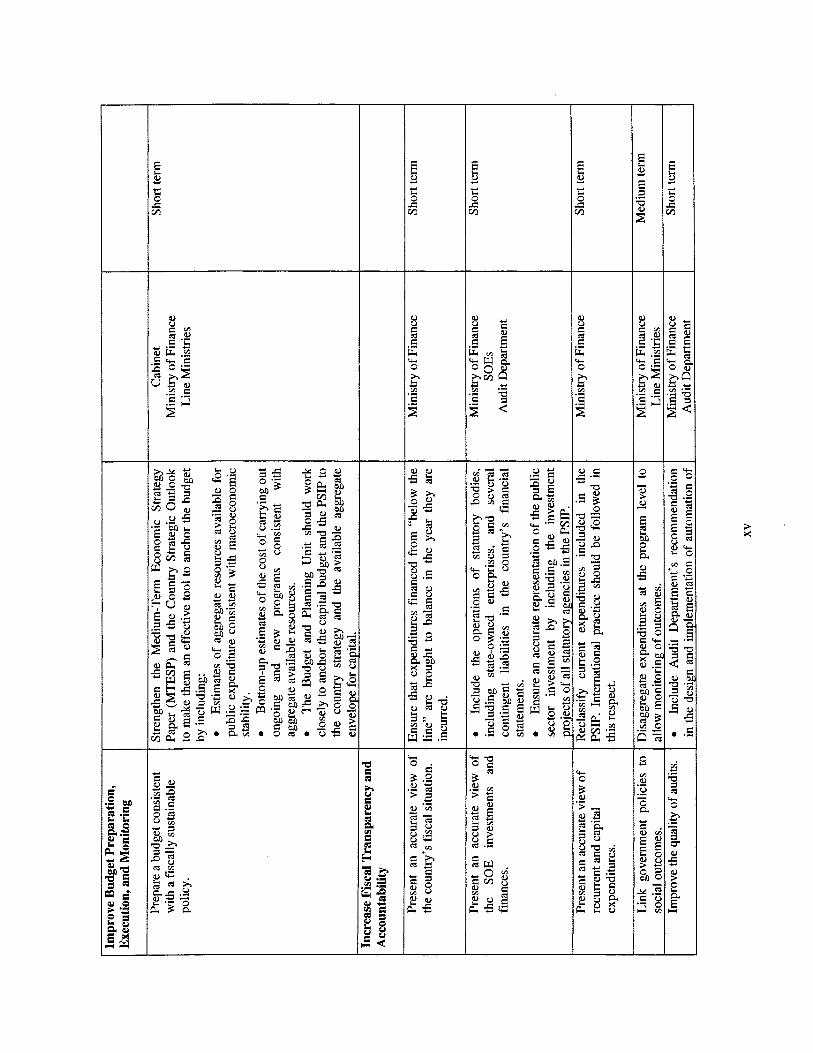
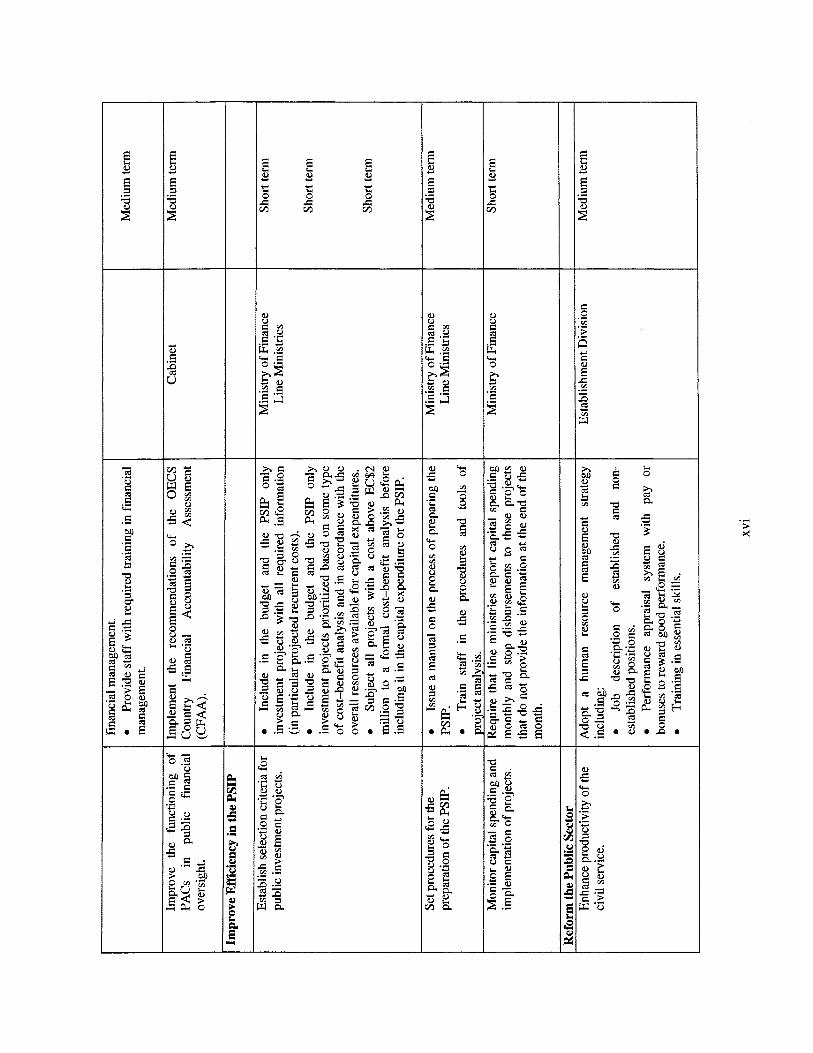
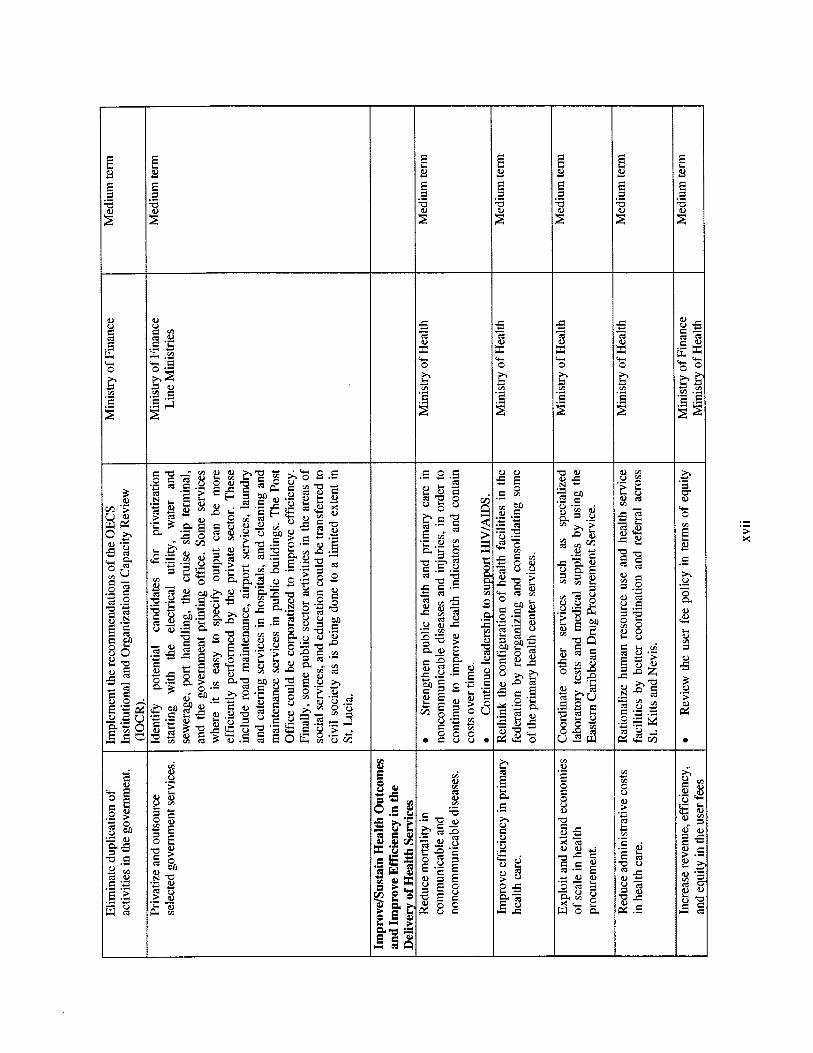
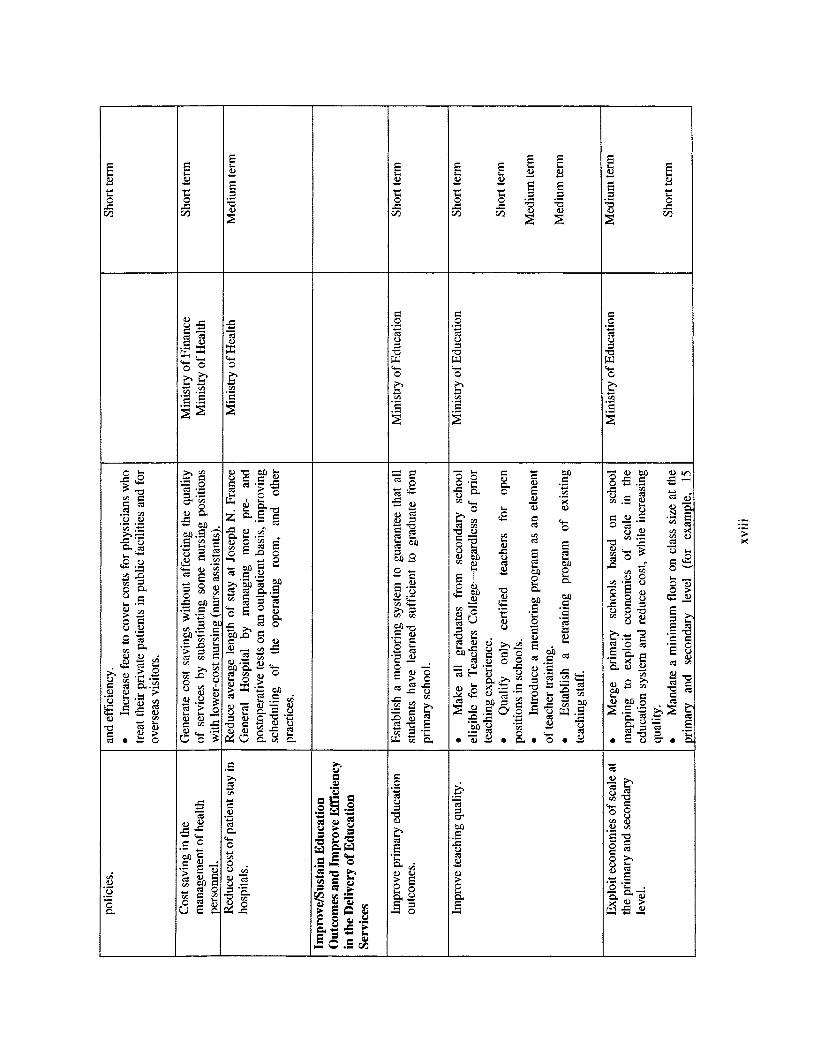
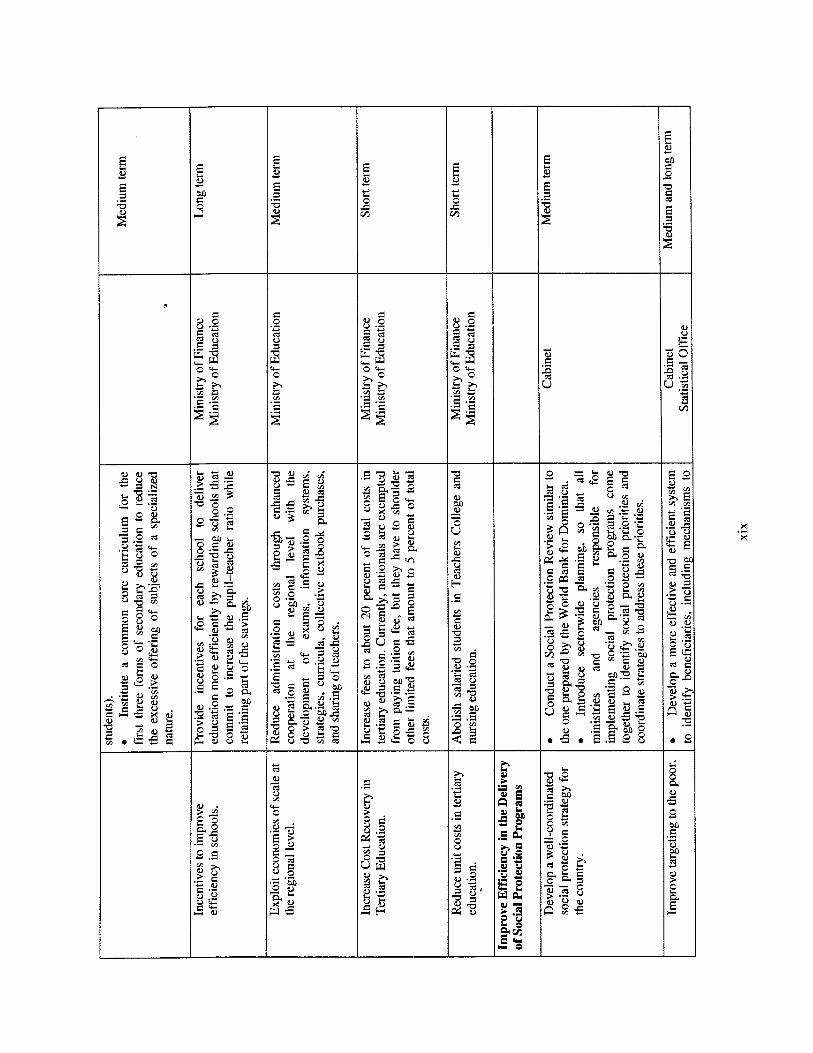
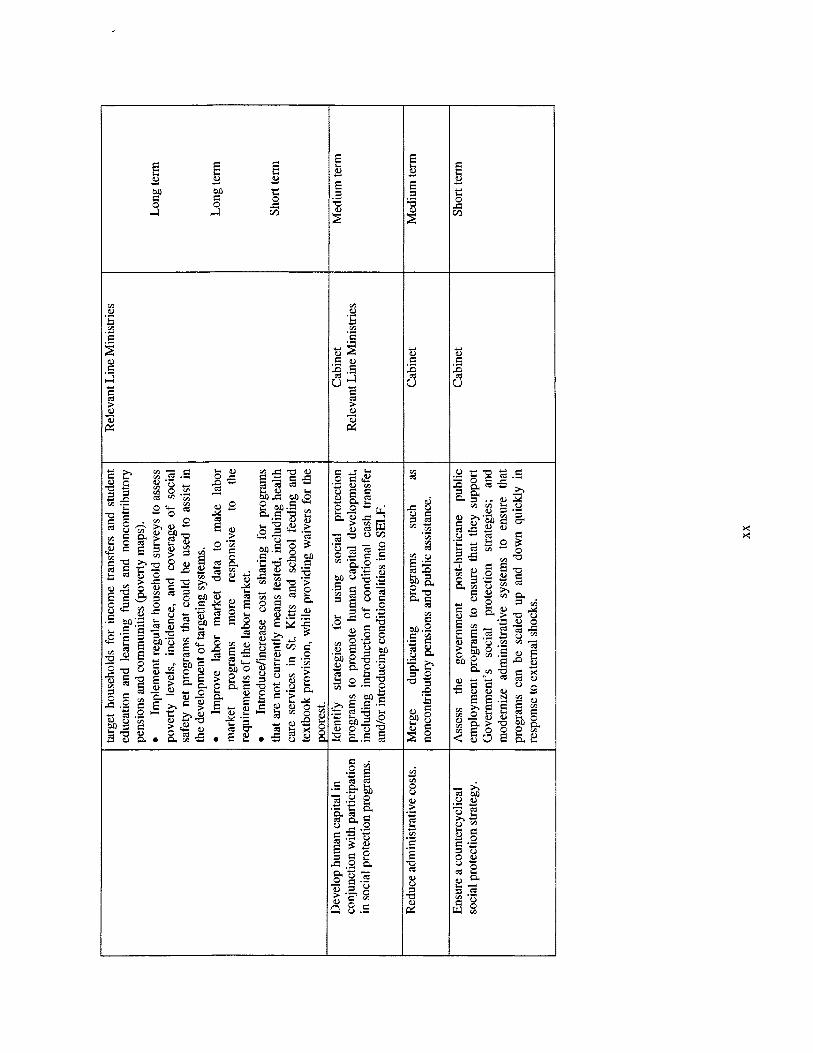
Table E.S. 1 Summary o f Policy Recommendations .............................................................................. xiv Table 1.1 Customs Revenue Forgone from Tax Concessions (as percentage o f GDP) .......................... 13 Table 2.1 Long-Term GDP. Central Government Revenue. and Expenditure Growth Rates.
1981-2002 ...................................................................................................................................... 20 Table 2.2 Cyclical Properties o f GDP. Central Government Revenue. and Expenditure. 1980-
2002 ............................................................................................................................................... 22 Table 3.1 Main Items Responsible for the Variance Between Actual and Budgeted Expenditures
in the Ministry of Finance and Planning. St . Kitts and Nevis. 1995-2000 (in millions EC$) ....... 35 Table 3.2 Ministries Consistently Over or Under Budget in St . Kitts and Nevis. 1995-2000
(average percentage) ...................................................................................................................... 36 Table 4.1 Medium-Term PSIF’ for St . Kitts and Nevis. 2001-06 (in thousands EC$) ........................... 44 Table 4.2 Sectoral Composition o f Actual Capital Expenditures for St . Kitts and Nevis Federal
Table 4.3 Sectoral Composition o f Actual Capital Expenditures for St . Kitts and Nevis Federal
Table 4.4 Source o f Financing o f St . Kitts and Nevis Federal Government Capital Expenditures
Table 4.5 Realization Rate o f St . Kitts and Nevis Federal Government Capital Expenditures.
Table 4.6 Realization Rate o f St . Kitts and Nevis Federal Government Capital Expenditures by Funding Source. 1994-2001 .......................................................................................................... 50
Table 4.7 Actual Public Sector Investment Expenditures and Realization Rate for Nevis Island Administration (in thousands EC$) ................................................................................................ 51
Table 5.1 Employment in the St . Kitts and Nevis Federal Government. 1995-2002 ............................. 55 Table 5.2 Distribution o f Established Positions by Ministry in the St . Kitts and Nevis Federal
Government. 2000-01 .................................................................................................................... 56 Table 5.3 St . Kitts and Nevis Federal Government Compensation. 1995-2002 .................................... 59 Table 5.4 Personal Emoluments and Wages by Ministry in the St . Kitts and Nevis Federal
Government (EC$) ......................................................................................................................... 60 Table 5.5 Public and Private Sector Wages in St . Kitts and Nevis. 2001 (EC$) .................................... 61 Table 5.6 Employment in Nevis Island Administration. 1995-2002 ..................................................... 63 Table 5.7 Established and Non-Established Positions. by Ministry. in the NIA. 2001-02 .................... 64 Table 5.8 Personal Emoluments and Wages in the NIA. 1997-2002 ..................................................... 65
Government (as percentage % GDP) ............................................................................................. 47
Government (as % total capital expenditures) ............................................................................... 47
(as % o f total capital spending) ...................................................................................................... 49
1 994-200 1 ...................................................................................................................................... 49
Table 6.1 Health Indicators in St . Kitts and Nevis Compared with Barbados. Jamaica. and other OECS Countries. 2000 .......................................................................................................... 69
Table 6.2 Health Indicators in St . Kitts and Nevis. 1995 and 2001 ........................................................ 70 Table 6.3 Leading Cause of Mortality. 1996200 1 (number of deaths per year) .................................. 70 Table 6.4 Characteristics o f the Health System. St . Kitts and Nevis. 1991-2001 ................................. 73 Table 6.5 Uses of Health Facilities in St . Kitts and Nevis. 1999 (in percentage) .................................. 74 Table 6.6 Health Spending in St . Kitts and Nevis Compared to Barbados. Jamaica. and
other OECS countries. 2000 (as percentage) ................................................................................ 76 Table 6.7 Recurrent Health Spending in St . Kitts and Nevis. 1995-2002 (in EC $ 95) ........................ 77 Table 7.1 Education Institutions in St . Kitts and Nevis by Ownership. 2000-01 .................................. 81 Table 7.2 Distribution of Education Subsidies by Quintile. 1999 ......................................................... 88 Table 8.1 Social Protection Programs and Expenditures in St . Kitts and Nevis. 2000 .......................... 98 Table 8.2 Incidence of Poverty. Indigence. and Other Related Indicators. 1999 (percentage) ............ 102 Table 8.3 St . Kitts and Nevis Risk Indicators by Age Cohort. Existing Programs.
and Suggested Interventions ........................................................................................................ 103
List of Figures
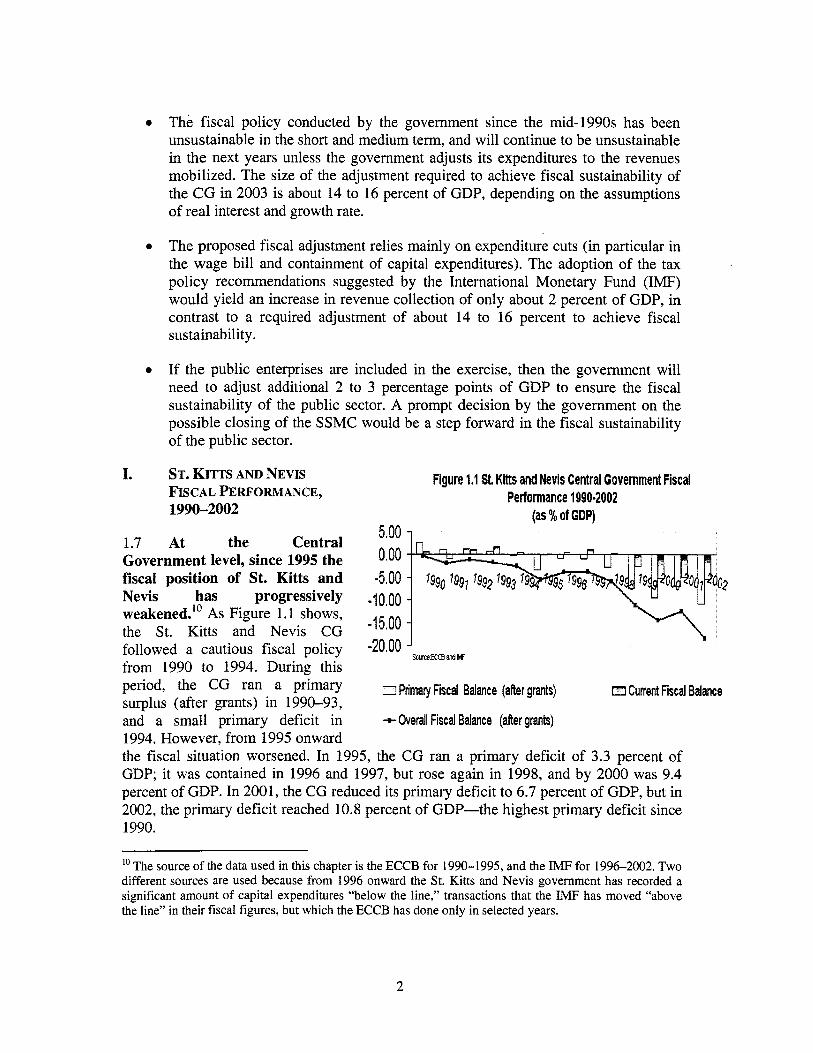
Figure 1.1 St . Kitts and Nevis Central Government Fiscal Performance 1990-2002 (as % of
Figure 1.2 St . Kitts and Nevis Central Government Primary Expenditure, Interest Payment and
Figure 1.3 St . Kitts and Nevis Central Government Debt and Primary Surplus 1990-2002 (as % GDP) ............................................................................................................................................... 3
Figure 1.4 St . Kitts and Nevis Central Government Short-Term Fiscal Gap 1991-2002 (as % GDP) ............................................................................................................................................... 6
Figure 1.5 St . Kitts and Nevis Central Government Projected Short-Term Fiscal Gap 2003-2005 (as % GDP) ..................................................................................................................................... 7
Figure 1.6 St . Kitts and Nevis Central Government Medium-Term Fiscal Gap 1991-2002 (as % GDP) ............................................................................................................................................... 8
Figure 1.7 St . Kitts and Nevis Central Government Revenue Composition 1990-2002 (as % Total Tax Revenue) .............................................................................................................. 11
Figure 1.8 St . Kitts and Nevis Central Government Expenditure Composition 1990-2002 (as % of GDP) ............................................................................................................................... 14
Figure 1.9 St . Kitts and Nevis Central Government Expenditure Composition 1990-2002 (in millions EC$ 95) ....................................................................................................................... 15
Figure 2.1 St . Kitts and Nevis GDP, GDP Trend and Cyclical Component 1980-2002 ....................... 19 Figure 2.2 Fiscal Cyclical Adjustment in St . Kitts and Nevis 1983-2002 (as percentage of GDP) ....... 23 Figure 2.3 Cyclical Adjusted Primary, Overall, and Current Balance in St . Kitts and Nevis,
1983-2002 (as % GDP) ................................................................................................................ 24 Figure 3.1 St . Kitts and Nevis Government Structure ........................................................................... 29 Figure 3.2 The Budget Cycle in the St . Kitts and Nevis Federal Government ...................................... 32 Figure 3.3 Variance between Actual and Budgeted Recurrent Expenditures, Ministry of Finance
and all other Ministries St . Kitts and Nevis 1995-2000 (in percentage) ....................................... 34 Figure 3.4 Variance between Actual and Budgeted Recurrent Expenditures, Ministry of Works,
and all other Ministries St . Kitts and Nevis 1995-2000 (in percentage) ....................................... 35 Figure 5.1 Government Employment as Percentage of Population, 2001
(Selected Caribbean Countries) .................................................................................................... 56
GDP) ............................................................................................................................................... 2
Revenue 1990-2002 (as % of GDP) ................................................................................................ 3
Figure 5.2 Average Wage as a Percentage of GDP per capita. 2001
Figure 6.1 Share of Recurrent Health Expenditures in GDP. St . Kitts and Nevis 1995-2000
Figure 6.2 Share of Hospital Expenditures in Total Recurrent Health Expenditures. St . Kitts
Figure 7.1 Gross Enrollment and Completion Rates in Primary Education in Caribbean Countries. 2001 (in percentage) ..................................................................................................... 82
Figure 7.2 Share of Education Expenditures in GDP. St . Kitts and Nevis 1994-2002 (as %) ............... 84 Figure 7.3 Education Expenditure in St . Kitts and Nevis 1994-2002 (millions of EC$ 95) .................. 84 Figure 7.4 Share of Recurrent Education Expenditures in Recurrent Expenditures.
St . Kitts and Nevis 1994-2002 (as %) ........................................................................................... 85 Figure 7.5 St . Kitts and Nevis Recurrent Education Expenditures by subsector 1996-2002
(as % Total) ................................................................................................................................... 85 Figure 7.6 Pupil-Teacher Ratio and Costs of Education in St . Kitts and Nevis. 2000 (in US$) ........... 89 Figure 7.7 Share of Trained Teachers in Primary and Secondary School. St . Kitts and Nevis.
1999 (in percentage) ...................................................................................................................... 91 Figure 8.1 Social Protection Expenditures in St . Kitts and Nevis (percentage of GDP) ..................... 101 Figure 8.2 Social Protection Expenditures in St . Kitts and Nevis (millions of EC$ 95) ..................... 102
(Selected Caribbean Countries) .................................................................................................... 61
(percentage) ................................................................................................................................... 76
and Nevis 1995-2002 (percentage) ............................................................................................... 77
List of Boxes
Box 1.1 The Convergence Criteria in the ECCU and WAEMU ........................................................... 10 Box 2.1 Chile’s Fiscal Rule ................................................................................................................... 26 Box 3.1 Financing Expenditures ‘Below the Line’. The Use of Advance and Deposits Accounts ...... 33 Box 4.1 Port Zante Cruise Ship dock .................................................................................................... 48 Box 5.1 Civi l Service Downsizing in Guyana ....................................................................................... 58 Box 6.1 Strengthening the National HIV/AIDS Program over 2003 to 2007: The St . Kitts and
Nevis HIV/AIDS Prevention and Control Project ........................................................................ 72 Box 7.1 Financing of Tertiary Education in Latin America and the Caribbean .................................... 87 Box 8.1 A Closer Look at the Social Assistance Program in St . Kitts ................................................ 100
OECS FISCAL ISSUES: ST. KITTS AND NEVIS
EXPENDITURES POLICIES TO ACHIEVE FISCAL SUSTAINABILITY AND IMPROVE EFFICIENCY AND EQUITY OF PUBLIC
EXECUTIVE SUWIMARY
Overview
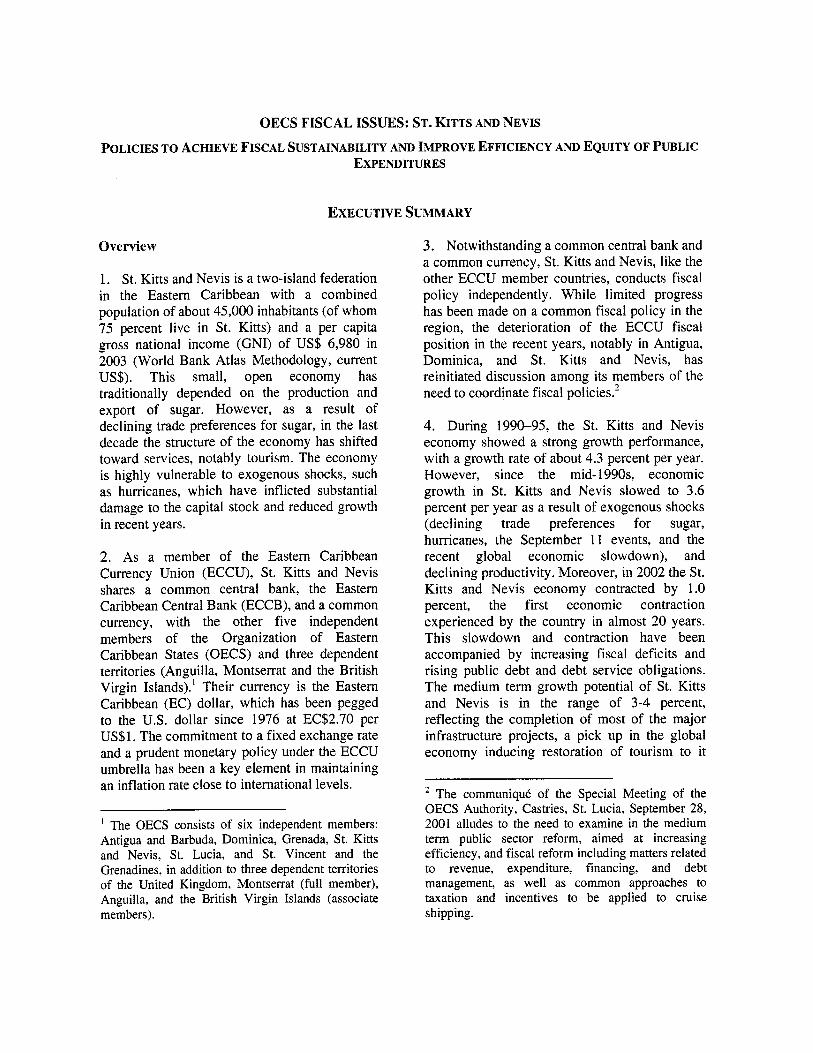
1. St. Kitts and Nevis is a two-island federation in the Eastern Caribbean with a combined population o f about 45,000 inhabitants (of whom 75 percent live in St. Kitts) and a per capita gross national income (GNI) o f US$ 6,980 in 2003 (World Bank Atlas Methodology, current US$). This small, open economy has traditionally depended on the production and export o f sugar. However, as a result o f declining trade preferences for sugar, in the last decade the structure o f the economy has shifted toward services, notably tourism. The economy i s highly vulnerable to exogenous shocks, such as hurricanes, which have inflicted substantial damage to the capital stock and reduced growth in recent years.
2. As a member o f the Eastern Caribbean Currency Union (ECCU), St. Kitts and Nevis shares a common central bank, the Eastern Caribbean Central Bank (ECCB), and a common currency, with the other five independent members o f the Organization o f Eastern Caribbean States (OECS) and three dependent territories (Anguilla, Montserrat and the British Virgin Islands).' Their currency i s the Eastern Caribbean (EC) dollar, which has been pegged to the U.S. dollar since 1976 at EC$2.70 per US$ I. The commitment to a fixed exchange rate and a prudent monetary policy under the ECCU umbrella has been a key element in maintaining an inflation rate close to international levels.
' The OECS consists o f six independent members: Antigua and Barbuda, Dominica, Grenada, St. Kitts and Nevis, St. Lucia, and St. Vincent and the Grenadines, in addition to three dependent territories of the United Kingdom, Montserrat (full member), Anguilla, and the British Virgin Islands (associate members).
3. Notwithstanding a common central bank and a common currency, St. Kitts and Nevis, like the other ECCU member countries, conducts fiscal policy independently. While limited progress has been made on a common fiscal policy in the region, the deterioration o f the ECCU fiscal position in the recent years, notably in Antigua, Dominica, and St. Kitts and Nevis, has reinitiated discussion among i ts members o f the need to coordinate fiscal policies.*
4. During 199G95, the St. Kitts and Nevis economy showed a strong growth performance, with a growth rate o f about 4.3 percent per year. However, since the mid- 1990s, economic growth in St. Kitts and Nevis slowed to 3.6 percent per year as a result o f exogenous shocks (declining trade preferences for sugar, hurricanes, the September 11 events, and the recent global economic slowdown), and declining productivity. Moreover, in 2002 the St. Kitts and Nevis economy contracted by 1.0 percent, the first economic contraction experienced by the country in almost 20 years. This slowdown and contraction have been accompanied by increasing fiscal deficits and rising public debt and debt service obligations. The medium term growth potential o f St. Kitts and Nevis i s in the range o f 3-4 percent, reflecting the completion o f most o f the major infrastructure projects, a pick up in the global economy inducing restoration o f tourism to it
* The communiqut of the Special Meeting of the OECS Authority, Castries, St. Lucia, September 28, 2001 alludes to the need to examine in the medium term public sector reform, aimed at increasing efficiency, and fiscal reform including matters related to revenue, expenditure, financing, and debt management, as well as common approaches to taxation and incentives to be applied to cruise shipping.
pre-September 2001 levels, and the near doubling o f the room capacity in the country as a result o f the opening of the 900- room Marriott Resort. Ma in exogenous risks to the medium term scenario are posed by a prolonged global recession, potential uncertainty engendered by Nevis’s plans to secede, a natural disaster such as a tropical storm or hurricane, and risks o f a drying up of the regional capital market fuelled by high fiscal deficit and debt ratios.
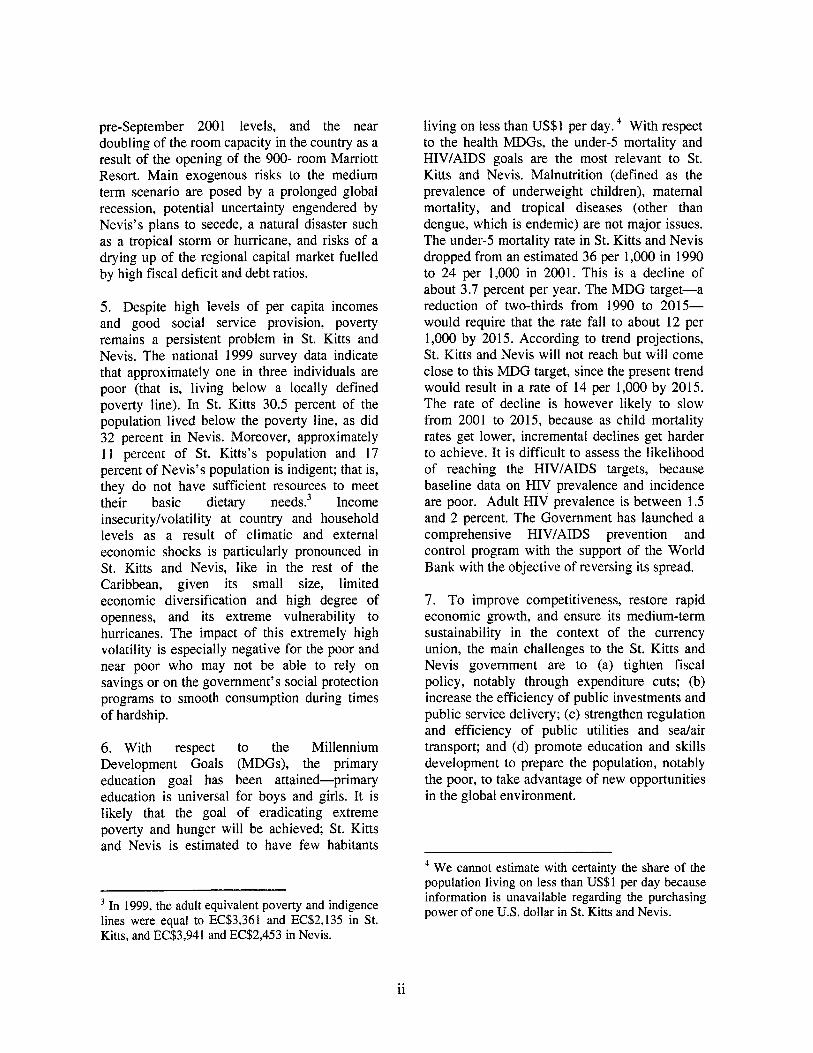
5. Despite high levels o f per capita incomes and good social service provision, poverty remains a persistent problem in St. Kitts and Nevis. The national 1999 survey data indicate that approximately one in three individuals are poor (that is, l iving below a locally defined poverty line). In St. Kitts 30.5 percent o f the population l ived below the poverty line, as did 32 percent in Nevis. Moreover, approximately 11 percent o f St. Kitts’s population and 17 percent o f Nevis’s population i s indigent; that is, they do not have sufficient resources to meet their basic dietary needs.3 Income insecurity/volatility at country and household levels as a result o f climatic and external economic shocks i s particularly pronounced in St. Kitts and Nevis, like in the rest o f the Caribbean, given i t s small size, limited economic diversification and high degree of openness, and i ts extreme vulnerability to hurricanes. The impact o f this extremely high volatility i s especially negative for the poor and near poor who may not be able to rely on savings or on the government’s social protection programs to smooth consumption during times o f hardship.
6. With respect to the Millennium Development Goals (MDGs), the primary education goal has been attained-primary education i s universal for boys and girls. I t i s likely that the goal o f eradicating extreme poverty and hunger w i l l be achieved; St. Kitts and Nevis i s estimated to have few habitants
l iving on less than US$ 1 per day. With respect to the health MDGs, the under5 mortality and HIV/AIDS goals are the most relevant to St. Kitts and Nevis. Malnutrition (defined as the prevalence o f underweight children), maternal mortality, and tropical diseases (other than dengue, which is endemic) are not major issues. The under-5 mortality rate in St. Kitts and Nevis dropped from an estimated 36 per 1,000 in 1990 to 24 per 1,000 in 2001. This i s a decline o f about 3.7 percent per year. The MDG target-a reduction o f two-thirds from 1990 to 2015- would require that the rate fall to about 12 per 1,000 by 20 15. According to trend projections, St. Kitts and Nevis wi l l not reach but w i l l come close to this MDG target, since the present trend would result in a rate o f 14 per 1,000 by 2015. The rate o f decline i s however likely to slow from 2001 to 2015, because as child mortality rates get lower, incremental declines get harder to achieve. I t i s difficult to assess the likelihood o f reaching the HIVIAIDS targets, because baseline data on HIV prevalence and incidence are poor. Adult HIV prevalence i s between 1.5 and 2 percent. The Government has launched a comprehensive HIV/AIDS prevention and control program with the support o f the World Bank with the objective o f reversing its spread.
7. To improve competitiveness, restore rapid economic growth, and ensure i ts medium-term sustainability in the context o f the currency union, the main challenges to the St. Kitts and Nevis government are to (a) tighten fiscal policy, notably through expenditure cuts; (b) increase the efficiency o f public investments and public service delivery; (c) strengthen regulation and efficiency o f public utilities and sea/air transport; and (d) promote education and skills development to prepare the population, notably the poor, to take advantage o f new opportunities in the global environment.
In 1999, the adult equivalent poverty and indigence lines were equal to EC$3,361 and EC$2,135 in St. Kitts, and EC$3,941 and EC$2,453 in Nevis.
We cannot estimate with certainty the share of the population living on less than US$1 per day because information i s unavailable regarding the purchasing power o f one U.S. dollar in St. Kitts and Nevis.
.. 11
8. This report concludes that the fiscal deficit in St. Kitts and Nevis i s unsustainable and poses a risk to the stability o f the currency board arrangement. Most of the adjustment needed to achieve a sustainable fiscal policy w i l l have to come from expenditure cuts, in particular a reduction in the number o f established and non- established positions? containment o f capital expenditures to projects geared to growth and poverty reduction and funded largely by grants and concessional loans, and the closure o f the unprofitable St. Kitts Sugar Manufacturing Company (SSMC). A reduction in tax exemptions and discretionary concessions i s also essential, as i s a restructuring o f the revenue base through the introduction o f the value-added tax (VAT). While social indicators are good for a country at this level o f gross domestic product (GDP), there i s ample room for more efficient modalities o f education and health service delivery that can generate significant savings and improve effectiveness. In addition, the government should strive to ensure that i t s social programs, in particular social protection, are provided in a well-targeted and effective manner in order to provide more effective safety nets for the possible impact o f sugar sector restructuring, fiscal consolidation and the rationalization o f education and health service delivery, and continued vulnerability to external shocks. Specific recommendations on how to achieve fiscal sustainability,. improve social service delivery, and reform social protection are provided in the attached matrix. See Table E.S. I.
There are two types o f government positions in the St. Kitts and Nevis Federal Government: established and non-established. Employees in established positions are appointed by the Governor General upon formal request by the Public Service Commission, with the approval of the Establishment Division in the Prime Minister’s Office. Established positions are permanent positions listed in the budget, and their compensation i s classified as Personal Emoluments. Employees in non-established positions are hired directly by line ministries, their numbers are not presented in the budget, and only their wages are included as a line item.
9. The report i s organized as follows: Chapter 1 discusses fiscal sustainability in St. Kitts and Nevis and presents options for fiscal consolidation; Chapter 2 discusses the role o f the business cycle in the design o f fiscal policy by reviewing the cyclical components o f the fiscal accounts; Chapter 3 discusses the budget management system in place and i ts effect on budgetary outcomes. Chapter 4 examines the Public Sector Investment Program (PSIP); ,Chapter 5 discusses public sector employment and compensation; Chapters 6 and 7 examine public expenditures and outcomes in the education and health sectors; and Chapter 8, the final chapter, discusses social protection programs.
Fiscal Sustainability
10. At the Central Government (CG) level, since 1995 the fiscal position o f St. Kitts and Nevis has weakened progressively (from a CG primary deficit of 3.3 percent in 1995 to 10.8 percent o f GDP in 2002). The main causes o f this deterioration have been increases in the wage bill and capital expenditure (to a degree in response to hurricane repair), and increases in expenditures linked to legislative elections that took place in 1995 and 2000. The government has relied on both external and domestic borrowing, mostly at commercial terms, to finance i t s fiscal deficit. As a result, the CG debt-to-GDP ratio increased from 5 1.5 percent o f GDP in 1995 to 104.4 percent o f GDP in 2002, and the interest expenditures increased from 2.1 percent o f GDP in 1995 to 7.6 percent o f GDP in 2002. The losses of public sector enterprises, notably the SSMC and the St. Christopher Air and Sea Ports Authority, put further pressure on the government deficit and public debt.
11. The short-term fiscal sustainability exercise (one year) shows that since 1995 the fiscal policy conducted by St. Kitts and Nevis (both the CG and the public sector) has been unsustainable. The short-term adjustment required to achieve fiscal sustainability o f the CG in 2003 i s about 14 to 16 percent o f GDP, depending on the assumptions o f real interest
... 111
and GDP growth rates. Since the CG guarantees the debt o f public enterprises, the government would need to adjust by additional 2 to 3 percentage points of GDP to ensure the fiscal sustainability o f the public sector.
12. This size o f adjustment is significant (equivalent to a primary surplus o f between 3 and 4 percent o f GDP), and it would be difficult to achieve it in the short-term, even with a major fiscal reform. The ECCB’s Monetary Council meeting that took place in February 2003 reconfirmed the agreed regional fiscal framework that includes ceilings on debt and fiscal performance of the CG (see Chapter 1, paragraph 1.28). The aim of the ECCB in setting these fiscal convergence criteria is to ensure long-run fiscal sustainability and the stability o f the currency union by limiting negative spillovers. Based on i ts fiscal ratios in 2002, the deadline for fiscal convergence (a four-year horizon) requires a fiscal adjustment higher than the one discussed above if the objective i s to meet the proposed 60 percent o f GDP ceiling, and wi l l require an even faster public sector reform and gearing up of the social protection programs.
13. Adoption o f the IMF tax policy recommendations would reduce the short-term fiscal gap only slightly. Hence, the fiscal adjustment would have to rely mainly on expenditure cuts, notably a reduction in the number o f established and non-established positions, containment of capital expenditures, and the closure o f the unprofitable SSMC. The increasing financial difficulties that the SSMC is facing are the result of a drop in productivity and the phasing out o f trade preferences. The report recommends that the government close the SSMC as soon as possible to avoid further deterioration o f an already unsustainable fiscal situation.
14. The sales o f government assets can be an option to soften the adjustment required to achieve fiscal sustainability. However, any privatization should not be driven by revenue considerations alone, but rather by the objective o f improving quality and efficiency and
increasing coverage, including establishing an adequate regulatory framework to ensure that public monopolies are not replaced by unregulated and inefficient private monopolies.
Fiscal Policy and the Business Cycle
15. Economic volatility tends to discourage long-term investments in physical and human capital, and thus leads to a lower growth potential. The poor segments o f the population are generally the most affected because they lack the means to protect themselves from adverse employment and income effects. Governments have a broad set o f instruments available to reduce aggregate volatility and i t s effects, one o f which i s fiscal policy. In developed economies, fiscal policy i s usually designed to stimulate output when the economy moves into recession and to contract output when an expansion takes place. A fiscal policy designed in this way leads to a strongly procyclical budget surplus (countercyclical fiscal policy).
16. The St. Kitts and Nevis GDP cyclical component shows no clear link to i ts major sources o f economic volatility, hurricanes, but several expansions and contractions are worth noticing. Between 1980 and 2002, St. Kitts and Nevis was hit by six hurricanes. In three out o f six hurricane years, St. Kitts and Nevis’s GDP decreased below i t s trend, and in the other three years increased above i t s trend. The deepest contraction took place in 1983, a year after the debt crisis and the greatest expansion in 1989, the year o f Hurricane Hugo.
17. All components o f the fiscal accounts are more volatile than GDP. The highest volatility i s for grants, capital expenditure; and capital revenue. Current expenditure, all i ts components, as well as capital expenditure are acyclical (that is, in good times or bad times the government does not increase or reduce its expenditures). This result i s similar to the one observed in Organization for Economic Cooperation and Development (OECD) countries, but not in developing countries. Current and tax revenue are procyclical (not
iv
surprising given that most taxes are in some way proportional to economic activity).
18. Finally, all measures o f fiscal balance such as primary, current, and overall balance are acyclical, that is, they do not co-move with the GDP cycle. In good times the government does not run a higher or lower fiscal surplus than its trend. This i s an interesting result and contrary to the empirical evidence for developing countries. However, most o f this evidence does not include small islands like St. Kitts and Nevis, in which the procyclicality o f tax revenues i s high enough and expenditures are acyclical.
19. The cyclical adjustment to the government budget balances in St. Kitts and Nevis varies from -1.8 percent of GDP in 1983 and 2002 (recession years) to 1.9 percent o f GDP in 1989 (expansion year). For example, in 2002 the overall fiscal deficit after grants was 18.3 percent o f GDP, but factoring out the cyclical impact o f lower tax collection, the cyclically adjusted overall fiscal deficit was only 16.5 percent o f GDP. The St. Kitts and Nevis cyclical adjustment compared to other countries in the region i s in the low range. The cyclical adjustment in Chile i s between -4.0 and 2.5 percent o f GDP.
20. Once the cyclical effects are factored out, the country has run a structural primary, current, and overall deficit for most o f the 1990s. In 1994, the structural primary deficit was 0.5 percent o f GDP and kept increasing until it reached 8.9 percent o f GDP in 2002. The same pattern i s observed for the structural overall fiscal balance. Since 1993, the country has run a structural overall deficit that has increased until it reached 16.5 percent o f GDP in 2002. This confirms the conclusion that the business cycle has had little effect on the sharp deterioration o f St. Kitts and Nevis’s fiscal position.
21. Fiscal rules have two main objectives: (a) to enforce fiscal responsibility, and (b) to ensure a countercyclical fiscal policy. In this regard, St. Kitts and Nevis i s on the right path with an acyclical fiscal policy. However, in order to
move the country to a countercyclical fiscal policy we propose a fiscal rule based on a structural surplus o f about 2 to 4 percent o f GDP. This rule i s more austere than the Chilean fiscal rule o f a structural surplus o f 1 percent. However, considerations o f credibility and high GDP volatility in small islands would require that small countries like St. Kitts and Nevis adopt tighter fiscal rules. This fiscal rule implies a fiscal adjustment o f about 14 to 16 percent o f GDP, in line with the adjustment recommended to achieve fiscal sustainability.
22. However, successful implementation o f a fiscal rule based on a structural surplus w i l l require, as a first step, timely and reliable fiscal information. As discussed in the report, the current presentation o f the fiscal information does not follow international practices and presents a distorted picture o f the country’s fiscal situation.
Financial Management
23. St. Kitts and Nevis has introduced substantial changes to the budget structure and processes in the last few years, and its timely reporting is commendable. These changes, however, have not yet fully translated into improved resource allocation and effective expenditure controls, because o f the lack o f firm resource envelopes at the aggregate and ministry level underpinned by a medium-term economic strategy and ministries’ corporate plans nested in a consistent macroeconomic framework. Both the Strategic Country Outlook (a yearly document that presents the economic prospects o f the country for the next fiscal year) and the Medium-Term Economic Strategy Paper (MTESP, a four-year economic plan) last prepared for the Caribbean Group for Cooperation in Economic Development (CGCED) in June 2002, suffer from the same shortcomings: (a) top-down estimates o f aggregate resources available for public expenditure not always consistent with macroeconomic stability, (b) lack o f bottom-up estimates o f the cost o f carrying out ongoing and new programs, and (c) no attempt to reconcile the aggregate resources with the cost estimates
V
o f ongoing and new programs. Most o f the ministries’ corporate plans are out o f date or cannot provide a link among objectives, expenditure required, and outcomes.
24. The budget provides an accountant’s view o f government transactions rather than a presentation o f the government’s fiscal policy. The budget adheres to the traditional administrative, program, and economic structure format. However, this presentation i s insufficient to assess the fiscal position of the government and to follow up on key programs supposedly linked to policy priorities. The Ministry o f Finance does, however, have the capacity to present the budget by standard functional classification and i t i s recommended that it do so in fiscal year 2004.
25. Moreover, sizeable expenditures (mainly capital expenditures) have been financed from “below the line” using advances and deposit accounts without being brought to balance and reflected in the budget in the years in which they occur. Thus, the recurrent and overall balances, as well as other line items presented in the budget, do not represent an accurate picture o f the government’s fiscal situation. I t i s recommended that the government bring to balance all “below the line” accounts starting in 2003.
26. The debt management function i s the weakest component o f the financial management information system. Unti l 2002, the debt management function was split between a small unit in Finance, which uses the Commonwealth Secretariat Debt Recording and Management System (CS-DRMS) to maintain data on foreign debt, and the Accountant General’s Department, which handled domestic debt (mainly treasury bills). These units have now been merged and renamed the Debt and Investment Unit under the Accountant General. However, this new unit lacks qualified personnel to keep adequate records o f external and domestic debt to analyze the data and advise the government on debt management issues.
27. The Audit Department does a commendable job. Audit Reports are current for the federal government. Unlike in other OECS countries, reports in St. Kitts and Nevis no longer detail hundreds of oversights and minor transgressions, focusing instead on material findings. Also, the Audit Department continues a modest program o f value-for-money audits to supplement compliance audits. However, while in principle independent because o f authority specified in the Constitution, the Audit Department has no guaranteed operating budget or staffing complement, and must obtain approval from the Minister o f Finance via the annual Estimates process. Additional factors that have affected its efficacy are the automation o f critical financial management functions without adequate input from the Audit Department in the design and implementation stages, the nonfunctioning o f the Public Accounts Committee, and the lack of training for staff.
28. The financial statements o f St. Kitts and Nevis present a partial view o f government activities. Significant fiscal operations are excluded. The operations o f statutory bodies, including state-owned enterprises (SOEs), are not covered, and several contingent liabilities are not presented in the financial statements. Most o f the SOEs are significantly in arrears in the preparation o f their financial statements and the submission o f these for audit and for Parliament’s review. Although the Director o f Audit has the right to require submission o f SOE audit reports and to supplement them by further investigations if hehhe considers it necessary, he/she has not done so. Finally, following the last election, the members o f the Public Accounts Committee (PAC) were appointed in November 2000, but the Committee did not meet subsequently. The Committee did meet a few times during 1992-94, but took little action o f substance. Weak PACs are a common feature in the OECS countries, and the report presents recommendations to improve their functioning to become a vibrant component o f public financial oversight.
29. The formulation o f the budget receives inputs from the social partners, but this
v i
undoubtedly could be made more systematic. The recent agreement by OECS countries to establish National Economic Councils with public and private sector members may lead in this direction. However, the capacity o f the social partners-most o f which are small organizations-to go beyond their immediate concerns and address complex national policy issues remains limited.
Public Sector Investment Program
30. In St. Kitts and Nevis, on average, during 1995-2002, capital expenditures as a fraction o f GDP increased about three times compared to 1990-94, including “below the line” transactions not presented in the annual budget estimates. This increase in expenditures was mostly financed through loans (commercial and concessional) and is one of the main reasons behind the difficult fiscal position facing the government today. Although the damage caused by Hurricanes Luis in September 1995, Lenny in November 1998, and Georges in November 1999 explains part o f the increase in capital expenditures, a large portion was not hurricane related and i ts aim was not necessarily to stimulate growth or reduce poverty.
3 1. The public sector investment program of St. Kitts and Nevis does not include investment projects by statutory agencies, such as SOEs. This i s a serious gap because these investments can represent a sizeable portion o f the public sector investment program and can expose the government to serious fiscal liabilities. The government should ensure an accurate representation o f the public sector investment program by including in the PSIP the investment projects of all statutory agencies. Investment projects by private corporations but guaranteed by the government should be disclosed in the government’s financial statement as government liabilities.
32. Although the PSIP i s prepared as a four-year rolling medium-term investment program, in practice the focus i s the one-year capital budget. The relatively low realization rate (about 25 percent) provides an indication o f the extent to
which the capital spending intentions included in the estimates do not represent a firm investment plan. N o cost-benefit analysis i s done by the line ministries to assess whether the projects proposed are cost-effective (with the exception o f those financed by external donors). Several investment projects included in the PSP and the capital budget should be classified as recurrent expenditures. Moreover, a significant amount o f the capital expenditures incurred by the government are recorded “below the line” and not captured in the PSIP.
33. The implementation o f the PSIP i s carried out by the line ministries and monitored by the Planning Unit. However, the coordination among these agencies i s weak. Post-evaluation o f projects i s usually conducted only for projects financed by external funds. Because no examples o f such evaluations were provided for local and foreign-funded projects, it i s impossible to assert how useful they have been for future project planning.
Public Sector Compensation
34. Given the small size o f i t s economy and population, St. Kitts and Nevis has limited resources to carry out the whole range o f functions performed by any government. As several studies have shown, small countries tend to have bigger public administrations in response to the higher cost o f supplying public goods and the need to provide a stabilization role to ameliorate the effect of external shocks. However, in the case o f St. Kitts and Nevis the public administration i s too large and expensive for sound fiscal management.
35. The main finding o f this report i s that the high wage bill in the St. Kitts and Nevis Federal Government (1 5 percent o f GDP) i s employment driven rather than wage driven. During 1995- 2002, the number of established positions increased in total by 38 percent, and the number o f non-established positions in full-time equivalent basis increased in total by 124 percent. At the same time, government real wages decreased slightly. St. Kitts and Nevis’s ratio o f government employment to population
v i i
(1 4.2 percent) i s at least three times higher than that observed in other economies in the Caribbean. Although the federation structure o f the country and the fact that in St. Kitts and Nevis many public utilities are part o f the Central Government explains to some extent the high ratio, the main cause has been an increase in the numbers o f established and non- established positions since 1995.
36. In 2000, the Government ,imposed a freeze on new hiring and identified the wage bill as an area where cutbacks were needed as part o f a strategy o f fiscal consolidation. However, although the freeze has been implemented with some success for established employees, non- established employment head count has increased since 2000 in total by 31 percent, or 3.8 percent in full-time equivalent. In the short term, it i s critical that the government strengthens controls on non-established employment and reports i t in the estimates similar to the way i t reports established employment. Over the medium term, the downsizing in public service employment required to close the fiscal gap i s more than the 10 percent o f the current number o f employees foreseen by the government. Downsizing the civi l service to the levels o f 1995 by cutting 800 established positions and 500 non-established positions (head count) would reduce the wage bill by EC$42 million, or 5 percent o f GDP. The downsize w i l l have to be across all line ministries with National Security, Education, Health and Environment taking a significant cut because they represent about 70 percent o f all government employment.
37. The St. Kitts and Nevis government lacks a public sector human resource strategy. Job descriptions and performance appraisals, which are required to effectively manage personnel, do not exist even for established positions. N o systematic analysis o f training needs has been carried out. Training in essential skills i s deficient and there i s no training plan for individual employees to enable them to advance along their career paths. Training i s often offered in an unsystematic way, depending on the availability o f donor financing.
38. There is considerable scope for the government to divest some o f i ts functions to the private sector with the objective of improving quality and efficiency and increasing coverage. So far, only telecommunications has been privatized and garbage collection contracted out. The electrical utility, water and sewerage, port handling, the cruise ship terminal, and the government printing office could all be considered potential candidates for privatization. Some services where it i s easy to specify output can be more efficiently performed by the private sector. These include road maintenance, airport services, laundry and catering services in hospitals, and cleaning and maintenance services in public buildings. The Post Office could be corporatized to improve efficiency. Finally, some public sector activities in the areas of social services, and education could be transferred to nonprofit organizations, as is being done to a limited extent in St. Lucia.
39.The government has so far delayed the decision to downsize its c iv i l service and reform its public sector because i t hopes that the new Marriott Hotel, scheduled to operate at full capacity in September-October 2003, w i l l be able to absorb some o f the potential laid-off public servants, as well as some o f the workers that may lose their jobs if the sugar company (SSMC) i s closed down.
40. A public sector reform program would need to address the issue o f the existing fragmentation and duplication of work among ministries, departments, and agencies, leading to a diffusion o f responsibilities, and the possibility o f the government divesting some o f its functions to the private sector. The reform would need to be informed by a human resource management strategy, and a performance appraisal system should be established with pay or bonuses to reward good performance. I t would also need to be accompanied by the introduction and/or upgrade o f information systems in order to accurately cost i ts implications (pension and severance payments) and monitor public employment (established and non-established positions) on a regular basis.
v i i i
41. A Public Sector Reform Unit was recently established with the mandate to lead the process of public sector reform, which is directed at modernizing the public service. This w i l l include taking an inventory o f the human resource capacity of each ministry, identifying the relevant training to address any deficiencies discovered, and taking a critical look at the procedures and systems in use in the public service to make sure they have not become impediments to efficiency. I t i s encouraging that the government has established such a unit; however, i t i s not clear whether the unit w i l l be adequately funded and has the support of the Cabinet to carry out i ts mandate.
Health
42. The Federation of St. Kitts and Nevis has a health system with a strong primary health care focus. I t i s dominated by publicly financed and publicly provided health care. There are no private clinics or hospitals, but there are physicians in private practice. Public spending on health during 1995-2002 was about 3.3 percent o f GDP, on average. Public health spending in real terms grew for the same period at about 4.4 percent per year. Given the tight fiscal constraints, this growth i s unlikely to be maintained over the short to medium term. Moreover, wages absorb about 80 percent of all health spending in St. Kitts and 73 percent in Nevis. These figures are on the high side, and raise questions as to whether there i s sufficient allocation for pharmaceuticals, medical supplies, and maintenance of equipment and buildings. Capital expenditures in health are highly donor dependent, with a very large share from the European Community.
43. Public facilities appear to provide reasonably good coverage, with a good level o f consumer satisfaction. Nevertheless, the health system faces many challenges in the future. Most immediately, the public system i s facing strong budgetary pressures as part o f the overall fiscal crisis. St. Kitts and Nevis's small size and federation structure also pose many challenges to the administration of public health programs, such as (a) unexploited potential economies o f
scale, (b) duplication across islands o f planning and monitoring activities, (c) health services mostly publicly provided, (d) health financing m,ostly through general revenue, and (e) a high ratio o f nurses to physician. The health system also faces the challenge o f adapting to a changing disease profile, including the need to vigorously address HIV/AIDS. There i s coordination, but Nevis has its own ministry responsible for health, and its own chief secretary responsible for the administration o f local health services.
44. As the disease patterns change over time and with the goal o f achieving greater economies o f scale, i t may be possible to rethink the configuration o f health facilities in the federation, primarily by reorganizing and consolidating some o f the primary health center services. The government should also be able to achieve greater economies of scale by better coordinating health services with i ts OECS neighbors and other countries in the region, including specialized laboratory tests and procurement o f medical supplies, an excellent example o f exploiting economies o f scale at the regional level that can be extended to other services i s the Eastern Caribbean Drug Procurement Service.
45. Public health financing i s mainly through the consolidated fund. Revenue from user fees is minor. User fees at public facilities amount to only about US$6 per capita per year, or 3 percent o f health recurrent spending in 2000. Facilities do not retain fees, so have little incentive to put effort into collection. Fees revert to the consolidated account. Furthermore, there are broad exemptions and fees are modest. While fees may seem low on a per service basis, user fees for a catastrophic health problem could put an unacceptably high burden on a poor household's financial situation, because the exemptions are not well targeted. The user fee policies would benefit from a review in terms o f equity and efficiency. The government should also consider how fees might be significantly increased to cover costs for physicians who treat their private patients in public facilities, and for overseas visitors.
ix
46. The government i s considering adopting a national health insurance system based on payroll taxes. Given that there is a general revenue-financed system in place, it i s not clear why it would make sense to add a payroll-tax system o f social insurance. The main motivation may be simply to find an additional source o f revenue for the health system. However, payroll tax systems have disadvantages. They are a tax on labor. In addition, given that many households are outside the formal sector, the system would not cover the full population. Working with the existing financing system, but finding ways to improve efficiency to ensure that the country i s getting better value for i t s money could be a better choice in the long run for such a small country. The main measures to improve efficiency over the short to medium term are (a) reorganizing and consolidating the primary health center services, (b) substituting nurses with nurse assistants where possible, and (c) increasing the reliance on well-targeted user fees for financing.
47. Public recurrent spending on hospitals in St. Kitts increased dramatically during 1995-2002. I t s share in total recurrent expenditures increased from about 52 percent in 1995 to close to 59 percent in 2002. This finding may be partly due to definitional changes. The budget categories in use on a year-to-year basis had frequent changes. However, i t i s likely that hospitals are putting pressure on health spending in St. Kitts, and this is certain to continue unless (a) changes are introduced to improve hospital efficiency, and (b) chronic disease prevention and early diagnosis and treatment programs are strengthened to keep people healthy and out o f hospitals.
Education
48. The close link between education and labor market earnings implies that the lack o f education is one o f the primary sources o f poverty in St. Kitts and Nevis. Data from the 1999 Survey o f Living Conditions indicate that 27 percent o f those with no education or a primary education are poor, while only 18 percent, 12 percent, and 5 percent are poor
among individuals with secondary, postsecondary, and university education, respectively. Hence, there are strong economic motives for the individual and the government to invest in education.
49. Education expenditures in St. Kitts and Nevis increased by about 40 percent in real terms between 1994 and 2000. However, this increase in public resources has not always been accompanied by an improvement in education outcomes, equity, and efficiency. The fiscal crisis that the country i s facing wi l l require a cut in expenditures for all sectors, but this should not preclude the government from completing the educational agenda by making better use o f the available resources and increasing the nongovernmental provision in education, for example, at the tertiary level.
50. Except for pupils in early childhood, Kittitians and Nevisians receive education predominantly from public institutions. The education system in St. Kitts and Nevis stands out in a Caribbean context in two ways: (a) the dual ministerial structure for one country due to i ts federal structure, and (b) the automatic progression in basic education, where no child repeats a class unless the parents directly express the wish. The dual ministerial structure increases administrative costs. The automatic progression system leads to impressive educational indicators in terms of enrollment, graduation, and repetition (with the millennium development goals related to primary education having been attained). However, it hides major quality and inefficiency problems. In this system, the use o f an effective monitoring and evaluation system is critical for the system to perform adequately.
51. During 1994-2001, on average, St. Kitts and Nevis spent about 5.2 percent o f GDP in recurrent and capital expenditures on education, with a rising trend toward the end o f the period. This compares with the average for Caribbean countries o f 6.6 percent of GDP and the Latin American average o f 4.1 percent of GDP.
52. Since the mid- 1990s, administration costs and tertiary education have taken an increasing
X
share o f recurrent education expenditures. Given the large fixed costs involved in education administration-for instance developing of exams, information systems, strategies, and curricula-it i s expected that smaller states allocate a higher share to administration.6 However, there are considerable savings to be gained from deeper within and cross-country cooperation, which, moreover, would stimulate quality improvements through international sharing o f best practices.
53. The share o f tertiary education in recurrent education expenditures increased from 14 percent in 1996 to 18 percent in 2002. In a Latin American context, this share i s below average, but so i s coverage o f tertiary education in St. Kitts and Nevis. The combination of limited access to tertiary education and a low cost- recovery ratio for tertiary education makes this budget line inequitable. Further, given that a nonnegligible share o f highly educated individuals migrates abroad, the public loses a corresponding share o f the returns to this public investment. I t i s recommended that fees be increased and regional cooperation between colleges be strengthened to ensure efficiency improvement through specialization.
54. The share o f secondary education expenditures in total recurrent education expenditures in the St. Kitts and Nevis Federal Government has decreased since the mid- 1990s. In the mid-l990s, 4 out o f each 10 education EC$ went to secondary education. At the start o f the new millennium, 3 out o f 10 reached this subsector. The adjustment reflects a serious squeezing o f nonsalary expenditures. The share o f recurrent expenditure to secondary education should not be allowed to fall further, and a reallocation o f recurrent expenditures to nonsalary expenditures at this level i s recommended.
The average cost of administration in other education systems in the Caribbean reaches 10 percent, twice the Latin American average of 5 percent.
55. The most important educational barriers for low-income families are limited access to, and inconsistent quality of, the education system. The School Feeding Program i s traditionally perceived as an expenditure line that benefits low-income students. However, in St. Kitts and Nevis at least 65 percent o f the well off, or half o f the student population, receive free meals. A similar pattern i s observed with free textbooks. The lack o f targeting for schoolbooks is especially worrisome given that 1 out o f 5 poor children has no textbook, while this happens for only 1 in 12 among children from the richest quintile. The government could hence either limit the School Feeding Program and textbook provision to low-income families only, or introduce fees for higher-income families.
56. Salaries are, by far, the largest spending item, taking up about 90 percent o f all recurrent education expenditures in 2000. At the secondary level, there i s especially reason for concern because the wage share in total secondary education spending increased from an already high 92 percent in 1996 to 99 percent in 2000. This leaves exceptionally little money to other crucially important learning inputs, such as writing paper, textbooks for poor students, and school maintenance. This skewed allocation o f expenditure toward salaries unnecessarily reduces the effectiveness o f public resources and results in inefficiently low learning. The main reason for the large share o f salaries in recurrent education expenditures i s the low pupil-teacher ratio. St. Kitts and Nevis spends the most per student per year in primary and secondary education among the Caribbean countries, US$860 and US$1,080, respectively. In primary and secondary education there are, on average, 18 and 13 pupils per teacher, respectively. The inefficiency involved in this poor teacher deployment is tremendous. I t i s recommended that these indicators be raised to the average Caribbean level, 25 and 18 pupils per teacher in primary and secondary education, respectively.
57. Quality o f instruction, and especially teacher qualification, i s key for increasing effectiveness o f learning. Teacher qualifications are inadequate in St. Kitts and Nevis. Only 56
xi
percent and 29 percent o f the teacher corps in primary and secondary education are adequately trained to perform their task. The lack o f qualifications i s a severe and long-term barrier for increased efficiency in the education sector. The inefficiency i s partially a result o f the rule o f admission at the teachers college that stipulates two years of teaching experience for eligibility. I t i s recommended that teachers be eligible for training before the commencement o f teaching.
Social Protection
58. Social protection programs in St. Kitts and Nevis emphasize risk-coping strategies; that is, programs to help households cope with the effects o f risk (especially poverty) rather than prevention and mitigation strategies. Moreover, the existing social protection programs are not well poised to respond to either significant economic downturns or natural disasters. Since the mid- 1990s, social protection expenditures in St. Kitts and Nevis have been on average about 3.5 percent o f GDP. Although below the average for the Latin American region (4.7 percent o f GDP), any effort to strengthen social protection cannot include costly new programs, given the difficult fiscal position that the St. Kitts and Nevis government is facing. Rather, what are required are improved targeting and distribution systems that can provide a safety net for possible retrenchment in the public sector and the sugar industry and that can be geared up quickly in the case o f external economic or climatic shocks.
59. The government o f St. Kitts and Nevis has adopted a social protection strategy designed to ensure access to health care and primary education and to expand access to secondary and tertiary ed~cat ion .~ The government also attempts to ensure that other programs and services (including income support, food, clothing, housing, and utilities) are available for the poor, This stated, the existing social protection strategy is not clearly articulated or well coordinated. There i s an array o f programs in both St. Kitts and Nevis, with little
’ Both as a federation and as separate island states.
coordination among programs within or between islands. With the exception o f the Social Security Program, programs are financed and administered separately by the two islands. Although the government has expressed its intent to better coordinate i t s social protection programs, it has yet to establish a mechanism to oversee the development o f an integrated social protection strategy and a rationalized set o f programs. The result i s that social protection priorities are not clearly identified, and fiscal prioritization o f programs i s lacking. This i s reflected in the budgetary process during which budgets are essentially determined by previous budget allocations and not in response to changing needs and priorities.
60. The large number o f programs, each with separate administrative systems and procedures, strain an already overburdened public sector. The lack o f coordinated efforts across ministries and departments has resulted in overlaps, duplication, inefficiencies, and administrative waste. To the degree to which they serve the elderly, Social and Public Assistance and noncontributory Social Security target the same group. Moreover, Social Security, the Social and Public Assistance programs, the Student Education and Learning Fund (SELF), and the Ministry o f Health all have different systems for identifying beneficiaries. This increases administrative costs and time costs for beneficiaries. There i s a need to strengthen the planning and executing capacity for these programs and to put in place mechanisms for their fiscal prioritization.
6 1. Several programs, including the school lunch program for primary students and a school bus service for secondary students, are not targeted and are provided cost-free irrespective of income. In St. Kitts, health care subsidies are targeted based on categorical criteria (children, elderly, disabled) rather than income. Reducing program leakage and introducing targeting o f school feeding and a few waivers for health services to the poor would considerably ease pressure on the budget. Divestment o f programs to private providers (profit or nonprofit) could also result in cost savings. However, much-
x i i
needed capacity building and institution strengthening, including development o f targeting, management information systems (MIS), and survey capacity, would add development and administrative costs. Expanding program coverage with provision o f benefits conditional on activities that promote human capital also come with their own investment costs. The net fiscal impact of the above reforms would need to be carefully assessed.
62. Effective planning w i l l require updated poverty and labor market information at regular intervals. Timely and reliable information on poor and vulnerable groups is essential for the design and implementation o f social safety net programs. The Caribbean Development Bank (CDB)-financed Poverty Assessment that was conducted in 1999 provided useful information; however, data on poverty and labor markets need to be collected on a regular basis.
63. Budgeting and management information systems also need to be strengthened. Several programs, including cash transfer and labor market programs, are not identified in the government’s budgets as separate programs. This limits effective planning and weakens fiscal accountability. Elevating social protection activities to program status would mean that expenditures, including expenditures by object code, could be easily tracked over time and evaluated with respect to program inputs and outcomes. In addition, management information systems need to be computerized.
64. Inadequate MIS systems and capacity constraints with respect to data collection, monitoring, and evaluation are common across the OECS. Regional initiatives to M I S development and monitoring and evaluation capacity building would address the human resource constraints in individual countries and would be more cost effective than developing systems on a country-by-country basis.
... X l l l
E .Y > s
> x .-
E
8 E Y
c CA
E b Y
5 c 2Y
o 0
9 9
2: 4 0 I
Y
2
U 0 3
E 3 8 Y Y
c Yl
> X
L k! Y il 0 c n
r P Y
5 8 L
4 3 z m Y
.- > x
E e, Y
E 5 8 Y
F v)
E 0 Ld .- Y
Y 8 rr G
Y m
E b Y
.3 G B
1
Y Q 0 m - x U 0
E ."
€ e, Y
E e, Y
i E 5
3 3 v3
M c M c 0

1. FISCAL DEFICIT, PUBLIC DEBT, AND FISCAL SUSTAINABILITY
1.1 St. Kitts and Nevis i s a two-island federation in the Eastern Caribbean with a combined population o f about 45,000 inhabitants (of whom 75 percent l ive in St. Kitts) and a GN1)of US$ 6,980 in 2003 (World Bank Atlas Methodology, current US$). The economy has traditionally depended on the production and export of sugar. However, in the last decade traditional economic activities such as agriculture have given way to a service-based economy.
1.2 St. Kitts and Nevis, as a member of the Eastern Caribbean Currency Union (ECCU), shares a common central bank, the Eastern Caribbean Central Bank (ECCB), and a common currency with the other five independent members o f the Organization of Eastern Caribbean States (OECS) and the two U.K. territories o f Anguilla and Montserrat.’ Their currency i s the Eastern Caribbean dollar, which has been pegged to the U.S. dollar since 1976 at EC$2.70 per US$1. The commitment to a fixed exchange rate and a prudent monetary policy under the ECCU umbrella has been a key element in maintaining an inflation rate close to international levels.
1.3 Notwithstanding a common central bank and a common currency, each member country conducts fiscal policy independently, and scant efforts have been made for a common fiscal policy in the region. Nevertheless, the deterioration o f the ECCU fiscal position in recent years, due mainly to the high fiscal deficits in Antigua, Dominica, and St. Kitts and Nevis, has reinitiated the discussion among i t s members o f the need to coordinate fiscal policies to ensure the stability o f the currency union.’
1.4 St. Kitts and Nevis’s fiscal position has deteriorated sharply since the mid-1990s. The main reasons for this deterioration are increases in the wage bill and capital expenditure in response to hurricane repair, a weakening of the finances of the state- owned St. Kitts Sugar Manufacturing Company (SSMC), increased expenditures linked to legislative elections that took place in July 1995 and March 2000, and increased debt service.
1.5 In light of the preceding discussion, the main objective o f th is chapter i s twofold: first, to evaluate the fiscal sustainability o f the St. Kitts and Nevis Central Government (CG) and public sector in the short and medium term, and second, to propose various options for the adjustment required to achieve fiscal sustainability.
1.6 The main findings and recommendations can be summarized as follows:
* The OECS consists o f six independent members: Antigua and Barbuda, Dominica, Grenada, St. Kitts and Nevis, St. Lucia, and St. Vincent and the Grenadines, and three dependent territories of the United Kingdom, Montserrat (full member), Anguilla, and the British Virgin Islands (associate members).
The communiqut of the Special Meeting of the OECS Authority, Castries, St. Lucia, September 28,2001 alludes to the need to examine in the medium term public sector reform, aimed at increasing efficiency, and fiscal reform including matters related to revenue, expenditure, financing, and debt management, as well as common approaches to taxation and incentives to be applied to cruise shipping.
0 The fiscal policy conducted by the government since the mid-1990s has been unsustainable in the short and medium term, and w i l l continue to be unsustainable in the next years unless the government adjusts i t s expenditures to the revenues mobilized. The size of the adjustment required to achieve fiscal sustainability o f the CG in 2003 i s about 14 to 16 percent of GDP, depending on the assumptions of real interest and growth rate.
0 The proposed fiscal adjustment relies mainly on expenditure cuts (in particular in the wage bill and containment o f capital expenditures). The adoption of the tax policy recommendations suggested by the International Monetary Fund (IMF) would yield an increase in revenue collection of only about 2 percent o f GDP, in contrast to a required adjustment o f about 14 to 16 percent to achieve fiscal sustainability .
0 If the public enterprises are included in the exercise, then the government w i l l need to adjust additional 2 to 3 percentage points o f GDP to ensure the fiscal sustainability o f the public sector. A prompt decision by the government on the possible closing o f the SSMC would be a step forward in the fiscal sustainability o f the public sector.
I. ST. KITTS AND NEVIS FISCAL PERFORMANCE, 1990-2002
Figure 1.1 St Kitts and Nevis Central Government Fiscal Performance 1990.2002
(as % of COP) 5.00 1.7 At the Central
Government level, since 1995 the 0.00 fiscal position of St. Kitts and -5.00 Nevis has progressively -10.00 weakened.” As Figure 1.1 shows, the St. Kitts and Nevis CG -15.00
Swce:ECCE and hF followed a cautious fiscal policy from 1990 to 1994. During this
-20.00 ’ period, the CG ran a primary 0 Primary Fiscal Balance (after grants) surplus (after grants) in 1990-93, and a small primary deficit in -Overall Fiscal Balance (after grants) 1994. However, from 1995 onward the fiscal situation worsened. In 1995, the CG ran a primary deficit o f 3.3 percent o f GDP; i t was contained in 1996 and 1997, but rose again in 1998, and by 2000 was 9.4 percent o f GDP. In 2001, the CG reduced i t s primary deficit to 6.7 percent o f GDP, but in 2002, the primary deficit reached 10.8 percent o f GDP-the highest primary deficit since 1990.
r!T Current Fiscal Balance
~~~ ~
lo The source of the data used in this chapter i s the ECCB for 1990-1995, and the IMF for 1996-2002. Two different sources are used because from 1996 onward the St. Ki t ts and Nevis government has recorded a significant amount of capital expenditures “below the line,” transactions that the M F has moved “above the line” in their fiscal figures, but which the ECCB has done only in selected years.
2
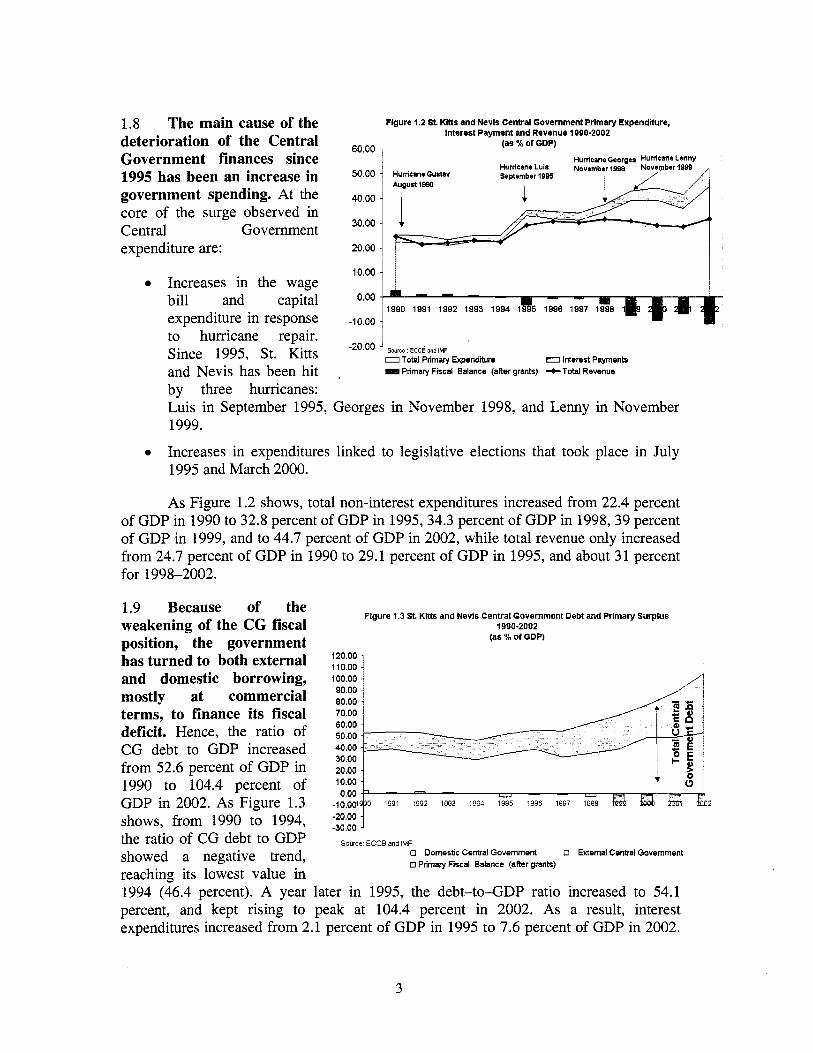
1.8 The main cause of the deterioration of the Central 60,00
Government finances since 1995 has been an increase in 50.00
government spending. At the 40.00
core of the surge observed in Central Government 30.00
expenditure are: 20.00
Figure 1.2 St Kltts and Nevis Central Government Prlmary Expenditure, Interest Payment and Revenue 1990-2002
(as X of GDP)
September 1995 - Hurncane Gustav August lggo
10.00
0.00 0 Increases in the wage
bill and capital expenditure in response -10.00
to hurricane repair.
1990 1991 1992 1993 1994 1
-20'oo Sourca ECCB and IMF Since 1995, St. Kitts 0 Total Primary Expenditure E3 Interest Payments and Nevis has been hit . I Pnmaty Fiscal Balance ( a b r grants) +Total Revenue
by three hurricanes: Luis in September 1995, Georges in November 1998, and Lenny in November 1999.
Increases in expenditures linked to legislative elections that took place in July 1995 and March 2000.
0
As Figure 1.2 shows, total non-interest expenditures increased from 22.4 percent of GDP in 1990 to 32.8 percent of GDP in 1995,34.3 percent of GDP in 1998,39 percent of GDP in 1999, and to 44.7 percent of GDP in 2002, while total revenue only increased from 24.7 percent of GDP in 1990 to 29.1 percent of GDP in 1995, and about 31 percent for 1998-2002.
1.9 Because of the weakening of the CG fiscal position, the government has turned to both external and domestic borrowing, mostly at commercial terms, to finance i ts fiscal deficit. Hence, the ratio of CG debt to GDP increased from 52.6 percent of GDP in 1990 to 104.4 percent of GDP in 2002. As Figure 1.3 shows, from 1990 to 1994, the ratio of CG debt to GDP showed a negative trend, reaching i t s lowest value in
Figure 1.3 St. Kitts and Nevis Central Government Debt and Primary Surplus 1990-2002
(as % Of GDP)
120.00 110.00 100.00 90.00 80.00 70.00 60.00 50 00 40.00 30 00 20.00 10.00 1 + S I
0 00 -10.001 2 -20.00 -30 00
Sourca ECCB and IMF 0 Domestic Central Government 0 External Cenbal Government 0 Primary Fiscal Balance (aRer grants)
1994 (46.4 percent). A year later in 1995, the debt-to-GDP ratio increased to 54.1 percent, and kept rising to peak at 104.4 percent in 2002. As a result, interest expenditures increased from 2.1 percent of GDP in 1995 to 7.6 percent of GDP in 2002.
3
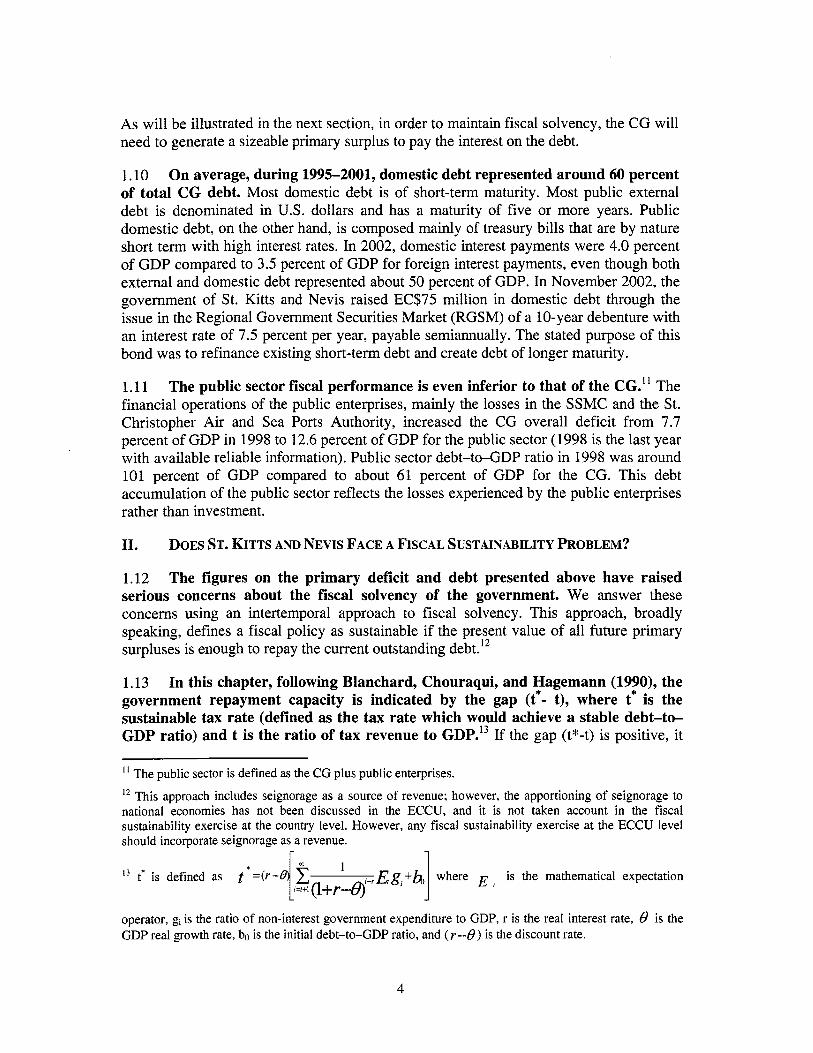
As wil l be illustrated in the next section, in order to maintain fiscal solvency, the CG wi l l need to generate a sizeable primary surplus to pay the interest on the debt.
1.10 On average, during 1995-2001, domestic debt represented around 60 percent of total CG debt. Most domestic debt i s of short-term maturity. Most public external debt i s denominated in U.S. dollars and has a maturity of five or more years. Public domestic debt, on the other hand, i s composed mainly of treasury bills that are by nature short term with high interest rates. In 2002, domestic interest payments were 4.0 percent of GDP compared to 3.5 percent o f GDP for foreign interest payments, even though both external and domestic debt represented about 50 percent of GDP. In November 2002, the government o f St. Kitts and Nevis raised EC$75 million in domestic debt through the issue in the Regional Government Securities Market (RGSM) of a 10-year debenture with an interest rate of 7.5 percent per year, payable semiannually. The stated purpose o f this bond was to refinance existing short-term debt and create debt o f longer maturity.
1.11 The public sector fiscal performance i s even inferior to that of the CG.' ' The financial operations of the public enterprises, mainly the losses in the SSMC and the St. Christopher Air and Sea Ports Authority, increased the CG overall deficit from 7.7 percent o f GDP in 1998 to 12.6 percent o f GDP for the public sector (1998 i s the last year with available reliable information). Public sector debt-to-GDP ratio in 1998 was around 101 percent of GDP compared to about 61 percent of GDP for the CG. This debt accumulation o f the public sector reflects the losses experienced by the public enterprises rather than investment.
11. DOES ST. KITTS AND NEVIS FACE A FISCAL SUSTAINABILITY PROBLEM?
1.12 The figures on the primary deficit and debt presented above have raised serious concerns about the fiscal solvency of the government. We answer these concerns using an intertemporal approach to fiscal solvency. This approach, broadly speaking, defines a fiscal policy as sustainable if the present value o f all future primary surpluses i s enough to repay the current outstanding debt.12
1.13 In this chapter, following Blanchard, Chouraqui, and Hagemann (1990), the government repayment capacity i s indicated by the gap (t*- t), where t* i s the sustainable tax rate (defined as the tax rate which would achieve a stable debt-tc+ GDP ratio) and t is the ratio of tax revenue to GDP.13 I f the gap (t*-t) i s positive, i t
I' The public sector i s defined as the CG plus public enterprises.
l2 This approach includes seignorage as a source of revenue; however, the apportioning o f seignorage to national economies has not been discussed in the ECCU, and it i s not taken account in the fiscal sustainability exercise at the country level. However, any fiscal sustainability exercise at the ECCU level should incorporate seignorage as a revenue.
r 1
where E , i s the mathematical expectation 1
l3 t* i s defined as t * = ( r -
operator, gi i s the ratio o f non-interest government expenditure to GDP, r i s the real interest rate, 8 i s the GDP real growth rate, bo i s the initial debt-to-GDP ratio, and ( r - 0 ) i s the discount rate.
4
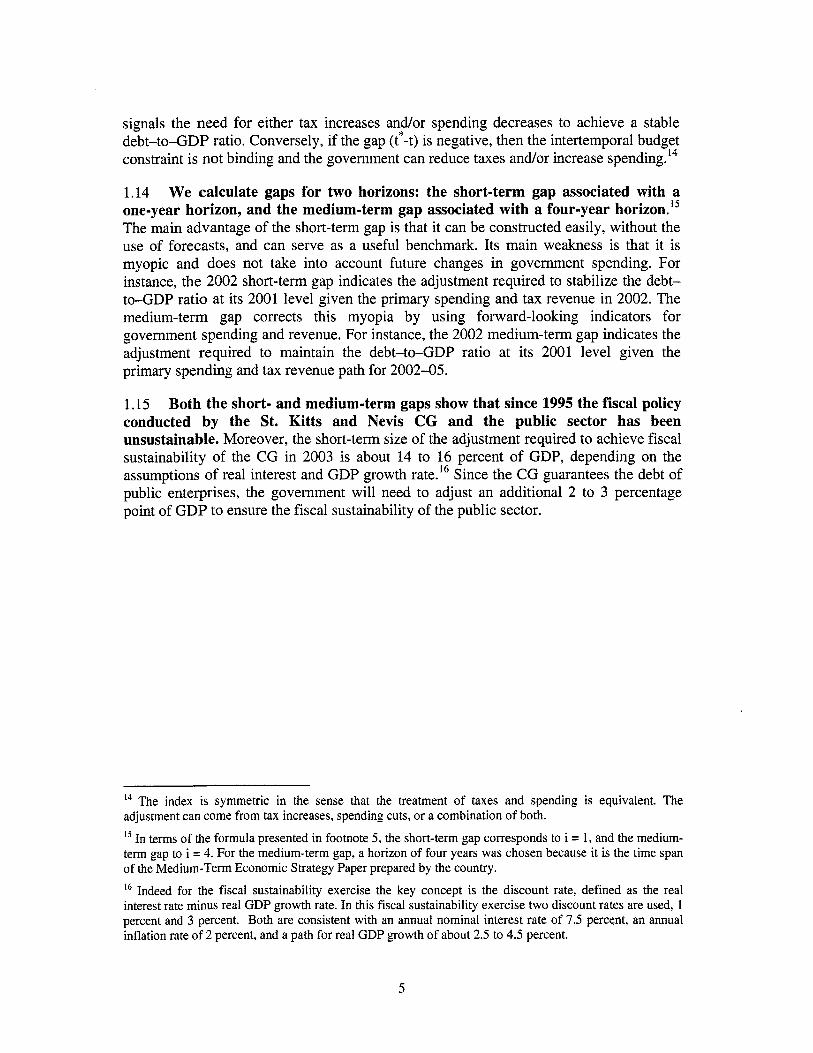
signals the need for either tax increases and/or spending decreases to achieve a stable debt-to-GDP ratio. Conversely, if the gap (t*-t) i s negative, then the intertemporal budget constraint i s not binding and the government can reduce taxes and/or increase ~pending. '~
1.14 We calculate gaps for two horizons: the short-term gap associated with a one-year horizon, and the medium-term gap associated with a four-year h ~ r i z o n . ' ~ The main advantage o f the short-term gap i s that i t can be constructed easily, without the use of forecasts, and can serve as a useful benchmark. I t s main weakness i s that it i s myopic and does not take into account future changes in government spending. For instance, the 2002 short-term gap indicates the adjustment required to stabilize the debt- to-GDP ratio at i ts 2001 level given the primary spending and tax revenue in 2002. The medium-term gap corrects this myopia by using forward-looking indicators for government spending and revenue. For instance, the 2002 medium-term gap indicates the adjustment required to maintain the debt-to-GDP ratio at i t s 2001 level given the primary spending and tax revenue path for 2002-05.
1.15 Both the short- and medium-term gaps show that since 1995 the fiscal policy conducted by the St. Kitts and Nevis CG and the public sector has been unsustainable. Moreover, the short-term size o f the adjustment required to achieve fiscal sustainability of the CG in 2003 i s about 14 to 16 percent o f GDP, depending on the assumptions of real interest and GDP growth rate.16 Since the CG guarantees the debt o f public enterprises, the government w i l l need to adjust an additional 2 to 3 percentage point of GDP to ensure the fiscal sustainability of the public sector.
l4 The index i s symmetric in the sense that the treatment of taxes and spending i s equivalent. The adjustment can come from tax increases, spending cuts, or a combination o f both.
Is In terms o f the formula presented in footnote 5, the short-term gap corresponds to i = 1, and the medium- term gap to i = 4. For the medium-term gap, a horizon o f four years was chosen because it i s the time span of the Medium-Term Economic Strategy Paper prepared by the country.
l6 Indeed for the fiscal sustainability exercise the key concept i s the discount rate, defined as the real interest rate minus real GDP growth rate. In this fiscal sustainability exercise two discount rates are used, 1 percent and 3 percent. Both are consistent with an annual nominal interest rate of 7.5 percent, an annual inflation rate o f 2 percent, and a path for real GDP growth o f about 2.5 to 4.5 percent.
5
Central Government
Figure 1.4 S t Kilts and Nevis Central Government Short-Term Fiscal Gap 1.16 W e can distinguish 1991-2002 (as Z GDP) two periods in the short-term (one- year horizon) fiscal 16M 1
1400 .
policy conducted by the CG. E The first period, 1991-94, is 8 l 2 O 0 -
characterized by a 31000- sustainable fiscal policy and 8 am1
ae n
- consequently decreasing ; debt-to-GDP ratio.” Figure 4oo
1.4 shows that the size of the f
fiscal adjustment required to c maintain a stable debt-to-GDP O M
ratio was on average negative at
s 2M
2 0 0 -e I-, -9
a discount rate (real interest rate OShot .Tem Gap (Discount rate 3 5) U S h o h T e n n Gap (Discount Rate 1 8) - T O ~ I Central Government Deb1
minus real GDP growth rate) of 1 percent, or positive but small at a discount rate o f 3 percent. That is, the CG could have reduced taxes and/or increased expenditures slightly at a discount rate of 1 percent.
1.17 The second period, 1995-2002, i s characterized by an unsustainable short- term fiscal policy and therefore an increasing debt-tWGDP ratio. Every year since 1995 the fiscal adjustment required to achieve a sustainable debt-to-GDP ratio was positive and sizeable at discount rates of 1 and 3 percent. In particular, for 2002 the adjustment required to stabilize the CG debt-to-GDP ratio (to i t s 2001 level) was about 12 percent o f GDP at a discount rate of 1 percent, and 13 percent o f GDP at a discount rate o f 3 percent. That i s to say, government expenditures needed to be cut and or taxes to be increased by 12 to 13 percent o f GDP in one year in order to achieve a constant debt- to-GDP ratio.18
1.18 For 2003-05, the short-term fiscal gap projections show that the fiscal policy will remain unsustainable if the CG keeps i ts primary expenditure and tax revenue at the level observed in 2002.19 As Figure 1.5 shows, in 2003 the adjustment required from the CG to stabilize i t s debt-to-GDP ratio at i t s 2002 level i s between 14 and 16 percent of GDP, depending on discount rate assumptions. That is, government expenditures need to be cut and/or taxes to be increased by 14 to 16 percent o f GDP. If by 2005 no adjustment has taken place, the debt-to-GDP ratio w i l l increase to about 154 percent o f GDP, and the adjustment required wi l l be 14 to 17 percent o f GDP, depending on discount rate assumptions.
” The short-term gap is constructed by using the following equation: (t*-t) = ( r -8 )bo - si.
Blanchard, Chouraqui, and Hagemann (1990) present estimates o f the short-term and medium-term gap for OECD countries that fluctuate between -3.5 percent o f GDP in 1989 for the U.K., and 6.4 percent o f GDP in 1985 for Italy.
l 9 The projections for the scenario without IMF tax recommendations assume a primary level o f expenditures and revenues in 2003-05 similar to the 2002 level. The scenario with IMF tax recommendations assumes a tax revenue-to-GDP ratio higher by 2 percentage points in 2004 and 2005.
6
1.19 The adoption of the IMF tax policy recommendations wil l reduce the short-term fiscal gap only slightly. In order to achieve a sustainable fiscal policy the fiscal adjustment wil l have to rely mainly on expenditure cuts. As Figure 1.5 shows, the adjustment required in 2005, if the IMF tax policy recommendations are adopted, i s between 12 and 16 percent of GDP compared to 14 to 16
18 M
d ISM 0 14M
2 12M
Q low
g 8M
ae
!!
E 600 2 e
E
4M
a 2M
om
Figure 1.5 St. Kitts and Nevis Central Government Projected Short-Term Fiscal Gap 2003-2005
(as % COP)
Wlth IMF Tax Recommendations Wimout IMF T u Recommendations
2003 m m Source Authots calculanons
2033
percent o f GDP without the adoption o f the IMF tax recommendations. This size o f adjustment is high (equivalent to a primary surplus o f between 3 and 4 percent o f GDP) and it would be difficult to achieve in the short term even with a major fiscal reform.20
1.20 The proposed adjustment for the CG, 14 to 16 percent of GDP, wil l only stabilize the debt-to-GDP ratio to about 100 percent of GDP in future years. This type of debt sustainability analysis does not address the optimal level o f indebtedness, i t s composition, or political economy considerations. Nevertheless, today St. Kitts and Nevis has one o f the highest debt-to-GDP ratios in the world, and interest expenditures on i ts debt amount to about 7 to 8 percent o f GDP.
1.21 The target of debt-to-GDP ratio for the C G of 60 percent has been proposed by the ECCB's Monetary Council and would require that the C G generate consistent primary surpluses of about 20 percent of GDP for the next 4- 5 years. However, these figures for primary surplus may be politically unfeasible, even with growth rates o f 6 to 7 percent of GDP.
1.22 The use of government liquid assets (cash plus tradable shares) can only partially contribute to reduce the debt stock. This i s because as o f December 2001, the ratio o f liquid assets to debt was only 7 percent.2'0ther assets (land, port, etc.) could be used to reduce the debt stock. But any privatization should not be driven by revenue considerations alone, but rather by sectoral efficiency criteria, including establishing an adequate regulatory framework to ensure that public monopolies are not replaced by unregulated and inefficient private monopolies.
The short-term gap in 2003 with and without implementation o f the IMF tax recommendations is the same because we assume that the increase in revenue collection wi l l start in 2004.
*' The liquid assets considered were cash (EC$ 14.8 million as of December 2002) and shares in the St. Kitts-Nevis-Anguilla National Bank, the St. Kitts Tourism Development Corporation, the Caribbean Shoe Manufacturers, the Leeward Island Air Transport, CARICOM Corn Soya Bean Company, the Development Bank of St. Kitts and Nevis, the St. Kitts and Nevis Telecommunications, the St. Kitts and Nevis Cable Communications, and the St. Kitts Urban Development Corporation, all with a total nominal value o f EC$37 million as of December 200 1.
7
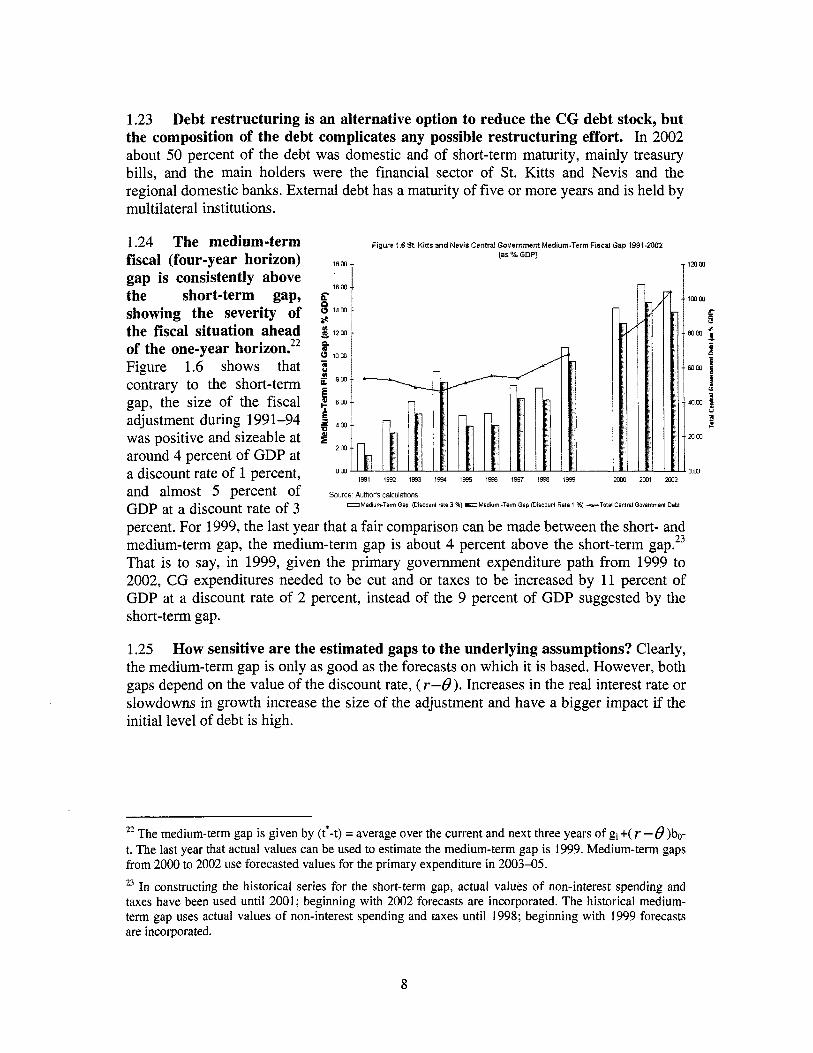
1.23 Debt restructuring is an alternative option to reduce the CG debt stock, but the composition of the debt complicates any possible restructuring effort. In 2002 about 50 percent o f the debt was domestic and o f short-term maturity, mainly treasury bills, and the main holders were the financial sector of St. Kitts and Nevis and the regional domestic banks. External debt has a maturity of five or more years and i s held by multilateral institutions.
1.24 The medium-term Figure 1 6 St Kitts and Nevis Csntral Government Medium-Term Fiscal Gap 1991 -2002 (as% GDP) fiscal (four-year horizon) 18m
gap is consistently above the short-term gap, c showing the severity of $ 14M
the fiscal situation ahead 812, 22 8 of the one-year horizon.
Figure 1.6 shows that ; contrary to the short-term '0° c gap, the size o f the fiscal e 6~
adjustment during 1991-94 5 O m P was positive and sizeable at E 2(JD
around 4 percent o f GDP at a discount rate o f 1 percent, and almost 5 percent of Source ~ ~ t h ~ f ~ calculations
GDP at a discount rate o f 3 percent. For 1999, the last year that a fair comparison can be made between the short- and medium-term gap, the medium-term gap i s about 4 percent above the short-term gap.23 That i s to say, in 1999, given the primary government expenditure path from 1999 to 2002, CG expenditures needed to be cut and or taxes to be increased by 11 percent o f GDP at a discount rate o f 2 percent, instead of the 9 percent o f GDP suggested by the short-term gap.
16 m
-
om 1931 1992 1993 IS94 1935 1596 1997 1998 1% 2000 2m1 202
UMedium-Terrn Gap (Dircount rat^ 3 %) E3 Medium -Term Gap (Dacounl Rate 1 %] -Total Central Government Deht
1.25 How sensitive are the estimated gaps to the underlying assumptions? Clearly, the medium-term gap i s only as good as the forecasts on which it i s based. However, both gaps depend on the value o f the discount rate, ( r - 0 ) . Increases in the real interest rate or slowdowns in growth increase the size o f the adjustment and have a bigger impact if the initial level of debt i s high.
22 The medium-term gap i s given by (t*-t) = average over the current and next three years of gi +( r - 0 )bo- t. The last year that actual values can be used to estimate the medium-term gap i s 1999. Medium-term gaps from 2000 to 2002 use forecasted values for the primary expenditure in 2003-05.
23 In constructing the historical series for the short-term gap, actual values o f non-interest spending and taxes have been used until 2001 ; beginning with 2002 forecasts are incorporated. The historical medium- term gap uses actual values o f non-interest spending and taxes until 1998; beginning with 1999 forecasts are incorporated.
8
Public Sector
1.26 I f the public enterprises are included in the exercise, in particular the losses of the S M C C and the St. Christopher Air and Sea Ports Authority, then the government will need to adjust in the short term an additional 2 to 3 percentage points of GDP to ensure the solvency of the public sector. For 1998, the last year with available reliable information on the primary balance o f the public enterprises, the adjustment required to achieve fiscal sustainability in the public sector i s about 2 percentage points higher than the one required by the CG at a discount rate o f 1 percent, and around 3 percentage points at a discount rate o f 3 percent.
Fiscal Rules in the ECCU
1.27 The ECCB’s Monetary Council that took place in February 2003 reconfirmed the agreed fiscal framework that includes ceilings on debt and fiscal performance of the CG.24 The aim of the ECCB in setting these fiscal rules i s to ensure long-run fiscal sustainability and the credibility o f the currency union by limiting negative spillovers. However, as we discussed in paragraph 1.3, the ECCB has no mandate over fiscal policy in any member country, and the fiscal rules are not binding at this moment for the member states. Box 1.1 presents the convergence criteria in the ECCU and the Western Africa Economic and Monetary Union (WAEMU). The- WAEMU, l ike the ECCU, comprises developing countries with a currency pegged to only one single currency, the Euro.
1.28 In 2002, St. Kitts and Nevis did not meet any of the four debt and fiscal performance ceilings proposed by the ECCB’s Monetary Council. Every year since 1991, the CG has run a current account surplus below the 4 to 6 percent o f GDP target. The target for overall deficit has been reached in only 3 o f the last 12 years. The debt-to- GDP target was achieved every year Until 1998, and the debt service-to-current revenue target has not been met since 2000.
1.29 At the time of the reconfirmation o f the fiscal framework agreement, the ECCB’s Monetary Council regarded 2007 as a critical date for fiscal consolidation. This deadline for convergence seems unrealistic based on the fiscal performance o f St. Kitts and Nevis in 2002: (a) current deficit o f about 5 percent o f GDP, (b) overall deficit of 20 percent of GDP, (c) debt-to-GDP ratio o f 104.4, and (d) debt service to current revenue o f 24 percent o f GDP. Indeed, th is four-year horizon would require a fiscal adjustment higher (primary surplus o f about 20 percent of GDP) than the one discussed in the previous section (primary surplus o f 3 to 4 percent o f GDP) if the objective i s to meet the proposed 60 percent o f GDP debt ceiling by 2007. Moreover, the WAEMU experience to meet the primary criteria in a three-year span was unsuccessful and i t was extended three additional years (to end-December 2005).
24 The methodology used to set the deficit and fiscal ceilings i s discussed in two ECCB documents, “Developing Sustainable Debt Indicators for the ECCB,” July 2001; and “The Targeted Public Sector Savings in the member countries of the ECCB” (undated).
9
Box 1.1 The Convergence Criteria in the ECCU and WAEMU
Eastern Caribbean Currency Union (ECCU)
The ECCB has put forward a proposal that comprises the following four targets to be achieved by 2007:
Central Government current account surplus o f 4 to 6 percent o f GDP; Overall Central Government budget deficit o f no more than 3 percent o f GDP;
Total outstanding Central Government debt o f no more than 60 percent o f GDP; and Debt service payments by the Central Government o f no more than 15 percent o f current revenue.
Western African Economic and Monetary Union (WAEMU)*
The regional Convergence, Stability, Growth, and Solidarity Pact adopted in December 1999 by the WAEIvfU has four primary convergence criteria and four secondary criteria. The norms established by these criteria had to be met by 2002. The primary criteria are:
Ratio o f the basic fiscal balance to nominal GDP must be 0 percent or more; Ratio o f outstanding domestic and foreign debt to nominal GDP must not exceed 70 percent; Average annual inflation cannot be more than 3 percent a year; and Nonaccumulation o f domestic and external payment arrears in the current fiscal period.
The secondary criteria are: Ratio o f the wage bill to tax revenue cannot exceed 35 percent; Ratio o f domestically financed public investment to tax revenue must be at least 20 percent; Ratio of current external deficit excluding grants to nominal GDP cannot exceed 5 percent; and Tax-to-GDP ratio must be 17 percent or more.
However, because o f the limited progress achieved by the member co,untries in meeting the convergence criteria at end-December 2002, the WAEMU Commission proposed to the heads o f state to extend the timetable to end-December 2005.
* The eight members o f the WAEMU are Benin, Burkina Faso, CBte d' IvBire, Guinea-Bissau, Mali, Niger, Senegal, and Togo.
1.30 The successful achievement of debt and fiscal ceilings needs the simultaneous introduction of a system of incentives and penalties against noncompliance, and a mechanism for monotoring and surveillance of the fiscal performance. The ECCB has not yet specified any system or mechanisms to ensure compliance with the proposed fiscal ceilings. Moreover, the WAEMU example suggests that survaillance o f the fiscal ceilings and close monitoring against annual targets during the convergence phase i s key to achieving fiscal convergence.
1.31 The ECCB-proposed fiscal ceilings only cover the CG, while public enterprises and government guaranteed debt have been excluded. However, as the fiscal sustainability exercise conducted in the last section suggests, the public sector position i s critical and should be included in any proposal o f deficit and debt ceilings. Moreover, the inclusion o f the public sector into the fiscal framework would ensure that the government would produce accurate and timely information on the financial position of the public enterprises and i ts debts.
10
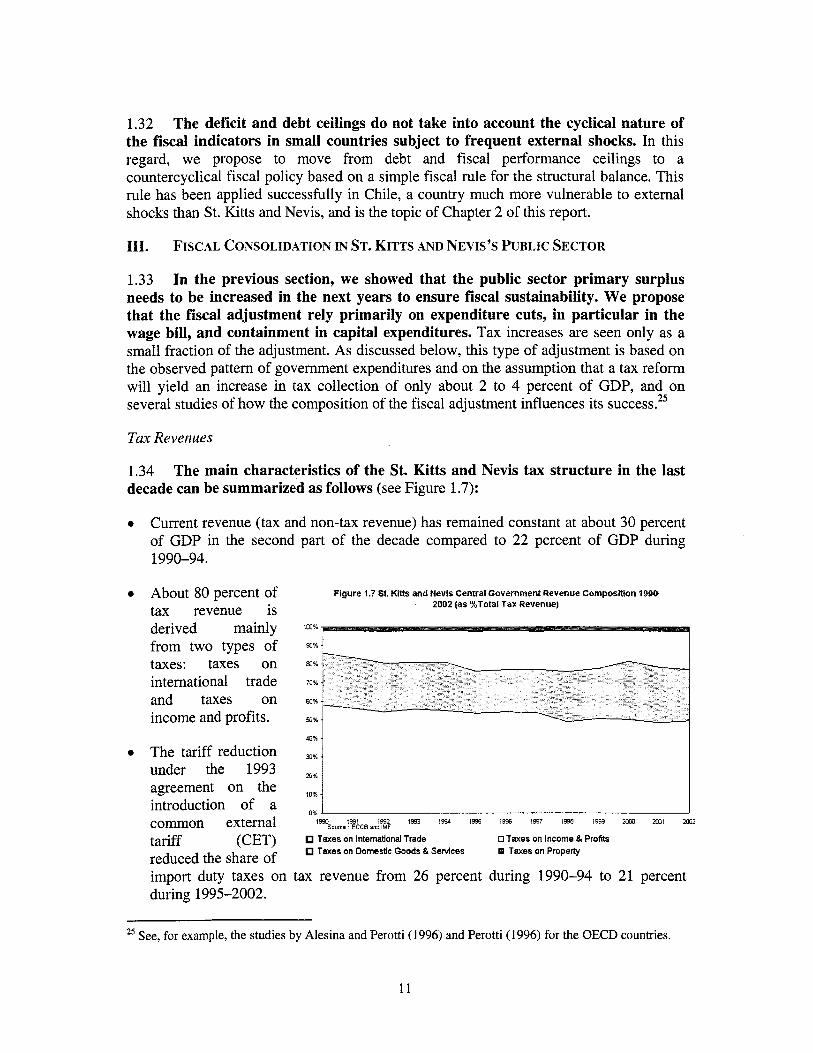
1.32 The deficit and debt ceilings do not take into account the cyclical nature of the fiscal indicators in small countries subject to frequent external shocks. In this regard, we propose to move from debt and fiscal performance ceilings to a countercyclical fiscal policy based on a simple fiscal ru le for the structural balance. This rule has been applied successfully in Chile, a country much more vulnerable to external shocks than St. Kitts and Nevis, and i s the topic of Chapter 2 o f this report.
111. FISCAL CONSOLIDATION IN ST. KITTS AND NEVIS’S PUBLIC SECTOR
1.33 In the previous section, we showed that the public sector primary surplus needs to be increased in the next years to ensure fiscal sustainability. W e propose that the fiscal adjustment rely primarily on expenditure cuts, in particular in the wage bill, and containment in capital expenditures. Tax increases are seen only as a small fraction of the adjustment. As discussed below, this type o f adjustment i s based on the observed pattern o f government expenditures and on the assumption that a tax reform wi l l yield an increase in tax collection o f only about 2 to 4 percent of GDP, and on several studies of how the composition of the fiscal adjustment influences i ts success.25
Tax Revenues
1.34 decade can be summarized as follows (see Figure 1.7):
The main characteristics of the St. Kitts and Nevis tax structure in the last
Current revenue (tax and non-tax revenue) has remained constant at about 30 percent of GDP in the second part o f the decade compared to 22 percent o f GDP during 1990-94.
About 80 percent o f Figure 1.7 St. Kitts and Nevis Central Government Revenue Composltion 1990. 2002 (as %Total l a x Revenue) tax revenue i s
derived mainly l m %
from two types o f 90%
taxes: taxes on a%
international trade 70%
and taxes on 60%
income and profits. yJ%
40%
The tariff reduction 30%
under the 1993 zo%
agreement on the introduction of a ox
tariff reduced the share o f import duty taxes on tax revenue from 26 percent during 1990-94 to 21 percent during 1995-2002.
1990 1991 1992 1993 1994 1995 1996 1997 1998 1999 2XC XOl 2002 common external Source ECCB and IMF
(CET) Taxes on International Trade Taxes on Dornedc Goods &Services
fi Taxes on Income 8, Profits Taxes on Property
25 See, for example, the studies by Alesina and Perotti (1996) and Perotti (1996) for the OECD countries.
11
0 Taxes on income and profits represented 26 percent o f tax revenue during 1990- 2002. There i s no tax on personal income, although income from employment i s subject to taxation through the social services levy, which i s a payroll tax. The absence o f a personal income tax, although rare in other developing countries, i s a feature present in a few other OECS countries. Consequently, the main source o f revenue in this category i s corporate income tax, about 17 percent of tax revenue, and the payroll tax.
0 Taxes on domestic goods and services increased as a percentage o f tax revenue from 16 percent during 1990-94 to 20 percent during 1995-2001. This category includes a number of excises and licenses on specific goods and services; the largest ones are the tax on hotels and services, the gasoline levy, and the stamp duty. The gasoline levy, contrary to other taxes on domestic goods and services, i s the residual o f the retail price (fixed by the government) minus the cost, insurance, and freight (CIF) price o f the imported product and the fixed margins for importers and retailers. This net tax can be negative and fluctuates with the CIF price if the retail price i s not adjusted. The experience in St. Kitts and Nevis i s that after an increase in the CIF prices, retail prices are kept fixed and net tax absorbed the increase. The government should introduce an automatic pricing and taxation mechanism for adjusting petroleum prices in l ine with international price movements.
0 Property taxes on the rental income from houses and on land contribute a modest 2 percent o f the total tax revenue intake. Non-tax revenue represented roughly 8 percent o f GDP between 1990 and 2002. Capital revenue and grants contributed only 1 percent o f GDP in the same period.
1.35 During 1996-2000, the revenue forgone by the St. Kitts and Nevis Central Government in customs duties, due to tax concessions, was on average 18 percent of GDP?6 A key feature o f the present tax system in St. Kitts and Nevis i s the pervasive use o f tax concession^.^^ As Table 1.1 shows, hotels and tourism received the highest proportion o f tax credits followed by special agreements and fiscal incentives. In the extreme case, for example, where all exemptions to hotel and tourism were repealed, a revenue gain of 6 to 8 percent of GDP would be expected, assuming zero elasticity o f imports with respect to tariffs.
26 All tax concessions pay the so-called consumption tax on CIF imports.
’’ An elaborate system of import duty exemptions provides for very generous concessions for taxes on imports for the development of industry, tourism, agriculture, social, educational, cultural, and other purposes. The main exemptions are provided under the Customs Act, the Fiscal Incentive Act, and the Hotel Aid Ordinance. Also, some investors benefit from income tax holidays.
12
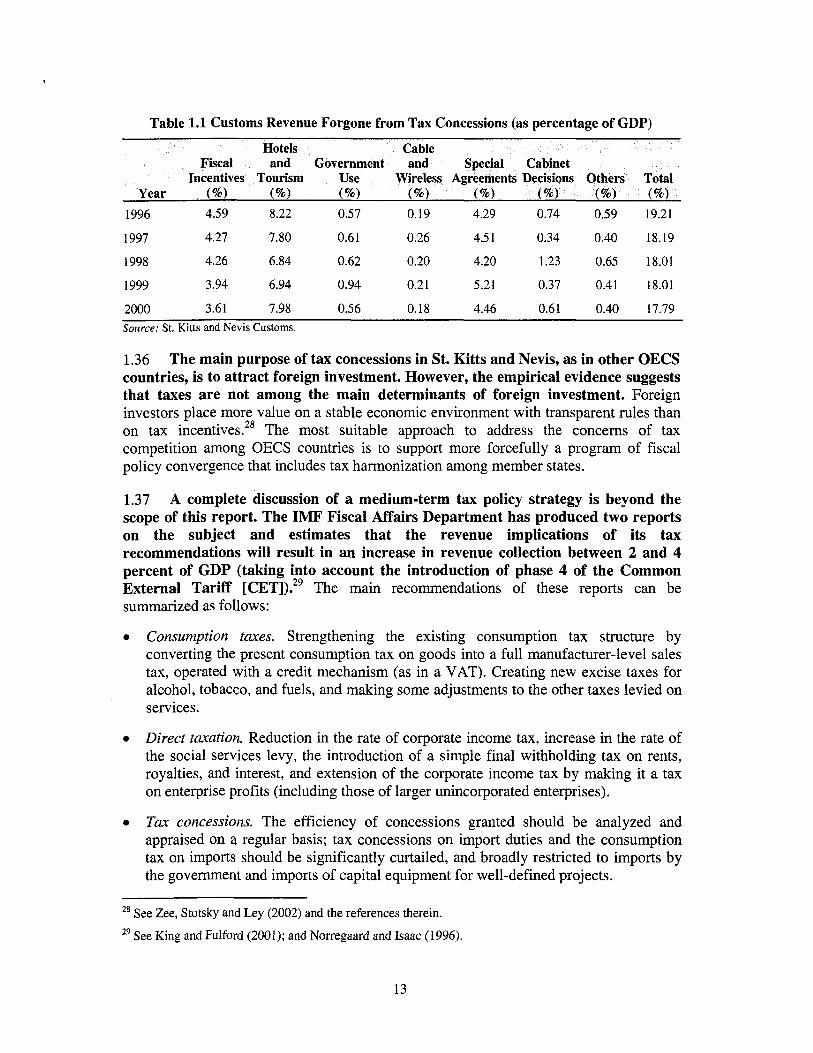
Table 1.1 Customs Revenue Forgone from Tax Concessions (as percentage of GDP)
Fiscal and Government and
1996 4.59 8.22 0.57 0.19 4.29 0.74 0.59 19.21
1997 4.27 7.80 0.6 1 0.26 4.5 1 0.34 0.40 18.19
1998 4.26 6.84 0.62 0.20 4.20 1.23 0.65 18.01
1999 3.94 6.94 0.94 0.2 1 5.21 0.37 0.41 18.01
2000 3.61 7.98 0.56 0.18 4.46 0.6 1 0.40 17.79 Source: St. Kitts and Nevis Customs.
1.36 The main purpose of tax concessions in St. Kitts and Nevis, as in other OECS countries, is to attract foreign investment. However, the empirical evidence suggests that taxes are not among the main determinants of foreign investment. Foreign investors place more value on a stable economic environment with transparent rules than on tax incentives.28 The most suitable approach to address the concerns o f tax competition among OECS countries i s to support more forcefully a program o f fiscal policy convergence that includes tax harmonization among member states.
1.37 A complete discussion of a medium-term tax policy strategy i s beyond the scope of this report. The IMF Fiscal Affairs Department has produced two reports on the subject and estimates that the revenue implications of its tax recommendations will result in an increase in revenue collection between 2 and 4 percent of GDP (taking into account the introduction of phase 4 of the Common External Tariff [CET])?9 The main recommendations o f these reports can be summarized as follows:
Consumption taxes. Strengthening the existing consumption tax structure by converting the present consumption tax on goods into a full manufacturer-level sales tax, operated with a credit mechanism (as in a VAT). Creating new excise taxes for alcohol, tobacco, and fuels, and making some adjustments to the other taxes levied on services.
Direct taxation. Reduction in the rate o f corporate income tax, increase in the rate o f the social services levy, the introduction o f a simple final withholding tax on rents, royalties, and interest, and extension o f the corporate income tax by making it a tax on enterprise profits (including those o f larger unincorporated enterprises).
Tax concessions. The efficiency o f concessions granted should be analyzed and appraised on a regular basis; tax concessions on import duties and the consumption tax on imports should be significantly curtailed, and broadly restricted to imports by the government and imports o f capital equipment for well-defined projects.
28 See Zee, Stotsky and Ley (2002) and the references therein.
29 See King and Fulford (2001); and Norregaard and Isaac (1996).
13
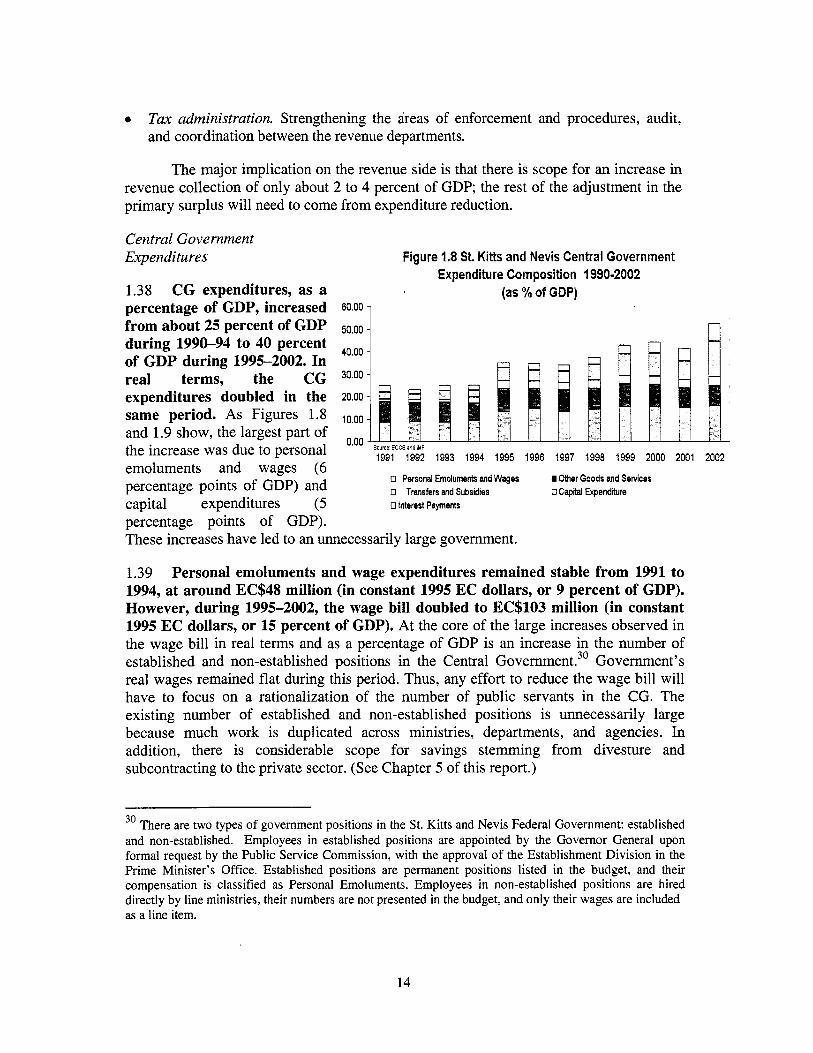
e Tax administration. Strengthening the areas of enforcement and procedures, audit, and coordination between the revenue departments.
The major implication on the revenue side i s that there i s scope for an increase in revenue collection of only about 2 to 4 percent o f GDP; the rest o f the adjustment in the primary surplus wi l l need to come from expenditure reduction.
Central Government Expenditures
1.38 CG expenditures, as a (as % of GDP) percentage of GDP, increased 60.00
from about 25 percent of GDP 50.00 during 1990-94 to 40 percent 40,00 of GDP during 1995-2002. In real terms, the CG 30.00 expenditures doubled in the 20.00 same period. As Figures 1.8 and 1.9 show, the largest part of the increase was due to personal emoluments and wages (6
Figure 1.8 St. Kitts and Nevis Central Government Expenditure Composition 1930-2002
1991 1992 1993 1994 1995 1996 1997 1998 1999 2000 2001 2002
0 Personal Emoluments and Wages 13 Tmsfers and Subsidies 0 Capital Expenditure
m Other Goods and Seriices percentage points o f GDP) and capital expenditures (5 0 Interest Payments
percentage points o f GDP). These increases have led to an unnecessarily large government.
1.39 Personal emoluments and wage expenditures remained stable from 1991 to 1994, at around EC$48 million (in constant 1995 EC dollars, or 9 percent of GDP). However, during 1995-2002, the wage bill doubled to EC$103 million (in constant 1995 EC dollars, or 15 percent of GDP). At the core o f the large increases observed in the wage bill in real terms and as a percentage o f GDP i s an increase in the number o f established and non-established positions in the Central G~vernment.~' Government's real wages remained flat during this period. Thus, any effort to reduce the wage bill w i l l have to focus on a rationalization of the number of public servants in the CG. The existing number o f established and non-established positions i s unnecessarily large because much work i s duplicated across ministries, departments, and agencies. In addition, there i s considerable scope for savings stemming from divesture and subcontracting to the private sector. (See Chapter 5 of this report.)
30 There are two types o f government positions in the St. Kitts and Nevis Federal Government: established and non-established. Employees in established positions are appointed by the Governor General upon formal request by the Public Service Commission, with the approval o f the Establishment Division in the Prime Minister's Office. Established positions are permanent positions listed in the budget, and their compensation i s classified as Personal Emoluments. Employees in non-established positions are hired directly by line ministries, their numbers are not presented in the budget, and only their wages are included as a line item.
14

1.40 Capital expenditure presents a pattern similar to the wage bill. From 1990 to 1994, capital expenditure fluctuated around 3 percent of GDP (approximately EC$17 mill ion in constant 1995 EC dollars). As in the case o f the wage bill, a rupture occurred in 1995. During 1995-2002, capital expenditure as a fraction o f GDP increased 2.5 times, and in real terms 3.5 times, compared to 1990-94.
Figure 1.9 St. Kitts and Nevis Central Government Expenditure Composition 1990-2002
(in millions ECS 95)
450.00 1 400.00 - 350.00 -
300.00 - 250.00 -
200.00 - 150.00 - 100 00
50.00
12!:e 2 c M r i . 9 2 1993 1994 1995 1996 1997 1998 1999 2000 2001 2002
0 Penonal Emolumenk and Wages 0 Transfers and Subsidies m Capital Expendibrre
0 Other Goods and Services n Interest Payments
The main explanation for these increases has been the damage caused by Hurricanes Luis in September 1995, Lenny in November 1998, and Georges in November 1999. However, a close look at the Public Sector Investment Program (PSIP) shows that hurricane-related expenditures were not the only cause of the increases in capital expenditure. Investment projects inconsistent with the growth strategy defined in the Medium-Term Economic Strategy Paper (MTESP) and projects beyond the ones required to repair the damage caused by the hurricanes were carried out without any cost-benefit analysis and financed domestically at high interest rates. Therefore, tighter control o f the PSIP i s crucial to improve the efficiency of the public investment and w i l l help the return o f the government to a fiscally sustainable path. (See Chapter 4 in this report.)
1.41 Expenditures on goods and services during 1990-2002 were stable at around 9 percent of GDP, but transfers and subsidies doubled from 1.6 percent of GDP during 1990-94 to 3.6 percent during 1995-2001. The latter i s due in part to subsidies given by the CG to the SSMC.
1.42 Finally, interest payments as a percentage of GDP almost doubled from 1990 to 2002. This reflects two factors: first, the higher indebtedness o f the St. Kitts and Nevis government, and second, the increased reliance o f the government on borrowing domestically at higher costs. Moreover, if the government continues i ts fiscal policy on an unsustainable path, interest payments w i l l start to crowd out the other components of government expenditures.
Public Enterprises and the Social Security System
1.43 St. Kitts and Nevis has a number of public enterprises, but a detailed list of all of them and the law that created them has been impossible to obtain from the authorities?' Up-to-date financial statements for these enterprises are not available, and the National Housing Corporation (NHC) has not made public i t s financial statements
31 We know of the existence of at least six public enterprises: SSMC, the Central Marketing Corporation (CEMACO), the Frigate Bay Development Corporation, St. Christopher Air and Sea Ports Authority, the Development Bank, and the National Housing Corporation (NHC).
15
since i ts creation in 1996.32 Nevertheless, transfers from the CG to the public enterprises have been substantial and unsustainable given the fiscal position o f the CG.
1.44 Despite this scant information, in 1998 public enterprises added 5 percentage points to the overall CG fiscal deficit. Thus, the overall public sector fiscal deficit including public enterprises was 12.6 percent o f GDP compared to 7.7 percent o f GDP for the Central Government. The main contributors to the deficit o f the public enterprises in 1998 were the St. Christopher Air and Sea Ports Authority and SSMC. The St. Christopher Air and Sea Ports Authority i s estimated to have run a deficit of 2.3 percent of GDP, and the SMMC a deficit of 2.8 percent of GDP. The increasing financial difficulties that the SSMC i s facing are the result of a drop in productivity and adverse external shocks. In light of the bleak financial prospects for the industry, the government i s discussing the options presented in a World Bank-funded study that examines the costs and benefits o f maintaining the industry, closing the industry, or intermediate options. I t i s essential that the government make a decision as soon as possible with respect to the possible closing of the SSMC before it further compromises the already unsustainable fiscal position of the government.
1.45 The finances of the Social Security Scheme (SSS) remained sound with a surplus of roughly 4.6 to 5 percent of GDP during 1995-98. The SSS i s a pay-as-you- go system. The benefits are financed by current contributions, 10 percent o f wage income, with 5 percent paid by the employer and 5 percent by the employee. The overall SSS surpluses are indirectly offsetting the deficit o f the public enterprises. However, th is i s a myopic view because in the medium term the finances o f the SSS will become more strained as the number of retirees begins to rise. In the medium term, a review o f the social security system wi l l be needed for St. Kitts and Nevis, as well as for the other OECS countries.
32 The NHC assists low-income families by constructing dwellings on land obtained from the government at no cost.
16
2. FISCAL POLICY AND BUSINESS CYCLES
2.1 The Latin America and the Caribbean (LAC) Region, like other developing regions, faces a high degree o f volatility in real output. In the last 40 years, the standard deviation o f the growth rate of real GDP in the L A C region has been twice as high as in industrial economies. Moreover, smaller economies such as the ones considered in this report tend to experience, on average, higher volatility than larger economies.33
2.2 The importance o f economic volatility in long-term growth and i t s effect on the poor segments o f the population are at the center of the need to identify policies and institutions that can ameliorate their impact. Volatility tends to discourage long-term investments in physical and human capital and thus leads to a lower growth potential. In addition, the poor segments o f the population are generally the most affected because they lack the means to protect themselves from adverse employment and income effects.
2.3 The government has a broad set of instruments available that i t can use to reduce aggregate volatility and i ts effects. One o f these instruments i s fiscal policy. In industrial economies, fiscal policy i s usually designed to stimulate output when the economy moves into recession and to contract output when an expansion takes place. A fiscal policy designed in this way leads to a strongly procyclical budget surplus (countercyclical fiscal policy).
2.4 In industrial economies, a countercyclical fiscal policy i s usually accomplished in two ways: first, by having components in the budget that respond automatically to the business cycle, such as tax revenues (which respond positively) or unemployment benefits (which respond negatively), and second, by using discretionary components in the budget to provide a stimulus during bad times.
2.5 This chapter f irst describes the cyclical features o f government finances in St. K i t t s and Nevis by applying the Hodrick-Prescott methodology, an algorithm that decomposes a time series into cycle and trend. Second, it suggests the implementation of a countercyclical fiscal policy based on a fiscal rule that uses the structural (cyclically adjusted) balance as the indicator o f fiscal policy. The application o f th is simple fiscal rule can allow the government to accumulate resources in good times and run them down in bad times.
2.6 The main findings and recommendations can be summarized as follows:
0 The cause o f the sharp deterioration in the fiscal position o f St. Kitts and Nevis since the mid-1990s i s a long-term growth rate in expenditures, specifically personal emoluments and wages and capital expenditures above revenues, and not cyclical factors such as hurricanes.
33 See De Ferranti and others (2000); Crucini (1997); and Head (1995).
17
0 St. Kitts and Nevis’s fiscal policy i s acyclical. That is, the primary, overall, and current fiscal balance does not co-move with the GDP cycle. In good times the government does not run a higher or lower fiscal surplus than its trend. This finding i s contrary to the empirical evidence for developing countries (procyclical fiscal policy).
0 The structural fiscal balance measures confirm that the deterioration in the fiscal position in St. Kitts and Nevis was not due to the business cycle. In order to enforce fiscal discipline and move the country to a counteryclical fiscal policy, we propose a fiscal rule based on a structural surplus of about 2 to 4 percent o f GDP. This rule implies a fiscal adjustment similar to one suggested in Chapter 1 (14 to 16 percent of GDP).
I. THENUS A N D CYCLES Ih’ ST. KITTS A N D NEVIS FISCAL ACCOUNTS, 1980-2001
2.7 I s the business cycle the main cause of the fiscal sustainability problem facing the St. Kitts and Nevis government? This section attempts to answer the question by examining the cyclical fluctuations in GDP and government fiscal accounts from 1980 to 2002 using yearly data.34 The methodology used to disentangle trend and cycle i s the Hodrick-Prescott (HP) filter.35 The empirical evidence confirms the results obtained in Chapter 1: the main cause of the deterioration o f the fiscal position in St. Kitts and Nevis i s a long-term growth rate in expenditures above current revenue. The business cycle had little influence on the sharp deterioration of the fiscal position.
Tlie Biisiness Cycle in St. Kitts nrzd Nevis
2.8 Since the 1990s’ St. Kitts and Nevis’s long-term GDP growth rate has slowed to 4.2 percent per year from 6.3 percent in the previous decade. As Table 2.1 shows, St. Kitts and Nevis’s GDP trend grew by 5.1 percent per year from 1981 to 2002. This long-term growth rate i s the result of two distinct periods. From 1981 to 1990, GDP trend grew by 6.3 percent per year, while from 1991 to 2002 GDP trend grew at only 4.2 percent. This reduction in the long-term growth rate i s a fundamental change in the economic environment that the government should take into consideration in future preparation o f the budget and the Country Strategic Outlook.
34 The choice of the sample period was largely driven by the availability o f data. The ECCB provided us with disaggregated government fiscal accounts and real GDP only since 1980.
35 In layman’s terms, the HP filter can be thought o f as removing a smooth trend (like one would draw freehand) from the data. A complete discussion of this method can be found in Appendix A.
18
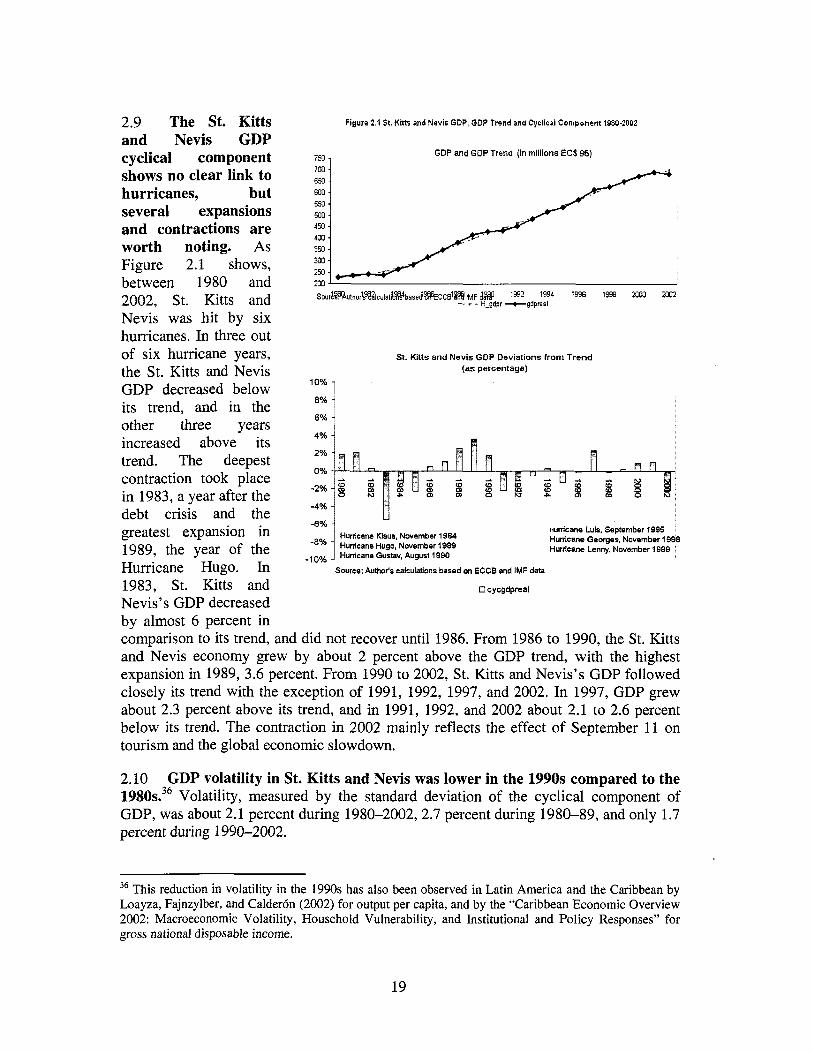
2.9 The St. Kitts and Nevis GDP cyclical component shows no clear link to hurricanes, but several expansions and contractions are worth noting. As Figure 2.1 shows, between 1980 and 2002, St. Kitts and Nevis was hit by six hurricanes. In three out of six hurricane years, the St. Kitts and Nevis GDP decreased below i ts trend, and in the other three years increased above i t s trend. The deepest contraction took place in 1983, a year after the debt crisis and the greatest expansion in 1989, the year of the Hurricane Hugo. In 1983, St. Kitts and Nevis’s GDP decreased by almost 6 percent in
Figure 2.1 St. Kith and Nevis GDP, GDP Trend and Cyclical Component 1980-2002
GDP and GDP Trend (In millions ECS 95) 750 7
St. Kitts and Nevis GDP Deviations from Trend (as percentage)
10%
6%
If -4% i U
Hurricane Klaus, November 1984 Hurricane Hugo, November 1989
Source: Author‘s calculations based on ECCB and IMF data
0 cycgdpreal
Hurricane Luis, September 1995 Humcane Georger, November 19 Hurricane Lenny, November 1999
1
comparison to i ts trend, and did not recover until 1986. From 1986 to 1990, the St. Kitts and Nevis economy grew by about 2 percent above the GDP trend, with the highest expansion in 1989, 3.6 percent. From 1990 to 2002, St. Kitts and Nevis’s GDP followed closely i ts trend with the exception of 1991, 1992, 1997, and 2002. In 1997, GDP grew about 2.3 percent above i ts trend, and in 1991, 1992, and 2002 about 2.1 to 2.6 percent below its trend. The contraction in 2002 mainly reflects the effect o f September 11 on tourism and the global economic slowdown.
2.10 GDP volatility in St. Kitts and Nevis was lower in the 1990s compared to the 1 9 8 0 ~ . ~ ~ Volatility, measured by the standard deviation of the cyclical component of GDP, was about 2.1 percent during 1980-2002,2.7 percent during 1980-89, and only 1.7 percent during 1990-2002.
36 This reduction in volatility in the 1990s has also been observed in Latin America and the Caribbean by Loayza, Fajnzylber, and Calder6n (2002) for output per capita, and by the “Caribbean Economic Overview 2002: Macroeconomic Volatility, Household Vulnerability, and Institutional and Policy Responses” for gross national disposable income.
19
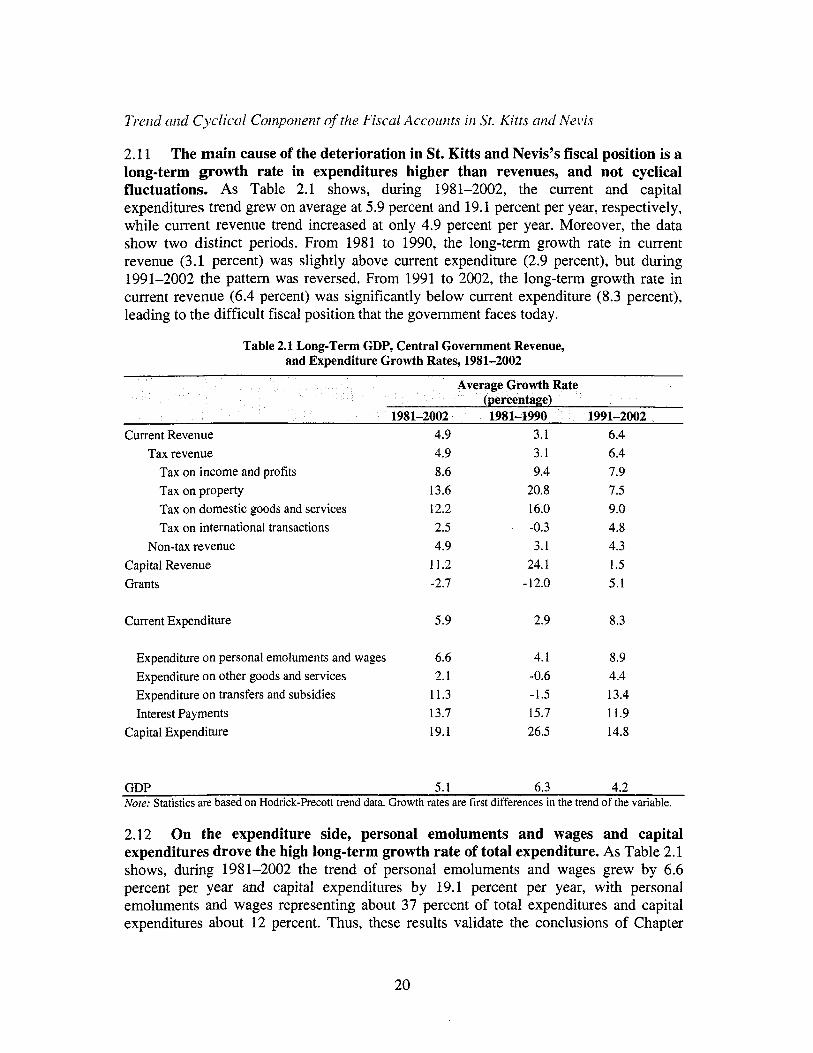
2.11 The main cause of the deterioration in St. Kitts and Nevis’s fiscal position is a long-term growth rate in expenditures higher than revenues, and not cyclical fluctuations. As Table 2.1 shows, during 1981-2002, the current and capital expenditures trend grew on average at 5.9 percent and 19.1 percent per year, respectively, while current revenue trend increased at only 4.9 percent per year. Moreover, the data show two distinct periods. From 1981 to 1990, the long-term growth rate in current revenue (3.1 percent) was slightly above current expenditure (2.9 percent), but during 1991-2002 the pattern was reversed. From 1991 to 2002, the long-term growth rate in current revenue (6.4 percent) was significantly below current expenditure (8.3 percent), leading to the difficult fiscal position that the government faces today.
Table 2.1 Long-Term GDP, Central Government Revenue, and Expenditure Growth Rates, 1981-2002
Average Growth Rate
1981-2002 1981-1990 1991-2002 Current Revenue
Tax revenue Tax on income and profits Tax on property Tax on domestic goods and services Tax on international transactions
Non-tax revenue Capital Revenue Grants
4.9 3.1 4.9 3.1 8.6 9.4
13.6 20.8 12.2 16.0 2.5 -0.3 4.9 3.1
11.2 24.1 -2.7 -12.0
6.4 6.4 7.9 7.5 9.0 4.8 4.3 I .5 5.1
Current Expenditure 5.9 2.9 8.3
Expenditure on personal emoluments and wages 6.6 4.1 8.9
Expenditure on transfers and subsidies 11.3 -1.5 13.4 Interest Payments 13.7 15.7 11.9
Capital Expenditure 19.1 26.5 14.8
Expenditure on other goods and services 2.1 -0.6 4.4
GDP 5.1 6.3 4.2 Note: Statistics are based on Hodrick-Precott trend data. Growth rates are first differences in the trend o f the variable.
2.12 On the expenditure side, personal emoluments and wages and capital expenditures drove the high long-term growth rate of total expenditure. As Table 2.1 shows, during 1981-2002 the trend of personal emoluments and wages grew by 6.6 percent per year and capital expenditures by 19.1 percent per year, with personal emoluments and wages representing about 37 percent of total expenditures and capital expenditures about 12 percent. Thus, these results validate the conclusions of Chapter
20
l-personal emoluments and wages and capital expenditures are the main sources o f the fiscal problem facing the country. Moreover, Chapter 5 wi l l restrict the large increase in the long-term growth in personal emoluments and wages to an increase in the number o f civil servants rather than an increase in wages. The third determinant o f the high long- term growth rate of total expenditure was interest payments. The trend o f interest payments grew at a rate o f 13.7 percent during 1981-2002 and represented about 10 percent of total expenditures. The same conclusions apply to the subperiod 1991-2002.
2.13 On the revenue side, during 1981-2002 the main determinants of the long- term growth rate of current revenue were taxes on income and profits, domestic goods and services, and non-tax revenue. As Table 2.1 shows, during 1981-2002 the trend of taxes on income and profits grew by 8.6 percent per year, taxes on domestic goods and services by 12.2 percent, and non-tax revenue by 4.9 percent per year with taxes on income and profits, domestic goods and services and non-tax revenue representing about 17 percent, 12 percent, and 28 percent of current revenue, respectively. Moreover, although taxes on international transactions represented about 41 percent o f total current revenue, the long-term growth rate was only 2.5 percent and therefore not a key determinant o f the long-term growth rate o f current revenue. T h i s i s not a surprising result, because the tariff reduction under the 1993 agreement on the introduction o f a CET reduced import duty revenues. Any tax reform should take these findings into account.
2.14 Grants present a negative trend during 1980-2002, and capital revenue shows a positive trend for the same period. Grants have decreased at a long-term rate of about 3 percent per year, while capital revenue has increased at a rate o f 11.2 percent per year in the same period. The negative trend in grants i s one o f the reasons why in Chapter 4 we suggest that the government should stop relying on grant funds for the financing o f capital expenditures.
2.15 All components of the fiscal accounts are more volatile than GDP. The highest volatility belongs to grants, capital expenditure, and capital revenue. As Table 2.2 shows, grants volatility i s 35 times higher than GDP volatility, and capital expenditure and capital revenue 33 times higher. Current revenue volatility i s higher than current expenditure volati l i ty-6.4 percent compared to 5.8 percent.
2.16 Current expenditure, all its components, and capital expenditure are acyclical. In other words, in good times the government does not increase i t s expenditures, and in bad times does not cut them. The correlation between the cyclical component o f expenditure and GDP fluctuates from -0.13 to 0.3 1, but i s not significant at 10 percent. This i s an interesting result s im i l a r to the one observed in OECD countries, but not in developing countries. However, Talvi and VCgh (2000) show the same result for the case o f the Dominican Republic.
21
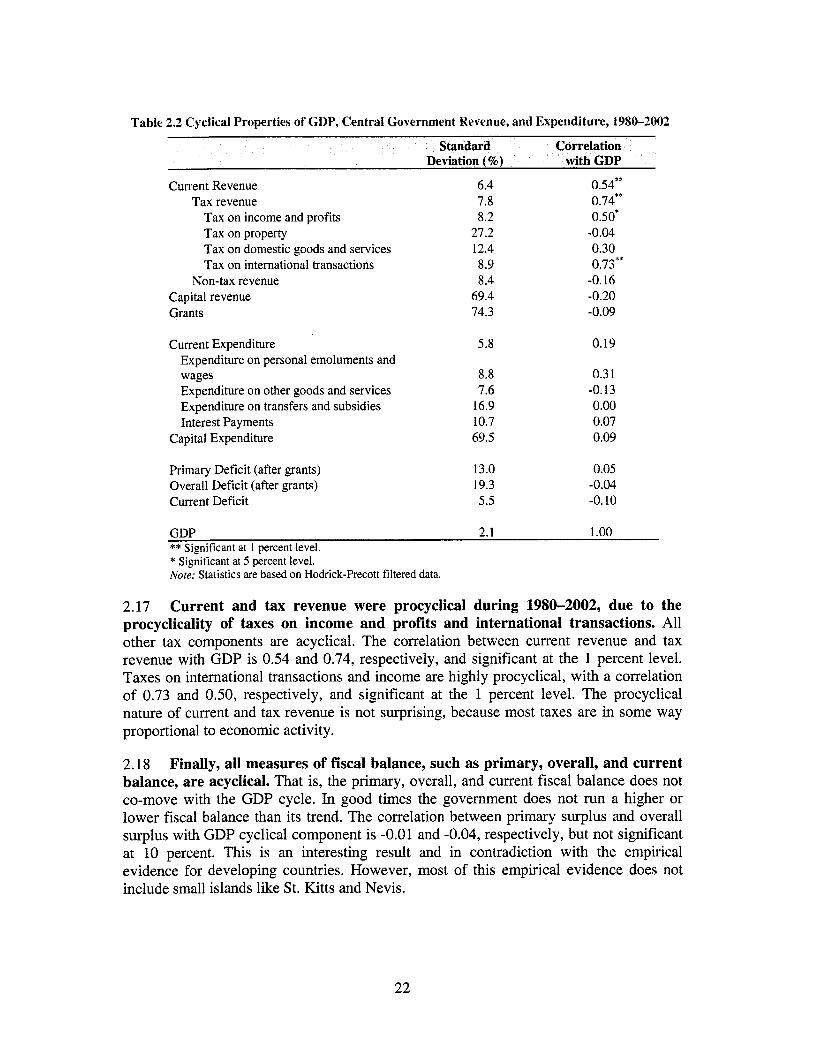
Table 2.2 Cyclical Properties of GDP, Central Government Revenue, and Expenditure, 1981)-2002
Standard Correlation Deviation (%\ with GDP
Current Revenue Tax revenue
Tax on income and profits Tax on property Tax on domestic goods and services Tax on international transactions
Non-tax revenue Capital revenue Grants
6.4 7.8 8.2
27.2 12.4 8.9 8.4
69.4 74.3
Current Expenditure 5.8
wages 8.8 Expenditure on personal emoluments and
Expenditure on other goods and services 7.6 Expenditure on transfers and subsidies 16.9 Interest Payments 10.7
Capital Expenditure 69.5
0.54*' 0.74** 0.50%
0.30 0.73**
-0.16 -0.20 -0.09
-0.04
0.19
0.3 1 -0.13 0.00 0.07 0.09
Primary Deficit (after grants) Overall Deficit (after grants) Current Deficit
13.0 0.05 19.3 -0.04 5.5 -0.10
GDP 2.1 1 .oo ** Significant at 1 percent level. * Significant at 5 percent level. Note: Statistics are based on Hodrick-Precott filtered data.
2.17 Current and tax revenue were procyclical during 1980-2002, due to the procyclicality of taxes on income and profits and international transactions. All other tax components are acyclical. The correlation between current revenue and tax revenue with GDP i s 0.54 and 0.74, respectively, and significant at the 1 percent level. Taxes on international transactions and income are highly procyclical, with a correlation o f 0.73 and 0.50, respectively, and significant at the 1 percent level. The procyclical nature of current and tax revenue i s not surprising, because most taxes are in some way proportional to economic activity.
2.18 Finally, all measures of fiscal balance, such as primary, overall, and current balance, are acyclical. That is, the primary, overall, and current fiscal balance does not co-move with the GDP cycle. In good times the government does not run a higher or lower fiscal balance than i t s trend. The correlation between primary surplus and overall surplus with GDP cyclical component i s -0.01 and -0.04, respectively, but not significant at 10 percent. This i s an interesting result and in contradiction wi th the empirical evidence for developing countries. However, most of this empirical evidence does not include small islands like St. Kitts and Nevis.
22
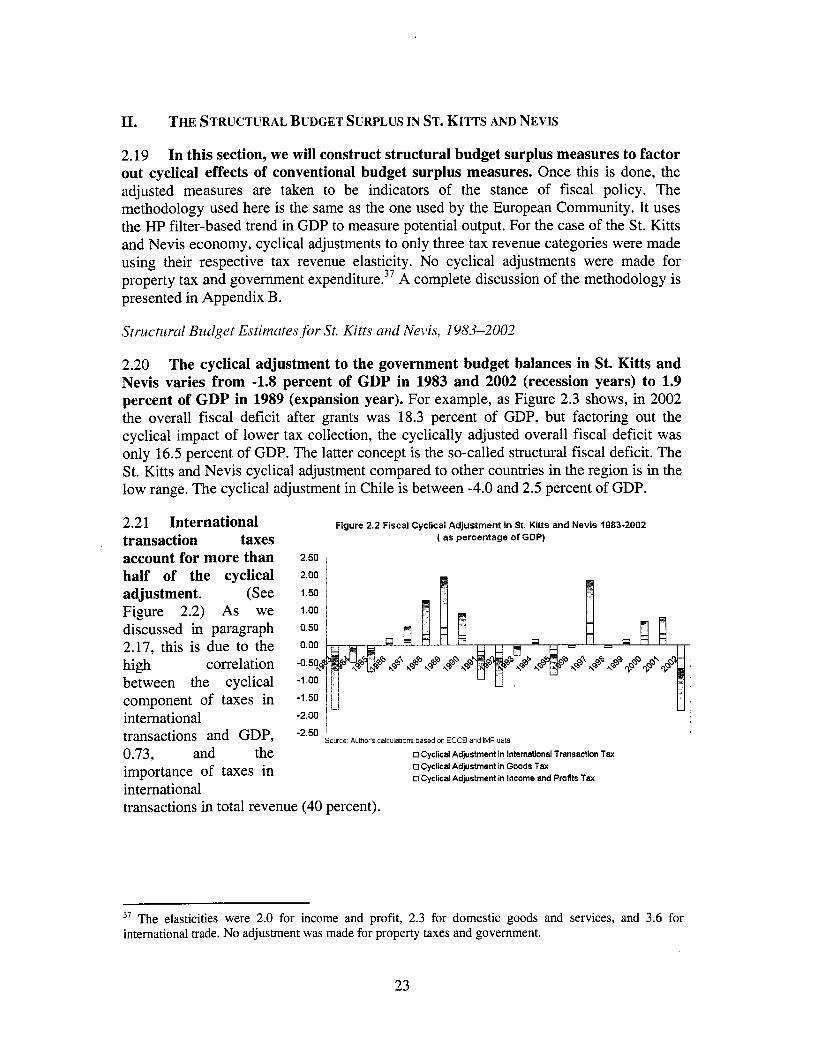
2.19 In this section, we will construct structural budget surplus measures to factor out cyclical effects of conventional budget surplus measures. Once this i s done, the adjusted measures are taken to be indicators of the stance of fiscal policy. The methodology used here i s the same as the one used by the European Community. I t uses the HP filter-based trend in GDP to measure potential output. For the case of the St. Kitts and Nevis economy, cyclical adjustments to only three tax revenue categories were made using their respective tax revenue elasticity. No cyclical adjustments were made for property tax and government e~penditure.~' A complete discussion o f the methodology i s presented in Appendix B.
Structiird Budget Estimtite,rfbr St. Kitts crnd Neiis, 1983-2002
2.20 The cyclical adjustment to the government budget balances in St. Kitts and Nevis varies from -1.8 percent of GDP in 1983 and 2002 (recession years) to 1.9 percent of GDP in 1989 (expansion year). For example, as Figure 2.3 shows, in 2002 the overall fiscal deficit after grants was 18.3 percent o f GDP, but factoring out the cyclical impact o f lower tax collection, the cyclically adjusted overall fiscal deficit was only 16.5 percent o f GDP. The latter concept i s the so-called structural fiscal deficit. The St. Kitts and Nevis cyclical adjustment compared to other countries in the region i s in the low range. The cyclical adjustment in Chile i s between -4.0 and 2.5 percent of GDP.
2.21 International transaction taxes account for more than half of the cyclical adjustment. (See Figure 2.2) As we discussed in paragraph 2.17, this i s due to the high correlation between the cyclical component o f taxes in international transactions and GDP, 0.73, and the importance o f taxes in international
Figure 2.2 Fiscal Cyclical Adjustment in St. Kitts and Nevis 1983-2002 ( as percentage of GDP)
4 S! S9 0' 6 \q hp \Q + +
-2.50 ' Source Author's CalCUlaPOnS based on ECCB and IMF data
0 Cyclical Adjustment in International Transaction Tax 0 Cyclical Adjustment in Goods Tax 0 Cyclical Adjustment in Income and Profits Tax
transactions in total revenue (40 percent).
37 The elasticities were 2.0 for income and profit, 2.3 for domestic goods and services, and 3.6 for international trade. No adjustment was made for property taxes and government.
23
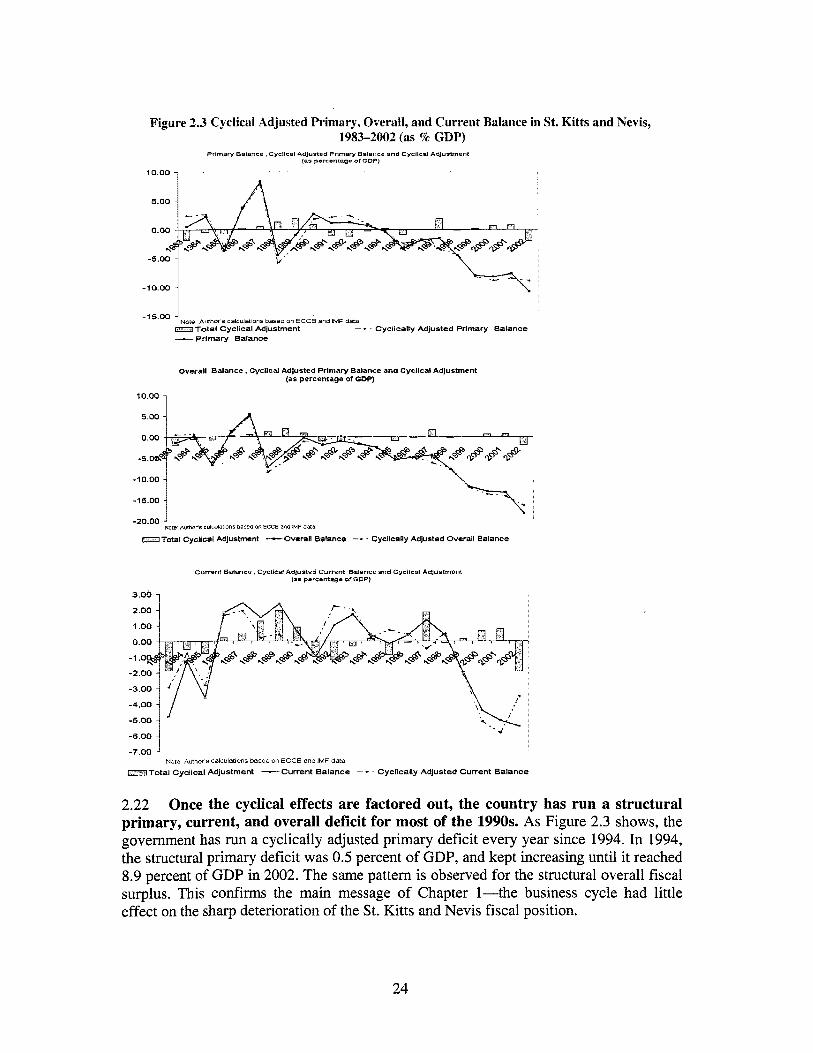
Figure 2.3 Cyclical Adjusted Primary, Overall, and Current Balance in St. Kitts and Nevis, 1983-2002 (as o/c GDP)
Piimaiy Balance, CYCIIF~I Adjusted PIlznaw E i l d r l ~ e and Cycllc~li AUju*ent (as pmwntag* of GDP)
O0 ~ o t e AUVors calcuIaI~ons Desed on ECCB and IMF data w Total Cyclical Adjustment - - Cyclically Adjusted Pnmary Balance c Pnmary Balance
Overail Balance. Cyclical Adjusted Primary Balance and Cyclical AdJustment (as percentage of GDP)
looo 1
0 Total Cyclical Adjustment -Overall Balance -- Cyclically Adjusted Overall Balance
Cumen1 Balance , Cy611cd Adjustad Current Balance and Cyclical Adjustment (as percentage orGDP)
3.00 7
-7 00
n Total Cyclical Adjustment -Current Balance -* Cyclically Adjusted Current Balance Note Authors calcuiaOons based on ECCB end IMF data
-Ooo 1
2.22 Once the cyclical effects are factored out, the country has run a structural primary, current, and overall deficit for most of the 1990s. As Figure 2.3 shows, the government has run a cyclically adjusted primary deficit every year since 1994. In 1994, the structural primary deficit was 0.5 percent of GDP, and kept increasing until it reached 8.9 percent of GDP in 2002. The same pattern i s observed for the structural overall fiscal surplus. This confirms the main message of Chapter 1-the business cycle had little effect on the sharp deterioration of the St. K i t t s and Nevis fiscal position.
24
2.23 Can we design a fiscal rule for St. Kitts and Nevis based on our structural budget measures? Any fiscal ru le has two objectives: (a) to enforce fiscal responsibility, and (b) to make certain that the government runs a countercyclical fiscal policy. In th is regard, St. Kitts and Nevis i s on the right path with an acyclical fiscal policy. However, in order to move the country to a countercyclical fiscal policy we propose a fiscal rule based on a structural surplus.
2.24 We propose a structural surplus of about 2 to 4 percent of GDP for St. Kitts and Nevis. This rule is more austere than the Chilean fiscal rule of an overall surplus of 1 percent. However, considerations of credibility and high GDP volatility in small islands may require that small countries such as St. Kitts and Nevis adopt tighter fiscal rules. This fiscal rule implies a fiscal adjustment of about 14 to 16 percent of GDP, similar to the adjustment proposed in Chapter 1. However, as we discussed in Chapter 1 this fiscal rule wi l l only stabilize the debt to GDP ratio to about 100 percent o f GDP in the next years. Box 2.1 presents in detail the fiscal rule in place in Chile since 2000.
2.25 However, successful implementation of a fiscal rule based on a structural surplus will require, as a first step, timely and reliable fiscal information. As we discuss at length in Chapter 3, the current presentation o f the fiscal information does not follow international practices and presents a distorted picture o f the country’s fiscal situation. Unless St. Kitts and Nevis i s willing to solve this shortcoming, fiscal mimics can sabotage a fiscal rule based on a structural surplus.
25
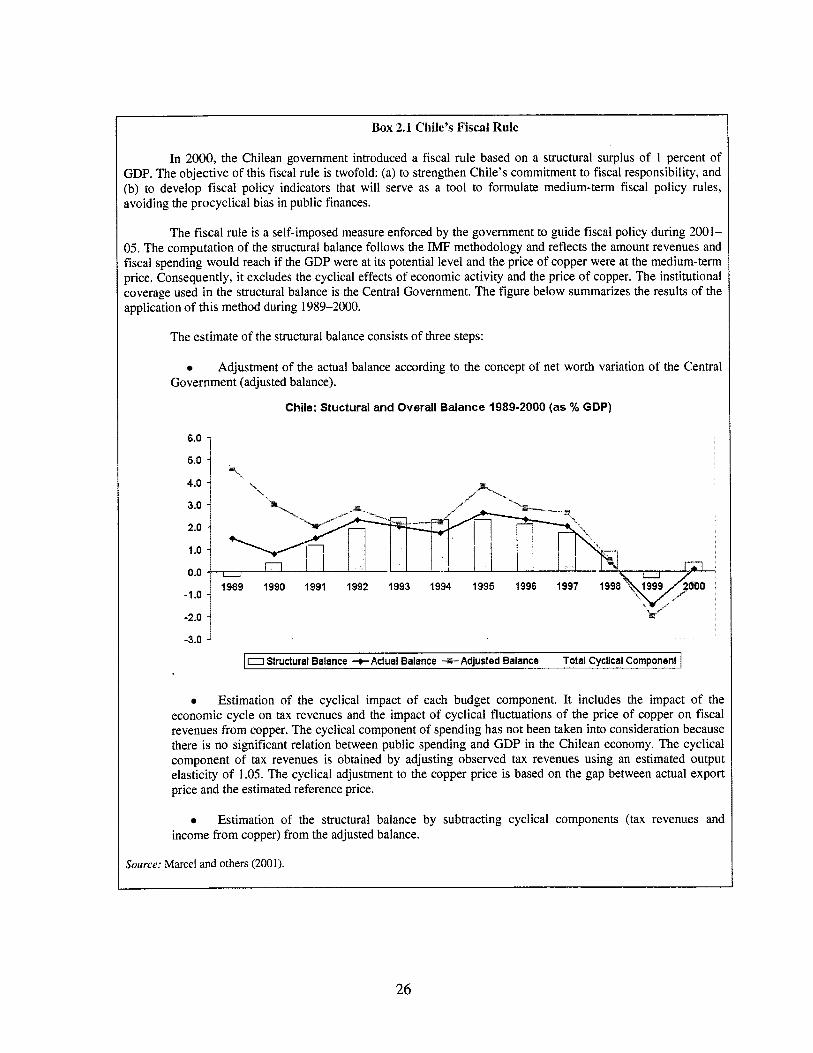
Box 2.1 Chile’s Fiscal Rule
In 2000, the Chilean government introduced a fiscal rule based on a structural surplus o f 1 percent of GDP. The objective of this fiscal rule i s twofold: (a) to strengthen Chile’s commitment to fiscal responsibility, and (b) to develop fiscal policy indicators that wil l serve as a tool to formulate medium-term fiscal policy rules, avoiding the procyclical bias in public finances.
The fiscal rule i s a self-imposed measure enforced by the government to guide fiscal policy during 200 1- 0.5. The computation of the structural balance follows the IMF methodology and reflects the amount revenues and fiscal spending would reach if the GDP were at i ts potential level and the price o f copper were at the medium-term price. Consequently, it excludes the cyclical effects of economic activity and the price o f copper. The institutional coverage used in the structural balance i s the Central Government. The figure below summarizes the results o f the application o f this method during 1989-2000.
I
I
The estimate o f the structural balance consists o f three steps:
Adjustment of the actual balance according to the concept of net worth variation o f the Central Government (adjusted balance).
Chile: Stuctural and Overall Balance 1989-2000 (as % GDP)
Estimation of the cyclical impact of each budget component. I t includes the impact o f the economic cycle on tax revenues and the impact of cyclical fluctuations o f the price o f copper on fiscal revenues from copper. The cyclical component o f spending has not been taken into consideration because there i s no significant relation between public spending and GDP in the Chilean economy. The cyclical component o f tax revenues is obtained by adjusting observed tax revenues using an estimated output elasticity o f 1.05. The cyclical adjustment to the copper price i s based on the gap between actual export price and the estimated reference price.
Estimation of the structural balance by subtracting cyclical components (tax revenues and income from copper) from the adjusted balance.
Source: Marcel and others (2001).
26

3. BUDGETMANAGEMENT.
3.1 Recent literature has emphasized the role that budget procedures have in influencing fiscal outcomes.38 Alesina and others (1996) have found evidence that, in Lat in America, budgetary institutions have had an important effect on primary deficits.
3.2 Since 1995 St. Kitts and Nevis’s, increasing levels of public debt and fiscal deficits have been of concern. Public spending, taxation, and borrowing are the result o f the government’s budget management. This chapter discusses the rules governing the decision making that leads to the formulation o f the budget, i t s passage through the legislature, and i ts implementation, execution, and monitoring.
3.3 St. Kitts and Nevis has introduced substantial changes to the budget structure and processes in the last few years, and i ts timely reporting i s commendable. These changes, however, have not yet fully translated into improved resource allocation and control o f the overall envelope allocation. That i s because the main problem i s the absence o f firm resource envelopes consistent with macroeconomic stability.
3.4
0
0
0
0
The main findings and recommendations can be summarized as follows:
On Legislation
The new Finance (Administration) Act (FAA), now being reviewed by the government before submission to the legislature i s a step forward in fiscal discipline. The new FAA i s to contain more stringent provisions governing the use o f advances and deposit accounts. In addition, this new FAA presents an excellent opportunity for the government to extend it into a fiscal responsibility law by introducing explicit fiscal targets to be met.
On Budget Preparation, Execution, and Monitoring
Strengthen the Medium-Term Economic Strategy Paper (MTESP) and the Country Strategic Outlook as a tool to anchor the budget by making certain that the following elements are thoroughly addressed: (a) estimates o f aggregate resources available for public expenditure consistent with macroeconomic stability, (b) bottom-up estimates o f the cost o f carrying out ongoing and new policies based on reliable assumptions, and (c) reconcile the aggregate resources with the cost estimates o f the ongoing and new policies.
The capital budget prepared by the Planning Unit needs to be an integral element of the Country Strategic Outlook and the MTESP, and not an addendum with a desired l i s t of investment projects. A complete discussion of the Public Sector Investment Program (PSIP) and policy recommendations are the focus o f Chapter 4.
38 Until recently, this literature had focused on the OECD countries. Von Hagen (1992) and Von Hagen and Harden (1995) find that budget institutions have a significant impact on debt ratios and on deficits in the European Union countries. Poterba (1994), among others, has studied the effects of fiscal restraints on fiscal outcomes for the United States, reaching qualitatively similar conclusions.
27
The government should stop using the “below the line” account to finance permanent expenditures that are never brought up to balance in the current fiscal year. Moreover, the government should move, as soon as possible, to present the budget according to international practices, including functional classification.
The current program presentation in the budget i s insufficient to link expenditures to policy priorities such as growth and poverty reduction. Therefore, the government wi l l be well advised to disaggregate expenditures at the program level in a way that w i l l be useful for monitoring outcomes, such as in health, education, and social protection.
The debt management function i s the weakest component o f the financial management information systems. The government has formed a new Debt and Investment Unit under the Accountant General’s office to monitor and manage domestic and external debt. However, the unit needs to be staffed with qualified personnel that can keep adequate records o f external and domestic debt, analyze the data, and advise the government on debt management issues.
The Standardized Integrated Government Financial Information System (SIGFIS) in Treasury has resulted in timely reporting. However, there are s t i l l shortcomings that curtail the effective operation o f SIGFIS. First, skilled and experienced personnel remain in short supply. Second, a commitment control system i s needed. Third, not all line ministries have terminals to access the SIGFIS system. To address the second problem, the Ministry o f Finance has commissioned the development of a commitment control module for SIGFIS, and plans are for this system to be in place by 2003.
*
a
o
0 On Budget Accountability
a The financial statements of St. Kitts and Nevis should cover all government activities. The operations o f statutory bodies, including state-owned enterprises, and several contingent liabilities should be included in the financial statements, such as government loan guarantees to finance private investment projects that the government wi l l have to honor if the recipient o f the loan i s no longer able to do so, or bailout operations for failed enterprises (for example, SSMC).
Weak Public Accounts Committees (PACs) are a common feature in the OECS countries. The recent Country Financial Accountability Assessment (CFAA) report for the OECS recommended a number o f measures, including the following, to begin addressing this common problem: a Given that opposition parties are often insufficiently represented to form a
functioning PAC, each country should consider enacting the appropriate constitutional or other changes to allow the appointment o f no parliamentary members.
Members of Parliament and other interested parties should participate in the Commonwealth Parliamentary Association, which, in conjunction with the World Bank Institute (WI), has organized a Study Group on Public Accounts Committees and plans follow-up seminars.
28
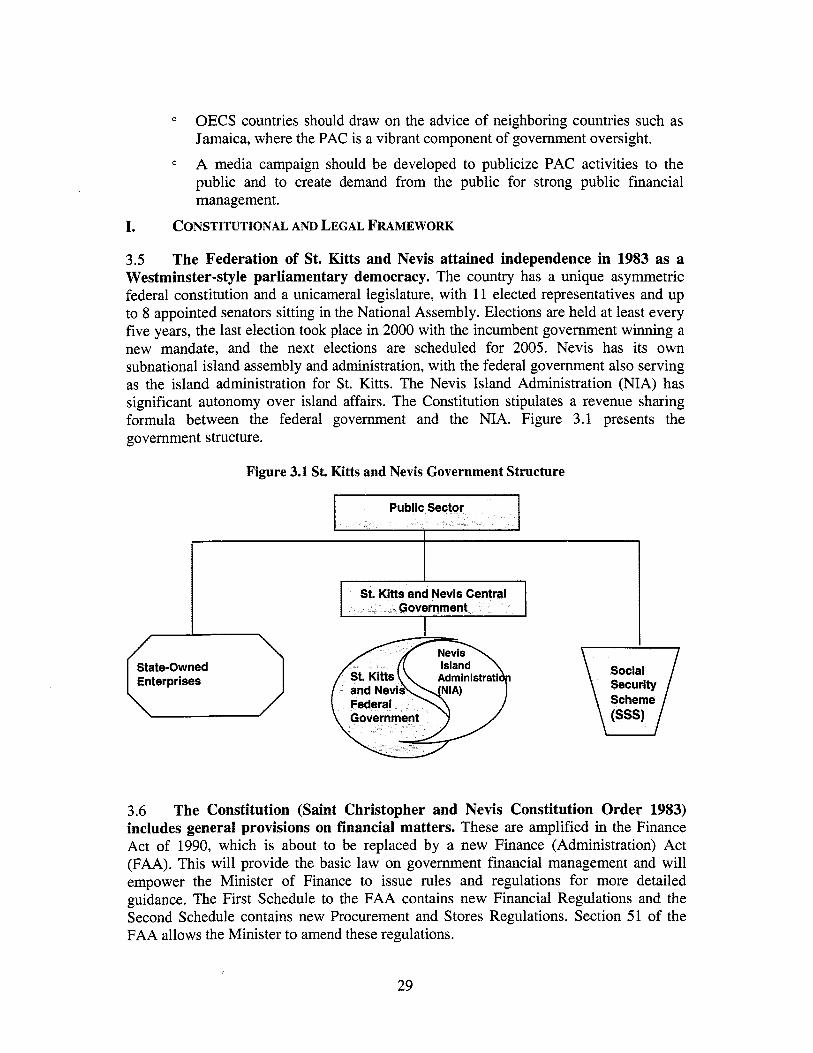
OECS countries should draw on the advice o f neighboring countries such as Jamaica, where the PAC i s a vibrant component o f government oversight.
A media campaign should be developed to publicize PAC activities to the public and to create demand from the public for strong public financial management.
I. CONSTITUTIONAL AND LEGAL FRAMEWORK
3.5 The Federation of St. Kitts and Nevis attained independence in 1983 as a Westminster-style parliamentary democracy. The country has a unique asymmetric federal constitution and a unicameral legislature, with 1 1 elected representatives and up to 8 appointed senators sitting in the National Assembly. Elections are held at least every five years, the last election took place in 2000 with the incumbent government winning a new mandate, and the next elections are scheduled for 2005. Nevis has i ts own subnational island assembly and administration, with the federal government also serving as the island administration for St. Kitts. The Nevis Island Administration (NIA) has significant autonomy over island affairs. The Constitution stipulates a revenue sharing formula between the federal government and the NIA. Figure 3.1 presents the government structure.
Figure 3.1 St. Kitts and Nevis Government Structure
Social Security Scheme
3.6 The Constitution (Saint Christopher and Nevis Constitution Order 1983) includes general provisions on financial matters. These are amplified in the Finance Act of 1990, which i s about to be replaced by a new Finance (Administration) Act (FAA). This w i l l provide the basic law on government financial management and wil l empower the Minister o f Finance to issue rules and regulations for more detailed guidance. The First Schedule to the FAA contains new Financial Regulations and the Second Schedule contains new Procurement and Stores Regulations. Section 51 o f the FAA allows the Minister to amend these regulations.
29
3.7 The new FAA is a step forward in fiscal discipline and transparency in the use of advances and deposit accounts. In addition to updating provisions to reflect current practices, including the use o f electronic media and the introduction o f automated tools for vote book accounting, the new FAA i s to contain more stringent provisions governing the use of advances and deposit accounts.39 For example, in cases where an advance warrant has been used to authorize expenditures in anticipation o f repayment or the raising of a loan, the new act wi l l contain an obligation to bring such expenditures to account should it be determined that the loan or repayment i s not forthcoming. Also, there w i l l be a provision to restrict deposit accounts from going into overdraft. The basic framework of the consolidated fund, parliamentary authorization o f annual estimates, accountability of permanent secretaries and heads of departments to Parliament, and the overall responsibility of the Ministry o f Finance (MoF) for public financial management, all remain the same.
3.8 While in the past, Central Government borrowing was governed by specific acts, since 1992 it has been governed under only one act: the Development Loans Act. This act currently allows the Central Government to borrow up to a ceiling o f 60 percent o f GDP via loans and debentures. Moreover, this act gives ample power to contract debt and guarantee loans contracted by other agencies to the MoF without the need o f parliamentary approval for each loan.
3.9 includes:
Other legislation that affects financial management in St. Kitts and Nevis
e Revenue legislation and fiscal incentives legislation, chiefly the Fiscal Incentives Act and the Tourism Incentives Act, which define the conditions in which exemptions from taxes, customs duties, service charges, and fees are granted.
e Acts, which establish statutory bodies (including state-owned enterprises).
e The Audit Act of 1990. This requires the Director o f Audit (DOA) to report to Parliament at least once a year on the work o f the office and key findings related to the audit o f the government’s accounts and records. The law empowers the Audit Department to undertake value-for-money audits. The DOA also audits the accounts o f the NIA.
11. BUDGET PREPARATION, EXECUTION, AND MONITORING
3.10 St. Kitts and Nevis has a dual budget system. The Budget unit in the MoF i s responsible for recurrent expenditures and for monitoring overall expenditures and revenues, while the Planning Unit takes the lead with respect to capital projects. St. Kitts and Nevis has a calendar fiscal year. The budget i s always passed before January 1. The budget cycle i s a continuous 24-month process, as presented in Figure 3.2.
39 A final review o f the draft legislation by all permanent secretaries i s scheduled for May, following which the Legal Affairs Department wi l l make any last revisions before submission to the legislature in the summer.
30
3.11 The budget is prepared based on the Country Strategic Outlook, the current MTESP, the capital budget, and each ministry’s strategy outlook. However, all these documents fall short of presenting a reliable framework for the budget. Both the Strategic Country Outlook (a yearly document that presents the economic prospects o f the country for the next fiscal year) and the MTESP (a four-year economic plan that provides the information for the next budgets) last prepared for the Caribbean Group for Cooperation in Economic Development (CGCED) in June 2002, suffer from the same shortcomings: (a) top-down estimates of aggregate resources available for public expenditure not always consistent with macroeconomic stability, (b) lack o f bottom-up estimates o f the cost of carrying out ongoing and new policies or based on unreliable assumptions (for example, tax revenues), and (c) no attempt to reconcile the aggregate resources with the cost estimates o f ongoing and new policies. On the ministries’ strategic outlook, most of them are out of date or cannot provide a link among objectives, expenditure required, and outcomes.
3.12 Given the dual budget system, the capital budget prepared by the Planning Unit i s appended to the country strategic outlook and the MTESP, but i t i s not an integrated element of these documents. Indeed, both the Public Sector Investment Program (PSIP), which presents the investment plan for four years, and the capital budget, that presents the current investment plan, are a desired l i s t o f investment projects rather than a well-thought-out investment plan with growth and poverty reduction as main objectives. Therefore, they cannot be used with confidence to project the fiscal outcomes in the current or next fiscal years. The PSIP i s the focus o f Chapter 4 o f this report.
3.13 The budget provides an accountant’s view of government transactions rather than a presentation of the government’s fiscal policy. The budget adheres to the traditional administrative, program, and economic structure format. However, this presentation i s insufficient to assess the fiscal position o f the government and to follow up on key programs supposedly linked to policy priorities. For instance, as we w i l l discuss in detail in Chapter 8, i t i s almost impossible to obtain from the budget the amount allocated to crucial safety net programs and to follow them over time.
31
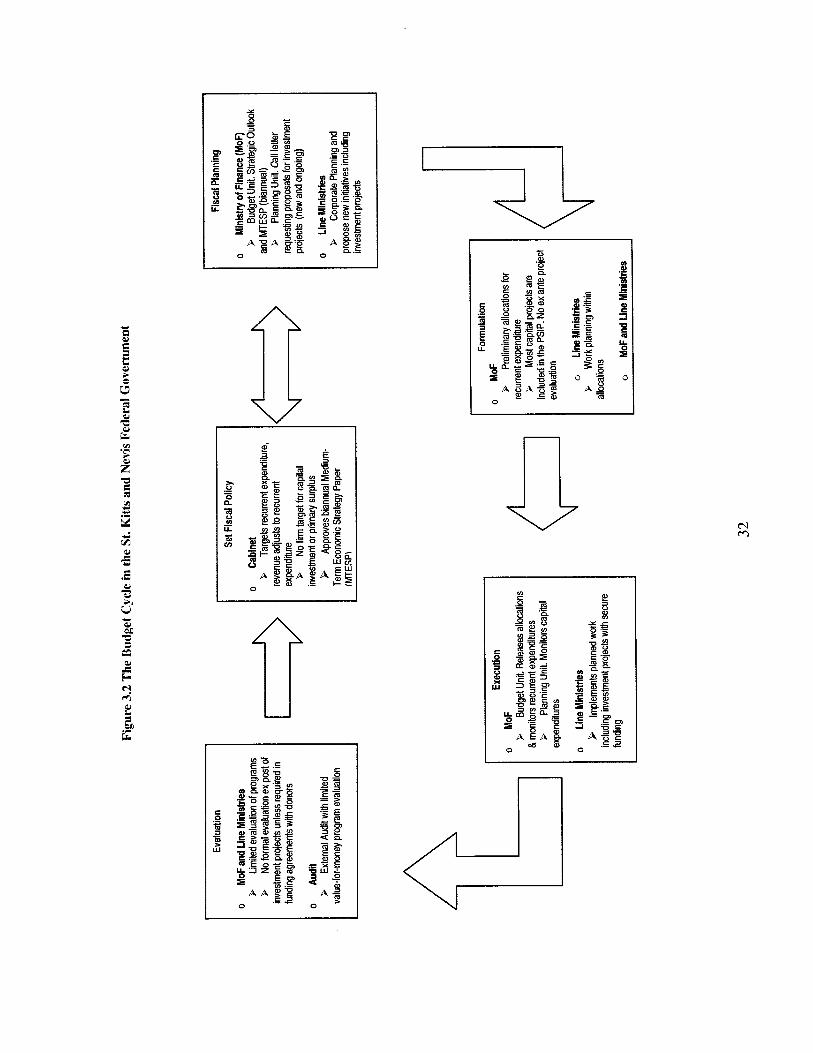
I Box 3.1 Financing Expenditures “BcIow the Line”: The Use of Advance and Deposits Accounts
In recent years, the St. Kitts and Nevis government has been making sizeable expenditures outside i ts budget process using below-the-line accounts. Traditionally, the biggest item has been the treatment o f revenue transfers from the Federal Government o f St. Kitts and Nevis to the Nevis Island Administration (NIA). For the most part these are a Constitutional requirement, but from 1983 to 1993, the Federal Government treated them as advances rather than transfers and, hence, did not show them in the estimates or in its statement of revenues and expenditures prepared for audit each year. B y 1994, the total value o f advances outstanding to the N I A had reached over EC$2 1 million, at which point the balances for other types of advances were EC$990,000 to other governments, EC$620,000 to public officers, EC$IO mill ion pending the raising of loans, and EC$17 million for all other advances (for example, SSMC).
I
These balances remained reasonably constant until 1999, when “all other advances” increased by over EC$13.5 million, followed by another increase o f almost EC$10 million the following year. The outstanding balance of “all other advances” reached over EC$40 million-about 5 percent of GDP-by the end o f 2000. Few o f these “advances” have been made with the expectation o f repayment: some went to the SSMC, some to the Air and Seaports Authority, and over EC$lO million went to various capital projects.
During the same period, the Federal Government also used deposit accounts to finance post-hurricane and other expenditures. Deposit accounts are properly used for a variety o f purposes, such as holding security deposits so that importers can obtain their goods before the final assessment o f duties. Successive governments have also established such accounts to lodge receipts in response to hurricane rel ief appeals. In these cases, unbudgeted emergency expenditures-whether capital or recurrent-are financed directly from the relevant account. Once the crisis has passed, Parliamentary approval should be obtained via a supplementary appropriation, at which point both the expenditures and the donated revenues would be brought to account. However, since the string o f hurricanes in 1998 and 1999, these deposit accounts have not been analyzed, approved via appropriation bills, and brought to account. Therefore, millions of dollars in expenditures made in this fashion have not been reflected in the government’s reported expenditures since 1998.
Transfers and expenditures financed from below-the-line accounts are covered by the Financial Act and are reflected in the statement o f assets and liabilities presented for audit as part of the government’s annual financial statements. As such, these expenditures are not improper and there are some safeguards against impropriety. However, when such substantial items are not brought to account for the years in which they are incurred, the statement o f revenues and expenditures no longer accurately reflects the government’s operations, impairing parliamentary oversight and accountability, and greatly complicating any analysis o f fiscal policy and the impact of government activities on the economy. I
3.14 Ministry of Finance does, however, have the capacity to present the budget b y standard functional classification, and should start doing so in fiscal year 2004. St. Kitts and Nevis uses to some extent the functional classification to make i ts economic and revenue projections. Thus, i t should be able to move quickly to present the budget according to international best practices, such as the ones contained in the IMF’s Government Financial Statistics (GFS). T h i s w i l l also facilitate investors in the Regional Security Market to more accurately assess the fiscal position o f the OECS countries.
3.15 Until recently, the St. Kitts and Nevis budget scored well in comprehensiveness. But in recent years, more sizeable expenditures (mainly capital expenditures) have been financed from “below the line” using advances and deposit accounts, without being brought to balance and reflected in the budget in the years in which they occur. Thus, the recurrent and overall balances as well as other line items presented in the budget do not represent an accurate picture of the government’s fiscal situation. The government needs to bring to balance all “below the line” accounts starting in 2003 (see Box 3.1).
33
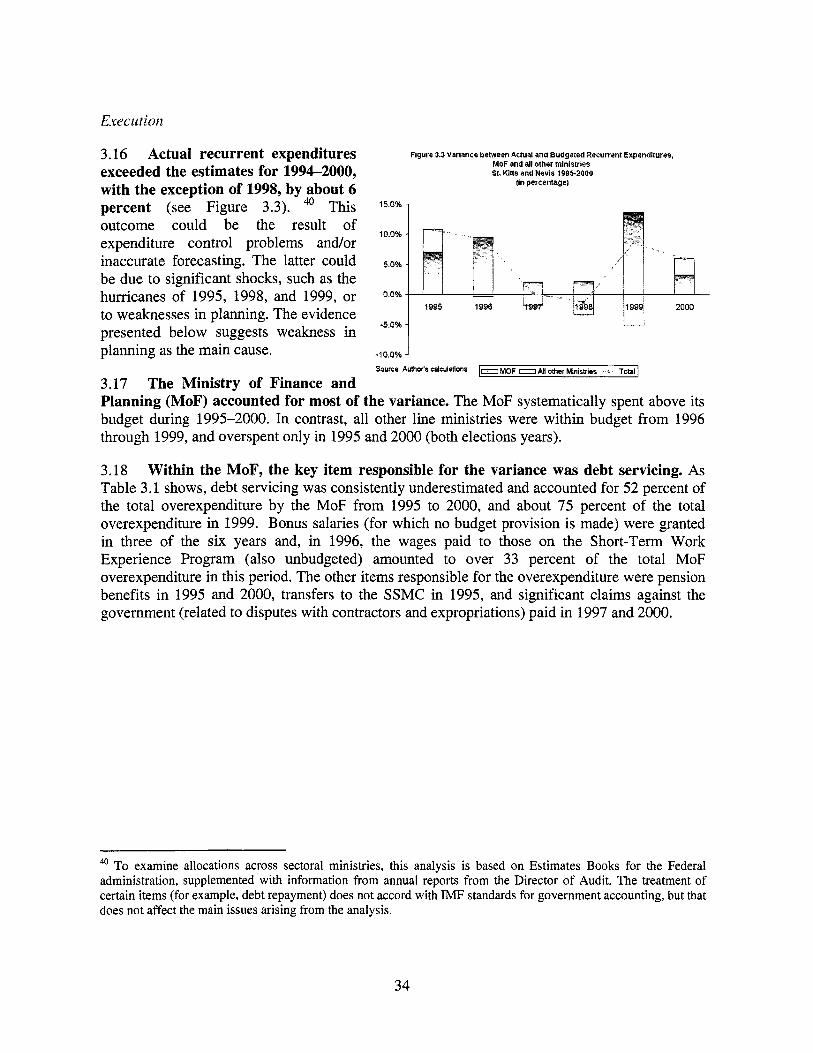
3.16 Actual recurrent expenditures exceeded the estimates for 1994-2000, with the exception of 1998, by about 6 percent (see Figure 3.3). This outcome could be the result of expenditure control problems andlor inaccurate forecasting. The latter could be due to significant shocks, such as the hurricanes of 1995, 1998, and 1999, or to weaknesses in planning. The evidence presented below suggests weakness in planning as the main cause.
3.17 The Ministry of Finance and
Figure 3.3 Variance between Achial and Budgeted Recurrent Expenditures, MoF and all other ministries h. ~ i t t s and Nevis 1905-2000
(in percentage)
15.0% 7
1998 49st' -5.0%
Planning (MoF) accounted for most of the variance. The MoF systematically spent above i t s budget during 1995-2000. In contrast, al l other l ine ministries were within budget from 1996 through 1999, and overspent only in 1995 and 2000 (both elections years).
3.18 Within the MoF, the key item responsible for the variance was debt servicing. As Table 3.1 shows, debt servicing was consistently underestimated and accounted for 52 percent of the total overexpenditure by the MoF from 1995 to 2000, and about 75 percent of the total overexpenditure in 1999. Bonus salaries (for which no budget provision i s made) were granted in three of the six years and, in 1996, the wages paid to those on the Short-Term Work Experience Program (also unbudgeted) amounted to over 33 percent of the total MoF overexpenditure in this period. The other items responsible for the overexpenditure were pension benefits in 1995 and 2000, transfers to the SSMC in 1995, and significant claims against the government (related to disputes with contractors and expropriations) paid in 1997 and 2000.
To examine allocations across sectoral ministries, th is analysis i s based on Estimates Books for the Federal administration, supplemented with information from annual reports from the Director o f Audit. The treatment of certain items (for example, debt repayment) does not accord with IMF standards for government accounting, but that does not affect the main issues arising from the analysis.
34
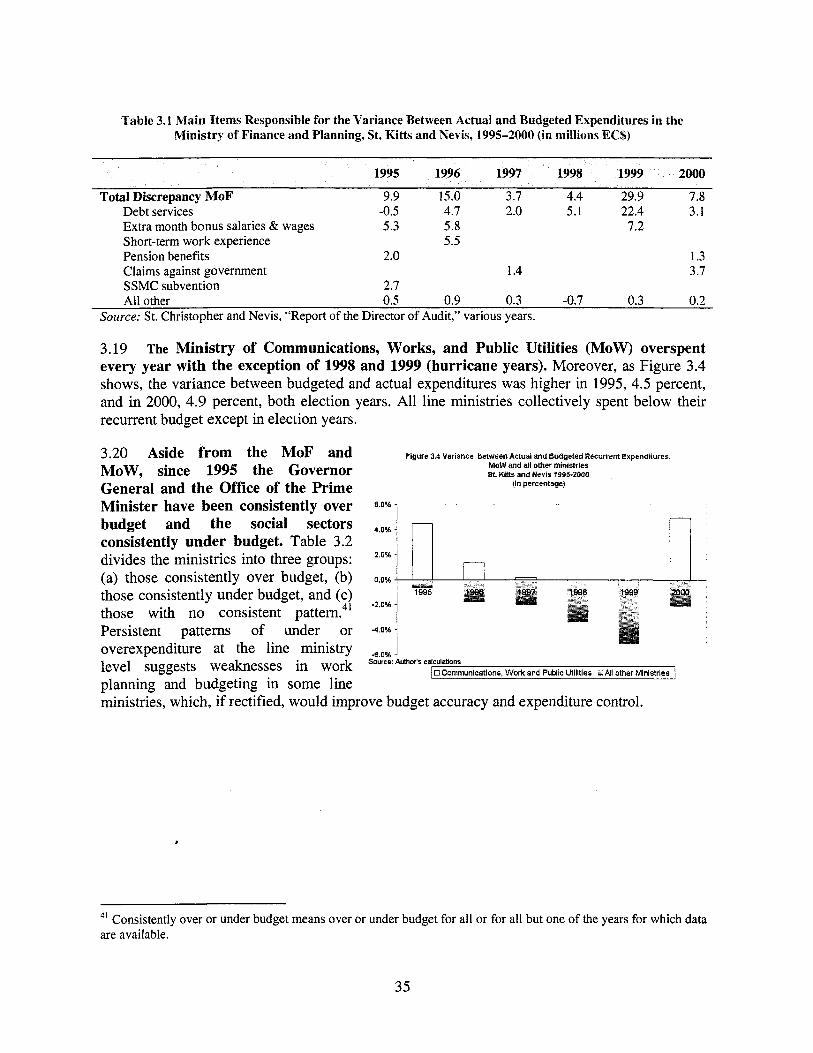
Table 3.1 Main Items Responsible for the Variance Between Actual and Budgeted Expenditures in the Ministry of Finance and Planning, St. Kitts and Nevis, 1995-2000 (in millions EC$)
1995 1996 1 1999 2000
Debt services -0.5 4.7 2.0 5.1 22.4 3.1 Extra month bonus salaries & wages 5.3 5.8 7.2 Short-term work experience 5.5 Pension benefits 2.0 1.3 Claims against government 1.4 3.7 SSMC subvention 2.1 All other 0.5 0.9 0.3 -0.7 0.3 0.2
Total Discrepancy M o F 9.9 15.0 3.7 4.4 29.9 7.8
Source: St. Christopher and Nevis, "Report of the Director o f Audit," various years.
3.19 The Ministry of Communications, Works, and Public Utilities (MOW) overspent every year with the exception of 1998 and 1999 (hurricane years). Moreover, as Figure 3.4 shows, the variance between budgeted and actual expenditures was higher in 1995, 4.5 percent, and in 2000, 4.9 percent, both election years. All l ine ministries collectively spent below their recurrent budget except in election years.
3.20 Aside f r o m the M o F and MOW, since 1995 the Governor General and the Office of the Prime Minister have been consistently over 6.0°h
budget and the social sectors 4,0%
consistently under budget. Table 3.2 divides the ministries into three groups: 2.0x
(a) those consistently over budget, (b) 0.0%
those consistently under budget, and (c) those with no consistent pattern. Persistent patterns of under or -4.0°h
overexpenditure at the line ministry -6,0x
41 -2.0%
Figure 3.4 Variance between Actual and Budgeted Recurrent Expenditures, MOW and all other ministries st KIUS and N+VIS ~99s-zaaa
(in percentage)
level suggests weaknesses in work planning and budgeting in some l ine ministries, which, if rectified, would improve budget accuracy and expenditure control.
Source Author'r C~ OCommunications, Work and Public Utilities -All other Ministries 1
,
4 ' Consistently over or under budget means over or under budget for all or for all but one of the years for which data are available.
35
Table 3.2 Ministries Consistently Over or Under Budget in St. Kitts and Nevis, 1995-2000 (average percentage)
Consistently Over Budget
Governor General (2 1.6%) Education (-4.0%) Legal Affairs (4.6%) Office o f the Prime Minister (I 1.6%) Health (-5.7%) Finance and Planning (24.1 %) Agriculture (-8.0%) National Security (-0.3%)
Audit (-8.5%) Tourism (-5.4%) Foreign Affairs (- 12.2%) Parliament (- 12.8%)
Culture, Youth, & Sports (3.2%)
Comm. & Social Affairs (-6.0%)
Source: St. Christopher and Nevis, “Report of the Director of Audit,” various years.
3.2 1 The Standardized Integrated Government Financial Information System (SIGFIS) in Treasury i s the key system for maintaining timely, accurate, and comprehensive financial data. The system has resulted in timely reporting. Trial balances are produced on the f i rs t working day following the end o f each month, which allows the Budget Unit to compile i ts Revenue-Expenditure Analysis Reports for the Cabinet within two weeks o f month’s end. The Annual Accounts are submitted for audit within the stipulated period (six months following the end o f the financial year).
3.22 There are still shortcomings that curtail the effective operation of SIGFIS. First, skilled and experienced personnel remain in short supply. Second, a commitment control system i s needed. Program managers have a tendency to order goods and services even when commitments exceed the free balance available for the account.42 Third, not all line ministries have terminals to access the SIGFIS system. To address the second problem, the MoF has commissioned the development o f a commitment control module for SIGFIS to block the issuance o f purchase orders when there i s inadequate available balance, and a computerized vote book, which w i l l allow agencies to post allocations, warrants, purchase orders, and payroll and other vouchers to their vote book accounts. This should reduce manual errors and simplify reconciliation against the SIGFIS printouts.43 Plans are for these systems to be in place in 2003.
3.23 Concerning revenues, the Standardized Integrated Government Tax Administration System (SIGTAS, Inland Revenue) and Automated System for Customs Documentation and Administration (ASYCUDA) systems computerize most revenue accounting tasks for the two major revenue departments. Unfortunately, the two systems are not integrated, which would facilitate the maintenance o f a single account per taxpayer covering all taxes. Revenues from the Electricity and Water Departments are becoming more significant because o f recent rate increases, and a new computerized water billing system was announced in 2002.
42 This results in a buildup o f payables because the government is committed to pay for goods and services delivered on the basis o f an order from a responsible public officer, even if that officer has exceeded his or her authority authorized by the allocations issued to date. To curtail the ability o f spending units to place orders with suppliers and then delay submission of the documentation to Treasury for processing, the MOF should notify suppliers that only the official purchase order wi l l be recognized.
43 The initial version wil l not incorporate computer-assisted reconciliation features, and wil l not be directly linked to SIGFIS. Ministry of Finance officials are aware that these enhancements are needed, but have not identified financing for its implementation.
36
3.24 The debt management function i s the weakest component of the financial management information systems. Until 2002, the debt management function was split between a small unit in Finance, which uses the CS-DRMS to maintain data on foreign debt, and the Accountant General’s Department, which handled domestic debt (mainly treasury bills). These units have now been merged and renamed the Debt and Investment Unit under the Accountant General. However, this new unit lacks qualified personnel to keep adequate records o f external and domestic debt, analyze the data, and advise the government on debt management issues.
3.25 With the announcement of a fiscal consolidation program in 2000, additional controls have been implemented. The MoF has reserved 10 percent o f the appropriated budgets for all discretionary expenditures (that is, excluding personal emoluments, wages, debt servicing, and statutory obligations). A hiring freeze was instituted and overtime payments now require management approval.44 In addition, a Central Purchasing Unit was established in March 2000. This unit initially purchased al l government stationery, but i ts role has been expanded to the procurement o f furniture and equipment. Eventually, i t w i l l purchase all goods and services required by government, incorporating the procurement function of the General Supplies Office, the Pharmaceutical Procurement Unit, the Public Works Department, and the Electricity Department. A computerized procurement module i s now being tested.
3.26 All these additional controls have not helped to restrain the sizeable fiscal deficit. That i s because the main problem i s the absence of firm resource envelopes at the aggregate and ministry level underpinned by an MTESP, strategic outlook, and ministries’ corporate plans nested in a consistent macroeconomic framework.
111. BUDGET ACCOUNTABILITY
Siipretne Audit Institution
3.27 A number of factors have hindered the potential benefits accruing from the work of the Audit De~artment.4~ The Audit Department, while in principle independent because of authority specified in the Constitution, has no guaranteed operating budget or staffing complement, and must obtain approval from the Minister o f Finance via the annual Estimates process. In addition, the automation o f critical financial management functions without adequate input from the Audit Department in the design and implementation stages, the nonfunctioning of the Publics Accounts Committee, lack o f training for staff, particularly on computer-assisted auditing tools, auditing o f computer systems, and value-for-money auditing have affected the efficacy of the Audit Department.
44 In 2001, the Audit Department undertook a special audit o f overtime at the Public Health Department and determined: “. . .procedures in place . . . have proven ineffective in controlling payment for overtime . . . There are no effective means of verifying and certifying the number o f hours worked . . . There was no evidence of attempts to certify works for which overtime was paid ... The number of irregularities ... cause the computation o f such payments to be inherently flawed.” (Audit Report for 2000, pp. 44-48)
45 The World Bank’s recent OECS Country Financial Accountability Assessment (CFAA) contains a detailed assessment o f the problems facing Supreme Audit Institutions in the OECS countries.
37
3.28 I n spite of these problems, the Audit Department does a commendable job. Audit Reports are current for the federal government.& Unlike Audit Reports in other OECS countries, reports in St. Kitts and Nevis no longer detail hundreds o f oversights and minor transgressions, and focus instead on material findings. Also, it continues a modest program o f value-for-money audits to supplement compliance audits.
3.29 The financial statements of St. Kitts and Nevis present a partial view of government activities. Significant fiscal operations are excluded. The operations o f statutory bodies, including state-owned enterprises, are not covered. In addition, several contingent liabilities are not presented in the financial statements, such as government loan guarantees to finance private investment projects that the government w i l l have to honor if the recipient o f the loan i s no longer able to do so, or bailout operations for failed enterprises (SSMC).
3.30 Most of the state-owned enterprises (SOEs) are significantly in arrears in the preparation of their financial statements and their submission for audit and, eventually, before Parliament. Audits of SOEs are contracted to private accounting firms in accordance with their enabling acts. The Director o f Audit has the right to require submission o f their audit reports and to supplement these by further investigations if hehhe considers i t necessary. He/she has not done so.
3.31 Following the last election, the members of the Parliament and the Public Accounts Committee (PAC) were appointed in November 2000, but the Committee has not met ~ubsequently."~ The Committee did meet a few times from 1992 to 1994, but took little action o f substance. Unlike other OECS countries, the majority o f PAC members (three of five) are supposed to come from the opposition. However, in the current Assembly the government holds all eight seats from St. Kitts, with the three seats from Nevis split between the two main Nevisian par tie^.^' Given that these two parties are rivals in elections to the Nevis Assembly, and both advocate secession, it i s perhaps unreasonable to expect effective work on a PAC that examines only the accounts o f the federal government.
3.32 Weak PACs are a common feature in the OECS countries. The recent CFAA report for the OECS recommended a number of measures, including the following, to begin addressing this common problem:
e Given that opposition parties are often insufficiently represented to form a functioning PAC, each country should consider enacting the appropriate constitutional or other changes to allow the appointment o f nonparliamentary members.
46 However, the Annual Accounts for Nevis, for which the federal Director of Audit also has audit responsibility, have not been submitted since 1996 due to a problem with the accounting software installed.
47 The World Bank's recent Country Financial Accountability Assessment (CFAA) contains a detailed assessment o f the problems facing Public Accounts Committees in the OECS countries.
48 There are also four appointed senators-two from the governing party and two from opposition parties-who s i t in the National Assembly.
38
0 Members o f Parliament and other interested parties should participate in the Commonwealth Parliamentary Association which, in conjunction wi th the World Bank Institute (WBI), has organized a Study Group on Public Accounts Committees and plans follow-up seminars.
0 OECS countries should draw on the advice of neighboring countries such as Jamaica, where the PAC i s a vibrant component of govemment oversight.
0 A media campaign should be developed to publicize PAC activities and create demand from the public for strong public financial management.
3.33 The formulation of the budget receives inputs from the social partners, but this undoubtedly could be made more systematic. The recent agreement by OECS countries to establish National Economic Councils with public and private sector members may lead in this direction. However, the capacity of the social partners-most of which are small organizations- to go beyond their immediate concerns and address complex national policy issues remains limited. There have also been extensive consultations with private sector f i r m s and associations concerning reforms to taxes and fiscal incentives. The Prime Minister and the Minister o f Commerce also meet monthly with private sector representative^.^^
49 The Governor of the ECCB also chairs a tripartite (government, business, and labor) committee, but i t s focus has been on getting a l l parties to better understand the l i nks between wages and productivity, and to agree on measures to enhance productivity.
39

4. THE PUBLIC SECTOR INVESTMENT PROGRAM
4.1 The conventional wisdom of the economics profession i s that countries need capital to grow, and that a direct relationship exists between capital spending and growth. Consequently, when economists evaluate the allocation o f public resources between current and capital spending in government budgets, they tend to be critical o f countries that allocate a large share o f government expenditure to current spending and to applaud countries that spend on capital.
4.2 This bias i s embedded in the “golden rule,” that is, only current expenditure needs to be balanced by local revenue, but a country can (within limits) run a fiscal deficit equal to the capital spending of the government. This rule i s implicit in many OECS budget presentations, where the focus i s on the current fiscal balance even though for fiscal sustainability the key concept i s the primary fiscal balance (overall balance minus interest payments).
4.3 Because most current spending by a government reflects entitlements or previous commitments, such as salaries, payments on public debt, and so forth, governments have in the short run limited scope to influence it. In contrast, the capital budget and i ts composition are highly discretionary. In formulating the capital budget, government makes the decisions that at the end wil l determine the size, composition, and in some cases the geographical location o f capital budget.
4.4 Why does this matter? Because in St. Kitts and Nevis, on average, during 1995-2002, capital expenditures as a fraction o f GDP increased about three times compared to 1990-94, including “below the line” transactions not presented in the annual budget estimates. This increase in expenditures was mostly financed through loans (commercial and concessional) and i s one o f the main reasons behind the difficult fiscal position facing the government today. Although the damage caused by Hurricanes Luis in September 1995, Lenny in November 1998, and Georges in November 1999 explained part of the increase in capital expenditures, a large portion was not hurricane related and i ts aim was not necessarily to stimulate growth or reduce poverty.
4.5 The purpose o f th is chapter i s f i rst to describe and draw attention to the limitations o f the processes in place to prepare, implement, and monitor the Public Sector Investment Program (PSIP) for the Federation o f St. Kitts and Nevis and the Nevis Island Administration (NIA), and second, to assess the size and composition o f the PSIP.
4.6 The main findings and recommendations can be summarized as follows:
On Capital Expenditures and PSIP Preparation, Monitoring, and Execution
The capital budget and the PSIP prepared by the Planning Unit in the Ministry o f Finance (MoF) needs to be an integral element o f the Country Strategic Outlook and the Medium- Term Economic Strategy Paper (MTESP), and not an addendum presenting a desired l i s t o f investment projects. The Budget and Planning Unit should work closely to anchor the capital budget and the PSIP to the country strategy. Moreover, the Budget Unit should set the overall envelope for capital expenditures (consistent with macroeconomic stability)
o
41
early in the year so that the Planning Unit can attempt to prioritize the projects early in the process instead of at the end o f the capital budget preparation.
The government of St. Kitts and Nevis needs to establish clear selection criteria for investment projects. First, only investment projects, independently of their source o f financing, with all the required information (in particular projected recurrent costs) should be included in the capital budget and the PSIP. Second, only investment projects prioritized based on some type o f cost-benefit analysis and in accordance to the overall resources available for capital expenditures should be included in capital expenditures and the PSIP. Third, all projects with a cost above EC$2 million should be subject to a formal cost-benefit analysis before being included in the capital budget or the PSIP. Fourth, given the high debt burden, only projects financed with concessional financing should be included.
At a technical level, documentation needs to be prepared on the process o f preparing the PSIP, and staff needs to be trained in the procedures and tools o f project analysis for preparing the PSIP. The Planning Unit should require the line ministries to report capital spending monthly and should stop disbursements to those projects that do not provide the information at the end o f the month.
O n the Coverage of Capital Expenditures and the PSIP
o
o
o
e
o Some investment projects currently included in the PSIP and as capital expenditures in the budget should be classified as recurrent expenditures. International practice should be followed in this respect.
A significant amount o f the capital expenditures incurred by the St. Kitts and Nevis government are recorded “below the line” and are not captured in the budget or the PSIP. The government should stop this practice.
All investment projects by statutory agencies, such as state-owned enterprises, or private corporations but financed through loans guaranteed by the government, are currently excluded from the PSIP. These investment projects can represent a sizeable portion o f the public sector investment program and can expose the government to serious unexpected fiscal problems. The government should ensure an accurate representation o f public sector investment by including the investment projects o f all statutory agencies in the PSIP. Investment projects by private corporations but guaranteed by the government should be disclosed in the government’s financial statement as government liabilities.
o
o
42
I. ST. KITTS AND NEVIS FEDERAL GOVERNMENT PSIP: PREPARATION, EXECUTION, AND MONITORING”
4.7 St. Kit ts and Nevis has a dual budget system. The St. Kitts and Nevis Federal Government P S I P is coordinated by the Planning Unit in the M o F with the support of two committees, the PSIP Operations Committee (PSIP OC) and the PSIP Project Coordinating Committee (PSIP PCC).” The PSIP OC meets monthly and has the dual function o f monitoring and coordinating the current capital spending program and identifying projects for inclusion in the next PSIP. The PSIP PCC i s expected to meet quarterly and i ts function i s to provide additional oversight and to make senior ministerial officials accountable for the capital spending program. However, since it was established in the fall o f 2000, it has not met regularly.
4.8 The public sector investment program of St. Kitts and Nevis i s in practice the investment program for the Federal Government. All investment projects by statutory agencies, such as state-owned enterprises, are excluded from the PSIP. T h i s i s a serious gap because these investment projects can represent a sizeable portion o f the public sector investment program and can expose the government to serious fiscal liabilities. The government should ensure an accurate representation of the public sector investment program by including in the PSIP the investment projects of all statutory agencies. Investment projects by private corporations but guaranteed by the government should be disclosed in the government’s financial statement as government liabilities. A good example o f the fiscal difficulties th i s can cause i s provided by the hurricane-related costs stemming from the Port Zante cruise ship dock, the reconstruction o f which was financed by the government although the port i s owned by a private corporation (see paragraph 4.19).
4.9 The St. Kitts and Nevis Federal Government prepares a four-year rolling medium- term PSIP as part of the annual budget process. However, in practice the focus is the one- year capital budget. As Table 4.1 shows, the capital spending intentions are the highest for the budget year (estimates). In future years, planned capital spending drops off. The reason for this pattern i s twofold: lack o f a well-thought-out medium-term country strategy and sectoral strategies that allow line ministries in coordination with the MoF to prepare a medium-term PSIP, and the fact that donors’ objectives and financing become explicit only closer to the budget year.
50 All the figures used in this chapter do not include “below the line” transactions because to do an analysis at the sectoral level we had to rely on the figures in the PSIP, which do not include these transactions. Therefore, the figures in this chapter differ from the numbers used in Chapter 1 o f th is report and by the IMF.
51 The PSIP OC i s formed by the financial officers from the line ministries and chaired by the Director o f the Planning Unit. The PSIP PCC is formed by all Permanent Secretaries and chaired by the Prime Minister with the Deputy Chair being the Minister o f Communications, Works and Public Utilities. The responsibilities o f the PSIP PCC in St. Kitts and Nevis are more focused on strategic decisionmaking than the Project Monitoring Committee in St. Lucia, which i s chaired by the Prime Minister and occupies itself with all aspects o f public sector investment, including monitoring and implementation. I t i s similar in responsibilities to the Priority Planning Consultative Committee in Grenada, but chaired at a higher level by the Prime Minister instead o f the Chief Planning Officer.
43
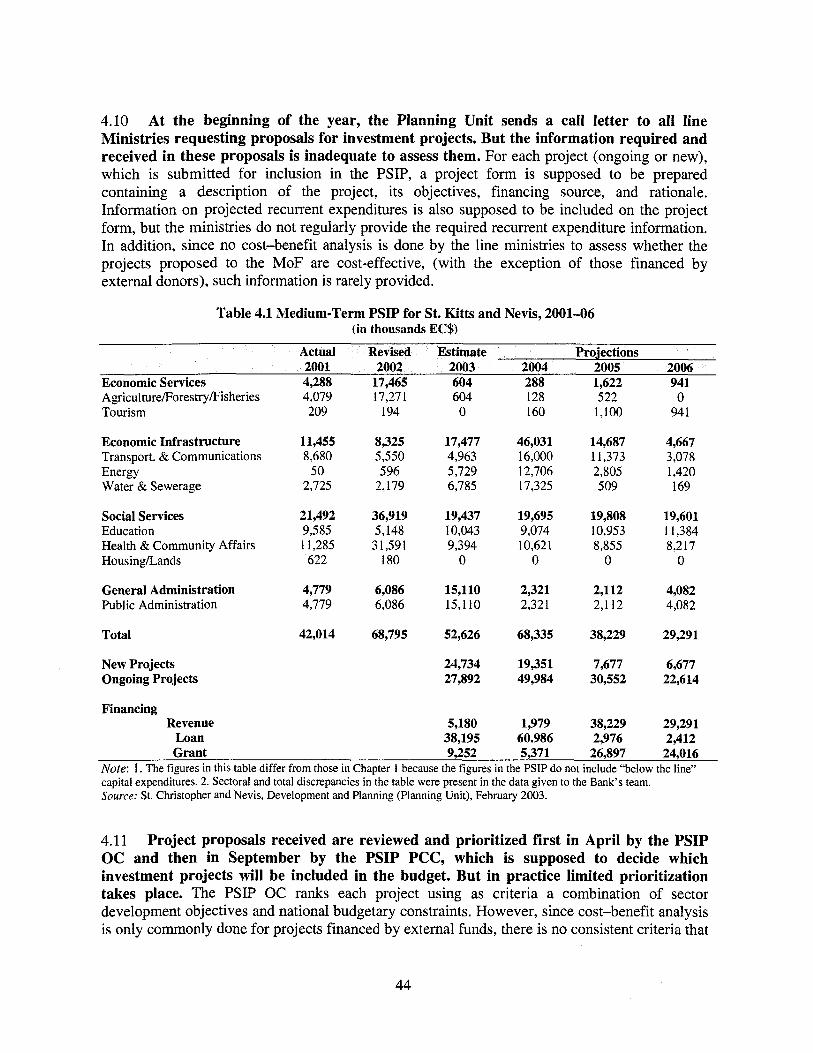
4.10 At the beginning of the year, the Planning Unit sends a call letter to all line Ministries requesting proposals for investment projects. But the information required and received in these proposals is inadequate to assess them. For each project (ongoing or new), which i s submitted for inclusion in the PSIP, a project form i s supposed to be prepared containing a description of the project, i t s objectives, financing source, and rationale. Information on projected recurrent expenditures i s also supposed to be included on the project form, but the ministries do not regularly provide the required recurrent expenditure information. In addition, since no cost-benefit analysis i s done by the line ministries to assess whether the projects proposed to the MoF are cost-effective, (with the exception of those financed by external donors), such information i s rarely provided.
Table 4.1 Medium-Term PSIP for St. Kith and Nevis, 2001-06 (in thousands EC$)
Economic Services 4,288 17,465 604 288 1,622 941
Tourism 209 194 0 160 1,100 94 1 Agricul tureForestryFisheries 4,079 17,27 1 604 128 522 0
Economic Infrastructure 11,455 8,325 17,477 46,031 14,687 4,667 Transport. & Communications 8,680 5,550 4,963 16,000 1 1,373 3,078 Energy 50 596 5,729 12,706 2,805 1,420 Water & Sewerage 2,725 2,179 6,785 17,325 509 169
Social Services 21,492 36,919 19,437 19,695 19,808 19,601 Education 9,585 5,148 10,043 9,074 10,953 11,384 Health & Community Affairs 1 1,285 31,591 9,394 10,62 1 8,855 8,217 Housing/Lands 622 180 0 0 0 0
General Administration 4,779 6,086 15,110 2,321 2,112 4,082 Public Administration 4,779 6,086 15,110 2,32 1 2,112 4,082
Total 42,014 68,795 52,626 68,335 38,229 29,291
New Projects Ongoing Projects
24,734 19,351 7,677 6,677 27,892 49,984 30,552 22,614
Financing Revenue 5,180 1,979 38,229 29,291
Loan 38,195 60.986 2,976 2,412 Grant 9,252 5,371 26,897 24,016
Note: 1. The figures in this table differ from those in Chapter 1 because the figures in the PSIP do not include “below the line” capital expenditures. 2. Sectoral and total discrepancies in the table were present in the data given to the Bank’s team. Source: St. Christopher and Nevis, Development and Planning (Planning Unit), February 2003.
4.1 1 Project proposals received are reviewed and prioritized first in April by the PSIP OC and then in September by the P S I P PCC, which i s supposed to decide which investment projects will be included in the budget. But in practice limited prioritization takes place. The PSIP OC ranks each project using as criteria a combination o f sector development objectives and national budgetary constraints. However, since cost-benefit analysis i s only commonly done for projects financed by external funds, there i s no consistent criteria that
44
can be applied to decide among investment projects. The investment projects ranked by the PSIP OC are then sent to the PSIP PCC to make the final decisions on which projects w i l l be included in the PSIP. First priority i s given to ongoing projects regardless of their merits, because presumably they already have funding. The new projects are supposed to be selected based on the ranking attached to them by the PSIP OC. However, in practice the PSIP PCC has not been capable o f making the required tough choices among investment projects, with the result that most o f the new investment projects are included in the budget. Those that are not deemed a current priority, but that are s t i l l important, are held for the next year’s budget. While the PSIP i s labeled as a rolling four-year plan, it i s really a one-year plan for the budget year, which also includes projects that are not expected to be implemented.
4.12 The Ministry of Finance does not coordinate contacts with donors, which i s an important part of the priority-setting exercise. Line ministries can contact donors directly. In some cases, th i s can result in the funding o f new projects that were not expected to be implemented and therefore were not included in the capital budget for the year and the PSIP.
4.13 The government’s stated objective of the PSIP i s to stimulate growth and reduce poverty. Nevertheless, some investment projects only partially fulfill these objectives. Good examples o f this include: in 1997 about 6 percent of total capital expenditures (EC$1.8 million) was allocated to upgrade netball and tennis facilities, in 1997 about 13 percent o f capital expenditures (EC$5 million) was allocated to football stands in Warner Park, and in 2000 about 12 percent of total capital expenditures (EC$6.2 million) was allocated to Carifesta VII. Carifesta i s a Caribbean arts and crafts festival that takes place regularly in the Caribbean, organized each time by a different country. In 2000 it was organized by St. Kitts and Nevis, and the government, in response to the alleged lack of capacity to make housing arrangements for all participants, built houses to accommodate the participants, which were subsequently sold.
4.14 Several investment projects included in the PSIP and the capital budget should be classified as recurrent expenditures. Moreover, a significant amount of the capital expenditures incurred by the government are recorded “below the line” and not captured in the PSIP. Investment projects such as maintenance o f roads, the purchase of books and magazines, painting of schools, census and household surveys, and technical assistance for a law project and the constitutional commission are examples of projects that should be moved to the recurrent budget. The reason why they have been kept in the capital budget may have been to avoid an increase in the deficit in the current fiscal balance, because i t i s the key fiscal variable targeted by the government, and to provide an opportunity to present them to the donors with the hope o f obtaining grants for their financing. Moreover, since 1995 a large portion o f capital expenditures has been financed “below the line” and therefore not recorded in the PSIP or in the capital budget. The Planning Unit in the M o F has made an effort to track down the capital expenditures financed from “below the line,” but it has not been very successful. The government should end the practice of financing expenditures from “below the line.”
4.15 The following steps can be taken to improve the preparation of the PSIP:
e The capital budget and the PSIP prepared by the Planning Unit in the Ministry o f Finance need to be made an integral element o f the country strategic outlook and the MTESP and not merely an addendum containing a wish l i s t o f investment projects. The Budget and
45
Planning Unit should work closely to anchor the capital budget and the PSIP to the country strategy. Moreover, the budget unit should set the overall envelope for capital expenditures (consistent with macroeconomic stability) early in the year so that the Planning Unit can attempt to prioritize the projects from the start instead of at the end of the process.
e The government o f St. Kitts and Nevis needs to establish clear selection criteria for investment projects. First, only investment projects, independently of their source of financing, with all the required information (in particular projected recurrent costs) should be included in the capital expenditure and the PSIP. Second, only investment projects prioritized based on some type of cost-benefit analysis and in accordance with the overall resources available for capital expenditures should be included in capital budget and the PSIP. Third, all projects with a cost above EC$2 mill ion should be subject to a formal cost-benefit analysis before being included in the capital budget or the PSIP. Fourth, given the high debt burden, only projects financed with concessional financing should be included.
e At a technical level, documentation needs to be prepared on the process o f preparing the PSIP, and staff needs to be trained in the procedures and tools o f project analysis for preparing the PSIP.
e The Planning Unit should require the line ministries to report capital spending monthly and should stop disbursements to those projects that do not provide the information at the end o f the month.
4.16 During 1996-2001, capital expenditures were on average around 5.0 percent of GDP?* As Table 4.2 shows, capital expenditures fluctuate from a low o f about 4.3 percent o f GDP in 1998 to a peak o f about 6 percent o f GDP in 1999 and 2000, when reconstruction in the aftermath o f Hurricane Lenny increased spending. On average, during 1996-2001, the largest amount o f capital expenditure was spent on infrastructure, at about 2.5 percent o f GDP, followed by social services, 1.7 percent o f GDP, and general administration, 0.5 percent o f GDP.
4.17 During 1996-2001, half of capital expenditures were concentrated in the area of economic infrastructure, including energy and water services. The latter could be diverted to the private sector in the future. Capital expenditures on infrastructure include roads, water, sewerage, ports, and other infrastructure investments, which are largely under the responsibility o f the Ministry o f Communications, Works and Public Utilities. As Table 4.3 shows, on average about 16 percent of total capital expenditures during 1996-2001 was allocated to energy and water investment. However, if these services could be privatized in the medium term, with an adequate regulatory framework, some resources could be freed up for investment in social services.
52 Not including “below the line” transactions.
46
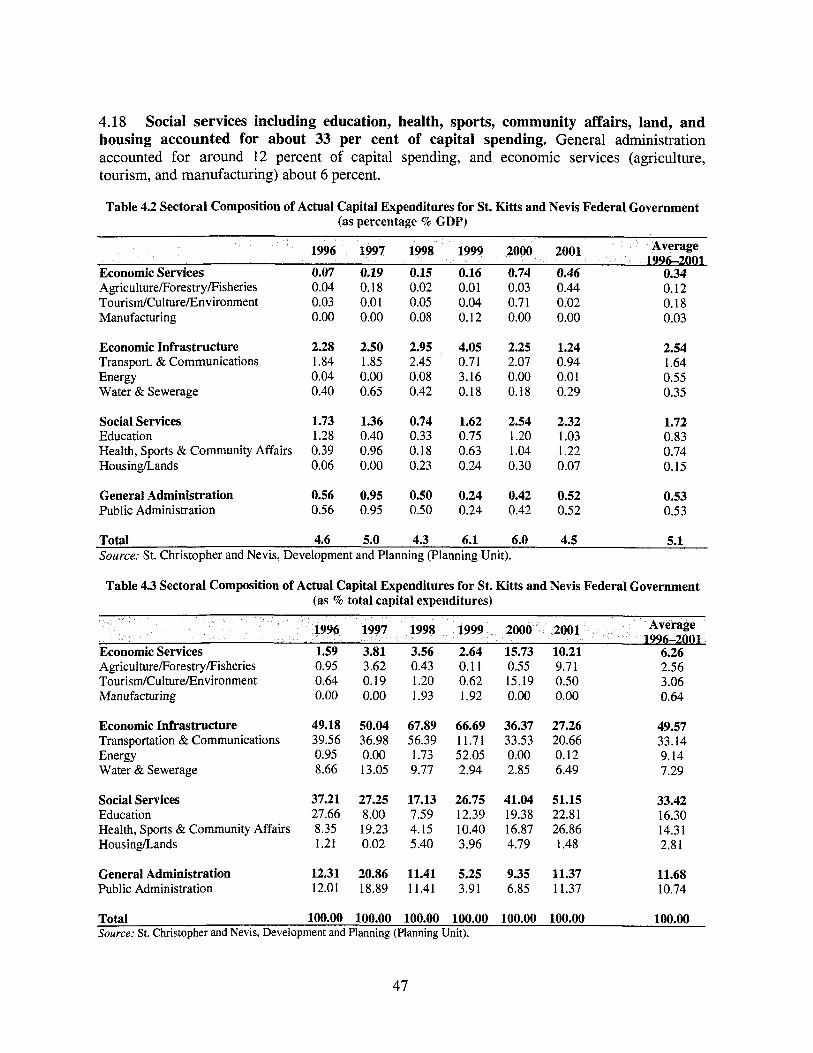
4.18 Social services including education, health, sports, community affairs, land, and housing accounted for about 33 per cent of capital spending. General administration accounted for around 12 percent of capital spending, and economic services (agriculture, tourism, and manufacturing) about 6 percent.
Table 4.2 Sectoral Composition of Actual Capital Expenditures for St. Kitts and Nevis Federal Government (as percentage % GDP)
Economic Services 0.07 0.19 0.15 0.16 0.74 0.46 0.34 AgricultureForestry Fisheries 0.04 0.18 0.02 0.01 0.03 0.44 0.12 TourisdCul tureEnvironment 0.03 0.01 0.05 0.04 0.71 0.02 0.18 Manufacturing 0.00 0.00 0.08 0.12 0.00 0.00 0.03
Economic Infrastructure 2.28 2.50 2.95 4.05 2.25 1.24 2.54 Transport. & Communications 1.84 1.85 2.45 0.71 2.07 0.94 1.64 Energy 0.04 0.00 0.08 3.16 0.00 0.01 0.55 Water & Sewerage 0.40 0.65 0.42 0.18 0.18 0.29 0.35
Social Services 1.73 1.36 0.74 1.62 2.54 2.32 1.72 Education 1.28 0.40 0.33 0.75 1.20 1.03 0.83 Health, Sports & Community Affairs 0.39 0.96 0.18 0.63 1.04 1.22 0.74 Housing/Lands 0.06 0.00 0.23 0.24 0.30 0.07 0.15
General Administration 0.56 0.95 0.50 0.24 0.42 0.52 0.53 Public Administration 0.56 0.95 0.50 0.24 0.42 0.52 0.53
Total 4.6 5.0 4.3 6.1 6.0 4.5 5.1 Source: St. Christopher and Nevis, Development and Planning (Planning Unit).
Table 4.3 Sectoral Composition of Actual Capital Expenditures for St. Kitts and Nevis Federal Government (as 9% total capital expenditures)
Economic Services 1.59 3.81 3.56 2.64 15.73 10.21 6.26 Agricul tureForestryFisheries TourisdCulturelEnvironment Manufacturing
Economic Infrastructure Transportation & Communications Energy Water & Sewerage
Social Services Education Health, Sports & Community Affairs Housing/Lands
General Administration Public Administration
0.95 0.64 0.00
49.18 39.56 0.95 8.66
37.2 1 27.66 8.35 1.21
12.31 12.01
3.62 0.19 0.00
50.04 36.98 0.00 13.05
27.25 8.00 19.23 0.02
20.86 18.89
0.43 1.20 I .93
67.89 56.39 1.73 9.77
17.13 7.59 4.15 5.40
11.41 11.41
0.11 0.62 1.92
66.69 11.71 52.05 2.94
26.75 12.39 10.40 3.96
5.25 3.9 1
0.55 15.19 0.00
36.37 33.53 0.00 2.85
41.04 19.38 16.87 4.79
9.35 6.85
9.7 1 0.50 0.00
27.26 20.66 0.12 6.49
51.15 22.8 1 26.86 1.48
11.37 1 1.37
2.56 3.06 0.64
49.57 33.14 9.14 7.29
33.42 16.30 14.31 2.8 1
11.68 10.74
Total 100.00 100.00 100.00 100.00 100.00 100.00 100.00 Source: St. Christopher and Nevis, Development and Planning (Planning Unit).
47
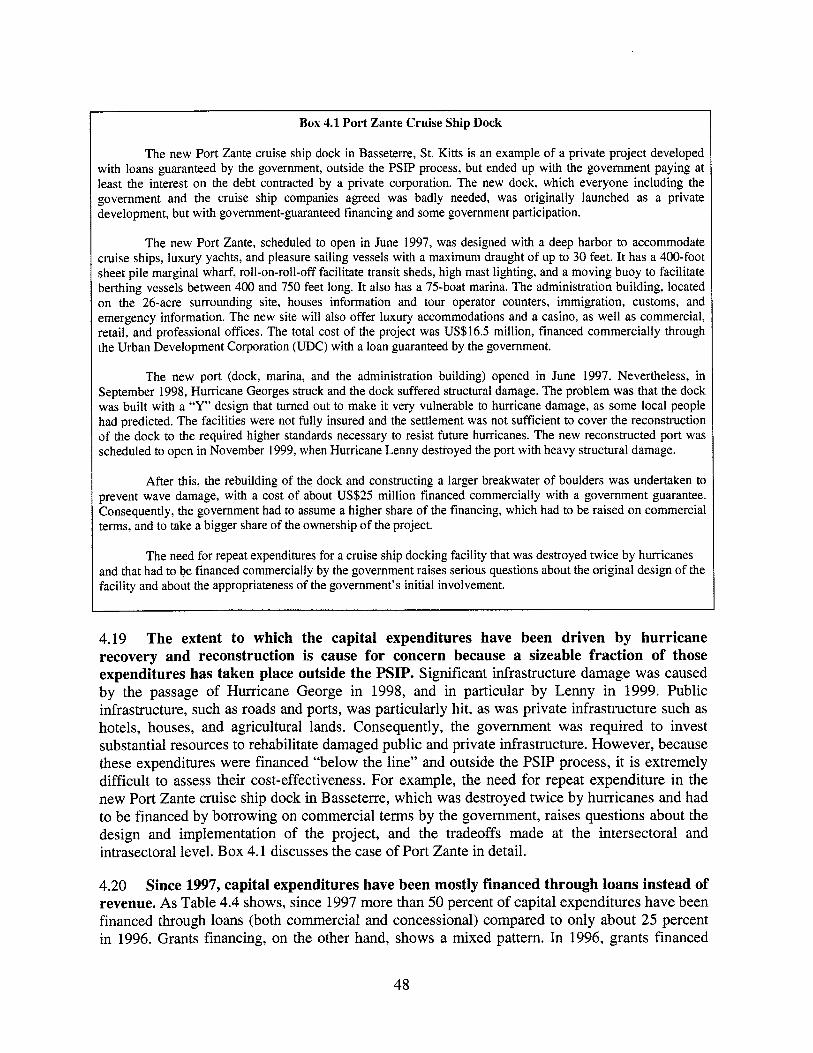
Box 4.1 Port Zante Cruise Ship Dock
The new Port Zante cruise ship dock in Basseterre, St. Kitts i s an example o f a private project developed with loans guaranteed by the government, outside the PSIP process, but ended up with the government paying at least the interest on the debt contracted by a private corporation. The new dock, which everyone including the government and the cruise ship companies agreed was badly needed, was originally launched as a private development, but with government-guaranteed financing and some government participation.
The new Port Zante, scheduled to open in June 1997, was designed with a deep harbor to accommodate cruise ships, luxury yachts, and pleasure sailing vessels with a maximum draught o f up to 30 feet. I t has a 400-foot sheet pile marginal wharf, roll-on-roll-off facilitate transit sheds, high mast lighting, and a moving buoy to facilitate berthing vessels between 400 and 750 feet long. I t also has a 75-boat marina. The administration building, located on the 26-acre surrounding site, houses information and tour operator counters, immigration, customs, and emergency information. The new site will also offer luxury accommodations and a casino, as well as commercial, retail, and professional offices. The total cost o f the project was US$16.5 million, financed commercially through the Urban Development Corporation (UDC) with a loan guaranteed by the government.
The new port (dock, marina, and the administration building) opened in June 1997. Nevertheless, in September 1998, Hurricane Georges struck and the dock suffered structural damage. The problem was that the dock was built with a “Y” design that turned out to make it very vulnerable to hurricane damage, as some local people had predicted. The facilities were not fully insured and the settlement was not sufficient to cover the reconstruction of the dock to the required higher standards necessary to resist future hurricanes. The new reconstructed port was scheduled to open in November 1999, when Hurricane Lenny destroyed the port with heavy structural damage.
After this, the rebuilding of the dock and constructing a larger breakwater o f boulders was undertaken to prevent wave damage, with a cost o f about US$25 million financed commercially with a government guarantee. Consequently, the government had to assume a higher share of the financing, which had to be raised on commercial terms, and to take a bigger share of the ownership o f the project.
The need for repeat expenditures for a cruise ship docking facility that was destroyed twice by hurricanes and that had to be financed commercially by the government raises serious questions about the original design o f the facility and about the appropriateness o f the government’s initial involvement.
4.19 The extent to which the capital expenditures have been driven by hurricane recovery and reconstruction is cause for concern because a sizeable fraction of those expenditures has taken place outside the PSIP. Significant infrastructure damage was caused by the passage o f Hurricane George in 1998, and in particular by Lenny in 1999. Public infrastructure, such as roads and ports, was particularly hit, as was private infrastructure such as hotels, houses, and agricultural lands. Consequently, the government was required to invest substantial resources to rehabilitate damaged public and private infrastructure. However, because these expenditures were financed “below the line” and outside the PSIP process, it i s extremely difficult to assess their cost-effectiveness. For example, the need for repeat expenditure in the new Port Zante cruise ship dock in Basseterre, which was destroyed twice by hurricanes and had to be financed by borrowing on commercial terms by the government, raises questions about the design and implementation o f the project, and the tradeoffs made at the intersectoral and intrasectoral level. Box 4.1 discusses the case o f Port Zante in detail.
4.20 Since 1997, capital expenditures have been mostly financed through loans instead of revenue. As Table 4.4 shows, since 1997 more than 50 percent o f capital expenditures have been financed through loans (both commercial and concessional) compared to only about 25 percent in 1996. Grants financing, on the other hand, shows a mixed pattern. In 1996, grants financed
48
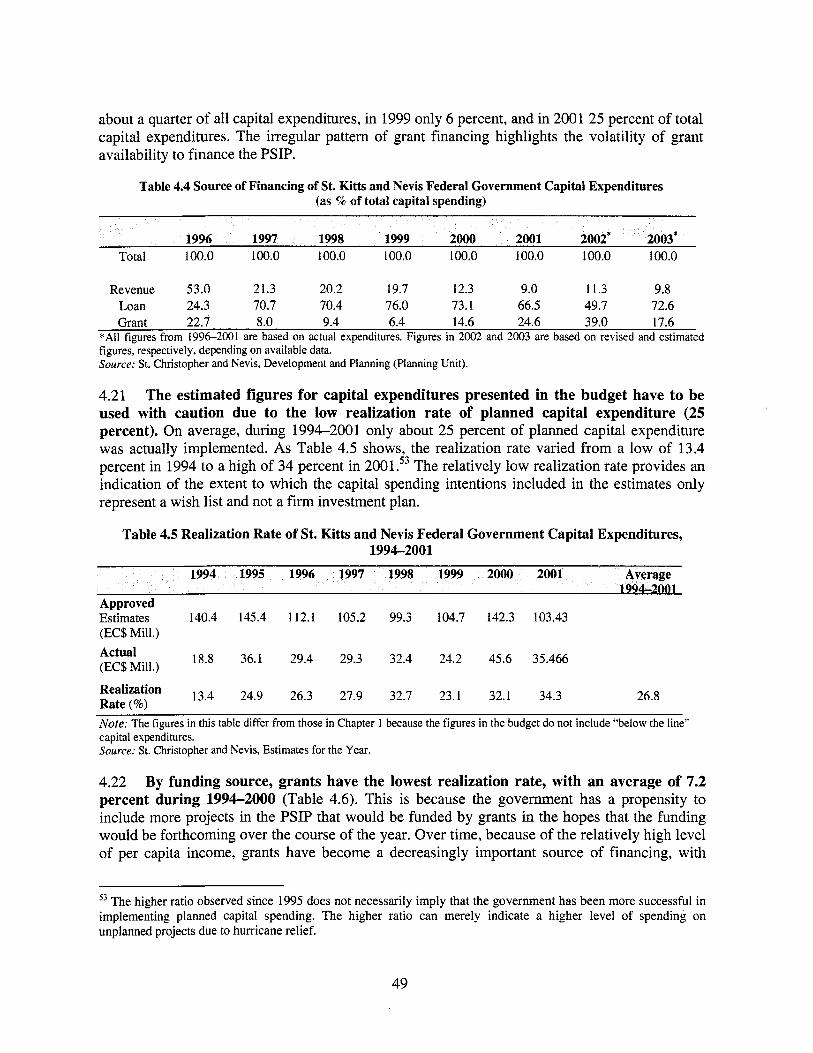
about a quarter o f a l l capital expenditures, in 1999 only 6 percent, and in 2001 25 percent of total capital expenditures. The irregular pattern of grant financing highlights the volatility of grant availability to finance the PSIP.
Table 4.4 Source of Financing of St. Kith and Nevis Federal Government Capital Expenditures (as % of total capital spending)
1996 1997 1998 1999 2000 2001 003: Total 100.0 100.0 100.0 100.0 100.0 100.0 100.0 100.0
Revenue 53.0 21.3 20.2 19.7 12.3 9.0 11.3 9.8 Loan 24.3 70.7 70.4 76.0 73.1 66.5 49.7 72.6 Grant 22.7 8.0 9.4 6.4 14.6 24.6 39.0 17.6
*All figures from 1996-2001 are based on actual expenditures. Figures in 2002 and 2003 are based on revised and estimated figures, respectively, depending on available data. Source: St. Christopher and Nevis, Development and Planning (Planning Unit).
4.21 The estimated figures for capital expenditures presented in the budget have to be used with caution due to the low realization rate of planned capital expenditure (25 percent). On average, during 1994-2001 only about 25 percent of planned capital expenditure was actually implemented. As Table 4.5 shows, the realization rate varied from a low of 13.4 percent in 1994 to a high of 34 percent in 2001.53 The relatively low realization rate provides an indication of the extent to which the capital spending intentions included in the estimates only represent a wish l i s t and not a firm investment plan.
Table 4.5 Realization Rate of St. Kitts and Nevis Federal Government Capital Expenditures, 1994-2001
Approved Estimates 140.4 145.4 112.1 105.2 99.3 104.7 142.3 103.43 (EC$ Mill.)
18.8 36.1 29.4 29.3 32.4 24.2 45.6 35.466 Actual (EC$ Mill.)
13.4 24.9 26.3 27.9 32.7 23.1 32.1 34.3 26.8 Rate (%) Note: The figures in this table differ from those in Chapter 1 because the figures in the budget do not include “below the line” capital expenditures. Source: St. Christopher and Nevis, Estimates for the Year.
4.22 By funding source, grants have the lowest realization rate, with an average of 7.2 percent during 1994-2000 (Table 4.6). T h i s i s because the government has a propensity to include more projects in the PSIP that would be funded by grants in the hopes that the funding would be forthcoming over the course of the year. Over time, because of the relatively high level of per capita income, grants have become a decreasingly important source of financing, with
53 The higher ratio observed since 1995 does not necessarily imply that the government has been more successful in implementing planned capital spending. The higher ratio can merely indicate a higher level of spending on unplanned projects due to hurricane relief.
49
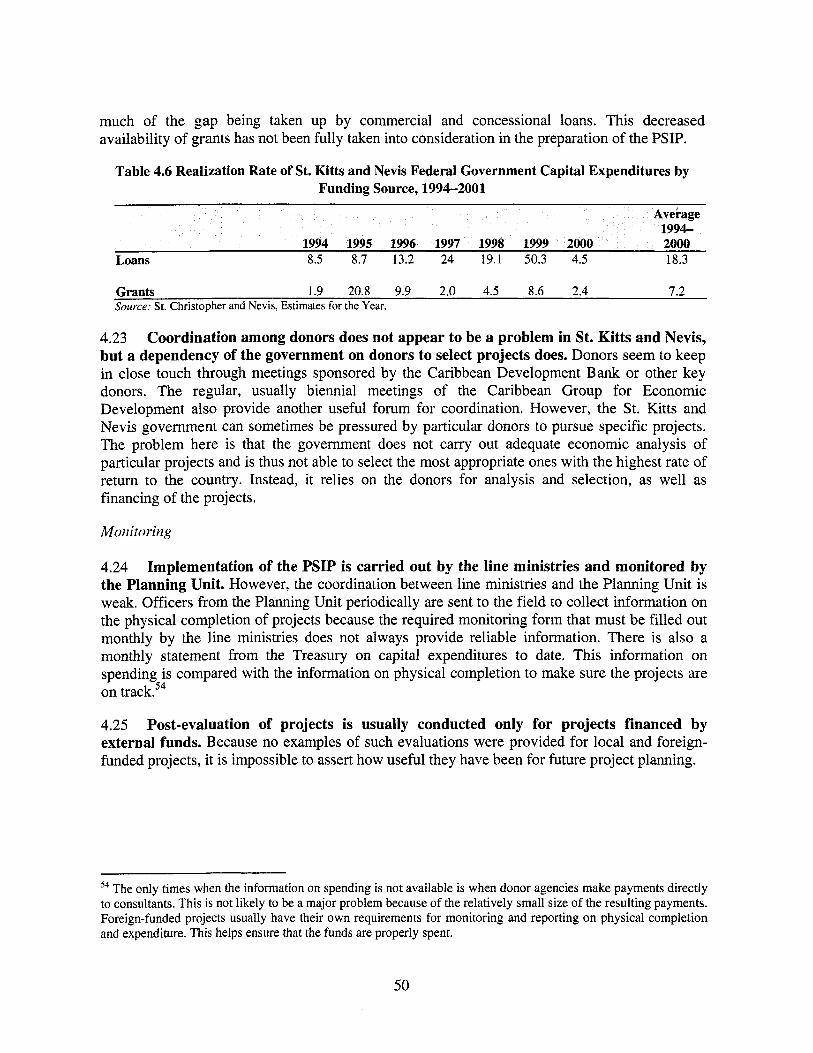
much o f the gap being taken up by commercial and concessional loans. T h i s decreased availability o f grants has not been fully taken into consideration in the preparation o f the PSIP.
Table 4.6 Realization Rate of St. Kith and Nevis Federal Government Capital Expenditures by Funding Source, 1994-2001
1994 1995 1996 1997 1998 1999 2000 Loans 8.5 8.7 13.2 24 19.1 50.3 4.5 18.3
Grants 1.9 20.8 9.9 2.0 4.5 8.6 2.4 7.2 Source: St. Christopher and Nevis, Estimates for the Year.
4.23 Coordination among donors does not appear to be a problem in St. Kitts and Nevis, but a dependency of the government on donors to select projects does. Donors seem to keep in close touch through meetings sponsored by the Caribbean Development Bank or other key donors. The regular, usually biennial meetings o f the Caribbean Group for Economic Development also provide another useful forum for coordination. However, the St. Kitts and Nevis government can sometimes be pressured by particular donors to pursue specific projects. The problem here i s that the government does not carry out adequate economic analysis o f particular projects and i s thus not able to select the most appropriate ones with the highest rate o f return to the country. Instead, i t relies on the donors for analysis and selection, as well as financing o f the projects.
4.24 Implementation of the PSIP is carried out by the line ministries and monitored by the Planning Unit. However, the coordination between line ministries and the Planning Unit i s weak. Officers from the Planning Unit periodically are sent to the field to collect information on the physical completion o f projects because the required monitoring form that must be filled out monthly by the line ministries does not always provide reliable information. There i s also a monthly statement from the Treasury on capital expenditures to date. This information on spending i s compared with the information on physical completion to make sure the projects are on track.54
4.25 Post-evaluation of projects i s usually conducted only for projects financed b y external funds. Because no examples o f such evaluations were provided for local and foreign- funded projects, it i s impossible to assert how useful they have been for future project planning.
54 The only times when the information on spending i s not available i s when donor agencies make payments directly to consultants. This i s not likely to be a major problem because of the relatively small size of the resulting payments. Foreign-funded projects usually have their own requirements for monitoring and reporting on physical completion and expenditure. T h i s helps ensure that the funds are properly spent.
50
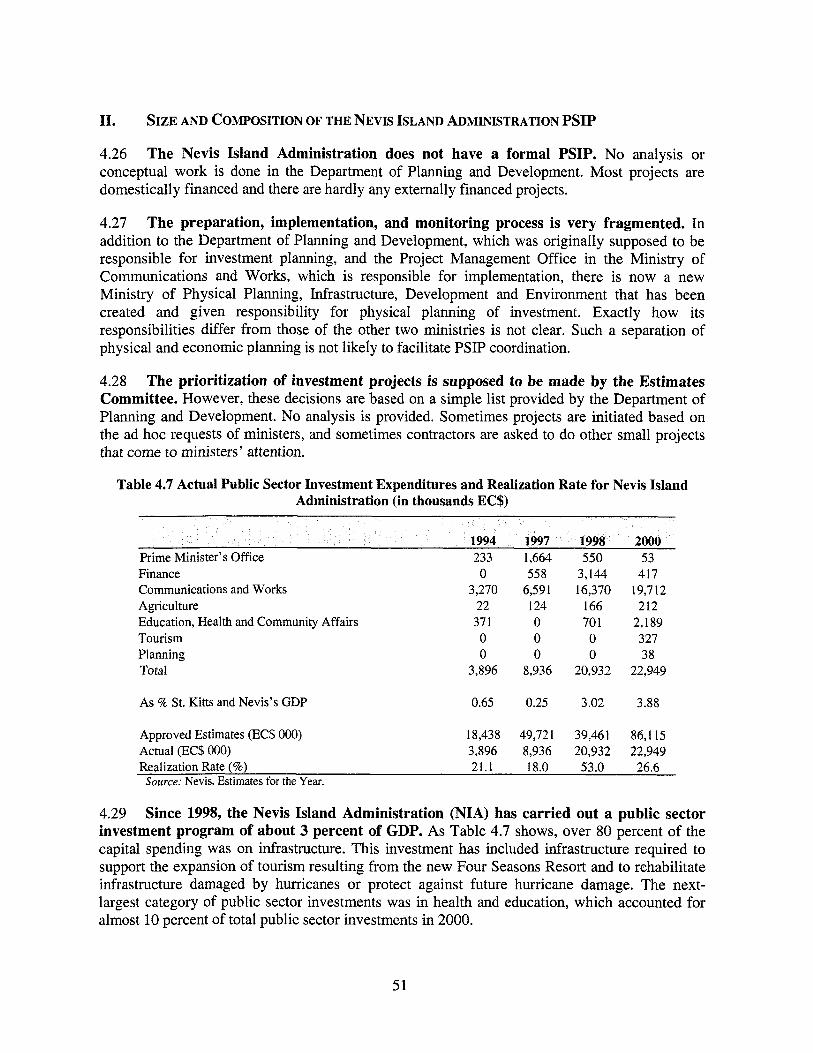
11. SIZE AND COMPOSITION OF THE NEVIS ISLAND ADMINISTRATION PSIP
4.26 The Nevis Island Administration does not have a formal PSIP. No analysis or conceptual work i s done in the Department of Planning and Development. Most projects are domestically financed and there are hardly any externally financed projects.
4.27 The preparation, implementation, and monitoring process i s very fragmented. In addition to the Department o f Planning and Development, which was originally supposed to be responsible for investment planning, and the Project Management Office in the Ministry o f Communications and Works, which i s responsible for implementation, there i s now a new Ministry o f Physical Planning, Infrastructure, Development and Environment that has been created and given responsibility for physical planning o f investment. Exactly how i ts responsibilities differ from those of the other two ministries i s not clear. Such a separation of physical and economic planning i s not likely to facilitate PSIP coordination.
4.28 The prioritization of investment projects is supposed to be made by the Estimates Committee. However, these decisions are based on a simple l i s t provided by the Department o f Planning and Development. No analysis i s provided. Sometimes projects are initiated based on the ad hoc requests of ministers, and sometimes contractors are asked to do other small projects that come to ministers’ attention.
Table 4.7 Actual Public Sector Investment Expenditures and Realization Rate for Nevis Island Administration (in thousands EC$)
2000 Prime Minister’s Office 233 1,664 Finance Communications and Works Agriculture Education, Health and Community Affairs Tourism Planning Total
As % St. Kitts and Nevis’s GDP
Approved Estimates (EC$ 000) Actual (EC$ 000)
0 3,270
22 37 1 0 0
3,896
0.65
18,438 3,896
558 6,59 1 124 0 0 0
8,936
0.25
49,72 1 8,936
550 53 3,144 417 16,370 19,712
166 212 701 2,189 0 327 0 38
20,932 22,949
3.02 3.88
39,461 86,115 20,932 22,949
Realization Rate (%) 21.1 18.0 53.0 26.6 Source: Nevis, Estimates for the Year.
4.29 Since 1995, the Nevis Island Administration (NIA) has carried out a public sector investment program of about 3 percent of GDP. As Table 4.7 shows, over 80 percent o f the capital spending was on infrastructure. T h i s investment has included infrastructure required to support the expansion o f tourism resulting from the new Four Seasons Resort and to rehabilitate infrastructure damaged by hurricanes or protect against future hurricane damage. The next- largest category of public sector investments was in health and education, which accounted for almost 10 percent o f total public sector investments in 2000.
51
4.30 The NIA, like the Federal Government of St. Kitts and Nevis, also has a very low realization rate for public sector investment projects. T h i s i s because it follows a similar approach in preparing i ts capital spending estimates, under which estimates for the budget year do not necessarily reflect expected spending for the year, but are more o f a wish list.
4.31 Most of the NIA’s expenditures on public sector investments are paid for with i ts own revenues or by borrowing on commercial terms. For example, in 2000,34 percent o f i ts capital expenditure was financed by i ts own revenues, 63 percent by loans, and only 2.6 percent by grants.
52
5. PUBLIC SECTOR EMPLOYMENT AND COMPENSATION
5.1 With a total population of about 45,000 inhabitants, St. Kitts and Nevis has limited resources to carry out the whole range o f functions performed by any government. As several studies have shown, small countries tend to have bigger governments in response to the higher cost o f supplying public goods and the need to provide a stabilization role to ameliorate the effect o f external shocks (Alesina and Wacziarg 1997; Rodrik 1996). However, even in a small country a government can be too big in several ways (Nunberg and Lindauer 1994):
0 The public service may be too large in the broad sense that the government sector i s overextended, possessing too many agencies and departments charged with too broad a span o f responsibilities. The public service may be too large in the narrower sense of employing workers in excess o f the requirements of designated tasks.
0 The public service may be too large and expensive for sound fiscal management.
0
5.2 In this chapter, we mainly focus on why the government’s wage bill in St. Kitts and Nevis constitutes too high a percentage o f GDP, about 15 percent during 1995-2002, for cost- effectiveness and sound fiscal management. The main findings and recommendations can be summarized as follows:
0 The high wage bill o f the St. Kitts and Nevis Federal Government i s employment driven rather than wage driven. During 1995-2002, the number o f established positions increased in total by 38 percent, and the number of non-established positions in full-time equivalent increased in total by 124 percent. At the same time, government real wages decreased slightly. Downsizing the civil service to the levels o f 1995 by cutting 800 established positions and 500 non-established positions (head count) would reduce the wage bill by EC$42 million, or 5 percent o f GDP.
0 However, to implement a well-thought-out downsizing program, the government w i l l have to introduce and/or upgrade its information systems in order to accurately cost i t s implications (pension and severance payments) and monitor public employment (established and non-established positions) on a regular basis.
Moreover, a medium-term and long-term downsizing program wi l l need to adopt a human resources management strategy and develop new strategies to carry out essential tasks by leveraging scarce resources. Otherwise, rehiring staff in the medium term can overturn the fiscal gains obtained by reducing the size o f the c iv i l service. For example, a performance appraisal system should be established with pay or bonuses to reward good performance. In addition, the fragmentation and duplication o f work among ministries, departments, and agencies, leading to a diffusion o f responsibilities, should be addressed, as should the possibility of the government divesting some o f its functions to the private sector.
0 The Nevis Island Administration (NIA) has reduced the number of positions (established and non-established) since 1995 in total by 15 percent. I t s main challenge for the future i s
0
53
to consolidate these gains and reduce the cost of the administrative ministries such as Finance and the Premier’s Office.
I. RECENT TREKDS IN EMPLOYMENT AND COMPENSATION IN THE ST. KITTS AND NEVIS FEDERAL GOVERNMEKT
5.3 There are two types of government positions in the St. Kitts and Nevis Federal Government: established and non-established. Employees in established positions are appointed by the Governor General upon a formal request by the Public Service Commission, with the approval of the Establishment Division in the Prime Minister’s Office. Established positions are permanent positions listed in the budget, and their compensation i s classified as Personal Emoluments. Employees in non-established positions are hired directly by l ine ministries, their numbers are not presented in the budget, and only their wages are included as a line item.55
5.4 The legislation that governs public sector employment i s more protective of established than non-established workers. Established employment i s governed by the Constitution, which has been in effect since 1983, and the public service regulations date from the 1970s. If an established worker retired in the “public interest” receives a lump sum immediately and a reduced pension, the lump sum i s equal to five times the full annual pension amount. The Pension Variation Act of July 1994 speaks o f no pension before 15 years of service, and a pension at age 50 after 15 years o f service. The Protection o f Employment Act dated June 1986 covers non-established workers. This act states that to dismiss a non-established worker requires only notice o f the dismissal. If the notice i s given a month in advance no severance payment i s necessary, but all benefits must be paid (for example, leave not taken). In the case o f dismissal in lieu of notice, a severance payment o f three months must be paid, plus the benefits at time of dismissal.
Employment
5.5 F r o m 1995 to 2002, the number of established positions increased by a tota1,of 38.3 percent, or 4.7 percent per year. As Table 5.1 shows, the largest increase in established positions occurred in 1997 (12.8 percent). I t was mainly the result o f the creation o f a National Defense Force (about 135 positions) and an Educational Planning Division (19 positions), and the hiring o f 60 supernumerary teachers (substitute teachers) in all high schools. One o f the largest increases was in 2000 (an election year).
5.6 In the same period, non-established positions on a full-time-equivalent (FTE) basis increased in total by 124 percent, o r 12.2 percent per year?6 A significant proportion of non-
55 The Public Service Commission i s also responsible for ratifying promotions and disciplinary actions. Decisions can be appealed to the Public Service Appeals Board. There have been only a couple of dismissals for cause in the past few years.
56 A head count o f non-established positions exists only for 2000 and 2002. For all others years the number of non- established positions on an FTE basis was estimated by dividing total wages in the Estimates by the average Personal Emoluments.
‘
54
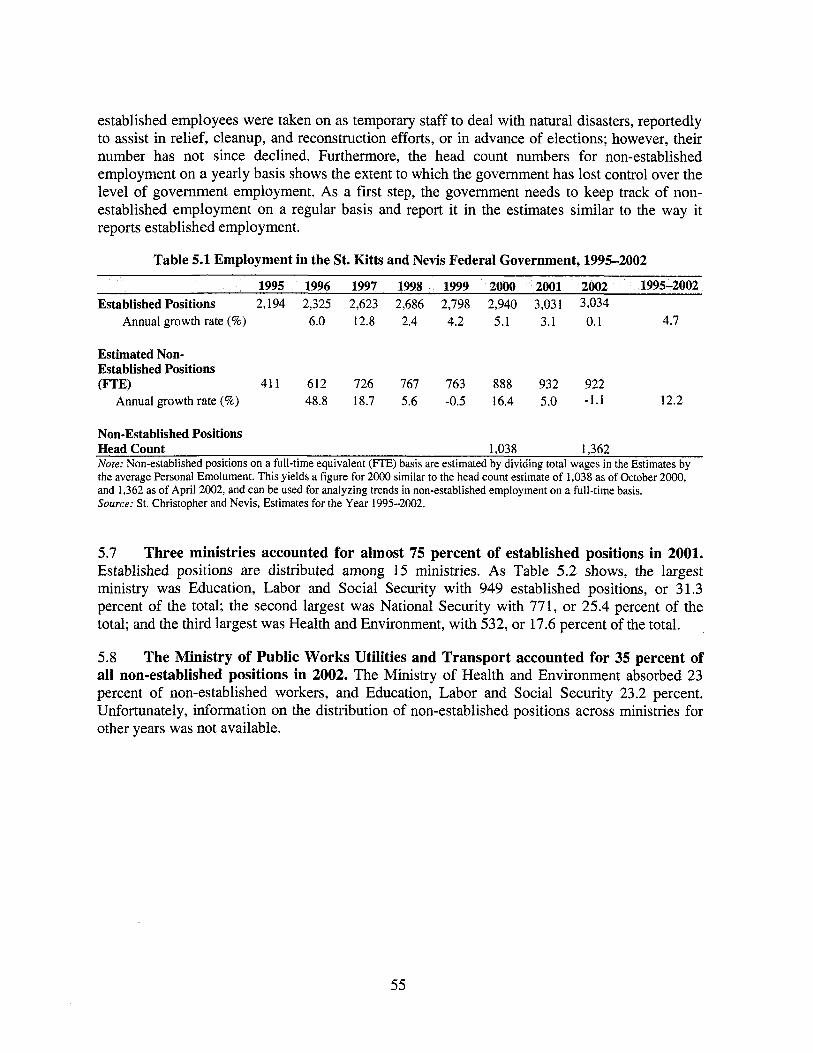
established employees were taken on as temporary staff to deal with natural disasters, reportedly to assist in relief, cleanup, and reconstruction efforts, or in advance of elections; however, their number has not since declined. Furthermore, the head count numbers for non-established employment on a yearly basis shows the extent to which the government has lost control over the level o f government employment. As a first step, the government needs to keep track o f non- established employment on a regular basis and report i t in the estimates similar to the way it reports established employment.
Table 5.1 Employment in the St. Kith and Nevis Federal Government, 1995-2002
1995 1996 1997 1998 1999 2000 2001 2002 1995-2002 Established Positions 2,194 2,325 2,623 2,686 2,798 2,940 3,031 3,034
Annual growth rate (%) 6.0 12.8 2.4 4.2 5.1 3.1 0.1 4.7
Estimated Non- Established Positions (FTE) 411 612 726 767 763 888 932 922
Annual growth rate (%) 48.8 18.7 5.6 -0.5 16.4 5.0 -1.1 12.2
Non-Established Positions Head Count 1,038 1,362 Note: Non-established positions on a full-time equivalent (RE) basis are estimated by dividing total wages in the Estimates by the average Personal Emolument. This yields a figure for 2000 similar to the head count estimate of 1,038 as of October 2000, and 1,362 as of April 2002, and can be used for analyzing trends in non-established employment on a full-time basis. Source: St. Christopher and Nevis, Estimates for the Year 1995-2002.
5.7 Three ministries accounted for almost 75 percent of established positions in 2001. Established positions are distributed among 15 ministries. As Table 5.2 shows, the largest ministry was Education, Labor and Social Security with 949 established positions, or 3 1.3 percent o f the total; the second largest was National Security with 771, or 25.4 percent o f the total; and the third largest was Health and Environment, with 532, or 17.6 percent o f the total.
5.8 The Ministry of Public Works Utilities and Transport accounted for 35 percent of all non-established positions in 2002. The Ministry o f Health and Environment absorbed 23 percent o f non-established workers, and Education, Labor and Social Security 23.2 percent. Unfortunately, information on the distribution of non-established positions across ministries for other years was not available.
55
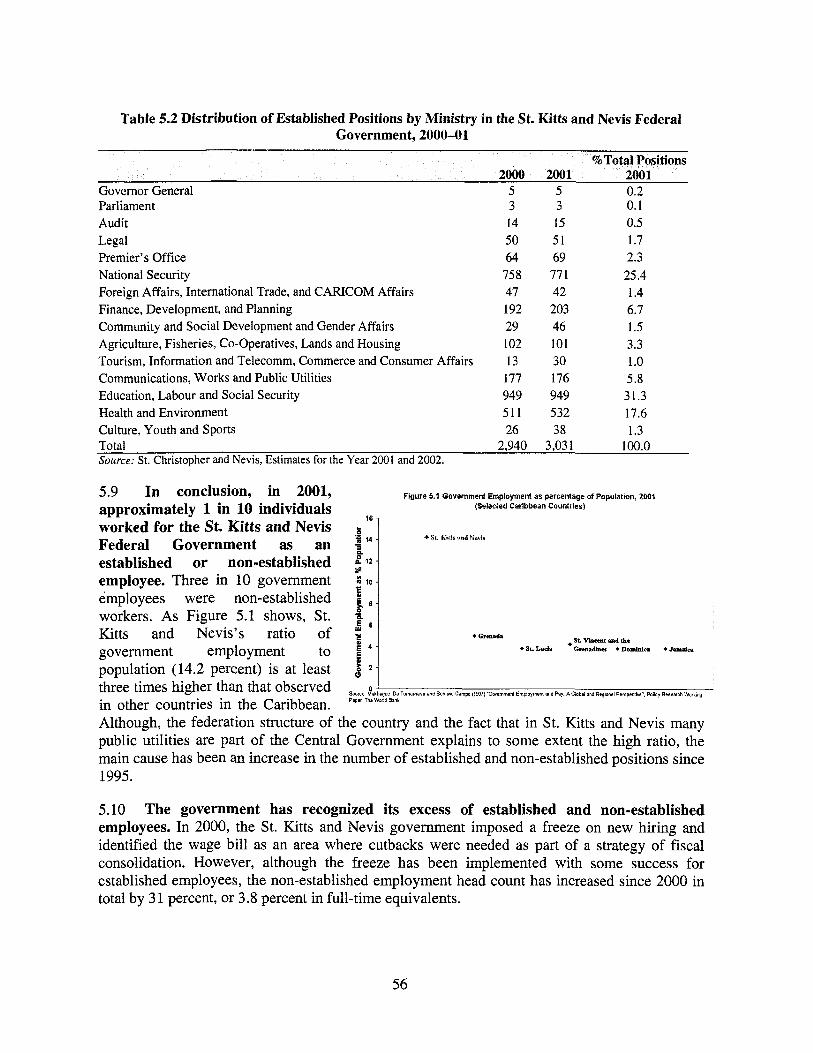
Table 5.2 Distribution of Established Positions by Ministry in the St. Kitts and Nevis Federal Government, 2000-01
worked for the St. Kitts and Nevis Federal Government as an established or non-established $ 1 2 - employee. Three in 10 government IO - employees were non-established workers. As Figure 5.1 shows, St. =
l5 6 - Kitts and Nevis's ratio o f - government employment to population (14.2 percent) i s at least 3 2 -
g 3 14 -
5 e -
f 4 -
%T ions
I) SL hiiir imii hcui5
,S+Vlmmtaadthe * Grenada
*S+Ludr Cmnadlna + D o d d e r *Jamaica
Governor General 5 5 0.2 Parliament 3 3 0.1 Audit 14 I5 0.5 Legal 50 51 1.7 Premier's Office 64 69 2.3 National Security 758 771 25.4 Foreign Affairs, International Trade, and CARICOM Affairs 47 42 1.4 Finance, Development, and Planning 192 203 6.7 Community and Social Development and Gender Affairs 29 46 I .5 Agriculture, Fisheries, Co-Operatives, Lands and Housing 102 101 3.3 Tourism, Information and Telecomm, Commerce and Consumer Affairs 13 30 1 .o Communications, Works and Public Utilities 177 176 5.8 Education, Labour and Social Security 949 949 31.3 Health and Environment 511 532 17.6 Culture, Youth and Sports 26 38 1.3 Total 2,940 3,031 100.0 Source: St. Christopher and Nevis, Estimates for the Year 2001 and 2002.
5.10 The government has recognized i ts excess of established and non-established employees. In 2000, the St. Kitts and Nevis government imposed a freeze on new hiring and identified the wage bill as an area where cutbacks were needed as part of a strategy of fiscal consolidation. However, although the freeze has been implemented with some success for established employees, the non-established employment head count has increased since 2000 in total by 31 percent, or 3.8 percent in full-time equivalents.
56
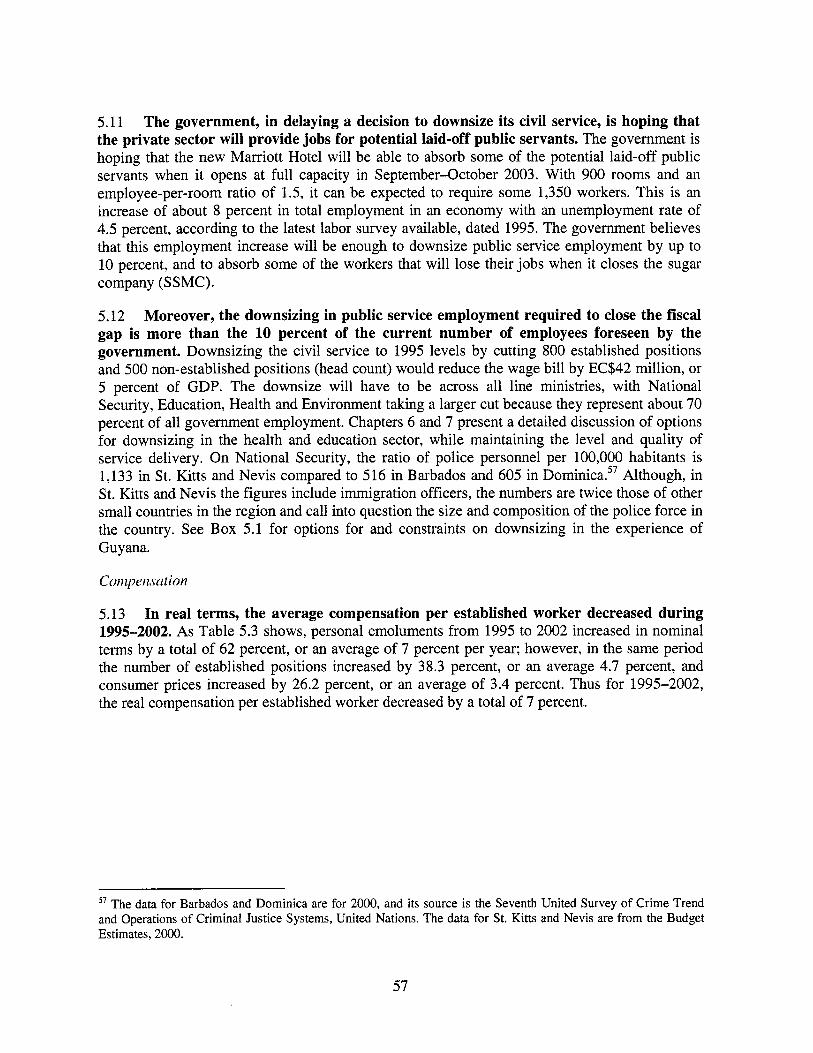
5.11 The government, in delaying a decision to downsize i ts civil service, i s hoping that the private sector will provide jobs for potential laid-off public servants. The government i s hoping that the new Marriott Hotel wi l l be able to absorb some of the potential laid-off public servants when it opens at full capacity in September-October 2003. With 900 rooms and an employee-per-room ratio o f 1.5, i t can be expected to require some 1,350 workers. This i s an increase of about 8 percent in total employment in an economy with an unemployment rate of 4.5 percent, according to the latest labor survey available, dated 1995. The government believes that th i s employment increase wi l l be enough to downsize public service employment by up to 10 percent, and to absorb some of the workers that wi l l lose their jobs when i t closes the sugar company (SSMC).
5.12 Moreover, the downsizing in public service employment required to close the fiscal gap i s more than the 10 percent of the current number of employees foreseen by the government. Downsizing the civil service to 1995 levels by cutting 800 established positions and 500 non-established positions (head count) would reduce the wage bill by EC$42 million, or 5 percent o f GDP. The downsize wi l l have to be across all l ine ministries, with National Security, Education, Health and Environment taking a larger cut because they represent about 70 percent of all government employment. Chapters 6 and 7 present a detailed discussion o f options for downsizing in the health and education sector, while maintaining the level and quality of service delivery. On National Security, the ratio of police personnel per 100,000 habitants i s 1,133 in St. Kitts and Nevis compared to 516 in Barbados and 605 in Dominica.57 Although, in St. Kitts and Nevis the figures include immigration officers, the numbers are twice those o f other small countries in the region and call into question the size and composition of the police force in the country. See Box 5.1 for options for and constraints on downsizing in the experience of Guyana.
Cot t zpet isnt ion
5.13 In real terms, the average compensation per established worker decreased during 1995-2002. As Table 5.3 shows, personal emoluments from 1995 to 2002 increased in nominal terms by a total o f 62 percent, or an average o f 7 percent per year; however, in the same period the number o f established positions increased by 38.3 percent, or an average 4.7 percent, and consumer prices increased by 26.2 percent, or an average o f 3.4 percent. Thus for 1995-2002, the real compensation per established worker decreased by a total o f 7 percent.
57 The data for Barbados and Dominica are for 2000, and i ts source i s the Seventh United Survey of Crime Trend and Operations of Criminal Justice Systems, United Nations. The data for St. Kitts and Nevis are from the Budget Estimates, 2000.
57
I Box 5.1 Civil Service Downsizing in Guyana I In Guyana, the Government has implemented a number o f actions over the last few years to ensure a
substantial downsizing o f the civil service and the public sector. The following downsizing methods were implemented with various degrees of success:
Termination: As part of the highly-indebted poor country (HIPC) and Poverty Reduction Growth Facility (PRGF) requirements, the government agreed to separate 1,000 core civil service security guards and 1,000 temporary and unqualified workers. The separation issue was put on the agenda because of extremely high wage increases of 3 1 and 27 percent, respectively, in 1999 and 2000, awarded by an arbitration tribunal. It was felt that by reducing the size o f the core civil service, the budgetary repercussions of possible future wage increases would be reduced. B y November 1, 2000 the Government had separated about 1,359 security guards, representing over 1 1 percent o f the “core” civil service (including medical workers but excluding teachers, police, and the armed forces). The cost of paying severance and related expenditures totaled G$465 million, or about 0.33 percent of current GDP. About 82 percent o f the package consisted of severance benefits, and, nearly 12 percent o f the package went to superannuation benefits for pensionable and non-pensionable staff. There has not been any termination o f employees categorized as “temporary and unqualified” so far. Since the Government s t i l l needs security services, it decided to outsource them. In order to ease the transition problems of the severed security guards, the severed security guards formed the company chosen to outsource these services, for the period November 1, 2000 to December 3 1, 2002. While the outsourcing o f security services does not offer any immediate financial benefit to the Government, it could in principle be a right step in a broader approach to civil service reform. The Government has been thinking along similar lines, that is, separation and outsourcing, for some o f its other work staff, such as cleaners and clerical services. Again, in principle, we would encourage such thinking, but the benefits wouid only be realized if the outsourcing processes were truly competitive and performance continuously monitored.
Hiring Freeze: Since October 1998, the Government has implemented a temporary employment freeze in the core civil service. The freeze affects promotions, new recruitment, reclassification, and so forth. Any exceptions to this freeze have to be directly approved by the Head of the Presidential Secretariat.
Decline in Civi l Service Employment: Since 1993, the total number of employees in civilian government (including regional administration, police, statutory bodies, and ministries) has dropped from approximately 56,000 to about 3 1,000, currently. In addition, employment in the public sector corporations has dropped significantly, including a decline on the rolls of the largest domestic employer, Guysuco (Guyana Sugar Company), from 27,000 in 1992 to less than 18,000, currently.
Corporatization: Another significant step in public service reform has been the recent corporatization of the Georgetown Public Hospital-the largest in the country and accounting for about 60 percent o f health sector staff. Since 1999, this hospital has been converted into a semiautonomous entity that receives Government budgetary support but i s managed by its own Board. I t has the power to hire and fire employees and to set wages. Since the hospital was taken over by an independent Board, the number o f employees on its payroll has gone down from 2,000 to 980 (the 2,000 included as many as 900 “ghost” employees who were drawing wages from the hospital but were either working elsewhere, or were working for political parties). The hospital has hired about 100 new employees to fill critical positions and was successful at attracting these new hires with better salaries and conditions of service, since it is no longer bound by civil service rules. Not surprisingly, i t s current productivity indicators show a marked improvement over those of previous years. O f course, it i s important that this institution starts generating a higher proportion o f i t s revenue than it currently does through fees and charges so that the burden o f higher salaries i s not eventually borne by government budget. The Guyana Revenue Authority and other agencies have followed the example of the Georgetown Public Hospital and have recorded positive results.
5.14 The pattern of increases in average compensation for established positions is more clearly revealed in the profile of salary scale K7, which i s at the low end of the salary scale and applies to drivers, messengers, and others comparable positions. The category K7 in the
58
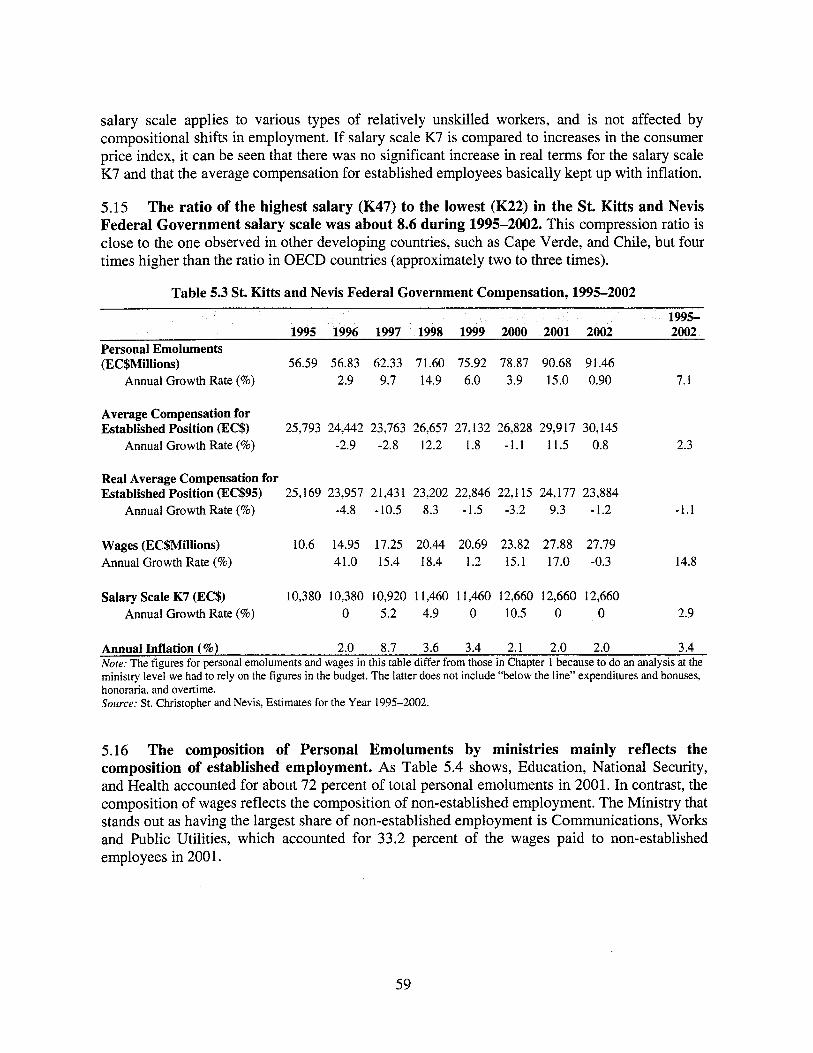
salary scale applies to various types of relatively unskilled workers, and i s not affected by compositional shifts in employment. I f salary scale K7 i s compared to increases in the consumer price index, i t can be seen that there was no significant increase in real terms for the salary scale K7 and that the average compensation for established employees basically kept up with inflation.
5.15 The ratio of the highest salary (K47) to the lowest (K22) in the St. Kitts and Nevis Federal Government salary scale was about 8.6 during 1995-2002. This compression ratio i s close to the one observed in other developing countries, such as Cape Verde, and Chile, but four times higher than the ratio in OECD countries (approximately two to three times).
Table 5.3 St. Kitts and Nevis Federal Government Compensation, 1995-2002 1995-
1995 1996 1997 1998 1999 2000 2001 2002 2002 Personal Emoluments (EC$Millions) 56.59 56.83 62.33 71.60 75.92 78.87 90.68 91.46
Annual Growth Rate (%) 2.9 9.7 14.9 6.0 3.9 15.0 0.90 7.1
Average Compensation for Established Position (EC$) 25,793 24,442 23,763 26,657 27,132 26,828 29,917 30,145
Annual Growth Rate (%) -2.9 -2.8 12.2 1.8 -1.1 11.5 0.8 2.3
Real Average Compensation for Established Position (EC$95) 25,169 23,957 21,43 1 23,202 22,846 22,115 24,177 23,884
Annual Growth Rate (%) -4.8 -10.5 8.3 -1.5 -3.2 9.3 -1.2
Wages (EC$Millions) 10.6 14.95 17.25 20.44 20.69 23.82 27.88 27.79 Annual Growth Rate (%) 41.0 15.4 18.4 1.2 15.1 17.0 -0.3
1.1
4.8
Salary Scale K7 (EC$) 10,380 10,380 10,920 11,460 11,460 12,660 12,660 12,660 Annual Growth Rate (%) 0 5.2 4.9 0 10.5 0 0 2.9
Annual Inflation (%) 2.0 8.7 3.6 3.4 2.1 2.0 2.0 3.4 Nore: The figures for personal emoluments and wages in this table differ from those in Chapter 1 because to do an analysis at the ministry level we had to rely on the figures in the budget. The latter does not include “below the line” expenditures and bonuses, honoraria, and overtime. Source: St. Christopher and Nevis, Estimates for the Year 1995-2002.
5.16 The composition of Personal Emoluments by ministries mainly reflects the composition of established employment. As Table 5.4 shows, Education, National Security, and Health accounted for about 72 percent o f total personal emoluments in 2001. In contrast, the composition of wages reflects the composition o f non-established employment. The Ministry that stands out as having the largest share o f non-established employment i s Communications, Works and Public Utilities, which accounted for 33.2 percent o f the wages paid to non-established employees in 200 1.
59
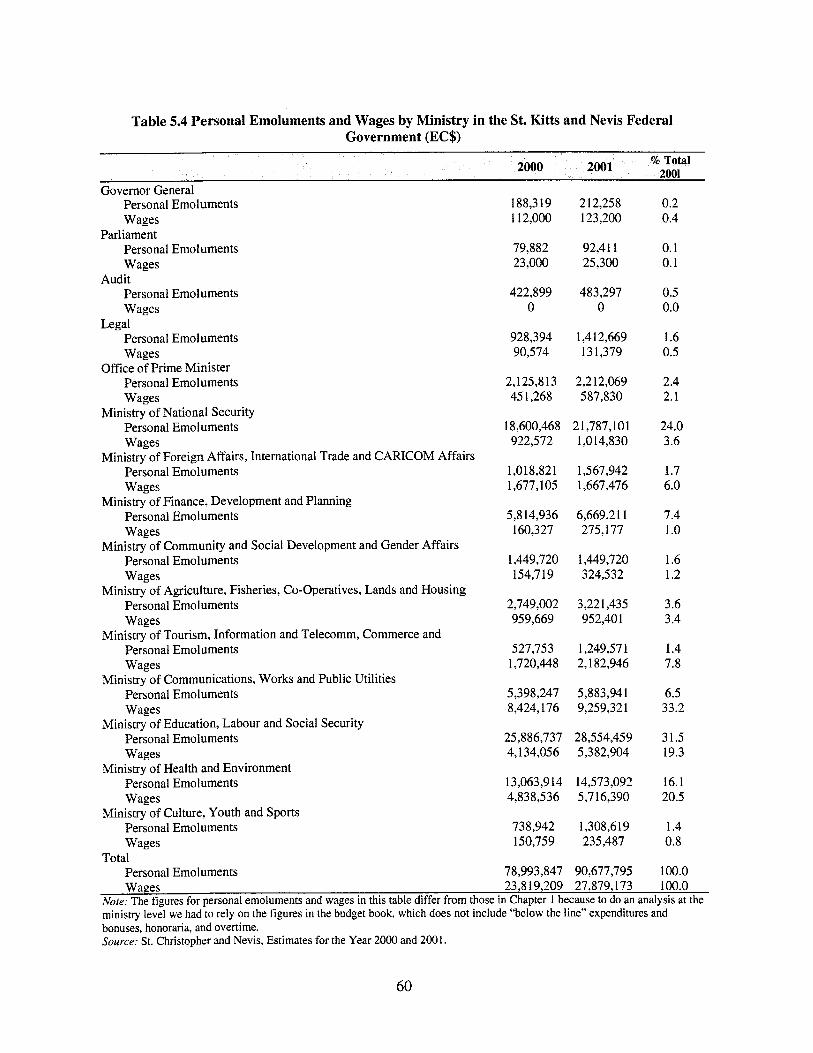
Table 5.4 Personal Emoluments and Wages by Ministry in the St. Kim and Nevis Federal Government (EC$)
% Total 2001 2000 2001
Governor General Personal Emoluments Wages
Parliament Personal Emoluments Wages
Personal Emoluments Wages
Personal Emoluments Wages
Personal Emoluments Wages
Ministry of National Security Personal Emoluments Wages
Personal Emoluments Wages
Personal Emoluments Wages
Personal Emoluments Wages
Personal Emoluments Wages
Personal Emoluments Wages
Personal Emoluments Wages
Personal Emoluments Wages
Personal Emoluments Wages
Personal Emoluments Wages
Personal Emoluments
Audit
Legal
Office of Prime Minister
Ministry of Foreign Affairs, International Trade and CARICOM Affairs
Ministry of Finance, Development and Planning
Ministry of Community and Social Development and Gender Affairs
Ministry of Agriculture, Fisheries, Co-Operatives, Lands and Housing
Ministry of Tourism, Information and Telecomm, Commerce and
Ministry of Communications, Works and Public Util i t ies
Ministry of Education, Labour and Social Security
Ministry of Health and Environment
Ministry of Culture, Youth and Sports
Total
188,319 1 12,000
79,882 23,000
422,899 0
928,394 90,574
2,125,8 13 45 1,268
18,600,468 922,572
1,018,82 1 1,677, I05
5,814,936 160,327
1,449,720 154,7 19
2,749,002 959,669
527,753 1,720,448
5,398,247 8,424,176
25,886,737 4,134,056
1 3,063,9 14 4,838,536
738,942 150,759
78,993,847
212,258 123,200
92,411 25,300
483,297 0
1,4 12,669 13 1,379
2,212,069 587,830
2 1,787,101 1,014,830
1,567,942 1,667,476
6,669,2 1 1 275,177
1,449,720 324,532
3,221,435 952,401
1,249,57 1 2,182,946
5,883,941 9,259,321
28,554,459 5,382,904
14,573,092 5,716,390
1,308,6 19 235,487
90,677,795
0.2 0.4
0.1 0.1
0.5 0.0
1.6 0.5
2.4 2.1
24.0 3.6
1.7 6.0
7.4 1 .o
1.6 1.2
3.6 3.4
1.4 7.8
6.5 33.2
31.5 19.3
16.1 20.5
1.4 0.8
100.0 Wages 23,819,209 27,879,173 100.0
Note; The figures for personal emoluments and wages in this table differ from those in Chapter 1 because to do an analysis at the ministry level we had to rely on the figures in the budget book, which does not include “below the line” expenditures and bonuses, honoraria, and overtime. Source; St. Christopher and Nevis, Estimates for the Year 2000 and 2001.
60
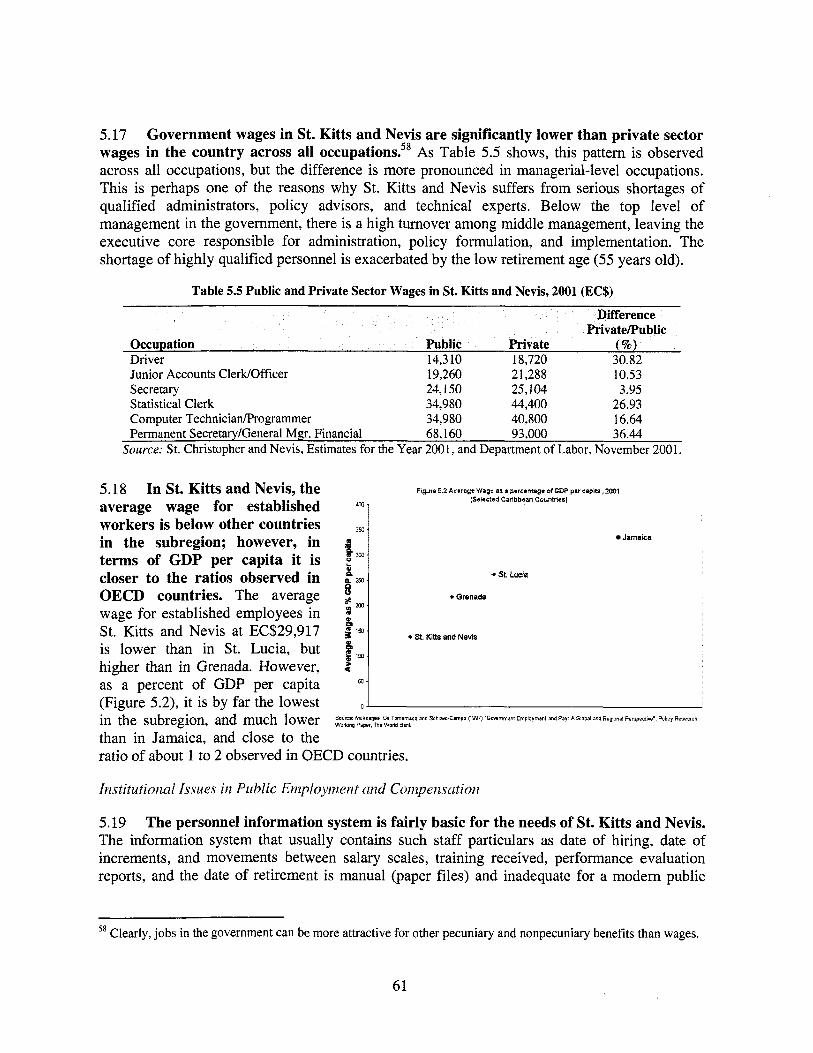
5.17 Government wages in St. Kitts and Nevis are significantly lower than private sector wages in the country across all occupations?' As Table 5.5 shows, this pattern is observed across all occupations, but the difference i s more pronounced in managerial-level occupations. This i s perhaps one of the reasons why St. Kitts and Nevis suffers from serious shortages o f qualified administrators, policy advisors, and technical experts. Below the top level o f management in the government, there i s a high turnover among middle management, leaving the executive core responsible for administration, policy formulation, and implementation. The shortage o f highly qualified personnel i s exacerbated by the low retirement age (55 years old).
Table 5.5 Public and Private Sector Wages in St. Kitts and Nevis, 2001 (EC$)
Occupation Public Private (%I Driver 14,3 10 18,720 30.82 Junior Accounts Clerk/Officer 19,260 2 1,288 10.53 Secretary 24,150 25,104 3.95 Statistical Clerk 34,980 44,400 26.93 Computer TechnicianProgrammer 34,980 40,800 16.64 Permanent SecretaryIGeneral Mgr. Financial 68,160 93,000 36.44
Source: St. Christopher and Nevis, Estimates for the Year 2001, and Department o f Labor, November 2001.
5.18 In St. Kitts and Nevis, the average wage for established workers is below other countries in the subregion; however, in B
; m terms of GDP per capita it i s ~
closer to the ratios observed in tZB OECD countries. The average $ m
wage for established employees in 2 &
St. Kitts and Nevis at EC$29,917 g 150
i s lower than in St. Lucia, but f l m
higher than in Grenada. However, C as a percent o f GDP per capita
350
50
Figure 6 2 Average Wage as a percentage ot GDP per capita, 2001 (Saloctsd Canbbaan Countnest
Jamaica
+ St. Luck
*Grenada
* St. KBs and Nevis
(Figure 5.2), it i s by far the lowest
than in Jamaica, and close to the ratio o f about 1 to 2 observed in OECD countries.
0
in the subregion, and much lower ~~~~~~~~~~~~~~~ and Schiao Campo (1-n 'Gaemment Ernploymen1 and Pay A Global and Rsgmal Perspectd Policy Rerearch
5.19 The personnel information system i s fairly basic for the needs of St. Kitts and Nevis. The information system that usually contains such staff particulars as date of hiring, date o f increments, and movements between salary scales, training received, performance evaluation reports, and the date of retirement i s manual (paper files) and inadequate for a modern public
58 Clearly, jobs in the government can be more attractive for other pecuniary and nonpecuniary benefits than wages.
61
sector. I t does not contain the information required for manpower planning, professional development, and the design and implementation o f a civil service reform.
5.20 Moreover, the St. Kitts and Nevis government lacks a human resources strategy. Job descriptions do not exist even for established positions. No performance appraisal system i s in place, which makes i t impossible to assess whether public servants are actually doing their job efficiently and effectively and to establish performance pay or bonuses to reward good ~e r fo rmance .~~ No analysis o f training needs has been carried out. Training in essential ski l ls such as writing, office procedures, financial and personnel management, and basic management i s deficient. There i s no training plan for individual employees to enable them to advance along their career paths. Training i s often offered in an unsystematic way, and dependant on the availability o f donor financing.
5.21 In St. Kitts and Nevis there is fragmentation and duplication of work among ministries, departments, and agencies, leading to a diffusion of responsibilities. The survey o f public officials, carried out for the OECS Institutional and Organizational Capacity Review (IOCR) in 2001, noted a duplication o f functions and that such overlap adversely affected the public service. This suggests that missions, objectives, and functions o f the different ministries need to be reviewed to determine the most effective and efficient organizational structure. More broadly, there i s concern about the degree o f overlap of functions across the various island governments in the subregion. Opportunities to pool resources and realize lower unit costs through greater collaboration extend to almost all areas o f public sector activity, including international relations, economic and social policy, and policing. The benefits o f common organizational arrangements for tax administration, customs, audit services, police services, magistracy, and environmental protection were discussed in the OECS IOCR.
5.22 There i s considerable scope for the government to divest some of its functions to the private sector to improve quality and efficiency and increase coverage So far, only telecommunications has been privatized and garbage collection contracted out. The electrical utility, water and sewerage, port handling, the cruise ship terminal, and the government printing office could al l be considered potential candidates for privatization. Some services where it i s easy to specify output can be more efficiently performed by the private sector. These include road maintenance, airport services, laundry and catering services in hospitals, and cleaning and maintenance services in public buildings. The Post Office could be corporatized to improve efficiency. Finally, some public sector activities in the areas o f social services, and education, could be transferred to civil society as i s being done to a limited extent in St. Lucia.
5.23 A Public Sector Reform Unit was recently established with the mandate to lead the process of public sector reform, which i s directed at modernizing the public service. This w i l l include taking an inventory o f the human resources capacity o f each ministry, identifying the relevant training to address any deficiencies discovered, and taking a critical look at the procedures and systems in use in the public service to make sure they have not become
59 Based on the experience in Grenada, even with a good performance appraisal system it may be difficult to get managers to document any deficiencies o f their staff given the close nature o f personal relationships on the island. Nevertheless, the St. Kitts and Nevis government should implement a system o f j ob descriptions and performance appraisals to facilitate management of the public service.
62
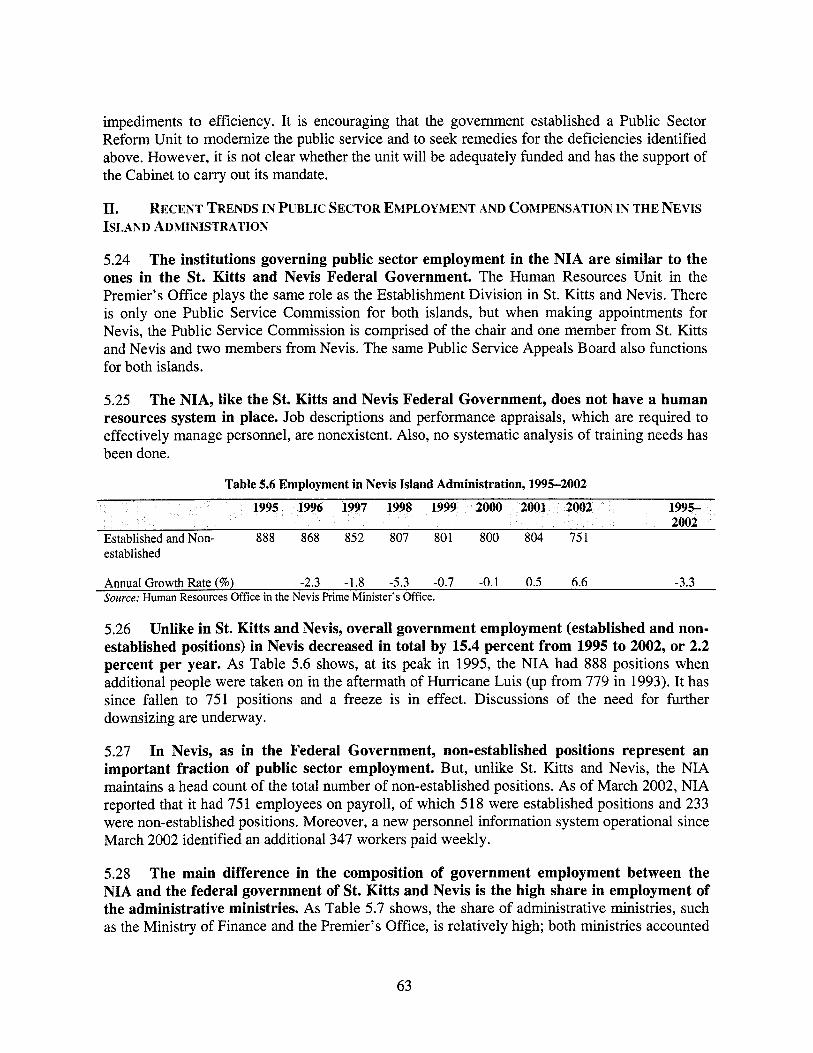
impediments to efficiency. I t i s encouraging that the government established a Public Sector Reform Unit to modernize the public service and to seek remedies for the deficiencies identified above. However, i t i s not clear whether the unit wi l l be adequately funded and has the support o f the Cabinet to carry out i t s mandate.
11. ISLAND ADMINISTRATION
RECENT TRENDS I& PCBLIC SECTOR EMPLOYMENT AND COMPENSATION IN THE NEVIS
5.24 The inst i tut ions governing publ ic sector employment in the NIA are s imi lar to the ones in the St. K i t t s and Nevis Federal Government. The Human Resources Unit in the Premier’s Office plays the same role as the Establishment Division in St. Kitts and Nevis. There i s only one Public Service Commission for both islands, but when making appointments for Nevis, the Public Service Commission i s comprised o f the chair and one member from St. Kitts and Nevis and two members from Nevis. The same Public Service Appeals Board also functions for both islands.
5.25 The NIA, l i ke the St. K i t t s and Nevis Federal Government, does not have a human resources system in place. Job descriptions and performance appraisals, which are required to effectively manage personnel, are nonexistent. Also, no systematic analysis o f training needs has been done.
Table 5.6 Employment in Nevis Island Administration, 1995-2002
1 1995- 2002
Established and Non- 888 868 852 807 801 800 804 751 established
Annual Growth Rate (%) -2.3 -1.8 -5.3 -0.7 -0.1 0.5 6.6 -3.3 Source: Human Resources Office in the Nevis Prime Minister’s Office.
5.26 Un l i ke in St. K i t t s and Nevis, overal l government employment (established and non- established positions) in Nevis decreased in total by 15.4 percent from 1995 to 2002, or 2.2 percent p e r year. As Table 5.6 shows, at i ts peak in 1995, the NIA had 888 positions when additional people were taken on in the aftermath o f Hurricane Luis (up from 779 in 1993). I t has since fallen to 751 positions and a freeze i s in effect. Discussions o f the need for further downsizing are underway.
5.27 In Nevis, as in the Federal Government, non-established positions represent an important fraction of publ ic sector employment. But, unlike St. Kitts and Nevis, the NIA maintains a head count o f the total number o f non-established positions. As o f March 2002, NIA reported that i t had 751 employees on payroll, o f which 518 were established positions and 233 were non-established positions. Moreover, a new personnel information system operational since March 2002 identified an additional 347 workers paid weekly.
5.28 The main difference in the composit ion of government employment between the NIA and the federal government of St. K i t t s and Nevis i s the high share in employment of the administrat ive ministries. As Table 5.7 shows, the share o f administrative ministries, such as the Ministry of Finance and the Premier’s Office, i s relatively high; both ministries accounted
63
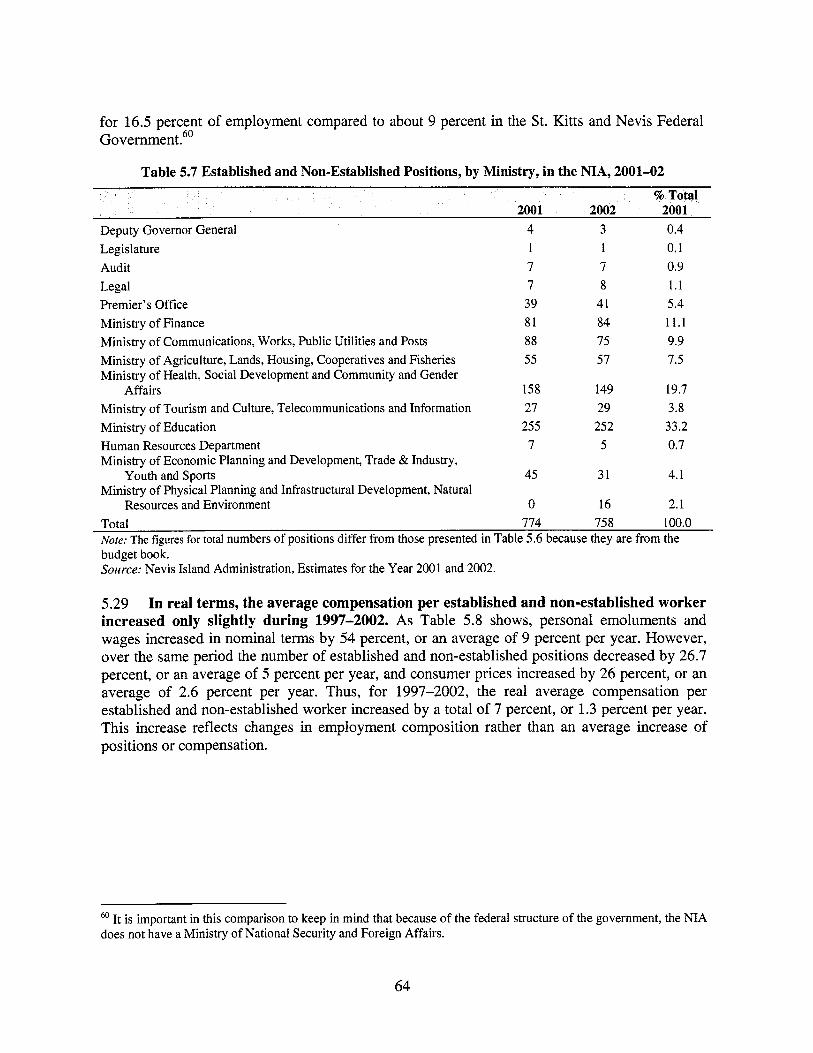
for 16.5 percent o f employment compared to about 9 percent in the St. Kitts and Nevis Federal Government .60
Table 5.7 Established and Non-Established Positions, by Ministry, in the NIA, 2001-02
% Total 2001 2001
Deputy Governor General 4 3 0.4 Legislature 1 1 0.1 Audit 7 7 0.9 Legal 7 8 1.1 Premier’s Office 39 41 5.4 Ministry of Finance 81 84 11.1 Ministry of Communications, Works, Public Util i t ies and Posts 88 75 9.9 Ministry of Agriculture, Lands, Housing, Cooperatives and Fisheries 55 57 7.5 Ministry of Health, Social Development and Community and Gender
Affairs 158 149 19.7 Ministry of Tourism and Culture, Telecommunications and Information 27 29 3.8 Ministry of Education 255 252 33.2 Human Resources Department 7 5 0.7 Ministry of Economic Planning and Development, Trade & Industry,
Youth and Sports 45 31 4.1 Ministry of Physical Planning and Infrastructural Development, Natural
Resources and Environment 0 16 2.1 Total 774 75 8 100.0 Note: The figures for total numbers of positions differ from those presented in Table 5.6 because they are from the budget book. Source: Nevis Island Administration, Estimates for the Year 2001 and 2002.
5.29 I n real terms, the average compensation per established and non-established worker increased only slightly during 1997-2002. As Table 5.8 shows, personal emoluments and wages increased in nominal terms by 54 percent, or an average of 9 percent per year. However, over the same period the number o f established and non-established positions decreased by 26.7 percent, or an average of 5 percent per year, and consumer prices increased by 26 percent, or an average of 2.6 percent per year. Thus, for 1997-2002, the real average compensation per established and non-established worker increased by a total o f 7 percent, or 1.3 percent per year. This increase reflects changes in employment composition rather than an average increase o f positions or compensation.
I t i s important in this comparison to keep in mind that because of the federal structure of the government, the NIA does not have a Ministry of National Security and Foreign Affairs.
64
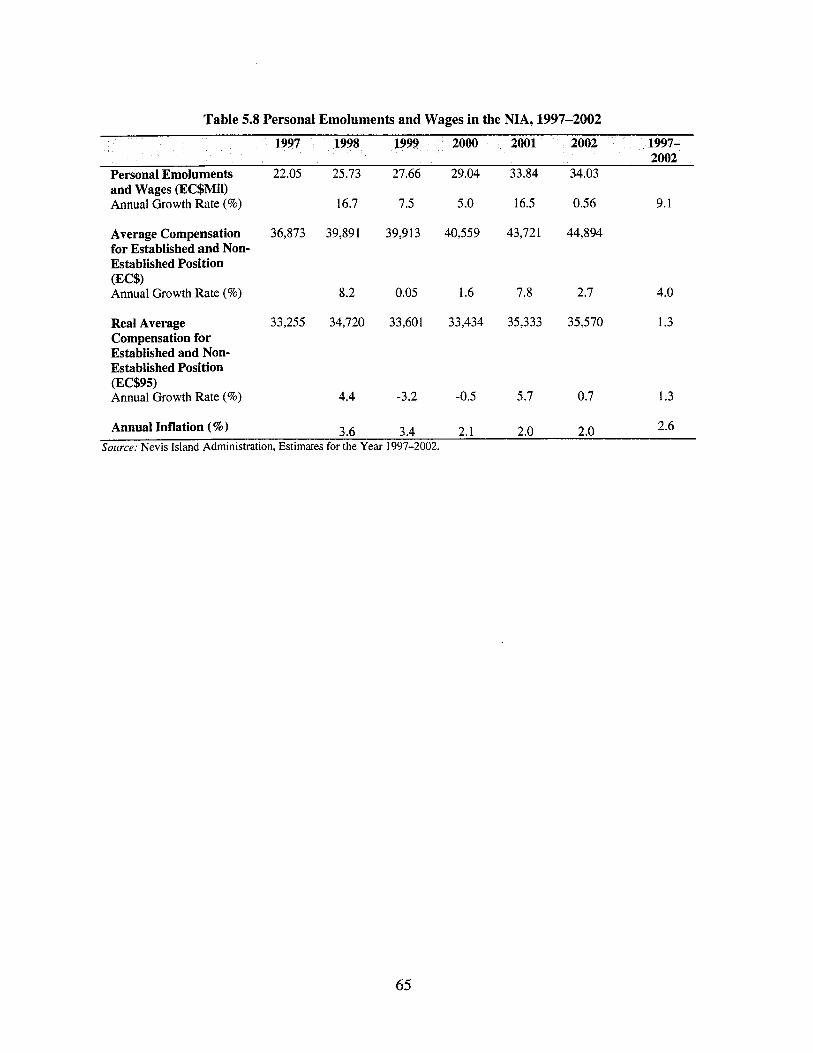
Table 5.8 Personal Emoluments and Wages in the NIA, 1997-2002
19 1998 19 2002 1997- 2002
Personal Emoluments and Wages (EC$MiI) Annual Growth Rate (%)
Average Compensation for Established and Non- Established Position
Annual Growth Rate (%) (EC$)
Real Average Compensation for Established and Non- Established Position (EC$95) Annual Growth Rate (96)
22.05
36,873
33,255
25.73
16.7
39,89 I
8.2
34,720
4.4
27.66
7.5
39,913
0.05
33,601
-3.2
29.04 33.84 34.03
5.0 16.5 0.56 9.1
40,559 43,721 44,894
1.6 7.8 2.7 4.0
33,434 35,333 35,570 1.3
-0.5 5.7 0.7 1.3
Annual Inflation (%) 2.6 3.6 3.4 2.1 2.0 2.0 Source: Nevis Island Administration, Estimates for the Year 1997-2002.
65

6. THE HEALTH SECTOR
6.1 The Federation of St. Kitts and Nevis has a health system with a strong primary health care focus. I t i s dominated by publicly financed and publicly provided health care. There are no private clinics or hospitals, but there are physicians in private practice. Public spending on health during 1995-2002 was about 3.3 o f GDP, on average. Public health spending in real terms grew for the same period at about 4.4 percent per year. This growth i s unlikely to be maintained over the short to medium term given the tight fiscal constraints.
6.2 Public facilities appear to provide reasonably good coverage, with a good level o f consumer satisfaction. Nevertheless, the health system faces many challenges in the future. Most immediately, the public system i s facing strong budgetary pressures as part o f the overall fiscal crisis. The health system also faces the challenge o f adapting to a changing disease profile, a steady emigration of nurses, and the type o f specialized services that i t can provide, and provide most efficiently, given the country’s small population size and federation structure. T h i s chapter reviews health outcomes in St. Kitts and Nevis, how services are financed, organized, and delivered, and suggests both short- and medium-term measures to improve health outcomes, equity in the system, and efficiency.
6.3 The main findings and recommendations can be summarized as follows:
e Improving and Sustaining Health Outcomes
o Public health and primary health care programs need to find ways to sustain the improvements in infant mortality that were reached in 2001, through promoting healthier lifestyles, better care during pregnancy, and quality care in the neonatal period.
In addition, because o f changes in disease patterns and age structures o f the population, St. Kitts and Nevis needs to strengthen public health and primary care in noncommunicable diseases and injuries, in order to continue to improve health indicators and contain costs over time. This means focusing health promotion and disease control activities as effectively as possible on tobacco control, injury prevention, control o f obesity through diet and physical activity, and screening and early treatment o f diabetes and hypertension. The government i s making strong efforts to strengthen HIV/AIDS prevention through behavior change, communication efforts (especially with high-risk groups), condom distribution, screening, treatment o f sexually transmitted diseases, and voluntary counseling and testing. High-level leadership and support needs to continue and to be strengthened. To help in these areas, the government i s implementing a World Bank- financed project o f US$4.04 mill ion to strengthen i ts national program. Given the importance o f acting now to reverse the HIV/AIDS epidemic, the government needs to ensure adequate implementation and counterpart funding for these efforts.
Improving EfJiciency in the Delivery of Services
o
e
o As the disease patterns change over time, and with the goal o f achieving greater economies o f scale, i t may be possible to rethink the configuration o f health facilities in
67
the federation by, for example, reorganizing and consolidating some o f the primary health center services.
The government achieves economies o f scale in drug procurement by using the Eastern Caribbean Drug Procurement Service, which gets good prices from competitive tendering processes. There may be scope to achieve greater economies of scale by coordinating other services such as specialized laboratory tests and medical supplies.
The parallel health delivery systems in St. Kitts and Nevis are cause for concern because o f duplication in efforts that waste scarce resources. The government could look for ways to rationalize human resource use and health service facilities by better coordination and referral across St. Kitts and Nevis.
o
o There are user fees on publicly provided services, with broad exemptions (for example, children and the elderly). Collection rates are low. Given the tight fiscal constraints, there may be some scope for increasing revenue through better collection, especially if facilities are permitted to retain the fees to cover some o f their costs. The user fee policy needs periodic review to ensure both the desired equity and efficiency impact.
e Uses of Health Spending
o Wages absorb most o f the spending in the health sector and raise questions as to whether there i s sufficient allocation for pharmaceuticals, medical supplies, and maintenance of equipment and buildings for the efficient delivery of services. There may be significant opportunities to generate cost savings without affecting the quality o f services by substituting some nursing positions with lower-cost nursing (nurse assistants).
Hospitals are absorbing an increasing share of public spending over time. This i s a concern and i s likely to continue unless (a) changes are introduced to improve hospital efficiency and contain costs, and (b) noncommunicable disease prevention and early diagnosis and treatment programs are strengthened to keep people healthy and out o f hospitals. I t may be possible to reduce average length o f stay at the Joseph N. France General Hospital by managing more pre- and postoperative tests on an outpatient basis, improving scheduling of the operating room, and other practices. There should be considerable scope to increasingly substitute inpatient surgery for outpatient surgery. Some o f these efficiency changes may require capital investments.
Donors are the main source o f capital spending in health. As i s true in many other countries, the government needs to ensure that donor-funded projects are in line with government priorities and are sustainable over the long run.
o
o
I. HEALTH OUTCOMES IN ST. KITTS AND NEVIS
6.4 St. Kitts and Nevis has good health indicators, although infant mortality-until recently-was higher than it should be for a country at its level of GDP per capita, and life expectancy appears to be lower than expected. Given i t s stage in the epidemiological transition, noncommunicable diseases and injuries are an increasing share o f the burden o f disease and a leading cause of mortality. Public health programs and primary care need to be reshaped to prevent injuries and chronic diseases and to provide early diagnosis and treatment. If
68

this i s not done, treatment of these ailments w i l l overburden the health system with high costs from, for example, complications of diabetes and hypertension. In addition, HIV/AIDS needs to be addressed as vigorously as possible.
Table 6.1 Health Indicators in St. K i t h and Nevis Compared with Barbados, Jamaica, and other OECS Countries, 2000
Total GDP Per Infant Mortality T Population Capita Estimate 2001 00OLive Birth
2001 (current $) 2000
St. Kitts and Nevis 41,082 8,345 19* 2.2 71 Antigua and Barbuda 68,487 9,729 15 1.7 75 Barbados 268,189 NA 17 1.8 75 Dominica 73,199 3,563 NA N A 76
Grenada 99,000 4,022 13 3.2 72 Jamaica 2,668,230 2,9 17 20 2.5 75 St. Lucia 158,134 4,356 13 2.0 71 St. Vincent and the Grenadines 115,881 2,9 14 20 2.1 73 * For St. Kitts and Nevis, the comparable IMR number in 2001 is much lower-12.5 per 1,OOO-due to a sharp decline in neonatal mortality that year. Source: World Development Indicators.
6.5 Infant and Child Health. Given i ts level of income, St. Kitts and Nevis has had relatively high infant mortality rates ( IMRs) , at 19 per 1,000 births in 2000. As shown in Table 6.1, this level o f IMR has been on par with Jamaica and St. Vincent and the Grenadines- countries with less than half the per capita income o f St. Kitts and Nevis. T h i s i s a problem that the government has recognized and has been trying to address, with some success. In 2001, the rate fe l l to 12.5, the lowest recorded, due to a sharp decline in neonatal mortality in that year (Table 6.2.) I t remains to be seen whether this improvement in neonatal health was a one-year change or whether it wi l l be sustained. A problem, linked to the IMR, i s the percentage o f births that are low birth weight, at 2,500 grams or less. This i s also relatively high, at 12.6 percent in 1998. Low birth weight i s a concern both for infant health and for long-term health. Evidence i s growing that low birth weight i s also a risk factor for health problems later in life, including obesity and hypertension in adults.
6.6 Total fertility rate is low, at 2.2, but a significant share of births is to teenagers. In 1995, about 17 percent o f all births were to teenagers. Teen births are a problem for many reasons. Teenage pregnancy i s often associated with school dropout. Teens are rarely ready psychosocially and financially to start families, and teen pregnancy i s a risk factor for infant mortality.
69
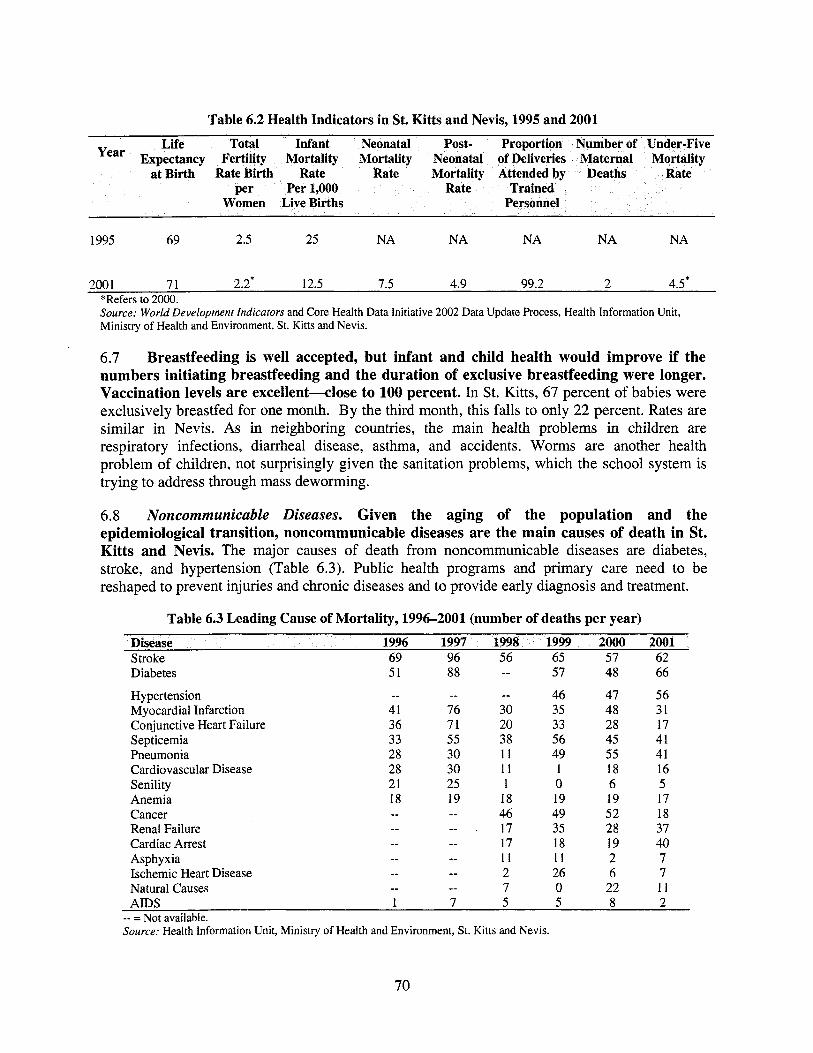
Table 6.2 Health Indicators in St. K i t t s and Nevis, 1995 and 2001
Life Total Infant Neonatal Post- Proportion Year Expectancy Fertility Mortality Mortality Neonatal
at Birth Rate Birth Rate Rate Mortality per Per 1,000 Rate
Women Live Births
1995 69 2.5 25 NA NA NA NA N A
200 1 71 2.2% 12.5 7.5 4.9 99.2 2 4.5* "Refers to 2000. Source: World Development Indicators and Core Health Data Initiative 2002 Data Update Process, Health Information Unit, Ministry of Health and Environment, St. Kitts and Nevis.
6.7 Breastfeeding i s well accepted, but infant and child health would improve if the numbers initiating breastfeeding and the duration of exclusive breastfeeding were longer. Vaccination levels are excellent-close to 100 percent. In St. Kitts, 67 percent o f babies were exclusively breastfed for one month. By the third month, this falls to only 22 percent. Rates are similar in Nevis. As in neighboring countries, the main health problems in children are respiratory infections, diarrheal disease, asthma, and accidents. Worms are another health problem o f children, not surprisingly given the sanitation problems, which the school system i s trying to address through mass deworming.
6.8 Noncommunicable Diseuses. Given the aging of the population and the epidemiological transition, noncommunicable diseases are the main causes of death in St. Kitts and Nevis. The major causes of death from noncommunicable diseases are diabetes, stroke, and hypertension (Table 6.3). Public health programs and primary care need to be reshaped to prevent injuries and chronic diseases and to provide early diagnosis and treatment.
Table 6.3 Leading Cause of Mortality, 1996-2001 (number of deaths per year)
Disease 1996 1997 1998 1999 2000 2001 Stroke 69 96 56 65 57 62 Diabetes 51 88 _ _ 57 48 66
Hypertension Myocardial Infarction Conjunctive Heart Failure Septicemia Pneumonia Cardiovascular Disease Senility Anemia Cancer Renal Failure Cardiac Arrest Asphyxia Ischemic Heart Disease Natural Causes
-- 41 36 33 28 28 21 18
_- 76 71 55 30 30 25 19
-- 30 20 38 11 I 1 1
18 46 17 17 11 2 7
46 35 33 56 49 1 0 19 49 35 18 11 26 0
47 56 48 31 28 17 45 41 55 41 18 16 6 5 19 17 52 18 28 37 19 40 2 7 6 7
22 11 AIDS 1 7 5 5 8 2
-- = Not available. Source: Health Information Unit, Ministry of Health and Environment, St. Kitts and Nevis.
70
6.9 St. Kitts and Nevis is a transit point for the illicit drug trade. Drug abuse is a problem on the islands, although good estimates are lacking on the magnitude of the problem. There i s a National Council on Drug Abuse that has received funding from the Canadian International Development Agency (CIDA) for drug abuse programs. Community psychiatric programs report that schizophrenia i s the top diagnosis for patients attending those programs, followed by substance abuse.
6.10 While there is underreporting and late reporting of new cases of HIV/AIDS, the epidemic is clearly a problem in St. Kitts and Nevis, as it i s for the Caribbean at large. From 1996 to 2000, 26 people died of AIDS-related causes. Of these deaths, 16 were male, and 10 were female, resulting in a male-female ratio o f 1 to 6. B y 2001, the Caribbean Epidemiology Center (CAREC) and the Centers for Disease Control (CDC) estimated there were 347 people living with HIVIAIDS, two o f them children. This i s an adult prevalence rate o f about 1.8 percent, which reflects an epidemic that i s s t i l l concentrated. Many factors in St. Kitts and Nevis are influencin the shape of the epidemic that the HIV/AIDS program needs to recognize and try to address. Some o f these factors are:
HIV/AIDS.
F, a
a
a
0
a
Sexual activity starts at a young age. There i s a pattern o f sex between young girls and older men in exchange for food and clothes. Homosexuals and people living with HIV/AIDS are stigmatized and discriminated against. The Rastafarian community does not accept condom use. The disease can be transmitted via migrant labor flows to and from other parts of the Caribbean and tourists.
The government has developed an HIV/AIDS project with US$4.04 mill ion in World Bank support (see Box 6.1).
6.11 The under-5 mortality and HIV/AIDS Millennium Development Goals (MDGs) are the most applicable to St. Kitts and Nevis of all the health-related MDGs. This i s because the other health-related MDGs: malnutrition (defined as the prevalence o f underweight children), maternal mortality, and tropical diseases (other than dengue, which i s endemic) are not major issues in the country. There i s one maternal death every few years in St. Kitts and Nevis; the country has relatively good reproductive health indicators and there are only about 700 births a year. The under-5 mortality rate in St. Kitts and Nevis dropped from an estimated 36 per 1,000 in 1990 to 24 per 1,000 in 2001. This i s a decline of about 3.7 percent per year. The MDG target-a reduction of two-thirds from 1990 to 2015-would require that the rate fall to about 12 per 1,000 by 2015. On trend projections, St. Kitts and Nevis w i l l not reach but wil l come close this MDG target, since the present trend would result in a rate of 14 per 1,000 by 2015. The rate o f decline i s however likely to slow from 2001 to 2015, because as child mortality rates get lower and lower, incremental declines get harder and harder to achieve. I t i s difficult to assess the likelihood o f reaching the HIV/AIDS targets, because baseline data on HIV prevalence and incidence are poor. Adult H I V prevalence i s probably somewhere between 1.5 and 2 percent.
6' Strategic Plan for the National Response to HIV/AIDS St. Kitts Nevis, 2001-2005.
71
The Government has launched a comprehensive HIV/AIDS prevention and control program with the suppott of the World Bank with the objective of reversing i t s spread.
Box 6.1 Strengthening the National HIV/AIDS Program over 2003 to 2007: The St. Kitts and Nevis HTC’IAIDS Prevention and Control Project
In 2002, St. Kim and Nevis met the eligibility criteria for country participation in the World Bank-financed Multi-Country HIVIAIDS Prevention and Control Adaptable Program Lending for the Caribbean, enabling the country to receive a US$4.04 million loan to strengthen its National HIV/AIDS Program
During 2003-07 the project wi l l help control the spread of HIV/AIDS through (a) scaling up prevention programs targeting high-risk groups and the general population; (b) strengthening treatment, care, and support for people living with HIVIAIDS; and (c) strengthening St. Kitts/Nevis’s multisectoral institutional capacity to better respond to the epidemic.
With respect to treatment, the project wil l support capacity strengthening and upgrading o f current services available for introducing antiretroviral therapy, care, and support for people living with AIDS. The total project cost i s US$4.5 million, o f which the government i s contributing $450,000, or about I O percent. The project i s expected to generate significant net benefits from the slowing and, ultimately, reversal, of the human, social, and economic costs that accompany the rise in HIVIAIDS cases.
While the project’s economic net benefits are expected to be significant, the government needs to realistically plan for the counterpart funding requirements during the project period, loan repayments, and the long- term incremental recurrent costs generated by the expanded program, especially in light of the current fiscal outlook. The postproject recurrent costs are estimated at US$236,000 per year. O f this, US$184,000 per year i s truly incremental, assuming that the current numbers of government staff dedicated to HIV/AIDS are not increased.
11. THE HEALTH SYSTEM: COVERAGE AND DELIVERY
6.12 The health system in St. Kitts and Nevis, as in the other OECS countries and the United Kingdom (U.K.), is predominantly publicly financed and publicly provided. All hospitals and clinics in St. Kitts and Nevis are public, although about 24 percent o f physicians are in full-time private practice (Table 6.4). Health systems can be dominated by public finance, either through general revenue (the U.K.) or social insurance (Germany), by private finance (China), or by a hybrid o f the two (the United States). Provision can be largely public, private, or a mix. There i s no ideal model of health system financing and delivery.
6.13 St. Kitts and Nevis’s small country size and federation structure pose many challenges to the administration of public health programs and clinical services, such as (a) unexploited potential economies of scale, (b) duplication across islands o f planning and monitoring activities, (c) health services mostly publicly provided, (d) health financing mostly through general revenue, and (e) a high ratio o f nurses to physicians.
72
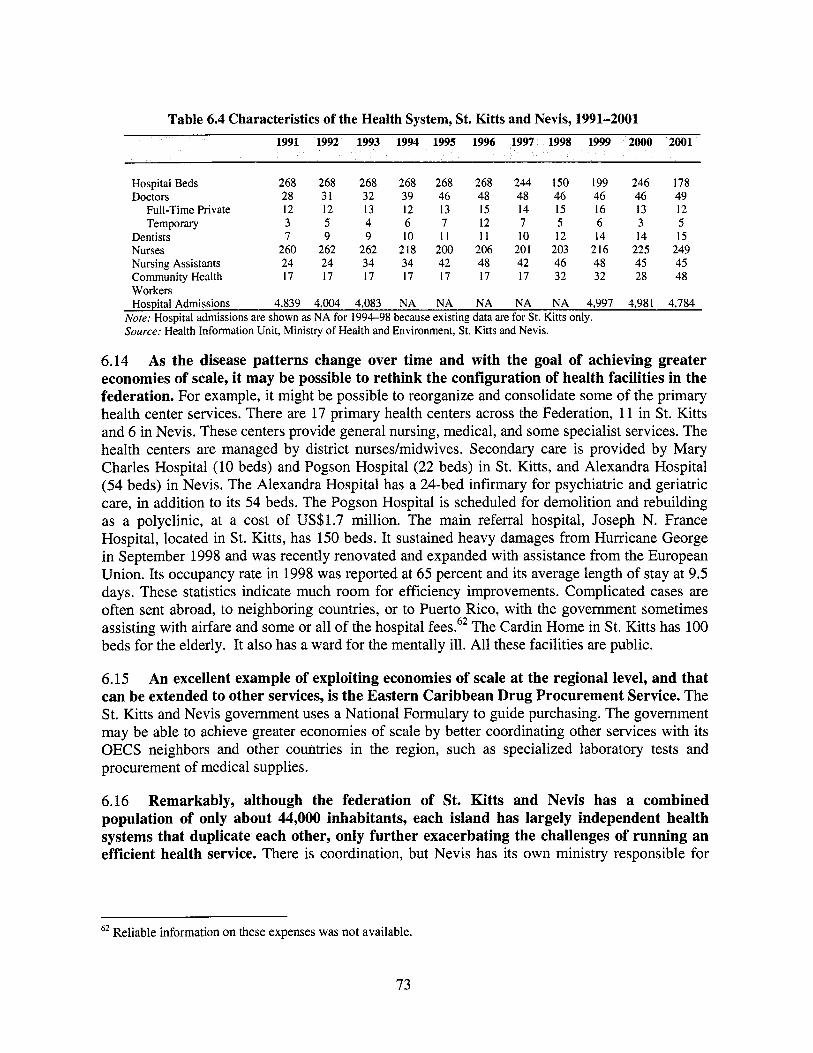
Table 6.4 Characteristics of the Health System, St. Kitts and Nevis, 1991-2001 1991 1992 1993 1994 1995 19% 7 1998 1999 2000 2
Hospital Beds 268 268 268 268 268 268 244 150 199 Doctors 28 31 32 39 46 48 48 46 46
Full-Time Private 12 12 13 12 13 15 14 15 16 Temporary 3 5 4 6 7 12 7 5 6
Dentists 7 9 9 10 11 11 10 12 14 Nurses 260 262 262 218 200 206 201 203 216 Nursing Assistants 24 24 34 34 42 48 42 46 48 Community Health 17 17 17 17 17 17 17 32 32 Workers Hospital Admissions 4,839 4.004 4,083 NA NA NA NA NA 4,997
Note: Hospital admissions are shown as NA for 1994-98 because existing data are for St. Kitts only. Source: Health Information Unit, Ministry of Health and Environment, St. Kitts and Nevis.
246 46 13 3 14
225 45 28
4,98 1
178 49 12 5 15
249 45 48
4,784
6.14 As the disease patterns change over time and with the goal of achieving greater economies of scale, it may be possible to rethink the configuration of health facilities in the federation. For example, i t might be possible to reorganize and consolidate some o f the primary health center services. There are 17 primary health centers across the Federation, 11 in St. Kitts and 6 in Nevis. These centers provide general nursing, medical, and some specialist services. The health centers are managed by district nurses/midwives. Secondary care i s provided by Mary Charles Hospital (10 beds) and Pogson Hospital (22 beds) in St. Kitts, and Alexandra Hospital (54 beds) in Nevis. The Alexandra Hospital has a 24-bed infirmary for psychiatric and geriatric care, in addition to i t s 54 beds. The Pogson Hospital i s scheduled for demolition and rebuilding as a polyclinic, at a cost o f US$1.7 million. The main referral hospital, Joseph N. France Hospital, located in St. Kitts, has 150 beds. I t sustained heavy damages from Hurricane George in September 1998 and was recently renovated and expanded with assistance from the European Union. I t s occupancy rate in 1998 was reported at 65 percent and i t s average length of stay at 9.5 days. These statistics indicate much room for efficiency improvements. Complicated cases are often sent abroad, to neighboring countries, or to Puerto Rico, with the government sometimes assisting with airfare and some or all o f the hospital fees.62 The Cardin Home in St. Kitts has 100 beds for the elderly. I t also has a ward for the mentally ill. All these facilities are public.
6.15 An excellent example of exploiting economies of scale at the regional level, and that can be extended to other services, is the Eastern Caribbean Drug Procurement Service. The St. K i t t s and Nevis government uses a National Formulary to guide purchasing. The government may be able to achieve greater economies o f scale by better coordinating other services with i ts OECS neighbors and other countries in the region, such as specialized laboratory tests and procurement o f medical supplies.
6.16 Remarkably, although the federation of St. Kitts and Nevis has a combined population of only about 44,000 inhabitants, each island has largely independent health systems that duplicate each other, only further exacerbating the challenges of running an efficient health service. There i s coordination, but Nevis has i t s own ministry responsible for
62 Reliable information on these expenses was not available.
73
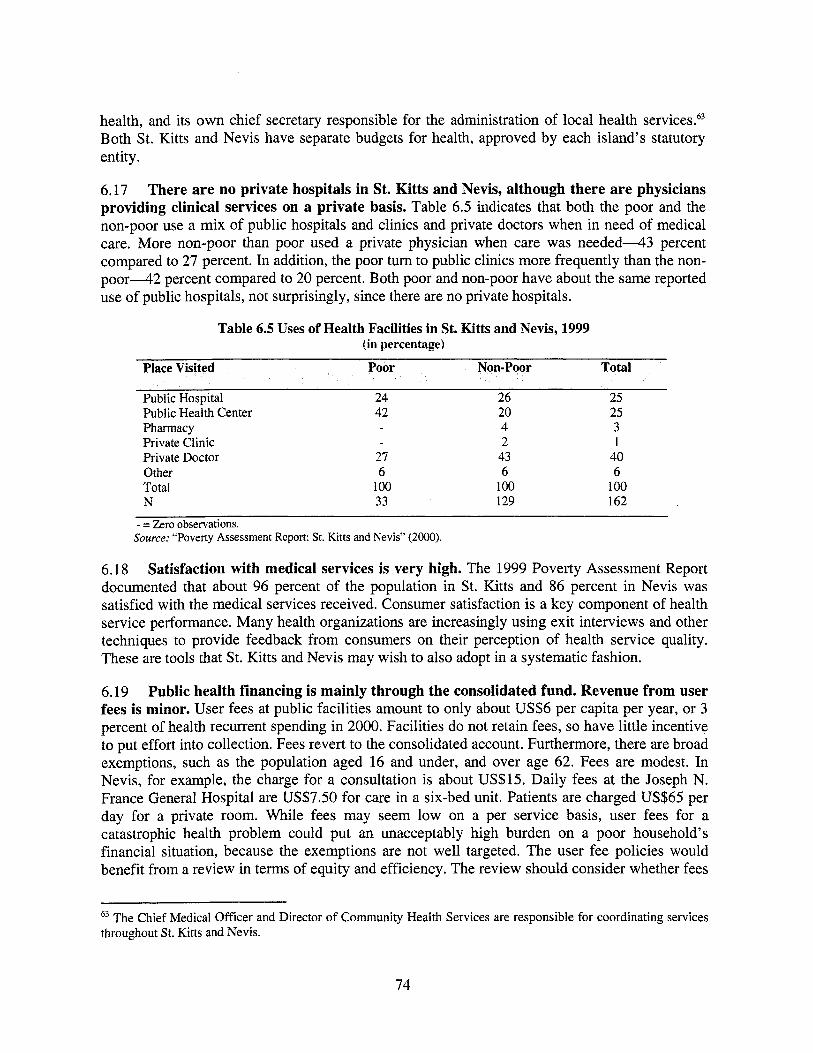
health, and i ts own chief secretary responsible for the administration of local health services.63 Both St. Kitts and Nevis have separate budgets for health, approved by each island’s statutory entity.
6.17 There are no private hospitals in St. Kitts and Nevis, although there are physicians providing clinical services on a private basis. Table 6.5 indicates that both the poor and the non-poor use a m ix o f public hospitals and clinics and private doctors when in need o f medical care. More non-poor than poor used a private physician when care was n e e d e d 4 3 percent compared to 27 percent. In addition, the poor turn to public clinics more frequently than the non- p o o r 4 2 percent compared to 20 percent. Both poor and non-poor have about the same reported use of public hospitals, not surprisingly, since there are no private hospitals.
Table 6.5 Uses of Health Facilities in St. Kitts and Nevis, 1999 (in percentage)
Place Visited Poor Non-Poor Total
Public Hospital 24 26 25 Public Health Center 42 20 25 Pharmacy 4 3 Private Clinic 2 1 Private Doctor 27 43 40 Other 6 6 6 Total 100 100 100 N 33 129 162
- = Zero observations. Source: “Poverty Assessment Report: St. Kitts and Nevis” (2000).
6.18 Satisfaction with medical services i s very high. The 1999 Poverty Assessment Report documented that about 96 percent o f the population in St. Kitts and 86 percent in Nevis was satisfied with the medical services received. Consumer satisfaction i s a key component of health service performance. Many health organizations are increasingly using exit interviews and other techniques to provide feedback from consumers on their perception o f health service quality. These are tools that St. Kitts and Nevis may wish to also adopt in a systematic fashion.
6.19 Public health financing i s mainly through the consolidated fund. Revenue from user fees i s minor. User fees at public facilities amount to only about US$6 per capita per year, or 3 percent o f health recurrent spending in 2000. Facilities do not retain fees, so have little incentive to put effort into collection. Fees revert to the consolidated account. Furthermore, there are broad exemptions, such as the population aged 16 and under, and over age 62. Fees are modest. In Nevis, for example, the charge for a consultation i s about US$15. Dai ly fees at the Joseph N. France General Hospital are US$7.50 for care in a six-bed unit. Patients are charged US$65 per day for a private room. While fees may seem low on a per service basis, user fees for a catastrophic health problem could put an unacceptably high burden on a poor household’s financial situation, because the exemptions are not well targeted. The user fee policies would benefit from a review in terms of equity and efficiency. The review should consider whether fees
63 The Chief Medical Officer and Director of Community Health Services are responsible for coordinating services throughout St. Kitts and Nevis.
74
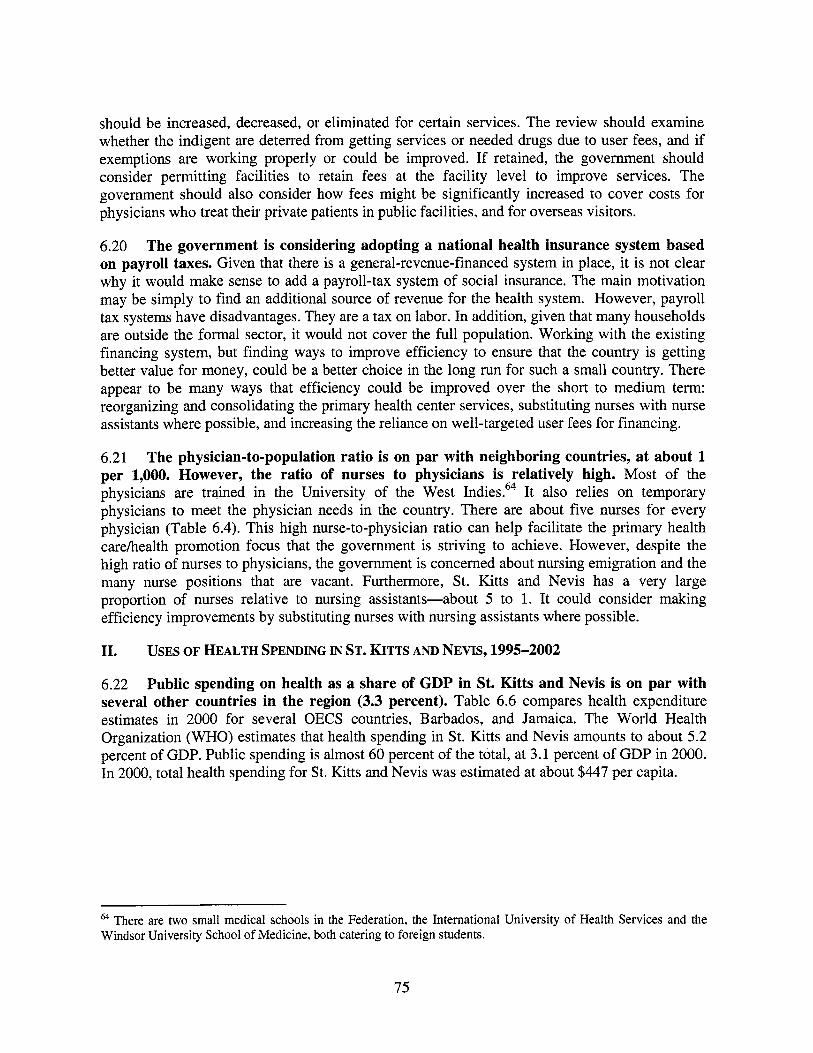
should be increased, decreased, or eliminated for certain services. The review should examine whether the indigent are deterred from getting services or needed drugs due to user fees, and if exemptions are working properly or could be improved. If retained, the government should consider permitting facilities to retain fees at the facility level to improve services. The government should also consider how fees might be significantly increased to cover costs for physicians who treat their private patients in public facilities, and for overseas visitors.
6.20 The government i s considering adopting a national health insurance system based on payroll taxes. Given that there i s a general-revenue-financed system in place, i t i s not clear why i t would make sense to add a payroll-tax system o f social insurance. The main motivation may be simply to find an additional source o f revenue for the health system. However, payroll tax systems have disadvantages. They are a tax on labor. In addition, given that many households are outside the formal sector, it would not cover the full population. Working with the existing financing system, but finding ways to improve efficiency to ensure that the country i s getting better value for money, could be a better choice in the long run for such a small country. There appear to be many ways that efficiency could be improved over the short to medium term: reorganizing and consolidating the primary health center services, substituting nurses with nurse assistants where possible, and increasing the reliance on well-targeted user fees for financing.
6.21 The physician-to-population ratio i s on par with neighboring countries, at about 1 per 1,000. However, the ratio of nurses to physicians i s relatively high. Most o f the physicians are trained in the University o f the West in die^.^^ I t also relies on temporary physicians to meet the physician needs in the country. There are about five nurses for every physician (Table 6.4). This high nurse-to-physician ratio can help facilitate the primary health carehealth promotion focus that the government i s striving to achieve. However, despite the high ratio o f nurses to physicians, the government i s concerned about nursing emigration and the many nurse positions that are vacant. Furthermore, St. Kitts and Nevis has a very large proportion o f nurses relative to nursing assistants-about 5 to 1. I t could consider making efficiency improvements by substituting nurses with nursing assistants where possible.
11. USES OF HEALTH SPENDING IN ST. KITTS AND NEVIS, 1995-2002
6.22 Public spending on health as a share of GDP in St. Kitts and Nevis is on par with several other countries in the region (3.3 percent). Table 6.6 compares health expenditure estimates in 2000 for several OECS countries, Barbados, and Jamaica. The World Health Organization (WHO) estimates that health spending in St. Kitts and Nevis amounts to about 5.2 percent of GDP. Public spending i s almost 60 percent o f the total, at 3.1 percent o f GDP in 2000. In 2000, total health spending for St. Kitts and Nevis was estimated at about $447 per capita.
64 There are two small medical schools in the Federation, the International University o f Health Services and the Windsor University School o f Medicine, both catering to foreign students.
75
Table 6.6 Health Spending in St. Kith and Nevis Compared to Barbados, Jamaica, and other OECS countries, 2000 (as percentage)
Public Health Share of
St. Kitts and Nevis 447 5.2 59 41 Antigua and Barbuda 562 5.5 60 40 Barbados 606 6.4 65 35 Dominica 247 6.1 71 29 Grenada 2 12 4.8 70 30 Jamaica 165 5.5 47 53 St. Lucia 202 4.3 62 38 St. Vincent and the Grenadines 190 6.3 65 35
Note: Estimates of public spending are more reliable than estimates of private spending. Source: World Health Organization, Preliminary Information.
6.23 Since 1995, the share of recurrent health spending in GDP has been stable at around 3.3 percent of GDP (Figure 6.1). In the same period, St. Kitts’s health sector received on average 9.8 percent of government recurrent spending. The equivalent figure in Nevis was 13.5 percent. These shares seem adequate; however, given the difficult fiscal situation that the government faces, savings can be obtained. The expected cyclical fluctuations in social expenditures as a response
Figure 6.1 Share of Recurrent Health Expenditures in GDP, S t Kilts and Nevis
(percenlage) 1995-2000
/ 4.0%
3.5%
3.0% -
2.5% -
2.0% -
1.5%
0.5% 0.0% I 0 % l
1995 1996 I997 1998 1999 2000 2001 2002 Source SI Chnstopher and N e w Esbrnates for the Year and News Island Admlnistrabon (NIA) Enmates forme Year Note informmonforNews 1999wasnotavail&
0 St. KMr +St.Kittr and Nevir
to economic shocks or natural disasters are not present in St. Kitts and Nevis health expenditures, mostly because of the large share o f personal emoluments and wages in the sector’s recurrent expenditures.
6.24 Public recurrent health expenditures in St. Kitts grew during 1995-2002 by 4.7 percent per year in real terms. As Table 6.7 shows, in Nevis the growth over the same period was 3.7 percent per year in real terms. Wages absorb about 80 percent o f all health spending in St. Kitts and 73 percent in ne vi^.^^ These figures are on the high side, and raise questions as to whether there i s sufficient allocation for pharmaceuticals, medical supplies, and maintenance of equipment and buildings. As discussed in paragraphs 6.15 and 6.22, there i s scope to reduce personnel spending by consolidation of health centers and substitution o f nurses for nursing assistants.
‘j The slightly lower share in Nevis may be because no pharmaceutical spending appears in the Nevis budget.
76
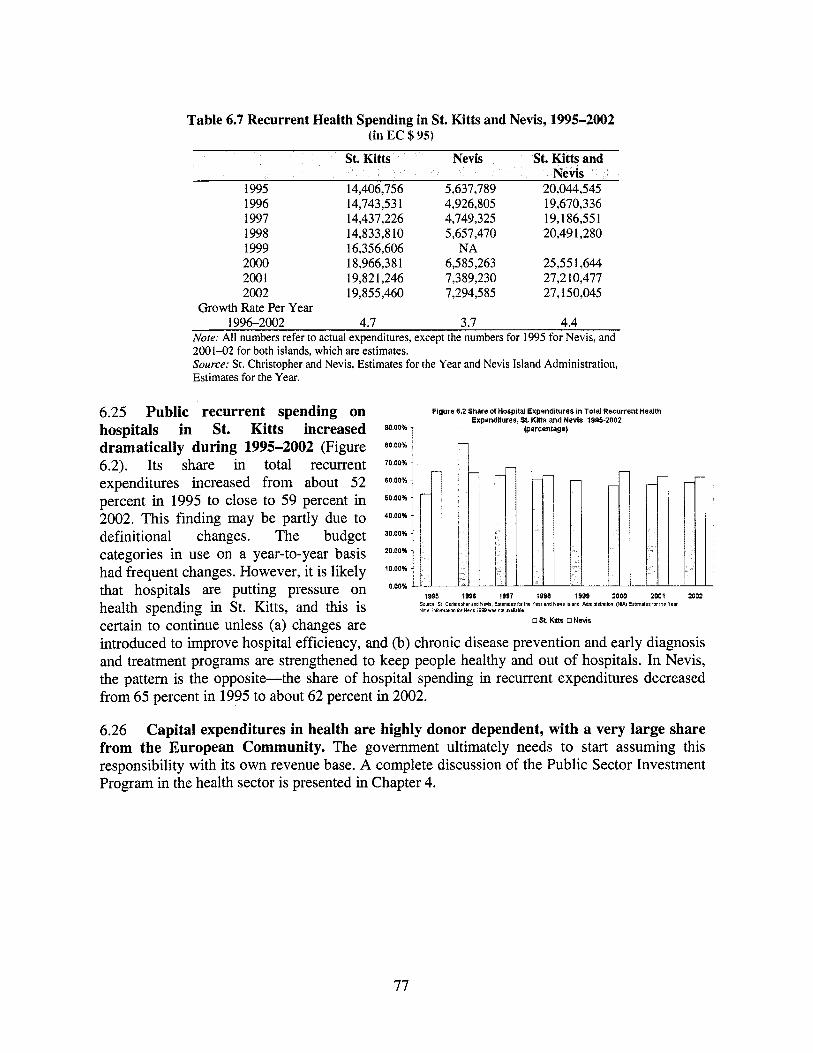
Table 6.7 Recurrent Health Spending in St. Kitts and Nevis, 1995-2002 (in EC $95)
Nevis St. Kitts and
1995 14,406,756 5,637,789 20,044,545 1996 14,743,53 1 4,926,805 19,670,336 1997 14,431,226 4,749,325 19,186,55 1 1998 14,833,8 10 5,657,470 20,49 1,280 1999 16,356,606 N A 2000 18,966,38 1 6,585,263 25,55 1,644 2001 19,821,246 7,389,230 27,2 10,477 2002 19,855,460 7,294,585 27,150,045
evis
Growth Rate Per Year 1996-2002 4.7 3.7 4.4
Nore: All numbers refer to actual expenditures, except the numbers for 1995 for Nevis, and 2001-02 for both islands, which are estimates. Source: St. Christopher and Nevis, Estimates for the Year and Nevis Island Administration, Estimates for the Year.
6.25 Public recurrent spending on hospitals in St. Kitts increased dramatically during 1995-2002 (Figure 6.2). I t s share in total recurrent expenditures increased from about 52 percent in 1995 to close to 59 percent in 2002. This finding may be partly due to definitional changes. The budget categories in use on a year-to-year basis had frequent changes. However, i t i s likely that hospitals are putting pressure on health spending in St. Kitts, and this i s certain to continue unless (a) changes are
90.00%
80.00%
70.00%
60.00%
60.00%
40.00%
30.00%
20.00%
10.00%
0.00%
Figure 6.2 Share of Hospital Expenditures in Told Recurrent Health Expenditures. SL ~ m s and Nevis 1995-2002
(percentage)
996 1996 1997 1998 1999 2000 Z M I ~ 2002
introduced to improve hospital efficiency, and (b) chronic disease prevention and early diagnosis and treatment programs are strengthened to keep people healthy and out o f hospitals. In Nevis, the pattern i s the opposite-the share of hospital spending in recurrent expenditures decreased from 65 percent in 1995 to about 62 percent in 2002.
6.26 Capital expenditures in health are highly donor dependent, with a very large share from the European Community. The government ultimately needs to start assuming this responsibility with i t s own revenue base. A complete discussion of the Public Sector Investment Program in the health sector i s presented in Chapter 4.
77

7. THE EDUCATION SECTOR
7.1 Education i s fundamental for economic and social development. The knowledge and sk i l ls taught in the education system are a highly valued commodity in the labor market. For example, in St. Kitts and Nevis, attainment of postsecondary education, seven to eight years o f additional schooling after primary education, allows an individual to increase earnings by more than 70 percent for the entire period o f labor market participation, 45 years.66 Furthermore, human capital investment i s known to bring better societal outcomes, such as reduced youth delinquency and improved health.
7.2 The close link between education and labor market earnings implies that lack o f education i s one o f the primary sources of poverty in St. K i t t s and Nevis. Data from the 1999 Survey o f Living Conditions indicate that 27 percent o f those with no education or a primary education are poor, while only 18 percent, 12 percent, and 5 percent are poor among individuals with secondary, postsecondary, and university education, respectively. Hence, there are strong economic motives for the individual and the government to invest in education.
7.3 Education expenditures in St. Kitts and Nevis, on average, were about 5.2 percent o f GDP during 1994-2001, with a rising trend toward the end o f the period. However, th is allocation in public resources has not always been accompanied by an improvement in education outcomes, equity, and efficiency. The fiscal crisis the country i s facing w i l l require a cut in expenditures for all sectors, but this should not preclude the government from completing the educational agenda by making better use o f the available resources and increasing the nongovernmental provision in education, for example, in tertiary education.
7.4 This chapter reviews education outcomes in St. Kitts and Nevis, discusses how education services are financed, organized, and delivered, and suggests interventions to improve outcomes, equity, and efficiency. The main findings and recommendations can be summarized as follows:
Expensive delivery of education at the primary and secondary level. St. Kitts and Nevis has the most expensive delivery system o f the OECS countries, mostly due to i ts high pupil-teacher ratio. Among the initiatives that the government could consider to increase the pupil-teacher ratio are:
0 Merging of primary schools. Inefficient use o f teachers takes place predominantly at smaller primary schools. A merging o f schools based on school mapping would exploit economies of scale in the education system and reduce cost, while increasing quality. Instituting a curriculum reform of secondary education. A common core curriculum for the first three forms o f secondary education would reduce the excessive offering o f subjects o f a specialized nature, such as typewriting, auto mechanics, and metalwork, and lead to larger classes. Mandating of a minimum floor on class size at the primary and secondary level. Many schools, in particular at the secondary level, offer subjects with
0
0
66 Without controlling for other factors influencing labor market earnings, such as age, gender, and ability, these observations suggest a return to investment in human capital o f the magnitude of 10 percent, a rate that often exceeds-in both magnitude and certainty-that o f investment in physical capital.
79
low demand, leading to small class sizes and high costs. Mandating a minimum class size of, say, 15 students, a rule in many developed countries, would increase efficiency. Rewarding wel2-pe~orming schools. The Ministry o f Education could provide incentives for each school to deliver education more efficiently by rewarding schools that commit to increase the pupil-teacher ratio while retaining part o f the savings.
0
0 Low quality of education due to an automatic progression system and very low level o f teacher training. The government could consider:
0 Introducing an efective monitoring and evaluation system. With automatic progression in primary school, i t i s critical to establish a monitoring system to guarantee that all students have learned sufficient to graduate from primary school. Rethinking teacher training and hiring regulations. All graduates from secondary school should be eligible for Teachers College-regardless of prior teaching experience. To address the lack of teaching experience a mentoring program should be introduced as an element of teacher training. Only certified teachers should qual ib for open positions. This would prevent the quality of the teacher corps from deteriorating further. A major retraining program of the existing teaching stafs should take place. Provided efficiency gains take place in the system, this would generate time and resources for teachers to attend retraining courses.
0
0
o
0 Reducing public unit costs in tertiary education by: o Raising fees. Currently, nationals are exempted from paying tuition fees, but
they have to shoulder other limited fees that amount to 5 percent o f total costs. Moreover, many tertiary graduates migrate, which raises the issue of the large subsidy to higher education. Increasing this ratio to 20 percent would generate EC$1 mill ion (3 percent o f the recurrent education budget). Abolishing salaried students in Teachers College and nursing education. Currently, around 25 students at the Teachers College and 10 students in nursing education are paid full-time salaries, while students o f other disciplines are unpaid. Elimination o f this differential treatment of students would provide the government with an estimated saving o f EC$650,000 (2 percent o f the recurrent education budget). Increasing regional cooperation among colleges, which in the medium run could pave the way for quality and efficiency improvements through specialization. Stimulating expansion through negotiating performance contracts with the main provider, which i s a medium-term way to increase enrollment at little cost.
o
o
o
0 Reducing administration costs through deeper cooperation within the country and at the regional level with the development o f exams, information systems, strategies, and curricula. This would reduce duplication o f work and lead to further efficiency gains
80
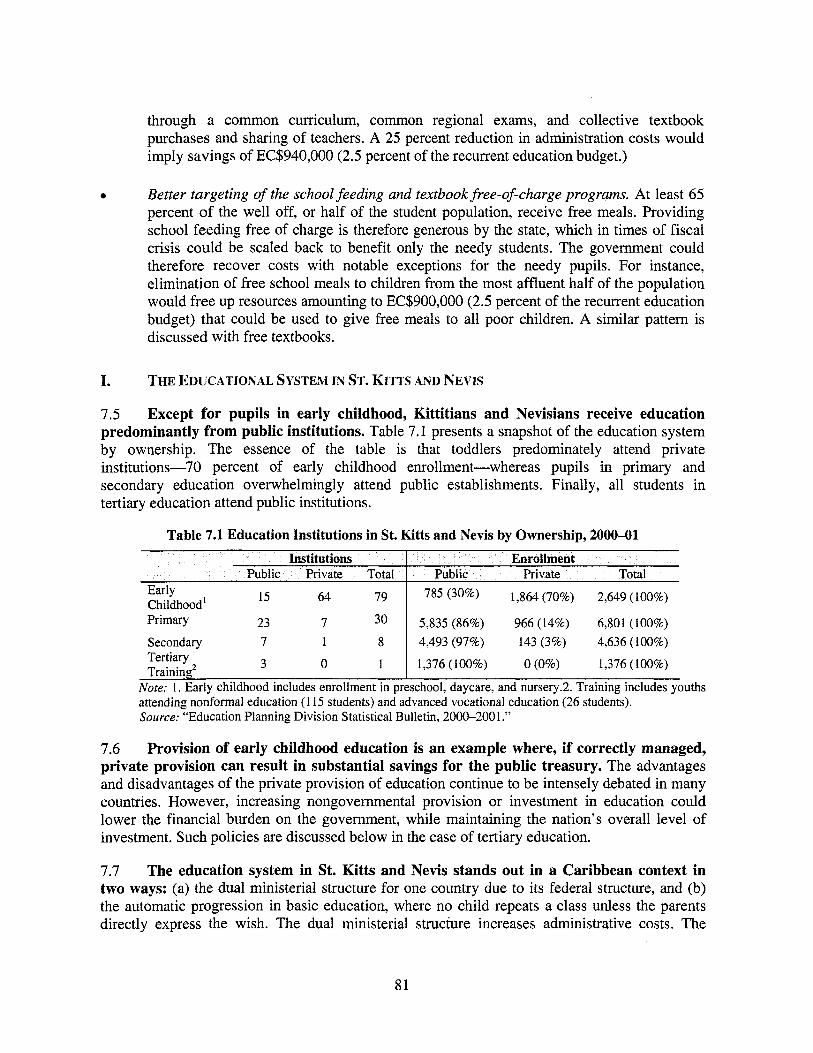
through a common curriculum, common regional exams, and collective textbook purchases and sharing of teachers. A 25 percent reduction in administration costs would imply savings o f EC$940,000 (2.5 percent o f the recurrent education budget.)
Better targeting of the school feeding and textbook free-of-charge programs. At least 65 percent of the well off, or half o f the student population, receive free meals. Providing school feeding free o f charge i s therefore generous by the state, which in times o f fiscal crisis could be scaled back to benefit only the needy students. The government could therefore recover costs with notable exceptions for the needy pupils. For instance, elimination o f free school meals to children from the most affluent half of the population would free up resources amounting to EC$900,000 (2.5 percent o f the recurrent education budget) that could be used to give free meals to al l poor children. A similar pattern i s discussed with free textbooks.
I. THE EDUCATIONAL SYSTEM IN ST. KITTS AND NEVIS
7.5 Except for pupils in early childhood, Kittitians and Nevisians receive education predominantly from public institutions. Table 7.1 presents a snapshot o f the education system by ownership. The essence o f the table i s that toddlers predominately attend private institutions-70 percent o f early childhood enrollment-whereas pupils in primary and secondary education overwhelmingly attend public establishments. Finally, all students in tertiary education attend public institutions.
Table 7.1 Education Institutions in St. Kitts and Nevis by Ownership, 2000-01
4,493 (97%) 143 (3%) 4,636 (100%)
Note: 1. Early childhood includes enrollment in preschool, daycare, and nursery.2. Training includes youths attending nonformal education (1 15 students) and advanced vocational education (26 students). Source: “Education Planning Division Statistical Bulletin, 2000-200 1 .”
7.6 Provision of early childhood education is an example where, if correctly managed, private provision can result in substantial savings for the public treasury. The advantages and disadvantages of the private provision o f education continue to be intensely debated in many countries. However, increasing nongovernmental provision or investment in education could lower the financial burden on the government, while maintaining the nation’s overall level o f investment. Such policies are discussed below in the case o f tertiary education.
7.7 The education system in St. Kitts and Nevis stands out in a Caribbean context in two ways: (a) the dual ministerial structure for one country due to i t s federal structure, and (b) the automatic progression in basic education, where no child repeats a class unless the parents directly express the wish. The dual ministerial structure increases administrative costs. The
81
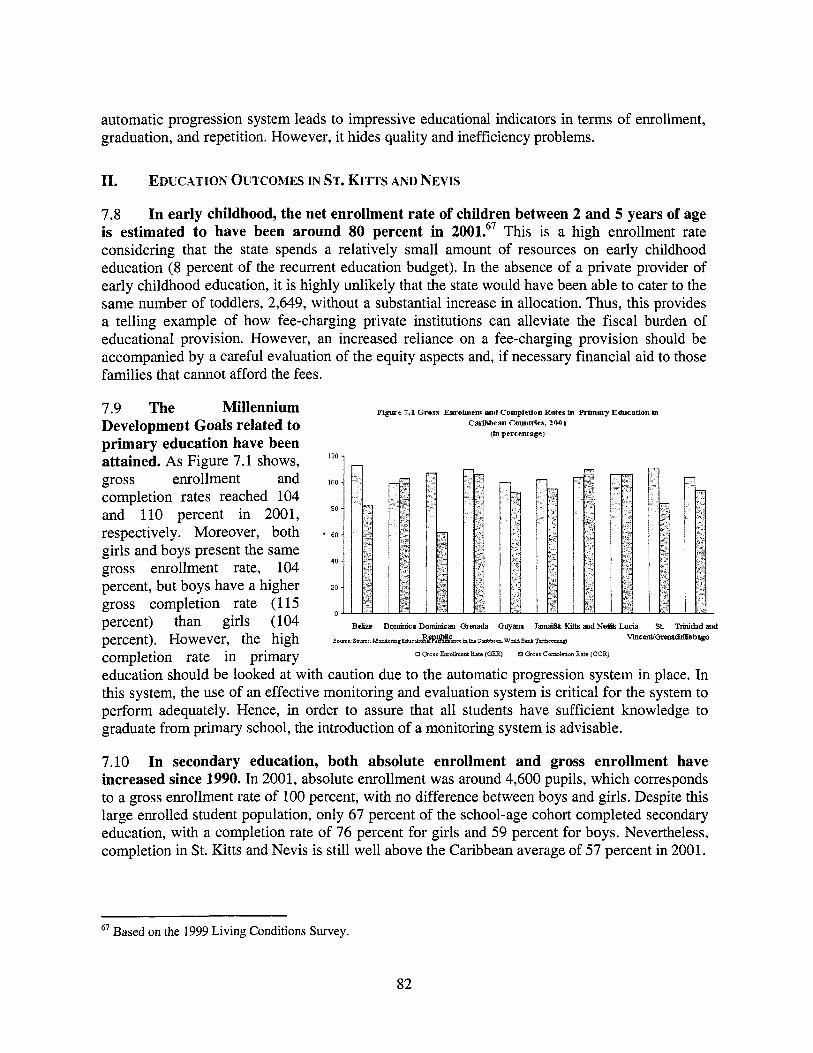
automatic progression system leads to impressive educational indicators in terms o f enrollment, graduation, and repetition. However, it hides quality and inefficiency problems.
11. EDUCATION OCTCOMES IN ST, KITTS AND NEVIS
7.8 In early childhood, the net enrollment rate of children between 2 and 5 years of age is estimated to have been around 80 percent in 2001.67 This i s a high enrollment rate considering that the state spends a relatively small amount o f resources on early childhood education (8 percent o f the recurrent education budget). In the absence of a private provider o f early childhood education, i t i s highly unlikely that the state would have been able to cater to the same number o f toddlers, 2,649, without a substantial increase in allocation. Thus, this provides a telling example o f how fee-charging private institutions can alleviate the fiscal burden o f educational provision. However, an increased reliance on a fee-charging provision should be accompanied by a careful evaluation o f the equity aspects and, if necessary financial aid to those families that cannot afford the fees.
7.9 The Millennium Development Goals related to primary education have been attained. As Figure 7.1 shows, gross enrollment and completion rates reached 104 and 110 percent in 2001, respectively. Moreover, both girls and boys present the same gross enrollment rate, 104 percent, but boys have a higher gross completion rate (115 percent) than girls (104 percent). However, the high completion rate in primary
F i g w e 7.1 Gross Iu-olmmnt and Conipletion Rntes in Prirnnry Education in Cwibbenn Countries, 1001
(in prrrentsgr)
120,
100
80
60
40
20
0
education should be looked at with caution due to the automatic progression system in place. In this system, the use of an effective monitoring and evaluation system i s critical for the system to perform adequately. Hence, in order to assure that all students have sufficient knowledge to graduate from primary school, the introduction o f a monitoring system i s advisable.
7.10 In secondary education, both absolute enrollment and gross enrollment have increased since 1990. In 2001, absolute enrollment was around 4,600 pupils, which corresponds to a gross enrollment rate o f 100 percent, with no difference between boys and girls. Despite this large enrolled student population, only 67 percent o f the school-age cohort completed secondary education, with a completion rate o f 76 percent for girls and 59 percent for boys. Nevertheless, completion in St. Kitts and Nevis i s s t i l l well above the Caribbean average of 57 percent in 2001.
67 Based on the 1999 Living Conditions Survey.
82
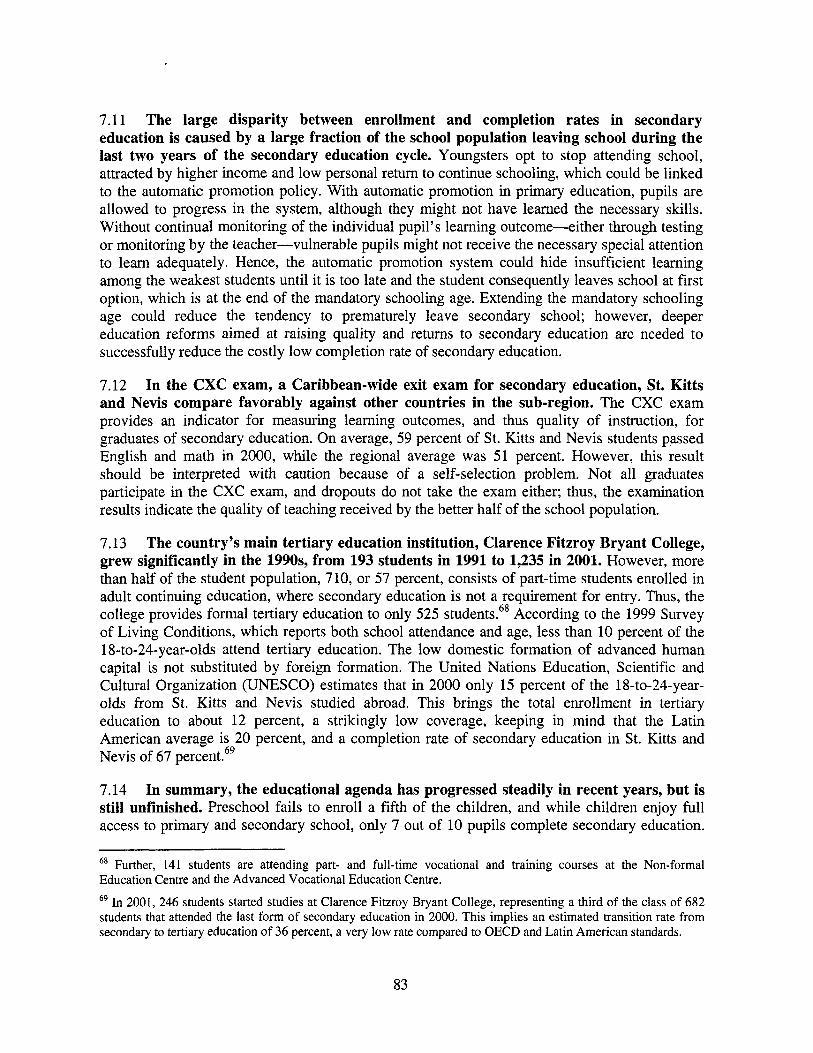
7.11 The large disparity between enrollment and completion rates in secondary education i s caused by a large fraction of the school population leaving school during the last two years of the secondary education cycle. Youngsters opt to stop attending school, attracted by higher income and low personal return to continue schooling, which could be linked to the automatic promotion policy. With automatic promotion in primary education, pupils are allowed to progress in the system, although they might not have learned the necessary skil ls. Without continual monitoring o f the individual pupil’s learning outcome-either through testing or monitoring by the teacher-vulnerable pupils might not receive the necessary special attention to learn adequately. Hence, the automatic promotion system could hide insufficient learning among the weakest students until it i s too late and the student consequently leaves school at f irst option, which i s at the end o f the mandatory schooling age. Extending the mandatory schooling age could reduce the tendency to prematurely leave secondary school; however, deeper education reforms aimed at raising quality and returns to secondary education are needed to successfully reduce the costly low completion rate o f secondary education.
7.12 In the CXC exam, a Caribbean-wide exit exam for secondary education, St. Kitts and Nevis compare favorably against other countries in the sub-region. The CXC exam provides an indicator for measuring learning outcomes, and thus quality o f instruction, for graduates o f secondary education. On average, 59 percent o f St. Kitts and Nevis students passed English and math in 2000, while the regional average was 51 percent. However, this result should be interpreted with caution because of a self-selection problem. Not all graduates participate in the CXC exam, and dropouts do not take the exam either; thus, the examination results indicate the quality o f teaching received by the better half of the school population.
7.13 The country’s main tertiary education institution, Clarence Fitzroy Bryant College, grew significantly in the 1990s, from 193 students in 1991 to 1,235 in 2001. However, more than half o f the student population, 710, or 57 percent, consists o f part-time students enrolled in adult continuing education, where secondary education i s not a requirement for entry. Thus, the college provides formal tertiary education to only 525 students.68 According to the 1999 Survey of Living Conditions, which reports both school attendance and age, less than 10 percent o f the 18-to-24-year-olds attend tertiary education. The low domestic formation o f advanced human capital i s not substituted by foreign formation. The United Nations Education, Scientific and Cultural Organization (UNESCO) estimates that in 2000 only 15 percent o f the 18-to-24-year- olds from St. Kitts and Nevis studied abroad. This brings the total enrollment in tertiary education to about 12 percent, a strikingly low coverage, keeping in mind that the Latin American average i s 20 percent, and a completion rate o f secondary education in St. Kitts and Nevis of 67 percent.69
7.14 In summary, the educational agenda has progressed steadily in recent years, but is sti l l unfinished. Preschool fails to enroll a fifth o f the children, and while children enjoy full access to primary and secondary school, only 7 out o f 10 pupils complete secondary education.
68 Further, 141 students are attending part- and full-time vocational and training courses at the Non-formal Education Centre and the Advanced Vocational Education Centre.
69 In 2001, 246 students started studies at Clarence Fitzroy Bryant College, representing a third o f the class of 682 students that attended the last form o f secondary education in 2000. This implies an estimated transition rate from secondary to tertiary education o f 36 percent, a very low rate compared to OECD and Latin American standards.
83
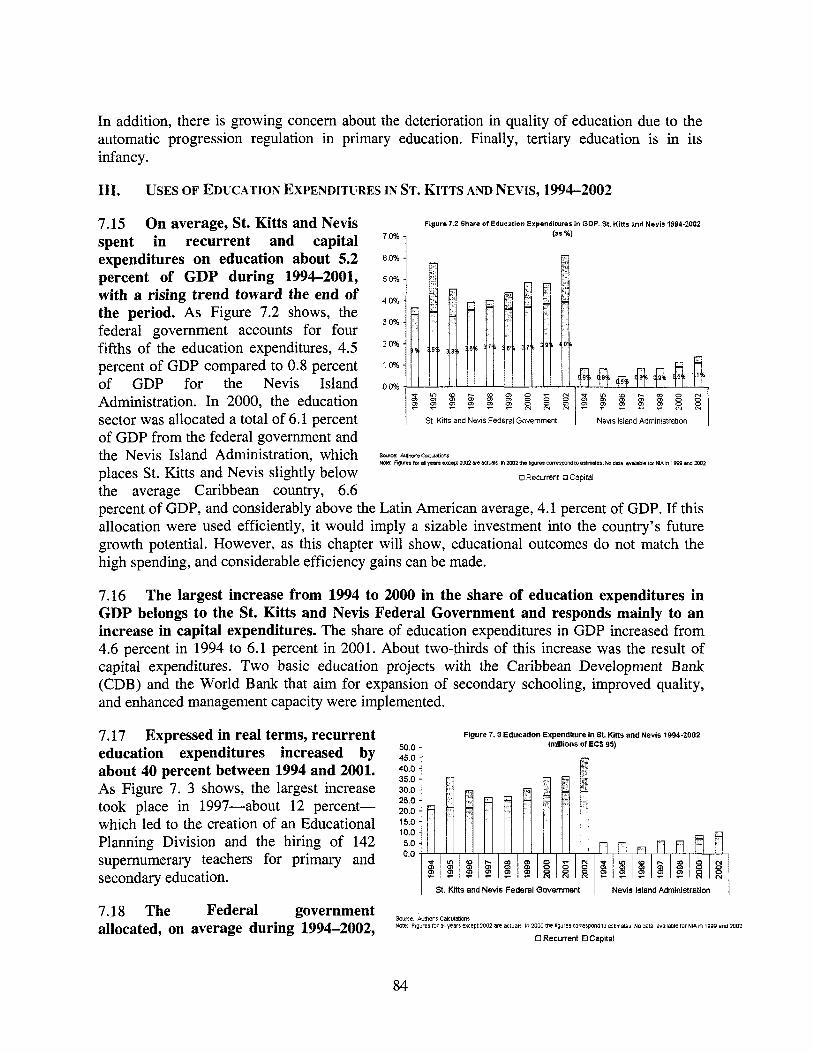
In addition, there i s growing concern about the deterioration in quality of education due to the automatic progression regulation in primary education. Finally, tertiary education i s in i t s infancy.
111. USES OF EDUCATION EXPENDITURES IN ST. KITTS AND NEWS, 1994-2002
7.15 On average, St. Kitts and Nevis spent in recurrent and capital expenditures on education about 5.2 percent of GDP during 1994-2001, with a rising trend toward the end of the period. As Figure 7.2 shows, the federal government accounts for four f i f ths o f the education expenditures, 4.5 percent o f GDP compared to 0.8 percent of GDP for the Nevis Island Administration. In 2000, the education sector was allocated a total o f 6.1 percent o f GDP from the federal government and the Nevis Island Administration, which places St. Kitts and Nevis slightly below the average Caribbean country, 6.6
Figure 7 9 Share of Education Expenditures in GDP. S t KiKs and Nevis 1994-2002 (as %)
x g I g S g g g g g g g I g ” r n 0 ” z $ ! z 2 z z R R R $ ! z z z z ? R R
St Kitts and Nevls Federal Government N e w Island Administration
percent o f GDP, and considerably-above the Latin American average, 4.1 percent o f GDP. If this allocation were used efficiently, i t would imply a sizable investment into the country’s future growth potential. However, as this chapter wi l l show, educational outcomes do not match the high spending, and considerable efficiency gains can be made.
7.16 The largest increase from 1994 to 2000 in the share of education expenditures in GDP belongs to the St. Kitts and Nevis Federal Government and responds mainly to an increase in capital expenditures. The share of education expenditures in GDP increased from 4.6 percent in 1994 to 6.1 percent in 2001. About two-thirds o f this increase was the result o f capital expenditures. Two basic education projects with the Caribbean Development Bank (CDB) and the World Bank that aim for expansion o f secondary schooling, improved quality, and enhanced management capacity were implemented.
7.17 Expressed in real terms, recurrent education expenditures increased by about 40 percent between 1994 and 2001. As Figure 7. 3 shows, the largest increase took place in 1997-about 12 percent- which led to the creation o f an Educational Planning Division and the hiring o f 142 supernumerary teachers for primary and secondary education.
7.18 The Federal government allocated, on average during 1994-2002,
Figure 7. 50 0 45.0 40.0 35.0 30.0 25 0 20 0 15 0 10 0 5 0 0 0
3 EducaDion Expenditure in S t K i m and Nevis 1994-2002 (millions of ECf 95)
1 St. Kitts and Nevis Federal Government 1 Nevis Island Administration 1 Source AUmarf Calculatlans NO@ ~ i g u i e ~ tor anyears e w p t 2002 are actilais in 2002 me ngures cornspondto esumatei NO dam avaiia~ie tor NR m 1999 and 2002
0 Recurrent L3 Capital
84
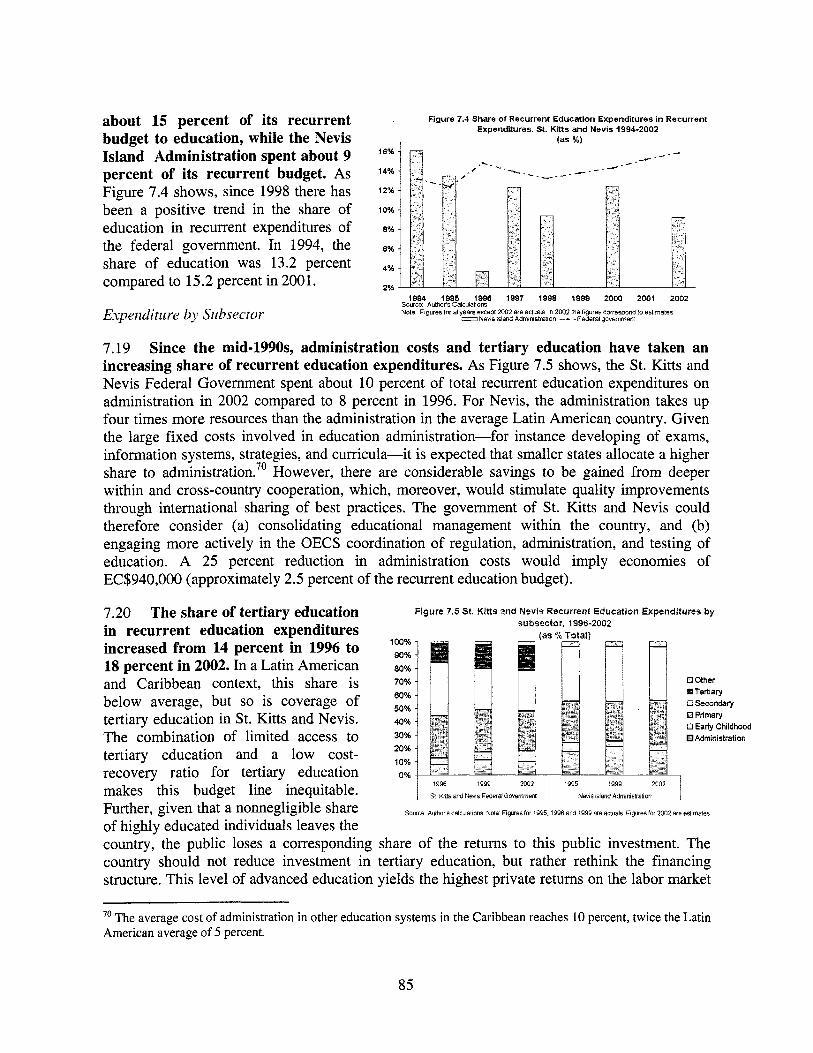
about 15 percent of its recurrent budget to education, while the Nevis Island Administration spent about 9 percent of its recurrent budget. As Figure 7.4 shows, since 1998 there has been a positive trend in the share o f education in recurrent expenditures o f the federal government. In 1994, the share o f education was 13.2 percent compared to 15.2 percent in 2001.
Figure 7.4 Share of Recurrent Education Expenditures in Recurrent Expenditures. St. Ktts and Nevis 1994-2002
(as Xt
1994 1995 1996 1997 1998 1999 2000 2001 2002 Source Authors Calculauans Note Figures for al years except 2002 are actual5 In 2002 the hgures correspond to esamates
n Nens Island Adminlstrauon -e -Federal government
7.19 Since the mid-l990s, administration costs and tertiary education have taken an increasing share of recurrent education expenditures. As Figure 7.5 shows, the St. Kitts and Nevis Federal Government spent about 10 percent o f total recurrent education expenditures on administration in 2002 compared to 8 percent in 1996. For Nevis, the administration takes up four times more resources than the administration in the average Latin American country. Given the large fixed costs involved in education administration-for instance developing o f exams, information systems, strategies, and curricula-it i s expected that smaller states allocate a higher share to administration.” However, there are considerable savings to be gained from deeper within and cross-country cooperation, which, moreover, would stimulate quality improvements through international sharing o f best practices. The government o f St. Kitts and Nevis could therefore consider (a) consolidating educational management within the country, and (b) engaging more actively in the OECS coordination o f regulation, administration, and testing of education. A 25 percent reduction in administration costs would imply economies of EC$940,000 (approximately 2.5 percent o f the recurrent education budget).
7.20 The share of tertiary education Figure 7.5 St. Kitts and Nevis Recurrent Education Expenditures by subsector, 1998-2002
(as o/b Total) in recurrent education expenditures increased from 14 percent in 1996 to 9056
18 percent in 2002. In a Latin American 80%
and Caribbean context, this share i s 70%
100%
0 Other E4Teltiary
0 Pnmary 0 Early Childhood
60% below average, but so i s coverage o f 5ou R Secondary
tertiary education in St. Kitts and Nevis. The combination of limited access to 30% Administration
40%
20% 10% tertiary education and a low cost-
makes this budget line inequitable.
of highly educated individuals leaves the country, the public loses a corresponding share of the returns to this public investment. The country should not reduce investment in tertiary education, but rather rethink the financing structure. T h i s level of advanced education yields the highest private returns on the labor market
recovery ratio for tertiary education 0%
Further, given that a nonnegligible share Source Authors caiculabons Note Figures far 1995 1998 and 1999 are actuals Figures for 2002 are elmates
’O The average cost o f administration in other education systems in the Caribbean reaches 10 percent, twice the Latin American average of 5 percent.
85
and spurs economic development; consequently, the financing burden could increasingly be shifted toward the beneficiary. With this aim in mind, the government could raise existing fees in tertiary education. Most countries, in particular developing countries, have introduced cost recovery measures in public higher education. Recently, Dominica established tuition fees for the country's community college that cover 13 percent of the institution's cost.
7.21 Currently in St. Kitts and Nevis, no tuition fee i s charged to nationals, but minor fees, such as a graduation fee and technology access fee, cover 5 percent of total costs. These could be raised to reflect the true costs o f tertiary education; for instance, a 20 percent cost- recovery ratio would generate immediate extra revenue o f EC$1 million (3 percent of the recurrent education budget). Further, to achieve higher value for public money, the Ministry o f Education could set performance targets for the Clarence Fitzroy Bryant College through a negotiated contract with the institution. The tertiary education budget i s also burdened by payment o f full-time salaries to 25 students enrolled at the teacher training college and 10 students enrolled in nursing school. This i s an exceptional, expensive, and unequal expenditure disproportionately favoring one type of student. Elimination of this spending category would provide the government with an estimated saving o f EC$650,000 (2 percent o f the recurrent education budget). Box 7.1 presents alternative sources o f financing tertiary education in Latin America and the Caribbean.
7.22 The share of secondary education expenditures in total recurrent education expenditures in the St. Kitts and Nevis Federal Government has decreased since the mid- 1990s. In the mid-l990s, 4 out of 10 education EC dollars went to secondary education. At the start o f the new millennium, 3 out o f 10 reached this subsector. The adjustment reflects a serious squeezing o f non-salary expenditures. The share o f recurrent expenditures to secondary education should not be allowed to fall further, and a reallocation of recurrent expenditures to non-salary expenditures in secondary education i s recommended and in accordance with the education priorities that the country i s facing.
Equity of Spending
7.23 The most important educational barriers for low-income families are limited access to, and inconsistent quality of, the education system. International evidence overwhelmingly demonstrates that such barriers disproportionately hurt the educational chances o f children from poor and uneducated families. Consequently, equitable policies would (a) increase completion of secondary education through quality improvements at the primary and secondary level, and (b) overcome barriers to access to early childhood development and tertiary ed~cat ion.~' This section further considers two specific budget lines that aim for enhanced equitable outcomes: the School Feeding Program and the free textbook program.
71 Barriers to access and completion o f education, regardless o f the level, are likely to be o f both social and financial nature. In the case o f early childhood education, the survey o f living conditions clearly indicates a relationship between barriers and income. One-fifth o f children from the lowest three income quintiles do not attend early childhood programs, while al l children from the highest two quintiles attend. Targeted financial aid could mitigate the disadvantage of children from poor families.
86
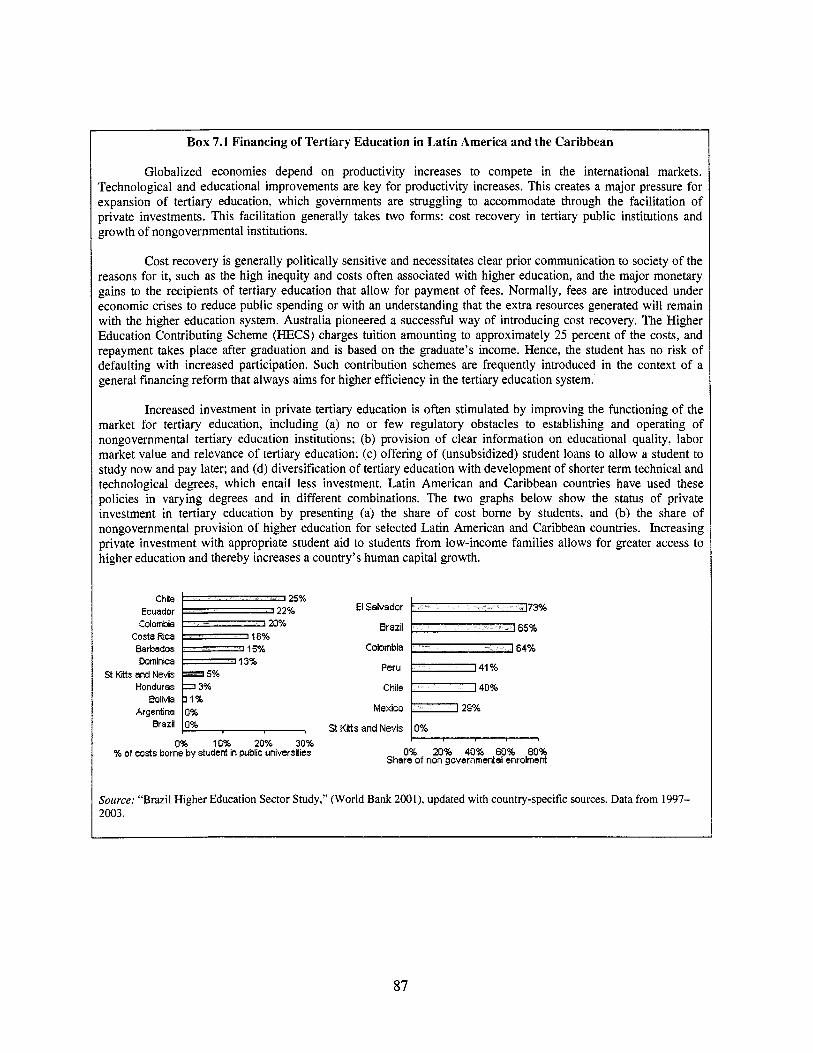
Box 7.1 Financing of Tertiary Education in Lat in America and the Caribbean
Globalized economies depend on productivity increases to compete in the international markets. Technological and educational improvements are key for productivity increases. This creates a major pressure for expansion o f tertiary education, which governments are struggling to accommodate through the facilitation o f private investments. Th is facilitation generally takes two forms: cost recovery in tertiary public institutions and growth o f nongovernmental institutions.
Cost recovery i s generally politically sensitive and necessitates clear prior communication to society o f the reasons for it, such as the high inequity and costs often associated with higher education, and the major monetary gains to the recipients of tertiary education that allow for payment o f fees. Normally, fees are introduced under economic crises to reduce public spending or with an understanding that the extra resources generated wil l remain with the higher education system. Australia pioneered a successful way of introducing cost recovery. The Higher Education Contributing Scheme (HECS) charges tuition amounting to approximately 25 percent o f the costs, and repayment takes place after graduation and i s based on the graduate’s income. Hence, the student has no risk o f defaulting with increased participation. Such contribution schemes are frequently introduced in the context of a general financing reform that always aims for higher efficiency in the tertiary education system.
Increased investment in private tertiary education i s often stimulated by improving the functioning of the market for tertiary education, including (a) no or few regulatory obstacles to establishing and operating o f nongovernmental tertiary education institutions; (b) provision o f clear information on educational quality, labor market value and relevance o f tertiary education; (c) offering o f (unsubsidized) student loans to allow a student to study now and pay later; and (d) diversification o f tertiary education with development of shorter term technical and technological degrees, which entail less investment. Latin American and Caribbean countries have used these policies in varying degrees and in different combinations. The two graphs below show the status of private investment in tertiary education by presenting (a) the share o f cost borne by students, and (b) the share of nongovernmental provision of higher education for selected Latin American and Caribbean countries. Increasing private investment with appropriate student aid to students from low-income families allows for greater access to higher education and thereby increases a country’s human capital growth.
Chile El Salvador Ecuador
Brazil Colombia Costa Rica Barbados Colombia
Peru Dominica
St Kitts and Nsvis Honduras Chile
Bolivia Argentina Mexico
St Kitts and Nevis Brazil
0% 20% 40% 60% 80% Share of non governmental enrolment
0% IO%, 20% 3.0% % of costs borne by student in public universdies
Source: “Brazil Higher Education Sector Study,” (World Bank 200 I), updated with country-specific sources. Data from 1997- 2003.
87
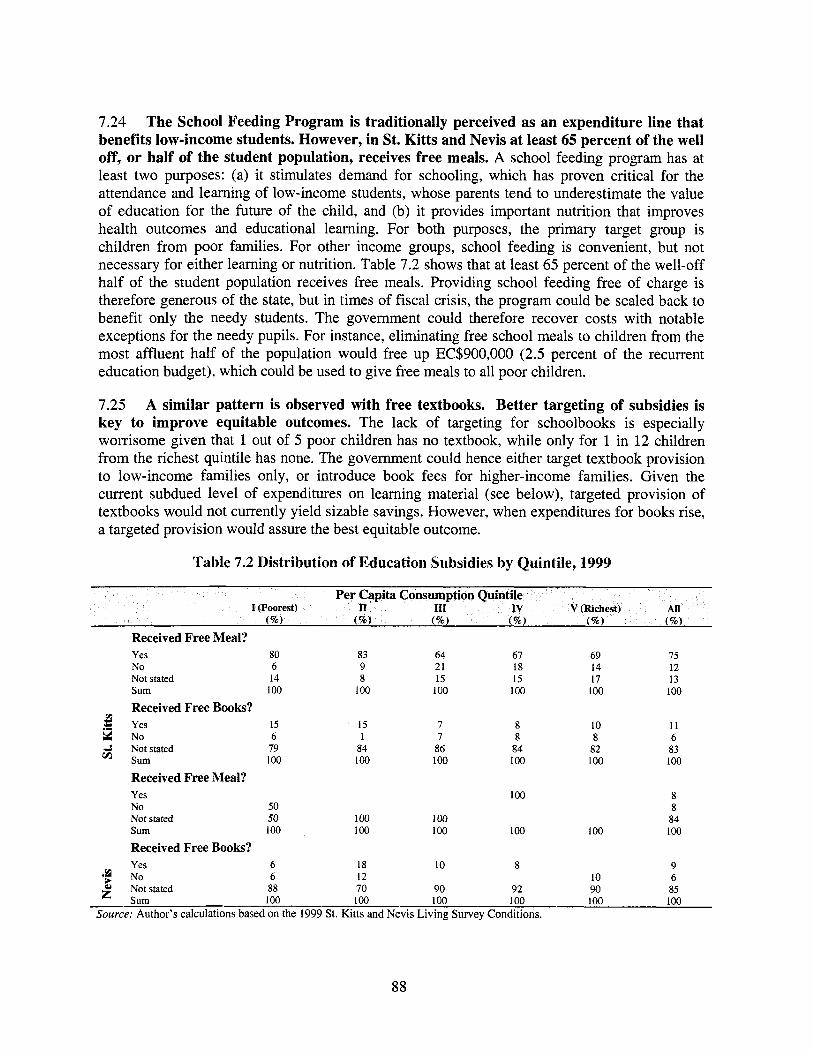
7.24 The School Feeding Program is traditionally perceived as an expenditure line that benefits low-income students. However, in St. Kitts and Nevis at least 65 percent of the well off, or half of the student population, receives free meals. A school feeding program has at least two purposes: (a) it stimulates demand for schooling, which has proven critical for the attendance and learning of low-income students, whose parents tend to underestimate the value o f education for the future of the child, and (b) i t provides important nutrition that improves health outcomes and educational learning. For both purposes, the primary target group i s children from poor families. For other income groups, school feeding i s convenient, but not necessary for either learning or nutrition. Table 7.2 shows that at least 65 percent o f the well-off half o f the student population receives free meals. Providing school feeding free of charge i s therefore generous o f the state, but in times o f fiscal crisis, the program could be scaled back to benefit only the needy students. The government could therefore recover costs with notable exceptions for the needy pupils. For instance, eliminating free school meals to children from the most affluent half of the population would free up EC$900,000 (2.5 percent o f the recurrent education budget), which could be used to give free meals to a l l poor children.
7.25 A similar pattern is observed with free textbooks. Better targeting of subsidies is key to improve equitable outcomes. The lack o f targeting for schoolbooks i s especially worrisome given that 1 out o f 5 poor children has no textbook, while only for 1 in 12 children from the richest quintile has none. The government could hence either target textbook provision to low-income families only, or introduce book fees for higher-income families. Given the current subdued level of expenditures on learning material (see below), targeted provision of textbooks would not currently yield sizable savings. However, when expenditures for books rise, a targeted provision would assure the best equitable outcome.
Table 7.2 Distribution of Education Subsidies by Quintile, 1999
Received Free Meal? Yes 80 83 64 67 69 75 No 6 9 21 18 14 12 Not stated 14 8 15 15 17 13 Sum 100 100 100 100 100 IO0
Received Free Books? ’ Yes 15 15 7 8 10 11 6 1 7 8 8 6
79 84 86 84 82 83 Sum 100 100 100 100 100 100
Received Free Meal? Yes 100 8 No 50 8 Not stated 50 100 100 84 Sum 100 100 100 100 100 100
Received Free Books? Yes 6 18 10 8 9
6 12 10 6 88 70 90 92 90 85
a No C; Not stated
v1 ‘6 No
n” ETd 100 100 100 100 100 100 Source: Author’s calculations based on the 1999 St. Kitts and Nevis Living Survey Conditions.
88
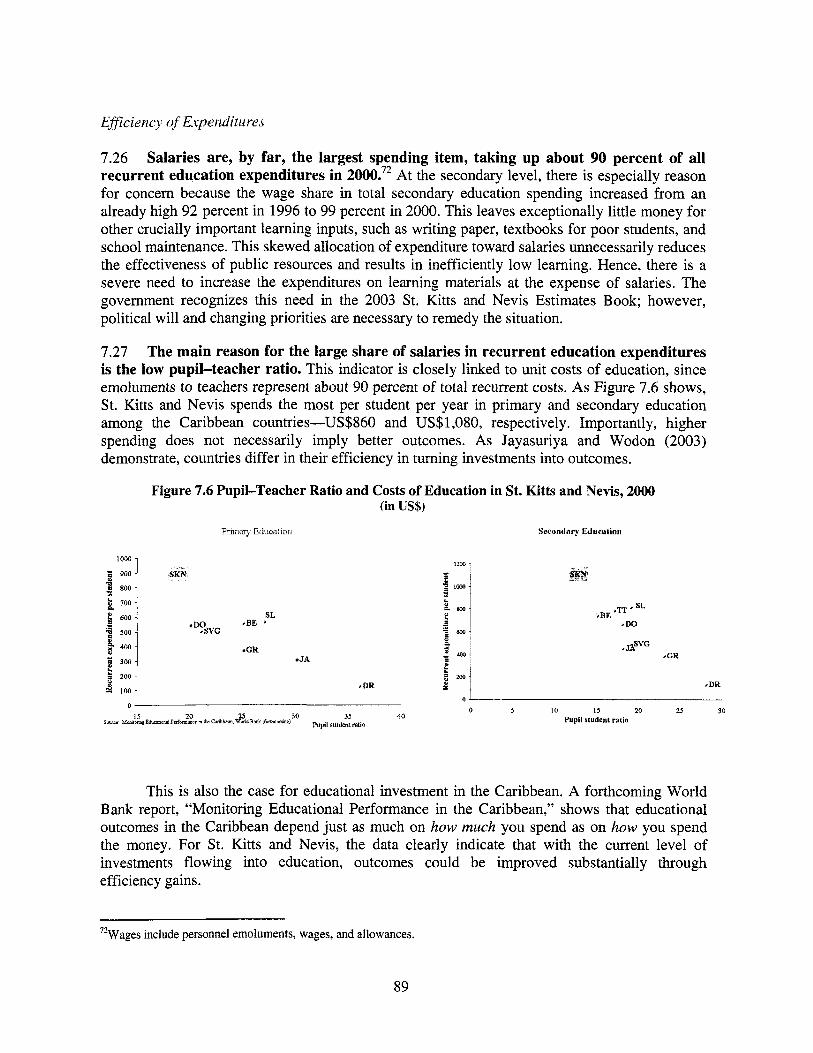
7.26 Salaries are, by far, the largest spending item, taking up about 90 percent of all recurrent education expenditures in 2000?* At the secondary level, there i s especially reason for concern because the wage share in total secondary education spending increased from an already high 92 percent in 1996 to 99 percent in 2000. This leaves exceptionally l i t t le money for other crucially important learning inputs, such as writing paper, textbooks for poor students, and school maintenance. Th is skewed allocation of expenditure toward salaries unnecessarily reduces the effectiveness of public resources and results in inefficiently low learning. Hence, there i s a severe need to increase the expenditures on learning materials at the expense o f salaries. The government recognizes this need in the 2003 St. Kitts and Nevis Estimates Book; however, political w i l l and changing priorities are necessary to remedy the situation.
700 - 2 600 -
; 5 0 0 -
400-
a 3 0 0 - t B 2 0 0 - 8 p: 100-
7.27 The main reason for the large share of salaries in recurrent education expenditures is the low pupil-teacher ratio. T h i s indicator i s closely linked to unit costs o f education, since emoluments to teachers represent about 90 percent o f total recurrent costs. As Figure 7.6 shows, St. Kitts and Nevis spends the most per student per year in primary and secondary education among the Caribbean countries--US$860 and US$l,OSO, respectively. Importantly, higher spending does not necessarily imply better outcomes. As Jayasuriya and Wodon (2003) demonstrate, countries differ in their efficiency in turning investments into outcomes.
Figure 7.6 Pupil-Teacher Ratio and Costs of Education in St. Kith and Nevis, 2000 (in US$)
Pisisiq ~ ~ I i m , ~ ~ s o r i Secondary Elluaition
1000 ,
SL DO *BE ‘
ePVG
GR JA
*DR
,BE ,TT ’ sL I DO
, JAS” GR
* DR
0 ’ 0 0 5 10 15 20 25 30
Pupil student ratio 20 25 30 35 40 Seulse Mm%gEdunnadP&m~icr rnhr Canbbcan. WddBakt&en& studentratio
T h i s i s also the case for educational investment in the Caribbean. A forthcoming World Bank report, “Monitoring Educational Performance in the Caribbean,” shows that educational outcomes in the Caribbean depend just as much on how much you spend as on how you spend the money. For St. Kitts and Nevis, the data clearly indicate that with the current level o f investments flowing into education, outcomes could be improved substantially through efficiency gains.
7’Wages include personnel emoluments, wages, and allowances.
89
7.28 Overall, the government of St. Kitts and Nevis manages teacher staff in an inefficient manner. In primary and secondary education, there are, on average, 18 and 13 pupils per teacher, respectively. This teacher deployment i s tremendously inefficient. If these indicators were raised to the average Caribbean level, 25 and 18 pupils per teacher in primary and secondary education, respectively, the government would save about EC$2.3 mill ion (6 percent of the recurrent education budget). This saving presupposes a shedding o f 117 teacher positions, through either attrition or layoffs, which would become redundant following reforms aimed at a more effective provision of education.73 One important element in the rationalization o f teacher staff i s an evaluation o f the advisability for the high number of so-called supernumerary teachers, 142 positions in 2002. The supernumerary teachers make up close to hal f the teacher force in primary education and a quarter in secondary education. According to the Ministry of Education, the majority o f these teachers are substituting for other teachers on study leave, which explains the finding o f a regional low pupil-teacher ratio, and suggests major savings are possible through strengthening lax teacher management.
7.29 Among the initiatives that the government could consider to increase the pupil- teacher ratio to lead to efficiency and quality improvements in the teacher deployment are:
e Merging of primary schools. Inefficient use o f teachers takes place predominantly at smaller primary schools. A merging of schools based on school mapping exercises to examine bussing options for children from small villages and future demand for schooling, would allow the system to exploit the economies o f scale in the education system and reduce costs, while increasing quality.
e Instituting a curriculum reform of secondary education. A common core curriculum for the f i rs t three forms in secondary would reduce the excessive offering o f subjects o f a specialized nature, such as typewriting, auto mechanics, and metalwork, and would lead to larger classes. Further, such a reform could be combined with a modernization o f offered courses that equip pupils with more sk i l ls that are relevant for today’s labor market. Such a reform i s underway in an OECS context, but implementation has been lagging .74
e Mandating of a minimum floor on class size at the primary and secondary level. Many schools, in particular at the secondary level, offer subjects with low demand, leading to small class sizes and high costs. Mandating a minimum class size of, for instance, 15-a rule that i s in place in many developed countries-would increase efficiency.
73 The savings in primary education would arise from a reduction in established teacher positions from the 2002 level of 296 to 232, the level needed with a pupil-teacher ratio of 1 to 25. The average wage of a primary or secondary education teacher remunerated in the wage categories (K10-2 1) i s EC$I9,260. From secondary education, the saving arises from a reduction of established positions from 309, the 2002 level, to 256, the level required at a pupil-teacher ratio of 18. This saving does not take into account the cost of retrenchment.
74 Besides improving efficiency through larger classes, a common curriculum within OECS could lead to further efficiency gains through common regional exams during the course of secondary education, collective textbook purchases, and sharing of teachers.
90
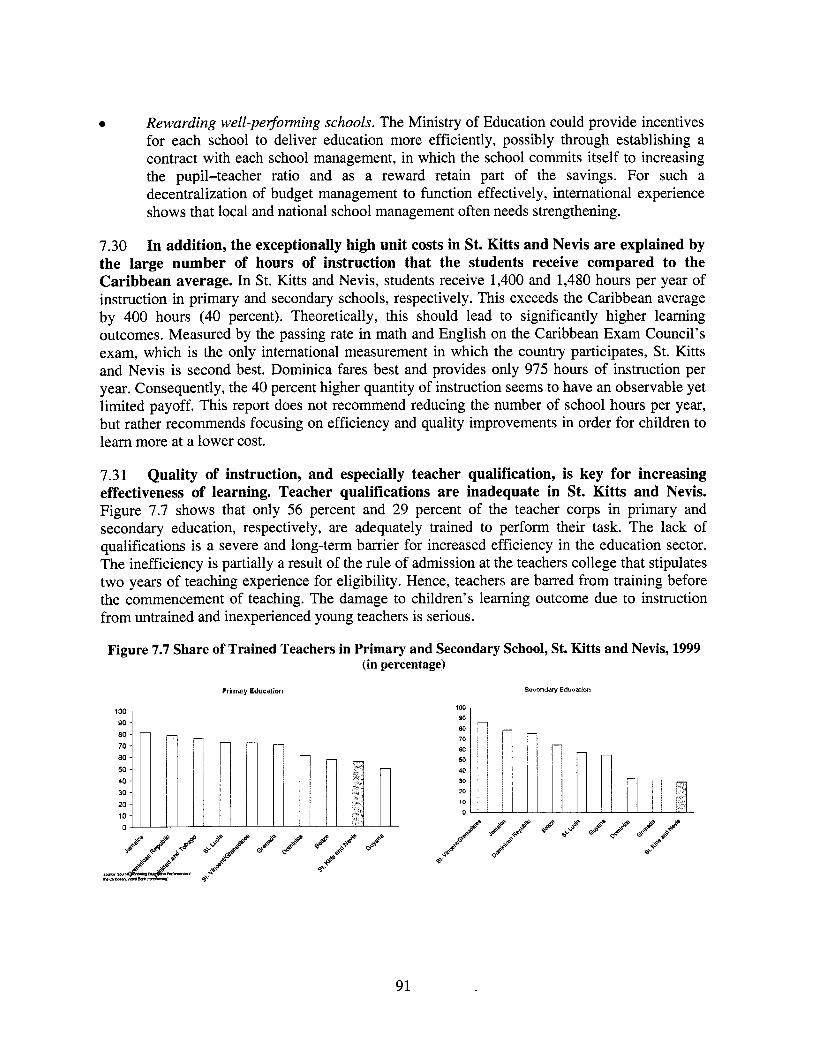
a Rewarding well-per$orming schools. The Ministry of Education could provide incentives for each school to deliver education more efficiently, possibly through establishing a contract with each school management, in which the school commits itself to increasing the pupil-teacher ratio and as a reward retain part of the savings. For such a decentralization o f budget management to function effectively, international experience shows that local and national school management often needs strengthening.
7.30 In addition, the exceptionally high unit costs in St. Kitts and Nevis are explained by the large number of hours of instruction that the students receive compared to the Caribbean average. In St. Kitts and Nevis, students receive 1,400 and 1,480 hours per year of instruction in primary and secondary schools, respectively. This exceeds the Caribbean average by 400 hours (40 percent). Theoretically, th i s should lead to significantly higher learning outcomes. Measured by the passing rate in math and English on the Caribbean Exam Council's exam, which i s the only international measurement in which the country participates, St. Kitts and Nevis i s second best. Dominica fares best and provides only 975 hours o f instruction per year. Consequently, the 40 percent higher quantity of instruction seems to have an observable yet limited payoff. T h i s report does not recommend reducing the number of school hours per year, but rather recommends focusing on efficiency and quality improvements in order for children to learn more at a lower cost.
7.3 1 Quality of instruction, and especially teacher qualification, i s key for increasing effectiveness of learning. Teacher qualifications are inadequate in St. Kitts and Nevis. Figure 7.7 shows that only 56 percent and 29 percent o f the teacher corps in primary and secondary education, respectively, are adequately trained to perform their task. The lack o f qualifications i s a severe and long-term barrier for increased efficiency in the education sector. The inefficiency i s partially a result o f the rule o f admission at the teachers college that stipulates two years o f teaching experience for eligibility. Hence, teachers are barred from training before the commencement o f teaching. The damage to children's learning outcome due to instruction from untrained and inexperienced young teachers i s serious.
Figure 7.7 Share of Trained Teachers in Primary and Secondary School, St. Kith and Nevis, 1999 (in percentage)
100
Primary Education
80 70 BO 50 40 30 20
i o 0
Secondary Education
n
91
7.32 To improve and strengthen teacher qualifications, the government could consider:
Rethinking teacher training and hiring regulations. All graduates from secondary schools should be eligible for the teacher training college-regardless of prior teaching experience. To address the lack of teaching experience, a mentoring program could be introduced as an element o f teacher training.
a Additionally, the government could stipulate that in the f i ture only certified teachers wil l qualify for open positions. This would prevent the quality of the teacher corps from deteriorating further.
To seriously address the shortfall of training, a major retraining program of the existing teaching stafs could take place. Provided efficiency gains take place in the system, this would generate time for teachers to attend retraining courses.
92
8. SOCIAL PROTECTION PROGRAMS
8.1 Social protection programs are public interventions to assist the most vulnerable groups of society with the ob’ective o f ensuring a minimum level of welfare for individuals, households, and c ~ m m u n i t i e s ? ~ ~ ~ ~ T h e most common social protection tools to address the social risks o f vulnerable groups are social insurance and social assistance.
e Social insurance consists of mechanisms that pool social risks across population groups, such as pension, unemployment, or health insurance programs.
0 Social assistance programs are designed to help the poor and vulnerable individuals and households cope with temporary or chronic poverty by providing income support and access to basic services. Social assistance programs aim to address the specific needs o f groups at risk, and include a variety of programs such as cash and in-kind transfers, subsidies, workfare, public works, housing programs, and social funds.
8.2 Social protection programs in St. Kitts and Nevis emphasize risk-coping strategies; that is, programs to help households cope with the effects o f risk (especially poverty) rather than prevention and mitigation strategies. Moreover, the existing system i s not well poised to respond to either economic downturns or natural disasters. Targeting and distribution systems that can be geared up quickly during crisis periods are required.
8.3 Several programs, including the school lunch program for primary students and a school bus service for secondary students, are not targeted and are provided cost free irrespective o f income. In St. Kitts, health care subsidies are targeted based on categorical criteria (children, elderly, disabled) rather than income.
8.4 Since the mid-l990s, social protection expenditures in St. Kitts and Nevis have been on average approximately 3.5 percent o f GDP. Although below the average for the Latin America and the Caribbean Region, any effort to strengthen social protection cannot include costly new programs given the difficult fiscal position that the St. Kitts and Nevis government i s facing.
8.5 This chapter identifies vulnerable groups, describes the social protection strategy and programs o f the Federation, reviews social assistance and social insurance spending, and suggests policy recommendations for strengthening social protection in St. Kitts and Nevis.
75 I t i s important to note at the outset that very little social protection sector work had been undertaken in St. Kitts and Nevis before this report. Further, there are over 20 social protection programs implemented by five different ministries and agencies in St. Kim, and a parallel set o f programs operated with separate administrative and budget systems in Nevis. This made programs hard to identify, and collection o f complete times series data on expenditures and beneficiaries impossible. Despite these constraints, considerable progress was made in identifying social protection programs, expenditures, and key issues.
76 This chapter examines current spending on social protection programs. Except for Upgrading of Daycare Centers with BNTF funding (EC$22,000 in 1999 and EC$700,000 in 2000), capital expenditures on social protection are limited to low-income housing programs. I t was decided not to include capital expenditures for low-income housing programs because, as reported by program directors, these differ enormously from the reported PSIP expenditures and, as implemented currently, are not targeted to the poor or most vulnerable.
93
8.6 summarized as follows:
The main recommendations to strengthen social protection programs can be
a On Social Protection Programs o Strengthen targeting of systems for social assistance, in particular, for income transfers
and the Student Education and Learning Funds (SELF), and introduce cost sharing for programs that are not currently means tested, including health care services in St. Kitts and the School Feeding Program, with cost recovery from those who can afford it and targeted fee waivers for those who cannot.77
Identify strategies for using social protection programs to promote human capital development-possibilities include introduction of conditional cash transfer and/or conditionalities into SELF.
Reduce administrative costs by merging or eliminating categories o f social assistance that are a duplication of programs already in place (for example, sk i l ls training programs) and by exploring alternative administrative strategies, including private sector provision o f sk i l ls training.
Assess the government post-hurricane public employment programs to ensure that they support Government’s social protection strategies.
Expand coverage o f the Social Security Scheme (SSS) and undertake an actuarial review to determine the fiscal viability o f the SSS and the Severance Fund.
o
o
o
o
a On Institutional Reforms o Develop a social protection strategy. This would require sectorwide planning; that is, all
ministries and agencies responsible for implementing social protection programs would come together to identify social protection priorities and coordinated strategies to address these priorities.
Develop a more effective and efficient system to identify beneficiaries, including mechanisms to target households and communities (poverty maps).78
Implement regular household surveys to assess poverty levels, incidence, and coverage o f social safety net programs that could be used to assist in the development o f targeting systems.
Improve labor market data to make labor market programs more responsive to the requirements o f the labor market.
Enhance fiscal accountability through introduction o f program budgeting for social protection programs not currently identified as programs in the budget, such as social public assistance and ski l ls training programs.
o
o
o
o
77 A means test i s an appraisal o f household income and assets to determine whether a household qualifies for program benefits.
78 Despite the small size o f St. Kitts and Nevis, there are considerable geographic differences in poverty rates. In St. Kitts, three of the nine parishes account for 70 percent o f al l the poor. In Nevis, St. George parish accounts for 43 percent o f the poor.
94
8.7 Reducing program leakage (from SELF and other targeted programs) and introducing targeting of school feeding and allowing few waivers for health services to the poor, would considerably ease budgetary pressure. Divestment of programs could also result in cost savings. However, capacity building and institution strengthening, including development of targeting, management information systems (MIS), and survey capacity, have their own development and administrative costs. Expanding program coverage with provision o f benefits conditional on activities that promote human capital also comes with i ts own investment costs. The net fiscal impact o f the above reforms would need to be carefully assessed.
I. ST. KITTS AND NEVIS SOCIAL PROTECTION STRATEGY AND PROGRAMS
Social Protection Srrcrtegy in St. Kitt,s aiid Nevis
8.8 The government of St. Kitts and Nevis has adopted a social protection strategy designed to ensure access to health care and primary education and to expand access to secondary and tertiary education.” Health care i s heavily subsidized and there i s no requirement for cost sharing in education. The government also attempts to ensure that other programs and services (including income support, food, clothing, housing, and utilities) are available for the poor. A Social Security Board provides retirement, disability, illness, and maternity benefits to people who have contributed to the social security scheme, and administers a noncontributory old age and invalid pension program. Training programs for disadvantaged job seekers are provided. In addition, the government identifies tax holiday measures for the tourism industry as an element o f i t s overall social protection strategy in that tax holidays are viewed as an employment-generation mechanism.
8.9 Social protection programs are directed primarily at children, the elderly (62 years old and over), and the chronically ill or disabled. Single-parent households, unemployed youth, or people who face economic downturns-especially those in the sugar industry and those who have suffered the effects o f natural disasters-are also targeted.
8.10 This stated, the existing social protection strategy is not clearly articulated or well coordinated. There i s an array of programs in both St. Kitts and Nevis with l i t t le coordination among programs within or between islands. With the exception o f the Social Security Program, programs are financed and administered separately by the two islands. There i s recognition o f the need to better coordinate social protection programs. Responsibility for coordination has been assigned to the Ministry o f Social Development, Community, and Gender Affairs through the Council for Human and Social Development (COHSOD). However, the primary objective o f COHSOD i s to address priorities identified by CARICOM, and the committee i s not specifically mandated to coordinate social programs in St. Kitts and Nevis. Although the government has expressed i t s intent to better coordinate i ts social protection programs, a mechanism to oversee the development of an integrated social protection strategy and a rationalized set o f programs i s required.
’’ Both as a federation and as separate island states.
95
8.11 The result i s that social protection priorities are not clearly identified and fiscal prioritization of programs is lacking. This i s reflected in the budgetary process during which budgets are essentially determined by previous budget allocations and not in response to changing needs and priorities.
Social Protection Programs and Expenditures in St. Kitts and Nevis, 2000
8.12 St. Kitts and Nevis implements an array of social protection programs including:
0 Social insurance programs. Social Security, a contributory pension, disability and sickness fund; and the Severance Fund, which provides severance benefits to workers retrenched from the private sector. Social assistance programs. Social and Public Assistance, means-tested income transfer programs, School Feeding Programs, and the SELF for needy students, sk i l ls training and adult education programs, microenterprise development programs, and fee waivers for medical care.
The key social protection programs are summarized in Table 8.1. Appendix C presents a detailed description o f social protection programs in St. Kitts and Nevis.
Social I i u u runce Program
8.13 The Social Security Scheme accounts for the largest share in total social protection expenditures (68 percent). The Social Security Scheme (based on contributions) covers employed and self-employed people, including public employees. I t provides benefits for retirement, temporary illness, disability, maternity, employment-related injuries, medical and funeral expenses, and funds a noncontributory pension and invalid assistance program with eligibility subject to a means test. The contributory scheme with total expenditures equal to US$8.3 mill ion (or EC$22.5 million) in 2000 i s b y far the largest social protection program in terms of both expenditures and beneficiaries. The program provided benefits to approximately 8,700 people and absorbed over two-thirds o f the social protection budget in 2000. Approximately 30 percent of the elderly population o f St. Kitts and Nevis received retirement benefits. In comparison, expenditures on the targeted noncontributory pension program were equal to US$0.7 million (EC$ 1.8 million).
8.14 The Severance Fund i s targeted to employees who have been retrenched from the private sector and provides a one-off benefit. I t s objective i s to mitigate shocks caused by private sector downsizing. The fund i s funded from a 1 percent employer-paid tax on the payroll of registered enterprises. The tax i s collected by the Social Security Board and transferred to the consolidated fund for administration by the Department o f Labor. Information on expenditures and number of claimants was not available. Moreover, reviews or evaluations o f the program have not been undertaken.
Social Assistance Progrnms
8.15 Income Support Programs represent the second-largest share in total social protection expenditures (16 percent). Community, social, youth, and development programs
96

represent 10 percent o f total expenditures, or US$1.3 mill ion (EC$3.4 million).80 These programs include targeted cash transfers, school uniforms, food vouchers, community assistance for the elderly, and gender- and community-based training programs. The other 6 percent of total expenditures belongs to the noncontributory pension program.
8.16 Education-based welfare programs account for the third-largest share in total social protection expenditures (8.3 percent). The main education-based programs implemented in both St. Kitts and in Nevis are the School Feeding Programs and SELF. Both islands also implement a variety o f other education-based social protection programs, including nontargeted school bus service for secondary students, targeted scholarships, and uniforms.
8.17 The St. Kitts School Feeding Program provides a centrally prepared free lunch to all primary school students, and to needy secondary school students. In Nevis, the program provides a meal or snack at all government preschools and primary schools. In 2000, combined recurrent expenditures on the School Feeding Program were estimated at US$0.7 mill ion (EC$1.8 million), with approximately 4,500 students receiving meals in St. Kitts and 585 in Nevis.
8.18 The Student Education and Learning Fund (SELF), implemented and financed separately in St. Kitts and in Nevis, provides assistance with textbooks, examination fees, and uniforms for needy secondary and tertiary students.8' Total expenditures were equal to US$0.2 mill ion in fiscal 2000 (EC$0.6 million). The program i s estimated to serve less than one- third o f needy students. Preliminary data from the 1999 Poverty Assessment Report indicate that the program i s poorly targeted, with 15 percent o f students in St. Kitts in the f i rs t quintile (the poorest) and 10 percent of students in the fifth quintile (the richest) reporting that they received free schoolbooks. Both islands implement a variety o f other education-based social protection programs, including target scholarship programs, school bus services, and uniform and book programs.
8.19 Health-based welfare programs represent only a small share of social protection expenditures (1 percent), not including the value of health subsidies in St. Kitts. St. Kitts and Nevis has adopted very different approaches to the provision o f health subsidies. In St. Kitts, fee waivers for medical care and pharmaceuticals are provided to all children, pregnant and lactating women, people aged 62 and over, and people with chronic illnesses. In contrast, Nevis provides means-tested fee waivers and transportation allowances for medical care. The expenditure implications o f these different approaches are dramatic. Although it i s impossible to estimate the full extent o f the subsidies in St. Kitts, they are considerable. A proposal to means test the fee waivers in St. Kitts (using the l ists of beneficiaries under the Social Assistance Program) has been approved by the Ministers o f Health and Finance, and i s currently before the Cabinet.
Ministry-level expenditure data are reported because program-level expenditure data were not available. However, changing portfolio responsibility for programs made it necessary to report the programs together because in some years they fell under the administrative and budget responsibility o f the ministry that implements the cash transfer programs.
'' Before 2001, the SELF program in Nevis was financed from the central budget o f St. Kitts and Nevis. SELF was introduced as a separate program in the Nevis budget in 2001, with an estimated allocation of EC$25,000.
97
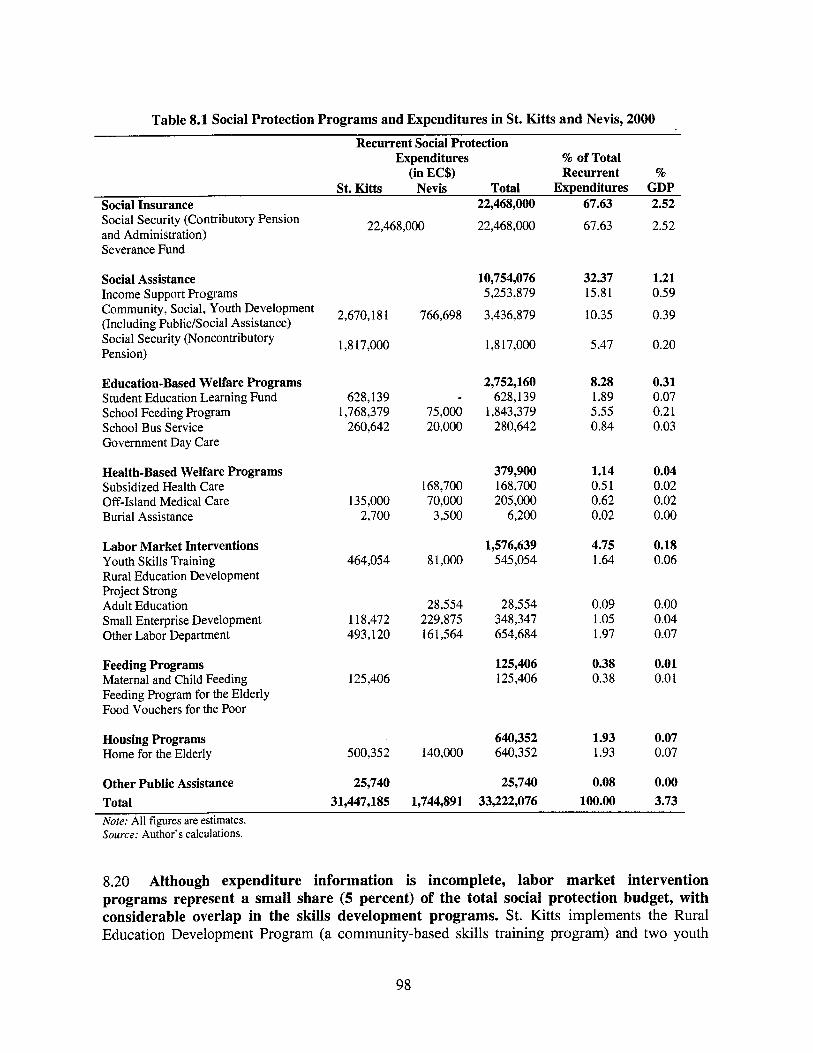
Table 8.1 Social Protection Programs and Expenditures in St. Kitts and Nevis, 2000 Recurrent Social Protection
Expenditures % of Total
St. Kitts Nevis Total Expenditures GDP (in EC$) Recurrent %
Social Insurance 22,468,000 67.63 2.52 Social Security (Contributory Pension and Administration) Severance Fund
Social Assistance Income Support Programs Community, Social, Youth Development (Including Public/Social Assistance) Social Security (Noncontributory Pension)
Education-Based Welfare Programs Student Education Learning Fund School Feeding Program School Bus Service Government Day Care
Health-Based Welfare Programs Subsidized Health Care Off-Island Medical Care Burial Assistance
Labor Market Interventions Youth Skil ls Training Rural Education Development Project Strong Adult Education Small Enterprise Development Other Labor Department
Feeding Programs Maternal and Child Feeding Feeding Program for the Elderly Food Vouchers for the Poor
Housing Programs Home for the Elderly
Other Public Assistance Total
22,468,000
2,670,18 1
1,8 1 7,000
628,139 1,768,379
260,642
135,000 2,700
464,054
118,472 493,120
125,406
500,352
25,740 31,447,185
766,698
75,000 20,000
168,700 70,000 3,500
8 1,000
28,554 229,875 16 1,564
140,000
1,744,891
22,468,000
10,754,076 5,253,879
3,436,879
1,8 17,000
2,752,160 628,139
1,843,379 280,642
379,900 168,700 205,000
6,200
1,576,639 545,054
28,554 348,347 654,684
125,406 125,406
640,352 640,352
25,740 33,222,076
67.63
32.37 15.81
10.35
5.47
8.28 1.89 5.55 0.84
1.14 0.5 1 0.62 0.02
4.75 1.64
0.09 1.05 1.97
0.38 0.38
1.93 1.93
0.08 100.00
2.52
1.21 0.59
0.39
0.20
0.31 0.07 0.2 1 0.03
0.04 0.02 0.02 0.00
0.18 0.06
0.00 0.04 0.07
0.01 0.0 1
0.07 0.07
0.00 3.73
Note: Al l figures are estimates. Source: Author’s calculations.
8.20 Although expenditure information is incomplete, labor market intervention programs represent a small share (5 percent) of the total social protection budget, with considerable overlap in the skills development programs. St. K i t ts implements the Rural Education Development Program (a community-based skil ls training program) and two youth
98
sk i l ls programs-the Youth Skil ls Program and Project Strong Program. Nevis implements an Adult Education and Ski l ls Training Program and the Woman’s Training Program. Both islands support microenterprise development programs through their Small Enterprise Development Units.
8.21 Both islands identify low-income housing programs among their menu of social protection programs; however, these programs exclude low-income people by virtue of their income and mortgage requirements. Other housing programs for the poor include housing repair programs and old age homes for the elderly poor and disabled. Expenditure and beneficiary data were not available for the housing repair programs. Expenditures on homes for the elderly, admission to which i s based on a means test, were equal to US$0.2 mi l l ion (EC$0.6 million) in fiscal 2000, with 100 residents in St. Kitts and 30 in Nevis.
Plmiiing and Excmting Cupacily~fiw Social Protectioii Progruins
8.22 The large number of programs, each with separate administrative systems and procedures, strain an already overburdened public sector. The lack o f coordinated efforts across ministries and departments has resulted in overlaps, duplication, inefficiencies, and administrative waste. To the degree that they serve the elderly, Social and Public Assistance and noncontributory Social Security target the same group. Moreover, Social Security, the Social and Public Assistance programs, SELF, and the Ministry o f Health all have different systems for identifying beneficiaries. T h i s increases administrative and time costs for beneficiaries. There i s a need to strengthen the planning and executing capacity of these programs and to put in place mechanisms for their fiscal prioritization.
8.23 Effective planning will require updated poverty and labor market information at regular intervals. Timely and reliable information on poor and vulnerable groups i s essential for the design and implementation o f social safety net programs. The CDB-financed Poverty Assessment that was conducted in 1999 provided useful information; however, data on poverty and labor markets need to be collected on a regular basis.
8.24 Budgeting and management information systems need to be strengthened. Several programs, including cash transfer programs and labor market programs, are not identified in the government’s budgets as separate programs. This limits effective planning and weakens fiscal accountability. Elevating social protection programs to program status would mean that expenditures, including expenditures by object code, could be easily tracked over time and evaluated with respect to program inputs and outcomes. In addition, management information systems are not computerized.
8.25 Regional initiatives to build information systems, data collection, and analysis capacity could address the human resource constraints and reduce the overall costs of development and implementation of monitoring and information systems. Inadequate MIS systems and capacity constraints with respect to data collection, monitoring, and evaluation are common across the OECS. Regional approaches to MIS development and monitoring and evaluation capacity building would address the human resource constraints in individual countries and would be more cost-effective than developing systems on a country-by-country basis.
99
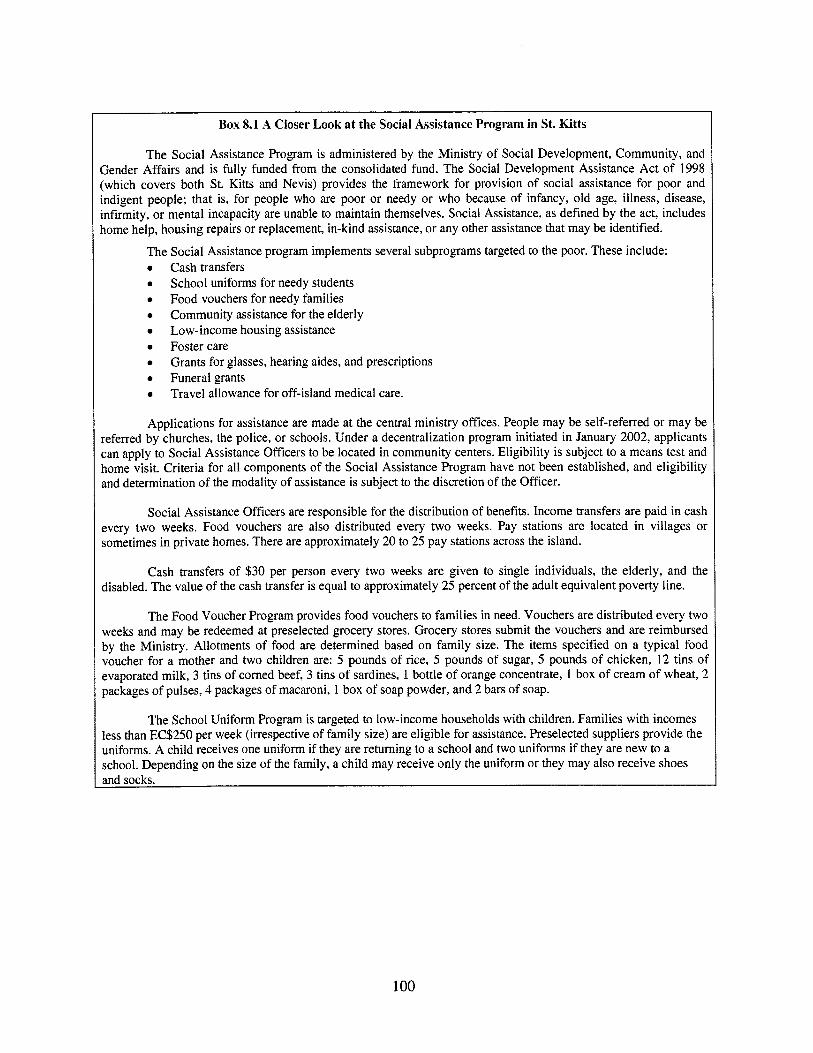
I Box 8.1 A Closer Look at the Social Assistance Program in St. Kitts
The Social Assistance Program i s administered by the Ministry of Social Development, Community, and Gender Affairs and i s fully funded from the consolidated fund. The Social Development Assistance Act o f 1998 (which covers both St. Kitts and Nevis) provides the framework for provision o f social assistance for poor and indigent people; that is, for people who are poor or needy or who because of infancy, old age, illness, disease, infirmity, or mental incapacity are unable to maintain themselves. Social Assistance, as defined by the act, includes home help, housing repairs or replacement, in-kind assistance, or any other assistance that may be identified.
The Social Assistance program implements several subprograms targeted to the poor. These include: 0 Cash transfers 0
0
0
0 Low-income housing assistance 0 Foster care 0
0 Funeral grants 0
Applications for assistance are made at the central ministry offices. People may be self-referred or may be referred by churches, the police, or schools. Under a decentralization program initiated in January 2002, applicants can apply to Social Assistance Officers to be located in community centers. Eligibility i s subject to a means test and home visit. Criteria for all components of the Social Assistance Program have not been established, and eligibility and determination o f the modality of assistance is subject to the discretion of the Officer.
School uniforms for needy students Food vouchers for needy families Community assistance for the elderly
Grants for glasses, hearing aides, and prescriptions
Travel allowance for off-island medical care.
Social Assistance Officers are responsible for the distribution of benefits. Income transfers are paid in cash every two weeks. Food vouchers are also distributed every two weeks. Pay stations are located in villages 01 sometimes in private homes. There are approximately 20 to 25 pay stations across the island.
Cash transfers o f $30 per person every two weeks are given to single individuals, the elderly, and t h e disabled. The value of the cash transfer i s equal to approximately 25 percent of the adult equivalent poverty line.
The Food Voucher Program provides food vouchers to families in need. Vouchers are distributed every twc weeks and may be redeemed at preselected grocery stores. Grocery stores submit the vouchers and are reimbursed by the Ministry. Allotments o f food are determined based on family size. The items specified on a typical food voucher for a mother and two children are: 5 pounds of rice, 5 pounds of sugar, 5 pounds of chicken, 12 tins oi evaporated milk, 3 tins o f corned beef, 3 tins o f sardines, 1 bottle o f orange concentrate, 1 box of cream o f wheat, 2 packages o f pulses, 4 packages of macaroni, 1 box of soap powder, and 2 bars of soap.
The School Uniform Program i s targeted to low-income households with children. Families with incomes less than EC$250 per week (irrespective of family size) are eligible for assistance. Preselected suppliers provide the uniforms. A child receives one uniform if they are returning to a school and two uniforms if they are new to a school. Depending on the size o f the family, a child may receive only the uniform or they may also receive shoes
I andsocks.
100
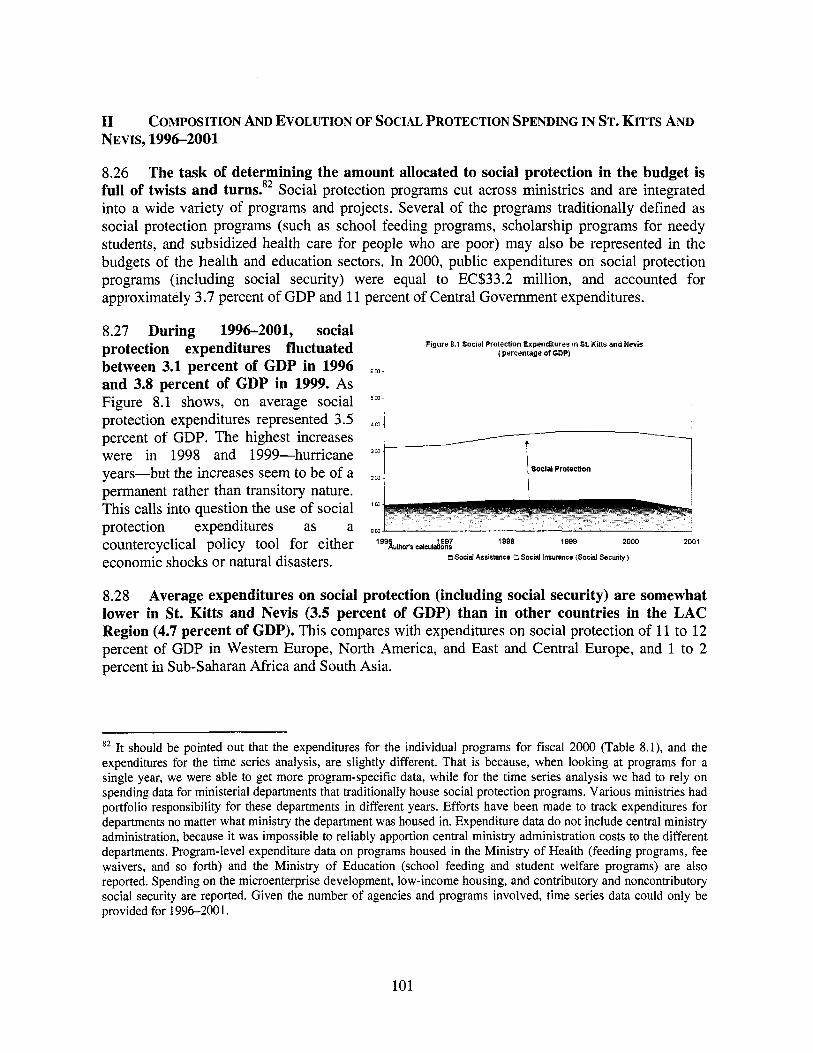
11 COMPOSITIoN AND EVOLUTION OF SOCIAL PROTECTION SPENDING IN ST. KITTS AND NEVIS, 1996-2001
6 O i -
503 -
4m.
8.26 The task of determining the amount allocated to social protection in the budget i s full of twists and turns.** Social protection programs cut across ministries and are integrated into a wide variety of programs and projects. Several o f the programs traditionally defined as social protection programs (such as school feeding programs, scholarship programs for needy students, and subsidized health care for people who are poor) may also be represented in the budgets of the health and education sectors. In 2000, public expenditures on social protection programs (including social security) were equal to EC$33.2 million, and accounted for approximately 3.7 percent o f GDP and 11 percent of Central Government expenditures.
8.27 During 1996-2001, social protection expenditures fluctuated between 3.1 percent of GDP in 1996 and 3.8 percent of GDP in 1999. As Figure 8.1 shows, on average social protection expenditures represented 3.5 percent of GDP. The highest increases were in 1998 and 1999-hurricane years-but the increases seem to be o f a permanent rather than transitory nature. T h i s calls into question the use o f social protection expenditures as a countercyclical policy tool for either economic shocks or natural disasters.
Figure 8.1 Social Protection Expenditures in S t Kitts and Nevis (percentage at GDP)
1M
OM
1888 1888 2000 2001 189wYmots ealcui&2 ElSocial Assistance 0 Social Insurance (Social Security)
8.28 Average expenditures on social protection (including social security) are somewhat lower in St. Kitts and Nevis (3.5 percent of GDP) than in other countries in the LAC Region (4.7 percent of GDP). T h i s compares with expenditures on social protection o f 11 to 12 percent of GDP in Western Europe, North America, and East and Central Europe, and 1 to 2 percent in Sub-Saharan Africa and South Asia.
82 I t should be pointed out that the expenditures for the individual programs for fiscal 2000 (Table S.l), and the expenditures for the time series analysis, are slightly different. That i s because, when looking at programs for a single year, we were able to get more program-specific data, while for the time series analysis we had to rely on spending data for ministerial departments that traditionally house social protection programs. Various ministries had portfolio responsibility for these departments in different years. Efforts have been made to track expenditures for departments no matter what ministry the department was housed in. Expenditure data do not include central ministry administration, because i t was impossible to reliably apportion central ministry administration costs to the different departments. Program-level expenditure data on programs housed in the Ministry of Health (feeding programs, fee waivers, and so forth) and the Ministry o f Education (school feeding and student welfare programs) are also reported. Spending on the microenterprise development, low-income housing, and contributory and noncontributory social security are reported. Given the number of agencies and programs involved, time series data could only be provided for 1996-200 1.
101
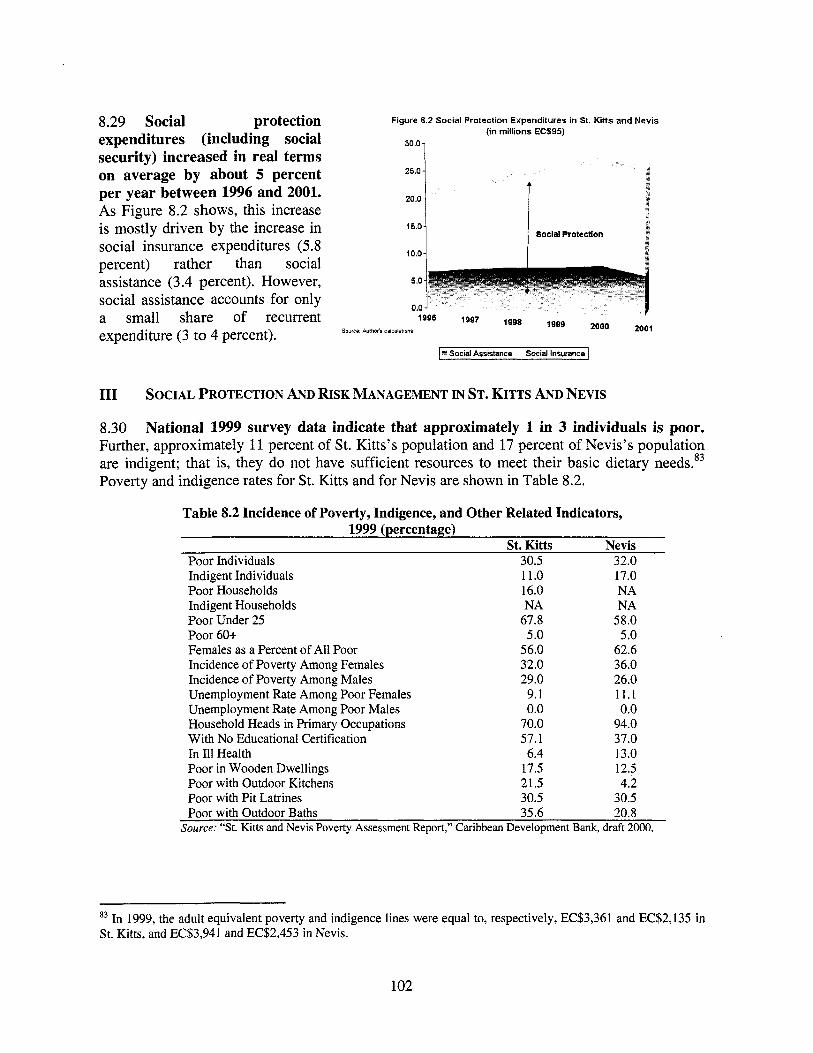
protection Figure 8.2 Social Protection Expenditures in St. Kitts and News (in millions ECF95)
8.29 Social
security) increased in real terms on average by about 5 percent
As Figure 8.2 shows, this increase
expenditures (including social 30.0
25.0 -
per year between 1996 and 2001.
social insurance expenditures (5.8 100-
20.0 -
150- i s mostly driven by the increase in Soclal Protection
percent) rather than social
social assistance accounts for only a small share o f recurrent expenditure (3 to 4 percent).
assistance (3.4 percent). However, 5.0-
0.0 -
Source Auihols sdculmons
1- Social Assistance Social Insurance
111 SOCIAL PROTECTION AND RISK MANAGEMENT IN ST. KITTS AND NEVIS
8.30 National 1999 survey data indicate that approximately 1 in 3 individuals i s poor. Further, approximately 11 percent of St. Kitts’s population and 17 percent o f Nevis’s population are indigent; that is, they do not have sufficient resources to meet their basic dietary needs.83 Poverty and indigence rates for St. Kitts and for Nevis are shown in Table 8.2.
Table 8.2 Incidence of Poverty, Indigence, and Other Related Indicators, 1999 (percentage)
St. Kitts Nevis Poor Individuals 30.5 32.0 Indigent Individuals Poor Households Indigent Households Poor Under 25 Poor 60+ Females as a Percent of All Poor Incidence o f Poverty Among Females Incidence of Poverty Among Males Unemployment Rate Among Poor Females Unemployment Rate Among Poor Males Household Heads in Primary Occupations With No Educational Certification In I11 Health Poor in Wooden Dwellings Poor with Outdoor Kitchens Poor with Pit Latrines
11.0 16.0 NA
67.8 5.0
56.0 32.0 29.0 9.1 0.0
70.0 57.1 6.4
17.5 21.5 30.5
17.0 NA NA
58.0 5 .O
62.6 36.0 26.0 11.1 0.0
94.0 37.0 13.0 12.5 4.2
30.5 Poor with Outdoor Baths 35.6 20.8
Source: “St. Kitts and Nevis Poverty Assessment Report,” Caribbean Development Bank, draft 2000.
83 In 1999, the adult equivalent poverty and indigence lines were equal to, respectively, EC$3,361 and EC$2,135 in St. Kitts, and EC$3,941 and EC$2,453 in Nevis.
102
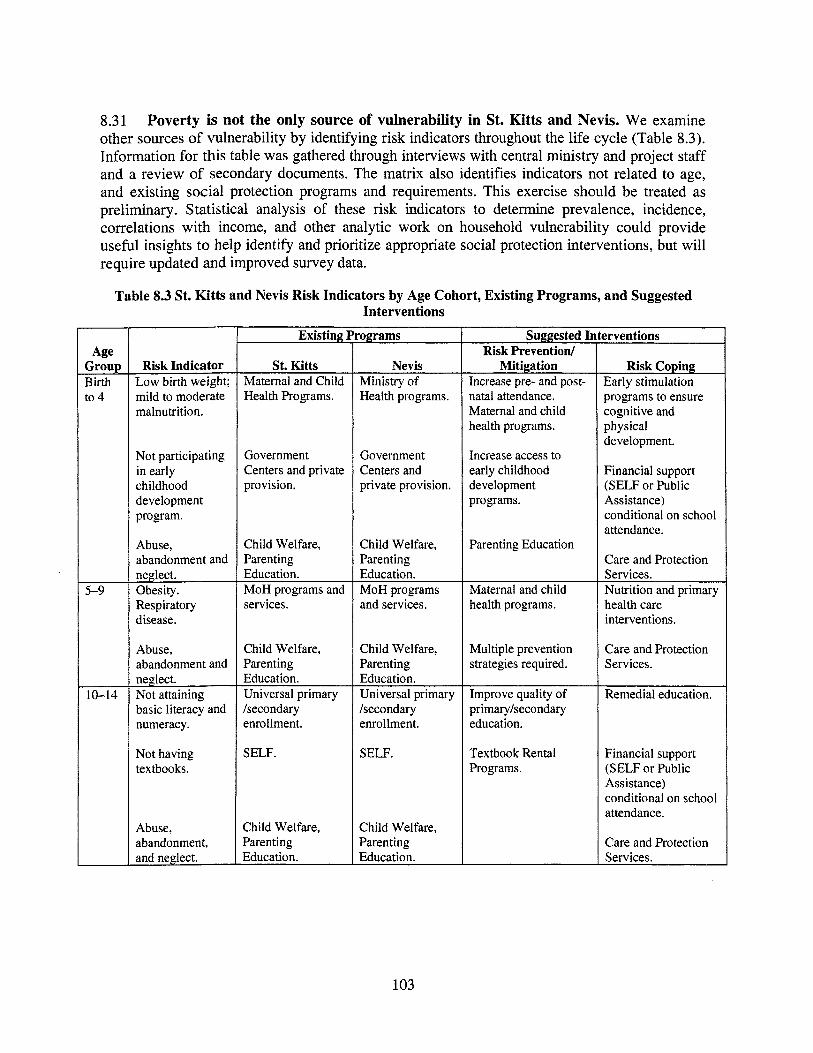
8.31 Poverty is not the only source of vulnerability in St. Kitts and Nevis. We examine other sources o f vulnerability by identifying risk indicators throughout the l ife cycle (Table 8.3). Information for this table was gathered through interviews with central ministry and project staff and a review o f secondary documents. The matrix also identifies indicators not related to age, and existing social protection programs and requirements. This exercise should be treated as preliminary. Statistical analysis of these risk indicators to determine prevalence, incidence, correlations wi th income, and other analytic work on household vulnerability could provide useful insights to help identify and prioritize appropriate social protection interventions, but w i l l require updated and improved survey data.
St. Kitts Maternal and Child Health Programs.
Government Centers and private provision.
Child Welfare, Parenting
Table 8.3 St. Kitts and Nevis Risk Indicators by Age Cohort, Existing Programs, and Suggested Interventions
Nevis Ministry o f Health programs.
Government Centers and private provision.
Child Welfare, Parenting
Age Group Birth to 4
Child Welfare, Parenting Education. Universal primary /secondary enrollment.
5-9
10-14
Child Welfare, Parenting Education. Universal primary /secondary enrollment.
Risk Indicator Low birth weight; mild to moderate malnutrition.
Not participating in early childhood development program.
Abuse, abandonment and neglect. Obesity. Respiratory disease.
Abuse, abandonment and neglect. Not attaining basic literacy and numeracy.
Not having textbooks.
Abuse, abandonment, and neglect.
Education. I Education. M o H programs and I M o H programs services. and services.
SELF. SELF.
Child Welfare, Child Welfare, Parenting Parenting
Suggested 11 Risk Prevention/
Mitigation Increase pre- and post- natal attendance. Maternal and child health programs.
Increase access to early childhood development programs.
Parenting Education
Maternal and child health programs.
Multiple prevention strategies required.
Improve quality of primarylsecondary education.
Textbook Rental Programs.
erventions
Risk Coping Early stimulation programs to ensure cognitive and physical development.
Financial support (SELF or Public Assistance) conditional on school attendance.
Care and Protection Services. Nutrition and primary health care interventions.
Care and Protection Services.
Remedial education.
Financial support (SELF or Public Assistance) conditional on school attendance.
Care and Protection Services.
103
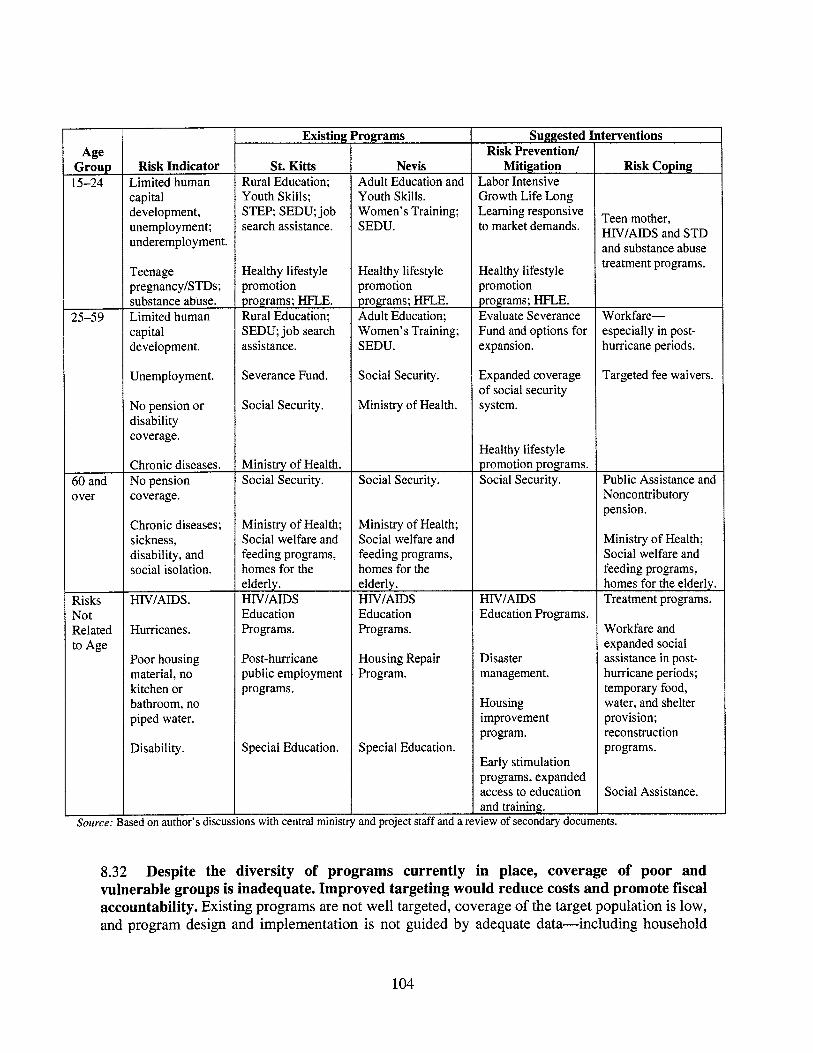
Age Group 15-24
25-59
60 and over
Risks No t Related to Age
Source:
Risk Indicator Limited human capital development, unemployment; underemployment.
Teenage pregnanc y/STDs ; substance abuse. Limited human capital development.
Unemployment.
N o pension or disability coverage.
Chronic diseases. N o pension coverage.
Chronic diseases; sickness, disability, and social isolation.
HIV/AIDS .
Hurricanes.
Poor housing material, no kitchen or bathroom, no piped water.
Disability.
sed on author’s discu:
Existing
St. Kitts Rural Education; Youth Skills; STEP; SEDU; job search assistance.
Healthy lifestyle promo t ion programs; HFLE. Rural Education; SEDU; j ob search assistance.
Severance Fund.
Social Security.
Ministry o f Health. Social Security.
Ministry o f Health; Social welfare and feeding programs, homes for the elderly. H IV/AIDS Education Programs.
Post-hurricane public employment programs.
Special Education.
’rograms
Nevis Adult Education and Youth Skills. Women’s Training; SEDU.
Healthy lifestyle promotion programs; HFLE. Adult Education; Women’s Training; SEDU.
Social Security.
Ministry o f Health.
Social Security.
Ministry o f Health; Social welfare and feeding programs, homes for the elderly. HIV/AIDS Education Programs.
Housing Repair Program.
Special Education.
Suggested Risk Prevention/
Mitigation Labor Intensive Growth L i fe Long Learning responsive to market demands.
Healthy lifestyle promotion programs; HFLE. Evaluate Severance Fund and options for expansion.
Expanded coverage o f social security system.
Healthy lifestyle promotion programs. Social Security.
HIV/AIDS Education Programs.
Disaster management.
Housing improvement program.
Early stimulation programs, expanded access to education and training.
:erventions
Risk Coping
reen mother, HIV/AIDS and S T D md substance abuse reatment programs.
Workfare- :specially in post- nurricane periods.
rargeted fee waivers.
Public Assistance and Noncontributory pension.
Ministry o f Health; Social welfare and feeding programs, homes for the elderlv. Treatment programs.
Workfare and expanded social assistance in post- hurricane periods; temporary food, water, and shelter provision; reconstruction programs.
Social Assistance.
ins with central ministry and project staff and a review of secondary documents.
8.32 Despite the diversity of programs currently in place, coverage of poor and vulnerable groups is inadequate. Improved targeting would reduce costs and promote fiscal accountability. Existing programs are not well targeted, coverage of the target population i s low, and program design and implementation i s not guided by adequate data-including household
104
and labor market information. Programs that could be targeted, such as School Feeding for primary students, are provided free of cost to all students.
8.33 Programs could do better at promoting human capital development initiatives. International experience suggests that a conditional cash transfer with benefits linked to health clinics or school attendance would be ideal, but given current capacity and financial constraints and the time required to establish these systems, it i s not at all clear that th i s should be the short- term priority. Alternative strategies, particularly the SELF program (the means-tested program to help to defray the out-of-pocket educational expenditures o f needy students) could be redesigned to better promote human capital development initiatives. Although it i s too early to draw conclusions, the St. Lucia model, in which a grant from Taiwan. China was used to capitalize a fund, with the interest earned used to finance student welfare programs, may also serve as a model to be replicated.
105

BIBLIOGRAPHY
Alesina, A., R. Hausman, R. Hommes, and E. Stein. 1996. “Bugget Institutions and Fiscal Performance in Latin America.” National Bureau of Economic Research, Working Paper No. 5586. Cambridge, MA, May.
Alesina, A., and R. Perotti. 1996. “Fiscal Adjustments in OECD Countries: Composition and Macroeconomic Effects.’’ National Bureau o f Economic Research, Working Paper No. 5730. Cambridge, MA, August.
Alesina, A., and R. Wacziarg. 1997. “Openness, Country Size and the Government.” National Bureau of Economic Research, Working Paper No. 6024. Cambridge, MA, April.
Baxter, M., and R. G. King. 1999. “Measuring Business Cycle: Appropriate Band-Pass Filters for Economic Time Series.” Review of Economic Studies, November, :575-93.
Beveridge, Stephen, and Charles R. Nelson. 1981. “A New Approach to the Decomposition o f Economic Time Series into Permanent and Transitory Components with Particular Attention to Measurement of the ‘Business Cycle’ .” Journal of Monetary Economics, March, : 151-74.
Blanchard, 0. 1990. “Suggestions for a New Set o f Fiscal Indicators.” Organization for Economic Cooperation and Development, Department o f Economics and Statistics, Working Papers No. 79. Paris, April.
Blanchard, O., J. C. Chouraqui, and R. Hagemann. 1990. “Sustainability o f Fiscal Policy: New Answers to an Old Question.” OECD Economic Studies, (15). Organization for Economic Cooperation and Development. Paris, Autumn.
Brown, E. C. 1956. “Fiscal Policy in the Thirties: A Reappraisal.’’ American Economic Review, December, :857-79.
Buiter, Willem H. 1993. “Measurement o f the Public Sector Deficit and Its Implications for Policy Evaluation and Design.” In Mario I. Blejer and Adrienne Cheasty, eds., How to Measure the Fisca2 Deficit. Washington, D.C.: International Monetary Fund.
Chouraqui, J. C., R. Hagemann, and N. Sartor. 1990. “Indicators o f Fiscal Policy: A Reexamination.” Organization for Economic Cooperation and Development, Department of Economics and Statistics, Working Paper No. 78. Paris.
Crucini, M. 1997. “Country Size and Economic Fluctuations.” Review of International Economics, May, :204-20.
D e Ferranti, D., G. Perry, 1. Gill, and L. Serven. 2000. Securing Our Future in a Global Economy. Washington, D.C.: World Bank.
Eastern Caribbean Central Bank. 2001. “Developing Sustainable Debt Indicators for the ECCB.” Mimeo, July. . “The Targeted Public Sector Savings in the Member Countries o f the ECCB.” Mimeo, undated.
Head, A. 1995. “Country Size, Aggregate Fluctuations, and International Risk Sharing.” Canadian Journal of Economics, November, : 1096-1 119.
107
Hodrick, Robert J., and Edward C. Prescott. 1997. “Postwar U.S. Business Cycles: An Empirical Investigation.” Journal of Money, Credit, and Banking, 29 : 1-16.
Jayasuriya, R., and Q. Wodon. 2003. “Efficiency in Reaching the Millenium Development Goal.” Washington, D.C.: World Bank.
King, J., and R. Fulford. 2001. “St. Kitts and Nevis: Reform of the Consumption Tax.” International Monetary Fund, Fiscal Affairs Department. Washington, D.C., March.
Loayza, N., P. Fajnzylber, and C. Calder6n. 2002. “Economic Growth in Lat in America and the Caribbean.” Washington. D.C.: World Bank.
Marcel, M., M. Tokman, R. ValdCs, and P. Benavides. 2001. “Balance Estructural del Gobierno Central. Metodologia y Estimaciones para Chile: 1997-2000.” Estudio de Finanzas Pliblicas, Ministerio de Hacienda, Direcci6n de Presupuestos, Septiembre.
Nonegaard, J., and J. Isaac. 1996. “St. Kitts and Nevis: Formulation of a Strategy for Tax Policy.” International Monetary Fund, Fiscal Affairs Department. Washington, D.C., June.
Nunberg, B., and D. Lindauer (Eds.). 1994. “Rehabilitating Government: Pay and Employment Reform in Africa.” Washington. D.C.: World Bank.
OECS Secretariat. 2002. “OECS Human Development Report 2002.” St. Lucia.
Perotti, R. 1996. “Fiscal Consolidation in Europe: Composition Matters.” American Economic Review, Papers and Proceedings, May, : 105-10.
Perry, G., and L. ServCn. 2002. “Can Fiscal Rules Help Reduce Macroeconomic Volatility in LAC?” Washington, D.C.: World Bank.
Poterba. 1994. “State Responses to Fiscal Crises: The Effects of Budgetary Institutions and Politics.” Journal of Political Economy, August, :779-821.
Price, W. R., and P. Muller. 1994. “Structural Budget Indicators and the Interpretation of Fiscal Policy Stance in OECD Economies.” OECD Economic Studies. Paris, Autumn.
Ravn, M., and H. Uhlig. 2001. “On Adjusting the HP-Filter for Frequency of Observations.’’ CEPR, Discussion Paper No. 2858, June.
Rodrik, D. 1996. “Why Do More Open Economies Have Bigger Governments?” National Bureau of Economic Research, Working Paper No. 5537. Cambridge, MA, April.
Talvi, E., and C. VCgh. 2000. “Tax Base Variability and Procyclical Fiscal Policy.’’ National Bureau of Economic Research, Working Paper No. 7499. Cambridge, MA, January.
Von Hagen, J. 1992. “Budgeting Procedures and Fiscal Performance in the European Communities.” European Communities Commission, Directorate General for Economic and Financial Affairs, Economic Papers No. 96, October.
Von Hagen, J., and I. Harden. 1995. “Budget Processes and Commitment to Fiscal Discipline.” European Economic Review, April, :771-79.
World Bank. 2001. “Brazil Higher Education Sector Study.” Washington, D.C.
.2002. “OECS Country Financial Accountability Assessment.’’ Washington, D.C.
108
. 2002. “OECS Institutional Organizational Capacity Review.” Washington, D.C.
. 2003. “Caribbean Economic Overview 2002: Macroeconomic Volatility, Household Vulnerability, and Institutional and Policy Responses.” Washington D.C.
. “Monitoring Educational Performance in the Caribbean.” Washington, D.C., forthcoming.
Zee, H., J. Stotsky, and E. Ley. 2002. “Tax Incentives for Business Investment: A Primer for Policymakers in Developing Countries.” World Development, September, : 1497-15 16.
109

APPENDICES
Appendix A The Hodrick-Prescott Detrending Procedure
There are several methods to describe the cyclical properties o f any economic variable. The literature on business cycles usually defines a cycle, for example o f output, as Y, = Y,* + Y,', where Y, i s actual output, q' i s the cyclical component o f output, and Y,*is some output benchmark (trend). A number of benchmarks can be the basis o f a measure of the business cycle:
0 The level o f potential output 0 The trend in output defined by a linear trend in i ts logarithm 0 The trend in output as defined by Hodrick and Prescott (1997) 0 The permanent component in output as defined by the Beveridge and Nelson (1981)
decomposition 0 The Baxter-King filter 0 The trend in output as defined by a peak-to-peak trend line.
Each o f these decomposition methods entails some relatively arbitrary decisions and has advantages and disadvantage^.^^ Chapter 2 of th is report uses the Hodrick and Prescott f i l ter (HP filter) to detrend GDP and revenue and expenditure categories. The HP filter was selected because o f i t s simplicity and transparency. Moreover, i t i s the most commonly used filter in empirical studies and policy analysis to identify trend components in macroeconomic series. The HP filter proposes the following minimization procedure to calculate the trend yr* :
T T-1
This procedure implies extracting the trend from the original series by minimizing the sum o f the deviation of yt from i t s trend (the f i r s t term) and the variability of the trend itself (the second term). The relative weight o f the second goal (variability) i s represented by the smoothing parameter A e The higher the preference for a smoother trend, the higher the value one should assign to A .
In empirical applications o f the HP filter, different values for Ahave been used. For quarterly data, a value of 1,600, recommended by Hodrick and Prescott in their original work, i s commonly employed. For annual data, current empirical practice i s to use A= 400 or 100. However, using frequency domain analysis, Ravn and Uhlig (2001) have shown that a value o f 1,600 for quarterly data corresponds to a value o f 6 to 8 for annual data. In this report we use a value o f A = 8.
84 See Baxter and King ( 1 999) f o r business cycles.
a discussion o f how alternative f i l ter ing methods affect the measurement of
111
Appendix R Structural Fiscal Balance Methodology
The literature on adjusted budget surplus measures can be traced back to the paper by Brown (1956), where he argued that to measure the stance of fiscal policy correctly one had to distinguish between “automatic” and “discretionary” policies. Brown’s paper did not propose an adjusted measure of the budget surplus, because he explicitly argued in favor o f the differential treatment o f the various components o f revenue and expenditure with reference to an explicit Keynesian model o f the economy.
Since the publication of Brown’s paper, economists have sought a single indicator o f the stance o f fiscal policy, similar to the budget surplus as a percentage o f GDP, but adjusted for the business cycle. A number o f government and international agencies produce these sorts o f measures, including the OECD, the World Bank, the IMF, the European Community, and their various member governments. A number of indicators have been suggested. Chouraqui, Hagemann, and Sartor (1990) and Price and Muller (1994) present good discussions o f the various indicators. Blanchard (1990) and Buiter (1993) provide arguments against using single indicators.
Cyclical adjustment of the budget usually begins with the decomposition o f output into some trend, or potential, component and i t s cyclical component. Appendix A describes several methods to detrend GDP, but the method used here i s the same as the one the European Community uses. I t simply uses the Hp filter-based trend in GDP as the measure of potential output.
To compute cyclically adjusted surplus measures the European Community, IMF, and OECD estimate the elasticities o f various components o f revenue and expenditure with respect to output. They use the estimated elasticities to make cyclical adjustments to these components o f the budget. At this stage an important set o f assumptions must be made: one must decide which revenue and expenditure components fall into the automatic category and which fall into the discretionary category. Because the assumption i s that the business cycle causes those that fall into the automatic category, while those in the discretionary category potentially cause the cycle, only those components that fall into the automatic category should be adjusted.
To illustrate the method of adjustment, take as an example income and profit tax revenue, T ” , typically thought of as an automatic category. I t s elasticity with respect to output, eTy i s
given by
The elasticities are sometimes estimated using purely statistical models o f the relationship between income tax revenue and GDP. In other cases they are obtained with reference to statutory tax rates, and a statistical model o f the relationship between personal income and GDP, as in the method employed by the Bureau o f Economic Analysis o f the U.S. Department o f Commerce. Given an estimate o f the elasticity, revenue i s adjusted by the amount
112
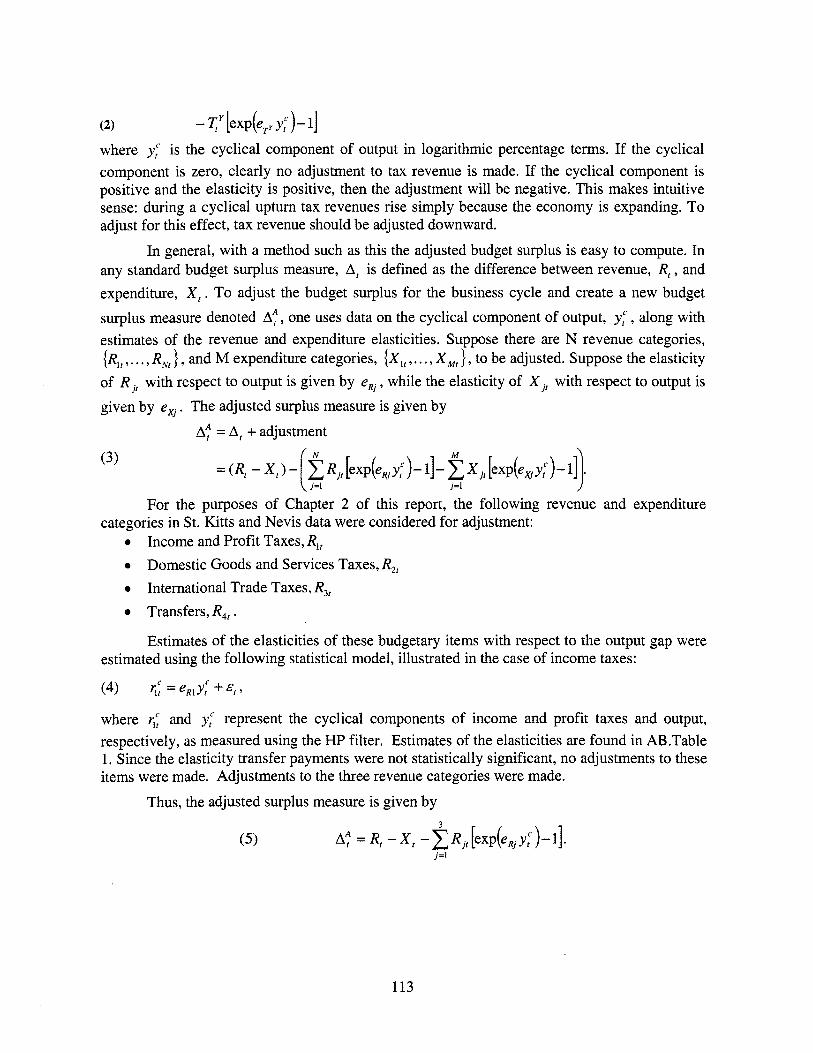
where yf i s the cyclical component o f output in logarithmic percentage terms. I f the cyclical component i s zero, clearly no adjustment to tax revenue i s made. If the cyclical component i s positive and the elasticity i s positive, then the adjustment wi l l be negative. T h i s makes intuitive sense: during a cyclical upturn tax revenues rise simply because the economy i s expanding. To adjust for this effect, tax revenue should be adjusted downward.
In general, with a method such as this the adjusted budget surplus i s easy to compute. In any standard budget surplus measure, A, i s defined as the difference between revenue, R, , and expenditure, X , . To adjust the budget surplus for the business cycle and create a new budget surplus measure denoted A t , one uses data on the cyclical component o f output, y: , along with estimates o f the revenue and expenditure elasticities. Suppose there are N revenue categories, {R,t,. , . , R, } , and M expenditure categories, {Xi, , . . . , X,} , to be adjusted. Suppose the elasticity of Rjr with respect to output i s given by eRj , while the elasticity of Xj, with respect to output i s
given by exj . The adjusted surplus measure i s given by
A; = A, + adjustment
(3)
For the purposes o f Chapter 2 of this report, the following revenue and expenditure
Income and Profit Taxes, R,, Domestic Goods and Services Taxes, R,,
categories in St. Kitts and Nevis data were considered for adjustment: 0
0
0 International Trade Taxes, R,, 0 Transfers, R,, .
Estimates of the elasticities o f these budgetary items with respect to the output gap were estimated using the following statistical model, illustrated in the case o f income taxes:
(4) qf = eRlyf + €1 3
where 5; and yrc represent the cyclical components o f income and profit taxes and output, respectively, as measured using the HI’ filter. Estimates o f the elasticities are found in AB.Table 1. Since the elasticity transfer payments were not statistically significant, no adjustments to these items were made. Adjustments to the three revenue categories were made.
Thus, the adjusted surplus measure i s given by 3
A; = R, - X , -CR,[exp(e,yf)-l]. j=1
113
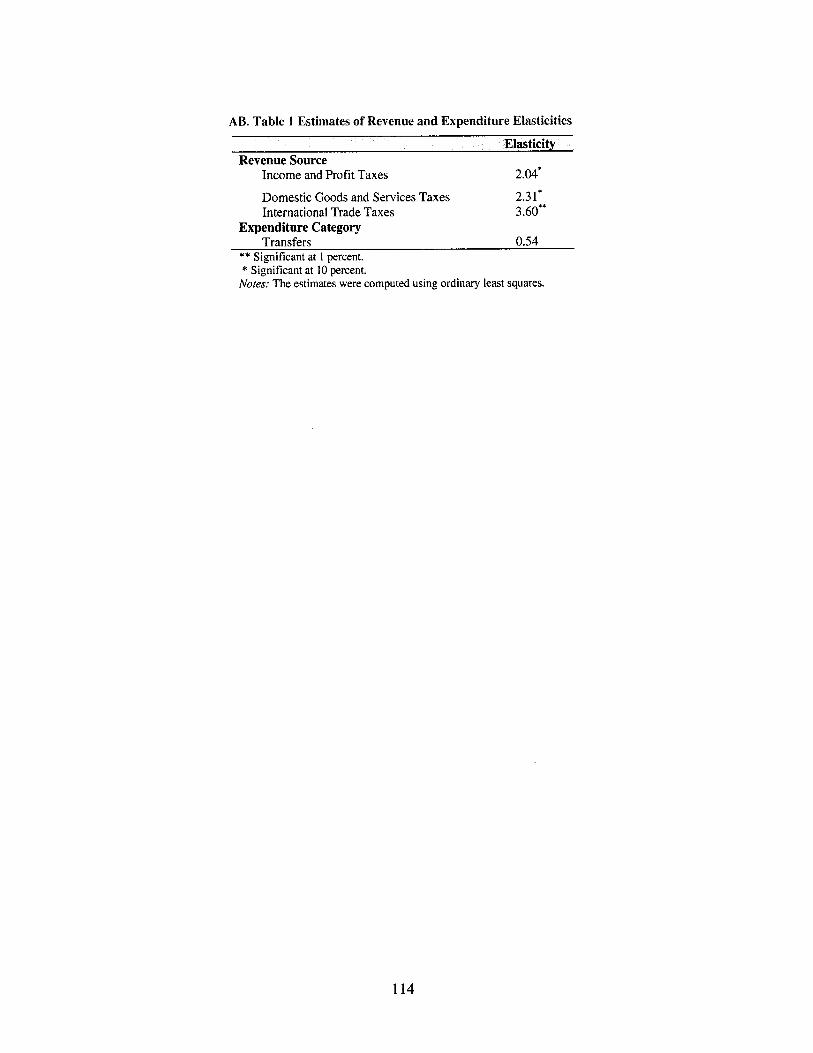
AB. Table 1 Estimates of Revenue and Expenditure Elasticities
Elasticity Revenue Source
Income and Profit Taxes 2.04*
Domestic Goods and Services Taxes 2.3 1* International Trade Taxes 3.60"'
Transfers 0.54 Expenditure Category
** Significant at 1 percent. * Significant at 10 percent.
Notes: The estimates were computed using ordinary least squares.
114
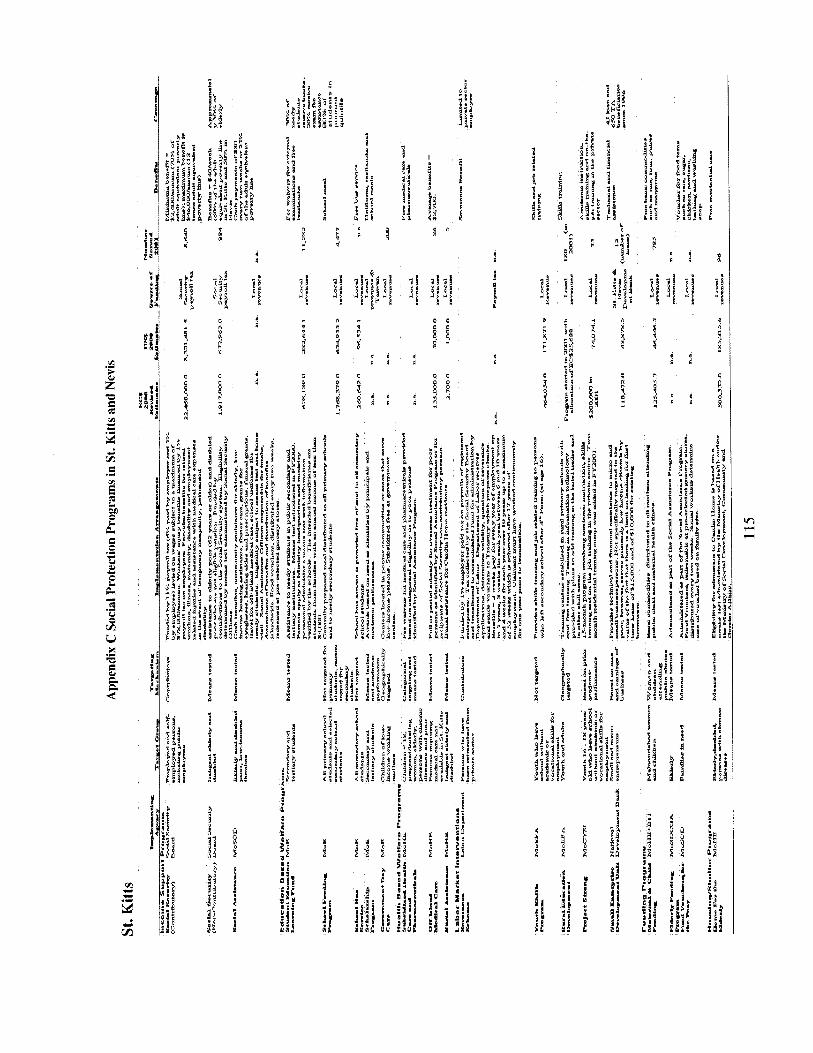
% a J
P $ d
W "
ai q li
f N
d
0 0 a J 8 d
" a d
3 i
E d c c
I C 1 :
P
B r ; @ I : : c
1 E Q 1% ; yd'il 1 ! 2 % E
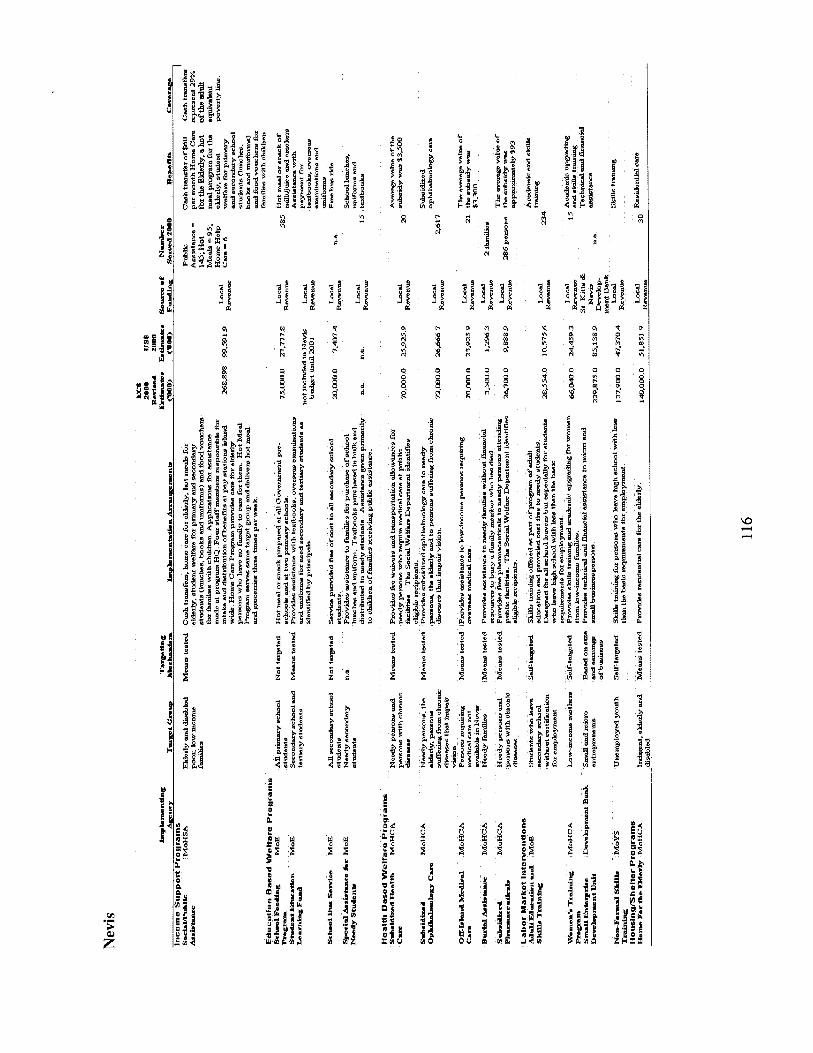
v o O - r i i $ ;
5 f
4
o c o c o c ? c
s 5
9' h I-
e
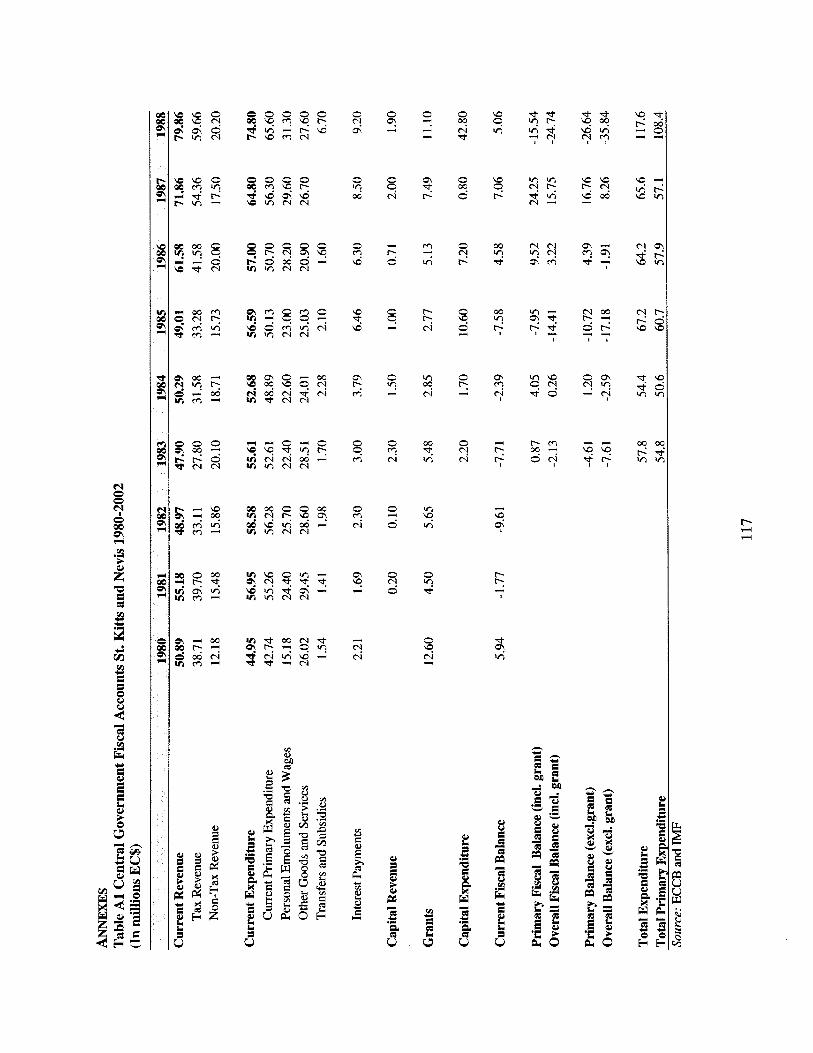
C $
0
0 09
C
2
0
2 i
0 ? 3
0
3
d 9 m
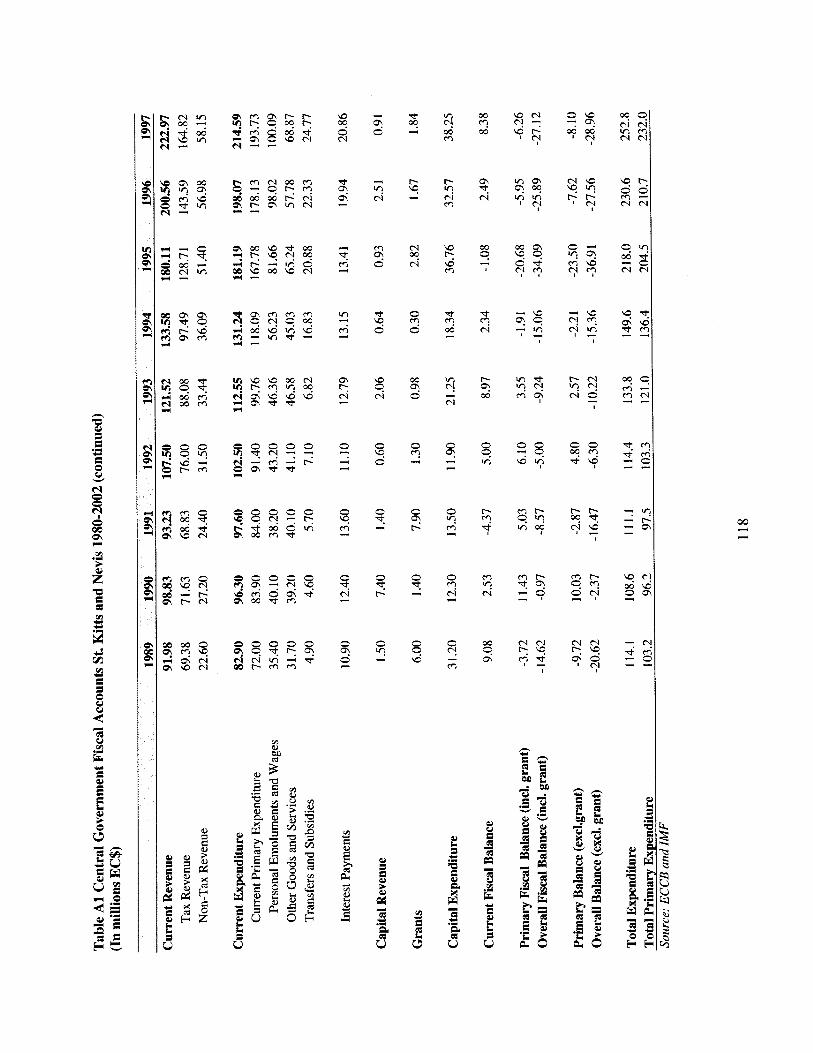
i
Y c1
m
2 0 - 2 % " 3
3
2 3
- w " " "13
I
0
0 " d
2 ri
0 : 3
0 t 3
0
2 0 x c1
l- a 0
2 0 a 0
t - 0
3 m 2
0
m c! c
00
Q\ 9
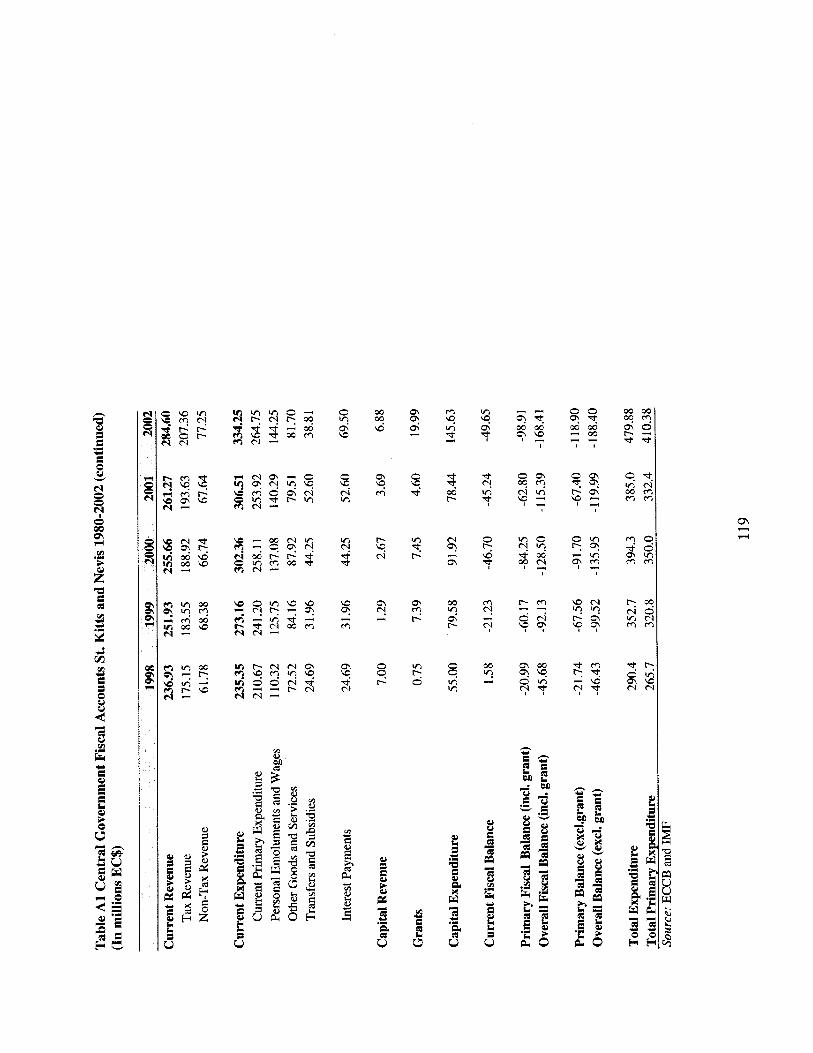
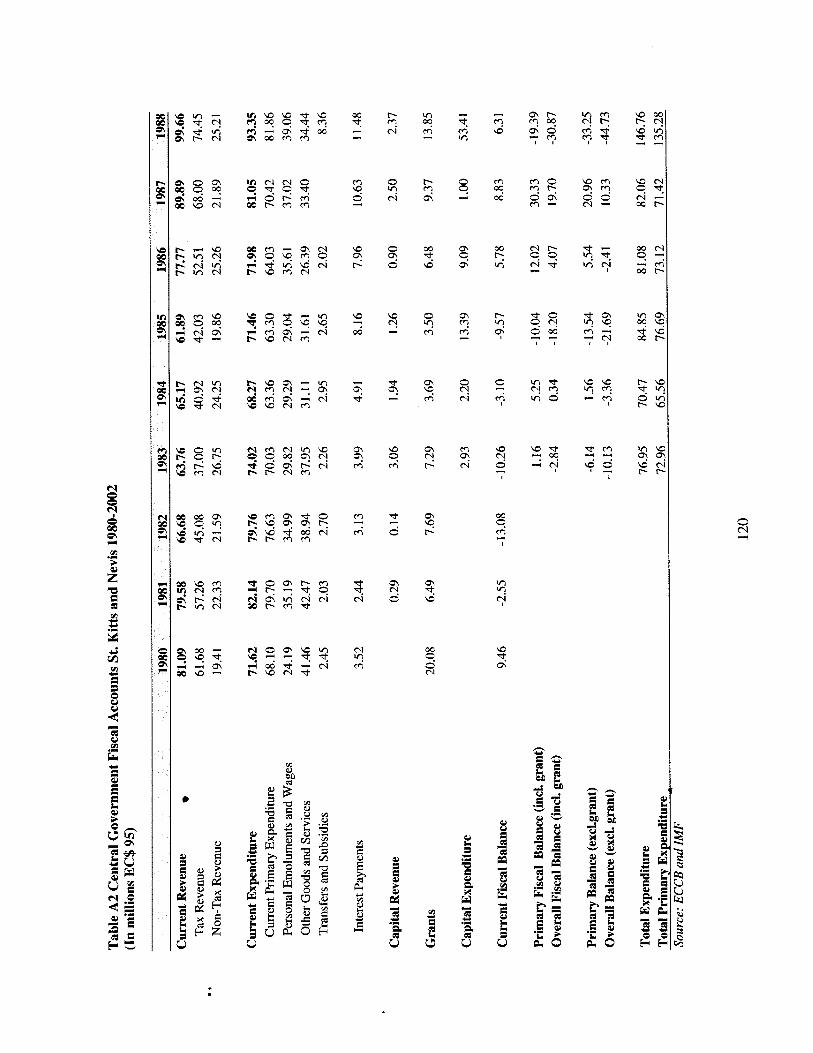
.
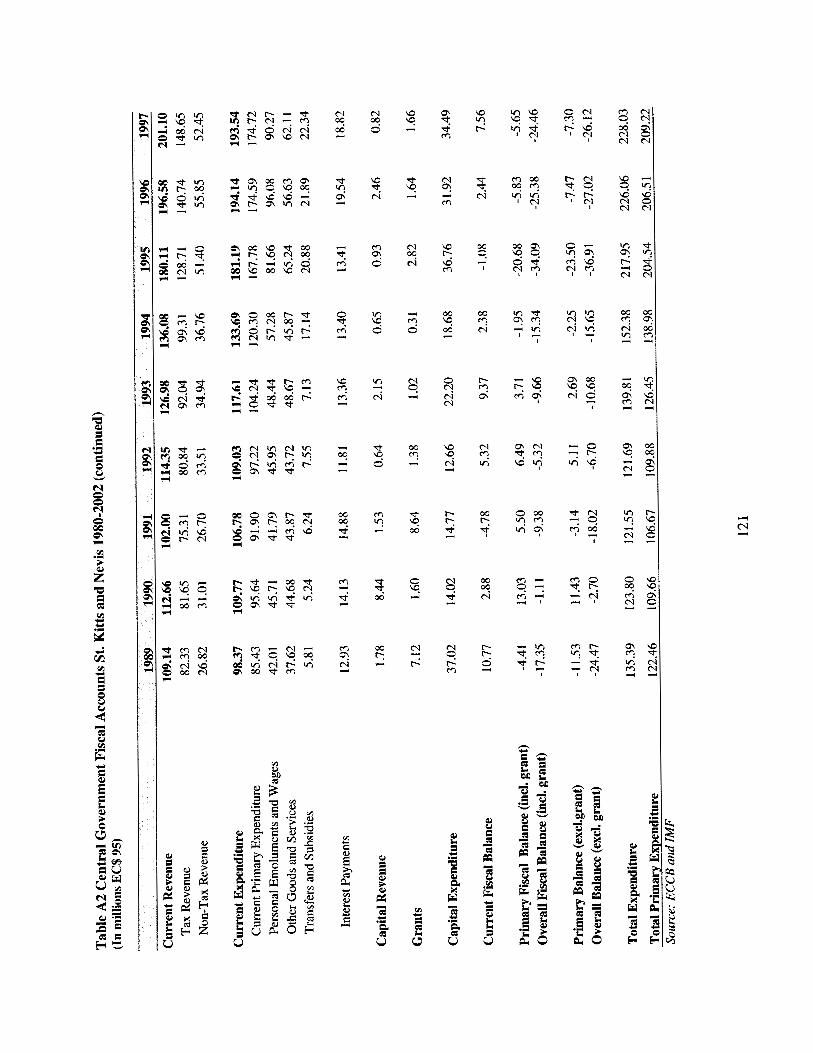
J
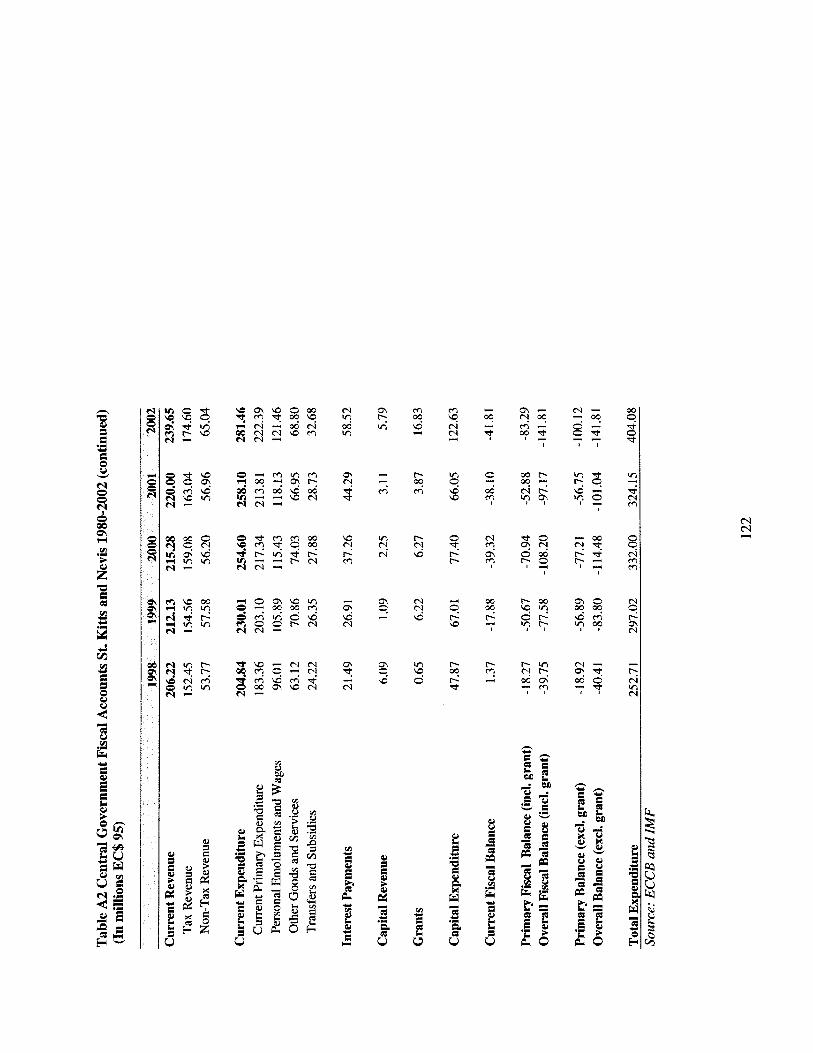
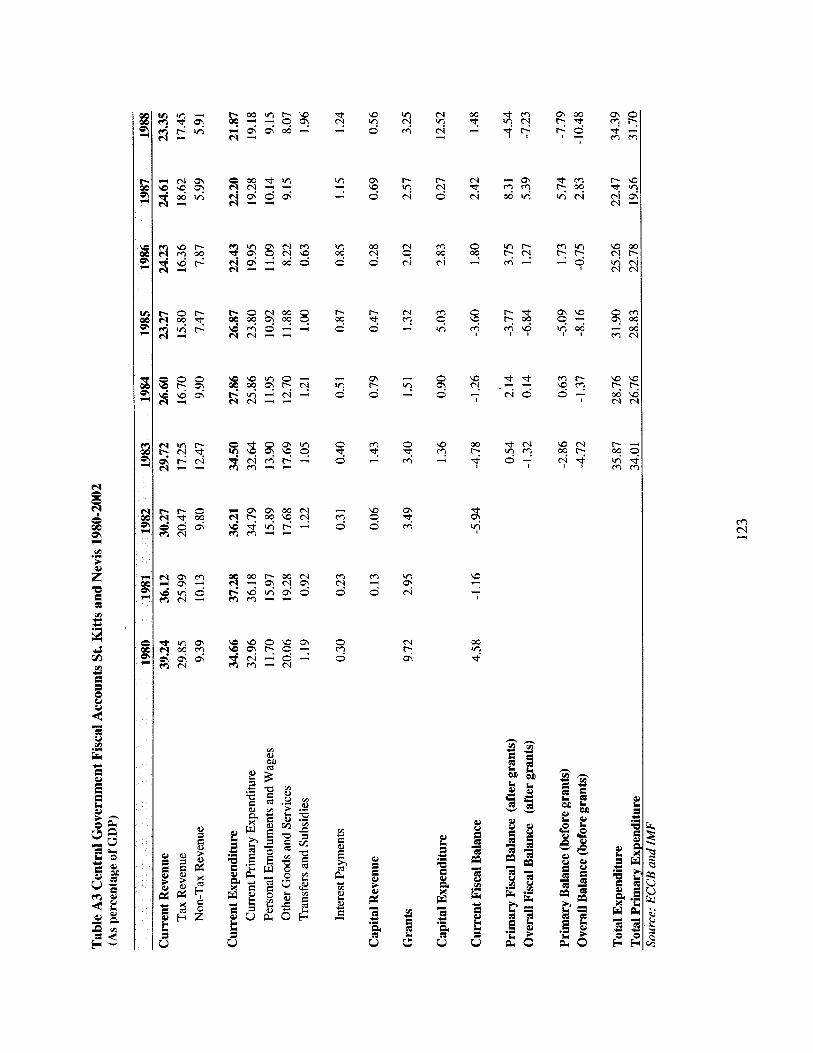
\o Y 0
m 2
00
2
[I x m 0 t':
a 3
\o
8
rn 3
0
3 0 0
2 2 2 N
W Y d
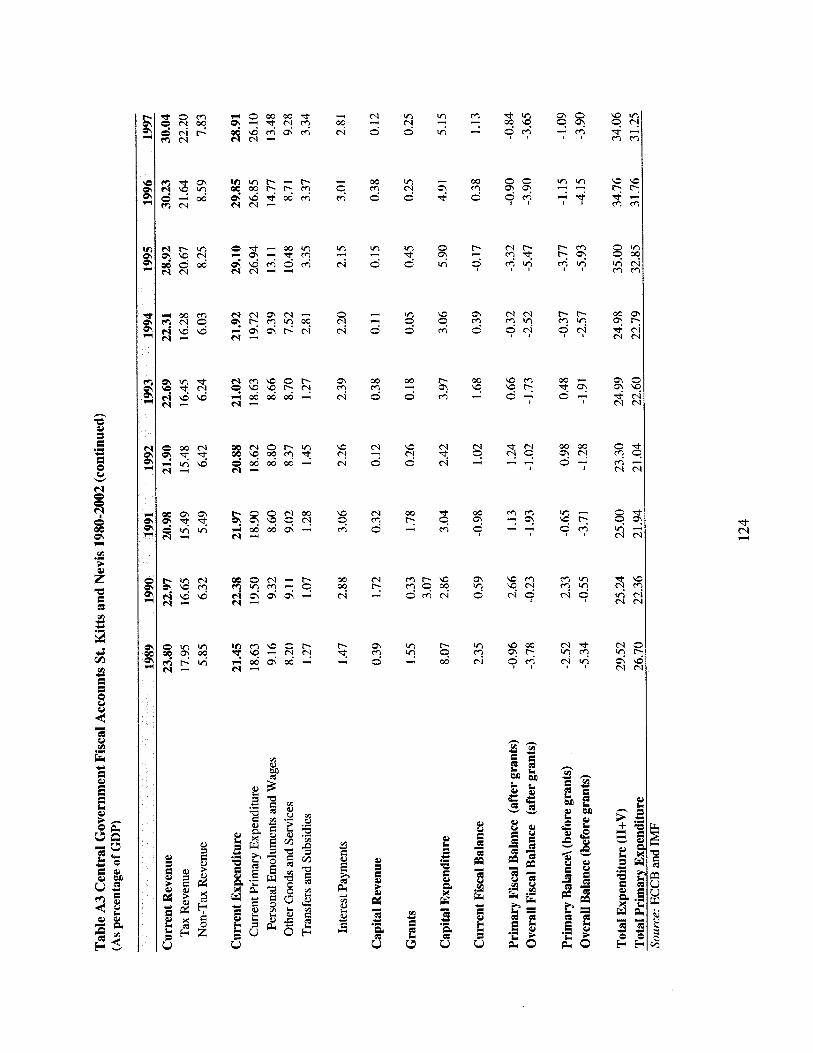
o e m m m m w m
m 2
m 2
2
2
00 c
0
W
0 c!
00 ": 3
g B 8 3
.I 5
w
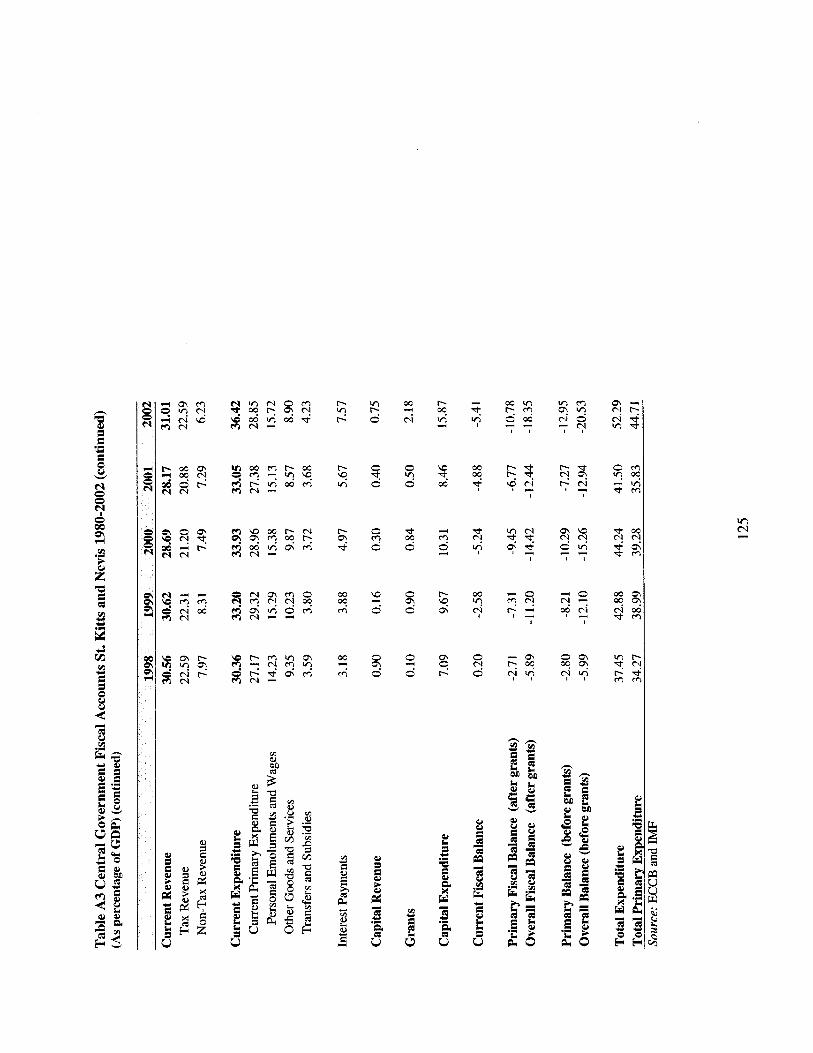
vi
2
0 x 0
2
!2 0
0
2
2 B B n
U .I Q
4 u
a - :? vi3
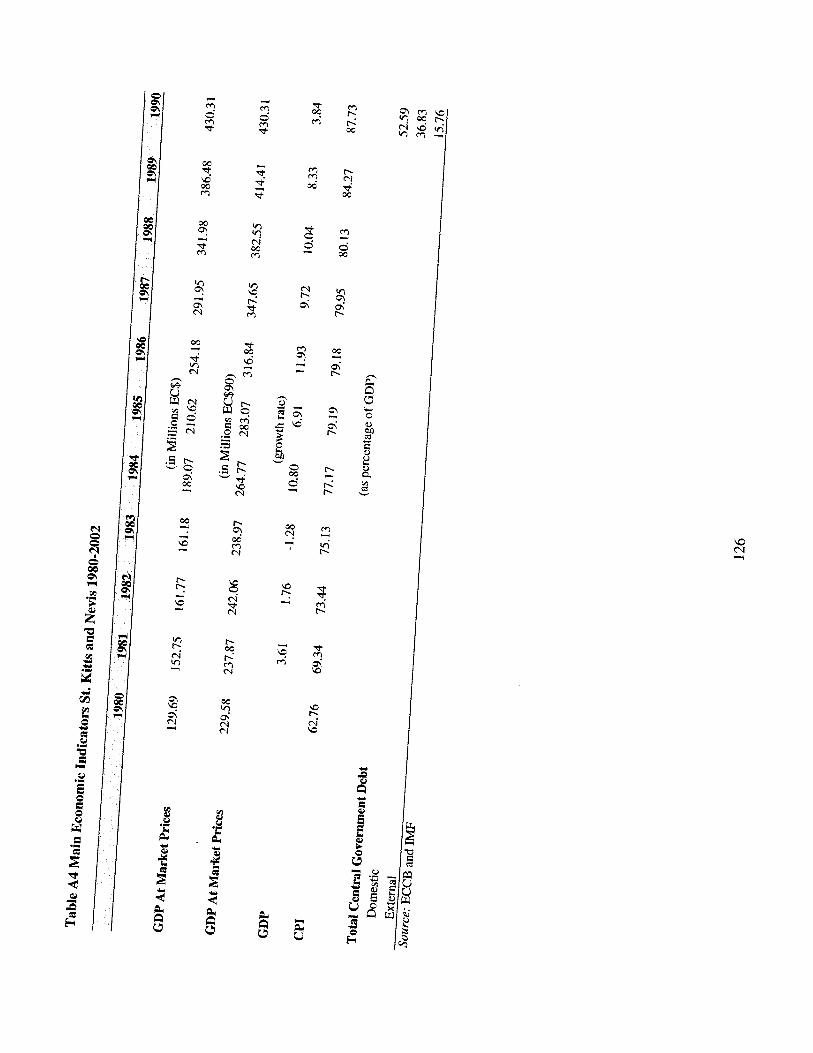
3 m
W
v) 00 m
B
3
r? 0 ?
3
4 %- * -
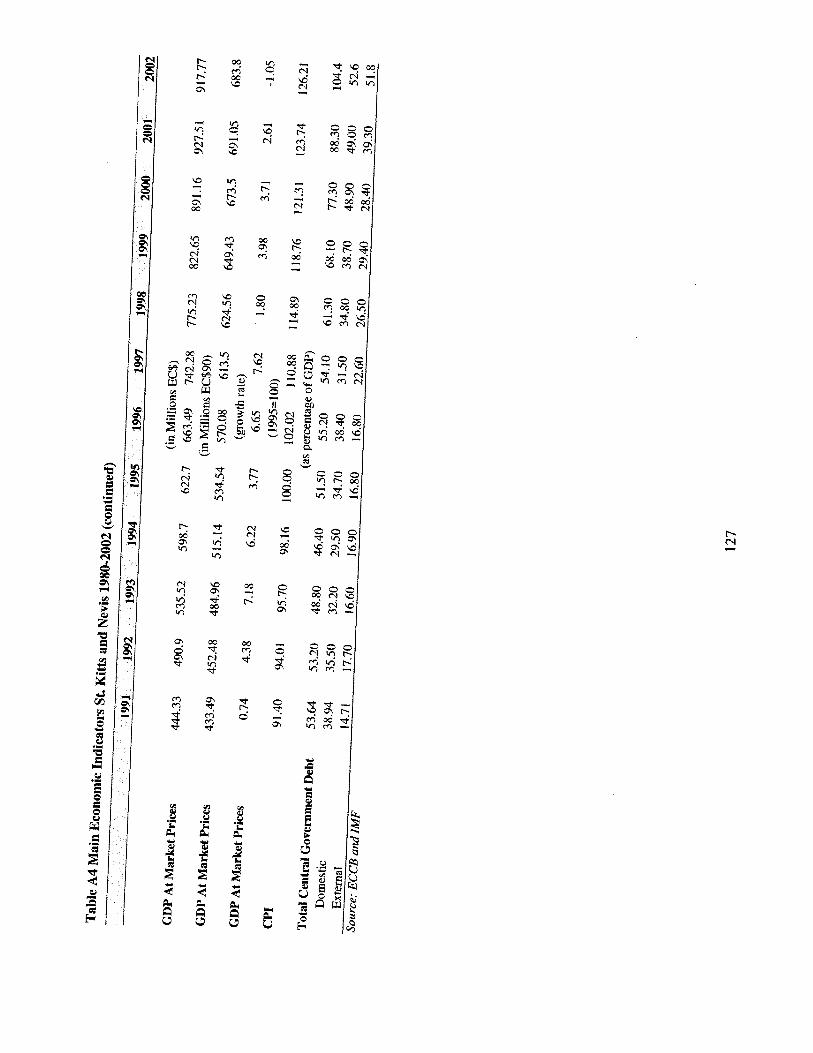
s" 3 ,
3
\4 m
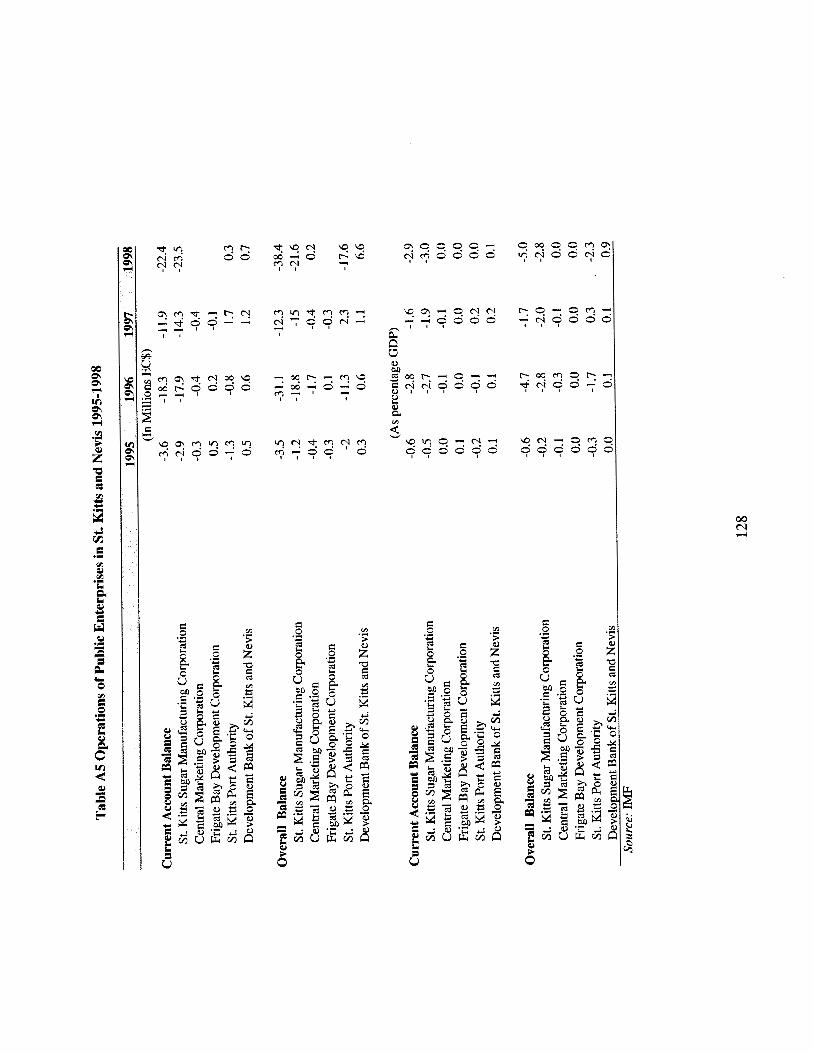
3 s
9 9 9 9 9 1 ~ ~ 0 0 0 0
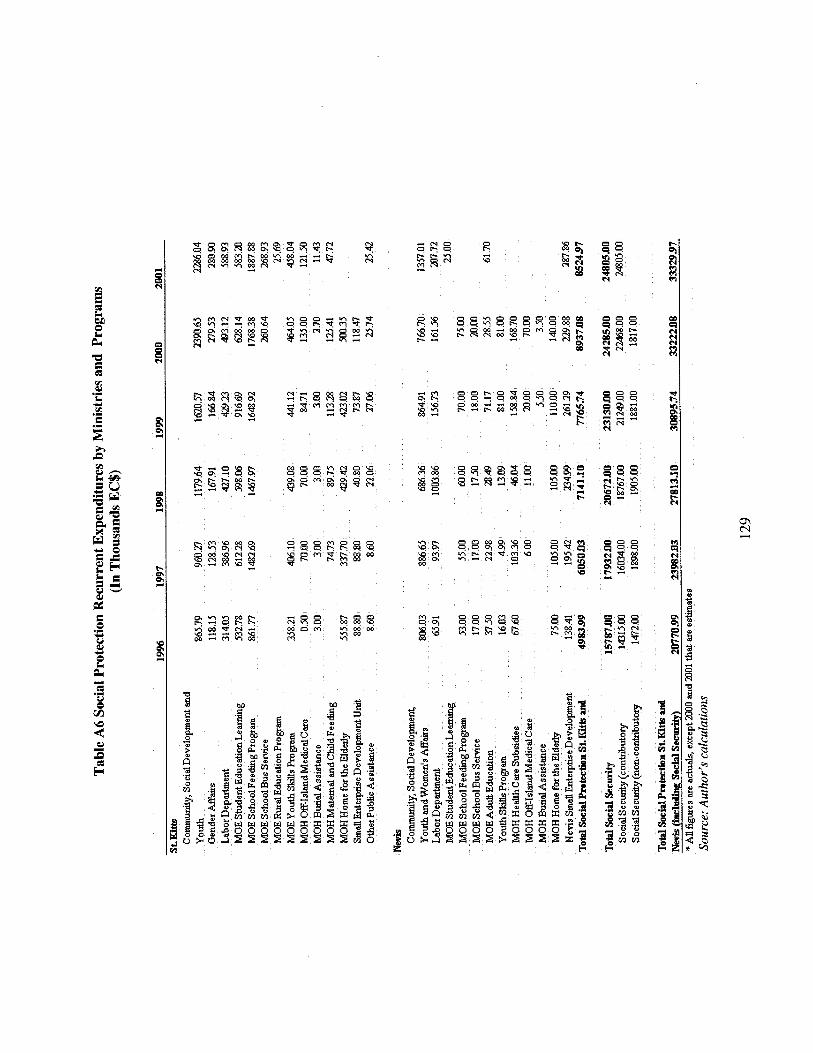


THIS PAGE INTENTIONALLY LEFT BLANK


THIS PAGE INTENTIONALLY LEFT BLANK

Copyright © 2022 FDOKUMEN