
ICLS SAINT PETRESPURG-RUSSIA
113
21 th International Conference on Spectral Line Shapes Saint Petersburg June 3-9, 2012 SPONSORS Saint Petersburg State University Dynasty Foundation
-
Upload
ouargla-univ-dz -
Category
Documents
-
view
1 -
download
0
Transcript of ICLS SAINT PETRESPURG-RUSSIA

21th International Conference
on Spectral Line Shapes
Saint Petersburg
June 3-9, 2012
SPONSORS
Saint Petersburg State University
Dynasty Foundation

21th International Conference on Spectral Line Shapes, Saint-Petersburg, June 3–9, 2012. — Saint-Petersburg: VVM Publishing Ltd., 2012. —10 + 101 pp.
ISBN 978-5-9651-0649-3

Local Organizing Committee
Nikolay G. Skvortsov (Chair, Vice-Rector for Research, St.Petersburg State University)Evgenii B. Aleksandrov (Academician RAS, Ioffe Physico-Technical Institute, St.Petersburg )Vadim А. Alekseev (Conference Secretary, St.Petersburg State University )Sergey F. Boureiko (Prof., St.Petersburg State University )Yury N. Gnedin (Vice-Director on Science, Pulkovo Observatory, St.Petersburg )Alexander Z. Devdariani (Prof., Deputy Chair, St.Petersburg State University)Alexander P. Kouzov (Sc.D., Deputy Chair, St.Petersburg State University)Nikolay A. Timofeev (Prof., St.Petersburg State University)
International Program Committee
Dionisio Bermejo (Spain)Roman Ciurylo (Poland)Elisabeth Dalimier (France)Alexander Devdariani (Russia)Milan S.Dimitrijevic (Serbia)Robert Gamache (USA)Marco Antonio Gigosos (Spain)Motoshi Goto (Japan)Magnus Gustafsson (Sweden)Jean-Michel Hartmann (France)Carlos Iglesias (USA)John Kielkopf (USA)John C.Lewis (Canada)Valery Lisitsa (Russia)Eugene Oks (USA)Christian Parigger (USA)Gillian Peach (UK)Adriana Predoi-Cross (Canada)Roland Stamm (France)
I

ICSLS-21 Program
SUNDAY, JUNE 3 17:00 - 20:00 Registration and Welcome Party, Hotel Rus'
MONDAY, JUNE 4
9:00 Registration
9:40 OpeningChairman John K.C.Lewis
10:00 I V.S. Lisitsa Spectroscopic Problems in ITER Diagnostics .....................................................................................3
10:35 I M. Hasuo Wideband High-Resolution Spectroscopy on Al-pellet Ablation Plasmas in Large Helical Device .......................................................................................................................4
11:10 C S. Lorenzen, A. Wierling, H. Reinholz, G. Röpke, M. C. Zammit, D. V. Fursa, I. Bray Quantum-Statistical Line Shape Calculations Of Dense H And H-like Plasmas ................................5
11:30 Coffee break
11:50 I J. Rosato Spectral Line Formation with Wave Effects in Optically Thick Plasmas...............................................6
12:25 C Ch. Parigger, A. Woods Hydrogen Balmer Series And Superposed Carbon Swan Spectra in Laser-Induced Plasma...............7
12:45 Lunch breakChairman Roland Stamm
14:15 I O.Renner, E. Dalimier, R. Liskac, E. Oks, M. Šmída Charge Exchange Signatures in X-Ray Line Emission Accompanying Plasma-Wall Interaction ......8
14:50 C F.Y. Khattak , O. A.M.B. Percie du Sert, F.B. Rosmej, D. Riley Evidence For Plasma Polarization Shift Of Ti He Line In High Density Laser Produced Plasma .....................................................................................................................9
15:10 I F.B. Rosmej Effect Of Atomic Structure On X-Ray Line Shapes..............................................................................10
15:45 Coffee break
16:00 -18:00 Poster Session A
II

TUESDAY, JUNE 5Chairman Yury N. Gnedin
10:00 I D.A.Varshalovich, A.V.Ivanchik, S.A.Balashev Quasar Spectroscopy and Cosmology............ ....................................................................................11
10:35 I D. Ilic, L.Č. Popović, A.I. Shapovalova, A.N. Burenkov, W.Kollatschny, A .Kovacevic, V.Chavushyan, G. La Mura, P. Rafanelli
Broad Emission Lines: A Tool For Studying Nuclei Of Active Galaxies ...........................................12
11:10 Coffee breakChairman Elisabeth Dalimier
11:30 I S. Sahal-Bréchot Virtual Laboratory Astrophysics: The STARK-B Database For Spectral Line Broadening By Collisions With Charged Particles And Its Link To VAMDC ........................................................ 13
12:05 I Y.N. Gnedin The Project MILLIMETRON: Investigation of Chemi-ionization Processes in The Universe...........14
12:40 C S. Gulyaev, J. Alexander On the “Mystery” of Radio Recombination Lines Narrowing ......................................................... 15
13:00 Lunch break. International Committee Business Meeting
Chairman Motoshi Goto14:30 I P.S. Barklem Hydrogen Atom Collision Processes In Cool Stellar Atmospheres: Effects On Spectral Line Strengths And Measured Chemical Abundances In Old Stars.....................16
15:05 C A.K. Belyaev Inelastic Collision Processes for Formation of Spectral Line Shapes in Stellar Atmospheres. Reprojection Method ........................................................................................................................17
15:25 C O.S. Alekseeva, A.Z. Devdariani, M.G. Lednev, A.L. Zagrebin Quasimolecular Absorption And Emission In Cd + Ar And Kr Collisions........................................18
15:45 Coffee break
16:05 C N. Jacquinet-Husson, L. Crépeau, R. Armante, Ch.Boutammine, A. Chédin, N. Scott, C. Crevoisier, V. Capelle The GEISA Spectroscopic Database For Remote Sensing Of Planetary Atmospheres: Content Description And Spectral Line Shapes Assessment .............................................................19
16:25 C V.A.Alekseev Satellite Bands In Spectra Of Collision Pairs Induced By Interaction Of Transient Optical Dipoles ........................................................................................................... 20
16:45 Coffee break
17:00 - 19:00 Poster Session B
III
WEDNESDAY, JUNE 6Chairman Valery Lisitsa
9:35 I O.Yu. Andreev QED Theory Of The Spectral Line Profile For Few-Electron Atoms And Ions ................................21
10:10 I Tetsuya Ido Optical Lattice Clocks: Hz-level Spectral Width With Sub-Hz Reproducibility .................................22
10:45 Coffee break
11:00 I P. Maslowski, A. Foltynowicz, T. Ban, K. Cossel, J. Ye Optical Frequency Comb as a New Tool for Broadband High Resolution Spectroscopy .................23
11:35 I V.A. Astapenko Spectral Peculiarities Of Matter Excitation By Ultrashort EM Pulses ..............................................24
12:10 Lunch
14:00 Excursion to Petrodvoretz and Conference Dinner
IV

THURSDAY, JUNE 7 Chairman Dionisio Bermejo
10:00 I E.B. Alexandrov, V.S. Zapasskii Optical and RF Spectroscopy of Spin Noise .......................................................................................25
10:35 I C. Daussy, C. Lemarchand, M. Triki, B. Darquié, C. Chardonnet, Ch. J. Bordé High Precision Line Shape Studies In Low Pressure Ammonia For An Accurate Determination Of The Boltzmann Constant ...............................................................................................................26
11:10 C A.V. Demura, S.Ya. Umanskii, A.V. Scherbinin, A.Z. Zaitsevskii Metal Atom Spectral Line Broadening by Noble Gas Atoms .......................................................27
11:30 Coffee breakChairman Alexander P. Kouzov
11:45 I L. Gianfrani Highly-Accurate Line Shape Studies in the Near-IR Spectrum of Water ...............................28
12:20 C J.C. Lewis, R.M. Herman Statistical Models of Scalar Collisional Interference Incorporating Phase Shifting: a Strongly Asymmetric LineProfile ............... .....................................................................................29
12:40 C O.V. Belai, D.A. Shapiro Coulomb Broadening of Resonance Induced by Standing Wave ....................................................30
13:00 Lunch breakChairman Christian Parigger
14:30 I H. Tran, N.H. Ngo, R.R. Gamache New Modeling Of H2O Isolated Line-Shape Based On Classical Molecular Dynamic
Simulations ................................. ............... ......................................................................................31
15:05 C M. Guitou, A. K. Belyaev, A. Spielfiedel, N. Feautrier, P. S. Barklem Mg-H collision rates for non-LTE determination of stellar atmospheric parameters .....................32
15:25 Coffee break
15:40 C G. Knopp, P.P. Radi, Y. Sych, P. Matsyutenko, Y. Liu, T. Gerber Rotational Energy Transfer And Spectral Line Shapes Of Small Molecules Viewed By Time Resolved Four-wave Mixing .................................................................................33 16:00 C M. Bruvelis, N. N. Bezuglov, A. Ekers Doppler Profile Particularities in Supersonic Beams for Circular, Square and Arbitrary Collimating Apertures ............. .................................................................................34
16:20 C K.A.Vereshchagin, A.K.Vereshchagin, V.V.Smirnov, O.M.Stel’makh, V.I.Fabelinsky, W.Clauss, M.Oschwald CARS Investigation of Collisional Broadening and Shift of the Hydrogen Q-branch Transitions by Water at High Temperatures ...............................................................35
16:40 C K.A.Vereshchagin Single-Shot lineshape spectroscopy and light statistics; CARS as a Tool
for Lineshape Spectroscopy: Advantages and Disadvantages........................................................ 36
17:00 Concert
V

FRIDAY, JUNE 8Chairman Roman Ciuryło
10:00 I T.A. Vartanyan Spectroscopy of Atomic Vapors in Nanometer Cells: Dicke Narrowing and Beyond .. ...................37
10:35 C N. Bonifaci, F. Aitken, V. M. Atrazhev, K. Von Haeften, J. Eloranta Shape of Atomic Lines Emitted by Liquid Helium ..........................................................................38
10:55 C K. Gebresellasie, J. Shirokoff , J.C. Lewis Effect of X-ray Line Spectra Profile Fitting with Pearson VII and
Pseudo-Voigt Functions on Asphalt Binder Aromaticity and Crystallite Parameters ......................39
11:15 Coffee breakChairman Vadim А. Alekseev
11:30 C V.V.Arakcheev, V.B.Morozov Vibrational Spectra of Molecular Fluids in Nanopores ...................................................................40
11:50 C M.V. Kazachek, T.V. Gordeychuk Peculiarities Of Atomic Lines In Sonoluminescence Spectra ..... ....................................................41
12:10 Best student presentation awards
12:20 The next conference
12:30 Closure
VI

POSTER SESSION A MONDAY 16:00 - 18:00
A1 O.S.Alekseeva, A.Z. Devdariani , M.G.Lednev , A.L. Zagrebin The Probabilities Of The ν′ 1( 3P2 ) − ν′′ 0+ ( 1S0 ) Transitions And The Radiative Lifetimes Of The ν′ 1( 3P2 ) States Of The CdAr And CdKr Molecules ........................................................................43
A2 V.A. Alekseev, R. Püttner, N. SchwentnerRotational quantum number dependent broadening of H2 (X → B) lines in mixtures with Rg gases and CF4 ...............................................................................................................44
A3 V.A. AlekseevAb Initio Study of Rg - H2( B Σ+
u ) Interaction Potential ...............................................................................45
A4 N. F. Allard, F. X. Gadéa , A. Monari, B. DeguilhemComparative Study of Emission Spectra of He(3S)-He(2P) at 706 and 728 nm Due to the Triplet and Singlet Transitions ........................................................................... .........................................................................46
A5 N. F. AllardPhysical interpretation of the blue shift of spectra obtained by corona discharge in liquid helium..............47
A6 N. Bonifaci, F. Aitken, Hai Van Nguyen,V. M. Atrazhev, K. Von Haeften, J.Eloranta, V.A. Shakhatov.Shape of Atomic Lines as Indicator of Gas Density in Helium micro-discharge ................ ............48
A7 N. Bonifaci, F. Aitken, Hai Van Nguyen, V. M. Atrazhev, K. Von Haeften, R. Rincon. Shape of Atomic Lines Emitted by Cryoplasma in Helium ................................................. ............... ............49
A8 A. K. Belyaev, A. Z. Devdariani, V. S. Rybak, I. A. ZlatkinElectronic Radiative Transitions in He(21,3S)-Ne Weakly Bound Molecules. Temperature Dependences ...50
A9 D. Boland, R. Hammami, H. Capes, Y. Marandet, J. Rosato, R. StammA Stark Broadening Simulation Using a Renewal Process ................................................. ............... ............51
A10 M. Bruvelis, J. Ulmanis, N. N. Bezuglov, K. Miculis, C. Andreev, B.Mahrov, D. Tretyakov, A. EkersAnalytical Model of Transit Time Broadening for Two-Photon Excitation in a Three-Level Ladder
and its Experimental Validation ......................................................................................... ............... ............52
A11 A. Cygan, D. Lisak, S. Wójtewicz, J. Domysławska, J. T. Hodges, R. S. Trawiński, R. CiuryłoDemonstration of the extremely high signal-to-noise ratio and advanced O2 B-band lines shape analysis in PDH-locked FS-CRDS experiment ............................................................................... ............... ............53
A12 A.V. Dadonova, A.Z. DevdarianiH- - H Collision Induced Radiative Transitions ............................................................... ............... ............54
A13 N. Larbi-Terzi, N. Ben Nessib, S. Sahal-Bréchot, M. S. DimitrijevićElectron-Impact Broadening of C II Spectral Lines ......................................................... ............... ............55
A14 D.K.Efimov, M.Yu.Zaharov, N.N.Bezuglov, A.A.Mihajlov, A.N.KlyucharevAnomalies in the Rydberg Atom Emission Spectra of Astrophysical Relevance ........................... ............56
A15 H. ElabidiElectron impact excitation for Ar VI .................................................................................. ............... ............57
VII

A16 T.A. Florko, A.A. Svinarenko, T.A. TkachCollisional Shift and Broadening Heavy Atoms Hyperfine Lines in an Atmosphere of the Inert Gas. ...........58
A17 Yu.A.Аnokhin, V..A.Boiko , B.A.Fomin, N.N.PetrovSpectral Line Shape Modeling in the LBL Code for Space Monitoring of the Earth
Climate-forming Factors .................................................................................................... ............... ............59
A18 A. Gatilova, A. Rudakova, D. Shchepkin, A. TsyganenkoEffect Of Adsorption And Lateral Interactions Upon The Bandshape In FTIR Spectra Of Adsorbed CF4 ..60
A19 G. D. Roston, Z. F. GhatassKrypton Influence on the spectral line shape of Cd 326.1 nm ....................................... ............... .................61
A20 W. Głaz, T. Bancewicz, G. Maroulis, A. Haskopoulos, J.-L. GodetNonlinear properties and collisonal spectra in hydrogen-(heavy) -noble-gas-atom mixtures ..... .. .............62
A21 A.V. GlushkovSpectroscopy of Atoms and Nuclei in Super strong Laser Field: Stark effect and Multiphoton
Resonances ............................................................ ..................................................... .................................63
A22 A.V. GlushkovSpectroscopy of the Cooperative Muon-γ-Nuclear Processes: Energy and spectral parameters .................64
A23 G.V.Golubkov, M.G.Golubkov, A.Z.DevdarianiQuenching Of Rydberg States In Slow Collisions With Neutral Atoms And Molecules Of Medium ............ 65
A24 M. Goto, K. Sawada, K. Fujii, M. Hasuo, S. MoritaEvaluation of Particle Source Rate and Its Influence on Particle Transport in Fusion Plasma ....... ............66
A25 G.M.GrigorianPeculiarities of the C2 d 3П→а 3П Band System Intensities in Gas Discharges through
CO-contained Mixtures ..................................................................................................... ................ ............67
A26 O.Yu. KhetseliusSpectroscopy of Cooperative Electron-γ-Nuclear Processes in Heavy Atoms: NEET and Shake-up
Effects ............................................................................................................................................... ............68
A27 Yu. I. Anisimov, I. Ch. Mashek, S. A. Smirnov, N. B. KosykhSpontaneous Rayleigh-Brillouin spectra in neutral gases measured with a wide aperture spectrometer ....... ...... ................... ........... ................... ........... ............................... ......................... ...........69
A28 M. Koubiti, T. Nakano, Y. Marandet, L. Mouret, J. Rosato, R. StammContribution Of Stark-Doppler Broadening Of Carbon Impurity Lines To The Analysis Of JT-60U Divertor Plasmas ........ ........... ................... ........... ............................... ......................... ...........70
VIII
POSTER SESSION B TUESDAY, JUNE 5 17:00 - 19:00
B1 N. F. AllardEmission Profiles of K-He Exciplexes in Cold Helium Gas.............................................................. ............71
B2 N.F. Allard , F. Spiegelman , A. Nakayama, J. F. KielkopfAbsorption Spectra of NaHe From White Dwarfs to Helium Clusters ........................................... ............72
B3 I. Verzbitskiy, W. Herrebout, B. van der Veken, A. KouzovRaman Line Shape Studies of Hydrogen Cryosolutions ........... ............................... ......................... ...........73
B4 D.N. Kozlov, P.P. RadiLine Profiles of Direct Absorption Transitions to Highly Excited Overtone-Combination Vibrational States of Methane ........................................................................................ .................................74
B5 S.A. Klemeshev, E.Yu. Kleymenov, P.A. Saveliev, N.A. KryukovFormation Of Xe2 In The Gas Discharge At Room Temperature ....................................................................75
B6 A.S. KvasikovaOperator Perturbation Theory to Hydrogen Atom in the Crossed Strong DС Electric and Magnetic
Fields ............................................................................................................................ ..................................76
B7 B. Ferhat, R. Redon, M. Ripert, Y. Azzouz, A. Lesage Experimental Study of Asymmetrical SiII Lines ........................................................... ...................................77
B8 H. Wheeler, J.C. LewisStatistical Models for Collision–Sequence Interference with Arbitrary Persistence of Velocity ...................78
B9 R. M. Herman, A. Suarez, J. Sofo. J. C. LewisCalculation of the Ortho–Para Conversion of Hydrogen in a p-type Silicon Lattice using a dwell time method ........................................................................................................................ ....................................79
B10 J. Domysławska, S. Wójtewicz, D. Lisak, A. Cygan, F. Ozimek, K. Stec, K. Bielska, P. Masłowski, Cz. Radzewicz, R. S. Trawiński, R. CiuryłoTransition Frequencies And Pressure Shifting Of Oxygen B-Band Lines Measured With Frequency-Comb Assisted Cavity Ring-Down Spectroscopy .................................................................. ....................................80
B11 A.V. LobodaGeneralized Energy Approach in Electron-Collisional Spectroscopy of Multicharged Ions in Plasma in Debye Approximation ........................................................................... ....................................81
B12 A. A. Mihajlov, V. A. Srećković, L. M. Ignjatović, M. S. Dimitrijević, A. MetropoulosThe Quasi-molecular Absorption Bands In UV Region Caused By The Non- symmetric Ion –atom Radiative Processes In The Solar Photosphere .......................................... ..................................82
B13 A.A. Pelmenev, I.N. Krushinskaya, R.E. Boltnev, I.B. Bykhalo, V.V. KhmelenkoSpectra of Nitrogen Atoms Captured By Free Nanoclusters ......................................................................83
B14 A.A. Pelmenev, I.N. Krushinskaya, R.E. Boltnev, I.B. Bykhalo, V.V. Khmelenko, D.M. LeeNitrogen Atoms As Optical Probes Of Structural Rearrangements In Impurity-Helium Condensates. ........84
B15 V. A. Ivanov, A. S. Petrovskaya, Yu. E. SkobloPopulation of the Ne 2p55s-States in He-Ne Mixture Plasma ......................................................................85
IX

B16 V. A. Ivanov, A. S. Petrovskaya, Yu. E. SkobloTemperature Dependence of the Rate of the Recombination Population of Neon Atomic Excited States in He-Ne Plasma ................................................................................. ..................................86
B17 G. Revalde, E. Bogans, J. Skudra, N. ZorinaDiagnostics of Capillary Light Sources by Means of Line Shape Measurements and Modeling ...............87
B18 J. Rosato, H. Capes, R. StammModeling of Hydrogen Stark Line Shapes with Kinetic Theory Methods .......................................................88
B19 G. D. Roston, M. S. HelmiTemperature Dependence of the Pressure Broadening of Spectral Lines ......................................... ...........89
B20 O. Mahran, G. D. Roston, M. ShahatThe Effect of Gaussian Line Shape on the Performance of Thulium and Erbium
Doped With Different Host Materials As Optical Fiber Amplifier ............................ ....................... ..........90
B21 I.N. Serga , Yu.V. Dubrovskaya, D.E. SukharevSpectroscopy of Hadronic Atoms: Spectra, Energy Shifts and Widths .............................................. ..........91
B22 V. A.Shakhatov, T. B. Mavljudov, V. M. Atrazhev, N.Bonifaci, A.Denat, Z. L.Li,Spectroscopic investigation of the gas discharges in mixtures of nitrogen with helium ................ ..........92
B23 I. A. Sharov, V. Yu. Sergeev, I. V. Miroshnikov, N. Tamura, S. Sudo, B. V. KuteevElectron Density Distribution In Ablating Polystyrene Pellet Cloud ............................... ................ ..........93
B24 A. Skudra , G. Revalde, A. Svagere, Z. GavareStudies Of Spectral Line Broadening In Thallium Containing High-frequency Electrodeless Lamps ........94
B25 R. Hammami, H. Capes, F. Catoire, L. Godbert-Mouret, M. Koubiti, Y. Marandet, A. Mekkaoui, J. Rosato, R. StammA Model for Line Intensities in a Fluctuating Plasma .............................................. ....................... ..........95
B26 T.A. TkachAdvanced Relativistic Quantum Defect Approach to Calculation of the Radiation Transition and Ionization Characteristics for Rydberg Atoms .............................................. ............................ ..........96
B27 V.V. Khromov, A.E. Logunov, A.S. Pazgalev, S.G. Przhibel’skii, D. Sarkisyan, T. A. VartanyanSpectroscopy of the atom-wall interactions in a nanocell .................................... ............................ ..........97
B28 S. Cartaleva, A. Krasteva, A. Sargsyan, D. Sarkisyan, D. Slavov, T. VartanyanHigh Resolution Spectroscopy of Cs Vapor Confined in Optical Cells of Few-Micron Thicknesses ..........98
B29 P. Wcisło, R. CiuryłoDicke Narrowing Effect for r-ν-type Collisional Potential ................................... ............................. ..........99
B30 L. Benmebrouk, F. Khelfaoui Determination of the Electronic Temperature and the Electronic Density of a Discharge Plasma .............100
B31 P.K. Sergeev, R.E. Asfin, V.V. Bertsev, T.D. Kolomiitsova, D.N. Shchepkin The Reconstruction of the Absorption Bandshape from Reflection Spectra for Strong Bands. The ν3 Band of Liquefied CF4 .......................................................................................................................101
X

Spectroscopic Problems in ITER Diagnostics
V.S. Lisitsa National Research Center “Kurchatov Institute”
Kurchatov square 1, Moscow 123182, Russia
Problems of spectroscopic diagnostics of ITER plasma are under consideration. Three types of diagnostics are presented: 1) Balmer lines spectroscopy in edge and divertor plasmas; 2) charge exchange recombination spectroscopy; 3) Thomson scattering.
Diagnostics of ITER plasma based on Balmer spectral line shapes measurements is one of the main spectroscopic diagnostics. The problem of spectral line shapes calculations faces with the development of the spectral line broadening theory for the broad domain of plasma densities and temperatures changing along lines of sight and taking into account the number of effects making the influence on observed line shapes. One of the main effect is the presence of strong magnetic field resulting in the strong Zeeman splitting being of the same order of magnitude as the atom interaction with electric fields of surrounding plasma particles (Stark effect). This results in hard enough calculations of Zeeman-Stark structures of atomic energy levels at arbitrary orientation of magnetic and electric fields. Moreover, the electric fields are not static due to intense thermal motion of charged particles. The new version of FFM method provides fast codes for line shapes calculations. The main goal of the calculations is to resolve between H,D,T isotopes spectra in order to determine the isotope content in ITER. The isotope spectra are presented for different lines of sights. The problem of an inverse problem solution for extracting of isotope composition from integral spectra is discussed. Some experimental results for isotope composition observations in T-10 tokamak are demonstrated. The radiation trapping in divertor plasma is also considered. General problem of edge radiation radiation blended by strong divertor radiation emission if discussed as well. The discussion of charge exchange recombination spectroscopy is presented. Cross sections for charge exchanges between fast diagnostics atoms and carbon ions are discussed. The problem of halo atomic structure together with their charge exchange on carbon ions is under considerations as well. Some experimental data on charge exchange recombination spectroscopy on T-10 tokamak are presented. The problem of plasma background radiation emission for Thomson scattering in ITER is discussed in details. The line shape of hydrogen P-7 spectral line close to the wave length of Thomson signal is presented for line of sight typical for Thomson scattering diagnostics. The intensities of nitrogen impurity spectral lines relative to the Thomson diagnostics spectral range are also under consideration.
3

Wideband High-Resolution Spectroscopy on Al-pellet Ablation Plasmas in Large Helical Device
Masahiro Hasuoa, Hirotaka Tanakaa, Keisuke Fujiia, Taiichi Shikamaa, Shigeru Moritab and Motoshi Gotob
a Graduate School of Engineering, Kyoto University Yoshidahonmachi, Sakyo-ku, Kyoto 606-8501, Japan, [email protected] b National Institute for Fusion Science, 322-6, Oroshi-cho, Toki 509-5292, Japan
Pellets of various elements are injected into a magnetic-confined fusion plasma for the
purposes of not only investigating impurity transport but also acquiring atomic data. A pellet plunged into the plasma is ablated due to heat flux from the plasma and a plasma cloud forms in the vicinity of the pellet, from which many atomic and ionic emission lines are observed [1,2].
An aluminum pellet is injected from an outer port of the Large Helical Device (LHD). Emission from the pellet ablation plasma in a wavelength range from 390 to 770 nm is simultaneously observed by a self-made echelle spectrometer with a resolution of about 0.1 nm. More than 100 lines are resolved, in which more than 50 of Al I, Al II, Al III and Al IV lines are identified with the NIST database [3].
Figure 1(a) shows excited level populations of Al+ per unit statistical weight estimated from the observed line intensities. They are plotted against their excitation energies from the ground level. A linear dependence is clearly seen. From the slope of the line fitted to the data shown in Fig. 1(a), we determine the electron temperature, Te, to be 1.51 ± 0.04 eV [1,2]. Fig. 1(b) shows the enlarged profile of the Al II 3p2(1D)-3s4p(1P) (466.3 nm) line. Line broadening, which was not resolved in the preceding work with a low-dispersion spectrometer [2], is due to Stark broadening having a Lorentzian profile and due to the instrumental broadening approximated by a Gaussian profile. From the fit with a Voigt function to the observed profile with a known instrumental width, the Stark width, WS, is determined.
With this method, we estimate Te for the Al, Al+ and Al2+ ablation plasmas and WS of many Al II and Al III lines, and then estimate the electron density of the plasmas and the Stark broadening coefficients of the Al II and Al III lines.
Fig. 2. (a) Populations of Al+ excited levels per unit statistical weight as a function of the excitation energy. (b) Al II 3p2(1D)-3s4p(1P) emission line profile.
REFERENCES
[1]. M. Goto, S. Morita and M. Koubiti, J. Phys. B: At. Mol. Opt. Phys., 43, 144023 (2010) [2]. M. Koubiti, M. Goto, S. Morita and R. Stamm, Plasma Fusion Res. SERIES, 8, 0991 (2009) [3]. NIST Atomic Spectra Database. ver. 4
4

Quantum-Statistical Line Shape Calculations Of Dense H And H-like Plasmas
Sonja Lorenzena, August Wierlinga, Heidi Reinholza, Gerd Röpkea, Mark C. Zammitb, Dmitry V. Fursab, and Igor Brayb
aInstitute of Physics, University of Rostock, 18051 Rostock, Germany ([email protected]) bInstitute of Theoretical Physics, Curtin University of Technology, Perth WA 6845, Australia
In this contribution, we present results for the Lyman lines of hydrogen and hydrogen-like ions in dense plasmas. Full line profiles are calculated within a quantum-statistical method, based on thermodynamic Green's functions. The focus is on the contribution to broadening and shift due to free electrons beyond the Born approximation.
The self-energies of initial and final state are central quantities in the Green's function method. The real and imaginary part of the self-energy correspond to the shift and broadening of the energy levels due to the surrounding medium, respectively. Ions and electrons are treated separately. As we consider the influence of surrounding ions in quasi-static approximation, the ionic self-energy is given by the linear and quadratic Stark effect. The electronic self-energy is calculated within a quantum-statistical many-body approach based on thermodynamic Green’s functions. The Born approximation has often been applied to give a perturbative approximation for the electronic self-energy [1,2]. However, in dense plasmas, strong electron radiator collisions are relevant and have to be included, too. The effect of strong collisions can be identified as ladder-like diagrams of the electron-emitter propagator. In an effective two-particle approximation the electronic self-energy is given in terms of scattering amplitudes [3], analogously to Baranger's expressions for line shift and broadening [4]. Here, we use scattering amplitudes obtained from close-coupling calculations [5]. The isolated scattering of an electron with the emitter does not allow for medium effects. To include the screening due to free electrons in the plasma, Debye screening is implemented into the close-coupling calculations [6].
Additionally, the coupling between initial and final states is taken care of by the vertex correction. Consistently, it has to be considered in the same approximation as the electronic self-energy, i.e. in Born approximation or based on scattering amplitudes, respectively.
In our examples, the free electron density ranges between 1023 and 1026 m-3 and the temperature is between 104 and 106 K.
This work was supported by the German Research Foundation DFG within SFB652.
REFERENCES
[1] S. Günter, L. Hitzschke, and G. Röpke, Phys. Rev. A, 44, 6834 (1991)[2] S. Lorenzen, A. Wierling, H. Reinholz, and G. Röpke, Contrib. Plasma Phys., 48, 657 (2008)[3] S. Günter, phD thesis at the University of Rostock (1990)[4] M. Baranger, Phys. Rev., 112, 855 (1958)[5] I. Bray, and A. T. Stelbovics, Phys. Rev. A, 46, 6995 (1992)[6] M. C. Zammit, D. V. Fursa, and I. Bray, Phys. Rev. A, 82, 052705 (2010)
5

Spectral Line Formation with Wave Effects in Optically Thick Plasmas
J. Rosato
Laboratoire PIIM, UMR 7345 Université d’Aix-Marseille / CNRS, Centre de Saint-Jérôme, Case 232, F-13397 Marseille Cedex 20, France
In standard textbooks on radiative transfer, it is assumed that the radiation field obeys a Boltzmann-like transport equation and this equation is derived heuristically from conservation relations, using that the photon emission and absorption processes are source and loss terms. In this work, we examine the validity of this interpretation by performing a derivation of the radiative transfer equation from first principles. This is done by applying the Wigner phase space formalism to second quantization [1]. We show that a more general equation accounting for the wave nature of light can be obtained. This equation reduces to the usual radiative transfer equation only in the limiting case where both the wavelength and the coherence length are small compared to the other spatial scales of interest. This suggests that the usual radiative transfer equation may be inaccurate in cases where the wave effects are significant. We illustrate this point through application to hydrogen line shapes both in low and high density plasmas.
REFERENCES
[1]. J. Rosato, Phys. Rev. Lett., 107, 205001 (2011)
6

Hydrogen Balmer Series And Superposed Carbon Swan
Spectra in Laser-Induced Plasma
Christian Parigger and Alexander Woods
The University of Tennessee Space Institute,
Center for Laser Applications,
411 B.H. Goethert Parkway,Tullahoma, TN 3738, U.S.A.
Measurements and analysis are discussed of hydrogen Balmer series atomic lines following
laser-induced optical breakdown. Electron density on the order of 1×1025
m−3
can be measured
using Hα Stark width and line shifts for breakdown plasmas in 1 to 1.25×10⁵ Pa, gaseous
hydrogen [1]. The Hβ line can be used for electron density up to 7×10²³
m−3
. Laser ablation of
aluminium is also discussed in view of application limits of the Balmer series. Hβ and Hγ lines
show presence of molecular carbon in a 2.7 and 6.5×10⁵ Pa, expanding methane flow [2].
Superposition spectra occur due to recombination or due to onset of chemical reactions. This
necessitates analysis of both atomic and molecular emission spectra following laser-induced
optical breakdown [3]. Figure 1, shows recorded and fitted Hβ profiles, and it shows C2 Swan
band presence. Molecular excitation temperature is determined using modified Boltzmann plots
and fitting of spectra from selected molecular transitions [4].
[nm]
res
idu
al
480 483 486 489 492-0.2
0
0.2
[nm]
no
rma
lize
din
ten
sit
y
480 483 486 489 492
0
0.5
1H
data
H
fit
H
profileH
C2
Figure 1: Recorded and fitted spectra for 2.1μs delay from optical breakdown, Ne=0.5×10²³
m-3
.
REFERENCES
[1]. Parigger, C.G., and Oks, E., International Review Atomic Molecular Physics, 1, 13 (2010).
[2]. Parigger, C.G., Woods, A., Hornkohl, J. O., Applied Optics, 51, B1 (2012).
[3]. Parigger, C.G., and Hornkohl, J.O., Spectrochimica Acta A, 81, 404 (2011).
[4]. Hornkohl, J.O., Nemes, L., and Parigger, C.G., “Spectroscopy of Carbon Containing
Diatomic Molecules,” in Spectroscopy, Dynamics and Molecular Theory of Carbon
Plasmas and Vapors, Advances in the Understanding of the Most Complex High-
Temperature Elemental System, L. Nemes and S. Irle, Eds. (World Scientific), 113 (2011).
7

8
Evidence For Plasma Polarization Shift Of Ti He- Line In
High Density Laser Produced Plasma
Fida Y. Khattaka , Ombeline A.M.B. Percie du Sert
b, Frank B. Rosmej
c,d, and
Dave Rileyb
aDepartment of Physics, Kohat University of Science and Technology, Kohat-26000, Khyber Pakhtunkhwa, Pakistan
bDepartment of Physics and Astronomy, Queen’s University of Belfast, Belfast, BT7 1NN, N-Ireland, UK,
cUniversité Pierre et Marie Curie, UMR 7605, LULI, Physique Atomique dans les Plasmas denses, case 128, 4
Place Jussieu, 75252 Paris Cedex 05, France,
dEcole Polytechnique, Laboratoire pour Utilisation des Lasers Intenses, PAPD, 91128 Palaiseau Cedex, France
We have studied the spectral shift of He- (1s2
1S0 - 1s2p
1P1) line emission
(4749.73 eV) in dense plasma for the highest Z reported so far by irradiating Ti foil targets
with high contrast, 45 fs, 400 nm p-polarized pulses at 45˚ with focused intensities
reaching to ≈1x10¹⁹
W/cm2. A line shift up to 3.41.0 eV (1.9±0.55 mÅ) was observed
whereas the line width at FWHM measures up to 12.1±0.6 eV (6.7±0.35 mÅ). For
comparison we looked into the emission of the same line from plasma produced by
focusing pulses of lower intensity (≈1017
W/cm2): we observed a spectral shift of only
1.81.0 eV (0.9±0.55mÅ) and the line-width measures up to 5.80.25 eV (2.7±0.35 mÅ).
These data show a signature of plasma polarization shift of the Ti He- line.

9
Charge Exchange Signatures in X-Ray Line Emission Accompanying Plasma-Wall Interaction
Oldřich Rennera, Elisabeth Dalimierb, Richard Liskac, Eugene Oksd, Michal Šmída,c
aInstitute of Physics, v.v.i., Academy of Sciences CR, 18221Prague, Czech Republic; [email protected] bSorbonne Universités, Pierre et Marie Curie, F-75252 Paris Cedex 05, and École Polytechnique, LULI,
F-91128 Palaiseau Cedex, France cCzech Technical University in Prague, FNSPE, 11519 Prague, Czech Republic
dPhysics Department, Auburn University, Auburn, AL 36849, USA
Directional flows of energetic ions produced at laser-burnt-through foils [1] provide a flexible tool for investigation of the plasma interaction with solid surfaces (generally known as plasma-wall interaction, PWI), and for description of transient phenomena occurring in the near-wall interaction zone [2]. Highly charged ions impinging on the secondary target interpenetrate the near surface layer, collide with the counter-propagating matter and capture a large amount of electrons. This process typically results in a creation of atoms in highly excited Rydberg states or hollow ions with multiple inner vacancies, and simultaneously, the target ions undergo single- and double-electron charge transfer processes.
In experiments performed at the Prague laser system PALS, the PWI was studied using single-side irradiated double-foil targets. The plasma jet produced at the rear surface of the 0.8-μm-thick Al foil was incident on the secondary target (thick C foil), the plasma x-ray self-emission was analyzed by focusing survey and high-dispersion spectrometers. In addition to prominent high-density effects (density-dependent broadening of spectral lines, self-absorption-induced depressions in the line centers and their frequency shifts, the so-called plasma polarization shifts, PPS), the time-integrated, spatially resolved narrow-band spectra recorded close to the C surface exhibit a sufficiently well resolved dip structure (hereafter X-dips) in the red-wing profiles of the hydrogenic Al Lyγ line. In accordance with the previously published analytical model [3] and the quasi-molecular numerical codes [4], these X-dips were attributed to the charge exchange between two stationary Coulomb centers represented by the Al XIII and fully stripped C ions. The validity of this interpretation of the found Al Lyγ profile modulation in terms of quasi-molecular effects is supported by comparison with the previous experimental observations of the X-dips occurrence in emission of multi-charged ions [4,5] and by the PALE–MULTIF hydrodynamic simulations [6,7] of environmental conditions in the near-wall plasma. Details on alternate experimental configurations and plasma modeling are provided.
To conclude, we report the first high precision x-ray spectroscopic identification of charge exchange phenomena accompanying the PWI. The experimentally found positions of X-dips are in agreement with the analytical results.
This research was supported by the Czech Science Foundation, Grant No. P205/10/0814.
REFERENCES
[1] Renner O. et al, Phys. Plasmas, 18, 093503 (2011) [2] Renner O., Liska R., Rosmej F.B., Laser Part. Beams, 27, 725 (2009) [3] Oks E., Leboucher-Dalimier E., J. Phys. B: At. Mol. Opt. Phys., 33, 3795 (2000) [4] Dalimier E. et al, J. Phys. B: At. Mol. Opt. Phys., 40, 909 (2007) [5] Leboucher-Dalimier E. et al, Phys. Rev. E, Rapid Communications, 64, 065401 (2001) [6] Liska R. et al, Journ. Phys: Conf. Series, 112, 022009 (2008) [7] Larroche O., Phys. Fluids B, 5, 2816 (1993)

Effect of atomic structure on X-ray line shapes
F.B. Rosmej
University Pierre and Marie Curie, Paris, France
X-ray K-shell transitions of highly charged ions are proposed to investigate
atomic structure effects on line shapes in dense plasmas. Employing
different methods of atomic wavefunction calculations we demonstrate
that a variation of dipole matrix elements of excited states can be made
visible via X-ray K-shell transitions. The advantageous properties of
selected X-ray transitions that do neither show interference effects nor
perturbation by neighboring matrix elements are discussed with respect to
experimental observation. Specific data are presented for the H- and He-
like ions of Al (transitions np-1s and 1snp – 1s2).
10

Quasar Spectroscopy and Cosmology
D.A.Varshalovich, A.V.Ivanchik, S.A.Balashev
Ioffe Phys.-Tech.Institute, St.Petersburg, Russia
Spectra of distant quasars are the main sources of information about ��� the evolution of the Universe. The quasars are the most powerful sources ���of radiation which can be observed from distances up to 13 billions of ��� light years. Their spectra observed now were formed 13 Gyr ago and ��� somewhat later. Absorption lines were imprinted into the spectra during ���a long light travel from the quasar. Therefore, analyses of the spectra ���give us invaluable data on physical conditions and chemical (isotopic) ��� composition of matter in early epochs of the Universe evolution.
11
Broad emission lines: a tool for studying nuclei of active galaxies
Dragana Ilića, Luka Č. Popovićb, Alla I. Shapovalovac, Alexander N. Burenkovc, Wolfram Kollatschnyd, Anđelka Kovačevića, Vahram Chavushyane, Giovanni La
Muraf, Piero Rafanellif
aDepartment of Astronomy, Faculty of Mathematics, University of Belgrade, Serbia, [email protected] bAstronomical Observatory, Volgina 7, 11160 Belgrade 74, Serbia
cSpecial Astrophysical Observatory of the Russian AS, Nizhnij Arkhyz, Karachaevo- Cherkesia 369167, Russia dInstitut fuer Astrophysik, Georg-August-Universitaet Goettingen, Germany
eInstituto Nacional de Astrofısica, Optica y Electronica, Apartado Postal 51-216, 72000 Puebla, Mexico fDipartimento di Fisica e Astronomia, Universita di Padova, Vicolo dell’Osservatorio, I-35122 Padova Italy
Active galactic nuclei (AGN) are the most distant and luminous observed objects in the Universe. It is widely accepted that in the center of an AGN there is a super-massive black hole (SMBH) with an accretion disk surrounded by gas and dust. The mass of the SMBH can be derived from the dynamics of the gas gravitationally bound to a SMBH. This is the case for a broad line region (BLR), i.e. a photoionized gas in the vicinity of a SMBH that emits broad emission lines (BELs). In spite of many papers devoted to the BLR research, its true nature is not well known. Therefore, it is still important to investigate the BLR structure (size, geometry, physics, etc.), and one of the aims is to better constrain the mass of the SMBH.
The BELs are the only signatures of the BLR. They can be clearly identified in the AGN spectra and they often show complex profiles. Their fluxes, profiles and intensities can provide much information about the BLR geometry and physics. Here we will present some tools and techniques for studying the properties of the BLR gas using emission lines [1, 2, 3]. Moreover, the BELs of AGN often exhibit variability, which is assumed to be caused by variation in the ionizing continuum strength and by dynamic evolution of the BLR gas on long timescales. Therefore, an investigation of the BEL flux and profile variability during a long period is another useful tool for mapping the geometrical and dynamical structure of the BLR [4, 5, 6], and will be presented in this talk too.
REFERENCES
[1]. Ilić, D. et al., MNRAS, 371, 1610 (2006) [2]. Popović, L. Č. et al., PASJ, 60, 1 (2008) [3]. La Mura, G. et al., ApJ, 671, 104 (2007) [4]. Popović, L. Č. et al., A&A, 528, 130 (2011) [5]. Shapovalova, A. I. et al., A&A, 517, 42 (2010) [6]. Shapovalova, A. I. et al., ApJS, submitted (2012)
12

Virtual Laboratory Astrophysics: The STARK-B Database For Spectral Line Broadening By Collisions With Charged
Particles And Its Link To VAMDC
S. Sahal-Bréchot
Paris Observatory, LERMA, CNRS-UMR8112 and Université P. et M. Curie, 5 Place Jules Janssen, 92190 Meudon, France, [email protected]
.
“Stark broadening” theories and calculations have been extensively developed for about 50 years. Accurate spectroscopic diagnostics and modelling require the knowledge of numerous collisional line profiles. Nowadays, the access to such data via an on line database becomes essential. The aim of STARK-B is to reply to ths need. It is a collaborative project between the Astronomical Observatory of Belgrade (AOB) and the “Laboratoire d’Etude du Rayonnement et de la matière en Astrophysique” (LERMA). It is a database of widths and shifts of isolated lines of atoms and ions due to electron and ion impacts that we have calculated and published in international refereed journals (more than 150 papers). It is devoted to modelling and spectroscopic diagnostics of stellar atmospheres and envelopes, laboratory plasmas, laser equipments and technological plasmas. Hence, the domain of temperatures and densities covered by the tables is wide and depends on the ionization degree of the considered ion. The STARK-B [1] database is a part of VAMDC [2][3]. VAMDC (Virtual Atomic and Molecular Data Centre) is an European Union funded collaboration between groups involved in the generation and use of atomic and molecular data. VAMDC aims to build a secure, documented, flexible and interoperable e-science environment-based interface to existing atomic and molecular data. We will present STARK-B in the VAMDC context at the Conference. We will also make a mini-tutorial for the conference participants, by showing how to use the STARK-B database and the VAMDC software .
REFERENCES
[1] http://stark-b.obspm.fr [2] http://www.vamdc.eu [3] Dubernet, M. L., Boudon, V., Culhane, J. L., et al.: JQSRT, 111, 2151 (2010)
13

The Project MILLIMETRON: Investigation of Chemi-ionization Processes in The Universe.
Y.N. Gnedin, Central Astronomical Observatory at Pulkovo, Saint-Petersburg, Russia.
ABSTRACT
I discuss the key astronomical problems that can be included in strategic researches
at the intersection of Astronomy and Physics. One can expect that observations in far infrared and sub-mm ranges of electromagnetic spectrum can give information on the cold component of matter in the Universe: Rydberg atoms and molecules.
The targets of new Russian Cosmic Project “MILLIMETRON” are ultra cold stars and exo-planets. The fundamental interaction between the cold Rydberg atoms is the dominant initial process in the reionization of the Universe.
14

On the “Mystery” of Radio Recombination Lines Narrowing
Sergei Gulyaev
Institute for Radio Astronomy and Space Research,
and Jordan Alexander
Auckland University of Technology, Auckland 1142, New Zealand
In the 1990s, Morley Bell and co-authors developed a technique for measuring weak spectral lines by reducing broad baseline variations and used this technique to measure radio recombination line widths and to test the Stark broadening theory. At 6 GHz, they found that the “[processed Hydrogen] lines at large principal quantum numbers, n, are both narrower and stronger than expected from theory” and suggested, that “this behaviour is ... inconsistent with Griem’s theory”. Bell’s paper [1], with a subtitle “Confrontation with theory at high principal quantum numbers” induced a wave of publications where Bell’s finding was called an anomaly, puzzle, and even mystery. For example, Oks [2] titled his paper “On the puzzle of the observed narrowing of radio recombination lines” and Griem [3] concluded by saying that the result “remains a mystery”. The result was called a “dramatic discrepancy” [4], and it was concluded in [5] “Thus this mystery is not resolved by the present calculations”. While some authors sought an explanation of these findings in the revision of Stark broadening theory [2, 5], some remained sceptical about the frequency switching technique or suggested that it required verification [6].
Bell’s findings [1] resulted from recursive frequency switching, in software, of spectra that were initially recorded at the telescope using hardware frequency switching. Here we present the basics of multiple frequency switching and demonstrate that, if applied correctly, it has a number of advantages, e.g. it removes gain variations and does not require subjective estimates of the zero level (baseline) of a spectrum.
We show that though the technique helped Bell et al. [1] to detect RRLs with Δn greater than Δn = 6 [7], the way the method was used in [1] was not optimal; in fact, it cannot be applied for testing the theory of spectral line broadening. We present simulation based on the Lockman and Brown’s [8] model of the Orion Nebula and conventional theory of spectral line broadening. We apply observational specifications from [1], including frequency range, channel width, frequency switching offset, number of frequency switching overlaps, and noise temperature rms. Results of our simulation demonstrate good agreement with Bell’s measurements, both in line widths and line temperatures. The computed “processed” widths exhibit narrowing similar to that reported in [1]. We show that Bell’s spectral line “narrowing” can be explained naturally [9] – it is the result of the way the observational data were processed. Therefore, we argue that Bell’s findings do not contradict the existing Stark broadening theory and do not necessitate a revision of this theory.
REFERENCES
[1]. Bell, M. B., Avery, L.W., Seaquist, E. R., Vall´ee, J. P., PASP, 112, 1236 (2000) [2]. Oks, E., ApJ, 609, L25 (2004) [3]. Griem, H. R., ApJ, 620, L133 (2005) [4]. Gavrilenko, V. P., Oks, E., Phys. Scr., 76, 43 (2007) [5]. Watson, J. K. G., J. Phys. B: At. Mol. Opt. Phys., 39, 1889 (2006) [6]. Gordon, M. A., Sorochenko, R. L., Radio Recombination Lines: Their Physics and
Astronomical Applications. New York: Springer (2009) [7]. Smirnov, G. T., Sorochenko, R. L., Pankonin, V., A&A, 135, 116 (1984) [8]. Lockman, F. J., Brown, R. L., ApJ, 201, 134 (1975) [9]. Alexander, J., Gulyaev, S., ApJ, 745, 194 (2012).
15

Hydrogen Atom Collision Processes In Cool Stellar Atmospheres: Effects On Spectral Line Strengths And
Measured Chemical Abundances In Old Stars
Paul S. Barklema
aDepartment of Physics and Astronomy, Uppsala University, Box 515 S75120, Uppsala, Sweden ([email protected])
The precise measurement of the chemical composition of stars is a fundamental problem
relevant to many areas of astrophysics. State-of-the-art approaches attempt to unite accurate descriptions of microphysics, non-local thermodynamic equilibrium (non-LTE) line formation and 3D hydrodynamical model atmospheres. In this paper I review progress in understanding inelastic collisions of hydrogen atoms with other species and their influence on spectral line formation and derived abundances in stellar atmospheres. These collisions are a major source of uncertainty in non-LTE modelling of spectral lines and abundance determinations, especially for old, metal-poor stars, which are unique tracers of the early evolution of our galaxy.
Full quantum scattering calculations of direct excitation processes
€
X(nl) +H↔ X(n' l') +H and charge transfer processes
€
X(nl) +H↔ X + +H − have been done for Li, Na and Mg [1,2,3] based on detailed quantum chemical data, e.g. [4]. Rate coefficients have been calculated and applied to non-LTE modelling of spectral lines in stellar atmospheres [5,6,7,8,9]. In all cases we find that charge transfer processes from the first excited S-state are very important, and the processes affect measured abundances for Li, Na and Mg in some stars by as much as 60%. Effects vary with stellar parameters (e.g. temperature, luminosity, metal content) and so these processes are important not only for accurate absolute abundances, but also for relative abundances among dissimilar stars.
REFERENCES
[1]. Belyaev, A. K., Barklem, P. S., Phys. Rev. A, 68, 062703 (2003) [2]. Belyaev, A. K., Barklem, P. S., Dickinson, A. S., Gadéa, F. X., Phys. Rev. A, 81, 032706 (2010) [3]. Belyaev, A. K., Barklem, P. S., Spielfiedel, A., M.Guitou, N. Feautrier, D. S. Rodionov, D. V. Vlasov, Phys. Rev. A, 85, 72 032704 (2012) [4]. Guitou, M., Spielfiedel, A., & Feautrier, N., Chem. Phys. Lett., 488, 145 (2010) [5]. Barklem, P. S., Belyaev, A. K., Asplund, M., A&A, 409, L1 (2003) [6]. Barklem, P. S., Belyaev, A. K., Dickinson, A. S., Gadéa, F. X., A&A, 519, A20 (2010) [7]. Belyaev, A. K., Barklem, P. S., Spielfiedel, A., M.Guitou, N. Feautrier, A&A in press (2012) [8]. Lind, K., Asplund, M., Barklem, P. S., A&A, 503, 541 (2009) [9]. Lind, K., Asplund, M., Barklem, P. S., Belyaev, A. K., A&A, 528, A103 (2011)
16

Inelastic Collision Processes for Formation of Spectral Line Shapes in Stellar Atmospheres. Reprojection Method.
Andrey K. Belyaev
Department of Theoretical Physics, Herzen University, Moika 48, St. Petersburg 191186 Russia [email protected]
Inelastic collision processes, especially in collisions with hydrogen atoms and hydrogen
negative ions, are important for formation of spectral line shapes in stellar atmospheres, see, e.g., [1,2]. Solutions of the non-local thermodynamic equilibrium (non-LTE) radiation transfer problems in stellar atmospheres require detailed and complete knowledge of many low-energy inelastic collision processes such as excitation and de-excitation, ion-pair production and mutual neutralization processes. The radiative and collision processes affect the statistical equilibrium of a given atomic species of interest since they determine atomic level populations and finally formation of spectral line shapes. A difficulty regarding the collision processes is to determine which, among the almost endless possibilities in a stellar atmosphere, are important. There are the two obvious candidates for the case of the solar atmosphere: inelastic collisions with electrons and with hydrogen atoms. The importance of electron collisions in many environments is arising from the fact that electrons have a higher collision rate. Hydrogen atoms are the most abundant perturber by far. Nowadays, it is recognized that the widely used Drawin formula does not provide reliable data for inelastic collision rate coefficients [3]. Experimental data are not available in many cases of interest, so calculations remain practically the only source of low-energy inelastic collision data. The full quantum treatment is required as the best option. The majority of theoretical quantum treatments of inelastic collisions is performed within the Born-Oppenheimer approach. Electronic structure calculations can be performed with high accuracy, e.g., making use of well-developed quantum-chemical packages. Having accurate potential energies and nonadiabatic couplings, it is expected that a nonadiabatic nuclear dynamical treatment is accomplished with high accuracy as well. On the other hand, conventional applications of the Born-Oppenheimer approach encounter severe problems leading to physical paradoxes such as infinite inelastic cross sections [4]. The problems have become treated as the fundamental limitation of the entire Born-Oppenheimer approach in its application to collision processes. The reprojection method [4-7] solves the problem mentioned above. The detailed analysis shows that the conventional application of the Born-Oppenheimer approach indeed has the limitations, while the reprojection method does not have such limitations. Finally, the reprojection method is free from physical artifacts and provides reliable inelastic cross sections and rate. The efficiency of the method will be demonstrated at the conference.
REFERENCES
[1]. Asplund M., ARA&A, 43, 481 (2005) [2]. Barklem P. S., 21 ICSLS, Invited talk, (2012) [3]. Barklem P. S., Belyaev A. K., Guitou M., et al, Astronomy & Astrophysics, 530, A94 (2011) [4]. Belyaev A. K., Phys. Rev. A, 82, 060701(R) (2010) [5]. Grosser J., Menzel T., Belyaev A. K., Phys. Rev. A, 59, 1309 (1999) [6]. Belyaev A. K., Egorova D., Grosser J., Menzel T., Phys. Rev. A, 64, 052701 (2001) [7]. Belyaev A. K., Phys. Scripta, 80, 048113 (2009)
17

Quasimolecular Absorption And Emission In Cd + Ar And Kr Collisions
Alekseeva O.S.a,b, Devdariani A.Z.b,c, Lednev M.G.a, Zagrebin A.L.a,b
aDepartment of Physics, Baltic State Technical University, St. Petersburg,Russia, e-mail: [email protected] bInstitute of Physics, St. Petersburg State University, Ul’janovskaja St. 1, Peterhof, 198504, Russia cDepartment of Physics , Herzen State Pedagogical University of Russia, St. Petersburg, Russia
We report on the theoretical study of qusimolecular absorption and emission near the
forbidden line Cd ( )3 12 05 P 5 S− in a mixture of cadmium vapor with inert gases (argon and
krypton). By using the semiempirical method of quasimiolecular term analysis [1] and available experimental potentials [2-6] the interaction potentials of the excited atoms Cd* + Kr and Cd* + Ar and the probabilities of the transitions were calculated. Based on them the processes of quasimolecular absorption and emission in Ar and Kr in collisions with Cd atoms were considered and the absorption coefficients and emission spectra were calculated. For the ground state the potentials determined in [5, 6] have been used.
The results of calculations of the spectral distributions of the absorption coefficients ( )abs , K T ∆ωℏ of mixtures of cadmium vapor with krypton and argon for T = 300 K and T = 700 K
are presented on Fig. 1. Emission spectra for the same temperatures are presented on Fig. 2.
Fig. 1. The spectral distributions of the absorption coefficients of mixtures of cadmium vapor with krypton and argon for T = 300 K and T = 700 K
Fig. 2. The normalized spectral distribution for the quasimolecular emission of mixtures of cadmium vapor with krypton and argon for T = 300 K and
T = 700 K at high pressure
REFERENCES
[1]. Alekseeva O.S., Devdariani A.Z., Zagrebin A.L., Lednev M.G., Russian Journal of Physical Chemistry B, 5, 946 (2011)
[2]. Funk D.J., Kvaran A., Breckenridge W.H., J. Chem. Phys., 90, 2915 (1989) [3]. Ruszczak M., Strojecki M., Koperski J., Chem. Phys. Lett., 416, 147 (2005) [4]. Kvaran A., Funk D.J., Kowalski A., Breckenridge W.H., J. Chem. Phys., 89, 6069 (1989) [5]. Koperski J., Kiełbasa Sz. M., Czajkowski M., Spectrochim. Acta, 56A, 1613 (2000) [6]. Koperski J., Łukomski M., Czajkowski M., Spectrochim. Acta, 58A, 2709 (2002)
18

The GEISA Spectroscopic Database for Remote sensing of Planetary Atmospheres: Content
Description and Spectral Line Shapes Assessment
Nicole Jacquinet-Husson, Laurent Crépeau, Raymond Armante, Chérif Boutammine, Alain Chédin, Noëlle Scott, Cyril Crevoisier, Virginie Capelle
Laboratoire de Météorologie Dynamique (LMD), Ecole Polytechnique, 91128 Palaiseau, France
Numerous physical phenomenon that influence the radiative transfer of a planet can be
discerned and often measured from the variation of specific spectral features. As a consequence, spectroscopy is at the root of modern planetology, enabling us to determine the physical properties of planets remotely. The accuracy of the, in such studies, generally used forward line-by- line models is affected in many ways, and uncertainty in the spectroscopic information is one of the greatest impacts in direct and inverse planetary radiative transfer.
Since quality of its reference information strongly impacts applications of planetary remote sensing, there is an acute and constant demand for validated, operational and interactive public spectroscopic databases that are comprehensive and trustworthy. In this context, the ARA group at LMD (http://ara.abct.lmd.polytechnique.fr) develops and maintains, for over three decades, GEISA1 (Gestion et Etude des Informations Spectroscopiques Atmosphériques: Management and Study of Atmospheric Spectroscopic Information), a computer accessible database system. GEISA, in its latest 2011 edition, comprises three independent sub-databases devoted respectively to: line parameters (50 molecules involved, including 111 isotopes, for a total of 3,794,448 entries, in the spectral range from 10-6 to 35,877.031 cm-1), infrared and ultraviolet absorption cross-sections, microphysical and optical properties of atmospheric aerosols.
The role of molecular spectroscopy in modern atmospheric research has entered a new phase with the launches of highly sophisticated spectroscopic instruments and associated computing systems Since the launch of
Metop-A (http://www.eumetsat.int/Home/Main/Satellites/Metop/index.htm?l=en, GEISA is the reference basis for the validation of the level-1 IASI (http://smsc.cnes.fr/IASI/index.htm) data (http://smsc.cnes.fr/IASI/index.htm), using the 4A radiative transfer model2 (4A/LMD; 4A/OP co-developed by LMD and Noveltis- http://www.noveltis.fr/, with the support of CNES).
The contents and access of each of the three sections of the GEISA 2011 edition will be presented. The quality requirements for spectroscopic line parameters will be specified with a specific emphasis for detailed assessment of the line shape parameters.
GEISA is freely accessible from the CNRS/CNES/IPSL expertise center website Ether (http://ether.ipsl.jussieu.fr/) and used on-line by more than 300 laboratories working in the domains of atmospheric physics, astronomy and astrophysics, and planetology.
References
1NJ-H, LC, R A, C. B, A C, N-A S, C C, V C, C B, N P –C, A B, A C, D C, Y B, B B, V B, L-R B, L-H C, A C, V D, V-M D, S F, A F, J-M F, A G, M H, G-J H, D J, A J, I K, A K, F. K-T, N L, N L, L-H X, O-M L, J-Y. M, A M, S M, C-E M, T M, N M-A, H-S-P M, AN, J O, V P, A P, D-T P, A P-C, C-P R, J-J R, M R, M-A-H S, K S, S T, J T, R-A T, A-C V, J V-A. Journal of Quantitative Spectroscopy & Radiative Transfer, 112, 2395 (2011).
2N-A S, AC. Journal of Applied Meteorology , 20, 556 (1981).

20
Satellite Bands In Spectra Of Collision Pairs Induced By Interaction Of Transient Optical Dipoles
Vadim A. AlekseevInstitute of Physics, St.Petersburg State University, Ul’janovskaja St.1, Peterhof, 198504 St.Petersburg, Russia
e-mail: [email protected].
It has been reported that absorption and fluorescence excitation spectra of Xe/CF4 mixtures in the Vac UV region display numerous bands coinciding with energies of the Xe atom states increased by one quantum energy of the IR active ν 3 mode of CF4 [1].. These satellite bands correspond to Xe (G) + CF4 (v3=0) + hν → Xe(DF) + CF4 (v3=1) (1)transitions, where G and DF denote the ground and dipole-forbidden states of the Xe atom. Satellites near transitions to the resonance (R) states, Xe (G) + hν → Xe (R), are especially strong when Xe( DF ↔ R ) is a dipole allowed transition. Some of them are readily seen when Xe and CF4
pressure is only few mbars. The satellites acquire strength owing to mixing of Xe(DF) + CF4 (v3=1) forbidden and Xe(R) + CF4 (v3=0) resonance states induced by interaction of Xe (DF ↔ R) and CF4 ( v3=0 ↔ v3=1) transient dipoles. Similar satellite bands have been observed in spectra of Xe+C2F6
and Na+CF4 collision pairs [1-3]. One may find other examples of A(G) + B(G) + hv → A(DF) + B(R) processes strongly enhanced by the accidental proximity of A(DF ↔ R) and B(G ↔ R) energies ([1] and references cited therein). A particular example is H(1s) + Li(2s) + hv → H(2s) + Li(2p) (2)transition. The Li(2s ↔ 2p) and H (2s ↔ 3p) energies differ by 330 cm−1 and, respectively, (2) is shifted by the same energy from the H(1s → 3p) Lβ resonance. Transition to the dipole forbidden H(2s) + Li(2p) state acquires strength owing to admixture of H(3p) + Li(2s) resonance state character induced by interaction of the H (2s ↔ 3p) and Li(2s ↔ 2p) transient dipoles. Due to the large
difference in Li (2s ↔ 2p) and CF4 (v3=0 ↔ v3=1) dipole moments ( 0.34 and 14 D respectively), the cross sections of (1) and (2) may differ by a factor of 104. The following two features make process (2) of special interest: (i) H and Li are abundant elements in the Universe;(ii) Li beam injection method is used as a tool for diagnostics of confined hydrogen reach plasmas. Intensity of (2) is proportional to the [H]x[Li] product and it may be used to monitor the binary concentration of atoms. Experimentally transition (2) may be observed in a Vac UV transmission spectrum of overlapped effusive beams of H and Li atoms. Such an experiment might provide data to evaluate applicability of this process for the diagnostic purpose.
REFERENCES
[1] Alekseev V.A., Schwentner N., J.Chem.Phys. 135, 044313 (2011)[2] Alekseev V.A., Schwentner N., Chem. Phys. Lett. 463, 47 (2008). [3] Alekseev V. A., J. Grosser J. , O. Hoffmann O., Rebentrost F., J.Chem. Phys. 129, 201102 (2008).

QED Theory Of The Spectral Line ProfileFor Few-Electron Atoms And Ions
Oleg Yu. Andreeva
aV.A. Fock Institute of Physics, Faculty of Physics, St. Petersburg State University, ul. Ulyanovskaya 1, RU-198504, St. Petersburg, Russia
e-mail: [email protected].
A review of the current status of the theoretical study of spectral line profile for systems with few electrons is presented. The line-profile approach (LPA) [1] is introduced for the investigation of the energy levels within the framework of QED. In particular, the energy of the levels, transition probabilities, one and two electron capture cross-sections [2-4], overlap of the resonances, asymmetry of the line profile beyond the resonance approximation [5] are considered. The line profile for cascade processes is also investigated [6]. Results of the corresponding calculations are presented.
REFERENCES
[1]. O.Y. Andreev, L. N. Labzowsky, G. Plunien, and D. A. Solovyev,Phys. Rep., 455, 135 (2008)[2]. O.Yu. Andreev, L.N. Labzowsky, and A.V. Prigorovsky, Phys. Rev. A, 80, 042514 (2009)[3]. O.Yu. Andreev, L.N. Labzowsky, and A.V. Prigorovsky, Phys. Rev. A, 83, 064501 (2011)[4]. E.A. Chernovskaya, O.Yu. Andreev, and L.N. Labzowsky, Phys. Rev. A, 84, 062515 (2011)[5]. L. Labzowsky, G. Schedrin, D. Solovyev, E. Chernovskaya, G. Plunien, and S. Karshenboim, Phys. Rev. A, 79, 052506 (2009)[6]. L. Labzowsky, D. Solovyev, and G. Plunien, Phys. Rev. A, 80, 062514 (2009)
21

Optical lattice clocks: Hz-level spectral width with sub-Hz reproducibility
Tetsuya Ido
National Institute of Information and Communications Technology 4-2-1 Nukui-kitamachi, Koganei, Tokyo, 184-8795 Japan
Time and frequency standards are one of major applications of precision spectroscopy. While the second in International System of units is presently defined by the hyperfine splitting of the 133Cs atoms, considerable progress of optical precision spectroscopy in the last decade has realized a number of optical clocks which surpass the accuracy and stability of the best cesium microwave clocks. In the last century, state-of-the-art optical clocks are based on precision recoil-free spectroscopy of singly trapped ions, where the signal intensity of the spectroscopy is so weak that it is difficult to obtain the Hz-level line shape by a single scan of the laser frequency. The situation has changed after the invention of the lattice clocks that utilize 104-105 neutral atoms [1]. Lots of quantum absorbers provide strong signal which enables Hz-level line shape by a single scan of laser with the scanning rate of ~Hz/s.
87Sr lattice clock developed in National Institute of Information and Communications Technology (NICT) provides a line shape with a spectral width of 12Hz (FWHM). While the stability of the clock laser at 698nm is not good as Hz-level, the fluctuation of the laser frequency is compensated by referring more stable laser at 729nm available in NICT. A frequency comb phase-locked to the 729nm laser has a comb component at 698nm as well. 698nm clock laser is phase-stabilized to this comb component to eliminate the frequency fluctuation [2].
Lately, the community of time and frequency standards has begun a serious discussion toward the redefinition of the second. One important issue to be resolved for the redefinition is how to distribute highly stabilized optical signals to remote sites without degradation. Developing the transfer technique will also enable the accurate comparison of two physically separated clocks. The confirmation of the identical frequency between distant clocks is critical to maintain the universality of the frequency standard. For this purpose, transfer using optical fiber network is the most promising tool. From the campus of NICT, a dark fiber link of 60km to the Univ. of Tokyo (UT) has lately been available [3]. We performed the fiber-based comparison of our clock with another clock operated in UT. The detail of the result that demonstrates the agreement of the frequency in sub-Hz regime will be presented [4]. The comparison clearly shows the relativistic frequency difference of the two clock frequencies due to the differential elevation of 65m.
The author and collaborators in NICT greatly thank H. Katori and the group member in the UT for the fruitful cooperation on the fiber-link experiment.
REFERENCES
[1] M. Takamoto, F. Hong, R. Higashi and H. Katori, Nature 435, 321 (2005). [2] A. Yamaguchi, et al., Appl. Phys. Express 5, 022701 (2012). [3] M. Fujieda, M. Kumagai, S. Nagano, A. Yamaguchi, H. Hachisu and T. Ido, Opt. Express 19 16498 (2011). [4] A. Yamaguchi et al., Appl. Phys. Express 4, 082203 (2011).
22

Optical Frequency Comb as a New Tool for Broadband High Resolution Spectroscopy
Piotr Maslowskia, Aleksandra Foltynowiczb, Ticijana Banc, Kevin Cosseld, Jun Yed
a Instytut Fizyki, Uniwersytet Mikołaja Kopernika ul. Grudziadzka 5,87-100 Torun, Poland. bDepartment of Physics, Umeå University, 901 87 Umeå, Sweden,
cInstitute of Physics, Bijenicka Cesta 46, Zagreb, Croatia dJILA, National Institute of Standards and Technology and University of Colorado, Department of Physics,
University of Colorado, Boulder, Colorado 80309-0440, USA
Optical frequency combs have revolutionized many fields of physics over the past dozen years. They are produced by mode-locked femtosecond lasers, whose spectrum in the optical domain spans hundreds of terahertz and consists of hundreds of thousands of equidistant narrow modes (comb teeth). The frequency of each comb tooth is determined by two radio frequencies: repetition rate of the laser and carrier-envelope frequency [1]. By establishing a direct link between the RF and optical domains, optical frequency combs have become the perfect tool for frequency metrology. The ability to serve as a precise frequency ruler has been utilized in conventional laser spectroscopy, enabling frequency-comb–assisted techniques.
A new approach employs optical frequency combs directly for spectroscopic measurements, in a technique called direct frequency comb spectroscopy (DFCS) [1]. It combines two distinct capabilities: extremely high spectral resolution of single comb component and broad spectral coverage of mode-locked femtosecond laser. As a result, the technique is virtually equivalent to a simultaneous measurement with tens of thousands of narrow linewidth lasers. Due to its very regular spectrum, the optical frequency comb can be efficiently coupled into an optical enhancement cavity, which improves vastly the interaction length with the sample. The method, called cavity-enhanced (CE) DFCS, can reach absorption sensitivities at a level of 10-10 cm-1 Hz-1/2 per spectral element. Thus it has the potential to become a real-time, highly sensitive, broad-bandwidth, high-resolution technique for line shape analysis, as well as for applications such as breath analysis, atmospheric research or studies of cold molecules.
In this talk, the principles of the CE-DFCS technique and related experimental implementations will be discussed. Two frequency-comb-based Fourier transform spectrometers working in the important near-infrared (1.53 – 1.57 µm) [3] and mid-infrared (2.8 – 4.2 µm) regions [2,4] will be presented in detail. They utilize Er:fiber laser and Yb:fiber laser down-converted by the optical parametric oscillator, respectively, as a source of light. These spectrometers are able to deliver high-resolution (up to 120 MHz) spectra of numerous molecular species in a few seconds acquisition time with simultaneous bandwidth of up to 150 nm. We achieve sensitivity of 2×10-12 cm-1 per spectral element in 400 s - the fundamental shot noise limit in the case of the near-infrared spectrometer.
REFERENCES
[1] F. Adler, M. J. Thorpe, K. C. Cossel, and J. Ye, Annual Review of Analytical Chemistry 3, pp. 175-205 (2010). A. Marian, M. C. Stowe, J. Lawall, D. Felinto, and J. Ye, Science 306, 2063 (2004).
[2] F. Adler, P. Maslowski, A. Foltynowicz, K. C. Cossel, T. C. Briles, I. Hartl and J. Ye, Opt. Express 18, 21861 (2010).
[3] A. Foltynowicz, T. Ban, P. Masłowski, , F. Adler, J. Ye, Phys. Rev. Lett. 107, 233002 (2011). [4] A. Foltynowicz, P. Masłowski, A. Fleischer, B. Bjork, J. Ye, Appl. Phys. B, accepted (2012).
23

Spectral peculiarities of matter excitation by ultrashort EM pulses
Astapenko V.A. [email protected]
Moscow Institute of Physics and Technology
Review of recent theoretical and experimental works devoted to matter excitation by ultrashort EM pulses (USP) is presented including methods of generation of USP with prescribed parameters (pulse duration and shape, carrier-evelope phase, frequency chirp etc), experiments demonstrated phase dependence of ultrashort interactions, number of theoretical works considering various aspects of the problem and original author theoretical results. The latter includes new formula for total probability of photoprocess which is derived in the frame of perturbation approach and applicable for one-cycle and subcycle USP. Developed formalism is used for description of photo-excitation of atoms, optical centers in solids and UPS scattering on atoms and plasmas. In nonperturbation regime the excitation of bound-bound transitions by USP is studied numerically with the help of Bloch vector fromalism. It is shown that characteristic of matter excitation by USP such as spectral shape of carrier distribution function in solids depends upon phase parameters of the pulse, namely, carrier-envelope phase, frequency chirp and pulse duration.
24

Optical and RF Spectroscopy of Spin Noise
E. B. Aleksandrov 1 and V. S. Zapasskii 2
1 Ioffe Physico-Technical Institute, Saint-Petersburg, Russia 2 Saint-Petersburg State University, Quantum Optics Laboratory, Saint-Petersburg, Russia
The technique of spin noise spectroscopy (SNS) proposed in early 80s [1] and strongly developed during the last several years [2,3] is considered as an optical technique of magnetic resonance. Spectral shape of the RF “noise signal”, in the vicinity of the Larmor frequency of the spin-system, is determined by magnetic characteristics of the paramagnet and, in fact, provides its magnetic resonance spectrum. Behavior of the other degree of freedom of the Faraday-rotation-based SNS, related to its optical channel, is controlled not only by magneto-optical characteristics of the system, but also, in a rather sophisticated way, with the nature of the optical transitions [4].
In the lecture, we will outline the state of the art in development the present-day spin noise spectroscopy and will consider informative capabilities of the optical and RF spectroscopy of spin fluctuations detected by means of magneto-optics. .
1. E. B. Aleksandrov and V. S. Zapasskii, JETP 54, 64 (1981)
2. S. A. Crooker, D. G. Rickel, A. V. Balatsky, and D. Smith, Nature, 431, 49 (2004)
3. G. M. Muller, M. Oestreich, M Romer, and J. Hubner, Physica E, 43, 569 (2010)
4. V. S. Zapasskii, A. Greilich, S. A. Crooker, Y. Li, G. G. Kozlov, D. R. Yakovlev, D. Reuter, A. D. Wieck, and M. Bayer, 2012 (in press)
25

High Precision Line Shape Studies In Low Pressure
Ammonia For An Accurate Determination Of The
Boltzmann Constant
C. Daussy, C. Lemarchand, M. Triki,
Laboratoire de Physique des Lasers, UMR 7538 CNRS, Université Paris 13, 99 av. J.-B. Clément, 93430
Villetaneuse, France
E-mail: [email protected]
NH3 is a very important molecule for interstellar and planetary observations. It is the main
molecule observable in a variety of astrophysical environments and it is present in the interstellar
medium, in giant planets of solar system, in brown dwarfs, and in cometary coma. Accurate
knowledge of the NH3 spectrum – especially the strong 2 band in the 10 µm region – as well as
lineshape parameters are in particular indispensable to enable astrophysical and planetary
interpretations. In this talk, we focus on the lineshape analysis of a single isolated rovibrational
absorption line. Under controlled temperature and pressure, absorption profiles provide a probe
of intermolecular interactions that directly affect the molecular dynamics. We present here an
accurate lineshape analysis of a self-broadened rovibrational absorption transition of ammonia in
the strong 2 band, recorded by linear absorption laser spectroscopy. Spectra are recorded at very
low pressures and analyzed using various models (which include Dicke narrowing or speed-
dependent effects) which enables to determine the profile which best matches the data. Accurate
lineshape parameters are then deduced from a least-squares fit of the data.
Our current project aiming at measuring the Boltzmann constant, kB, by laser spectroscopy
will straight away benefit from such knowledge [1,2]. In this experiment the main source of
uncertainty comes from the modelisation of collisional effects which directly affects the
absorption lineshape used for analysis [2]. We present here an accurate determination of the
mp c f bs p p f l p m s’ c s that of the Boltzmann constant. We
anticipate that a first optical determination of kB with a competitive uncertainty of a few ppm is
now reachable.
REFERENCES
[1]
C. Daussy, M. Guinet, A. Amy-Klein, K. Djerroud, Y. Hermier, S. Briaudeau, C. J. Bordé,
and C. Chardonnet, Phys. Rev. Lett. 98, 250801 (2007)
[2] Peter J. Mohr, B. N. Taylor, and D. B. Newell, arXiv:1203.5425 (2012)
[3]
C. Lemarchand, M. Triki, B. Darquié, C. J. Bordé, C. Chardonnet, and C. Daussy, New J.
Phys., 13, 073028 DOI: 10.1088/1367 (2011)
26

Metal Atom Spectral Line Broadening by Noble Gas Atoms
A.V. Demura1, S.Ya. Umanskii2, A.V. Scherbinin3, A.V. Zaitsevskii1
1 Hydrogen Energy & Plasma Technology Institute, National Research Center “Kurchatov institute”, Kurchatov Square 1, Moscow 123182, Russia
2N.N. Semenov Institute of Chemical Physics RAS, Kosigina Street 4, Moscow 117992, Russia 3Faculty of Chemistry, Moscow State University, Leninskie Gory, Moscow 119991, Russia
The complex universal approach for calculation of the binary broadening of metal atoms spectral lines by buffer noble gas atoms is presented [1]. The approach is based on utilizing the modified Buckingham type analytic potential for the description of interatomic interaction. The parameters of this potential for the particular atomic radiative transition in the target atom and a particular perturbing atom, which determine its behavior at small interatomic distances, are found by fitting the potential curves, obtained for the case under consideration by ab initio quantum chemical calculations. The Van der Waals part of this potential is calculated using both ab initio modeling and the perturbation theory in the molecular basis. The latter allows to get more universal expressions than ab initio methods. The parameterized modified Buckingham type potential for the particular atomic radiative transition of a target atom and a particular perturbing atom is then used for calculations of the total line profile in the framework of the Unified Frank Condon Theory (UFCT). The first basic step in generating UFCT profile is the derivation of its impact limit. It is done in the semiclassical approximation with account of strong Coriolis coupling between the degenerate quasimolecular electronic states. As the impact frequency range corresponds to distant collisions, only the explicit Van der Waals part of the potential is used. Then since the main contribution is given by large values of angular momenta (correspondingly by large internuclear distances) the rectilinear trajectory of the colliding particles can be assumed, and it is possible to neglect coupling between atomic states with different projections of the atomic angular momentum on the axis, normal to the collision plane. This allows to get explicit analytical expressions for the impact line width [1]. The outer from impact range of frequency detunings is described by the UFCT expression, splitting the variation of impact parameters in two regions. In the first region, which is close to the turning point, the trajectory is constructed taking into account short range character of the potential and using the Takayanagi approximation. In the second region of larger impact parameters the trajectories can be considered as rectilinear. Moreover, it is assumed that the quasimolecular dipole moment of the radiative transition varies very slowly versus internuclear distance. So, it could be put as constant, factored out and canceled during normalization of the profile. The further study of the reduced Frank-Condon factor versus detuning allows establishing qualitative properties of the profile in the asymptotic red and blue wings, as well as the appearance of satellites [1]. And at last this knowledge of asymptotic behavior of the profile gives possibility of the total profile representation in a more simple approximate way on the basis of Van der Waals broadening, introducing general receipts for the characteristic frequency cut-offs for the red and blue wings [1].
REFERENCES
[1] A.V. Demura, S.Ya. Umanskii, A.V. Scherbinin, A.V. Zaitsevskii, G.V. Demchenko, V.A. Astapenko, B.V. Potapkin, Evaluation of Van der Waals Broadening Data, IRAMP, 2012, accepted for publication
27

Highly-Accurate Line Shape Studies in the Near-IR Spectrum of Water
Livio Gianfrani
Dipartimento di Scienze Ambientali, Seconda Università di Napoli, Via Vivaldi 43, I-81100 Caserta, Italy
Water is the most important polyatomic molecule in the Universe. So far, it has been detected in a variety of astronomical objects from the ground as well as from satellite and airborne plat-forms. It is an important constituent of the Earth’s atmosphere, being responsible for the majority of the greenhouse effect. Water vapor is also a major product of most combustion processes. Therefore, it is no surprise that the spectrum of water has been the subject of numerous experi-mental and theoretical studies for decades. Nowadays, there is a growing need of high-quality spectroscopic parameters, traditionally used to describe absorption spectra, for H2O as well as other radiatively important molecules, in the near- and mid-infrared spectral regions. The accu-rate determination of positions, strengths, and pressure broadened widths of individual spectral lines requires a detailed and thorough understanding of spectral line shapes. Furthermore, H2
18O has been recently proposed as thermometric substance in Doppler-width thermometry, which is a relatively new method for determining the absolute temperature of a gaseous system at thermo-dynamic equilibrium [1, 2]. It consists in retrieving the Doppler width from the accurate observa-tion of the spectral line shape corresponding to a given atomic or molecular line. Also in this ap-plication, the precise modeling of the line shape is an important ingredient [3]. With such strong motivations, a specific study on line shape deviations from the usual Voigt profile in the near-IR spectrum of water is being performed, since a few years. Particularly, a great attention is paid to the role of speed-dependence of relaxation rates. From the experimental point of view, high spec-tral fidelity has been reached by using the technique of offset-frequency locking of a pair of ex-tended cavity diode lasers [4]. In such a system, the master laser is frequency stabilized against a narrow sub-Doppler molecular line, while the slave laser is actively controlled so that its emis-sion frequency maintains a given offset with respect to the frequency of the master laser. This method allows to perform highly accurate and reproducible frequency scans of the slave laser around a given vibration-rotation line.I will present recent results and discuss the implications for the spectroscopic determination of the Boltzmann constant [5].
REFERENCES
[1]. Casa G., Castrillo A., Galzerano G., Wehr R., Merlone A., Di Serafino D., Laporta P., and Gianfrani L., Phys. Rev. Lett., 100, 200801 (2008)[2]. Castrillo A., Casa G., Merlone A., Galzerano G., Laporta P., and Gianfrani L., C. R. Phys., 10, 894 (2009)[3]. De Vizia M.D., Moretti L., Castrillo A., Fasci E., and Gianfrani L., Mol. Phys., 109, 2291 (2011)[4]. Castrillo A., Fasci E., Galzerano G., Casa G., Laporta P., and Gianfrani L., Optics Express, 18, 21851 (2010)[5]. De Vizia M.D., Rohart F., Castrillo A., Fasci E., Moretti L., and Gianfrani L., Phys. Rev. A, 83, 052506 (2011)
28
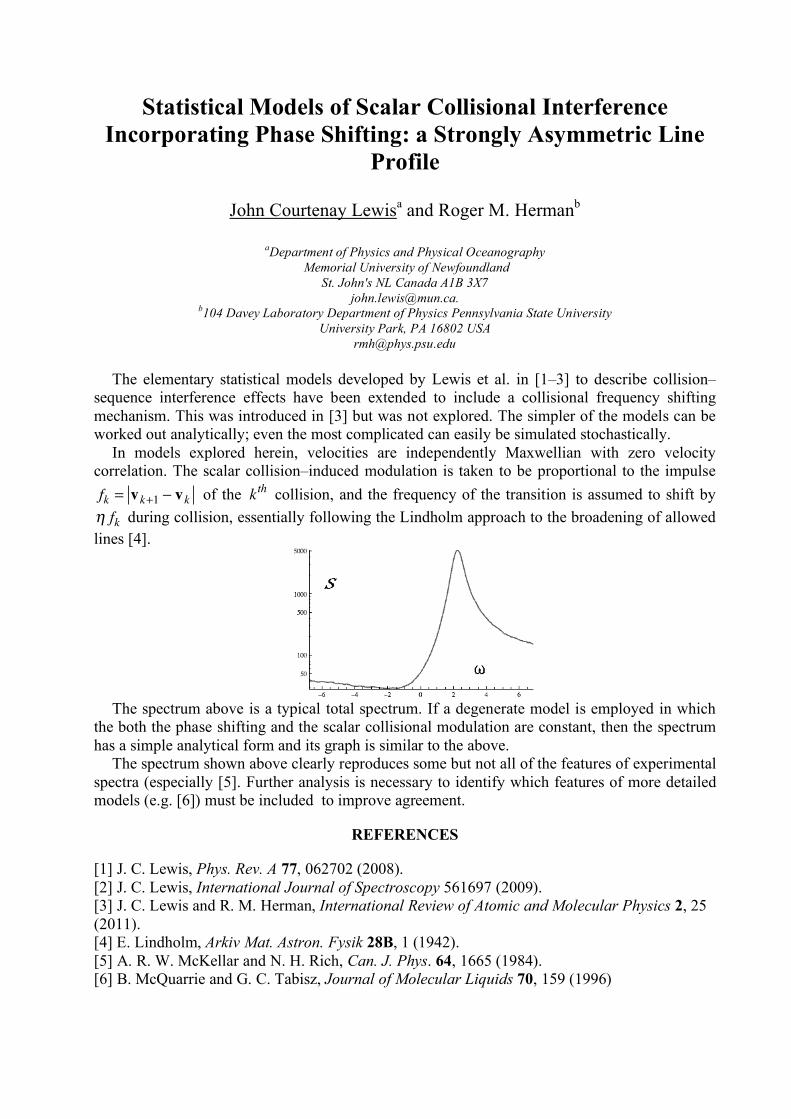
Statistical Models of Scalar Collisional Interference Incorporating Phase Shifting: a Strongly Asymmetric Line
Profile
John Courtenay Lewisa and Roger M. Hermanb
aDepartment of Physics and Physical Oceanography Memorial University of Newfoundland
St. John's NL Canada A1B 3X7 [email protected].
b104 Davey Laboratory Department of Physics Pennsylvania State University University Park, PA 16802 USA
The elementary statistical models developed by Lewis et al. in [1–3] to describe collision–sequence interference effects have been extended to include a collisional frequency shifting mechanism. This was introduced in [3] but was not explored. The simpler of the models can be worked out analytically; even the most complicated can easily be simulated stochastically.
In models explored herein, velocities are independently Maxwellian with zero velocity correlation. The scalar collision–induced modulation is taken to be proportional to the impulse fk = vk+1 ! vk of the kth collision, and the frequency of the transition is assumed to shift by ! fk during collision, essentially following the Lindholm approach to the broadening of allowed lines [4].
The spectrum above is a typical total spectrum. If a degenerate model is employed in which
the both the phase shifting and the scalar collisional modulation are constant, then the spectrum has a simple analytical form and its graph is similar to the above.
The spectrum shown above clearly reproduces some but not all of the features of experimental spectra (especially [5]. Further analysis is necessary to identify which features of more detailed models (e.g. [6]) must be included to improve agreement.
REFERENCES
[1] J. C. Lewis, Phys. Rev. A 77, 062702 (2008). [2] J. C. Lewis, International Journal of Spectroscopy 561697 (2009). [3] J. C. Lewis and R. M. Herman, International Review of Atomic and Molecular Physics 2, 25 (2011). [4] E. Lindholm, Arkiv Mat. Astron. Fysik 28B, 1 (1942). [5] A. R. W. McKellar and N. H. Rich, Can. J. Phys. 64, 1665 (1984). [6] B. McQuarrie and G. C. Tabisz, Journal of Molecular Liquids 70, 159 (1996)

Coulomb Broadening of ResonanceInduced by Standing Wave
O. V. Belaia, D. A. Shapiroa,b
aInstitute of Automation and Electrometry, Siberian Branch, Russian Academy ofSciences, 1 Koptjug Avenue, Novosibirsk, 630090 Russia, [email protected].
bNovosibirsk State University, 2 Pirogov Street, Novosibirsk 630090, Russia.
Coherent preparation of quantum states of atoms and ions by laser light can lead to elec-tromagnetically induced transparency and related effects [1]. In particular, the standingwave at the adjacent transition induces a new type of nonlinear resonance in the probe-field spectrum of a three-level system. The reason of the resonance is the effect ofhigh-order harmonics of atomic coherence [2]. However, the broadening of resonancewas unclear. The paper describes how the velocity changing collisions broaden theresonance. The analytic formulas taking into account up to 4-th order of the perturba-tion theory are presented. The numerical calculations are described [3]. The analyticalformulas are shown to give a similar qualitative behavior to the measured nonlinear ab-sorption spectrum. The numerical computation demonstrates the quantitative agreementwith experiment. The Coulomb dephasing is discussed as the physical mechanism of thebroadening.
REFERENCES
[1] Fleischhauer M., Imamoglu A., Marangos J. P., Rev. Mod. Phys., 77, 633 (2005).
[2] Babin S. A. et al, Phys. Rev. A, 67, 043808 (2003).
[3] Belai O. V., Shapiro D. A., Opt. Spectr., 100, 888 (2006).
30

New Modeling of H2O Isolated Line-Shape Based On Classical Molecular Dynamics Simulations
H. Trana, N. H. Ngoa, and R. R. Gamacheb
aLISA, CNRS UMR 7583, Univeristés Paris-Est Créteil and Paris Diderot, 94010 Créteil Cedex, France [email protected]
bDepartment of Environmental, Earth, and Atmospheric Sciences, University of Massachusetts Lowell, 265 Riverside Street, Lowell, MA 01854, USA.
It is well known that the Voigt profile does not well describe the measured shapes of
isolated lines. This is due to the neglect of the intermolecular collision-induced velocity changes and of the speed dependence of the collisional parameters. We present here a new line profile model for pure H2O and H2O in N2 (and air) which takes both of these effects into account. The speed dependence of the collisional parameters has been calculated by a semi-classical method. The velocity changes have been modeled by using the Keilson-Storer collision kernel with two characteristic parameters. The latter have been deduced from classical molecular dynamics simulations which also indicate that, for pure H2O and H2O/N2, the correlation between velocity-changing and state-changing collisions is not negligible, a result confirmed by the analysis of measured spectra. A partially Correlated Speed-Dependent Keilson-Storer model has thus been adopted to describe the line-shape. Comparisons between simulated spectra and measurements for several self- and N2 (and air)- broadened lines at various pressures show excellent agreements.
31

Mg-H collision rates for non-LTE determination of stellar atmospheric parameters
M. Guitoua, A. K. Belyaevb, A. Spielfiedelc, N. Feautrierc and P. S. Barklemd
aUniversité Paris-Est,, Laboratoire MSME UMR 8208 CNRS, 5 Bd Descartes, 77454, Marne-la-Vallée, France bDepartment of Theoretical Physics, Herzen University, St. Petersburg 191186, Russia
cLERMA UMR 8112 CNRS, Observatoire de Paris, 92195 Meudon Cedex, France dDepartment of Physics and Astronomy, Uppsala University, Box 515 S-75120 Uppsala, Sweden.
Non-LTE modeling implies competition between radiative and collisional processes. The
influence of inelastic hydrogen atoms collisions, dominant in cold atmospheres has been and remains to be a significant source of uncertainty for stellar abundance analysis. In the particular case of Mg atoms, a large number of electronic states of the MgH molecule as well as the associated couplings that mix the states during the collision were calculated by high level quantum chemical methods [1] and then used in full quantum scattering calculations. This allows to treat the excitation processes between the seven lowest atomic states of magnesium in collision with hydrogen atoms, as well as the ion-pair production and the mutual neutralization processes [2,3]. The detailed mechanisms involved during the collision process have been analysed in details [3]. Our calculations show that the usual approximate formulae (Drawin, Kaulakis) lead to errors by factors up to 106. As was already found in Li+H and Na+H collisions, excitation processes were found to be less important than charge transfer processes. However, unlike Li [4] and Na [5], Mg has different spin terms, singlet and triplet, leading both to doublet molecular MgH electronic states. Collisional rates between spin-allowed and spin-forbidden atomic states are found to be of the same order of magnitude although spin-forbidden states are only radiatively coupled. Thus we may expect consequences on non-LTE calculations.
REFERENCES
[1]. Guitou M., Spielfiedel A., Feautrier N., Chem. Phys. Lett., 488, 145 (2010) [2]. Guitou M., Belyaev A. K., Barklem P. S., Spielfiedel A., Feautrier N., J. Phys. B, 448, 035202 (2011) [3] Belyaev A. K., Barklem P. S., Spielfiedel A., Guitou M., Feautrier N., Rodionov D. S., Vlasov D. V., Phys. Rev. A, 85, 032704 (2012) [4] Belyaev A. K., Barklem P. S., Phys. Rev. A, 68, 062703 (2003) [5] Belyaev A. K., Barklem P. S., Dickinson A. S., Gadéa F. X., Phys. Rev. A, 81, 032706 (2010)
32
Single-shot lineshape spectroscopy and light statistics
K.A.Vereshchagina, A.K. Vereshchaginb
General Physics Institute, Vavilov Str.38, 119991, Moscow, Russia a [email protected]
At single-shot lineshape spectroscopy we mean the use of so-called «broadband case» of spectroscopy when laser sources have spectral widths wider than width of transition under investigation, and contour of a spectral line can entirely be registered at a multichannel photodetector (OMA) "in one stage" (during one laser shot). Such approach can be applied to express-measurements of spectral lines profiles in non-stationary conditions and in «short-living» objects. A «price» for it is: not so high spectral resolution, being defined in this case by properties of the dispersive device used for the spectral analysis. Usually a broadband laser radiation has not a continuous spectrum, but – mode's structure that means: radiation is present only on certain frequencies of a spectrum and is absent in intervals between modes [1]. With use such a laser the contour of a spectral line will be defined in several (by number of modes) points and with the accuracy depending on fluctuations of mode’s amplitudes and phases, being belong to the spectral range occupied with a contour on frequencies scale. Thus, the contour of a spectral line is being "painted" not continuously, but – is discrete, only at mode's localization places over the spectrum of laser radiation; in a sense it is similar to «painting» of a contour "point-by-point" at scanning of frequency of a narrow-band laser source with the certain step equal to the mode spacing. The response of the spectral device on each mode represents by itself a profile of slit function, and superposition of slit functions profiles from each of modes is forming a resulting signal shape on the detector. With equal amplitudes of modes, aggregate of peak values from each of slit function profile in places of modes localization will describe a total spectral line profile. At casual distribution of amplitudes and phases of modes of broadband radiation, the contour of a spectral line can be considerably deformed, up to full unrecognizability. Thus, at «single-shot» lineshape spectroscopy, the basic role will be played by mode’s structure of laser sources radiation and by statistics of this radiation [2]. Even at possibility of a signal accumulation (work under "accumulation/averaging on N shots" mode of operation) the average value of the measured amplitudes of a signal in each of contour points can differ considerably, and arbitrarily, from it’s mathematical expectations. To the full this statement concerns the case of "scanned" variant of the lineswhape spectroscopy with use of a narrow-band tunable laser under "accumulation/averaging on N shots" mode of operation. In the present contribution the possibilities of use for lineshape spectroscopy the broadband laser sources with various types of light statistics are considered. Possibilities of getting of light with the preset statistics of fluctuations are discussed.
REFERENCES
[1]. O. Svelto. Principles of Lasers. Springer; 5th ed. edition (2009). [2]. J.W.Goodman. Statistical Optics, Wiley-Interscience Publ., New York (1985).
33

Rotational energy transfer and spectral line shapes of small molecules viewed by time resolved four-wave mixing
G. Knopp, P.P. Radi, Y. Sych, P. Matsyutenko, Y. Liu and T. Gerber
Paul Scherrer Institut, CH-5323 Villigen, Switzerland [email protected]
Rotational energy transfer (RET) can either be viewed in the frequency- or in the time domain. The treatment of optical line shapes as relaxation problem of statistical physics ascertains a relation between the band wing shape and rotational relaxation processes. Collisions typically cause a phase shift in the radiation and a population change of the upper and lower levels by intermolecular energy transfer. Because of complexity in the case of coherent FWM, relaxation is often treated phenomenologically by including the population and coherence relaxation times T1 and T2. Once the spectroscopic lines overlap in frequency, coherent line mixing effects may lead to additional difficulties in the FWM-signal evaluation. Coherent fs time-resolved FWM, and in particular fs-CARS, is highly sensitive for the investigation of collision induced changes in optical line shapes especially when line mixing occurs and frequency resolved measurements often come to their limits [1]. A system of two colliding species at the closest approach looks very similar to a bound complex rotating over its center of mass. The initial translational energy of the two colliding species can be viewed as totally converted to rotational and internal energy of the (pseudo-rotating) collision complex. Considering that the finite lifetime (c) of this intermediate is defined through the time-energy uncertainty relation t E ≥ ћ and the energy transfer is limited by E, the ‘angular momentum and energy corrected sudden approximation’ (AECS), based on fs-CARS measurements has been developed [2,3]. The defined interaction time (collision duration) Δt ≈ tc
is the crucial free fit parameter describing the energy transfer between the two colliding species. Various collision systems (N2-N2, N2-rare gas, C2H2-C2H2, CO-CO) have been investigated. The signals are fitted by using the AECS scaling law, in which the number of free model fit parameters is only two (A0, c), preserving the excellent agreement to the experimental data. Fs-CARS exclusively probes dynamics occurring in the ground electronic state. To study the more complex excited-state relaxation dynamics, we presently employ electronically resonant time- resolved two-colour FWM. For parallel laser field polarizations, the measured fs-TCFWM signals reveal ‘population’ decays and characteristic beating patterns, which originate from the generation of ‘rotational coherences’ in the excited states [4]. Fs-FWM signals from C2 matching the strong a3 – d3 ro-vibronic transition moments in the ‘Swan-Band’ region at ~514 nm have been measured in an acetylene flame.
REFERENCES
[1]. Knopp G., Beaud P., Radi P.P. Tulej M., Bougie B., Cannavo D., Gerber T., J. Raman Spectrosc., 33, 861 (2002). [2] Beaud P., Knopp G., Chem. Phys. Lett., 371, 194 (2003). [3] Knopp G., Radi P.P., Tulej M., Gerber T., Beaud P.,J.Chem. Phys., 118, 8223 (2003). [4] Walser A.M., Meisinger M., Radi P.P., Gerber T. Knopp G., PCCP, 11, 8456 (2009).
34

Doppler Profile Particularities in Supersonic Beams forCircular, Square and Arbitrary Collimating Apertures
M. Bruvelis a, N. N. Bezuglova,b and A. Ekersa
aLaser Centre, University of Latvia, LV-1002 Riga, Latvia , [email protected]. bFaculty of Physics, St.Petersburg State University, 198904 St. Petersburg, Russia
Since the collimation angle of particle beams is always finite, the residual Doppler broadening for laser excitation (at the wavelength λ ) in the direction perpendicular to the particle beam axis is also finite, often comparable with the natural linewidth. Conventionally one involves Gaussian function to describe the Doppler profile P (∆ν) [1]. In an earlier study we have found the residual Doppler profile for circular collimating aperture of the supersonic beam is non Gaussian, where by a convenient analytical representation Pc (∆ν)=√1 − ∆ν2 / ∆νD can be used for most essential, core part of the profile [2].
We present here a general case of arbitrary form collimating aperture when the Doppler profile can be expressed via the double integration over the nozzle exit plane area A and the aperture plane area A , where v is the atom speed in the supersonic beam, v f is the characteristic flow velocity, ∆ v f is the velocity dispersion, L is the distance from the nozzle to the collimating aperture, see Eq. (1). Numerical calculations for square and circular collimating aperture are shown in Fig. 1. Given in Fig. 1 these results show that the Doppler profile differs considerably from the ordinary Gaussian shape.
PD (∆ν)=1
A A∫A
dx dy∫Adxdy∫0
∞dv
v2
√π v f2 ∆ v f
exp ((v−v f )
2
∆ v f2 )δ( ∆ν−
(x− x)L λ
) (1)
REFERENCES
[1]. G.Scoles, Atomic and Molecular Beam Methods (Oxford, New York, 1998) [2]. N. N. Bezuglov, and M. Yu. Zaharov, et al , Opt. Spectrosc. 102, 819 (2007)
Figure 1: Numerical calculations of the Doppler profile in the supersonic beam with square and circular collimating aperture. Core part of Doppler profile for circular collimating aperture is also shown.
35
CARS Investigation of Collisional Broadening and Shift of the Hydrogen Q-branch Transitions by Water at High
Temperatures
K.A.Vereshchagin1, A.K.Vereshchagin1,a,V.V.Smirnov1, O.M.Stel’makh1, V.I.Fabelinsky1,W.Clauss2, M.Oschwald2
1General Physics Institute, Vavilov Str.38, 119991, Moscow, Russia 2German Aerospace Center (DLR) Space Propulsion Institute, Langer Grund, 74239, Hardthausen, Germany.
When CARS-spectroscopy is used for combustion studies, complex spectral calculations must
be carried out. Such calculations require knowledge of the non-linear susceptibilities of the sample, as well as an understanding of the collisional relaxation processes responsible for the broadening and shift of the spectral lines. From a more fundamental point of view, accurate measurement of Raman line shape parameters can provide valuable information on the intermolecular potentials.
While CARS itself can be used to deduce line-broadening and line-shift information, the CARS spectrum depends on both the absorptive and dispersive parts of the non-linear susceptibilities, as well as a non-resonant background contribution, making the analysis of the collisional processes responsible for the forming of the spectral line shape more complicated [1]. Namely, interference from the non-resonant background produces asymmetry in the CARS line shape and additional line-shift, depending on magnitude and sign of non-resonant background.
To carry out the research of spectral lines shapes at high temperatures and pressures we have had to work with high pressure H2/O2 pulsed burner [2]. We have developed a high-resolution (~0.1 cm-1) spectroscopic technique that allows single-shot CARS-spectra of hydrogen Q-branch molecular transitions to be obtained in non-stationary media. The method is based on the application of a Fabry-Perot interferometer to the spectral analysis of a broadband (BB) CARS-spectral line profile with detection of an interference pattern by a CCD-detector [3].
In the present contribution we report on measurements of collisional broadening and shifting coefficients of Q1, Q3, Q5, Q7 and Q9 lines of hydrogen molecules broadened and shifted by collisions with water molecules in temperature range 2200 - 3500 K. This study can illustrate the use of CARS-spectroscopy as a tool for single-shot high-resolution lineshape spectroscopy.
REFERENCES
[1]. Hall, R.J., Eckbreth, A.C., in: «Laser Applications», Vol. 5, Eds. Ready, J. F. & Erf, R.K., Academic Press, Orlando, Florida, pp. 213-309 (1984). [2]. W.Clauss, D.N.Klimenko, M.Oschwald, K.A.Vereschagin, V.V.Smirnov, O.M.Stelmakh, V.I.Fabelinsky. J.Raman Spectrosc., 33, 906 (2002). [3]. K.A.Vereschagin, V.V.Smirnov, O.M.Stelmakh, V.I.Fabelinsky, W.Clauss, D.N.Klimenko, M.Oschwald, A.K. Vereschagin, J.Raman Spectrosc., 36, 134 (2005).
36

Spectroscopy of Atomic Vapors in Nanometer Cells: Dicke Narrowing and Beyond
Tigran A. Vartanyan
St. Petersburg National Research University of Information Technologies Mechanics and Optics, Kronverkskii pr. 49, St. Petersburg, 197101, Russian Federation. E-mail: [email protected]
Sub-Doppler spectroscopy of gaseous media confined in thin pillbox cells was pioneered by
R.H. Dicke [1]. In the past, this particular work attracted much less attention compared to his famous work [2] devoted to “Dicke narrowing” in buffer gas where the atoms or molecules perform a random work or diffusive motion instead of being bounced back and forth between the walls of the cell in a completely predetermined nature. The situation is going to be changed as atomic spectroscopy becoming an essential part of mobile devices for civil and military applications that require tiny spectroscopic cells [3].
The main idea of [1] is that in a pillbox shaped cell the slowly moving atoms contribute most to the absorption as well as to the fluorescence simply because they spend more time in their free flights between the walls. Dealing with the microwave region R.H. Dicke employed a standing wave in a cell one half wavelength thick. This particular choice of the width guarantees that all atoms experience the field oscillations of the same phase.
The role of the slowly moving atoms and their transient polarization in the presence of only one boundary was highlighted just a little before by J.L. Cojan [4]. His theory of the sub-Doppler spectral line shapes in reflection was developed in more details in [5]. By merging these two approaches we have developed a theoretical description of optical reflection from and transmission through the narrow slice of atomic vapors [6]. Contrary to the microwave regime, the standing wave approximation was not used assuming an antireflection coating to be applied on the rear wall of the cell. A manifold of line shapes was obtained depending on the width of the cell. An unusual interference between transient polarizations with the period doubled compared to familiar Fabri-Perot resonances is shown to lead to four fold enhancement of the reflection amplitude as well as switching between even and odd spectral line shapes.
It was not until the invention of an Extremely Thin Cell (ETC) by D. Sarkisyan [7] that the observation of these effects becomes possible in the optical domain. Since that time the field is flourishing with a number of linear and nonlinear optical effects observed in the ETC in different laboratories.
An additional feature of ETC is a possibility to explore the atom-wall interaction. Although important information have been obtained from the position and distortion of the central part of the spectral line [8], far wings provide information on the interaction at still smaller distances from the solid surface. The current progress in the far wings investigations will be presented.
REFERENCES
[1]. Romer R. H. Dicke R.H. Rhys. Rev., 99, 532 (1955). [2]. Dicke R.H. Rhys. Rev., 89, 472 (1953). [3]. Hasegawa M. Sensors and Actuators A, 167, 594 (2011). [4]. Cojan J.L. Ann. Phys. (Paris), 9, 385 (1954). [5]. Schuurmans M.F.H. J. Phys. (Paris), 37, 469 (1976). [6]. Vartanyan T.A., Lin D.L. Rhys. Rev. A, 51, 1959 (1995). [7]. Sarkisyan D. et al. Opt. Comm., 200, 201, (2001). [8]. Laliotis A. et al. Proc. SPIE, 6604, 660406 (2007).
37
Shape of Atomic Lines Emitted by Liquid Helium
N. Bonifaci1, F Aitken1, V. M. Atrazhev2, K. Von Haeften3, J. Eloranta4
1 Laboratoire G2Elab CNRS & Joseph Fourier University, 25 rue des Martyrs, 38042 Grenoble, France 2 Joint Institute for High Temperatures, RAS, Moscow, 125412
3Departement of physics and Astronomy, University of Leicester, UK 4Department of Chemistry,University of California, USA
Emission spectroscopy studies of liquid helium have a long history. Experimental techniques, such as high energy electron bombardment, α-particle bombardment, corona discharge, strong field ionization by femtosecond laser pulses, vacuum UV excitation and synchrotron radiation, have been employed. The corona discharge in liquid helium is realized in our work and it serves as a source of emitted atoms. Spectral lines of the light emitted by the corona can be used to determine conditions surrounding the emitted atoms or molecules.
In liquid helium the excited He* and He2* species have been established to reside inside voids with a radius ranging from (7 – 15) Å (“bubble states”). Such structures are the result of the Pauli repulsive exchange interaction between the Rydberg electron of the excited atom and surrounding helium atoms. The excited atom and atoms from its environment are far enough each other in the “bubble state”. So, the long-length asymptotic of the repulsive potential is important for formation of this state. The object of the report is a comparison of spectra observed in liquid helium with one from discharge in He-gas.
In a gas, the “impact” interaction of radiator with surrounding atoms determines the symmetric Lorentzian profile of spectral lines with shift and width are proportional to the gas density. The shift sign (“blue shift” for the shift toward shorter wavelengths) is characteristic of radiator-perturbator repulsion. Well known measurements showed the blue shift of the line 706 nm (33S-23P transition) in low density He gas. They were made using discharge in low pressure gas (< 10 Torr) and gave the symmetric Lorentzian profile of the line. An instant change of a radiation phase due to collisions between radiator and perturbator determines the “impact” profile of the line. In this case, a short-length of the inter-atomic potential is important. Thus, different spatial parts of the potential work in the bubble state (liquid) and in a gas.
The cryoplasma in helium under pressures (0.1 -0.2) MPa at temperature of 4.2K allows us to observe lines of HeI in liquid He. Shift and shape of the atomic line of 706 nm were measured for these conditions. The line has a width less than the “impact” gaseous one. In order to explain the experimental data in a framework of a model of “bubble state”, The long-length part of He*(33S)-He(11S) potential has been calculated. The contribution of 120 cm-1 repulsive “hump” near 5 Å in the potential leads to creation of an empty cavity with radius depended on applied pressure. The profile of a medium density of the cavity boundary was calculated using Bosonic Density Functional Theory (BDFT), which can provide a more rigorous microscopic description of the liquid and especially the gas-interface region (boundary) surrounding the cavity. The interaction of an excited atom with a medium distribution with the density profile n(R) calculated by BDFT results in deformation of an emitted line shape. The line profile was calculated using statistic approximation for given distribution of n(R). Line shifts and widths as a function of pressure were extracted from the experimental data and compared to the theoretical predictions, establishing that the nascent He* atoms reside in a bubble state within the liquid. It was observed that the experimental data could only be consistently reproduced if the excited He* atoms emit in a less dense environment as compared to the rest of the bulk liquid.
Russian participant of the work (V. M. A.) thanks the Russian Foundation for Basic
Researches grant 12-08-91052 for support.
38

Effect of X-ray Line Spectra Profile Fitting with Pearson VII and Pseudo-Voigt Functions on Asphalt Binder Aromaticity
and Crystallite Parameters
K. Gebresellasiea, J. Shirokoffb and J. Courtenay Lewisa
aDepartment of Physics and Physical Oceanography, Memorial University of Newfoundland, St. John’s, Newfoundland, A1B 3X7, Canada.
bFaculty of Engineering and Applied Science, Memorial University of Newfoundland, St. John’s, Newfoundland, A1B 3X5, Canada.
Asphalt is a sticky, black viscous liquid or semi-solid of chemical composition that varies
considerably depending on feedstock such as crude oil, bituminous coal, and natural sources. Most modern day asphalt production is currently derived from petroleum refining (distillation) of crude oils. In spite of their origin, three major components that are usually found in asphalts (asphalt binders) consist of asphaltenes, resins and oils (aromatic hydrocarbons, and alkanes i.e. saturated hydrocarbons) [1]. The molecular structure of asphalts is important to understand since it affects the physical and aging (oxidation) properties of asphalt as well as how the molecules may interact with each other and with additional components such as crushed stone used in making asphalt roads and highways.
XRD methods developed by Warren, Franklin and Diamond and have been used recently to study petroleum asphaltenes with improvements in instrumentation and computer software [10].
In this work, X-ray line spectra profile fitting using Pearson VII, pseudo-Voigt and the newly introduced generalized Fermi functions [2] was performed on asphalt binders to enable the calculation of their aromaticity and crystallite size parameters. The effect of Pearson VII, pseudo-Voigt and generalized Fermi function on results are presented and discussed in terms of the peak profile fit parameters used, peak de-convolution procedure, uncertainties in calculated values that can arise owing to peak shape, peak features in the pattern and crystallite size according to asphalt models (Yen [3,4], modified Yen [1] or Yen-Mullins [1,6,7]) and theories discussed. Interpretation of these results is important in terms of evaluating the performance of asphalt binders used in highways and road applications.
REFERENCES
[1]. Mullins O. C. et al. Eds, Asphaltenes, Heavy Oils and Petroleomics, Springer, NY, (2007) [2]. Eyssautier J., Levitz P., Espinat D. et al., J. Chem Phys. B 115, 6827 (2011) [3]. Yen T. F., Fuel Sci. Technol. Int. 10, 723 (1992) [4]. Yen T.F., J.G. Erdman and S.S. Pollack, Anal. Chem. 33, 1587 (1961) [5]. Tanaka R., Sato E., Hunt J.E. et al., Energy Fuels 18, 1118 (2004) [6]. Mullins O. C., Energy Fuels 24, 2179 (2010) [7]. Mullins O.C. et al., Offshore Technol. Conf, OTC 20464, 1-9 (2010) [8]. Goual L., Sedghi M., Zeng H. et al., Fuel 90, 2480 (2011) [9]. Hesp S.A.M., Illiuta S. and Shirokoff J., Energy & Fuels 21, 1112 (2007) [10] Shirokoff J. and Lewis, J.C. in 20th Int. Conf. Spectral Line Shapes, CP1290, AIP, 274
(2010) [11] Siddiqui M.N., Ali M.F. and Shirokoff J., Fuel 81, 51 (2002)
39

Vibrational Spectra of Molecular Fluids in Nanopores
V.V.Arakcheev and V.B.Morozov
International Laser Center and Physics Department of M.V. Lomonosov Moscow State University Moscow 11999, [email protected]
Vibrational spectroscopy methods and coherent Raman scattering techniques in particular can be an effective tool for probing molecular fluids filling pores of transparent nanoporous host materials. The fluid confined in pores of several nanometers in diameter can be in the gaseous, adsorbed on pore walls and liquid-like states simultaneously, that are characterized by definite values of spectral width and shift therefore multi-component composite system should be taken into consideration. Based on modeling adsorption and condesation inside pores, spectral behavior of molecular medium is associated with thermodynamical parameters (pressure, density, temperature), as well as the characteristics of porous material structure (the average pore radius distribution etc.). Available transparent materials like nanoporous glasses, polymers, aerogels, zeolites provide a wide range of pore radiuses and morphology and allow realizing different confinement conditions. Recently we applied coherent anti-Stokes Raman spectroscopy (CARS) method to study fluid adsorption and condensation in pores of nanoporous glasses [1-4].
On the other hand, spectroscopic approach can be applied to nanoporous host structures evaluation. The analysis of spectroscopic data allows to recognize the condensation conditions and then to estimate the mean pore radius. The transformation of spectra at condensation in nanopores allows to determine the pressure range at which pores are only partially filled with condensed fluid. This pressure range is directly connected with the pore radius distribution [3,4]. Comparison of spectral contributions intensities makes it possible to determine the amount of adsorbate and to calculate internal surface area of pores. Furthermore, the level of nonresonant background in CARS signal can be used for the porosity estimation. Then, the developed approach gives fundamental opportunity for complex characterization the structure of transparent nanoporous materials.
In the present paper, CARS spectroscopy was applied to diagnostics of phase behavior of a molecular subcritical, nearcritical and supercritical carbon dioxide in pores of nanoporous glasses. Obtained results show that even at supercritical temperature and high enough pressures, molecular medium inside pores contains an interphase boundary, that may be characterized as a critical point shift manifestation in pores.
The work is supported by Russian Foundation for Basic Research (projects 11-02-01309-a, 11-02-12112-ofi-m-2011).
REFERENCES
1. Arakcheev V.G., Valeev A.A., Morozov V.B., Olenin AN., Las. Phys., 18, 1451 (2008).2. Arakcheev V. G., Bagratashvili V.N., Valeev A.A., et al., Russian Journal of Physical
Chemistry B, 3, 57 (2009).3. Arakcheev V.G., Valeev A.A., Morozov V.B., Moscow University Physics Bulletin, 66,
147 (2011).4. Andreeva O.V., Arakcheev V.G., Bagratashvili V.N., J.Ram.Srectr., 42, 1747 (2011).
40
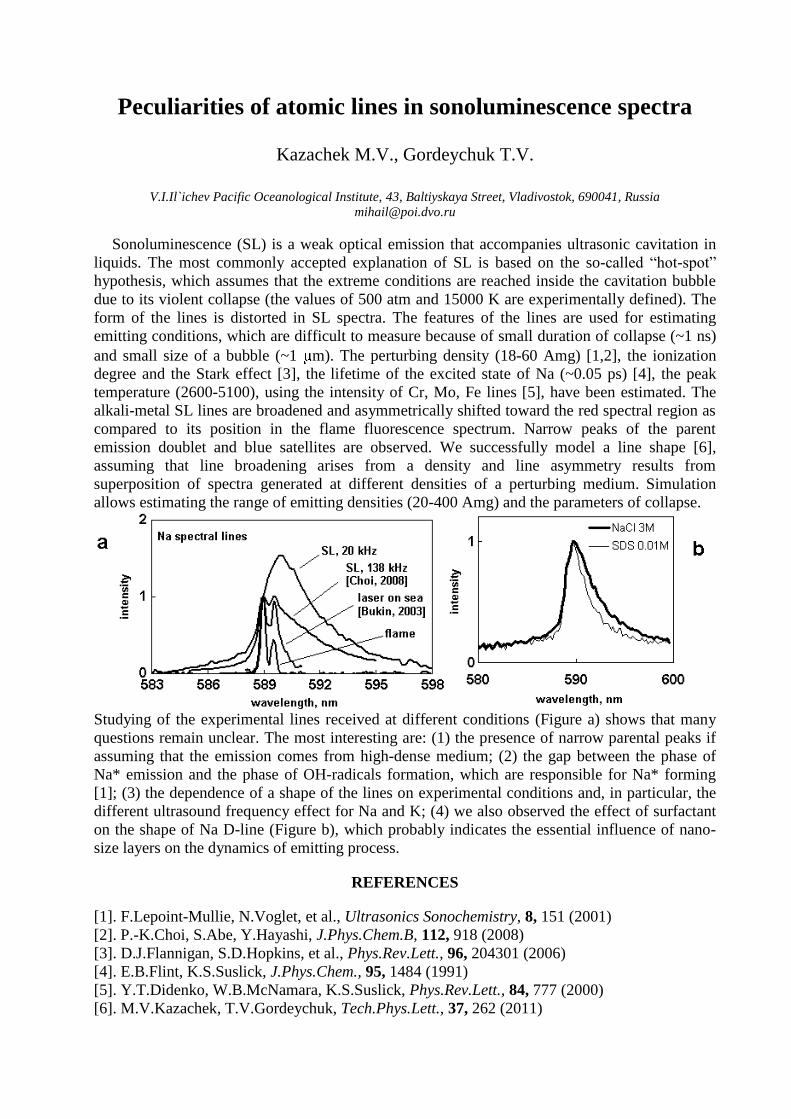
Peculiarities of atomic lines in sonoluminescence spectra
Kazachek M.V., Gordeychuk T.V.
V.I.Il`ichev Pacific Oceanological Institute, 43, Baltiyskaya Street, Vladivostok, 690041, Russia
Sonoluminescence (SL) is a weak optical emission that accompanies ultrasonic cavitation in
liquids. The most commonly accepted explanation of SL is based on the so-called “hot-spot”
hypothesis, which assumes that the extreme conditions are reached inside the cavitation bubble
due to its violent collapse (the values of 500 atm and 15000 K are experimentally defined). The
form of the lines is distorted in SL spectra. The features of the lines are used for estimating
emitting conditions, which are difficult to measure because of small duration of collapse (~1 ns)
and small size of a bubble (~1 m). The perturbing density (18-60 Amg) [1,2], the ionization
degree and the Stark effect [3], the lifetime of the excited state of Na (~0.05 ps) [4], the peak
temperature (2600-5100), using the intensity of Cr, Mo, Fe lines [5], have been estimated. The
alkali-metal SL lines are broadened and asymmetrically shifted toward the red spectral region as
compared to its position in the flame fluorescence spectrum. Narrow peaks of the parent
emission doublet and blue satellites are observed. We successfully model a line shape [6],
assuming that line broadening arises from a density and line asymmetry results from
superposition of spectra generated at different densities of a perturbing medium. Simulation
allows estimating the range of emitting densities (20-400 Amg) and the parameters of collapse.
Studying of the experimental lines received at different conditions (Figure a) shows that many
questions remain unclear. The most interesting are: (1) the presence of narrow parental peaks if
assuming that the emission comes from high-dense medium; (2) the gap between the phase of
Na* emission and the phase of OH-radicals formation, which are responsible for Na* forming
[1]; (3) the dependence of a shape of the lines on experimental conditions and, in particular, the
different ultrasound frequency effect for Na and K; (4) we also observed the effect of surfactant
on the shape of Na D-line (Figure b), which probably indicates the essential influence of nano-
size layers on the dynamics of emitting process.
REFERENCES
[1]. F.Lepoint-Mullie, N.Voglet, et al., Ultrasonics Sonochemistry, 8, 151 (2001)
[2]. P.-K.Choi, S.Abe, Y.Hayashi, J.Phys.Chem.B, 112, 918 (2008)
[3]. D.J.Flannigan, S.D.Hopkins, et al., Phys.Rev.Lett., 96, 204301 (2006)
[4]. E.B.Flint, K.S.Suslick, J.Phys.Chem., 95, 1484 (1991)
[5]. Y.T.Didenko, W.B.McNamara, K.S.Suslick, Phys.Rev.Lett., 84, 777 (2000)
[6]. M.V.Kazachek, T.V.Gordeychuk, Tech.Phys.Lett., 37, 262 (2011)

Fast Fourier Transform of the Frantz-Keldysh oscillations from the InGaAs/GaAs/AlGaAs structures with the nonuniform built-in electric field
L P Avakyants1, P Yu Bokov1, A V Chervyakov1, I P Kazakov2, E A Trufanov1
1 M V Lomonosov Moscow State University, Moscow, Russia 2 P N Lebedev Physical Institute RAS, Moscow, Russia
E–mail: [email protected] Semiconductor structures based on GaAs compounds with different carrier concentration
are investigated by the method of photoreflectance spectroscopy. Photoreflectance spectra were measured at room temperature with a double graiting
monochromator [1]. The modulation of reflectance has been made by 5 mW He-Ne laser irradiation (633 nm).
The samples under investigations are n-GaAs layers with different carrier concentrations: 3·1017 cm-3, 6·1017 cm-3, 4·1018 cm-3. To apply the Fast Fourier Transform a program to convert the experimental photoreflectance spectra from a linear grid in nanometers into the linear grid in electron-volts has been made. Also the program to obtain the Fourier Transformation of Franz-Keldysh oscillations has been made.
Photoreflectance spectra for a series of test samples n-GaAs have been measured. The impositions of the Franz-Keldysh oscillations of different periods in the spectra have been observed.
All spectra are reduced to a linear grid of energies. As a result of treatment of the photoreflectance spectra with the Franz-Keldysh oscillations by using the Fast Fourier Transform dependence on the modulation signal from the module "frequency" oscillations have been obtained [2]. The strength of built-in electric field and the effective masses ratio have been obtained as a result of processing experimental data. All data are presented in the table.
N n, cm-‐3 ES1,kVcm
ES2,kVcm
µhh
µlh
1 3·1017 100±13 32±7 2,35±0,12 2 6·1017 125±25 39±8 2,16±0,16 3 4·1018 130±40 40±10 2,5±0,3
In this dependence from two to four peaks have been observed, which indicate the
presence in these structures the several areas with built-in electric field. So, the Fast Fourier Transform of Frantz-Keldysh oscillations may be useful to determine
the built-in electric field strength and the effective mass ratio. References
1. Avakyants L P, Bokov P Yu, Chervyakov A V. Journal of Technical Physics vol.75, 66-68 (2005)
2. Sheibler H E, Alperovich V L, Jaroshevich A S, and Terekhov A S. Phys. Stat. sol. (a) 152, 113 (1995)
42

The Probabilities Of The ( ) ( )3 12 0 1 0P S+′ ′′ν − ν Transitions
And The Radiative Lifetimes Of The ( )32 1 P′ν States
Of The CdAr And CdKr Molecules
Alekseeva O.S.a,b, Devdariani A.Z.b,c, Lednev M.G.a, Zagrebin A.L.a,b
aDepartment of Physics, Baltic State Technical University, St. Petersburg,Russia, e-mail: [email protected] bInstitute of Physics, St. Petersburg State University, Ul’janovskaja St. 1, Peterhof, 198504, Russia cDepartment of Physics , Herzen State Pedagogical University of Russia, St. Petersburg, Russia
To date, the spectra of the transitions from the 1
1C Π , 10D +Σ , A30+ and B31 states to the
ground X10+ state of the Cd-RG (RG = Ar or Kr atom) molecules, produced by the Cd(51,3P1)
resonance levels, are well known. In this paper the ( ) ( )3 12 0 1 0P S+′ ′′ν − ν transitions which are
forbidden in the limit of separated atoms are investigated. The interaction potential curves for the
( )32Cd 5 Ar, KrP − and the dipole moments were restored from the available experimental
potentials [1-5] by making use of the semiempirical method of quasimiolecular term analysis [6]. With the use of obtained interaction potentials and dipole moments the probabilities A(v', v'') of
the ( ) ( )3 12 0 1 0P S+′ ′′ν − ν transitions and the radiative lifetimes of the ( )3
21 P′ν states of the
CdAr and CdKr molecules were calculated. The results of the calculations are presented in the Table.
Table
The probabilities A(v', v'') (in s-1) of the ( ) ( )3 12 0 1 0P S+′ ′′ν − ν transitions and the radiative lifetimes ( )′τ ν
(in 10-6 s) of the ( )321 P′ν states of the CdAr and CdKr molecules
RG v//
v/
0 1 2 3 4 5 ( )′τ ν
0 1
Ar 0 74 102 51 36 0 3700 1580
1 408 750 237 0.7 2.4 74
Kr 0 110 321 242 19 28 41 1300 615
1 408 750 237 0.7 2.4 74
REFERENCES
[1]. Funk D.J., Kvaran A., Breckenridge W.H., J. Chem. Phys., 90, 2915 (1989) [2]. Ruszczak M., Strojecki M., Koperski J., Chem. Phys. Lett., 416, 147 (2005) [3]. Kvaran A., Funk D.J., Kowalski A., Breckenridge W.H., J. Chem. Phys., 89, 6069 (1989) [4]. Koperski J., Kiełbasa Sz. M., Czajkowski M., Spectrochim. Acta, 56A, 1613 (2000) [5]. Koperski J., Łukomski M., Czajkowski M., Spectrochim. Acta, 58A, 2709 (2002) [6]. Alekseeva O.S., Devdariani A.Z., Zagrebin A.L., Lednev M.G., Russian Journal of
Physical Chemistry B, 5, 946 (2011)
43

44
Rotational quantum number dependent broadening of H2 (X → B) lines in mixtures with Rg gases and CF4
Vadim A. Alekseeva, Ralph Püttnerb, and Nikolaus Schwentnerb
a Institute of Physics, St.Petersburg State University, Ul’janovskaja St.1, Peterhof, 198504 St.Petersburg, Russiae-mail: [email protected].
b Institut für Experimentalphysik, Freie Universität Berlin, Arnimallee 14, D-14195 Berlin, Germany
This contribution reports studies of H2 (X 1Σ+g → B 1Σ+
u) transition in mixtures with rare gases and CF4. Spectra were recorded at 10m normal incidence monochromator beamline at BESSY synchrotron. Absorption and luminescence excitation spectra were recorded in the l04.5 (LiF window cutoff) - 112 nm region which includes X v''=0 → B v'=0, 1, 2, and 3 bands. Because of the large rotational constant only J < 5 levels of H2(X) have sufficiently high population at T=300K to record spectra with acceptable signal to noise ratio. Experiments showed that PR transitions between J < 2 levels display far stronger broadening in comparison with transitions between J > 2 levels. As an example, Figure shows spectra of the 0→0 band in pure H2 and in mixtures with He. Similar in scale effects were observed in mixtures with other Rg gases and CF4, although the shapes of broadened lines depend on perturbing gas.
The H2 (X→ B) transition in mixtures with rare gases seems not to have been studied before except for a brief study by Takezawa and Iida [1]. In the course of the present study we recorded few representative spectra for each Rg gas and CF4 at fixed pressure of 1 bar. A systematic study at high spectral resolution appears of interest. Observation of the broadening effect for J > 2 lines would require much high pressure. Ab initio data on Rg-H2 interaction potentials are needed for analysis and some work in this direction is in progress [2].
V.A.A. acknowledges financial support from the Russian-German beamline project at BESSY.
REFERENCES
[1] Takezawa S., Iida Y., Annual Reports, Gunma University, 16, 61 (1995) ( available on-line http://ci.nii.ac.jp/naid/110005000043/en )[2] Alekseev V.A., this conference
H2 (X v''=0 → B v'=0) band.
Left: absorption spectra of pure H2 10 mbar (solid) and H2 10 mbar + He 1000 mbar mixture (dotted).
Right: Luminescence excitation spectra of pure H2 10 mbar (solid) and H2 10 mbar + He 1000 mbar mixture (dotted). Undispersed luminescence was recorded in the Vac UV region using solar blind PMT. Feature labeled with ' * ' is P5 line of the 0→1 band.

Ab Initio Study of Rg - H2(B Σ+u) Interaction Potential
Vadim A. Alekseev
Institute of Physics, St.Petersburg State University, Ul’janovskaja St.1, Peterhof, 198504 St.Petersburg, Russiae-mail: [email protected].
The ground state of RgH2 vdW complex has been a subject of several experimental and theoretical studies. In contrast, excited state potentials seem not to have been studied before. The present contribution reports on ab initio study of Rg-H2(B) potential. The H2(B) state diabatically correlates with H+ + H-. In contrast to the gerade ion-pair configuration which strongly interacts with a Rydberg configuration resulting in the double-well EF Σ+
g state, the ungerade configuration at internuclear distances ~ Re(X)=0.74 Å is not affected by such an interaction and in the first approximation, the Rg-H2(B) potential may be calculated assuming that H2(B) is a pure ion-pair state. Calculations were performed using MOLCAS [1] at CASPT2 level. As an example of the present results, Figure shows Rg-H2 potentials for the linear and T-shape geometries. The Rg-H2(B) potential is strongly anisotropic with strongest repulsion in the linear geometry. For Rg=Ar the Rg-H2(B) potential is bound at small distances. For the T-shape geometry the bound part of Ar-H2(B) potential is accessible optically from the ground state at the room temperature collision energies. The present ab initio data are of interest in particular for interpretation of H2(B-X) transition line shapes in mixtures with Rg gases [2].
REFERENCES
[1] Aquilante F., DeVico L., Ferré N., Ghigo G., Malmqvist P.-Å., Neogrády P., Pedersen T.B., Pitonak M., Reiher M., Roos B.O., Serrano-Andrés L., Urban M., Veryazov V., Lindh R., J.Comput.Chem., 31, 224 (2010) [2] Alekseev V.A., Püttner R., Schwentner N., this conference
Left: Potentials of the ground H2 (X) and ion-pair H2 (B) states. Right: Ne-H2 and Ar-H2 potentials at fixed distance R(H-H)=1 Å. Black line - Ne-H2, ϕ=90o, red - Ne-H2, ϕ=0o , green - Ar-H2, ϕ=90o, blue - Ar-H2, ϕ=0o. VQZP basis sets.
45

Comparative Study of Emission Spectra of He(3S)-He(2P)at 706 and 728 nm Due to the Triplet and Singlet
Transitions.
N F Allarda , F X Gadéab , A Monarib and B Deguilhemb
a Observatoire de Paris, GEPI, 61, avenue de l'Observatoire, F-75014 France [email protected]
b Laboratoire de Physique Quantique, Université Paul Sabatier Toulouse, France [email protected]
In Allard et al 2009 [1] we presented the first calculations of He-He collisional profiles at 706nm due to the triplet 3s-2p transition in a unified line shape semi-classical theory using ab initio molecular potentials. The excellent agreement between experimental and theoretical determinations of the near wing of the line profiles established the accuracy of the interaction potentials. New ab initio potentials for the singlet 3s-2p transitions allow us to extend our previous study to the line at 728nm. A physical understanding of observed emission spectrum in dense plasmas of helium excited by a corona discharge requires to perform line profiles derived theoretically from ab initio potential calculations and a suitable line shape theory.
REFERENCE
[1] N.F. Allard, B. Deguilhem, F.X. Gadea, N. Bonifaci, A. Denat, Eur. Phys. Lett. 88, 53002 (2009)
46

Physical interpretation of the blue shift of spectra obtained by corona discharge in liquid helium
N F Allarda
a Observatoire de Paris, GEPI, 61, Avenue de l'Observatoire, F-75014 Paris, France [email protected]
In Allard et al 2011 [1] we have reported a detailed analysis of the line parameters of the He(3S)-He(2P) line. We discussed the major importance of temperature and perturber density in the broadening, shift and asymmetry measured from calculated profiles within a unified line shape semi-classical theory. One can easily interpret the shape of the profile in liquid He byextrapolating the profiles obtained as the medium evolved from gaseous helium to liquid. The main interest of this approach is that it is free of ajustable parameters. The line shapes depend on atomic interaction energy that are now known with high accuracy when using ab initio potentials.
REFERENCE
[1] N.F. Allard, N. Bonifaci, A. Denat, Eur. Phys. J D 61, 365 (2011)
47

Shape of Atomic Lines as Indicator of Gas Density in
Helium micro-discharge.
N. Bonifaci1, F Aitken
1, Hai Van Nguyen
1,V. M. Atrazhev
2, K. Von Haeften
3, J.
Eloranta4, V.A. Shakhatov
5.
1 Laboratoire G2Elab CNRS & Joseph Fourier University, 25 rue des Martyrs, 38042 Grenoble, France
2 Joint Institute for High Temperatures, RAS, Moscow, 125412
3Departement of physics and Astronomy, University of Leicester, UK
4Department of Chemistry,University of California, USA
5 Topchiev of Petrochemical Synthesis Institute, RAS, Moscow, 119991.
Emission spectroscopy is a tool to obtain information about the important parameters of non-
equilibrium discharge plasma at both low and high pressures. Spectroscopic observations of the
light emitted by ionization gases can be used to determine conditions surrounding the emitted
atoms or molecules. In our experiments, gaseous Helium at 300 K and pressure (0.1-5) MPa was
excited using a corona discharge both for negative and positive high voltages. Corona discharge
is strong spatial inhomogeneous. The corona current is determined by mobility of negative or
positive ions in a low-field drift zone but the current density increases strongly with approaching
to the region with high electric field near a tip electrode. The Joule heating of a gas is possible in
vicinity of the tip electrode. This region (ionization zone) is a source of a light which was
analyzed in our research. Excited atoms interact with environment and their spectra give
information about density and temperature of a gas in the ionization zone. The pressure
broadening of spectral lines depends on the gas density. The “impact” interaction of radiator with
surrounding atoms leads to the Lorentzian profile of spectral lines emitted by a discharge in low
pressure gases. In this case the width of a line and the line shift are proportional to gas density. In
present experiments with high pressure gas the measured width of a line reaches 7.6 nm. For
such strong broadened line its intensity exceeds background intensity by 40% only. Strong noise
distorts the line profile, though features of the line can be recorded. Asymmetric shape of atomic
lines 706 nm and 728 nm was observed. Blue wings of the lines are more intensive than their red
wings. Blue shift of the line about 0.6 nm exhibits a dominate repulsion between excited atom
and surrounding atoms. Such repulsion has to be described in “static” approximation for the case
of dense gas under high pressure. Growth of the density of a gas was accompanied by distortion
of the “impact” Lorentz profile of lines. The asymmetric shape of line became more significant.
The line shape was described as a convolution of “impact” Lorentz profile of the line center and
a “statistical” profile of a blue wing of the line. It allowed us to treat the line profile and
simulated it for matching of gas density specific for ionization zone of corona discharge. The
analysis showed that heating of the gas take place for negative corona. The figure shows a profile
of 706 nm line (points). The curve is a result of simulation which treated the line shape as
696 698 700 702 704 706 708 7102,0
2,2
2,4
2,6
2,8
3,0
3,2
Negative
corona
80A
500K, 49atm
Inte
nsity,
arb
.units.
Wavelength, nm.
convolution of an “impact” Lorentz profile and “static”
blue wing. The simulation is in agreement with
experimental data if a temperature in corona is assumed
500 K instead 300 K in surrounding cold gas. The
analysis showed that no gas heating was in positive
corona with less current. Russian participants of the team (V. M. A. and V. A. S.) thank
the Russian Foundation for Basic Researches grant 12-08-
91052 for support.
48

Shape of Atomic Lines Emitted by Cryoplasma in Helium
N. Bonifaci1, F Aitken
1, Hai Van Nguyen
1, V. M. Atrazhev
2, K. Von Haeften
3,
R. Rincon4.
1 Laboratoire G2Elab CNRS & Joseph Fourier University, 25 rue des Martyrs, 38042 Grenoble, France
2 Joint Institute for High Temperatures, RAS, Moscow, 125412
3Departement of physics and Astronomy, University of Leicester, UK
4Grupo de Espectroscopía de Plasmas (GEP) University of Cordoba, Cordoba, Spain
Emission spectroscopy is a powerful tool to obtain information about the important
parameters that characterize non-equilibrium discharge plasma (corona) in high pressures.
Spectroscopic observations of the light emitted by ionized gases can be used to determine
conditions surrounding the emitted atoms or molecules. An ionization zone near a tip electrode is
a source of a light emitted by the corona.
Gaseous and liquid Helium under pressures (0.1 -0.2) MPa at temperatures between of 4.2K
and 5.2K was excited using the corona discharge both for negative and positive high voltages.
The light emitted from the ionization zone of the discharge was analyzed. Asymmetric shape of
an atomic line 706 nm was recorded in our experiments. Blue wing of the line recorded in
negative corona was more intensive than its red wing. In positive corona, red wing of the line
was more intense than blue wing. Spectral shift of the line was small for the range of applied
pressure. The line shape observed in gaseous and liquid Helium for conditions closed to the
boiling pressure at a fixed temperature was the same.
The cryoplasma in helium allows us to observe lines of HeI in conditions where both liquid
and dense gas were realized. Experiments have been carried out in gaseous and liquid He at the
fixed temperatures 4.5 K and 5.1 K and under different pressures in the cell from 0.1 MPa up to
0.5 MPa. The corona micro-discharge in liquid and cryogenic gaseous helium is realized in our
work and it was served as a source of emitted atoms. Shift and shape of an atomic line 706 nm
were measured for these conditions. The width of the line measured both in liquid He (well-
known bubble states) and in a cryogenic dense gaseous helium is less than width calculated in
the “impact” approximation. In liquid helium the excited He* and He2* species have been
established to reside inside voids with a radius ranging from (7 – 15) Å (“bubble states”). Such
structures are the result of the Pauli repulsive exchange interaction between the Rydberg electron
of the excited atom and surrounding helium atoms. The excited atom and atoms from its
environment are far enough each other in the “bubble state”. So, the long-length asymptotic of
the repulsive potential is important in formation of this state. In a gas, the “impact” interaction of
radiator with surrounding atoms determines the symmetric Lorentzian profile of spectral lines
with shift and width are proportional to the gas density. An instant change of a radiation phase
due to collisions between radiator and perturbator determines the “impact” profile of the line. In
this case, a short-length of the inter-atomic potential is important. Thus, different parts of the
potential work in the bubble state (liquid) and in a gas.
The interesting result of our experiments is an observation of more intensive red wing of the
706 nm line in the positive corona in cryogenic Helium. Intensive blue wing of the line in
negative corona has well-known explanation in a frame of the model of a long-range repulsion of
helium atoms. The red wing of the line in is unintelligible as yet. The next result is low
broadening of the line in dense cryogenic gas. It is a reason for assumption of low density
cavities existing around an excited atom in the dense gas.
Russian participant of the work (V. M. A.) thanks the Russian Foundation for Basic
Researches, grant 12-08-91052 for support.
49

Electronic Radiative Transitions in He(21,3S)-Ne Weakly Bound Molecules. Temperature Dependences
A. K. Belyaeva,*, A. Devdariania,b, V. S. Rybaka, I. A. Zlatkinb a Department of Theoretical Physics, Herzen University, St. Petersburg 191186, Russia. b Department of Optics and Spectroscopy, St. Petersburg University, St. Petersburg 198904, Russia.
The metastable states He(1s2s 21,3S) are the champions in terms of radiative lifetimes of neutral atomic states, [1,2] for the singlet and triplet states respectively. However, in numerous applications, e.g., in ionosphere and discharge plasmas, one deals with a metastable atom surrounded by buffer gas atoms. Thus, one needs to account for the influence of the interaction between atoms on radiative properties including lifetimes and spectral profiles. The issue is of topical in the case of low temperatures when processes of recombination lead to the formation of clusters and dimers containing excited atoms. This work focuses on the influence of the Ne atoms as a particular example. For large interatomic distances about 10 a0 it was shown that the interaction with a Ne atom destroys the spherical symmetry of the He(21S) state via admixture of p-atomic states of the He atom that increases the probability of radiation in ~103 times [3]. For small distances about 5a0 the recent ab initio calculations [4,5 ] have revealed the existence of shallow potential wells with a few vibrational states. Now we have calculated for the first time the lifetimes of weakly bound He(21,3S)-Ne molecules as well as temperature dependences of lifetimes and spectral profiles averaged over the Boltzmann distribution. The interaction at small distances results in
substantial decreasing of lifetimes: !! = 6.7 ∙10!!!!! for singlets and !! = 1.3 ∙ 10!!!!! for triplets, mainly in consequence of bound-free transitions followed by the formation of atoms in the ground states with the relative kinetic energy about 0-0.03eV. Figure shows the spectral profile produced by radiative decay of the He(23S)-Ne molecules, the vertical bold line marks the position of the bound-bound transition.
REFERENCES
[1]. Hodgman S. S., Dall R. G., Byron L. J., Baldwin K. G. H., Buckman S. J., Truscott A. G., Phys. Rev. Letters, 103, 053002(4), (2009) [2]. Dyck S. van, Johnson C.E., Shugart H.A., Phys. Rev. A, 4, 1327, (1971) [3]. Devdariani A.Z., Zagrebin A.L. , Blagoev K.B., Ann. Phys. Fr. 17, 365, (1992) [4]. Buenker R.J., Liebermann H.-P., Devdariani A.Z., J. Phys. Chem. A, 111, 1307, (2007) [5]. Devdariani A., Belyaev A.K., Alekseyev A., Lieberman H.-P., Buenker R., Molecular Physics, 108, 757, (2010)
!10 ! 20•10"3s,! 3
0 ! 7•103s
159400 159600 159800 160000 160200 160400Photon energy, cm-1
0
0.005
0.01
0.015
Squa
re o
f ade
rage
d tra
nsiti
on d
ipol
e mom
ent,
au
He(2 3S)-Ne
50
A Stark Broadening Simulation Using a Renewal Process
D. Bolanda, R. Hammamia, H. Capesa, Y. Marandeta, J. Rosatoa, R. Stamma
aPIIM, Aix-Marseille University and CNRS, campus Saint Jérôme, Marseille, 13397, France.
Stark broadening of atomic lines in plasmas is investigated by generating the electric microfield with a renewal process. For such processes the microfield is stepwise constant, with arbitrary jumping times from one microfield value to the other. Renewal theory generalizes the waiting time distribution on each step, which can be more general than an exponential [1]. Our model is a true simulation of the renewal process, using random number generators for generating different probability density functions (PDF). The use of an equilibrium static microfield PDF and an exponential waiting time distribution reproduces the so called model microfield method (MMM) results [2]. The work presented is an application to the hydrogen Lyman-α line, which is compared to standard MMM and ab-initio simulations spectral lines, non-Markovian effects being investigated through specific waiting time distributions.
REFERENCES
[1]. W. Feller, An introduction to probability theory and its applications, John Wiley and sons (1971) [2]. U. Frisch and A. Brissaud, J. Quant. Spectr. Rad. Transfer 11, 1767(1971).
51
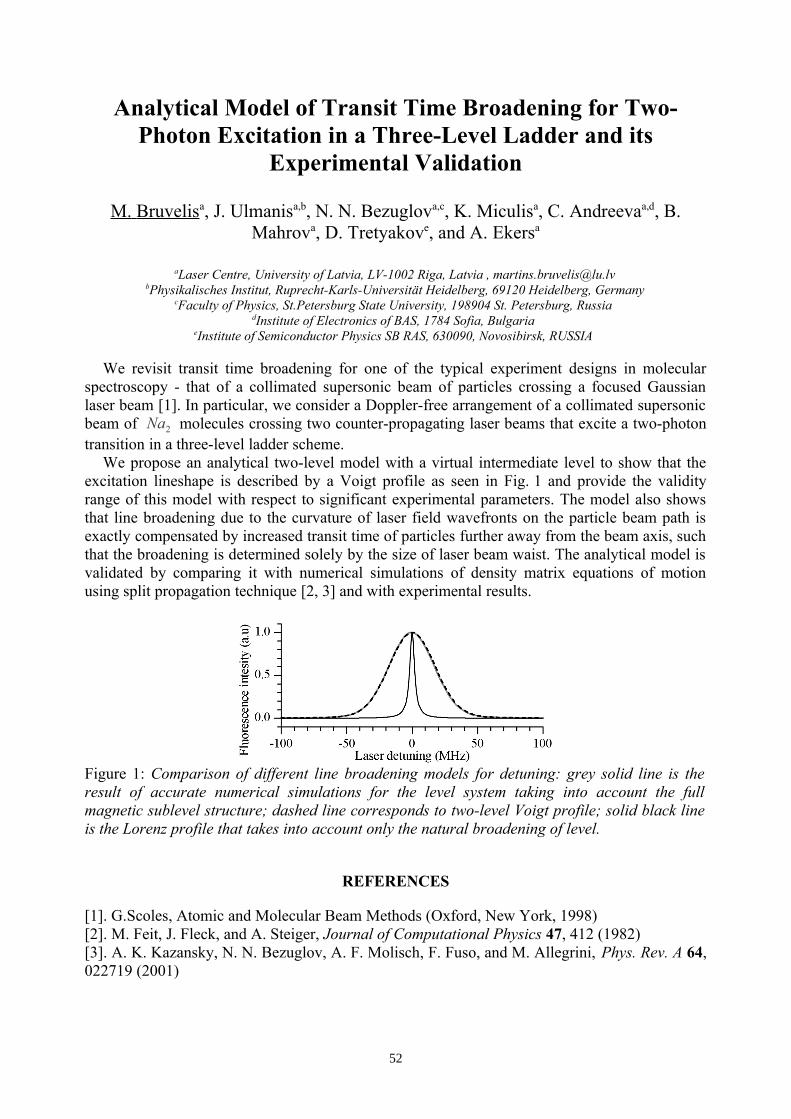
Analytical Model of Transit Time Broadening for Two-Photon Excitation in a Three-Level Ladder and its
Experimental Validation
M. Bruvelis a, J. Ulmanisa,b, N. N. Bezuglova,c, K. Miculisa, C. Andreevaa,d, B. Mahrova, D. Tretyakove, and A. Ekersa
aLaser Centre, University of Latvia, LV-1002 Riga, Latvia , [email protected] Institut, Ruprecht-Karls-Universität Heidelberg, 69120 Heidelberg, Germany
cFaculty of Physics, St.Petersburg State University, 198904 St. Petersburg, Russia dInstitute of Electronics of BAS, 1784 Sofia, Bulgaria
eInstitute of Semiconductor Physics SB RAS, 630090, Novosibirsk, RUSSIA
We revisit transit time broadening for one of the typical experiment designs in molecular spectroscopy - that of a collimated supersonic beam of particles crossing a focused Gaussian laser beam [1]. In particular, we consider a Doppler-free arrangement of a collimated supersonic beam of Na2 molecules crossing two counter-propagating laser beams that excite a two-photon transition in a three-level ladder scheme.
We propose an analytical two-level model with a virtual intermediate level to show that the excitation lineshape is described by a Voigt profile as seen in Fig. 1 and provide the validity range of this model with respect to significant experimental parameters. The model also shows that line broadening due to the curvature of laser field wavefronts on the particle beam path is exactly compensated by increased transit time of particles further away from the beam axis, such that the broadening is determined solely by the size of laser beam waist. The analytical model is validated by comparing it with numerical simulations of density matrix equations of motion using split propagation technique [2, 3] and with experimental results.
REFERENCES
[1]. G.Scoles, Atomic and Molecular Beam Methods (Oxford, New York, 1998)[2]. M. Feit, J. Fleck, and A. Steiger, Journal of Computational Physics 47, 412 (1982) [3]. A. K. Kazansky, N. N. Bezuglov, A. F. Molisch, F. Fuso, and M. Allegrini, Phys. Rev. A 64, 022719 (2001)
Figure 1: Comparison of different line broadening models for detuning: grey solid line is the result of accurate numerical simulations for the level system taking into account the full magnetic sublevel structure; dashed line corresponds to two-level Voigt profile; solid black line is the Lorenz profile that takes into account only the natural broadening of level.
52

Demonstration of the extremely high signal-to-noise ratio
and advanced O2 B-band lines shape analysis in
PDH-locked FS-CRDS experiment
A. Cygana*
, D. Lisaka, S. Wójtewicz
a, J. Domysławska
a, J. T. Hodges
b,
R. S. Trawińskia, R. Ciuryło
a
aInstytut Fizyki, Uniwersytet Mikołaja Kopernika, Grudziądzka 5/7 87-100, Toruń, Poland
bNational Institute of Standards and Technology, 100 Bureau Drive, Gaithersburg, Maryland 20899, USA
We demonstrate an extremely high signal-to-noise ratio in the measurement of spectral line shapes.
Our approach [1], which combines high-bandwidth Pound-Drever-Hall (PDH) [2,3,4] locking of a
continuous wave probe laser and the frequency-stabilized cavity ring-down spectroscopy technique [5],
enables long-term signal averaging and yields high-resolution spectra with a relatively wide dynamic
range and low detection limit. An active control of the PDH error signal offset [6], applied recently to our
repetitively-locked cw-CRDS system, solved definitely the problem of unexpected PDH-lock breaking
during high-repetition rate ring-down events generation and hence assured more reliable and faster work
of our spectrometer. Possible extension of laser light switching-off time, between consecutive ring-down
events, up to 1 ms is shown.
An exceptionally precise measurements of absorption line shape and line position [7] are demonstrated
by probing rovibronic transitions of the 16
O2 B band near λ = 689 nm [8,9]. A signal-to-noise ratio of
220000:1 and a minimum detectable absorption coefficient of 2.4 × 10⁻¹¹
cm−1
is reported [10], which
corresponds to the lowest line intensity measurable by this setup of approximately 1.3 × 10⁻³⁰
cm−1
/(molecule cm−2
). Careful analysis of the data revealed a subtle line-shape asymmetry that could be
explained by the speed dependence of the collisional shift. The demonstrated measurement precision
enables the quantification of systematic line-shape deviations, which were approximately 1 part in 80 000
of the peak absorption. The influence of slowly drifting etaloning effects on the precision of the line-
shape analysis is shown. The proposed line-shape measurement technique together with precise data
analysis are crucial for such experiments as accurate determination of the Boltzmann constant by optical
methods [11,12,13,14].
The research is part of the program of the National Laboratory FAMO in Toruń, Poland, and is
partially supported by the Foundation for Polish Science TEAM Project co-financed by the EU European
Regional Development Fund. A.Cygan is supported by the Polish NCN, Project No. N N202 239240.
REFERENCES
[1] A. Cygan, et al,. Rev. Sci. Instrum. 82, 063107 (2011).
[2] R. W. P. Drever, et al., Appl. Phys. B 31, 97 (1983).
[3] R. Z. Martínez, et al., J. Opt. Soc. Am. B 23, 727 (2006).
[4] H. Pan, et al., Rev. Sci. Instrum. 82, 103110 (2011).
[5] J. T. Hodges, et al., Rev. Sci. Instrum. 75, 849 (2004).
[6] A. Cygan, et al., Meas. Sci. Technol. 22, 115303 (2011).
[7] J. Domysławska, et al., J. Chem. Phys. 136, 024201 (2012).
[8] D. Lisak, et al., Phys. Rev. A 81, 042504 (2010).
[9] S. Wójtewicz, et al., Phys. Rev. A 84, 032511 (2011).
[10] A. Cygan, et al., Phys. Rev. A 85, 022508 (2012).
[11] C. Lemarchand, et al., New J. Phys. 13, 073028 (2011).
[12] A. Castrillo, et al., Phys. Rev. A 84, 032510 (2011).
[13] Y. R. Sun, et al., Opt. Express 19, 19993 (2011).
[14] A. Cygan, et al., Phys. Rev. A 82, 032515 (2010).
53

H- - H Collision Induced Radiative Transitions
A.V.Dadonovaa, A.Devdariania,b
aDepartment of Theoretical Physics, Herzen University, St. Petersburg 191186, Russia, [email protected]
b Department of Optics and Spectroscopy, St. Petersburg University, St. Petersburg 198904, Russia.
Exchange interaction leads to the formation of gerade and ungerade states of temporary molecules (quasimolecules) formed during the H- - H slow collisions. The work deals with the radiation produced by optical transitions between these states. The main characteristics involved in description of optical transitions in quasimolecules, i.e., energy terms, optical dipole transition moments, have been calculated in the frame of zero-range potentials model [1]. The main feature of calculations is that the results can be expressed analytically in closed forms via the Lambert W function [2]. The figure shows the results for the spectral profiles averaged over Maxwell’s distributions in relative units as a function of frequency in atomic units for two temperatures.
REFERENCES
[1]. Demkov Yu.N., Ostrovskii V.N., Zero-Range Potentials and Their Applications in Atomic Physics, Plenum Pub Corp, 1988. [2]. Corless R.M.,Connet G.H., Hare D.E.G., Jeffrey D.J., Knuth D.E., Adv.Comput.Math. 5, 329 (1996).
54

Electron-Impact Broadening of C II Spectral Lines
Neila Larbi-Terzia, Nébil Ben Nessib
a, Sylvie Sahal-Bréchot
b and
Milan S. Dimitrijevićc
aGroupe de Recherche en Physique Atomique et Astrophysique, Institut National des Sciences Appliquées et de
Technologie, University of Carthage, Centre Urbain Nord B. P. No. 676, 1080 Tunis Cedex, Tunisia,
E-mail : [email protected], [email protected] bLaboratoire d'Etude du Rayonnement et de la Matière en Astrophysique,
Observatoire de Paris, UMR CNRS 8112, UPMC,\\
Bâtiment Evry Schatzman, 5 Place Jules Janssen, F-92195 Meudon Cedex,France, [email protected] cAstronomical Observatory, Volgina 7, 11060 Belgrade, Serbia
Using semiclassical perturbation approach in the impact approximation, we have obtained
Stark broadening parameters for 148 CII multiplets. Energy levels and oscillator strengths are
taken from the TOPbase database. Results are obtained as a function of temperature, for a
perturber densities of 1014
, 1017
and 1018
cm-3
. In addition to electron-impact full half widths and
shifts, Stark broadening parameters due to singly ionized carbon-impacts have been calculated,
in order to provide Stark broadening data for the important charged perturbers in the atmospheres
of carbon white dwarfs. Obtained results have been compared to the existing experimental data.
Also, the influence of the choice of oscillator strengths on the result of calculations was
investigated on the case of the 3s-np and 3d-nf spectral series. The complete results will be
published in Ref [1] and here only illustrative examples will be shown.
REFERENCES
[1]. N. Larbi-Terzi, S. Sahal-Bréchot, N. Ben Nessib, M. S. Dimitrijević, Montly Notices of the
Royal Astronomical Society, accepted (2012)
55

Anomalies in the Rydberg Atom Emission Spectra of Astrophysical Relevance
D.K.Efimova, M.Yu.Zaharova, N.N.Bezuglova,c, A.A.Mihajlovb and A.N.Klyuchareva
aDepartment of physics, Saint-Petersburg University, Ulianovskaya 1, 198504, St.Petersburg, Petrodvorets, Russia, [email protected]
bInstitute of physics, P.O. Box 57, 11001 Belgrade, Serbia, [email protected] Laser Centre, University of Latvia, Zellu Str. 8, LV-1002 Riga, Latvia, [email protected]
Recent measurements of the IR emission spectra of white dwarfs reveal a gap in the radiation emitted by Rydberg atoms (RA) with values of the principal quantum number of n≈10 [1]. Several possible reasons for such anomalies have been considered in the existing scientific literature: (i) collision induced absorption; (ii) relativistic quantum effects of “vacuum polarization” in presence of extreme magnetic fields with B≥1013G; (iii) Stark-effect upon exposure to electric fields with intensities E≥106 V/cm.
The threshold for electric field ionization of RA is E≈3∙104 V/cm for states with n>10. This means that the emission of RA with n ≥10 is effectively blocked for such fields. The lifetime of RAs with respect to collisional ionization is relatively short and appears to be τcol≤10-8c for n≈10 provided the following typical conditions occurring the ionized atmospheres of white dwarfs: the number density of ground state particles N0≥3∙1017 cm-3, the electron density Nel ≥ 108 cm-3, the number density of RA NRA
*≥1013 cm-3, and the collisional ionization rate constant k ≈10-9cm3c-1. The collisional de-excitation time τion appears to be by two orders of magnitude shorter than the respective spontaneous lifetime τsp. In addition, the maximum of k(n) corresponds to n≈10 [2], which introduces a certain “selectivity” of in the efficiency of collisional ionization with respect to n in absence of external electric fields.
In this study we consider another mechanism of population redistribution among Rydberg states, namely the chaotic diffusion of Rydberg electron (RE) in the energy spectrum in RA + Atom collisions. The so-called stochastic dynamics regime can occur due to nonlinear behavior of RE as a function of n. We demonstrate that external static magnetic or electric fields may strongly affect the properties of the dynamic chaos regime if the {n,l} state of the RE satisfies the so called Förster resonance condition, when the RE energy Enl is exactly between the energies of any two adjacent states belonging to l’=l±1 manifold: 2Enl ≡ En’l’+ En+1’l’. In the vicinity of the Föster resonance, the diffusion coefficients of the Fokker-Planck equation describing the random walk of RE in the manifold of energy levels are shown to be very sensitive to the internuclear potential. Therefore, one can expect irregular changes of the ionization time τion upon variation of the intensities of external fields. Since the autoionization time τion determines the concentration of RAs in the atmospheric plasmas of white dwarfs, irregular variations of τion should manifest themselves as anomalies in the RA emission spectra.
The work was carried out within the EU FP7 Centre of Excellence FOTONIKA-LV and under the partial support by the EU FP7 IRSES Project COLIMA.
REFERENCES
[1] Afanasiev V. Z., Borisov N.V., Gnedin Yu.N. et al Physics of Magnetic Stars // Intern. Conf. AO RAN, Eds. I.I. Romanyuk, D.O. Kudryavtsev, August, 28-31, 2006.[2] Klyucharev A.N., Bezuglov N.N., Matveev A.A., Mihajlov A.A., Ignatovic L.M., Dimitrievic M.S., New Astr. Rev., 51, p.547 (2007)
56
Electron impact excitation for Ar VI
H. Elabidi
Groupe de Recherche en Physique Atomique et Astrophysique, Faculté des Sciences de Bizerte, Université de Carthage, Zarzouna 7021, Tunisia, [email protected]
The five times ionized argon Ar VI is an interesting ion in astrophysics. The Ar VI transition
at 1303.86 Å was identified in 2007 as an isolated line in the STIS spectrum of LSV+46°21 [1], where it was the first time that Ar VI has been detected in the photosphere of any star. The radiative atomic, electron impact excitation and Stark broadening data for Ar VI will be very interesting for stellar spectroscopy, astrophysical and laboratory plasmas analysis and for opacity calculations. Consequently, these data will strongly improve future spectral analyses and thus, make determinations of photospheric properties more reliable. We present in this work atomic data (energy levels, oscillator strengths, radiative transition probabilities…) and electron impact collision strengths between fine structure levels using the AUTOSTRUCTURE code [2]. The atomic structure is calculated by constructing target wavefunctions using radial wavefunctions calculated in a scaled Thomas-Fermi-Dirac statistical model potential. Two-body non-fine structure interactions (contact spin-spin, two-body Darwin and orbit-orbit), valence-valence two-body fine structure and spin-orbit interactions are taken into account in AUTOSTRUCTURE. The Distorted Wave approximation implemented in the AUTOSTRUCTURE [3] code has been used to provide collision strengths between fine structure levels. The AUTOSTRUCTURE code has some similarities with the UCL-DW one (due to their common SUPERSTRUCTURE (SST) heritage), but there are many fundamental differences between them. We will perform also the same calculations using the UCL-SST/DW/JAJOM [3,4,5] codes in order to compare with the AUTOSTRUCTURE results. We note that the SUPERSTRUCTURE code does not take into account the two-body non-fine structure and the valence-valence two-body fine structure effects. To our best knowledge, there are no electron impact excitation data for Ar VI. Consequently, these calculations will be very useful for several astrophysical tools. The UCL-SST/DW/JAJOM codes have been used for a long time to provide radiative atomic and electron impact excitation data [6]. Recently, they have been adapted to calculate line-broadening data [7,8,9,10] and will be used to provide Ar VI line-broadening parameters in future works.
REFERENCES
[1] Rauch T. et al., Astonomy & Astrophysics, 470, 317 (2007) [2] Badnell N. R., Comput. Phys. Commun., 182, 1528 (2011) [3] Eissner W., Jones M., Nussbaumer H., Comput. Phys. Commun., 8, 270 (1974) [4] Eissner W., Comput. Phys. Commun., 114, 295 (1998) [5] Saraph H. E., Comput. Phys. Commun., 15, 247 (1978) [6] Elabidi H., Ben Nessib N., Sahal-Bréchot S., Physica Scripta, in Press (2012) [7] Elabidi H. et al., J. Phys. B: At. Mol. Opt. Phys., 41, n° 025702 (2008) [8] Elabidi H., Ben Nessib N., Sahal-Bréchot S. Eur. Phys. J. D., 54, 51 (2009) [9] Elabidi H., Sahal-Bréchot S., Mon. Not. R. Astron. Soc., 407, 25 (2011) [10] Elabidi H., Ben Nessib N, Sahal-Bréchot S., J. Quant. Spectrosc. Radiat. Transfer (2012), http://dx.doi.org/10.1016/j.jqsrt.2012.03.028
57

Collisional Shift and Broadening Heavy Atoms Hyperfine
Lines in an Atmosphere of the Inert Gas
T.A. Florkoa , A.A. Svinarenko
a, T.A. Tkach
a
aOdessa State University – OSENU, P.O.Box 24a, Odessa-9 65009
e-mail: [email protected]
Studying the collisional shifts and broadening of the hyperfine lines for heavy elements
(alkali, alkali-earth, lanthanides and others) in an atmosphere of inert gases is one of the
important and actual topics of collision theory and spectral lines theory. Especial interest
attracts the corresponding phenomenon for atom of Tl in the light of creating the Tl
quantum frequency measure [1]. Besides, this atom is interested from the point of view of
studying a role of the weak interactions in an atomic and particle physics. At last,
calculating the hyperfine line shift allows to detect an quality of the wave functions and
study a contribution of the relativistic and correlation effects. To calculate the hyperfine
spectral lines collision shift one should use the expression from kinetical theory of the spectral
lines [1]:
( ) ( )( ) dRRkTRURdwkT
w
p
Df p
2
0
0 exp4
∫∞
−==π
where U(R) is an effective potential of the inter atomic interaction, which has a central
symmetry in a case of the pairs A-B (A=Tl,Yb; B=He,Ar); T is temperature, w0 is a
frequency of the hyperfine transition in the isolated active atom; dω (R)=Dw (R)/w0 is the
relative local shift of the hyperfine lines, which is arisen due to the disposition of atoms of the
A and B on a distance R. The relativistic many-body PT [3] is used to determine the
relativistic Dirac functions for Tl and other atoms. We present our results for the collisional
fρ shift for pairs: A-B in dependence on temperature T. Our values are compared with the
available experimental data and other calculation results (see Refs. in [1,2]), which are
obtained within the PT with the Hartree-Fock or non-optimized Dirac-Fock basis. The
feature of our scheme is a precise accounting for the correlation effects with using effective
potentials [2,3]. Analysis shows that our data for the examined systems are in the reasonable
agreement with available experimental data (at least for available T). Very interesting
features are found for the collisional broadening Га parameter, namely, performing the
Folly law (Га ~ fр,).
REFERENCES
[1]. Chorou B, Scheps R, Galagher J, J. Chem. Phys. 65, 326 (1976); Batygin V, Sokolov I, Opt.
Spectr. 55, 30 (1983).
[2]. Glushkov A.V. et al, Opt. Spectr. 84, 670 (1998); J.Str.Chem. 39, 220 (1998); Malinovskaya
S.V., Glushkov A.V., Florko T.A., et al, Int.J.Quant.Chem. 109, 3325 (2009).
[3]. Glushkov A.V., Khetselius O.Yu., Florko T.A. et al, Frontiers in Quantum Systems in Chem.
and Phys. (Berlin, Springer) 18, 505 (2008); Svinarenko A.A., Nikola L.V., Tkach T. et al,
Spectral Lines Shape (AIP). 1290, 94 (2010).
58

Spectral Line Shape Modeling in the LBL Code for Space Monitoring of the Earth Climate-forming Factors
Аnokhin Yu.A.a, Boiko V.Ab, Fomin B.A.c, Petrov N.N.a
a “Institute of Global Climate and Ecology”, 107258, Moscow, Glebovskaya str., 20B, tel. (499) 169-24-11, fax (499) 160-08-31, <[email protected]>
b NPP “Geofizika-Kosmos”, 107497, Moscow, Irkutskaya str., 11(1),tel/fax: (495) 652-71-13, <[email protected] >
b “Central Aerological Observatory”, Pervomayskaya str., 3, Dolgoprudniy, Moscow Region, 141700, Russia; tel: (495) 408-61-48, fax: (495)576-33-27, <[email protected]>
As well known the LBL codes being used as a “forward” model for space monitoring of the Earth climate-forming factors need very accurate spectral line shape modeling. In this report some problems of the modeling are considered as well as the universal “forward” model that can simulate signals from high resolution satellite onboard sensors is presented.
59
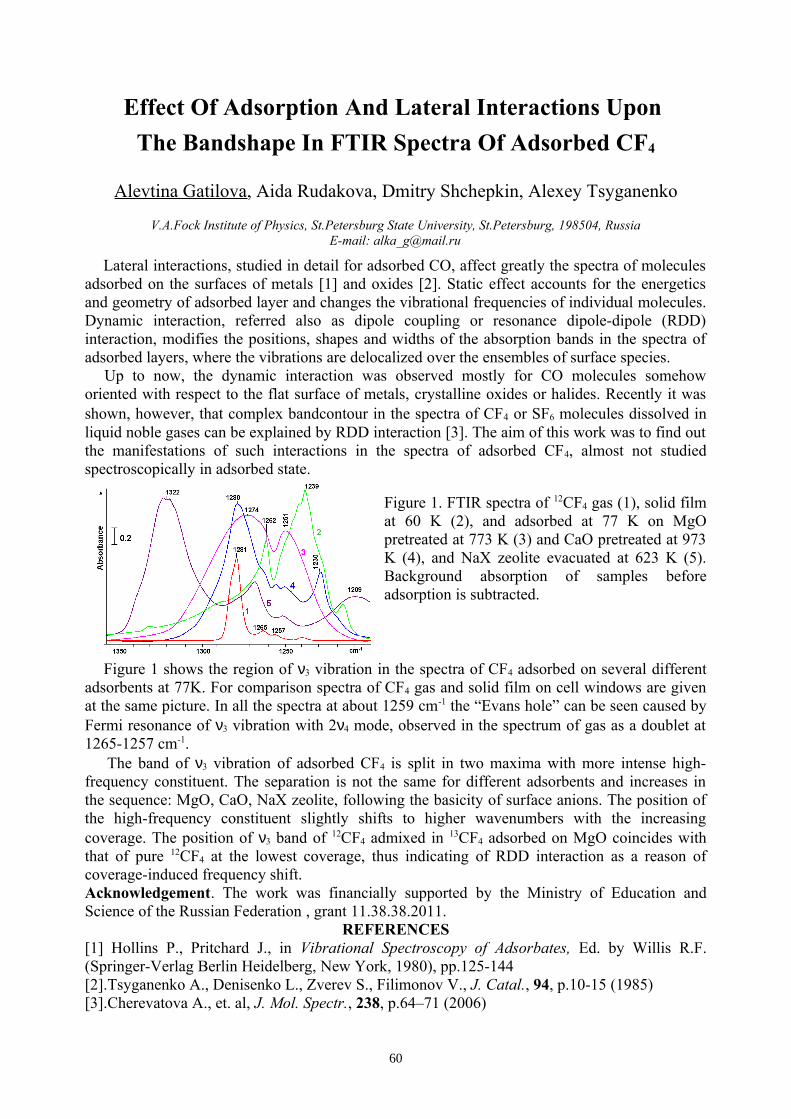
Effect Of Adsorption And Lateral Interactions Upon
The Bandshape In FTIR Spectra Of Adsorbed CF4
Alevtina Gatilova, Aida Rudakova, Dmitry Shchepkin, Alexey Tsyganenko
V.A.Fock Institute of Physics, St.Petersburg State University, St.Petersburg, 198504, RussiaE-mail: [email protected]
Lateral interactions, studied in detail for adsorbed CO, affect greatly the spectra of molecules adsorbed on the surfaces of metаls [1] and oxides [2]. Static effect accounts for the energetics and geometry of adsorbed layer and changes the vibrational frequencies of individual molecules. Dynamic interaction, referred also as dipole coupling or resonance dipole-dipole (RDD) interaction, modifies the positions, shapes and widths of the absorption bands in the spectra of adsorbed layers, where the vibrations are delocalized over the ensembles of surface species.
Up to now, the dynamic interaction was observed mostly for CO molecules somehow oriented with respect to the flat surface of metals, crystalline oxides or halides. Recently it was shown, however, that complex bandcontour in the spectra of CF4 or SF6 molecules dissolved in liquid noble gases can be explained by RDD interaction [3]. The aim of this work was to find out the manifestations of such interactions in the spectra of adsorbed CF4, almost not studied spectroscopically in adsorbed state.
Figure 1. FTIR spectra of 12CF4 gas (1), solid film at 60 K (2), and adsorbed at 77 K on MgO pretreated at 773 K (3) and CaO pretreated at 973 K (4), and NaX zeolite evacuated at 623 K (5). Background absorption of samples before adsorption is subtracted.
Figure 1 shows the region of ν3 vibration in the spectra of CF4 adsorbed on several different adsorbents at 77K. For comparison spectra of CF4 gas and solid film on cell windows are given at the same picture. In all the spectra at about 1259 cm-1 the “Evans hole” can be seen caused by Fermi resonance of ν3 vibration with 2ν4 mode, observed in the spectrum of gas as a doublet at 1265-1257 cm-1.
The band of ν3 vibration of adsorbed CF4 is split in two maxima with more intense high-frequency constituent. The separation is not the same for different adsorbents and increases in the sequence: MgO, CaO, NaX zeolite, following the basicity of surface anions. The position of the high-frequency constituent slightly shifts to higher wavenumbers with the increasing coverage. The position of ν3 band of 12CF4 admixed in 13CF4 adsorbed on MgO coincides with that of pure 12CF4 at the lowest coverage, thus indicating of RDD interaction as a reason of coverage-induced frequency shift.Acknowledgement. The work was financially supported by the Ministry of Education and Science of the Russian Federation , grant 11.38.38.2011.
REFERENCES[1] Hollins P., Pritchard J., in Vibrational Spectroscopy of Adsorbates, Ed. by Willis R.F. (Springer-Verlag Berlin Heidelberg, New York, 1980), pp.125-144[2].Tsyganenko A., Denisenko L., Zverev S., Filimonov V., J. Catal., 94, p.10-15 (1985)[3].Cherevatova A., et. al, J. Mol. Spectr., 238, p.64–71 (2006)
60

Krypton Influence on the Spectral Line Shape of Cd 326.1 nm
Rostona G. D and Ghatassb Z. F
a Department of Physics, Faculty of Science, Alexandria University, Egypt b Department of Environmental Studies, Institute of Graduate Studies and Research,
Alexandria University, Egypt [email protected]
The line center of the Cd intercombination spectral line 326.1 nm (51So-53P1) perturbed by Kr has been investigated using a high - resolution scanning Fabry-Perot interferometer. The van der Waals and Lennard –Jones potentials for Cd-Kr system has been calculated using the Coulomb approximation. The values of the pressure broadening (β) and shift (δ) coefficients for the studied line at temperature 468 K, density of cadmium N = 4.02 1012 cm-3 and gas Kr pressure ranged from 3 to 95 Torr has been obtained and compared with theoretical and experimental published values. Fig. (1) shows the plot of the Lorentzian half-width (γL) and the shift (∆) of the Cd spectral line 326.1 nm perturbed by Kr as a function of the perturbing gas density (N) at temperature 468 K. The average experimental Doppler half-width (γD) was 49.01±1.2x10⁻³ cm-1.
Figure 1: Lorentzian half-width (γL) and the pressure shift (∆) of the Cd spectral line 326.1 nm perturbed by Kr at
temperature 468 K plotted against the perturbing gas density.
REFERENCES [1] Helmi M.S, Grycuk T, Roston G.D, Spectrochim. Acta B. 51, 633 (1996) [2] Roston G.D, Helmi M.S, Chem. Phys. 258, 55 (2000) [3] Roston G.D, Physica Scripta. 72, 31 (2005) [4] Roston G.D, Ghatass Z.F, J. Quant. Spect. Rad. Transf. 101, 205 (2006) [5] Roston G.D, Ghatass Z.F, J. Quant. Spect. Rad. Transf. 109, 2427 (2008) [6] Kowalski A, Czajkowski M, Breckenridge WH, Chem. Phys. Lett. 121, 217 (1985) [7] Koperski J, Łukomski M, Czajkowski M, Spectrochimica Acta Part A. 58, 2709 (2002) [8] Czuchaj E, Krosnicki M. C.C.S, Chem. Phy. Let. 329, 495 (2002) [9] Brym S, Domysfawska J, Physica Scripta. 52, 511(1995) [10]
Roston
G
.D
, Helmi
M.S, Chem
. Phy
. 358
, 30
(2009)
-20
-10
0
10
20
30
40
50
0 10 20 30 40
N (1017 cm-3)
Δ γ L
(10
-3 c
m-1)
61

Nonlinear properties and collisonal spectra in hydrogen-(heavy) -noble-gas-atom mixtures
Waldemar Głaza, Tadeusz Bancewicza, George Maroulis, Anastasios Haskopoulosb
and Jean-Luc Godetc
aNonlinear Optics Division, Faculty of Physics, Adam Mickiewicz University, 61-614 Poznań, Poland, bDepartment of Chemistry, University of Patras, GR-26500 Patras, Grece, cLaboratorie de Photonique d'Angers,
EA 4464, Universite d'Angers, 2 boulevard Lavoisier, F—49045 Angers Cedex 01, France
The progress of recent decades in numerical and experimental procedures has made it possible to perform a deeper insight into subtle electrical, linear and nonlinear, properties brought about or modified by intermolecular interactions within colliding supermolecular compounds. In a series of works the phenomena like the collision induced Rayleigh- and hyper-Rayleigh scat-tering of light (CIRS/CIHRS) has been studied on the basis of the numerical quantum chemistry methods as well as by means of a theoretical approach. A relatively wide range of hetero-atomic noble gas pairs were originally taken into account and subsequently extended into the systems composed of H₂ molecules and lighter inert gas atoms (Rg) [1-6].
In this report a more complete research into the nonlinear spectroscopic properties of H₂-Rg pairs will be presented with the Rg set of He, Ne, Ar, Kr and Xe atoms considered as perturbers. The collision-induced hyperopolarizability tensorial values obtained via quantum chemistry methods are applied in order to produce CIHR spectral distributions; their influence on the lines is compared with earlier theoretical predictions. Consequently, the validity of the multipole-induced-multipole (MIM) model is assessed and its relevance to reproduce long range functional behavior of the so called symmetry adapted components of the first hyperpolarizability tensor Δβ(R) is discussed. A thorough analysis of the roto-translational spectra is performed to identify the role of the hyperpolarizabilty spatial distribution in forming the collisional line shapes. An extension of the dipole-induced-dipole analytical model is suggested and tested with regard to its ability to reproduce accurate spectral profiles.
REFERENCE
[1]. W. Głaz, T. Bancewicz, J.-L. Godet, G. Maroulis, and A. Haskopoulos, Phys. Rev., A 73, 042708 (2006)[2]. G. Maroulis, J. Chem. Phys., 104, 4772 (2000)[3]. T. Bancewicz, W. Głaz, and J.-L. Godet, Chem. Phys. Lett., 127, 134308 (2007)[4]. T. Bancewicz, W. Głaz, J.-L. Godet, and G. Maroulis, J. Chem. Phys. 129, 124306 (2008)[5]. J.-L. Godet, T. Bancewicz, W. Głaz, G. Maroulis, and A. Haskopoulos, J. Chem. Phys., 131, 204305 (2009)[6]. W. Głaz, J.-L. Godet, T. Bancewicz, A. Haskopoulos, and G. Maroulis, Phys. Rev., A84, 012503 (2011)
62

Spectroscopy of Atoms and Nuclei in Super strong Laser
Field: Stark effect and Multiphoton Resonances
A.V. Glushkova
aOdessa State University – OSENU, P.O.Box 24a, Odessa-9 65009
e-mail: [email protected]
An energy approach [1] is used to study interaction of nuclei and atoms with an intense and
super intense laser field, including high power raser and graser pulses. Method bases on
description of atom in a field by the k- photon emission and absorption lines. The lines are
described by the QED moments of different orders, which can be calculated with the use of the
Gell-Mann and Low S-matrix adiabatic formalism (T=0). In relativistic version the Gell-Mann
and Low formulae expresses an imaginary part of the energy shift Im E{a} through the QED
scattering matrix, including interaction of atom with electromagnetic field and field of the
photon vacuum. For any atomic level ImE{a}(w) is calculated as a function of the laser pulse
central frequency w (resonant curve). We calculate the moments for resonance, connected with
concrete atomic a-p transition (a,p-discrete levels; k photons is absorbed). The Stark resonances
energies and widths for a number of atoms (H, Li, Tm,U etc.) and different low-lying
and Rydberg states [1] are obtained within operator perturbation theory. The latter allow to
describe the strong field Stark effect in despite of the weak filed case [3]. The parameters
of multi-photon resonance, ionization profiles in Cs, Yb, Gd atoms are found. Earlier we have
discovered a laser field effect of the giant broadening of widths for the Letokhov-Ivanov re-
orientation decay autoionization resonances in Tm etc [1]. Here this effect is firstly predicted for
U atom and could be used in carrying out an optimal laser photoionization scheme of the
uranium and other isotopes and nuclear isomers. New data are obtained for electric and magnetic
multipole E2, M1 transitions in U, Yb, Gd, Tm. Modelling nuclear ensembles in a super strong
laser field provides opening the field of nuclear quantum optics and is carried out in our work
too. A nuclear dynamic (AC) Stark shift of low-lying nuclear states due to off-resonant
excitation by laser field (I~1025
-1035
W/cm2) is studied and is described within the operator
perturbation theory and the relativistic mean-field (RMF) model for the nucleus. The ac-Stark
shifts of the same order as in typical quantum optical systems relative to the respective transition
frequencies are feasible with state-of-the-art or near-future laser field intensities [4].
REFERENCES
[1]. Letokhov V.S., Ivanov L.N., Com.Mod.Phys.D:At.Mol.Phys. 4, 169 (1985); Glushkov A.V.,
Ivanov L.N., Phys.Lett.A170, 33 (1992); Preprint ISAN NAS-4, Moscow-Troitsk (1992);
J.Phys.B.: At. Mol.Opt.Phys. 26, L379 (1993).
[2]. Glushkov et al, Phys.Scripta. T135, 014022 (2009); Frontiers in Quantum Systems in Chem.
and Phys.(Berlin, Springer).18,522-545 (2008); in Coherence and Ultrashort Pulse Emission,
ed. F.J.Duarte (Intech, Vienna) p.159-186 (2011).
[3]. Lisitsa V.S., Physics- Uspekhi, Uspekhi Phys. Nauk. 153, 379 (1977).
[4]. Burvenich T., Evers J., Keitel C., Phys.Rev.Lett. 96,142501 (2006); Phys. Rev. C74, 044601
(2007); Shahbaz A., Muller C., Burvenich T., Keitel C., Nucl. Phys. A821, 106 (2009).
63

Spectroscopy of the Cooperative Muon-γγγγ-Nuclear
Processes: Energy and spectral parameters
A.V. Glushkova
aOdessa State University – OSENU, P.O.Box 24a, Odessa-9 65009
e-mail: [email protected]
A negative muon µ captured by a metastable nucleus may accelerate the discharge of the latter
by many orders of magnitude [1]. For a certain relation between the energy range of the nuclear
and muonic levels a discharge may be followed by µ ejection and µ- participates in discharge of
other nuclei. This work is devoted to studying energy and spectral characteristics iof the
cooperative muon-gamma-nuclear processes. We have applied a generalized relativistic energy
approach combined with an effective relativistic many-body theory [2,3] to studying the
discharge of a nucleus with emission of γ quantum and further µ conversion, which initiates this
discharge. Besides, the external raser effect on cited processes is studied. The decay probability
is linked with imaginary part of the "nucleus core+ external nucleon+µ-" system energy. One
should consider 3 channels [1]: i). radiative purely nuclear 2j-poled transition (probability P1;
this value can be calculated on the basis of known traditional formula); ii). Non-radiative decay,
when a proton transits into the ground state and µ- leaves a nucleus with energy E=E(p-N1J1)-
E(i), where E(p-N1J1) is an energy of nuclear transition, E(i) is the bond energy of µ- in 1s state
(P2); iii). A transition of proton to the ground state with µ- excitation and emission of γ quantum
with energy E(p-N1J1)-E(nl) (P3). Under condition E(p-N1J1)>E(i) a probability definition
reduces to QED calculation of probability of autoionization decay of 2-particle system. As
example, data for Sc, Tl nuclei are presented. The probabilities of µ--atom decay for different
transitions (with using the generalized Dirac-Saxon-Woods model [3]) are as follows (Sc):
P2(p1/2-p3/2)=3,93⋅1015
, P2(p1/2-f7/2)= 3,15⋅1012
, P2(p3/2-f7/2)=8,83⋅1014
. Here the nucleus must
transit the momentum no less than 2,4 and 2 according to the momentum and parity rules. If a µ--
atom is in the initial state p1/2, than the cascade discharge occur with ejection of µ- on first stage
and secondly the γ quantum emission. To consider a case when the second channel is closed and
the third one is opened, suppose: E(p1/2)-E(p3/2)=0.92 MeV. Energy of nuclear transition is not
sufficient to transit µ- to continuum state and it may excite to 2p state. Then, there is the proton
transition p1/2-p3/2 with virtual µ-
excitation to states of nd series and γ quantum emission
ħω=Ep(p1/2)+Eµ(1s)- Ep(p3/2)-Eµ(2p). The dipole transition 2p-1s occurs with P3=1.9⋅1013
s-1
(more than P(p1/2-p3/2), P(p1/2-f7/2 ) transitions without radiation.
REFERENCES
[1]. Letokhov V.S., Goldanskii V.I., JETP. 67, 513 (1974); Letokhov V.S., Ivanov L.N., JETP.
70, 19 (1976); . Glushkov A.V., Ivanov L.N., Phys.Lett.A170, 33 (1992); Preprint ISAN
NAS-4, Moscow-Troitsk (1992); Ivanov L.N., Ivanova E.P., Knoght L., Phys.Rev.48 , 4365
(1993).
[2]. Glushkov A.V., Low Energy Antiproton Phys. 796 , 206 (2005); Glushkov A.V., Khetselius
O.Yu., Svinarenko A.A., etal, Adv. in Theory of Quantum Systems in Chem. and Phys.
(Berlin, Springer). 22, 51 (2011); Glushkov A.V., Adv. in Theory of Quantum Systems in
Chem. and Phys. (Berlin, Springer). 28, 101 (2012).
[3]. Glushkov A.V. et al, Nucl.Phys. 734, 21 (2004) ; Int.J.Mod.Phys.A.24 , 611 (2009).
64

QUENCHING OF RYDBERG STATES IN SLOW COLLISIONS WITH NEUTRAL ATOMS AND MOLECULES OF MEDIUM
G.V.Golubkov1), M.G.Golubkov1), A.Z.Devdariany2) 1) Semenov Institute of Chemical Physics RAS, Moscow, Russia
2) Fock Institute of Physics, St. Peterburg University, Russia
A method for calculating the i fn n→ transition amplitude in slow collisions of highly
excited particles A** and neutral particles B is suggested. For the case 2 1Bn T µ << it can be represented in the form
( )2i f i foptF n n µπ
→ = − Ψ ΨV ,
where n is the principle quantum number, µ is the reduced mass of the particles A** and B, BT is the medium temperature, i fn n> , ( 1em e= = =h ). Depending on the total energy E of a nonlocal optical interaction operator is defined as follows [1]
1** **(1 )A B A BA B A B e B e B A Bopt i+ + − − +
−⎡ ⎤= + +⎣ ⎦V U U G K K G U .
Here A B+
U is the local operator of А+−В interaction, **A BG is the Green’s operator of the
noninteracting А** + В system. Operator e B−
K is presented a real e B−− scattering matrix
built on the standing waves [2]
(0)
( ) 1e B e B e B e Bs
rs rs
r skE E E E Rϕ ϕ
− − − −= +− − − +∑K K V V .
The first term (0)e B−
K corresponds to the direct potential scattering, and the second one
describes a resonant inelastic scattering mechanism by transition to the intermediate А+−В − ion state. Operator
e B−V describes a configuration interaction, rE is the energy of electron affinity,
sE is the vibrational s − level excitation energy of ion А+В − , rsϕ is the vibronic wave
function for bound state of this ion. In one act of collision the representative point performs multiple virtual transitions between the Rydberg and ionic configurations in the vicinity of the pseudocrossings. The probability 2( )i fF n n→ is the result of interference of each amplitude for the whole set of such transitions. A fundamentally important feature of this approach is that these transitions are taken into account consistently by introducing the interaction operator optV
in which this function is performed by Green's **A BG operator. 1. G.V.Golubkov, A.Z.Devdariani, M.G.Golubkov. Collision of Rydberg atom A** with atom
B in the ground electric state. Optical potential. JETP 95(6) 987-997 (2002) 2. G.V. Golubkov, G.K. Ivanov, Rydberg states of atoms and molecules and elementary
processes with their participation, Moscow: Editorial URSS, 2001, 302 p.
65

Evaluation of Particle Source Rate and Its Influence on Particle Transport in Fusion Plasma
M. Gotoa, K. Sawadab, K. Fujiic, M. Hasuoc, S. Moritaa
aNational Institute for Fusion Science, Toki 509-5292, Japan ([email protected])
bDepartment of Applied Physics, Faculty of Engineering, Shinshu University, Nagano 380-8553, Japan cDepartment of Mechanical Engineering and Science, Graduate School of Engineering, Kyoto University,
Kyoto 606-8501, Japan
The hydrogen Balmer-α line profile is measured for plasmas in the Large Helical Device (LHD), a heliotron-type fusion experiment device. Line emissions of neutral hydrogen dominantly take place as the atoms penetrate into confined region from outside. The line profile is found not to be approximated with a single Gaussian profile or, more precisely, it has a rather broad tail component. Since the possible broadening mechanism is the only Doppler broadening under the present plasma condition, the line profile is understood as a superposition of different temperature components.
We have carried out numerical inversion of the Laplace transform for the observed line profile, and have derived the intensity distribution function against the atom temperature [1]. The temperature dependence is interpreted to the spatial dependence with the help of other diagnostic data so that the radial profile of photon emission rate is derived. The photon emission rate then yields the ionization rate as a result of the collisional-radiative model calculation. The ionization rate or the particle production rate inside the confined region is a key parameter to evaluate the particle confinement time, τp, of electrons or protons, which is a measure of confinement performance of the plasma.
From the derived ionization rate we have evaluated the particle confinement time as a function of normalized minor radius, reff, for two kinds of discharges characterized by the different magnetic field strength. The results are shown in Fig. 1. In the high field case, a turning point is clearly seen at around reff = 0.6, which corresponds to the last closed magnetic flux surface. In the low field case, no such clear boundary is seen. In the present low field case the β value, i.e., the plasma pressure normalized to that of the magnetic filed, is rather high so that the magnetic surface may be perturbed and broken in the plasma edge region. This effect could be observed. The absolute value of the confinement time is approximately one-order smaller in the low field case than in the high field case.
REFERENCES
[1] M. Goto, K. Sawada, K. Fujii, M. Hasuo and S. Morita., Nuclear Fusion, 51, 023005 (2011).
10-3
10-2
10-1
100
101
(s)
0.60.40.20re! (m)
#110857 (2.75 T)
#97910 (0.41 T)
FIG. 1: Particle confinement derived for high field (2.75 T) and low field (0.41 T) discharges.
66

Peculiarities of the C2 d3П→а3П Band System Intensities in Gas Discharges through CO-contained Mixtures
G.M.Grigorian
St.Petersburg University, St.Petersburg, 198504, Russia [email protected]
The C2 (d3Пg → а3Пu) bands excited in the discharge through CO - He and CO – He - O2
mixtures have been investigated spectrally with special attention being paid to the observed selective excitation of the v = 6 level of d3Пg state.
A population inversion in v = 6 has been observed in a lot of experiments. There is general agreement to attribute this inversion to production of C2 molecules in an electronic state crossing d3Пg in the vicinity of v' = 6. In [1] a theoretically predicted metastable 5Пg state of C2 molecules has been proposes as a candidate for the precursor state.
It was shown in our previous works, that changes in the CO vibrational population in CO containing plasmas influence intensities of Swan system (С2: d3Пg→а3Пu transition), the vibrational distribution of d3Пg state and the rotational temperature of v = 6 d3Пg. In conditions with high concentration of CO(w) molecules a population inversion in v = 6 of C2 d3Пg
disappeared. One of the reasons of this phenomenon may be the changing of the excitation process of v = 6 d3Пg. This electronic state of C2 corresponds energetically to some vibrationally excited levels of CO(X1Σ, w) molecule, with the vibrational quantum numbers w > 10. This hints to a possible energy transfer from the vibrational to electronic states between these molecules (V-E processes). Up to date it is unclear which ones of the vibrational levels of CO(X1Σ, w>10) take part in processes followed the disappearing of the selective excitation of v = 6 d3Пg C2.
In the present report we study the influence of the changes of populations of different vibrational levels of CO(w) molecules on the concentration of v = 6 d3Пg state of the C2.
The experimental set-up has been described in detail elsewhere [2]. The discharge was operated in DC mode. The experimental conditions were the typical for the active medium of electrical discharge CO-laser and the discharge tube with an appropriate resonator may work as a CO-laser. The analysis of the spontaneous emission spectra allowed us to determine the populations of the vibrational levels of CO(X1Σ+) molecules, the gas temperature and the concentrations of the electronically excited particles in the gas discharge plasma. The vibrational distribution of CO molecules in the ground electronic state was determined from the spectra of IR molecular emission at the first and second overtones. The changes of CO vibrational energy distribution were imposed by an application of a tunable laser resonator to the discharge tube (in oscillation regime populations of vibrational levels of CO(v) molecules which take part in generation drastically decrease). It was found that the vibrational levels 12 < w < 20 of the CO molecules most effect on the concentration of the C2 (d3Пg, v = 6). In conditions with low concentrations of CO(w) molecules (in the lasing regime of the discharge tube) rotational temperature determined from (6,5) band of the C2 Swan system - Tr
C2 (v = 6) was ~ 150K, but Tr (v≠6) was equal to the gas temperature (~
300-400 K) - Tg. Without lasing all rotational temperatures TrC2
(v) was equal Tg and the inversion on the C2 (d3Пg, v = 6) was absent.
REFERENCES
[1]. Little C.E., Browne R.G., Chem.Phys.Lett., 134, 560 (1987)[2]. Grigorian G.M., Kochetov I.V., Quantum Electronics, 38, 222 (2008)
67

Spectroscopy of Cooperative Electron-γγγγ-Nuclear Processes
in Heavy Atoms: NEET and Shake-up Effects
O.Yu. Khetseliusa
aOdessa State University – OSENU, P.O.Box 24a, Odessa-9 65009 E-mail: [email protected]
A new consistent relativistic energy approach (REA) combined with the relativistic many-body
perturbation theory [1] is applied to studying the cooperative electron-gamma-nuclear processes.
Spectral features of the “shake-up” and nuclear-excitation-electron transition (NEET) effects are
studied [2]. The NEET probability P can be determined as the probability that the decay of the
initial excited atomic state will result to excitation of and subsequent decay from the
corresponding nuclear state. Within REA the probability is connected with an imaginary part of
energy shift for the system (nuclear subsystem plus electron subsystem) excited state. The latter
can be expanded to a series on the known parameters e
a
IF Rω , N
N
IF Rω . The effects of purely
nuclear transition, purely electron-(hole), combined electron–nuclear transition are distinguished.
The calculation results on the NEET effect are presented for the atomic/nuclear systems Os189
76,
Ir193
77, Au
197
79 and compared with available theoretical and experimental data [3]. We predicted an
effect of the giant increasing shake-up probability under transition from the neutral atoms Fe57
26,
Cs133
55 , Yb171
70 to the corresponding O-and F-like multicharged ions. The detailed analysis of
spectra of the electronic satellites in spectra of gamma emission of the atoms is given. Studying
cooperative processes is expected to allow a determination of nuclear spectral parameters and the
study of atomic vacancy effects on population mechanisms of excited levels.
Table 1. Theoretical and experimental data on РNEET (M1) for the isotopes of Os189
76, Ir193
77, Au
197
79
Nucleus Energy of nuclear
excitation (keV)
Experiment [3] Theory [3]
Our work
Os189
76 69.535 <9.5⋅10-10
1.2⋅10-10
1.3⋅10-10
1.9⋅10-10
Ir193
77 73.04 (2.8±0.4) ⋅10-9
2.0⋅10-9
2.7⋅10-9
Au197
79 77.351 (5.7±1.2) ⋅10-8
(4.5±0.6) ⋅10-8
3.4⋅10-8
4.5⋅10-8
4.6⋅10-8
REFERENCES
[1]. Glushkov A.V., Ivanov L.N., Phys.Lett.A170, 33 (1992); Glushkov A.V., Khetselius O.Yu.,
Malinovskaya S.V., Europ.Phys.J. 160, 195 (2008); Glushkov A., Khetselius O., Lovett L.,
Adv. in Theory of Atomic and Molecular Syst.: Dynamics, Spectroscopy, Clusters, and
Nanostructures.- Berlin, Springer. 20, 125 (2009); Khetselius O.Yu., Phys.Scripta, T135,
014023 (2009); Int.J.Quant.Chem. 109, 3330 (2009).
[2]. Morita M., Progr.Theor.Phys. 49, 1574 (1973); Letokhov V.S., Goldanskii V.I., JETP. 67,
513 (1974); Letokhov V.S., Ivanov L.N.,JETP.68,1748 (1975); Goldanskii V.I., Namiot V.,
Phys. Lett.B62, 393 (1976).
[3]. E.V. Tkalya, Nucl.Phys.A539, 209 (1992); Phys. Rev. A75, 022509 (2007); I. Ahmad etal,
Phys.Rev.C61, 051304 (2000); S. Kishimoto etal, Phys.Rev.Lett. 85, 1831 (2000); Phys. Rev.
C74, 031301 (2006).
68

Spontaneous Rayleigh-Brillouin spectra in neutral gases
measured with a wide aperture spectrometer
Yu. I. Anisimov, I. Ch. Mashek, S. A. Smirnov, N. B. Kosykh.
Saint-Petersburg State University, 198504, Saint-Petersburg, Ulyanovskaya street, 2, [email protected]
Rayleigh-Brillouin scattering in gases was first explored in the 1960s using narrow-band
lasers and Fabry-Perot interferometers, which provide the frequency resolution needed to
observe the Brillouin doublet due to scattering off thermal sound. The study of the exact
Rayleigh-Brillouin spectral line shape is of practical relevance since it provides information on
the velocity, density, and temperature of the illuminated gas samples. There are some kinetic
line-shape models, that use macroscopic transport coefficients, such as the viscosity, the bulk
viscosity, the heat conductivity, and the heat capacity of the gas. Differential cross-section of the
scattering could be given by equation (1):
),(])(4
sin[),(
4
0
2
KSKKDS T
(1)
where K is wave vector, ),( KS
is Furier-transform of correlation function.
In case of non-stationary gas flow, it’s nesessary to measure Doppler’s shifted spectr as quick
as possible. Also, if incident light power is limited by studying only statistical density
fluctuation, an experimental setup should have a wide input diaphragm and sensitive
photodetector. Photomultiplier tube in photon count mode gives high sensitivity, but using wide
aperture makes Brilloun peaks wider due to angular dependence of the cross-section. Kinetic
model [1] can be used to estimate spectral broadening by integrating the cross-section at input
diaphragm plane. Dot lines in picture (a), (b) show the kinetic calculations in comparison with
specrtral line shapes, measured in N2 during only ten seconds, round aperture 35 mm in diameter
was set at the distance 150 mm from the scattering point, at scattering angle 15o[2]. Optimal
forms of input apertures could be find for short exposition or for high accuracy with the
preliminary estimation.
REFERENCES
[1]. Sugawara A., Yip S., Phys. Fluids, 10, 1911 (1976)
[2]. Anisimov Yu., Kosykh N., Mashek I., Optics and Spectroscopy, 102, 467 (2007)
69

Contribution of Stark-Doppler broadening of carbon
impurity lines to the analysis of JT-60U divertor plasmas
M. Koubitia, T. Nakano
b, Y. Marandet
a, L. Mouret
a, J. Rosato
a and R. Stamm
a
aAix-Marseille Université, PIIM UMR 7345, F-13397 Marseille Cedex 20, France
CNRS, PIIM UMR 7345, F-13397 Marseille Cedex 20, France
bJapan Atomic Energy Agency, 801-1, Mukoyama, Naka, Ibaraki, 311-0193, Japan
In magnetic fusion devices, one of the best scenarios to protect the Plasma Facing
Components (PFCs) from the huge heat load escaping from the confined plasma core consists in
cooling the divertor by impurity radiation. In such situations, evaluating the power balance
requires the knowledge of the impurity radiative power. However, radiative power calculations
necessitate the knowledge of the plasma parameters which should be determined with the highest
possible accuracy. Plasma parameters can be determined from spectroscopic measurements such
as line intensities and line profiles. In JT-60U, whose wall and targets are made of carbon,
radiative cooling is ensured by line radiation from carbon impurities, mainly C2+
and C3+
ions
[1]. Here we propose to explore high-resolution line spectra for diagnostic purposes. More
exactly we fit high-resolution spectra of the C IV n=6-7 722.6 nm line with Stark-Doppler
profiles. Theoretical profile calculations are carried out using the PPP line shape code [3]
assuming equal ion and electron temperatures, the latter being determined from line intensities of
low-resolution C IV VUV and visible spectra. Specific results will be presented for a detached
divertor plasma of JT-60U in presence of a MARFE (Multifaceted Asymmetric Radiation From
the Edge) centered around the X-point. It will be shown that while spectra measured along
viewing chords crossing peripheral parts of the MARFE are easily fitted with a single profile, the
fit of those measured along viewing chords crossing the central part of the MARFE requires the
use of at least two profiles [4]. We found that the X-point MARFE can be characterized with
electron temperatures and densities in the ranges 1-25 eV and 1-8x10¹⁴
cm-3
respectively.
REFERENCES
[1] T. Nakano et al, J. Nucl. Mater. 390-391, 255 (2009)
[2] M. Koubiti et al, J. Nucl. Mater. 415, S1151 (2011)
[3] B. Talin et al, Phys. Rev.A.51, 1918 (1995)
[2] M. Koubiti et al, Contrib. Plasma. Phys. (Under press).
70
Emission Profiles of K-He Exciplexes in Cold Helium Gas
N F Allarda
a Observatoire de Paris, GEPI, 61, Avenue de l'Observatoire, F-75014 Paris, France [email protected]
Emission spectra of exciplexes composed of a light alkali atom in the first excited state and He atoms have been observed in cryogenic gas. A unified semi-classical theory of line broadening has been used to determine the emission profiles of potassium perturbed by helium at low temperatures and high He density. The agreement of the theoretical peak positions of K-Heexciplexes compared to the experimental determinations is fairly good. Such comparisons provide a critical test of the calculated molecular potentials and the relevance of the theoretical approach which has been used.
71

Absorption Spectra of NaHe From White Dwarfs to Helium Clusters
N F Allarda , F Spiegelmanb , A Nakayamac and J F Kielkopfd
a Observatoire de Paris, GEPI, 61, Avenue de l'Observatoire, F-75014 Paris, France [email protected] b Laboratoire de Physique Quantique, Université Paul Sabatier Toulouse, France
[email protected] Division of Chemistry, Graduate School of Science, Hokkaido University, Sapporo 06-0810, Japan
[email protected] Physics & Astronomy, University of Louisville, Louisville, Kentucky 40292 USA [email protected]
The absorption spectrum of Na produced in dense plasmas of helium shows line features, broadening and shift due to extrema in the potential difference of the transitions which contributed to the 3s-3p transition. Several theoretical computed profiles are used to illustrate the evolution of the line shapes at high perturber density when decreasing the temperatures from 5000K, the temperature prevailing in atmosphere of ultra-cool white dwarfs down to 1K.
72

Raman Line Shape Studies of Hydrogen Cryosolutions
I. Verzbitskiya, W. Herreboutb, B. van der Vekenb, A. Kouzova
aDepartment of Physics, Saint-Petersburg State University, Ulyanovskaya str. 3, Peterhof, Saint-Petersburg 198504, Russia; ivan.verzhbitskiy@gmail, [email protected]
bDepartment of Chemistry, University of Antwerp, Groenenborgerlaan 171, 2020 Antwerp, Belgium; [email protected], [email protected]
New data on Raman line shapes of molecular hydrogen dissolved in liquid argon (T=87 K) and nitrogen (T=80 K) are reported. The rotational S0(J) and rotovibrational S1(J) lines with J=0,1 were recorded using the triple Princeton Instruments TriVista 557 spectrometer. Due to the improved spectral resolution (0.4 cm-1) and S/N ratios, the shape features hitherto escaping the observation [1,2] were resolved. The S0(J) shapes in the H2-LAr solution are found to follow the lorentzian distribution; at detunings larger than two half widths, the H2-LN2 S0(J) shapes exhibit sub-lorentzian behavior. This shows the H2 rotational perturbations by Ar to be quite fast, whereas the decay rate of the H2-LN2 ones should be about 15 cm-1. This value is close to the mean speed of N2 rotation. A decimal order increase of the S0(J) widths caused by substitution of argon by nitrogen also suggests the key role of the N2 rotation in the S0(J) line broadening. Qualitatively, these results respond to the quadrupole-quadrupole H2-N2 interaction model; the shorter-ranged anisotropic H2-Ar forces decorrelate much faster and therefore give rise to the lorentzian shapes.
Remarkably, the S1(J) H2-LAr lines are about five times broader than the corresponding S0(J) lines and show asymmetry which survives even when the shapes are corrected to the quantum detailed balance (Fig. 1). In the H2-LN2 case, the vibrational broadening effect is quite small (less than 5%) and the line asymmetry is much weaker than that observed on the S1(J) H2-LAr lines. Altogether, our results intimate the possible interference between the rotational and vibrational channels of broadening.
Fig.1. Measured S1(0) shape of H2 in liquid argon (dots); lorentzian distribution corrected for quantum detailed balance (red solid line).
REFERENCES
[1]. Orlova N.D., Pozdniakova L.A., Optics and Spektrosk., 48, 1086 (1980). [2]. Orlova N.D., Khamitov R., Optics and Spektrosk., 65, 567 (1988).
73
Line Profiles of Direct Absorption Transitions to Highly Excited Overtone-Combination Vibrational States
of Methane
D.N. Kozlova and P.P. Radib
aA.M. Prokhorov General Physics Institute, Russian Academy of Sciences, Vavilov str. 38, 119991 Moscow, Russia [email protected]
bPaul Scherrer Institute, CH-5232 Villigen, Switzerland
Spectra of weak direct absorption transitions to overtone-combination vibrational states of CH4 provide new experimental data on their spectroscopic and relaxation characteristics and are relevant for the development of novel theoretical approaches to the description of the highly-excited spherical top polyads [1]. Laser-Induced Gratings (LIGs) spectroscopy [2] has been used to record with high sensitivity and signal-to-noise ratio the resolved rovibrational absorption spectra of CH4 assigned to [3] the bands 3ν1+ν3, 2ν1+2ν3, and ν1+3ν3 (polyad P8, 889 nm, 861 nm, 840 nm, respectively), 3ν1+ν3+(ν2 or ν4) (polyad P9, 790 nm), 4ν1+ν3 (polyad P10, 727 nm), and 5ν1+ν3 (polyad P12, 619 nm). LIGs were resonantly excited by a ns-pulse radiation of two crossed pump laser beams. A cw probe radiation provided a μs-scale pulse of the diffracted light, and its temporal evolution was registered by a photodetector as the characteristic LIG signal. Spectroscopy of the absorption transitions is performed by tuning the pump laser frequency and deriving the integral of the LIG signal over a definite time interval as a function of the frequency. The transition spectral profiles have been recorded with a spectral resolution of ∼ 0.04 cm-1 at pressures 0.1-4 bar and temperatures of 295 and 150ºK.
Despite the high density of rovibrational states (several states/cm-1), with the splittings typically less than characteristic intermolecular interaction terms and the states mixed well with each other, a relatively small number of narrow "prominent" lines and a very dense "undergrowth" of numerous weaker overlapping lines are distinguished in the spectra. All these lines rise above a structureless absorption background. The prominent lines represent one single or, at most, a few "bright" rovibrational states. The weaker lines and the background result from an extremely dense spectrum of surrounding "dark" states, coupled to the bright ones by various vibrational and rovibrational interactions.
Collisionally-broadened profiles of a few of the prominent lines in each of the bands have been fitted using the Lorentzian function corrected for the contributions from the neighbouring lines and the constant background. The measured variations with pressure of line broadening and shift are presented. The results show that the observed prominent lines correspond to long-living rovibrational states existing within the polyads, their collisional relaxation rates being only about twice as large as those of the rotational levels of the fundamental ν1 state [4]. The work was made possible by the visiting researcher program of the Région Nord - Pas-de-Calais, France, and was also supported by the Russian Foundation for Basic Research (RFBR), grant № 11-02-01296, the Swiss Federal Office of Energy and the Swiss National Science Foundation (200020_124542/1).
REFERENCES
[1]. D.A. Sadovskii, D.N. Kozlov, P.P. Radi, Phys. Rev. A, 82, 012503 (2010). [2]. D.N. Kozlov, P.P. Radi, J. Raman Spectrosc., 39, 730 (2008). [3]. L.P. Giver, J. Quant. Spectrosc. Radiat. Transfer, 19, 311 (1978). [4]. D.N. Kozlov, V.V. Smirnov, and S.Yu. Volkov, Appl. Phys. B48, 273 (1989).
74

Formation Of Xe2 In The Gas Discharge At Room Temperature
S.A. Klemeshev, E.Yu. Kleymenov, P.A. Saveliev, and N.A. Kryukov
St. Petersburg State University, Ulianovskaja 1, St. Petersburg (Peterhof), 198904 Russia, [email protected]. We have measured concentrations of excited Xe atoms and Xe2 molecules with VUV
emission and IR absorption spectroscopies and obtained rate constants of the Xe2 formation in the gas discharge at room temperature.
Fig. 1 shows emission VUV spectra of Xe2. The spectra are formed by the electronic transitions from the lowest radiative excited 0+
u and 1u molecular states to the ground 0+g state.
The spectrum contains the short-wavelength (147-148 nm) and long-wavelength (150-200 nm) peaks, which correspond to the transitions from the high and low vibrational states (the first and second continuum respectively). We have obtained concentrations of Xe2 in high and low vibrational states from the integral spectral intensities at the following conditions: neat xenon and mixture of xenon and helium, xenon pressure from 1 to 63 Torr, and discharge current from 1 to 15 mA.
The Xe 5p56s (3P2) and 5p56s (3P1) atomic states correspond to the dissociation limits of the Xe2
0+u and 1u states. We have measured concentrations of Xe atoms in these excited states
by monitoring the IR absorption at a wavelength of 881.9 nm and 828.0 nm. The pressure dependence of the molecular and atomic concentrations (Fig. 2) supports the hypothesis of the third-order formation reaction. An excited Xe atom, a Xe atom in the ground electronic state and an atom in the ground state (Xe or He) are participating the formation of the excited Xe2 molecule.
We have calculated formation rate constants of Xe2 in the excited molecular states using the pressure dependences shown in Fig. 2, radiation and vibrational relaxation constants from Ref. 1, and assuming the contributions of the parent states 0+
u and 1u in the emission spectrum (Fig. 1), as proposed in Ref. 1. The obtained formation rate constant values: kf (0
+u) = (4±2) 10-32 cm6s−1 and kf (1u) = (0.3 ± 0.1) 10−32 cm6s−1.
REFERENCES
[1] Zagrebin A.L., Kryukov N.A., Savel’ev P.A., Optics and Spectroscopy, 86, 678-685 (1999)
Fig. 1. Emission spectra of Xe2.
Fig. 2. Dependence of molecular and atomic concentrations on the xenon pressure.
75

Operator Perturbation Theory to Hydrogen Atom in the
Crossed Strong DС Electric and Magnetic Fields
A.S. Kvasikovaa
aOdessa State University – OSENU, P.O.Box 24a, Odessa-9 65009
e-mail: [email protected]
Within the operator perturbation theory (OPT) a new approach to calculating energies, Stark
resonances widths and probabilities of radiative transitions between Stark and Zeemane
sublevels in a spectrum of an atom in the crossed DC electric and magnetic fields is presented.
The essence of the OPT method [1] is the inclusion of the well-known method of "distorted
waves approximation" in the frame of the formally exact PT. The zeroth order Hamiltonian H0 of
this PT possesses only stationary bound and scattering states. To overcome formal difficulties,
the zeroth order Hamiltonian was defined by the set of the orthogonal EF and EE without
specifying the explicit form of the corresponding zeroth order potential. In the case of the
optimal zeroth order spectrum, the PT smallness parameter is of the order of G/E, where G and E
are the field width and bound energy of the state level. It has been shown that G/E ≤1/n even in
the vicinity of the "new continuum" boundary (n is the principal quantum number). It is very
important to note that the hamiltonian H0 is defined so that it coincides with the total
Hamiltonian H at ε ⇒ 0. (ε is the electric field strength). Note that perturbation in OPT does not
coincide with the electric field potential, though they disappear simultaneously. As example of
application, below we present the calculation results for energy (in Ry) of the ground state for
hydrogen atom in the dc electric and magnetic fields [3]. For comparison there are also listed the
results of the ground state hydrogen atom energy on the basis of the Turbiner’s standard
perturbation theory SPT (look, for example, [2]). Analysis shows that the both results are in the
physically reasonable agreement, at least till the field strengths values ~0.04 atomic units.
Further in a case more strong field it begins to increase the difference between our theory data
and the SPT results. It is important underline that our results are obtained in the first PT order,
i.e. already the first PT order provides the physically reasonable results. From the one hand, for
weak field strength values an excellent agreement between both approaches can be easily
explained. From the other hand, the standard PT formalism falls in a case of consideration the
strong electric or magnetic or both simultaneously fields. Our theory is absolutely valid in a case
of the strong DC electric field due to using the OPT formalism as the zeroth approximation,
where an electric field is taken into account on the non-perturbative basis. However, our theory
can hardly applied in a case of the strong external magnetic field. It is obvious that in the last
case the non-perturbative treatment in the presented theory is necessary. The similar preliminary
results are also obtained for the lithium atom and compared with data from [4].
REFERENCES
[1]. Glushkov A.V., Ivanov L.N., J. Phys. B: At. Mol. Opt. Phys. 26, L379 (1993) ; Glushkov
A.V. et al, Int.J.Quant. Chem. 99, 936 (2004).
[2]. Lisitsa V.S., Physics-Uspekhi (Usp.Phys.Nauk). 153, 379 (1977).
[3]. Kvasikova A.S. et al, Photoelectronics 20, 71 (2011).
[4]. Meng H-Y., Zhang Y-X., Kang S., Shi T-Y., Zhan M-S., J. Phys. B: At. Mol. Opt. Phys. 41,
155003 (2008).
76

Experimental Study of Asymmetrical SiII Lines
B. Ferhat a R. Redon b M. Ripert b Y. Azzouz a A. Lesage c
a LEQ, Faculté de Physique, U.S.T.H.B, BP 32 El Alia, 16111, Alger, Algérie, [email protected] b PROTEE /ISO, U.S.T.V, 83957 La Garde CEDEX, France
cGEPI, Observatoire de Paris-Meudon, 92195 Meudon CEDEX, France
Six lines of SiII are experimentally studied in pulsed plasma generated by Nd :Yag laser breakdown, on pure solid silicon target. A set of experimental Stark parameters of asymmetrical lines are measured in temperature range from 14 000 K to 18 000 K. Theoretical values of the electron density vary from 1.7 to 6.1 x 10²³/m3. Processed spectral lines are 333.982 nm (3s24p -3s26s) and 397.746 nm, 399.177 nm, 399.801 nm and 401.622 nm (3d’2F0- 4f’4G and 3d’2F0- 4f’2G) of astrophysical interest. Asymmetrical line shapes are synthesized by a sum of two lorentzian distributions. The fit is very good.
Widths and shifts knowledge of SiII is of great interest for atomic physicists and astrophysicists. Some spectroscopic parameters of silicon are not yet experimentally determined. This lack of data is indicated in [1, 2].
They are several elaborated theories [3-9] to determinate Stark parameters, for weakly and heavily charged ions. Almost all published experimental values concern symmetrical lines only described by a Lorentzian (or Voigt) distribution. At the same time, the phenomenon of the asymmetry of the line shape is relatively few studied experimentally, although it is known since years, few authors have focused their interest on its study [10-13].
REFERENCES [1]. Lanz T., Artru M.C., Physica Scripta, 32,115 (1985) [2]. Lesage A., Redon R., A&A, 478, 765 (2004) [3]. Griem H. R., Phys.Rev, 165, 258 (1968) [4]. Griem H. R., Spectral line broadening by plasmas, Academic press, New York (1947) [5]. Sahal-Bréchot S., A&A, 1, 91 (1969a); 2, 322 (1969b) [6]. Lanz T., Dimitrievic M. S., Artru M.C., A&A, 192, 249 (1988) [7]. Ralchenko Yu. V., Griem H. R., Bray I., JQSRT, 81, 371 (2003) [8]. Ralchenko Yu. V., Griem H. R., Bray I., Fursa D.V., Phys. Review A, 59, 3 (1999) [9]. Alexiou S., in 13th I.C.L.S., Zoppi M. and Ulivi L. ed. (1997) [10] Szudy J., Baylis W.E., JQSRT, 17(5), (1977) [11] Könies A., Gunter S., JQSRT , 52, 825 (1994) [12] Nicolic D., Djurovic S., Mijatovic Z., Kobilarov R., Vujicic B., Cirisan M., JQSRT, 86, 285 (2004) [13] Bengoechea J., Aragon C., Aguilene J.A., Spectrochimica Part B, 60 , 897 (2005)
77

Statistical Models for Collision–Sequence Interference with Arbitrary Persistence of Velocity
Herbert Wheelera and John Courtenay Lewisb
a605 – 160 Third Street West North Vancouver BC Canada V7M 0A9
[email protected] bDepartment of Physics and Physical Oceanography
Memorial University of Newfoundland St. John's NL Canada A1B 3X7
The elementary statistical models developed by Lewis et al. [1–3] to describe collision–sequence interference effects have mostly used Gaussian–distributed velocities, always with zero persistence of velocity. The earliest of the models assumed constant intervals between successive collisions, while Poisson-distributed collision times were used in [3], and models with a shifting mechanism were also introduced in that paper.
In the present work we assume persistence of velocities which run from zero to just less than unity. Velocity sequences with this property can be modelled by an AR(1) (Box–Jenkins) process [4].
Such processes necessarily lead to persistence–of–velocity coefficients vi !vi+1 ,
vi !vi+2 … vi !vi+k … which form a geometrical progression. Here vi is the velocity before
the ith collision in a collision sequence). However, we can model more complicated behaviour. For vector collision–sequence interference the results show the interference dip narrowing with increasing persistence of velocity, as predicted earlier [5–8].
There is no change in line shape when a power of the change of velocity rather than the change in velocity is used as the integrated induced dipole moment, which is in disagreement with observations in a molecular dynamics simulation in Lennard–Jonesium [9]. The reason for the difference is not clear, but presumably reflects differing roles for the soft and hard parts of the interaction in the simulation results.
REFERENCES
[1] J. C. Lewis, Phys. Rev. A 77, 062702 (2008). [2] J. C. Lewis, International Journal of Spectroscopy p. 561697 (2009). [3] J. C. Lewis and R. M. Herman, International Review of Atomic and Molecular Physics 2, 25 (2011). [4] G. Box, G. M. Jenkins, and G. C. Reinsel, Time Series Analysis: Forecasting and Control (Prentice–Hall, 1994), 3rd ed. [5] J. C. Lewis and J. van Kranendonk, Can. J. Phys. 50, 352 (1972). [6] J. C. Lewis and J. van Kranendonk, Can. J. Phys. 50, 2902 (1972). [7] J. C. Lewis, in Phenomena Induced by Intermolecular Interactions, edited by G. Birnbaum (Plenum Press, New York, 1985), pp. 215–257. [8] J. C. Lewis and R. M. Herman, Phys. Rev. A 68, 032703 (2003). [9] J. C. Lewis, in Proceedings of the 17th International Conference on Spectral Line Shapes, edited by E. Dalimier (Frontier Group, 2004), pp. 358–360.
78

Calculation of the Ortho–Para Conversion of Hydrogen in a p-type Silicon Lattice using a dwell time method
Roger M. Hermana A. Suareza, J. Sofoa and John Courtenay Lewisb
a104 Davey Laboratory Department of Physics Pennsylvania State University University Park, PA 16802 USA
[email protected] bDepartment of Physics and Physical Oceanography
Memorial University of Newfoundland St. John's NL Canada A1B 3X7
[email protected]. Hydrogen has been observed in silicon lattices by Raman [1] and by IR spectroscopy [2], the
IR spectrum being apparently due to an interaction-induced dipole moment [3]. Quantitative spectroscopic studies of hydrogen in a p–type silicon lattice at room temperature and at reduced temperature have led to rates for the ortho–para conversion process [6, 7]. The characteristic relaxation time at room temperature is about 8 hours. An attempt to explain this rate on the basis of the interaction between the interstitial H2 and naturally occurring 29Si using the Wigner rate expression [7] was given by Hiller et al. [5]. Their explanation was found to be incompatible with experiment by Peng et al. [8], the principal difficulty being that the Wigner mechanism would necessitate a superposition of different decaying exponentials corresponding to the presence of 29Si in nearest, next nearest, etc. neighbors, leading to a complicated multi–exponential decay, as opposed to observation.
The present authors [9] calculated the rate assuming that the ortho–para conversion was effected during scattering of the holes from the hydrogen molecules, this being not much different from scattering in free space, though an anisotropic mass tentor was used for the holes. The result was a rate smaller than that observed by several orders of magnitude.
In the present work it is assumed that spz holes moving with group velocity v diffuse randomly throughout the Si lattice, dwelling on effective areas associated with spz sites. The dwell time is taken to be the separation between spz containing planes divided by velocity. The transition matrix elements are the same as for the scattering mechanism [9] with the same exchange enhancement.
The resultant characteristic time at room temperature we find to be 1000 hr. Considering that the result is the product of several large and small terms each with considerable uncertainty the discrepancy between this and observation is not sufficient as to negate our physical picture.
REFERENCES
[1]. Pritchard R., Ashwin M., Tucker J., and Newman R., Phys. Rev. B 57, 15048 (1998) [2]. Leitch A., Alex A., and Weber J., Phys. Rev. Lett. 81, 421 (1998) [3]. Zhou J. A., Chen E., and Stavola M., Physica B 273–274, 200 (1999) [4]. Chen E. E., Stavola M., Fowler W. B., and Zhou J. A., Phys. Rev. Lett. 88, 245503 (2002) [5]. Hiller M., Lavrov E. V., and Weber J., Phys. Rev. Lett. 98, 055504 (2007) [6]. Hiller M., Lavrov E. V., and Weber J., Phys. Rev. Lett. 99, 209901 (2007) [7]. Wigner E. P., Z. phys. Chem. B 23, 28 (1933) [8]. Peng C., Stavola M., Fowler W. B., and Lockwood M., Phys. Rev. B 80, 125207 (2009) [9]. Herman R. M., Suarez A., Sofo J. and Lewis, J.C. in 20th Int. Conf. Spectral Line Shapes, CP1290, AIP, 284 (2010)

Transition Frequencies And Pressure Shifting Of Oxygen B-Band Lines Measured With Frequency-Comb Assisted
Cavity Ring-Down Spectroscopy
J. Domysławska a, S. Wójtewicz a, D. Lisak a, A. Cygan a, F. Ozimek b, K. Stec a, K. Bielska a, P. Masłowski a, Cz. Radzewicz b, R. S. Trawiński a and R. Ciuryło a
a Instytut Fizyki, Uniwersytet Mikołaja Kopernika, ul. Grudziądzka 5/7, 87-100 Toruń, Poland. b Wydział Fizyki, Uniwersytet Warszawski, ul. Hoża 69, 00-681 Warszawa, Poland
Transition frequencies and pressure shifting of weak B-band lines of O2 were measured with
low uncertainties. These results were compared to data available in the literature. In order to achieve reported accuracy of the transition frequencies and collisional shifting coefficient it was necessary to take into account several subtle line-shape effects, such as speed-dependence of collisional broadening and shifting and Dicke narrowing in data analysis. We found that the speed-dependent Nelkin-Ghatak profile can properly describe experimental line shapes in the investigated pressure range.
Our experimental setup consists of the Pound-Drever-Hall locked frequency-stabilized cavity ring-down spectrometer (PDH-locked FS-CRDS). Its description can be found in papers [1-3]. This spectrometer provides high-resolution and very high signal-to-noise ratio of measured spectra [4]. It was recently linked to the optical frequency comb (OFC) [5,6,7] working in the visible region of spectrum. This upgrade allows for accurate determination of the absolute frequency of the CRD probe laser at each point of measured spectrum [8].
The research is part of the program of the National Laboratory FAMO in Toruń, Poland and is supported by the Polish National Science Centre, Project No. DEC-2011/01/B/ST2/00491. The research was also supported by the Foundation for Polish Science TEAM Project co-financed by the EU European Regional Development Fund.
REFERENCES
[1] A. Cygan, D. Lisak, P. Masłowski, K. Bielska, S. Wójtewicz, J. Domysławska, R. S. Trawiński, R. Ciuryło, H. Abe, J. T. Hodges, Rev. Sci. Instrum. 82, 063107 (2011)
[2] A. Cygan, D. Lisak, S. Wójtewicz, J. Domysławska, R. S. Trawiński, R. Ciuryło, Meas. Sci. Technol. 22, 115303 (2011)
[3] S. Wójtewicz, D. Lisak, A. Cygan, J. Domysławska, R. S. Trawiński, R. Ciuryło, Phys. Rev. A. 84, 032511 (2011)
[4] A. Cygan, D. Lisak, S. Wójtewicz, J. Domysławska, J. T. Hodges, R. S. Trawiński, R. Ciuryło, Phys. Rev. A 85, 022508 (2012)
[5] T. Udem, J. Reichert, R. Holzwarth, T. W. Hansch, Phys. Rev. Lett. 82, 3568 (1999) [6] D. Gatti, A. Gambetta, A. Castrillo, G. Galzerano, P. Laporta, L. Gianfrani, M. Marangoni,
Opt. Express 19, 17520 (2011) [7] D. Mazzotti, P. Cancio, A. Castrillo, I. Galli, G. Giusfredi, P. De Natale, J. Opt. A: Pure
Appl. Opt. 8, S490 (2006) [8] J. Domysławska, S. Wójtewicz, D. Lisak, A. Cygan, F. Ozimek, K. Stec, Cz. Radzewicz,
R. S. Trawiński, R. Ciuryło, J. Chem. Phys. 136, 024201 (2012)
80

Generalized Energy Approach in Electron-Collisional
Spectroscopy of Multicharged Ions in Plasma in Debye
Approximation
A.V. Lobodaa
aOdessa State University – OSENU, P.O.Box 24a, Odessa-9 65009
e-mail: [email protected]
Our work lies within an electron-collisional spectroscopy of the atoms and multicharged
ions. We have applied a new generalized energy approach (EA) [1] combined with the
relativistic many-body perturbation theory [2] to calculating spectroscopic characteristics
(the collision cross-sections and collision strengths, oscillators strengths) of multicharged
ions in plasma with taking into account of a plasma effect in a Debye shielding
approximation and interparticle correlations within many-body perturbation theory. In
fact the uniform quantum energy approach is firstly used in a theory of spectra and
spectral lines shape for the multicharged ions in a plasma. The energy shift due to the
collision is arisen at first in the second PT order in the form of integral on the scattered
electron energy εsc [1]:
),,,(Im scinieivGE εεεεπ=∆
where G is the squared combination of the two-particle matrix elements:
×−++++=+++++ 214321)1()12)(12)(12)(12()3,4;2,1( 4321
mmjjjjjjjjV
)(...
..........
.
..........)1(
.42
42
...31
31
,
BrQulQQ
mm
jj
mm
jjλλ
µλ
µ +
µ−
λ
µ−
λ−× ∑
The values Qul
λQ ,
Br
λQ are corresponding to the Coulomb part exp(i|ω|r12)/r12 and the Breit
part exp(i|ω|r12)α1α2/r12 (αi are the Dirac matrices) of the inter-particle interaction. We
have carried out a studying the collision cross-sections and collision strengths, oscillators
strengths for a group of the low lying (and Rydberg) transitions in spectra of the He-, Ве-,
Ne-like ions with a charge of a nucleus Z=8,26-36 and corresponding plasma parameters
Ne=1022
-1024
cm-3
, T=0.5-2keV. A part of the data has been firstly presented. To test the
results of calculations we have compared the obtained data for some Be-like ions with
other authors’ calculations and available experimental data [1-3]. The analysis shows that
using optimized wave functions basis’s, the Debye shielding model [2,3] and an account
for the Rydberg states is of a great importance for the precise description of the
collisional characteristics. The obtained data are important in the complex plasma theory
[4] etc too.
REFERENCES
[1]. Ivanov L.N., Ivanova E.P., Knight L., Phys.Rev.48 , 4365 (1993); Glushkov A.V., Ivanov
L.N., Phys.Lett.A170, 33 (1992); J. Phys. B: At. Mol. Opt. Phys. 26, L379 (1993).
[2]. Glushkov A.V., Loboda A.V. et al, J Phys.CS. 11,188 (2005); 35 , 420 (2006); Phys.Scripta.
T135, 014022 (2009); Int.J.Quant.Chem. 104, 562 (2004); 111, 2888 (2011);
[3] Yongqiang Li, JianhuaWu, etal, J.Phys.B: At.Mol. Opt. Phys. 41, 145002 (2008); Okutsu H.,
SakoI., Yamanouchi K., Diercksen G.H.F, J. Phys. B: At. Mol. Opt. Phys. 38, 917 (2005).
[4]. Astapenko V.A., Bureyeva L.A., Lisitsa V.S., In: Review of Plasma Phys., ed. V.D.
Shafranov.- Kluwer Acad. Publisher. 23, p.1-205 (2003).
81

The Quasi-molecular Absorption Bands In UV Region
Caused By The Non- symmetric Ion –atom Radiative
Processes In The Solar Photosphere
A. A. Mihajlov
1, V. A. Srećković
1, Lj. M. Ignjatović
1, M. S. Dimitrijević
2 and A. Metropoulos
3
1Institute of physics, P.O. Box 57, 11001, Belgrade, Serbia,
2Astronomical Observatory, Volgina 7, 11060 Belgrade 74 Serbia,
3Theoretical and Physical Chemistry Institute, National Hellenic Research Foundation, Athens, Greece
The aim of this research is to show that the radiative processes in strongly non- symmetric ion-
atom collisions significantly influence on the opacity of the solar photosphere in UV region.
Within this work only the He+H+ and H+A
+ ion-atom systems, where A is the atom of one of the
metal (Mg, Si and Al), are taken in to account. It is caused by the fact that the needed
characteristics of the corresponding molecular ions, i.e. molecular potential curves and dipole
matrix elements, have been determined by now. Here the non-symmetric radiative processes are
considered under the conditions characterizing the non-LTE standard model of the solar
atmosphere [1], which gives the possibility to performed all needed calculations and determined
the corresponding spectral absorption coefficients. It is shown that the examined processes
generate rather wide quasi-molecular absorption bands in the UV and VUV regions, whose
intensity is comparable and sometimes even larger than the intensity of known one’s caused by
the H+H+ radiative collision processes [2], which are included now in the solar atmosphere
models [3]. Consequently, the presented results suggest that the non-symmetric ion-atom
absorption processes have to be also included in standard models of the solar atmosphere.
REFERENCES
[1]. Vernazza, J., Avrett, E., & Loser, R., ApJS, 45, 635 (1981)
[2]. Mihajlov, A.A., Ignjatović, L. M., Sakan, N. M., & Dimitrijević, M. S., A&A, 437,
1023 (2007)
[3]. Fontenla, J. M., Curdt, W., Haberreiter, M., Harder, J., & Tian, H., ApJ, 707, 482 (2009)
82

Spectra of Nitrogen Atoms Captured By Free Nanoclusters
A.A. Pelmeneva, I.N. Krushinskayaa, R.E. Boltneva, I.B. Bykhaloa, and V.V. Khmelenkob
a Branch of Institute of Energy Problems of Chemical Physics RAS, Chernogolovka, Moscow region, 142432, Russia bDepartment of Physics and Astronomy, Texas A&M University, College Station, TX 77843, USA.
A spectrum shape gives information about the emitting particle’s surroundings. We report on observation of spectrum transformations of the α-group of nitrogen atoms captured by free nanoclusters. The α-group corresponds to the 2D-4S transition of a nitrogen atom. We use a helium gas jet expanding into cryostat as it approaches liquid helium surface [1]. Helium gas contains ~ 1 % of impurity(-ies) under study. Atoms of Ne, Ar, Kr, and Xe, as well as molecules of H2, D2, or N2, can be used as impurity particles. A radiofrequency discharge (40 MHz, up to 70 W) was applied to dissociate impurity molecules. Fast cooling of the gas jet by dense helium vapors (T 1.5 K) causes intense aggregation of impurity particles into free nanoclusters [2,3]. This experimental technique allows us to obtain the very high densities of stabilized radicals: up to 1014 per cm2 of D atoms on the krypton nanocluster surfaces [4] and local concentrations of N atoms ~ 1020 per cm3 [5].
Very efficient de-excitation of nitrogen atoms trapped on the clusters’ surfaces was observed by co-condensation of D2 molecules from the second crossing jet. We show also a significant effect of the neighbors on the α-group spectra observed from nanoclusters in gas jets containing various admixtures of N2 and other impurities. The spectral transformations were detected upon condensation of nitrogen atoms with different ratios of the Ne (Kr) contents in mixed gas jets.
The study was supported by grants RFBR № 11-02-92500 and CRDF № RUP1-7025-CG-11, federal contract 11.519.11.6021 with the Russian Federation Ministry of Education and Science.
REFERENCES
[1]. E.B. Gordon, L.P. Mezhov-Deglin, and O.F. Pugachev. JETP Lett. 19, 103 (1974). [2]. Kiryukhin V., Keimer B., Boltnev R.E., Khmelenko V.V., Gordon E.B., Phys. Rev. Lett. 79, 1774 (1997). [3]. V. Kiryukhin, E.P. Bernard, V.V. Khmelenko, R.E. Boltnev, N.V. Krainyukova, and D.M. Lee, Phys. Rev. Lett. 98, 195506 (2007). [4]. R.E. Boltnev, V.V. Khmelenko and D.M. Lee, Low Temp. Phys. 36, 484 (2010) [5]. E.P. Bernard, R.E. Boltnev, V.V. Khmelenko and D.M. Lee, J. Low Temp. Phys. 134, 199 (2004).
83

Nitrogen Atoms As Optical Probes Of Structural
Rearrangements In Impurity-Helium Condensates
A.A. Pelmeneva, I.N. Krushinskaya
a, R.E. Boltnev
a, I.B. Bykhalo
a,
V.V. Khmelenkob, and D.M. Lee
b
a Branch of Institute of Energy Problems of Chemical Physics RAS, Chernogolovka, Moscow region, 142432, Russia bDepartment of Physics and Astronomy, Texas A&M University, College Station, TX 77843, USA.
Impurity-helium condensates formed by condensing a helium gas jet containing ~ 1 % of
impurity(-ies) under study into bulk superfluid helium in a collection beaker [1]. We used as
impurity particles atoms of Ne and molecules of N2. A radiofrequency discharge was applied to
dissociate nitrogen molecules. Fast cooling of the gas jet by dense helium vapor (at T 1.5 K)
causes intense aggregation of impurity particles into nanoclusters [2,3]. When more than one
kind of impurity particles is added to helium gas, a component possessing the highest
polarizability forms cluster cores, which are covered later with the less polarizable components.
Thus the clusters forming in the expanding gas jet demonstrate a shell structure [4]. Before
entering the superfluid helium bulk cold impurity nanoclusters are enveloped by a shell of
adsorbed helium atoms. Such solid helium films prevent the contact of impurity clusters and the
recombination of radicals stored on the cluster surfaces. The impurity clusters in superfluid
helium form impurity-helium condensates, very porous, gel-like samples.
A transformation of spectrum shapes reflects changes in the emitting particle surroundings.
We report on observations of such transformations for spectra of the α-group of nitrogen atoms
during warm-up and destruction of nitrogen-neon-helium condensates. The α-group corresponds
to the 2D-
4S transition of a nitrogen atom. Spectra of the α-group of nitrogen atoms stabilized in
such condensates revealed two processes. The number of the emitting nitrogen atoms surrounded
by neon atoms decreases during the warm-up and destruction of the samples, while the number
of the emitting nitrogen atoms surrounded by nitrogen molecules increases. This is also
confirmed by a decrease in the intensity ratio of the α- and α'-groups, Iα/Iα', from 570 at the
beginning of the sample destruction to 80 in the end. The α'-group corresponds to simultaneous
transitions of an atom and a neighboring molecule
N(2D) + N2(X
1g , v”=0) N(
4S) + N2(X
1g , v”=1) + α'.
The study was supported by grants № 010366-0137-2009 Norman Hackerman Advanced
Research Program, RFBR № 11-02-92500 and CRDF № RUP1-7025-CG-11, federal contract
11.519.11.6021 with the Russian Federation Ministry of Education and Science.
REFERENCES
[1]. E.B. Gordon, L.P. Mezhov-Deglin, and O.F. Pugachev. JETP Lett. 19, 103 (1974).
[2]. Kiryukhin V., Keimer B., Boltnev R.E., Khmelenko V.V., Gordon E.B., Phys. Rev. Lett. 79,
1774 (1997).
[3]. V. Kiryukhin, E.P. Bernard, V.V. Khmelenko, R.E. Boltnev, N.V. Krainyukova, and D.M.
Lee, Phys. Rev. Lett. 98, 195506 (2007).
[4]. V.V. Khmelenko, I.N. Krushinskaya, R.E. Boltnev, I.B. Bykhalo, A.A. Pelmenev, and D.M.
Lee, accepted for publication in Low Temp. Phys.
84

Population of the Ne 2p55s-States in He-Ne Mixture Plasma
V. A. Ivanov, A. S. Petrovskaya, Yu. E. Skoblo
Faculty of Physics, St. Petersburg State University, Ulianovskaya ul. 3, St.Petersburg 198504, Russia [email protected]
Since first studies of laser effect at 6328 Å (2p53p, 2p4 – 2p55s, 3s2) (Paschen’s notation), the main attention was paid to the excitation transfer process: He(21S0)+Ne → Ne(2p55s,3si)+He(11S0). In a number of studies (e.g., [1]) a hypothesis of population of the upper laser level in electron-ion recombination was expressed: Ne Ne e Ne *
2 +→++ (1)
He Ne e HeNe * +→++ . (2) However there are no data on the processes (1,2) as a source of atoms Ne(2p55s) at present. The report presents some results of spectroscopic study of He-Ne plasma produced by pulsed (128µs) discharge with a long (8.3ms) afterglow. In our experiment (technique as in [2]) we measured densities of metastable atoms [He(21S0)], and electrons [e], He and Ne spectral line intensities and their response to two pulses heating the electrons in the afterglow. Densities of neutral atoms were: [He]=1.2·1018cm-3, [Ne]=1013cm-3. Fig.1 shows the time course of observed values. It is seen that in
discharge and early afterglow there is a clear correlation between the J6293 (2p5-3s2) intensity and the density of He(21S0), while for t≥200µs when [He(21S0)] falls by more than an order of magnitude, Ne(3s2) atoms appear due to recombination with its characteristic response to electron heating. The analysis of the evolution of ion composition has shown that the process (2) plays the major role. Also this process is the main source of Ne(3s3, 3s4, 3s5) atoms in the afterglow stage. In this case the
afterglow line profiles should be broader than the corresponding discharge line profiles.
REFERENCES
[1]. Egorov V. S., Kozlov Yu. G., Shukhtin A. M., Optics and spectroscopy, 15, 839 (1963). [2]. Ivanov V. A., Skoblo Yu. E., JETP (Eng), 79, 921 (1994).
Fig. 1
0 100 200 300 400 500102
103
104
105
106
107
108[H
e(21 S 0)]
(cm
-3)
J(nu
mbe
r of p
hoto
ns p
er s
econ
d)
t(µs)
J5852 J6182 (J6313)/5 J5764 J6293 J5662
108
109
1010
1011
1012
1013
1014
[He(21S0)]
85

Temperature Dependence of the Rate of the RecombinationPopulation of Neon Atomic Excited States in He-Ne Plasma
V. A. Ivanov, A. S. Petrovskaya, Yu. E. Skoblo
Faculty of Physics, St. Petersburg State University, Ulianovskaya ul. 3, St.Petersburg 198504, Russia [email protected]
The authors of [1] observed a broadening of spectral lines if their upper levels were populated due todissociative recombination: Ne Ne e Ne *
2 +→++ (1).This additional Doppler broadening of the spectral line was caused by the difference between thetotal energy of the initial state (Ne2
+ + e) and the potential energy of the final state (Ne* + Ne). Inthe present work we obtained a dependence of the rate of the recombination population of severalatomic excited states of neon on electron temperature. Experiment was carried out in helium (withsmall admixture of neon, [He]=1.2·1018cm-3, [Ne]=1013cm-3). Plasma was produced by pulsed(128µs) discharge with a long (8.3ms) afterglow. In our previous paper “Population of the Ne 2p55s-states in He-Ne mixture plasma” presented at ICSLS-21 it was shown that the states Ne(2p55s, 3si,i=2,3,4,5) as well as Ne(2p54d, 4d4') are populated in the afterglow mainly due to dissociativerecombination: He Ne e HeNe * +→++ (2)except for the first 200µs. In the present work the dependences of spectral intensities Ji on theelectron temperature Te were investigated as described in [2]. We measured the response of theintensities to the pulsed (duration ≈50µs) heating of the electrons by the axial electric field ofvarious amplitude in the afterglow. Fig.1 shows the temperature dependences of the spectralintensities proportional to the rates of the recombination population of neon atomic states 3s2, 3s5and 4d4'. The intensities Ji decrease in the range kTe=(0.03-0.20)eV and increase in the rangekTe=(0.20-0.40)eV. The decreasing dependence can be described by the function close to Ji~(kTe)-1
and corresponds to the process (2). The increasing brunch at kTe=(0.20-0.40)eV means that thepopulation of the excited states under consideration is caused by the threshold process.
Approximation by the function Ji~exp(-∆ε/kTe)allows to estimate of the energy threshold∆ε=(0.3-0.45)eV. This value of ∆ε correspondsto the difference between the energies of thestate 3s2 or 3s5 or 4d4' and the groundvibrational state (v=0) of the Ne2
+ ion. Thus,the increase of Ji(kTe) at kTe=(0.20-0.40)eV canbe caused by the threshold process of thedissociative recombination (1) of Ne2
+(v=0)ions with electrons.
REFERENCES
[1]. Frommhold L., Biondi M. A., Phys. Rev.,185, 244 (1969). [2]. Ivanov V. A., Skoblo Yu. E., JETP (Eng),79, 921 (1994).
0,1 10,1
1 (3s5->2p9)(4d4'->2p9)
J6182A J5764A
(3s2->2p5)
J i(kT e)/
J i(300
K)
kTe(eV)
J6293A
Fig.1.
86

Diagnostics of Capillary Light Sources by Means of Line Shape Measurements and Modeling
Gita Revalde, Egils Bogans, Janis Skudra, Natalia Zorina
Institute of Atomic Physics and Spectroscopy, University of Latvia, Skunu str 4, Riga, LV 1050, Latvia, e-mail: [email protected]
.
In this work the spectral diagnostics of capillary light sources by means of spectral line shape measurements and modeling is presented. The special type electrodeless capillary lamps, investigated in this work, are used in different spectral devices, for example in mercury atomic absorption analyzers. To increase the sensitivity of atomic absorption spectrometry, it is extremely important to optimize the spectral properties of such lamps. Spatial homogeneity of the plasma and emission profile is important for the use of such light sources also in precision measurements. In addition, capillary light sources are difficult to investigate due to the small dimensions of the source, and spectral line shapes are one of the tools to get useful information about plasma properties, for example, plasma temperature.
In our previous work, the spatial plasma homogeneity of Hg/Xe and Hg/Ar capillary lamps was investigated by means of tomography [1]. The radial profile has demonstrated a substantial depletion of the population density of excited states from the lamp centre in the different operating positions. In this work we present the measurements of the spectral line shapes form Hg capillary discharge lamps by means of the Fourier Transform spectrometer Bruker IFS-125HR.
The Fourier spectra were registered for lamps, operated in vertical and horizontal operation positions. Examples of the registered spectral lines shapes for Hg 435,7 nm Hg line are shown in Fig.1. The spectral lines are split due to the magnetic field inside the generator. The registered spectral line shape is a convolution of the real shape with the instrument function of Fourier spectrometer (0.03 cm-1). The modeling of the spectral line shapes of the visible triplet was performed to deconvolute the instrument function and to calculate the real spectral line shape. The temperature of the emitting capillary plasma was estimated.
REFERENCES
[1]. Denisova N., Revalde G.,Skudra A., Skudra J., Japanese Journal of Applied Physics, Volume 50, Issue 8, pp. 08JB03-08JB03-5 (2011).
Acknowledgments
The work was partially supported by ESF project “Spectrometric techniques for detection of heavy metal contaminants”(Nr.2009/0210/1DP/1.1.1.2.0/09/APIA/VIAA/100) and by EC FP7-ENV-2010 project “GMOS”, Agr.#265113.
22937,2 22937,4 22937,6 22937,8 22938,0 22938,2 22938,4 22938,6 22938,8 22939,0
-200
0
200
400
600
800
1000
1200
Inte
nsity
, rel
.un.
Wavenumber, cm-1
horizontal vertical, reservoir up vertical, reservoir down
435,7 nm
Fig.1. Registered spectral line shapes, emitted from Hg capillary light source in three different operating positions: horizontal, vertical with Hg reservoir up and vertical, Hg reservoir down.
87

Modeling of Hydrogen Stark Line Shapes with Kinetic Theory Methods
J. Rosato, H. Capes, and R. Stamm
Laboratoire PIIM, UMR 7345 Université d’Aix-Marseille / CNRS, Centre de Saint-Jérôme, Case 232, F-13397 Marseille Cedex 20, France
The unified formalism for Stark broadening [1,2] is revisited in the framework of magnetic fusion research. Since a few years ago, modeling efforts have been carried out in order to provide analytical formulas for the Stark broadening of the first Lyman lines of hydrogen, for opacity simulation purposes [3]. One of the most challenging issues concerns the description of the ion dynamics. At densities and temperatures relevant to tokamak edge and divertors, the impact approximation is not far from being valid for ions, with typically ρW/r0 ≤ 0.5 for Ly-α and Ly-β (with ρW, r0 being the Weisskopf radius and the mean interparticle distance). At such regimes, an approach based on first principles like the unified theory is particularly suitable for the description of the ions. In the initial BBGKY-formulation of this theory [1], multiple correlations were neglected and a binary-collision description of the broadening (similar to the impact formalism) was obtained. Following early works [4,5], a generalization of the model able to account for multiple correlations has been proposed and presented in [6]. The resulting expression of the line shape contains a modified collision operator that obeys a non-linear equation. Approximate treatments of the solution have been proposed and applied in different contexts [6,7]. In this work, we examine the relevance of these approximations and perform comparisons to benchmark simulations. The applicability of the model to Balmer lines (which will be used in ITER diagnostics [8]) will be also examined.
REFERENCES
[1]. D. Voslamber, Z. Naturforsch., 24a, 1458 (1969) [2]. E. W. Smith, J. Cooper, and C. R. Vidal, Phys. Rev., 185, 140 (1969) [3]. J. Rosato, D. Reiter, V. Kotov, Y. Marandet, H. Capes, L. Godbert-Mouret, M. Koubiti, and R. Stamm, Contrib. Plasma Phys., 50, 398 (2010) [4]. H. Capes and D. Voslamber, Phys. Rev. A, 5, 2528 (1972) [5]. H. Capes, Unpublished thesis (PhD), University of Paris-Sud (1980) [6]. J. Rosato, H. Capes, Y. Marandet, A. Mekkaoui, and R. Stamm, Transport Theor. Stat. Phys., in press [7]. J. Rosato, D. Reiter, V. Kotov, P. Börner, H. Capes, Y. Marandet, R. Stamm, S. Ferri, L. Godbert-Mouret, M. Koubiti, and C. Mossé, High Energy Density Phys., 5, 93 (2009) [8]. J. Rosato, V. Kotov, and D. Reiter, J. Phys. B: At. Mol. Opt. Phys., 43, 144024 (2010)
88

Temperature Dependence of the Pressure Broadening of Spectral Lines
Roston G. D and Helmi M. S
Department of Physics , Faculty of Science, Alexandria University, Alexandria , Egypt [email protected]
Abstract
It is known that the temperature variations of the widths of pressure broadened spectral lines
are represented by a power – law relation when the applied potential difference ∆V(R) between the upper and lower levels of the emitting atom is represented by a simple inverse law. This law is obtained theoretically in a simple analytical form and examined in a wide temperature ranges for some atomic interactions when the applied potential difference ∆V(R) is represented by the Lennard – Jones potential. It was shown that the temperature index deviates from its value, when the repulsive form of the (L - J) potential is only applied. This deviation depends strongly on the potential parameters (∆C6 and ∆C12) and the reduced mass µ of the colliding particles.
The pressure broadening coefficient β as a function of the temperature was obtained as:
Kn TCT
cLk
== + )5.02(28
πµβ
Where L and n are constants depending on the ranges of temperatures and the velocity of light. C and K are parameters calculated for the transition leading to the spectral line 703.08 nm of Ar, when it is perturbed by Ar, Ne and He, and spectral lines 603.02 nm , 649.6 nm and 522.1 nm of Ar resulting respectively from the transitions 3P54P - 3P5nd (n = 5-7), when it is perturbed by Ar only. It is found that the parameters C and K are a little dependent on the temperature ranges. The results show also that as the ratio (ΔC6/ΔC12) increases the parameter C decreases for the same interaction, while the temperature index parameter K is dependent on the type of interaction.
References
[1] Lwin A., Mc Cartan D.D., Levis E.L., J. Astrophys. 213, 599, 1977 [2] Spielfiedel A., Roueff E. , J. Phys. B. 14, L795, 1981 [3] Peach G., Adv.Phys. B17, 2599. 1981 [4] Bielski A., Bobkowski R., and Szudy J, Astrom.Astrophys.208, 357. 1989 [5] Hindmarsh,W.R.,Petford,A.D.,Smith,G.,Proc.Roy.Soc. London, A297, 296. 1967 [6] Helmi M. S. and Roston G. D., Physica Scripta, 62, 36. 2000 [7] Roston G.D., Ghatass Z.F., Obaid F.S., JQSRT, 110, 175–183, 2009 [8] Bielski A.,Wawrzynski J.and Wolnikowski J.,Acta Phy.Polon.,67A,(3), 621, 1985 [9] Wolnikowski J.,Wwrzynski J., Bielski A and Szudy J,PhysicaScripta,35,135.1987
89

The Effect of Gaussian Line Shape on the Performance of Thulium and Erbium Doped With Different Host Materials
As Optical Fiber Amplifier
O. Mahran, G. D. Roston and M. Shahat
Department of Physics , Faculty of Science, Alexandria University, Alexandria , Egypt
Abstract
This work describes the comparison of the amplification characteristics (gain) and the
Noise figure (NF) of the Thulium and Erbium in three different host materials which the Yttria
Alumina-Silica glass, Fluoride and Telluride fiber glass. The gain using these host materials
covers the range 1.45-1.65 µm. Thulium doped fiber amplifier (TDFAs) operated in the region of
wavelength (1480-1510 nm) which is called S-band. The main pump source is 1.04 and 1.55 µm
which creates population inversion between 3F4 (upper laser level) and 3H4 (lower laser level),
and Erbium doped fiber amplifier EDFA operated in the region (1510-1650 nm) which is called L
–band with the pump wavelength 980 nm. It is found that the erbium doped yttria-alumina
silicate fiber amplifier exhibits a maximum gain of 40.3 dB at the central wavelength 1540 nm
and minimum noise figure 14 dB, but the broadening in the gain curve is 20 nm. Also it is found
that the thulium doped yttria-alumina silicate fiber amplifier exhibits a maximum gain of 27.5 dB
at the central wavelength 1467 nm and minimum noise figure 2.5 dB, with the broadening in the
gain curve is 41 nm. Gain flatness was investigated and the results strongly confirm the
feasibility of using different hosts’ glass doped with Thulium in practical ultra large capacity
WDM networks.
90

Spectroscopy of Hadronic Atoms:
Spectra, Energy Shifts and Widths
I.N. Sergaa , Yu.V. Dubrovskaya
a, D.E. Sukharev
a
aOdessa State University – OSENU, P.O.Box 24a, Odessa-9 65009
e-mail: [email protected]
In the last few years transition energies in pionic and kaonic atoms have been measured with an
unprecedented precision [1]. The spectroscopy of hadronic hydrogen allows to study the strong
interaction at low energies [2] by measuring the energy and width of the ground level with a
precision of few meV. The light hadronic atoms can additionally be used to define new low-
energy X-ray standards and to evaluate the pion mass using high accuracy X-ray spectroscopy.
Paper is devoted to studying spectra for hadronic (kaonic and pionic) atoms and some
superheavy isotopes. Ab initio relativistic many-body perturbation theory approach [3] with an
accurate account of relativistic, nuclear, radiative effects is used in calculating spectra of the
hadronic (pion, kaon) atoms. One of the main purposes is establishment a quantitative link
between quality of nucleus structure modeling and accuracy of calculating energy and spectral
properties of systems. The wave functions zeroth basis is found from the Klein-Gordon or Dirac
equation. The potential includes the SCF ab initio potential, the electric and polarization
potentials of a nucleus (the RMF, Fermi and Gauss models for a charge distribution in a nucleus
are considered). For low orbits there are the important effects due to the strong hadron-nuclear
interaction. The energy shift is connected with a length of the hadron-nuclear scattering. For
superheavy isotopes (ions) the correlation corrections of high orders are accounted for within the
Green function method. The radiative corrections are effectively taken into account by using the
effective radiative potentials. We list the data on: 1).energy levels for superheavy H-and, Li-like
ions 2). Shifts and widths of transitions (2p-1s,3d-2p, 4f-3d etc) in some pionic and kaonic atoms
(H, He, N, W, U). The calculated X-ray transitions spectrum for kaonic He and estimate of 2p
level shift due to the strong K-N interaction 1.57 eV are in the reasonable agreement with
experimental data (cited shift 1.9eV) by Okada et al (2008; E570; КЕК 12GeV, RIKEN Nishina
Centre, JAPAN) and differ (about order) of other experimental data by Wiegand-Pehl (1971),
Batty et al (1979), Baird et al (1983).
REFERENCES
[1]. Gotta D., Progr. in Part. and Nucl. Phys. 52 , 133 (2004) ; Beer G. et al., Phys. Lett.B 535,
52 (2002) ; Deslattes et al, Rev. Mod. Phys. 75, 35 (2003) ; Trassinelli M., Indelicato P.,
arXiv:phys/0611262v2 (2007).
[2]. Batty C. et al, Phys.Rev.C.40, 2154 (1989) ; Ito T. et al., Phys. Rev. C. 58 , 2366 (1998);
Okada S. et al., Phys.Lett.B. 653, 387 (2007).
[3] Glushkov A.V. et al., Frontiers in Quantum Systems in Chem. and Phys. (Berlin, Springer)
18,505 (2008); Theory and Applications of Comp. Chem. (AIP). 1102, 168 (2009).
91

Spectroscopic investigation of the gas discharges in mixtures
of nitrogen with helium
Shakhatov V Aa, Mavljudov T B
a, Atrazhev V M
b, Bonifaci N
c, Denat
A
c, Li Z L
c,
aTopchiev Institute of Petrochemical Synthesis RAS, Leninsky Prospect, 29, Moscow, 119991, Russia
E-mail:[email protected] bInstitute for High Energy Densities, AIHT RAS, Moscow, Ijorskay 13/2, 125412, Russia
cG2E.lab, CNRS et Universite Joseph Fourier, 25 rue des Martyrs, 38042, Grenoble, France
In the present study spectral composition, rotational temperature rotT , electronically –
vibrationally – rotationally energy level distribution functions in the electronic excited 3
uC
and 3
gB states of the nitrogen molecule, 2
uB state of the nitrogen ion molecule, and also in
the electronic excited 1
uD and 3
ud states of the helium molecule are investigated by
spectroscopic techniques in the DC glow discharge, bright electrode sheath of the spatial
inhomogeneous microwave and negative corona discharges in the mixtures of nitrogen with
helium 2He N . The new approach is developed for evaluating population densities of atoms
and molecules in the excited states at their deviation from Boltzmann’s distribution.
It is established that the spectral composition of the gas discharges depends on percentage of He
and 2N in the mixture 2He N . Modelling of the emission spectra of the first negative
+ 2 2
2N u gB X , second 3 3
2 u gN C Π B Π and first 3 3 +
2 g uN B Π A Σ positive
systems, and as well as 1 1
2( )u gHe D B and 3 3
2( )u gHe d b systems in the assumption
of the Boltzmann’s distribution of the molecules on electronically – vibrationally – rotationally
energy levels in the radiative excited 2
uB , 3
uC , 3
gB , 1
uD and 3
ud states, respectively,
well describe the measured those in the discharges. Values of rotational temperatures rotT ,
corresponding to the electronically – vibrationally – rotationally energy levels of the upper
radiative levels are good agreement in the positive column of the DC glow and microwave
discharges. In the negative corona discharge values of rotT of the 2
uB and 3
uC states are
markedly different. The population density distribution on vibrational level 0 4Cv of the
nitrogen molecule in the excited 3
uC state is slightly differed from those calculated by
Boltzmann’s formula in the positive column of the DC glow and microwave discharges.
Opposite, vibrational distribution function on vibrational level 3 12Bv of the nitrogen
molecule in the excited 3
gB state do not describe by Boltzmann’s formula. The measured
structure of the distributions is slightly changed with the percentage of He in the mixture
2He N . In the negative corona discharge the population density distribution on vibrational
level of the nitrogen molecule in the excited 3
uC state is differed from Boltzmann’s
distribution.
Work was partially supported by grant RFBR № 12-08-91052 NCNI_a.
92

Electron density distribution
in ablating polystyrene pellet cloud
I. A. Sharova, V. Yu. Sergeev
a, I. V. Miroshnikov
a, N. Tamura
b, S. Sudo
b, and
B. V. Kuteevc
aSaint- Petersburg State Polytechnical University, 29, Politechnicheskaya st., Saint Petersburg, 195251, Russia,
e-mail: [email protected], [email protected], [email protected] bNational Institute for Fusion Science, 322-6, Oroshi-cho, Toki, Gifu, 509-5292, Japan,
e-mail: [email protected], [email protected] cNRC Kurchatov Institute, 1, Kurchatov sq., Moscow, 123182, Russia, e-mail: [email protected]
Injection of deuterium and impurity pellets is widely used in magnetically confined devices
with hot (Te = 0.1-10 keV) and rare (ne = 1013-14
cm-3
) plasmas for fuelling, disruption mitigation
and numerous diagnostics. In the plasma, solid pellets ablate with a rate of about 1020-23
atoms/s
(impurity case) and 1022-24
atoms/s (deuterium case). A cold dense plasmoid exists in the vicinity
of the ablating pellet. There are data on electron temperature Tcl and density ncl averaged over the
pellet cloud [1-5]. It was observed that pellet cloud densities of 1016-17
cm-3
for impurity pellets
and 1017-18
cm-3
for deuterium ones were approximately proportional to the pellet ablation rates.
The measured values Tcl ≅ 3 – 10 eV for impurity pellets were higher than those Tcl ≅ 1 – 5 eV
measured for deuterium pellet clouds. It is seen that there is a huge difference between
temperature and density values of the plasmoid and the ambient hot plasma. Most of pellet
applications require knowledge of spatial distributions of the plasmoid parameters what is a
complicated experimental task.
In this report a spectroscopic approach to density distributions measuring is described in
details for the cloud of polystyrene pellet ablating in Large Helical Device plasmas. The method
is based on Stark-broadened Hβ line spectral shape measurements. Electron density values
measured in the cloud are in the range of 1016
- 2×10¹⁷
cm-3
depending on the cloud region,
ambient plasma density and ablation rates. Proportionality between the cloud density and
ablation rate was confirmed. Spatial distributions of the cloud density shape reveal exponential
decay along the cloud axis in discharges with lower ambient plasma densities (1.2×10¹⁷
–
1.6×10¹⁷
cm-3
) whereas almost plateau of distribution was measured in plasma shots with high
ambient plasma density (4.5×10¹⁷
cm-3
). Some features of the observed Hβ spectral line profiles
in comparison with those S(∆λ, ncl) calculated in Ref. [6] are discussed.
REFERENCES
[1] N. Tamura, V. Yu. Sergeev, D. Kalinina, S. Sudo, M. Goto, R. Ishizaki, A. Matsubara, K.
Sato, S. Kato and LHD experimental Group, in Proc.30th EPS Conf. Plasma Phys., pp. 1–59, St.
Petersburg, Russia, 2003 .
[2] D. H. McNeill, G. J. Greene, J. D. Newburger, and D. K. Owens, AIP, Phys. Fluids, vol. B 3,
no. 8, pp. 1994–2009, 1991.
[3] R. D. Durst, W. L. Rowan, M. E. Austin, R. A. Collins, R. F. Gandy, P. E. Philips, and B.
Richards, Nucl. Fusion, vol. 30, no. 1, p. 3, Jan. 1990.
[4] V. Yu. Sergeev, A. Yu. Kostryukov, and S. A. Shibaev, Fusion Eng. Des., vol. 34–35, pp.
323–327, Mar. 1997.
[5] M. Goto, R. Sakamoto, and S. Morita, Plasma Phys. Controll. Fusion, vol. 49, no. 8, pp.
1163–1176, Aug. 2007.
[6] C. Stehl’e and R. Hutcheon, Astron. Astrophys. Suppl. Ser., vol. 140, pp. 93–97, Nov. 1999.
93

Studies of spectral line broadening in thallium containing high-frequency electrodeless lamps
Atis Skudra a ,Gita Revalde a, Anda Svagere a, Zanda Gavare a
aInstitute of Atomic Physics and Spectroscopy, University of Latvia, Skunu str 4, Riga, LV 1050, Latvia, e-mail: [email protected].
Our work is concerned with the preparation and investigation of high-frequency electrodeless
lamps (HFEL). HFELs are applied in various scientific devices such as radiation and absorption spectrometers, spectrometers–goniometers, frequency standards, magnetometers, etc. HFELs are known to be extremely bright radiators with the line spectrum characterized by high intensities and narrow line shapes. HFEL balloons are mostly made of glass or quartz and filled with a working element and buffer gas. These light sources must be optimized for each application in accordance with the specific requirements of radiation quality, life time and stability.
For these studies lamps were prepared filled with: (1) Tl205+Ar and (2) Tl205+Hg+Ar. Buffer gas pressure was about 3 Torr. The plasma was excited by placing lamp in electromagnetic field of 100MHz frequency. Lamps were operated at excitation generator voltage values from 21V till 31V. The spectral line profile registration was performed using Fourier Transform spectrometer Bruker IFS-125HR with instrumental function of 0.03 cm-1. It was observed that thallium line intensities of lamps filled with Tl205+Hg+Ar were higher compared to line intensities of Tl205+Ar lamp at the same excitation generator voltages. This can be explained by the fact that mercury combines with thallium creating amalgam, which is easier to evaporate than pure thallium. It means that there will be more thallium atoms in the discharge at lower temperature.
The first observation of energy transfer between mercury and thallium was made by Cario and Franck in their classical experiments on sensitized fluorescence of atoms in the vapour phase. A mixture of mercury and thallium vapour, when irradiated with the light of the mercury resonance line, shows the emission spectra of both atoms. Since thallium atoms do not absorb the exciting light, they can get excited only indirectly by an excitation transfer from mercury atoms [1]. Thallium spectral line broadenings were studied in [2]. When an excited mercury atom collides with thallium atom in its ground state, the excitation energy can be transferred into kinetic energy or internal energy of thallium, which leads to the broadening of the spectral line.
Analysis of Tl 351,9 nm spectral line profiles showed that broadening of this line is bigger in emission of Tl205+Hg+Ar lamp compared to Tl205+Ar lamp. This indicates that there is energy transfer process from excited mercury atoms to thallium atoms in ground state in HFELs.
Acknowledgments: The work was partially supported by ESF project “Spectrometric techniques for detection of heavy metal contaminants” (Nr.2009/0210/1DP/1.1.1.2.0/09/APIA/VIAA/100). Authors express many thanks to Dr. hab. M. Tamanis for the possibility to perform measurements on Fourier Spectrometer.
REFERENCES
[1] Cario G., Franck J., Zeit. Phys., 17, 202 (1923) [2] Kraulinya E. K., Liepa S. Ya., Skudra A. Ya., Lezdin A. E., Optics and Spectroscopy, 47, 26 (1979)
94

A Model for Line Intensities in a Fluctuating Plasma
R. Hammami1, H. Capes1, F. Catoire2, L. Godbert-Mouret1, M. Koubiti1 Y. Marandet1, A. Mekkaoui1, J. Rosato1 and R. Stamm1
1PIIM, Aix-Marseille Université and CNRS, centre Saint Jérôme, Marseille, 13397, France. 2CELIA, Université de Bordeaux 1 and CNRS, Domaine du Haut Carré, Talence, 33405, France.
The population balance of atoms or ions in a plasma is usually obtained by solving a stationary collisional-radiative model, assuming constant values of the plasma electronic density and temperature. These plasma parameters may however be strongly and rapidly fluctuating in many kinds of plasmas. In edge plasmas of magnetic fusion, density fluctuations of order unity on time scales of the order of 10 μs have been measured, and characterized with their statistical properties such as the probability density function (PDF) and the waiting time distribution or correlation function of the fluctuating density [1]. We have developed a stochastic model for calculating the effect of plasma parameter fluctuations on the population kinetics [2]. Our model takes advantage of the knowledge of the plasma parameter statistical properties, and assumes a stepwise constant stochastic process for the fluctuating variable. We have applied this model to simplifyed systems such as three level atoms affected by density fluctuations obeying to a gamma PDF, and an exponential waiting time distribution. The limits of slow and fast fluctuations as compared to the atomic frequencies will be analysed. Our final aim is to provide a line ratio diagnostic of simple atoms (hydrogen isotopes, helium) sensitive to turbulent fluctuations of the plasma parameters.
REFERENCES
[1] J. P. Graves et al., Plasma Phys. Control. Fusion 47, L1-L9 (2005)
[2] F. Catoire et al., Phys. Rev. A 83, 012518 (2011)
95

Advanced Relativistic Quantum Defect Approach to
Calculation of the Radiation Transition and Ionization
Characteristics for Rydberg Atoms
T.A. Tkacha
aOdessa State University – OSENU, P.O.Box 24a, Odessa-9 65009
e-mail: [email protected]
The accurate radiative decay widths and probabilities, oscillator strengths of atomic transitions
are needed in astrophysics and laboratory, thermonuclear plasma diagnostics, in fusion research
and laser physics etc. traditionally it is one of the important and actual topics of atomic
spectra and spectral lines theory. In our work It has been presented an advanced relativistic
quantum defect approach to calculation of the radiation transition and ionization probabilities
and oscillator strengths for Rydberg atoms. The starting master method is the combined
relativistic energy approach [1] and relativistic many-body perturbation theory with the zeroth
order optimized one-particle approximation [2]. The key feature of the presented basis theory is
an implementation of the relativistic quantum defect approximation into the frames of the S-
matrix energy formalism to Rydberg multi-electron atomic system. It provides sufficiently
correct and simultaneously simplified numerical procedure to definition of the corresponding
radiative transition and ionization properties and thus it is represented significantly more
advantagable in comparison with the cumbersome Hartree-Fock and Dirac-Fock methods. As
illustration we have carried out calculating energies and probabilities of the radiative transitions
and ionization characteristics for Li-like multicharged ions (Z=10-42). Our approach provides
physically reasonable agreement with experiment and significantly more advantagable in
comparison with the standard Dirac-Fock and Hartree-Fock methods. It has been checked that
all results for oscillator strengths, obtained within our approach in different photon propagator
gauges (Coulomb, Babushkin, Landau) are practically equal [3], that is provided by using an
effective QED energy procedure [1].
REFERENCES
[1]. Ivanova E. P., Ivanov L. N., Knight L., Phys.Rev. A48, 4365 (1993); Glushkov A.V., Ivanov
L.N., Phys.Lett. A170, 33 (1992)
[2] Glushkov A.V., Khetselius O.Yu., Florko T.A. et al, Frontiers in Quantum Systems in Chem.
and Phys. (Berlin, Springer) 18, 505 (2008); Malinovskaya S.V., Glushkov A.V., Florko T.A., et
al, Int.J.Quant.Chem. 109, 3325 (2009).
[3]. Malinovskaya S.V., Glushkov A.V., Tkach T.B. et al, Int.J. Quant. Chem. 111, 288 (2011);
Svinarenko A.A., Nikola L.V., Tkach T. et al, Spectral Lines Shape (AIP). 1290, 94 (2010).
96

Spectroscopy of the atom-wall interactions in a nanocell
V.V. Khromova, A.E. Logunova, A.S. Pazgaleva, S.G. Przhibel’skiia, D. Sarkisyanb, T. A. Vartanyana
aSt. Petersburg National Research University of Information Technologies Mechanics and Optics, Kronverkskii pr. 49, St. Petersburg, 197101, Russian Federation. E-mail: [email protected]
bInstitute for Physical Research, NAS of Armenia, Ashtarak-0203, Armenia,e-mail: [email protected]
The optical spectroscopy of rubidium atoms confined to a nanocell was employed to study the quenching and energy transfer processes in the course of atom-wall collisions. The nanocell diameter was 24 mm while the distance between its sapphire windows varies between 150 and 500 nm forming a vapor wedge [1]. At moderate pressures, the frequency of the atom-wall collisions in such a cell greatly exceeds the frequency of atom-atom collisions. Hence, the line shapes and intensities recorded in a nanocell provide valuable information about interactions of excited atoms with the surface of the window material.
Two tunable cw diode lasers were used to excite the rubidium atoms stepwise from its ground state 5S1/2 to 5P3/2 to 5D5/2. The pump intensities were 20 and 40 mW, correspondently. The vapor fluorescence at the wavelengths of 5P3/2 ->5S1/2 (780 nm) and 5D5/2-> 5P3/2 (776 nm) was readily detected and measured. Additionally, the intensity of the 6P3/2->5S1/2 transition on the wavelength of 420 nm was monitored as well. The registration system comprises a high-transmission spectrometer, photomultiplier, and lock-in amplifier. The whole system was calibrated to enable the measurements of the ratios of the absolute intensities of fluorescence at all wavelengths under consideration.
The main outcome of these measurements is that the intensities of the three studied transitions 5P3/2 ->5S1/2:5D5/2-> 5P3/2:6P3/2->5S1/2 is equal to 500:2:1.
To rationalize the observed relations, one has to consider the probabilities of quenching of the rubidium excited states at the sapphire surface. Although the information of such processes is very scare, according to [2] the probability of quenching of cesium atoms at the sapphire surface is equal to 0.98±0.02. By analogy between different alkali atoms one can safely assume that the probability of quenching of the excited states of rubidium, 5P3/2 and 5D5/2, are close to unity as well. With this in mind and taking into account the oscillator strengths, the life times and the pump intensities one arrives to the ratio of the 5P3/2->5S1/2:5D5/2->5P3/2 transitions close to the measured value.
The explanation of the ratio of the 5D5/2->5P3/2:6P3/2->5S1/2 transitions is much more involved. The commonly accepted way of the 6P3/2 population, radiation of an IR photon at 5.5 µm, is not operative in the nanocell as it takes 700 ns while the mean time of flight of atoms between the walls is only 1 ns. Taking into account the lifetimes and branching ratios of the involved transitions one arrives to the intensity ratio of 2000:1 instead of observed 2:1.
A plausible explanation of the observed intensity ratio is that at the surface the 5D5/2 state experiences a transition into 6P3/2 state. To confirm this “incomplete quenching” mechanism we check that the ratio in question does not depend on the distance between the sapphire walls of the nanocell. High efficiency of this “incomplete quenching” may be due to matching between the sapphire phonon spectrum and the energy difference between the 5D5/2 and 6P3/2 states [3].
REFERENCES
[1]. Sarkisyan D. et al. Opt. Comm., 200, 201, (2001). [2]. Przhibel’skii S.G., Khromov V.V. Opt. Spectr., 88, 22, (2000). [3]. Failache H. et al. Eur. Phys. J. D, 23, 237, (2003).
97
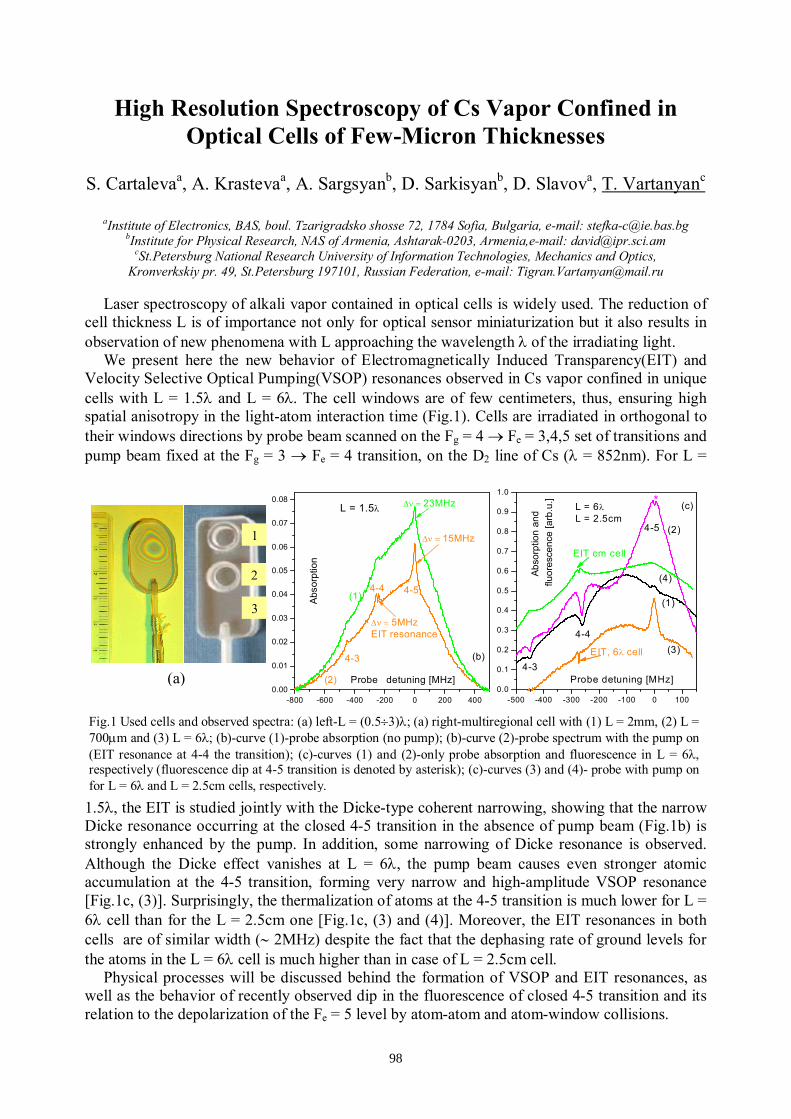
High Resolution Spectroscopy of Cs Vapor Confined in Optical Cells of Few-Micron Thicknesses
S. Cartalevaa, A. Krastevaa, A. Sargsyanb, D. Sarkisyanb, D. Slavova, T. Vartanyanc
aInstitute of Electronics, BAS, boul. Tzarigradsko shosse 72, 1784 Sofia, Bulgaria, e-mail: [email protected] bInstitute for Physical Research, NAS of Armenia, Ashtarak-0203, Armenia,e-mail: [email protected]
cSt.Petersburg National Research University of Information Technologies, Mechanics and Optics, Kronverkskiy pr. 49, St.Petersburg 197101, Russian Federation, e-mail: [email protected]
Laser spectroscopy of alkali vapor contained in optical cells is widely used. The reduction of
cell thickness L is of importance not only for optical sensor miniaturization but it also results in observation of new phenomena with L approaching the wavelength of the irradiating light.
We present here the new behavior of Electromagnetically Induced Transparency(EIT) and Velocity Selective Optical Pumping(VSOP) resonances observed in Cs vapor confined in unique cells with L = 1.5 and L = 6. The cell windows are of few centimeters, thus, ensuring high spatial anisotropy in the light-atom interaction time (Fig.1). Cells are irradiated in orthogonal to their windows directions by probe beam scanned on the Fg = 4 Fe = 3,4,5 set of transitions and pump beam fixed at the Fg = 3 Fe = 4 transition, on the D2 line of Cs ( = 852nm). For L =
1.5, the EIT is studied jointly with the Dicke-type coherent narrowing, showing that the narrow Dicke resonance occurring at the closed 4-5 transition in the absence of pump beam (Fig.1b) is strongly enhanced by the pump. In addition, some narrowing of Dicke resonance is observed. Although the Dicke effect vanishes at L = 6, the pump beam causes even stronger atomic accumulation at the 4-5 transition, forming very narrow and high-amplitude VSOP resonance [Fig.1c, (3)]. Surprisingly, the thermalization of atoms at the 4-5 transition is much lower for L = 6 cell than for the L = 2.5cm one [Fig.1c, (3) and (4)]. Moreover, the EIT resonances in both cells are of similar width ( 2MHz) despite the fact that the dephasing rate of ground levels for the atoms in the L = 6 cell is much higher than in case of L = 2.5cm cell.
Physical processes will be discussed behind the formation of VSOP and EIT resonances, as well as the behavior of recently observed dip in the fluorescence of closed 4-5 transition and its relation to the depolarization of the Fe = 5 level by atom-atom and atom-window collisions.
1
2
3
(a) -800 -600 -400 -200 0 200 400
0.00
0.01
0.02
0.03
0.04
0.05
0.06
0.07
0.08
5MHzEIT resonance
15MHz
Abso
rptio
n
Probe detuning [MHz]
(1)
(2)
4-3
4-4 4-5
23MHzL = 1.5
(b)
-500 -400 -300 -200 -100 0 1000.0
0.1
0.2
0.3
0.4
0.5
0.6
0.7
0.8
0.9
1.0
(2)
(4)
(1)
4-5
4-4
Abso
rptio
n an
d fl
uore
scen
ce [a
rb.u
.]
Probe detuning [MHz]4-3
(3)
(c)
EIT, 6cell
EIT cm cell
*L = 6L = 2.5cm
Fig.1 Used cells and observed spectra: (a) left-L = (0.53); (a) right-multiregional cell with (1) L = 2mm, (2) L = 700m and (3) L = 6; (b)-curve (1)-probe absorption (no pump); (b)-curve (2)-probe spectrum with the pump on (EIT resonance at 4-4 the transition); (c)-curves (1) and (2)-only probe absorption and fluorescence in L = 6, respectively (fluorescence dip at 4-5 transition is denoted by asterisk); (c)-curves (3) and (4)- probe with pump on for L = 6 and L = 2.5cm cells, respectively.
98

Dicke Narrowing Effect for r-ν-type Collisional Potential
Piotr Wcisło and Roman Ciuryło
Institute of Physics, Nicholas Copernicus University, Grudziądzka 5/7, 87-100 Toruń, Poland
There is a need for application of ab initio velocity-changing collision operators in the spectral line shapes modeling [1] including Dicke narrowing effect [2]. The class of r-ν - type collisional potentials applied to the line shape problem was introduced by Blackmore [1]. The billiard ball model (hard spheres collisions) based on results obtained by Lindenfeld [3] was applied [4] to the case including speed-dependent collisional broadening and shifting [5].
We extended the approach described in [4,6] to the class of r-ν-type collisional potentials. Expressions for the matrix elements of the velocity-changing collision operators given by Lindenfeld and Shizgal [7] have been used. Contrary to Blackmore's [1] conclusions we have found significant differences between profiles calculated for various potential powers ν, especially when perturbers are much heavier then absorbers. We put particular attention to the effect of freezing of emitters speeds. We found region in the parameters space for which emitters directions are thermalized, whereas speeds classes are still not mixed. It was shown that the shape of this region depends on the potential power ν. The convergence of numerical techniques was carefully examined. It was shown that, independently from potential power ν, our results converge to the Galatry profile [8] in the soft-collision limit and to the Lorentz profile in the hydrodynamic limit [2] case of very high collisions frequency. The analytical formula for the line shape profile in the hard spheres case (the potential power ν = ∞) in the limit of infinitely heavy perturbers is discussed, as well. We checked that our numerical calculations are consistent with this analytical expression.
REFERENCES
[1]. R. Blackmore, J. Chem. Phys., 87, 791 (1987)[2]. R. H. Dickie, Phys. Rev., 89, 472 (1952)[3]. M. J. Lindenfeld, J. Chem. Phys., 73, 5817 (1980)[4]. R. Ciuryło, D. A. Shapiro, J. R. Drummond, A. D. May, Phys. Rev. A, 65, 012502 (2001)[5]. P. R. Berman, J. Quant. Spectrosc. Radiat. Transf., 12, 1331 (1972)[6]. D. A. Shapiro, R. Ciuryło, J. R. Drummond, A. D. May, Phys. Rev. A, 65, 012501 (2001)[7]. M. J. Lindenfeld, B. Shizgal, Chem. Phys., 41, 81 (1979)[8]. L. Galatry, Phys. Rev., 122, 1218 (1961)
99

Determination of the Electronic Temperature and the
Electronic Density of a Discharge Plasma
L. Benmebrouka & F. Khelfaoui
b
University of Kasdi Merbah, Ouargla 30000, Algérie
In the setting of characterization of discharge plasma we achieved a numerical survey
on the experimental specters given by plasma of deposition on thin films of silicon.
The sought-after objective is determination of the electronic temperature and the
electronic density of a discharge plasma provoked in the pure helium with a pressure
of 0.1mb, a RF power (100-400W) and for positions (x = 0, x = 3 and x = 5). The
spectral line shape and the knowledge of the state of thermodynamic equilibrium of
the middle are necessary in achieving our studies. We took data bases atomic physics
of the different elements of the middle as a basis (HeI, HeII, SiI, SiII…), and
theoretical and numerical model to calculate the different reasons of broadening
(Natural, Doppler, Stark and experimental). The found results show that plasma is not
at local thermodynamic equilibrium and the electronic temperature is close to those
valued by other authors.
REFERENCES
[1] M. Baranger, Phy. Rev. 112,855, (1958).
[2] M. Baranger, Phy. Rev. 111,494, (1958).
[3] A. C. Kolb et H. R. Griem, Phys. Rev. 111, 514, (1958).
[4] H.R. Griem;“Spectral Line Broadening by Plasma“; academic press, New York,
(1994).
[5] M.S. Aida;“Elaboration et Caractérisation des Couches Minces de Silicium
Amorphe Hydrogéné par Pulvérisation Cathodique, étude des Effets de la Puissance
RF“; thése de Doctorat, Constantine, (1994).
100

The Reconstruction of the Absorption Bandshape from
Reflection Spectra for Strong Bands. The ν3 Band of
Liquefied CF4
Pavel K. Sergeev, Ruslan E. Asfin, Vladimir V. Bertsev, Tatyana D. Kolomiitsova,
and Dmitry N. Shchepkin
Department of Physics, Saint-Petersburg State University, Ulianovskaya ul. 3, 198504, St. Petersburg, Russia
In this report we describe the method of reconstruction of the strong band shape from
reflection spectra obtained on an interface of a cell window and a sample. This method was
applied to study of a bandshape of the strong ν3 band of liquefied CF4 at temperature 90 K. The
spectra were recorded with a Bruker IFS 28 spectrometer with resolution 1 cm-1
. The extraction
of reflection spectra from recorded signals was performed. The band ν3 is characterized by
asymmetric profile, accent Evance hole, and the weak ν3 13
CF4 band.
The reconstruction of absorption band was made by next procedure. An arbitrary absorption
profile was presented as a set of reference point. The absorptions in other experimental
frequencies were obtained by cubic spline interpolation. The reflection spectrum of an arbitrary
absorption profile was calculated using the Kramers–Kronig relations. The square of difference
between calculated and experimental reflection spectra had been minimized to obtain the
absorption profile using one of down-hill methods with the value of optical density of reference
points as parameters of minimization. The fitting of different initial profiles led to the same
resulting absorption band.
The resulting band has very strong intensity that unusual for molecular liquids. The maximum
of reflection index Rmax = 0.8 and the maximum of extinction coefficient ϰmax = 3.65. The optical
density for this band with path length 10 μm reaches 15 absorbance units.
The wings of the reconstructed band were compared with experimental one obtained in layer
about 100 μm. The good agreement was obtained.
1350 1300 1250 1200
0.0
0.2
0.4
0.6
0.8
, cm-1
R
1350 1300 1250 1200
0
1
2
3
4
, cm-1
Fig.1. Reflection spectra (left) and reconstructed extinction coefficient (right) of liquefied CF4 at
90 K in the region of the fundamental ν3 band.
101

F. Aitken 38, 48, 49 V. A. Alekseev 20, 44, 45 O. S. Alekseeva 18, 43 J. Alexander 15 E. B. Alexandrov 25 N. F. Allard 46, 47, 71, 72 O. Yu. Andreev 21 C. Andreev 52 Yu. I. Anisimov 69 Yu. A. Anokhin 59 V. V. Arakcheev 40 R. Armante 19R.E. Asfin 101 V. A. Astapenko 24 V. M. Atrazhev 38, 48, 49, 92 L. P. Avakyants 42 Y. Azzouz 77 S. A. Balashev 11 T. Ban 23 T. Bancewicz 62 P. S. Barklem 16, 32 O. V. Belai 30 A. K. Belyaev 17, 32, 50 L. Benmebrouk 100 N. Ben Nessib 55 V.V. Bertsev 101N. N. Bezuglov 34, 52, 56 K. Bielska 80 E. Bogans 87 V. A. Boiko 59 P. Yu. Bokov 42 D. Boland 60 R. E. Boltnev 83, 84 N. Bonifaci 38, 56, 49, 92 Ch. J. Bordé 26 I. Bray 5 M. Bruvelis 34, 52 A. N. Burenkov 12 I. B. Bykhalo 83, 84 H. Capes 51, 88, 95 S. Cartaleva 98 F. Catoire 95 Ch. Boutammine 19 C. Chardonnet 26 A. V. Chervyakov 42 R. Ciuryło 53, 80, 99 K. Cossel 23 L. Crépeau 19 A. Cygan 53, 80 A. Dadonova 54 E. Dalimier 8 B. Darquié 26
C. Daussy 26 B. Deguilhem 46 A. V. Demura 27 A. Denat 92 A. Z. Devdariani 18, 43, 50,65 M. S. Dimitrijević 55, 82 J. Domysławska 53, 80 Yu. V. Dubrovskaya 91 D. K. Efmov 56 A. Ekers 34, 52 H. Elabidi 57 J. Eloranta 38, 48 N. Feautrier 32 B. Ferhat 77 T. A. Florko 58 A. Foltynowicz 23 B. A. Fomin 59 K. Fujii 66 D. V. Fursa 5 F. X. Gadéa 46 R. R. Gamache 31 A. Gatilova 60 Z. Gavare 94 K. Gebresellasie 39 T. Gerber 33 Z. F. Ghatass 61 L. Gianfrani 28 W. Głaz 62 A. V. Glushkov 63, 64 Y. N. Gnedin 14 L. Godbert-Mouret 95 J.-L. Godet 62 G. V. Golubkov 65 M. G. Golubkov 65 T. V. Gordeychuk 41 M. Goto 66 G. M. Grigorian 67 M. Guitou 32 S. Gulyaev 15 K. Von Haeften 38, 48, 49 R. Hammami 51, 95 A. Haskopoulos 62 M. Hasuo 4, 66 M. S. Helmi 89 R. M. Herman 29, 79 W. Herrebout 73 J. T. Hodges 53 T. Ido 22 L. M. Ignjatović 82 D. Ilic 12 A. V. Ivanchik 11 V. A. Ivanov 85, 86
N. Jacquinet-Husson 19 M. V. Kazachek 41 I. P. Kazakov 42 F. Y Khattak 10F. Khelfaoui 100 O. Yu. Khetselius 68 V. V. Khmelenko 83, 84 V. V. Khromov 97 J. F. Kielkopf 71 S. A. Klemeshev 75 E. Yu. Kleymenov 75 A. N. Klyucharev 56 G. Knopp 33 W. Kollatschny 12 T. D. Kolomiitsova 101N. B. Kosykh 69 M. Koubiti 70, 95 A. Kouzov 73 D. N. Kozlov 74 A. Krasteva 98 I. N. Krushinskaya 83, 84 N. A. Kryukov75 B. V. Kuteev 93 A. S. Kvasikova 76 N. Larbi-Terz 55 M. G. Lednev 18, 43 D. M. Lee 84 C. Lemarchand 26 A. Lesage 77 J. C. Lewis 29, 39, 78, 79 Z. L. Li 92 D. Lisak 53, 80 V. S. Lisitsa 3 R. Liskac 8 Y Liu 33 A. V. Loboda 81 A. E. Logunov 97 S. Lorenzen 5 O. Mahran 90 B. Mahrov 52 Y. Marandet 51, 70, 95, G. Maroulis 62 I. Ch. Mashek 69 P. Maslowski 23, 80 P. Matsyutenko 33 T. B. Mavljudov 92 A. Mekkaoui 95 A. Metropoulos 82 K. Miculis 52 A. A. Mihajlov 56, 82 I. V. Miroshnikov 93 A. Monari 46
Index

S. Morita 66 V. B. Morozov 40 L. Mouret 70 T. Nakano 70 A. Nakayama 71 N. H. Ngo 31 Hai Van Nguyen 48, 49 E. Oks 8 F. Ozimek 80 Ch. Parigger 7 A. S. Pazgalev 97 A. A. Pelmenev 83, 84 O. A. M. B. Percie du Sert 10 N. N. Petrov 59 A. S. Petrovskaya 85, 86 L. Č. Popović 12 S. G. Przhibel’skii 97 R. Püttner 44 P. P. Radi 33, 74 Cz. Radzewicz 80 R. Redon 77 H. Reinholz 5 O. Renner 8 G. Revalde 87, 94 D. Riley 10 R. Rincon 49 M. Ripert 77 G. Röpke 5 J. Rosato 6, 51, 70, 88, 95 F. B. Rosmej 9, 10 G. D. Roston 61, 89, 90 A. Rudakova 60 V. S. Rybak 50
S. Sahal-Bréchot 13, 55 A. Sargsyan 98 D. Sarkisyan 97, 98 PA. Saveliev 75 K. Sawada 66 A. V. Scherbinin 27 N. Schwentner 44 I. N. Serga 91 P.K. Sergeev 101M. Shahat, 90 V. A. Shakhatov 48, 92 D. A. Shapiro 30 A. I. Shapovalova 12 I. A. Sharov 93 D. Shchepkin 60, 101 J. Shirokoff 39 Yu. E. Skoblo 85, 86 A. Skudra 94 J. Skudra 87 D. Slavov 98 M. Šmída 8 V. V. Smirnov 35 S. A. Smirnov 69 J. Sofo 79 F. Spiegelman 71 A. Spielfedel 32 V. A. Srećković 82 R. Stamm 51, 70, 88, 95 K. Stec 80 O. M. Stel’makh 35 A. Suarez 79 S. Sudo 93 D. E. Sukharev 91
A. Svagere 94 A. A. Svinarenko 58 Y. Sych 33 N. Tamura 93 T. A. Tkach 58, 96H. Tran 31 R. S. Trawiński 53, 80 D. Tretyakov 52 M. Triki 26 E. A. Trufanov 42 A. Tsyganenko 60 J. Ulmanis 52 S. Ya. Umanskii 27 B. van der Veken 73 D. A. Varshalovich 11 T. A. Vartanyan 37, 97, 98 K. A. Vereshchagin 35, 36, A. K. Vereshchagin 35 I. Verzbitskiy 73 P. Wcisło 99 H. Wheeler 78 A. Wierling 5 S. Wójtewicz 53, 80 A. Woods 7 J. Ye 23 V. Yu. Sergeev 93 A. L. Zagrebin 18, 43 M. Yu. Zaharov 56 A. Z. Zaitsevskii 27 M. C. Zammit 5 V S. Zapasskii 25 I. A. Zlatkin 50 N. Zorina 87