
S-SAR-G-00001, Revision 1, Safety Analysis Report Model ...
378
Revision 0 S-SAR-G-0000 I Revision 0 S-SAR-G-0000 1 APPENDIX 2.3 9965 CONE-SEAL CLOSURE PERFORMANCE AT -4 0 °F Appendix 2.3 - I of 4
-
Upload
khangminh22 -
Category
Documents
-
view
3 -
download
0
Transcript of S-SAR-G-00001, Revision 1, Safety Analysis Report Model ...
Revision 0 S-SAR-G-0000 IRevision 0 S-SAR-G-0000 1
APPENDIX 2.3
9965 CONE-SEAL CLOSURE PERFORMANCE AT -4 0 °F
Appendix 2.3 - I of 4

Revision 0 S-SAR-G-0000 IRevision 0 S-SAR-G-OOO0 1
This Page Intentionally Left Blank
Appendix 2.3 - 2 of 4
Revision 0 S-SAR-G-00001
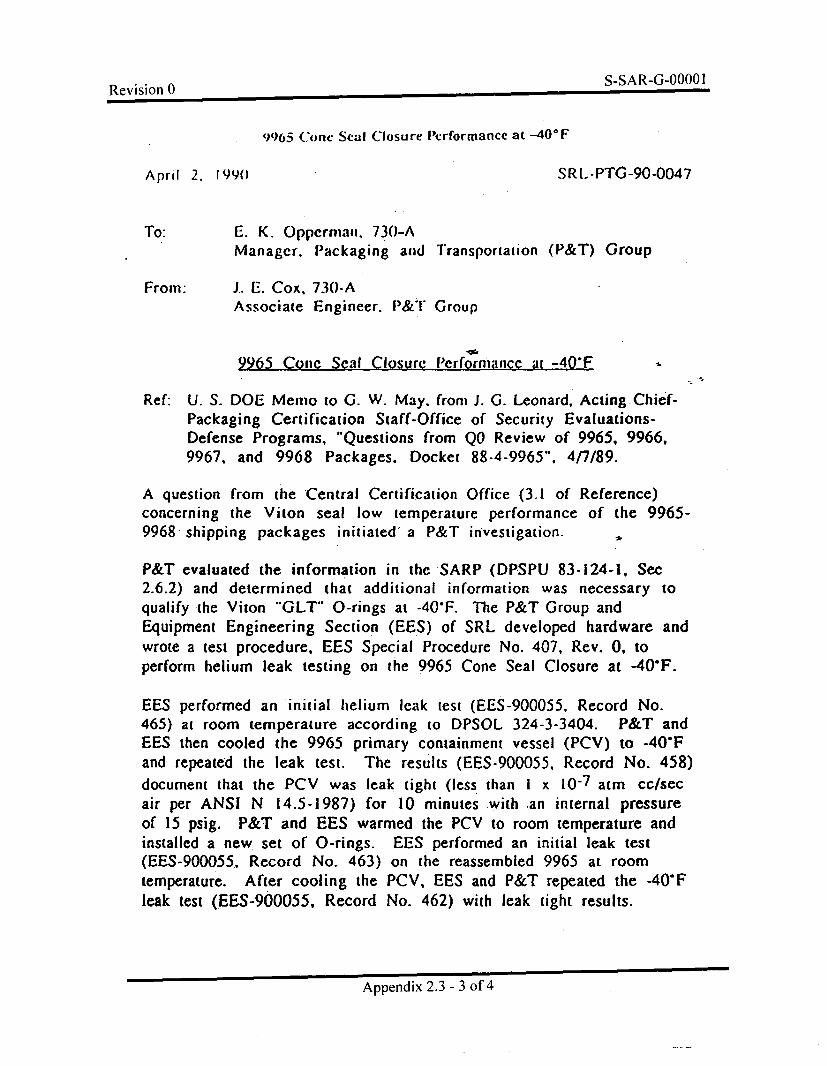
9965 (Cone Seal Closure Performance at -40*F
April 2, 199(0 SRL-PTG-90-0047
To: E. K. Opperman, 73(0-AManager. Packaging and Transportation (P&T) Group
From: J. E. Cox, 730-AAssociate Engineer. P&T Group
9965 Cone Seal Closure Performiaicc it -40"F
Ref: U. S. DOE Memo to G. W. May. from J. G. Leonard, Acting Chief-Packaging Certification Staff-Office of Security Evaluations-Defense Programs, "Questions from QO Review of 9965, 9966,9967, and 9968 Packages. Docket 88-4-9965". 4/7/89.
A question from the Central Certification Office (3.1 of Reference)concerning the Viton seal low temperature performance of the 9965-9968 shipping packages initiated' a P&T investigation.
P&T evaluated the information in the SARP (DPSPU 83-124-1, Sec2.6.2) and determined that additional information was necessary toqualify the Viton "GLT" O-rings at -40"F. The P&T Group andEquipment Engineering Section (EES) of SRL developed hardware andwrote a test procedure, EES Special Procedure No. 407, Rev. 0, toperform helium leak testing on the 9965 Cone Seal Closure at -40"F.
EES performed an initial helium leak test (EES-900055. Record No.465) at room temperature according to DPSOL 324-3-3404. P&T andEES then cooled the 9965 primary containment vessel (PCV) to -40"Fand repeated the leak test. The results (EES-900055, Record No. 458)document that the PCV was leak tight (less than I x 10-7 atm cc/secair per ANSI N 14.5-1987) for 10 minutes with -an internal pressureof 15 psig. P&T and EES warmed the PCV to room temperature andinstalled a new set of O-rings. EES performed an initial leak test(EES-900055., Record No. 463) on the reassembled 9965 at roomtemperature. After cooling the PCV, EES and P&T repeated the -40"Fleak test (EES-900055, Record No. 462) with leak tight results.
Appendix 2.3 - 3 of 4
Revision 0 S-SAR-G-0000 I
P&T documented thc tcsts in the 9965-9968 QA flic 810000574located in SRL and revised Section 2.6.2 of tic SARP. DOE/SavannahRiver will transmit the revised SARP to the Central CertificationOffice for review after P&T addresses all of the QOs and incorporatesthe changes into the SARP. All "scoping" work leading up to the finaltests will be on file in the P&T Group files.
If you have any questions, please contact nie. extension 5-1713.
M2 G. Cadelli
Appendix 2.3 - 4 of 4
Revision I S-SAR-G-0000 IRevision I S-SAR-G-O000 I
APPENDIX 2.4
EVALUATION OF 9975 SHIPPING CONTAINER FLANGE CLOSURE
Appendix 2.4 - 1 of 70

Revision I S-SAR-G-0000 IRevision I S-SAR-G-O000 1
This Page is Intentionally Left Blank
Appendix 2.4 - 2 of 70
Revision I S-SAR-G-00001
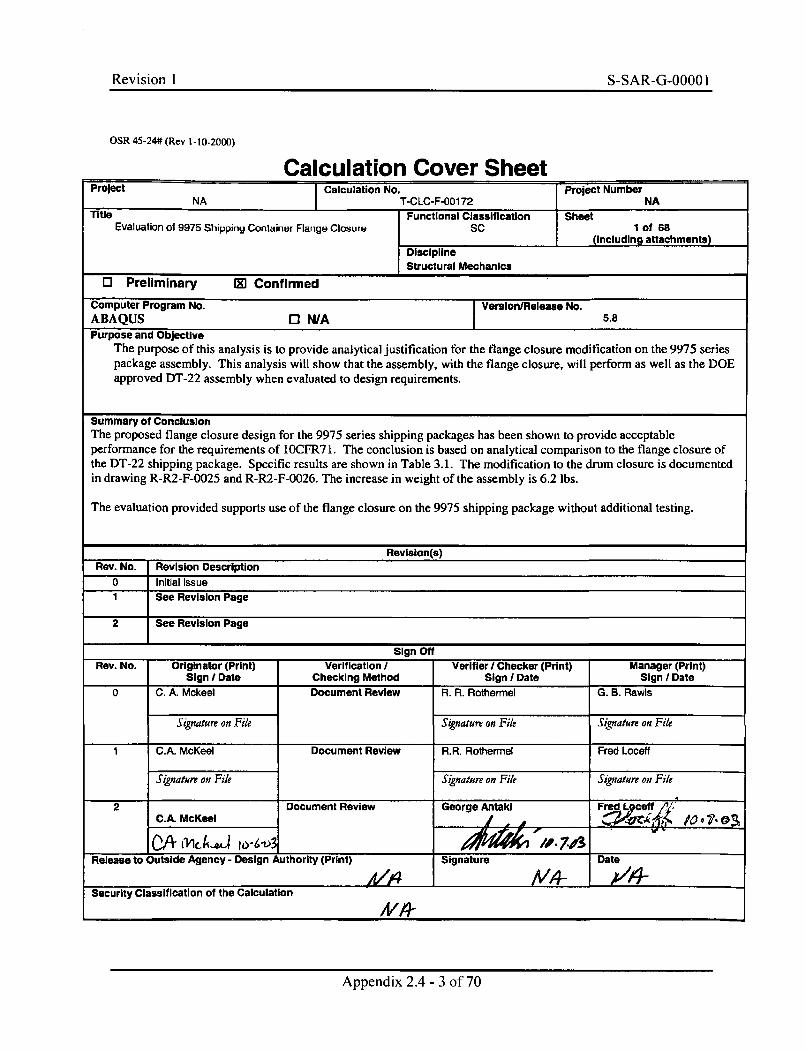
OSR 45-24# (Rev 1-10.2000)
Calculation Cover SheetProject Calculation No. Project Number
NA T-CLC-F-00172 NATitle Functional Classification Sheet
Evaluation of 9975 Shipping Container Flange CIoSul SC I of 68(including attachments)
DisciplineStructural Mechanics
0 Preliminary [9] ConfirmedCom'puter Program No. Version/Release No.ABAQUS 0 NWA 5.8
Purpose and ObjectiveThe purpose of this analysis is to provide analytical justification for the flange closure modification on the 9975 seriespackage assembly. This analysis will show that the assembly, with the flange closure, will perform as well as the DOEapproved DT-22 assembly when evaluated to design requirements.
Summary of ConclusionThe proposed flange closure design for the 9975 series shipping packages has been shown to provide acceptableperformance for the requirements of 10CFR71. The conclusion is based on analytical comparison to the flange closure ofthe DT-22 shipping package. Specific results are shown in Table 3.1. The modification to the drum closure is documentedin drawing R-R2-F-0025 and R-R2-F-0026. The increase in weight of the assembly is 6.2 lbs.
The evaluation provided supports use of the flange closure on the 9975 shipping package without additional testing.
Revision(s)
Rev. No. Revision Description0 Initial IssueI See Revision Page
2 See Revision Page
Sign OffRev. No. Originator (Print) Verification I Verifier I Checker (Print) Manager (Print)
Sign I Date Checking Method Sign ) Date Sign I Date0 C. A. Mckeel Document Review R. R. Rothermel G. B. Rawis
Signature on File Signature on File Signature on File
I C.A. McKeel Document Review R.R. Rothermel Fred Loceff
Sgnature on File Signature on File Signature on File
2 Document Review George Antaki Fre cet w ff .
Release to Outside Agency - Design Authority (Print) Signature Date
Security Classification of the Calculation
Appendix 2.4 - 3 of 70
Revision 1 S-SAR-G-00001
T-CLC-A-00172, Rev. 2, Pg.2 of 68
1 PURPOSE ................................................................................................................ 7
2 SCOPE ..................................................................................................................... 7
3 CONCLUSIONS ................................................................................................... 7
4 METHODOLOGY ................................................................................................. 8
4.1 Analytical Methodology ................................................................................................................................. 8
4.2 Acceptance Criteria ........................................................................................................................................ 8
5 INPUTS .................................................................................................................... 8
5.1 Structural Details ............................................................................................................................................ 8
5.2 Material Properties ...................................................................................................................................... 11
6 ANALYSIS ............................................................................................................. 12
6.1 Evaluation of Previous Test Data ............................................................................................................ 12
6.2 Drop Evaluation ............................................................................................................................................ 146.2.1 FE A M odel D escription ......................................................................................................................... 146 .2 .2 L o ad C ases ............................................................................................................................................. 196 .2 .3 R esu lts ................................................................................................................................................... 196.2.4 Evaluation of Closure Screws for Container Crush Loads .............................................................. 376.2.5 Evaluation of L id C urvature .................................................................................................................. 39
6.3 Axial Compression Evaluation .................................................................................................................... 426.3.1 Five Times Load Compression Test .................................................................................................. 426 .3 .2 B uck ling A naly sis .................................................................................................................................. 4 9
6.4 Weight Evaluation ........................................................................................................................................ 50
6.5 Closure Fastener Evaluation ....................................................................................................................... 52
6.6 Vibratory Loads on 9975 Package During Normal Conditions of Transport ..................................... 54
6.7 Loosening of Drum Bolts During Normal Conditions of Transport ................................................... 57
6.8 Evaluation of Flange to Drum Weld ...................................................................................................... 59
7 REFERENCES ................................................................................................... 63
Appendix 2.4 - 4 of 70

Revision 1 S-SAR-G-O000 1
T-CLC-A-00172, Rev. 2, Pg.3 of 68
OPEN ITEMS
None
Appendix 2.4 - 5 of 70
Revision I S-SAR-G-o000 1T-CLC-A-00 172, Rev. 2, Pg.4 of 68
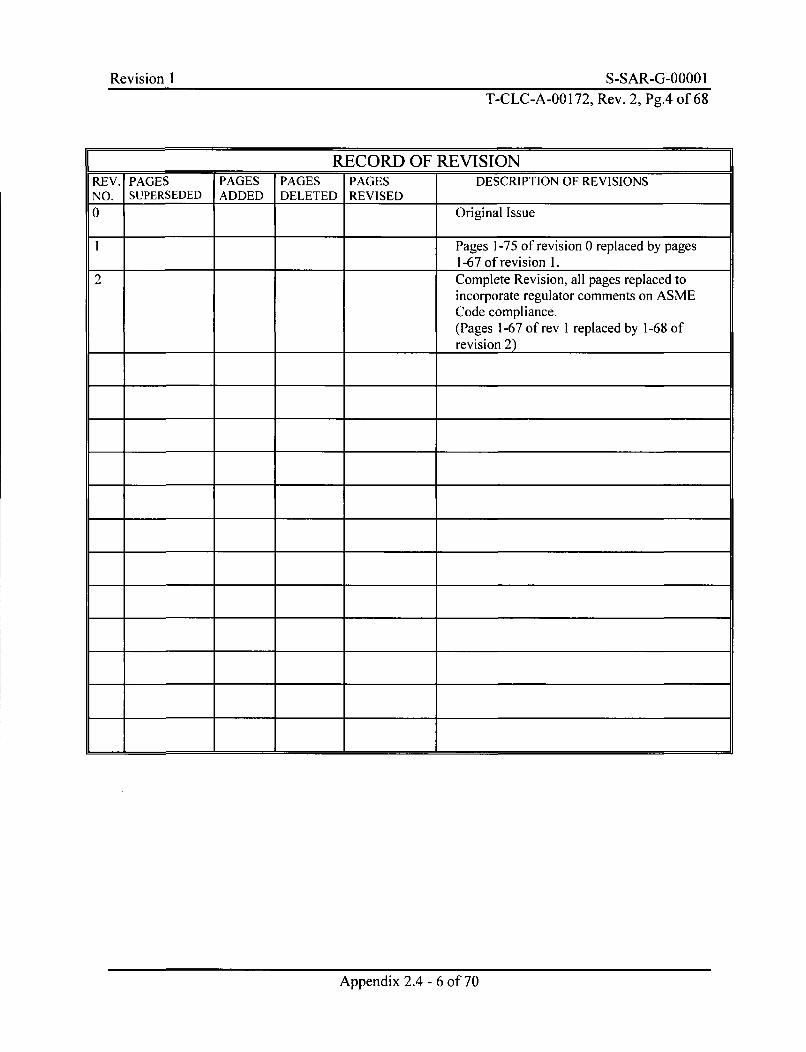
_RECORD OF REVISIONREV. PAGES PAGES PAGES PAGES DESCRIPTION OF REVISIONSNO. SUPERSEDED ADDED DELETED REVISED
0 Original Issue
1 Pages 1-75 of revision 0 replaced by pages1-67 of revision 1.
2 Complete Revision, all pages replaced toincorporate regulator comments on ASMECode compliance.(Pages 1-67 of rev I replaced by 1-68 ofrevision 2)
_ j __ hi __ I ________
I + I 4 4-
-4 I I
I 4- I I
Appendix 2.4 - 6 of 70
Revision I S-SAR-G-OO00 1
T-CLC-A-00172, Rev. 2, Pg.5 of 68
1 PurposeThe purpose of this analysis is to provide analytical justification for the flange closure modification onthe 9975 series package assembly. This analysis will show that the assembly, with the flange closure,will perform as well as the DOE approved DT-22 assembly when evaluated to design requirements.
2 ScopeThe items addressed in this calculation are those directly related to the flange closure. Existing testdata and analysis qualifies all aspects of the 9975 package except for the existing banded closuredesign. This analysis will evaluate the 9975 package flange closure design by comparison to the DT-22 flange design, whenever possible. The items evaluated are:
1. The acceptable performance of the flange closure, including meeting the requirements of 10CFR71.71 NCT and 10 CFR71.73 HAC testing.
2. Maintenance of 2 inches of undamaged Celotex between the drum and the package internals.3. Compressive load capability.4. Closure fastener pre-load.5. Closure fastener integrity during NCT vibrations.6. Closure fastener loosening due to thermal cycles.7. Additional weight of modifications.
3 ConclusionsThe proposed flange closure design for the 9975 series shipping packages has been shown to provideacceptable performance for the requirements of I0CFR71. The conclusion is based on analyticalcomparison to the flange closure of the DT-22 shipping package. This comparison is based onapplying loads statically to a non-linear model of the DT-22 container to achieve a comparable level ofpermanent deformation with the tested DT-22 containers, for both the 450 drop and a horizontal dropfrom a height of 30 feet. Then a similar model of the 9975 package was loaded to achieve acomparable level of deformation and the resulting closure bolt loads were determined and compared.
The analysis shows that because of the stiffer geometry (from the smaller radius of the 9975 container)the closure screw loads are greater. In order to provide the same level of safety, this 9975 designspecifies ½" closure screws, rather than the 3/8" used in the DT-22 package. The modification to thedrum closure is documented in drawings R-R2-F-0025 and R-R2-F-0026. The increase in weight ofthe package is 6.2 lbs.
The evaluation provided supports use of the flange closure on the 9975 shipping package withoutadditional testing. If additional testing is specified, this analysis suggests that the 45' inclination, topdown, drop produces worst case loads on the closure screws. It is also recommended that the impactpoints used in the pre-condition drop and the 30 foot drop be spaced a minimum of 15 degrees and amaximum of 30 degrees apart.
Appendix 2.4 - 7 of 70
Revision 1 S-SAR-G-O000 1T-CLC-A-00 172, Rev. 2, Pg.6 of 68
4 Methodology
4.1 Analytical Methodology
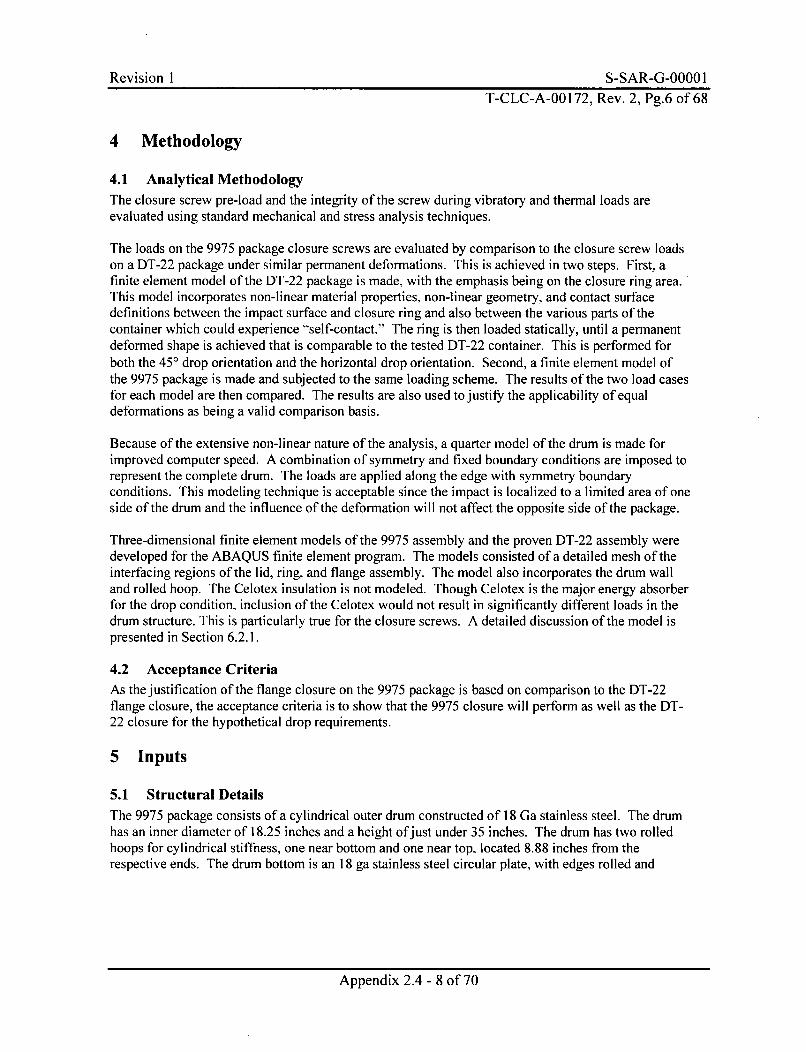
The closure screw pre-load and the integrity of the screw during vibratory and thermal loads areevaluated using standard mechanical and stress analysis techniques.
The loads on the 9975 package closure screws are evaluated by comparison to the closure screw loadson a DT-22 package under similar permanent deformations. This is achieved in two steps. First, afinite element model of the DT-22 package is made, with the emphasis being on the closure ring area.This model incorporates non-linear material properties, non-linear geometry, and contact surfacedefinitions between the impact surface and closure ring and also between the various parts of thecontainer which could experience "self-contact." The ring is then loaded statically, until a permanentdeformed shape is achieved that is comparable to the tested DT-22 container. This is performed forboth the 450 drop orientation and the horizontal drop orientation. Second, a finite element model ofthe 9975 package is made and subjected to the same loading scheme. The results of the two load casesfor each model are then compared. The results are also used to justify the applicability of equaldeformations as being a valid comparison basis.
Because of the extensive non-linear nature of the analysis, a quarter model of the drum is made forimproved computer speed. A combination of symmetry and fixed boundary conditions are imposed torepresent the complete drum. The loads are applied along the edge with symmetry boundaryconditions. This modeling technique is acceptable since the impact is localized to a limited area of oneside of the drum and the influence of the deformation will not affect the opposite side of the package.
Three-dimensional finite element models of the 9975 assembly and the proven DT-22 assembly weredeveloped for the ABAQUS finite element program. The models consisted of a detailed mesh of theinterfacing regions of the lid, ring, and flange assembly. The model also incorporates the drum walland rolled hoop. The Celotex insulation is not modeled. Though Celotex is the major energy absorberfor the drop condition, inclusion of the Celotex would not result in significantly different loads in thedrum structure. This is particularly true for the closure screws. A detailed discussion of the model ispresented in Section 6.2.1.
4.2 Acceptance Criteria
As the justification of the flange closure on the 9975 package is based on comparison to the DT-22flange closure, the acceptance criteria is to show that the 9975 closure will perform as well as the DT-22 closure for the hypothetical drop requirements.
5 Inputs
5.1 Structural DetailsThe 9975 package consists of a cylindrical outer drum constructed of 18 Ga stainless steel. The drumhas an inner diameter of 18.25 inches and a height of just under 35 inches. The drum has two rolledhoops for cylindrical stiffness, one near bottom and one near top, located 8.88 inches from therespective ends. The drum bottom is an 18 ga stainless steel circular plate, with edges rolled and
Appendix 2.4 - 8 of 70
Revision I S-SAR-G-0000 IT-CLC-A-00172, Rev. 2, Pg.7 of 68
crimped (double seamed) and welded continuously to the drum bottom. The top lid is also an 18 ga.circular plate. The lid incorporates a 0.55" offset hat section. The hat section diameter is 17.87inches. The outer section of the lid is welded to a 1/8 inch thick x 1.25 inch wide circular ring of20.85 inch outer diameter. The ring has 24 holes, equally spaced on a 19.84 inch diameter. Themaximum gross weight of the 9975 is 404 lbs.
The DT-22 package consists of a cylindrical outer drum constructed of 18 Ga stainless steel. Thedrum has an inner diameter of 22.4 inches and a height of just under 28 inches. The drum has tworolled hoops for cylindrical stiffness. The hoops are located 3 inches from each end. The drumbottom is an 18 ga stainless steel circular plate, with edges rolled and crimped (double seamed) andwelded continuously to the drum bottom. The top lid is also an 18 ga. circular plate. The lidincorporates a 0.75" offset hat section. The hat section diameter is 22 inches. The outer section of thelid is welded to a 1/8 inch thick x 1.25 inch wide circular ring of 25.2 inch outer diameter. The ringhas 24 holes, equally spaced on a 24.2 inch diameter. The maximum gross weight of the DT-22 is 412lbs. as tested.
Appendix 2.4 - 9 of 70
Revision I S-SAR-G-0000 1T-CLC-A-00172, Rev. 2, Pg.8 of 68
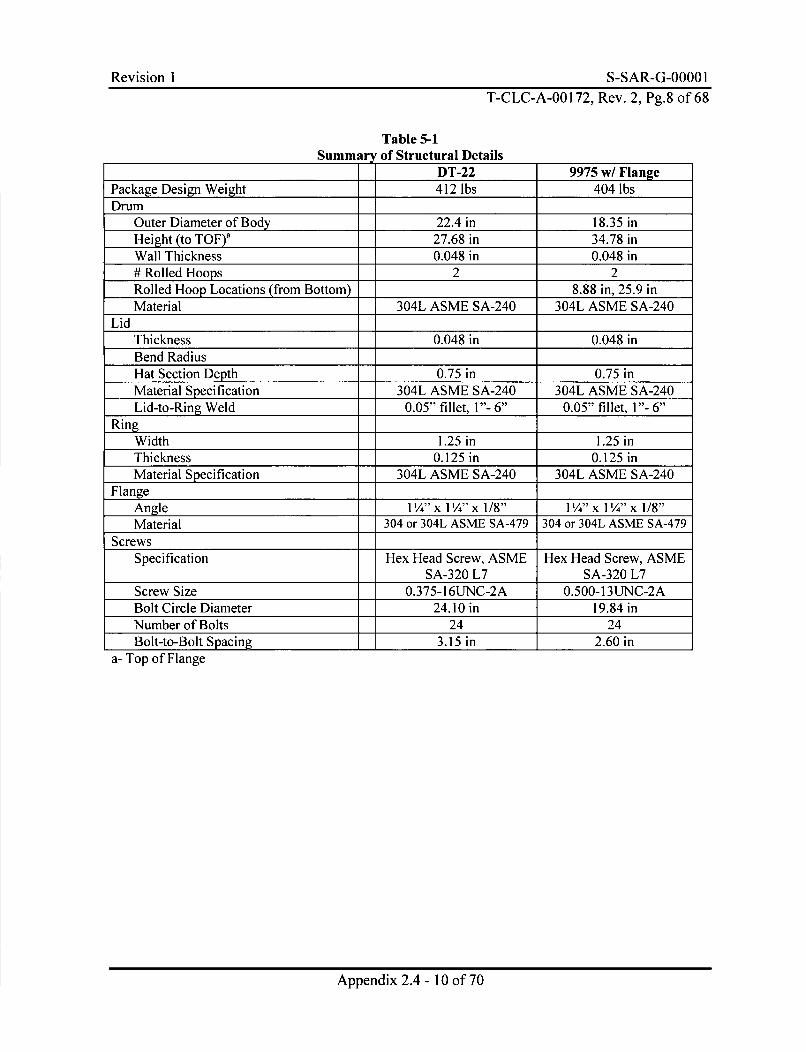
Table 5-1Summary of Structural Details
DT-22 9975 w/ FlangePackage Design Weight 412 lbs 404 lbsDrum
Outer Diameter of Body 22.4 in 18.35 inHeight (to TOF)a 27.68 in 34.78 inWall Thickness 0.048 in 0.048 in# Rolled Hoops 2 2Rolled Hoop Locations (from Bottom) 8.88 in, 25.9 inMaterial 304L ASME SA-240 304L ASME SA-240
LidThickness 0.048 in 0.048 inBend RadiusHat Section Depth 0.75 in 0.75 inMaterial Specification 304L ASME SA-240 304L ASME SA-240Lid-to-Ring Weld 0.05" fillet, 1"- 6" 0.05" fillet, 1"- 6"
RingWidth 1.25 in 1.25 inThickness 0.125 in 0.125 inMaterial Specification 304L ASME SA-240 304L ASME SA-240
FlangeAngle P/4" x P/4" x 1/8" 1/" x 1¼" x 1/8"Material 304 or 304L ASME SA-479 304 or 304L ASME SA-479
ScrewsSpecification Hex Head Screw, ASME Hex Head Screw, ASME
SA-320 L7 SA-320 L7Screw Size 0.375-16UNC-2A 0.500-13UNC-2ABolt Circle Diameter 24.10 in 19.84 inNumber of Bolts 24 24Bolt-to-Bolt Spacing 3.15 in 2.60 in
a- Top of Flange
Appendix 2.4 - 10 of 70
Revision I S-SAR-G-00001T-CLC-A-00 172, Rev. 2, Pg.9 of 68
5.2 Material PropertiesThe material properties used for the stainless steel drum, flange, lid and ring, the closure screws, andthe screw nuts are shown below. Parametric studies to show the effects of median or upper boundmaterial properties are not performed, as this analysis is comparative in nature. On the same basis, theincreased material strength due to the high strain rates was also not considered.
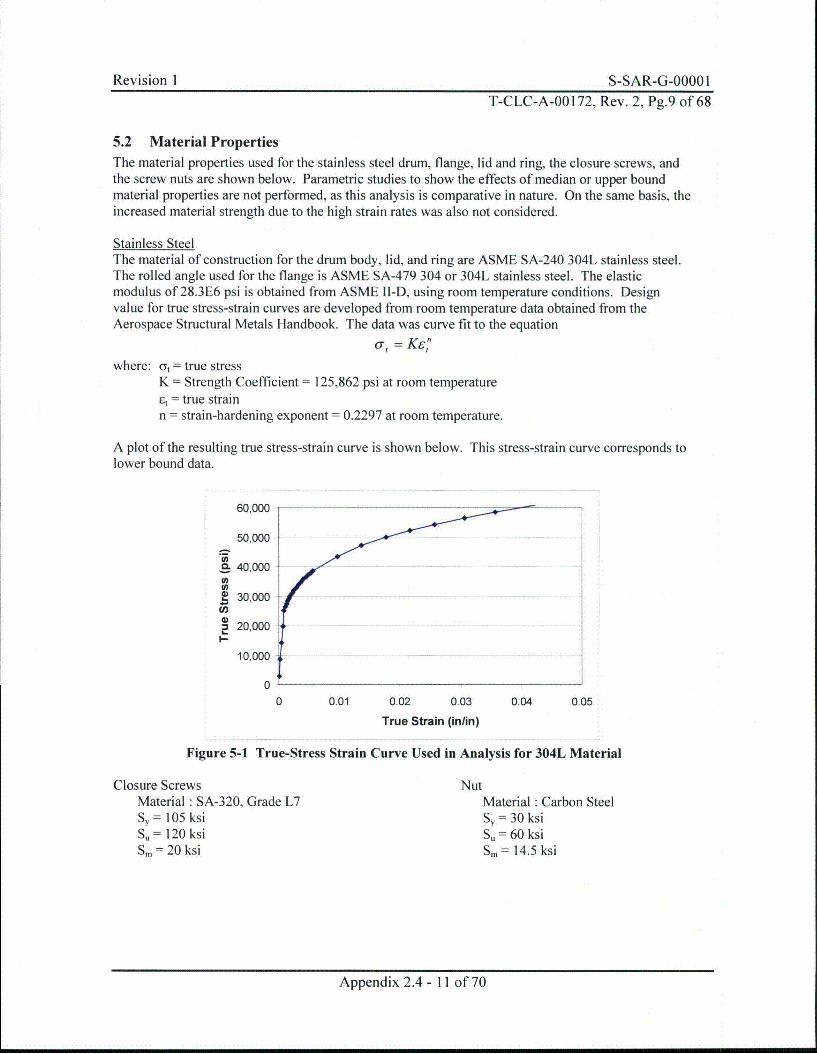
Stainless SteelThe material of construction for the drum body, lid, and ring are ASME SA-240 304L stainless steel.The rolled angle used for the flange is ASME SA-479 304 or 304L stainless steel. The elasticmodulus of 28.3E6 psi is obtained from ASME l1-D, using room temperature conditions. Designvalue for true stress-strain curves are developed from room temperature data obtained from theAerospace Structural Metals Handbook. The data was curve fit to the equation
K-, =<Kg
where: ot = true stressK = Strength Coefficient = 125,862 psi at room temperatureEt = true strainn = strain-hardening exponent = 0.2297 at room temperature.
A plot of the resulting true stress-strain curve is shown below. This stress-strain curve corresponds tolower bound data.
60,000
50,000
40,000
.• 30,000
2 20,0001-
10,000
00 0.01 0.02 0.03 0.04 0.05
True Strain (inlin)
Figure 5-1 True-Stress Strain Curve Used in Analysis for 304L Material
Closure ScrewsMaterial : SA-320, Grade L7Sy = 105 ksiSu = 120 ksiSm = 20 ksi
NutMaterial : Carbon SteelSy = 30 ksiSu = 60 ksiSm= 14.5 ksi
Appendix 2.4 - 11 of 70
Revision I S-SAR-G-00001T-CLC-A-00172, Rev. 2, Pg.10 of 68
6 Analysis
6.1 Evaluation of Previous Test Data
In preparation for developing computer models of the redesigned 9975 closure details, the drop testresults of containers having similar closures were reviewed. This included review of test reports andphotographs of the tested specimen's damaged state with specific recognition of any breaching of theclosure seal, as well as, to assess the expected deformed state of tested containers. The reports for thetested containers that have similar closure flanges to the proposed 9975 modification that wereavailable for review were:
"Test Report for Certification of the DC-I Shipping Package" (YMA-93-20), and"Test Report for the Certification of the DT-22 Shipping Package" (YMA-93-15).
Both the DC-I and the DT-22 shipping containers have larger diameters than the 9975 container.Table 6-1 lists pertinent geometry and weight differences between the tested containers and the 9975container.
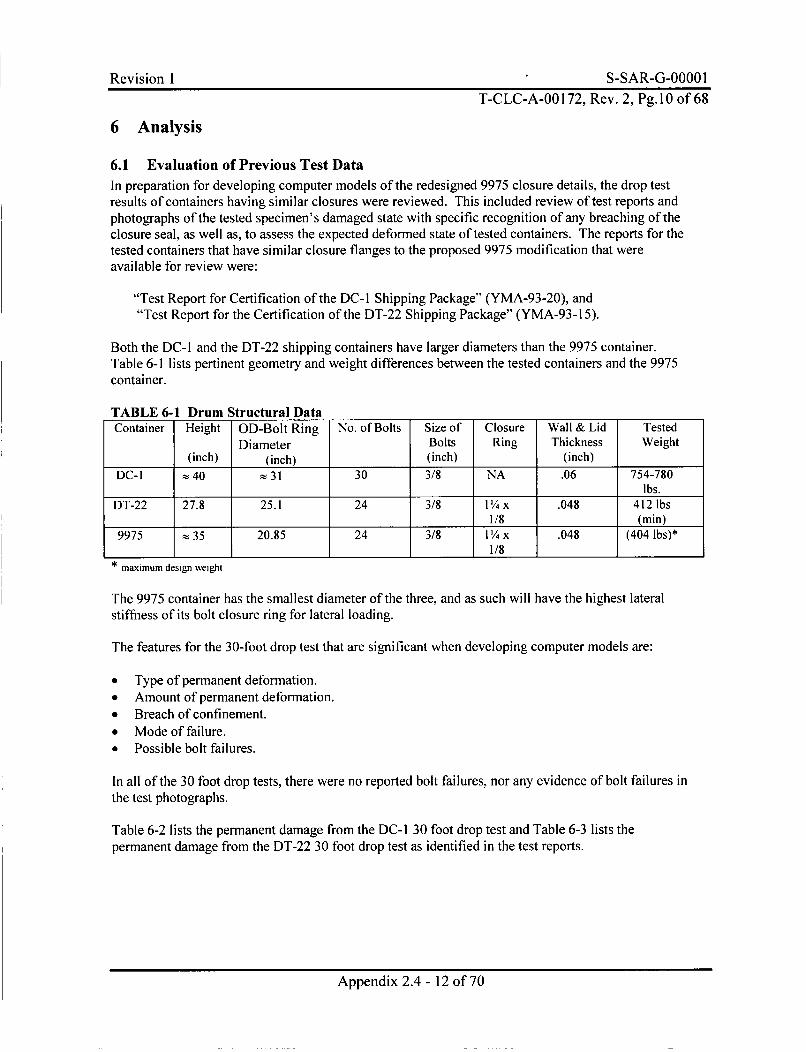
TABLE 6-1 Drum Structural DataContainer Height OD-Bolt Ring No. of Bolts Size of Closure Wall & Lid Tested
Diameter Bolts Ring Thickness Weight(inch) (inch) (inch) (inch)
DC-I 40 31 30 3/8 NA .06 754-780lbs.
DT-22 27.8 25.1 24 3/8 1¼ x .048 412 lbs1/8 (min)
9975 35 20.85 24 3/8 11/4 x .048 (404 lbs)*1/8
* maximum design weight
The 9975 container has the smallest diameter of the three, and as such will have the highest lateral
stiffness of its bolt closure ring for lateral loading.
The features for the 30-foot drop test that are significant when developing computer models are:
" Type of permanent deformation.* Amount of permanent deformation.* Breach of confinement." Mode of failure.* Possible bolt failures.
In all of the 30 foot drop tests, there were no reported bolt failures, nor any evidence of bolt failures inthe test photographs.
Table 6-2 lists the permanent damage from the DC-1 30 foot drop test and Table 6-3 lists thepermanent damage from the DT-22 30 foot drop test as identified in the test reports.
Appendix 2.4 - 12 of 70
Revision I S-SAR-G-00001T-CLC-A-00 172, Rev. 2, Pg. I1 of 68
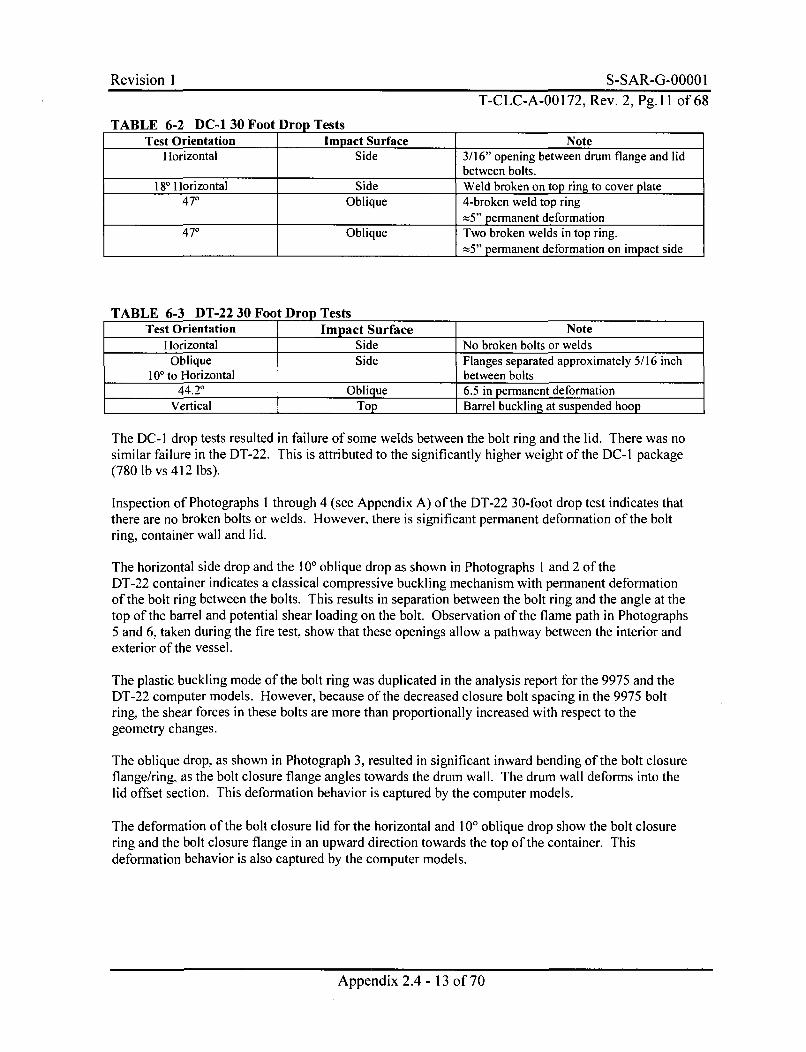
TABLE 6-2 DC-1 30 Foot Drop TestsTest Orientation Impact Surface Note
Horizontal Side 3/16" opening between drum flange and lidbetween bolts.
180 Horizontal Side Weld broken on top ring to cover plate470 Oblique 4-broken weld top ring
-:5" permanent deformation470 Oblique Two broken welds in top ring.
L5" permanent deformation on impact side
TABLE 6-3 DT-22 30 Foot Drop TestsTest Orientation Impact Surface Note
Horizontal Side No broken bolts or weldsOblique Side Flanges separated approximately 5/16 inch
100 to Horizontal between bolts44.20 Oblique 6.5 in permanent deformation
Vertical Top Barrel buckling at suspended hoop
The DC-I drop tests resulted in failure of some welds between the bolt ring and the lid. There was nosimilar failure in the DT-22. This is attributed to the significantly higher weight of the DC-I package(780 lb vs 412 lbs).
Inspection of Photographs I through 4 (see Appendix A) of the DT-22 30-foot drop test indicates thatthere are no broken bolts or welds. However, there is significant permanent deformation of the boltring, container wall and lid.
The horizontal side drop and the 100 oblique drop as shown in Photographs I and 2 of theDT-22 container indicates a classical compressive buckling mechanism with permanent deformationof the bolt ring between the bolts. This results in separation between the bolt ring and the angle at thetop of the barrel and potential shear loading on the bolt. Observation of the flame path in Photographs5 and 6, taken during the fire test, show that these openings allow a pathway between the interior andexterior of the vessel.
The plastic buckling mode of the bolt ring was duplicated in the analysis report for the 9975 and theDT-22 computer models. However, because of the decreased closure bolt spacing in the 9975 boltring, the shear forces in these bolts are more than proportionally increased with respect to thegeometry changes.
The oblique drop, as shown in Photograph 3., resulted in significant inward bending of the bolt closureflange/ring, as the bolt closure flange angles towards the drum wall. The drum wall deforms into thelid offset section. This deformation behavior is captured by the computer models.
The deformation of the bolt closure lid for the horizontal and 10' oblique drop show the bolt closurering and the bolt closure flange in an upward direction towards the top of the container. Thisdeformation behavior is also captured by the computer models.
Appendix 2.4 - 13 of 70
Revision I S-SAR-G-00001T-CLC-A-00172, Rev. 2, Pg.12 of 68
6.2 Drop EvaluationThe structural response of the drum closure for the 30 foot drop loading is evaluated in this section.The finite element method is utilized to make mathematical models to represent the drum structuralcomponents of the DT-22 and the 9975 assemblies. This evaluation does not consider the dynamics ofthe 30 foot drop, but rather makes a comparison by confirming that an imposed static deformation viadisplaced rigid surface on the Finite Element Model (FEM) reasonably duplicates the deformed shapeof the test results of the DT-22. The evaluation is by comparison of the response of the 9975 closureto that of the response of the proven DT-22 closure under the same load deflections.
6.2.1 FEA Model DescriptionThe 30 foot drop of the shipping packages induces large., localized, deformations on the exterior shell.Significant plastic behavior and non-linear geometric effects result from the drop testing. In order toanalyze this nonlinear behavior, the finite element method is used. A three-dimensional model of eachdrum is created and coded for the ABAQUS/Standard finite element program. The intent of themodeling is to compare the forces on the closure assembly during the expected crushing. The crush isimposed onto the model using a static analysis procedure.
Element DescriptionThe basic construction of the model employs first order shell elements. The model consists of theclosure ring, the closure lid, the drum flange and the drum itself. The closure screws are modeled asbeam elements. Each of these components are modeled as completely separate modules. The closurering is tied to the closure lid intermittently using Multi-Point-Constraints (MPC's). These MPC'srepresent the stitch welding to be used on the actual drum. Similarly, the drum flange is joined to thedrum shell using MPC's at the weld attachment points. The drum/flange assembly and the lid/ringassembly are then joined via ABAQUS contact surfaces and with the (closure screw) beam elements.
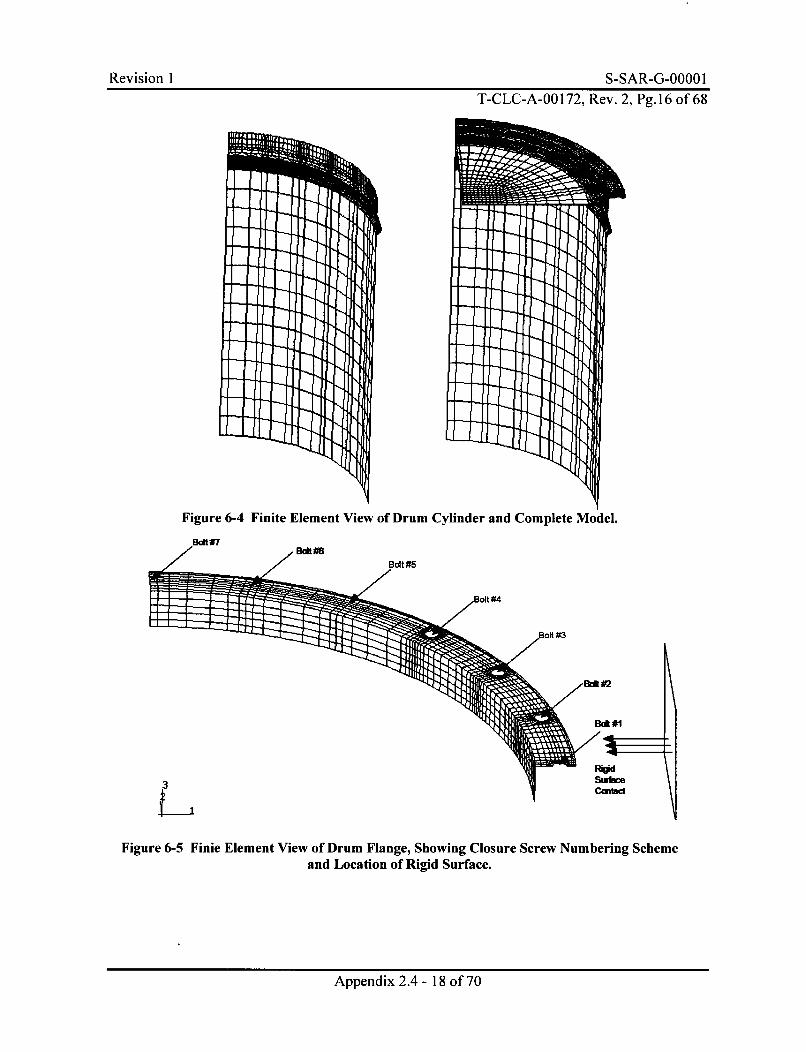
A quarter model is used to represent the full drum. Symmetry boundary conditions are imposed alongone edge of the quarter model, while the other edge has the symmetry condition plus a restraint in thedirection parallel with the drum axis. The imposed deformations are applied along the edge with thepure symmetry condition, as shown in Figure 6-5. This modeling technique is acceptable since theimpact deformation is localized to a limited area of one side of the drum and the influence of hedeformation will not affect the opposite side of the drum. The specific screw hole locations aremodeled in the vicinity of the applied load. Away from the load application point, the model becomesmore coarse and the bolt holes are not explicitly modeled. However, all the attachment screws aremodeled such that the shear and tensile load can be obtained.
ContactABAQUS provides modeling of mechanical contact between bodies. Mechanical contact describescases where bodies may touch or separate during an analysis. Contact is modeled by defining surfaces(or nodes) which may interact. These surfaces are used in Contact Pair definitions, in which onesurface is "slaved" to a "master" surface. Each contact pair is linked to a specific SURFACE[NTERACTION option to describe the interaction effects (e.g. friction, heat).
The package assembly is modeled using frictionless contact, such that the bolts are the only shearconnection between the drum/flange portion and the lid/ring portion of the model. Softened contact isused. The "softened contact" option allows the contact pressure to build once the involved nodes are
Appendix 2.4 - 14 of 70
Revision 1 S-SAR-G-0000 IT-CLC-A-00172, Rev. 2, Pg.13 of 68
within a user specified distance. A stiffness of the surface is also specified with "soft contact". Sincethe shell elements are modeled at their actual centerline, the distance specified in the model is the sumof the half thickness of the slave element and the half thickness of the master element. A stiffnessbased on the plate thickness and elastic modulus is used.
In addition to the contact elements, non-linear, compression only springs were modeled between thesurfaces at the fastener locations. These elements were chosen to simplify the model. Because of therefinement of the mesh at the hole locations, the use of contact surfaces in these areas would haveinvolved too many nodes, creating a penalty in run time and overall performance. The spring stiffnesswas chosen on the same basis as the contact stiffness.
Because contact introduces a severe non-linearity, only the minimum amount of contact surfaces areused. Contact is specified between the flange and lid by partitioning the surface into several regions.The first region is a band along the outer edge of the flange upper surface, which is paired to a similarregion on the lower surface of the lid. The second region is along the inner edge of the matingsurfaces. Additional regions include a portion of the mid-span between each bolt. The regions aresegmented in order to minimize the nodes involved in contact. Because the bolts have been shown toperform well at keeping the components mated together, the small sliding option is used on the flangeto lid surface. With small sliding, ABAQUS minimizes the contact search algorithm by establishing aspecific segment of the master surface for each slave node, versus the more general approach ofsearching an entire region of the master surface for each slave node. Small sliding is appropriate forthis surface, since the surfaces do not exhibit significant relative sliding.
Contact using the large sliding algorithm is also specified between the offset section of the lid, and theinner drum wall.
To apply the load, contact is also specified between a rigid surface representing the drop target andcontacted portions of the drum. These portions of the drum include the top surface of the ring, thebottom surface of the flange, and the upper region of the drum wall. The surfaces are defined to coverthe circumferential distance likely to contact the target surface (,z+/-l 50). The large sliding algorithmis used. No friction is used between the rigid surface and the drum body.
Material PropertiesPlastic material properties are used for the ring, lid, flange, and drum. The bolts are modeled strictlyelastically. The plastic material properties used for the drum assembly are described in section 5.2.
Pre-LoadThe closure screws are modeled explicitly using beam elements. The upper beam end is tied to thering and the lower end is tied to the flange. Pre-load of the screw creates tension in the screw andforces the flange and lid surfaces together. The pre-load is applied by specifying a thermal contractionof the bolt. Since friction effects between the surface are not explicitly modeled, and the screw ismodeled elastically, the actual magnitude of pre-load is not critical to the analysis results. Table 6-4below shows the required temperature change to impose the pre-load on the bolt. Because of theflexibility created by the softened contact, the actual required temperature change will be slightlyhigher than that computed. The following calculations are shown using a 3/8" closure screw, asincorporated in the finite element model. The conclusion of this analysis shows that a larger bolt is
Appendix 2.4 - 15 of 70
Revision I S-SAR-G-00001T-CLC-A-00172, Rev. 2, Pg.14 of 68
required. The model with the smaller screw is still valid in terms of shear loads. As the only shearload path between the lid/ring and the drum/flange are the closure screws, the actual stiffness used willnot influence the load magnitude. The change in tensile pre-load is also not significant, since contactfriction is not incorporated into the model.
Table 6-4Preload Calculations
DT-22 9975Pre-Load F 1350 lbs 1350 lbsBolt Tensile Area A 0.078 in2 0.078 in2Young's Modulus E 29E6 psi 29E6 psiMechanical Strain in Bolt, =(F/A) / E £m 0.000612 0.000612Modeled Thermal Expansion Coefficient a7 in in7.E-6 -- 7.E-6 -
in o F in o FInitial Temperature T, 70 OF 70 OFRequired Temperature change AT -87.4 OF -87.4 OF= Enm/I I
Specified Temperature = T, - AT T -17.4 OF -17.4 OF
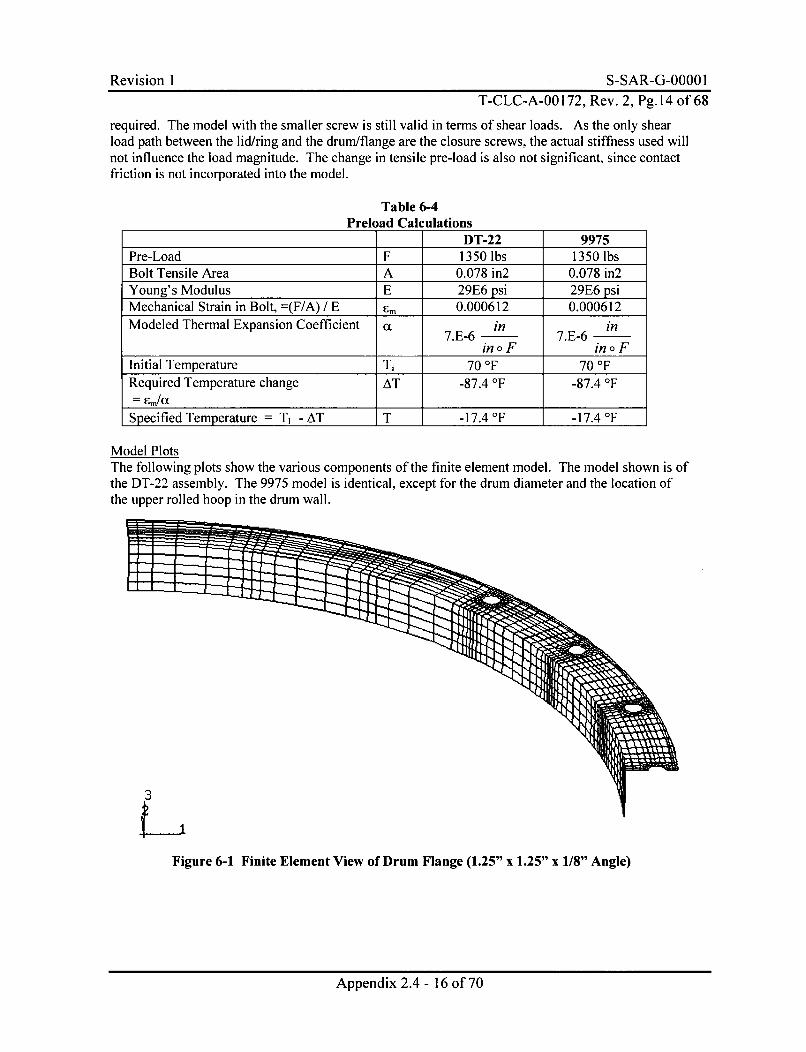
Model PlotsThe following plots show the various components of the finite element model. The model shown is ofthe DT-22 assembly. The 9975 model is identical, except for the drum diameter and the location ofthe upper rolled hoop in the drum wall.
3
Figure 6-1 Finite Element View of Drum Flange (1.25" x 1.25" x 1/8" Angle)
Appendix 2.4 - 16 of 70
Revision I S-SAR-G-00001T-CLC-A-00172, Rev. 2, Pg.15 of 68
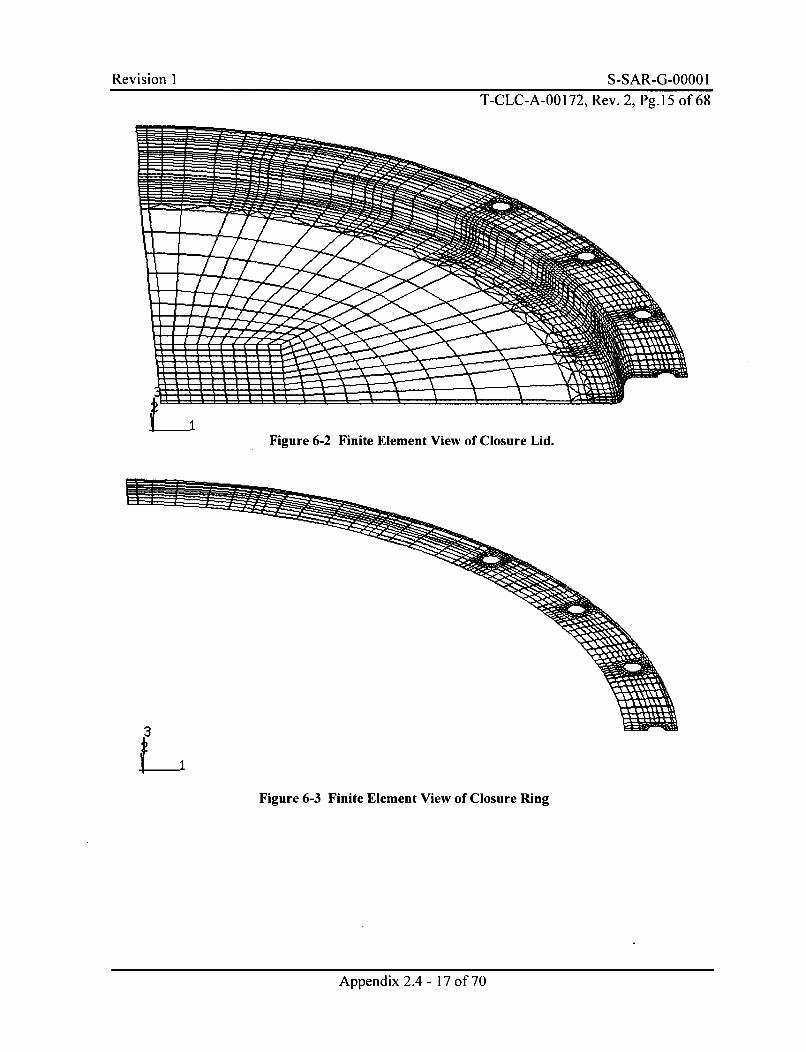
Figure 6-2 Finite Element View of Closure Lid.
3
Figure 6-3 Finite Element View of Closure Ring
Appendix 2.4 - 17 of 70
Revision I S-SAR-G-00001
T-CLC-A-00172, Rev. 2, Pg. 16 of 68
Figure 6-4 Finite Element View of Drum Cylinder and Complete Model.
47
t#4
3 Cmntad
Figure 6-5 Finie Element View of Drum Flange, Showing Closure Screw Numbering Schemeand Location of Rigid Surface.
Appendix 2.4 - 18 of 70
Revision 1 S-SAR-G-0000 1T-CLC-A-00172, Rev. 2, Pg. 17 of 68
6.2.2 Load Cases
Two load cases are analyzed on the overall model for each drum:* Low Angle (horizontal) Impact* 450 Angle Impact
In the low angle impact, the rigid surface is oriented to be parallel to the drum wall. Contact isinitiated at the outer edge of the flange. The overall relative displacement between the drum andsurface is specified to be 2.5 inches from initial contact.
In the 45' angle impact, the rigid surface is placed at the tip of the flange and oriented at 45'. Thedisplacement is specified to simulate 3.5 inches of movement of the surface into the drum at the 45angle. The actual radial and axial displacement at the flange tip will depend on the relative drumassembly stiffnesses in the respective directions.
The analysis procedure is completed in two steps. The first step applies the thermal load to the bolts toprovide pre-load. The second step is a static procedure to displace the drum into the rigid surface.
6.2.3 Results
The results of the FEA drop simulations includes the crush forces as a function of displacement, thebolt tensile and shear loads as a function of displacement and the energy absorbed as a function ofdisplacement. In addition to these quantitative results, the deflected shapes of the crushed drums isshown for a qualitative comparison to the photographs from previous drop test. These results areshown for each drop simulation on both the 9975 assembly with flange and for the DT-22 assembly.
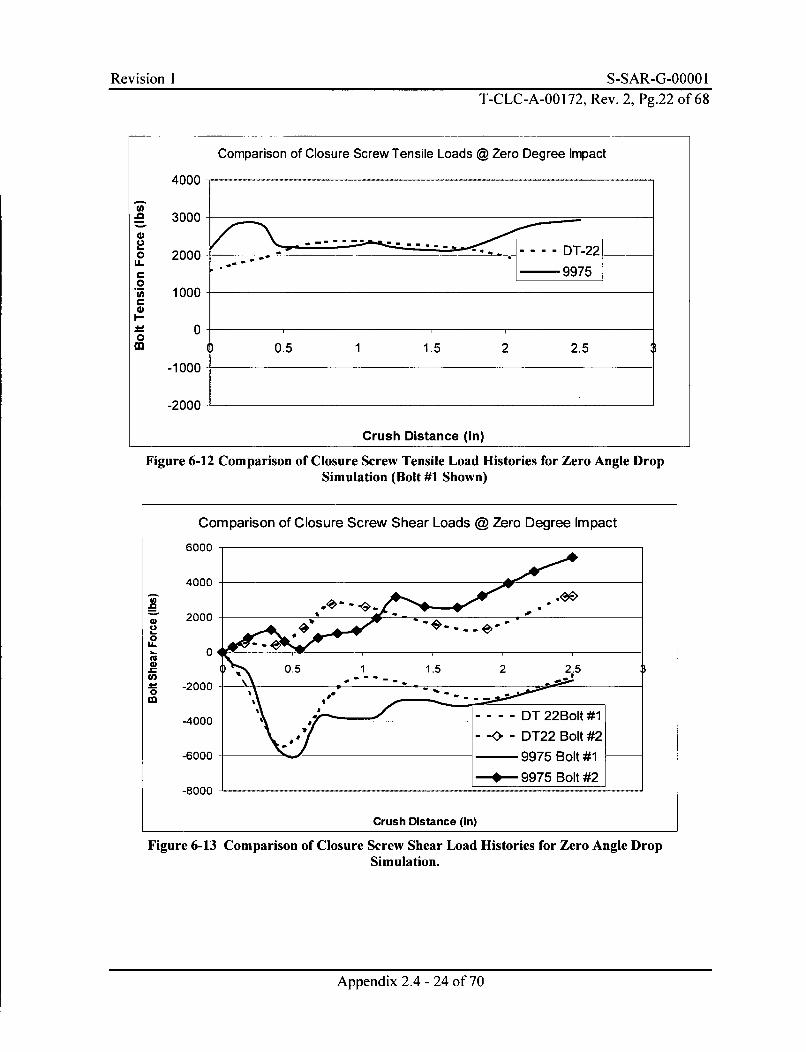
Low Angle Drop SimulationThe results of the crush simulations show the two drums behave similarly in terms of deflected shape.The low angle (Zero degree) drop simulation results in the flange bending upwards, duplicating themode shape indicated in the photographs of existing drop tests. The computer simulation also capturesthe ring buckling between bolts as the ring is forced inward and into compression. The load historiesfor the 9975 drop simulation are shown in figures 6-6 through 6-8. The corresponding results for theDT-22 are shown in figures 6-9 though 6-11. A comparison of the results are shown in Figures 6-12though 6-14. A summary of the results are shown in the following tables. A plot of the displacedshapes are shown in Figures 6-15 though 6-18.
The data for the zero angle simulation shows the 9975 develops more shear force in the screws for agiven crush distance. On both drums, the shear load histories show a couple of peaks and dips, a resultof the assembly passing through the drum wall buckling mode and the lid/ring buckling mode. Thesame variances are seen on the crush load histories. It is also seen that the variance of the tensile loadsis such that a net tensile load is always maintained. The maximum tensile variance for all screws oneither drum was a reduction of less than 500 lbs to an increase of 1200 lbs. Given the nominal valuesof pre-load, (3360 to 3840 lbs for 9975 {see sec 6.5}, t1300 to 1500 lbs DT-22), and the maximumsustainable tensile load of the screws (> 9000 Ibs), the screws are shown to be structurally qualified.
Appendix 2.4 - 19 of 70
Revision I S-SAR-G-00001T-CLC-A-00172, Rev. 2, Pg.18 of 68
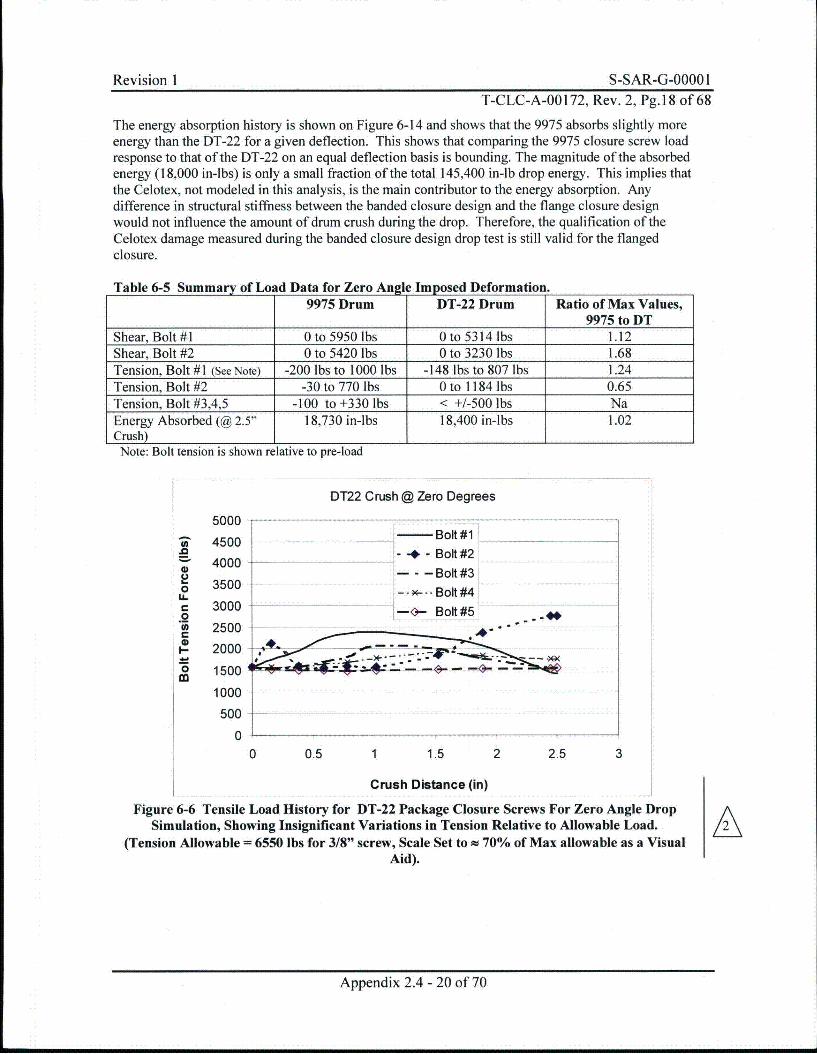
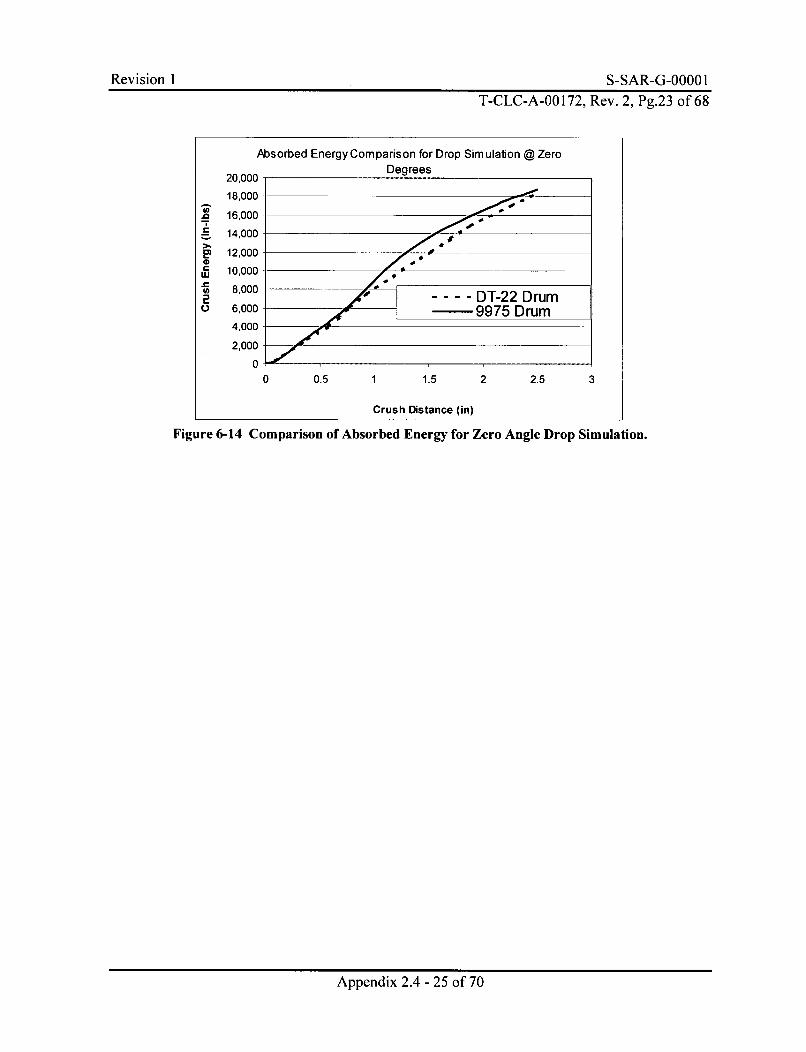
The energy absorption history is shown on Figure 6-14 and shows that the 9975 absorbs slightly moreenergy than the DT-22 for a given deflection. This shows that comparing the 9975 closure screw loadresponse to that of the DT-22 on an equal deflection basis is bounding. The magnitude of the absorbedenergy (18,000 in-lbs) is only a small fraction of the total 145,400 in-lb drop energy. This implies thatthe Celotex, not modeled in this analysis, is the main contributor to the energy absorption. Anydifference in structural stiffness between the banded closure design and the flange closure designwould not influence the amount of drum crush during the drop. Therefore, the qualification of theCelotex damage measured during the banded closure design drop test is still valid for the flangedclosure.
Table 6-5 Summary of Load Data for Zero Angle Imposed Deformation.9975 Drum DT-22 Drum Ratio of Max Values,
9975 to DTShear, Bolt #1 0 to 5950 lbs 0 to 5314 lbs 1.12Shear, Bolt #2 0 to 5420 lbs 0 to 3230 lbs 1.68Tension, Bolt #1 (See Note) -200 lbs to 1000 lbs -148 lbs to 807 lbs 1.24Tension, Bolt #2 -30 to 770 lbs 0 to 1184 lbs 0.65Tension, Bolt #3,4,5 -100 to +330 lbs < +1-500 lbs NaEnergy Absorbed (@ 2.5" 18,730 in-lbs 18,400 in-lbs 1.02Crush)Note: Bolt tension is shown relative to pre-load
DT22 Crush @ Zero Degrees
50004Bolt #1R 4500
4000 --- Bolt #2"" 4000 ot#3500- - - Bolt #30 3500 --- Boft #4
P 3000.2
250
2- 2000 - B # - ._1500 --
1000500
00 0.5 1 1.5 2 2.5 3
Crush Distance (in)
Figure 6-6 Tensile Load History for DT-22 Package Closure Screws For Zero Angle DropSimulation, Showing Insignificant Variations in Tension Relative to Allowable Load.
(Tension Allowable = 6550 lbs for 3/8" screw, Scale Set to r 70% of Max allowable as a VisualAid).
Appendix 2.4 - 20 of 70
Revision I S-SAR-G-0000 IT-CLC-A-00172, Rev. 2, Pg.19 of 68
DT22 Crush @ Zero Degrees
4500
A*
0
0C-
2500
500
-1500
-3500
2 2.5
- Bolt #1
- •* - Bolt#2
--- 6--Bolt#3-5500
-7500
Crush Distance (in)
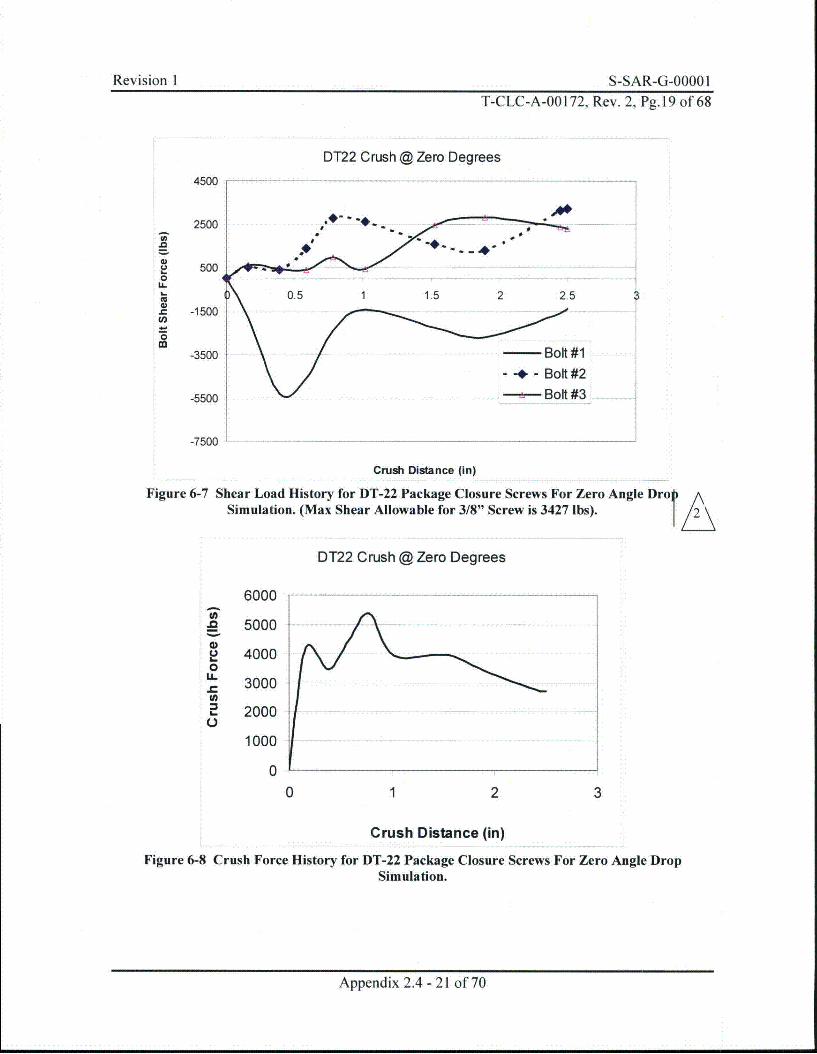
Figure 6-7 Shear Load History for DT-22 Package Closure Screws For Zero Angle DrolASimulation. (Max Shear Allowable for 3/8" Screw is 3427 lbs). t /
DT22 Crush @ Zero Degrees
4)2
0.U-
U10_U-
6000
5000
4000
3000
2000
1000
0
0 1 2 3
Crush Distance (in)
Figure 6-8 Crush Force History for DT-22 Package Closure Screws For Zero Angle DropSimulation.
Appendix 2.4 - 21 of 70
Revision 1 S-SAR-G-00001T-CLC-A-00172, Rev. 2, Pg.20 of 68
9975 (w/ Flange) Crush @ Zero Degrees
In
.0U.U-
C
I-
0M
5000
4500
4000
3500
3000
2500
2000
1500
1000
500
0
Bolt #1
-- ~-Bolt #2- -- Bolt #3
---- Bolt #4-- •Bolt #5 •
0 0.5 1 1.5 2
Crush Distance (in)
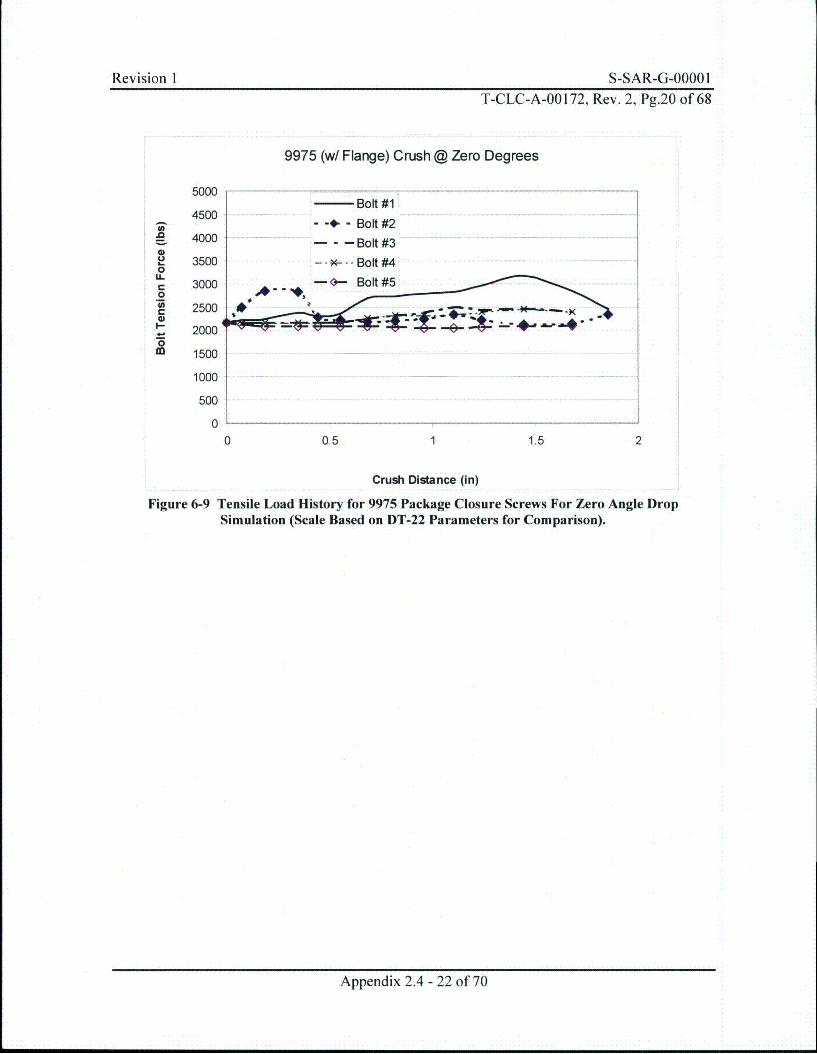
Figure 6-9 Tensile Load History for 9975 Package Closure Screws For Zero Angle DropSimulation (Scale Based on DT-22 Parameters for Comparison).
Appendix 2.4 - 22 of 70
Revision 1 S-SAR-G-.21O 1T-CLC-A-00172, Rev. 2, Pg.21 of 68
9975 (w/ Flange) Crush @ Zero Degrees
0.
0
0,
6000
4000
2000
0
-2000
-4000
-6000
-6000
* S..
* Bolt #1+ - - Bolt #2
1 1.5 2 2.5
Figure 6-10
Crush Distance (in)
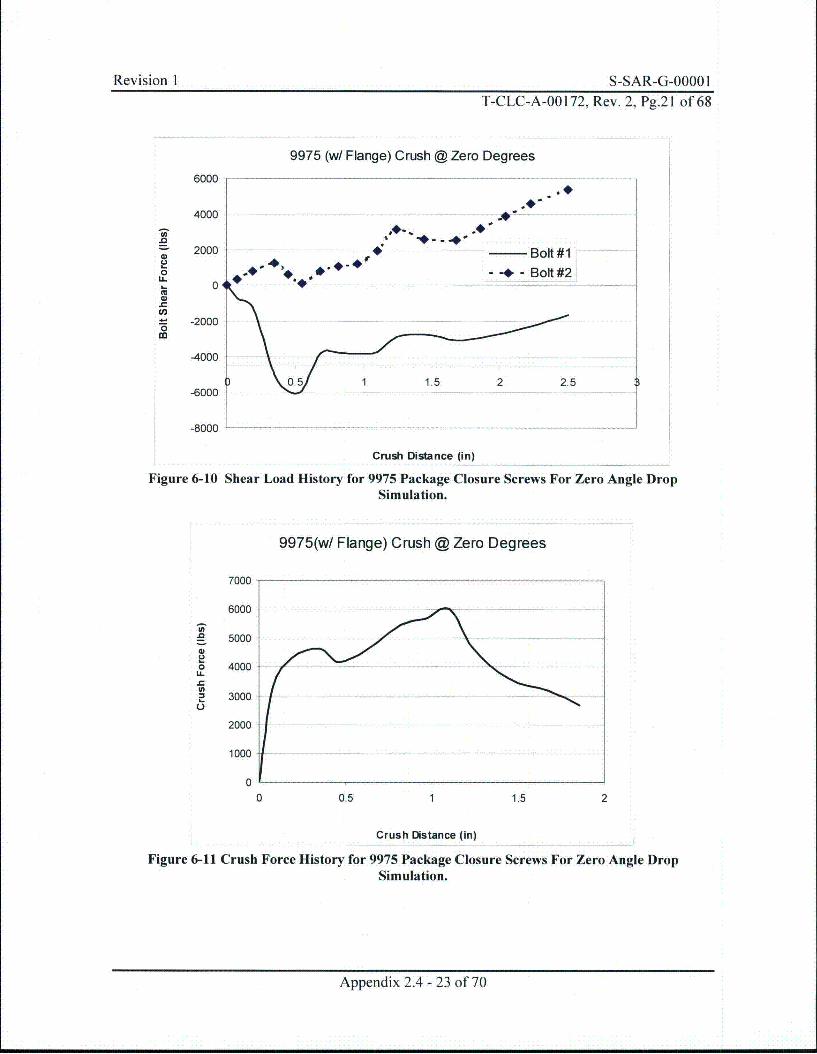
Shear Load History for 9975 Package Closure Screws For Zero Angle DropSimulation.
9975(w/ Flange) Crush @ Zero Degrees
.0
LL
fa)
7000
6000
5000
4000
3000
2000
1000
0
0 0.5 1 1.5 2
Crush Distance (in)
Figure 6-11 Crush Force History for 9975 Package Closure Screws For Zero Angle DropSimulation.
Appendix 2.4 - 23 of 70
Revision I S-SAR-G-0000 IT-CLC-A-00172, Rev. 2, Pg.22 of 68
Comparison of Closure Screw Tensile Loads @ Zero Degree Impact
4000
a 3000
2 .. . . D -2 2o 2000 .- °r- -99750") 1000
0 0 .00 0.5 1 1.5 2 2.5
-1000
-2000
Crush Distance (in)
Figure 6-12 Comparison of Closure Screw Tensile Load Histories for Zero Angle DropSimulation (Bolt #1 Shown)
Comparison of Closure Screw Shear Loads @ Zero Degree Impact
6000
4000
S 2000V
0U.
0 , .5 .1. 1.5 2 2.5CO)
0 -2000 •-.
-4000 DT 22Bolt #1
- -0 - DT22 Bolt #2
-6000 %,-- 9975 Bolt #1
4- 9975 Bolt #2-8000
Crush Distance (in)
Figure 6-13 Comparison of Closure Screw Shear Load Histories for Zero Angle DropSimulation.
Appendix 2.4 - 24 of 70
Revision I S-SAR-G-0000 IT-CLC-A-00172, Rev. 2, Pg.23 of 68
Absorbed Energy Comparison for Drop Sim ulation @ Zero
20,000- Degrees
18,000
16,000
14,000
12,000 -
LU 10,000-1,08,000 • •
0 ---- DT-22 Drum0 6,000 -- - 9975 Drum
4,000
2,000
0 0.5 1 1.5 2 2.5 3
Crush Distance (in)
Figure 6-14 Comparison of Absorbed Energy for Zero Angle Drop Simulation.
Appendix 2.4 - 25 of 70
Revision I S-SAR-G-00001T-CLC-A-00 172, Rev. 2., Pg.24 of 68
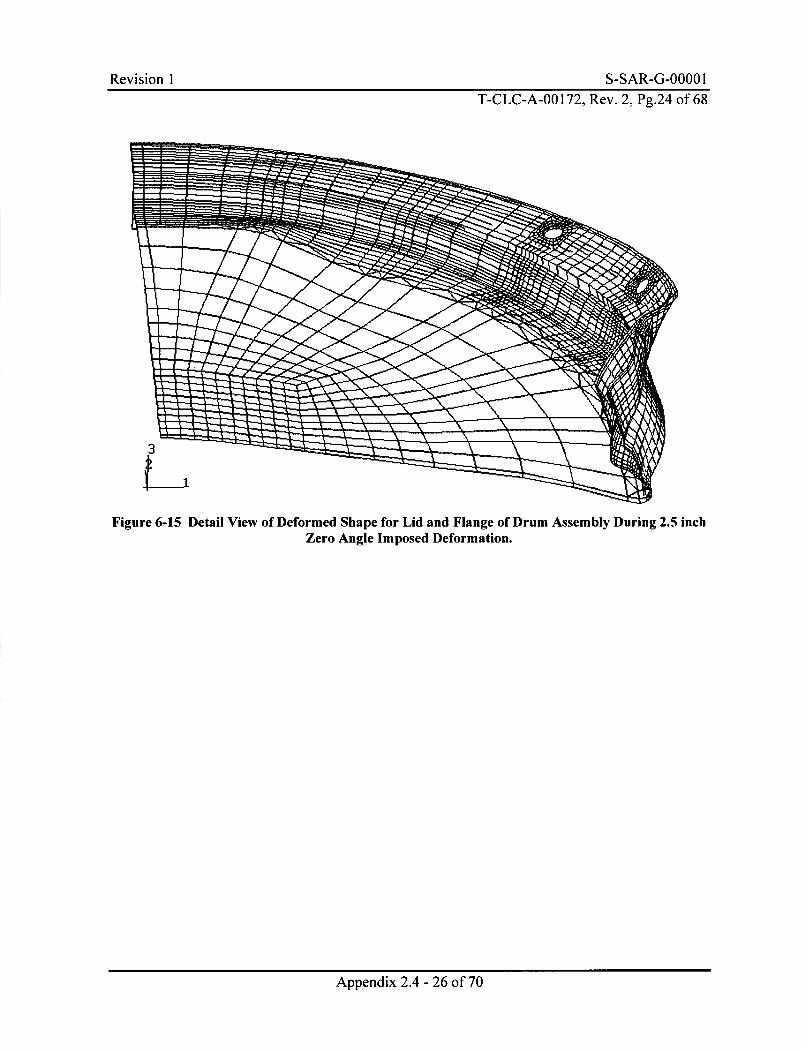
Figure 6-15 Detail View of Deformed Shape for Lid and Flange of Drum Assembly During 2.5 inchZero Angle Imposed Deformation.
Appendix 2.4 - 26 of 70
Revision 1 S-SAR-G-0000 1T-CLC-A-00 172, Rev. 2, Pg.25 of 68
F
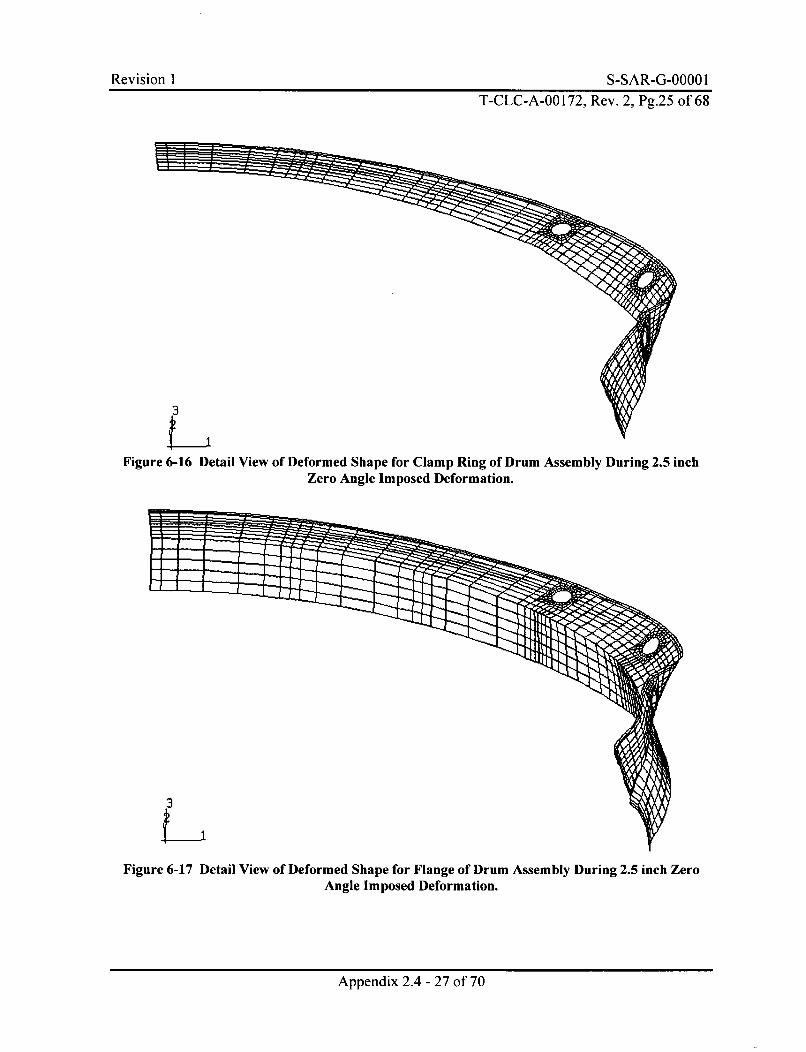
VFigure 6-16 Detail View of Deformed Shape for Clamp Ring of Drum Assembly During 2.5 inch
Zero Angle Imposed Deformation.
Figure 6-17 Detail View of Deformed Shape for Flange of Drum Assembly During 2.5 inch ZeroAngle Imposed Deformation.
Appendix 2.4 - 27 of 70
Revision 1 S-SAR-G-00001T-CLC-A-00172, Rev. 2, Pg.26 of 68
L t kAý4
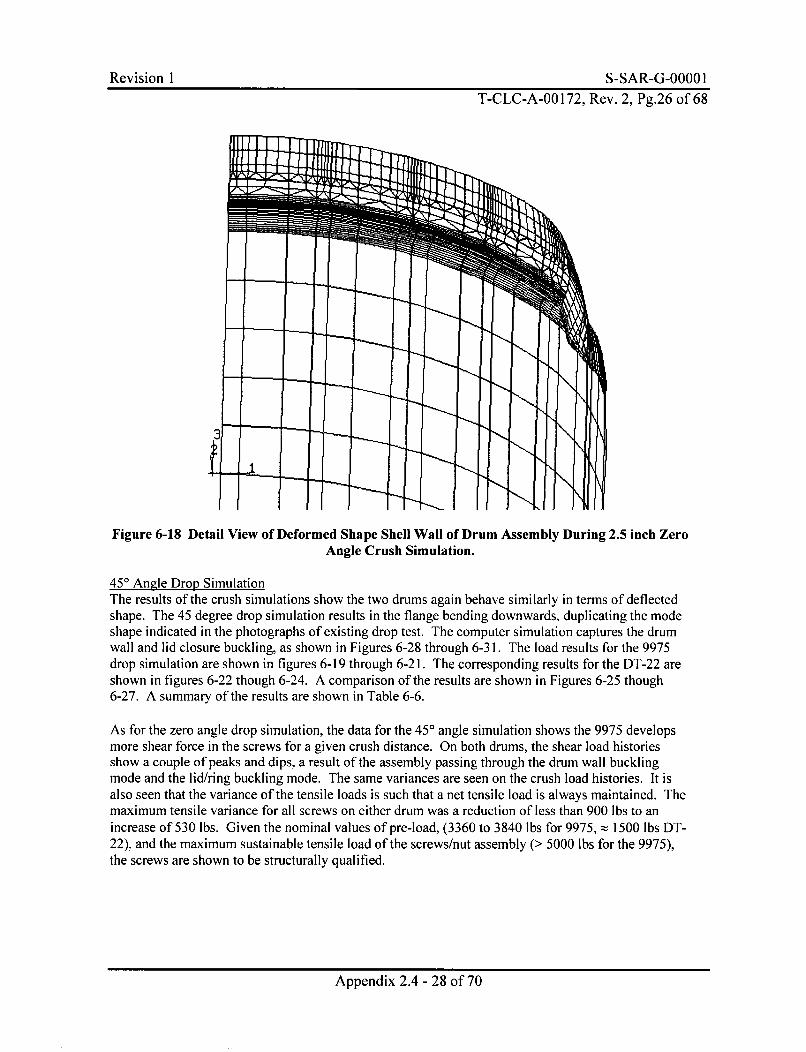
Figure 6-18 Detail View of Deformed Shape Shell Wall of Drum Assembly During 2.5 inch ZeroAngle Crush Simulation.
450 Angle Drop Simulation
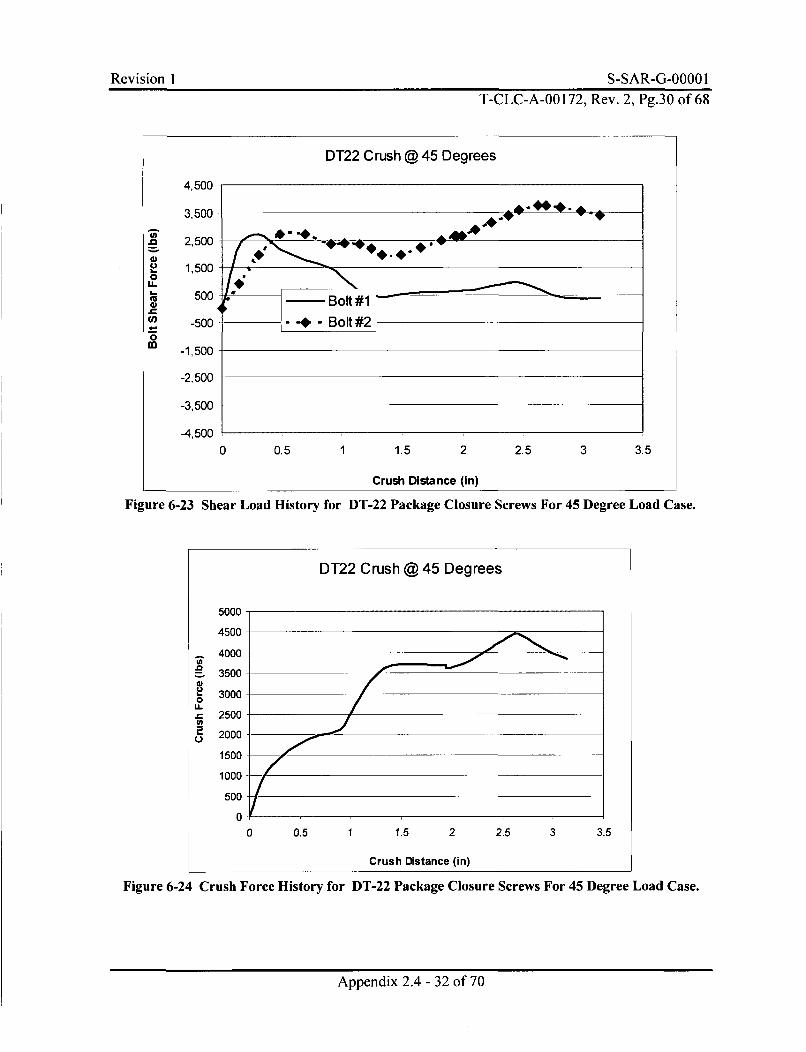
The results of the crush simulations show the two drums again behave similarly in terms of deflectedshape. The 45 degree drop simulation results in the flange bending downwards, duplicating the modeshape indicated in the photographs of existing drop test. The computer simulation captures the drumwall and lid closure buckling, as shown in Figures 6-28 through 6-31. The load results for the 9975drop simulation are shown in figures 6-19 through 6-2 1. The corresponding results for the DT-22 areshown in figures 6-22 though 6-24. A comparison of the results are shown in Figures 6-25 though6-27. A summary of the results are shown in Table 6-6.
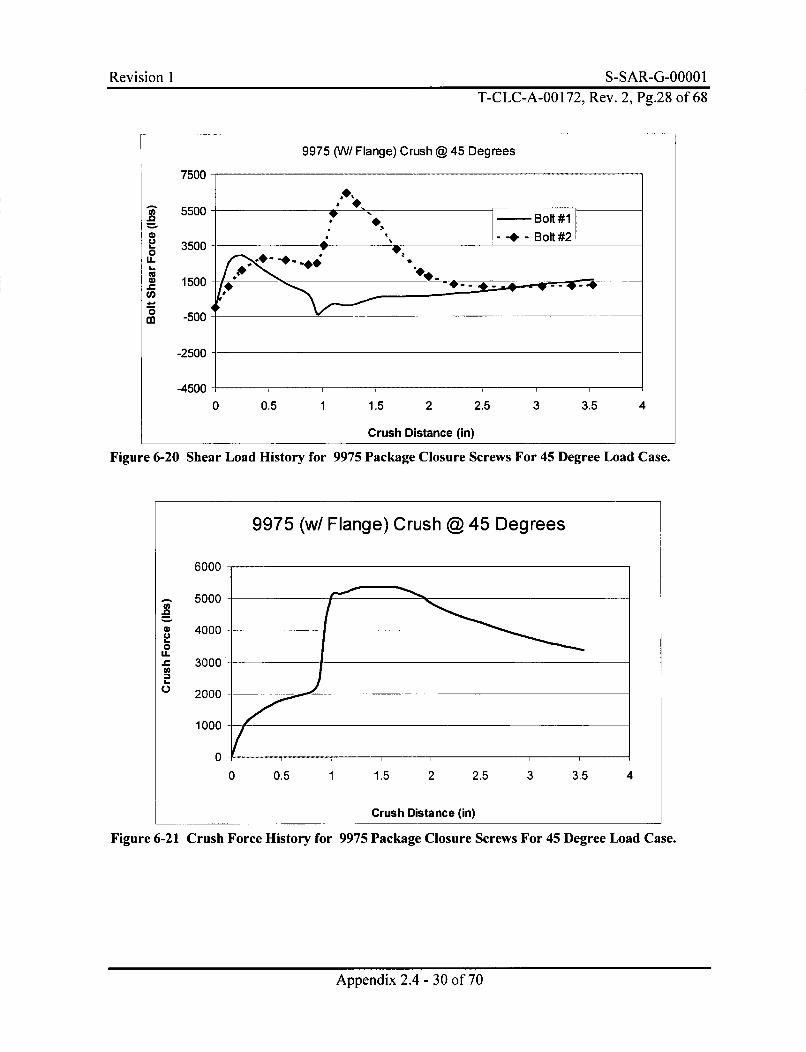
As for the zero angle drop simulation, the data for the 45' angle simulation shows the 9975 developsmore shear force in the screws for a given crush distance. On both drums, the shear load historiesshow a couple of peaks and dips, a result of the assembly passing through the drum wall bucklingmode and the lid/ring buckling mode. The same variances are seen on the crush load histories. It isalso seen that the variance of the tensile loads is such that a net tensile load is always maintained. Themaximum tensile variance for all screws on either drum was a reduction of less than 900 lbs to anincrease of 530 lbs. Given the nominal values of pre-load, (3360 to 3840 lbs for 9975,:: 1500 lbs DT-22), and the maximum sustainable tensile load of the screws/nut assembly (> 5000 lbs for the 9975),the screws are shown to be structurally qualified.
Appendix 2.4 - 28 of 70
Revision 1 S-SAR-G-O000 1T-CLC-A-00172, Rev. 2, Pg.27 of 68
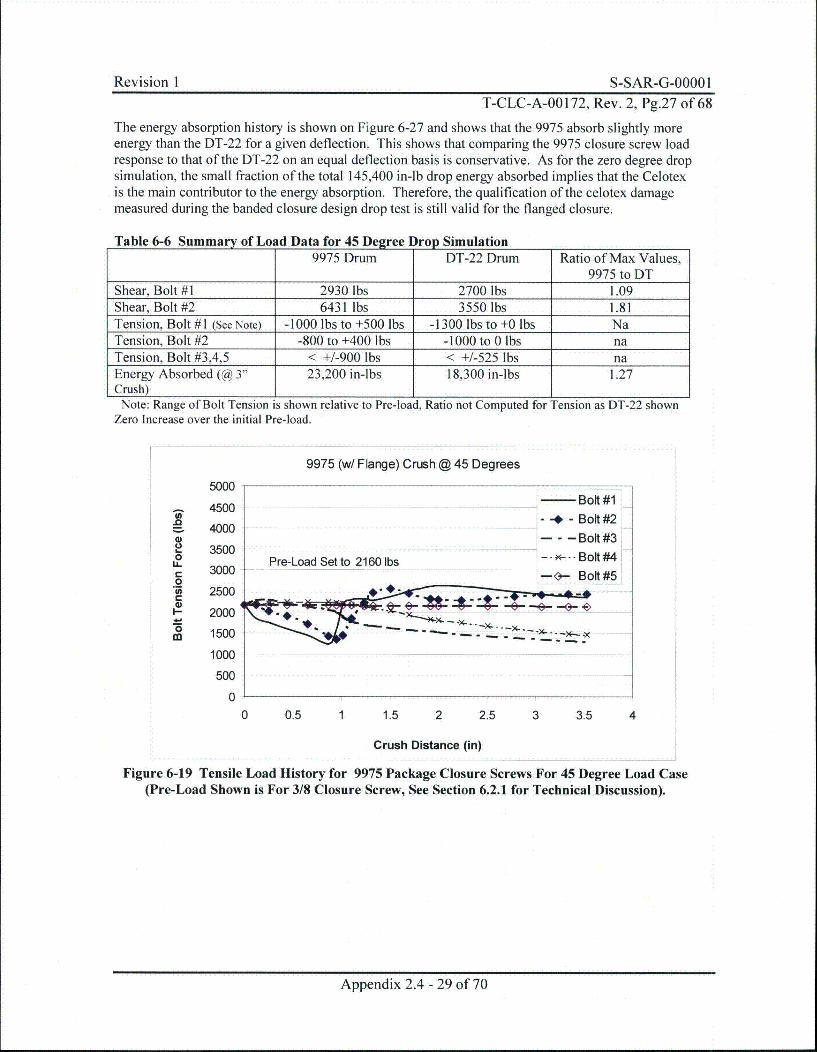
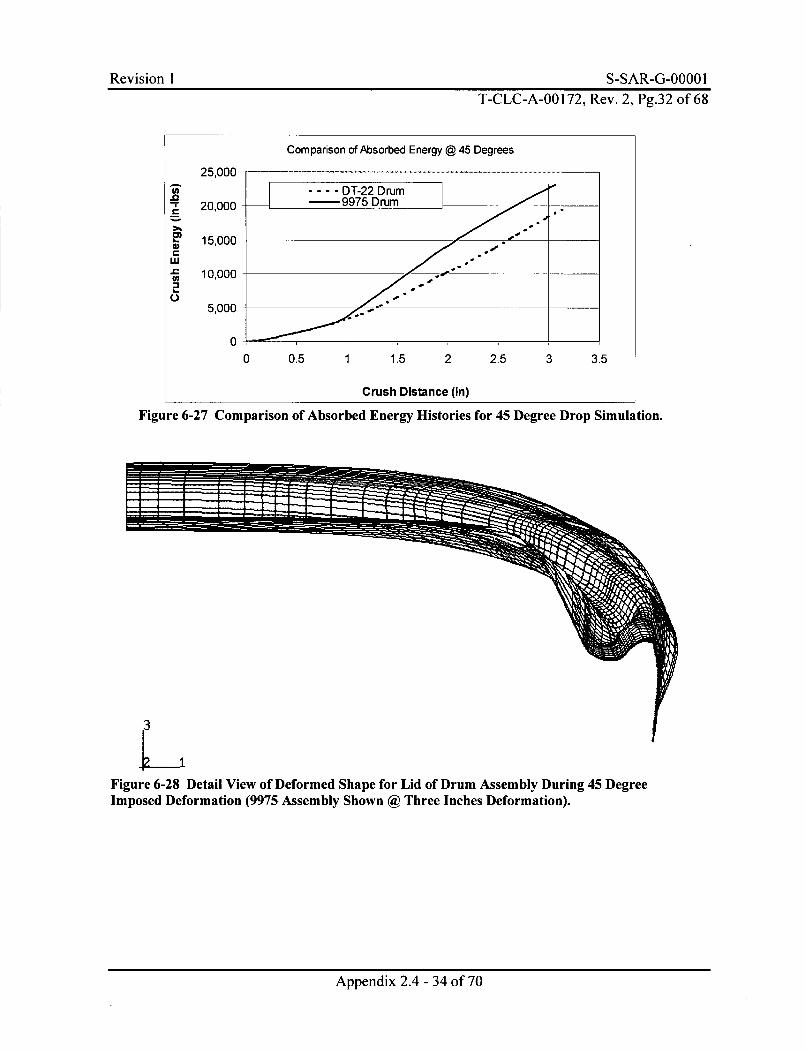
The energy absorption history is shown on Figure 6-27 and shows that the 9975 absorb slightly moreenergy than the DT-22 for a given deflection. This shows that comparing the 9975 closure screw loadresponse to that of the DT-22 on an equal deflection basis is conservative. As for the zero degree dropsimulation, the small fraction of the total 145,400 in-lb drop energy absorbed implies that the Celotexis the main contributor to the energy absorption. Therefore, the qualification of the celotex damagemeasured during the banded closure design drop test is still valid for the flanged closure.
Table 6-6 Summary of Load Data for 45 Degree Drop Simulation9975 Drum DT-22 Drum Ratio of Max Values,
9975 to DTShear, Bolt #1 2930 lbs 2700 lbs 1.09Shear, Bolt #2 6431 lbs 3550 lbs 1.81Tension, Bolt #1 (See Note) -1000 lbs to +500 lbs -1300 lbs to +0 lbs NaTension, Bolt #2 -800 to +400 lbs -1000 to 0 lbs naTension, Bolt #3,4,5 < +/-900 lbs < +/-525 lbs naEnergy Absorbed (@ 3" 23,200 in-lbs 18,300 in-lbs 1.27Crush)
Note: Range of Bolt Tension is shown relative to Pre-load, Ratio not Computed for Tension as DT-22 shownZero Increase over the initial Pre-load.
9975 (w/ Flange) Crush @ 45 Degrees
50004Bolt #1•. 4500 -- Bl#400- - -Bolt #24000
-..- Bolt #3w 35000 -•- Bolt #4:,, Pre-Load Set to 2160 Ibs
I- 2000 --- Bot#
02 1500
M, 1500•. . . . . , .•
1000
500
00 0.5 1 1.5 2 2.5 3 3.5 4
Crush Distance (in)
Figure 6-19 Tensile Load History for 9975 Package Closure Screws For 45 Degree Load Case(Pre-Load Shown is For 3/8 Closure Screw, See Section 6.2.1 for Technical Discussion).
Appendix 2.4 - 29 of 70
Revision 1 S-SAR-G-.28 of
T-CLC-A-00 172, Rev. 2, Pg.28 of 68
9975 (W/ Flange) Crush @ 45 Degrees
7500
7 5500 -.. 4, ,i. Bolt #,
Bolt #21
2 3500 -- o#0
U-
m -500
-2500
-4500 ....
0 0.5 1 1.5 2 2.5 3 3.5 4
Crush Distance (in)
Figure 6-20 Shear Load History for 9975 Package Closure Screws For 45 Degree Load Case.
9975 (w/ Flange) Crush @ 45 Degrees
6000
5000
40000
.C 3000
2000
1000
000
0 0.5 1 1.5 2 2.5 3 3.5 4
Crush Distance (in)
Figure 6-21 Crush Force History for 9975 Package Closure Screws For 45 Degree Load Case.
Appendix 2.4 - 30 of 70
Revision I S-SAR-G-0000 IT-CLC-A-00172, Rev. 2, Pg.29 of 68
DT22 Crush @ 45 Degrees
5000
4500
.4000
235000
30000
" 2500
= 2000
1500
1000
500
00 0.5 1 1.5 2 2.5 3 3.5
Crush Distance (in)
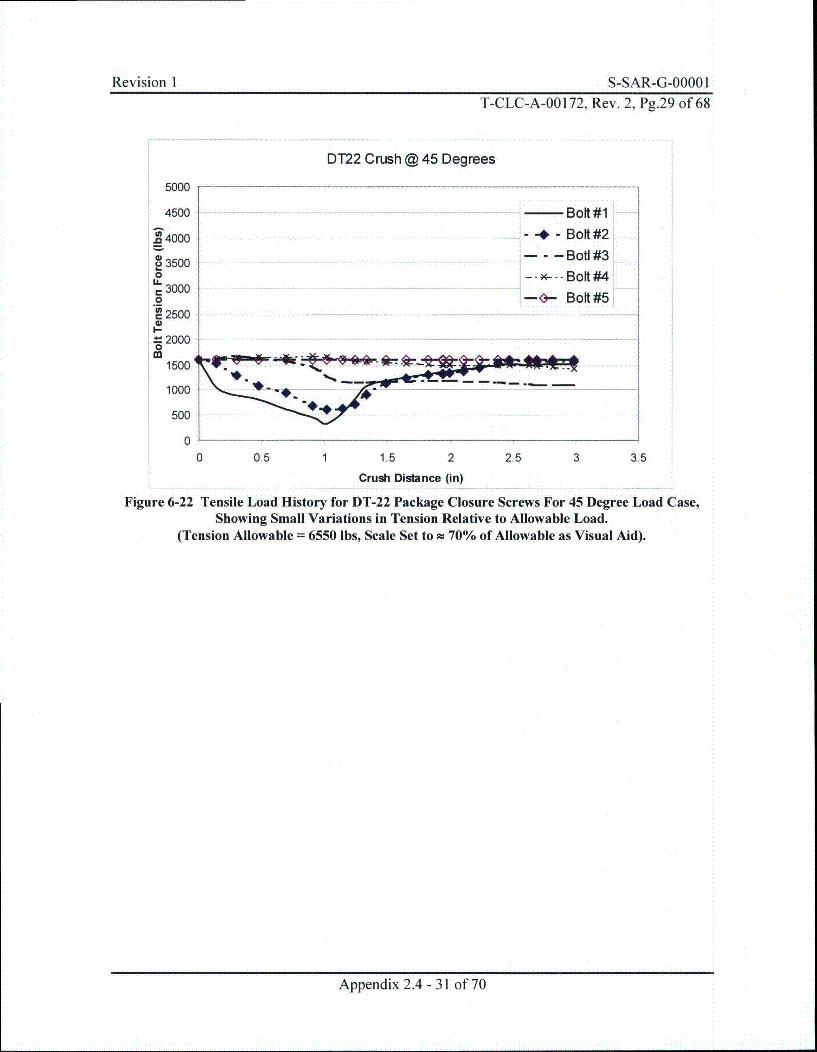
Figure 6-22 Tensile Load History for DT-22 Package Closure Screws For 45 Degree Load Case,Showing Small Variations in Tension Relative to Allowable Load.
(Tension Allowable = 6550 lbs, Scale Set to z 70% of Allowable as Visual Aid).
Appendix 2.4 - 31 of 70
Revision I S-SAR-G-0000 IT-CLC-A-00 172, Rev. 2, Pg.30 of 68
DT22 Crush @ 45 Degrees
4,500
3,500
2,500
1,500
500
-500
-1,500
-2,500
-3,500
-4,5000 0.5 1 1.5 2 2.5 3 3.5
Crush Distance (in)
Figure 6-23 Shear Load History for DT-22 Package Closure Screws For 45 Degree Load Case.
DT22 Crush @ 45 Degrees
0L-
2U
5000
4500
4000
3500
3000
2500
2000
1500
1000
500
0
0 0.5 1 1.5 2
Crush Distance (in)
2.5 3 3.5
Figure 6-24 Crush Force History for DT-22 Package Closure Screws For 45 Degree Load Case.
Appendix 2.4 - 32 of 70
Revision I S-SAR-G-00001T-CLC-A-00 172, Rev. 2, Pg.31 of 68
Comparison of Closure Screw Tensile Loads @ 45 Degree Impact
3000
.o 2500 -
0 2000
U-
0."A 1500
ooo F-. _----DT-22 Bolt #1
. . --- 9975 Bolt #2
50o - - 9975 Bolt#1- -. - DT-22 Bolt #2
0-0 0.5 1 1.5 2 2.5 3
Crush Distance (in)
3.5
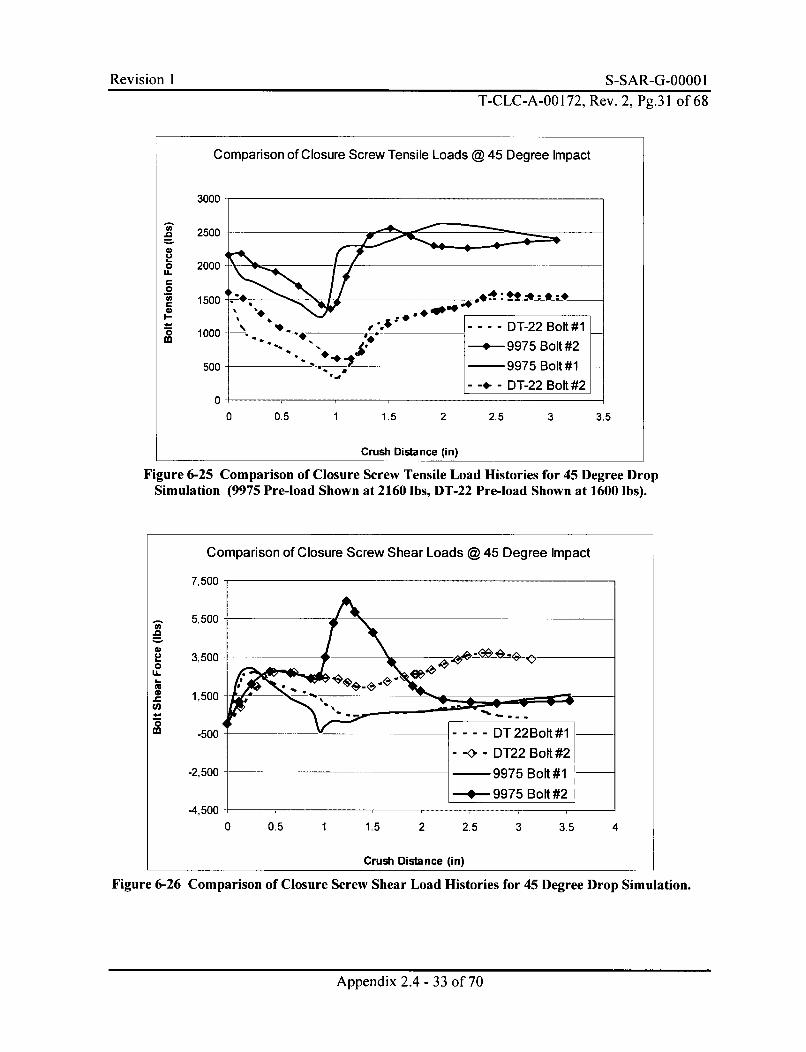
Figure 6-25 Comparison of Closure Screw Tensile Load Histories for 45 Degree DropSimulation (9975 Pre-load Shown at 2160 Ibs, DT-22 Pre-load Shown at 1600 lbs).
Comparison of Closure Screw Shear Loads @ 45 Degree Impact
7,500
5,500 -
3, 500 ... D2Bl#
.0
Iwo 0 t--4 995 ol*#
1 ,500
0
-<>K - DT22 Boft#2-2,500- - 9975 Bolt#1
-4-- 9975 Bolt #2-4,500 1..
0 0.5 1 1.5 2 2.5 3 3.5 4
Crush Distance (in)
Figure 6-26 Comparison of Closure Screw Shear Load Histories for 45 Degree Drop Simulation.
Appendix 2.4 - 33 of 70
Revision I S-SAR-G-0000 IT-CLC-A-00 172, Rev. 2., Pg.32 of 68
Comparison of Absorbed Energy @ 45 Degrees
I-.
2U-
25,000
20,000
15,000
10,000
5,000
00 0.5 1 1.5 2 2.5 3 3.5
Crush Distance (in)
Figure 6-27 Comparison of Absorbed Energy Histories for 45 Degree Drop Simulation.
3
Figure 6-28 Detail View of Deformed Shape for Lid of Drum Assembly During 45 DegreeImposed Deformation (9975 Assembly Shown @ Three Inches Deformation).
Appendix 2.4 - 34 of 70
Revision I S-SAR-G-00001T-CLC-A-00172, Rev. 2. Pg.33 of 68
3
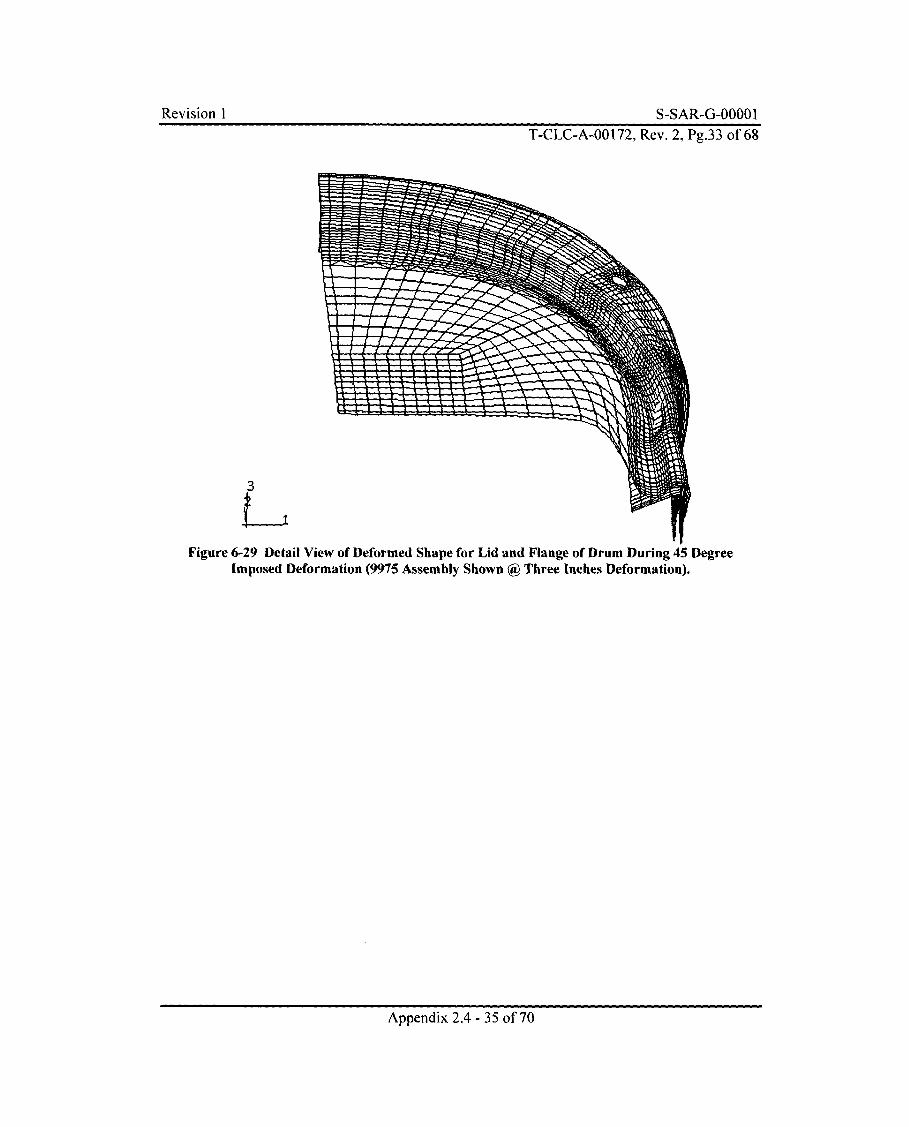
Figure 6-29 Detail View of DeformiImposed Deformation (9975
Appendix 2.4 - 35 of 70
Revision I S-SAR-G-O0001
T-CLC-A-00 172, Rev. 2, Pg.34 of 68
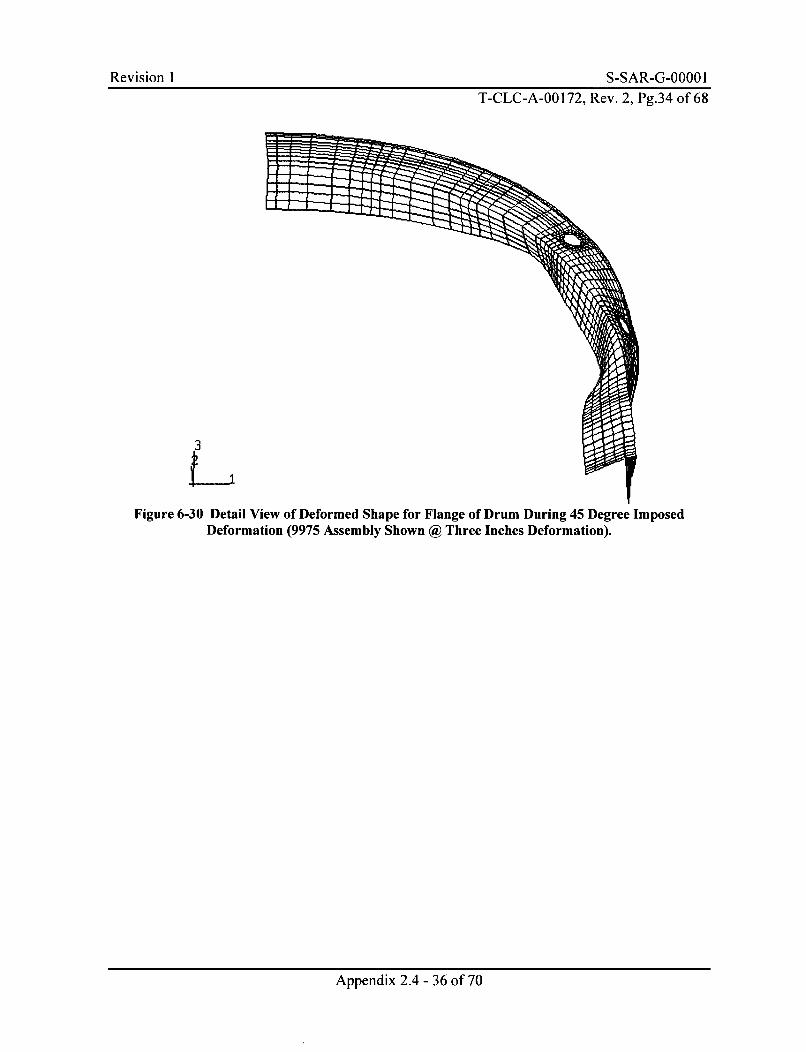
Figure 6-30 Detail View of Deformed Shape for Flange of Drum During 45 Degree ImposedDeformation (9975 Assembly Shown @ Three Inches Deformation).
Appendix 2.4 - 36 of 70
Revision I S-SAR-G-00001
T-CLC-A-00 172, Rev. 2, Pg.35 of 68
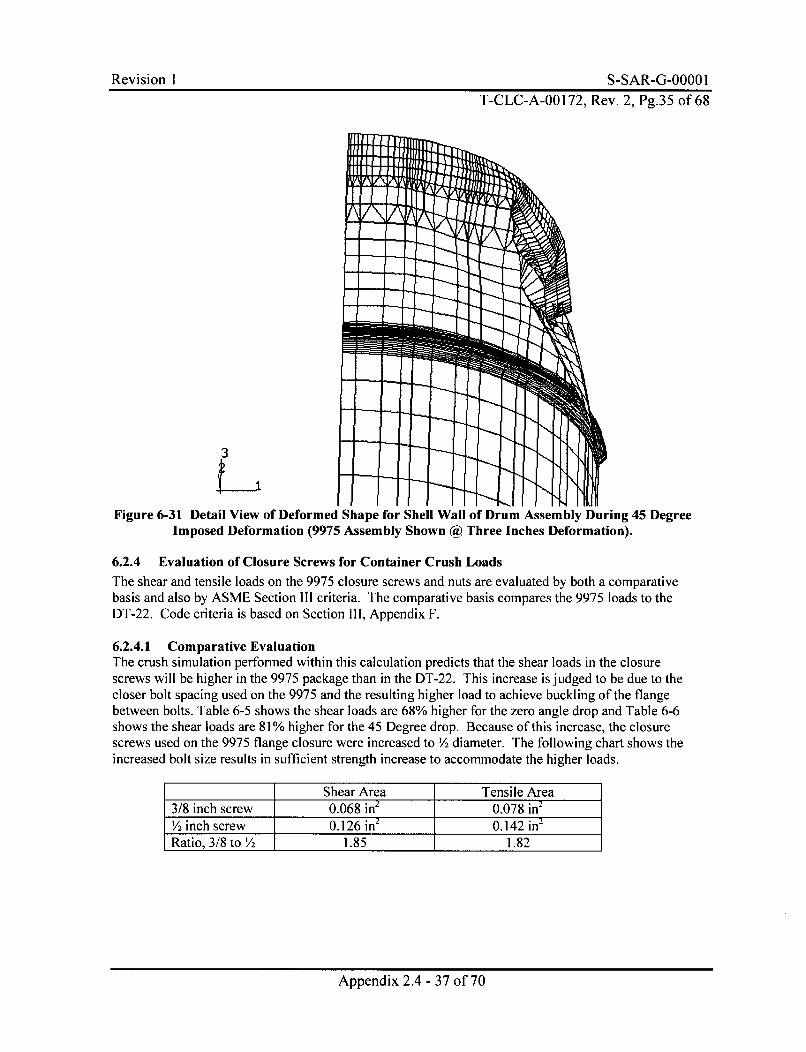
Figure 6-31 Detail View of Deformed Shape for Shell Wall of Drum Assembly During 45 DegreeImposed Deformation (9975 Assembly Shown @ Three Inches Deformation).
6.2.4 Evaluation of Closure Screws for Container Crush LoadsThe shear and tensile loads on the 9975 closure screws and nuts are evaluated by both a comparativebasis and also by ASME Section III criteria. The comparative basis compares the 9975 loads to theDT-22. Code criteria is based on Section III, Appendix F.
6.2.4.1 Comparative EvaluationThe crush simulation performed within this calculation predicts that the shear loads in the closurescrews will be higher in the 9975 package than in the DT-22. This increase is judged to be due to thecloser bolt spacing used on the 9975 and the resulting higher load to achieve buckling of the flangebetween bolts. Table 6-5 shows the shear loads are 68% higher for the zero angle drop and Table 6-6shows the shear loads are 81% higher for the 45 Degree drop. Because of this increase, the closurescrews used on the 9975 flange closure were increased to ½/ diameter. The following chart shows theincreased bolt size results in sufficient strength increase to accommodate the higher loads.
Shear Area Tensile Area3/8 inch screw 0.068 in2 0.078 in2
' 2 inch screw 0.126 in2 0.142 in2
Ratio, 3/8 to '/2 1.85 1.82
Appendix 2.4 - 37 of 70
Revision 1 S-SAR-G-0000 1T-CLC-A-00172, Rev. 2, Pg.36 of 68
6.2.4.2 Code EvaluationIn addition to the comparative evaluation of the closure screw loads, the shear and tensile loads areevaluated to ASME B&PV Code Section III Appendix F acceptance criteria. The Code specifiedlimits based on both ultimate and yield strengths. For the bolt material, the ultimate strength controls:
Shear = lesser of 42% of Ultimate, 70% Yield = 0.42 * 120,000 psi = F, = 50,400 psiTension => lesser of 70% of Ultimate, 100% Yield = 0.70 * 120,000 psi = F,= 84,000 psi
Combined=> K2 + fl. <IF, F2
Closure Screws - Zero Degree DropTable 6-5 shows that the bolt nearest the impact point is the highest loaded bolt. The shear load is5950 lbs and the tension load increases to 1000 lbs above the pre-load value. The maximum pre-loadis determined to be 3,840 lbs (section 6.5)
Shear Stress = 5090 lbs / 0.126 in2 = 40,397 psi (less than allowable of 50,400 psi)Tension Stress = 1000 lbs / 0.142 in2 = 7,042 psi (less than allowable of 84,000 psi)
Comind~ 70422 403972_Cobined 0 2 +5400 - 0.65 < 1 (Meets the combined interaction equation)14, 0002 +50,400'
Closure Screws - 45 Degree DropTable 6-6 shows that the highest loaded bolt is bolt #2, the one adjacent to the point of impact. Theshear load is 6431 lbs and the tension load increases to 400 lbs above the pre-load value. Themaximum pre-load is determined to be 3,840 lbs (section 6.5)
Shear Stress = 6431 lbs / 0.126 in2 =51,039 psi (just above the allowable of 50,400 psi)Tension Stress = 400 lbs / 0.142 in2 = 2,817 psi (less than allowable of 84,000 psi)
2,8172 51,0392Combined= 284,02 + 5, = 1.027 > 1
84,'0002 50,4002
The Code evaluation shows that the predicted bolt loads exceed Code allowables by less than 3%. Thebolted flange closure is judged to be acceptable because:" The comparative evaluation shows the 9975 meets the performance target of the DT-22" The overstress would occur only on 2 non-adjacent bolts of the total of 24 bolts." The predicted stress level is below the ultimate capacity of the bolt material by more than 25%.
Screw-NutsThe threads of the welded nut are evaluated for the imposed tensile loads. The maximum tensile loadobtained from the imposed formation load cases is an increase of 1000 lbs above the initial pre-load.The allowable load is limited to the shear out of the nut threads controlled by ultimate shear strengthof the nut. The nut shear out area is 0.462 in2 (see Section 6.5)
Load = Pre-Load + Enveloping increase of 1000 lbs = 3840 + 1000 lb. = 4840 lb.Allowable = 42% * 60,000 psi * .462in 2
= 11,642 lbThe actual load of 4840 lbs is less than the 11,642 lb allowable.
Appendix 2.4 - 38 of 70
Revision 1 S-SAR-G-00001T-CLC-A-00 172, Rev. 2, Pg.37 of 68
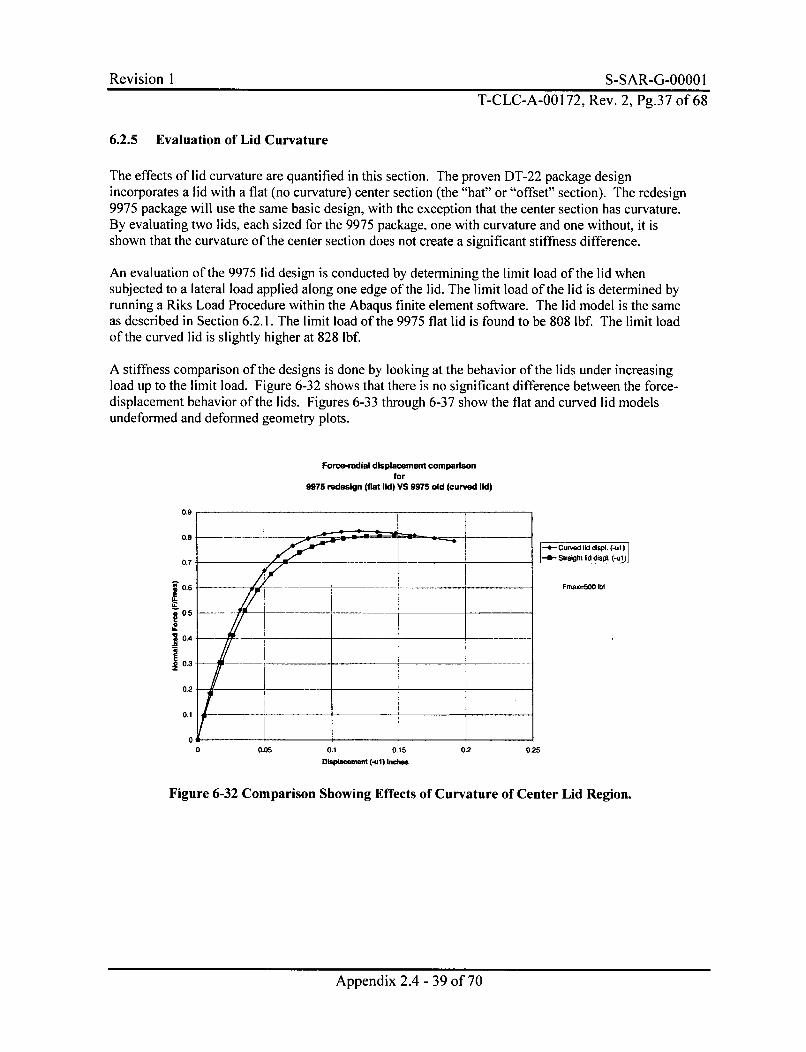
6.2.5 Evaluation of Lid Curvature
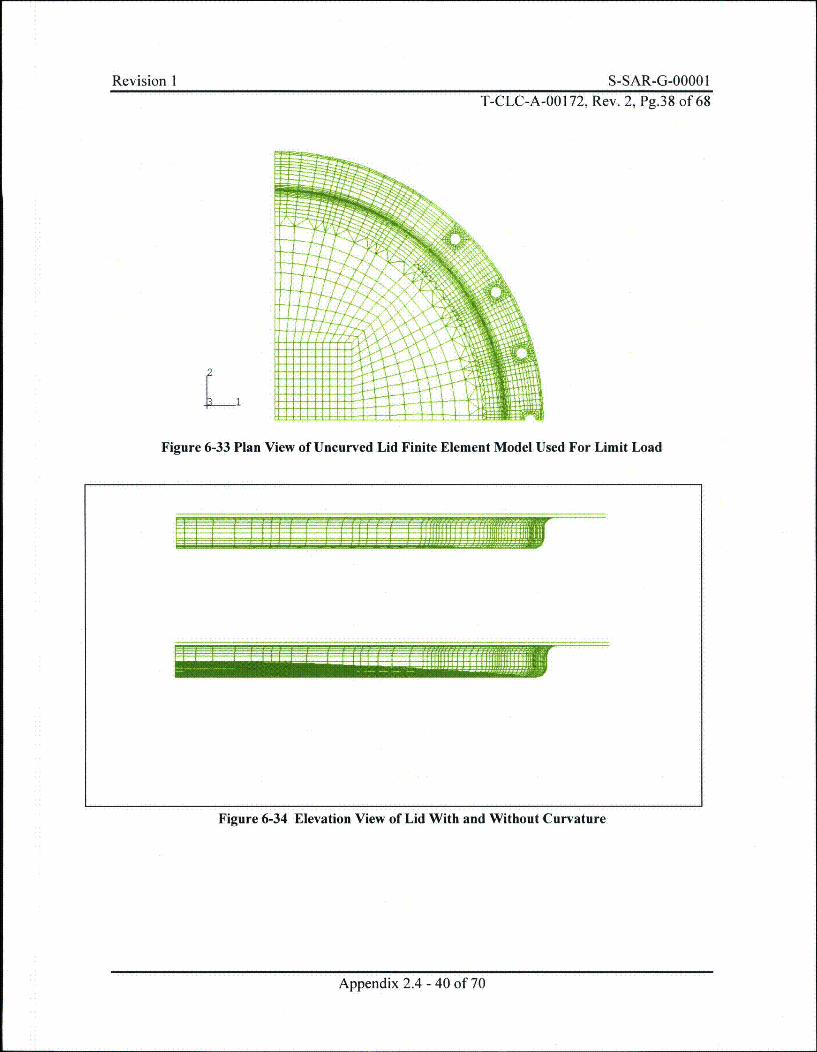
The effects of lid curvature are quantified in this section. The proven DT-22 package designincorporates a lid with a flat (no curvature) center section (the "hat" or "offset" section). The redesign9975 package will use the same basic design, with the exception that the center section has curvature.By evaluating two lids, each sized for the 9975 package, one with curvature and one without, it isshown that the curvature of the center section does not create a significant stiffness difference.
An evaluation of the 9975 lid design is conducted by determining the limit load of the lid whensubjected to a lateral load applied along one edge of the lid. The limit load of the lid is determined byrunning a Riks Load Procedure within the Abaqus finite element software. The lid model is the sameas described in Section 6.2.1. The limit load of the 9975 flat lid is found to be 808 lbf. The limit loadof the curved lid is slightly higher at 828 lbf.
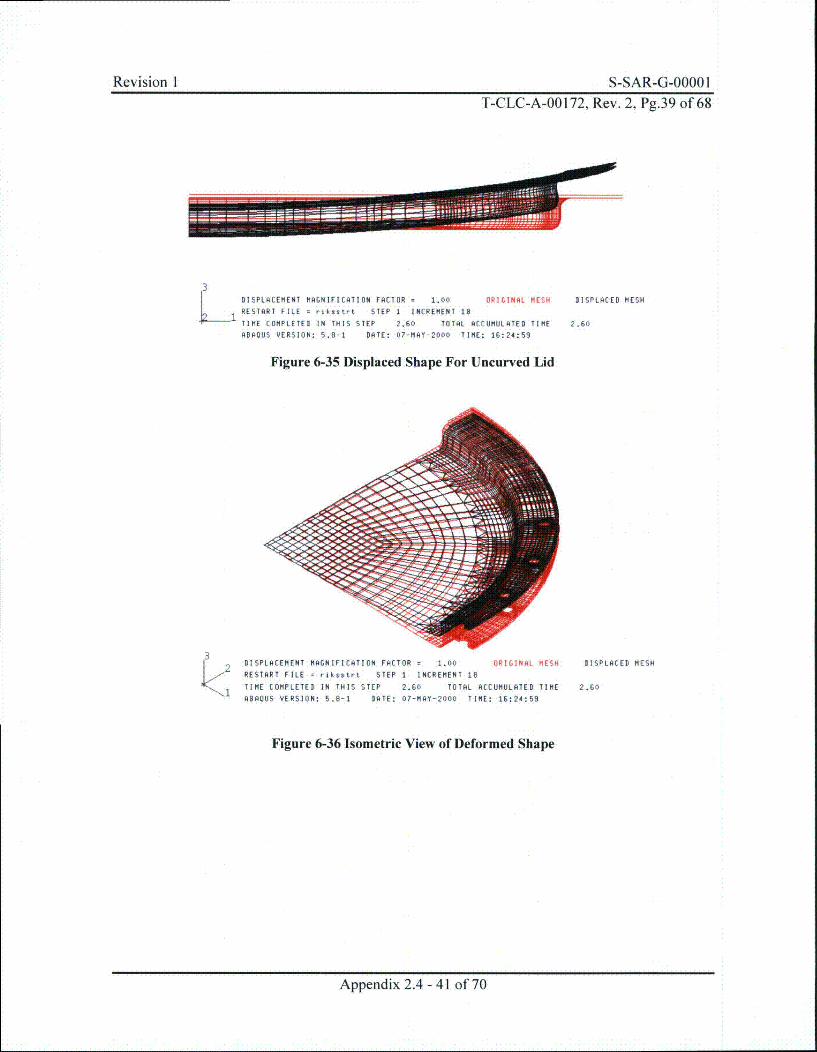
A stiffness comparison of the designs is done by looking at the behavior of the lids under increasingload up to the limit load. Figure 6-32 shows that there is no significant difference between the force-displacement behavior of the lids. Figures 6-33 through 6-37 show the flat and curved lid modelsundeformed and deforned geometry plots.
Force-radial displacement comparisonfor
9975 redesign (flat lid) VS 9975 old (curved lid)
0.9 _ _ _
0.- - Cuyved i, d displ. (-ut)
0.7- Straight id dispi. (-ul)
0.6 Fnia__0 __ _ __b!_ __ _
0.5
0.4
0.3
020.1 0
0 0.05 0.1 0.15 0.2 0.25
Displacement (-ul) inches
Figure 6-32 Comparison Showing Effects of Curvature of Center Lid Region.
Appendix 2.4 - 39 of 70
Revision I S-SAR-G-0000 IT-CLC-A-00172, Rev. 2, Pg.38 of 68
I
L1
7 ~ I ~~ ~*I 1*~* ii
Figure 6-33 Plan View of Uncurved Lid Finite Element Model Used For Limit Load
w~ 75772.''§7
Figure 6-34 Elevation View of Lid With and Without Curvature
Appendix 2.4 - 40 of 70
Revision I S-SAR-G-0000 IT-CLC-A-00172, Rev. 2, Pg.39 of 68
3
L1
DISPLACEMENT MAGNIFICATION FACTOR 1.00 ORIGINAL MESHRESTART FILE riksstrt STEP 1 INCREMENT 18
TIME COMPLETED IN THIS STEP 2.60 TOTAL ACCUMULATED TIMEADAQUS VERSION: 5.8-1 DATE: 07-MAY-2000 TIME: 16:24:59
Figure 6-35 Displaced Shape For Uncurved Lid
DISPLACED MESH
2 .60
2
1
DISPLACEMENT MAGNIFICATION FACTOR = 1.00 ORIGINAL MESH
RESTART FILE = rlksstrt STEP 1 INCREMENT 18
TIME COMPLETED IN THIS STEP 2.60 TOTAL ACCUMULATED TIME
ADAOUS VERSION: 5.8-1 DATE: 07-MAY-2000 TIME: 16:24:59
Figure 6-36 Isometric View of Deformed Shape
DISPLACED MESH
2.60
Appendix 2.4 - 41 of 70
Revision I S-SAR-G-00001T-CLC-A-00 172, Rev. 2, Pg.40 of 68
_.Mwwooo
Now=
rv
3
DISPLACENENT NAGNIFICATION FACTOR 1.00 ORIGINAL MESH DISPLACED MESHRESTART FILE = liecur STEP 1 INCREMENT 18TINE COMPLETED IN THIS STEP 2.60 TOTAL ACCUNULATED TIME 2.60ABAOUS VERSION: 5.8-1 DATE: O8-NAY-2000 TINE: 11:36:38
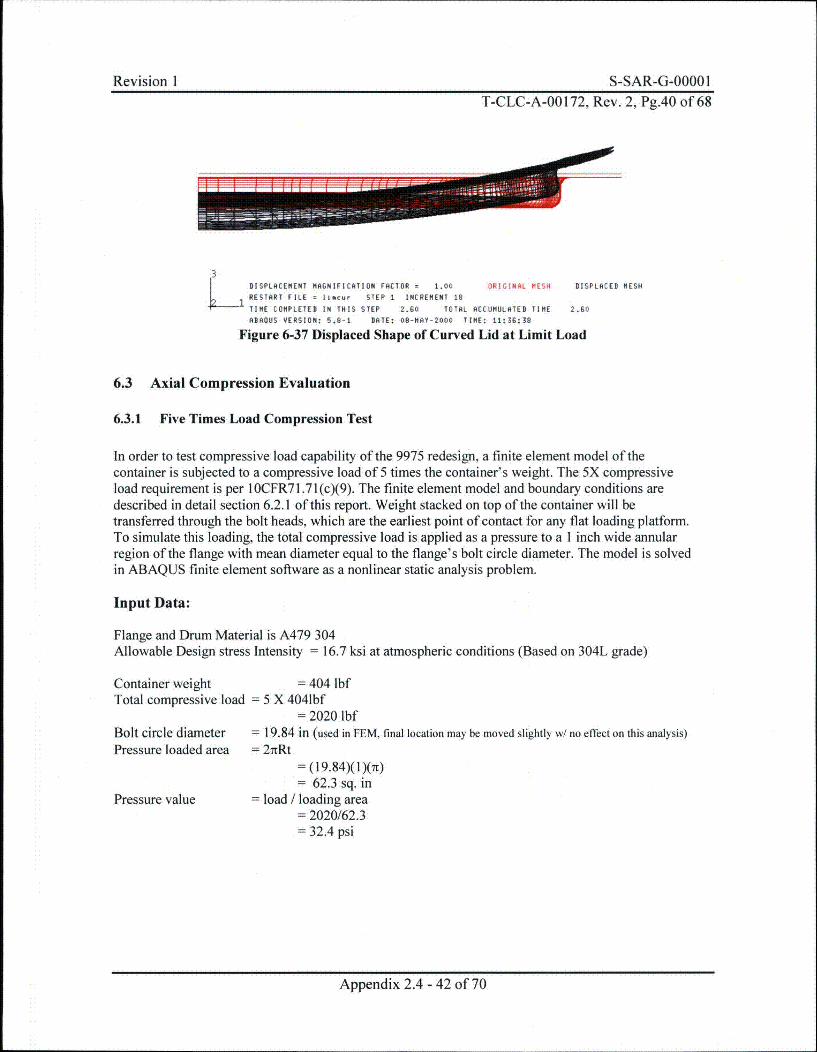
Figure 6-37 Displaced Shape of Curved Lid at Limit Load
6.3 Axial Compression Evaluation
6.3.1 Five Times Load Compression Test
In order to test compressive load capability of the 9975 redesign, a finite element model of thecontainer is subjected to a compressive load of 5 times the container's weight. The 5X compressiveload requirement is per 1 OCFR71.71 (c)(9). The finite element model and boundary conditions aredescribed in detail section 6.2.1 of this report. Weight stacked on top of the container will betransferred through the bolt heads, which are the earliest point of contact for any flat loading platform.To simulate this loading, the total compressive load is applied as a pressure to a 1 inch wide annularregion of the flange with mean diameter equal to the flange's bolt circle diameter. The model is solvedin ABAQUS finite element software as a nonlinear static analysis problem.
Input Data:
Flange and Drum Material is A479 304Allowable Design stress Intensity = 16.7 ksi at atmospheric conditions (Based on 304L grade)
Container weightTotal compressive load
Bolt circle diameterPressure loaded area
Pressure value
= 404 lbf= 5 X 4041bf
= 2020 lbf= 19.84 in (used in FEM, final location may be moved slightly w/ no effect on this analysis)
= 21tRt= (19.84)(1)(7t)= 62.3 sq. in
= load / loading area= 2020/62.3= 32.4 psi
Appendix 2.4 - 42 of 70
Revision 1 S-SAR-G-0000 IT-CLC-A-00172, Rev. 2, Pg.41 of 68
Results Summary:
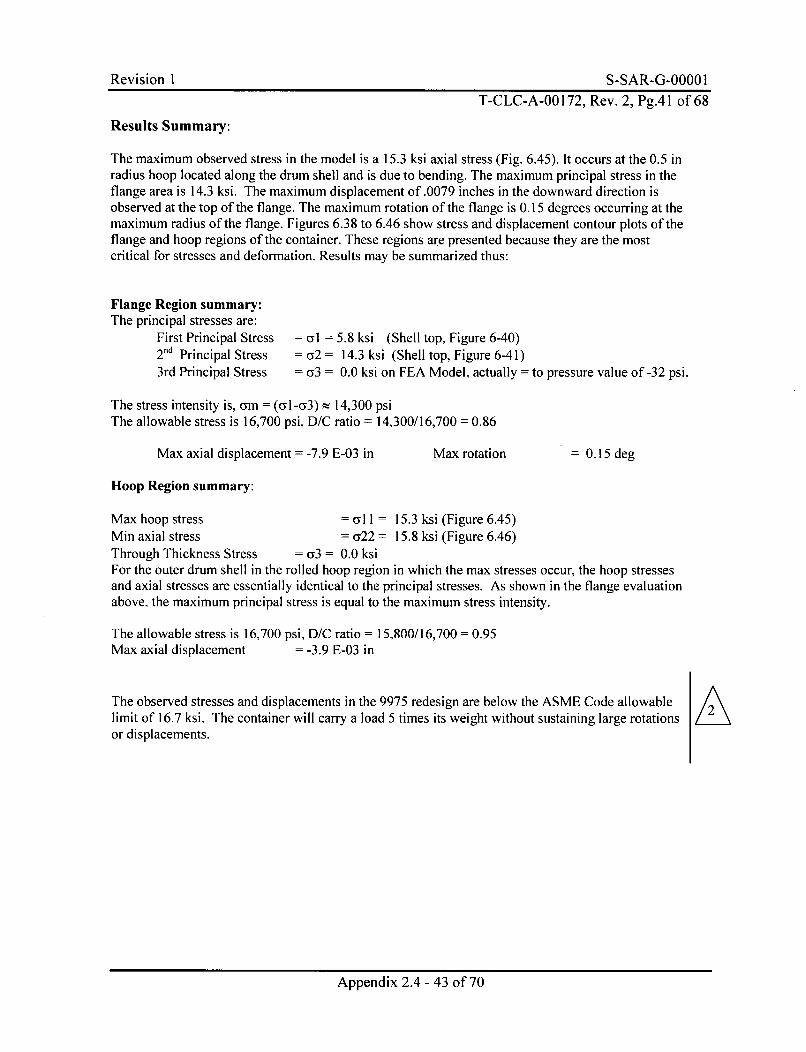
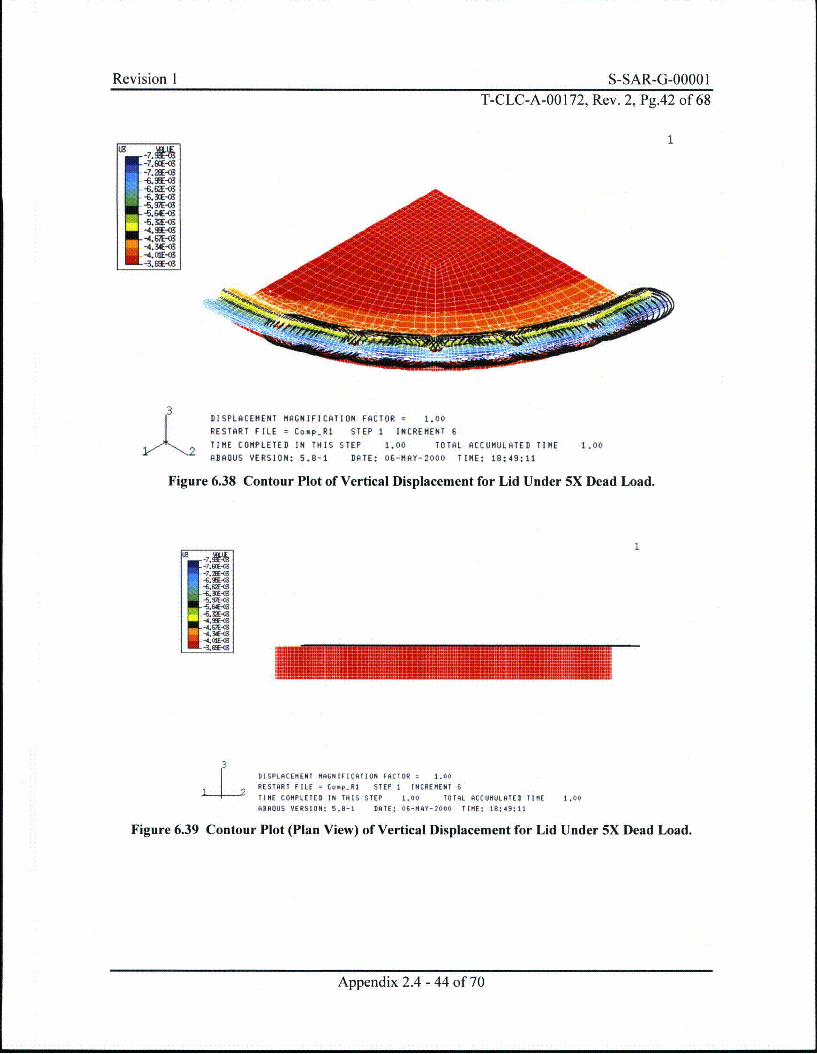
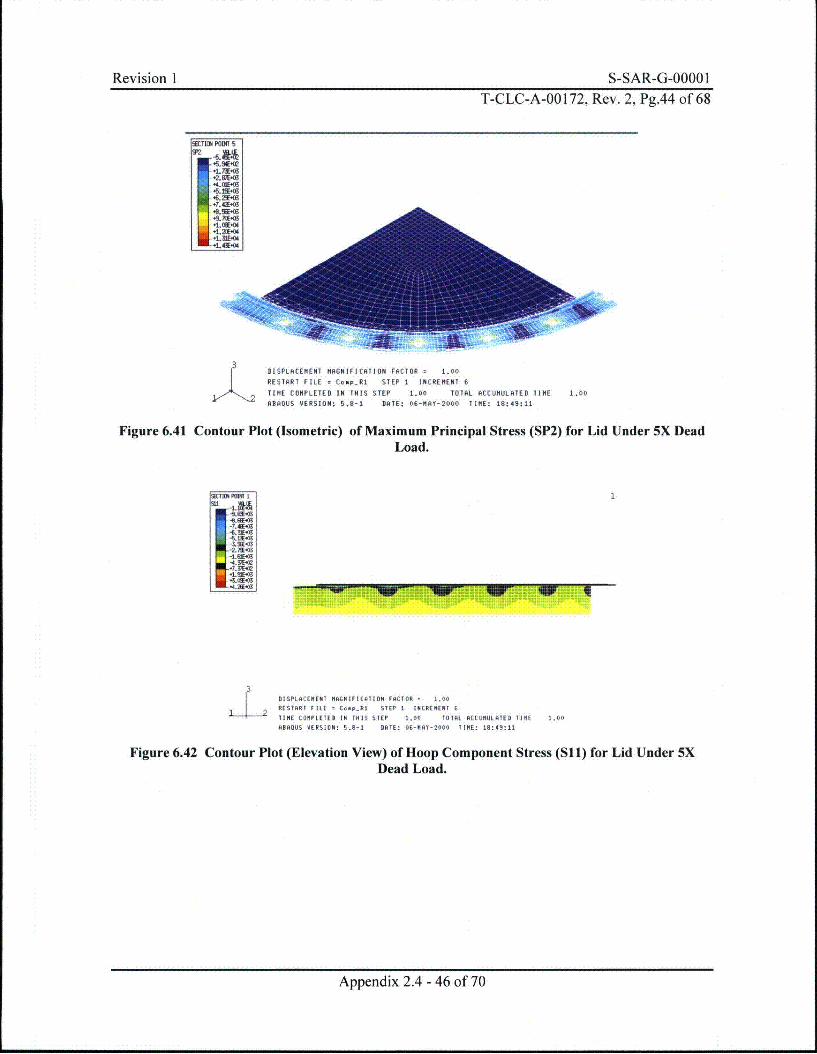
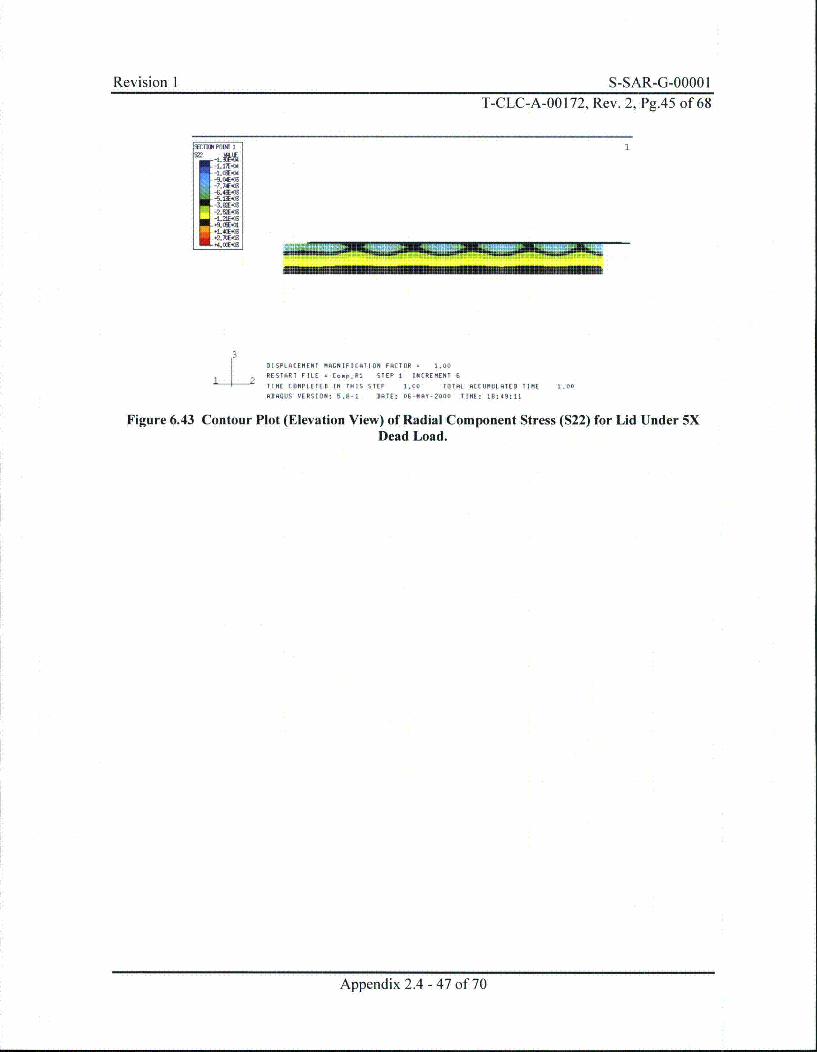
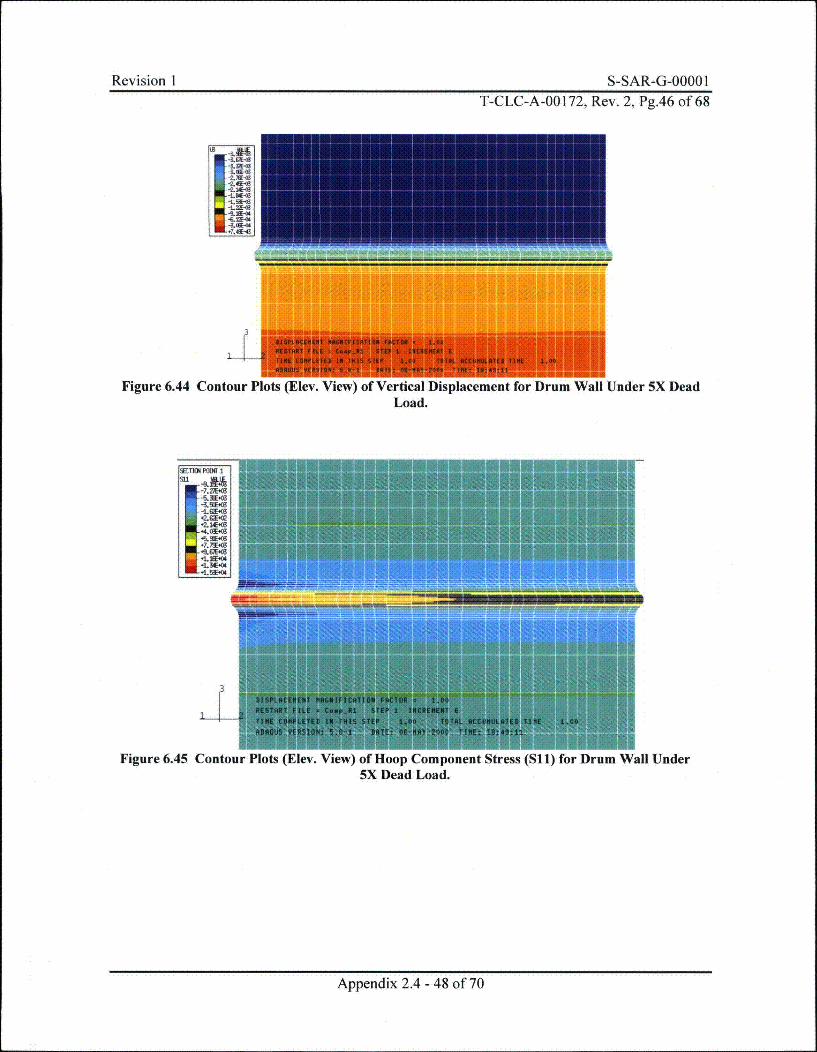
The maximum observed stress in the model is a 15.3 ksi axial stress (Fig. 6.45). It occurs at the 0.5 inradius hoop located along the drum shell and is due to bending. The maximum principal stress in theflange area is 14.3 ksi. The maximum displacement of.0079 inches in the downward direction isobserved at the top of the flange. The maximum rotation of the flange is 0.15 degrees occurring at themaximum radius of the flange. Figures 6.38 to 6.46 show stress and displacement contour plots of theflange and hoop regions of the container. These regions are presented because they are the mostcritical for stresses and deformation. Results may be summarized thus:
Flange Region summary:The principal stresses are:
First Principal Stress = al = 5.8 ksi (Shell top, Figure 6-40)2 d Principal Stress = a2 = 14.3 ksi (Shell top, Figure 6-41)3rd Principal Stress = 73 = 0.0 ksi on FEA Model, actually = to pressure value of-32 psi.
The stress intensity is, am = (a1-a3) • 14,300 psiThe allowable stress is 16,700 psi, D/C ratio = 14,300/16,700 = 0.86
Max axial displacement = -7.9 E-03 in Max rotation = 0.15 deg
Hoop Region summary:
Max hoop stress = all = 15.3 ksi (Figure 6.45)Min axial stress = 722 = 15.8 ksi (Figure 6.46)Through Thickness Stress = a3 = 0.0 ksiFor the outer drum shell in the rolled hoop region in which the max stresses occur, the hoop stressesand axial stresses are essentially identical to the principal stresses. As shown in the flange evaluationabove, the maximum principal stress is equal to the maximum stress intensity.
The allowable stress is 16,700 psi, D/C ratio = 15,800/16,700 = 0.95Max axial displacement = -3.9 E-03 in
The observed stresses and displacements in the 9975 redesign are below the ASME Code allowable 2limit of 16.7 ksi. The container will carry a load 5 times its weight without sustaining large rotations Aor displacements.
Appendix 2.4 - 43 of 70
Revision I S-SAR-G-0000.T-CLC-A-00 172, Rev. 2, Pg.42 of 68
1
-6.0~-06-6.97E-03
-4.99E-09-43.=4-4.CIE-03
3DISPLACEMENT MAGNIFICATION FACTOR = 1.00
RESTART FILE = CompRI STEP 1 INCREMENT 6
TIME COMPLETED IN THIS STEP 1.00 TOTAL ACCUMULATED TIME
ADAQUS VERSION: 5.8-1 DATE: 06-MAY-2000 TIME: 18:49:11
1.00
Figure 6.38 Contour Plot of Vertical Displacement for Lid Under 5X Dead Load.
1
-kX0-4.O6E-03-169E-03
3 DISPLACEMENT MAGNIFICATION FACTOR = 1.00
RESTART FILE = Coop.R1 STEP 1 INCREMENT 6
TIME COMPLETED IN THIS STEP 1.00 TOTAL ACCUMULATED TIME
ABROUS VERSION: 5.8-1 DATE: 06-MAY-2000 TIME: 18:43:11
1.00
Figure 6.39 Contour Plot (Plan View) of Vertical Displacement for Lid Under 5X Dead Load.
Appendix 2.4 - 44 of 70

Revision I S-SAR-G-o000 1T-CLC-A-00 172, Rev. 2, Pg.43 of 68
RTICN POINT 5
-3.41*-2.H--CS-L7z-.m-LOGE--3.91-<'ý74EAV49.31-<-L611(6+2.27E4Cg2.9C4CS-3.61-C9+4 2?E-G4:%E-(6
1-5.ME-ca
DISPLACEMENT MAGNIFICCATION FACTOR 1.00
RESTART FILE = Co.pR1 STEP I INCREMENT 6
TIME COMPLETED IN THIS STEP 1.00 TOTAL ACCUMULATED TIME 1.00ABROUS VERSION: 5.6-1 DATE: OE-MAY-2000 TIHE: 18:49:11
SLTIOA POIAT 5
-2.N403-1-72E03-11 ffw0.&5.00
.2 63E.032.X4(602 9.00~c.4 20F.00.491X
:-35.8103
Figure 6.40 Contour Plots (Isometric and Elevation) of Minimum Principal Stress (SP1) for LidUnder 5X Dead Load.
Appendix 2.4 - 45 of 70
Revision I S-SAR-G-00001T-CLC-A-00172, Rev. 2, Pg.44 of 68
SETION POINT 5
-zm-4 Q.IE.OI-A-
1.21E-0
3DISPLACEMENT MAGNIFICATION FACTOR 1.00
RESTART FILE = Cop.-R1 STEP 1 INCREMENT 6
TIME COMPLETED IN THIS STEP 1.00 TOTAL ACCUMULATED TIME
ABACUS VERSION: 5.8-1 DATE: 06-MAY-2000 TIME: 18:49:11
1.00
Figure 6.41 Contour Plot (Isometric) of Maximum Principal Stress (SP2) for Lid Under 5X DeadLoad.
SU -LA$~O7M- M
-4.TIE.OOI .Y-I
-IMF- - -- I
DISPLACEMENT MAGNIFICATION FACTOR - 1.00RESTART FILE = Co p.A1 STEP 1 INCREMENT '
TIME COMPLETE IAI THIS STEP 1.00 TOTAL ACCUMULATED TIME 1.00
AVAOUS VERSION: 5.8-1 DATE: O0-HAY-2000 TIME: 18:49:11
Figure 6.42 Contour Plot (Elevation View) of Hoop Component Stress (Sll) for Lid Under 5XDead Load.
Appendix 2.4 - 46 of 70
Revision 1 S-SAR-G-0000 1T-CLC-A-00172, Rev. 2, Pg.45 of 68
ýETICN PON14 1
-1. "II 1.7E0-4:4-w
1.401.0
1
3DISPLACEMENT MAGNIFICATION FACTOR ý 1.00
RESTART FILE Co..ppR1 STEP 1 INCREMENT 6
TIRE LO-PLETED IN THIS STEP 1.00 TOTAL ACCUMULATED TIME 1.00ARAQOS VERSION: 5.8-1 DATE: 06-AY-2000 TIME: 18:49:11
Figure 6.43 Contour Plot (Elevation View) of Radial Component Stress (S22) for Lid Under 5XDead Load.
Appendix 2.4 - 47 of 70
Revision I S-SAR-G-.46 ofT-CLC-A-00 172, Rev. 2, Pg.46 of 68
-LK--LX--LZ-10-
.7.a-43
Figure 6.44 Contour Plots (Elev. View) of Vertical Displacement for Drum Wall Under 5X DeadLoad.
-LMC-A-
5.4 a.7 7
3
Figure 6.45 Contour Plots (Elev. View) of Hoop Component Stress (S11) for Drum Wall Under5X Dead Load.
Appendix 2.4 - 48 of 70
Revision I S-SAR-G-0000 IT-CLC-A-00172, Rev. 2, Pg.47 of 68
-i1On P01W I
-. M
-L9-
191E-03
*13E-0
3E-
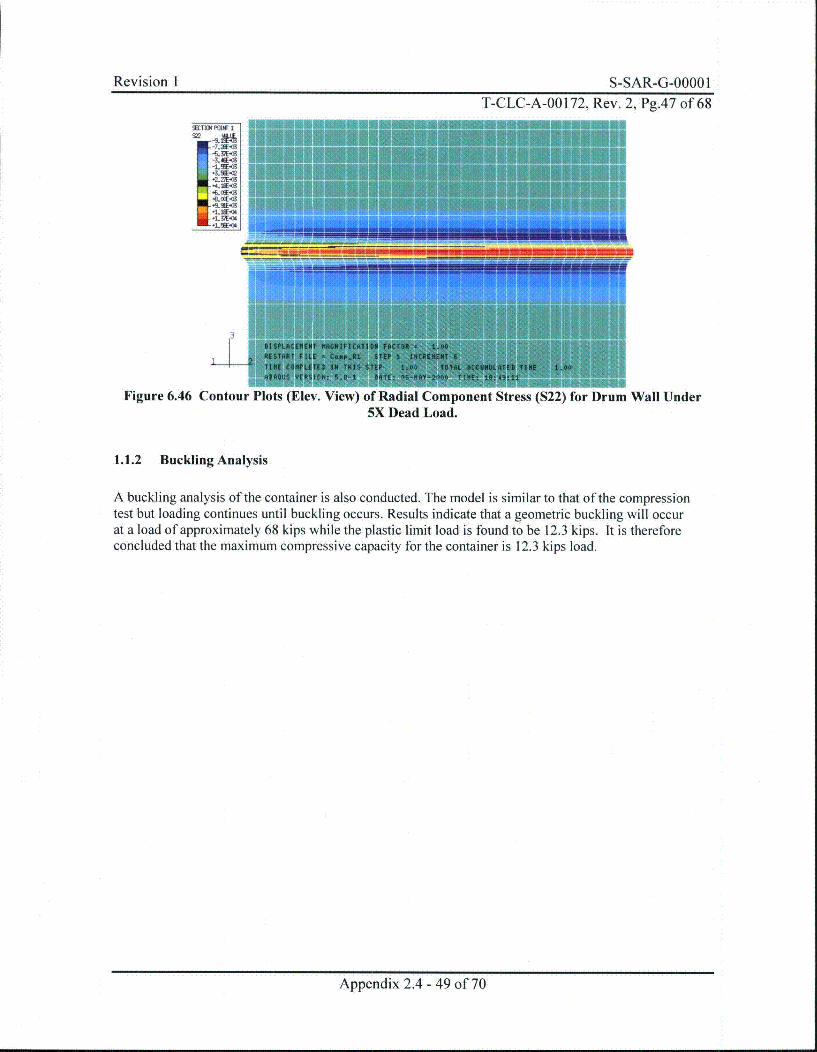
Figure 6.46 Contour Plots (Elev. View) of Radial Component Stress (S22) for Drum Wall Under5X Dead Load.
1.1.2 Buckling Analysis
A buckling analysis of the container is also conducted. The model is similar to that of the compressiontest but loading continues until buckling occurs. Results indicate that a geometric buckling will occurat a load of approximately 68 kips while the plastic limit load is found to be 12.3 kips. It is thereforeconcluded that the maximum compressive capacity for the container is 12.3 kips load.
Appendix 2.4 - 49 of 70
Revision I S-SAR-G-0000 IRevision I S-SAR-G-OOOO 1
T-CLC-A-00172, Rev. 2, Pg.48 of 68
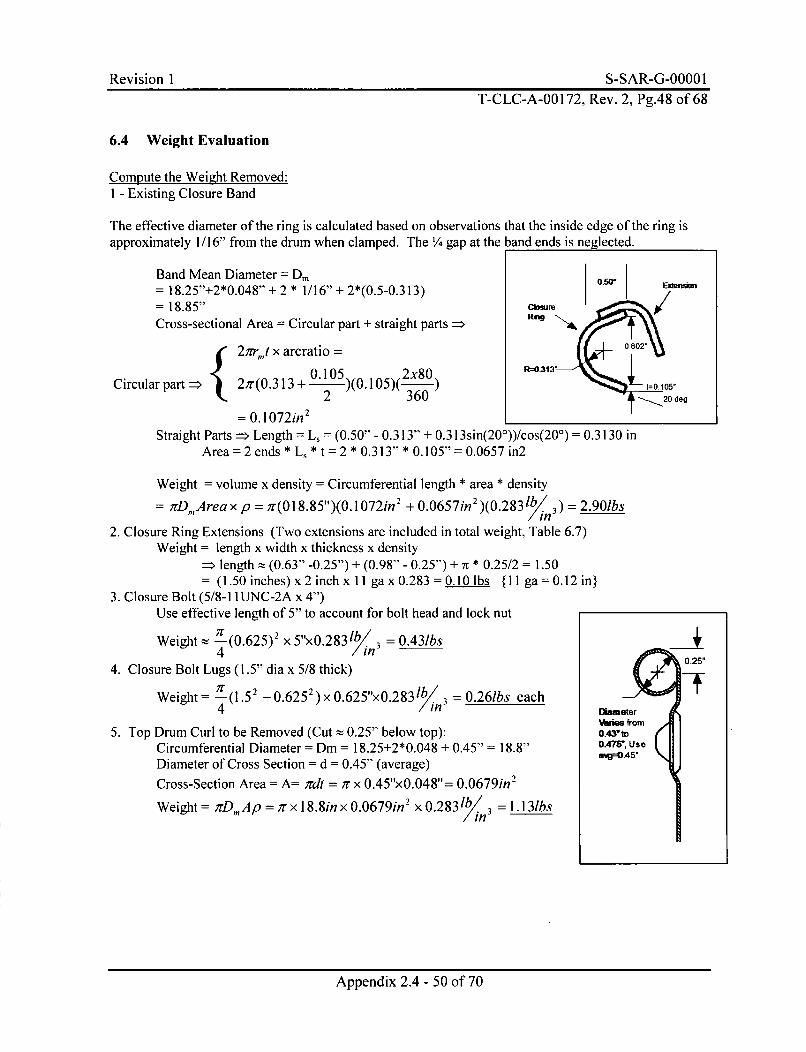
6.4 Weight Evaluation
Compute the Weight Removed:I - Existing Closure Band
The effective diameter of the ring is calculated based on observations that the inside edge of the ring isapproximately 1/16" from the drum when clamped. The 1A gap at the band ends is neglected.
Band Mean Diameter = Dm o-Wo Emnmo
= 18.25"+2"0.048" + 2 * 1/16" + 2*(0.5-0.313)= 18.85" c3uW e
Cross-sectional Area = Circular part + straight parts = Rhg '
2;rrt x arcratio = 0802"
Circular part = 2z(0.313 + 0.105 )(0.105)( 2x80) =313" t=0.12360 -_20 deg
= 0.1072in2 2__20_dog
Straight Parts =:> Length = L, = (0.50" - 0.313" + 0.3I3sin(20°))/cos(20°) = 0.3130 inArea = 2 ends * L, * t = 2 * 0.313" * 0.105" = 0.0657 in2
Weight = volume x density = Circumferential length * area * density
= XDmArea x p = ;r(0I18.85")(0. 1072in 2 + 0.0657in 2 )(0.283 lbin = 2.90lbs
2. Closure Ring Extensions (Two extensions are included in total weight, Table 6.7)Weight = length x width x thickness x density
= lengthtý (0.63" -0.25") + (0.98" - 0.25") + E * 0.25/2 = 1.50= (1.50 inches) x 2 inch x I Iga x 0.283 = 0.10 lbs {I Iga = 0.12 in}
3. Closure Bolt (5/8-11UNC-2A x 4")Use effective length of 5" to account for bolt head and lock nut
Weight 4-(0.625)2 x 5"xO.283 1l = 0.431bs4 /in __
4. Closure Bolt Lugs (1.5" dia x 5/8 thick) 0.25"
Weight = I-(1.52 -0.6252)x 0.625"x0.2831b/.. = 0.261bs each14 4 int Diameter
5. Top Drum Curl to be Removed (Cut = 0.25" below top): 0.,-,toCircumferential Diameter Dm = 18.25+2*0.048 + 0.45" = 18.8" _.45, useDiameter of Cross Section = d = 0.45" (average) wa=°As"
Cross-Section Area = A= irdt = ;,r x 0.45"xO.048"= 0.0679in2
Weight = ;rD,,Ap = ;r x 18.8in x 0.0679in2 x 0.283/Ib. =1.131bs/ in
Appendix 2.4 - 50 of 70
Revision I S-SAR-G-00001T-CLC-A-00172, Rev. 2, Pg.49 of 68
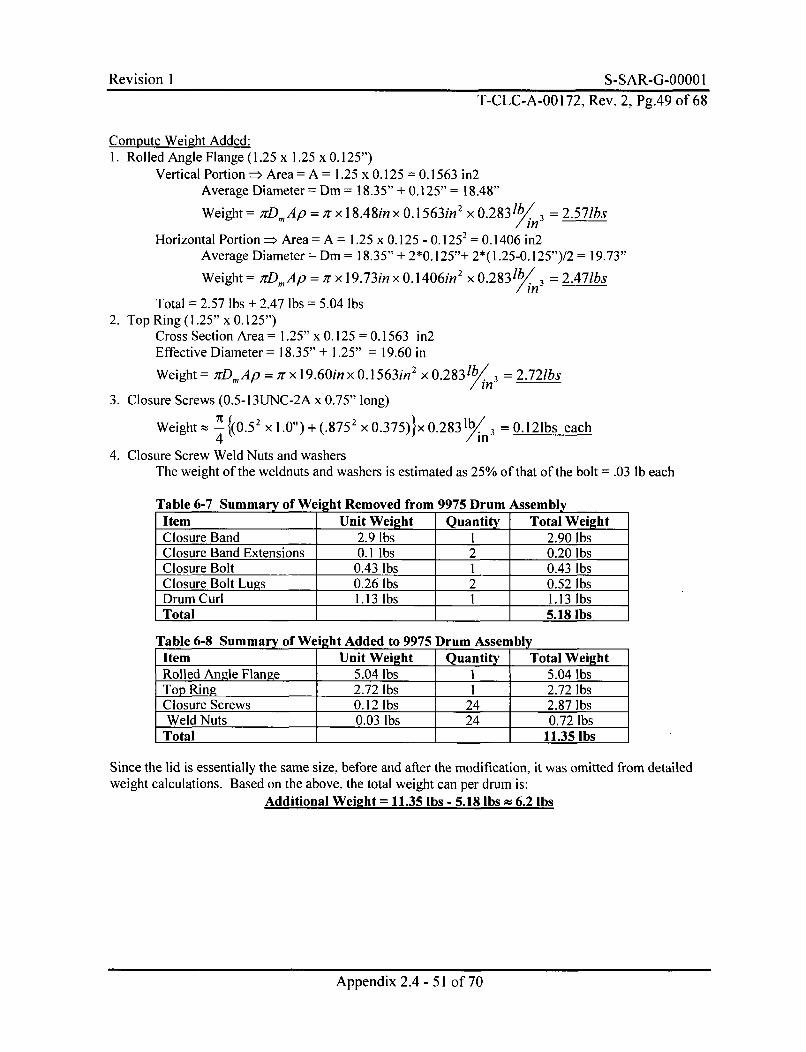
Compute Weight Added:1. Rolled Angle Flange (1.25 x 1.25 x 0.125")
Vertical Portion = Area = A = 1.25 x 0.125 = 0.1563 in2Average Diameter Dm = 18.35" + 0.125" = 18.48"
Weight = ;rD,,Ap = r x 18.48in x 0.1563in2 x 0 .2 83 Ibi 2.571bs/in
Horizontal Portion = Area A = 1.25 x 0.125 - 0.1252 = 0.1406 in2Average Diameter = Dm = 18.35" + 2*0.125"+ 2*(1.25-0.125")/2 = 19.73"
Weight = ;TD,,Ap = ir x 19.73in x 0.1 406in2 x 0 .2 8 3 lbl/3 = 2.47lbs
Total = 2.57 lbs + 2.47 lbs = 5.04 lbs2. Top Ring (1.25" x 0.125")
Cross Section Area = 1.25" x 0. 125 = 0.1563 in2Effective Diameter = 18.35" + 1.25" = 19.60 in
Weight = rD,,,Ap = ir x 19.60in x 0.1563in 2 x 0.283 1b .3 =2.721bs
3. Closure Screws (0.5-13UNC-2A x 0.75" long)
Weight z ;-' .52 xl.0")+(.8752 x0.375) 0.283 b 3 -0.12lbs each
4. Closure Screw Weld Nuts and washersThe weight of the weldnuts and washers is estimated as 25% of that of the bolt = .03 lb each
Table 6-7 Summary of Weight Removed from 9975 Drum AssemblyItem Unit Weight Quantity Total WeightClosure Band 2.9 lbs 1 2.90 lbsClosure Band Extensions 0.1 lbs 2 0.20 lbsClosure Bolt 0.43 lbs 1 0.43 lbsClosure Bolt Lugs 0.26 lbs 2 0.52 lbsDrum Curl 1.13 lbs 1 1.13 lbsTotal _1 5.18 ibs
Table 6-8 Summary of Weight Added to 9975 Drum AssemblyItem Unit Weight Quantity Total WeightRolled Angle Flange 5.04 lbs 1 5.04 lbsTop Ring 2.72 lbs 1 2.72 lbsClosure Screws 0.12 lbs 24 2.87 lbsWeld Nuts 0.03 lbs 24 0.72 lbs
Total __ 11.35 Ibs
Since the lid is essentially the same size, before and after the modification, it was omitted from detailedweight calculations. Based on the above, the total weight can per drum is:
Additional Weiaht = 11.35 Ibs - 5.18 Ibs z 6.2 Ibs
Appendix 2.4 - 51 of 70
Revision 1 S-SAR-G-0000 IT-CLC-A-00172, Rev. 2, Pg.50 of 68
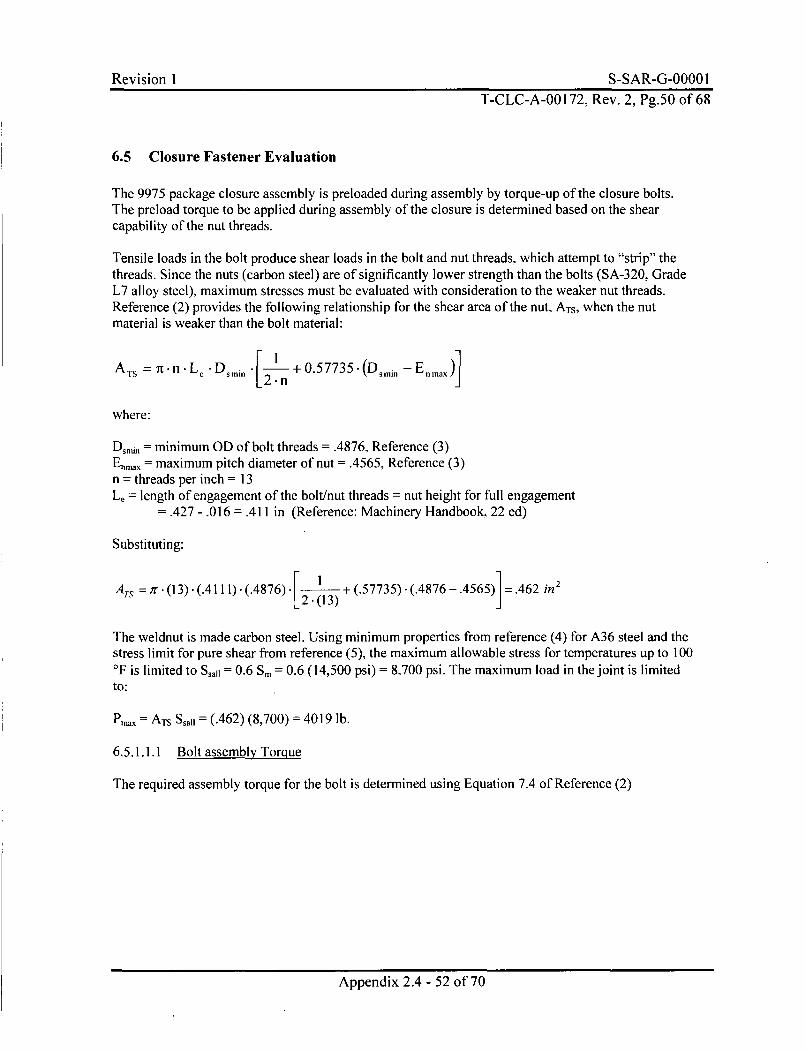
6.5 Closure Fastener Evaluation
The 9975 package closure assembly is preloaded during assembly by torque-up of the closure bolts.The preload torque to be applied during assembly of the closure is determined based on the shearcapability of the nut threads.
Tensile loads in the bolt produce shear loads in the bolt and nut threads, which attempt to "strip" thethreads. Since the nuts (carbon steel) are of significantly lower strength than the bolts (SA-320, GradeL7 alloy steel), maximum stresses must be evaluated with consideration to the weaker nut threads.Reference (2) provides the following relationship for the shear area of the nut, ATS, when the nutmaterial is weaker than the bolt material:
ATS=r7'n'Le Dsmi," 121-- 0.57735.(Dsmin- En)..]
where:
D,. = minimum OD of bolt threads = .4876, Reference (3)Ea = maximum pitch diameter of nut = .4565, Reference (3)n = threads per inch = 13L, = length of engagement of the bolt/nut threads = nut height for full engagement
= .427 - .016 = .411 in (Reference: Machinery Handbook, 22 ed)
Substituting:
ATS = 7r- (13). (.4111). (.4876). [(13) + (.57735). (.4876 -. 4565) = .462 in 2
The weldnut is made carbon steel. Using minimum properties from reference (4) for A36 steel and thestress limit for pure shear from reference (5), the maximum allowable stress for temperatures up to 100'F is limited to SsaII = 0.6 Sm = 0.6 (14,500 psi) = 8,700 psi. The maximum load in the joint is limited
to:
P.x = ATS Ssaii = (.462) (8,700) = 4019 lb.
6.5.1.1.1 Bolt assembly Torque
The required assembly torque for the bolt is determined using Equation 7.4 of Reference (2)
Appendix 2.4 - 52 of 70
Revision 1 S-SAR-G-00001
T-CLC-A-00 172, Rev. 2, Pg.51 of 68
T= FP K D
where:
Tmi= input torque, lb.-in.FP= achieved preload = 4019 lb.D = nominal fastener diameter = .5 inK = nut factor (dimensionless), taken as 0.2 for steel surfaces, reference (2)
The required torque is:
Tm = (4019) (0.2) (.5) = 402 lb.-in. = 33.5 lb.ft
An assembly torque of 28-32 ft.-lbs. is specified on the drawing. For this torque range, the bolt preloadis:
Tmin (28).(12)Pi KD . (.2).(.5) =33601b.
Tm a _ (32).(12)Pma. K (. - .5 = 3840 lb.K- D .... (.2)" (.5)
Evaluation of the thermal loads and vibratory loosening (Section 6.7) are performed based on theminimum pre-load of 3360 lb.
To achieve the above pre-load, the bolts shall be tightened using two torquing passes around thecircumference of the drum. The first pass is to snug the bolts to a torque of approximately 10% of thefinal torque. The second pass is to impart full torque to the bolts.
Appendix 2.4 - 53 of 70
Revision I S-SAR-G-00001T-CLC-A-00172, Rev. 2, Pg.52 of 68
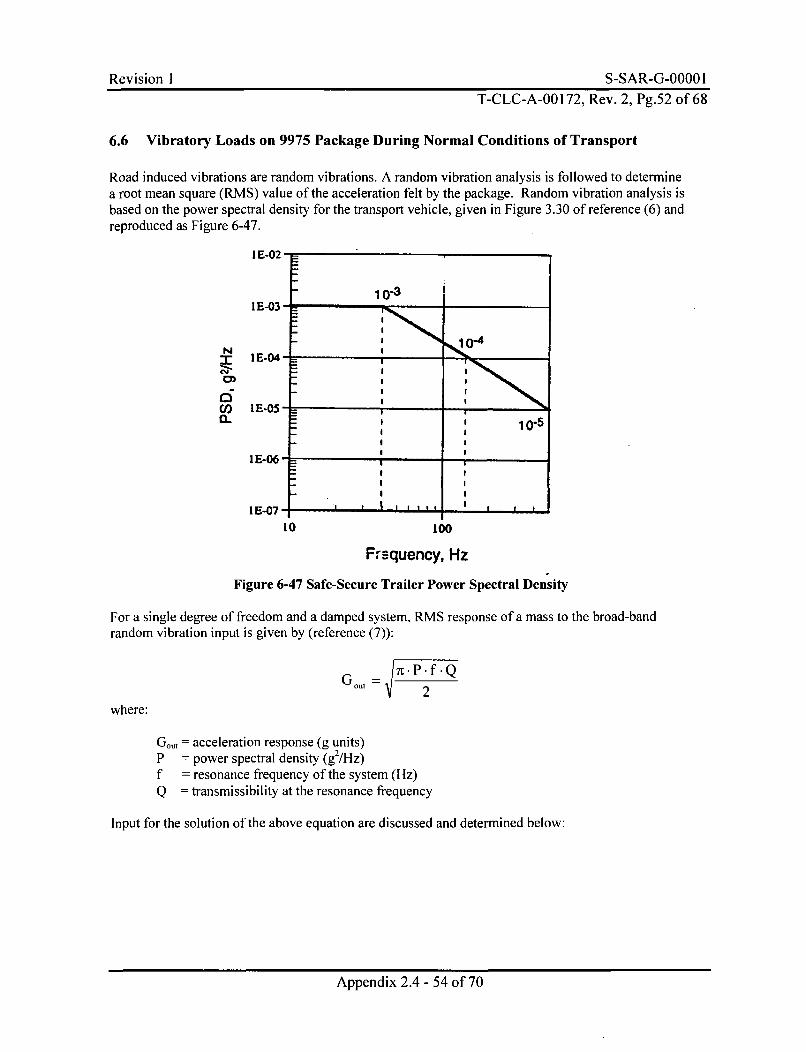
6.6 Vibratory Loads on 9975 Package During Normal Conditions of Transport
Road induced vibrations are random vibrations. A random vibration analysis is followed to determinea root mean square (RMS) value of the acceleration felt by the package. Random vibration analysis isbased on the power spectral density for the transport vehicle, given in Figure 3.30 of reference (6) andreproduced as Figure 6-47.
I E-02
10-31 E-03
N I E-04- 1
U) I E-05" =13-- I I10-5
I E-06 - =I E* I
10 10o
Froequency, Hz
Figure 6-47 Safe-Secure Trailer Power Spectral Density
For a single degree of freedom and a damped system., RMS response of a mass to the broad-bandrandom vibration input is given by (reference (7)):
2where:
G,,t = acceleration response (g units)P = power spectral density (g2/Hz)f = resonance frequency of the system (Hz)Q = transmissibility at the resonance frequency
Input for the solution of the above equation are discussed and determined below:
Appendix 2.4 - 54 of 70
Revision I S-SAR-G-O000 1T-CLC-A-00 172, Rev. 2, Pg.53 of 68
Resonance Frequency of the Package, f
Vibratory response of the 9975 package is evaluated by assuming the natural frequency to coincidewith the peak of the power spectral density curve shown in Figure 6-47. This corresponds to afrequency of 40 hz and a PSD of I E-3 g2/Hz. The degree of conservatism in the above approach,compared to standard practices in evaluating drum vibratory loads, is evaluated by considering thecontainment vessels with mass M associated with its contained vessel assembly, and structuralstiffness k, characterized by the supporting Celotex insulation. The natural frequency is:
IF= I .rkg
where:
k = stiffness of Celotex insulation (determined below)w = weight of the combined vessel assembly = 283 lb, reference (1)g = acceleration of gravity = 386.4 in/sec2
The stiffness of the Celotex insulation is determined by examination of test results reported inreference (1). For a 2 x 2 x 2 inch cubic specimen, progressively loaded in compression, loading of thespecimen increased from 20 to 600 pounds as a deflection of 0.5 inch was imposed. The equivalentelastic modulus, E is calculated as:
E- Pt L,- (600 - 20)-(2.0) =-580 lb. 2
A, -A (2.0.2.0). (0.5)where:
P, = applied load, lbs.L, = specimen length = 2 inchesA, = specimen cross-section area = 2.0 x 2.0 = 4 inches 2
The vessel assemblies are supported by an 11.2 inch diameter aluminum plate, which bears on a 4.00inch thick layer of Celotex. The stiffness of the supporting Celotex, k is calculated below:
k- " _= A: E =1 -= 14,300 Ib.'L 4.00 n.
where:
= area of the supporting Celotex (taken as the area of the aluminum support plate)L= height of the column of Celotex under the support plate (Drawing R-R2-F-00 19)
The natural frequency of the package is now calculated using the above relation:
F I kg _ 1 1(14,300) .(386.4) =22.2 Hz
27rc w 2-t7 283
Appendix 2.4 - 55 of 70
Revision 1 S-SAR-G-0000 1T-CLC-A-00172, Rev. 2, Pg.54 of 68
Transmissibility, 0
From reference (7), the transmissibility, Q (also known as magnification factor) is determined as:
Q=[ r2)2 ++(2.r d)2t =[(1-2)2 +(2.1..10)2-[5 5.0
where:
d = damping coefficient = 0.10r = frequency ratio = f/ f, = 1, where f, = natural frequency
The package acceleration, Gou, is now calculated below:
;°. (0.00 " g-2 /hz)' (40hz)' (5.0)2.Gol=,17 I-P = 001 2-56 g
where P = 0.001 from Figure 6-47. Using the computed frequency of 22 Hz results in 0.42 g.
The maximum vibration of the containment vessels and contents is about 3 to 4 times the root meansquare, or about 1.7 g to 2.25 g. Conservatively assuming 100% of the package mass is acting at thisacceleration level yields a maximum load of less than 1000 lbs. The resistance of the container lid tothis load is from the bolt pre-load, as documented in Section 6.5.
Appendix 2.4 - 56 of 70
Revision 1 S-SAR-G-00001
T-CLC-A-00172, Rev. 2, Pg.55 of 68
6.7 Loosening of Drum Bolts During Normal Conditions of Transport
The only known mechanism for bolt loosening in the 9975 package bolts is vibration-caused motion ofthe lid flange relative to the drum. If motion occurs, and is properly directed, then turning of the bolthead could be possible. However, motion of the lid flange is prevented by bolt preload as discussedbelow.
Bolt preload in the drum lid is caused by torque applied to the bolts during assembly. The minimumload on the bolts due to torque-up is given in Section 6.4 as 3360 lbs.
The tensile stress in the bolt, S due to torque-up at 700 F is determined below:
F 3360S- -- =23,680 psi
Ah 0.1419
where Ab is the bolt tensile stress area = 0.1419 in., reference (2)
The bolt strain, , is:
S 23,680E=-- -. 0007893 in / inE 30,.000,000
where E is the modulus of elasticity of the bolt material = 30,000,000 psi
At ambient temperature, the bolt length will increase as it is preloaded by the amount, ALI, calculatedas follows:
ALI = L = (0.435). (0.0007893) = 0.0003433 in.where:
L = effective loaded length of the bolt = tif+ tj + tdf + hw = .125 + 0.048+ .125 + .137 = .435 in.tif is the thickness of the lid flange = 0.125 in., Drawing R-R2-F-0025t1 is the thickness of the lid = 0.048 in., Drawing R-R2-F-0025tdf is the thickness of the drum flange = 0.125 in, Drawing R-R2-F-0025h, is the washer thickness = .137 in. (reference: ASTM F436-94)
At -40' F, some of the tension in the bolt will relax. Using the coefficients of thermal expansion forthe flanges and the bolts, the change in length of the bolt, AL2 with decreased temperature isdetermined below:
AL2 = (a8 -6 a AT10 - L x-6 h,,)
= (8.46 x10⁻⁶ -5.6 x10⁻⁶). [70 -(-40)].(0.435 -.137) =0.000 1108 in.
Appendix 2.4 - 57 of 70
Revision 1 S-SAR-G-00001T-CLC-A-00 172, Rev. 2, Pg.56 of 68
where(cf is the coefficient of thermal expansion for the flange material (304L)
= 8.46 x 10⁻⁶ in/in/°F (ASME Code, Section II, Part D)ctb is the coefficient of thermal expansion for the bolt and nut material (carbon/alloy steel)
= 5.6 x 10⁻⁶ in/in/°F (ASME Code, Section II, Part D)AT is the temperature change from bolt-up (70 OF) to minimum service temperature (-40 °F)
This tells us that the flange thickness contracts 5.03 x 10⁻⁶ inch more than the bolts, thus reducing thepre-load. However, at minus 40 degrees Fahrenheit the bolt is still in tension because of the remainingpre-load, which is calculated below. The remaining elongation of the bolt, AL3 is calculated asfollows:
AL3 = ALI - AL2 = 0.0003433 - 0.0001108 = 0.0002325 in.
The remaining pre-load is calculated as follows:
= S3 . A= E. E A = (AL 3 ).E.A (0.0002325)-(30x10 6).(.1419) = 2 275 lb.
L 0.435
where the subscript 3 denotes the values of the previously defined variables at -40 OF.
The remaining preload at minus 40 degrees Fahrenheit is 2275 pounds per bolt. This remainingpreload can now be compared with the vibratory load on the drum lid to determine if loosening canoccur.
The weight of the drum lid is estimated from details given on Drawing R-R2-F-0025, as follows:
W, = (0.29)[7r/4(18.1 )'(.048)+rt(18.1 )(.048)(.75)+ir/4(20.75 18.12)(.048)+7r/4(20.852-1 8.852)(. 125)] =7.6 lb.
The vibratory load tending to loosen the bolts is calculated as the product of the maximumacceleration, 2.25 g (see Section 6.6) and the lid weight, or Pnl,, = 2.25 (7.6) • 20 lbs. Conservativelyassuming this load is applied in a lateral direction, friction at the lid to drum bolted joint must besufficient to prevent relative motion between the closure assembly parts, which is the postulatedloosening mechanism for the closure bolts. Assuming a metal-to-metal coefficient of friction betweenthe closure parts, the resistance of the closure to slip is calculated as:
Pres =,.u" F3 - N1 = (0.1). (2275). (24) = 5687.5 lb.
It is seen that the resistance to slip in the closure assembly, 5687 lbs. is significantly greater than thevibratory load tending to cause slip, 20 lb., and vibration will not be a problem during NormalConditions of Transport.
Appendix 2.4 - 58 of 70
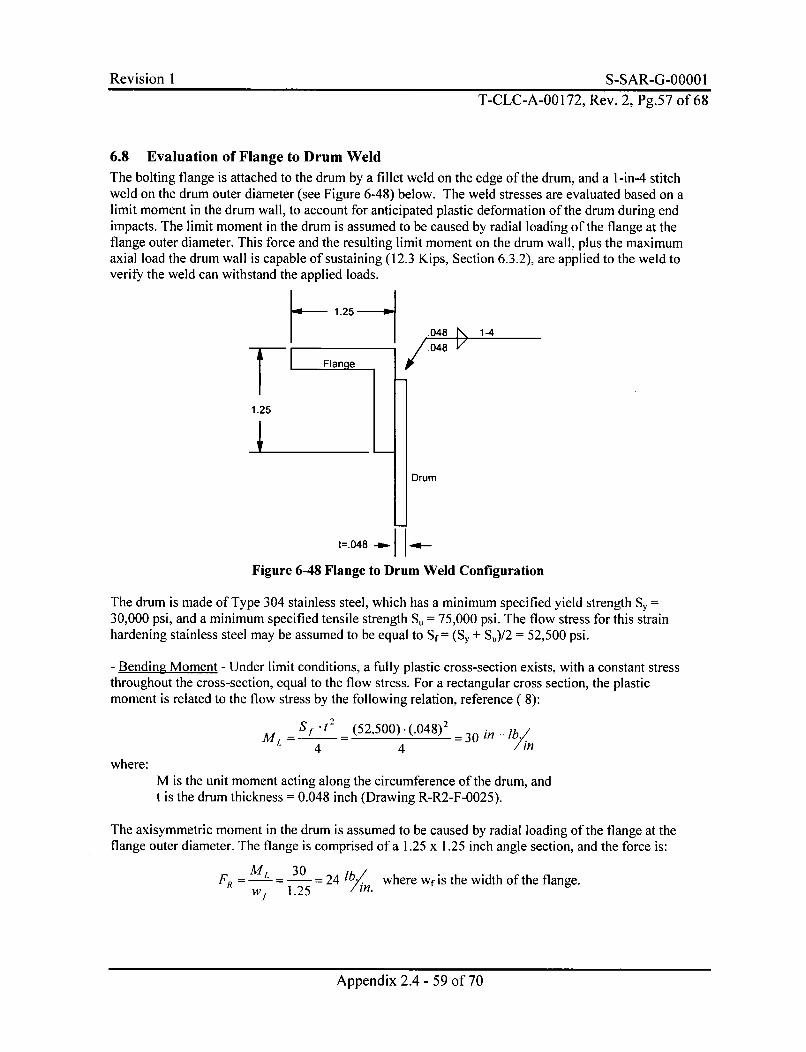
Revision 1 S-SAR-G-OO00 1T-CLC-A-00 172, Rev. 2, Pg.57 of 68
6.8 Evaluation of Flange to Drum WeldThe bolting flange is attached to the drum by a fillet weld on the edge of the drum, and a l-in-4 stitchweld on the drum outer diameter (see Figure 6-48) below. The weld stresses are evaluated based on alimit moment in the drum wall, to account for anticipated plastic deformation of the drum during endimpacts. The limit moment in the drum is assumed to be caused by radial loading of the flange at theflange outer diameter. This force and the resulting limit moment on the drum wall, plus the maximumaxial load the drum wall is capable of sustaining (12.3 Kips, Section 6.3.2), are applied to the weld toverify the weld can withstand the applied loads.
1.25
.048 1-4.048
Elange
1.25
Drum
t=.048 -a-
Figure 6-48 Flange to Drum Weld Configuration
The drum is made of Type 304 stainless steel, which has a minimum specified yield strength Sy,30,000 psi, and a minimum specified tensile strength Su = 75,000 psi. The flow stress for this strainhardening stainless steel may be assumed to be equal to Sf= (Sy + SJ)/2 = 52,500 psi.
- Bending Moment - Under limit conditions, a fully plastic cross-section exists, with a constant stressthroughout the cross-section, equal to the flow stress. For a rectangular cross section, the plasticmoment is related to the flow stress by the following relation, reference ( 8):
ML S t2 (52,500).(.048)2 =30 in- lb.4 4 Yin
where:M is the unit moment acting along the circumference of the drum, andt is the drum thickness = 0.048 inch (Drawing R-R2-F-0025).
The axisymmetric moment in the drum is assumed to be caused by radial loading of the flange at theflange outer diameter. The flange is comprised of a 1.25 x 1.25 inch angle section, and the force is:
1.25 3 24 lb.i.. where wfis the width of the flange.w4) 1.25in
Appendix 2.4 - 59 of 70
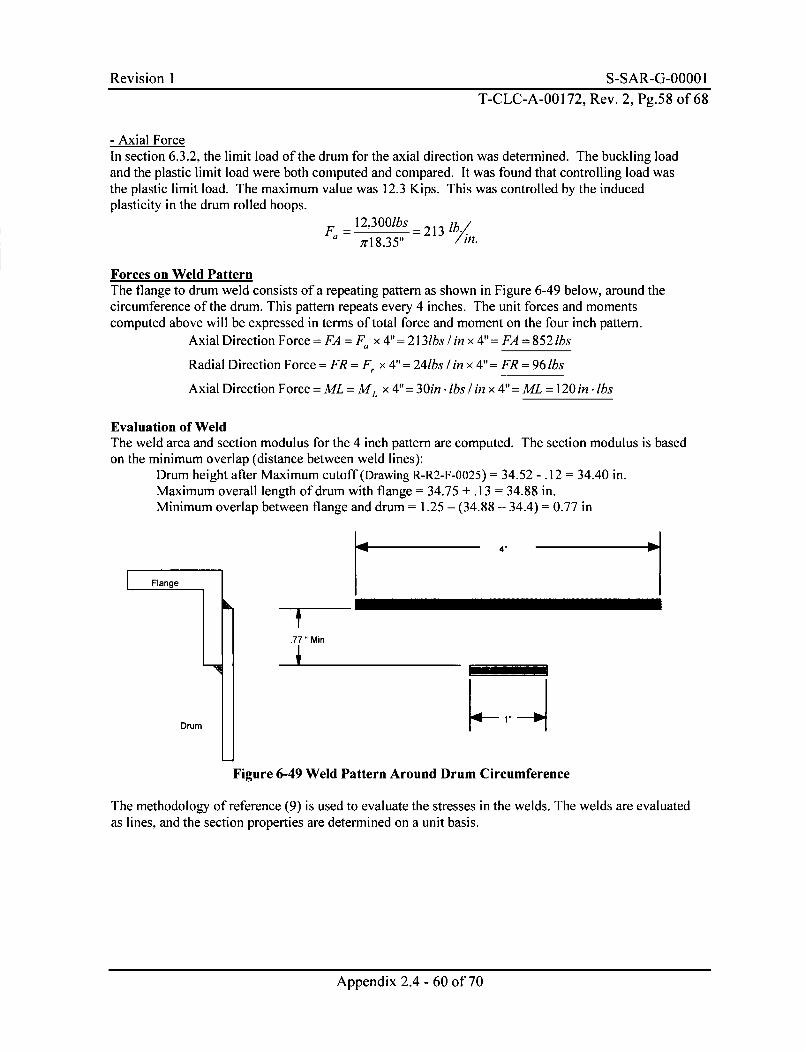
Revision I S-SAR-G-O000 1
T-CLC-A-00 172, Rev. 2, Pg.58 of 68
- Axial ForceIn section 6.3.2, the limit load of the drum for the axial direction was determined. The buckling loadand the plastic limit load were both computed and compared. It was found that controlling load wasthe plastic limit load. The maximum value was 12.3 Kips. This was controlled by the inducedplasticity in the drum rolled hoops.
12,300lbs = 213a - l 8.35" in.
Forces on Weld PatternThe flange to drum weld consists of a repeating pattern as shown in Figure 6-49 below, around thecircumference of the drum. This pattern repeats every 4 inches. The unit forces and momentscomputed above will be expressed in terms of total force and moment on the four inch pattern.
Axial Direction Force = FA = Fa x 4"= 213lbs / in x 4"= FA = 852 lbs
Radial Direction Force = FR = Fr x 4" = 241bs / in x 4" = FR = 96 lbs
Axial Direction Force = ML = ML x 4"= 30in . lbs / in x 4"= ML = 120 in . lbs
Evaluation of WeldThe weld area and section modulus for the 4 inch pattern are computed. The section modulus is basedon the minimum overlap (distance between weld lines):
Drum height after Maximum cutoff (Drawing R-R2-F-0025) = 34.52 -. 12 = 34.40 in.Maximum overall length of drum with flange = 34.75 + .13 = 34.88 in.Minimum overlap between flange and drum = 1.25 - (34.88 - 34.4) = 0.77 in
4,
Flange
.77" Min
Drum
Figure 6-49 Weld Pattern Around Drum Circumference
The methodology of reference (9) is used to evaluate the stresses in the welds. The welds are evaluatedas lines, and the section properties are determined on a unit basis.
Appendix 2.4 - 60 of 70
Revision I S-SAR-G-0000 IT-CLC-A-00172, Rev. 2, Pg.59 of 68
Weld AreaThe total weld area for a four inch length is the sum of the top and bottom weld lengths (4" plus 1"),multiplied by the appropriate weld throat:
A,= .707. h. (d, + d 2 ) =.707.(.048).(4.0 + 1.0) = 0.170 in.2
h is the weld leg height = 0.048 in.d, is the length of the upper weld = 4.0 in.
d2 is the length of the lower weld = 1.0 inch
Weld Section ModulusThe area moment of inertia of the weld group about its centroid is first determined. The centroid islocated at a distance from a given datum as follows:
- -A.y
For a datum located midway between the welds:
- (4.0).(.77 / 2) - (1.0).(.77 / 2) -0.231
4.0+1.0
The centroid is located .77/2 + .231 = .616 inches above the stitch weld, and .77/2 - .231 .154 inchesbelow the upper weld. The moment of inertia of the weld group about the centroid is:
I,,= A.y =1.0-(.616)2 +4.0-(.154)2 =.474 in.4 /in
The moment of inertia of the 4" pattern is equal to the width of the weld throat times the unit momentof inertia. The section modulus is the moment of inertia divided by the maximum distance from weldto centroid (cI =0.616")
I = 0.707-1h. I,, = 0.707 . (.048). (.474) = 0.0161 in.4
S-Ic 0.0161 in.4 0 6 0.026Nn3=~ ~~. 16" =006ln
Weld StressThe weld stress due to the radial load and the bending moment combine directly. The stress due to theaxial load is perpendicular to the bending and radial stress and is combined by SRSS methods.
FR 96lbsStress due to Radial Load = SR = - -670hz2 =565 psiA, .1 70in2
FA 8521bsStress due to Axial Load = SA4 . =5012 psi
A, .170in 2
ML 120in. lbsStress due to Bending = SM =-n - = 4598 psiS .06ln
Appendix 2.4 - 61 of 70
Revision 1 S-SAR-G-0000 1T-CLC-A-00172, Rev. 2, Pg.60 of 68
Evaluation of Combined StressesThe combined stress from the two forces and one moment is computed below:
'e,, =(SR + SM )2 + (SA)2 } = j(565+ 4598)2 + (5012)2 }/2= 7196psi
The shear stress is evaluated to the limits provided in ASME Code, Section 111, Division I, AppendixF, Paragraph 133 1. 1(d), which identifies a limit of 0.42 S, for pure shear for faulted conditions. Forthe Type 304 stainless steel weld material, S, = 75,000 psi, and the allowable shear stress is 0.42(75,000) = 31,500 psi. The maximum shear stress is well within the maximum allowable, and thedrum/flange welds are therefore acceptable for loading due to drum deformation. The margin iscalculated below:
margin = (31,500/7196 - 1) = 3.4
Appendix 2.4 - 62 of 70
Revision I S-SAR-G-0000 1T-CLC-A-00172, Rev. 2, Pg.61 of 68
7 References
1. Safety Analysis Report - Packages 9965, 9968, 9972-9975 Packages (U), WSRC-SA-7, Revision8, August 1999
2. An Introduction to the Design and Behavior of Bolted Joints, J. H. Bickford; 3 rd Ed.;Dekker, 1995
3. Machinery's Handbook, Twentieth Edition; Industrial Press, 1975
4. ASME Code, Section II, Part D (1998)
5. ASME Code, Section III, Subsection NB (1998)
6. C. F. Magnuson. Manufacture-to-Stockpile Sequence. SAND83-0480, Sandia National Laboratory,Albuquerque, NM 87115 (June 1983)
7. Shock and Vibration Handbook, C. M. Harris and C. E. Crede; 2nd Ed; McGraw-Hill., 1976
8. Engineering Design; 2"d Edition; J. H. Faupel & F. E. Fisher. Wiley, 1981
9. Mechanical Engineering Design; 3rd Edition; J. E. Shigley. McGraw-Hill, 1977
Appendix 2.4 - 63 of 70

Revision I S-SAR-G-0000 IT-CLC-A-00172, Rev. 2, Pg.62 of 68
Appendix A
DT-22 Test Photographs
Appendix 2.4 - 64 of 70
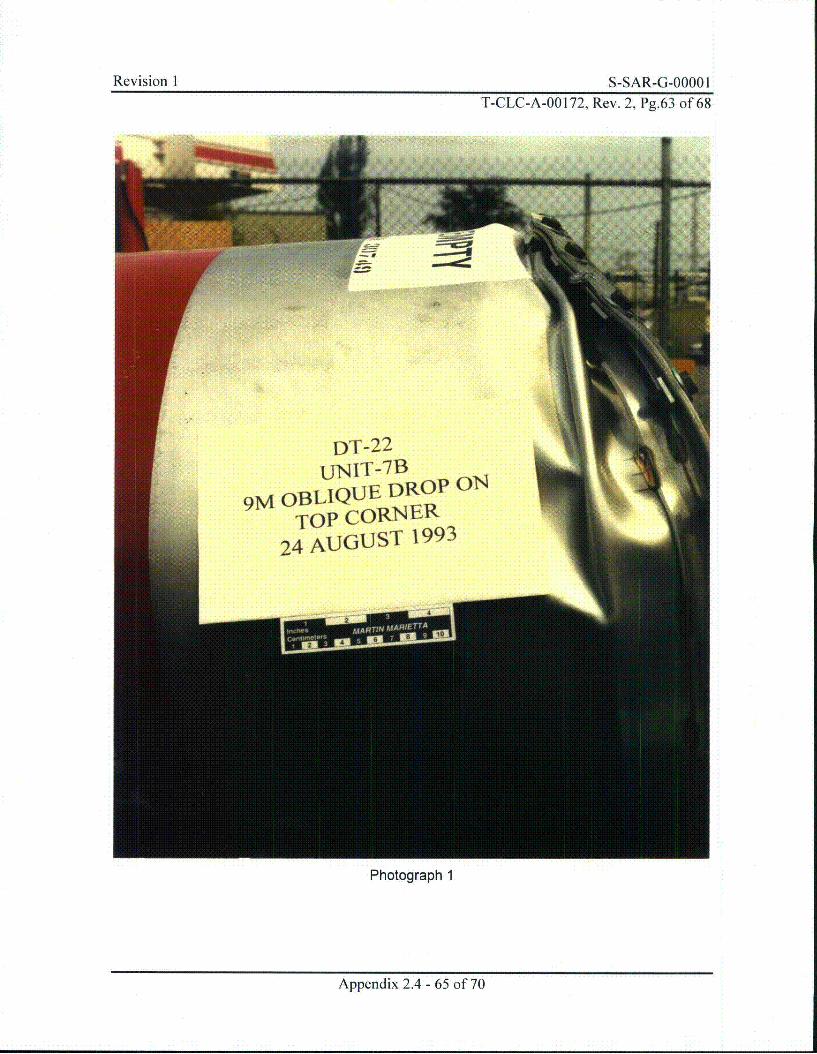
Revision I S-SAR-G-0000 IT-CLC-A-00172, Rev. 2, Pg.63 of 68
Photograph 1
Appendix 2.4 - 65 of 70
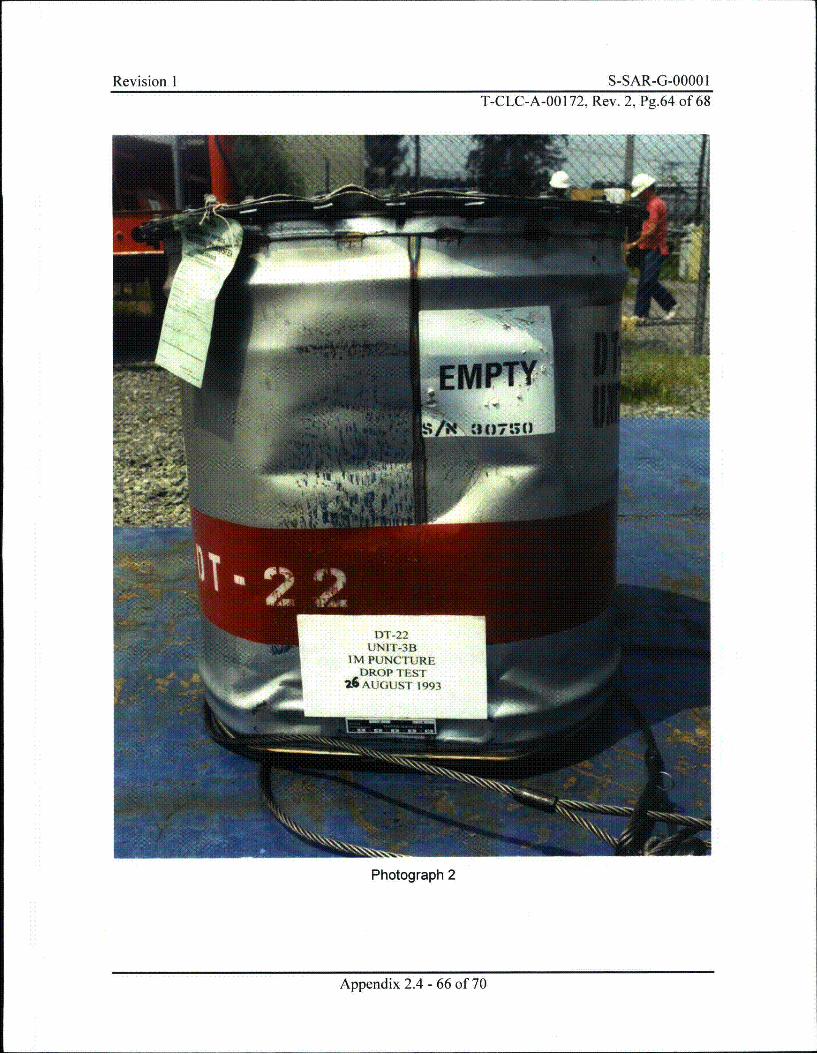
Revision I S-SAR-G-0000 IT-CLC-A-00 172, Rev. 2, Pg.64 of 68
Photograph 2
Appendix 2.4 - 66 of 70
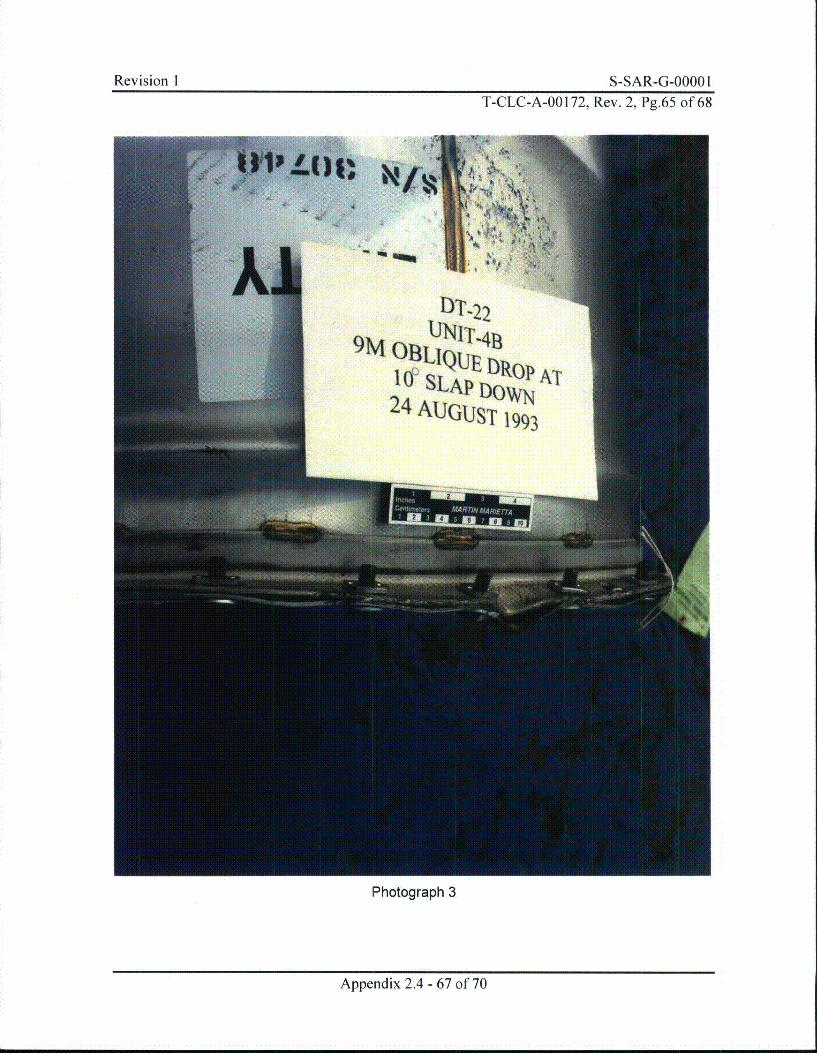
Revision I S-SAR-G-0000 IT-CLC-A-00172, Rev. 2, Pg.65 of 68
9MAT
1993
Photograph 3
Appendix 2.4 - 67 of 70
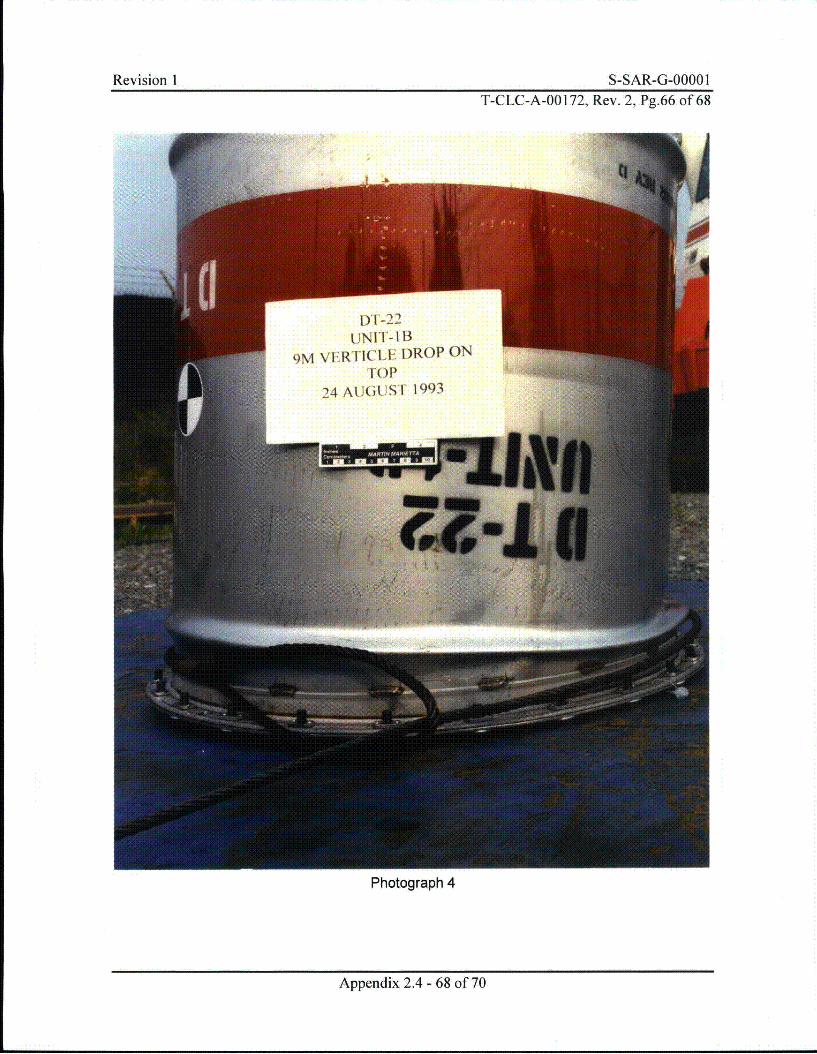
Revision I S-SAR-G-00001T-CLC-A-00172, Rev. 2, Pg.66 of 68
Photograph 4
Appendix 2.4 - 68 of 70
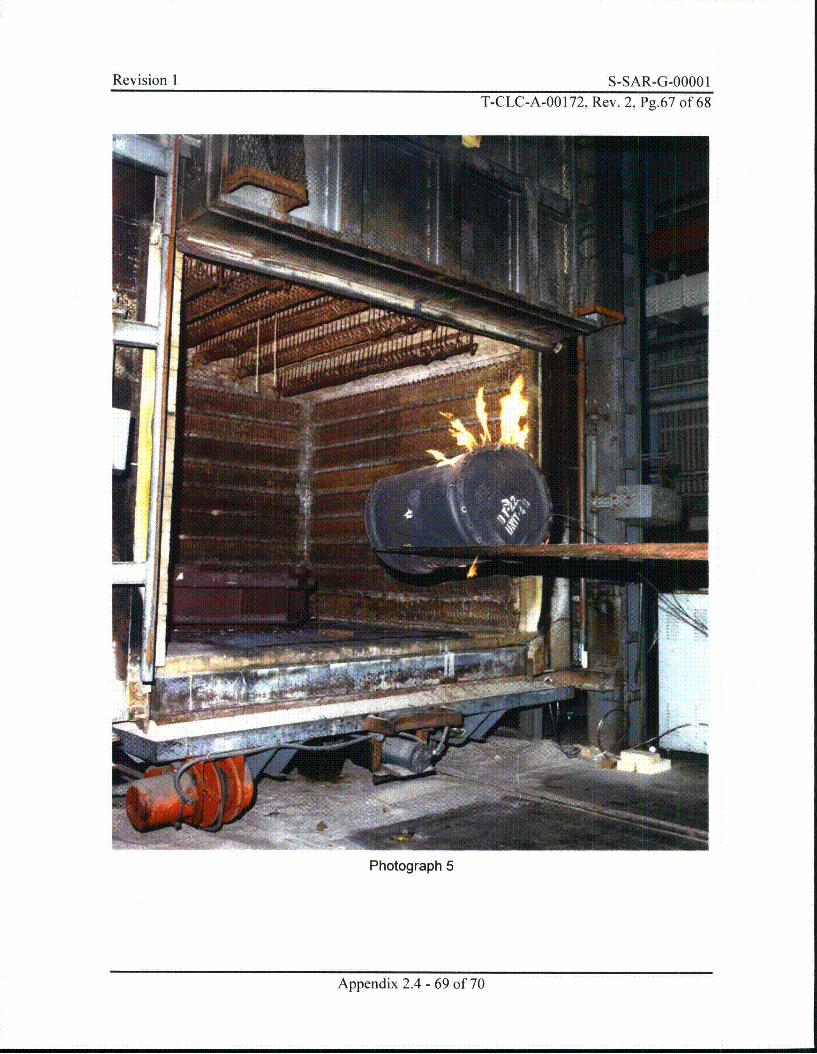
Revision I S-SAR-G-00001T-CLC-A-00172, Rev. 2, Pg.67 of 68
Photograph 5
Appendix 2.4 - 69 of 70
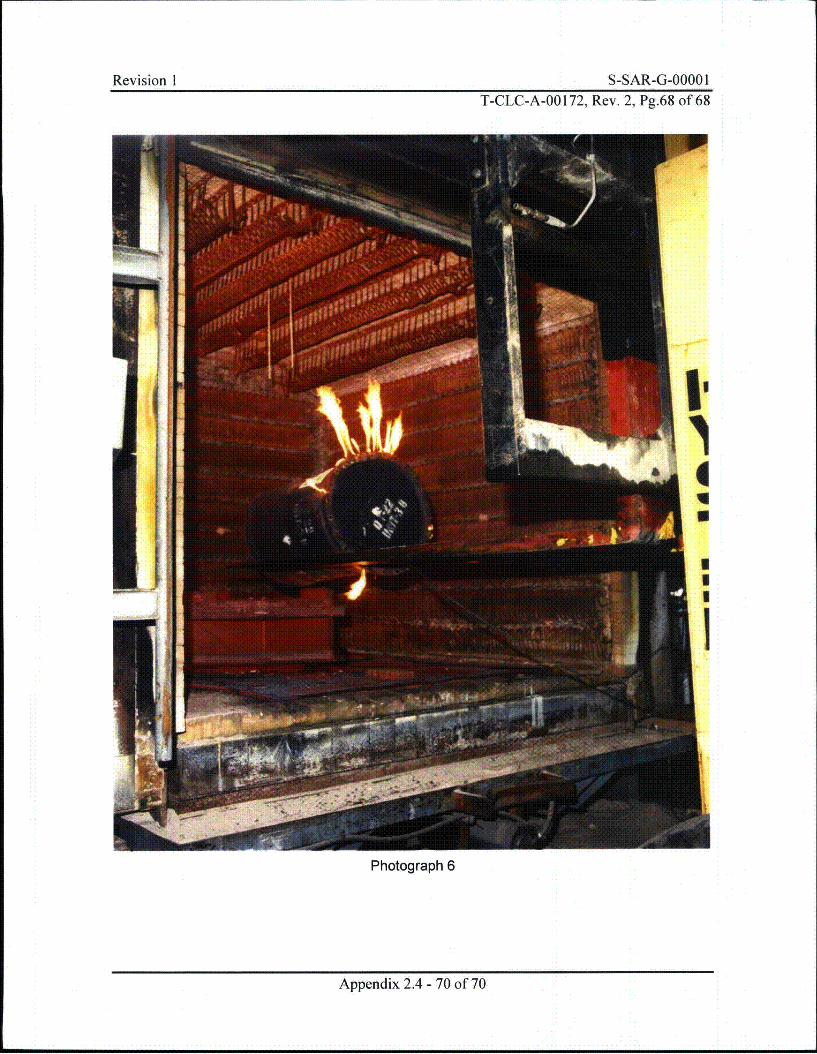
Revision I S-SAR-G-00001T-CLC-A-00172, Rev. 2, Pg.68 of 68
Photograph 6
Appendix 2.4 - 70 of 70
Revision I S-SAR-G-0000 IRevision I S-SAR-G-OOOO 1
APPENDIX 2.5
9975 PACKAGING COMPARISONS
WITH THE 9966, 9967, 9968, 9973, 9974, AND 9975 PROTOTYPE
Appendix 2.5 - I of 16

Revision I S-SAR-G-0000 IRevision 1 S-SAR-G-OOOO 1
This Page Intentionally Left Blank
Appendix 2.5 - 2 of 16
Revision I S-SAR-G-00001
9975 PACKAGING COMPARISONSWITH THE 9966, 9967, 9968, 9973, 9974, AND 9975 PROTOTYPE
This appendix provides comparisons between the 9975 packaging and packagings of similardesign• 1,] to show that results from Hypothetical Accident Condition (HAC) impact testing andHAC thermal testing are applicable to the 9975. Comparisons of package components andconfigurations are shown in the following figures and tables.
HAC testing consists of subjecting the packaging to a series of structural and thermal events.10 CFR 71.41 authorizes evaluation by subjecting a specimen to these tests. Accordingly, thefollowing comparisons and the package test results summarized in Chapter 2 demonstrate thatthe 9975 package is compliant with 10 CFR 71.
The comparisons are presented in a manner consistent with Regulatory Guide 7.9, Section2.7. l.d, Comparison to Similar Packages.
The principal results from testing of comparable packages that support the HAC evaluation ofthe 9975 are:
" The integrity of the drum enclosure (9967, 9968, 9974 and 9975 Prototype)" The integrity of the containment vessels (9967, 9968, 9974 and 9975 Prototype)" Thermal performance of packaging (9967, 9973 and 9975 Prototype)
The 9967 and 9974 packages are based on 55-gallon drums and include lead shielding over twiceas thick as that of the 9975 design. Hence, these packages are significantly heavier than the9975. Because of heavier weight, the HAC impact responses of the 9967 and the 9974documented in previous SARPs[1 2] involve more severe damage than the lighter 9975.However, both the PCVs and SCVs are the same basic designs except for approximately 5-inchshorter lengths than those employed in the 9975 design.
Since impact energy is linear with mass, the resulting impact energy absorbed by the 9967 and9974 from a 30-ft drop is over 50% greater than that of the 9975. In addition, since the impactcharacteristics of a Celotex-insulated drum are common to these packages, the impact forcestransmitted to the respective containment systems are in the same proportion. Satisfactoryperformance of the heavier 9974 and 9967 packages establishes that the performance of thelighter 9975 is acceptable by comparison.
The 9968 is a predecessor and largely identical to the 9975 with the exceptions of the carbonsteel drum material, bolt/nut/ring drum closure and tie rods for assembling the insulation layersused in the 9968. The carbon steel drum has lower tensile strength than the 9975's 304Lstainless steel drum and as a result is more susceptible to structural damage. Therefore,favorable results from 9968 drop testing that demonstrated continued drum integrity and leak-tightness of the containment vessels are applicable to the 9975.
The 9967 and 9973 are lighter and absorb lower impact energy than the 9975 package. Whilegeneral comparisons of structural damage to the containment features are not applicable to the
Appendix 2.5 - 3 of 16
Revision I S-SAR-G-0000 I
9975, a comparison can be made between the thermal features of the packages. The thermalloadings on the containment system of the 9973 are more severe than on the 9975 as follows:
* Less Celotex axial thickness in the 9973 nearest the containment vessel closures* Absence of lead shield in the 9973 (absence of hot vapor barrier)
A 9973 package was chosen to evaluate fire testing on a drop-damaged package. A 9975package was chosen to evaluate the effect of preheated contents on fire testing but it was notdrop tested before the fire test. Therefore, it is necessary to use the results from the 9973 fire testto provide confirmation that the 9975 will pass the HAC regulatory test sequence.
Compared to the 9975, the 9973 has a lower thermal capacity because there is no lead shieldingand the containment vessels are lighter. Although the 9973 has slightly larger radial insulationmaterial (5.5 inches versus 4.75 for the 9975), the increased insulating effect for the 9973 has aminor effect. This is seen in the 9973 test results from Appendix 3.5, which show that theincrease in temperature from steady state at the SCV seal is substantially greater (-50'F) than the9975 at the same location. If the 9973 had contained heat generating contents, the maximum sealtemperature could reach 235°F or slightly higher, which would not challenge its limit or any ofthe component temperature limits.
Therefore, results of thermal tests on the 9973 package are more severe on the containmentfunction of the package and consequently bound the 9975 thermal behavior. It may beconcluded that if the 9975 had undergone a drop test followed by a fire test with a 19-watt heatload, it would be expected to meet the regulatory HAC performance requirements.
The 9966 package is nearly identical to the 9973 except there is no air-shield on the 9966, whichlessens the protection of the Celotex during the fire. The result of the fire test on the 99661'Jshowed no damage to the containment vessels and temperatures were well within limits for thesecomponents. Therefore, thermal testing of the 9966 package is more severe on the containmentfunction of the package and consequently results of bound the 9975 thermal behavior.
The 9975 prototype package is exactly like the current 9975 design except for the drum closure.Drop tests performed on the 9975 prototype demonstrated a potential failure mode for the ringclosure. As a result of these tests, the drum closure was redesigned to a bolted-flange,characteristic of the type used on Oak Ridge Y-12 Plant packages of the same or heavier weight.The drum closure style has no effect on the loads and stresses of the containment vessels or thetemperatures of the drum internals, therefore not all tests were re-run.
REFERENCES:
I. Safety Analysis Report - Packages.- USA/9965/B(U)F (DOE), USA/9966/B(U)F (DOE),USA/9967/B(U)F (DOE), USA/9968/B(U) F (DOE), (Packaging of Fissile and OtherRadioactive Materials), DPSPU 83-124-1, Rev. 0, Savannah River Site, Aiken, SC (June1984).
2. Safety Analysis Report - Packages.- 9965, 9968, 9972-9975Packages (U), WSRC-SA-7,Rev. 0, Savannah River Site, Aiken, SC (December 1994).
Appendix 2.5 - 4 of 16
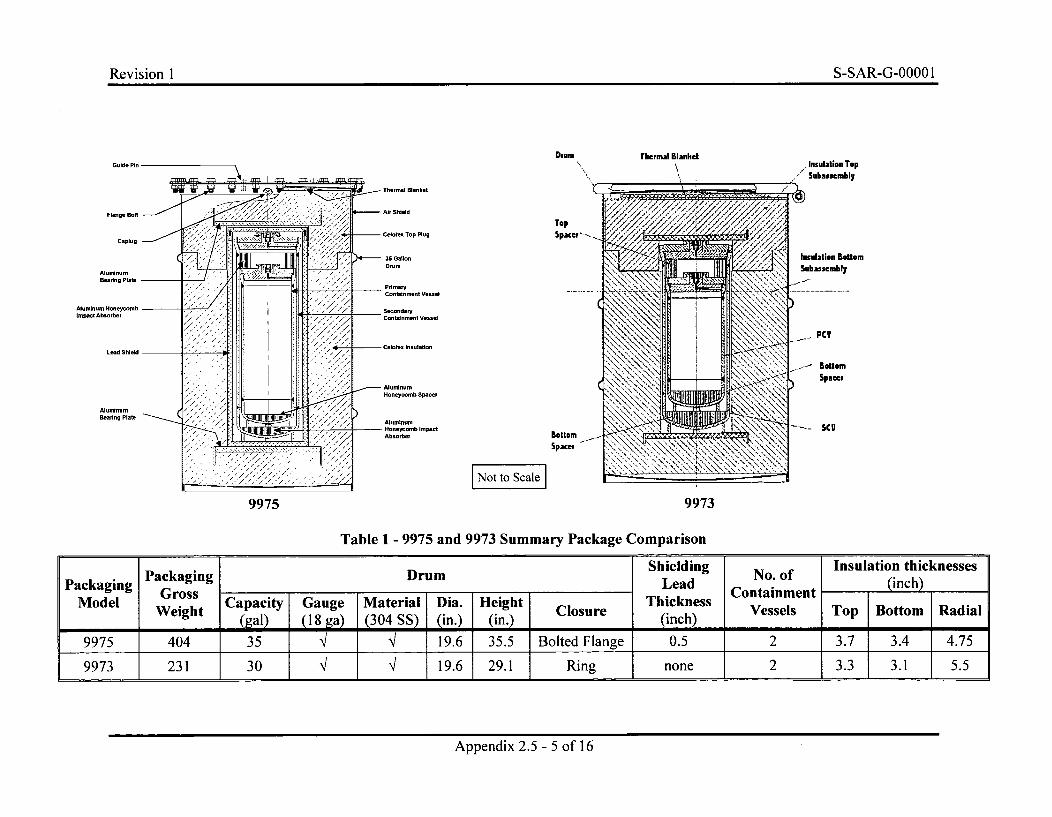
Revision I S-SAR-G-0000 1
Drum Thermal BlanketInsulation TopSubassembly
Thermal Blanket
Air Shield
TopSpacer -------Calotex Top Plug
35 GatlonDrum
PrinmaryContainment Vessel
SecondaryContainment Vessel
- Celotex Insulation
Al umninum
Honeycomb Spacer
Aluminum- Honeycomb lmpact
Absorber BottomSpacer
~~ScaIe
9975 9973
Table 1 - 9975 and 9973 Summary Package Comparison
Appendix 2.5 - 5 of 16
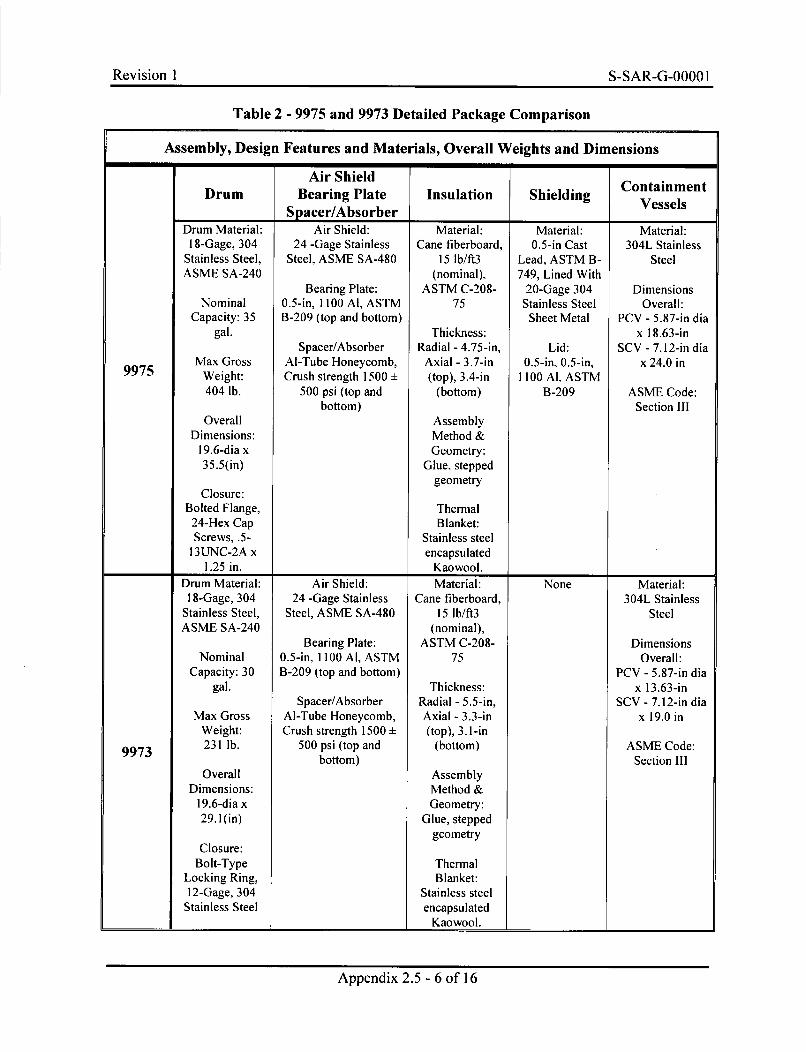
Revision I S-SAR-G-0000 IRevision I S-S AR-G-OOOO I
Table 2 - 9975 and 9973 Detailed Package Comparison
Assembly, Design Features and Materials, Overall Weights and Dimensions- ~ p I I I
DrumAir Shield
Bearing PlateSpacer/Absorber
Insulation ShieldingContainment
Vessels4 4
9975
Drum Material:18-Gage, 304
Stainless Steel,ASME SA-240
NominalCapacity: 35
gal.
Max GrossWeight:404 lb.
OverallDimensions:
19.6-dia x35.5(in)
Closure:Bolted Flange,
24-Hex CapScrews, .5-
13UNC-2A x1.25 in.
Air Shield:24 -Gage Stainless
Steel, ASME SA-480
Bearing Plate:0.5-in, 1100 Al, ASTMB-209 (top and bottom)
Spacer/AbsorberAl-Tube Honeycomb,Crush strength 1500 +
500 psi (top andbottom)
Material:Cane fiberboard,
15 lb/ft3(nominal),
ASTM C-208-75
Thickness:Radial - 4.75-in,
Axial - 3.7-in(top), 3.4-in
(bottom)
AssemblyMethod &Geometry:
Glue, steppedgeometry
ThermalBlanket:
Stainless steelencapsulated
Kaowool.
Material:0.5-in Cast
Lead, ASTM B-749, Lined With
20-Gage 304Stainless Steel
Sheet Metal
Lid:0.5-in, 0.5-in,
1100 Al, ASTMB-209
Material:304L Stainless
Steel
DimensionsOverall:
PCV - 5.87-in diax 18.63-in
SCV - 7.12-in diax 24.0 in
ASME Code:Section II1
Drum Material:18-Gage, 304
Stainless Steel,ASME SA-240
NominalCapacity: 30
gal.
Max GrossWeight:231 lb.
OverallDimensions:
19.6-dia x29.1(in)
Closure:Bolt-Type
Locking Ring,12-Gage, 304
Stainless Steel
Air Shield:24 -Gage Stainless
Steel, ASME SA-480
Bearing Plate:0.5-in, 1100 Al, ASTMB-209 (top and bottom)
Spacer/AbsorberAl-Tube Honeycomb,Crush strength 1500 ±
500 psi (top andbottom)
9973
Material:Cane fiberboard,
15 lb/ft3(nominal),
ASTM C-208-75
Thickness:Radial - 5.5-in,Axial - 3.3-in(top), 3. 1-in
(bottom)
AssemblyMethod &Geometry:
Glue, steppedgeometry
ThermalBlanket:
Stainless steelencapsulated
Kaowool.
None Material:304L Stainless
Steel
DimensionsOverall:
PCV - 5.87-in diax 13.63-in
SCV - 7.12-in diax 19.0 in
ASME Code:Section III
Appendix 2.5 - 6 of 16
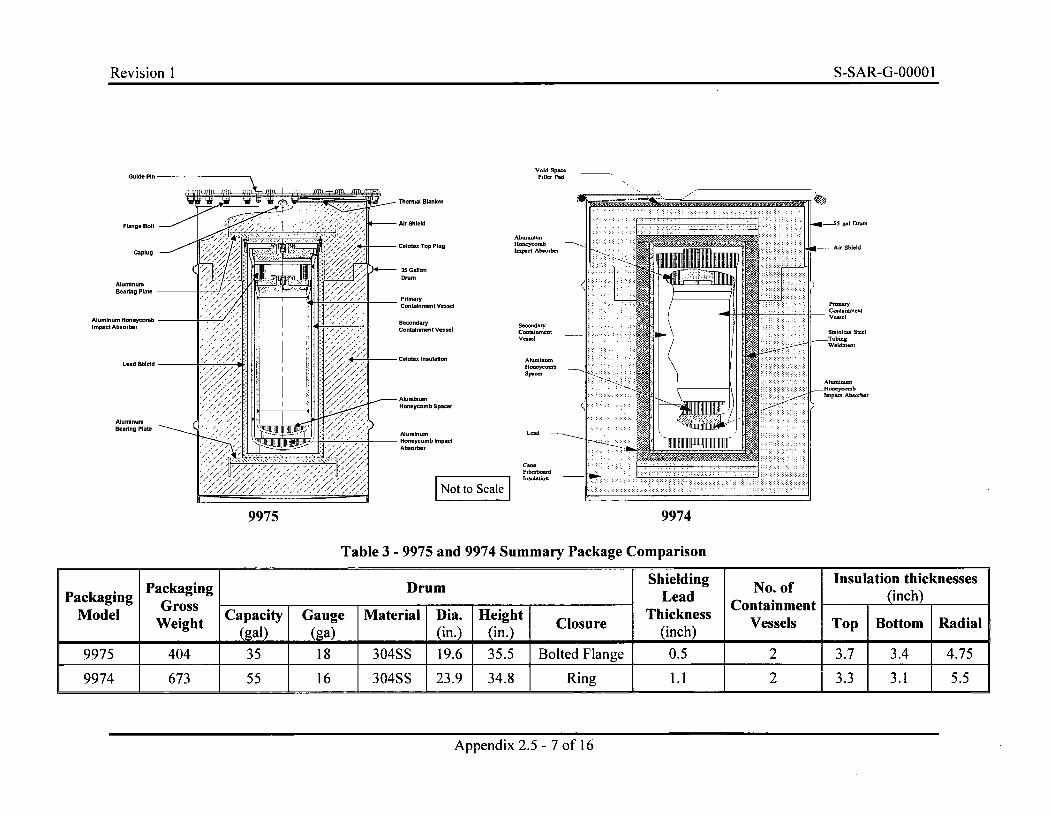
Revision I S-SAR-G-O000 1
Void SpaceFille, Pad
-Thermal Blanket
-Air Shield
Celotex Top Plug
S35 GalonDrum
Prmary
Containment Vesse
SecondaryContainment Vessel
-Celotex Insulation
HoneyrombLmpwr Absorber
Secnodary
Aloa -oH-onyoomSlracc,
- AlumlnumHoneycomb Spacer
AluminumH- oneycomb ImpactAbsorber
I NoSt aIe
Load
loaolnlieo
9975 9974
Table 3 - 9975 and 9974 Summary Package Comparison
Packaging Drum Shielding No. of Insulation thicknessesPackaging -Gross__ __Lead Containment
Model Weight Capacity Gauge Material Dia. Height Closure Thickness Cnament T Bto Raieight (gal) (ga) (in.) (in.) Closure (inch) Vessels Top Bottom Radial
9975 404 35 18 304SS 19.6 35.5 Bolted Flange 0.5 2 3.7 3.4 4.75
9974 673 55 16 304SS 23.9 34.8 Ring 1.1 2 3.3 3.1 5.5
Appendix 2.5 - 7 of 16
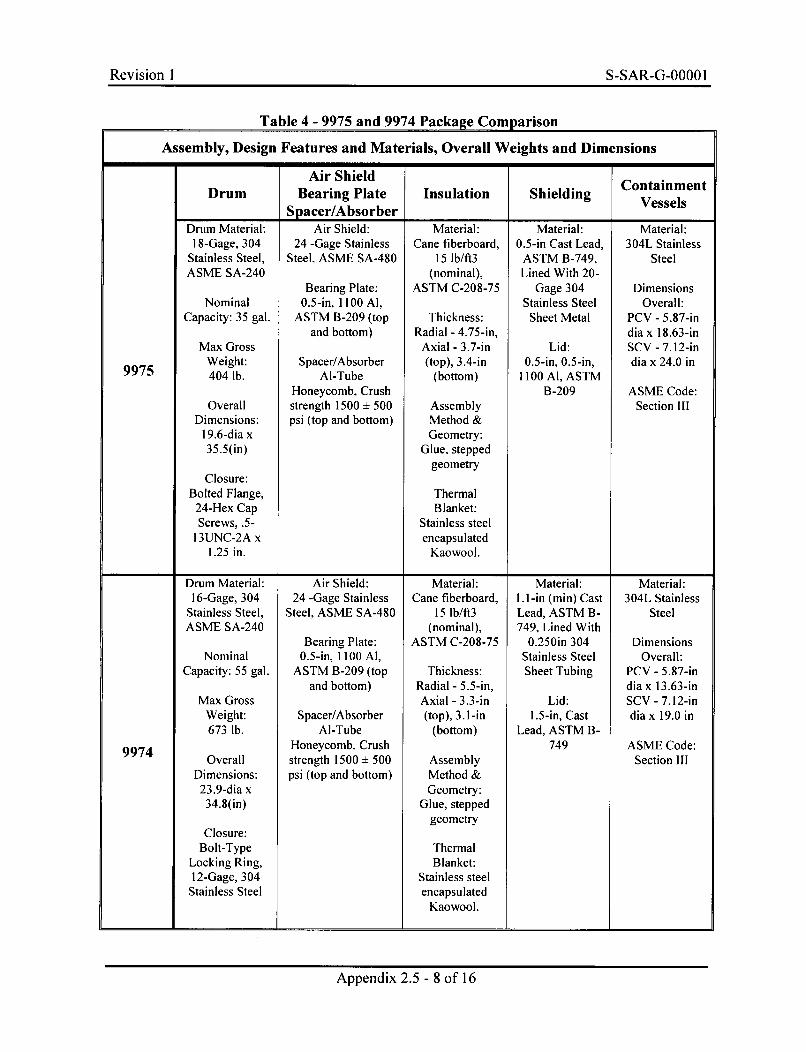
Revision I S-SAR-G-00001Revision I S-SAR-G-OOOO 1
Table 4 - 9975 and 9974 Package Comparison
Assembly, Design Features and Materials, Overall Weights and DimensionsP P P I
DrumAir Shield
Bearing PlateSpacer/Absorber
Insulation ShieldingContainment
Vessels
9975
Drum Material:18-Gage, 304
Stainless Steel,ASME SA-240
NominalCapacity: 35 gal.
Max GrossWeight:404 lb.
OverallDimensions:
19.6-dia x35.5(in)
Closure:Bolted Flange,
24-Hex CapScrews, .5-
13UNC-2A x1.25 in.
Air Shield:24 -Gage Stainless
Steel, ASME SA-480
Bearing Plate:0.5-in, 1100 Al,
ASTM B-209 (topand bottom)
Spacer/AbsorberAl-Tube
Honeycomb, Crushstrength 1500 ± 500psi (top and bottom)
Material:Cane fiberboard,
15 lb/ft3(nominal),
ASTM C-208-75
Thickness:Radial - 4.75-in,
Axial - 3.7-in(top), 3.4-in
(bottom)
AssemblyMethod &Geometry:
Glue, steppedgeometry
ThermalBlanket:
Stainless steelencapsulated
Kaowool.
Material:0.5-in Cast Lead,
ASTM B-749,Lined With 20-
Gage 304Stainless Steel
Sheet Metal
Lid:0.5-in, 0.5-in,
1100 Al, ASTMB-209
Material:304L Stainless
Steel
DimensionsOverall:
PCV - 5.87-india x 18.63-inSCV - 7.12-india x 24.0 in
ASME Code:Section III
4Drum Material:
16-Gage, 304Stainless Steel,ASME SA-240
NominalCapacity: 55 gal.
Max GrossWeight:673 lb.
OverallDimensions:23.9-dia x
34.8(in)
Closure:Bolt-Type
Locking Ring,12-Gage, 304Stainless Steel
Air Shield:24 -Gage Stainless
Steel, ASME SA-480
Bearing Plate:0.5-in, 1100 Al,
ASTM B-209 (topand bottom)
Spacer/AbsorberAl-Tube
Honeycomb, Crushstrength 1500 ± 500psi (top and bottom)
Material:Cane fiberboard,
15 lb/ft3(nominal),
ASTM C-208-75
Thickness:Radial - 5.5-in,Axial - 3.3-in(top), 3.1-in
(bottom)
AssemblyMethod &Geometry:
Glue, steppedgeometry
ThermalBlanket:
Stainless steelencapsulated
Kaowool.
Material:1.1-in (min) CastLead, ASTM B-749, Lined With
0.250in 304Stainless SteelSheet Tubing
Lid:1.5-in, Cast
Lead, ASTM B-749
Material:304L Stainless
Steel
DimensionsOverall:
PCV - 5.87-india x 13.63-inSCV - 7.12-india x 19.0 in
ASMIE Code:Section III
9974
Appendix 2.5 - 8 of 16
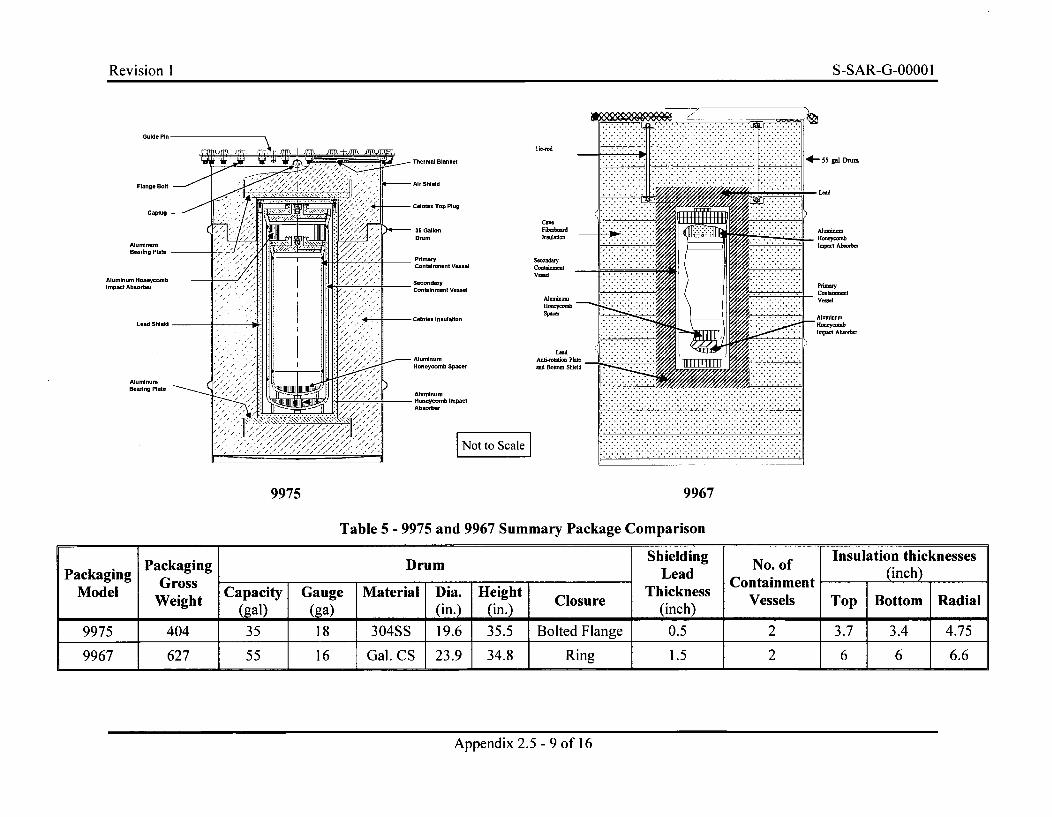
Revision I S-SAR-G-O000 1
Guide Pin
Flange Bolt
Caplug
Alum numBeadng Plat.
Aluminum HoneycombImpact Absorber
Lead Shield
AluminumBearing Platn
Tis-od
kt
ug
cam,Fiberboard
Secondar
Vessel
AlumnilumHoonycomb
Hon
LeadAnli-rnotolun Plato
pam. and Bo.om Shield
hPact
t'po , ouat
......... ........... ........ ............................. .......... ..ý......... ....... ..... ... ... .. . . ...............................I .... ........ ...... ..... .............. .........................
........ ............................................................................. ........ .* ...........I ................. ......I ............. ..... .. ......- ...... ... .. .............................. .............- I ... .... ... ...... .... ... ......................... ..............
*- 55 gal Doo
Lead
Alulnu-
HoneycombImpat Absorber
9975 9967
Table 5 - 9975 and 9967 Summary Package Comparison
mShielding Insulation thicknessesPcaigPackaging Drum Lheadin No. of (inh)____Packaing rossLead Containment (nh
Model Gross Capacity Gauge Material Dia. Height Closure Thickness C enTWeight (al) (ga) (in.) (in.) Closure (inch) Vessels Top Bottom Radial
9975 404 35 18 304SS 19.6 35.5 Bolted Flange 0.5 2 3.7 3.4 4.75
9967 627 55 16 Gal. CS 23.9 34.8 Ring 1.5 2 6 6 6.6
Appendix 2.5 - 9 of 16
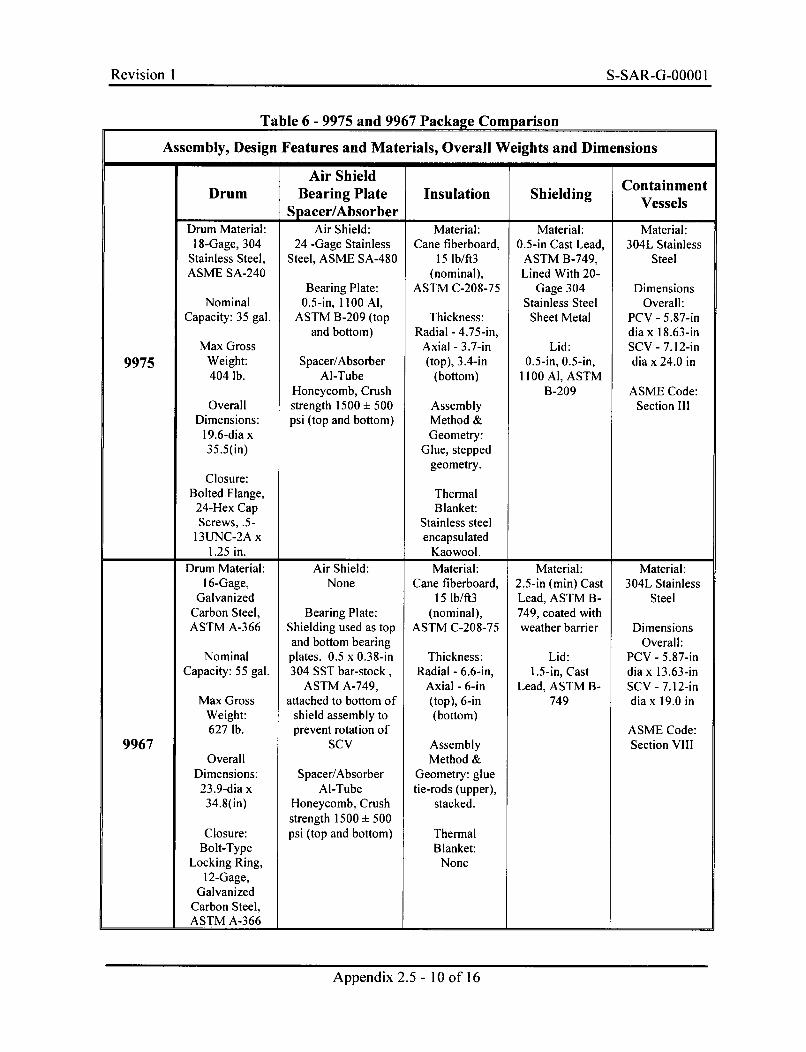
Revision I S-SAR-G-00001
Table 6 - 9975 and 9967 Package Comparison
Assembly, Design Features and Materials, Overall Weights and DimensionsI
- Y
DrumAir Shield
Bearing PlateSpacer/Absorber
9975
Drum Material:18-Gage, 304
Stainless Steel,ASME SA-240
NominalCapacity: 35 gal.
Max GrossWeight:404 lb.
OverallDimensions:
19.6-dia x35.5(in)
Closure:Bolted Flange,
24-Hex CapScrews, .5-
13UTNC-2A x1.25 in.
Air Shield:24 -Gage Stainless
Steel, ASME SA-480
Bearing Plate:0.5-in, 1100 Al,
ASTM B-209 (topand bottom)
Spacer/AbsorberAl-Tube
Honeycomb, Crushstrength 1500 ± 500psi (top and bottom)
Material:Cane fiberboard,
15 lb/ft3(nominal),
ASTM C-208-75
Thickness:Radial - 4.75-in,
Axial - 3.7-in(top), 3.4-in
(bottom)
AssemblyMethod &Geometry:
Glue, steppedgeometry.
ThermalBlanket:
Stainless steelencapsulated
Kaowool.
Material:0.5-in Cast Lead,
ASTM B-749,Lined With 20-
Gage 304Stainless Steel
Sheet Metal
Lid:0.5-in, 0.5-in,
1100 Al, ASTMB-209
304L StainlessSteel
DimensionsOverall:
PCV - 5.87-india x 18.63-inSCV - 7.12-india x 24.0 in
ASMLE Code:Section III
I 4
9967
Drum Material:16-Gage,
GalvanizedCarbon Steel,ASTM A-366
NominalCapacity: 55 gal.
Max GrossWeight:627 lb.
OverallDimensions:
23.9-dia x34.8(in)
Closure:Bolt-Type
Locking Ring,12-Gage,
GalvanizedCarbon Steel,ASTM A-366
Air Shield:None
Bearing Plate:Shielding used as topand bottom bearingplates. 0.5 x 0.38-in304 SST bar-stock,
ASTM A-749,attached to bottom of
shield assembly toprevent rotation of
SCV
Spacer/AbsorberAl-Tube
Honeycomb, Crushstrength 1500 ± 500psi (top and bottom)
Material:Cane fiberboard,
15 lb/ft3(nominal),
ASTM C-208-75
Thickness:Radial - 6.6-in,
Axial - 6-in(top), 6-in(bottom)
AssemblyMethod &
Geometry: gluetie-rods (upper),
stacked.
ThermalBlanket:
None
Material:2.5-in (min) CastLead, ASTM B-749., coated withweather barrier
Lid:1.5-in, Cast
Lead, ASTM B-749
Material:304L Stainless
Steel
DimensionsOverall:
PCV - 5.87-india x 13.63-inSCV - 7.12-india x 19.0 in
ASME Code:Section VIII
Appendix 2.5 - 10 of 16
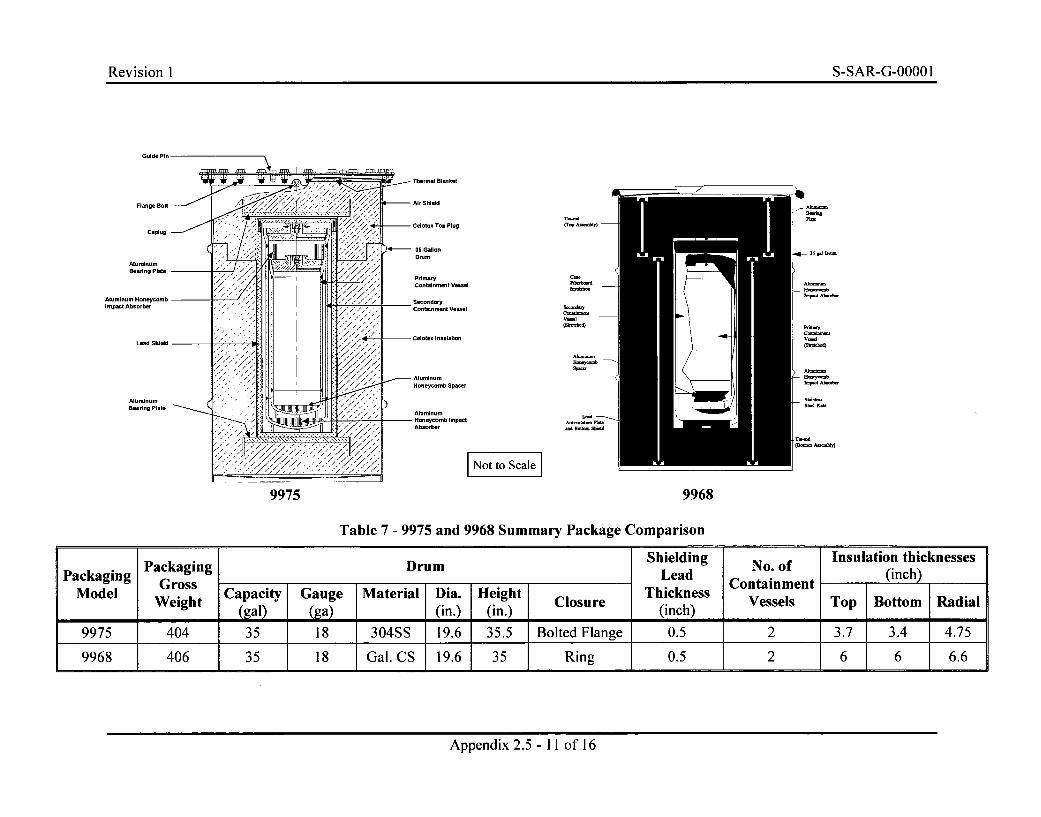
Revision 1 S-SAR-G-00001
Guide Pin*
Flange Bolt
Caplug
AluminumBearing Plate
Aluminum Honeyo mbImpact Abusorbe
Lead Shield
AluminumBeadng Plate
_ 0m~
S-
1&l- 35,W u
h-
-ma
~~ScaIe
9975 9968
Table 7 - 9975 and 9968 Summary Package Comparison
Appendix 2.5 - I11 ofl16
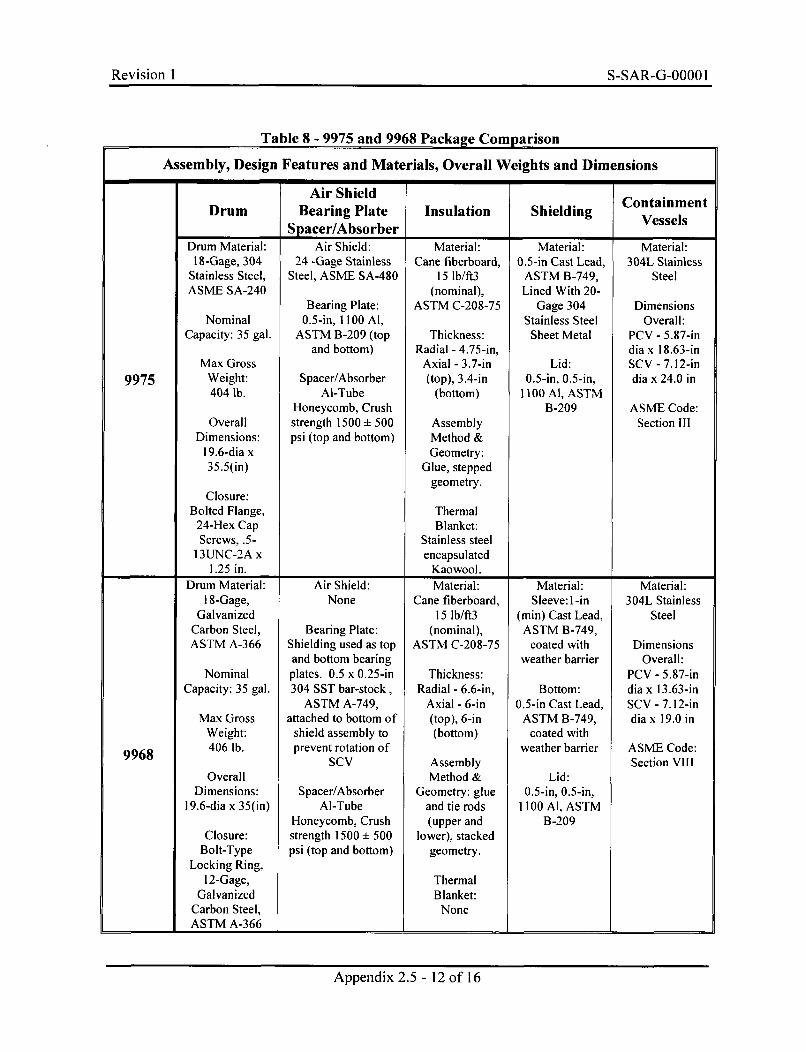
Revision I S-SAR-G-0000 I
Table 8 - 9975 and 9968 Package Comparison
Assembly, Design Features and Materials, Overall Weights and Dimensions-! p
DrumAir Shield
Bearing PlateSpacer/Absorber
Insulation ShieldingContainment
Vessels4 4
9975
Drum Material:18-Gage, 304
Stainless Steel,ASME SA-240
NominalCapacity: 35 gal.
Max GrossWeight:404 lb.
OverallDimensions:
19.6-dia x35.5(in)
Closure:Bolted Flange,
24-Hex CapScrews, .5-
13UNC-2A x1.25 in.
Air Shield:24 -Gage Stainless
Steel, ASME SA-480
Bearing Plate:0.5-in, 1100 Al,
ASTM B-209 (topand bottom)
Spacer/AbsorberAl-Tube
Honeycomb, Crushstrength 1500 + 500psi (top and bottom)
Material:Cane fiberboard,
15 lb/ft3(nominal),
ASTM C-208-75
Thickness:Radial - 4.75-in,
Axial - 3.7-in(top), 3.4-in
(bottom)
AssemblyMethod &Geometry:
Glue, steppedgeometry.
ThermalBlanket:
Stainless steelencapsulated
Kaowool.
Material:0.5-in Cast Lead,
ASTM B-749,Lined With 20-
Gage 304Stainless Steel
Sheet Metal
Lid:0.5-in, 0.5-in,
1100 Al, ASTMB-209
Material:304L Stainless
Steel
DimensionsOverall:
PCV - 5.87-india x 18.63-inSCV - 7.12-india x 24.0 in
ASME Code:Section III
I. 4 4
9968
Drum Material:18-Gage,
GalvanizedCarbon Steel,ASTM A-366
NominalCapacity: 35 gal.
Max GrossWeight:406 lb.
OverallDimensions:
19.6-dia x 35(in)
Closure:Bolt-Type
Locking Ring,12-Gage,
GalvanizedCarbon Steel,ASTM A-366
Air Shield:None
Bearing Plate:Shielding used as topand bottom bearingplates. 0.5 x 0.25-in304 SST bar-stock,
ASTM A-749,attached to bottom of
shield assembly toprevent rotation of
SCV
Spacer/AbsorberAl-Tube
Honeycomb, Crushstrength 1500 ± 500psi (top and bottom)
Material:Cane fiberboard,
15 lb/ft3(nominal),
ASTM C-208-75
Thickness:Radial - 6.6-in,
Axial - 6-in(top), 6-in(bottom)
AssemblyMethod &
Geometry: glueand tie rods(upper and
lower), stackedgeometry.
ThermalBlanket:
None
Material:Sleeve: 1-in
(min) Cast Lead,ASTM B-749,
coated withweather barrier
Bottom:0.5-in Cast Lead,
ASTM B-749,coated with
weather barrier
Lid:0.5-in, 0.5-in,
1100 Al, ASTMB-209
Material:304L Stainless
Steel
DimensionsOverall:
PCV - 5.87-india x 13.63-inSCV - 7.12-india x 19.0 in
ASME Code:Section VII1
Appendix 2.5 - 12 of 16
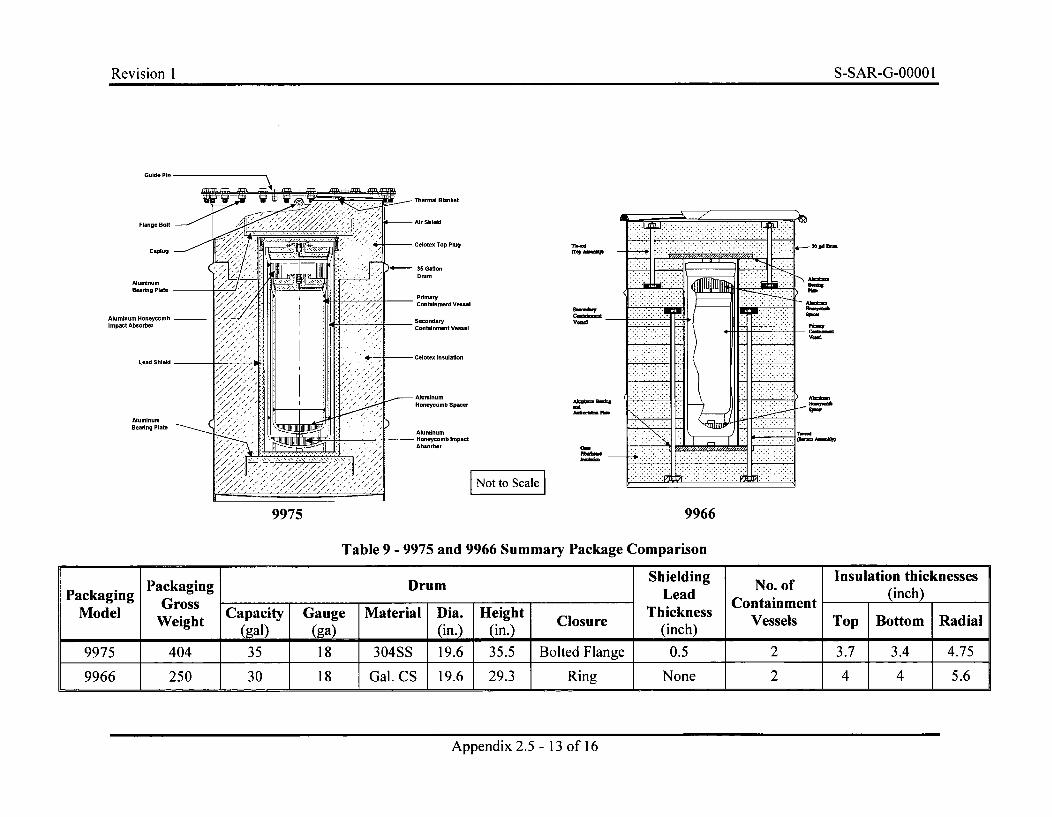
Revision I S-SAR-G-00001
. Thermal Blanket
- Air Shield
- Celotex Top Plug
- 35 GalIonDrum
P inaryContalnument Vessel
SecondaryContainmeont Vessel
Vo -Aluminum HoneycombImpact Absorber
::.Al Ll... . ... .. ... .. .... ... . . .... . ............. ................ ......... ... .. .. .. ... .. .. . ..... .. . .. .. ... .. .... .. .. .. .. .. . ....
.. .. ... .. . . .. .. .. .. . . .
. . . . . . . . . .
..... ......
. ........... . . . . . . . . ............... . ... ... . .. .. ... .... .. .. ... ... .. . ... .
... ..........
. . . . . . . . . . . .
.. . .. .. . .. ... ..... .........
. ............. ... ... . .. ... ... ....
. ... . .. . . .. ... ...
.. ........... ........ .
.. .... ...... >. ............ ... ... .. . ... ... .... ... ... . . .
. ...........
... ............. .. ......... ............. ......... ... ..........
......... ................ ... ............. ....... ... , . . . . .. ...... ................ .... .............. ....... ..........
" so mass,
Dallas
basy
W-wd
- Celotex Insulatbon
- AluminumHoneycomb Spacer Ako as Beebe
sal
AluindnumHoneycomb ImpactAbsorber
Aaaa
9975 9966
Table 9 - 9975 and 9966 Summary Package Comparison
Packaging Drum Shielding No. of Insulation thicknessesPackaging Gross _____Lead Containment (i
Model Weight Capacity Gauge Material Dia. Height Closure Thickness Cnament (nh BotmRdaMogeig al) (ga) (in.) (in.) Closure (inch) Vessels Top Bottom Radial
9975 404 35 18 304SS 19.6 35.5 Bolted Flange 0.5 2 3.7 3.4 4.75
9966 250 30 18 Gal. CS 19.6 29.3 Ring None 2 4 4 5.6
Appendix 2.5 - 13 of 16
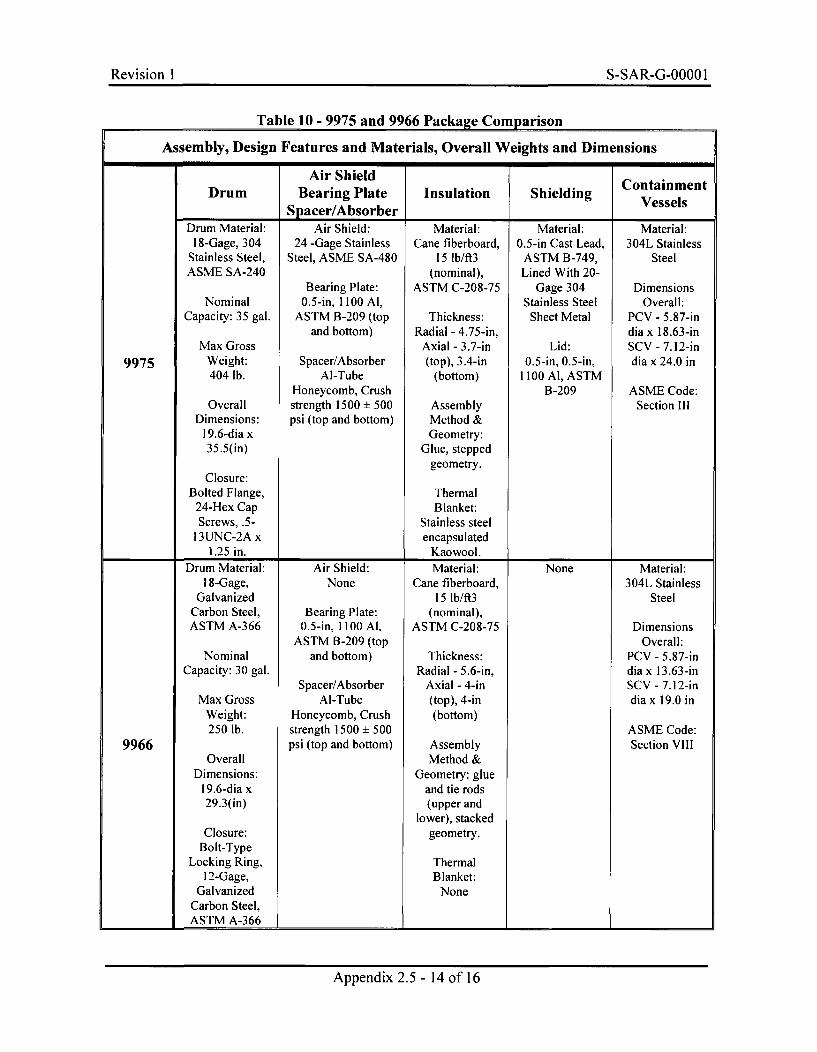
Revision I S-SAR-G-0000 IRevision 1 S-SAR-G-OOOO I
Table 10 - 9975 and 9966 Package Comparison
Assembly, Design Features and Materials, Overall Weights and Dimensions-. q P
DrumAir Shield
Bearing PlateSpacer/Absorber
Insulation ShieldingContainment
Vessels* 4 4
9975
Drum Material:18-Gage, 304
Stainless Steel,ASME SA-240
NominalCapacity: 35 gal.
Max GrossWeight:404 lb.
OverallDimensions:
19.6-dia x35.5(in)
Closure:Bolted Flange,
24-Hex CapScrews, .5-
13UNC-2A x1.25 in.
Air Shield:24 -Gage Stainless
Steel, ASMIE SA-480
Bearing Plate:0.5-in, 1100 Al,
ASTM B-209 (topand bottom)
Spacer/AbsorberAl-Tube
Honeycomb, Crushstrength 1500 ± 500psi (top and bottom)
Material:Cane fiberboard,
15 lb/ft3(nominal),
ASTM C-208-75
Thickness:Radial - 4.75-in,
Axial - 3.7-in(top), 3.4-in
(bottom)
AssemblyMethod &Geometry:
Glue, steppedgeometry.
ThermalBlanket:
Stainless steelencapsulated
Kaowool.
Material:0.5-in Cast Lead,
ASTM B-749,Lined With 20-
Gage 304Stainless Steel
Sheet Metal
Lid:0.5-in, 0.5-in,
1100 Al, ASTMB-209
Material:304L Stainless
Steel
DimensionsOverall:
PCV - 5.87-india x 18.63-inSCV - 7.12-india x 24.0 in
ASME Code:Section III
I 4 4
9966
Drum Material:18-Gage,
GalvanizedCarbon Steel,ASTM A-366
NominalCapacity: 30 gal.
Max GrossWeight:250 lb.
OverallDimensions:
19.6-dia x29.3(in)
Closure:Bolt-Type
Locking Ring,12-Gage,
GalvanizedCarbon Steel,ASTM A-366
Air Shield:None
Bearing Plate:0.5-in, 1100 Al,
ASTM B-209 (topand bottom)
Spacer/AbsorberAl-Tube
Honeycomb, Crushstrength 1500 ± 500psi (top and bottom)
Material:Cane fiberboard,
15 lb/ft3(nominal),
ASTM C-208-75
Thickness:Radial - 5.6-in,
Axial - 4-in(top), 4-in(bottom)
AssemblyMethod &
Geometry: glueand tie rods(upper and
lower), stackedgeometry.
ThermalBlanket:
None
None Material:304L Stainless
Steel
DimensionsOverall:
PCV - 5.87-india x 13.63-inSCV - 7.12-india x 19.0 in
ASME Code:Section VIII
Appendix 2.5 - 14 of 16
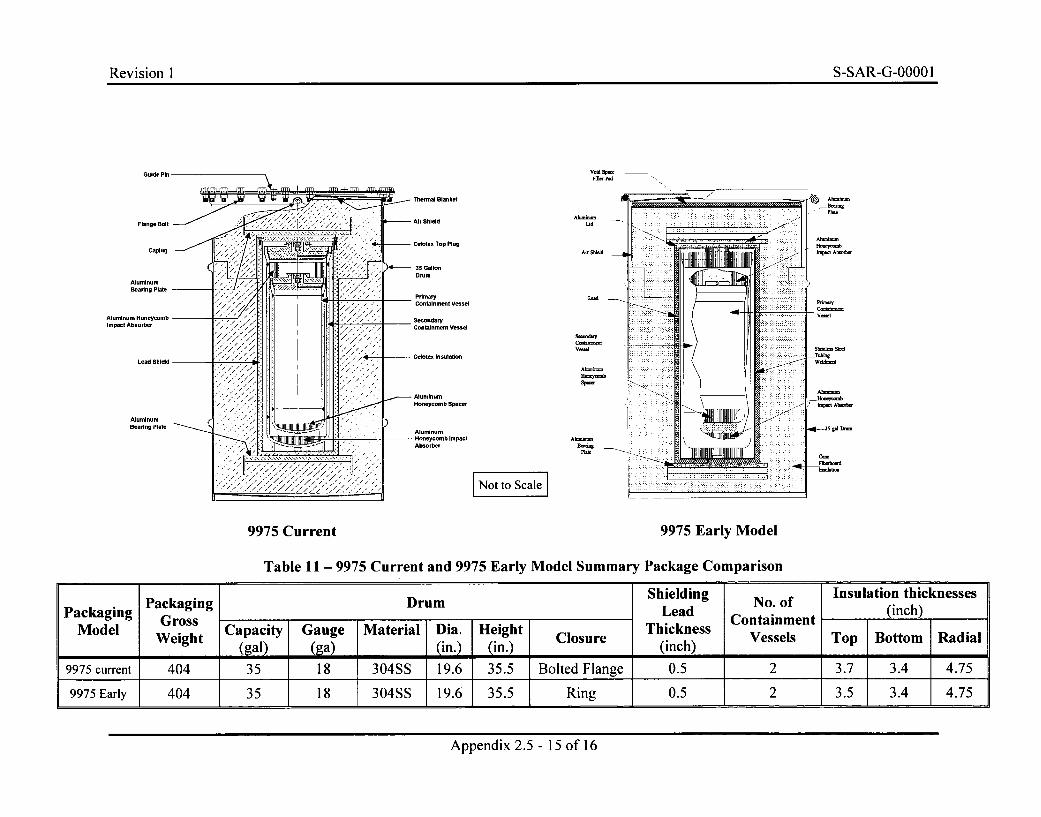
Revision 1 S-SAR-G-0000 I
Void SpeuFlM. Pad
Thermal Blanket
Air Shield
Celotex Top Plug
35 GallonDrum
PrimaryContainment Vessel
SecondaryContainment Vessel
lid
Ail Shn•i
Lead
V-1~
Aluminum HoneycombImpact Absorber
Celotex Insulabon
AluminumHoneycomb Spacer
AluminumHoneycomb ImpactAbsorber
~Scale
9975 Current 9975 Early Model
Table 11 - 9975 Current and 9975 Early Model Summary Package Comparison
Packaging Drum Shielding No. of Insulation thicknessesPackaging Gross Drum Lead Containment (inch)
sWsht Capacity Gauge Material Dia. Height Closure Thickness C enTModaeigl) (ga) (in.) (in.) Closure (inch) Vessels Top Bottom Radial
9975 current 404 35 18 304SS 19.6 35.5 Bolted Flange 0.5 2 3.7 3.4 4.75
9975 Early 404 35 18 304SS 19.6 35.5 Ring 0.5 2 3.5 3.4 4.75
Appendix 2.5 - 15 of 16
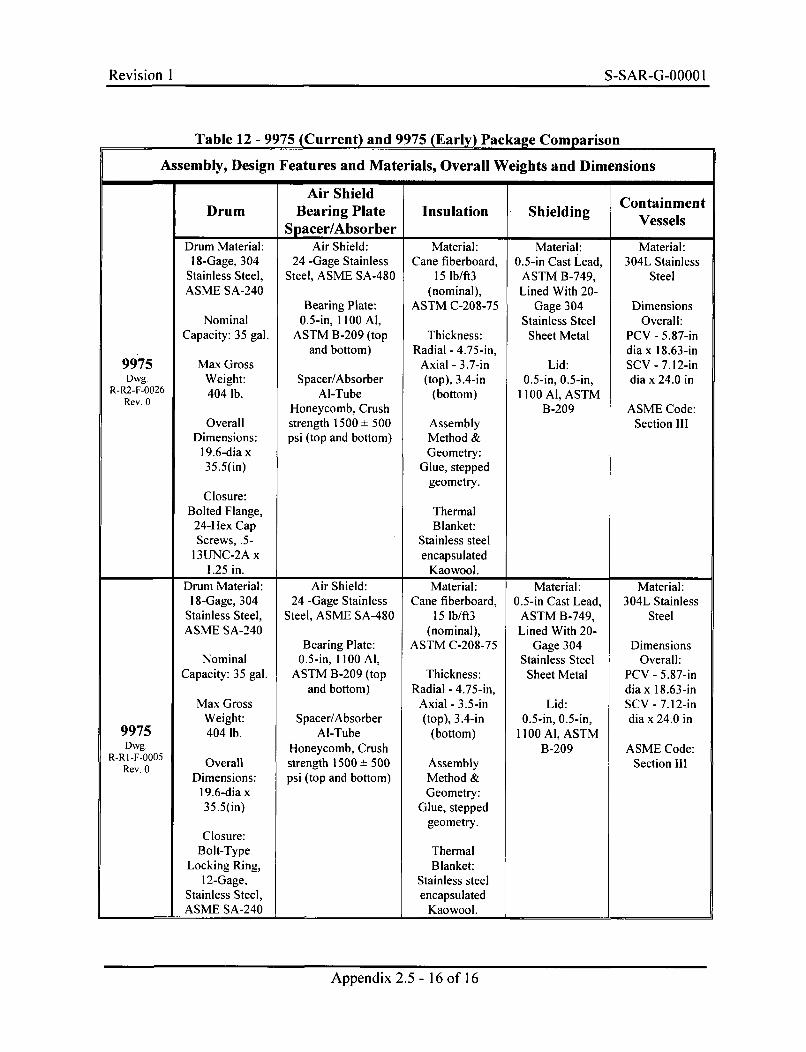
Revision I S-SAR-G-0000 I
Table 12 - 9975 (Current) and 9975 (Early) Package Comparison
Assembly, Design Features and Materials, Overall Weights and DimensionsI q p I P
DrumAir Shield
Bearing PlateSpacer/Absorber
Insulation ShieldingContainment
Vessels__________ - __________ __________ h
9975Dwg.
R-R2-F-0026Rev. 0
Drum Material:18-Gage, 304
Stainless Steel,ASME SA-240
NominalCapacity: 35 gal.
Max GrossWeight:404 lb.
OverallDimensions:
19.6-dia x35.5(n)
Closure:Bolted Flange,
24-Hex CapScrews, .5-
13UNC-2A x1.25 in.
Air Shield:24 -Gage Stainless
Steel, ASME SA-480
Bearing Plate:0.5-in, I 100 Ai,
ASTM B-209 (topand bottom)
Spacer/AbsorberAl-Tube
Honeycomb, Crushstrength 1500 ± 500psi (top and bottom)
Material:Cane fiberboard,
15 lb/ft3(nominal),
ASTM C-208-75
Thickness:Radial - 4.75-in,
Axial - 3.7-in(top), 3.4-in
(bottom)
AssemblyMethod &Geometry:
Glue, steppedgeometry.
ThermalBlanket:
Stainless steelencapsulated
Kaowool.
Material:0.5-in Cast Lead,
ASTM B-749,Lined With 20-
Gage 304Stainless Steel
Sheet Metal
Lid:0.5-in, 0.5-in,
1100 Al, ASTMB-209
Material:304L Stainless
Steel
DimensionsOverall:
PCV - 5.87-india x 18.63-inSCV - 7.12-india x 24.0 in
ASMIE Code:Section III
9975Dwg.
R-R I -F-0005Rev. 0
Drum Material:18-Gage, 304
Stainless Steel,ASME SA-240
NominalCapacity: 35 gal.
Max GrossWeight:404 lb.
OverallDimensions:
19.6-dia x35.5(in)
Closure:Bolt-Type
Locking Ring,12-Gage,
Stainless Steel,ASME SA-240
Air Shield:24 -Gage Stainless
Steel, ASME SA-480
Bearing Plate:0.5-in, I 100 Al,
ASTM B-209 (topand bottom)
Spacer/AbsorberAl-Tube
Honeycomb, Crushstrength 1500 ± 500psi (top and bottom)
Material:Cane fiberboard,
15 lb/ft3(nominal),
ASTM C-208-75
Thickness:Radial - 4.75-in,
Axial - 3.5-in(top), 3.4-in
(bottom)
AssemblyMethod &Geometry:
Glue, steppedgeometry.
ThermalBlanket:
Stainless steelencapsulated
Kaowool.
Material:0.5-in Cast Lead,
ASTM B-749,Lined With 20-
Gage 304Stainless SteelSheet Metal
Lid:0.5-in, 0.5-in,
1100 Al, ASTMB-209
Material:304L Stainless
Steel
DimensionsOverall:
PCV - 5.87-india x 18.63-inSCV - 7.12-india x 24.0 in
ASME Code:Section III
Appendix 2.5 - 16 of 16
Revision I S-SAR-G-0000 IRevision 1 S-SAR-G-OOOO 1
APPENDIX 3.1
NCT THERMAL ANALYSIS BENCHMARKING
Appendix 3.1 - 1 of 14

Revision I S-SAR-G-0000 IRevision 1 S-SAR-G-OOOO 1
This Page Intentionally Left Blank
Appendix 3.1 - 2 of 14
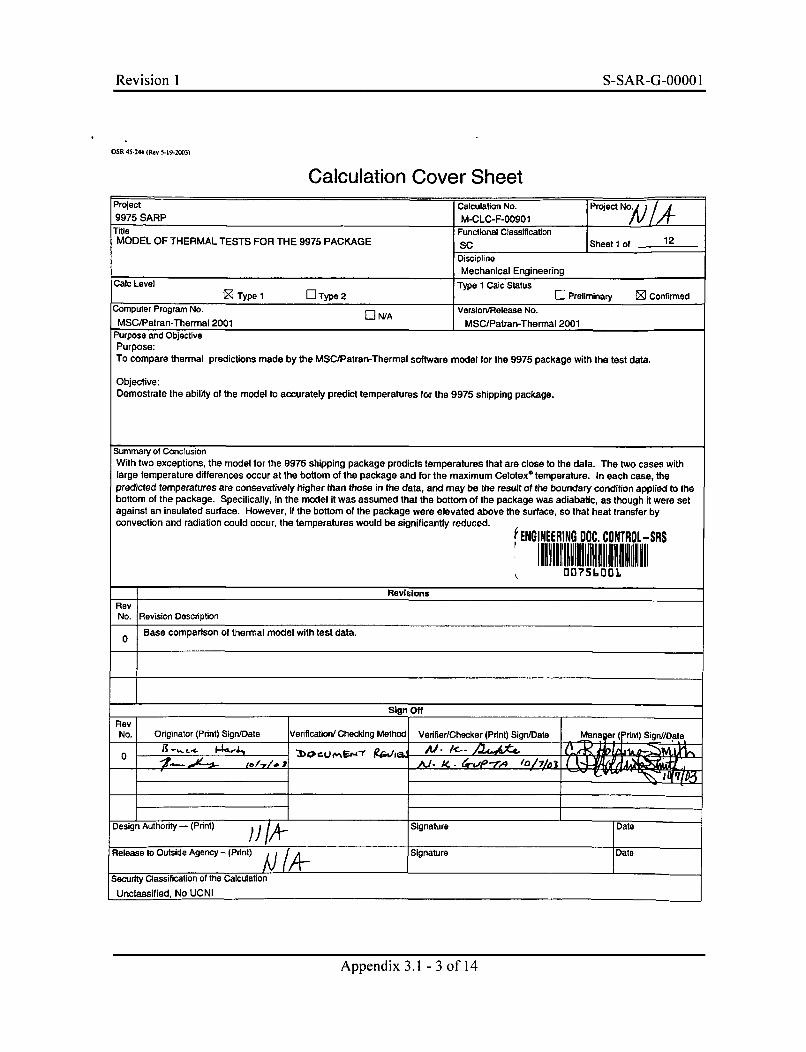
Revision 1 S-SAR-G-0000 1
OSR 45.240 (Rcv 5-19-2W03)
Calculation Cover SheetProject Calculation No. Project NONJ /9975 SARP M-CLC-F-0O901Title Functional ClassificationMODEL OF THERMAL TESTS FOR THE 9975 PACKAGE SC Sheet 1 of 12
Discipline
Mechanical EngineeringCalc Level Tp acSauLe Type 1 El Type 2 Type 1 Calc St Preliminary [ ConfirmedComputer Program No. N/A Version/Release No.
MSC/Patran-Thermal 2001 MSC/Patran-Thermal 2001Purpose and ObjectivePurpose:To compare thermal predictions made by the MSC/Patran-Thermal software model for the 9975 package with the test data.
Objective:Demostrate the ability of the model to accurately predict temperatures for the 9975 shipping package.
summary of ConclusionWith two exceptions, the model for the 9975 shipping package predicts temperatures that are close to the data. The two cases withlarge temperature differences occur at the bottom of the package and for the maximum Celotex* temperature. In each case, thepredicted temperatures are consevatively higher than those in the data, and may be the result of the boundary condition applied to thebottom of the package. Specifically, In the model it was assumed that the bottom of the package was adiabatic, as though it were setagainst an insulated surface. However, if the bottom of the package were elevated above the surface, so that heat transfer byconvection and radiation could occur, the temperatures would be significantly reduced.
0ENGINEERING DO, CONTROL-SRS
00O75600L
RevisionsRevNo. Revision Description
0 Base comparison of thermal model with test data.
Sign Off
RevNo. Originator (Print) Sign/Date Verification/ Checking Method Verifier/Checker (Pdnt) Sign/Date ManeNer (frint) Sign//Date
N. / <,,,,, -.
/,4I
o
0-
Design Authority - (Print) Signature Date
Release to Outside Agency - (Print) ,tj {,- Signature Date
Security Classification of the Calculation
Unclassified, No UCNI
Appendix 3.1 - 3 of 14
Revision 1 S-SAR-G-0000 1M-CLC-F-00901, Rev. 0, Pg.2 of 13
Revisions
Revision Description0 Original Issue
Appendix 3.1 - 4 of 14
Revision 1 S-SAR-G-0000 IM-CLC-F-00901, Rev. 0, Pg.3 of 13
MODEL OF THERMAL TESTS FOR THE 9975 PACKAGE
1.0 Conclusions
In the previous version of the SARP [I], thermal models were used to evaluate the 9975package for the NCT, HAC and the Post-Fire Transient. These models, which werebased on the MSC/ Patran-Thermale general purose heat transfer software, utilized anorthotropic thermal conductivity for the Celotexw insulation. In these models the thermalconductivity of the Celotex® was represented by an orthotropic tensor because it wasinserted into the drum as horizontal layers, which were glued together. To demonstratethe accuracy of the model, it was benchmarked against thermal tests conducted at SandiaNational Laboratories on a mockup of the 9975 package [2]. However, the modelutilized a scalar thermal conductivity for the Celotexo. To ensure consistency with theNCT, HAC and the Post-Fire Transient models, the benchmark comparison was repeatedwith the thermal conductivity of the Celotex® changed to an orthotropic tensor havingidentical components to those used for the other tests. In addition, discrepancies betweenthe dimensions of the benchmark model and the package used in the test were corrected.
The ambient temperature for this analysis was set to 770 F to match the test environment.The power to the heater was 21 Watts and was applied as a surface heat flux on the heaterelement, assumed to be composed of ceramic. In the model, natural convection andthermal radiation boundary conditions were applied to the top and side of the package.There was no heat conduction from the bottom of the package, as though it were standingon an insulated surface. Of course, if the package were raised so that the base was nolonger insulated, the temperatures predicted by the model would be somewhat lower.This may explain the relatively large differences between the predicted and measuredtemperature at the bottom of the package and the maximum Celotex® temperature, seeTable 1.
There was no indication whether air filled gaps existed where the Celotex® contacted thedrum and the lead shield. Therefore several models were created. The results presentedin this document were obtained from a model that assumed no air gaps existed where theCelotex® contacted the shield and the drum.
The comparison with Sandia test data from Table I of Appendix 3.8, Section 1.2 ofReference 1 is given in Table I below. Figure 1 shows the steady state temperatureprofile predicted by the model.
Appendix 3.1 - 5 of 14
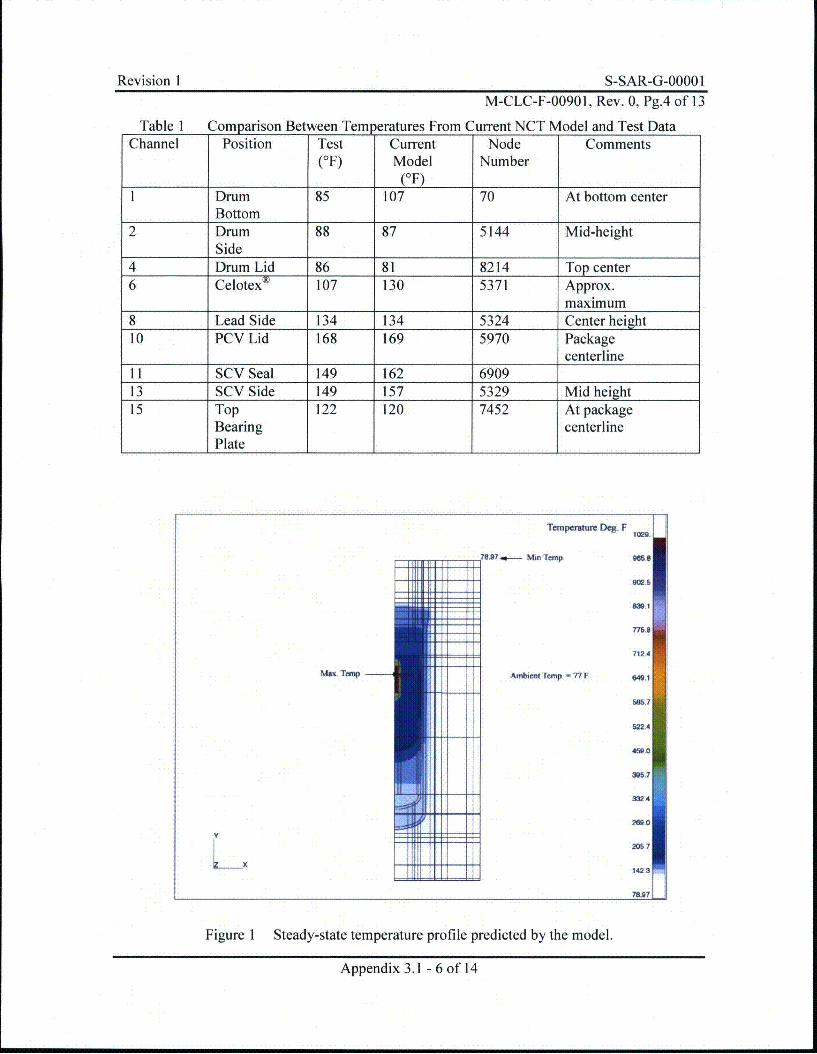
Revision I S-SAR-G-0000 IM-CLC-F-00901, Rev. 0, Pg.4 of 13
Table I Comparison Between Tern eratures From Current NCT Model and Test DataChannel Position Test Current Node Comments
(OF) Model Number(OF)
I Drum 85 107 70 At bottom centerBottom
2 Drum 88 87 5144 Mid-heightSide
4 Drum Lid 86 81 8214 Top center6 Celotex® 107 130 5371 Approx.
maximum8 Lead Side 134 134 5324 Center height10 PCV Lid 168 169 5970 Package
centerline11 SCV Seal 149 162 690913 SCV Side 149 157 5329 Mid height15 Top 122 120 7452 At package
Bearing centerlinePlate
Tempemaure Deg. F
839.1
776,8
712.4
Mox. Temp Abi~ent Temp. 7F 0471
585.7
5224
315,7
332.4
258.0
205.7
142.3
78Fe7 p
Figure 1 Steady-state temperature profile predicted by the model.
Appendix 3.1 - 6 of 14
Revision 1 S-SAR-G-0000 IM-CLC-F-00901, Rev. 0, Pg.5 of 13
2.0 Input
In Reference 1, a comparison was made between the results of a thermal test conductedon a mockup of the 9975 package at Sandia National Laboratories [2] and a thermalmodel. The purpose of the comparison was to demonstrate the adequacy of the thermalmodel for the NCT, HAC and the post fire transient in Reference 1. Because theCelotex® is placed into the drum in horizontal sheets, which are glued together, thethermal conductivity of the Celotex® was input as an orthotropic tensor. However, themodel compared with the test employed a scalar, rather than an orthotropic tensor for thethermal conductivity. In addition, there were a number of geometric discrepanciesbetween the mockup and the model. In this calculation, temperatures predicted by acorrected thermal model are compared to the temperatures measured in the Sandia test.In the model developed for this document, the Celotex® thermal conductivity was inputas an orthotropic tensor and the dimensions accurately represent the mockup.
In the Sandia tests a 21 W heater was used to simulate the effects of decay heat and asteel annulus with an outside diameter of 4.7 in., inside diameter of 1.38 in., and length of8.4 in. was used to replicate the mass of the isotopic sources. A photograph of the heaterand the replicate mass is shown in Figure 2. The mockup was exposed to an ambienttemperature of approximately 77°F and was assumed to be in an upright position,standing on a solid base so that heat transfer through the bottom was negligible. Therewere air filled gaps of 0.25 in. between the top of the steel annulus and PCV lid, 0.345 in.between the heater and the steel annulus, and 1.18 in. between the heater and PCV lid.The aluminum plate attached to the lead sleeve in the 9975 package was left out of themockup and was represented in the model as an air space. The duration of the thermaltest was 120 hours and temperatures measured at the end of that period were compared tothose predicted by the steady-state model.
The thermal model for the mockup used in the Sandia thermal test was created with theMSC/Patran-Thermal® general purpose heat transfer software. The model was built in2D, axisymmetric geometry and utilized dimensions shown in Figure 3, which is alsoFigure 1 in Appendix 3.8, Section 3.8-5 of Reference 1. The geometric locations ofmaterials in the model are shown schematically in Figure 4 and material thermalproperties are listed in Table 2. There was no indication whether air filled gaps existedwhere the Celotex® contacted the drum and the lead shield. Therefore several modelswere created. The results presented in this document were obtained from a model thatassumed no air gaps existed where the Celotexe contacted the shield and the drum.
The 21-W heat source was modeled as a ceramic cylinder with a radius of 0.345 in. and alength of 2.8 in. The heat source was uniformly applied at the curved surface of thecylinder to give a total power of 21 W. Heat was transferred within the package byconduction and radiation. In all models, thermal radiation heat transfer was appliedacross all gaps filled with gas while natural convection was neglected in the internal gasspaces. Further, all gasses were assumed non-absorbing for thermal radiation and, hence,were treated as non-participating media in the radiation calculations..
Appendix 3.1 - 7 of 14
Revision 1 S-SAR-G-0000 IM-CLC-F-00901, Rev. 0, Pg.6 of 13
Both the heater and the replicate mass exchange heat with one another, and the PCV, byradiation and conduction. In the current model, the emissivities for the heater, the steelannulus and the outer surface of the drum were those used in Appendix 3.8 of Reference1. It should be remarked that in this reference, the emissivity of the heater was assigned avalue of 0.05 to provide the best fit to the data. However, it was claimed that analysesshowed the package temperatures were relatively insensitive to the heater thermalproperties. In Appendix 3.8 Reference I the emissivity of the steel annulus was taken tobe 0.6 and the surface emissivity of the drum was set to 0.21. Emissivities used in thecurrent model are listed in Table 3.
In the current model, natural convection and thermal radiation boundary conditions wereapplied to the top and side of the mockup. There was no heat conduction from thebottom of the mockup, as though it were standing on an insulated surface. Of course, ifthe mockup were raised so that the base was no longer insulated, the temperaturespredicted by the model would be somewhat lower.
To avoid the excessively small elements that would be required to model the thin steel ofthe drum, it was not included in the model. As stated above, it was assumed that therewere no air gaps between the Celotex® and the steel drum. It was further assumed thatthe drum and Celotexe were in good thermal contact, so that thermal resistances werevery small. Hence, it was possible to apply natural convection and thermal radiationboundary conditions directly to the exterior of the Celotexe at the top and side of themockup. That is, the outer surface emissivity of the drum, s=0.21, was applied to theCelotex®. This approximation is reasonable because the high thermal conductivity of thesteel, coupled with the small thickness of the steel layer, results in a very smalltemperature gradient across the drum wall.
Natural convection along the vertical side of the mockup is given by the correlations
Nu =0.68+ 0.-670Ra 0 25 for Ra < 1 x 10⁹
[1 Pr"92/614/9
or2
Nu = 0.825 + 0.387Ra0 21 for Ra > lx109
l+ / • - • 0 .4 9 2 ) 9 /'16 8 / 2 7
[ Pr I
Natural convection at the top of the mockup is given by the correlations
Appendix 3.1 - 8 of 14

Revision I S-SAR-G-0000 1M-CLC-F-00901, Rev. 0, Pg.7 of 13
Nu = 0.54Ra02 5
or
Nu = 0.15Ra'/3
for 2.6x10 4 <Ra<lx10 7
for lx10 7 <Ra<3x0I10
where: Ra = Rayleigh number, dependent on film temperature (based on wall height forthe correlations applied to the vertical side)
Nu = Nusselt number, dependent on film temperaturePr = Prandtl number, dependent on film temperature
Appendix 3.1 - 9 of14
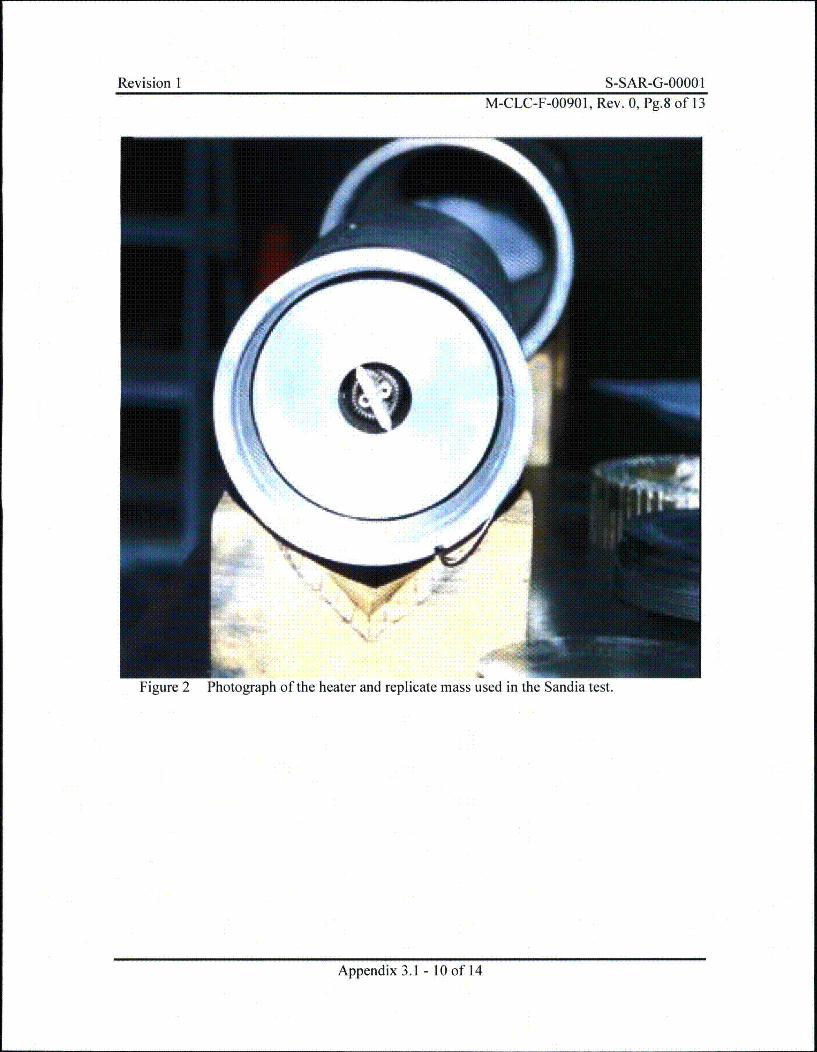
Revision I S-SAR-G-0000 IM-CLC-F-00901, Rev. 0, Pg.8 of 13
Figure 2 Photograph of the heater and replicate mass used in the Sandia test.
Appendix 3.1 - 10 of 14
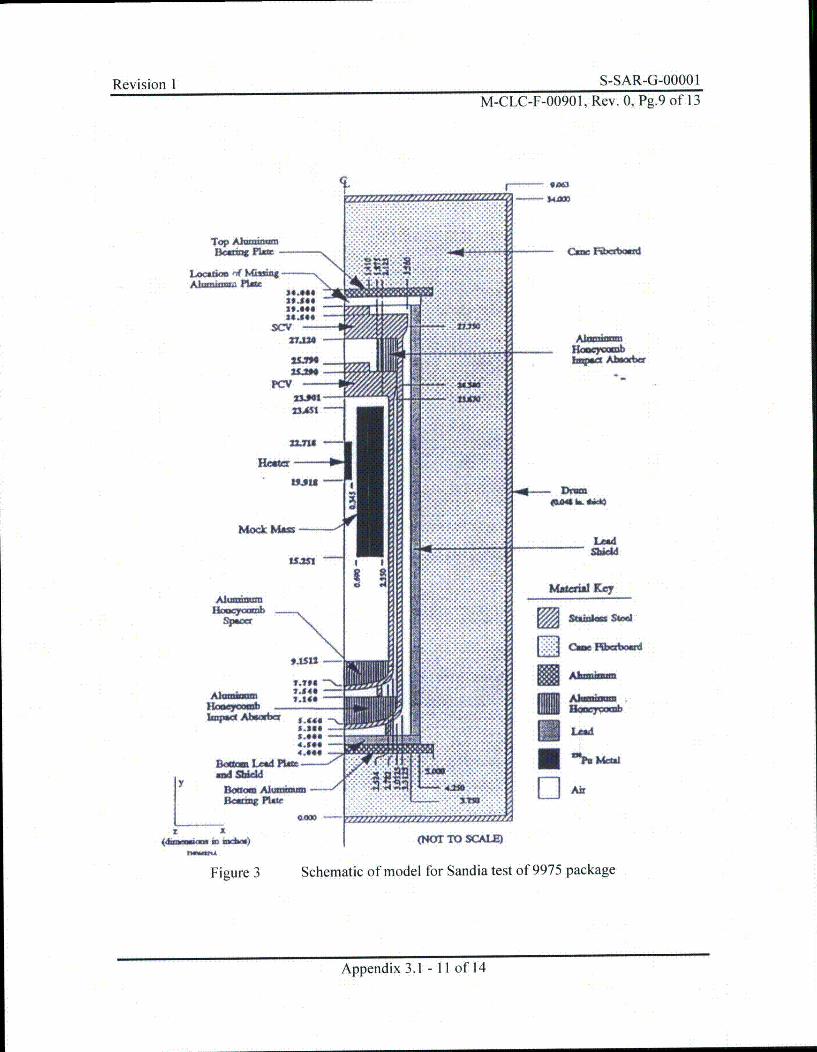
Revision I S-SAR-G-.9Oo I
M-CLC-F-00901, Rev. 0, Pg.9 of 13
I- SAM
Top AliwnamiDein FI
Loauioa nf MaiinwAlnnm~i PI
36.044
Isis44
2UPO
PCV
mock MOM
lSjMI
AlStaiimSta
DMLeo4
SU-
Ema Key
DAi
ZIP*-
#.ISIS -
1.196 -N
Ham. 7mb 1546
hmpW Absorbe S.44:Sn.
Boa Lead Platsai Skmd
Boom AkaissamuBamzg Pinky7
z I(4usansi- ig 3)
Figure 3
(NOT T1 SCAofM1
Schematic of model for Sandia test of 9975 package
Appendix 3.1 -11 of 14
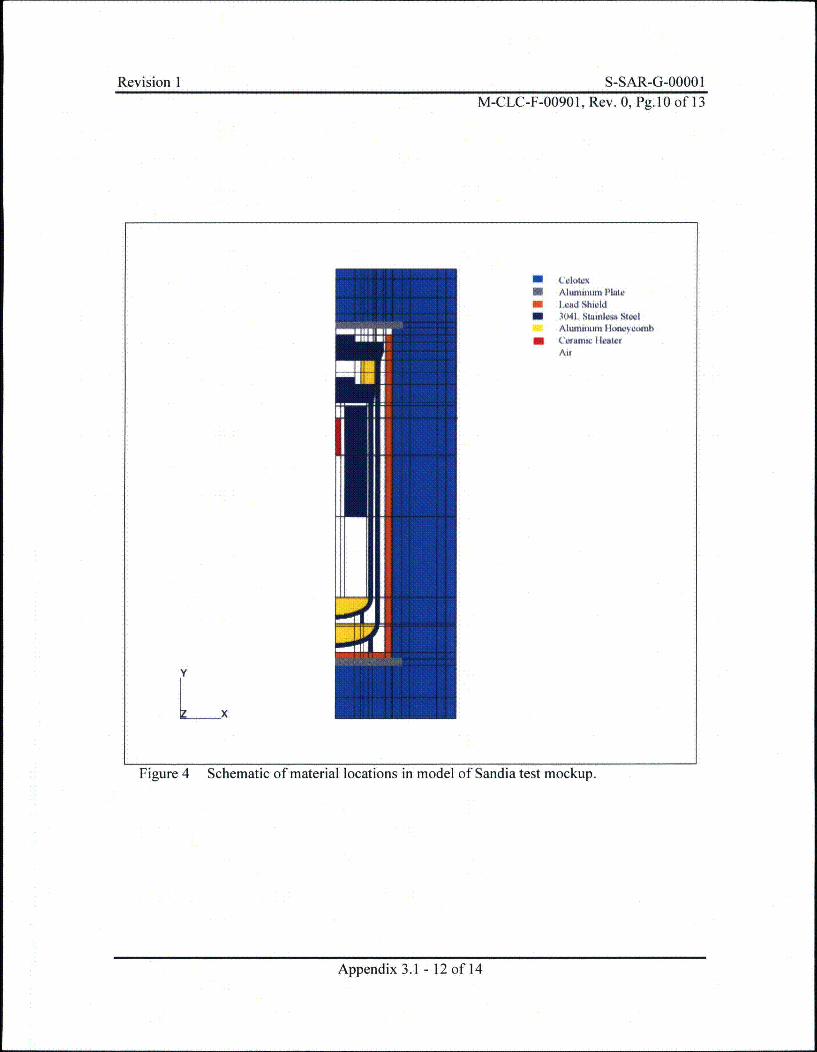
Revision 1 S-SAR-G-0000 1M-CLC-F-00901, Rev. 0, Pg.10 of 13
* Aluminumn MateM Lea~d ShieddM 3041- Stain"* Stee
Aiwn-anum I oae "uM CeaiwncI eater
V
Lx
Figure 4 Schematic of material locations in model of Sandia test mockup.
Appendix 3.1 - 12 of 14
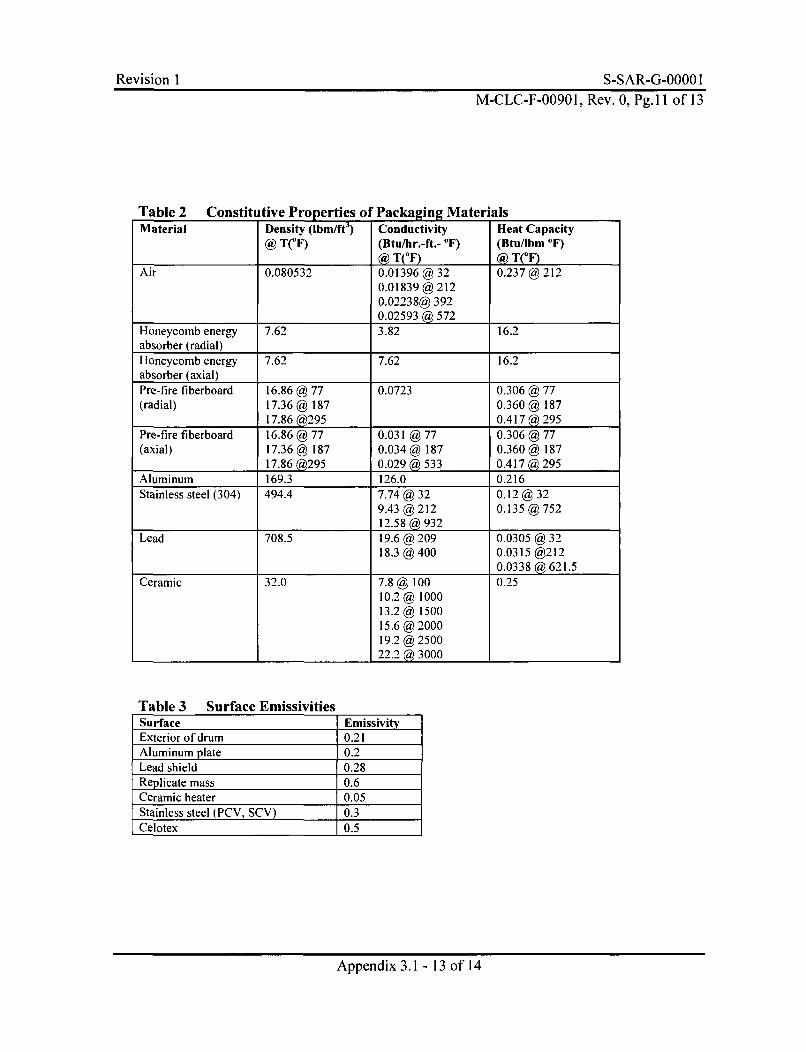
Revision I S-SAR-G-0000 IM-CLC-F-00901, Rev. 0, Pg.1 1 of 13
Table 2 Constitutive ProDerties of Packaging, MaterialsMaterial Density (Ibm/ft3) Conductivity Heat Capacity
@ T(0F) (Btu/hr.-ft.- °F) (Btu/Ibm TF)@ T(°F) @ T(°F)
Air 0.080532 0.01396 @ 32 0.237 @ 2120.01839 @ 2120.02238@ 3920.02593 @ 572
Honeycomb energy 7.62 3.82 16.2absorber (radial)Honeycomb energy 7.62 7.62 16.2absorber (axial)Pre-fire fiberboard 16.86 @ 77 0.0723 0.306 @ 77(radial) 17.36 @ 187 0.360 @ 187
17.86 @295 0.417 @ 295Pre-fire fiberboard 16.86 @ 77 0.031 @ 77 0.306 @ 77(axial) 17.36 @ 187 0.034 @ 187 0.360 @ 187
17.86 @295 0.029 @ 533 0.417 @ 295Aluminum 169.3 126.0 0.216Stainless steel (304) 494.4 7.74 @ 32 0.12 @ 32
9.43 @ 212 0.135 @ 75212.58 @ 932
Lead 708.5 19.6 @ 209 0.0305 @ 3218.3 @ 400 0.0315 @212
0.0338 @ 621.5Ceramic 32.0 7.8 @ 100 0.25
10.2 @ 100013.2 @ 150015.6 @ 200019.2 @ 250022.2 @ 3000
Table 3 Surface EmissivitiesSurface EmissivityExterior of drum 0.21Aluminum plate 0.2Lead shield 0.28Replicate mass 0.6Ceramic heater 0.05Stainless steel (PCV, SCV) 0.3Celotex 0.5
Appendix 3.1 - 13 of 14
Revision 1 S-SAR-G-0000 1M-CLC-F-00901, Rev. 0, Pg.12 of 13
3.0 Analytical Methods and Computations
The general purpose conduction-radiation computer code MSC/Patran-Thermal® wasused to perform the computations [3]. Work was performed in accordance with theWSRC E-7 manual [4]. The thermal models of the storage configurations were createdusing the general purpose finite element pre and post processor MSC/Patran® [5].
4.0 Results
The steady state temperature profile predicted by the model is shown in Fig. 1. Predictedsteady-state temperatures are compared to measurements in Table 1.
5.0 References
1. Safety Analysis Report - Packages, 9972-9975 (U), WSRC-SA-7, Rev 15,Westinghouse Savannah River Company, Aiken, SC (May 2003).
2. Schulze, D.H. and R. Moreno, "Test Report Simulated Fire Tests of the 9973 and9975 Packagings", Report No. 6324AK2801, Sandia National Laboratory,Albuquerque, NM (June 1994).
3. MSC/Thermal, MacNeal-Schwendler Corporation, Los Angeles, CA 90041.
4. Westinghouse Savannah River Co., Conduct of Engineering Manual, E-7, 1998.
5. Patran 2001, MacNeal-Schwendler Corporation, Los Angeles, CA 90041.
Appendix 3.1 - 14 of 14

Revision I S-SAR-G-0000 IRevision I S-SAR-G-OOOO 1
APPENDiX 3.2
HAC FIRE ANALYSIS BENCHMARKINGOF THE 9973 AND 9975 PACKAGES
Appendix 3.2 - 1 of 20

Revision I S-SAR-G-00001Revision 1 S-SAR-G-O000 1
This Page Intentionally Left Blank
Appendix 3.2 - 2 of 20
Revision I S-SAR-G-00001Revision I S-SAR-G-OOOO 1
WESTINGHOUSE SAVANNAH RIVER COMPANYINTER-OFFICE MEMORANDUM
SRT-EMS-940065
September 12, 1994
TO:. R. J. Gromada, 773-53A
FROM: S. J. Hensel, 773-42A •r
_YW.1e•fU- Technical Reviewer Date'
J. R. Pelfrey Manager Date
HAC Fire Analysis BenchmarkingOf The 9973 And 9975 Packages (U)
Abstract
Two packages were fire tested in the Sandia radiant heat facility to benchmark thefiberboard HAC fire analysis model against package test data, and provide evidence ofsatisfactory package performance during the HAC fire. The 9973 was tested after a 30 ft.top down drop and puncture, and an undamaged 9975 containing a heater was tested todetermine heat source effects. A previously developed cane fiberboard HAC fire modelwas used as the basis to benchmark against the test results. Analysis results using a refinedversion of the HAC model compared well against the test data from both the damaged 9973without a heat source and the undamaged 9975 containing a heat source. This analysis willbe included as an Appendix in Chapter 3 of the 9965, 9968, 9972, 9973, 9974, and 9975SARP.
Appendix 3.2 - 3 of 20
Revision I S-SAR-G-00001
SRT-EMS-940065
P. 2 of 17HAC Fire Analysis Benchmarking
Of The 9973 And 9975 Packages
A damaged 9973 package and undamaged 9975 package containing a heater were fire
tested in the Sandia Radiant Heat Facility [1]. The 9973 was tested laying on its side and the
9975 was tested upright. The purpose of the test was to demonstrate package survivability and
to benchmark the Hypothetical Accident Condition (HAC) fire model developed by Hensel and
Gromada [2]. Analysis of the 9972-75 packages will be performed upon successful
benchmarking of the HAC fiberboard model to package test data.
A schematic of the 9973 and 9975 axisymmetric models used in the analysis are shown
in Figures 1 and 2. Although the 9973 package was fire tested after a 30 ft. top down drop and
puncture, it was modeled as an undamaged package. The 9973 was loaded with 45 lbs. of lead
to simulate contents. The thermal properties of the contents portion of the model were adjusted
to account for the added mass. The 9975 package was inadvertently assembled without one of
the top bearing plates. The 9975 model accurately reflects this oversight and the resulting air
gap. The 9975 also contains a heater surrounded by a steel cylinder, and both are included in
the model.
All thermal analyses were performed using the general purpose conduction based
analysis software package P/Thermal [3]. Analysis of the 9973 began with an initial
temperature of 75*F throughout the package, and boundary condition temperature data was
supplied by the test report [1]. The 9975 package was heated for a few days (until temperatures
leveled off) prior to the test by the internal heat source. A preliminary steady-state normal
condition analysis (without solar) was required to obtain the initial temperature distribution in
the 9975 package. Results of this normal condition analysis overpredicted internal package
temperatures when the cane fiberboard thermal properties in the literature were used. The
fiberboard conductivity was increased by a factor of 2 to more accurately compute the
temperature profiles in the 9975 package. An accurate initial condition is essential to
benchmarking the HAC fire test results.
The cane fiberboard HAC fire properties ultimately used in the benchmarking are
presented in Tables 1 and 2. These properties are similar to the initial set developed against I-D
fiberboard fire tests [2]. The fiberboard properties in Table 1 are used throughout the package
during the fire (heating) portion of the test. "During the cooling, special char properties are used
on the first 1.4 inches from the drum wall both radially inward from the drum side and axially
inward from the top and bottom. The char properties are presented in Table 2. The fiberboard
Appendix 3.2 - 4 of 20
Revision I S-SAR-G-0000 I
SRT-EMS-940065
P. 3 of 17
properties in Table 1 are used throughout the non-char region (within 1.4 inches from the drum
wall) throughout the cooling. In the 9973 an air gap between the secondary vessel and cane
fiberboard exists. The conductivity of the cane fiberboard HAC fire model was used in this air
gap to simulate the flow of hot gases out of the cane fiberboard.
Results of the HAC fire analysis of the 9973 are presented in Figures 3 through 5. All
of these Figures are of the same format where the data from the test is referenced as "Data", and
the analysis results contain symbols at times in which temperatures written to a file. All
temperatures are in OF and all times are in hours. The analysis ended at 4.5 hours.
Figure 3 is a transient plot of the drum wall temperature. Four thermocouples were
located circumferentially around the outer drum wall during the test. The data varied slightly
around the drum wall due to circumferential heating variations. The drum wall temperature
during the analysis compares well with the data. Drum wall analysis temperatures verify that
adequate boundary conditions were used during the analysis. Actual benchmarking
comparisons must be made with internal package temperature data.
In Figures 4 and 5 analyses results are compared with test temperatures at the Secondary
Containment Vessel (SCV) seal and SCV side. The transient temperatures compare well at the
SCV seal and SCV wall. The analysis predicts a peak temperature at both locations within 20OF
of the measured values. The calculated peak temperatures occur about one half hour later than
the measured ones. The measured curves illustrate the circumferential variations at both
locations. These variations are likely caused by asymmetric heating (as shown by the drum wall
transient temperature curves) and small air gaps because the package is laying on its side during
the test.Results of the HAC fire analysis of the 9975 are presented in Figures 6 through 11.
Again, all of these Figures are of the same format where the data from the test is referenced by
"Data", and the analysis results contain symbols at times in which temperatures were written to
a file. The temperatures are in OF, times are in hours, and the analysis ended at 4.5 hours.
Figure 6 is a transient plot of the drum wall temperature. Two thermocouples were
located circumferentially around the outer drum wall during the test. The drum wall temperature
during the analysis compares well with the data, and circumferential variation in the data is
minimal because the package was tested upright.
In Figures 7 through 11 analyses results are compared with test temperatures at the
fiberboard middle, lead side, SCV seal, SCV side, and Primary Containment Vessel (PCV) lid.
All measured temperatures compare fairly well with the analysis. The measured temperatures at
Appendix 3.2 - 5 of 20
Revision I S-SAR-G-O0001
SRT-EMS-940065
P. 4 of 17
the fiberboard middle show extensive circumferential variation. Post test evaluation of thepackage showed uneven charring in the package circumferentially, although little circumferentialtemperature variation exists elsewhere. Post test evaluation also suggested minimalthermocouple movement. The measured temperatures of internal package components allcompare fairly well with the calculated values, although the calculated values tend to somewhatoverpredict peak temperatures and cool more quickly. The overprediction and excessive coolingwere observed in the 9973 comparison between calculated and measured values. The 9975benchmark demonstrates that internal package component temperatures can be calculatedincluding heat source effects.
The fiberboard HAC fire thermal model has been benchmarked against a damaged 9973and undamaged 9975 with an internal heater by comparison with measurements taken during atest at SNL. The internal package temperature transients compare well with the calculations.Damage appears to have relatively minimal effects on package internal temperatures, althoughthis may not be true for a poorly designed package in which the damage included extensive gapsin the fiberboard or significant fiberboard thickness reduction between the vessel and drumwall. An air gap between the fiberboard and vessel wall, as in the 9973, requires special
treatment to negate the usual insulating effects of the air gap. The model presented in Tables 1and 2 will be used to analyze the 9972, 9973, 9974, and 9975 packages including internal heatsources under HAC fire conditions. This analysis will be included as an Appendix in Chapter 3of the 9965, 9968, 9972-75 SARP.
Appendix 3.2 - 6 of 20
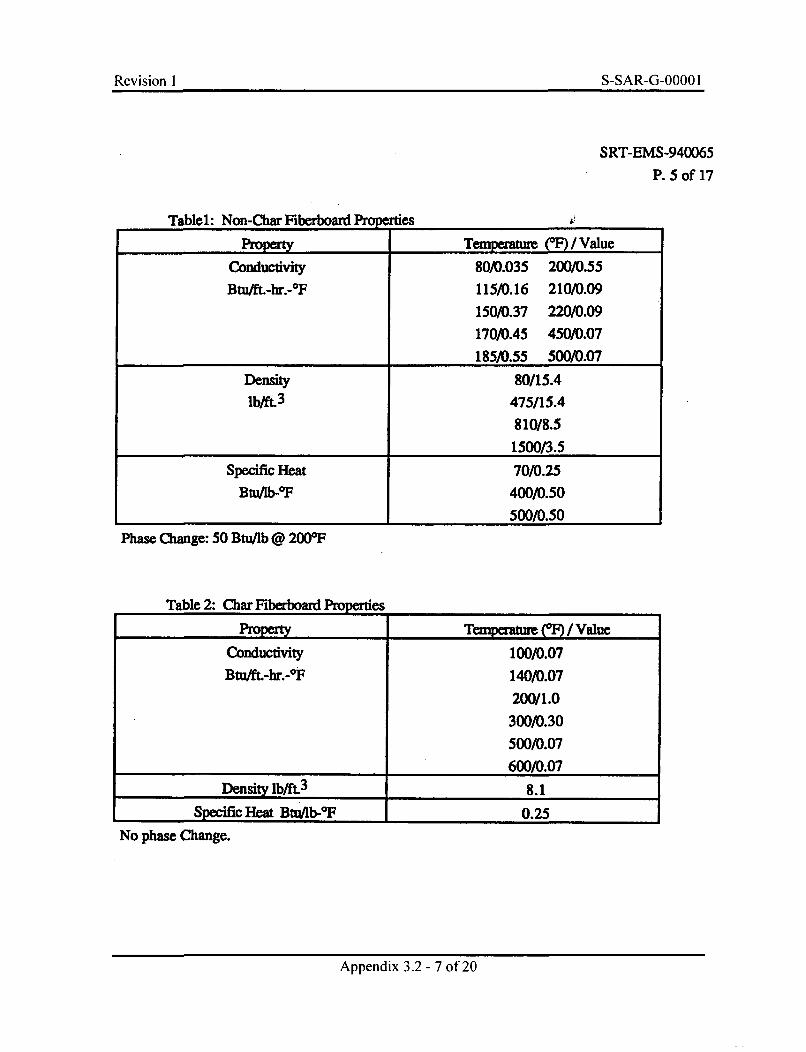
Revision I S-SAR-G-0000 IRevision I S-SAR-G-0000 1
SRT-EMS-940065
P. 5 of 17
Table1: Non-Char Fiberboard Propertes
Property Temperuture (F) / Value
Conductivity 80/0.035 200/0.55
Btu/ft.-hr.-OF 115/0.16 210/0.09
150/0.37 220/0.09
170/0.45 450/0.07
185/0.55 500/0.07
Density 80/15.4lb/ft.3 475/15.4
810/8.5
1500/3.5
Specific Heat 70/0.25
Btu/Ib-OF 400/0.50
500/0.50
Phase Change: 50 Btu/lb @ 200OF
Table 2: Char Fiberboard Properties
Property Teper / Value
Conductivity 100/0.07
Btu/ft.-hr.-0F 140/0.07
200/1.0
300/0.30
500/0.07
600/0.07
Density lb/ft.3 8.1
Specific Heat Btq/Ib-OF 0.25
No phase Change.
Appendix 3.2 - 7 of 20
Revision I S-SAR-G-O000 1
SRT-EMS-940065
P. 6 of 17
References:
[1] M. N. Van Alstine, SRT-PTG-94-0058, "9973 and 9975 Packaging Thermal Test Report
(U)", July 25, 1994.
[2] S. J. Hensel and R. J. Gromada, "Development of A Simulation (Thermophysical
Property) Model For Cane Fiberboard Packages Subjected to A Hypothetical Accident
Condition Fire", 1994 DOE Defense Programs Packaging Workshop, Knoxville, TN.
[3] P/Thermal 2.6, PDA Engineering, PATRAN Division, Costa Mesa, CA (March 1993).
Appendix 3.2 - 8 of 20
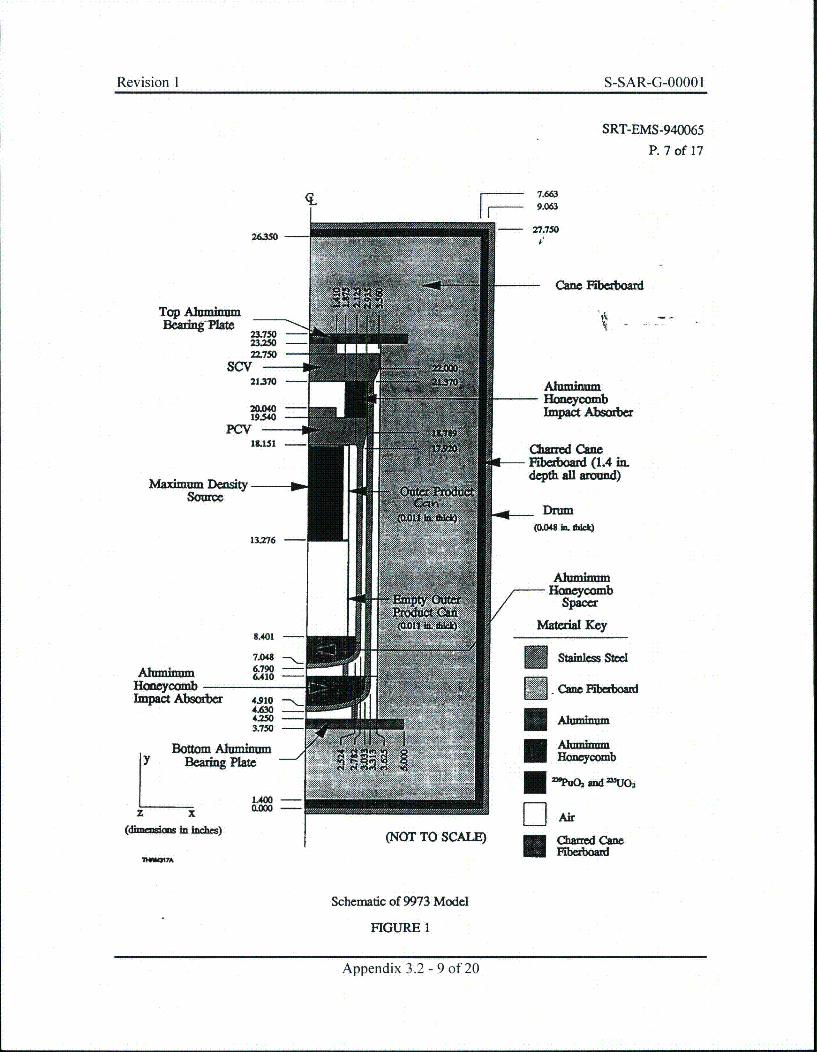
Revision I S-SAR-G-00001Revision I S-SAR-G-OOOO I
SRT-EMS-940065
P. 7 of 17
~7.663 9.063
-27.750N - t!)6%0 -
-Cane Fiberboard
Top AluminumBea Plate
23.750 -23=0 -22.750 -
SCV -21.370 -
20.040 -1930-M
Pcv• -- H
13.151 -
Maximum Dmsi-ySource
13.276-
t
AlhmnnumHoneycombImpact Absorbe
Charn Cane- iberboard (1.4 in.
dept Al around)
Drum(A048 hL kO
AhuminumHoneycomb
spacer
8.401
Ahnuinm 6.790 -
6.410 -
HoneycombImpact Absorber 4.910 N.
4.630 -4.2503.750
Material Key
Staidles Seel
-Cone, FIbeboard
EAluminumEAlumbium
Honeycomb
"%%~ Mid "U02
F1AirE haffd CanwFberboard
B o
z x
ea Alminam%uarig Plate
1400-0.0O-
(dbmaukms in Inchm) I (NOT TO SCALE)
?H7A
Schematic of 9973 Model
FIGURE 1
Appendix 3.2 - 9 of 20
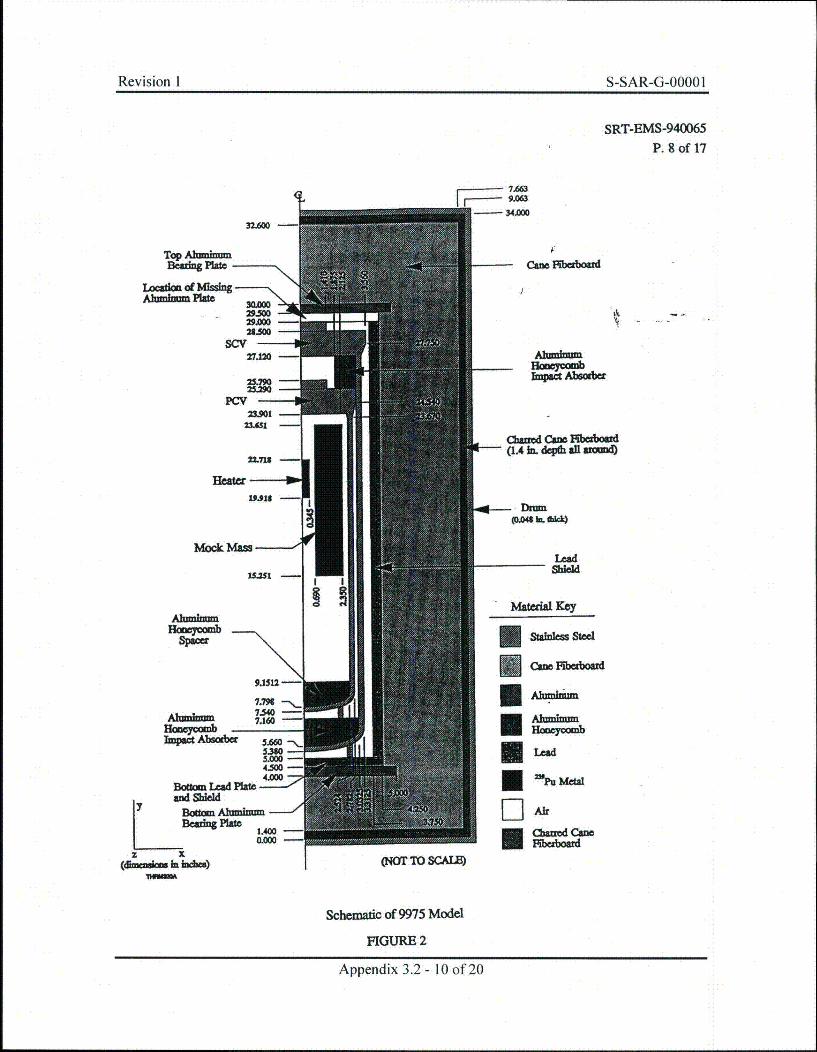
Revision I S-SAR-G-00001Revision I S-SAR-G-O000 I
SRT-EMS-940065P. 8 of 17
7AW9.w-3.000
Top AluminumBiadug Plae
Locatkm of missingAuminum PWO_
29A
scW -I27.W2 -
25.790
2&M -~
23A01 -
22.71 -
HeaWe -
mock Maws
7.796 -
Aluminum 7-40-Abiocmbm 7.160-
Impac Absoebc 5.60530 -5.000 -4.5%0 -
Boa=m Lead Plat -L~and Sbied
BOaW= Ahlumnm =Beadng Rat 140
z X(zndwIn himde)Won
Alumiltow
Impac Absodibe
Camnd Cam .. mboar(1.4 hn dcpdi Ai 000wi
LeadShield
Mlaterial Key
camo Fpaeooatd
*Alumhnxn
I amnnd CameMeezboez
I (NYMTOSCAME
Schematic of 9975 Model
FIGURE 2
Appendix 3.2 - 10 of 20
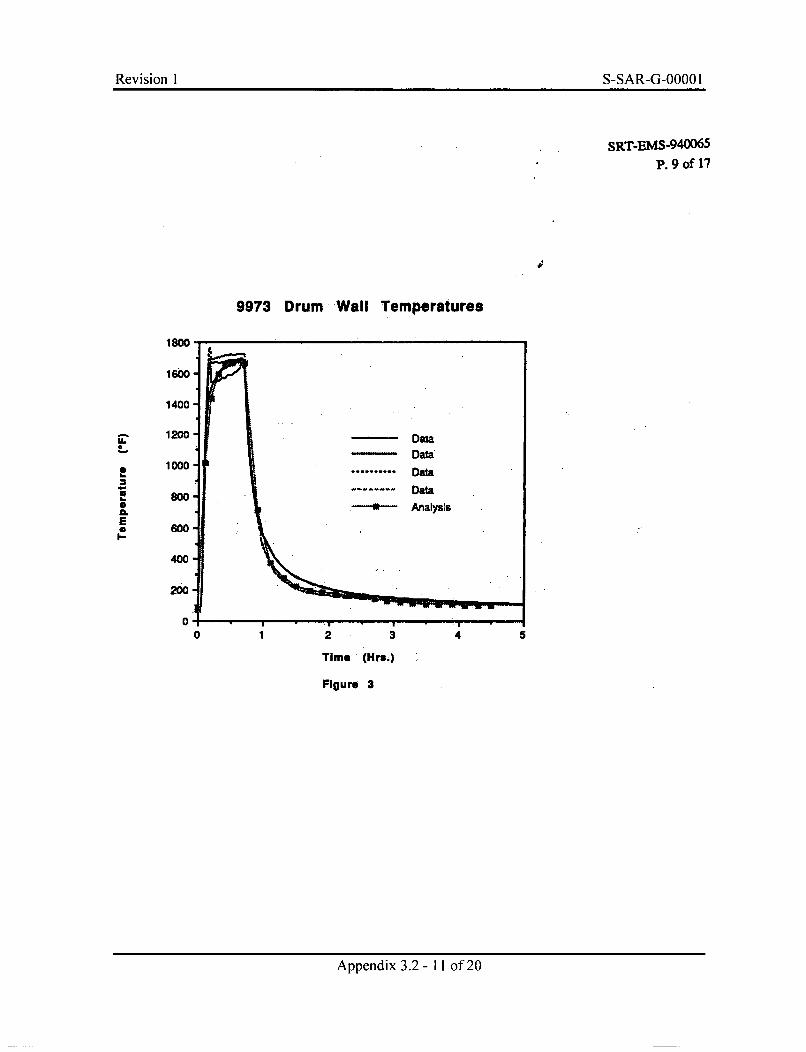
Revision I S-SAR-G-0000 1
SRT-EMS-9400 6 5
P. 9 of 17
-0
9973 Drum Wall Temperatures
0
I-
E.
I-
01 2 3 4 5
Time (Hra.)
Figure 3
Appendix 3.2 - 11 of 20
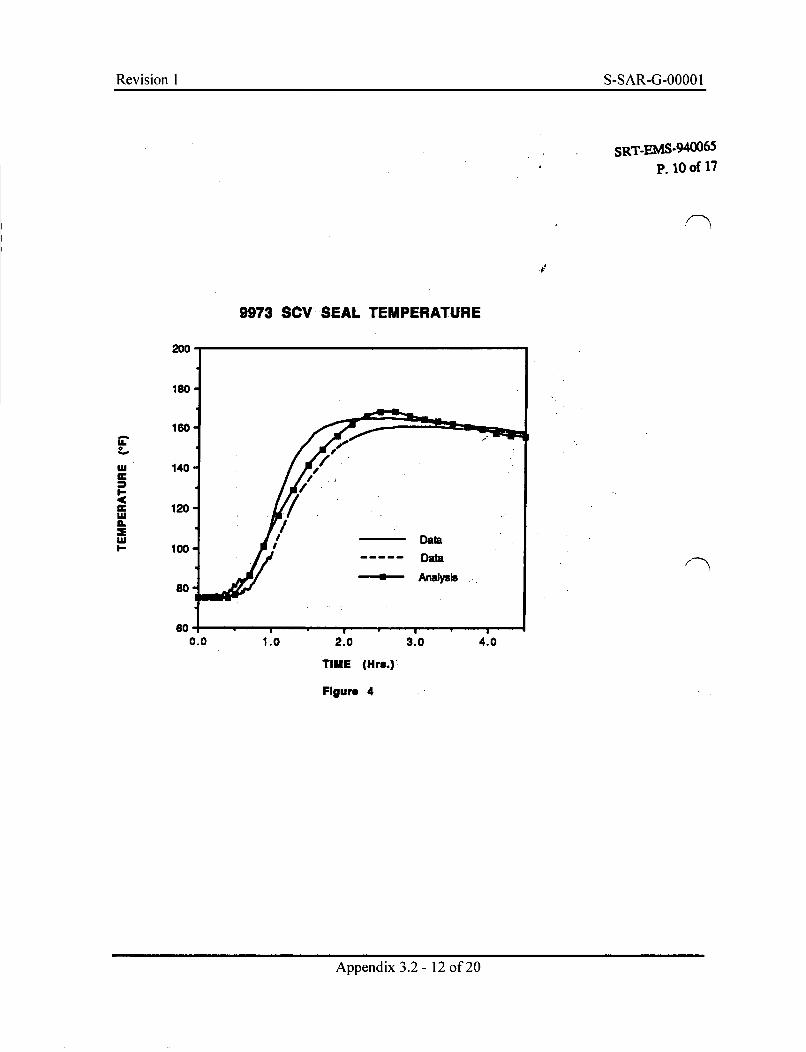
Revision I S-SAR-G-0000 IRevision I S-SAR-G-OOOO 1
SRT-EMS-9065p. 10 of 17
e
9973 SCV SEAL TEMPERATURE
IS -
TIME (Hre.)
Figure 4
Appendix 3.2 - 12 of 20
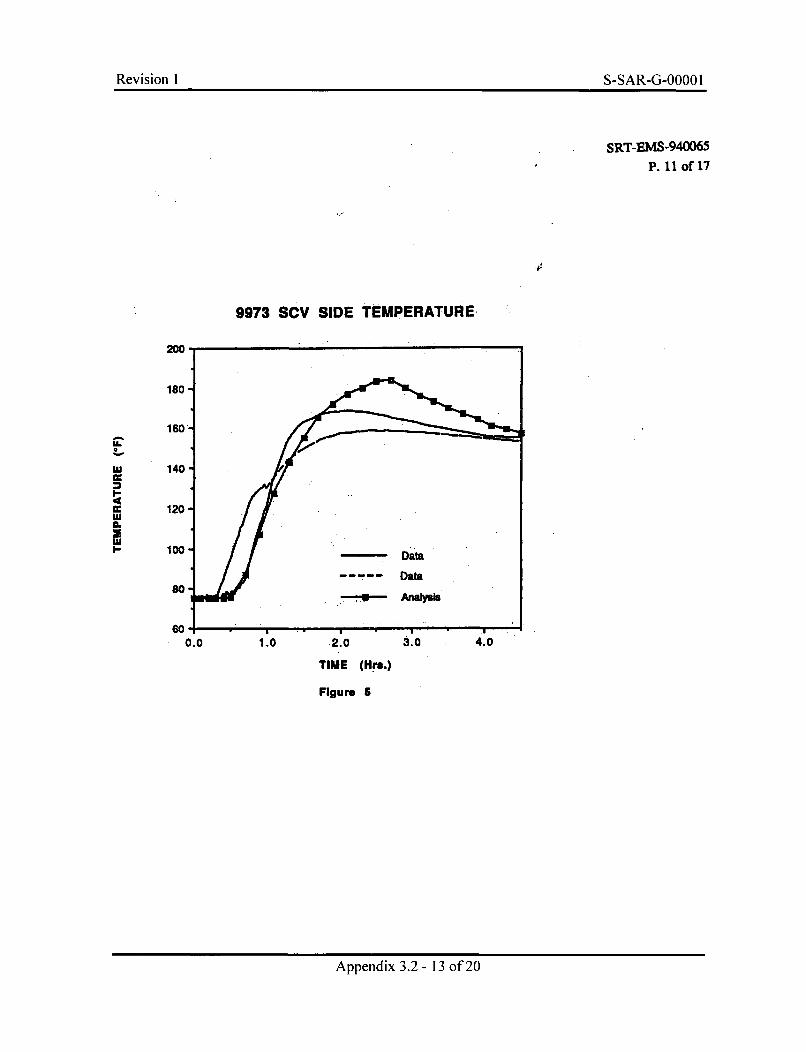
Revision I S-SAR-G-0000 IRevision 1 S-SAR-G-OO0O 1
SRT-EMS-940065P. 11 of 17
9973 SCV SIDE TEMPERATURE.
I"
w
I--
w-a.1eUwE
2.0
TIME (Hr..)
Figure 5
Appendix 3.2 - 13 of 20
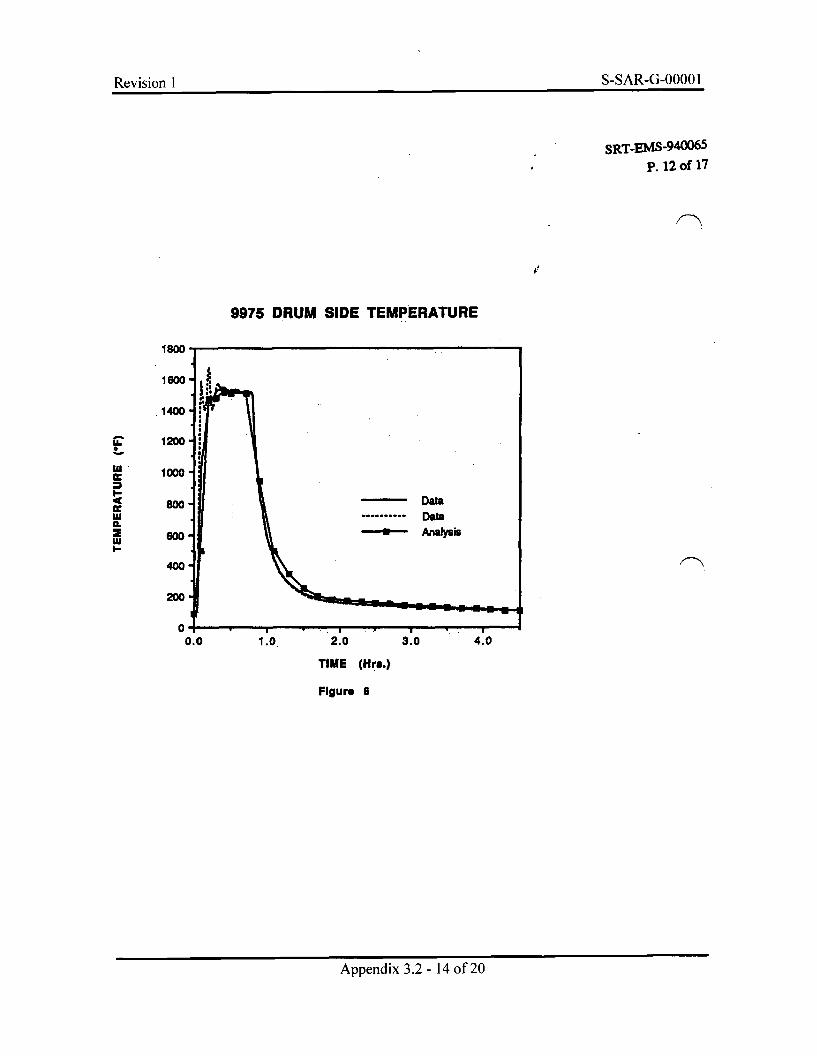
Revision I S-SAR-G-0000 IRevision 1 S-SAR-G-O000 1
SRT-EMS-9400 5
P. 12 of 17
9975 DRUM SIDE TEMPERATURE
F'U
I-
'Ua.U'U
TIME (Hr..)
Figure 6
Appendix 3.2 - 14 of 20
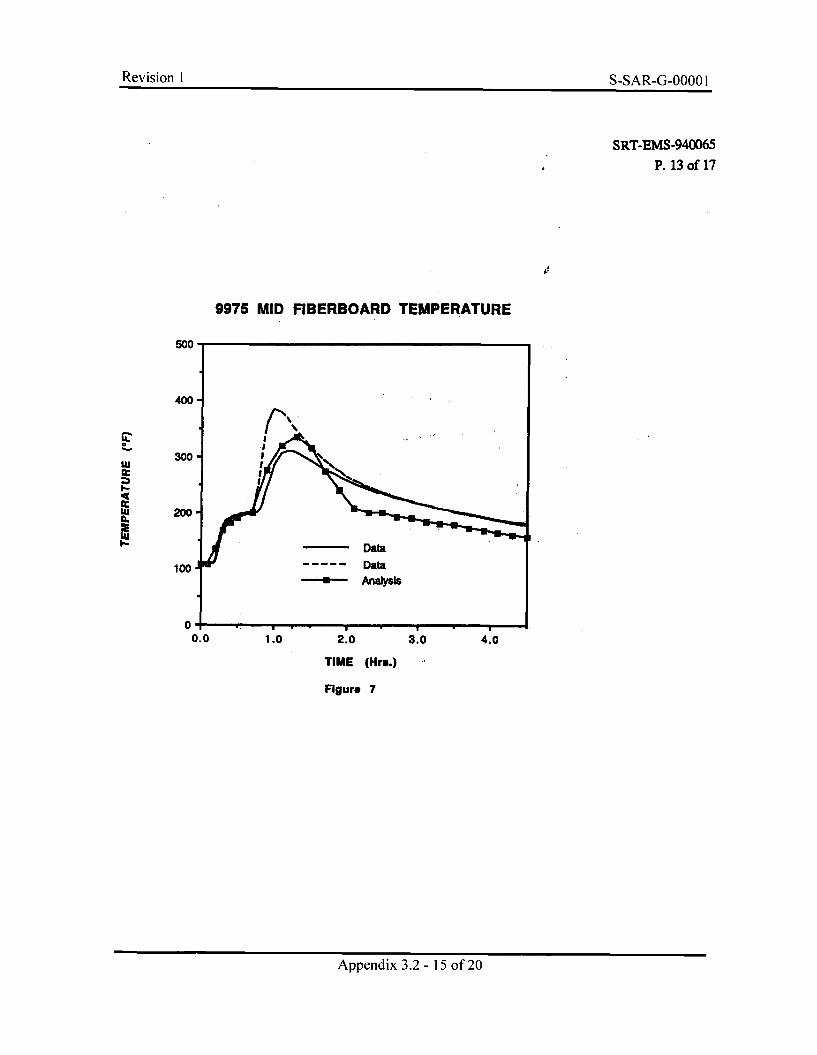
Revision I S-SAR-G-0000 IRevision I S-SAR-G-O000 1
SRT-EMS-940065
P. 13 of 17
9975 MID FIBERBOARD TEMPERATURE
500
400
w
I.-
w
wI.-
300
200
100
0.
TIME (Hrs.)
Figure 7
Appendix 3.2 - 15 of 20
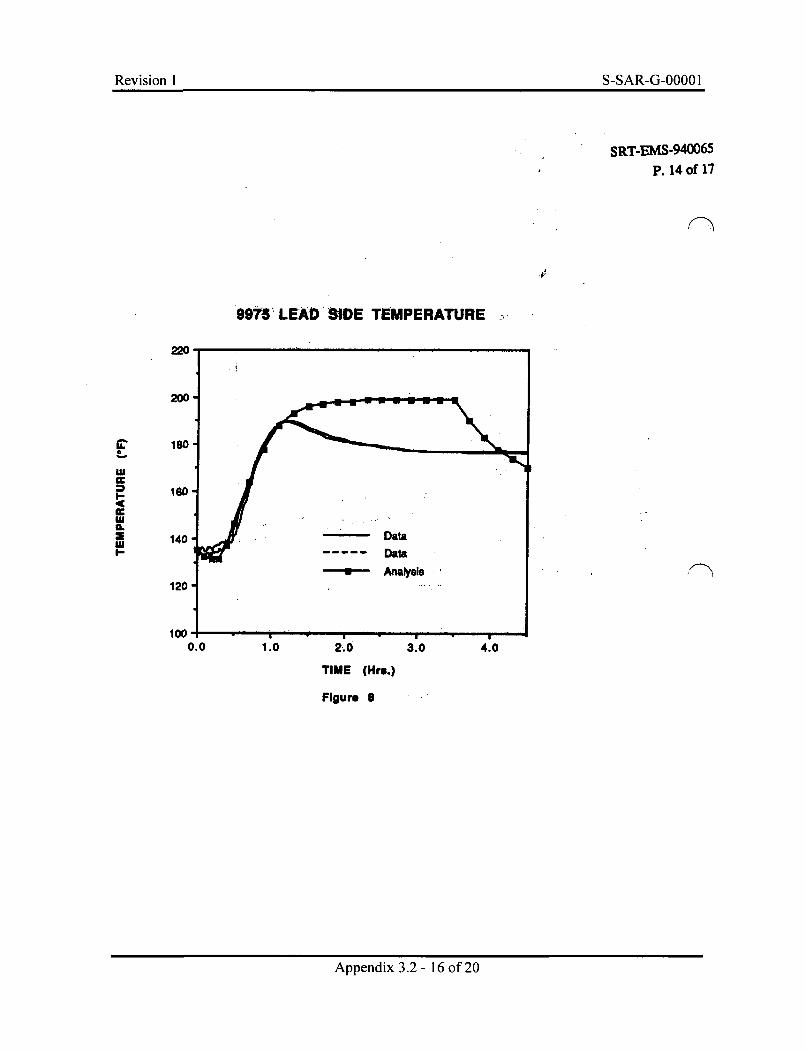
Revision I S-SAR-G-00001Revision I S-SAR-G-OOOO I
SRT-EMS-9400 65
P. 14 of 17
99758 LEAD SIDE TEMPERATURE
w
I-Uwa.UwI-
TIME (Hrs.)
Figure 8
Appendix 3.2 - 16 of 20
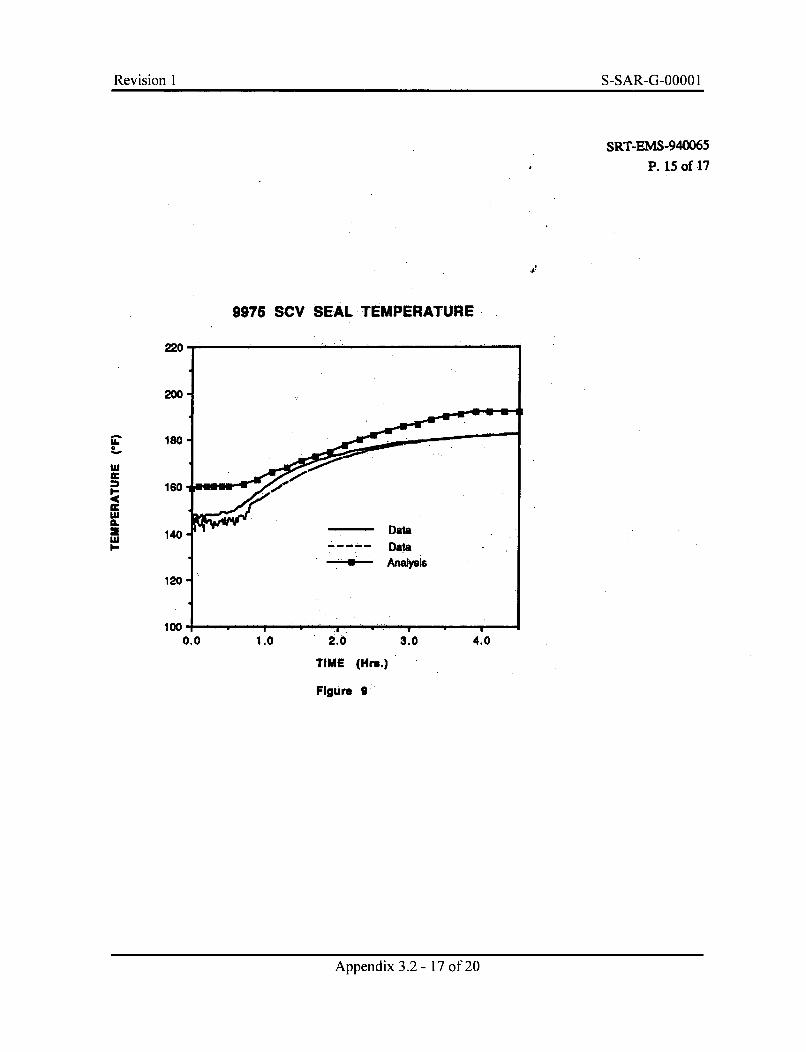
Revision I S-SAR-G-0000 1
SRT-EMS-940065
P. 15 of 17
9975 SCV SEAL TEMPERATURE
220
cc
0
w
I-IIA-
I--
0.0 1.0 2.0 3.0 4.0
TIME (Hrs.)
Figure g
Appendix 3.2 - 17 of 20
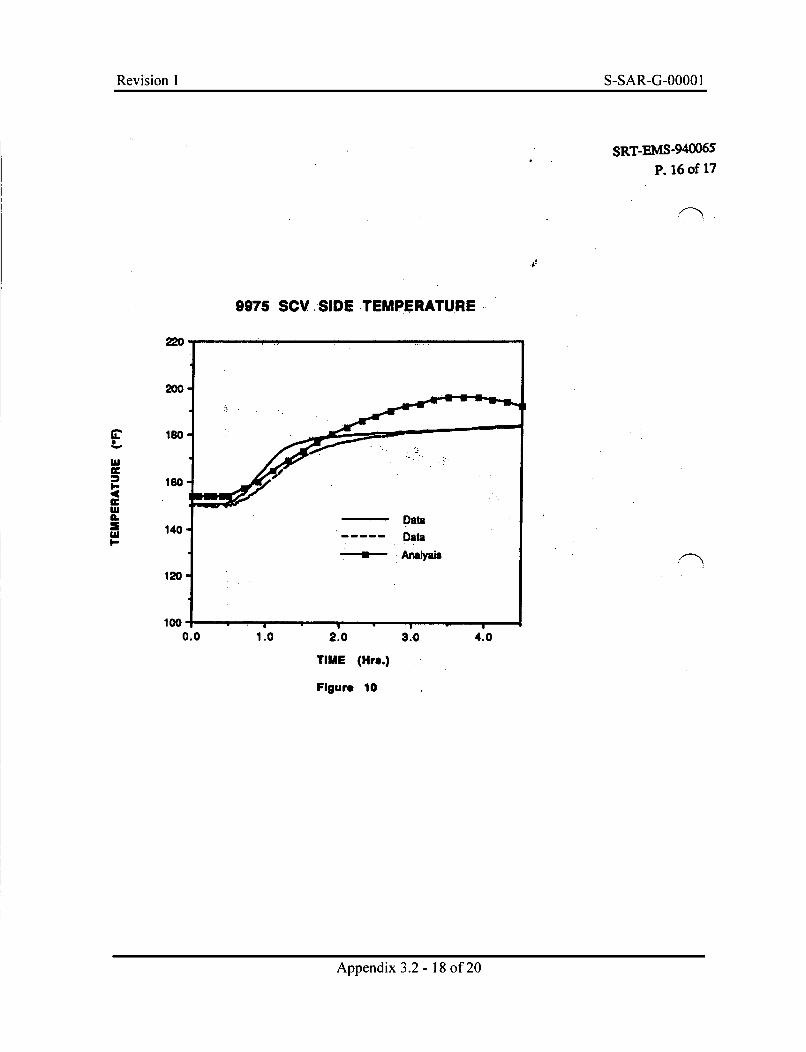
Revision I S-SAR-G-0000 1
SRT-EMS-9 40065
P. 16 of 17
4.
9975 SCV. SIDE TEMPERATURE
IL
TIME (Hrs.)
Figure 10
Appendix 3.2 - 18 of 20
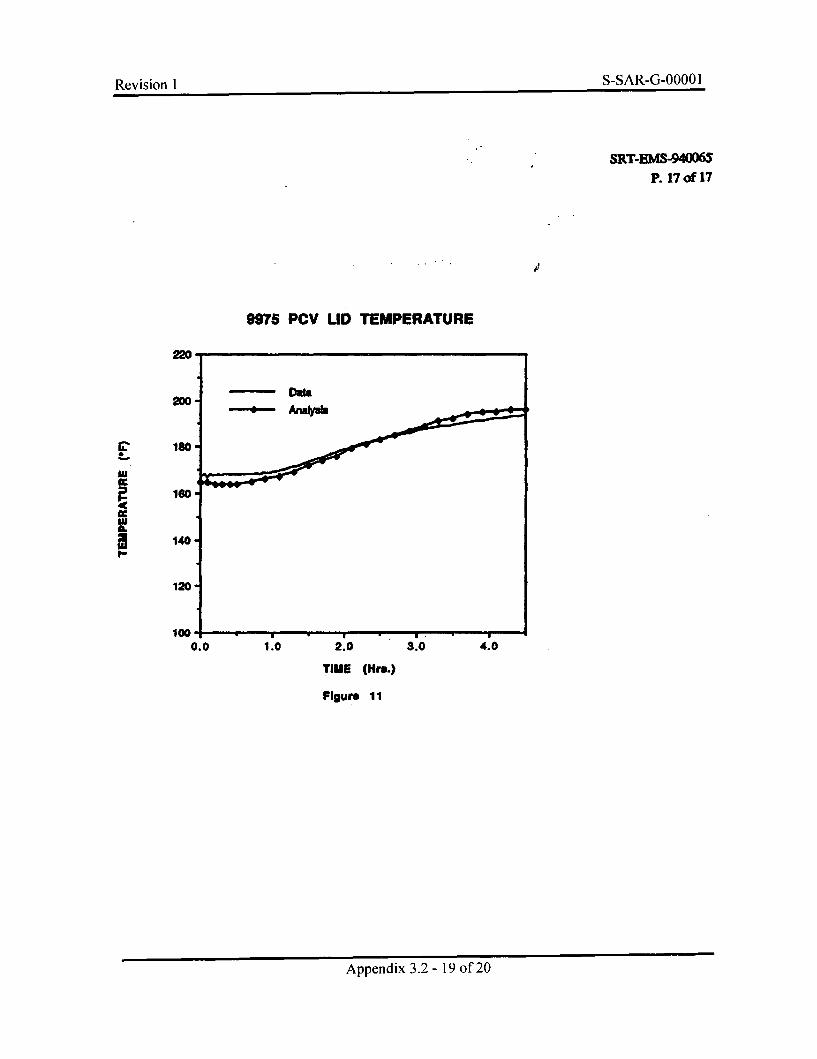
Revi•inn I S-SAR-G-0000 IRev~isin I -A-GO0
SRT-EMS-940065P. 17 of 17
I.
9975 PCV LID TEMPERATURE
SM
SM
220-
200
180
160
140
120
1000.0 2.0
TIME (Hra.)
Figure 11
Appendix 3.2 - 19 of 20

Revision I S-SAR-G-0000 IRevision 1 S-SAR-G-OO00 I
This Page Intentionally Left Blank
Appendix 3.2 - 20 of 20
Revision I S-SAR-G-0000 IRevision 1 S-SAR-G-OOOO I
APPENDIX 3.3
THERMAL ANALYSIS OF THE 9975 PACKAGEFOR
NORMAL CONDITIONS OF TRANSPORTAND
HYPOTHETICAL ACCIDENT CONDITIONS
Appendix 3.3 - I of 44

Revision I S-SAR-G-0000 IRevision 1 S-SAR-G-OOOO 1
This Page Intentionally Left Blank
Appendix 3.3 - 2 of 44
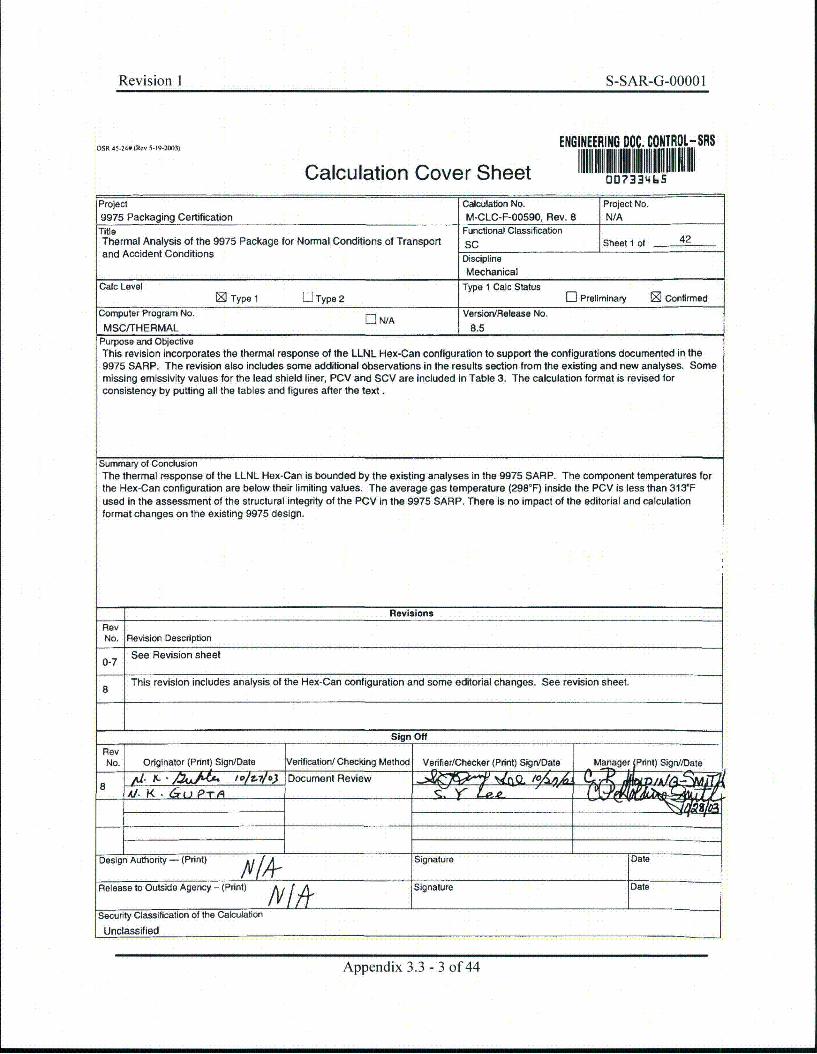
Revision I S-SAR-G-0000 IRevision 1 S-SAR-G-OOOO I
OSR 4S-2.#(ReV 5-19-21)3) ENGINEERING DOC. CONTROL-SRS
DIIi I N III HII iIIIIII IIIt lll00733465Calculation Cover SheetProject Calculation No. Project No.9975 Packaging Certification M-CLC-F-00590, Rev. 8 N/A
Title Functional ClassificationThermal Analysis of the 9975 Package for Normal Conditions of Transport SC Sheet 1 of 42and Accident Conditions Discipline
MechanicalCaic Level Type 1 Calc Status
Le Type 1 D Type 2 lE Preliminary [ Confirmed
Computer Program No. N/A Version/Release No.
MSC/THERMAL 8.5
Purpose and ObjectiveThis revision incorporates the thermal response of the LLNL Hex-Can configuration to support the configurations documented in the9975 SARP. The revision also includes some additional observations in the results section from the existing and new analyses. Somemissing emissivity values for the lead shield liner, PCV and SCV are included in Table 3. The calculation format is revised forconsistency by putting all the tables and figures after the text.
Summary of ConclusionThe thermal response of the LLNL Hex-Can is bounded by the existing analyses in the 9975 SARP. The component temperatures forthe Hex-Can configuration are below their limiting values. The average gas temperature (298'F) inside the PCV is less than 313*Fused in the assessment of the structural integrity of the PCV in the 9975 SARP. There is no impact of the editorial and calculationformat changes on the existing 9975 design.
RevisionsRevNo. Revision Description
0-7 See Revision sheet
This revision includes analysis of the Hex-Can configuration and some editorial changes. See revision sheet.8
Sign Off
Rev iNo. Originator (Print) Sign/Date Verification/ Checking Method Verifier/Checker (Print) Sign/Date Manager PPdnt) Signt/Date
x. 2. • & /y t/Jpo Document Review_A/. K- CU PTAq
Design Authority - (Print) /41 Signature Date
Release to Outside Agency - (Print) /V Signature Date
Security Classification of the Calculation
Unclassified
Appendix 3.3 - 3 of 44
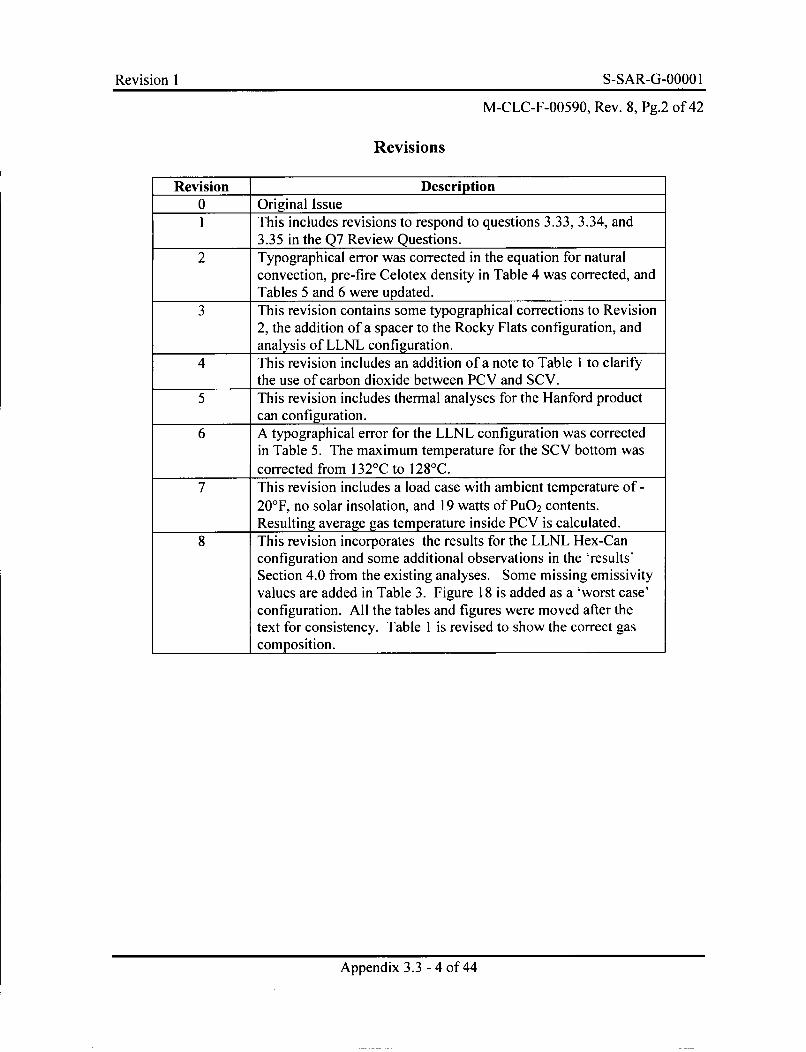
Revision I S-SAR-G-0000 I
M-CLC-F-00590, Rev. 8, Pg.2 of 42
Revisions
Revision Description0 Original Issue1 This includes revisions to respond to questions 3.33, 3.34, and
3.35 in the Q7 Review Questions.2 Typographical error was corrected in the equation for natural
convection, pre-fire Celotex density in Table 4 was corrected, andTables 5 and 6 were updated.
3 This revision contains some typographical corrections to Revision2, the addition of a spacer to the Rocky Flats configuration, andanalysis of LLNL configuration.
4 This revision includes an addition of a note to Table 1 to clarifythe use of carbon dioxide between PCV and SCV.
5 This revision includes thermal analyses for the Hanford productcan configuration.
6 A typographical error for the LLNL configuration was correctedin Table 5. The maximum temperature for the SCV bottom wascorrected from 132°C to 128°C.
7 This revision includes a load case with ambient temperature of-20'F, no solar insolation, and 19 watts of PuO 2 contents.Resulting average gas temperature inside PCV is calculated.
8 This revision incorporates the results for the LLNL Hex-Canconfiguration and some additional observations in the 'results'Section 4.0 from the existing analyses. Some missing emissivityvalues are added in Table 3. Figure 18 is added as a 'worst case'configuration. All the tables and figures were moved after thetext for consistency. Table 1 is revised to show the correct gascomposition.
Appendix 3.3 - 4 of 44
Revision I S-SAR-G-0000 I
M-CLC-F-00590, Rev. 8, Pg.3 of 42
Thermal Analysis of the 9975 Package forNormal Conditions of Transport and Accident Conditions
1.0 Conclusions
This revision (Revision 8) contains thermal analyses for the LLNL Hex-Canconfiguration. The Hex-Can is designed to carry special Pu oxide material. BoundingNCT solar analyses are performed to include low density oxide (2 g/cc) and high densityoxide (11 g/cc) contents. The power content is 19 watts in both cases. The analysesshow that the low density oxide configuration is the limiting configuration. All thecomponents temperatures are below their limiting temperatures. The average gastemperature inside the PCV is 298°F which is less than the maximum average of 313'Fcalculated for the foodcan configuration.
This revision (Revision 7) includes a load case where the ambient temperature is -20'F,no solar insolation, and the package has 19 watts of PuO2 contents in the PCV. Theanalysis was performed to determine the PCV seal temperature, and to ensure that theresulting gas pressure would not be higher than the MNOP (365.4 psig). The analysiswas performed for the LLNL configuration. The analysis shows that the MNOP at NCTbounds the temperatures and pressure inside PCV when the ambient is at -20'F.
This revision (Revision 5) contains thermal analyses for the Hanford convenience canconfiguration. This can configuration is similar to BNFL and Rocky Flats 3013 productcan configurations. Table I lists the contents of the packagings and the Table 2 gives theexternal dimensions of the containers. The analyses show that the temperatures for theHanford product can configuration with 19 watts of PuO2 contents are bounded by theexisting BNFL and Rocky Flats product cans analyses.
This revision (Revision 4) incorporates a note in Table 1 to clarify the impact of theconsideration of CO2 in analyzing the various content configurations listed in Table 1.CO 2 is required for the Food Can configuration only. The inclusion of this note will notimpact the results and conclusions in this calculation.
This revision (Revision 3) contains some typographical corrections to Revision 2,addition of a spacer in the Rocky Flats configuration, and analysis results for the LLNLcontent configuration. Specifically, LLNL content configuration was added in Table 1,LLNL convenience can dimensions were added in Table 2, typographical errors in thethermal conductivity values of air in Table 4 were corrected, and thermal properties ofCO 2 were added in Table 4. Justification is provided for the addition of the spacer in theRocky Flats configuration which will not impact the conclusions from the Revision 2analyses. Results for the LLNL can configuration are presented.
This revision contains corrections to Revision I which respond to questions 3.33, 3.34and 3.35 in the "Q7 Review Questions, 9975 Packaging, Docket No. 93-4-9975" for the9975 shipping package SARP. Specifically, a typographical error was corrected in the
Appendix 3.3 - 5 of 44
Revision I S-SAR-G-0000 I
M-CLC-F-00590, Rev. 8, Pg.4 of 42
equation for natural convection for 1.0 x 10⁹ < Ra, the pre-fire density for Celotex®
(fiberboard) in Table 4 was corrected and figures showing isotherms in the Celotex® wereadded. In addition, Tables 5 and 6 were updated to include the peak temperatures in theCelotex® and lead shield.
The thermal analysis of the 9975 package performed in Reference 1 has been revised toincorporate minor design modifications, revised content configurations, a revised foodcan configuration and an accident fire analysis. Three content configurations utilizing the3013 vessel (two Pu metal and one Pu oxide) and one Pu oxide configuration with foodcans were analyzed. All 9975 content configurations were analyzed for Normalconditions of Transport (NCT) and the Hypothetical Accident Conditions (HAG) fire. Inall analyses, a 19 watt total decay power was uniformly distributed over the volume ofthe Pu metal and/or oxide.
For both the NCT and HAC analyses the 9975 drum was upright. In the steady-stateNCT analysis, the drum was exposed to insolation heat flux of 800 W/m 2 on the drum topand 400 W/m 2 on the drum side (253.6 Btu/hr-ft2 and 126.8 Btu/hr-ft2). The drum bottomwas adiabatic for the NCT analyses and the 9975 package exchanged heat through naturalconvection and radiation to an ambient temperature of 100'F.
During the HAC transient, the ambient temperature was 1475'F for the first 30 minutesand 1 00°F thereafter. The initial condition for the HAC transient was identical to thesteady-state NCT, except insolation was excluded. In the 30 minute fire phase, all sidesof the drum (including the bottom) were heated by forced convection and radiation. Thecooldown phase occurred immediately after the 30 minute fire. During this phase thedrum was exposed to a 1 00'F ambient temperature, and insolation on the drum top andside (as in NCT) was included. The bottom of the drum transferred heat to the ambientvia radiation only during cooldown. The entire HAC transient consisted of the 30 minutefire and 3 hours of cooldown.
The containment vessels, seals, and Pu temperatures were found to be higher during NCT(with insolation) than at any time during the 3 hour HAC transient. This result isexpected because of the high thermal resistance of the Celotex® overpack in the 9975package. Therefore, NCT (with insolation) temperatures bound the thermal conditionsfor the 9975 components of interest (e.g. outer drum not of interest) when 19 watts ofpayload are considered.
The most significant NCT temperature results are summarized to provide insight into theperformance of the 9975 package. The middle Pu metal temperature is 423°F for theRocky 3013 configuration and 314'F for the SRS 3013 configuration. The containmentvessels and seals are below 300'F in all configurations, and the maximum peakfiberboard temperature of approximately 257°F occurs for 3013 oxide and the RockyFlats configurations. The average primary containment vessel (PCV) gas temperaturesfor the 3013 oxide and food can configurations are 308'F and 313'F, respectively.
Appendix 3.3 - 6 of 44
Revision I S-SAR-G-00001
M-CLC-F-00590, Rev. 8, Pg.5 of 422.0 Input
Several minor changes to the design of the 9975 package and the addition of 3013packing configurations required NCT and HAC thermal analyses to be revisited. Inaddition to three 3013 container storage configurations (two for Pu metal and one for Puoxide), a thermal analysis was performed for a food can configuration. Allconfigurations were analyzed under the Normal Conditions of Transport (NCT) and theHypothetical Accident Conditions (HAC) fire. In the NCT analysis, the drum wasexposed to insolation heat flux. The bottom of the drum was adiabatic and the top andsides of the 9975 package exchanged heat through natural convection and radiation to anambient temperature of I 00°F. The HAC analysis initiated from a steady state which wasidentical to the NCT analysis except that insolation was absent. For the HAC analysis,the drum was upright and exposed to an ambient temperature was 1475'F for the first 30minutes and 1 00°F thereafter. For all analyses, a 19 watt total decay power wasuniformly distributed over the volume of the Pu metal and/or oxide as an internal heatsource.
2.1 Thermal Models
2.1.1 Geonietrv and Contents
Table 1 identifies all of the 9975 content configurations currently considered. A schematicof the contents of the 9975 package with the 3013 container and the Food Can containers isshown in Figure 1. The BNFL, Hanford, LLNL, and Rocky Flats configurations consist ofthree nested containers/cans within the PCV of the 9975. The Food Can configurationconsists of two stacked cans within the PCV. The SRS 3013 and the Food Canconfigurations are double nested. LLNL Hex-Can configuration has one Hex-Can, twoaluminum spacers, and an aluminum sleeve similar to the Food Can configuration.Dimensions of the containers/cans are shown in Table 2.
Figure 1 does not show the ingot can spacer [9] for the Rocky Flats configuration. LLNLconfiguration consists of BNFL outer can, BNFL inner can, and the LLNL conveniencecans (1 or 2). Hanford configuration consists of BNFL outer can, Hanford BTS innercan, and the Hanford convenience can.
2.1.2 Axisymnietric Thermal Models
Based on the 9975 package geometry, axisymmetric models were developed in PATRANand run with MSC/Thermal. A color representation of the material composition of a9975 package, which does not include the finite element mesh, is shown in Figure 2.Figure 3 shows a detailed schematic of the axisymmetric model of the 9975 packagingwith the BNFL configuration for Pu oxide contents. The four axisymmetric 9975 models(three 3013 and one food can) contain roughly 7300 nodes each. An example of the typeof mesh used is shown in Figure 4. An ingot can spacer was added to the Rocky Flatsconfiguration after the Rev. 2 of this calculation. The spacer is not an axisymmetriccomponent and is not modeled in the model. The RFET spacer is fabricated from two
Appendix 3.3 - 7 of 44
Revision I S-SAR-G-0000 I
M-CLC-F-00590, Rev. 8, Pg.6 of 42stainless steel pieces of sheet metal. Each sheet is 1/16 thick and approximately 2 incheshigh by 4 inches wide. The weight of the spacer is 0.285 lb (130 g). The mass and size ofthe spacer are such that it is not expected to alter the conclusions of the calculations thatwere performed without a spacer (see Item 8 of Results).
LLNL Hex-Can is modeled as a cylinder having the same internal volume (0.75 Liter)and height (4.08 inches) as the original geometry. This simplification is reasonable tomaintain the axisymmetric nature of the model. Metal volume of the Hex-Can walls issmall and is conservatively neglected. The walls maintain their radiative characteristicsfor radiation heat transfer.
Heat is transferred within the 9975 package by conduction and radiation. In all models,thermal radiation heat transfer was applied across all gaps filled with gas while naturalconvection was neglected in the internal gas spaces. Further, all gasses were assumednon-absorbing for thermal radiation and, hence, were treated as non-participating mediain the radiation calculations. For the SRS and Rocky Flats models, the Pu metal buttonswere modeled as disks 0.75 in. thick with flat tops and 5.125 in. radius of curvaturebottoms (curved side down) as shown in Figure 5 [2]. Contact between the metal buttonand the container is at a point. In the case of the BNFL and Food Can models, the Puoxide was assumed to completely fill the innermost container.
2.2 Normal Conditions of Transport
In 10 CFR-71.71(c) (1) the NCT are defined as an ambient temperature of I00F in stillair with solar heating of 800 W / m2 on the top of the drum and 400 W / m2 on the side.The 9975 drum is assumed to be upright and to have an adiabatic bottom surface. Heattransfer from the side and top of the drum to the ambient occurs via natural convectionand radiation.
The convection coefficients used are functions of the temperature difference between thedrum surfaces and the ambient temperature. Heat transfer coefficients for naturalconvection were obtained from correlations in the MSC/Thermal code. Specifically, thenatural convection correlations are for isothermal plates and have the form:
1. For a vertical isothermal plate with Ra < 1.0x 10⁹,
0.670 x Ra 0 25
2. For a vertical isothermal plate with 1.0 x 1 < <Ra
Appendix 3.3 - 8 of 44
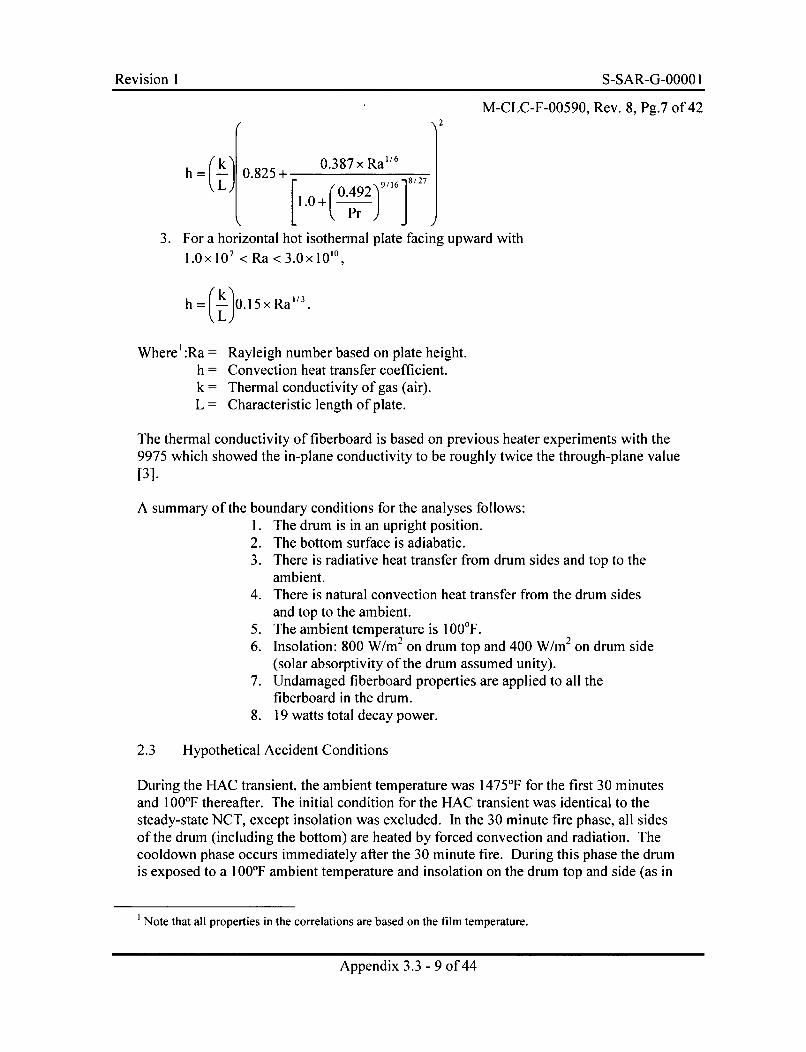
Revision I S-SAR-G-0000 IRevision 1 S-SAR-G-O000 1
M-CLC-F-00590, Rev. 8, Pg.7 of 422
h 0.8250+ .387 x Ra 6 1
L = 082 + _ 0.492.,19/16_]18/ 27
I 1 + Pr]8 7
3. For a horizontal hot isothermal plate facing upward with1.0x10 7 <Ra<3.0xl010 ,
h =(k!Sj0.15 xRa"3
Where':Ra = Rayleigh number based on plate height.h = Convection heat transfer coefficient.k = Thermal conductivity of gas (air).L = Characteristic length of plate.
The thermal conductivity of fiberboard is based on previous heater experiments with the9975 which showed the in-plane conductivity to be roughly twice the through-plane value[3].
A summary of the boundary conditions for the analyses follows:I. The drum is in an upright position.2. The bottom surface is adiabatic.3. There is radiative heat transfer from drum sides and top to the
ambient.4. There is natural convection heat transfer from the drum sides
and top to the ambient.5. The ambient temperature is 100°F.6. Insolation: 800 W/m 2 on drum top and 400 W/m 2 on drum side
(solar absorptivity of the drum assumed unity).7. Undamaged fiberboard properties are applied to all the
fiberboard in the drum.8. 19 watts total decay power.
2.3 Hypothetical Accident Conditions
During the HAC transient, the ambient temperature was 1475°F for the first 30 minutesand 100IF thereafter. The initial condition for the HAC transient was identical to thesteady-state NCT, except insolation was excluded. In the 30 minute fire phase, all sidesof the drum (including the bottom) are heated by forced convection and radiation. Thecooldown phase occurs immediately after the 30 minute fire. During this phase the drumis exposed to a 100'F ambient temperature and insolation on the drum top and side (as in
Note that all properties in the correlations are based on the film temperature.
Appendix 3.3 - 9 of 44
Revision 1 S-SAR-G-0000 1
M-CLC-F-00590, Rev. 8, Pg.8 of 42NCT) is included. During the cooldown phase, the bottom of the drum transfers heat tothe ambient by radiation only. The top and sides of the drum transfer heat to the ambientvia both radiation and natural convection. The entire HAC transient consists of the 30minute fire plus 3 hours of cooldown. The conditions for the three phases of the HAC aregiven below.
For the initial phase of the HAC:1. The drum is in an upright position.2. The bottom surface is adiabatic.3. There is radiation heat transfer from the sides and top of the
drum to the ambient.4. There is natural convection heat transfer from the drum sides
and top to the ambient. Convection coefficients were obtainedfrom correlations for natural convection in MSC/Thermal.
5. The ambient temperature is I00°F.6. No insolation.7. Undamaged fiberboard properties are applied to all the
fiberboard in the drum.8. 19 watts total decay power.
For the fire phase of the HAC:I. The drum is in an upright position.2. There is forced convection from all surfaces of the drum. The
convection coefficients, based on a 20 m/s air velocity, are:i. 5.9 Btu/hr-ft 2 'F for the top and bottom of the drum.ii. 3.0 Btu/hr-ft2 'F for the side of the drum.
3. There is thermal radiation heat transfer from all surfaces of thedrum to the ambient.
4. The ambient temperature is 1475°F.5. No insolation.6. Fire phase fiberboard properties are applied to all the
fiberboard in the drum-.7. 19 watts total decay power.
For the fire post-fire phase of the HAC:1. The drum is in an upright position.2. There is thermal radiation from the top, sides and bottom of the
drum to the ambient.3. There is natural convection from the top and sides of the drum
to the ambient. Convection coefficients were obtained fromcorrelations for natural convection in MSC/Thermal.
4. The ambient temperature is I 00°F.5. Insolation: 800 W/m on drum top and 400 W/m 2 on drum side
(solar absorptivity of the drum assumed unity).
2 The fiberboard properties used during the fire analyses were developed from extensive testing [4].
Appendix 3.3 - 10 of 44
Revision I S-SAR-G-0000 I
M-CLC-F-00590, Rev. 8, Pg.9 of 426. "Char layer" properties are applied to the outer 1.4 inch layer
of the top, bottom and sides of the fiberboard contained in thedrum2.
7. Fire phase properties are applied to the all fiberboard not in the1.4 inch outer layer 2.
8. 19 watts total decay power.
2.4 Thermal Properties
Conduction heat transfer through helium, carbon dioxide and air were considered (asappropriate) within the package, as indicated in Table 1. As mentioned previously, allgasses were assumed to be non-absorbing. The temperature ranges of the gasses wereconsidered when assigning the constitutive properties, however, the gas pressure wasassumed to remain at 1 atm.
The thermal properties of the packaging components used in the analyses are shown inTables 3 and 4.
3.0 Analytical Methods and Computations
The general purpose conduction-radiation computer code MSC/Thermal (also known asP/Thermal) was used to perform the computations [5]. This computer code meets sitenuclear safety QA requirements [6]. Work was performed in accordance with the WSRC E-7manual [7]. The thermal models of the storage configurations were created using the generalpurpose finite element pre and post processor PATRAN [8].
4.0 Results
Steady state temperatures predicted by the models for NCT and HAC are shown inTables 5 - 8. HAC transient temperatures are shown in Tables 9 - 24 and Figures 6 - 13.Temperature profiles in the fiberboard for NCT are shown in Figures 14 - 17. In thetables, temperatures at key locations are shown for each configuration. A review of theresults shows that all the configurations have similar temperature distribution with minordifferences for the different components. The BNFL oxide can configuration appears tohave the higher temperatures than others. Figure 18 shows the PCV and SCVtemperature contours for the BNFL oxide configuration during NCT. The followingresults are noteworthy:
1. The maximum predicted fiberboard temperature is approximately 2570 F (125°C)and occurs with the Pu oxide in the BNFL 3013 configuration.
2. During NCT, the maximum SCV temperature is 268'F (13 IVC) and the maximumPCV temperature is 285'F (140'C). The maximum temperature occurs on thebottom of the containment vessels with the 3013 Rocky configuration (Pu metal).
Appendix 3.3 - 11 of 44
Revision I S-SAR-G-0000 I
M-CLC-F-00590, Rev. 8, Pg.10 of 423. During NCT, the maximum PCV seal temperature is 264'F (129C) and the
maximum SCV seal temperature is 252'F (129°C).
4. During NCT, the middle Pu centerline temperatures are 525°F (274°C), 423°F(217°C), 314-F (157'C) and 4010F (205'C) for the 3013 BNFL (Pu oxide), 3013Rocky (Pu metal), 3013 SRS (Pu metal), and food can (Pu oxide) configurations,respectively.
5. During NCT, the average PCV gas temperature for the BNFL 3013 configuration(Pu oxide) is 308'F (153°C) and for the Food Can configuration (Pu oxide) is313'F (156'C). Average gas temperatures were calculated by volume averagingof nodal temperatures at select nodal locations in the cavities within the PCV.The nodal temperatures were selected along the cavity centerlines and on cavitysurfaces.
6. Except near the outer region of the package, temperatures at the end of the 30minute HAC fire are lower than during NCT (with insolation). The temperaturesare about 90'F cooler inside the PCV at the end of the HAC fire compared withNCT (with insolation).
7. For the BNFL (Pu oxide) configuration during NCT, the lead temperature near theaxial midplane is approximately 253°F. The maximum lead temperature ofapproximately 257°F occurs at the bottom of the lead shield near the support forthe SCV.
8. The Rocky Flats configuration will use a spacer [9] to raise Pu metal buttons intheir convenience cans. This will raise the center of the buttons 2" from theanalyzed condition. This shift in the location of the heat source will shift thehigher PCV temperatures from the bottom of the vessel to the side of the vessel(see Tables 5, 11, and 12). However this shift still places the location of themaximum temperature well below the PCV O-rings and will not adversely impactthe integrity of the O-rings.
9. The LLNL and BNFL Oxide configurations have similar packaging temperaturesfor the pre-fire and solar conditions. These are shown in Tables 5 and 7. Basedon the closeness of these temperatures, it is concluded that the temperaturesduring the fire and post-fire transients will also be similar and were therefore notrecalculated.
10. The Hanford Pu oxide can configuration has similar or lower temperatures thanthe LLNL and BNFL configurations for the pre-fire and solar conditions. Theseare shown in Tables 5 and 7. Based on the closeness of these temperatures, it isconcluded that the temperatures during the fire and post-fire transients will also besimilar and were therefore not recalculated. In general, the maximumtemperatures with Pu metal contents are lower than with Pu oxide contents and,therefore, this configuration is also not reanalyzed.
Appendix 3.3 - 12 of 44
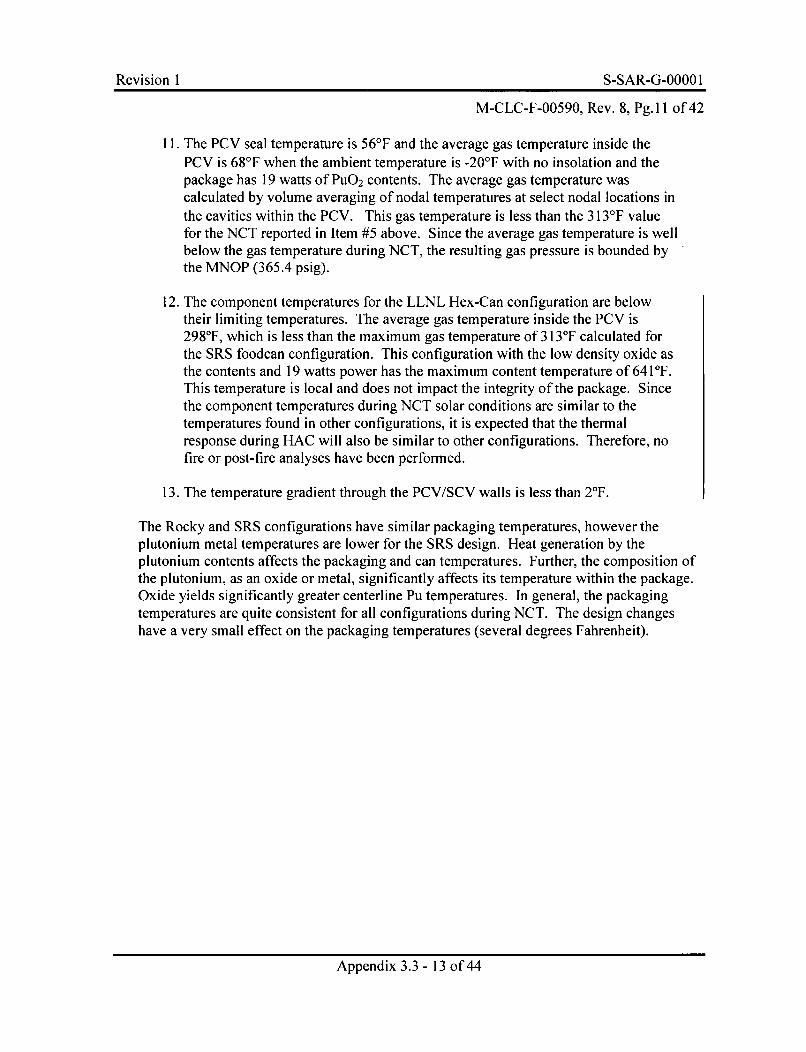
Revision I S-SAR-G-0000 I
M-CLC-F-00590, Rev. 8, Pg.l 1 of 42
11. The PCV seal temperature is 56°F and the average gas temperature inside thePCV is 68'F when the ambient temperature is -207F with no insolation and thepackage has 19 watts of PuO2 contents. The average gas temperature wascalculated by volume averaging of nodal temperatures at select nodal locations inthe cavities within the PCV. This gas temperature is less than the 313'F valuefor the NCT reported in Item #5 above. Since the average gas temperature is wellbelow the gas temperature during NCT, the resulting gas pressure is bounded bythe MNOP (365.4 psig).
12. The component temperatures for the LLNL Hex-Can configuration are belowtheir limiting temperatures. The average gas temperature inside the PCV is298°F, which is less than the maximum gas temperature of 313'F calculated forthe SRS foodcan configuration. This configuration with the low density oxide asthe contents and 19 watts power has the maximum content temperature of 641'F.This temperature is local and does not impact the integrity of the package. Sincethe component temperatures during NCT solar conditions are similar to thetemperatures found in other configurations, it is expected that the thermalresponse during HAC will also be similar to other configurations. Therefore, nofire or post-fire analyses have been performed.
13. The temperature gradient through the PCV/SCV walls is less than 2°F.
The Rocky and SRS configurations have similar packaging temperatures, however theplutonium metal temperatures are lower for the SRS design. Heat generation by theplutonium contents affects the packaging and can temperatures. Further, the composition ofthe plutonium, as an oxide or metal, significantly affects its temperature within the package.Oxide yields significantly greater centerline Pu temperatures. In general, the packagingtemperatures are quite consistent for all configurations during NCT. The design changeshave a very small effect on the packaging temperatures (several degrees Fahrenheit).
Appendix 3.3 - 13 of 44
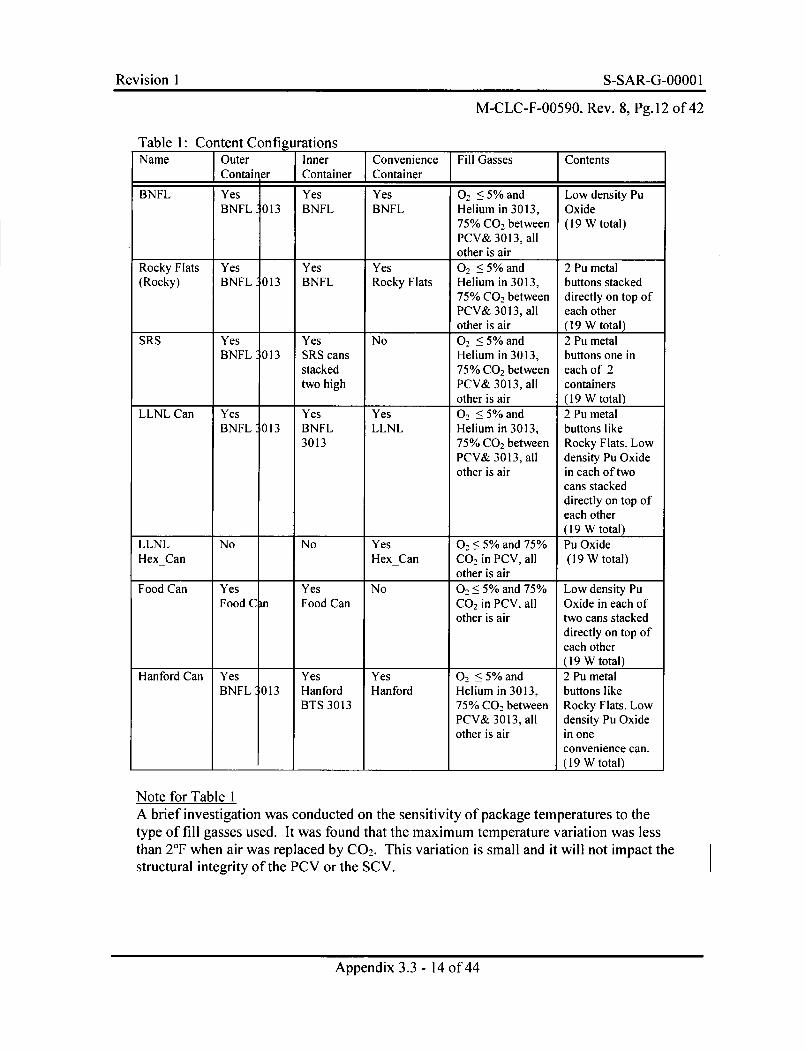
Revision I S-SAR-G-0000 1
M-CLC-F-00590, Rev. 8, Pg.12 of 42
Table 1: Content ConfigurationsName Outer Inner Convenience Fill Gasses Contents
Contai er Container Container
BNFL Yes Yes Yes 02 < 5% and Low density PuBNFL 013 BNFL BNFL Helium in 3013, Oxide
75% CO 2 between (19 W total)PCV& 3013, allother is air
Rocky Flats Yes Yes Yes 0 < 5% and 2 Pu metal(Rocky) BNFL 013 BNFL Rocky Flats Helium in 3013, buttons stacked
75% CO2 between directly on top ofPCV& 3013, all each otherother is air (19 W total)
SRS Yes Yes No O2 < 5% and 2 Pu metalBNFL 013 SRS cans Helium in 3013, buttons one in
stacked 75% CO 2 between each of 2two high PCV& 3013, all containers
other is air (19 W total)LLNL Can Yes Yes Yes 0 < 5% and 2 Pu metal
BNFL 013 BNFL LLNL Helium in 3013, buttons like3013 75% CO 2 between Rocky Flats. Low
PCV& 3013, all density Pu Oxideother is air in each of two
cans stackeddirectly on top ofeach other(19 W total)
LLNL No No Yes 0: < 5% and 75% Pu OxideHexCan HexCan CO2 in PCV, all (19 W total)
other is airFood Can Yes Yes No O < 5% and 75% Low density Pu
Food C n Food Can CO2 in PCV, all Oxide in each ofother is air two cans stacked
directly on top ofeach other(19 W total)
Hanford Can Yes Yes Yes O < 5% and 2 Pu metalBNFL 013 Hanford Hanford Helium in 3013, buttons like
BTS 3013 75% CO2 between Rocky Flats. LowPCV& 3013, all density Pu Oxideother is air in one
convenience can.(19 W total)
Note for Table 1A brief investigation was conducted on the sensitivity of package temperatures to thetype of fill gasses used. It was found that the maximum temperature variation was lessthan 2'F when air was replaced by CO2 . This variation is small and it will not impact thestructural integrity of the PCV or the SCV.
Appendix 3.3 - 14 of 44
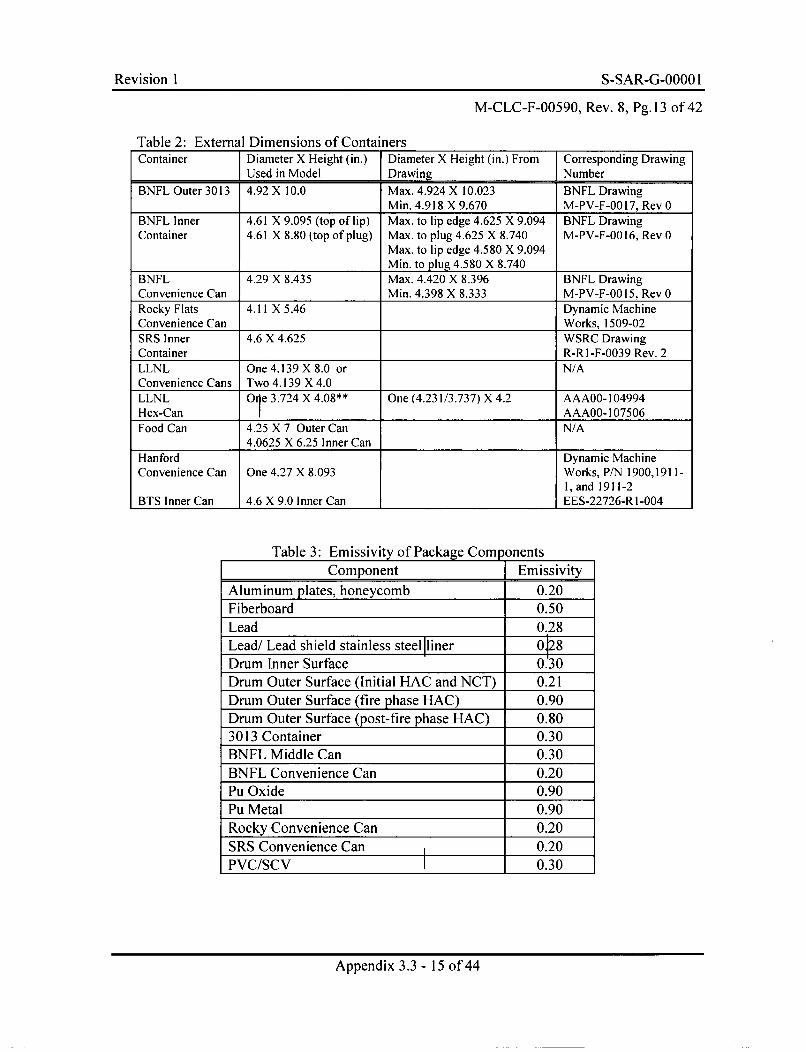
Revision I S-SAR-G-0000 I
M-CLC-F-00590, Rev. 8, Pg.13 of 42
Table 2: External Dimensions of ContainersContainer Diameter X Height (in.) Diameter X Height (in.) From Corresponding Drawing
Used in Model I Drawing N umber
BNFL Outer 3013 4.92 X 10.0 Max. 4.924 X 10.023 BNFL DrawingMin. 4.918 X 9.670 M-PV-F-0017, Rev 0
BNFL Inner 4.61 X 9.095 (top of lip) Max. to lip edge 4.625 X 9.094 BNFL DrawingContainer 4.61 X 8.80 (top of plug) Max. to plug 4.625 X 8.740 M-PV-F-0016, Rev 0
Max. to lip edge 4.580 X 9.094Min. to plug 4.580 X 8.740
BNFL 4.29 X 8.435 Max. 4.420 X 8.396 BNFL DrawingConvenience Can Min. 4.398 X 8.333 M-PV-F-0015, Rev 0Rocky Flats 4.11 X 5.46 Dynamic MachineConvenience Can Works, 1509-02SRS Inner 4.6 X 4.625 WSRC DrawingContainer R-RI-F-0039 Rev. 2LLNL One 4.139 X 8.0 or N/AConvenience Cans Two 4.139 X 4.0LLNL Ole 3.724 X 4.08** One (4.231/3.737) X 4.2 AAAOO-104994Hex-Can[ AAAOO-107506Food Can 4.25 X 7 Outer Can N/A
4.0625 X 6.25 Inner CanHanford Dynamic MachineConvenience Can One 4.27 X 8.093 Works, P/N 1900,1911-
1, and 1911-2BTS Inner Can 4.6 X 9.0 Inner Can EES-22726-R1-004
Table 3: Emissivity of Package ComponentsComponent Emissivity
Aluminum plates, honeycomb 0.20Fiberboard 0.50Lead 0.28Lead/ Lead shield stainless steel liner 0P8Drum Inner Surface 0.30Drum Outer Surface (Initial HAC and NCT) 0.21Drum Outer Surface (fire phase HAC) 0.90Drum Outer Surface (post-fire phase HAC) 0.803013 Container 0.30BNFL Middle Can 0.30BNFL Convenience Can 0.20Pu Oxide 0.90Pu Metal 0.90Rocky Convenience Can 0.20SRS Convenience Can 0.20PVC/SCV 0.30
Appendix 3.3 - 15 of 44
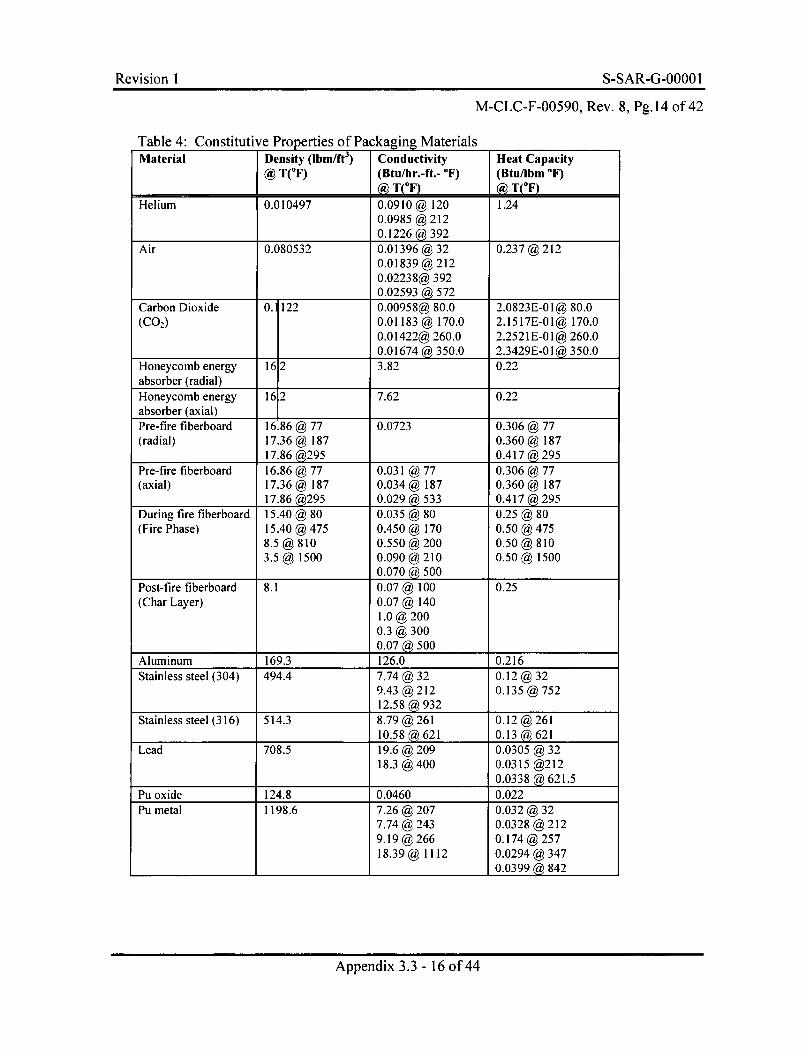
Revision 1 S-SAR-G-0000 I
M-CLC-F-00590, Rev. 8, Pg.14 of 42
Table 4: Constitutive Properties of Packaging MaterialsMaterial Density (Ibm/ft3) Conductivity Heat Capacity
@ T(°F) I (Btu/hr.-ft.- °F) (Btu/lbm 0F)___ _ * @T(0F) @ T(°F)
Helium 0.010497 0.0910 @ 120 1.240.0985 @ 2120.1226 @ 392
Air 0.080532 0.01396 @ 32 0.237 @ 2120.01839 @ 2120.02238@ 3920.02593 @ 572
Carbon Dioxide 0. 122 0.00958@ 80.0 2.0823E-01@ 80.0(C0 2) 0.01183 @ 170.0 2.1517E-01@ 170.0
0.01422@ 260.0 2.2521E-01@ 260.00.01674 @ 350.0 2.3429E-01@ 350.0
Honeycomb energy 16 2 3.82 0.22absorber (radial) IHoneycomb energy 162 7.62 0.22absorber (axial)Pre-fire fiberboard 16.86 @ 77 0.0723 0.306 @ 77(radial) 17.36 @ 187 0.360.@ 187
17.86 @295 0.417 @ 295Pre-fire fiberboard 16.86 @ 77 0.031 @ 77 0.306 @ 77(axial) 17.36 @ 187 0.034 @ 187 0.360 @ 187
17.86 @295 0.029 @ 533 0.417 @ 295During fire fiberboard 15.40 @ 80 0.035 @ 80 0.25 @ 80(Fire Phase) 15.40 @ 475 0.450 @ 170 0.50 @ 475
8.5 @ 810 0.550 @ 200 0.50 @ 8103.5 @ 1500 0.090 @ 210 0.50 @ 1500
0.070 @ 500Post-fire fiberboard 8.1 0.07 @ 100 0.25(Char Layer) 0.07 @ 140
1.0 @ 2000.3 @ 3000.07 @ 500
Aluminum 169.3 126.0 0.216Stainless steel (304) 494.4 7.74 @ 32 0.12 @ 32
9.43 @ 212 0.135 @ 75212.58 @ 932
Stainless steel (316) 514.3 8.79 @ 261 0.12 @ 26110.58@621 0.13@621
Lead 708.5 19.6 @ 209 0.0305 @ 3218.3 @ 400 0.0315 @212
0.0338 @ 621.5Pu oxide 124.8 0.0460 0.022Pu metal 1198.6 7.26 @ 207 0.032 @ 32
7.74 @ 243 0.0328 @ 2129.19 @ 266 0.174 @ 25718.39@ 1112 0.0294@347
1_ 1_ 1 10.0399 @ 842
Appendix 3.3 - 16 of 44
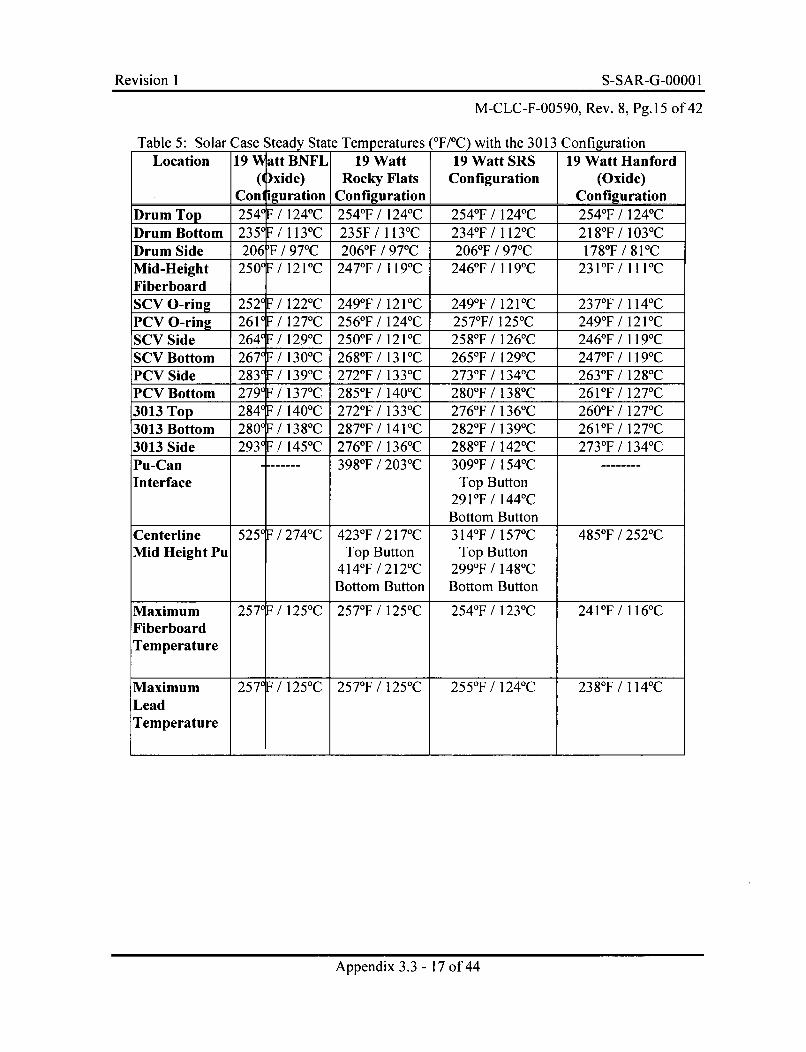
Revision I S-SAR-G-0000 I
M-CLC-F-00590, Rev. 8, Pg.15 of 42
Table 5: Solar Case Steady State Temperatures (0F/0C) with the 3013 ConfigurationLocation 19 Matt BNFL 19 Watt 19 Watt SRS 19 Watt Hanford
(I )xide) Rocky Flats Configuration (Oxide)Con iguration Configuration Configuration
Drum Top 254'F / 1240C 254 0F /124 0C 254 0F /124 0 C 254 0F /124 0 CDrumBottom 235- /113 0C 235F/113 0 C 234 0F/1120 C 218°F/1030 CDrum Side 206'F / 970C 206OF / 970C 206°F / 970C 178 0F / 81°CMid-Height 2500 / 121°C 247 0F / 119 0C 246 0F / 119 0 C 231°F / 111°CFiberboardSCV O-ring 252F / 122 0C 249 0F/ 121°C 2490F/ 121°C 237 0F / 114 0CPCV 0-ring 261 / 127 0C 256 0F / 124 0C 257 0F/ 125 0C 2490F / 121°CSCV Side 2640F / 129 0C 250°F/ 121 0C 258 0F / 126 0C 246 0F / 119 0CSCV Bottom 2670F / 1300C 268 0F /131°C 265 0F / 1290 C 247 0F / 119 0 CPCV Side 2830V / 139 0C 2720F / 133°C 2730F / 1340C 2630F / 128 0CPCV Bottom 2790F / 137 0C 2850F / 1400C 280°F / 1380C 261°F / 127 0C3013 Top 2840F / 1400C 2720F /133 0C 2760F /136 0 C 260F /127 0 C3013 Bottom 280OF / 138 0C 287 0F /141 0C 2820F /139 0C 261OF /127 0C3013 Side 2930F / 1450C 2760F /136 0C 2880F /142 0 C 273 0F /134 0 CPu-Can 3980F / 2030C 309°F / 1540CInterface Top Button
291°F / 1440CBottom Button
Centerline 525F /274 0C 423 0F /217 0C 314°F / 157 0C 485 0F / 2520CMid Height Pu Top Button Top Button
414°F / 212 0C 2990F / 148 0CBottom Button Bottom Button
Maximum 257F / 1250C 257 0F / 1250C 254 0F / 123 0C 241OF / 1 160CFiberboardTemperature
Maximum 257 / 125 0C 257 0F / 1250C 2550F / 1240C 238 0F / 1 140CLeadTemperature
Appendix 3.3 - 17 of 44
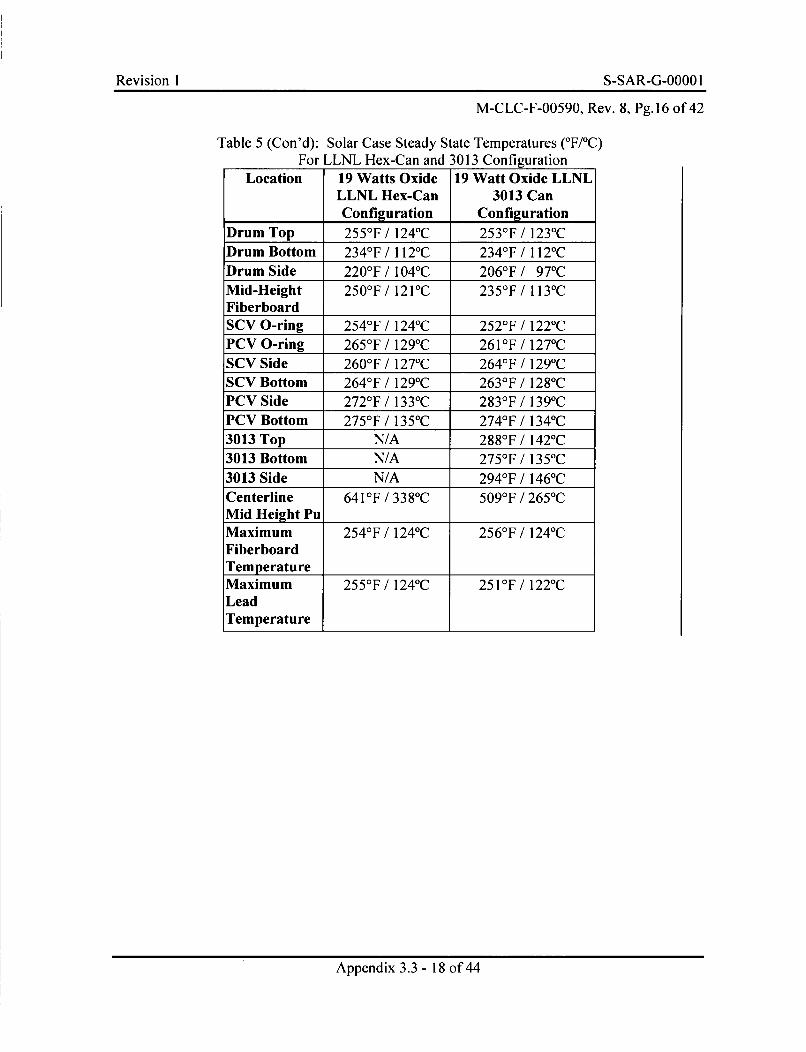
Revision I S-SAR-G-0000 I
M-CLC-F-00590,. Rev. 8, Pg.16 of 42
Table 5 (Con'd): Solar Case Steady State Temperatures (°F/°C)For LLNL Hex-Can and 3013 Configuration
Location 19 Watts Oxide 19 Watt Oxide LLNLLLNL Hex-Can 3013 CanConfiguration Configuration
Drum Top 255 0F / 1240C 253 0F / 1230CDrum Bottom 234 0F / 112 0C 234 0F / 112 0CDrum Side 220°F / 1040C 206°F / 970CMid-Height 250°F / 121°C 235 0F / 113 0CFiberboardSCV O-ring 2540 F / 124 0C 252 0 F / 1220CPCV O-ring 2650 F / 129 0C 261°F / 1270CSCV Side 260°F / 127 0C 2640 F / 129 0CSCV Bottom 2640 F / 129 0C 2630 F / 128 0CPCV Side 272 0F / 1330C 283 0F / 1390 CPCV Bottom 2750 F / 135 0C 2740F / 134 0C3013 Top N/A 288 0F / 1420 C3013 Bottom N/A 275 0F / 1350 C3013 Side N/A 294 0F / 1460CCenterline 641 OF / 338 0C 509°F / 2650CMid Height PuMaximum 254 0F / 1240 C 256 0F / 1240 CFiberboardTemperatureMaximum 255 0F /124 0 C 251°F / 1220 CLeadTemperature
Appendix 3.3 - 18 of 44
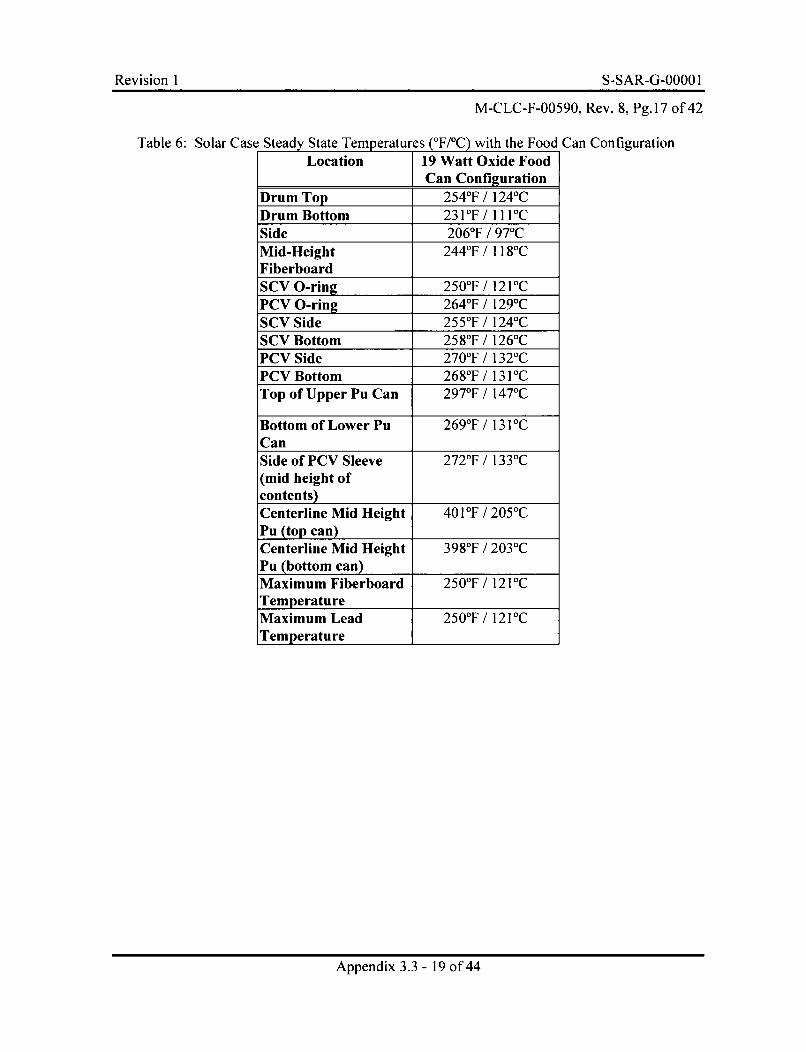
Revision I S-SAR-G-0000 1
M-CLC-F-00590, Rev. 8, Pg.17 of 42
Table 6: Solar Case Steady State Temperatures (°F/°C) with the Food Can ConfigurationLocation 19 Watt Oxide Food
Can Configuration
rDrum Top 254 0F / 1240C
Drum Bottom 231°F / 111°CSide 206°F / 97 0CMid-Height 2440F / 11 80CFiberboardSCV O-ring 250°F/ 121°CPCV O-ring 2640F / 1290CSCV Side 2550F / 124 0CSCV Bottom 2580F / 126 0CPCV Side 270°F / 132 0CPCV Bottom 268 0F/ 13 1°CTop of Upper Pu Can 2970F / 147 0C
Bottom of Lower Pu 2690F / 131°CCanSide of PCV Sleeve 2720F / 133 0C(mid height ofcontents)Centerline Mid Height 401°F / 2050CPu (top can)Centerline Mid Height 3980F / 2030CPu (bottom can)Maximum Fiberboard 250°F / 121°CTemperatureMaximum Lead 250°F / 121°CTemperature
Appendix 3.3 - 19 of 44
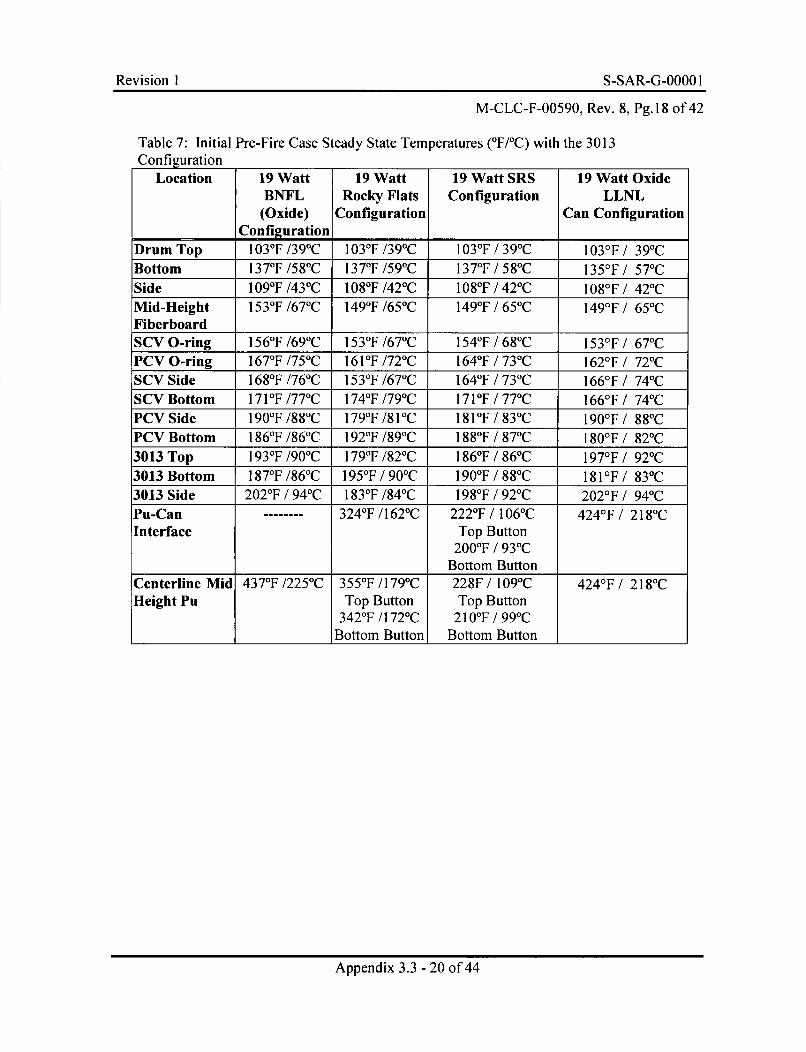
Revision I S-SAR-G-0000 I
M-CLC-F-00590, Rev. 8, Pg.18 of 42
Table 7: Initial Pre-Fire Case Steady State Temperatures (°F/°C) with the 3013Configuration
Location 19 Watt 19 Watt 19 Watt SRS 19 Watt OxideBNFL Rocky Flats Configuration LLNL
(Oxide) Configuration Can ConfigurationConfiguration
Drum Top 103 0F /390C 103 0F /390C 103 0F / 390C 103 0F / 390CBottom 137 0F/580C 137 0F/590C 137 0F / 580 C 135 0F / 570CSide 109 0F /430C 108 0F /420C 108 0F / 420C 108 0 F / 420CMid-Height 153 0F /670C 149 0F /65 0C 149 0F / 650C 149 0F / 650CFiberboardSCV O-ring 156 0F /690C 153 0F /670C 154 0F / 680C 153 0 F / 670CPCV O-ring 167 0F /750C 161OF /720C 164 0F / 730C 162 0 F / 720CSCV Side 1680F /760C 153 0F /670C 164 0F / 730C 166 0 F / 740CSCV Bottom 171OF/770C 174 0F/790C 171OF / 770C 166 0F / 740CPCV Side 190OF/880C 179 0F/81°C 181°F/ 830C 190°F / 88 0CPCV Bottom 186 0F /860C 192 0F /89 0C 188 0F / 87 0C 180°F / 820C3013 Top 193 0F/900C 179 0F/820C 186 0F / 860C 197 0F / 920C3013 Bottom 187 0F/860C 195 0F / 900C 190°F / 880C 181°F / 830C3013 Side 202°F / 94 0C 183 0F /84 0C 198 0F / 920C 202°F / 940CPu-Can 3240F /1620C 2220F / 1060C 4240F / 218 0CInterface Top Button
200°F / 930CBottom Button
Centerline Mid 4370F /225 0C 355 0F /179 0C 228F / 1090C 4240F / 218 0CHeight Pu Top Button Top Button
3420F /172 0C 210°F / 990CBottom Button Bottom Button
Appendix 3.3 - 20 of 44
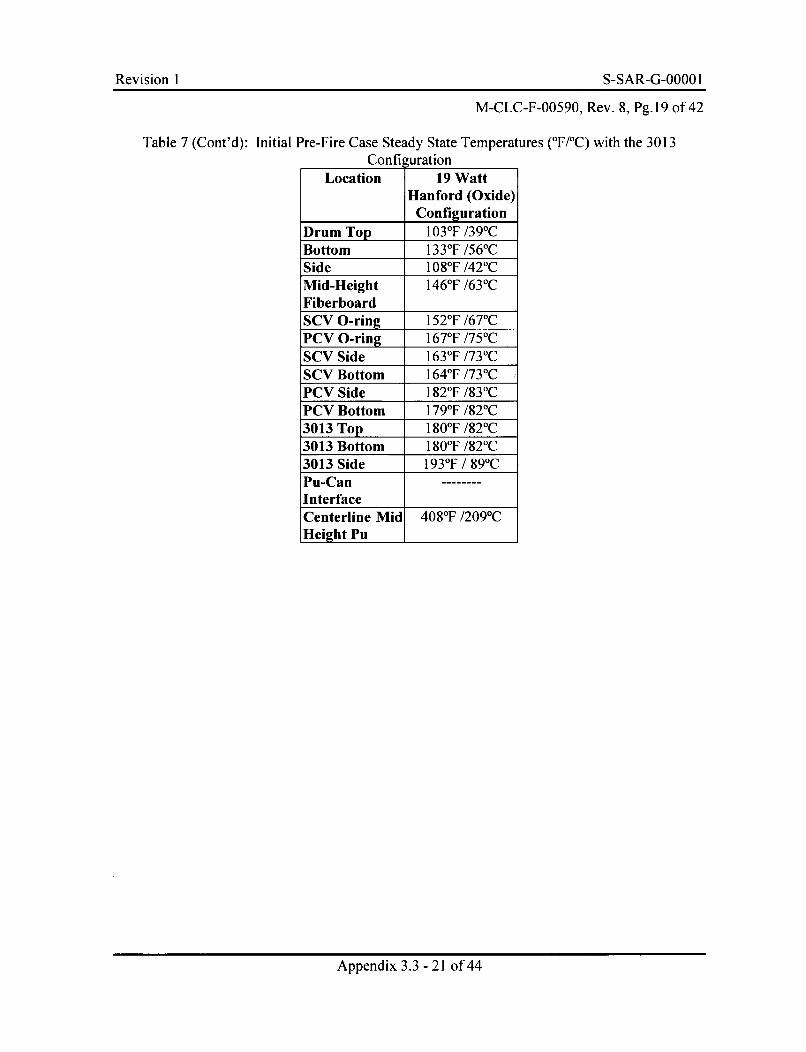
Revision I S-SAR-G-0000 I
M-CLC-F-00590, Rev. 8, Pg.19 of 42
Table 7 (Cont'd): Initial Pre-Fire Case Steady State Temperatures (°F/°C) with the 3013Configuration
Location 19 WattHanford (Oxide)
ConfigurationDrum Top 103 0F /390CBottom 133 0F /560CSide 108 0F/420CMid-Height 146 0F /63 0CFiberboardSCV O-ring 152 0F /67 0CPCV O-ring 167°F /75°CSCV Side 163 0F /73 0CSCV Bottom 164 0F /73 0CPCV Side 182 0F_/83 0CPCV Bottom 179 0F /82 0C3013 Top 180°F /82 0C3013 Bottom 180°F /82 0C3013 Side 193 0F / 89 0CPu-CanInterfaceCenterline Mid 408°F /2090CHeight Pu
Appendix 3.3 - 21 of 44
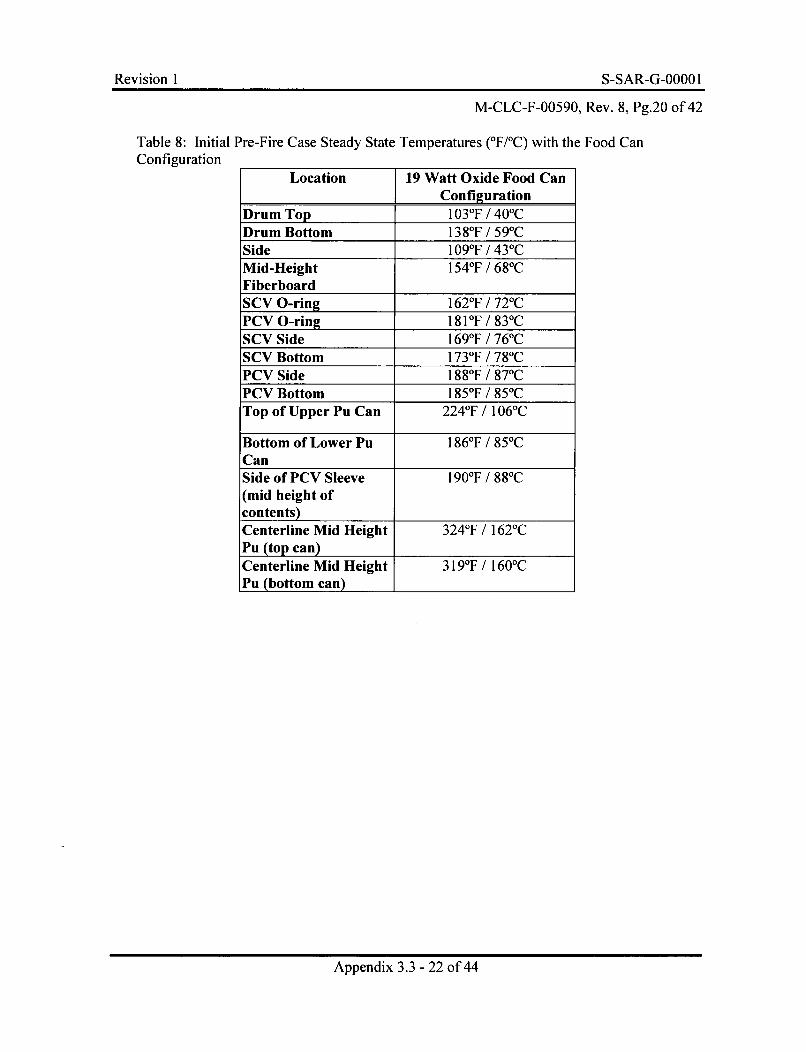
Revision I S-SAR-G-0000 I
M-CLC-F-00590, Rev. 8, Pg.20 of 42
Table 8: Initial Pre-Fire Case Steady State Temperatures (°F/°C) with the Food CanConfiguration
Location 19 Watt Oxide Food CanConfiguration
Drum Top 103 0F / 400CDrum Bottom 138 0F / 590CSide 109 0F / 430CMid-Height 154 0F / 680CFiberboardSCV O-ring 1620F / 720CPCV O-ring 181°F / 83 0CSCV Side 169 0F / 760CSCV Bottom 173 0F / 780CPCV Side 188 0F / 870CPCV Bottom 1850F / 85 0CTop of Upper Pu Can 2240F / 106 0C
Bottom of Lower Pu 186 0F / 85 0CCanSide of PCV Sleeve 190OF / 88 0C(mid height ofcontents)Centerline Mid Height 324°F / 1620CPu (top can)Centerline Mid Height 319°F / 160 0CPu (bottom can)
Appendix 3.3 - 22 of 44
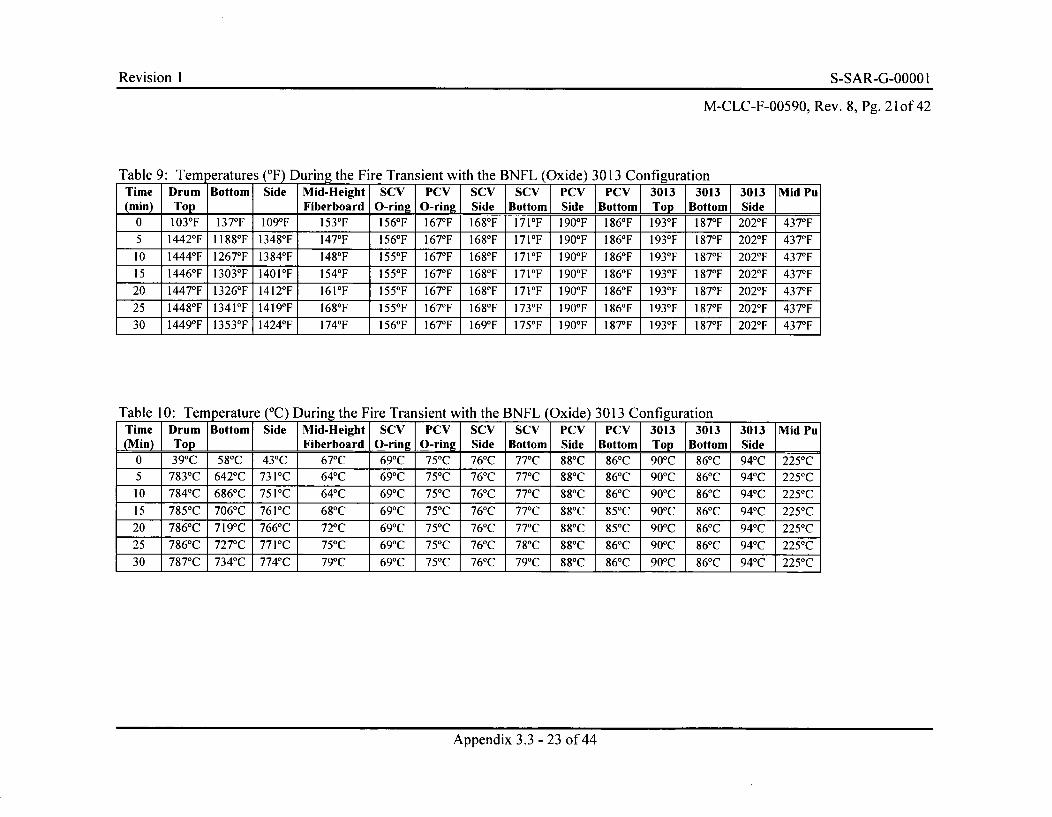
Revision IM-CLC-F-00590,-00 Re.8Ig.2o4
M-CLC-F-00590, Rev. 8, Pg. 21 of 42
Table 9: Temperatures (°F) During the Fire Transient with the BNFL (Oxide) 3013 ConfigurationTime Drum Bottom Side ýMid-Height] ScvIPcv [ scv PCV PCV 13013 3013 3013 MidPu(mn)[ Top [Fiberboard O-ringIO-ring Side Bottom Side Bottom Top Bottom Side
0 1030F 137 0F 109 0F 153 0F 156 0F 167 0F 1680F 171°F 190°F 1860F 1930F 1870F 202°F 4370 F5 1442 0F 11880F 1348 0F 147 0F 156 0F 1670F 168 0F 171°F 190°F 1860F 1930F 187 0F 202°F 4370 F
10 1444 0F 12670F 1384 0F 148 0F 155 0F 1670F 168 0F 171°F 190°F 1860F 1930F 1870F 202°F 4370 F15 1446 0F 1303°F 1401OF 154 0F 155 0F 167 0F 168 0F 171°F 190OF 1860F 1930F 1870F 202°F 4370F
20 1447 0F 13260F 1412°F 161OF 155 0F 167°F 1680F 171°F 190°F 1860F 1930F 187 0F 202°F 437°F25 1448 0F 1341°F 1419°F 168 0F 155°F 167°F 168°F 1730F 190°F 1860F 1930F 1870F 202°F 437°F30 1449 0F 1353 0F 1424 0F 1740F 156 0F 1670F 169°F 1750F 190°F 187°F 193°F 187-F 202°F 4370 F
Table 10: Temperature (°C) During the Fire Transient with the BNFL (Oxide) 3013 ConfigurationTime Drum rBottom Sie Mid-Height] SCV PCV [ScV SCV JPCV PCV ]3013 3013 3013 ]Mid Pu(Min) Top Fiberboard 0-ring 0-ring Side Bottom Side Bottom] Top Bottom Side
0 390C 580C 430C 670C 69 0C 75 0C 76 0C 770C 880C 860C 900C 860C 94 0C 2250C5 783 0C 6420C 731 0C 640C 69 0C 75 0C 76 0C 770C 880C 860C 900C 860C 94 0C 2250C10 784 0C 686 0C 751 0C 640C 69 0C 75 0C 76 0C 770C 880C 860C 900C 860C 94 0C 2250C15 785 0C 7060C 7610C 680C 69 0C 75 0C 76 0C 770C 880C 850C 900C 860C 94 0C 2250C20 7860C 719 0C 7660C 720C 69 0C 75 0C 76 0C 770C 880C 850C 900C 860C 94 0C 2250C25 786 0C 7270C 7710C 750C 69 0C 75 0C 76 0C 780C 88°C 86°C 90°C 860C 94-C 225°C30 787°C 734 0C 7740C 79°C 69 0C 75 0C 76 0C 79 0C 880C 860C 90 0C 860C 94 0C 2250C
Appendix 3.3 - 23 of 44
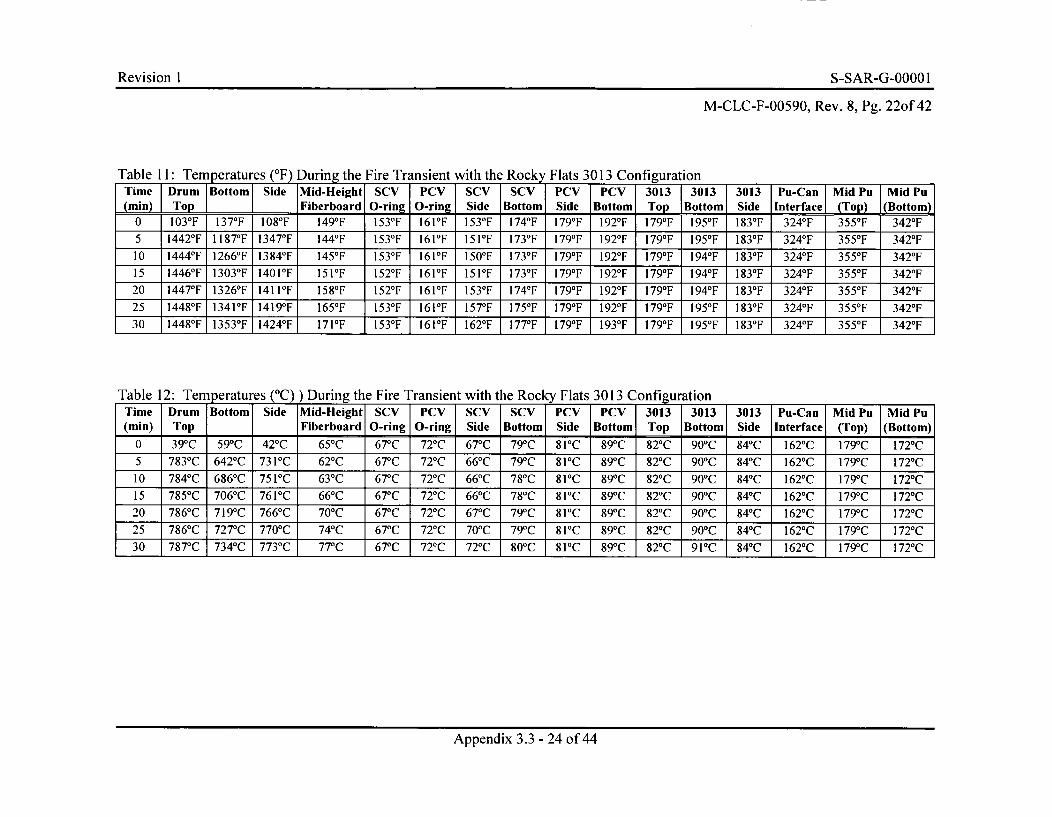
Revision I S-SAR-G-00001I
M-CLC-F-00590, Rev. 8, Pg. 22of 42
Table 11: Tern eratures ('F) During the Fire Transient with the Rocky Flats 3013 Configuration(min) Top Fiberboard O-ring O-ring Side Bottom Side Bottom Top Bottom Side Interface Top (Bottom)
0 103 0F 137 0F 1080F 1490F 1530F 161F 153 0F 1740F 1790F 1920 F 179 0F 1950 F 183 0F 3240 F 355 0F 3420 F5 14420F 11870F 13470 F 1440F 1530F 161°F 151°F 1730F 1790F 1920 F 1790F 1950 F 183 0F 3240 F 355 0F 3420 F10 14440F 12660 F 13840 F 1450F 1530F 161°F 150°F 1730 F 179 0F 1920 F 179 0F 1940 F 183 0F 3240 F 355 0F 3420 F15 14460F 1303°F 1401°F 151°F 1520F 161OF 1510 F 1730F 1790F 1920 F 1790F 1940F 183 0F 3240 F 355 0F 3420 F20 14470F 13260 F 1411°F 158 0F 152°F 161°F 153 0F 1740F 1790F 1920 F 179 0F 1940 F 183 0F 3240 F 3550 F 3420 F25 14480F 1341°F 1419°F 1650F 1530F 161°F 157 0F 1750 F 1790F 192 0F 179 0F 195 0F 183 0 F 3240F 3550 F 3420 F30 14480F 1353 0F 1424 0F 171°F 1530F 161°F 162 0F 1770F 1790F 1930 F 179-F 195 0F 183 0 F 3240 F 3550 F 3420 F
Table 12: Tem peratures (°C)) During the Fire Transient with the Rocky Flats 3013 ConfigurationTime Drum Bottom Side Mid-Height SCV PCV SCV SCV PCV PCV 3013 3013 3013 Pu-Can Mid Pu Mid Pu(min) Top Fiberboard O-ring O-ring Side Bottom Side Bottom Top Bottom Side Interface (Top) (Bottom)
0 39°C 590C 420C 650C 67 0C 720C 670C 79 0C 810C 89 0C 82°C 900C 84-C 162°C 179-C 172 0C5 7830C 6420C 731 0C 620C 67 0C 720C 660C 79 0C 810C 89 0C 820C 900C 840C 1620C 1790C 172 0C10 7840C 686 0C 751 0C 630C 67 0C 720C 660C 78 0C 810C 89 0C 820C 900C 840C 1620C 1790C 172 0C15 7850C 706 0C 761°C 66°C 67 0C 720C 660C 78 0C 810C 89 0C 820C 900C 840C 1620C 1790C 1720C20 786°C 719°C 766°C 70°C 67°C 72°C 67°C 79°C 81°C 89°C 82°C 90°C 84°C 162°C 1790 C 172°C
25 7860C 7270C 7700C 74 0C 67 0C 720C 700C 79 0C 810C 89 0C 820C 900C 840C 1620C 1790C 1720C30 7870C 734 0C 7730C 77 0C 67 0C 720C 720C 800C 810C 89 0C 820C 910C 840C 1620C 1790C 1720C
Appendix 3.3 - 24 of 44
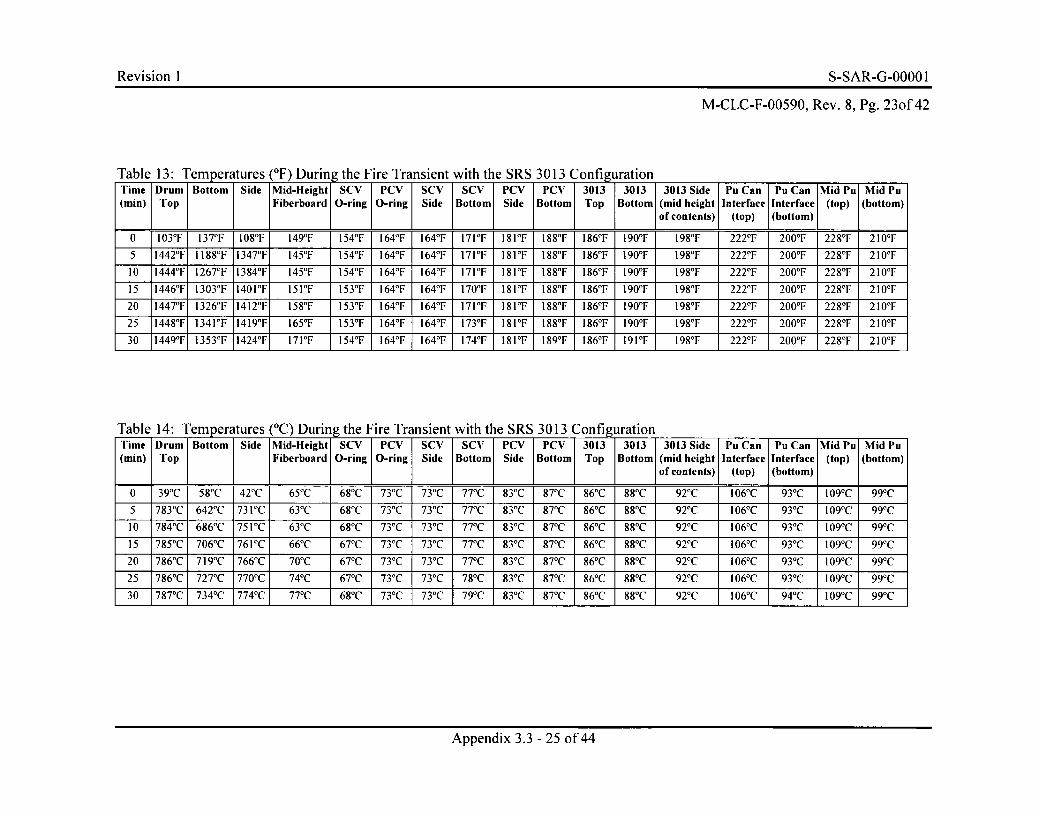
Revision I S-SAR-G-0000 I
M-CLC-F-00590, Rev. 8, Pg. 23of 42
Table 13: Temperatures ('F) During the Fire Transient with the SRS 3013 ConfigurationTime Drum Bottom Side Mid-Height SCV PCV SCV SCV PCV PCV 3013 3013 3013 Side Pu Can Pu Can Mid Pu Mid Pu(min) Top Fiberboard O-ring O-ring Side Bottom Side Bottom Top Bottom (mid height Interface Interface (top) (bottom)
of contents) (top) (bottom)
0 103'F 137'F 108'F 149'F 154°F 164°F 164'F 171 iF 18 VF 188°F 186'F 190'F 198'F 222°F 200'F 228°F 210°F
5 1442°F 1188°F 1347°F 145'F 154°F 164°F 164°F 17i°F 1810 F 188°F 186'F 190'F 198°F 222°F 200'F 228°F 210'F
10 1444°F 1267°F 1384°F 145'F 154'F 164°F 164'F 171]F 181VF 188'F 186°F 190'F 198°F 222°F 200'F 228°F 210'F
15 1446°F 1303'F 1401'F 151'F 153°F 164'F 164°F 170'F 181'F 188°F 186'F 190'F 198°F 222'F 200'F 228°F 210'F
20 1447°F 1326°F 1412'F 158°F 153°F 164°F 164°F 171]F 181'F 188'F 186°F 190'F 198°F 222°F 200'F 228°F 210'F
25 1448°F 1341'F 1419'F 165°F 153°F 164°F 164°F 173°F 181'F 188°F 186°F 190'F 198°F 222°F 200'F 228°F 210'F
30 1449°F 1353°F 1424°F 171°F 154F I164'F 164'F 174'F 181'F 189°F 186°F 191'F 198°F 222°F 200'F 228°F 210'F
Table 14: Ternperatures (°C) During the Fire Transient with the SRS 3013 ConfigurationTime Drum Bottom Side Mid-Height SCV PCV SCV SCV PCV PCV 3013 3013 3013 Side Pu Can Pu Can Mid Pu Mid Pu(min) Top Fiberboard O-ring O-ring Side Bottom Side Bottom Top Bottom (mid height Interface Interface (top) (bottom)
of contents) (top) (bottom)
0 39°C 58'C 42°C 65°C 68°C 73°C 73°C 77°C 83°C 87°C 86°C 88°C 92°C 106'C 93'C 109'C 99°C
5 783°C 642°C 73i°C 63°C 68°C 73°C 73°C 77°C 83°C 87°C 86°C 88WC 92°C 106'C 93°C 109'C 99°C
10 784°C 686'C 751°C 63'C 68°C 73°C 73°C 77°C 83°C 87°C 86°C 88°C 92°C 106'C 93°C 109'C 99°C
15 785°C 706'C 761°C 66°C 67°C 73°C 73°C 77°C 83°C 87°C 86°C 88WC 92°C 106'C 93'C 109'C 99°C
20 786°C 719'C 766°C 70'C 67°C 73°C 73°C 77°C 83°C 87°C 86°C 88°C 92°C 106'C 93°C 109'C 99°C
25 786°C 727°C 770°C 74°C 67°C 73°C 73°C 78°C 83'C 87°C 86°C 88°C 92'C 106'C 93°C 109'C 99°C
30 787°C 734°C 774°C 77°C 68°C 73°C 73°C 790 C 83°C 87°C 86°C 88°C 92°C 106'C 94°C 109'C 99°C
Appendix 3.3 - 25 of 44
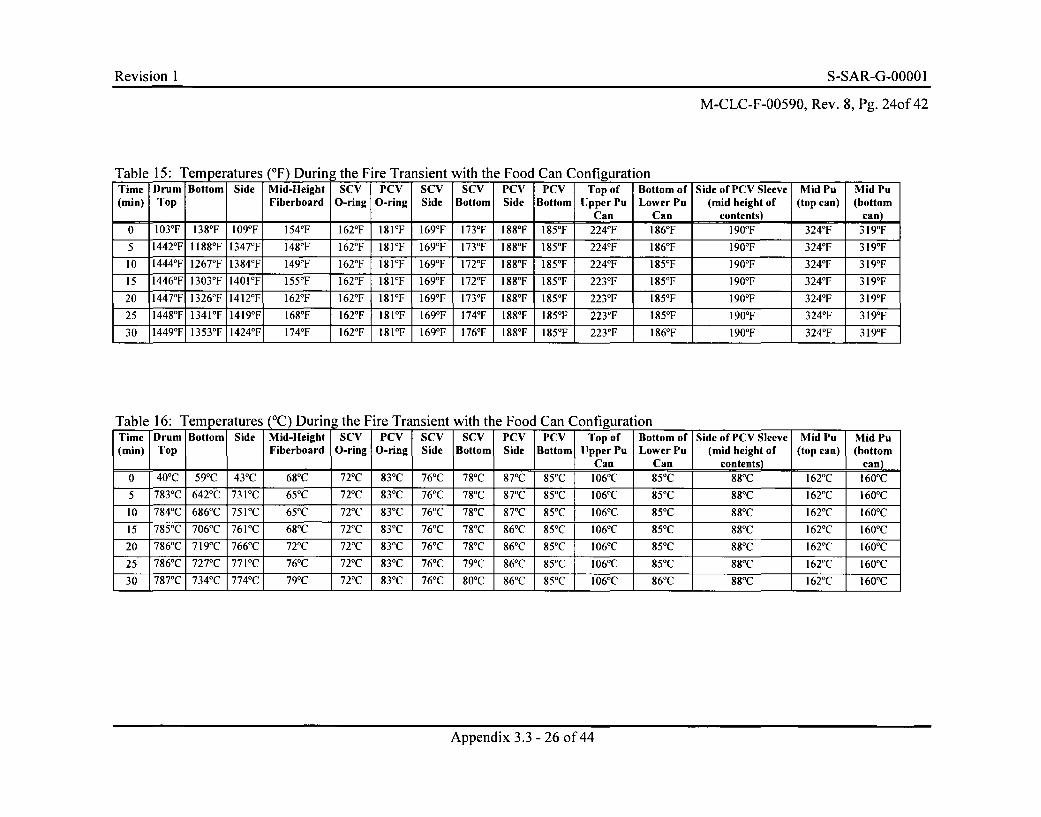
Revision I S-SAR-G-0000 1
M-CLC-F-00590, Rev. 8, Pg. 24of 42
Table 15: Temperatures (°F) During the Fire Transient with the Food Can ConfigurationTime Drum Bottom Side Mid-Height SCV PCV SCV SCv PCV PCV Top of Bottom of Side of PCV Sleeve Mid Pu Mid Pu(min) Top Fiberboard O-ring O-ring Side Bottom Side Bottom Upper Pu Lower Pu (mid height of (top can) (bottom
Can Can contents) can)0 103'F 138°F 109'F 154°F 162°F 1810 F 169°F 173'F 188°F 185°F 224°F 186°F 190'F 324°F 319°F
5 1442°F 1188°F 1347°F 148°F 162°F 181°F 169°F 173°F 188°F 185°F 224°F 186°F 190'F 324°F 319°F
10 1444°F 1267°F 1384°F 149°F 162°F 181°F 169°F 172°F 188-F 185°F 224°F 185°F 190'F 324°F 319°F
15 1446*F 1303'F 1401°F 155°F 162°F 181VF 169°F 172°F 188°F 185°F 223°F 185°F 190'F 324°F 319'F
20 1447°F 1326°F 1412'F 162°F 162°F 181°F 169°F 173°F 188°F 185°F 223°F 185°F 190'F 324°F 319'F
25 1448°F 1341'F 1419'F 168°F 162°F 181°F 169°F 174°F 188'F 185°F 223°F 185°F 190'F 324°F 319'F
30 1449°F 1353°F 1424°F 174°F 162°F 181°F 169'F 176°F 188°F 185°F 2230F 186°F 190'F 324°F 319'F
Table 16: Tern eratures (°C) During the Fire Transient with the Food Can ConfigurationTime Drum Bottom Side Mid-Height SCV PCV SCV SCV PCV PCV Top of Bottom of Side of PCV Sleeve Mid Pu Mid Pu(min) Top Fiberboard O-ring O-ring Side Bottom Side Bottom UpperPu LowerPu (mid height of (top can) (bottom
I I Can Can contents) can)0 40*C 59'C 43°C 68'C 72°C 83°C 76°C 78°C 87'C 85°C 106'C 85°C 88°C 162°C 160'C
5 783°C 642'C 731*C 65°C 72'C 830C 76'C 78°C 87'C 85°C 106'C 85°C 88'C 162°C 160°C
10 784°C 686'C 751°C 65°C 72°C 83°C 76'C 78°C 87°C 85°C 106'C 85°C 88°C 162°C 160'C
15 785°C 706°C 761-C 68°C 72'C 83°C 76°C 78°C 86°C 85'C 106°C 85'C 88°C 162°C 160RC
20 786°C 719'C 766°C 72°C 72°C 83°C 76°C 78°C 86'C 85'C 106'C 85°C 88'C 162IC 160'C
25 7860C 727°C 7710C 76'C 72°C 83°C 76'C 79°C 86°C 85'C 106'C 85°C 88°C 162°C 160'C
30 787H C 734°C 774°C 79°C 72°C 83°C 76°C 80'C 86WC 85°C 106'C 86°C 88°C 162°C 160'C
Appendix 3.3 - 26 of 44
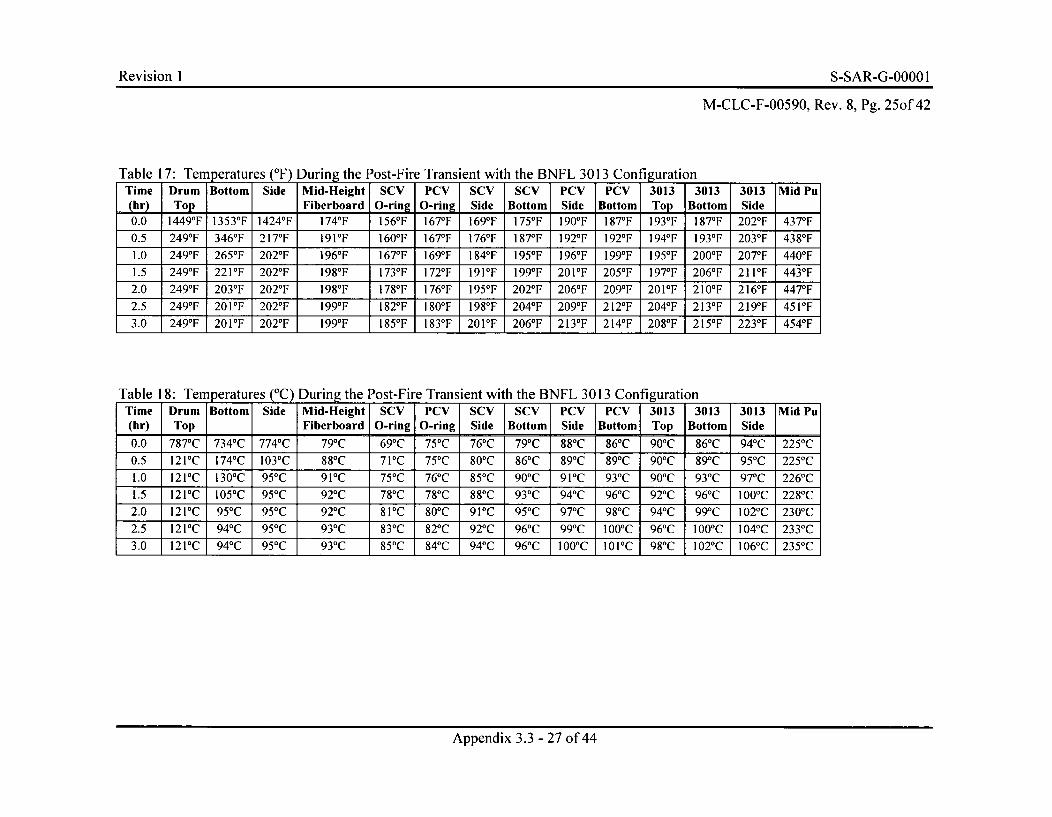
Revision I M-CLC-F-00590,-00 Re.8Ig.2o4
M-CLC-F-00590, Rev. 8, Pg. 25of 42
Table 17: Tem peratures (°F) During the Post-Fire Transient with the BNFL 3013 ConfigurationTime Drum Bottomi Side Mid-Height 1SCV PCV ISCV 1SCV JPSCV PCV 13013 [3013 T3013 1Mid Pu(hr) Top I I Fiberboard O-ring I O-ring Side Bottom Side Bottom Top Bottom Side0.0 14490F 1353°F 14240F 1740F 156 0F 167°F 169 0F 1750F 190°F 187 0F 193 0F 1870 F 202°F 4370F0.5 2490F 3460F 217°F 191OF 160°F 1670F 1760F 1870F 1920F 1920F 194 0F 1930 F 203°F 4380F1.0 2490F 2650F 202°F 1960F 167 0F 169 0F 1 840F 1950F 1960F 1990F 195°F 200°F 207°F 440°F
1.5 2490F 221°F 202°F 1980F 173 0F 1720F 191OF 1990F 201°F 205°F 1970 F 206°F 21 1°F 443°F2.0 2490F 203°F 202°F 1980F 178 0F 1760F 1950F 202°F 206°F 209°F 201OF 210°F 216°F 4470F
2.5 2490F 201F 202°F 1990F 182 0 F 180OF 1980F 204°F 209°F 212°F 204OF 213°F 219°F 451OF3.0 2490F 201OF 202°F 1990F 185 0F 1830F 201OF 206°F 213°F 214°F 208°F 215°F 2230 F 4540F
Table 18: Tem peratures (°C) During the Post-Fire Transient with the BNFL 3013 ConfigurationTime Drum Bottom Side Mid-Height SCV PCV SCV SCV PCV PCV 3013 3013 3013 Mid Pu(hr) Top Fiberboard O-ring O-ring Side Bottom Side Bottom Top Bottom Side
0.0 787°C 7340C 774°C 79°C 69 0C 750C 76°C 79°C 88°C 86°C 90-C 86°C 94°C 225°C0.5 121 0C 174 0C 103 0C 880C 71 0C 750C 800C 860C 890C 890C 900C 89 0C 950C 2250C1.0 121 0C 130 0C 95 0C 910C 75 0C 76°C 850C 90 0C 91 0C 930C 900C 93 0C 970 C 2260C1.5 121 0C 1050C 95 0C 920C 78 0C 780C 880C 930C 94 0C 960C 920C 960C I00°C 2280C2.0 121 0C 950C 95 0C 920C 810C 800C 910C 950C 97 0C 980C 940C 990C 1020C 230 0C2.5 1210C 940C 95 0C 930C 830C 820C 920C 960C 99 0C I0°0 C 960C I0°0 C 1040C 233 0C3.0 121 0C 940C 95 0C 930C 850C 84°C 940C 96°C 100°C 10 1-C 980C 1020C 1060C 235 0C
Appendix 3.3 - 27 of 44
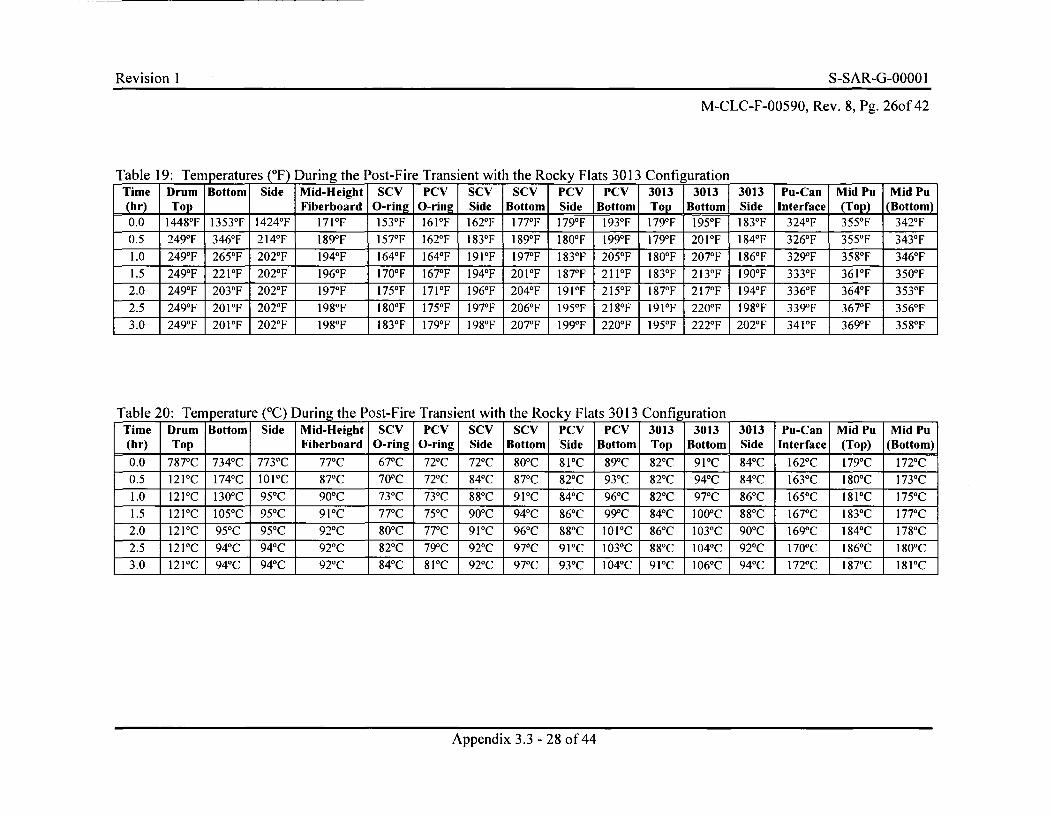
Revision IM-CLC-F-00590,-00 Re.8Ig.2o4
M-CLC-F-00590, Rev. 8, Pg. 26of 42
Table 19: Ter peratures (°F) During the Post-Fire Transient with the Rocky Flats 3013 ConfigurationTime JDrum Bottom Side Mid-Height [SCV ]PCV [SCV SCV PCV PCV 3013 13013 J3013 [Pu-Can Mid Pu 1Mid Pu(hr) Top Fiberboard O-ring O-ring Side Bottom Side Bottom Top Bottom Side Interface (Top) (Bottom)0.0 1448-F 1353°F 1424-F 171°F 153-F 161°F 162-F 177-F 179°F 193-F 179°F 195°F 183-F 324-F 355-F 342°F0.5 2490 F 3460F 214OF 189 0 F 157 0F 1620F 183 0F 1890 F 180°F 1990F 1790 F 201°F 1840F 3260F 355°F 3430 F1.0 2490F 2650 F 202OF 194 0F 1640F 1640F 191°F 197 0F 1830F 205°F 180°F 207°F 186 0F 3290F 3580F 3460 F1.5 2490F 221°F 202°F 196 0F 170°F 167°F 1940F 201°F 1870F 211°F 183 0F 213°F 190°F 3330F 361°F 350°F2.0 2490F 203°F 2020F 197 0F 175 0F 171°F 1960F 204°F 191°F 215°F 187 0F 217°F 194 0F 3360F 364°F 3530F
2.5 2490F 201°F 202°F 198 0F 180°F 1750F 1970F 206°F 1950F 218°F 191°F 220°F 198 0F 3390F 367°F 3560F3.0 249°F 201°F 202°F 198 0F 1830F 1790F 1980F 207°F 1990F 220°F 195°F 222°F 202°F 341°F 369OF 358°F
Table 20: Tem perature ('C) During the Post-Fire Transient with the Rocky Flats 3013 ConfigurationTime 1 Drum Bottom Side ] Mid-Height [ SCV PCV SCV SCV PCV PCV 3013 3013 3013 Pu-Can Mid Pu Mid Pu(hr)I Top Fiberboard O-ring O-ring Side Bottom Side Bottom Top Bottom Side Interface (Top) (Bottom)
0.0 787 0C 7340C 7730C 77 0C 67 0C 72 0C 72 0C 80 0C 81 0C 890C 820C 91 0C 840C 1620C 1790C 1720C
0.5 121 0C 174 0C 1010C 870C 70 0C 72 0C 840C 87 0C 82 0C 93 0C 820C 94 0C 840C 1630C 180 0C 1730C
1.0 121 0C 130 0C 95 0C 90 0C 73 0C 73 0C 880C 910C 84 0C 96 0C 820C 97 0C 860C 1650C 1810C 1750C
1.5 12 1°C 105 0C 95 0C 910C 77 0C 75 0C 90 0C 940C 86 0C 990C 840C 100°C 880C 1670C 183 0C 1770C
2.0 121 0C 950C 95 0C 920C 800C 77 0C 910C 960C 880C 1010C 860C 103 0C 90 0C 1690C 184 0C 178 0C
2.5 121 0C 940C 94°C 920C 820C 79°C 920C 970C 91°C 103HC 88°C 104°C 92°C 170°C 186°C 180°C3.0 121 0C 940C 94°C 920C 840C 810C 92 0C 970C 93°C 104°C 91°C 106°C 94°C 172°C 187°C 1810C
Appendix 3.3 - 28 of 44
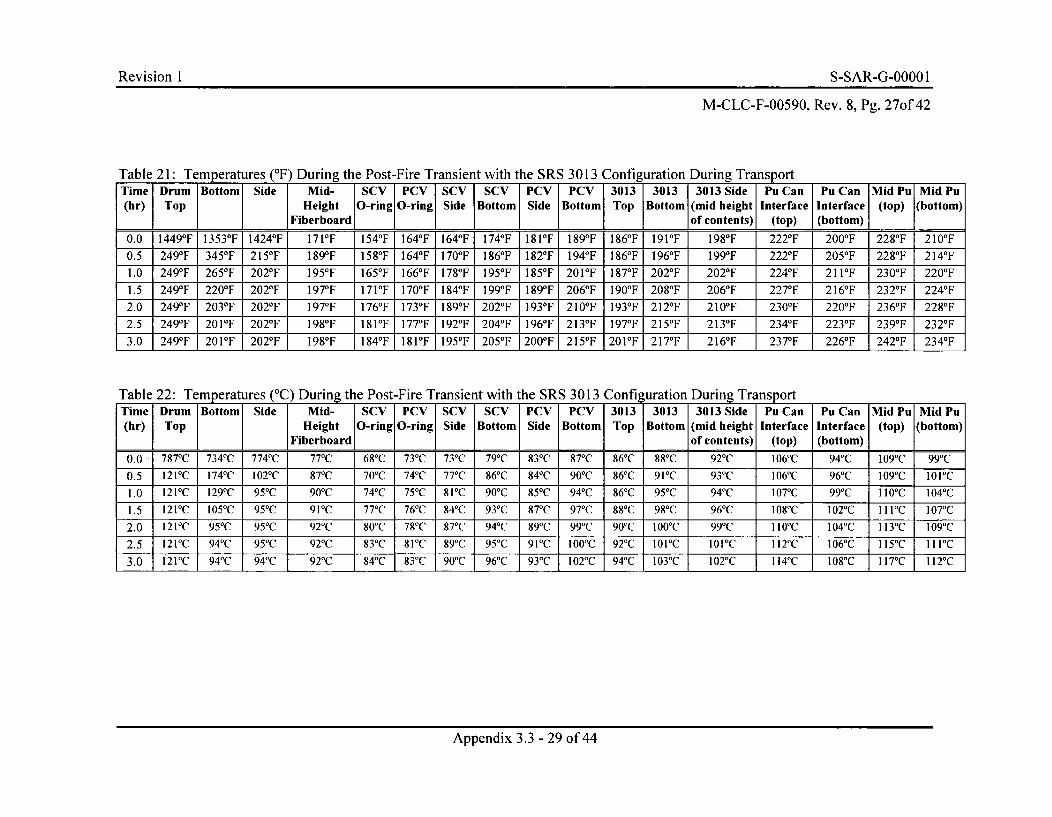
Revision I M-CLC-F-00590-000 Re.8Ig.2o4
M-CLC-F-00590,. Rev. 8, Pg. 27of 42
Table 21: Tem peratures (°F) During the Post-Fire Transient with the SRS 3013 Configuration During TransportTime Drum Bottom Side Mid- SCV PCV SCV SCV PCV PCV 3013 3013 3013 Side Pu Can Pu Can Mid Pu Mid Pu(hr) Top Height O-ring O-ring Side Bottom Side Bottom Top Bottom (mid height Interface Interface (top) (bottom)
Fiberboard of contents) (top) (bottom)
0.0 14490 F 13530F 14240F 171°F 154 0F 164 0F 164 0F 1740F 1810 F 1890 F 186 0F 191OF 1980F 2220F 200°F 2280 F 210°F
0.5 2490F 3450F 215OF 189OF 158 0F 1640F 170OF 1860F 182 0F 194 0F 186 0F 1960F 1990F 2220F 205°F 2280 F 214°F1.0 2490F 2650F 202°F 1950F 1650F 1660F 1780F 1950F 185 0F 201°F 187 0F 202°F 202OF 2240F 2110 F 230°F 220°F1.5 2490F 220OF 202OF 197 0F 171OF 170OF 184 0F 1990F 189 0F 206°F 190°F 208°F 206OF 2270F 216OF 2320 F 2240F2.0 2490F 203OF 202°F 1970F 1760F 1730F 189 0F 202°F 1930F 210OF 193 0F 212OF 210°F 230°F 220OF 2360 F 2280F2.5 2490F 201OF 202°F 1980F 181°F 177 0F 1920F 204°F 196 0F 213OF 1970F 215°F 213OF 2340F 2230F 2390 F 2320F3.0 2490F 201°F 202°F 1980F 1840F 181°F 1950F 205OF 200°F 215°F 201OF 217°F 216OF 237 0F 2260F 2420 F 2340F
Table 22: Tern eratures (°C) During the Post-Fire Transient with the SRS 3013 Configuration During TransportTime Drum Bottom Side Mid- SCV PCV SCV SCV PCV PCV 3013 3013 3013 Side Pu Can Pu Can Mid Pu Mid Pu(hr) Top Height O-ring O-ring Side Bottom Side Bottom Top Bottom (mid height Interface Interface (top) (bottom)
Fiberboard of contents) (top) (bottom)
0.0 7870C 734°C 774°C 77°C 68°C 730C 73'C 79°C 83°C 87°C 86°C 88WC 92°C 106'C 94'C 109°C 99°C
0.5 12 VC 174'C 102'C 87'C 70*C 74WC 77'C 86'C 84WC 90'C 86'C 91°C 93'C 106'C 96WC 1090C 1011C1.0 121-C 129-C 950C 900C 74'C 75'C 81 C 90'C 85'C 94°C 86'C 95-C 94'C 1070C 991C I 10'C 104'C
1.5 121VC 105'C 950C 910C 770C 76'C 84WC 930C 870C 97'C 880C 980 C 96'C 108'C 102'C I I I°C 1070 C
2.0 l212C 950C 95'C 920C 80'C 78'C 87'C 94'C 890C 99'C 90'C I00°C 99'C I I 0C 104'C 113C 109'C2.5 121VC 94'C 95'C 92°C 83'C 81VC 89'C 95'C 91VC IOO0C 92'C IO01C 1010C 112'C 106'C 115'C I I IC3.0 12 VC 94'C 94'C 92*C 84WC 83'C 90'C 96'C 93'C 102'C 94'C 1030C 1020C 114°C i080C 117 0C 112 0C
Appendix 3.3 - 29 of 44
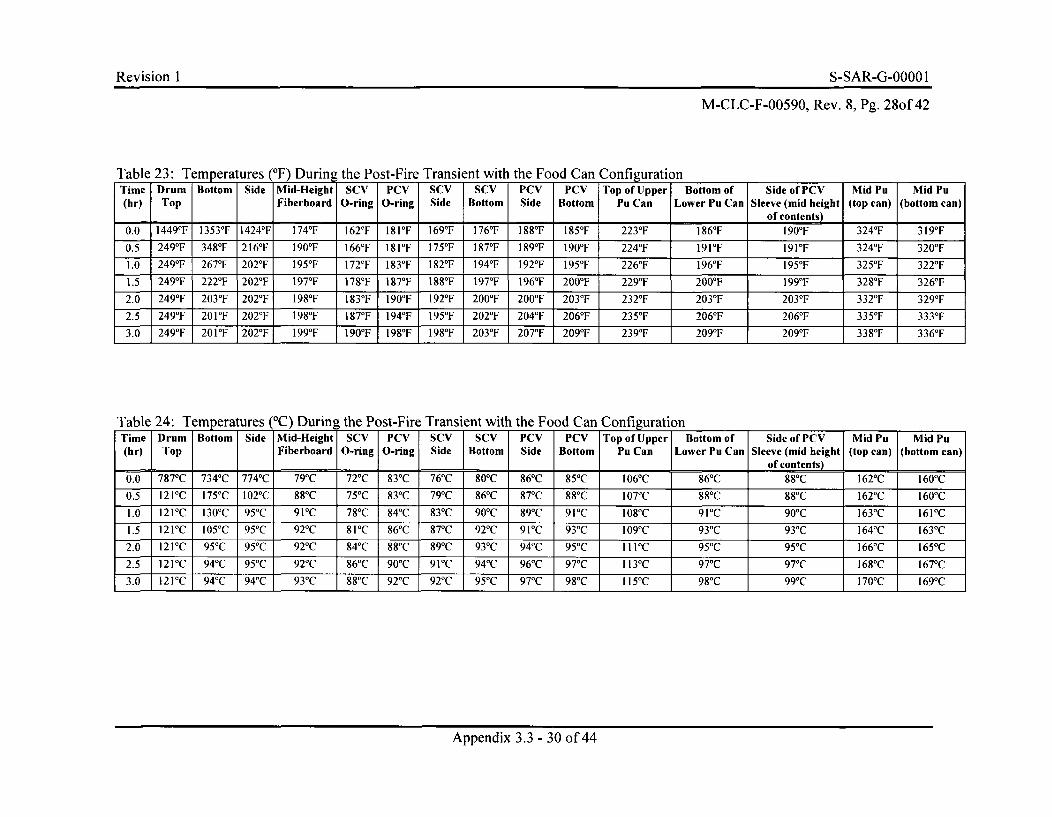
Revision I S-SAR-G-00001
M-CLC-F-00590, Rev. 8, Pg. 28of 42
Table 23: Temperatures (°F) During the Post-Fire Transient with the Food Can ConfigurationTime Drum Bottom Side Mid-Height SCV PCV SCV SCV PCV PCV Top of Upper Bottom of Side of PCV Mid Pu Mid Pu(hr) Top Fiberboard O-ring O-ring Side Bottom Side Bottom Pu Can Lower Pu Can Sleeve (mid height (top can) (bottom can)
of contents)
0.0 1449°F 1353°F 1424'F 174°F 162'F 181°F 169°F 176°F 188°F 185°F 223°F 186°F 190'F 324°F 319'F
0.5 249'F 348'F 216'F 190'F 166°F 181 °F 175°F 187°F 189°F 190'F 224°F 191 F 191 0 F 324°F 320'F
1.0 249°F 267°F 202'F 195°F 172°F 183°F 182°F 194°F 192°F 195°F 226°F 196°F 195°F 325'F 322°F
1.5 249'F 222'F 202'F 197'F 178°F 1871F 188°F 197'F 196°F 200'F 229°F 200'F 199°F 328°F 326F
2.0 249°F 203'F 202'F 198'F 183°F 190'F 192 F 200'F 200'F 203'F 232°F 203'F 203'F 332'F 329°F
2.5 249°F 201'F 202'F 198°F 187°F 194'F 195°F 202'F 204'F 206°F 235°F 206'F 206'F 3350 F 333°F
3.0 249°F 201'F 202'F 199'F 190'F 198°F 198°F 203'F 207'F 209'F 239°F 209'F 209'F 338°F 336°F
Table 24: Temperatures (°C) During the Post-Fire Transient with the Food Can ConfigurationTime Drum Bottom Side Mid-Height SCV PCV SCV SCV PCV PCV Top of Upper Bottom of Side of PCV Mid Pu Mid Pu(hr) Top Fiberboard O-ring O-ring Side Bottom Side Bottom Pu Can Lower Pu Can Sleeve (mid height (top can) (bottom can)
_ I _ I II Ic L~ v PC I of contents)0.0 787°C 734°C 774'C 79'C 72°C 83°C 76°C 80'C 86°C 85°C 106'C 86°C 88°C 162'C 160'C
0.5 121'C 175°C 102'C 88°C 75°C 83°C 79°C 86°C 87'C 88°C 107'C 88°C 88'C 162'C 160'C
1.0 121'C 130'C 95°C 91°C 78'C 84°C 83°C 90°C 89*C 91°C 108'C 91°C 901C 163'C 161'C
1.5 121IC 105'C 95-C 92°C 81'C 86°C 87°C 92°C 911C 93'C 1091C 93°C 93°C 164'C 163'C
2.0 121'C 95°C 95 C 92°C 84°C 88'C 89'C 93°C 94°C 95°C 1111C 95°C 95'C 166'C 165°C
2.5 121°C 94°C 95°C 92'C 86°C 90'C 91'C 94°C 96'C 97°C 113'C 97°C 970 C 168°C 167°C
3.0 121'C 94°C 94'C 93°C 88°C 92°C 92°C 95'C 97°C 98°C 115'C 98°C 991C 170'C 169°C
Appendix 3.3 - 30 of 44
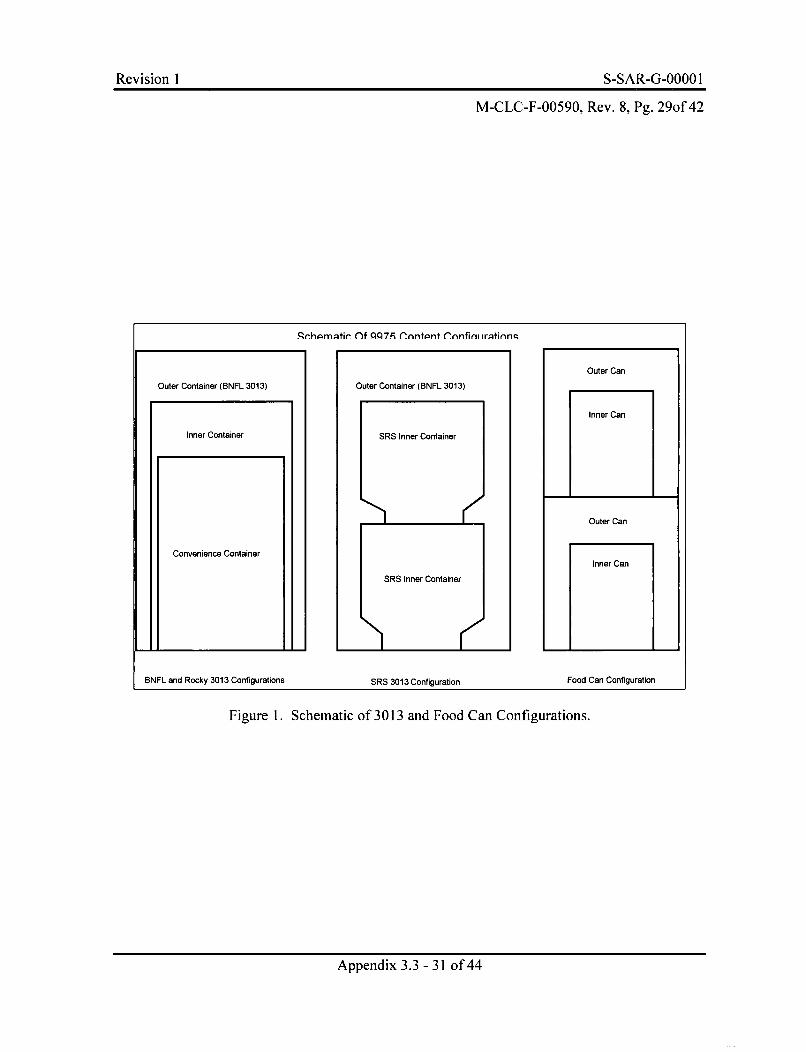
Revision I S-SAR-G-.000 I
M-CLC-F-00590, Rev. 8, Pg. 29of 42
Rrhpmntir flf QQ79f rnntpnt r.nnfiniirmtinn.,
Outer Container (BNFL 3013)
Inner Container
Convenience Container
BNFL and Rocky 3013 Configurations SRS 3013 Configuration Food Can Configuration
Figure 1. Schematic of 3013 and Food Can Configurations.
Appendix 3.3 - 31 of 44
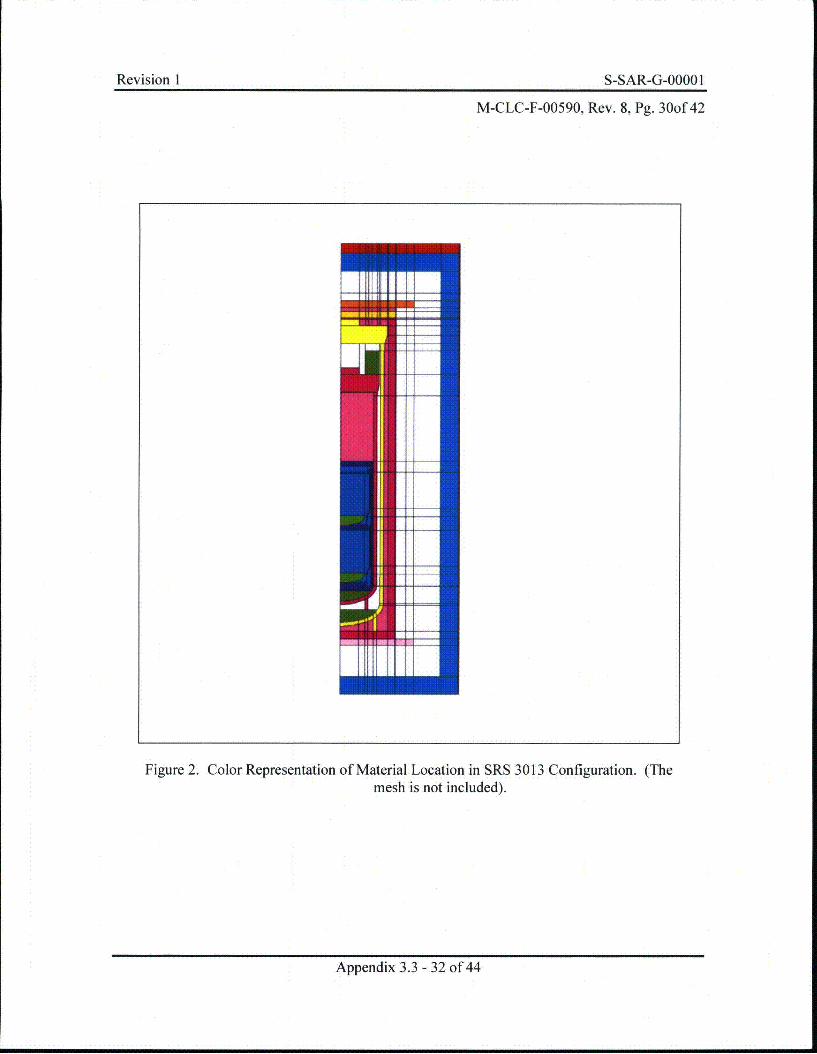
Revision I S-SAR-G-0000 I
M-CLC-F-00590, Rev. 8, Pg. 30of 42
Figure 2. Color Representation of Material Location in SRS 3013 Configuration. (Themesh is not included).
Appendix 3.3 - 32 of 44
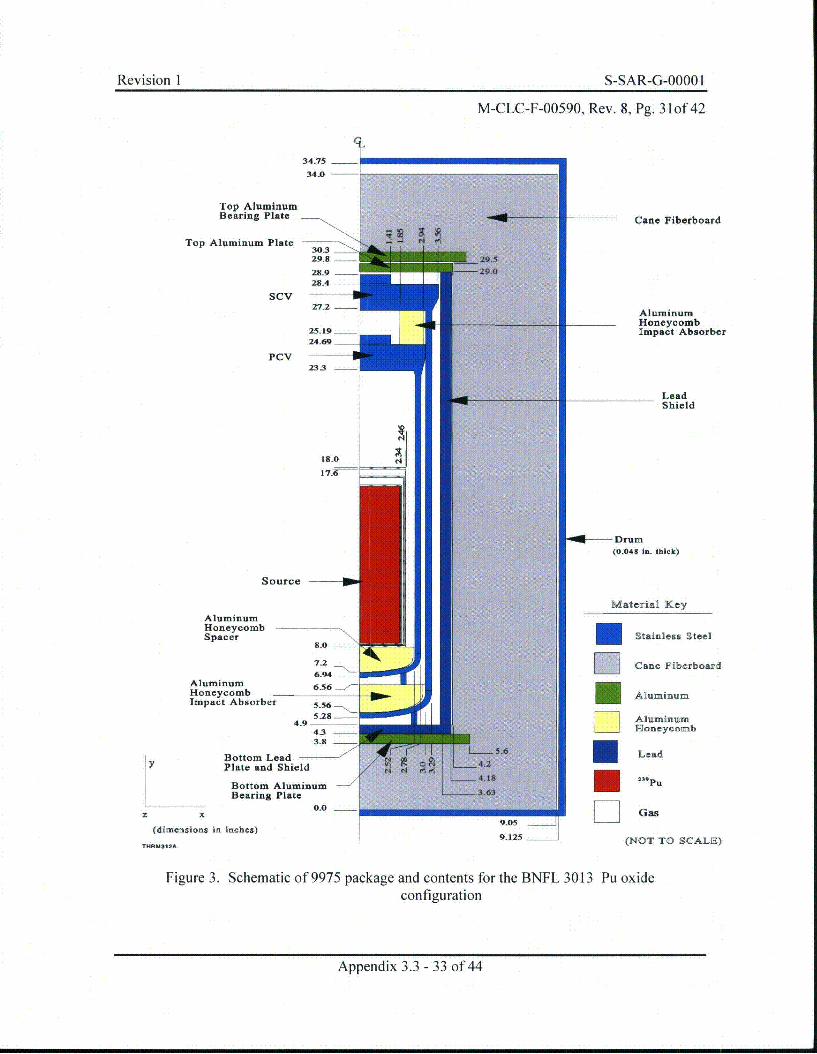
Revision I S-SAR-G-.O31oI
M-CLC-F-00590, Rev. 8, Pg. 3 1of 42
34.75
34.0
Top AluminumBearing Plate
Top Aluminum Plate
_ _ Cane Fiberboard
AluminumHoneycombImpact Absorber
LeadShield
0-tDrum
(0.048 in. thick)
AluminumHoneycombSpacer
AluminumHoneycombImpact Absorber
Material Key
EStainless Steel
DCane Fiberboard
EAluminumLAluminum
Honeycomb
ELead
239pu
ly
z X
Bottom LeadPlate and Shield
Bottom AluminumBearing Plate
0.0
(dimensions in inches) 9125
(NOT TO SCALE)TNRM~t2A
Figure 3. Schematic of 9975 package and contents for the BNFL 3013 Pu oxideconfiguration
Appendix 3.3 - 33 of 44
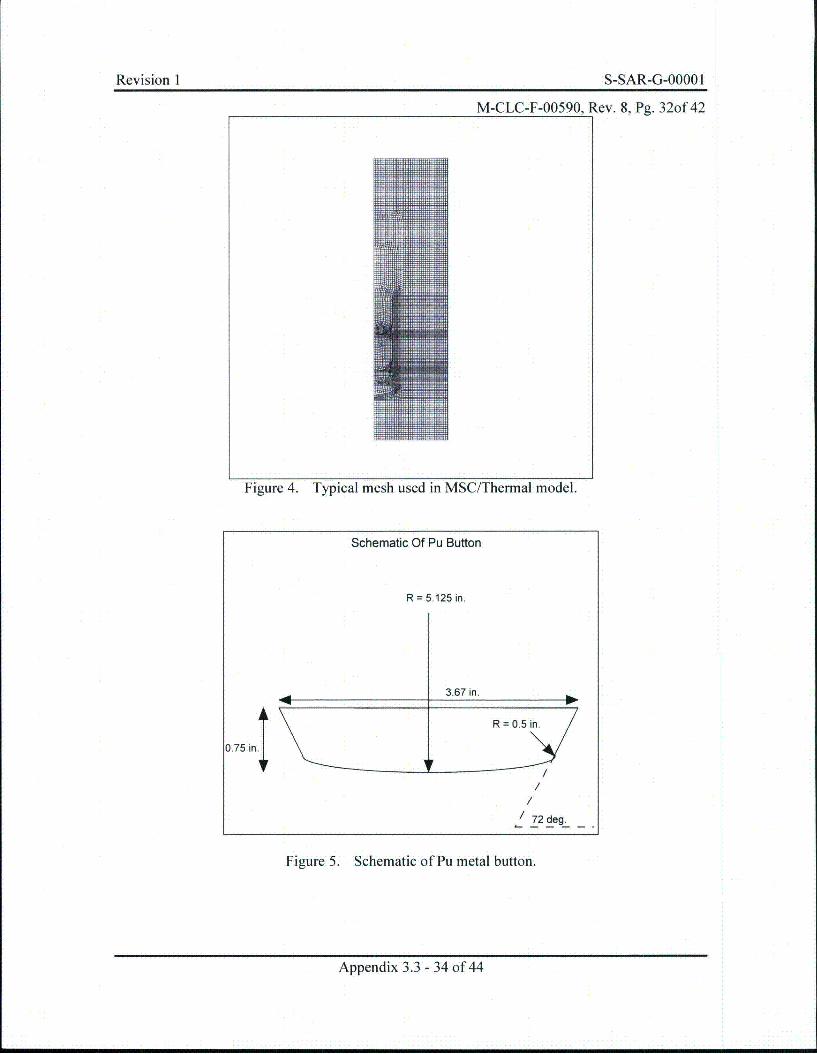
Revision I S-SAR-G-0000 I
M-CLC-F-00590, Rev. 8, Pg. 32of 42
Figure 4. Typical mesh used in MSC/Thermal model.
Schematic Of Pu Button
R = 5.125 in.
3.67 in.
0.75 in.I
/ 72 deg.
Figure 5. Schematic of Pu metal button.
Appendix 3.3 - 34 of 44
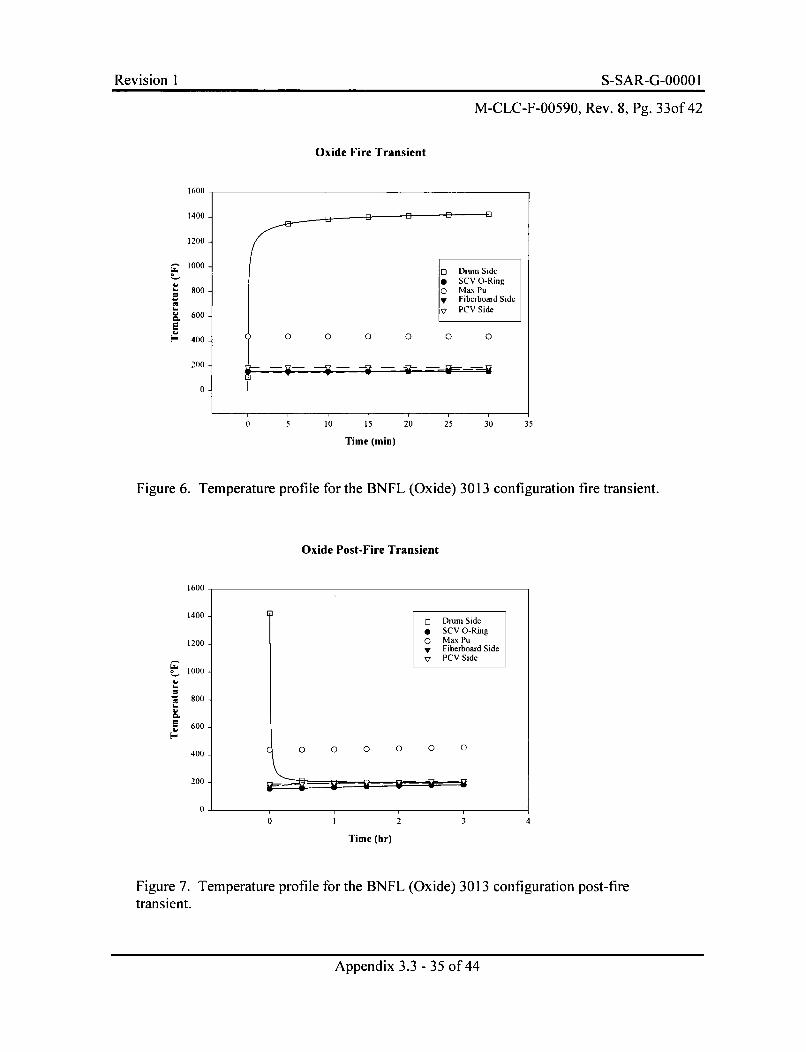
Revision I S-SAR-G-0000 I
M-CLC-F-00590, Rev. 8, Pg. 33of 42
Oxide Fire Transient
1600
1400
1200
1000
800
• 600
[ 400
200
0.
E Drum Side0 SCV O-Ring0 Max Puy Fiberboard SideV PCV Side
0 0 0 0 0 0
0 5 10 15 20 25 30 35
Time (min)
Figure 6. Temperature profile for the BNFL (Oxide) 3013 configuration fire transient.
Oxide Post-Fire Transient
1600
1400
1200
1000
" 800
600
400
200
0
Drum Side* SCV O-Ring0 Max Puy Fiberboard SideV PCV Side
0 0 0 0 0 0
0 2 3 4
Time (hr)
Figure 7. Temperature profile for the BNFL (Oxide) 3013 configuration post-firetransient.
Appendix 3.3 - 35 of 44
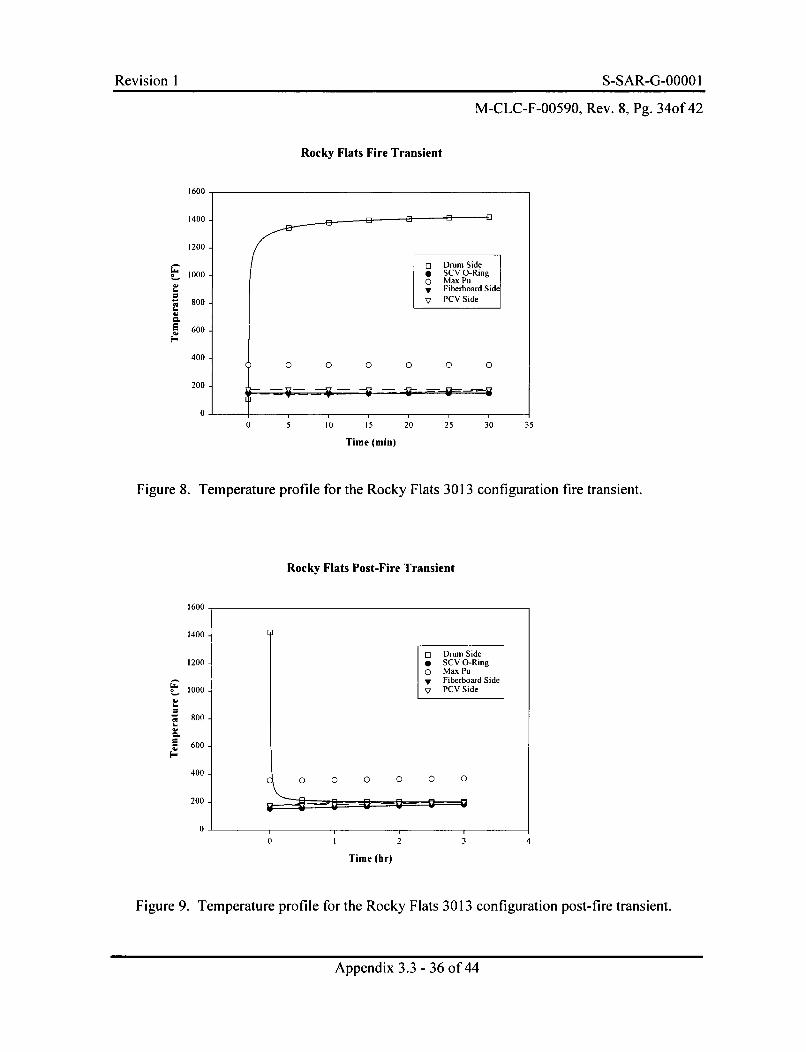
Revision 1 S-SAR-G-.OOO 1
M-CLC-F-00590, Rev. 8, Pg. 34of 42
Rocky Flats Fire Transient
44
4'
0 5 10 15 20 25 30 35
Time (min)
Figure 8. Temperature profile for the Rocky Flats 3013 configuration fire transient.
Rocky Flats Post-Fire Transient
1600
1400
1200
t 000
800
600
400
200
0
Drum Side* SCV O-Ringo Max Puy Fiberboard SideV PCV Side
0 0 0 0 0 0
v 0
0 2 3 4
Time (hr)
Figure 9. Temperature profile for the Rocky Flats 3013 configuration post-fire transient.
Appendix 3.3 - 36 of 44
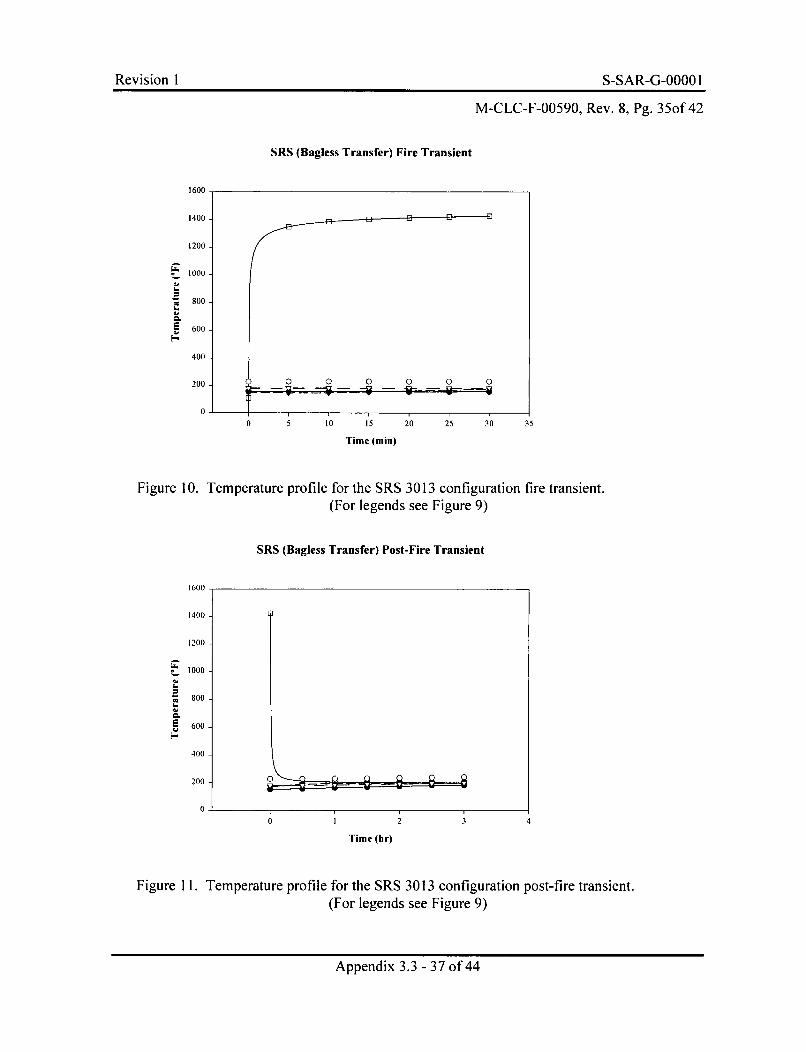
Revision I S-SAR-G-0000 I
M-CLC-F-00590, Rev. 8, Pg. 35of 42
SRS (Bagless Transfer) Fire Transient
a..=44
a..
I
1600
1400
1200
1000 -
800 -
600 -
400 -
200 - 0 0 0 0 0 0
0 5 10 15
Time (min)
20 25 30 35
Figure 10. Temperature profile for the SRS 3013 configuration fire transient.(For legends see Figure 9)
SRS (Bagless Transfer) Post-Fire Transient
44a..4'
I
1600
1400 -
1200.
I000
800
600
400
200
0
0
0 3 4
Time (hr)
Figure 11. Temperature profile for the SRS 3013 configuration post-fire transient.(For legends see Figure 9)
Appendix 3.3 - 37 of 44
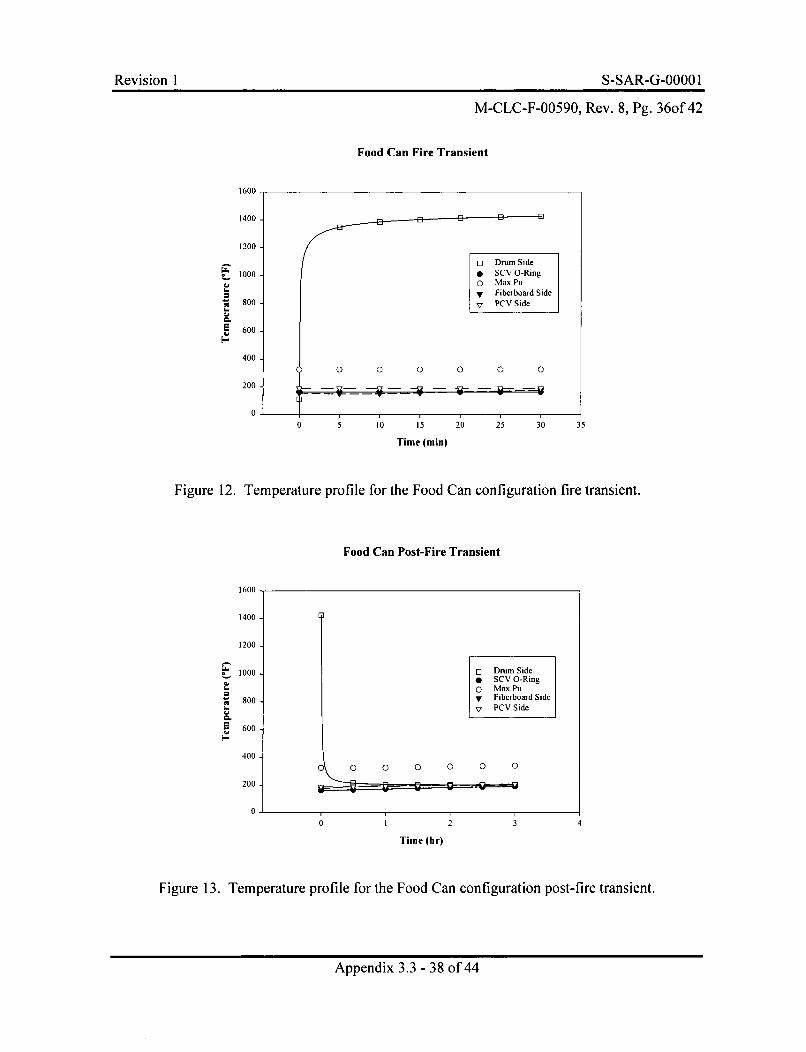
Revision I S-SAR-G-0000 I
M-CLC-F-00590, Rev. 8, Pg. 36of 42
Food Can Fire Transient
1000
- 800
E 600
0 5 10 15 20 25 30 35
Time (min)
Figure 12. Temperature profile for the Food Can configuration fire transient.
Food Can Post-Fire Transient
1600
1400
1200
1000
" 800
600
400
200
0
Drum Side* SCV O-Ring0 Max PuV Fiberboard Side7 PCV Side
0 0,7 0 0" "---""-' 0,0
0
ApnIx33-3of4
3 4
Time (hr)
Figure 13. Temperature profile for the Food Can configuration post-fire transient.
Appendix 3.3 - 38 of 44
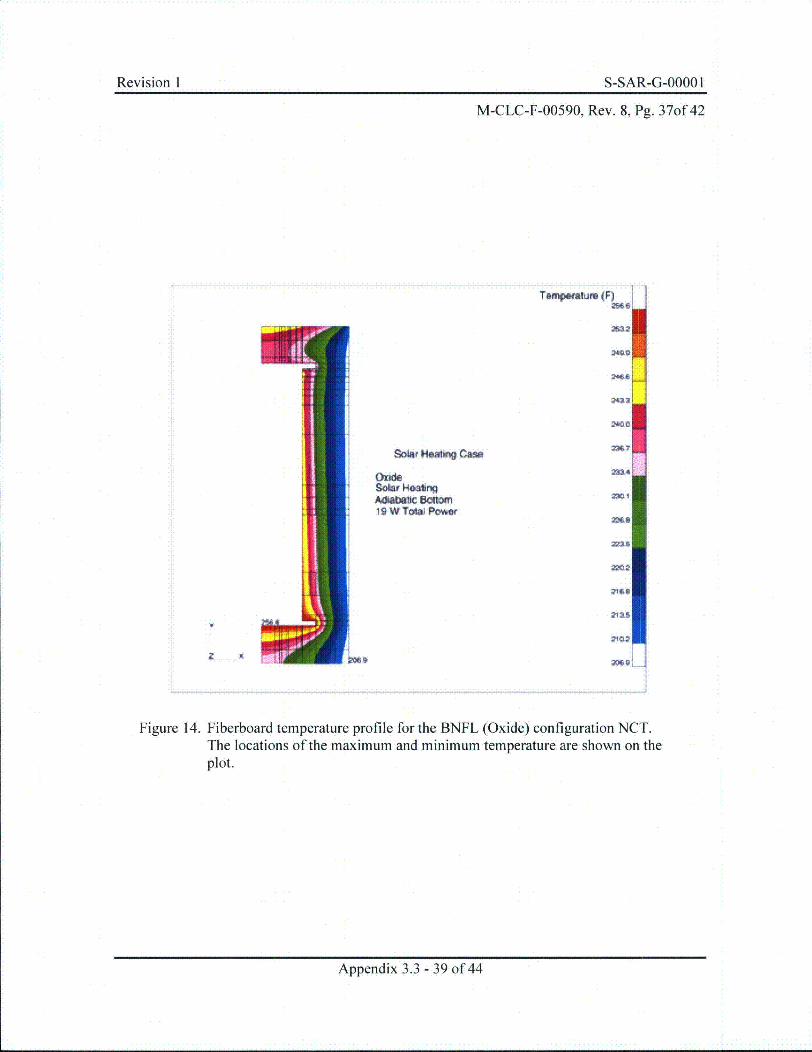
Revision I S-SAR-G-0000 I
M-CLC-F-00590, Rev. 8, Pg. 37of 42
TemMloMure (F)
1254.l
26L
Solar Heantig Casa
OxideSolar HealingAabetkc OcflItw19 W Towe Powom
2140
2115
4 X hoe, 2060i
Figure 14. Fiberboard temperature profile for the BNFL (Oxide) configuration NCT.The locations of the maximum and minimum temperature are shown on theplot.
Appendix 3.3 - 39 of 44
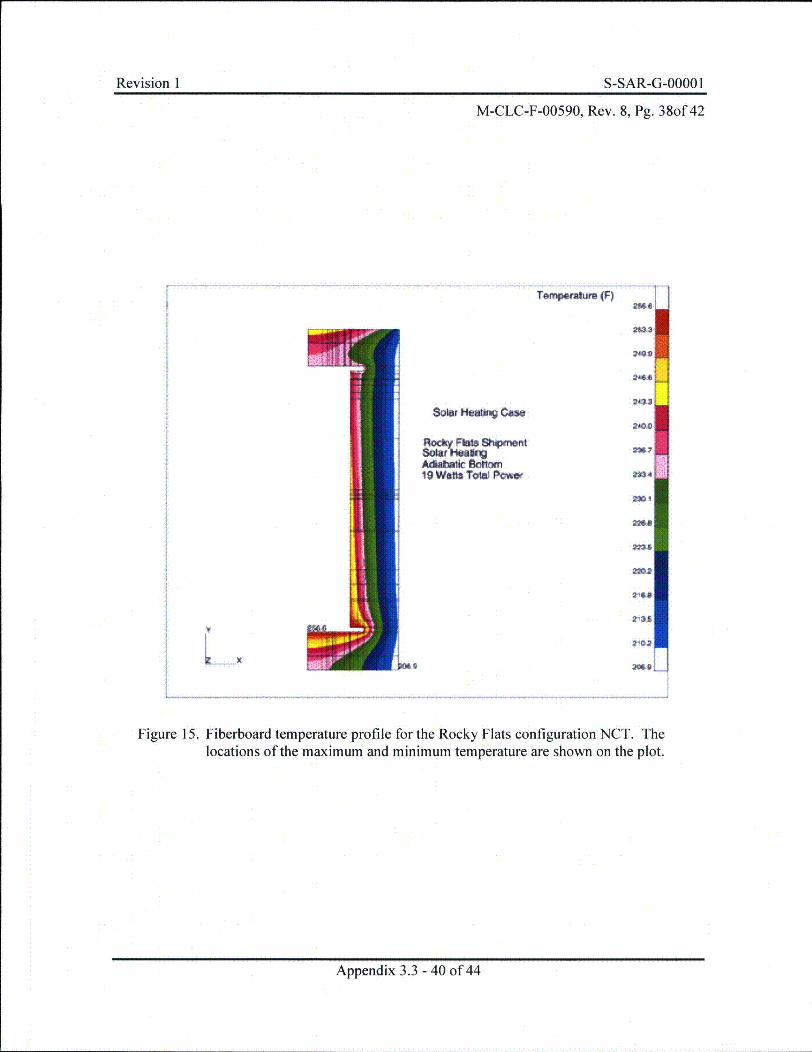
Revision I S-SAR-G-0000 I
M-CLC-F-00590, Rev. 8, Pg. 38of 42
Tenmprum (F)2S6
26"i
24Q9
WOL
Solar K81UN1 C&-S
_ok Fkfts Shprnent
19 Waftt TOWs PC*eW
2•21
x209L
Figure 15. Fiberboard temperature profile for the Rocky Flats configuration NCT. Thelocations of the maximum and minimum temperature are shown on the plot.
Appendix 3.3 - 40 of 44
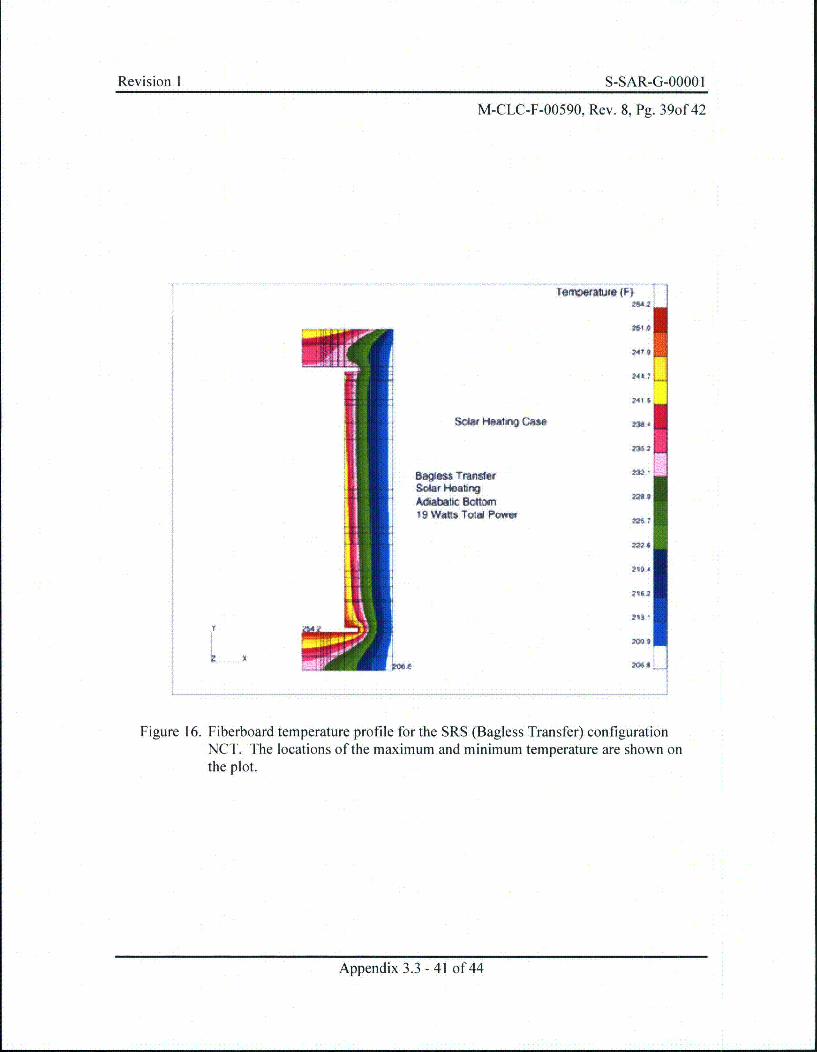
Revision 1 S-SAR-G-.OOO 1
M-CLC-F-00590, Rev. 8, Pg. 39of 42
MA2
:61 io
74? 9
LiA2'41S
SCkV HIMtoig Ca"
ageven TraisfefSelaf HaabrgAdabaiC BCfbi~n19 Wati Told Poww
2U
M 4
40 9
Figure 16. Fiberboard temperature profile for the SRS (Bagless Transfer) configurationNCT. The locations of the maximum and minimum temperature are shown onthe plot.
Appendix 3.3 - 41 of 44
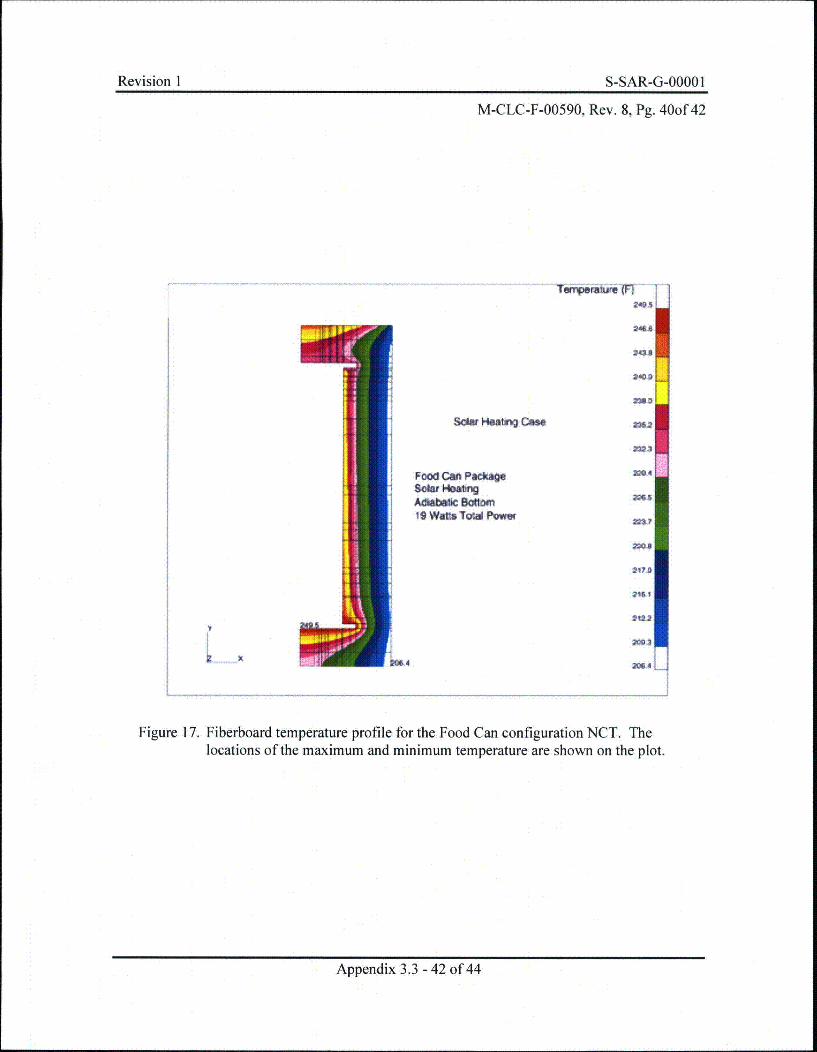
Revision I S-SAR-G-00001
M-CLC-F-00590, Rev. 8, Pg. 40of 42
Sc0rW -O Can
Food Can~ PaCka"$au ew alngAdkfab Bar~iIs Waftt TOW Poe"
2411
2204
2161
2022
M315
2064
094
Figure 17. Fiberboard temperature profile for the Food Can configuration NCT. Thelocations of the maximum and minimum temperature are shown on the plot.
Appendix 3.3 - 42 of 44
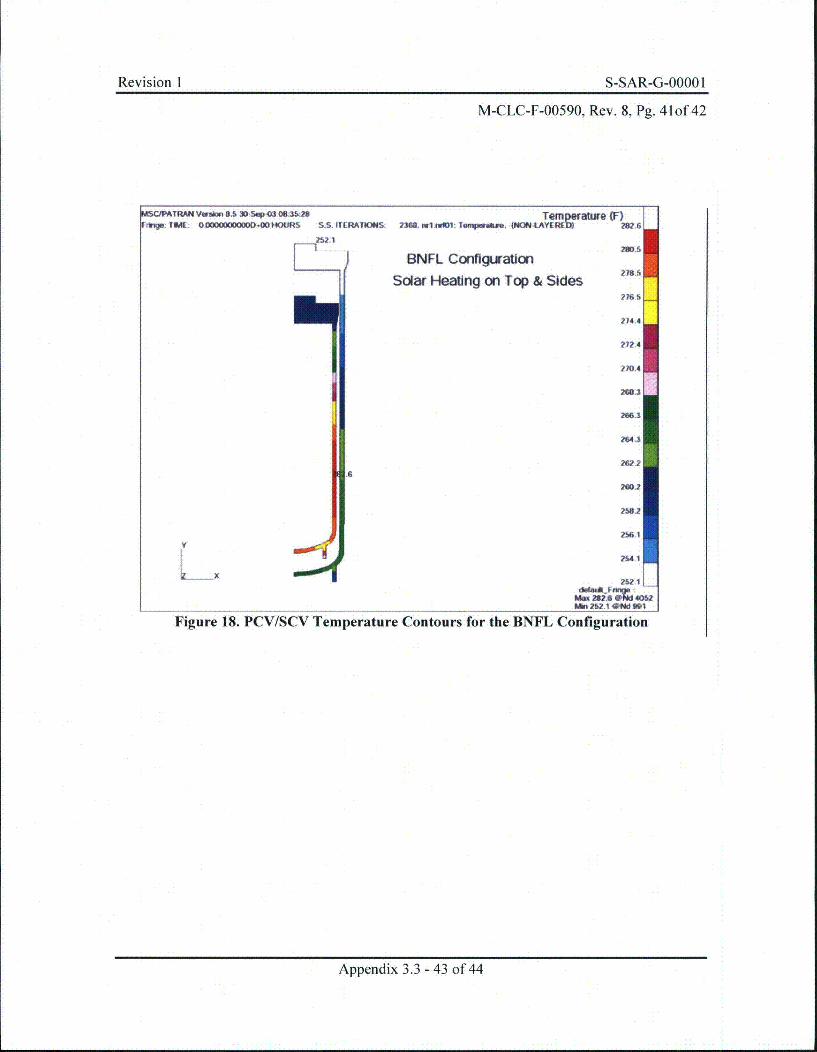
Revision I S-SAR-G-0000 I
M-CLC-F-00590, Rev. 8, Pg. 41of 42
WSCOPATRANI Vus 8AS 30Sep,03 W035:2FrWW: 1AK. ODOGOOWOOOO.W HOURS S.S. ITERATION4S:
M I1
m
Temperature (F)23W• ewlm : Iempwalus, 4NM-IAYEi)D2M8 16
M0.5
BNFL Configuration27*,S
Solar Heating on Top & Sides
?76.6
V14.4
272.4
770.4
268.3
266.3
6
264.3
202.2
258.2
2561
254.1
Min 262,1 44d 9,11
y
SX
Figure 18. PCV/SCV Temperature Contours for the BNFL Configuration
Appendix 3.3 - 43 of 44
Revision 1 S-SAR-G-0000 1
M-CLC-F-00590, Rev. 8, Pg. 42of 425.0 References
1. Hensel, S. J., "Thermal Analyses Of The 9975 Package With the 3013 Configuration
During Normal Conditions of Transport", WSRC-TR-98-00420.
2. Gray, L. W., "Kinetics Of The Ambient Temperature Dissolution Of Plutonium Metal
In Sulfuric Acid", March 1978.
3. Jerrell, J. W., Van Alstine, M. N., and Gromada, R. J., Normal Conditions of
Transport Thermal Analysis and Testing of a Type B Drum Package, PVP-Vol. 307,
pp. 11-117.
4. Hensel, S. J., Van Alstine, M. N. and Gromada, R. J., "Hypothetical Accident
Condition Thermal Analysis and Testing of a Type B Drum Package", ASME PVP
Conference, PVP-Vol. 30, pp. 119-126, 1995.
5. MSC/Thermal, MacNeal-Schwendler Corporation, Los Angeles, CA 90041.
6. Gupta, N. K., "Validation of MSC/THERMAL Finite Element Software for Thermal
Analysis at the Savannah River Site", G-VVR-G-0001 1, Rev. 0, 2001.
7. Westinghouse Savannah River Co., Conduct Of Engineering Manual, E-7, 1998.
8. Patran 8.5, MacNeal-Schwendler Corporation, Los Angeles, CA 90041.
9. Ingot Can Spacer Details and assembly, Rocky Flats Drawing No. 51651-9065
Rev. 0.
Appendix 3.3 - 44 of 44
Revision I S-SAR-G-0000 IRevision 1 S-SAR-G-OOOO I
APPENDIX 3.4
THE EFFECT OF A CELOTEX® GAP ON 9975 PACKAGE TEMPERATURESDURING THE HAC-FIRE AND COOL-DOWN TRANSIENTS
Appendix 3.4- I of 18

Revision I S-SAR-G-0000 IRevision 1 S-SAR-G-OOOO I
This Page Intentionally Left Blank
Appendix 3.4 - 2 of 18
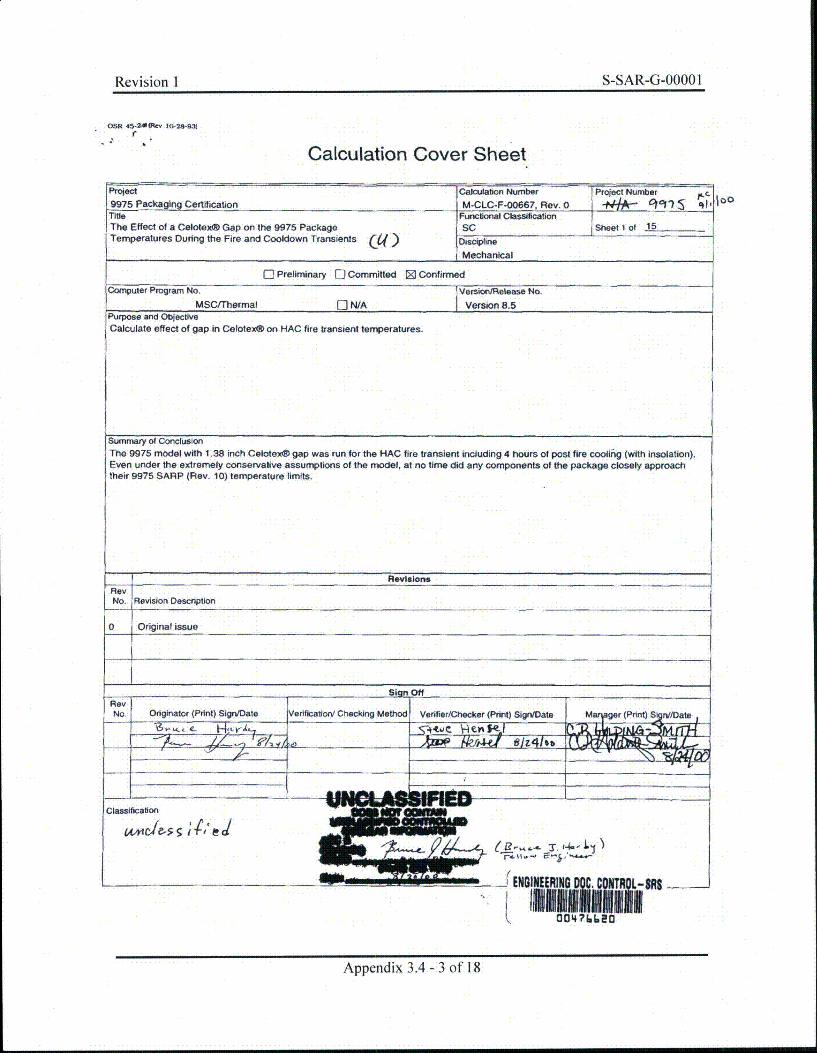
Revision 1 S-SAR-G-0000 1
OSR 45-24~VOL 10-28-93)
Calculation Cover Sheet
Project9975 Packaging CertificationTitleThe Effect of a CelotexS Gap on the 9975 PackageTemperatures During the Fire and Cooldown Transients C4,)
Calkxabon NumberM-CLC-F-00667, Rev. 0
Project Number kl 100
W4*- "IFunclional ClassificationSC Sheet 1 of 15
Discipline
Mechanical
C3 Preliminary [] Committed [ ConfirmedComputer Program No. VersioTvtteleese No.
MSC/Thermal [E N/A Version 8.5Purpose and ObjectiveCalculate effect of gap in Celotex(1 on HAC fire transient temperatures.
Summary of ConclusionThe 9975 model with 1.38 inch Celotext gap was run for the HAC fire transient including 4 hours of post fire Coolinig (with insolation).Even under the extremely conservalive assumptions of the model, at no time did any components of the package closely approachtheir 9975 SARP (Rev. 10) temperature limits.
RevisionsRevNo. Revision Description
0 JOriginal issue
Sian Off _RevNo, Originator (Print) Sign/Date Verification/ Checking Method Verifier/Checker (Print) Sign/Date M ger (Print) S rd./Date
a• ~~ ~ 4 AdhD~m
Classificationf
""__ ___ __" ___(ENGINEERING OC. L-S --N,iMenlia00476620
Appendix 3.4 - 3 of 18
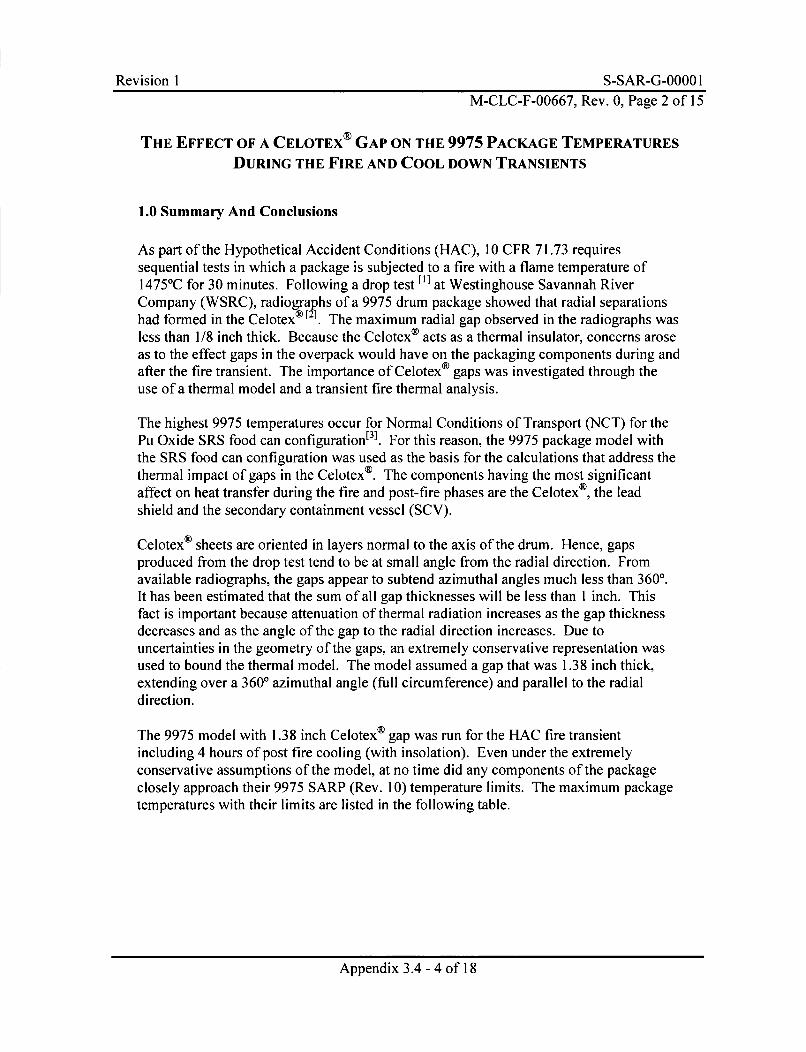
Revision 1 S-SAR-G-0000 1M-CLC-F-00667, Rev. 0, Page 2 of 15
THE EFFECT OF A CELOTEX® GAP ON THE 9975 PACKAGE TEMPERATURES
DURING THE FIRE AND COOL DOWN TRANSIENTS
1.0 Summary And Conclusions
As part of the Hypothetical Accident Conditions (HAC), 10 CFR 71.73 requiressequential tests in which a package is subjected to a fire with a flame temperature of1475°C for 30 minutes. Following a drop test [I] at Westinghouse Savannah RiverCompany (WSRC), radiographs of a 9975 drum package showed that radial separationshad formed in the Celotex® [21 . The maximum radial gap observed in the radiographs wasless than 1/8 inch thick. Because the Celotex® acts as a thermal insulator, concerns aroseas to the effect gaps in the overpack would have on the packaging components during andafter the fire transient. The importance of Celotex® gaps was investigated through theuse of a thermal model and a transient fire thermal analysis.
The highest 9975 temperatures occur for Normal Conditions of Transport (NCT) for thePu Oxide SRS food can configurationE31. For this reason, the 9975 package model withthe SRS food can configuration was used as the basis for the calculations that address thethermal impact of gaps in the Celotex®. The components having the most significantaffect on heat transfer during the fire and post-fire phases are the Celotex®, the leadshield and the secondary containment vessel (SCV).
Celotex® sheets are oriented in layers normal to the axis of the drum. Hence, gapsproduced from the drop test tend to be at small angle from the radial direction. Fromavailable radiographs, the gaps appear to subtend azimuthal angles much less than 3600.It has been estimated that the sum of all gap thicknesses will be less than 1 inch. Thisfact is important because attenuation of thermal radiation increases as the gap thicknessdecreases and as the angle of the gap to the radial direction increases. Due touncertainties in the geometry of the gaps, an extremely conservative representation wasused to bound the thermal model. The model assumed a gap that was 1.38 inch thick,extending over a 360' azimuthal angle (full circumference) and parallel to the radialdirection.
The 9975 model with 1.38 inch Celotex® gap was run for the HAC fire transientincluding 4 hours of post fire cooling (with insolation). Even under the extremelyconservative assumptions of the model, at no time did any components of the packageclosely approach their 9975 SARP (Rev. 10) temperature limits. The maximum packagetemperatures with their limits are listed in the following table.
Appendix 3.4 - 4 of 18
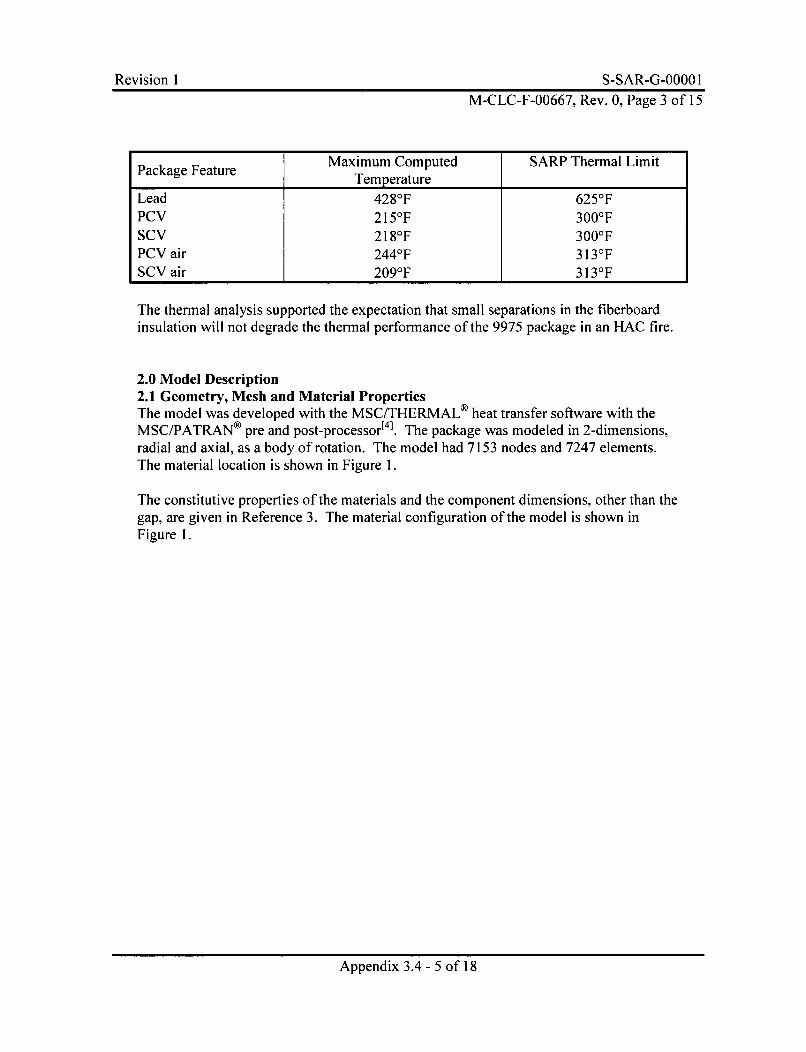
Revision I S-SAR-G-0000 IM-CLC-F-00667, Rev. 0, Page 3 of 15
Maximum Computed SARP Thermal LimitPackage Feature Tmeaue_____________Temperature
Lead 4280F 6250 FPCV 215°F 300OFSCV 218°F 300°FPCV air 2440F 313OFSCV air 209°F 313°F
The thermal analysis supported the expectation that small separations in the fiberboardinsulation will not degrade the thermal performance of the 9975 package in an HAC fire.
2.0 Model Description2.1 Geometry, Mesh and Material PropertiesThe model was developed with the MSC/THERMAL® heat transfer software with theMSC/PATRAN® pre and post-processor 43. The package was modeled in 2-dimensions,radial and axial, as a body of rotation. The model had 7153 nodes and 7247 elements.The material location is shown in Figure 1.
The constitutive properties of the materials and the component dimensions, other than thegap, are given in Reference 3. The material configuration of the model is shown inFigure 1.
Appendix 3.4 - 5 of 18
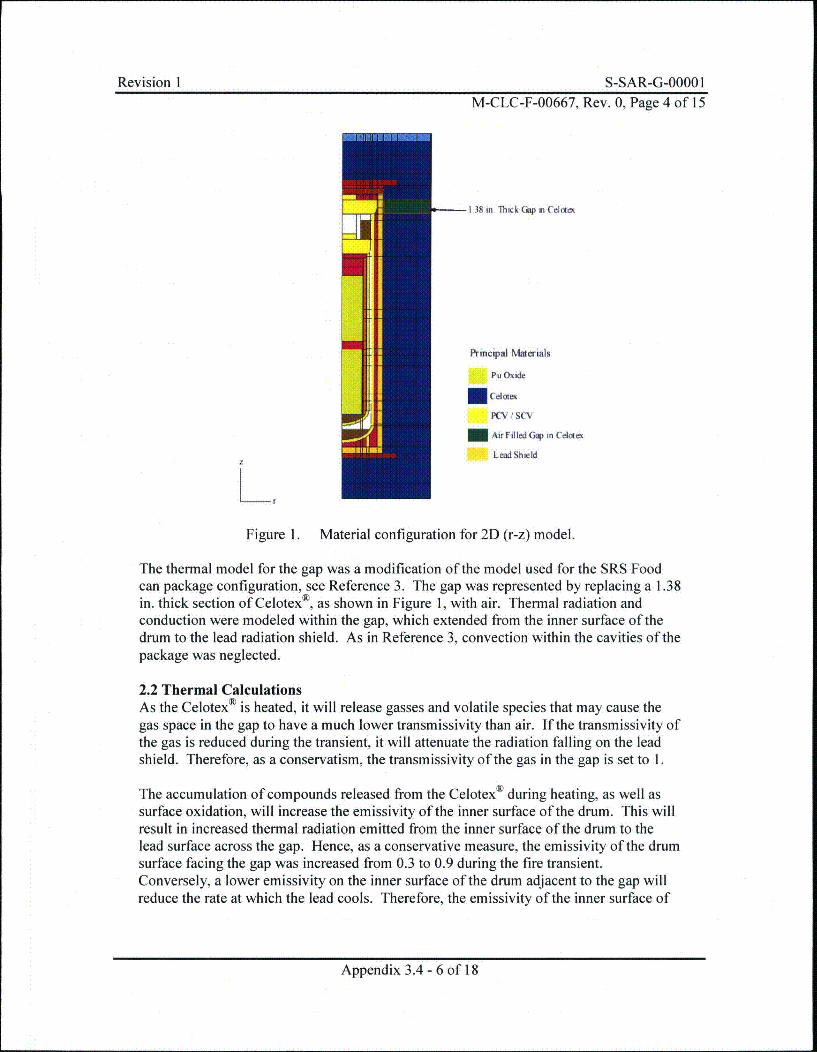
Revision I S-SAR-G-0000 IRevision I S-SAR-G-OOOO 1
M-CLC-F-00667, Rev. 0, Page 4 of 15
138in Thick ap m eotaex
Principal Materials
Pu Oxide
Celotex
P". I SCV
Air Filled Gap in Celotex
Lead ShieldL
Figure 1. Material configuration for 2D (r-z) model.
The thermal model for the gap was a modification of the model used for the SRS Foodcan package configuration, see Reference 3. The gap was represented by replacing a 1.38in. thick section of Celotex®, as shown in Figure 1, with air. Thermal radiation andconduction were modeled within the gap, which extended from the inner surface of thedrum to the lead radiation shield. As in Reference 3, convection within the cavities of thepackage was neglected.
2.2 Thermal CalculationsAs the Celotex® is heated, it will release gasses and volatile species that may cause thegas space in the gap to have a much lower transmissivity than air. If the transmissivity ofthe gas is reduced during the transient, it will attenuate the radiation falling on the leadshield. Therefore, as a conservatism, the transmissivity of the gas in the gap is set to 1.
The accumulation of compounds released from the Celotex® during heating, as well assurface oxidation, will increase the emissivity of the inner surface of the drum. This willresult in increased thermal radiation emitted from the inner surface of the drum to thelead surface across the gap. Hence, as a conservative measure, the emissivity of the drumsurface facing the gap was increased from 0.3 to 0.9 during the fire transient.Conversely, a lower emissivity on the inner surface of the drum adjacent to the gap willreduce the rate at which the lead cools. Therefore, the emissivity of the inner surface of
Appendix 3.4 - 6 of 18
Revision 1 S-SAR-G-0000 1M-CLC-F-00667, Rev. 0, Page 5 of 15
the drum, across from the gap, was reduced from 0.9 to 0.3 for the cool down phase ofthe post-fire transient.
Lead emissivity varies from 0.28 for a gray, oxidized surface to 0.63 for an oxidizedsurface at 300'F. To be conservative, for the lead surface facing the gap an emissivity of0.7 was used during the fire transient and an emissivity of 0.28 was used for the post-firecool down.
Thermal calculations were performed for the HAC fire transient discussed in Reference3. The HAC fire transient consists of three phases, the initial phase, the fire phase andthe post-fire phase. The conditions for the three phases are given below.
For the initial phase of the HAC:1. The drum is in an upright position.2. The bottom surface is adiabatic.3. There is radiation heat transfer from the sides and top of the drum
to the ambient.4. There is natural convection heat transfer from the drum sides and
top to the ambient. Convection coefficients were obtained fromcorrelations for natural convection in MSC/THERMAL®.
5. The ambient temperature is 100'F.6. No insolation.7. Undamaged Celotex®properties are applied to all the Celotex in
the drum.8. 19 watts total decay power.9. Emissivity of drum facing the gap is 0.3.10. Emissivity of the lead facing the gap is 0.28.
For the fire phase of the HAC (duration 0.5 hour):1. Restart from temperature profile in initial phase.2. The drum is in an upright position.3. There is forced convection from all surfaces of the drum. The
convection coefficients, based on a 20 m/s air velocity, are:i. 5.9 Btu/hr-ft2 'F for the top and bottom of the drum.ii. 3.0 Btu/hr-ft2 'F for the side of the drum.
4. There is thermal radiation heat transfer from all surfaces of thedrum to the ambient.
5. The ambient temperature is 1475°F.6. No insolation.7. Fire phase Celotex® properties are applied to all the Celotex® in
[3]the drum8. 19 watts total decay power.9. External drum surface emissivity of 0.9.10. Emissivity of drum facing the gap is 0.9.11. Emissivity of the lead facing the gap is 0.7.
Appendix 3.4 - 7 of 18
Revision I S-SAR-G-0000 1
M-CLC-F-00667, Rev. 0, Page 6 of 15
For the fire post-fire phase of the HAC (duration 4 hours):1. Restart from temperature profile at end of fire phase.2. The drum is in an upright position.3. There is thermal radiation from the top, sides and bottom of the
drum to the ambient.4. There is natural convection from the top and sides of the drum to
the ambient. Convection coefficients were obtained fromcorrelations for natural convection in MSC/Thermal.
5. The ambient temperature is 100°F.6. Insolation: 800 W/m 2 on drum top and 400 W/m 2 on drum side
(solar absorptivity of the drum assumed unity).7. "Char layer" properties are applied to the outer 1.4 inch layer of
the top, bottom and sides of the Celotex® contained in the drum[3].8. Fire phase properties are applied to the all Celotex® not in the 1.4
inch outer layer[31.9. 19 watts total decay power.10. Emissivity of drum facing the gap is 0.3.11. Emissivity of the lead facing the gap is 0.28.
3.0 RESULTSThe temperature profile prior to the start of the fire phase is shown in Figure 2. Thetemperature profile at the end of the fire phase (0.5 hours of a 1475°F fire) for thepackage is shown in Figure 3. Figure 4 shows the temperature profile in the lead andSCV at this time. The temperature profile in the package after 30 minutes of post firecooling is shown in Figure 5, the profile in the lead and SCV at this time is shown inFigure 6.
Transient temperatures for the 30 minute fire phase, along with the limiting temperaturesfor each component are given in Table 1. The limiting temperatures listed in Tables Iand 2 were given by the Radioactive Materials Packaging and Technology Group. Thepost-fire temperature in Table 1 are plotted in Figures 7 and 8.
Transient temperatures for 4 hours after the end of the fire phase, along with the limitingtemperatures for each component are given in Table 2. The post-fire temperature inTable 2 are plotted in Figures 9 and 10.
The model for the gap was run for the HAC fire transient of Reference 3. Even under theextremely conservative assumptions of the model, at no time did any components of thepackage closely approach their temperature limits.
Appendix 3.4 - 8 of 18
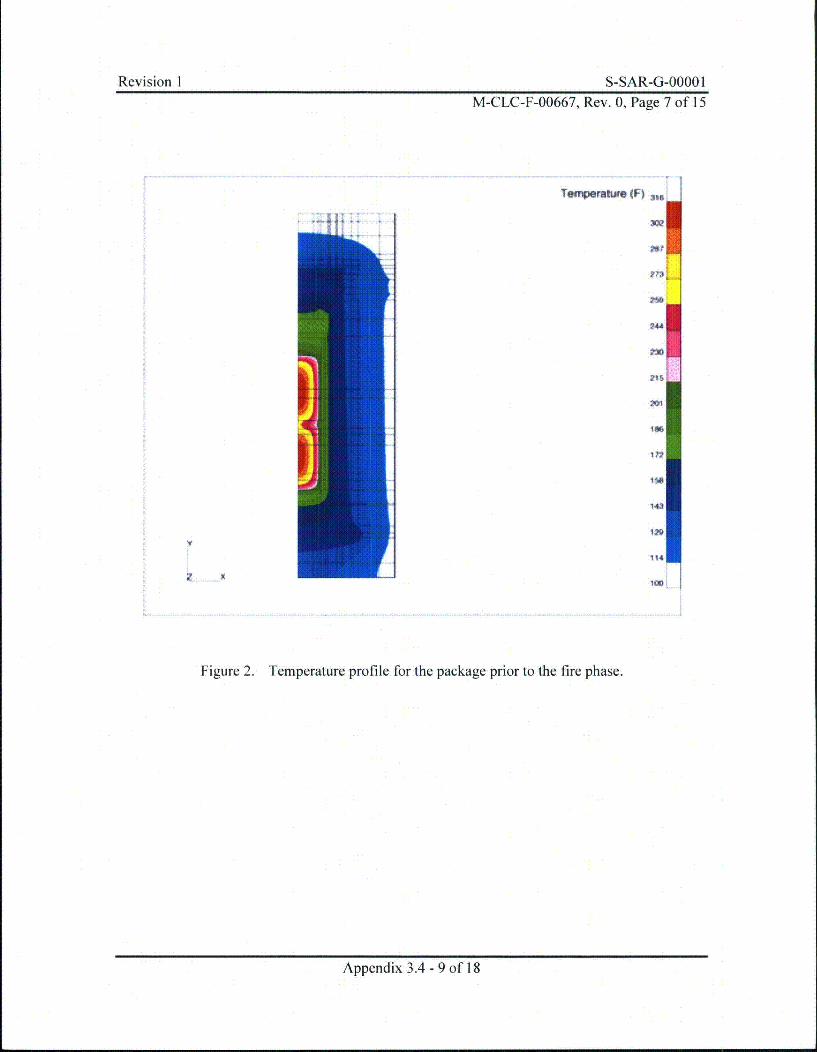
Revision 1 S-SAR-G-eo 1IM-CLC-F-00667, Rev. 0, Page 7 of 15
Teanpmlroh (F)
244
20
iis
143I
120
114
,do,S K
Figure 2. Temperature profile for the package prior to the fire phase.
Appendix 3.4 - 9 of 18
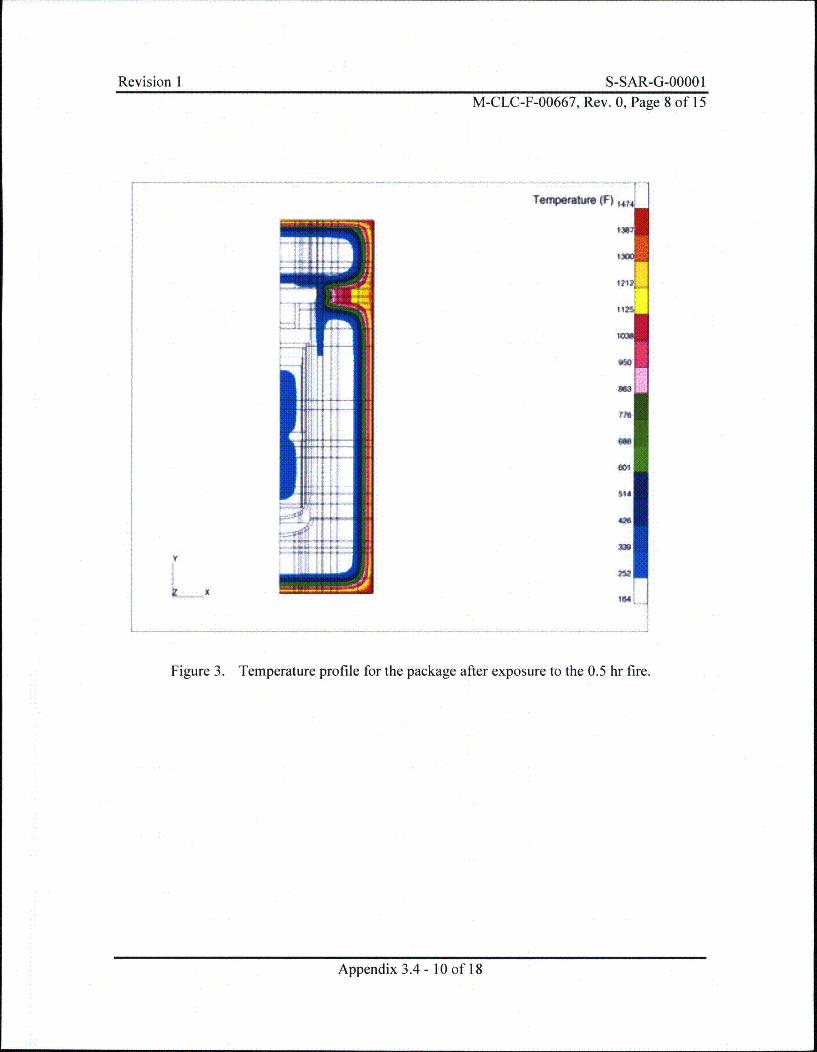
Revision I S-SAR-G-0000 1
M-CLC-F-00667, Rev. 0, Page 8 of 15
Tenleruture (F) !
so
N3
TF
Figure 3. Temperature profile for the package after exposure to the 0.5 hr fire.
Appendix 3.4 - 10 of 18
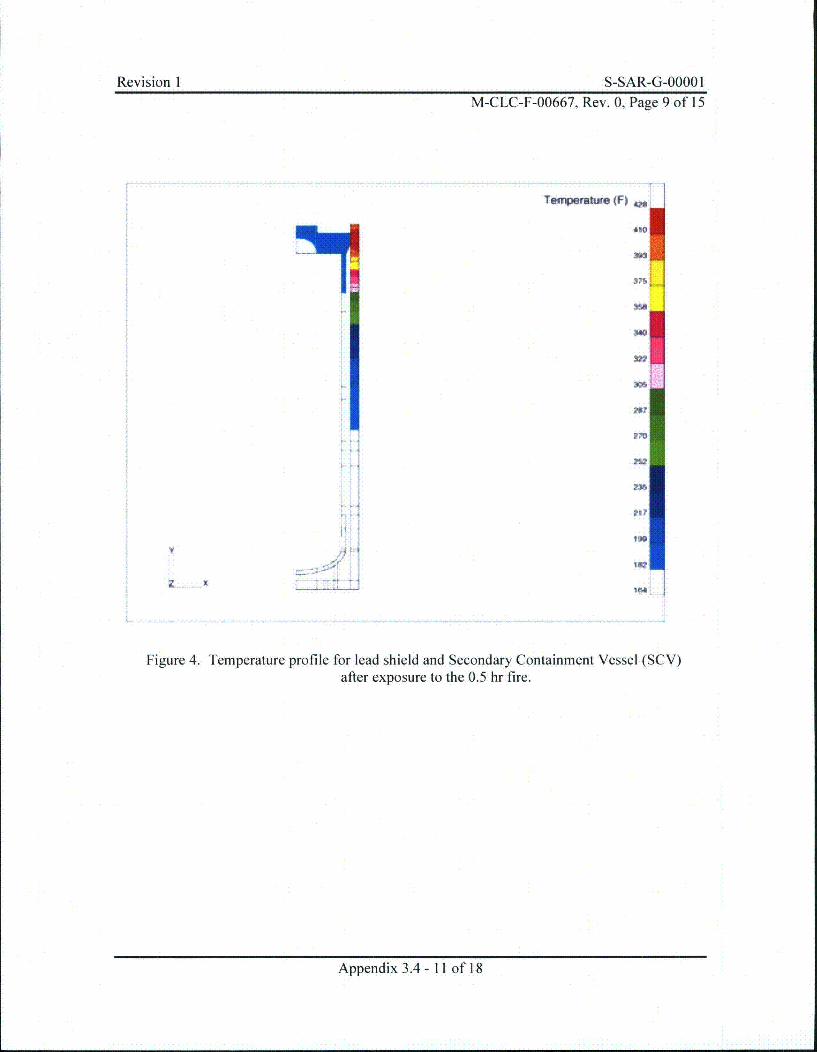
Revision I S-SAR-G-0000 IM-CLC-F-00667, Rev. 0, Page 9 of 15
Toinpetature (F)
14"
z~ X
Figure 4. Temperature profile for lead shield and Secondary Containment Vessel (SCV)after exposure to the 0.5 hr fire.
Appendix 3.4 - 11 of 18
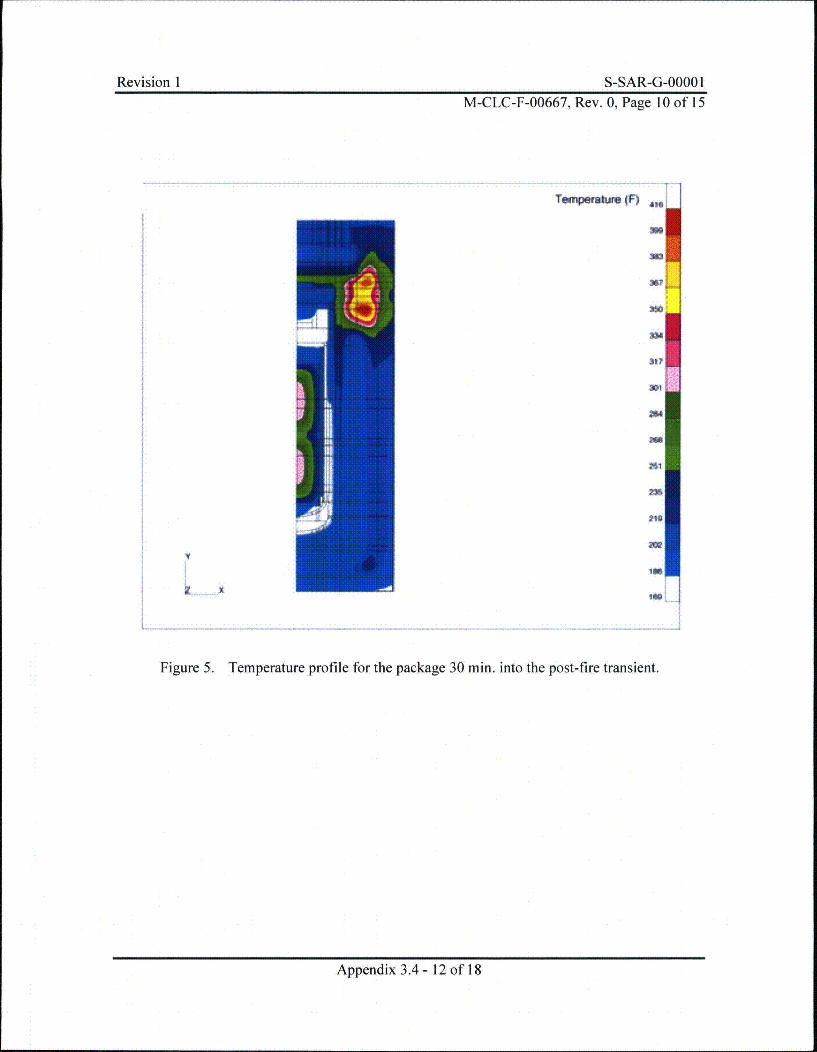
Revision I S-SAR-G-1 of15M-CLC-F-00667, Rev. 0, Page 10 of 15
Tempembtre IF)
317
3W
rig
MS
InV
Figure 5. Temperature profile for the package 30 min. into the post-fire transient.
Appendix 3.4 - 12 of 18
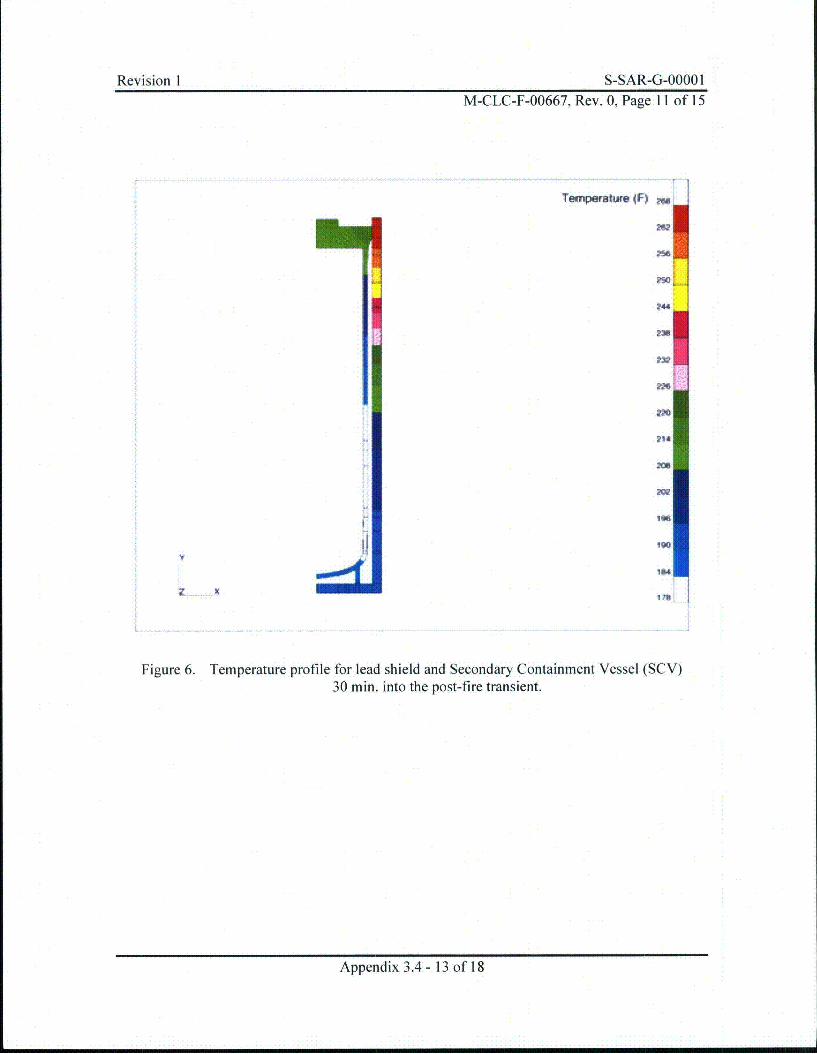
Revision 1 S-SAR-G-0000 1M-CLC-F-00667, Rev. 0, Page 11 of 15
Tempeature IF) •!
100
Figure 6. Temperature profile for lead shield and Secondary Containment Vessel (SCV)30 min. into the post-fire transient.
Appendix 3.4 - 13 of 18
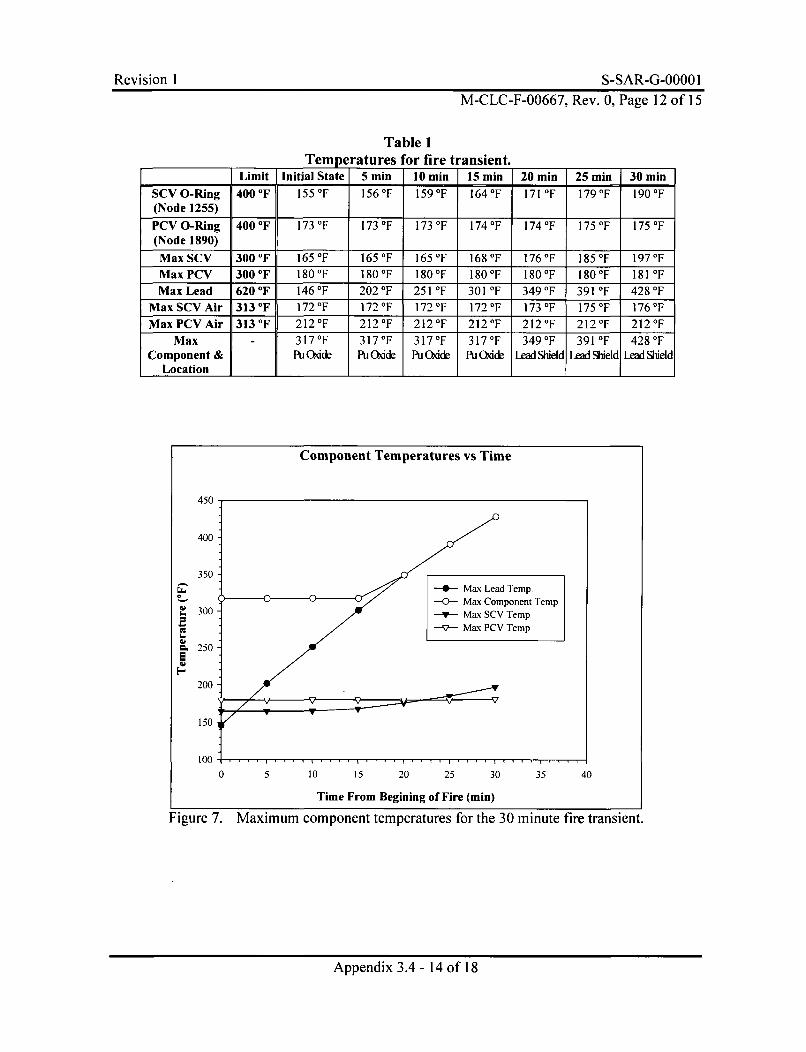
Revision I S-SAR-G-0000 1M-CLC-F-00667, Rev. 0, Page 12 of 15
Table 1Temperatures for fire transient.
Limit Initial State 5 min 10 min 15 min 20 min 25 min 30 minSCV O-Ring 400°F 155°F 156°F 159°F 164OF 171 OF 179OF 190OF(Node 1255)
PCV O-Ring 4000 F 173OF 173°F 173OF 174°F 174OF 175OF 175°F(Node 1890)
MaxSCV 300OF 165°F 165OF 165°F 168OF 176°F 185 0 F 197°FMaxPCV 300 OF 180 OF 180 OF 180 OF 180 OF 180 OF 180 OF 181 OFMax Lead 620OF 146°F 202OF 251 OF 301 OF 349OF 391 OF 428OF
Max SCV Air 313 OF 172 OF 172 °F 172 OF 172 OF 173 °F 175 OF 176 OFMax PCV Air 313°F 212OF 212°F 212OF 212OF 212OF 212OF 212°F
Max - 317°F 317OF 317°F 317OF 349°F 391 OF 428°FComponent & PuQ&ide Pu Oxde Pu Oide Pu Oide Lead hield Lead Rield Lead %ield
Location _1 1_1
Component Temperatures vs Time
450 -
400 -
350•" j -- 0- Max Lead T
- 4 - M a x L e a d0 -0- Max Compo
4.. 300 ,- 300---- Max SCV T,• M _ P C ,
-v- Max PCV T
- 250 -E
200
150
0 5 10 15 20 25 30
Time From Begining of Fire (min)
35 40
Figure 7. Maximum component temperatures for the 30 minute fire transient.
Appendix 3.4 - 14 of 18
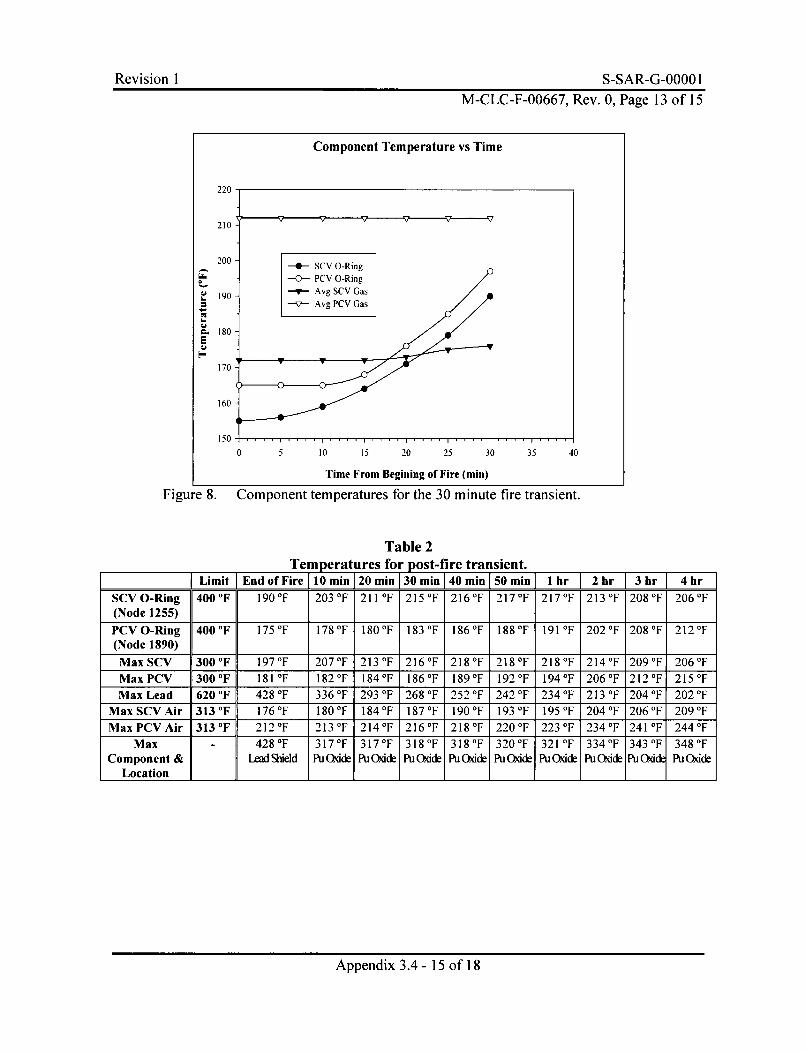
Revision I S-SAR-G-e000 1M-CLC-F-00667, Rev. 0, Page 13 of 15
Component Temperature vs Time
220
210
200 ---- SCV O-Ring
-- 0- PCV O-Ring190 -9-- Avg SCV Gas
- Avg PCV Gas
180
170
160
150 . . . .
0 5 10 15 20 25 30
Time From Begining of Fire (min)
35 40
Figure 8. Component temperatures for the 30 minute fire transient.
Table 2Tem peratures for post-fire transient.
Limit lEndofFire110min120mmin130min140min]50min 1 hr 2hr 3hr 4hrSCVO-Ring 400°F 190°F 203°F 211 OF 215°F 216°F 217OF 217°F 213°F 208°F 206°F(Node 1255)PCVO-Ring 400°F 175OF 178OF 180°F 183°F 186OF 188OF 191°F 202°F 208OF 212°F(Node 1890)MaxSCV 300OF 197OF 207OF 213OF 216OF 218OF 218°F 218°F 214°F 209OF 206OFMaxPCV 300°F 181°F 182OF 184°F 186OF 189°F 192°F 194OF 206°F 212OF 215°FMaxLead 620°F 428OF 336OF 293OF 268OF 252OF 242OF 234OF 213°F 204°F 202OF
MaxSCVAir 313 0 F 176°F 180°F 184OF 187OF 190OF 193OF 195°F 204OF 206°F 209OFMaxPCVAir 313°F 212°F 213°F 214OF 216°F 218°F 220°F 223°F 234°F 241OF 244°F
Max - 428°F 317°F 317°F 318°F 318°F 320°F 321 OF 334°F 343°F 348OFComponent & Lead Sield Pu Ode PuxiOde PuxiOde PuOdCde Puxide PuCbxde Pu~dde Puxid PuOx&d
Location III_
Appendix 3.4 - 15 of 18
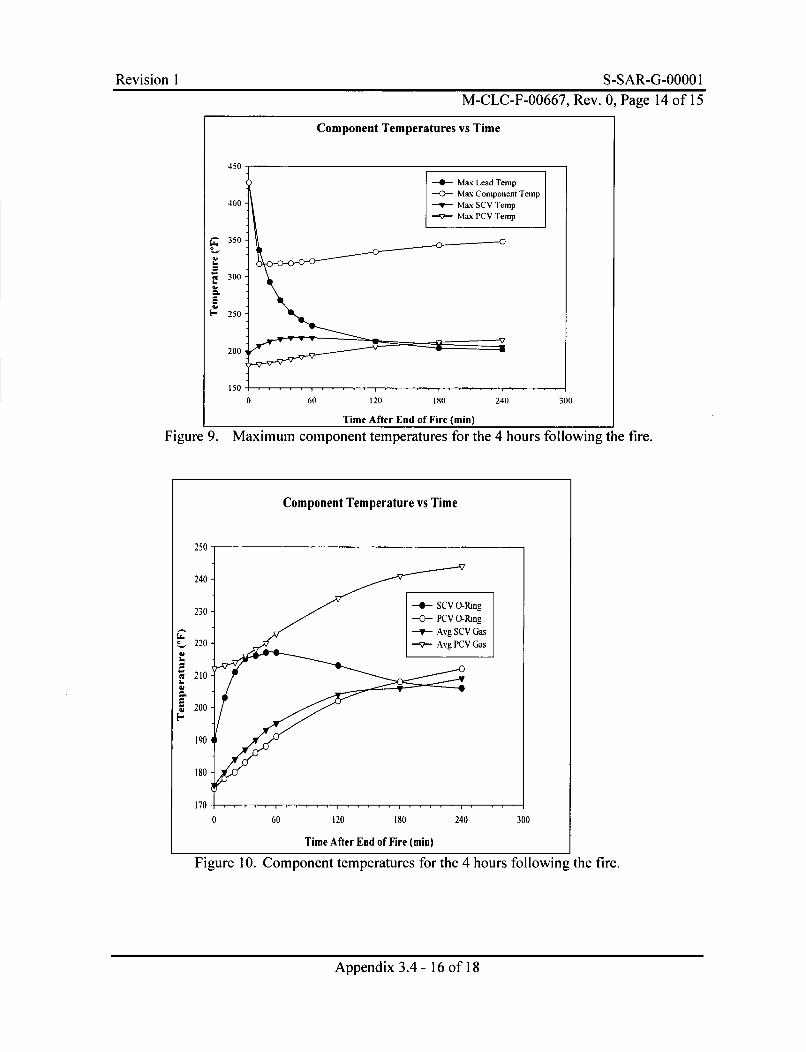
Revision 1 S-SAR-G-e4o 1IM-CLC-F-00667, Rev. 0, Page 14 of 15
Component Temperatures vs Time
=I-
24.
0 60 120 180
Time After End of Fire (min)
240 300
Figure 9. Maximum component temperatures for the 4 hours following the fire.
Component Temperature vs Time
250 ,
240 "
230- --G-- SCV O-Ring--0-- PCV 0-Ping•" /" I -'--Avg scv Gas
220 Avg PCV Gas4.
2104. ,
200 -
190
180
170 . . ,. . .
0 60 120 180 240 300
Time After End of Fire (min)
Figure 10. Component temperatures for the 4 hours following the fire.
Appendix 3.4 - 16 of 18
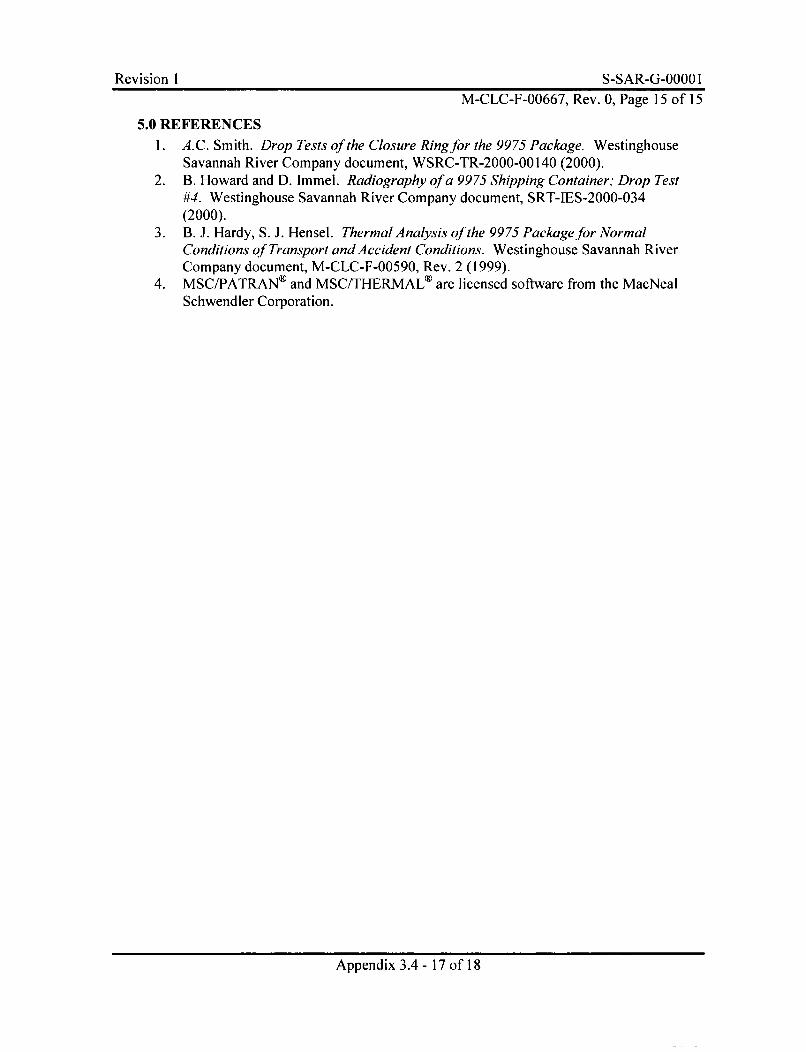
Revision I S-SAR-G-0000 IM-CLC-F-00667, Rev. 0, Page 15 of 15
5.0 REFERENCES1. A.C. Smith. Drop Tests of the Closure Ring for the 9975 Package. Westinghouse
Savannah River Company document, WSRC-TR-2000-00140 (2000).2. B. Howard and D. Immel. Radiography of a 9975 Shipping Container,. Drop Test
#4. Westinghouse Savannah River Company document, SRT-IES-2000-034(2000).
3. B. J. Hardy, S. J. Hensel. Thermal Analysis of the 9975 Package for NormalConditions of Transport and Accident Conditions. Westinghouse Savannah RiverCompany document, M-CLC-F-00590, Rev. 2 (1999).
4. MSC/PATRAN® and MSC/THERMAL® are licensed software from the MacNealSchwendler Corporation.
Appendix 3.4 - 17 of 18

Revision I S-SAR-G-0000 IRevision 1 S-SAR-G-OOOO I
This Page Intentionally Left Blank
Appendix 3.4 - 18 of 18
Revision I S-SAR-G-0000 IRevision I S-SAR-G-OOOO 1
APPENDIX 3.5
9973 AND 9975 PACKAGING HAC THERMAL TEST REPORT
Appendix 3.5 - I of 106

Revision I S-SAR-G-0000 1
This Page Intentionally Left Blank
Appendix 3.5 - 2 of 106
Revision I S-SAR-G-0000 I
WESTINGHOUSE SAVANNAH RIVER COMPANY
INTER-OFFICE MEMORANDUM
SRT-PTG-94-0058Page 1 of 58
July 25, 1994
T:. 730-A FILE ROOMPROJECT FOLDER 22381 (QA/RIDS 4814))
FROM: MARK N. VAN ALSTINE, 773-53A
REVIEWED: (IDELL 773-53A
9973 AND 9975 PACKAGING THERMAL TEST REPORT ()
INTRODUCTION
Savannah River Site tested the 9973 and 9975 design variations of the 9972-series packagings.Testing of the 9973 was part of the regulatory hypothetical accident sequence defined in 10CFR 71.731. Testing of the 9975 was primarily to provide benchmark data for analyticalmodels. Summarized in this test report are test descriptions and results. Other supportingrecords are on file2.
The selection of the 9973 and 9975 packagings as representative of the series is documentedelsewhere3.
PACKAGING DESCRIPTION
The 9973 and 9975 test units are representative of the final packaging designs. Figures 1 and 2show key packaging features. Significant thermal features are the thin walled drum andfiberboard insulation. A step at the fiberboard junction eliminates radial gaps through thefiberboard which otherwise may allow radiation heating of the containment vessel from thedrum. The metal shield on the upper fiberboard eliminates air ingress into the fiberboard fromthe vent holes and lid during the thermal accident and subsequent cooling.
Packaging thermal acceptance criteria are listed below.* containment vessel O-ring seals s 400F rating• lead S 620"F melting point (applicable to the 9975)• fiberboard not burnt (burning is evidenced by loss of form and ash residue; charring is
evidenced by retained form but carbonized structure, and is expected)* containment vessels remain leak tight per ANSI N14.5-874 (s 1.96 x 10⁻⁷ ski cn3 HM& at
14.7 psi differential)
Appendix 3.5 - 3 of 106
Revision I S-SAR-G-0000 I
730-A FILE ROOM. PROJECT FOLDER 22381SRT-PTG-94-0058Page 2 of 58July 25, 1994
A thin ceramic blanket is used as required to fill between the lid and metal shield. The 9973test unit had this blanket while the 9975 did not. The blanket has approximately the samethermal conductivity as fiberboard but has a much higher temperature rating.
During the thermal accident, the thin wall drum temperature will quickly rise, after which thefiberboard will slowly char inward. Significant internal temperature increases are expectedonly in the charred region. Fusible vent plugs will relieve drum pressurization. Eliminating airingress, particularly in side orientations prone to chimney effects, prohibits fiberboard burningand smoldering. Both the vent plugs and lid gasket are assumed to be destroyed early in theaccident.
PACKAGING PREPARATION
Instrumented assembly of the packagings is described in Appendix 1. Figures 3 and 4 showlocations of the packaging thermocouples. All leads were routed from the packagings inflexible metal conduits.
The 9973 packaging included pressurized, leak tested containment vessels and content mass.Following assembly, it was subjected to the regulatory free drop and puncture tests, bothimpacting on the drum lid. Details of these impact tests are reported elsewhere. Expecteddamage was to minimize the fiberboard thickness and integrity in the upper packaging adjacentto the containment vessel seals. Internal damage was not assessed prior to the thermal test.
The 9975 packaging included content mass and an electric heater simulating a 21W contentload. Both containment vessel walls were breached for instrumentation leads and the sealswere not leak tested. Thermal testing was not preceded by any other hypothetical accidentconditions.
PACKAGING TESTING
Thermal testing was performed at the Sandia National Laboratory in Albuquerque, NewMexico. Test requirements are documented in Appendix 2. Sandia's radiant heat facility waschosen for its test control capabilities. Heating was obtained by external quartz-electric heatlamps heating an upright cylindrical metal shroud which in turn radiated heat to the enclosedpackaging. Coating on the shroud approximated a black-body source. Reradiant heating frominsulation-backed thin metal plates provided top and bottom heating. Heat lamp power wascontrolled based on shroud temperatures.
Temperatures of the shroud and its upper and lower air plenums were recorded to demonstratethat the cool down environment was acceptable. An annular gap at the shroud bottom and a topbaffle allowed for air flow around the packaging after the heat exposure. Conduit thermalprotection was provided by insulation wrap and nitrogen purging.
A Sandia test report5 fully describes the facility and demonstrates that the required hypotheticalaccident environment was obtained.
Appendix 3.5 - 4 of 106
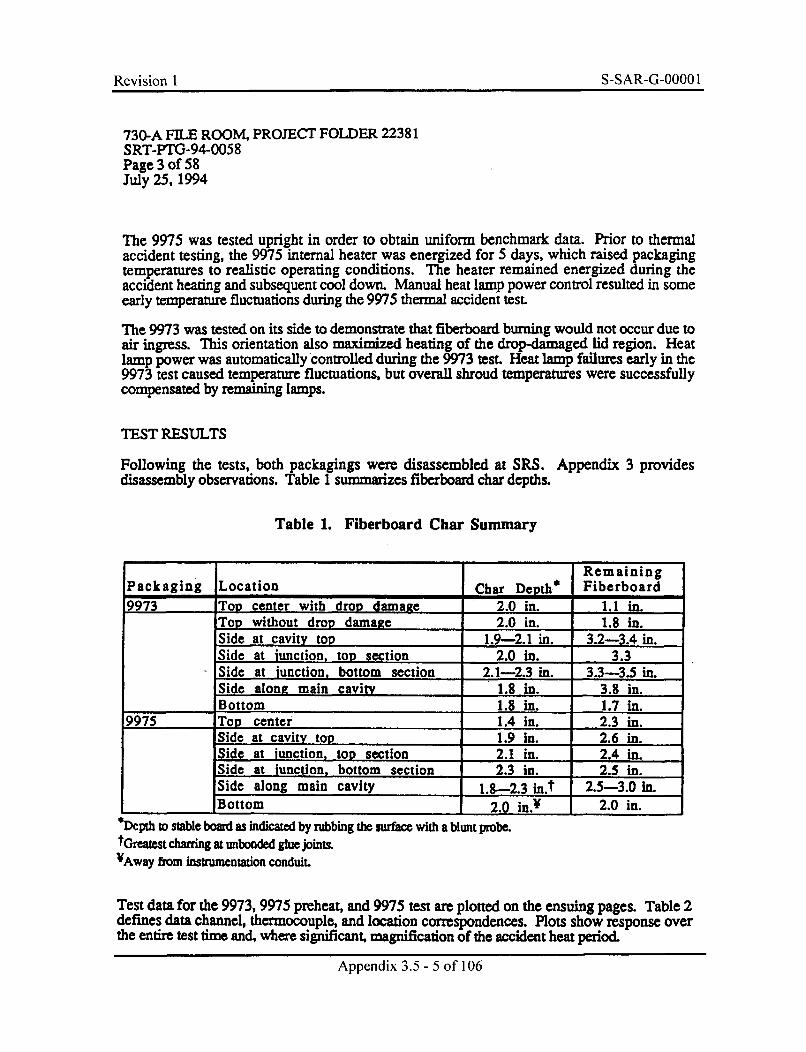
Revision I S-SAR-G-0000 I
730-A FILE ROOM, PROJECT FOLDER 22381SRT-PTG-94-0058Page 3 of 58July 25, 1994
The 9975 was tested upright in order to obtain uniform benchmark data. Prior to thermalaccident testing, the 9975 internal heater was energized for 5 days, which raised packagingtemperatures to realistic operating conditions. The heater remained energized during theaccident heating and subsequent cool down. Manual heat lamp power control resulted in someearly temperature fluctuations during the 9975 thermal accident test.
The 9973 was tested on its side to demonstrate that fiberboard burning would not occur due toair ingress. This orientation also maximized heating of the drop-damaged lid region. Heatlamp power was automatically controlled during the 9973 test. Heat lamp failures early in the9973 test caused temperature fluctuations, but overall shroud temperatures were successfullycompensated by remaining lamps.
TEST RESULTS
Following the tests, both packagings were disassembled at SRS. Appendix 3 providesdisassembly observations. Table 1 summarizes fiberboard char depths.
Table 1. Fiberboard Char Summary
RemainingPackaging Location Char Depth* Fiberboard9973 Top center with drop damage 2.0 in. 1.1 in.
Top without drop damage 2.0 in. 1.8 in.Side at cavity top 1.9-2.1 in. 3.2-3.4 in.Side at iunction, top section 2.0 in. 3.3Side at iunction, bottom section 2.1-2.3 in. 3.3-3.5 in.Side alone main cavity 1.8 in. 3.8 in.Bottom 1.8 in. 1.7 in.
9975 Top center 1.4 in. 2.3 in.Side at cavity too 1.9 in. 2.6 in.Side at iunction, top section 2.1 in. 2.4 in.Side at junction, bottom section 2.3 in. 2.5 in.Side along main cavity 1.8--2.3 in.t 2.5-3.0 in.
_____Bottom 2.0 in.¥ 2.0 in.
Depth to stable board as indicated by rubbing the surface with a blunt probe.tOreazest charring at unbonded glue joints.VAway from instrumentation conduit.
Test dam for the 9973, 9975 preheat, and 9975 test are plotted on the ensuing pages. Table 2defines data channel, thermocouple, and location correspondences. Plots show response overthe entire test time and, where significant, magnification of the accident heat period.
Appendix 3.5 - 5 of 106
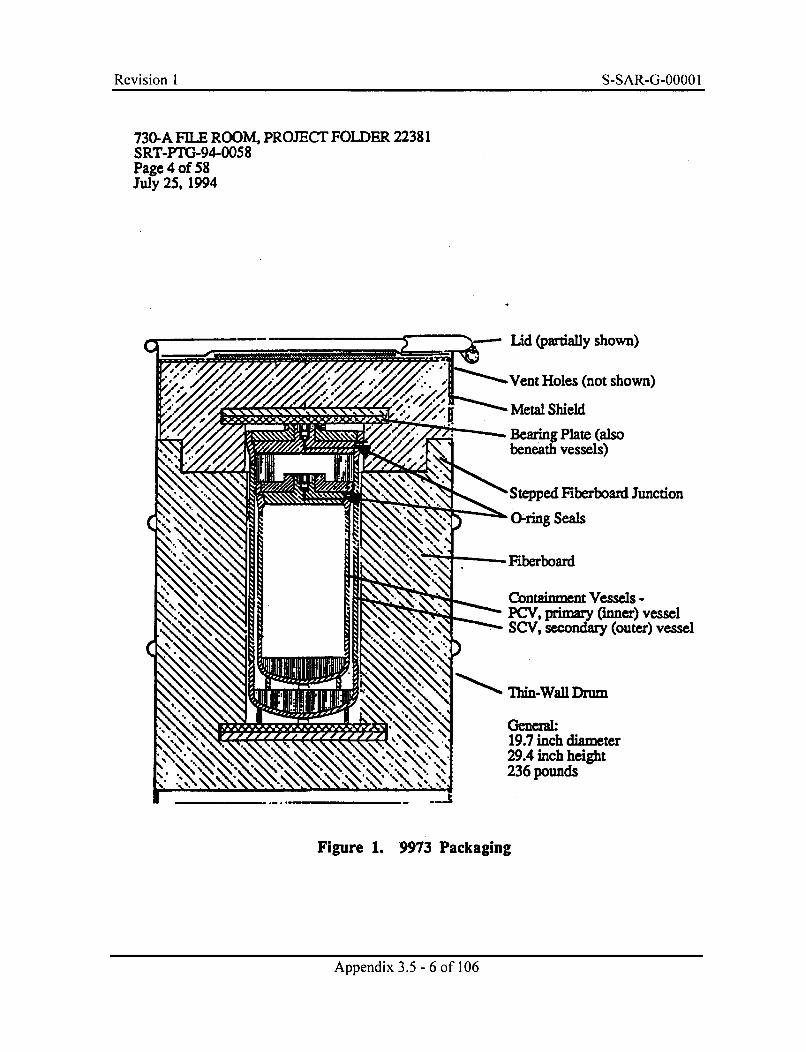
Revision I S-SAR-G-0000 IRevision 1 S-SAR-G-OOOO 1
730-A FILE ROOMK PROJECT FOLDER 22381SRT-PTG-94-0058Page 4 of 58July 25, 1994
*Vent Holes (not shown)
Containment Vessels -PCV, primary (inner) vesselSCV, secondary (outer) vessel
Figure 1. 9973 Packaging
Appendix 3.5 - 6 of 106
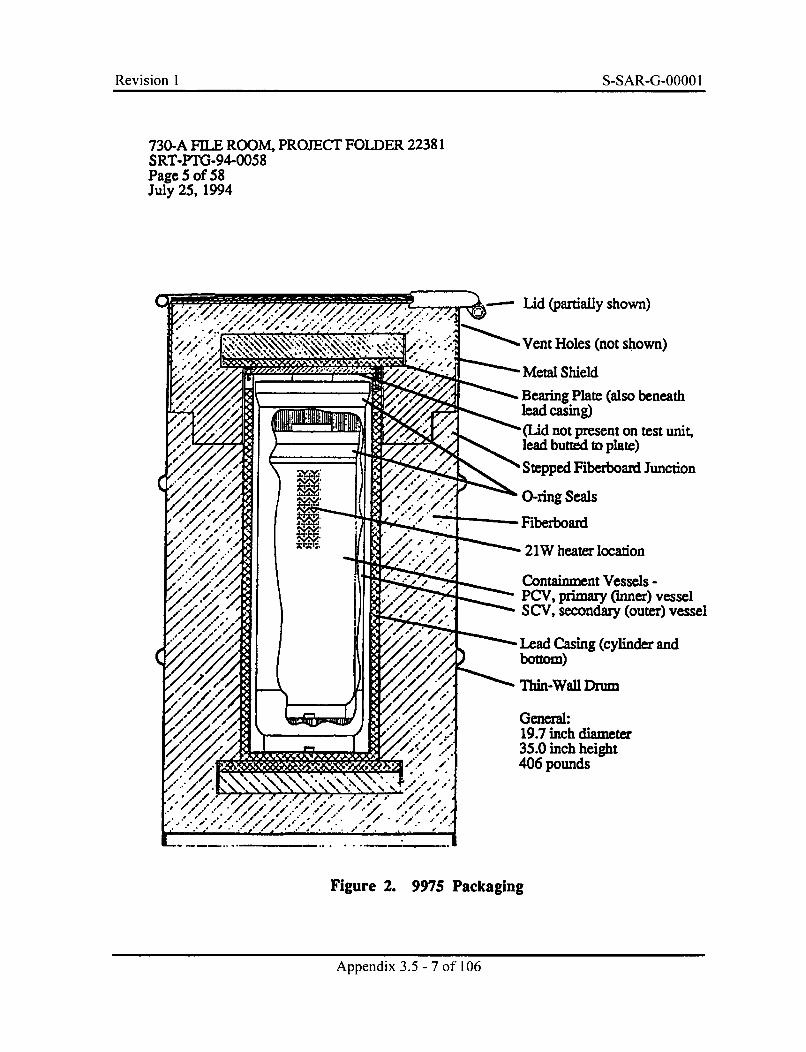
Revision I S-SAR-G-0000 IRevision 1 S-SAR-G-OOOO I
730-A FILE ROOM, PROJECT FOLDER 22381SRT-PrG-94-0058Page 5 of 58July 25, 1994
Ce.. - --.. Lid (partially shown)
•. Vent Holes (not shown)
~.I f.- '* Metal Shield
Bearing Plate (also beneath
(Lid not present on test unit,
lead butted to plate)
rStepped Fiberboard Junction
O-ring Seals. • Fiberboard
21W heater location
Containment Vessels -PCV, primary (inner) vesselSCV, secondary (outer) vessel
Lead Casing (cylinder and( ) bottom)
Thin-Wall Drum
General:19.7 inch diameter35.0 inch height406 pounds
Figure 2. 9975 Packaging
Appendix 3.5 - 7 of 106
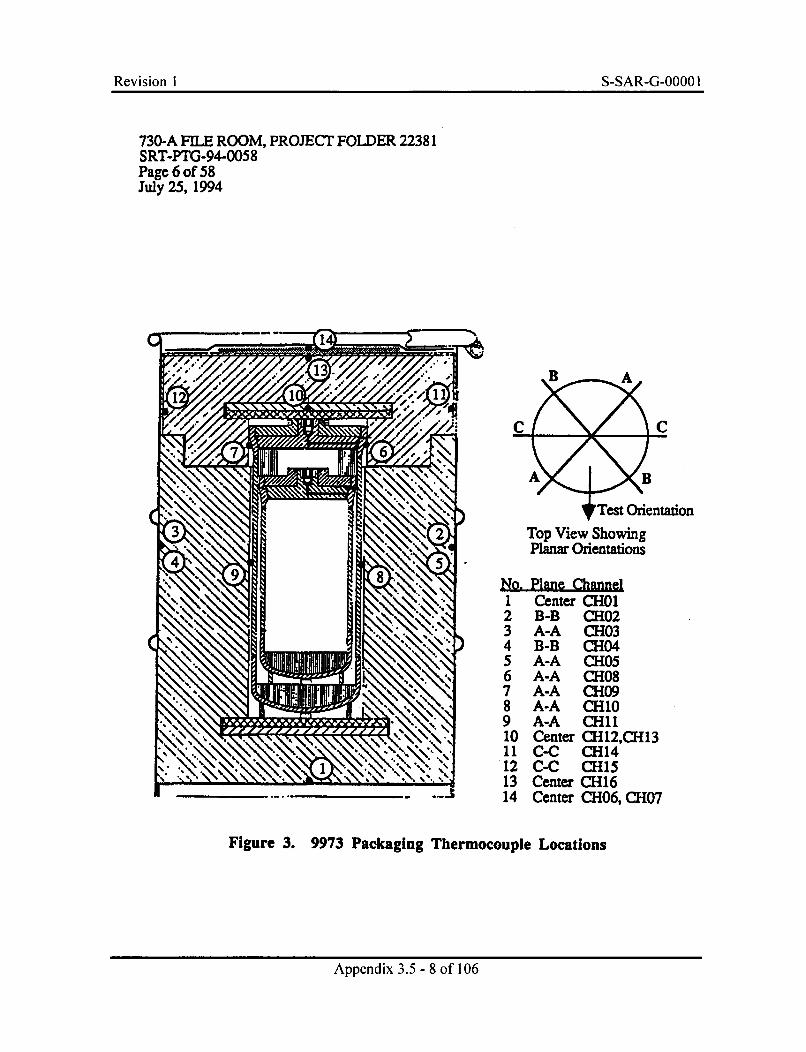
Revision I S-SAR-G-0000 IRevision I S-SAR-G-OOOO 1
730-A FILE ROOM, PROJECT FOWDER 22381SRT-PTG-94-0058Page 6 of 58July 25, 1994
CC "7
Test Orientation
Top View ShowingPlanar Orientations
No. Plane ChannelI Center CHOI
2 B-B CH02X 3 A-A CH03
4 B-B CH045 A-A CH05
6 A-A CH087 A-A CR098 A-A CH109 A-A CH1110 Center CH12,CH1311 C-C CH14
12 C-C CH1513 Center CH16._..t 14 Center CH06, CH07
Figure 3. 9973 Packaging Thermocouple Locations
Appendix 3.5 - 8 of 106
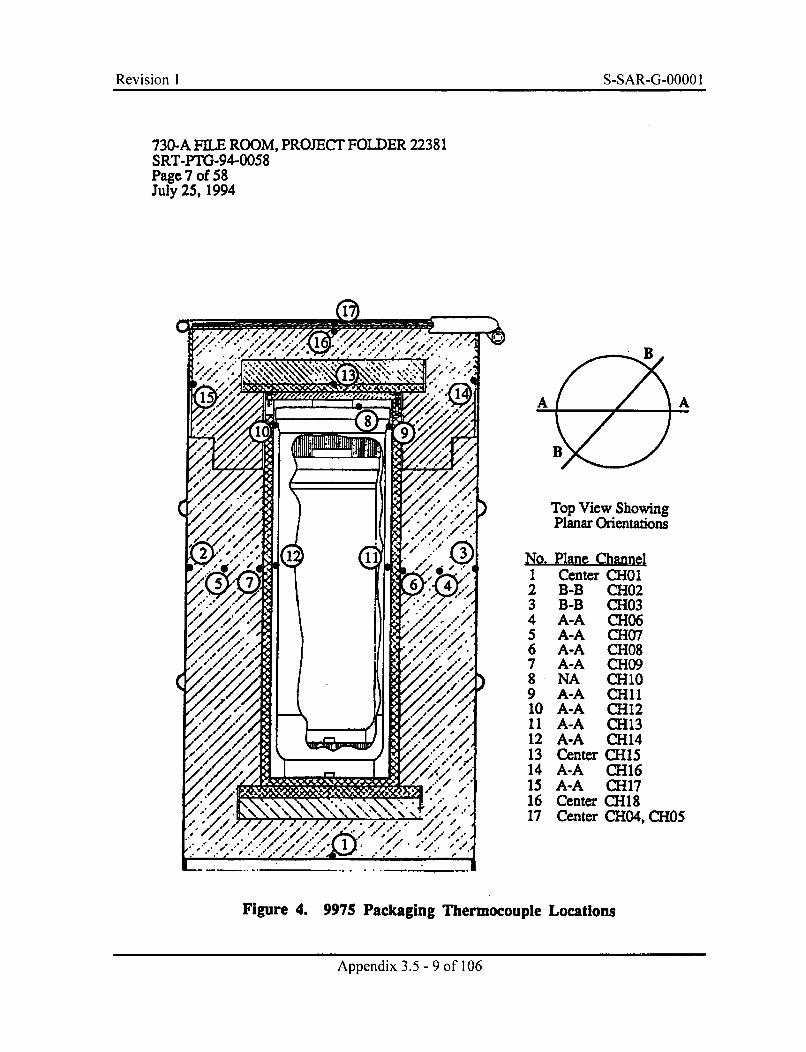
Revision I S-SAR-G-0000 IRevision 1 S-SAR-G-OOOO I
730-A FILE ROOM, PROJECT FOLDER 22381SRT-PTG-94-0058Page 7 of 58July 25, 1994
Top View ShowingPlanar Orientalions
No. Plane Channel1 Center CHO12 B-B CH023 B-B CH034 A-A CH065 A-A CH076 A-A CH087 A-A CH098 NA CH109 A-A CH1110 A-A CH1211 A-A CH1312 A-A CH1413 Center CH1514 A-A CH1615 A-A CH1716 Center CH1817 Center CH04, CH05
Figure 4. 9975 Packaging Thermocouple Locations
Appendix 3.5 -9 of 106
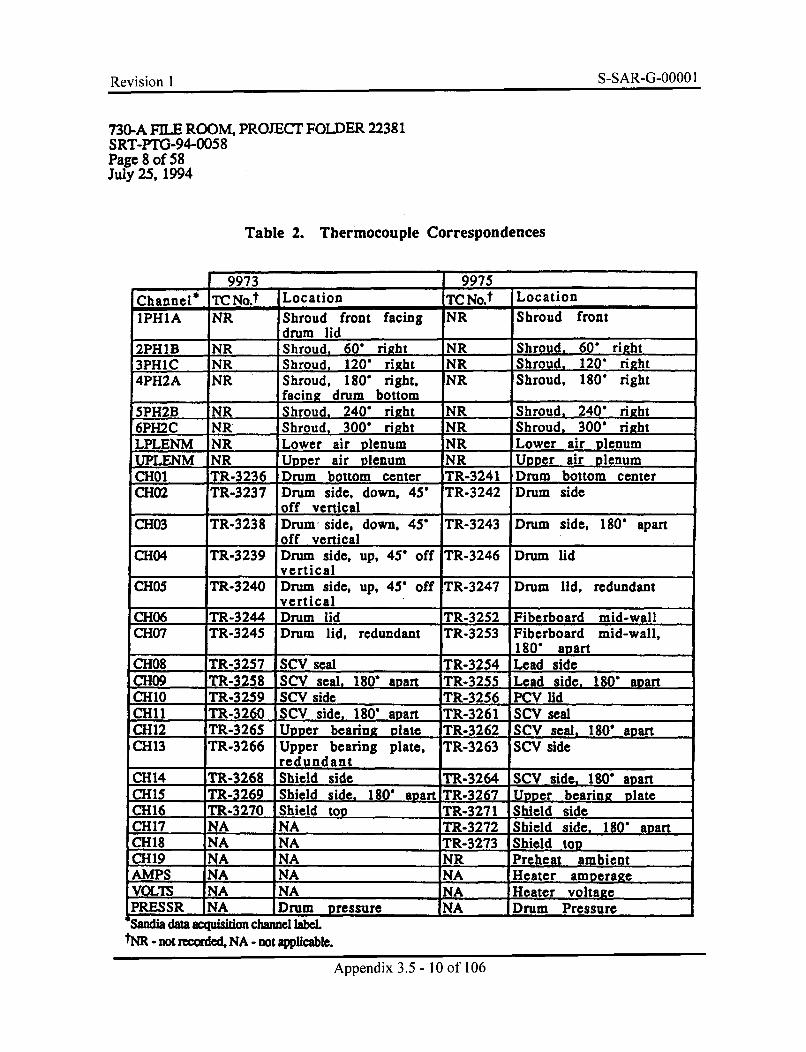
Revision I S-SAR-G-0000 IRevision I S-SAR-G-OOOO I
730-A FILE ROOM, PROJECT FOLDER 22381SRT-PTG-94-0058Page 8 of 58July 25, 1994
Table 2. Thermocouple Correspondences
9973 9975Channel* TC No.t Location TC No.t Location
IPHIA NR Shroud front facing NR Shroud frontdrum lid
2PH1B NR Shroud, 60' right NR Shroud. 60" right3PHIC NR Shroud, 120" right NR Shroud, 120' right4PH2A NR Shroud. 180" right. NR Shroud, 180" right
facing drum bottom5PH2B NR Shroud. 240' right NR Shroud, 240' right6PH-2C NR Shroud, 300' right NR Shroud, 300' rightLPLENM NR Lower air plenum NR Lower air plenumUPLENM NR Upper air plenum NR Upper air plenumCHOI TR-3236 Drum bottom center TR-3241 Drum bottom centerCH02 TR-3237 Drum side, down, 45' TR-3242 Drum side
off verticalCH03 TR-3238 Drum side, down. 45' TR-3243 Drum side, 180' apart
off verticalCH04 TR-3239 Drum side, up, 45' off TR-3246 Drum lid
verticalCH05 TR-3240 Drum side, up, 45' off TR-3247 Drum lid, redundant
verticalCH06 TR-3244 Drum lid TR-3252 Fiberboard mid-wallCH07 TR-3245 Drum lid, redundant TR-3253 Fiberboard mid-wall,
180' apartCH08 TR-3257 SCV seal TR-3254 Lead sideCH09 TR-3258 SCV seal, 180" apart TR-3255 Lead side. 180' apartCHIO TR-3259 SCV side TR-3256 PCV lidCH1l TR-3260 SCV side, 180' apart TR-3261 SCV sealCH12 TR-3265 Uvper bearing vlate TR-3262 SCV seal, 180' avartCH13 TR-3266 Upper bearing plate, TR-3263 SCV side
redundantCH14 TR-3268 Shield side TR-3264 SCV side, 180' apartCH15 TR-3269 Shield side, 180' apart TR-3267 Unper bearing vlateCH16 TR-3270 Shield top TR-3271 Shield sideCH17 NA NA TR-3272 Shield side, 180' apartCH18 NA NA TR-3273 Shield topCH19 NA NA NR Preheat ambientAMPS NA NA NA Heater amperageVOLTS NA NA NA Heater voltagePRESSR NA Drum pressure NA Drum Pressure•Sanoa came acquismon chm el el
tNR - not recorded. NA - not applicable.
Appendix 3.5 - 10 of 106
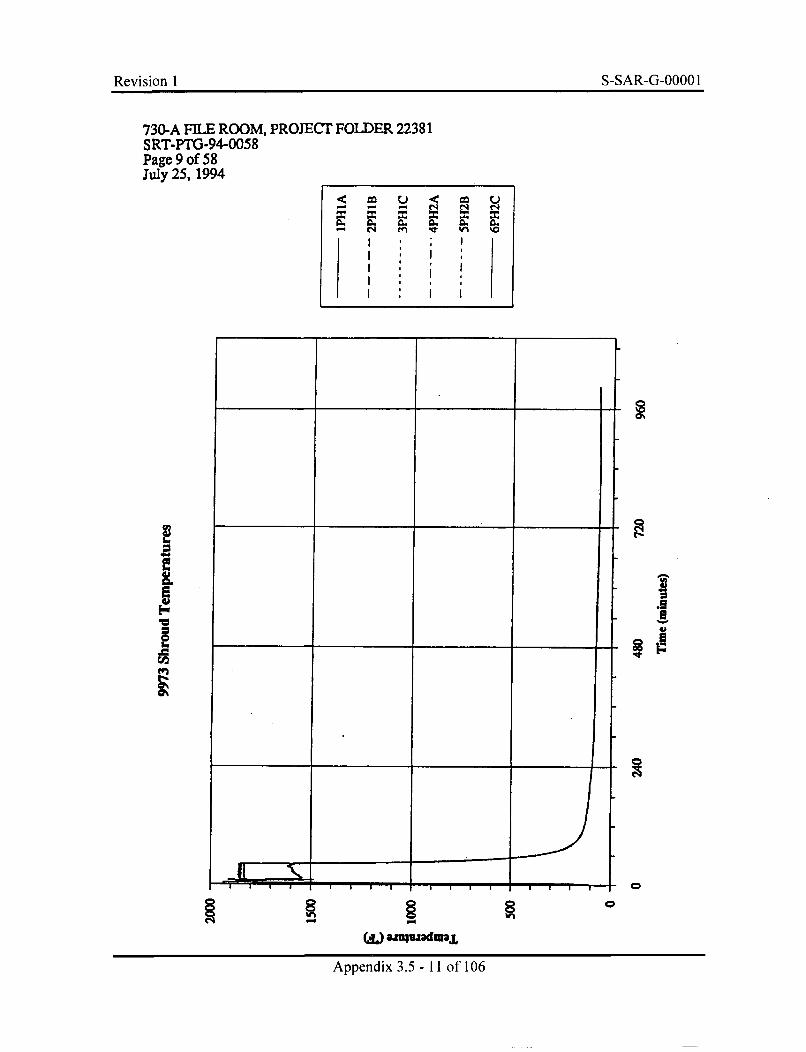
Revision I S-SAR-G-0000 IRevision 1 S-SAR-G-OOOO 1
730-A FILE ROOM, PROJECT FOLDER 22381SRT-PTG-94-0058Page 9 of 58July 25, 1994
go U 0 u
S~ en -i N N
S I I
.Cw
-~ I 11111
.1
45
I
C
&EUUJOdUL
0
Appendix 3.5 - 11 of 106
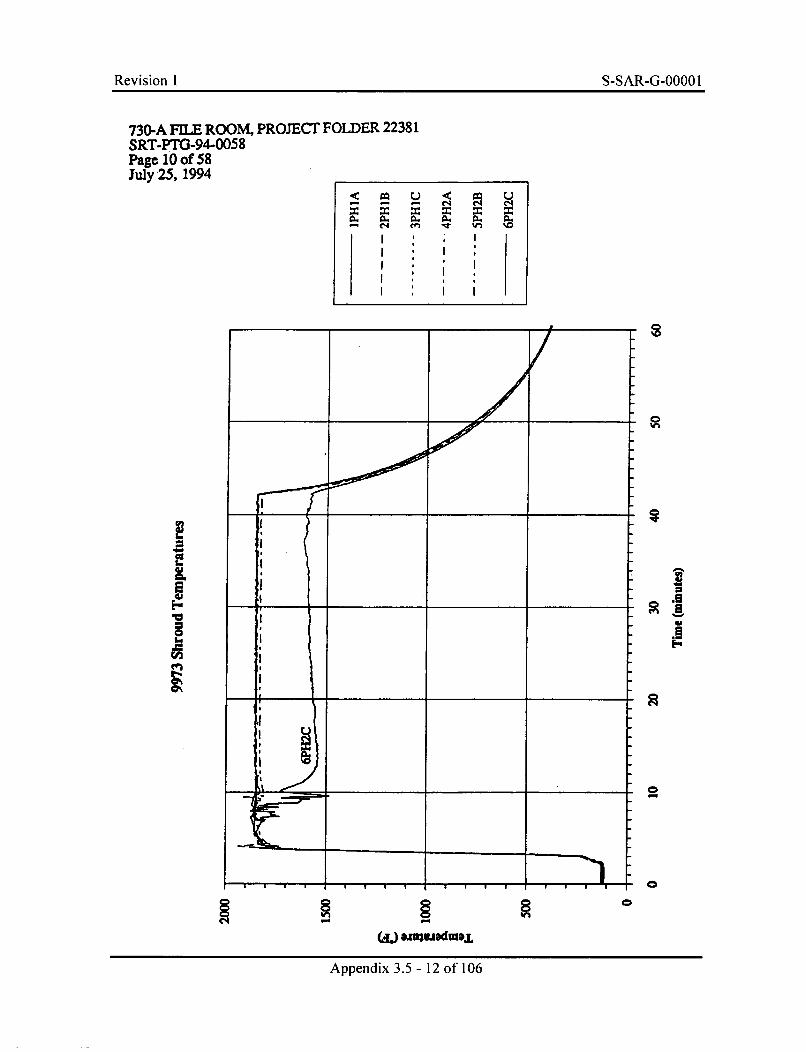
Revision 1 S-SAR-G-0000 1
730-A FILE ROOM, PROJECT FOLDER 22381SRT-PTG-94-0058Page 10 of 58July'25, 1994
0-- -4 en el"
I I
/ a'
o UtLl
1 9 0 0
Appendix 3.5 - 12 of 106
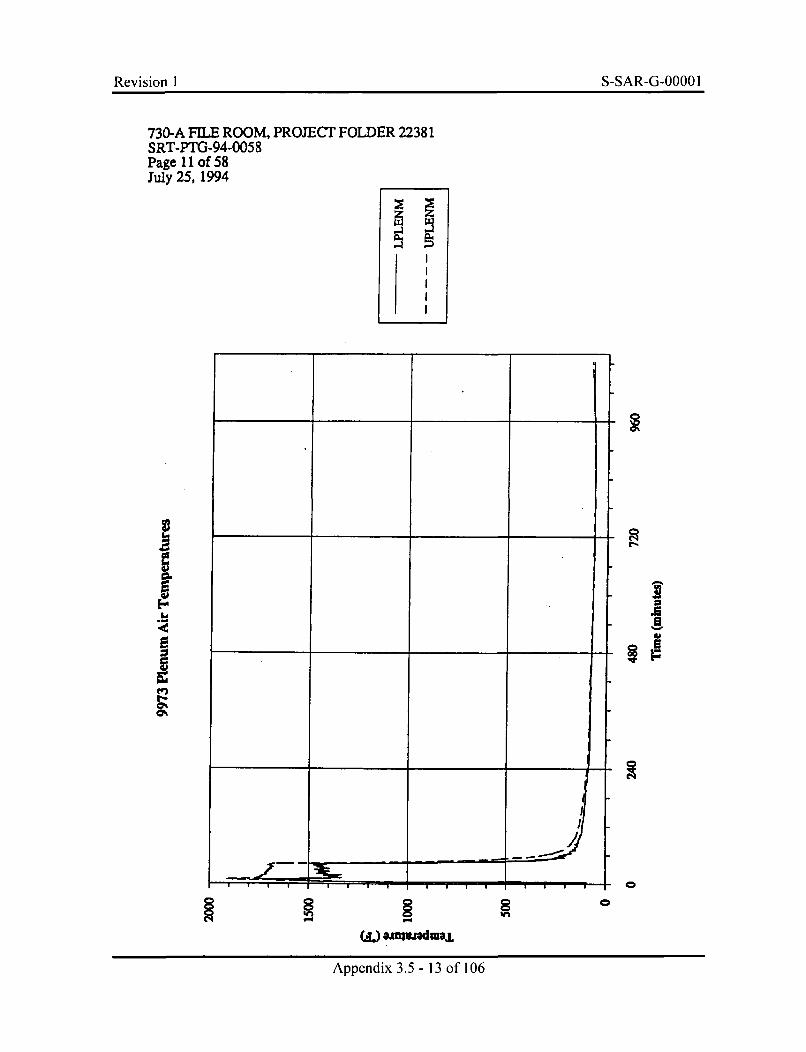
Revision I S-SAR-G-0000 IRevision 1 S-SAR-G-OOOO I
730-A FILE ROOM, PROJECT FOLDER 22381SRT-PTG-94-0058Page 11 of 58July 25, 1994
ii
V
GD
GD
ff~
0%
I/
E.;
C
(iL) .Jfl3WfldW3~L
0
Appendix 3.5 - 13 of 106
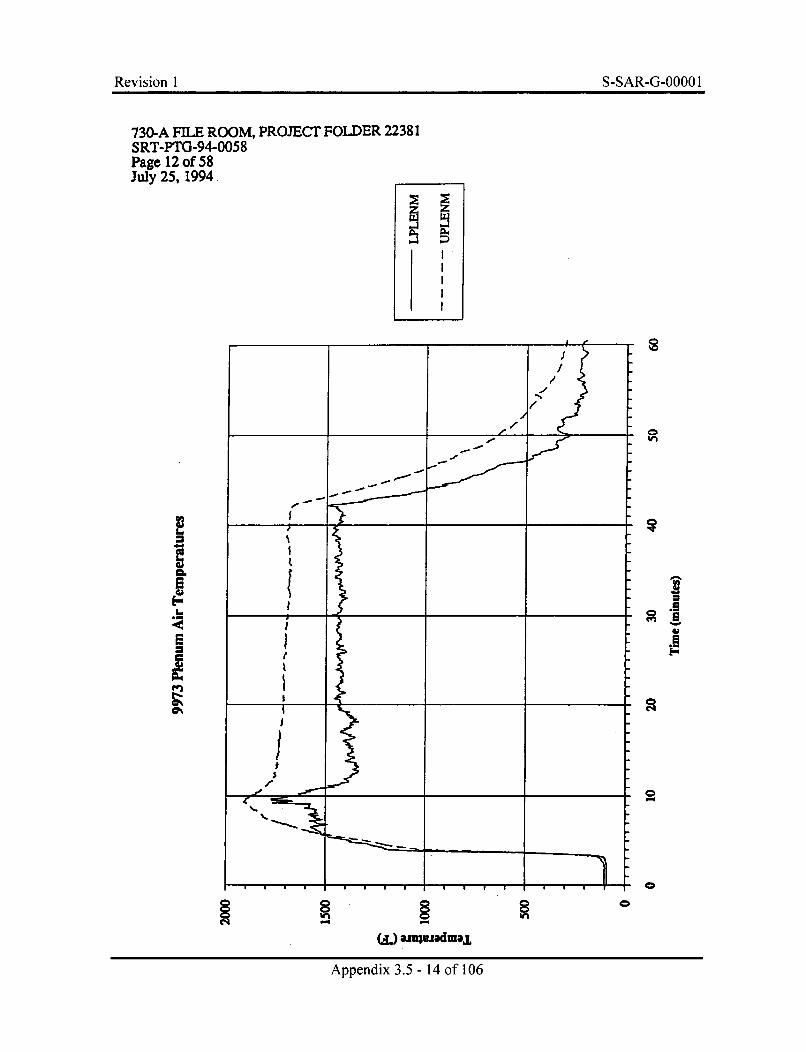
Revision I S-SAR-G-0000 IRevision 1 S-SAR-G-OOOO 1
730-A FILE ROOM, PROJECT FOLDER 22381SRT-PTG-94-0058Page 12 of 58July 25, 1994.
J:
< I
E
i- 0'A
.1
0
0
C
Appendix 3.5 - 14 of 106
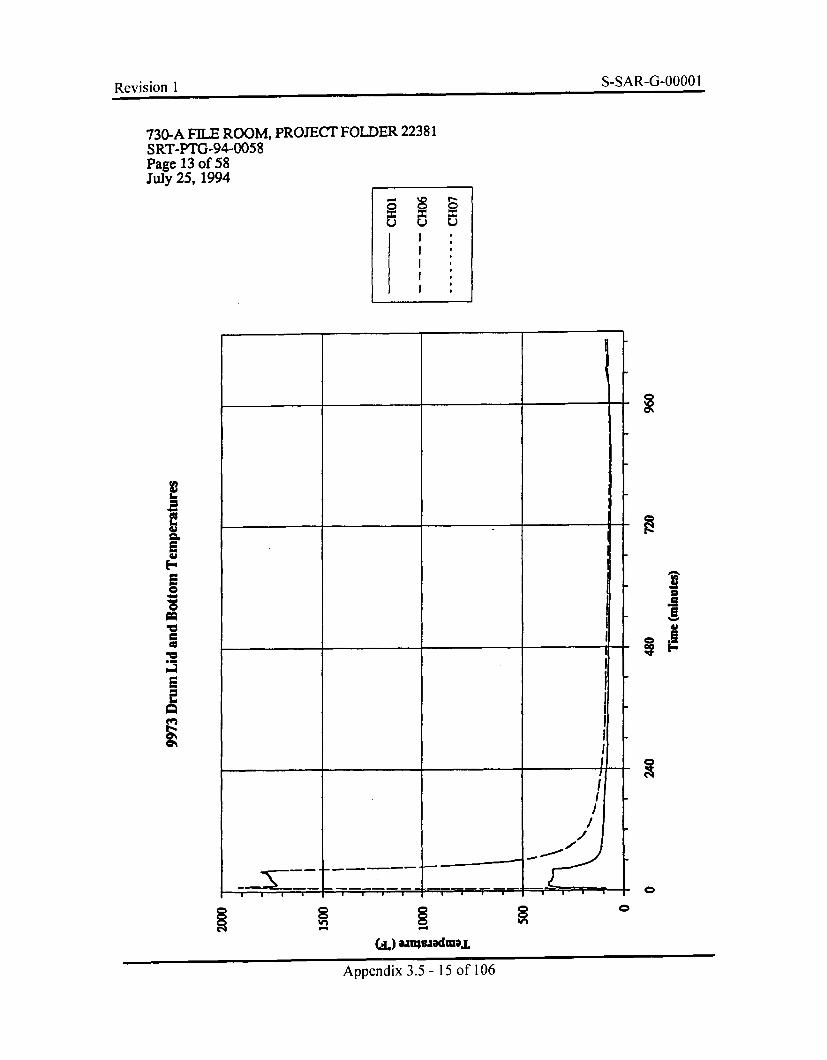
S-SAR-G-0000 ID, L,;;Lnn Ia~~;;n1SSRGOO
730-A FILE ROOM, PROJECT FOLDER 22381SRT-PTG-94-0058Page 13 of 58July 25, 1994
(~) U U
2
E
E
.1
U
.1Eu
C
0
(A.) anSuIadmaIL
Appendix 3.5 - 15 of 106
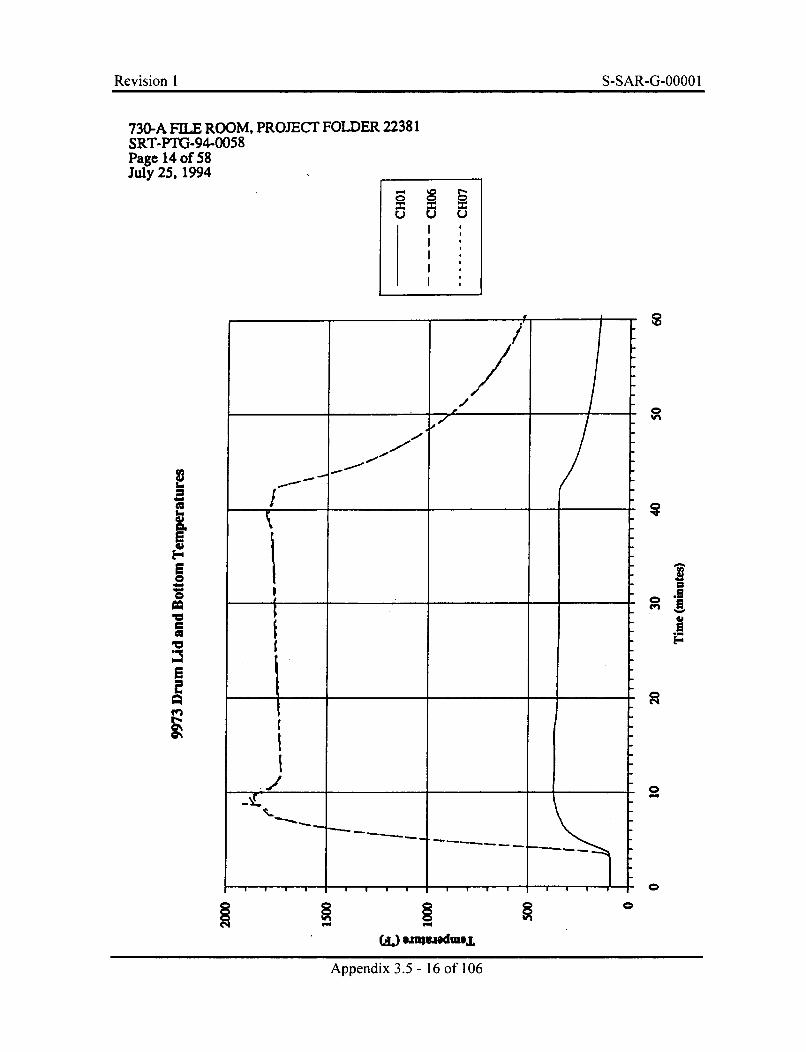
Revision 1 S-SAR-G-0000 1
730-A FILE ROOM, PROJECT FOLDER 22381SRT-PTG-94-0058Page 14 of 58July 25, 1994
Cen
'F
_____ ___
II
e I
F,
0
C
(AL) 3.5un-1ofj10
Appendix 3.5 - 16 of 106

Revision I S-SAR-G-00001Revision I S-SAR-G-OOOO 1
730-A FILE ROOM, PROJECT FOLDER 22381SRT-PTG-94-0058Page 15 of 58July 25, 1994
I I
I II
t'
0
(Ap ) 3.5u1maj 6
Appendix 3.5 - 17 of 106
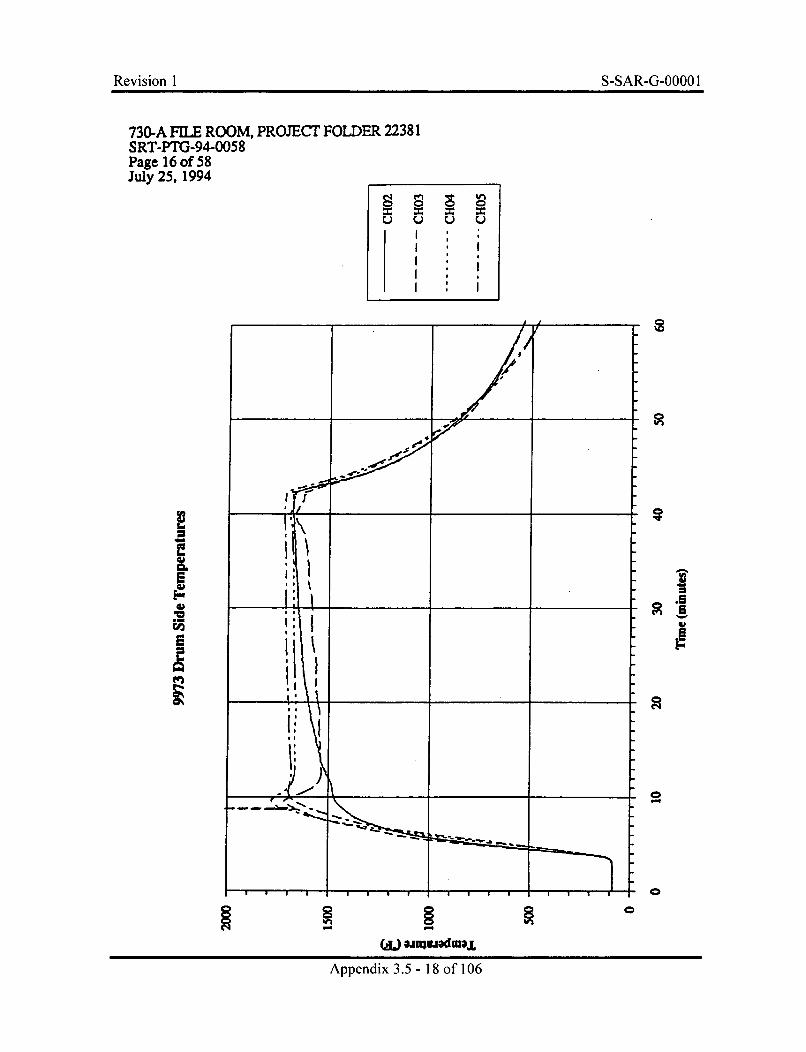
Revision 1 S-SAR-G-0000 1
730-A FIL.E ROOM, PROJECT FOLDER 22381SRT-PTG-94-0058Page 16 of 58July 25, 1994
z(~) U U U
Qtn
L-
UI
41aF
2
0
(L) .injuadmajL
0
Appendix 3.5 - 18 of 106
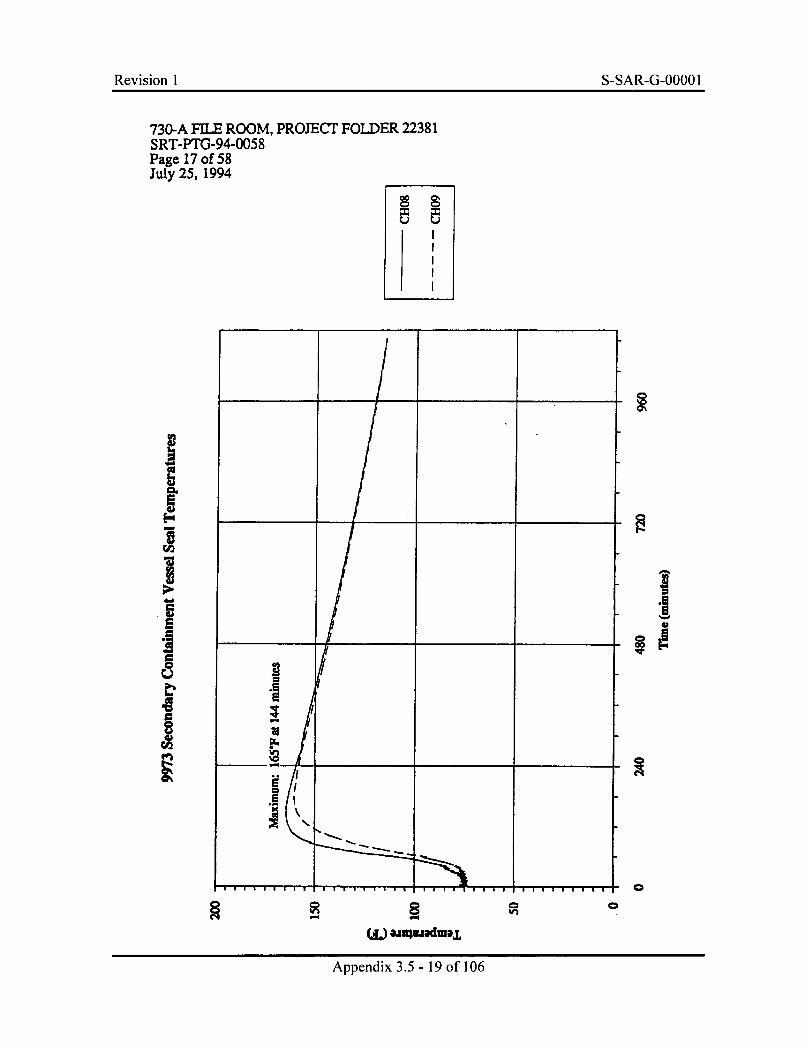
Revision I S-SAR-G-O000 I
730-A FILE ROOM, PROJECT FOLDER 22381SRT-PTG-94-0058Page 17 of 58July 25, 1994
00
UU
F.'*1U2
I!
UC
a-'U
II
-, I
EL.
I K~
0
03
Appedix .5 -19 o 10
Q
W*) MuuadmsjL
Appendix 3.5 - 19 of 106
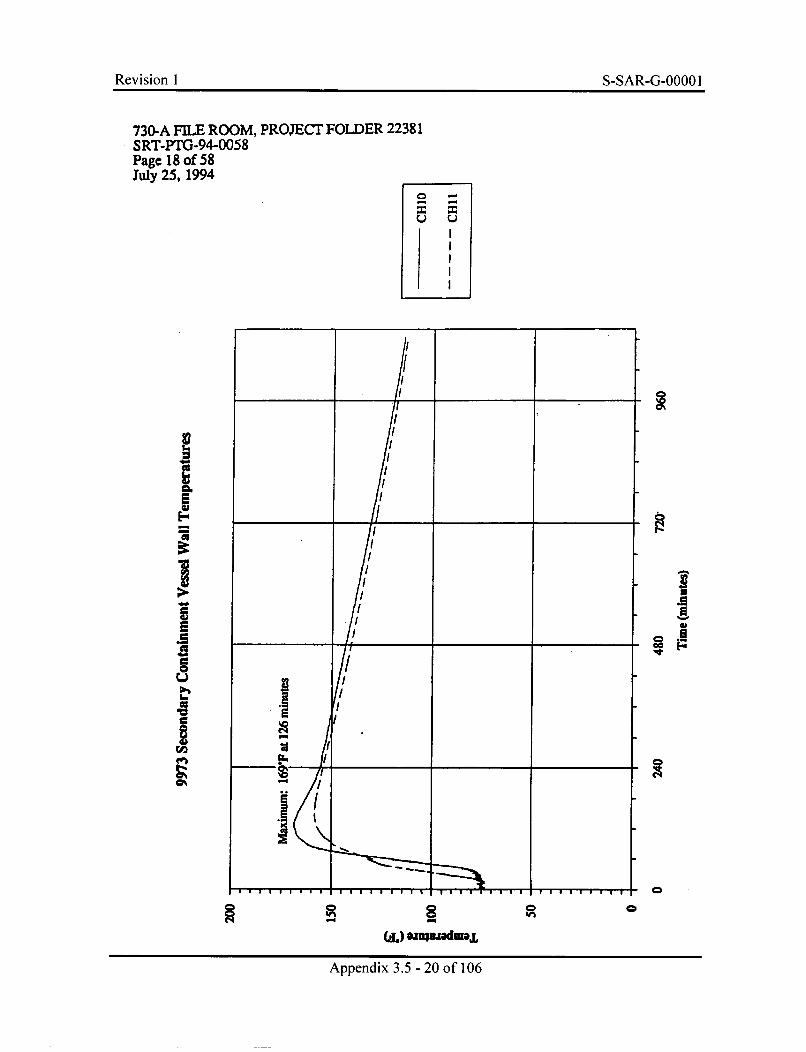
Revision I S-SAR-G-0000 IRevision 1 S-SAR-G-OOOO 1
730-A FILE ROOM, PROJECT FOLDER 22381SRT-PTG-94-0058Page 18 of 58July 25, 1994
0 -
2a1wGh
S
IUw5.5aUC
1w
=
E1CD@0
0
C5
(dwlml
lw,
0 0
(i.) omjfladEaji
Appendix 3.5 - 20 of 106
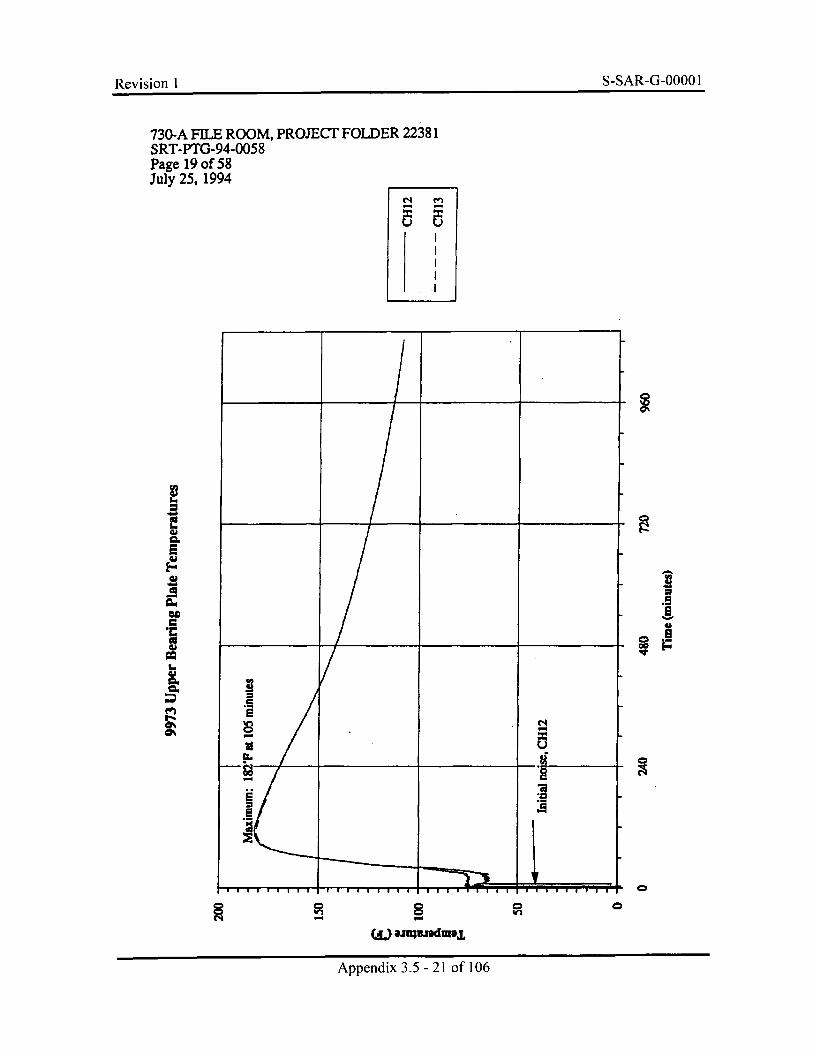
Revision I S-SAR-G-0000 I
730-A FILE ROOM, PROJECT FOLDER 22381SRT-PTG-94-0058Page 19 of 58July 25, 1994
=
0
0in 0
(s).numndwm*L
Appendix 3.5 - 21 of 106
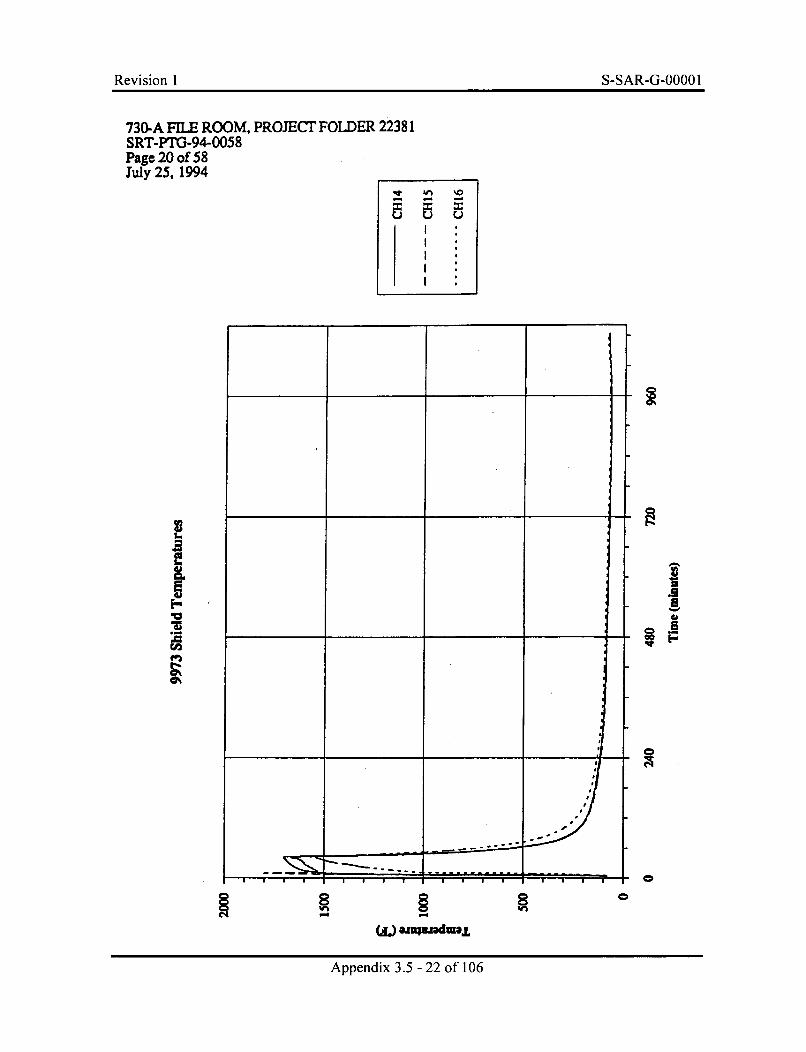
Revision I S-SAR-G-0000 1
730-A FILE ROOM, PROJECT FOLDER 22381SRT-PrG-94-0058Page 20 of 58July 25, 1994
'A %O
T U.9
0SF
0
0
(W. a.jm.rideL,
Appendix 3.5 - 22 of 106
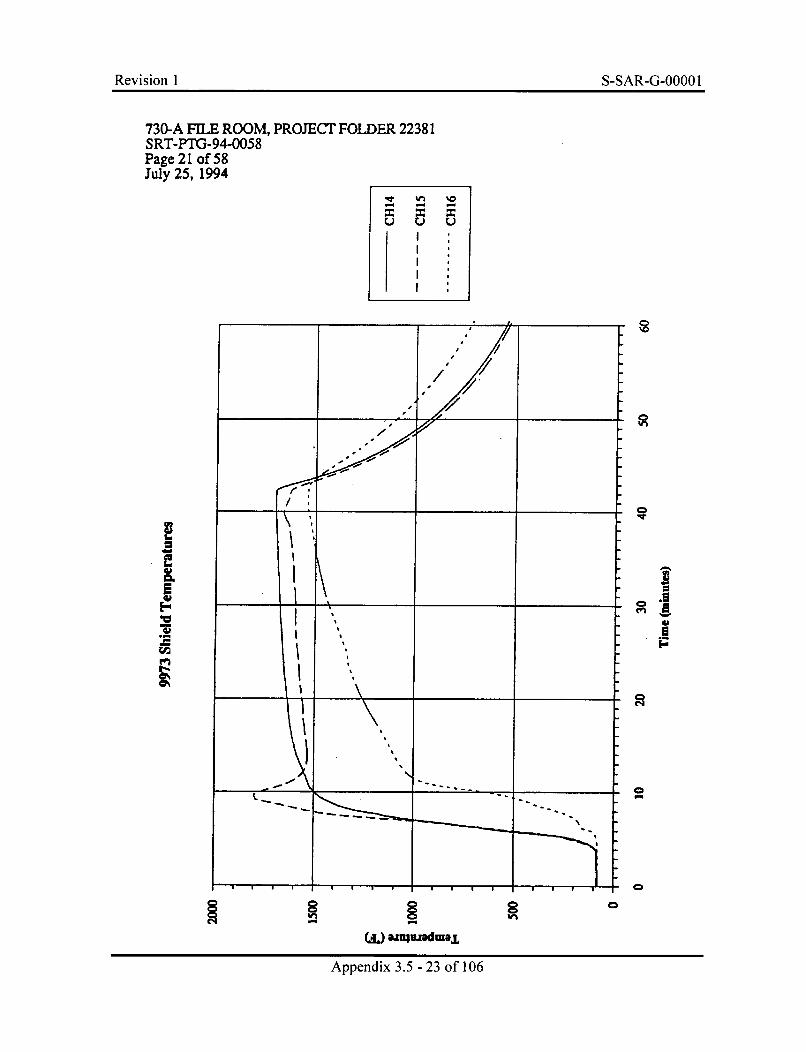
Revision 1 S-SAR-G-0000 1
730-A FILE ROOM, PROJECT FOLDER 22381SRT-PTG3-94-0058Page 21 of 58July 25, 1994
U CL) U
I ,
,/ //
, ,//
/ ,i/.0
'I
L.0Gn
'U' i i i i i i
LAp ) 35m- 3moJ1
Appendix 3.5 - 23 of 106
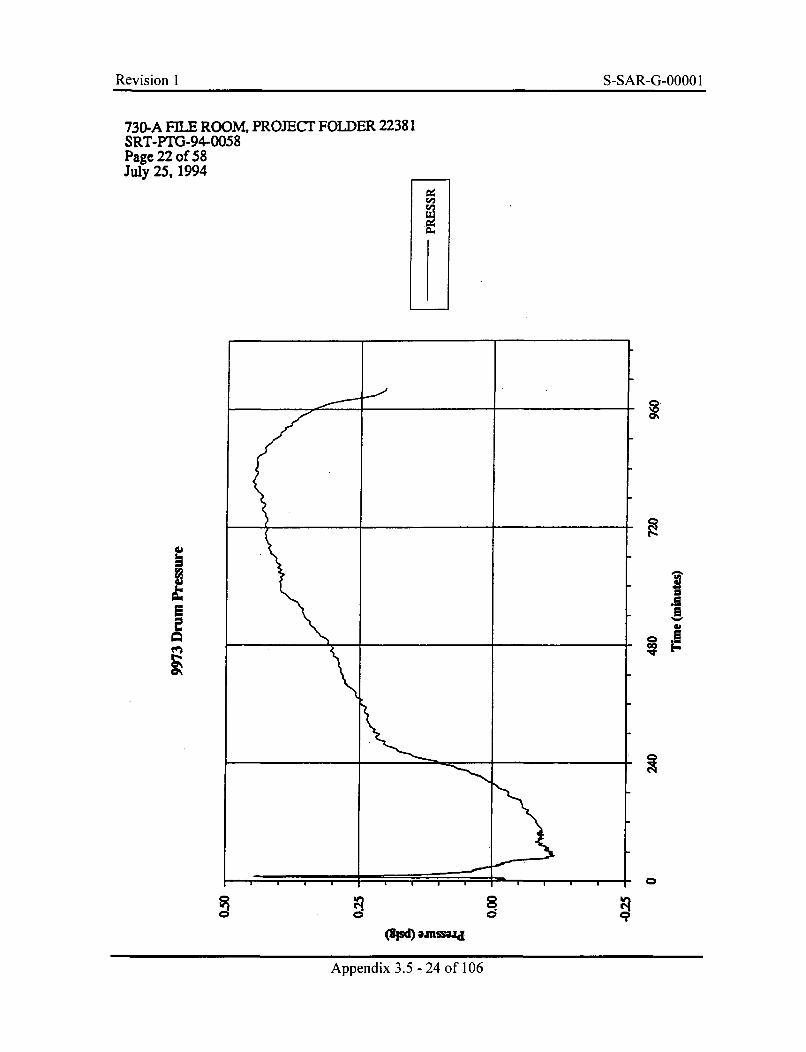
Revision 1 S-SAR-G-0000 1
730-A FILE ROOM, PROJECT FOLDER 22381SRT-PTG-94-0058Page 22 of 58July 25, 1994
U9
II
• •1$E
! i i | i - i i
(Sjsd .Jussu
Appendix 3.5 - 24 of 106
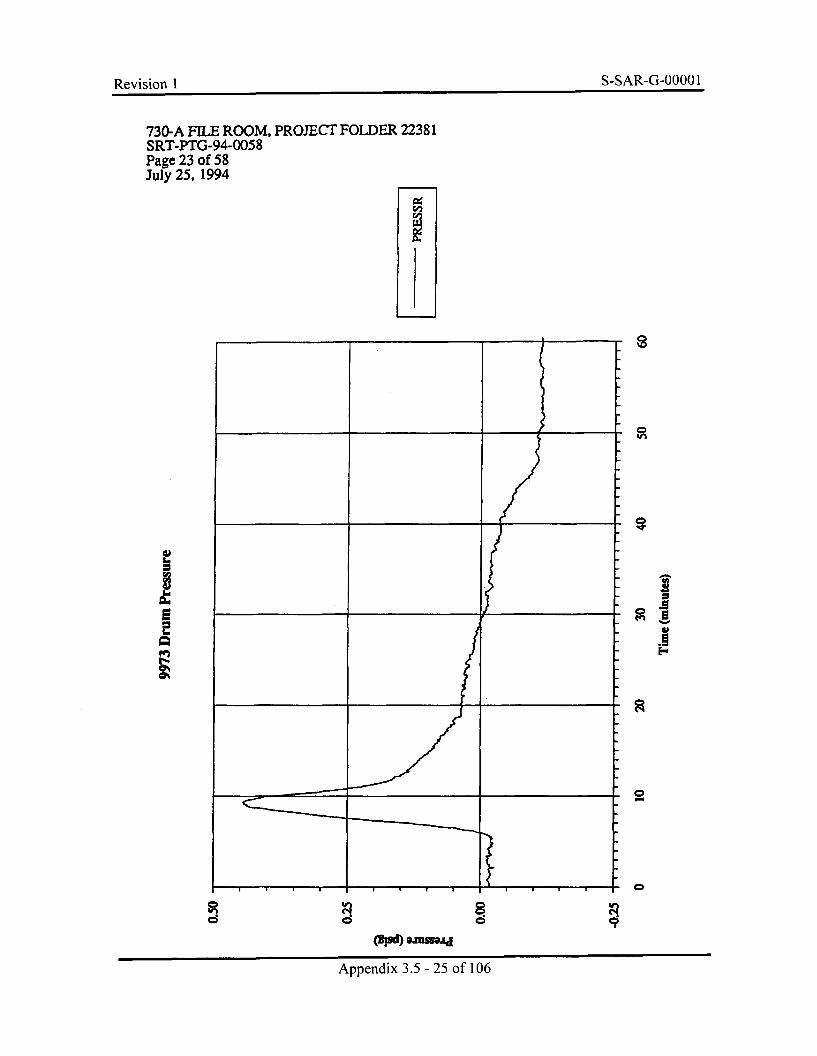
Revision 1 S-SAR-G-0000 IRevision I SSRGOO
730-A FILE ROOM, PROJECT FOLDER 22381SRT-PTG-94-0058Page 23 of 58July 25, 1994
I
R
6
.1
.1
0
D
(Roed) 3.5-om
Appendix 3.5 - 25 of 106
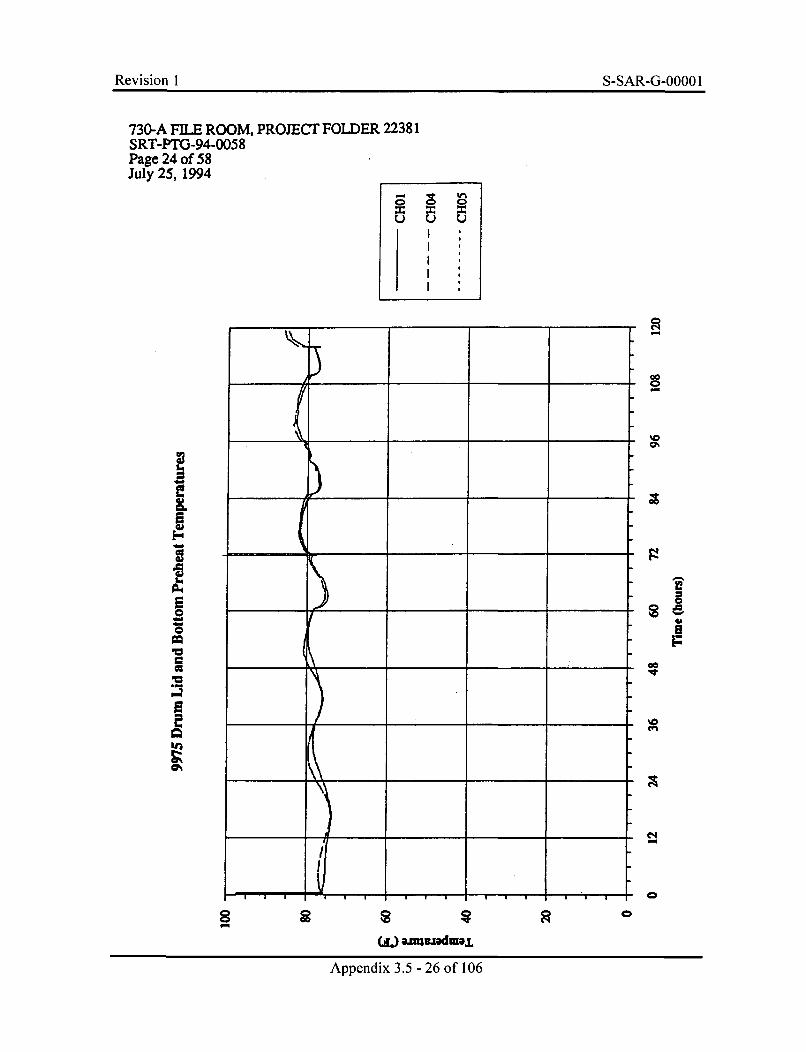
Revision 1 S-SAR-G-0000 1
730-A FILE ROOM, PROJECT FOLDER 22381SRT-PTG-94-0058Page 24 of 58July 25, 1994
cJU U
00
Lu
.2
IEC
C
.5
'5
In
a.'
0
a
00
e1
C
0
()mme a.,,dmajL
Appendix 3.5 - 26 of 106

Revision I S-SAR-G-0000 I
730-A FILE ROOM, PROJECT FOLDER 22381SRT-PTG-94-0058Page 25 of 58July 25, 1994
rU U
411
IL
Ai
I ______ [i ______ ______ I
(a..) muuniaL,
Appendix 3.5 - 27 of 106
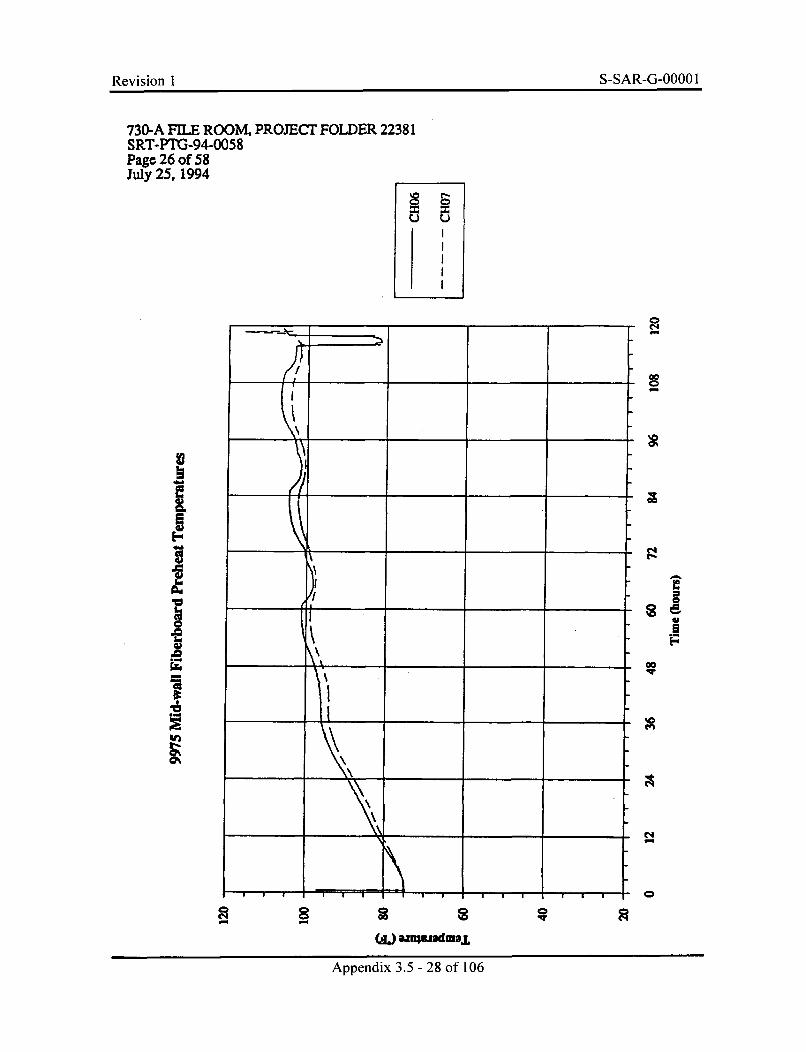
Revision I S-SAR-G-O000 I
730-A FILE ROOM, PROJECT FOLDER 22381SRT-MIX3-94-0058Page 26 of 58July 25, 1994
u u
0
000
5
Imu
.1
t-.
EDaF
00.q.
0
(..) e.numadmal
Appendix 3.5 - 28 of 106
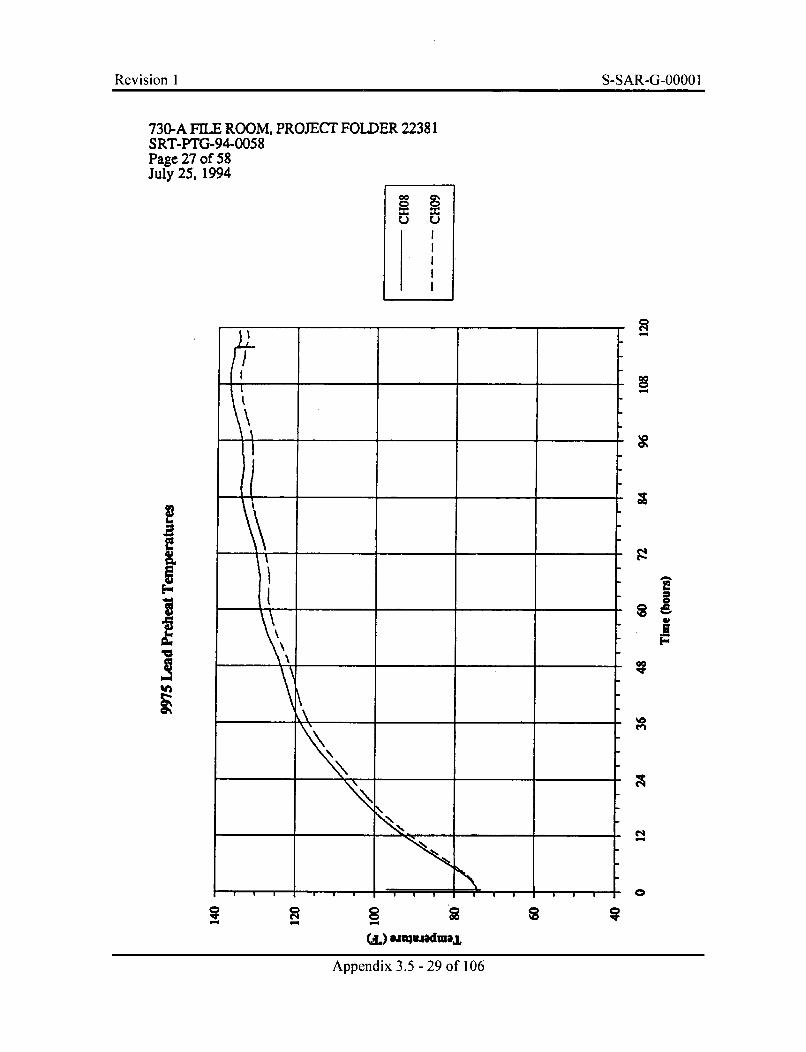
Revision I S-SAR-G-0000 I
730-A FILE ROOM, PROJECT FOLDER 22381SRT-PTG-94-0058Page 27 of 58July 25, 1994
c~)
AC
.1
(.
Appendix 3.5 - 29 of 106
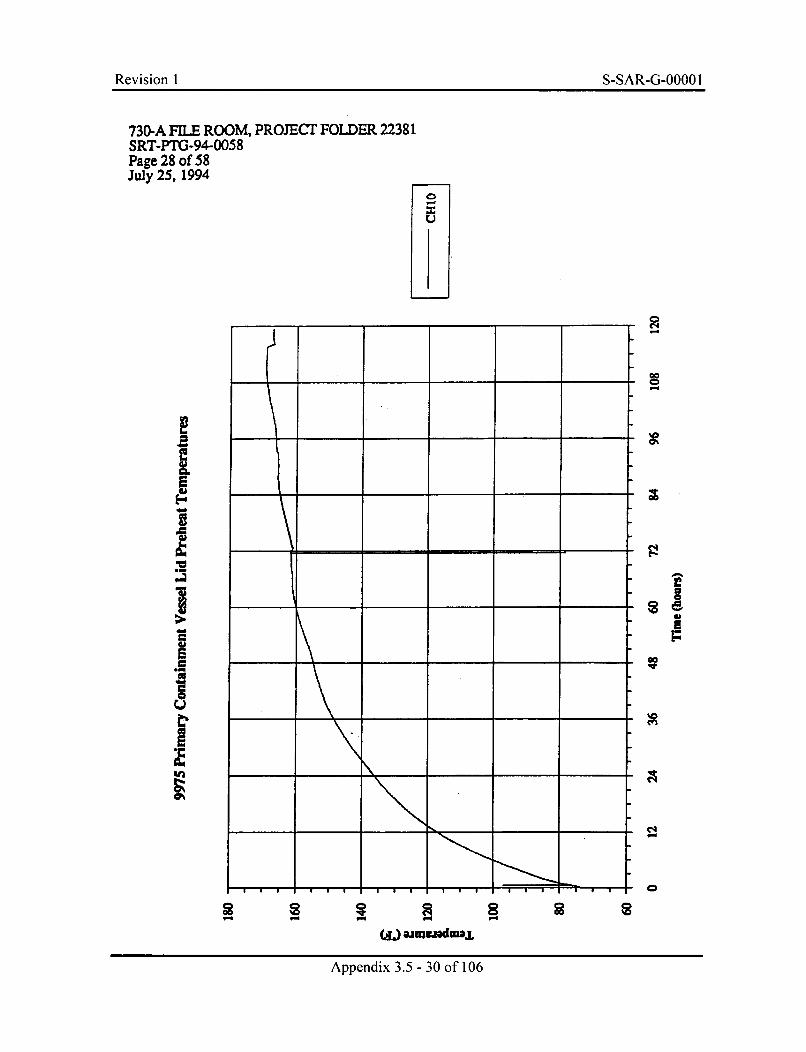
Revision I S-SAR-G-0000 IRevision 1 S-SAR-G-OOO0 I
730-A FILE ROOM, PROJECT FOLDER 22381SRT-PTG-94-0058Page 28 of 58July 25, 1994
0
0
0
E
4
U
61UF
@0
%0
(.4
C-
WQ ajt~i-dmaj,
Appendix 3.5 - 30 of 106
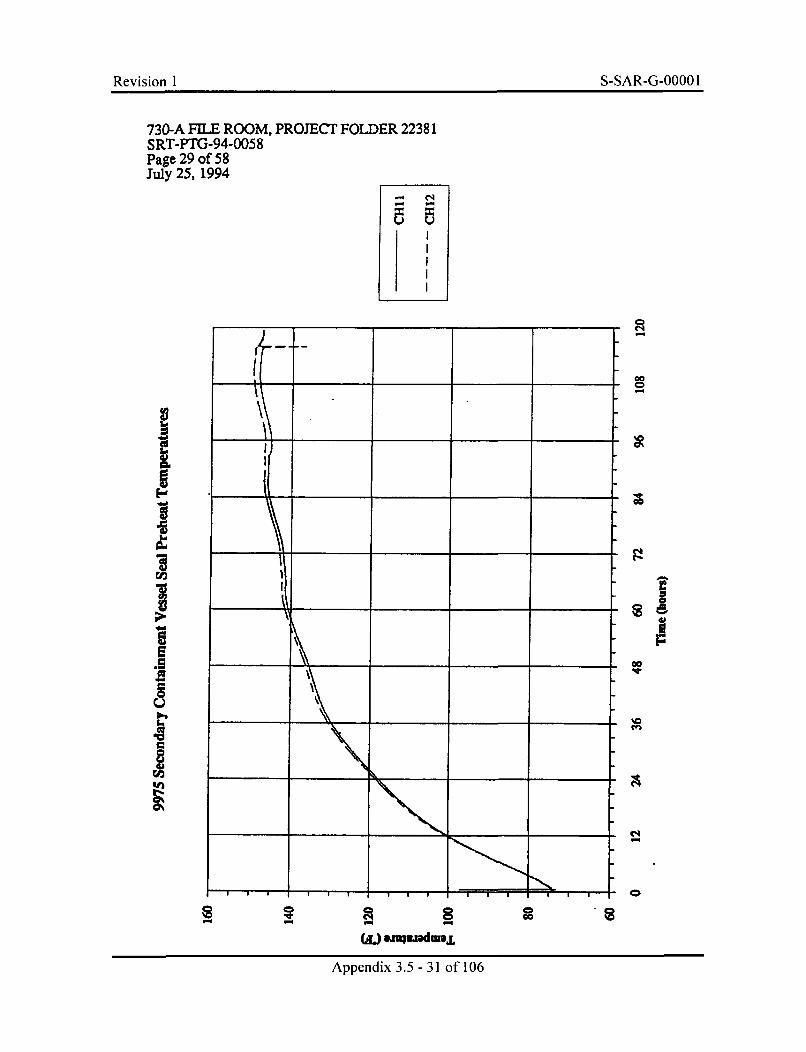
Revision I S-SAR-G-0000 IRevision 1 S-SAR-G-OOOO 1
730-A FILE ROOM, PROJECT FOLDER 22381SRT-PTG-94-0058Page 29 of 58July 25, 1994
- e~
00
Q.
2
1
IaE
a
.1
(.
Appendix 3.5 - 31 of 106
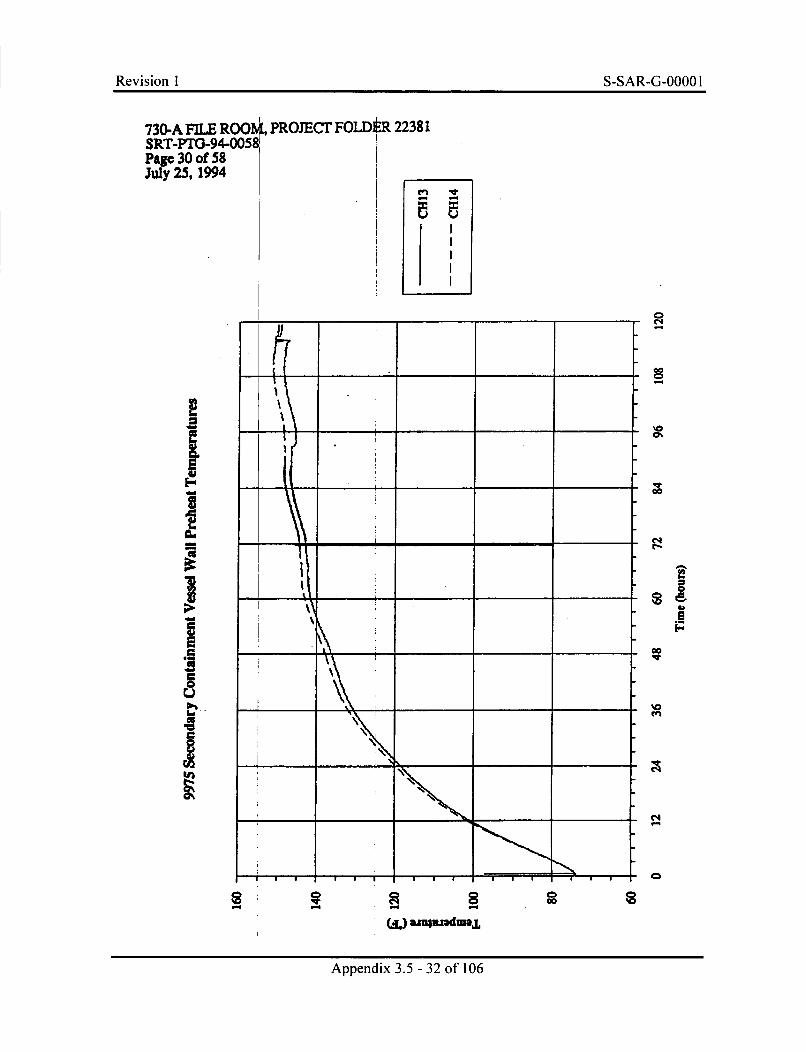
Revision I S-SAR-G-00001
0eq
000
'00~
ClI.-
UC
41UF
00
0
aGo
W wr4ujadmajL
Appendix 3.5 - 32 of 106
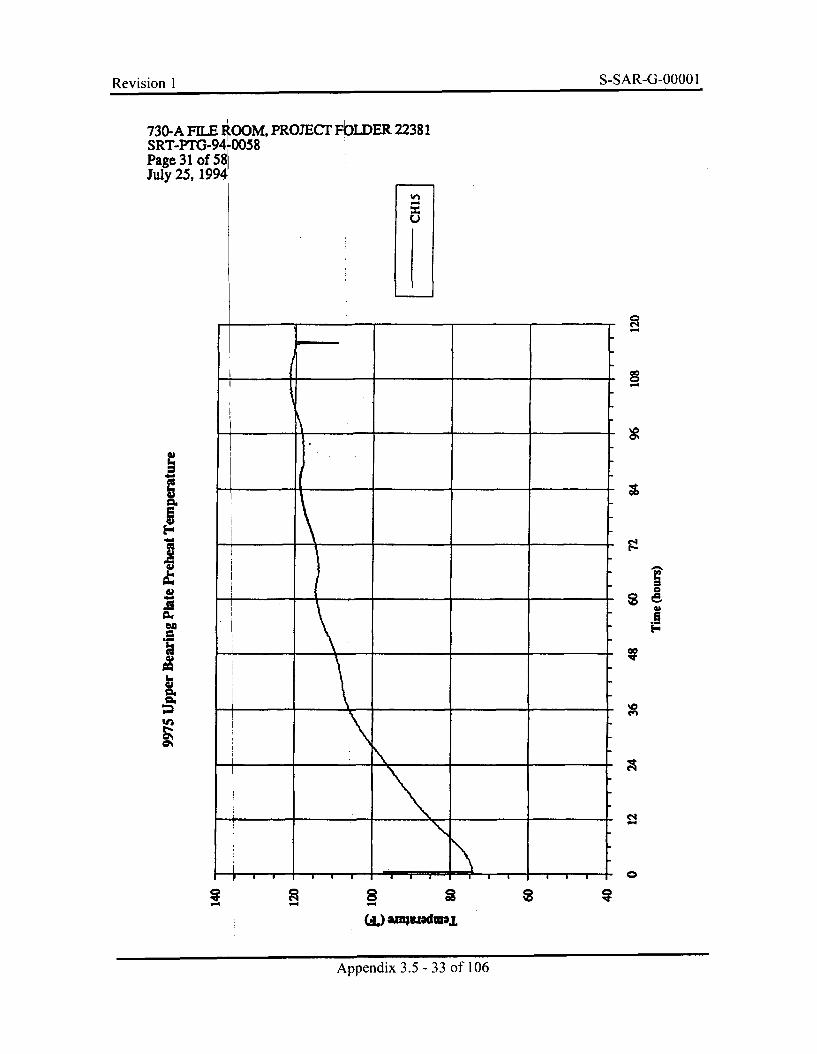
Revision 1 S-SAR-G-0000 1Revision I
PROJECT FbLDER 22381
________ _______ ________ C_____ * c'l
UC
IF
- -~ ~~~1~~1~* 0
(A.) aEuhw.iadui.L
Appendix 3.5 - 33 of 106
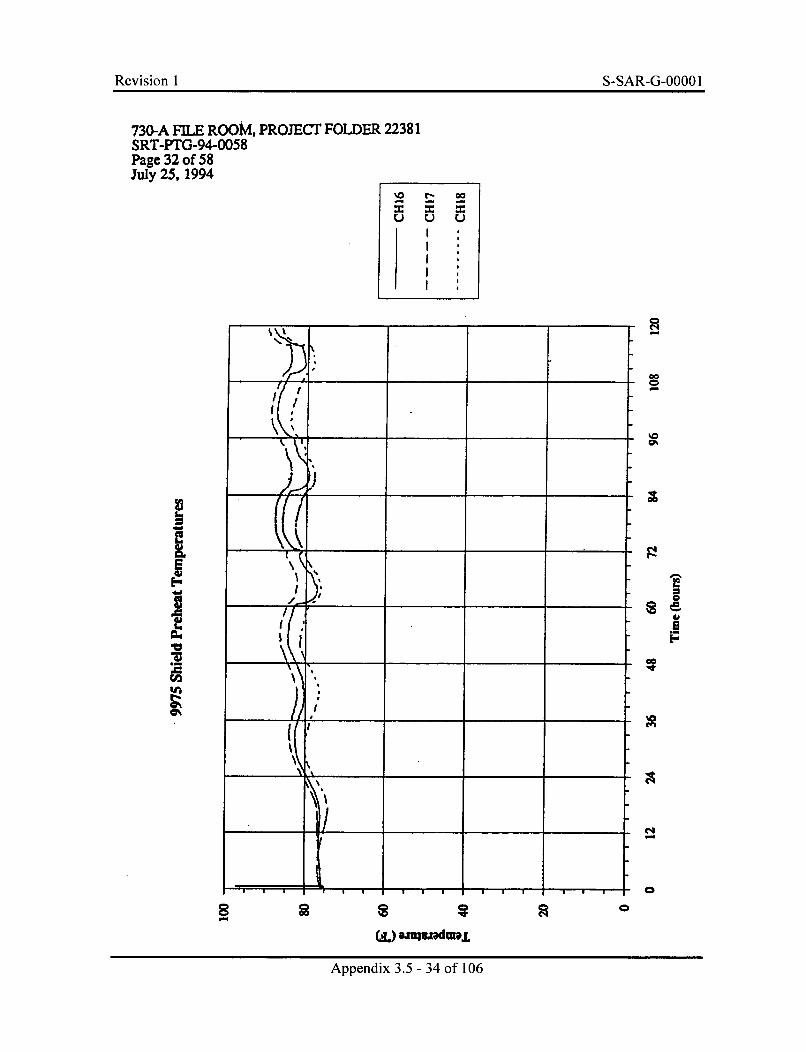
Revision I S-SAR-G-0000 IRevision 1 S-SAR-G-OOOO I
730-A FILE ROOM, PROJECT FOLDER 22381SRT-PTG-94-0058Page 32 of 58July 25, 1994
'0 r- u
a
00
A
tU
Si
No
0
0
A A.) 3.5z-34ofh0
Appendix 3.5 - 34 of 106
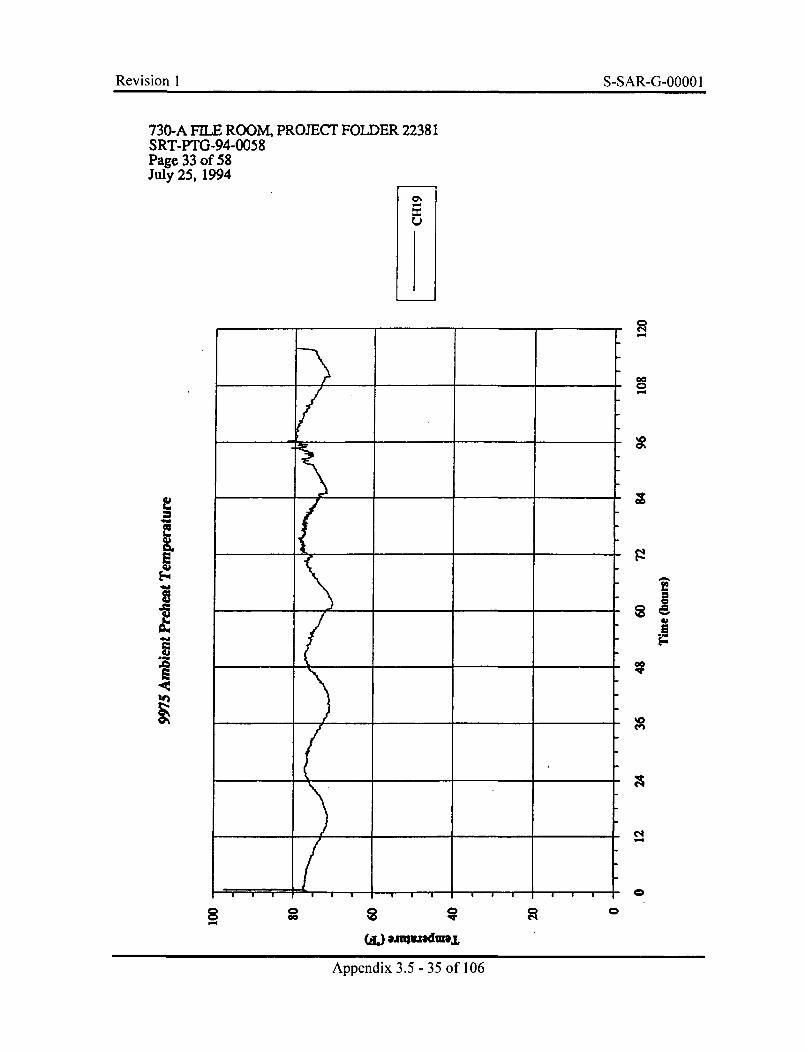
Revision 1 S-SAR-G-0000 1
730-A FILE ROOM, PROJECT FOLDER 22381SRT-PTG-94-0058Page 33 of 58July 25, 1994
L)
cc
Lw
1~
C.S
I
C
S
UF
%'
0
Apedx35 5o 0
0
Wa. umviwdma.L
Appendix 3.5 - 35 of 106
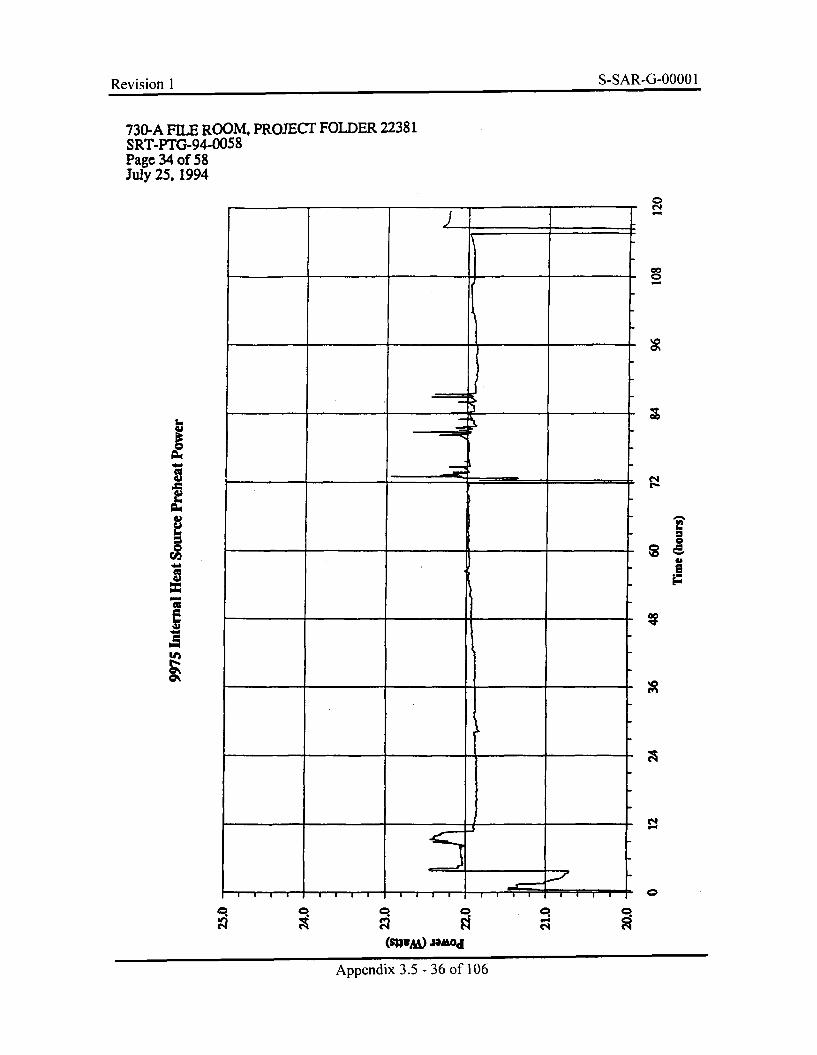
Revision 1 S-SAR-G-0000 1
730-A FILE ROOMK PROJECr FOLDER 22381SRT-PTG-94-0058Page 34 of 58July 25, 1994
00
k___
Scc
.C0
C4
j 0%
i ' I I I Ii ' '
Appendix 3.5 - 36 of 106
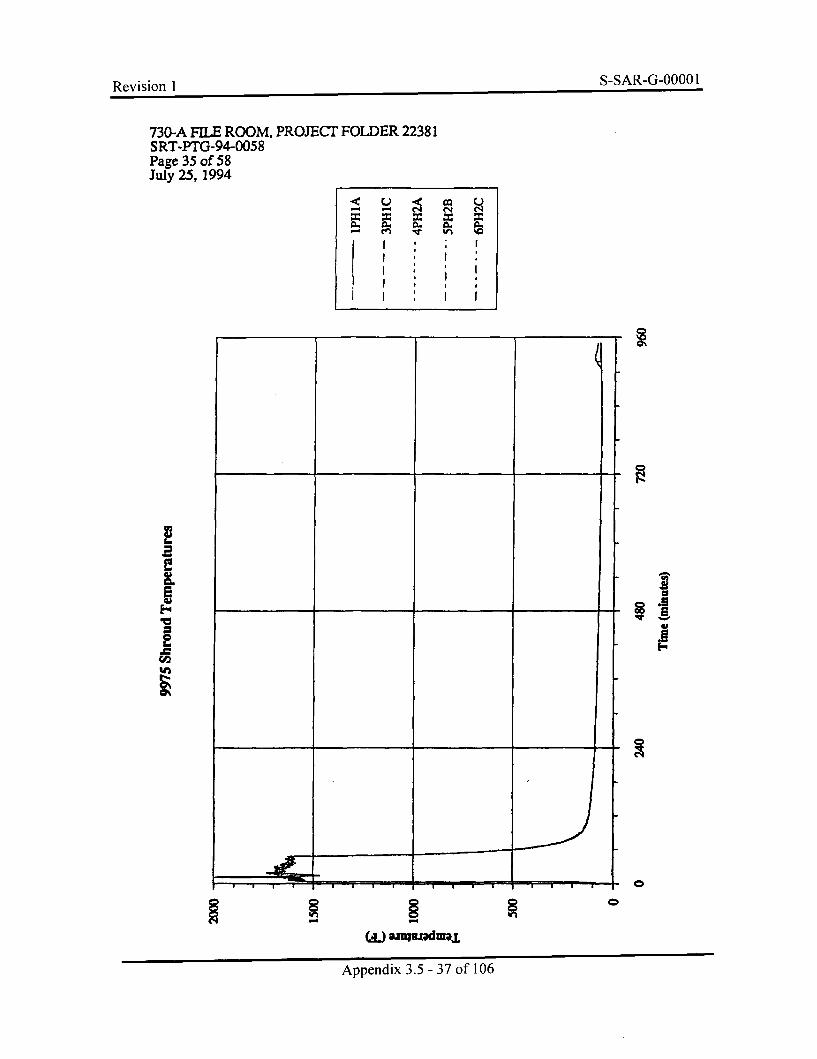
Revision I S-SAR-G-0000 1
730-A FILE ROOM, PROJECT FOLDER 22381SRT-PTG-94-0058Page 35 of 58July 25, 1994
I A.
2 U
4'
.1I-u
5
I R §0
W 3u.-7dm fL
Appendix 3.5 - 37 of 106

R Pvi in 1 S-SAR-G-00001Revision I
730-A FILE ROOMK PROJECT FOLDER 22381SRT-PTG-94-0058Page 36 of 58July 25, 1994
.~ U *4: ~ U
- ~ ,t It~h '0
I Ii i
I-U
0
C
.9
F
2
0
C
Appendix 3.5 - 38 of 106
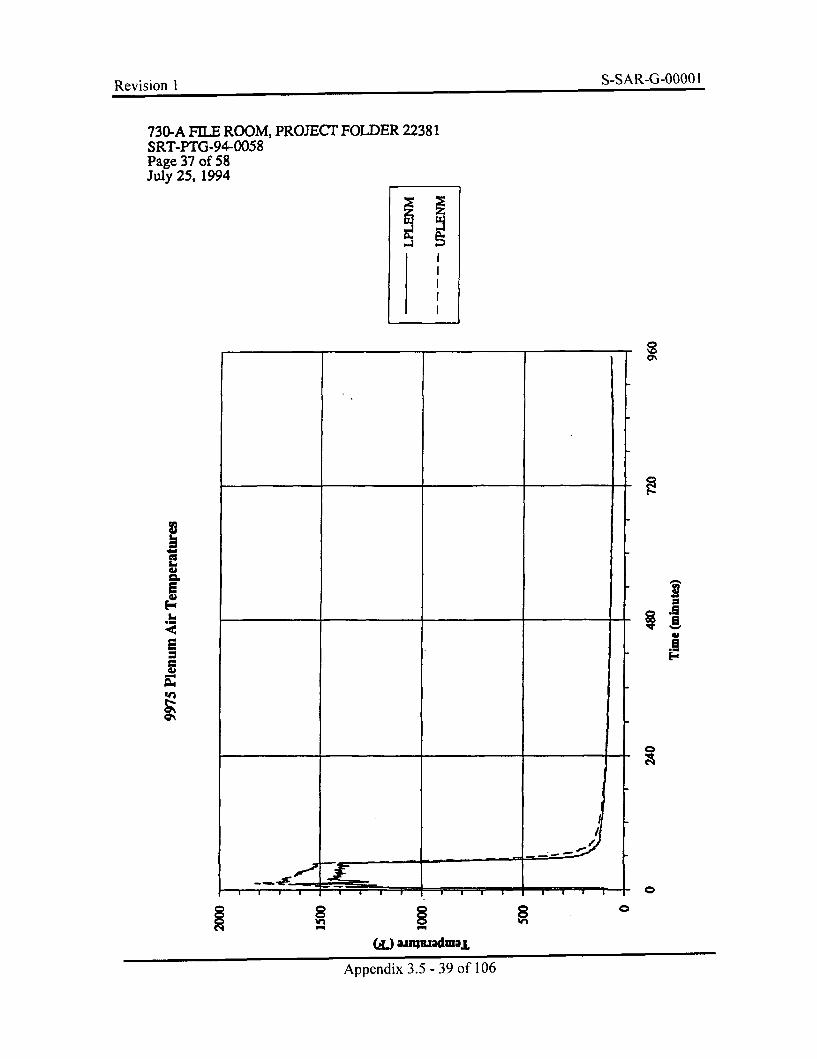
o A n P hhnfi 1Revision I z,-Z5Ar-%j-VuuvU
730-A FILE ROOM, PROJECT FOLDER 22381SRT-PTG-94-0058Page 37 of 58July 25, 1994
CL.
I I I I ' I I I I I I I
0 0 0 0 0
(L).i wadmndau
Appendix 3.5 - 39 of 106

Revision 1 S-SAR-G-0000 1
730-A FILE ROOM, PROJECr FOLDER 22381SRT-PTG-94-0058Page 38 of 58July 25, 1994
ii
CD
~~%
/
0 0 0 0 0
Wix 3.5 m4admo10
Appendix 3.5 - 40 of 106
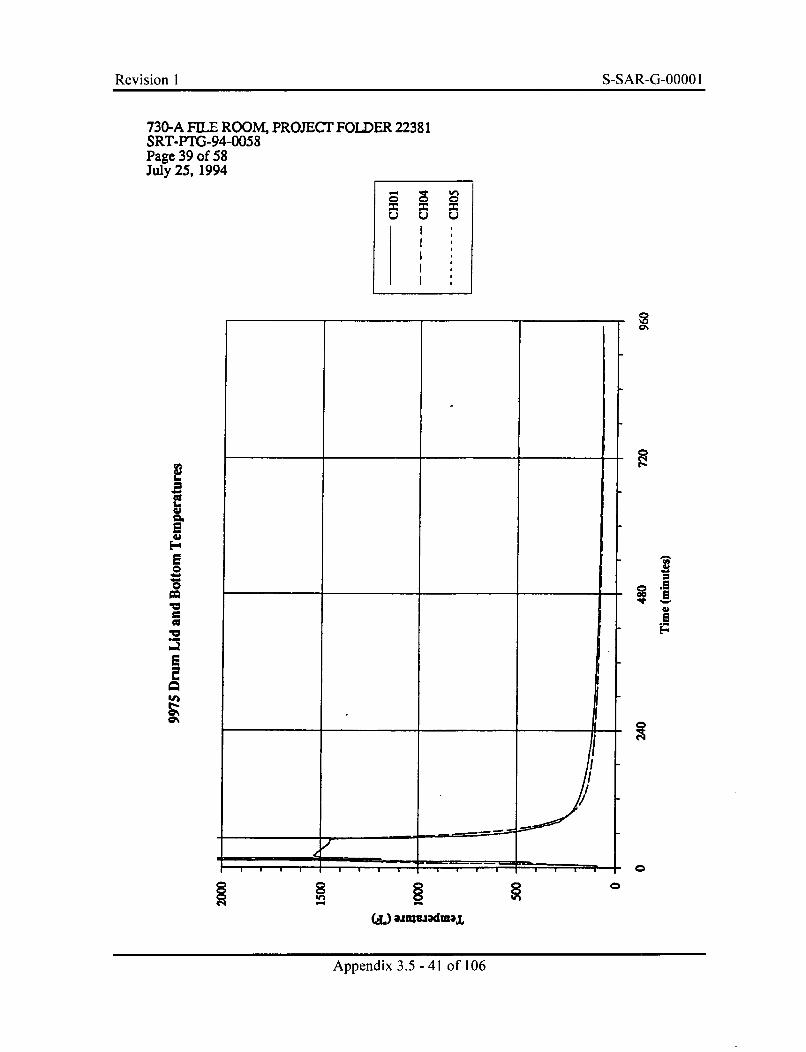
Revision I S-SAR-G-0000 IRevision I S-SAR-G-OOOO 1
730-A FILE ROOMK PROJECT FOLDER 22381SRT-PTG-94-0058Page 39 of 58July 25, 1994
u u u
6
IC
0
VU
V
0%
a0aF
0
0
(L) vin3juadmaj
Appendix 3.5 - 41 of 106
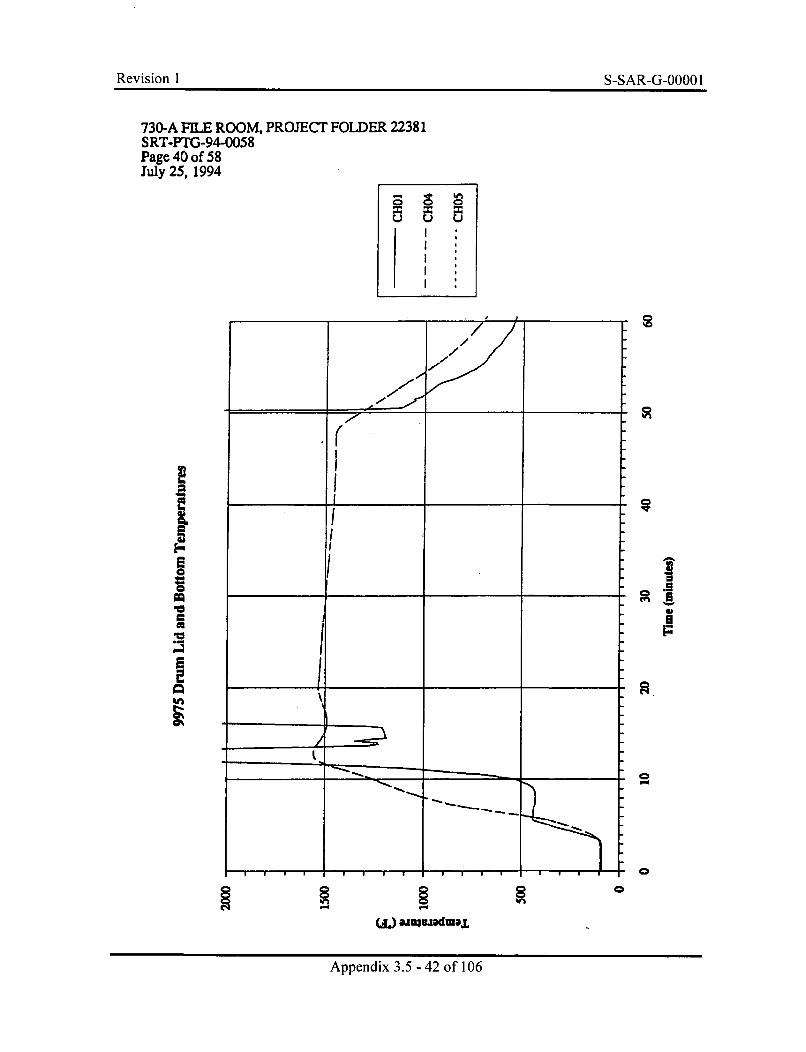
Revision I S-SAR-G-0000 IRevision I S-SAR-G-OOOO 1
730-A FILE ROOM, PROJECT FOLDER 22381SRT-PTG-94-0058Page 40 of 58July 25, 1994
u u u
0
CQ
ViA-
C
0
0
(,n) 3j5 4uodf1L
Appendix 3.5 -42 of 106
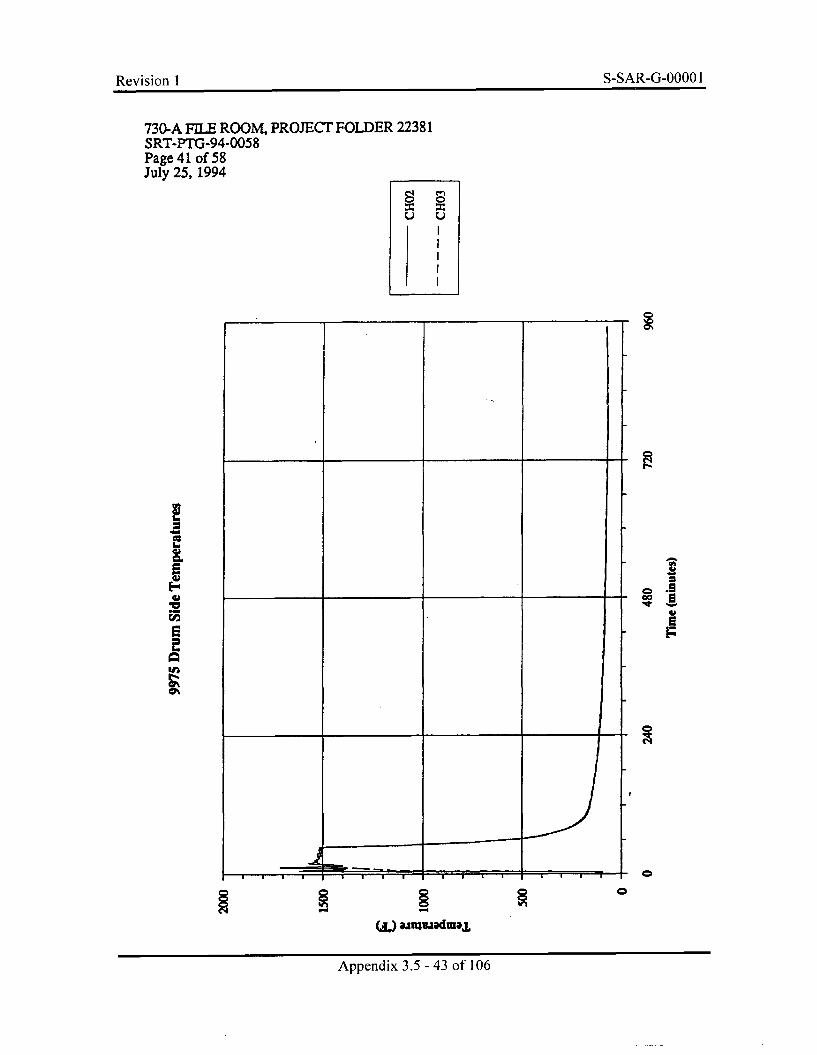
Revision 1 S-SAR-G-00001
730-A FILE ROOMK PROJECT FOLDER 22381SRT-PTG-94-0058Page 41 of 58July 25, 1994
I..
*1
Li
4b
In
0003
41UF
C
0
(!I.) ajnu~aduajL
Appendix 3.5 - 43 of 106
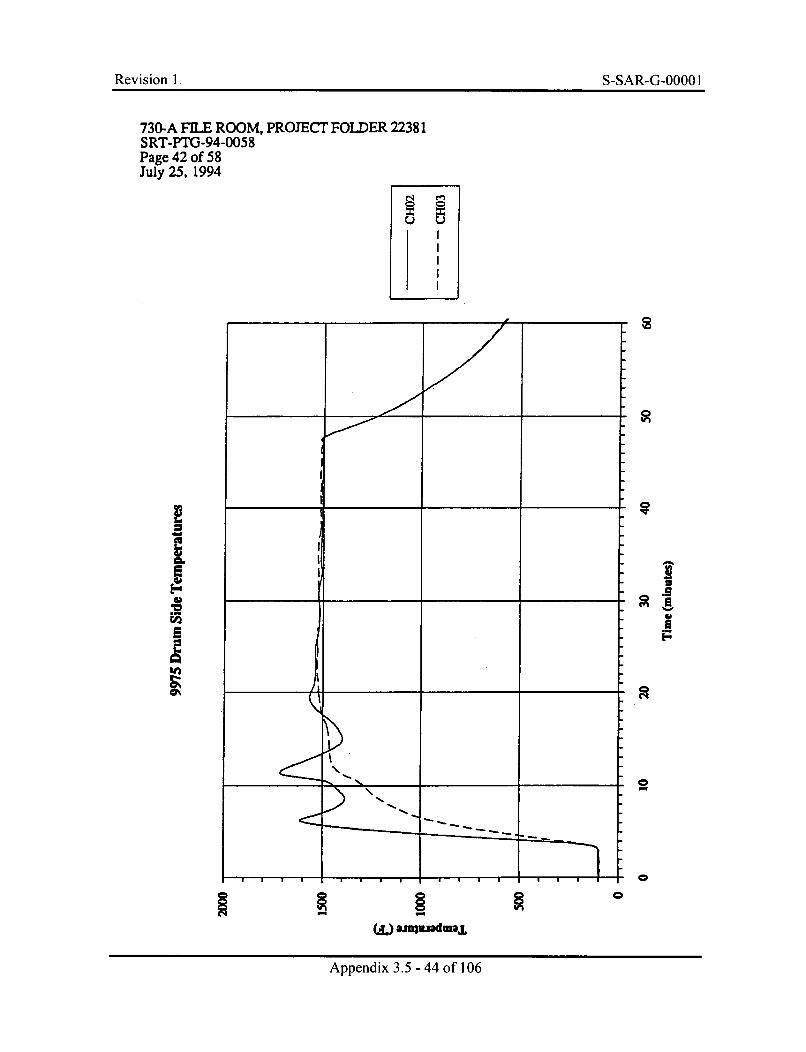
Revision I S-SAR-G-0000 IRevision I S-SAR-G-OOOO 1
730-A FILE ROOM, PROJECT FOLDER 22381SRT-PTG-94-0058Page 42 of 58July 25, 1994
.) U•
0Idl
E
Zg
2
0
0
W amemadmajL
Appendix 3.5 - 44 of 106
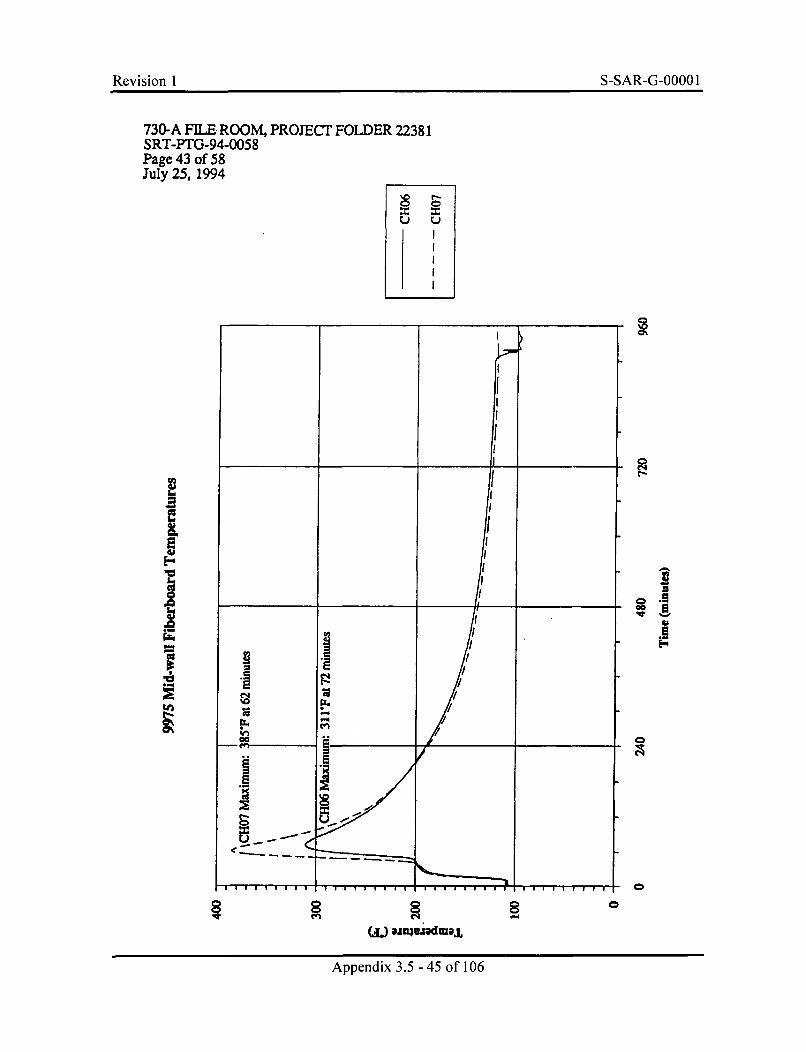
Revision 1 S-SAR-G-0000 1
730-A FILE ROOMK PROJECT FOLDER 22381SRT-PTG-94-0058Page 43 of 58July 25, 1994
I
IIrU
•F/N
0
(aIj eUxudmajL
0
Appendix 3.5 - 45 of 106
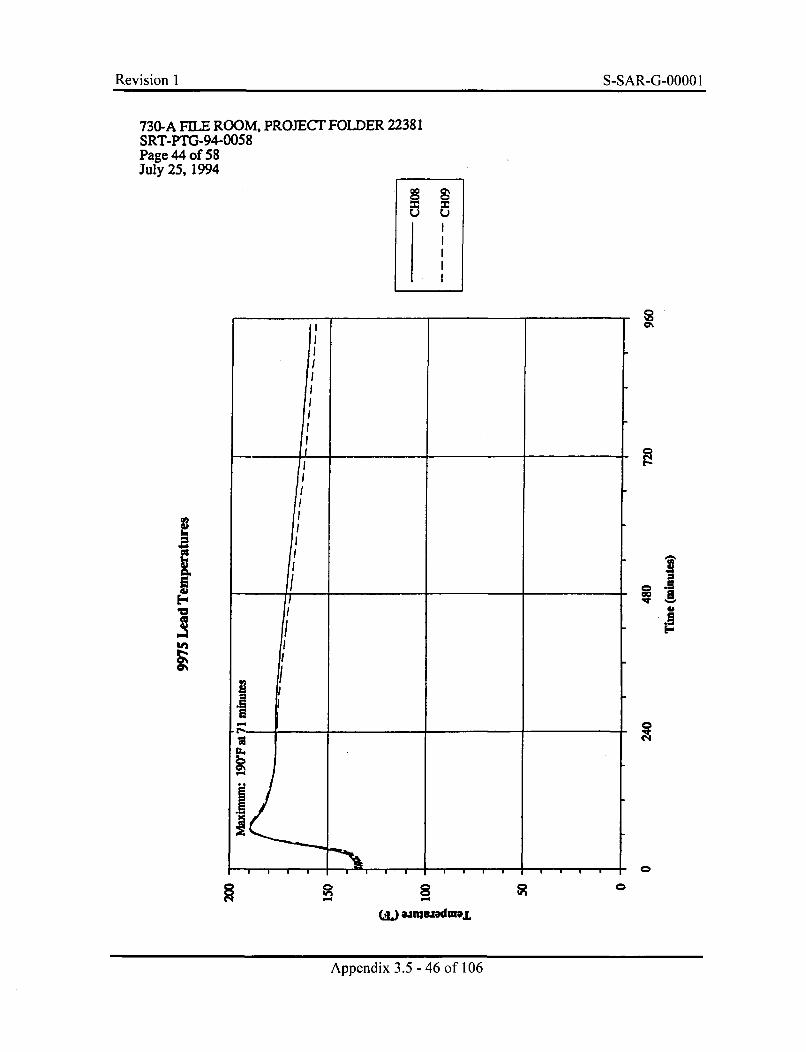
Revision I S-SAR-G-0000 1
730-A FILE ROOM, PROJECT FOLDER 22381SRT-PTG-94-0058Page 44 of 58July 25, 1994
I- I
.3
Le
___
~~ II-
C
A- 0
WA. ampuafdIE.L
Appendix 3.5 -46 of 106
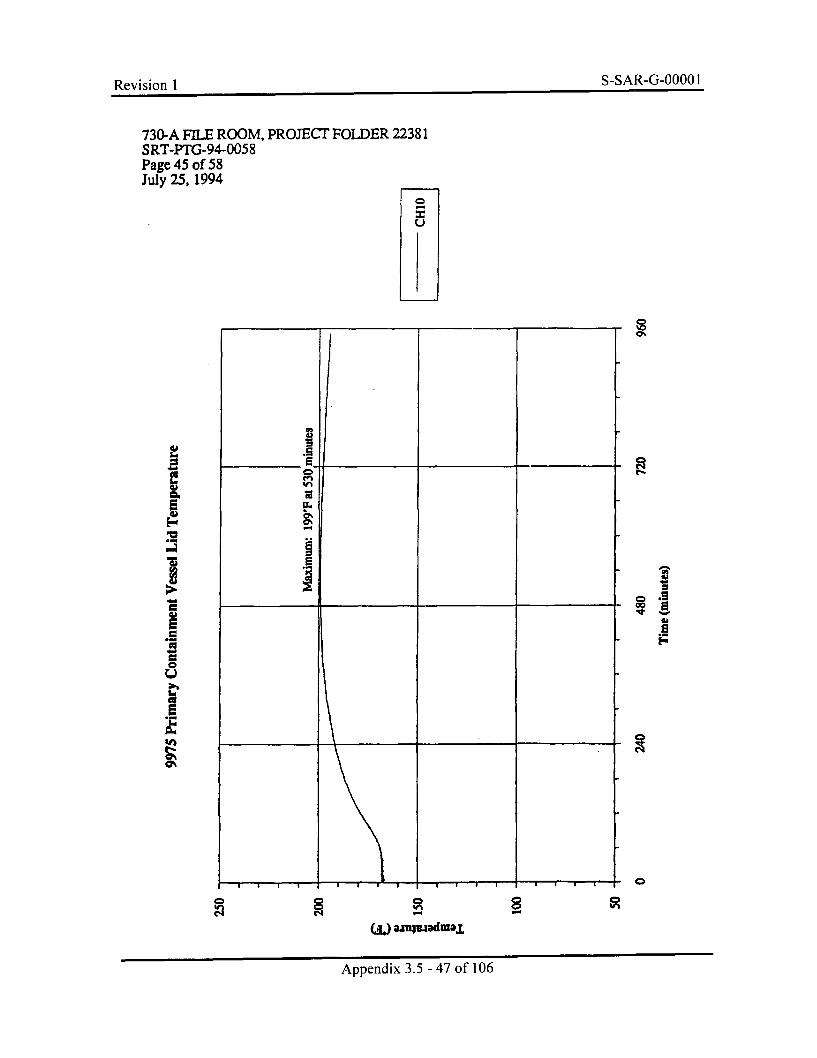
Rpvikinn 1 S-SAR-G-0000 IRevi-inn I
730-A FILE ROOM, PROJECT FOLDER 22381SRT-PTG-94-0058Page 45 of 58July 25, 1994
0
U)
2E
E
A
E
U0002
Gh
2F
a
(A.) 3JdmajL
Appendix 3.5 - 47 of 106
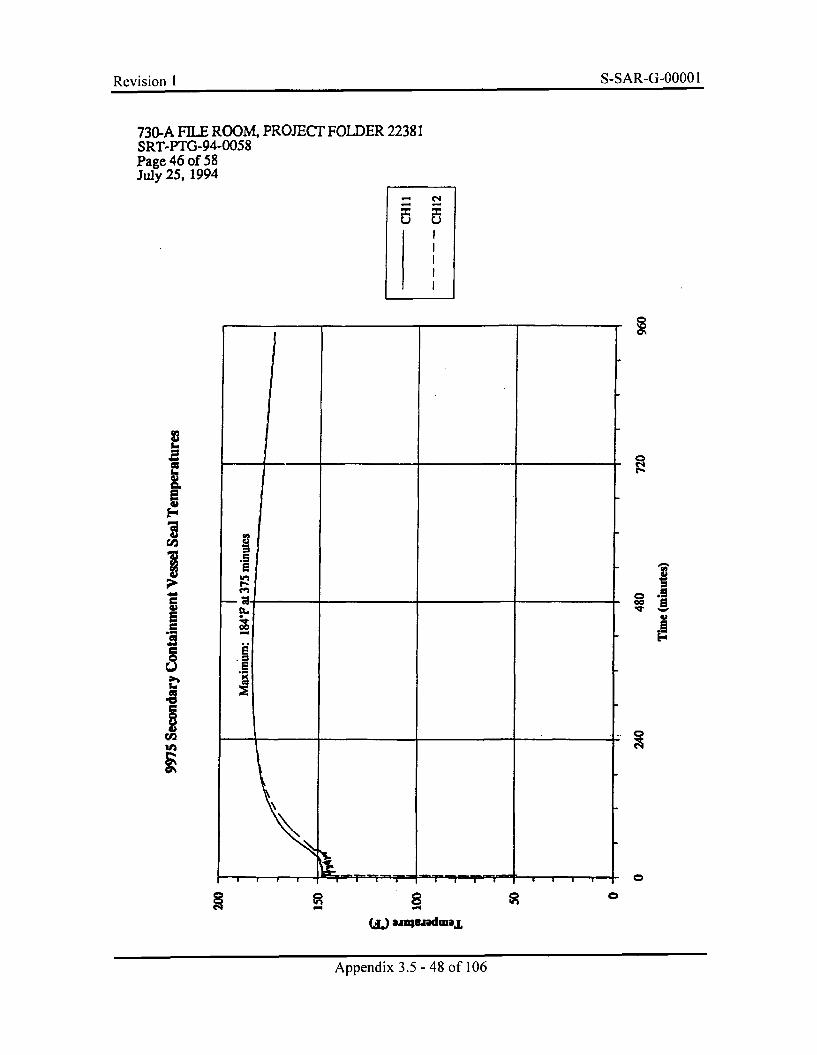
Revision 1 S-SAR-G-0000 1
730-A FILE ROOM, PROJECT FOLDER 22381SRT-PTG-94-0058Page 46 of 58July 25, 1994
~*6
E
'a
U2
PuU'a
C
C
C'U
U
A
0
Apedx35
8o
0
R C
W4L uarmudmasL
Appendix 3.5 - 48 of 106
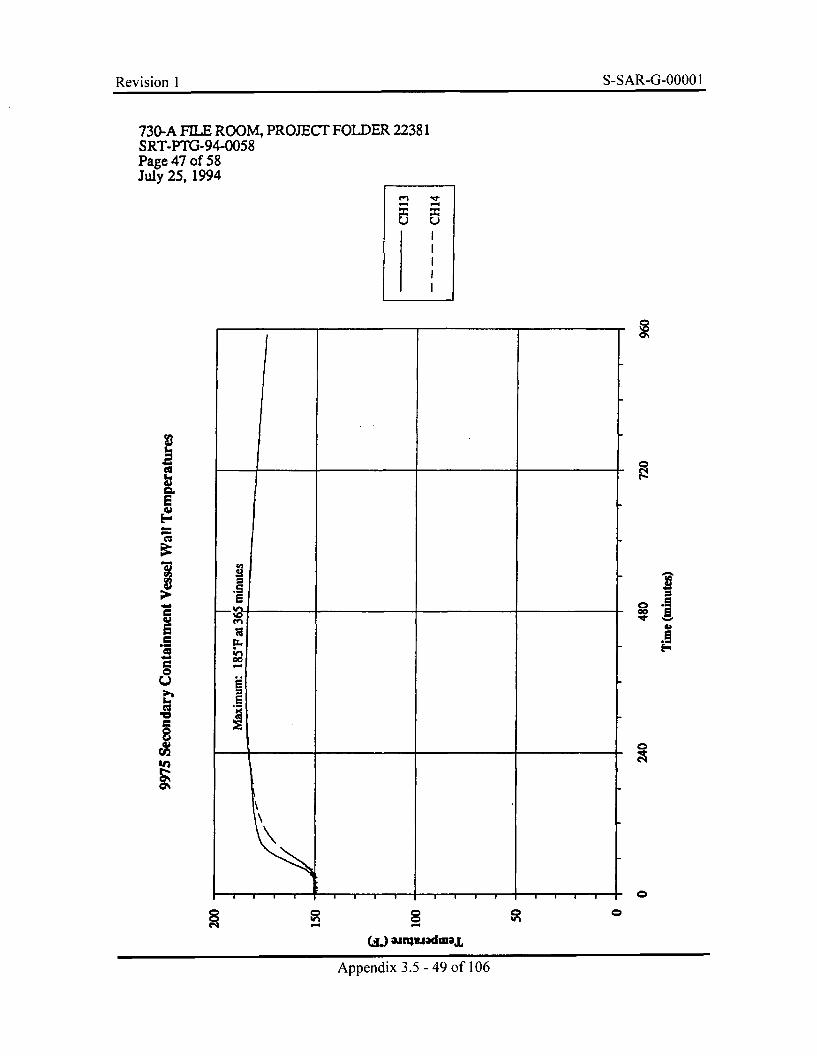
Revision 1 S-SAR-G-0000 1
730-A FILE ROOM, PROJECT FOLDER 22381SRT-PTG-94-0058Page 47 of 58July 25, 1994
U. U
iso0
0C..'C.-
o
Gb
0
0,0•mu;la[
Apedi . -4 o 0
Co
WL aiU3luadma3L
Appendix 3.5 - 49 of 106
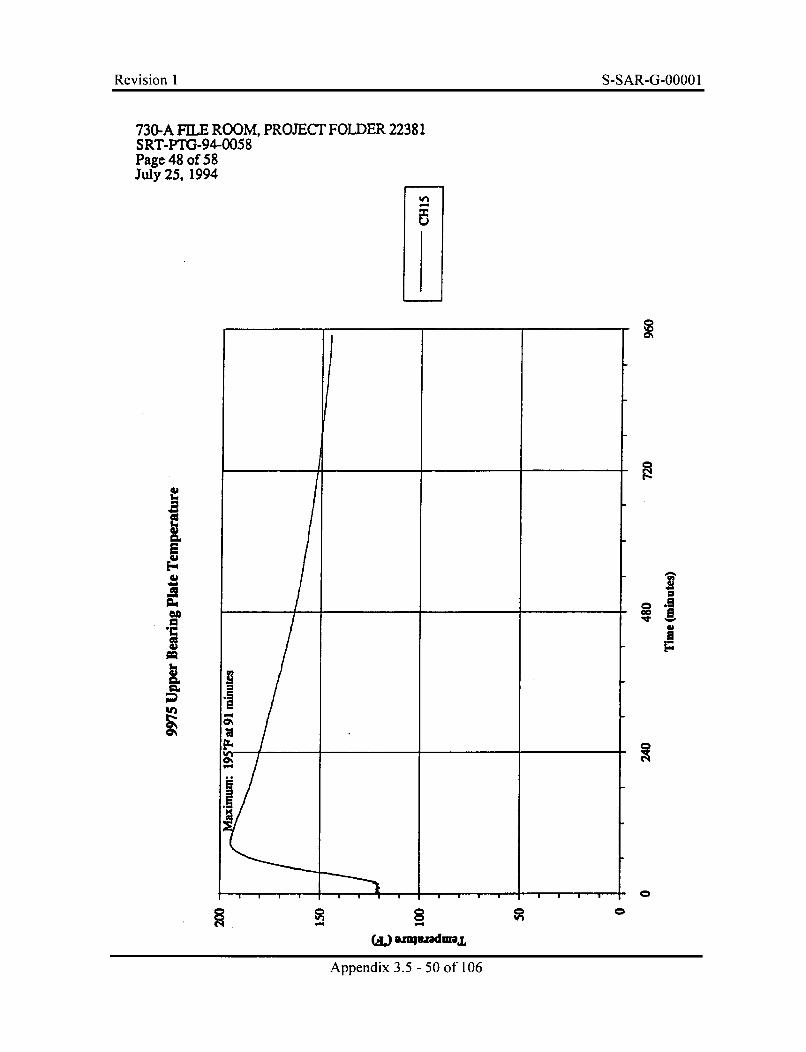
Revision 1 S-SAR-G-0000 1
730-A FILE ROOM, PROJECT FOLDER 22381SRT-PTG-94-0058Page 48 of 58July 25. 1994
%_
ca0.
0
C'I,
0
WA. .JmqxndUI.
Appendix 3.5 - 50 of 106
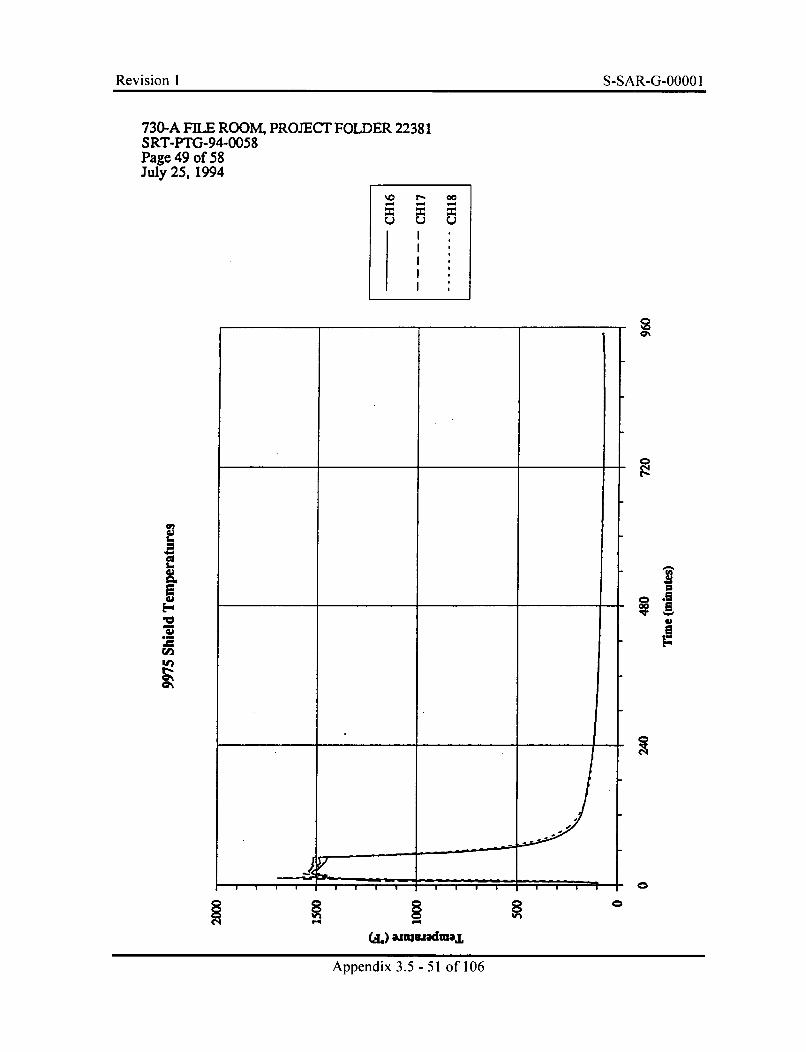
Revision I S-SAR-G-0000 IRevision 1 S-SAR-G-OOOO 1
730-A FILE ROOM, PROJECT FOLDER 22381SRT-PTG-94-0058Page 49 of 58July 25, 1994
ICr- 0
55
.1I-
U,
.1 ____________
0c~4
o .8003
'-V
ED3
40I I I I
. (. .) Iulad
al I II I ! u I #
0
WA. siuhUJdmai
Appendix 3.5 -51 of 106
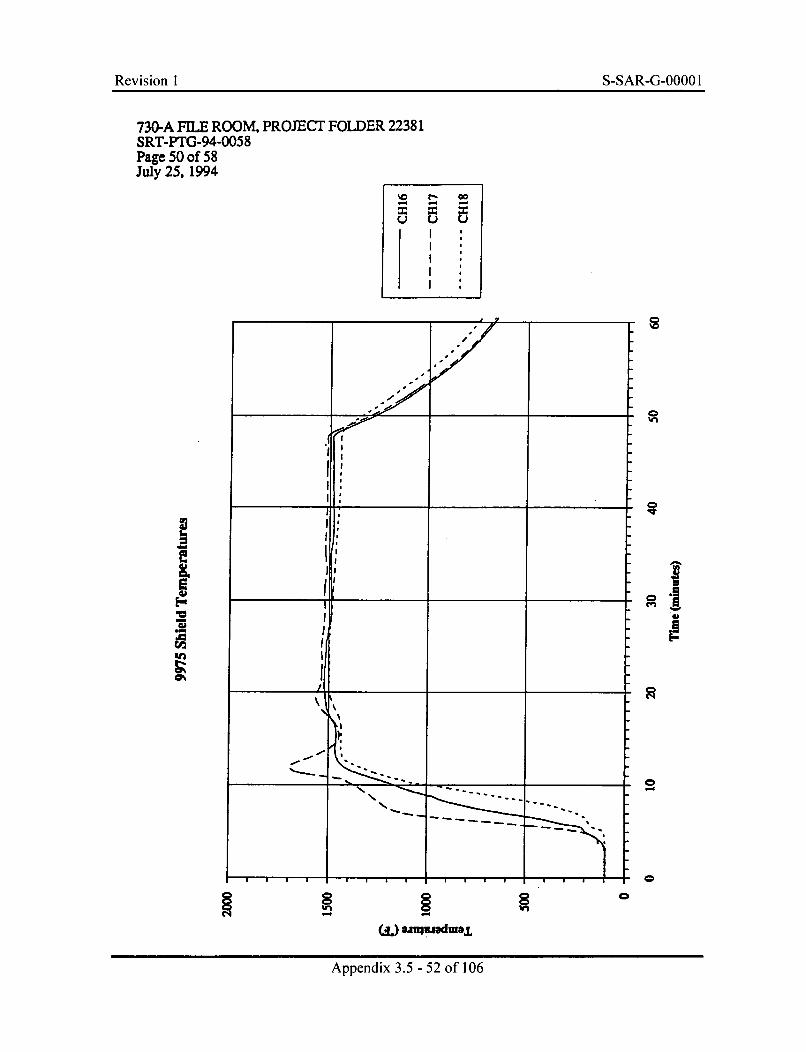
Revision I S-SAR-G-0000 1
730-A FILE ROOM, PROJECr FOLDER 22381SRT-PTG-94-0058Page 50 of 58July 25, 1994
%4 0
R
E
Ab GD
.1
0
0
-
(L) saqu.zsdiu.~
0
Appendix 3.5 - 52 of 106
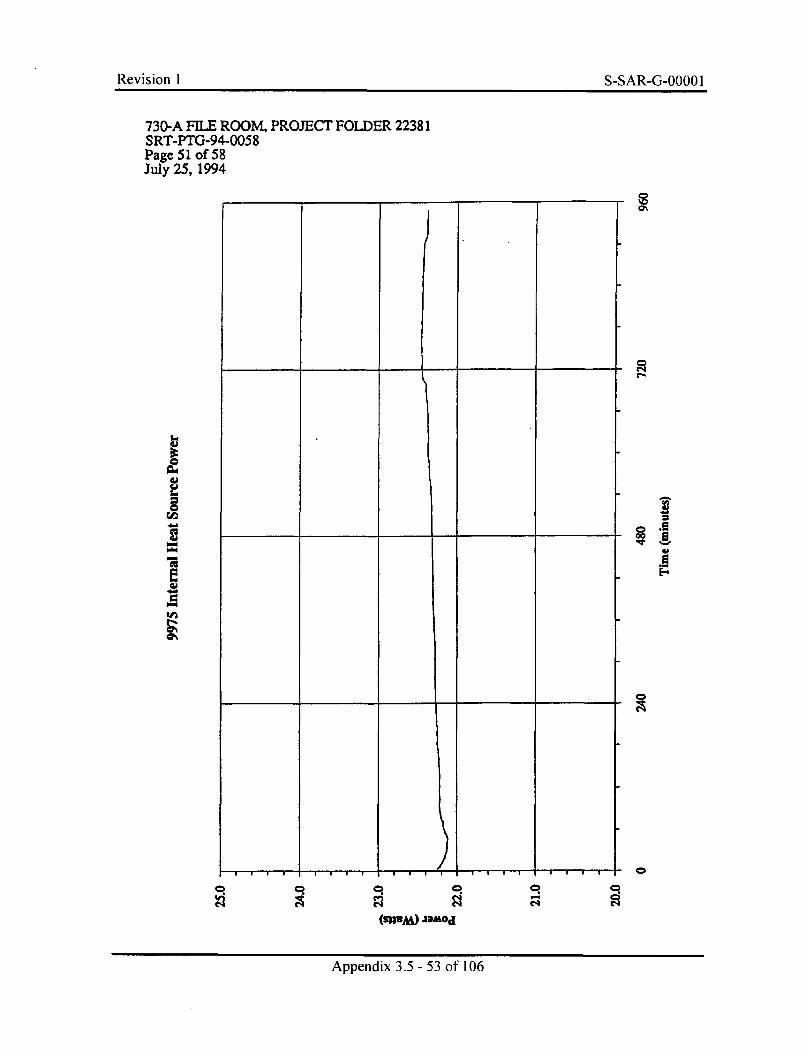
Revision I S-SAR-G-00001Revision 1 S-SAR-G-OOOO 1
730-A FILE ROOM, PROJECT FOLDER 22381SRT-PTG-94-0058Page 51 of 58July 25, 1994
&I
as
Q
q qC4I
(Andix ) Jm.of
Appendix 3.5 - 53 of 106
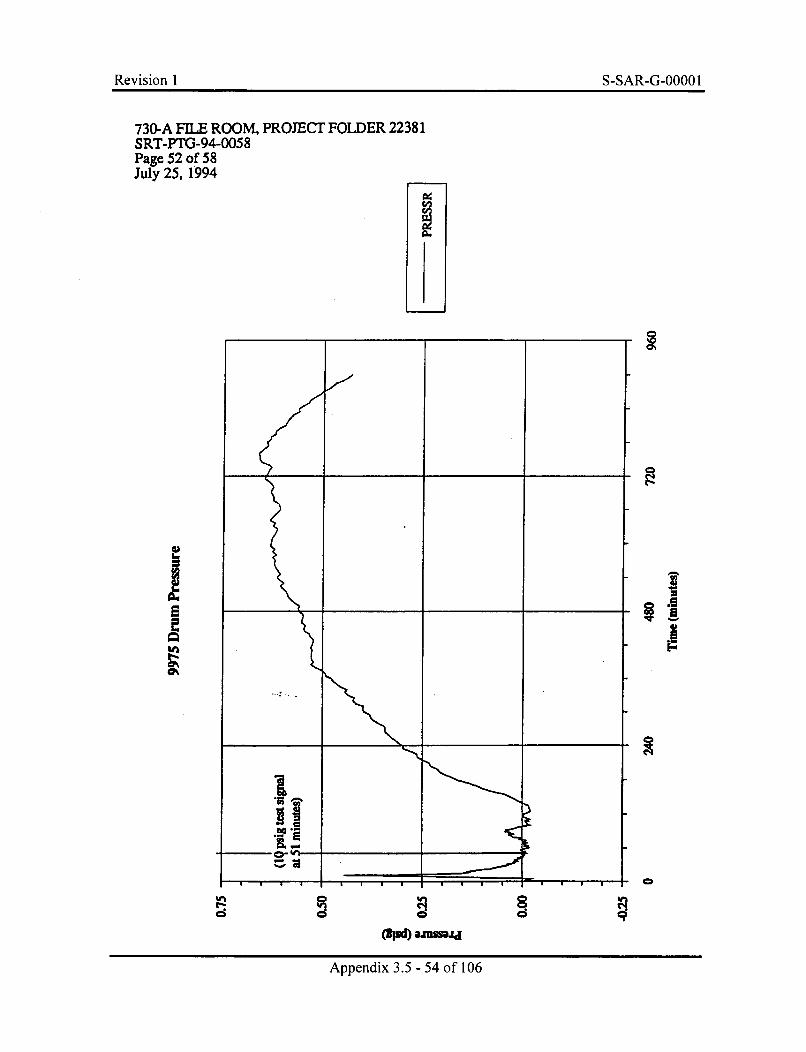
Revision I S-SAR-G-0000 IRevision 1 S-SAR-G-OOOO 1
730-A FILE ROOM, PROJECT FOLDER 22381SRT-PTG-94-0058Page 52 of 58July 25, 1994
m
V_
I io@0I
UF
c
tnC
Appndx
35 54of10
(Iud) aSWJ4M
Appendix 3.5 - 54 of 106
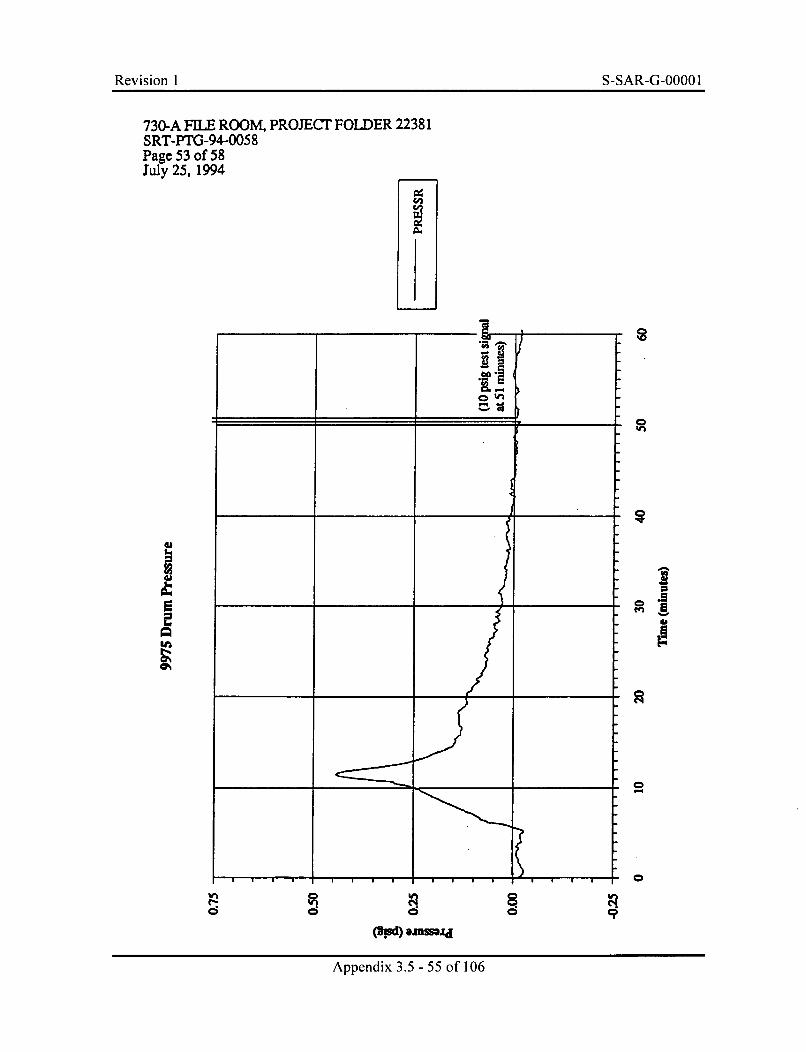
Revision 1 S-SAR-G-0000 I
730-A FILE ROOM, PROJECT FOLDER 22381SRT-PTG-94-0058Page 53 of 58July 25, 1994
rX
i
*-
0
Apedx350
5o 0
d 9(2u.0 Din=ssd
Appendix 3.5 - 55 of 106
Revision I S-SAR-G-0000 1
730-A FILE ROOM, PROJECT FOLDER 22381SRT-PTG-94-0058Page 54 of 58July 25, 1994
DISCUSSION
9973 Accident Test
This test was to fully comply with the regulatory test requirements. Consequently, acceptancewas that during heating, the minimum drum temperature be at least 1500"F or greater for 30minutes. Given the thin drum wall, this would ensure satisfying regulatory temperature andheat flux requirements. Following heating, the packaging was allowed to cool 17 hours whileremaining in the test facility.
Shroud temperatures and plenum air temperatures indicate the thermal environment duringheating and cooling. Heating began at 2 minutes and ended at 42 minutes. All shroudchannels initially rose to approximately 1850"F; however, heat lamp failures at 7 minutescaused fluctuations and a decrease in channel 6PH2C to approximately 1575'F. Powercompensations to the remaining heat lamps caused a localized melt-through of the shroud wall.Temperature spikes on some' drum channels at 8 minutes are attributed to this powercompensation. Again, the upper plenum was hotter than the lower plenum and rapid cooling ofthe facility environment indicated that the 9973 cooled as if in natural surroundings.
Drum bottom temperatures were again lost due to an apparent failure in channel CHOD. Due tothe horizontal packaging orientation, actual drum bottom temperatures are assumed to be thesame as the drum top (CR06, CH07). Disassembly revealed essentially the same top andbottom test effects, further indicating that the temperatures were the same. Drum toptemperatures remained above 1500'F for 38 minutes and above 1725"F during the 30 minuteregulatory test period.
Lower drum side temperatures (CH02, CH03) were cooler than the upper drum sidetemperatures (CH04, CH05). CH02 controlled the test initiation. It reaching 1500"F at 12minutes and gradually increased to 1684'F. Heat lamp failures caused CH03 to drop to1534"F, which remained acceptable. Shield side temperatures (CH14, CH15) closely followedthe drum side temperatures. However, the shield top temperature (CR16) heated much slowerand peaked lower than did the drum lid. This is assumed to be caused by the thermal blanketbetween the lid and shield top.
Table 3 summarizes internal temperature peaks. Appendix 3 includes hardware evaluations.
Drum pressure was much less than expected. It reached a sharp peak of 0.45 psig at 9 minutesduring heating, followed by a drop to -.012 psig at 51 minutes. Pressure then steadilyincreased, peaking at 0.45 psig at 859 minutes. It is not obvious whether the gradual increasewas due to packaging behavior or facility conditions. The drum pressure tap fitting wasobserved to be loose following the test and was assumed to have loosened during the heatingand subsequent cooling. No jetting marks were observed on the shroud, although thepackaging orientation would have precluded direct impingement on the shroud.
Both the SCV and PCV were leak tight following the test and disassembly, as reported inAppendix 3.
Appendix 3.5 - 56 of 106
Revision I S-SAR-G-0000 I
730-A FILE ROOM, PROJECT FOLDER 22381SRT-PTG-94-0058Page 55 of 58July 25, 1994
Table 3. 9973 Peak Test Temperatures
lChannel Location Peak and TimeCH08 SCV seal 165'F 144 min.CH09 SCV seal, 180" apart 160"F. 181 min.CH10 SCV side 169"F, 126 min.CH1I SCV side. 180" apart 158"F. 149 min.CH12 Upper bearing plate 182"F, 105 min.CH13 Upper bearing plate, redundant 181"F, 109 min.
9975 Preheat
The preheat, or 5 day period during which the internal heater brought the 9975 to normaloperating temperatures, occurred in an air-conditioned building. Heater power was maintainedat approximately 22W, sli•h.ly in excess of the design 21W. All 9975 preheat temperatureplots show a calibration spike early in the first hour. Discontinuities at 72 hours were due tosignal tests. Discontinuities after 114 hours were due to system changeover when thepackaging was relocated to the test facility. Preheat was terminated when temperatures hadreached nearly steady state as based on observation and preliminary analytical estimates.
Ambient temperatures (CH19) show the air temperature fluctuations starting at approximately3:00 p.m., June 4, 1994. Daily peaks remained about 77"F until the last 2 days, which peakedat about 80'F. The drum skin temperatures (CHOI through CH05) were strongly influencedby the ambient. Heating caused skin temperatures to increase approximately 10"F in 5 days.Internal temperatures reflected ambient cycling, but to a gradually lesser extent further towardthe packaging center. Temperature increases were greater closer to the packaging center (andheat source). Temperatures are summarized in Table 4.
9975 Accident Test
Immediately following the preheat, the 9975 was moved into the radiant heat facility andexposed to the thermal accident conditions. Acceptance was that the drum side temperatures beat 1500"F or greater for 30 minutes Following the exposure, the packaging was allowed tocool 15 hours while remaining in the test facility.
Heater power remained approximately 22W the entire time. As with the 9973, shroudtemperatures and plenum air temperatures indicate the thermal environment during heating andcooling. Heating began at 3 minutes and ended at 48 minutes. Shroud channel 1PHIA brieflyrose to 2000"F at 11 minutes while heater power was being leveled. Shroud channel 2PH1Bfailed and was not reported. As expected, the upper plenum was hotter than the lower plenum.Rapid cooling of the facility environment indicated that the packaging was allowed to cool as ifin natural surroundings. Shroud temperature increases at 900 minutes were due to solarheating during facility disassembly.
Drum bottom temperatures during heating were lost due to channel CH01 failing. When CR01apparently recovered at 51 minutes, the drum bottom (CHOI) was 1124'F while the drum top
Appendix 3.5 - 57 of 106
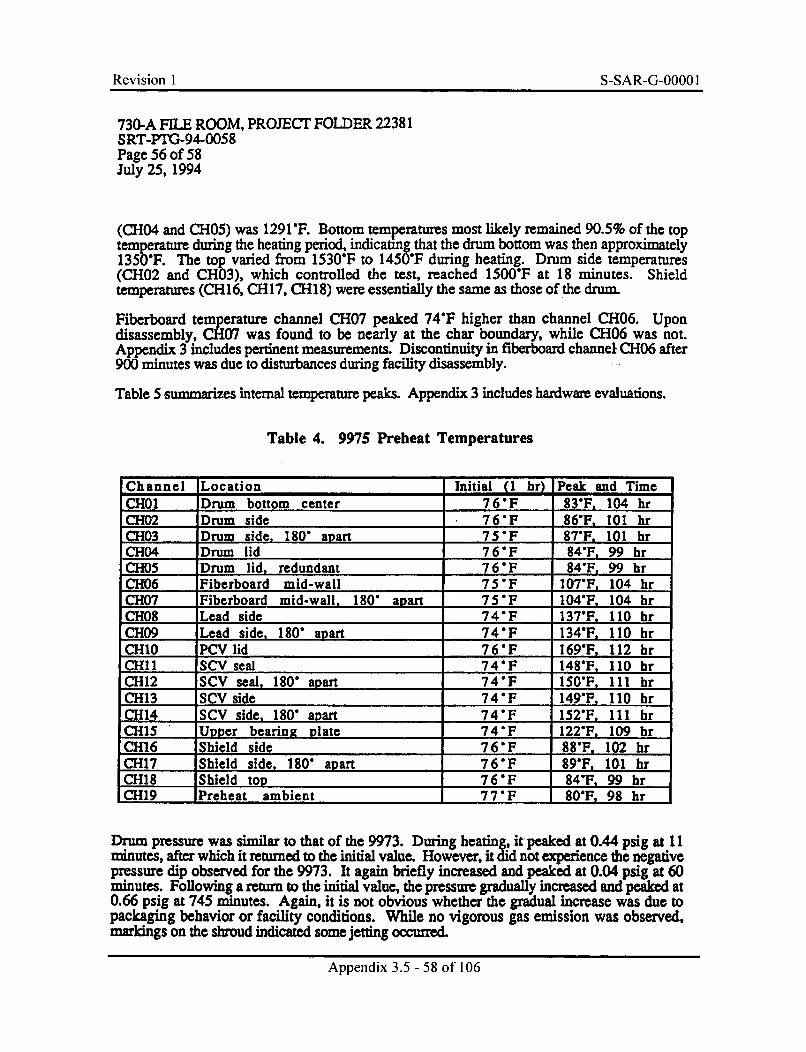
Revision I S-SAR-G-0000 I
730-A FILE ROOM, PROJECT FOLDER 22381SRT-PTG-94-0058Page 56 of 58July 25, 1994
(CH04 and CH05) was 1291"F. Bottom temperatures most likely remained 90.5% of the toptemperature during the heating period, indicating that the drum bottom was then approximately1350"F. The top varied from 1530"F to 1450"F during heating. Drum side temperatures(CH02 and CH03), which controlled the test, reached 1500"F at 18 minutes. Shieldtemperatures (CH16, CH17, CH18) were essentially the same as those of the drum.
Fiberboard temperature channel CH07 peaked 74"F higher than channel CH06. Upondisassembly, CH07 was found to be nearly at the char boundary, while CH06 was not.Appendix 3 includes pertinent measurements. Discontinuity in fiberboard channel. CH06 after900 minutes was due to disturbances during facility disassembly.
Table 5 summarizes internal temperature peaks. Appendix 3 includes hardware evaluations.
Table 4. 9975 Preheat Temperatures
Channel Location Initial (0 hr) Peak and TimeCHOI Drum bottom center 760F 83'F, 104 hrCH02 Drum side 7 6F 86'F. 101 hrCH03 Drum side, 180" apart 75"F 87"F. 101 hrCH04 Drum lid 76"F 84"F, 99 hrCH05 Drum lid, redundant 76"F 84'F 99 hrCH06 Fiberboard mid-wall 75"F 107"F: 104 hrCH07 Fiberboard mid-wall, 180' apart 75"F 104"F, 104 hrCH08 Lead side 7 4"F 137"F. 110 hrCH09 Lead side, 180" apart 74"F 134"F. 110 hrCH10 PCV lid 76"F 169"F, 112 hrCHR1 SCV seal 74"F 148"F. 110 hrCH12 SCV seal, 180" apart 74"F 150'F. 111 hrCH13 SCV side 74"F 149"F. 110 hrCH14 SCV side, 180' apart 74"F 152"F. I1 hrCH15 Upper bearing plate 74"F 122"F. 109 hrCH16 Shield side 76"F 88'F. 102 hrCH17 Shield side, 180' apart 76"F 89WFE 101 hrCH18 Shield top 76"F 84"F. 99 hrCH19 Preheat ambient 77" F 80F. 98 hr
Drum pressure was similar to that of the 9973. During heating, it peaked at 0.44 psig at 11minutes, after which it returned to the initial value. However, it did not experience the negativepressure dip observed for the 9973. It again briefly increased and peaked at 0.04 psig at 60minutes. Following a return to the initial value, the pressure gradually increased and peaked at0.66 psig at 745 minutes. Again, it is not obvious whether the gradual increase was due topackaging behavior or facility conditions. While no vigorous gas emission was observed,markings on the shroud indicated some jetting occurred.
Appendix 3.5 - 58 of 106
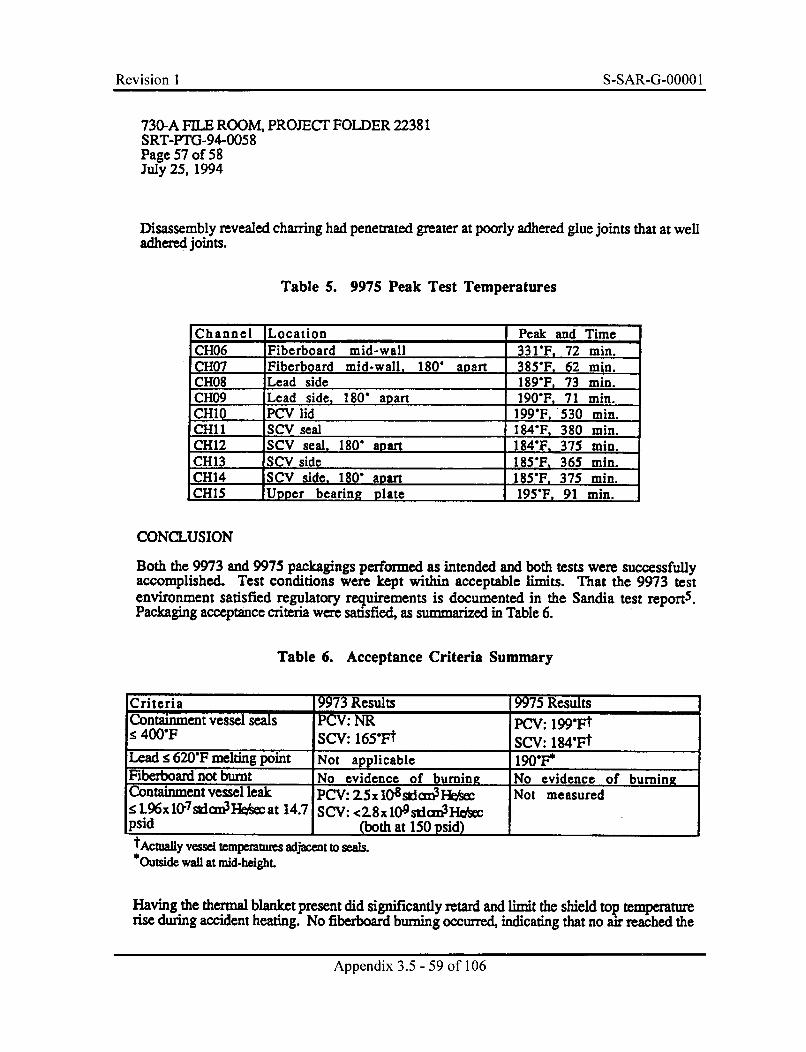
Revision I S-SAR-G-0000 I
730-A FILE ROOM, PROJECT FOLDER 22381SRT-PTG-94-0058Page 57 of 58July 25, 1994
Disassembly revealed charring had penetrated greater at poorly adhered glue joints that at welladhered joints.
Table 5. 9975 Peak Test Temperatures
Channel Location Peak and TimeCH06 Fiberboard mid-wall 331"F, 72 min.CH07 Fiberboard mid-wall, 180" apart 385"F. 62 min.CH08 Lead side 189"F, 73 min.CH09 Lead side. 180" apart 190"F. 71 min.CH10 PCV lid 199'F, 530 min.CHIl SCV seal 184'F, 380 min.CH12 SCV seal, 180" apart 184"F. 375 min.CH13 SCV side 185"F. 365 min.CHI4 SCV side, 180" apart 185"F. 375 min.CHI5 Upper bearing plate 195"F, 91 min.
CONCLUSION
Both the 9973 and 9975 packagings performed as intended and both tests were successfullyaccomplished. Test conditions were kept within acceptable limits. That the 9973 testenvironment satisfied regulatory requirements is documented in the Sandia test report5 .Packaging acceptance criteria were satisfied, as summarized in Table 6.
Table 6. Acceptance Criteria Summary
Criteria 9973 Results 9975 ResultsContainment vessel seals PCV: NR PCV: 1991F4< 400"F SCV: 165"Ft SCV: 184"Ff
Lead r. 620'F melting point Not applicable 190*F*Fiberboard not burnt No evidence of burning No evidence of burninxContainment vessel leak PCV: 2.5 x 10⁸ sidma3 Hesez Not measured< L96xlO'Tsldm 3 Heoeat 14.7 SCV: <2.8xlO9stdn3FW=psid (both at 150 psid)tActually vessel tempemtures adjacent to seals.*Outside wall at mid-height.
Having the thermal blanket present did significantly retard and limit the shield top temperaturerise during accident heating. No fiberboard burning occurred, indicating that no air reached the
Appendix 3.5 - 59 of 106
Revision I S-SAR-G-0000 I
730-A FILE ROOMK PROJECT FOLDER 22381SRT-PTG-94-0058Page 58 of 58July 25, 1994
heated fiberboard and further indicating that the shield functioned as intended. The vent plugswere completely consumed while the drum lid gasket, although fully charred, remained intact
The fiberboard junction step, although fully charred, remained intact. There were noindications of radiant heating from the drum wall to the 9975 lead cylinder or 9973 SCV.Therefore, any gapping that may have occurred, particularly in the 9973 as a result of dropdamages, was successfully overcome by the step. Poorly adhered glue joints allow greaterchar penetration than do well adhered joints.
As expected, the drum temperatures responded quickly to the heating and coolingenvironments, while large internal. temperature increases occurred only in charred regions.
REFERENCES
1. Packaging and Transportation of Radioactive Material, Code of Federal Regulations, Title10, Part 71, Washington, DC (January 1, 1991).
2. 9973 and 9975 Packagings Thermal Testing (U), WSRC Equipment and MaterialsTechnology Department, Job Number 22381, (1994).
3. Package Test Selection Jusisfication (U), WSRC Memorandum SRT-ATS-940047, S. J.Hensel (July, 1994).
4. American National Standard for Radioactive Leakage Tests on Packages for Shipment.ANSI N14.5-87, American National Standards Institute, Inc., New York, NY (1987).
5. D. H. Schulze, R. Moreno, W. Gill, Test Report, Simulated Fire Tests of the 9973 and9975 Packagings, 6324AK2801, Sandia National Laboratory,.Albuquerque, NM (June1994).
Appendix 3.5 - 60 of 106
Revision I S-SAR-G-0000 1
730-A FILE ROOM, PROJECT FOLDER 22381SRT-PTG-94-0058APPENDIX 1July 25, 1994
APPENDIX 1
INSTRUMENTED ASSEMBLY OF THE 9973 AND 9975 SHIPPING PACKAGINGS (U),WSRC SRTC E&MT Procedure FP 558, Rev. 0 (Performed May and June, 1994)
Appendix 3.5 - 61 of 106
Revision 1 S-SAR-G-0000 1
Savannah River Technology Center Procedure: FP 558, Rev 0E&MT Field Procedure E&MT Job Folder: 22306
PTG Project File: PTG-PF-001Category: 1Effective: 65/ /94
Instrumented Assembly of the 9973 and 9975 Shipping Packagings Page: 1 of 2L .3
Instrumented Assembly of the 997.pping Packagings (U)WRK IM Our
COPIED BYcopY DATEE.XLAI DATEApprovals
P&T Engineer Date: ____'_/___
~v Date _-7//'JTfFT&OS Engineer . -- m
P&T Task Leader.
SRTC CQF
E&MT Manager <
Purpose
Date SZ11Z41z..
Datez4•
This procedure ensures proper, documented assembly of the 9973 and 9975shipping packagings that will be subsequently thermally tested.
Scope
This procedure pertains to the task work supporting certification of the 9972-seriespackaging. This procedure applies to preparation of the 9973 shipping package thatwill be used for the certification drop, puncture, and thermal test, and applies to the9975 shipping packaging that will be used for the benchmark thermal test.Prerequisite to this procedure are provision of the standard packaging hardwareand, for the 9973, the containment vessel assembly. This procedure directsmodification of the standard hardware for thermal test purposes.
Procedure performance assumes close cooperation of the test'engineer and thefabrication shop. The test engineer will direct the work and be allowed substantialleeway during assembly. This is appropriate since this work is custom in nature.
Appendix 3.5 - 62 of 106
Revision I S-SAR-G-0000 I
Savannah River Technology Center Procedure: FP 558, Rev 0E&MT Field Procedure E&MT Job Folder: 22306
Category: 1Instrumented Assembly of the 9973 and 9975 Shipping Packagings Page: 2 of 23
Terms and Definitions
9973 packaging - Drum-type radioactive materials packaging design defined inattachment 1, 3, and drawing S5-2-11039.
9975 packaging - Drum-type radioactive materials packaging design defined inattachment 2, 3, and drawing S5-2-13100.
Standard packaging hardware - Those items excluding radioactive materialsnecessary to assemble the packaging, including for the 9973 in this case anassembled, pressurized and leak tested containment system.
Responsibilities
FT&OS Engineer
The Equipment and Materials Technology (E&MI) Fabrication Technology andOperations Support (FT&OS) engineer is responsible for
* ensuring standard packaging hardware is available* facilitating fabrication support, including shop access and manpower
P&T Task Leader
The E&MT Packaging and Transportation task leader is responsible for* overall task coordination, including the work covered in this procedure
P&T Engineer
The E&MT Packaging and Transportation engineer is responsible for* the test engineer role, including preparing this procedure" initialing and dating each step upon satisfactory completion* approving and noting within the procedure all deviations to this procedure
Shop Foreman
The Shop Foreman is responsible for* providing qualified personnel to assist in executing this procedure• providing a safe shop environment for doing this work
Safety
Shop personnel are to know and follow shop safety practices. E&MT personnelare responsible for heeding shop safety rules.
The 9975 sleeve may require special controls due to its being lead. Cadmiumplating may be present when welding conduit fittings.
Appendix 3.5 - 63 of 106
Revision I S-SAR-G-0000 IRevision 1 S-SAR-G-OOOO 1
Savannah River Technology CenterE&MT Field Procedure
Instrumented Assembly of the 9973 and 9975 Shipping Packagings
Procedure: FP 558, Rev 0E&MT Job Folder: 22306Category: 1Page: 3 of 23
Acceptance Criteria
The acceptance criteria is that the P&T engineer has initialed and dated eachprocedure step and any associated deviations.
Required Instrumentation and Equipment
The following equipment is necessary to perform this procedure:
" typical shop mechanical and fabrication tools (e.g.. wrenches, drills, etc.)" standard 9973 and 9975 packaging hardware with a 9973 containment
vessel assembled per E&MT FP 516 and FP 519 and an unassembled 9975containment vessel (supplied by the FT&OS engineer)
* mineral-insulated type K thermocouples, .63 in. dia. x 180 in., GordonABEOOOQ99OUK30X, M&TE #TR-3236---TR-3251 calibrated to 1000'Cand TR-3252---TR-3275 calibrated to 600"C (supplied by P&T Engineer)
* 3/4 in. flexible all-metal conduit, panel fittings, and end terminations (2 ea.)* 4.7 min. dia. x 8.4 in. min. length bar (carbon or stainless steel)* loose high temperature fiberglass insulation as required to fill small holes* small nylon or similar wire ties* 1/4 in. dia. thin wall copper tubing, approx. 22 feet* .002-.003 in. stainless steel sheet sufficient for retaining thermocouples* tack welding capability (likely via E&MT Equipment Engineering)
, v s ' • electric heater element, Master Appliances HAS-041K or similar, and leadwires (supplied by P&TEngineer °4 , *..- . F/hAohmmeter with sensitivity t<2178• , , s,'.,da,,
50c'4 M&TE calibration noJexp. date: A11/ . s/-•4 ((•. ,,A)
1 pressure tap fittings (supplied by P&T Engineer)j~ ~~ ~~~rs (5,.- ch A 1"3.c , '.b,4,. l., ,0a
Procedure
1. General Instructions
1. DO NOT bend thermocouples smaller than a 3/16 in. inner bend radius.
2. Ensure each thermocouple M&TE number remains attached to the lead end.
3. DO NOT allow exposed thermocouple wires on lead ends to be broken.When routing thermocouples, a closed piece of tubing may be used as aprotective casing.
4. Verify thermocouple calibrations and, per ASTM E-1350, measure thethermoelement loop resistance of each thermocouple prior to installation.Record the results in Table 1.
ýAw 47 Da
Initials_,,ýeLDate -S /ý qf,,
Appendix
3.5 - 64 of 106
44A-A a VOR
Appendix 3.5 - 64 of 106
Revision I S-SAR-G-0000 I
Savannah River Technology Center Procedure: FP 558, Rev 0E&MT Field Procedure E&MT Job Folder: 22306
Category: 1Instrumented Assembly of the 9973 and 9975 Shipping Packagings Page: 4 of 23
5. When cited, measure the post-installation thermoelement loop resistance perASTM E- 1350. If damage is indicated (measured before and after installationresistance difference is >5%), repeat the procedure steps necessary to replacethe damaged thermocouple(s). Explain, reinitial, and redate repeated steps.
6. Minor notching of the fiberboard (width less than 1/4 in.) is allowed asnecessary for muting leads.
7. Thermocouples should be attached such that at least 1.5 in. from the junctionends are in expected isotherms.
8. Attach thermocouples to steel surfaces by forming a small sheet metal retentionstrap over thermocouple and then tack welding the strap to the surface. Seeattachment 4 for example.
Attach thermocouples to lead and aluminum surfaces by grooving the surface 1thermocouple dia. wide by 1.5 dia. deep and approximately 1.5 in. long orlonger if necessary for retention, inserting the thermocouple, then peening thegroove edges to retain the thermocouple.
WARNING - do not burn through the thermocouple sheath when welding orcrush the sheath when peening!
2. Drum and Lower Fiberboard Preparation and Instrumentation
1. Drill a hole in the side of the 9973 drum for attachment of the 3/4 in. conduitbulk head fitting. The hole is to be such that its center will be at the elevationof the inner fiberboard step and is to be central in the quadrant of 2 adjacentvent holes.
Initialsý 1V Dat
2. Drill a hole in the bottom of the 9975 drum for attachment of the 3/4 in. conduitbulk head fitting. The hole is to be eccentric from the axis 3.6 in. and is to becentral in the quadrant of 2 adjacent vent holes.
Initialsch fL Dait in s w tt uo'
3. Attach the 9975 conduit fitting and seal weld it at the drum exterior.
InitialsŽ•Da.e J/ 9i,'l
Appendix 3.5 - 65 of 106
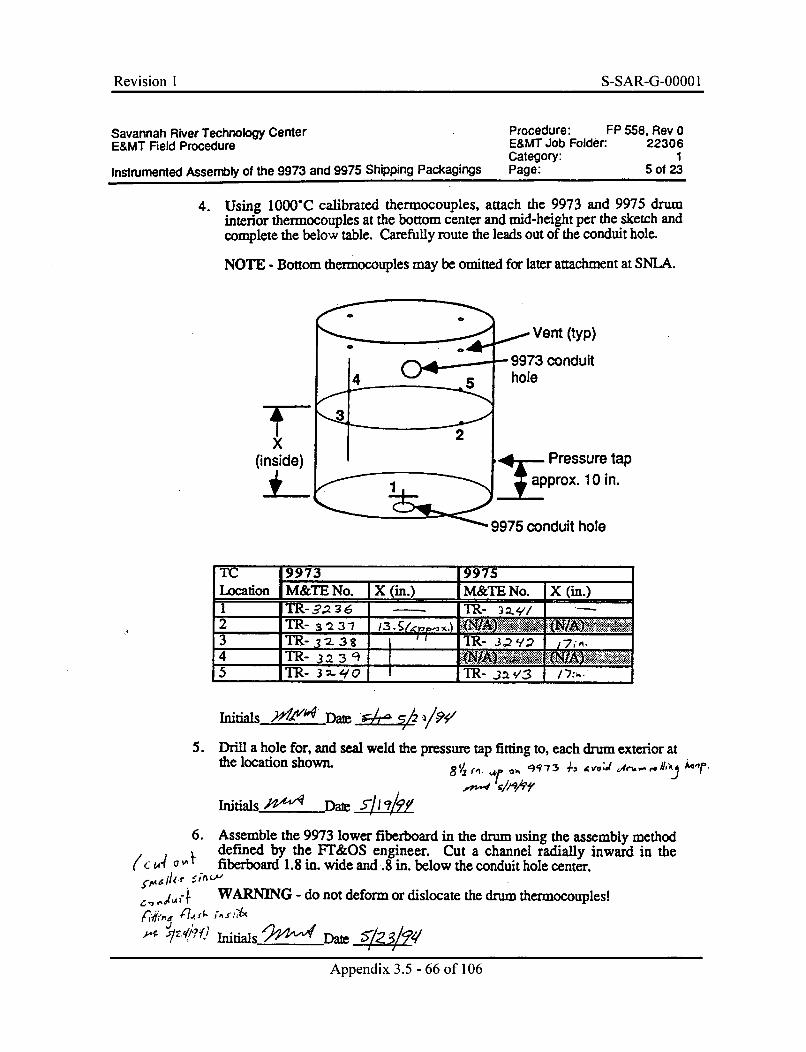
Revision I S-SAR-G-O0001
Savannah River Technology Center Procedure: FP 558, Rev 0E&MT Field Procedure E&MT Job Folder: 22306
Category: IInstrumented Asserribly of the 9973 and 9975 Shipping Packagings Page: 5 of 23
4. Using 100"'C calibrated thermocouples, attach the 9973 and 9975 druminterior thermocouples at the bottom center and mid-height per the sketch andcomplete the below table. Carefully route the leads out of the conduit hole.
NOTE - Bottom thermocouples may be omitted for later attachment at SNLA.
4O4~~-~
5
2f-
Vent (typ)
-9973 conduithole
* -- Pressure tapj aprox. 10 in.
9975 conduit hole
T" 9973 [9975Location M&TE No. X (in.) M&TE No. X (in.)1 TR .2 g6 ____ TR- 34/____
2': . .... 3r" -" 1 ... .... . ...' l .. .: € .: •' .z:$::• . x2
3 TR- 3 TR- 3,.2'I 7Y,.
4 TR- 323: _TR- __ ,__ 1_:_.5R 3~~ 2- ýqTR- ja v3 /7:k..
Initials Date- 05W~-~
5. Drill a hole for, and seal weld the pressure tap fitting to, each drum exterior atthe location shown. 8/ my' .Mi"
-q '?/73 ,4 u-(.r
Initials AP" Dat
6. Assemble the 9973 lower fiberboard in the drum using the assembly methoddefined by the FT&OS engineer. Cut a channel radially inward in the
(C c4 o , fiberboard 1.8 in. wide and .8 in. below the conduit hole center.
• t WARNING - do not deform or dislocate the drum thermocouples!
Appendix 3.5 - 66 of 106
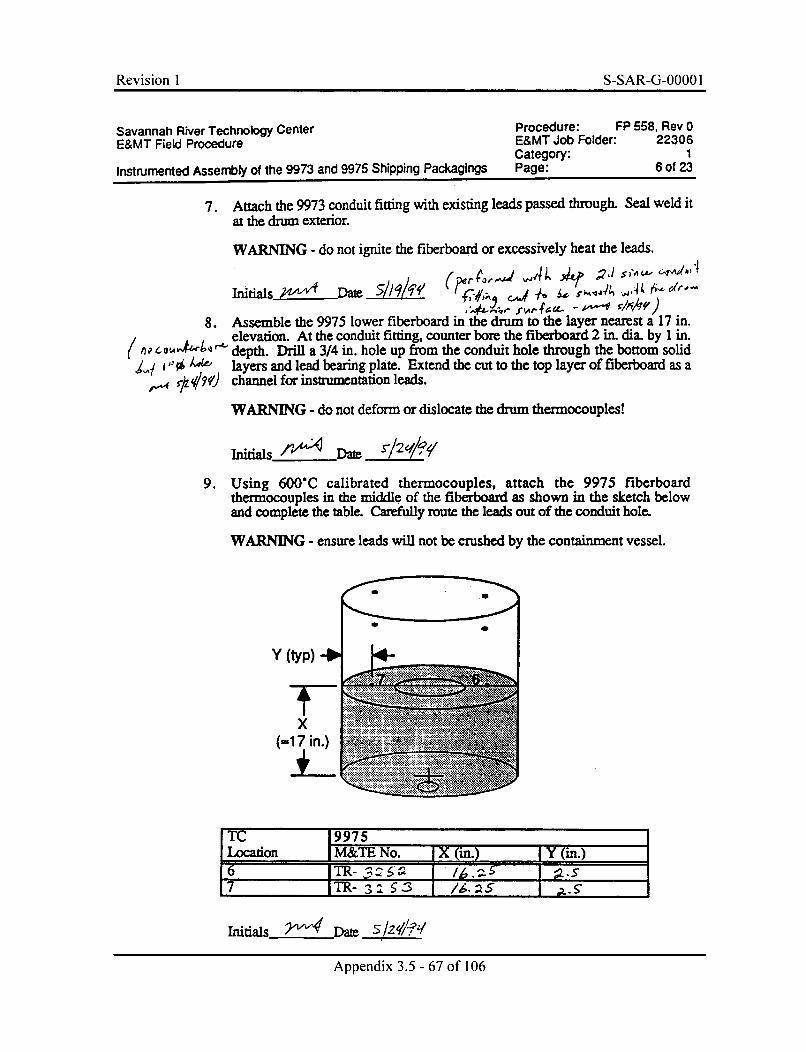
Revision I S-SAR-G-0000 I
Savannah River Technology Center Procedure: FP 558, Rev 0E&MT Field Procedure E&MT Job Folder: 22306
Category: 1Instrumented Assembly of the 9973 and 9975 Shipping Packagings Page: 6 of 23
7. Attach the 9973 conduit fitting with existing leads passed through. Seal weld itat the drum exterior.
WARNING - do not ignite the fiberboard or excessively heat the leads.
Initials Date • q/€€ (p!,• • ., ,,.-
8. Assemble the 9975 lower fiberboard in the drum to the layer nearest a 17 in.elevation. At the conduit fitting, counter bore the fiberboard 2 in. dia. by 1 in.
(A COW4 'ý" ' depth. Drill a 3/4 in. hole up from the conduit hole through the bottom solid1,0 4de1,e layers and lead bearing plate. Extend the cut to the top layer of fiberboard as a
, -,4r ýi) channel for instrumentation leads.
WARNING - do not deform or dislocate the drum thermocouples!
Initials_2ý = Date____
9. Using 600C calibrated thermocouples, attach the 9975 fiberboardthermocouples in the middle of the fiberboard as shown in the sketch belowand complete the table. Carefully route the leads out of the conduit hole.
WARNING - ensure leads will not be crushed by the containment vessel.
Y (typ)
xF
(-17 in.) NO-± ~ -1 V Pu-1 \
TC 19757 _I.cation M&TE No. X (in.) Y (in.)
6 3IR- I if 1067 I~TR- 31 3 1/16. a5S-
Initials-22v14Date______/0'
Appendix 3.5 - 67 of 106
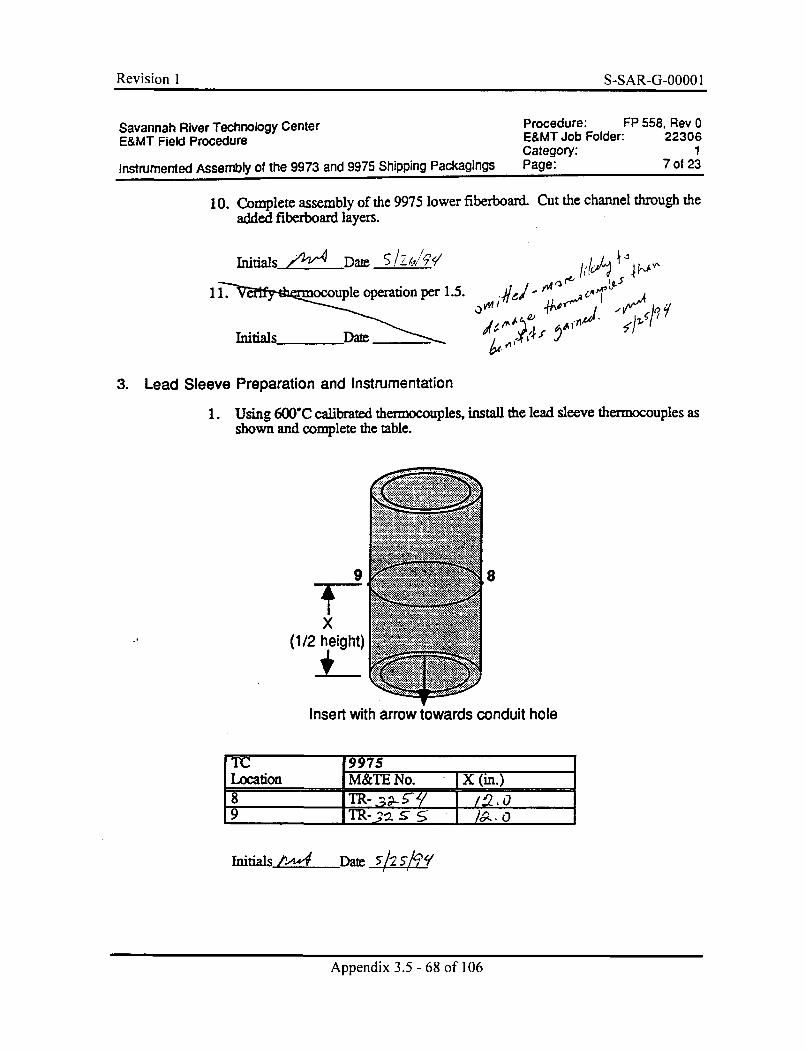
Revision 1 S-SAR-G-0000 1
Savannah River Technology Center Procedure: FP 558, Rev 0E&MT Field Procedure E&MT Job Folder: 22306
Category: 1Instrumented Assembly of the 9973 and 9975 Shipping Packagings Page: 7 of 23
10. Complete assembly of the 9975 lower fiberboard. Cut the channel through theadded fiberboard layers.
Initials •,, Dam /l,"7q
11. ocouple operation per 1.5.
InitialsDate
141
a' -
3. Lead Sleeve Preparation and Instrumentation
1. Using 600"C calibrated thermocouples, install the lead sleeve thermocouples asshown and complete the table.
WE31' NN'..."
.............
×8
X(1/2 height) M
Insert with arrow towards conduit hole
TC 19975Location M&TE No. X (in.)8 I -2.59 TR-.
TnitialsjŽ!±....Date 159
Appendix 3.5 - 68 of 106
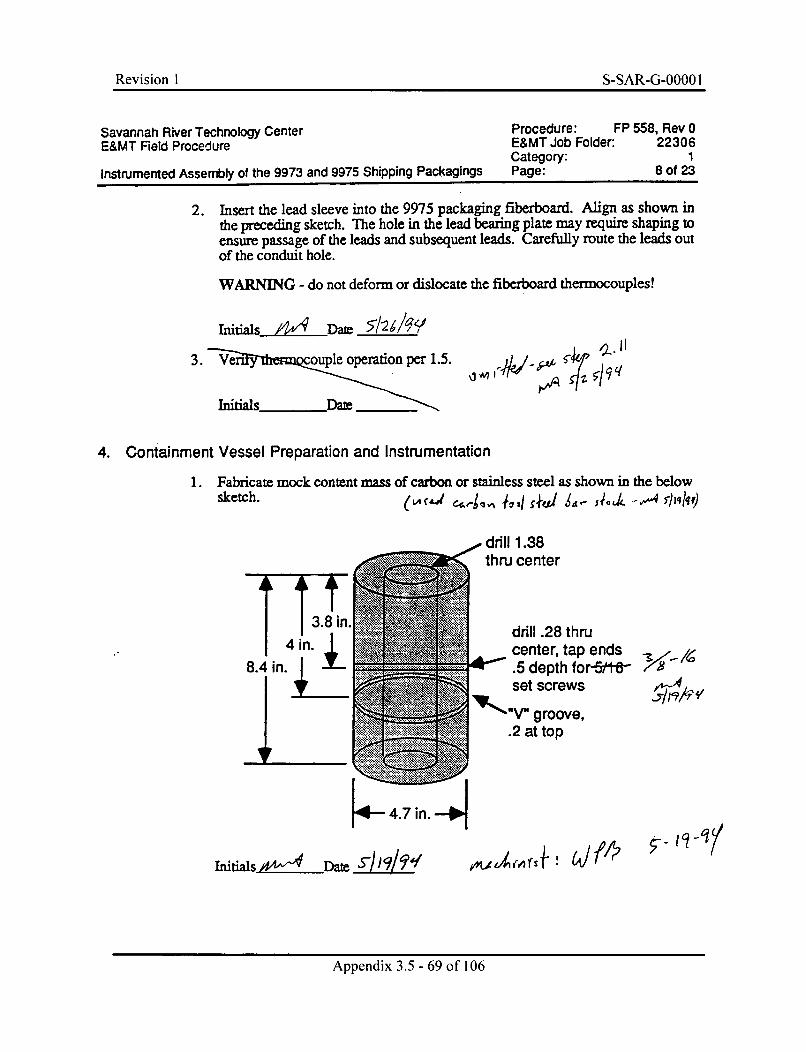
Revision I S-SAR-G-0000 IRevision 1 S-SAR-G-OOOO I
Savannah River Technology CenterE&MT Field Procedure
Instrumented Assembly of the 9973 and 9975 Shipping Packagings
Procedure: FP 558, Rev 0E&MT Job Folder: 22306Category: 1Page: 8 of 23
2. Insert the lead sleeve into the 9975 packaging fiberboard. Align as shown inthe preceding sketch. The hole in the lead bearing plate may require shaping toensure passage of the leads and subsequent leads. Carefully route the leads outof the conduit hole.
WARNING - do not deform or dislocate the fiberboard thermocouples!
Iitials jw4Date //9
3. Ve uple operation per 1.5.
Initials Dam
.q.l
4. Containment Vessel Preparation and Instrumentation
1. Fabricate mock content mass of carbon or stainless steel as shown in the below
drill 1.38thru center
drill .28 thrucenter, tap ends.5 depth for-5/1fteset screws
groove,
.2 at top
I
3fl14
K- 4.7nin. -- ON-
Initials -LAP-ýDam S 19zt/
Appendix 3.5 -69 of 106
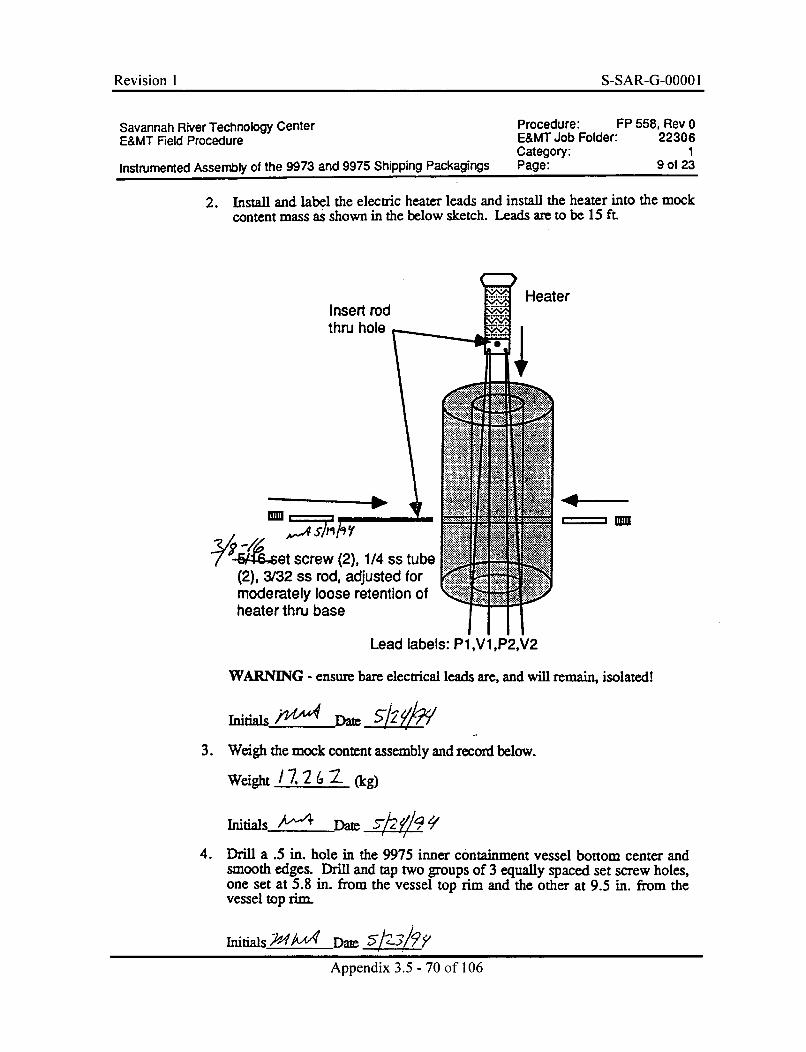
Revision I S-SAR-G-0000 I
Savannah River Technology Center Procedure: FP 558, Rev 0E&MT Field Procedure E&MT Job Folder: 22306
Category: 1Instrumented Assembly of the 9973 and 9975 Shipping Packagings Page: 9 of 23
2. Install and label the electric heater leads and install the heater into the mockcontent mass as shown in the below sketch. Leads are to be 15 ft.
HeaterInsert rodthru hole
= uMa
et screw (2), 1/4 ss tube 0"'(2), 3/32 ss rod, adjusted formoderately loose retention ofheater thru base
Lead labels:I1111
P1,V1,P2,V2
WARNING - ensure bare electrical leads are, and will remain, isolated!
Initials M 4 Da= L< ?3. Weigh the mock content assembly and record below.
Weight /2, 2 (kg)
Initials 5~ Da A2 '4. Drill a .5 in. hole in the 9975 inner containment vessel bottom center and
smooth edges. Drill and tap two groups of 3 equally spaced set screw holes,one set at 5.8 in. from the vessel top rim and the other at 9.5 in. from thevessel top rim.
Initials 2Apn4 Date 5/-t2-310
Appendix 3.5 -70 of 106
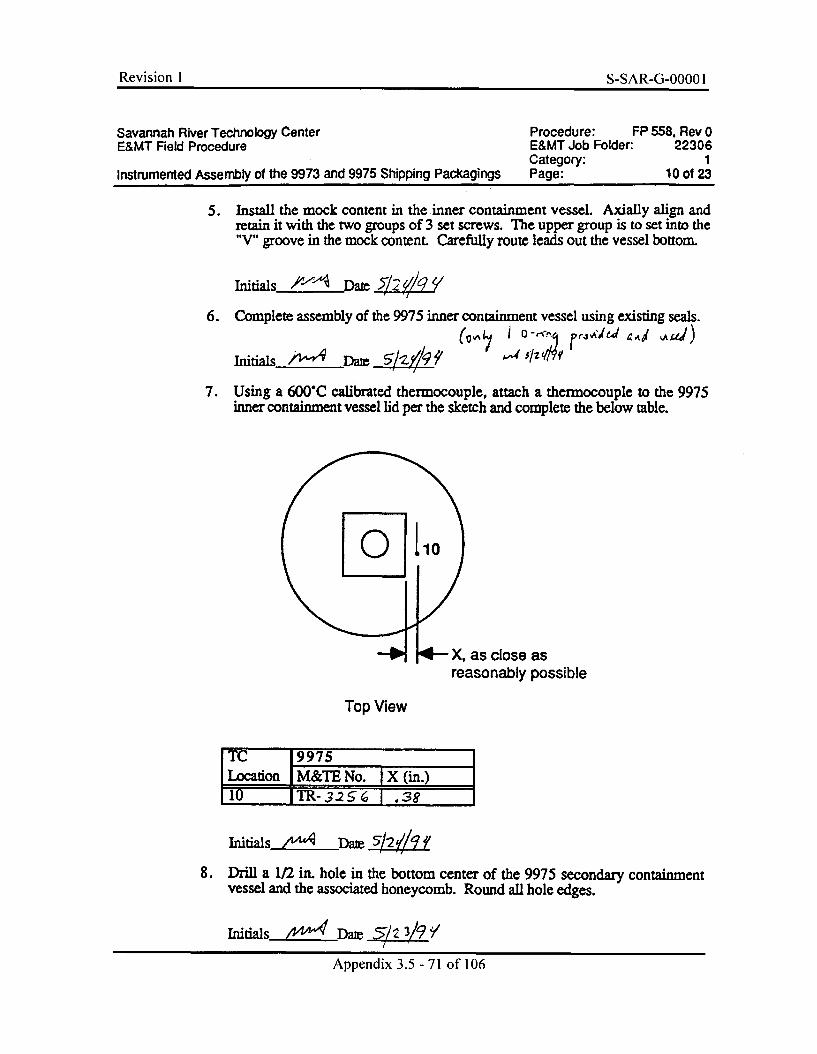
Revision 1 S-SAR-G-0000 1
Savannah River Technology Center Procedure: FP 558. Rev 0E&MT Field Procedure E&MT Job Folder: 22306
Category: 1Instrumented Assembly of the 9973 and 9975 Shipping Packagings Page: 10 of 23
5. Install the mock content in the inner containment vessel. Axially align andretain it with the two groups of 3 set screws. The upper group is to set into the"V" groove in the mock content. CarefuUy route leads out the vessel bottom.
Initials A"IDam~ 52i/zZY6. Complete assembly of the 9975 inner containment vessel using existing seals.
nDate 51-Z,//9
7. Using a 600"C calibrated thermocouple, attach a thermocouple to the 9975inner containment vessel lid per the sketch and complete the below table.
X, as close asreasonably possible
Top View
LctCo IM&TE No. Xi.
10 1TR- 3.2.536
InitialSL_ !4 Dame .5-/2 /0
8. Drill a 1/2 in. hole in the bottom center of the 9975 secondary containmentvessel and the associated honeycomb. Round all hole edges.
InitialsAppenDate 3 .5 3/9
Appendix 3.5 - 71 of 106
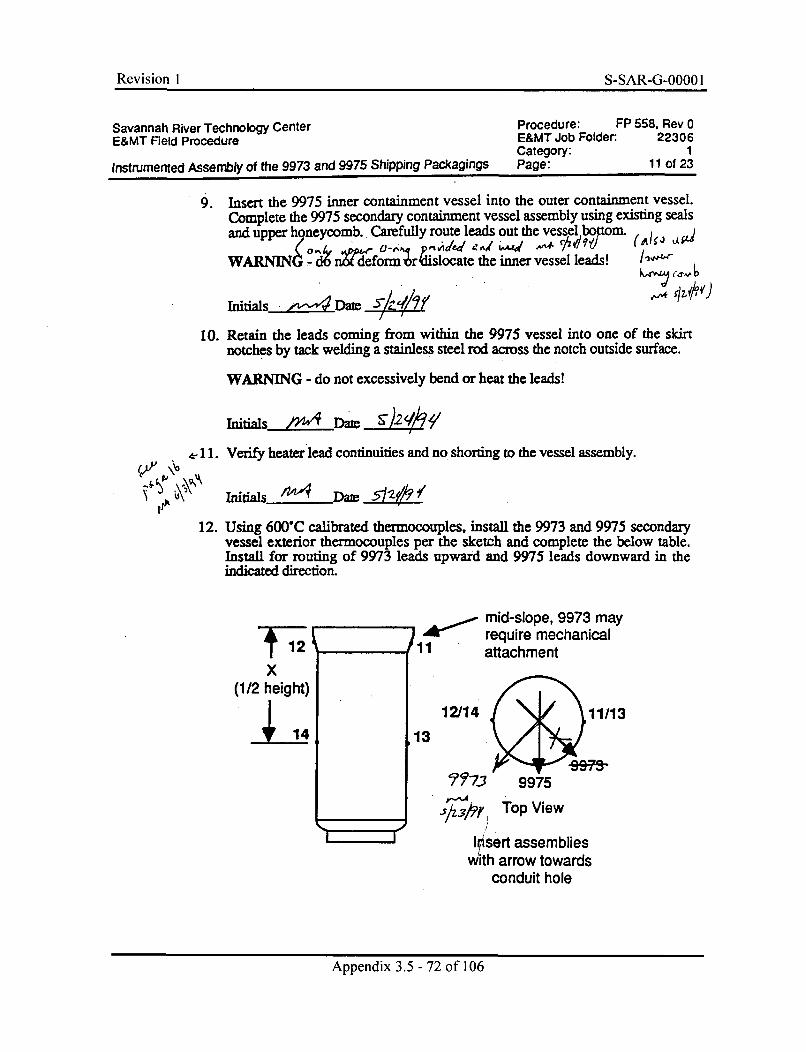
Revision 1 S-SAR-G-0000 1
Savannah River Technology Center Procedure: FP 558, Rev 0E&MT Field Procedure E&MT Job Folder: 22306
Category: 1Instrumented Assembly of the 9973 and 9975 Shipping Packagings Page: 11 of 23
9. Insert the 9975 inner containment vessel into the outer containment vessel.Complete the 9975 secondary containment vessel assembly using existing sealsand upper honeycomb. Carefully route leads out the vessel bottom.
0at^ thg ier Iese (Alds L4"
WARN`Fý - a n r' eorm.rsloate the inner vessel leads!1-4', b
InitialsL. 4Date s10. Retain the leads coming from within the 9975 vessel into one of the skirt
notches by tack welding a stainless steel rod across the notch outside surface.
WARNING - do not excessively bend or heat the leads!
4-11. Verify heater lead continuities and no shorting to the vessel assembly.
Initiais _ a"7Lk
12. Using 600C calibrated thermocouples, install the 9973 and 9975 secondaryvessel exterior thermocouples per the sketch and complete the below table.Install for routing of 9973 leads upward and 9975 leads downward in theindicated direction.
mid-slope, 9973 may12 require mechanical
11 attachmentX
(1/2 height)
'13 12/14 11/13
I
?'77 9975
,/?9,V Top View
/l5sert assemblieswith arrow towards
conduit holeApp
ndi
3.0
7 f
0
Appendix 3.5 -72 of 106
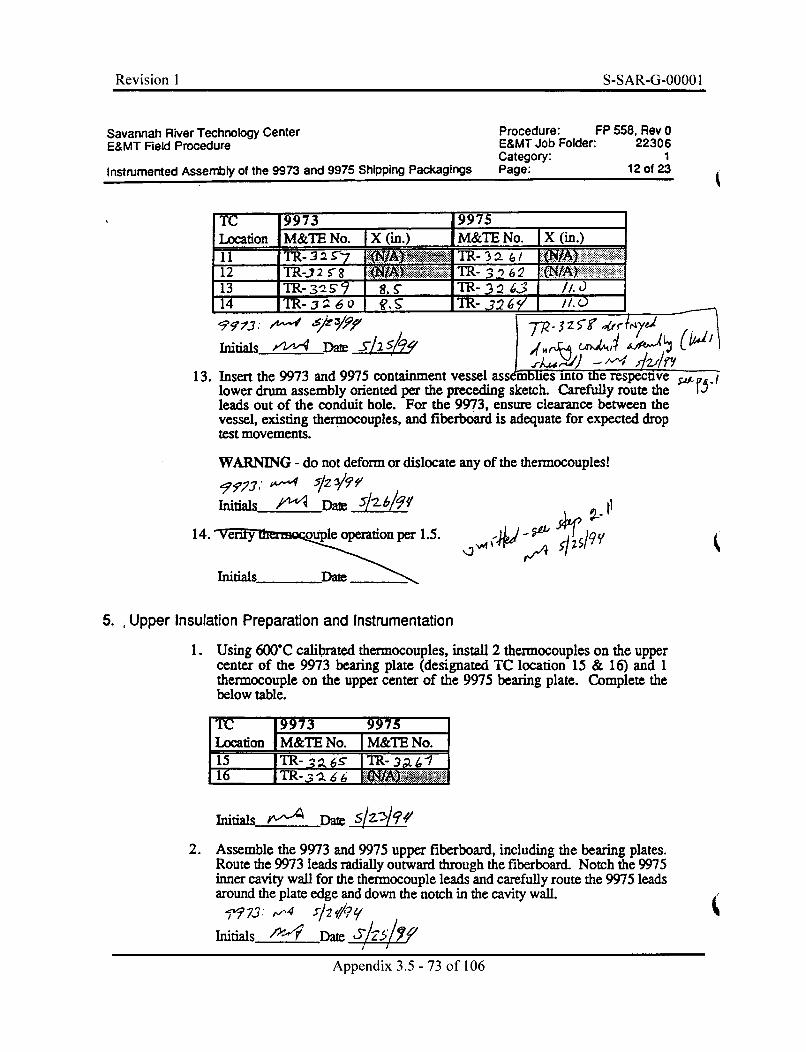
Revision I S-SAR-G-0000 1
Savannah River Technology CenterE&MT Field Procedure
Instrumented Assembly of the 9973 and 9975 Shipping Packagings
Procedure: FP 558, Rev 0E&MT Job Folder: 22306Category: 1Page: 12 of 23
TC 9973 19975Location M&TE No. X (in.) M&TE No. X (in.)
12 TR-i 2 S a _______-______ . TR- 32 62 _,
13 jTR-3'2S7q S," S TR-3 24,3 //,14 TR- 3,2 6 0 MR- ?96•' -/" //. 0
__________ A - - 4 - - -- . & a
'Ff J-7: A--V "S' 31RO
Initials #-24 Da= 1 /TPR3zS 5- (,I'd I ý
13. Insert the 9973 and 9975 containment vessel assembleis nto the respectVe .,.lower drum assembly oriented per the preceding sketch. Carefully route the I-leads out of the conduit hole. For the 9973, ensure clearance between thevessel, existing thermocouples, and fiberboard is adequate for expected droptest movements.
WARNING - do not deform or dislocate any of the thermocouples!
99IV,-J w- 5t3?PInitials /A-ý1Dai= /69
14. y ouple operation per 1.5.
IntialsDate___
fik s4f 0
5. , Upper Insulation Preparation and Instrumentation
1. Using 600'C calibrated thermocouples, install 2 thermocouples on the uppercenter of the 9973 bearing plate (designated TC location 15 & 16) and 1thermocouple on the upper center of the 9975 bearing plate. Complete thebelow table.
[TC 9973 9975Locato M&TENo. M&TENo.15 6R-T TR-~ -ýA13- TR- ".63 - -
Initials Date____3/_
2. Assemble the 9973 and 9975 upper fiberboard, including the bearing plates.Route the 9973 leads radially outward through the fiberboard. Notch the 9975inner cavity wall for the thermocouple leads and carefully route the 9975 leadsaround the plate edge and down the notch in the cavity wall.
-73: I4 -/ /2
Initials Dam - 7 fAppendix 3.5 - 73 of 106
4"
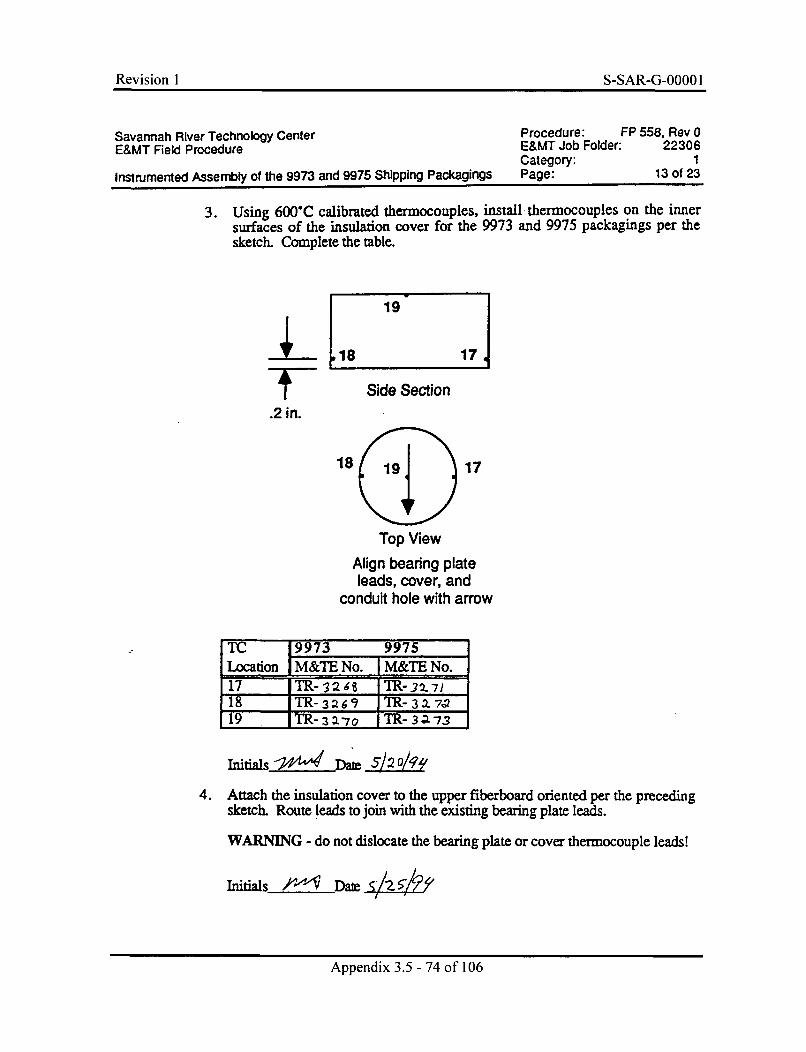
Revision 1 S-SAR-G-00001
Savannah River Technology Center Procedure: FP 558, Rev 0E&MT Field Procedure E&MT Job Folder: 22306
Category: IInstrumented Assembly of the 9973 and 9975 Shipping Packagings Page: 13 of 23
3. Using 600"C calibrated thermocouples, install thermocouples on the innersurfaces of the insulation cover for the 9973 and 9975 packagings per thesketch. Complete the table.
I-.2 in.
18
19
17.
Side Section
17
Top View
Align bearing plateleads, cover, and
conduit hole with arrow
TC 19973 9975Location M&TE No. M&TE No.17 iTR- 12- TR-317118 TR- 3 2fi TR- 3 -7,
19 TR- 3 2-7o TR- 3,. -73
Initials 1*tO4 Date o9
4. Attach the insulation cover to the upper fiberboard oriented per the precedingsketch. Route leads to join with the existing bearing plate leads.
WARNING - do not dislocate the bearing plate or cover thermocouple leads!
Initials- 4 Daiae4
Appendix 3.5 - 74 of 106
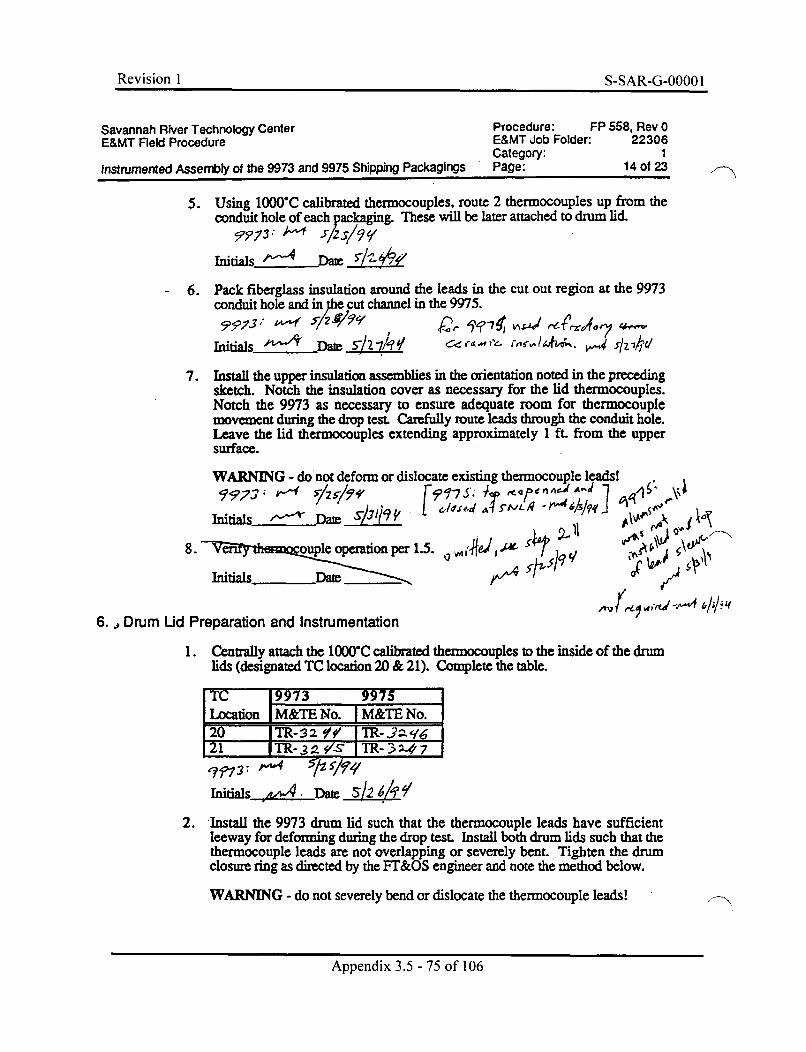
Revision 1 S-SAR-G-0000 1
Savannah River Technology Center Procedure: FP 558, Rev 0E&MT Field Procedure E&MT Job Folder: 22306
Category: 1Instrumented Assembly of the 9973 and 9975 Shipping Packagings Page: 14 of 23
5. Using 1000"C calibrated thermocouples, route 2 thermocouples up from theconduit hole of each packaging. These will be later attached to drum lid.
Initials_ - Date_ __
6. Pack fiberglass insulation around the leads in the cut out region at the 9973conduit hole and in Pe cut channel in the 9975.
Initialsj DaM 5shi/q'/ Ce11'- rwI/k..&
7. Install the upper insulation assemblies in the orientation noted in the precedingsketch. Notch the insulation cover as necessary for the lid thermocouples.Notch the 9973 as necessary to ensure adequate room for thermocouplemovement during the drop test. Carefully route leads through the conduit hole.Leave the lid thermocouples extending approximately 1 ft. from the uppersurface.
WARNING - do not deform or dislocate existing thermocouple leads!
IS " 'iv' AT kp:l" ý 04initials = D ate it %N ~ CA -k 01.
8. ouple operation ýper 1.5. Sý ? 7,~ U
nitials *• Date" 0" r
6. , Drum Ud Preparation and Instrumentation
1. Centrally attach the 1000"C calibrated thermocouples to the inside of the drumlids (designated TC location 20 & 21). Complete the table.
TC 19973 -. 997 .Iocation I M&TE No. -M&TE No.
YP4
j20 jTR-:3z9f ITR-32,961 ITR-3a/S~ ITR-3ý47
Initia~s-,u 4e Date 12 ,/
2. Install the 9973 drum lid such that the thermocouple leads have sufficientleeway for deforming during the drop test. Install both drum lids such that thethermocouple leads are not overlapping or severely bent. Tighten the drumclosure ring as directed by the FT&OS engineer and note the method below.
WARNING - do not severely bend or dislocate the thermocouple leads!
Appendix 3.5 - 75 of 106
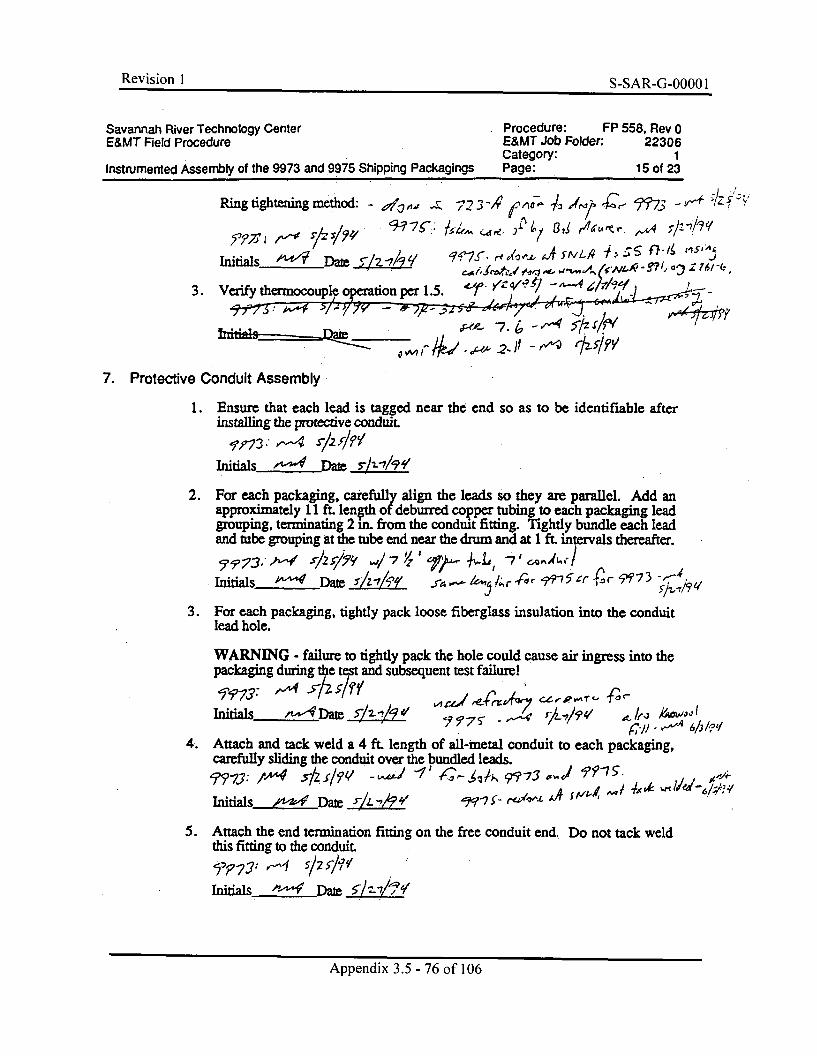
Revision I S-SAR-G-0000 IRevision 1 S-SAR-G-OOOO I
Savannah River Technology CenterE&MT Field Procedure
Instrumented Assembly of the 9973 and 9975 Shipping Packagings
Procedure: FP 558, Rev 0E&MT Job Folder: 22306Category: IPage: 15 of 23
Ring tightening method: 2 3- W, v-
Initialsý _^4-f Date ;:L:Z/
per 1.5.3. Verify
-~_-d
0~r ~-2-i
7. Protective Conduit Assembly
1. Ensure that each lead is tagged near the end so as to be identifiable afterinstalling the protective conduit.
Initials ,-t- Daz 5 fI/I/99
2. For each packaging, carefully align the leads so they am parallel. Add anapproximately 11 ft. length of deburred copper tubing to each packaging leadgrouping, terminating 2 in. from the conduit fitting. Tightly bundle each leadand tube grouping at the tube end near the drum and at 1 ft intervals thereafter.
7 'F'3,h- s S/2;/,,9 / 7 V2 ' r- 4 , ,, -7, A / -IA
Initials pLA Dae %/z1/9 _r4 i 5r W-7 r 395'7
3. For each packaging, tightly pack loose fiberglass insulation into the conduitlead hole.
WARNING - failure to tightly pack the hole could cause air ingress into thepackaging during tie tet and subsequent test failure!
Initials A/ 4 Daw " /.I I4 AIhpy
4. Attach and tack weld a 4 ft. length of all-metal conduit to each packaging,carefully sliding the conduit over the bundled leads.IFY"79: ',/ i zsf' _•,Ac -1' 9,_•!, -73,, >f
~tials2~•Date W:&i -7 S_- rld-1114 k4 SM-1,
5. Attach the end termination fitting on the free conduit end. Do not tack weldthis fitting to the conduit.
51 rl'1i
Iniias _rDate
Appendix 3.5 - 76 of 106

Revision 1 S-SAR-G-0000 I
Savannah River Technology Center Procedure: FP 558, Rev 0E&MT Field Procedure E&MT Job Folder: 22306
Category: 1Instrumented Assembly of the 9973 and 9975 Shipping Packagings Page: 16 of 23
6 431
? '~)rh
6. Perform a final thermocouple verification check per 1.5 and record the resultsin Table 1. For uninstalled thermocouples, merely note "NA".
" 9'9, ' 7 -k . ,-5 7 -7 -1,- " f L
Initials /- D at A!•/ •r ' " "4 *'" -
7. Carefully slip a length of heavy wall plastic or similar tube over the remainingexposed leads and join to the conduit with a union fitting or another suitablemeans. Fix this protective conduit assembly to the packaging sufficient fordrop testing (9973) and shipment to Albuquerque. This may require fixing tothe drums by tack welded wires and, for the 9973, making and tack welding aprotective roll bar on the drum side at the conduit connection.
Ini iti as I -A . -5 11
Records
The following documents shall be retained as records in accordance with SRTC Liprocedure 8.17:
1. This approved procedure (prior to use), per the E&MT procedure controlsystem
2. This procedure once completed.
References
1. E&MT Procedure No. FP 516, Rev. 0, "Load Procedure for the PrimaryContainment Vessel of the 9973 & 9974 Shipping Containers."
2. E&MT Procedure No. FP 519, Rev. 0, "Load & Leak Test Procedure forSecondary Containment Vessel of the 9972 Family of ShippingContainers."
3. ASTM Standard E-1350-91, "Standard Test Methods for Testing SheathedThermocouples Prior to, During, and After Installation."
I ~c~f~ t12) 1.4)
/,.s 4 C "• , , !f, - ""/ 6/Vl'f
, If -A pd x, . 5 -7 7 of 0 W
Appendix 3.5 - 77 of 106
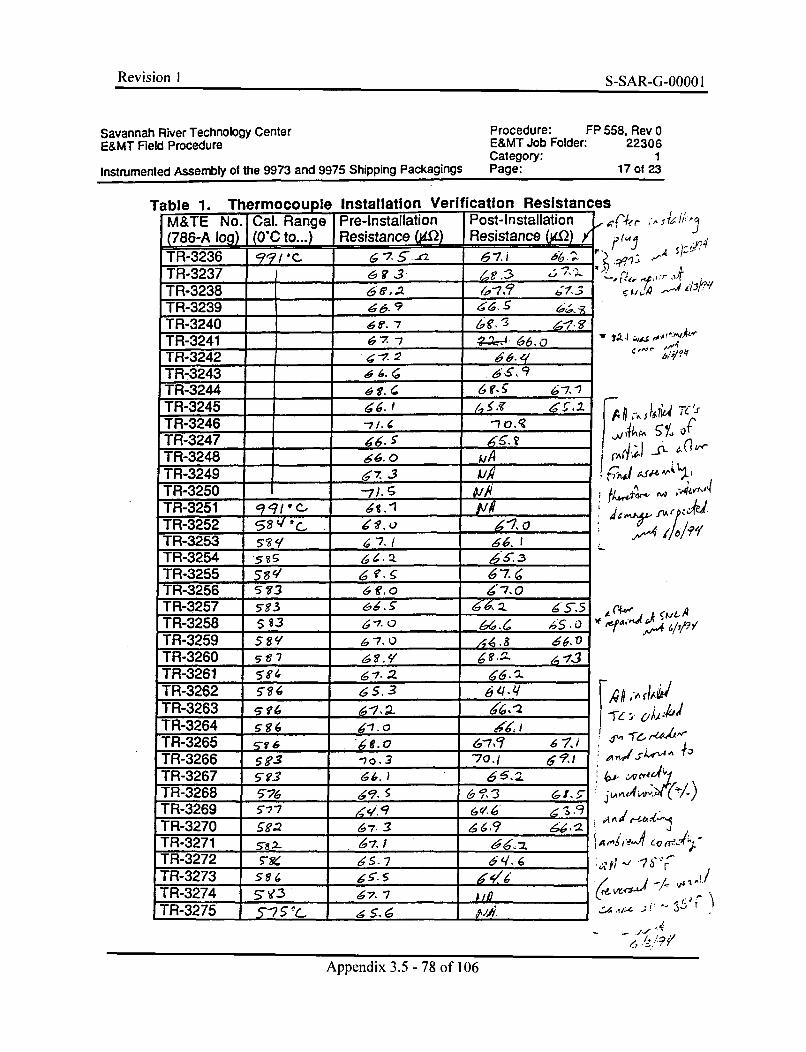
Revision I S-SAR-G-00001I
Savannah River Technology Center Procedure: FP 558, Rev 0E&MT Field Procedure E&MT Job Folder: 22306
Category: 1Instrumented Assembly of the 9973 and 9975 Shipping Packagings Page: 17 of 23
Tr,ft 6 I'm ' Th~irmna'~numnl~ In~ftalI~tInn VArifk~tinn RA~I~tAnc~A~.h rnn Io Verification Resistances....
M&TE No. Cal. Range Pre-Installation Post-Installation(786-A log) (0"C to...) Resistance (gO) Resistance (j-a2,TR-3236 t"-/c.6. -7.5"-- a 6-1. iTR-3237 6 4 ., .TR-3238 _ _,_,_ _ _--7,' j7..TR-3239 66. 9 676. STR-3240 6?. 7 S,
TR-3241 67. -7 6--. 66, oTR-3242 •-^. 2 66.4'TR-3243 _ £.c• 6'.. 9TR-3244 .- 7.-7TR-3245 .'
TR-3246 -._-_I o._ _
TR-3247 -6. "•. 'TR-3248 66.0TR-3249 44_ _____
TR-3250 . "__ .____ ___
TR-3251 ,9qi•C., q1_ ,"___,_TR-3252 58q 4. ,o"7,0TR-3253 4'V - 7.1 66. 1TR-3254 5es 5r.2. ,,__'. _
TR-3255 58' 6-7.TR-3256 533,o 02'-7. oTR-3257 5-3 64. ."; 46, z-TR-3258 ss3 6-.. 6,1.. 65.TR-3259 59 6 -7. , 1. ;1.8
TR-3260 5r s_-1_9._- _ 68.1-TR-3261 5 Y / 6-7.2TR-3262 s-?6 65.3 6144TR-3263 6•1.,. _-___, __
TR-3264 5.6oTR-3265 :;'16 8.0 66- 67.,TR-3266 _____ -70.3 617 ,
TR-3267 5g3 ? 64. 1 ___.__.
TR-3268 5-76 9.5 ,',3TR-3269 5`77 /"/,-'9 _____ ,_ _ .TR-3270 5e__--, 67.3 66.9TR-3271 5_81-_ 67.1 6.2.TR-3272 5-% _15_. 7 __ _q. _
TR-3273 ___ _,, _ g!5. _ _ _ _ _ _
TR-3274 S7V-3 4 67.-7 ___ M
TR-3275 5"7 "s. -,
114J
A
,- t '1 .P
",w .,. /- /
It, •/,W -,•'i- ''••€¢,€,r t'•
o/./,
F1Q-6daTe;.Ov 'u
j ".-r
6 Lcq7'"•
Appendix 3.5 - 78 of 106
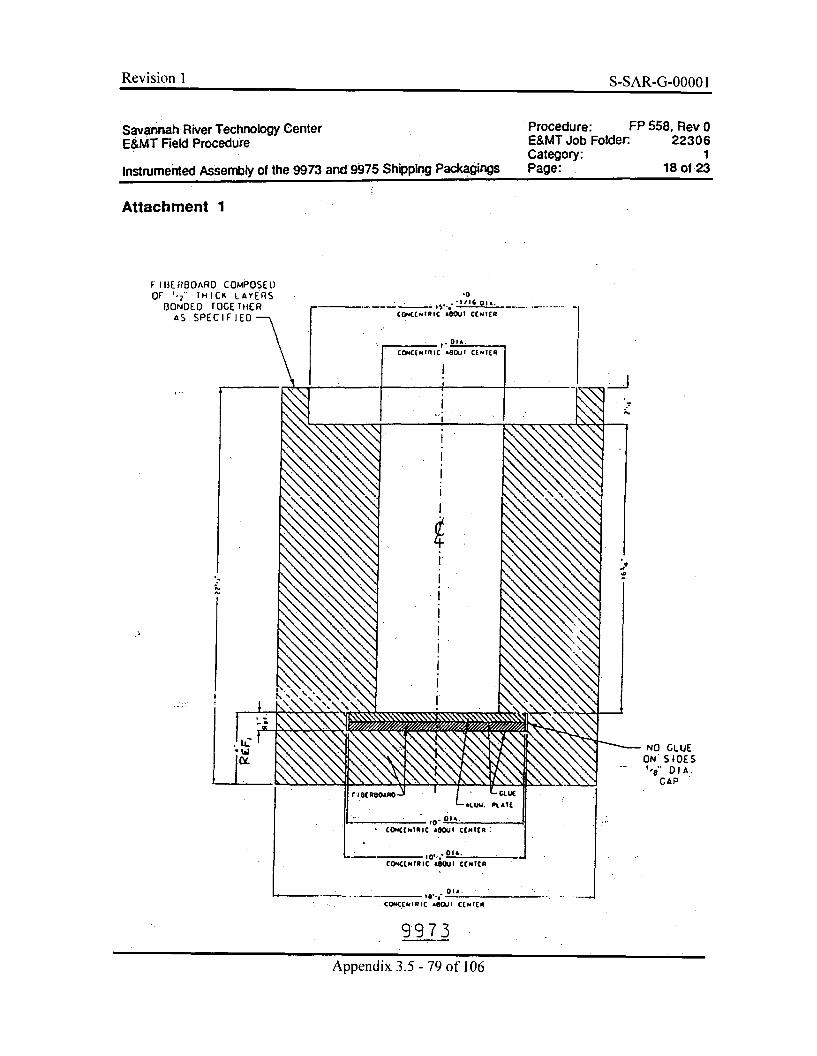
Revision 1 S-SAR-G-0000 1
Savannah River Technology Center Procedure: FP 558, Rev 0
E&MT Field Procedure E&MT Job Folder: 22306Category: 1
Instrumented Assembly of the 9973 and 9975 Shipping Packagings Page: 18 of 23
Attachment 1
F II3ERBOARO COMPOSEI)OF '-2" THICK LAYERS
BONDED TOGETHERAS SPECIFIED -"\
NO CLUEON SIDES1,>'" DIA.
GAP
9973
Appendix 3.5 - 79 of 106
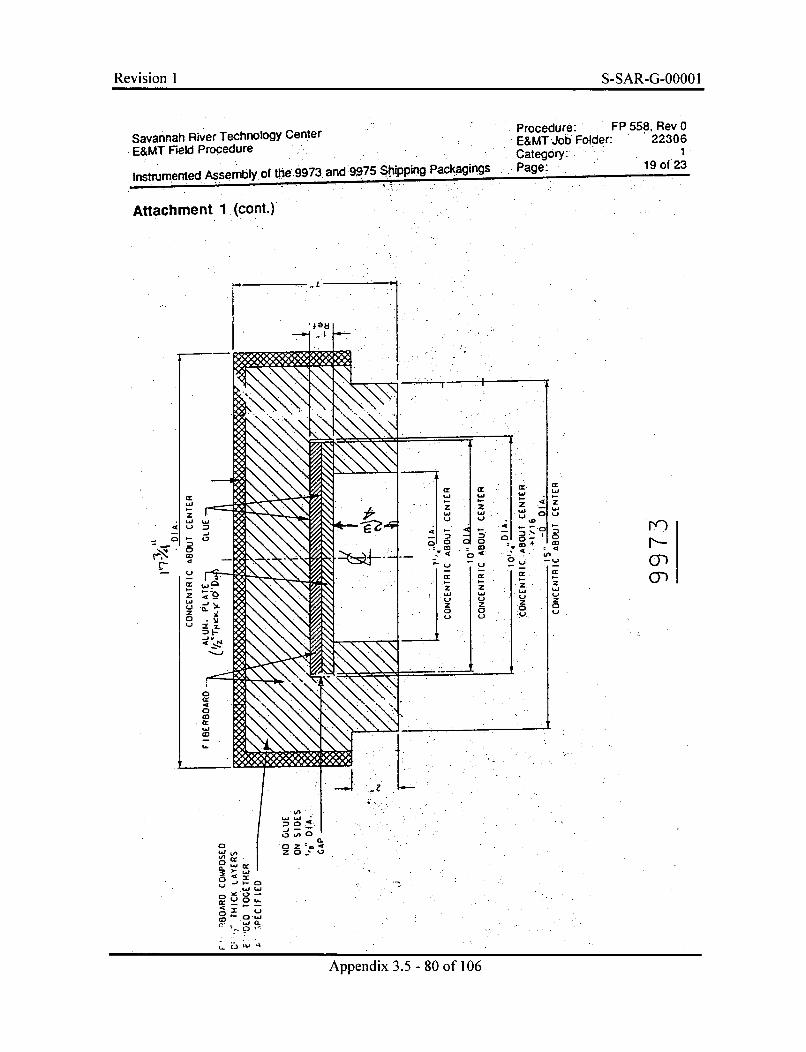
Revision 1 S-SAR-G-0000 1
Procedure: FP 558. Rev 0Savannah River Technology Center Foc d 2230E&MT Field Procedure E&MT Job Folder: 22306
Category:ntad995SppnPcagings
instrumented Assembly of the ,9973 and . 9975 hipping Packgng Page: ' 19 of 23
Attachment 1 (cont.)
"L f za~ .. .
S~-- ~ C + CD U
_ 0
. . . . : • " i" '"
• .... . . .
zZ
0La
COa-0"
Appendix 3.5 - 80 of 106
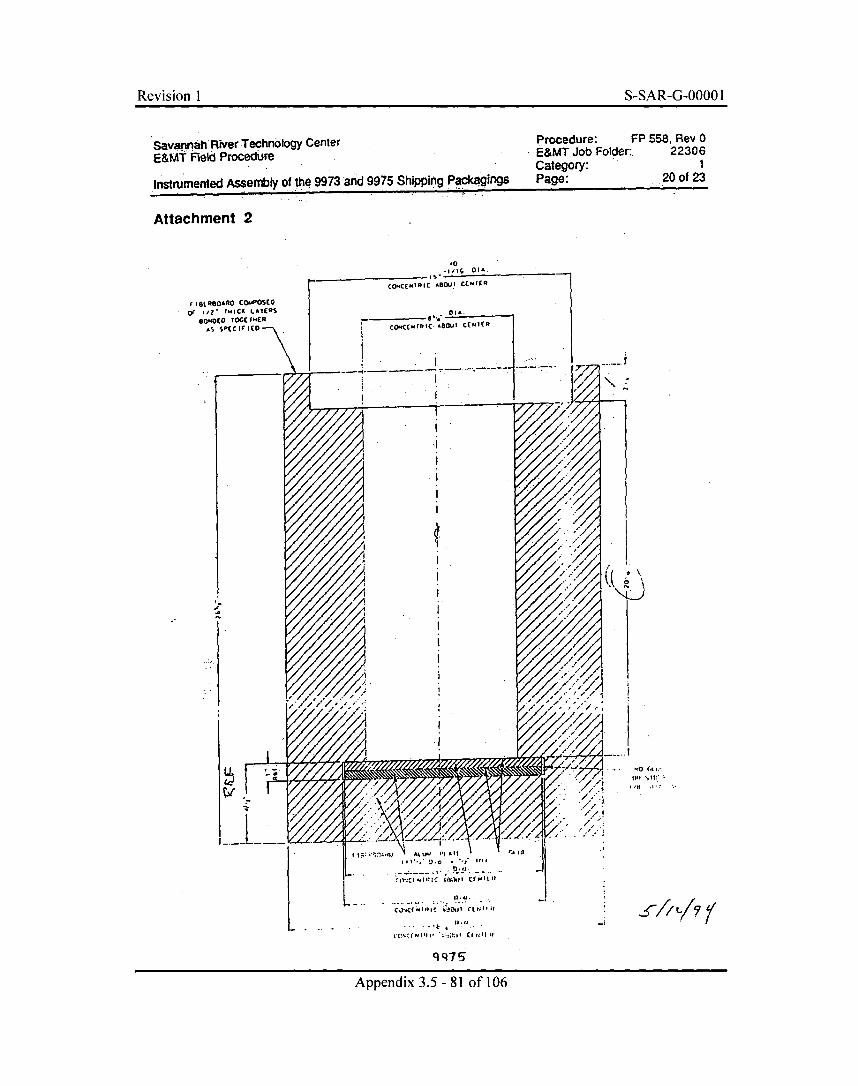
Revision 1 S-SAR-G-0000 1
Savannah River Technology CenterE&MT Field Procedure
Instrumented Assembly of the 9973 'and 9975 Shipping Packagings
Procedure: FP 558, Rev 0E&MT Job Folder:. 22306Category: 1Page: ....20 of 23
Attachment 2
"a CL I~;iwi *,ll,.
'14
A%~t .. wz abut 11 ;
lilt -
CY.CflllfllC ajOul CLl~llU
11.11
q-75
Appendix 3.5 - 81 of 106
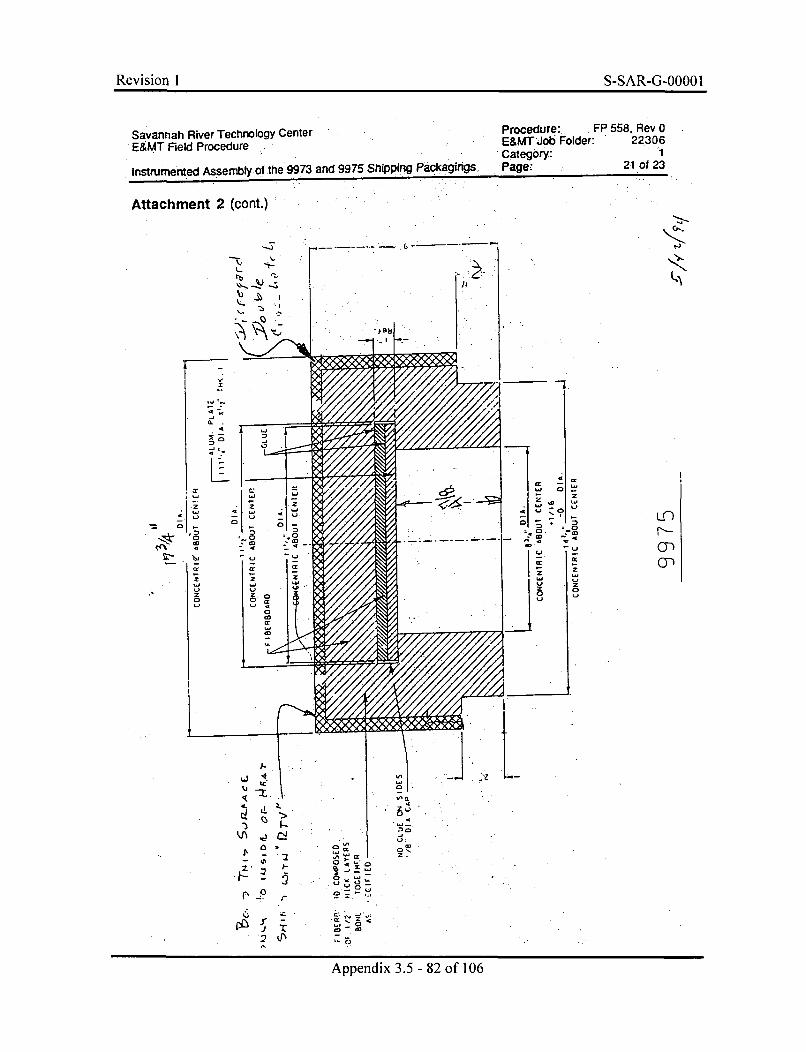
Revision I S-SAR-G-0000 IRevision 1 S-SAR-G-OOOO 1
Savannah River Technology CenterE&MT Field Procedure
Instrumented Assembly. o!the 9973 and 9975 Shipping PackagingS.
Procedure: . FP 558, Rev 0E&MT Job Folder: 22.306Category: IPage: 21 of 23
Attachment 2 (cont.)C?-
--
IXC
Z.
z
0•
2=20
mn
A-
,j
a
rtI-
10 ' C.
rC- ., ..
.t . . _. •
A2
Appendix 3.5 -82 of 106
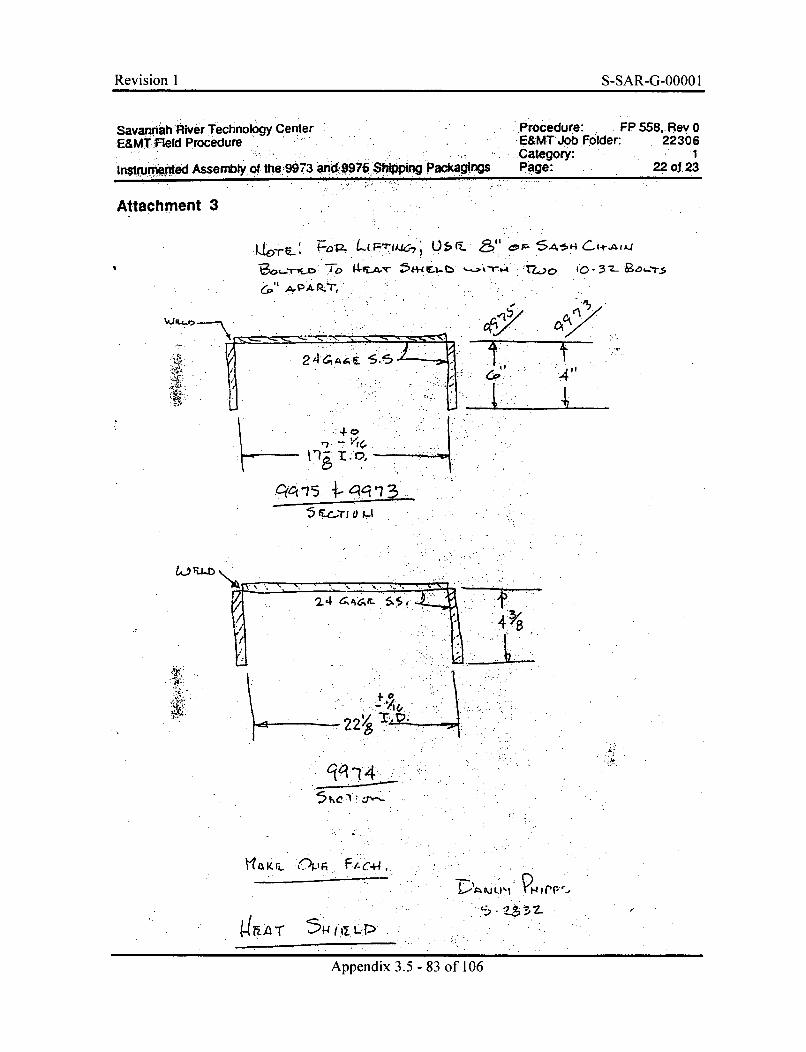
Revision 1 S-SAR-G-0000 I
SavannahRiver Technology Center ...Procedure: FP 558, Rev 0-E&MT Field Procedure E&MT Job Folder: 22306
.. Category: 1lnsum ed Assembly Qf the 9973 and-... 7 Whing Packagings Page:. 22123ins an 99. .-g .. .....
Attachment 3
L ' ,,,.. 0 -r• 5 " ,-^4+ AW
-JO
.2 4 , S,1
. .40
qA '7. ..c ...
5 rC..-TI V• M
1..
22!/~T
Appendix 3.5 -83 of 106
Revision IRevision IS-S AR-£4-A000 I
Savannah River Technology CenterE&MT Field Procedure
Instrumented Assembly of the 9973 and 9975 Shipping Packagings
Procedure: FP 558, Rev 0E&MT Job Folder: 22306Category: 1Page: 23 of 23
Attachment 4
Example Thermocouple Attachments
Appendix 3.5 - 84 of 106
Revision I S-SAR-G-0000 I
730-A FILE ROOM, PROJECT FOLDER 22381SRT-PrG-94-0058APPENDIX 2July 25, 1994
APPENDIX 2
WSRC TEST REQUIREMENTS FOR 9973 AND 9975 PACKAGING TESTING (U),WSRC Memorandum SRT-PTG-94-0033, M. N. Van Alstine to W. Gill, May 23, 1994.
Appendix 3.5 - 85 of 106
Revision I S-SAR-G-O000 1
( Westinghouse P0 8ox 616
Savannah River Company Aiken. SC 29802
SRT-PTG-94-0033
May 23, 1994
Mr. Walter GillSandia National LaboratoriesP. O. Box 5800Mail Stop 1135Albuquerque, NM 87185-1135
Attention: Mr. Walter Gill
Dear Walt:
WSRC TEST REQUIREMENTS FOR 9973 AND 9975 PACKAGING TESTING (U'
This memorandum identifies WSRC's test requirements for SNLA's thermal testing of the9973 and 9975 packagings. In general, SNLA test work shall be planned, coordinated,controlled, and performed in accordance with approved written procedures or equivalent testplanning documents developed and approved per SNLA work control implementingprocedures. SNLA shall address the included WSRC test requirements.
WSRC will provide assembled and internally instruments packagings and additionalthermocouples. WSRC is responsible for post-test disassembly and evaluation of thepackaging hardware.
Test Planning
" SNLA shall prepare a test procedure or equivalent test planning documentationaddressing the information identified in the attachment
" The SNLA test procedure shall be uniquely identifiable, legible, and retrievable.
* SNLA shall document review of the test procedure for technical and administrativedetails prior to approval. SNLA should provide WSRC a draft by May 27, 1994.
* SNLA shall include myself or my designee and the WSRC Quality liaison, whom I willidentify, on the test procedure approval.
* SNLA shall ensure that personnel performing test activities are trained and qualified.
Test Performance
• SNLA shall perform the test following the documents prepared during test planning.
Appendix 3.5 - 86 of 106
Revision I S-SAR-G-0000 I
Mr. Walter GillSRT-PTG-94-0033Page 2 of 4
Evaluation of Test Results and Data
SNLA shall evaluate and in the test report document the comparison of the resultsobtained to the acceptance criteria in the attachment. The test report is to also describethe test requirements, facilities, procedures, and test execution.
The SNLA test report author shall sign and date the test report draft and forward it tomyself or my designee. WSRC shall accept or reject the test report based on theevaluation adequacy. If WSRC rejects the test report, SNLA and WSRC shall work toresolve the deficiencies.
0 Upon written WSRC acceptance of the test report, SNLA shall distribute the fimal report,including 10 copies to myself or my designee.
Post Test Hardware Disposition
• SNLA shall offer to WSRC custody of all test materials provided by WSRC, and shallassist WSRC in return transportation of materials.
* WSRC shall assume responsible for final disposition of all WSRC test materials.
Records
SNLA shall provide myself or my designee with the following records:
" Approved test procedure in prior to use condition
* Completed test procedure, including data records (3.5 in. diskettes)
" Test report as noted previously
* Any associated nonconformance documents indicating resolution of nonconformingconditions
" Any additional supporting documentation or documents deemed as records as prescribedwithin the SNIA test procedure
We tentatively are scheduled for performing these tests the week of June 5, 1994. Pleaseschedule the SNLA test planning accordingly.
Sincerely,
Mark N. Van Alstine, Senior EngineerSavannah River Technology Center
CC: R. J. Gromada, WSRC, 773-53AE. KI Opperman, WSRC, 773-54AJ. Pardo, WSRC, 992-IWS. J. Hensel, 773-42AJ. W. Jerrell, 773-42A
Appendix 3.5 - 87 of 106
Revision I S-SAR-G-0000 I
Mr. Walter GillSRT-PTG-94-0033Page 3 of 4
ATTACHMENT
Objective
WSRC requires that 2 tests be performed. An undamaged 9975 packaging will be tested toprovide bench marking support for WSRC analytical models. A damaged 9973 packagingwill be tested as part of the 10 CFR 71.73 hypothetical accident condition (HAQ) sequence.
SNLA is to provide this testing per the acceptance criteria and requirements below and is to
document the degree that the acceptance criteria have been satisfied.
Acceptance Criteria
" For the 9973 HAC test, SNLA shall provide sufficient evidence that the heatingenvironment satisfied 10 CFR 71.73 (c)(3) and that the minimum drum temperature wasmaintained at > 815"C for the regulatory time. The maximum drum temperature shouldnot exceed 1040"C.
* For the 9975 preheat, SNLA shall report packaging and ambient temperatures and noteambient conditions relative to the shade and still air requirement.
" For the 9975 benchmark, SNLA shall provide sufficient evidence that the heatingenvironment satisfied 10 CFR 71.73 (c)(3) but with the drum temperature sidesmaintained at 815±10"C for the regulatory time. (The minimum drum temperature willlikely be less than 800"C.)
• For the 9975, SNLA shall provide evidence that the heater power level remained 21+2. 1/-0 W except during brief periods (less than 1 hr) for packaging movement, during whichpower may be suspended.
* SNLA shall provide sufficient evidence that the remaining requirements of 10 CFR 71.73(b) and (c)(3) have been satisfied.
" SNLA shall provide a conclusive assessment of the functionality of all thermocouplesduring the tests.
Hold Points
SNLA shall have approval of the WSRC test engineer" prior to installing insulation on the instrumentation leads (WSRC shall verify that the
nitrogen purge and instrumentation leads are connected)." prior to initiating the thermal test (WSRC shall verify that the orientation is correct, the
instrumentation leads are protected, the data acquisition system is ready with correctchannel to thermocouple correspondence, and the packaging is at steady state).
" prior to test termination (WSRC shall verify that the packaging is at steady state).
Deviations
* SNLA shall obtain approval of the WSRC test engineer and quality assurance liaisonprior to an otherwise not permitted deviation from the approved test procedure.
Test Requirements
" SNLA shall provide the packaging fixturing." SNLA shall provide a nitrogen purge with attachment for the 1/4 in. packaging tube." SNIA shall provide sufficient insulation to protect instrumentation leads." SNLA measuring and test equipment calibrations shall be current and traceable to NIST.• SNLA shall allow test access to cleared WSRC personnel.
Appendix 3.5 - 88 of 106
Revision 1 S-SAR-G-0000 1
Mr. Walter GillSRT-PTG-94-0033Page 4 of 4
" SNLA shall be amenable to installing external thermocouples as provided by WSRC." SNLA shall assess proper function of facility and packaging thermocouples prior to and
following the tests.• SNILA shall provide attachment of a pressure tap line (.25 in. dia. stainless steel tubing) to
a tap in each packaging.• SNiA shall provide and operate instrumentation and data acquisition with capabilities for
* 22 channels of type K thermocouple couple input from each packaging* a controlled power supply for the 21W heater .* a 1 kPa pressure transducer for dead head pressure reading from a tap line (NIST
traceability optional)* data acquisition with storage to DOS-formatted 3.5 in. diskettes.
• SNLA shall measure pre and post test drum diameters at consistent central locations.• For the 9973, SNLA shall acquire ambient and packaging temperatures and pressure
throughout the test duration at an interval of 10 seconds.* For the 9975, SNLA shall acquire ambient and packaging temperatures at an interval of
10 minutes during the preheat and shall acquire ambient and packaging temperatures andpressure throughout the test duration at an interval of 10 seconds.
" SNLA shall preheat the 9975 by energizing the internal heater to the prescribed powerand perform the preheat in a shaded, still air environment.
• SNIA shall test the 9973 packaging on its side with the instrumentation conduit down.* SNLA shall test the 9975 packaging upright with maximum thermal symmetry.• SNLA shall initiate each test when the packaging temperatures reach steady state in a
normal (approx. 25C) ambient. This may take up to 5 days for the 9975 preheat.* SNLA shall terminate each test when post-heat temperatures cool to steady state.
Appendix 3.5 - 89 of 106
Revision I S-SAR-G-O000 I
730-A FILE ROOM, PROJECT FOLDER 22381SRT-PTG-94-0058APPENDIX 3July 25, 1994
APPENDIX 3
DISASSEMBLING THE 9973 AND 9975 THERMAL TEST PACKAGINGS (U), WSRCSRTC E&MT Procedure FP 570, Rev. 0 (Performed June and July, 1994)
Appendix 3.5 - 90 of 106
Revision I S-SAR-G-0000 1
* Savannah River Technology CenterE&MT Field Procedure
Disassembling the 9973 and 9975 Thermal Test Packagings
Procedure: FP 570, Rev 0E&MT Job Folder: 22306PTG Project File: PTG-PF-001Category: 1Effective: 6/16/94Page: I of 12
Disassembling the 9973 and 9975 Thermal Test Packagings
Approvals
(U)
P&T Engineer ~4z44Z ~Date: 6hiz 9'!
P&T Task Leader.
SRTC CQF~
A 14 DateL.•zZ
Date4lo./~6/
E&MT Manager
Purpose
This procedure ensures that test data is recovered during disassembly of the 9973and 9975 shipping packagings that have been thermally tested.
Scope
This procedure specifically applies to the 9973 and 9975 packagings that have beenassembled per procedure FP 558, rev. 0, and have been tested at Sandia NationalLaboratory the week of June 5, 1994.
Piocedure performance assumes close cooperation of the test engineer and shoppersonneL The test engineer will direct the work and be allowed substantial leewayduring disassembly. This is appropriate since this work is custom in nature.
Terms and Definitions
9973 and 9975 packagings - Prototype drum-type radioactive materialspackagings produced by execution of procedure FP 558, rev. 0.
WORKING COPYCOPIED BY 9LCOPY DATE A
EXP. DATE LI3
Appendix 3.5 - 91 of 106
Revision 1 S-SAR-G-0000 1
Savannah River Technology Center Procedure: FP 570, Rev 0E&MT Field Procedure E&MT Job Folder: 22306
Category: 1Disassembling the 9973 and 9975 Thermal Test Packagings Page: 2 of 12
Responsibilities
P&T Task Leader
The E&MT Packaging and Transportation task leader is responsible foroverall task coordination, including the work covered in this procedure
* allowing work past engineering witness points (if this waives otherwitnesses, he shall note this in the procedure next to their names).
P&T Engineer
The E&MT Packaging and Transportation engineer is responsible for0 the test engineer role, including preparing this procedure0 initialing and dating each step upon satisfactory completion* obtaining task leader approval before passing engineering witness points* approving and noting within the procedure all deviations to this procedure
other than engineering wimess point waivers
Shop Foreman
The Shop Foreman is responsible for• providing qualified personnel to assist in executing this procedure* providing a safe shop environment for doing this work-
Safety
Shop personnel are to know and follow shop safety practices. E&MT personnelare responsible for heeding shop safety rules.
The 9975 sleeve may require special controls due to its being lead.
Acceptance Criteria
The acceptance criteria is that the P&T engineer has initialed and dated eachprocedure step and any associated deviations.
Required Instrumentation and Equipment
The following equipment is necessary to perform this procedure:
* typical shop mechanical and fabrication tools (e.g.. wrenches, drills, etc.)* 9973 and 9975 packagings* VHS video camera and 35mm still camera
Appendix 3.5 - 92 of 106
Revision I ,q-.q A R -•_(•fifiO 1Revison IS-S AR-£LAAAA I
Savannah River Technology CenterE&MT Reid Procedure
Disassembling the 9973 and 9975 Thermal Test Packagings
Procedure: FP 570, Rev 0E&MT Job Folder: 22306Category: 1Page: 3 of 12
Procedure
1. General
1. During disassembly, mark the relative locations of all parts using a highlyvisible, durable marker. Someone should be able to reassemble the parts basedon the markings.
.2. All parts are to be retained and stored inside as directed by the P&T engineer.
3. Observations must include the following as applicable:* when relative to a thermocouple (TC) location, the TC M&TE number• TC attachment condition• note char depths relative to inner undamaged surface* traces of water condensation* effe•ts of conduit penetrationSdrop damage effects to 9973* movement (tollapse, etc.) of parts* heat marks and exhaust patterns* evidence of burning* effects of adjacent features.
4. Cut TC and wire leads as necessary for disassembly.
5. Take enough video and still pictures throughout for complete reference.
2. 9973 Disassembly
1. Remove the conduit cover up to the drum fitting. Record observations below.
54 f'-"1 "SA IZ ,•Ki/ , %dr 14 e, Z /r d l
".A& M PMAI rpL f-,,
Initials_42~ Date 16/1 71y2. Remove the drum lid using the closure bolt and ring. Record observations
below.
n 3 / 9
Appendix 3.5 - 93 of 106
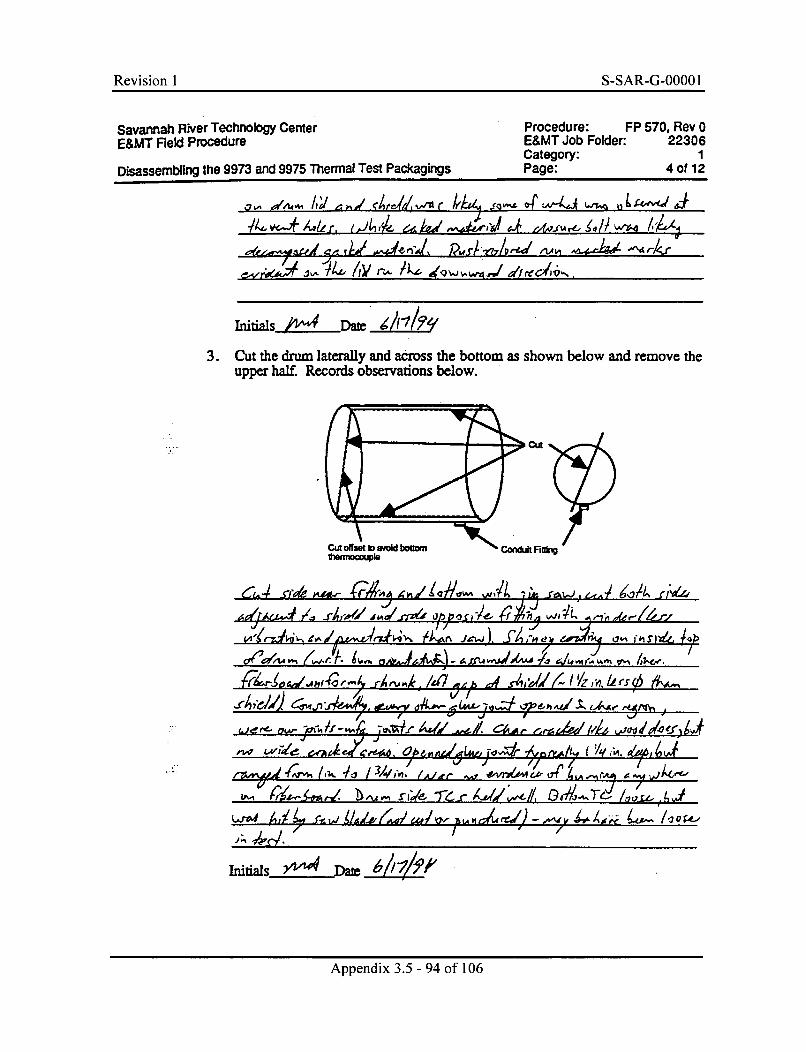
Revision I S-SAR-G-0000 IRevision 1 S-SAR-G-OOOO I
Savannah River Technology Center Procedure: FP 570, Rev 0E&MT Field Procedure E&MT Job Folder: 22306
Category: 1Disassembling the 9973 and 9975 Thermal Test Packagings Page: 4 of 12
3. Cut the drum laterally and across the bottom as shown below and remove theupper half. Records observations below.
cut
Cu offset W iod bottom CorWdut FiRf•mnocopIe
, r jaw) 4bV " I t
1AIe A, iJ/ ,ý1 AV
S- I w VreL..) A-dol ,4 /-,
6 z,4 , /ztly/- X S 11,4a) A 0 r,-,A$.
initils-21ý Dat
Appendix 3.5 - 94 of 106
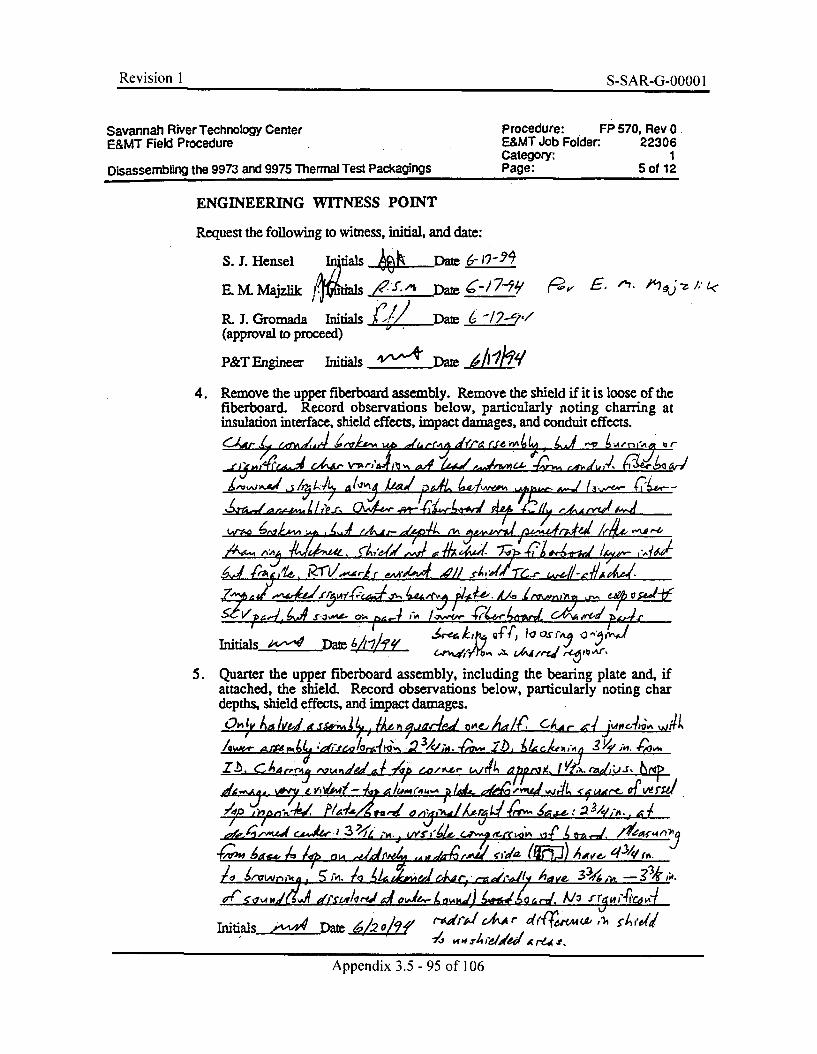
Revision I S-SAR-G-00001Revison IS-SAR-G-0000 1
Savannah River Technology Center Procedure: FP 570, Rev 0E&MT Field Procedure E&MT Job Folder: 22306
Category: 1Disassembling the 9973 and 9975 Thermal Test Packagings Page: 5 of 12
ENGINEERING WITNESS POINT
Request the following to witness, initial, and date:
S. 3. Hensel Initials _ D40 6--
E. Kvi Majzlik lins /.<' S' In Da 1<
R. J. Gromada Initials -/ Date 6 -/?-W,/(approval to proceed)
P&T Engineer Initials .D . "
4. Remove the upper fiberboard assembly. Remove the shield if it is loose of thefiberboard. Record observations below, particularly noting charring atinsulation interface, shield effects, impact damages, and conduit effects.
CJ.. nijJA&,w M ,s . j ~
- - Vp6 V '.4 f
4 4 " ' -•-'/ fhD ,•41.,-4 A /,,J
Initials e-A __D Date 7V
5. Quarter the upper fiberboard assembly, including the bearing plate and, ifattached, the shield. Record observations below, particularly noting chardepths, shield effects, and impact damages.
•. . 2-". / 4 .- b .
/ / II 4
/h. /i4 ."d, Ala
/od . 4,,.,,,ljiq. 5m. I, A , do•,,-Ie . ,y ,,JIV Atgve 34, -34,,.
Initials -,,-•Date A/2 f0 r~AA Fpedi d3.5- M E5 of"106
Appendix 3.5 - 95 of 106
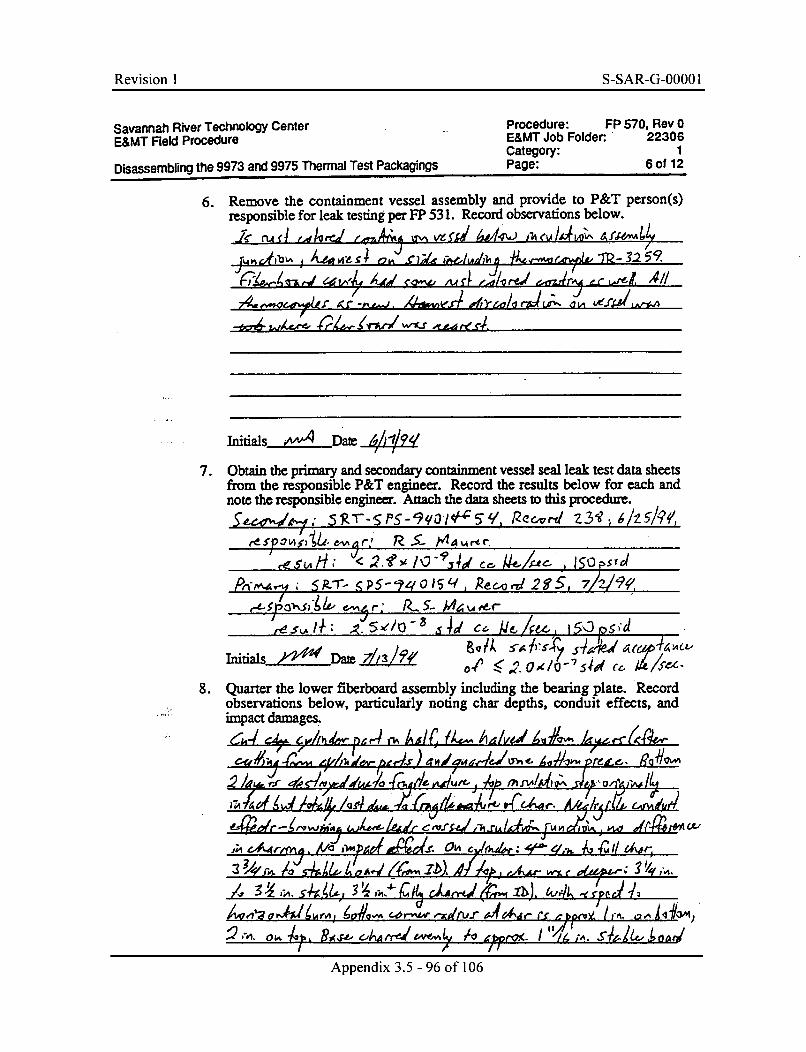
Revision I S-SAR-G-0000 I
Savannah River Technology Center Procedure: FP 570, Rev 0E&MT Field Procedure E&MT Job Folder' 22306
Category: 1
Disassembling the 9973 and 9975 Thermal Test Packagings Page: 6 of 12
6. Remove the containment vessel assembly and provide to P&T person(s)responsible for leak testing per FP 53 1. Record observations below.
kmes 1;/ /i&d1 ýZ 25
JuiicA'ib W Adji 4 "L' /U~ r -ir'ý ~i, r ef.rd 1A/
.. k.e•.,~ £~- rZ/ IK
Initials__A/Vý -a t &
7. Obtain the primary and secondary containment vessel seal leak test data sheetsfrom the responsible P&T engineer. Record the results below for each andnote the responsible engineer. Attach the data sheets to this procedure.
re5H-" 2 e,/% -4 r YXel2 ~~- 15o psi d '
observations below, particulIaly noting char depths, conduit effects, and• I&impact damages.
S SL/. . s. , e 4I 15 1/ d
d7 / 4,~C~'VV~dt~ ~ /~a ~Y
I IF .Ajr. Iw, " "/N~ iA
I t 1
Appendix 3.5 - 96 of 106
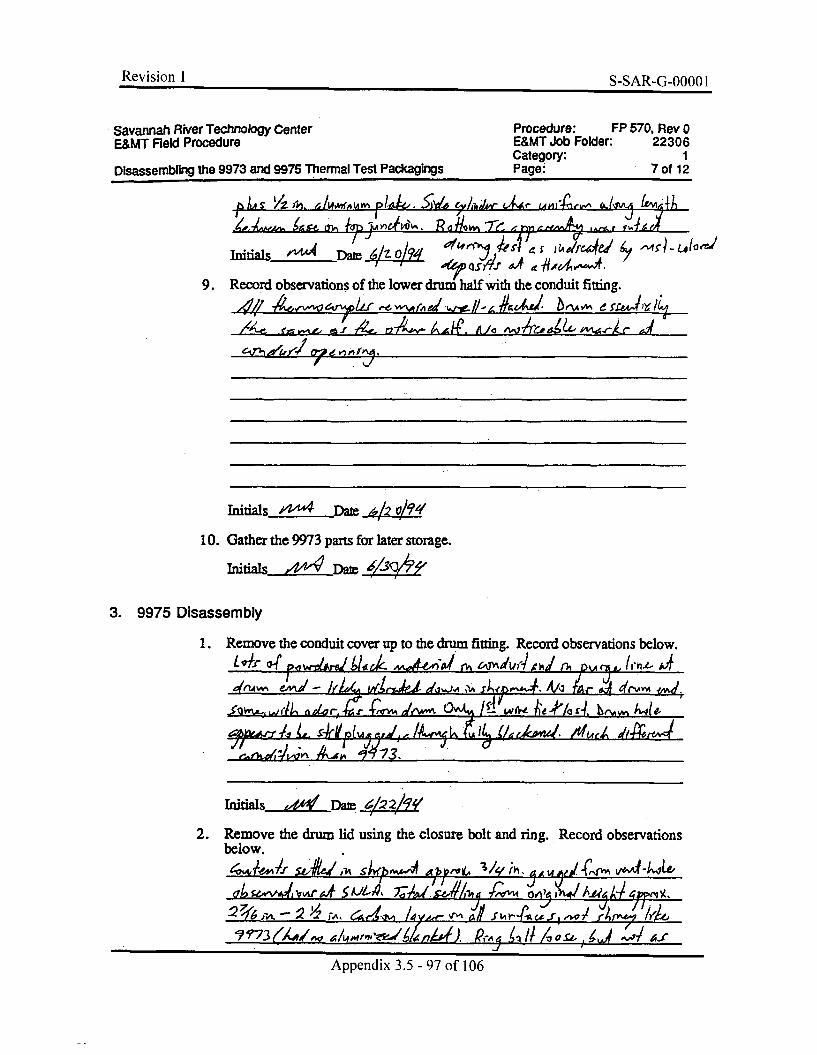
Revision I •-•A tl -•,-flfl(If) 1Revision 1S-S AR-G-0000 I
Savannah River Technology CenterE&MT Field Procedure
Disassembling the 9973 and 9975 Thermal Test Packagings
Procedure: FP 570, Rev 0E&MT Job Folder: 22306Category: 1Page: 7 of 12
I ' 40st-r - r 4, s-Va ,,Wntials '!ý Dae1gL 6sfJ='i~ird~ I
9. Record observations of the lower drum half with the conduit fitting.
/0o11
7' '. V'
Initials2 ±DAie~ Ah o?4
10. Gather the 9973 parts for later storage.
Intidals-Z-LDate /r
3. 9975 Disassembly
1. Remove the conduit cover up to the drum fitting. Record observations below.
Wnk I.!-~~21 Aftd~d4,SI•.&,L,I(I, Oor•,,• •, /,, • I • /,/ , t
dl , • F
Indisia -dejýDate 2/f
2. Remove the drum lid using the closure bolt and ring. Record observationsbelow.
.i •4Vi- Ud J, 1.
Appendix 3.5 - 97 of 106
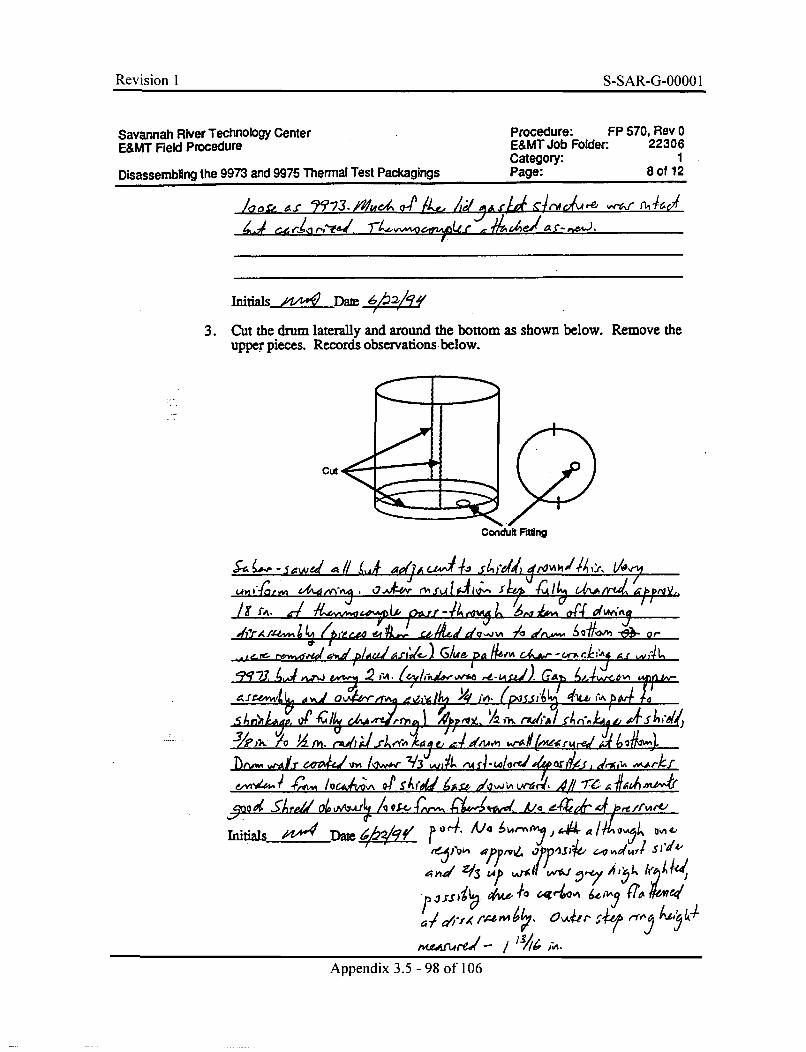
Revision 1 S-SAR-G-0000 1
Savannah River Technology Center Procedure: FP 570, Rev 0E&MT Field Procedure E&MT Job Folder: 22306
Category: 1Disassembling the 9973 and 9975 Thermal Test Packagings Page: 8 of 12
h04 o yA W,?3. d ILJ, lid A fA
InidalsLZZ Date -6~
3. Cut the drum laterally and around the bottom as shown below. Remove theupper pieces. Records observations below.
Conduit Firng
£d--vwd4 /( adps44 LiSA . 4w 7v4l ,sWLk O~f14~ S 4,) i d uIAM142 V9
,U-n, ..•l r fy 446ff,.,.i ,]4 •, .• /,, -/ 0,.,., rVo-/4dIV f6 o1A" rýa~,-
.,- rv'•~ i /~'AJh- /4 s C-& ,dJICI rI
7 .Q-
-A , .ng a~gd i k W,-~ G/w 64 .*/L - ce-A r k; A-
Intidals &4 VI-* ý A. " bth.-I
e,,. df-tw 7 yY.,, 4 s,• ,4,, s. ,.d"
,AA•.tJ- / "/4 ,;.
Appendix 3.5 - 98 of 106
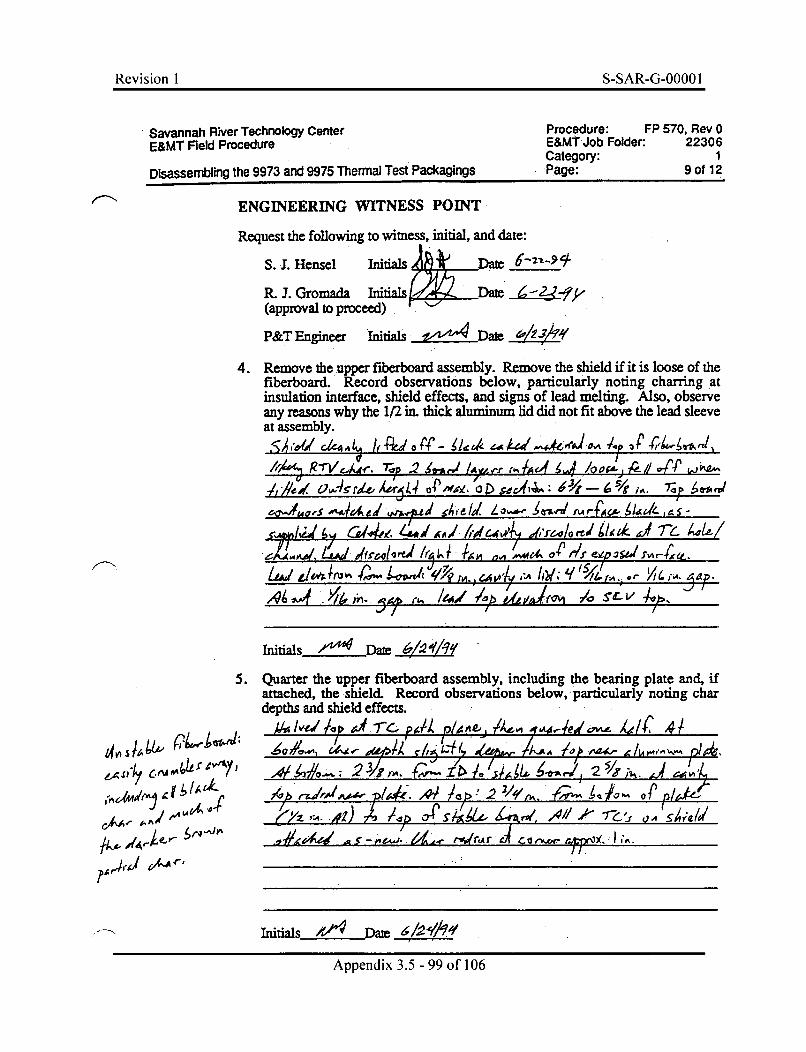
Revision I S-SAR-G-0000 IRevision 1 S-SAR-G-OOOO 1
Savannah River Technology Center Procedure: FP 570, Rev 0E&MT Field Procedure E&MT Job Folder: 22306
Category: 1Disassembling the 9973 and 9975 Thermal Test Packagings Page: 9 of 12.
ENGINEERING WITNESS POINT
Request the following to witness, initial, and date:
S. J. Hensel Iniial Dae>=~ -
R. J. Gromada Initials [ E• Date -9-(approval to proceed)
P&T Engineer Initials "r± Date •/•3,/94-
4. Remove the upper fiberboard assembly. Remove the shield ff it is loose of thefiberboard. Record observations below, particularly noting charring atinsulation interface, shield effects, and signs of lead. melting. Also, observeany reasons why the 1/2 in. thick aluminum lid did not fit above the lead sleeveat assembly.
SAW /f~t k4ido4 0 r - "4 a 4aPR-rV4A~di. TOP-.2 Ifr Avrf 0, 9,4 _IOg Ie wg
111aas"id'0P~ k z11VAW &0L4 /OO%'-sŽ/ 9114dl-,e,
4 I'
L1&.//4 '~ k~d kl/f U&'.l hW qi '1' ;
I&~~, _A -r
,• . ,•,,, • (' i,/4 /a b,,J( /o S-L V4 .
Initials-X" Daie_____
5. Quarter the upper fiberboard assembly, including the bearing plate and, ifattached, the shield. Record observations below, particularly noting chardepths and shield effects.
gg/w.,~¶/I' 4, di-C. Psit o,:,/4pte /Xc 4d-Ie'~4 kd/f 41
4o' Aao, 4,; odi~ C2~Zj /I IV4r- W~ft A,li ' . /•"ý ý . h .1
c.L4 ,4, #,.A-% ,4 / I x s, I,
ti , .2 .
dq S
I--
#"W A'
Appendix 3.5 - 99 of 106
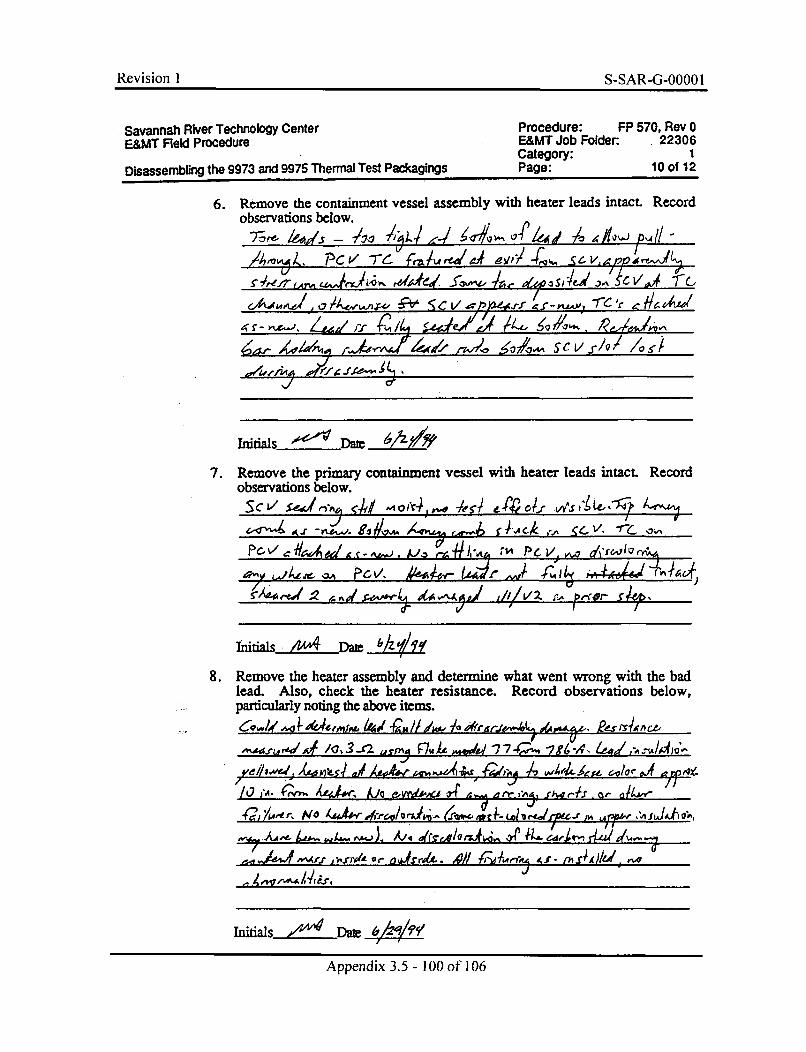
Revision I S-SAR-G-00001I
Savannah River Technology Center Procedure: FP 570, Rev 0E&MT Field Procedure E&MT Job Folder: 22306
Category: 1Disassembling the 9973 and 9975 Thermal Test Packagings Page: 10 of 12
6. Remove the containment vessel assembly with heater leads intact. Recordobservations below.
~~). - ' o'/sla V.~4, 4/ -ý
4 I.tZze,,
A~,/.,/J" 4#e4' . J47 CA-I /I-
7.
Initals~~Di ~
Remove the primary containment vessel with heater leads intact. Recordobservations below.
Sc'-' (-74/ -A Cs k V. Xol~'G4L
PjhC, rm( gs-.&i/ 1~-/, z1 -a P ,Aod A
4( A,.o /ZIAAP~ir itit 'rV
Initials . +4LDate.Ž
8. Remove the heater assembly and determine what went wrong with the badlead. Also, check. the heater resistance. Record observations below,particularly noting the above items.
A%",rfj'-d1A /'O3-a P.7WAM~ .d 7 4;;, g 12-.4~ ~,-~
d'i-Y-W, ýmxsl d/ A4#t m w.,z4, - , -A ,ý4kf4 elo- W
/0 JA- U b~*4 AJO CVrL&ACi 0-A & fklAfi~f a-%J lJ/o ,-. •'../w,< Aj. Wrg g /a .m6.ý,-. e,ý• l,,
_IZI INZY 0 r N F0V -,YA f-f 10d
InitalAs Z" _Date b/21'
Appendix 3.5 - 100 of 106
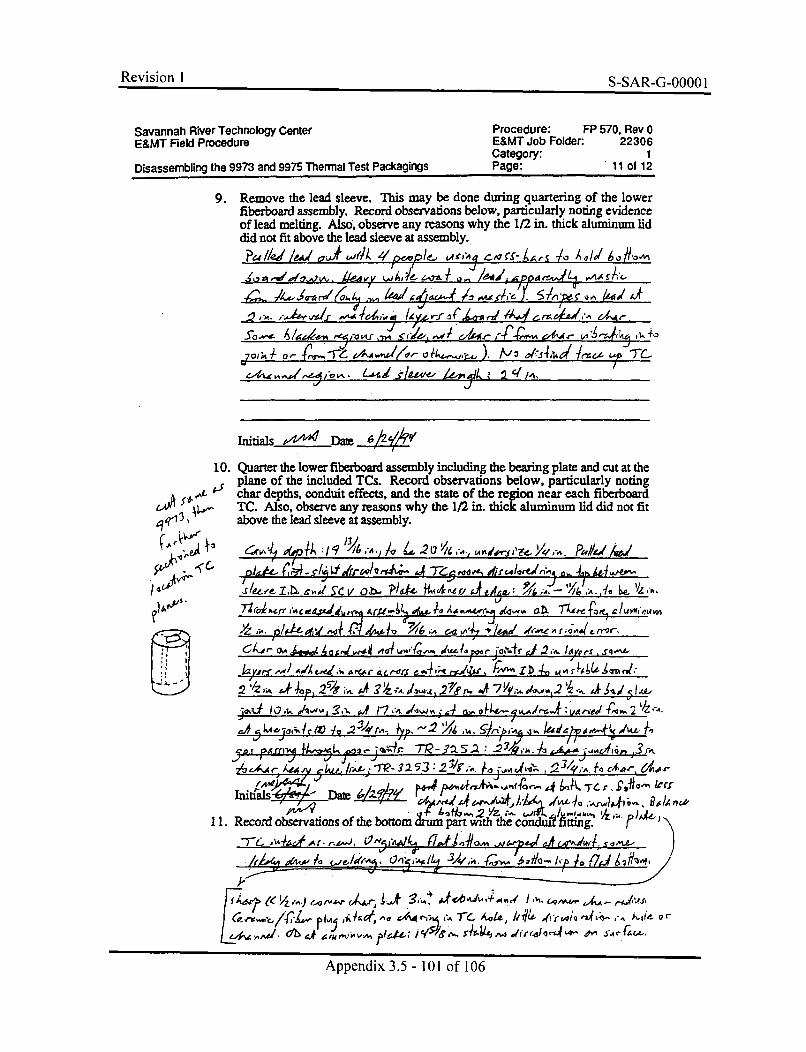
Revision I q-4Z A P• _(-_nnnn IRevision 1 ARJ~JbAAA1
Savannah River Technology CenterE&MT Field Procedure
Disassembling the 9973 and 9975 Thermal Test Packagings
Procedure: FP 570, Rev 0E&MT Job Folder: 22306Category: 1Page: 11 of 12
9. Remove the lead sleeve. This may be done during quartering of the lowerfiberboard assembly. Record observations below, particularly noting evidenceof lead melting. Also, observe any reasons why the 1/2 in. thick aluminum liddid not fit above the lead sleeve at assembly.
zao, 0 /.V3 01"54.J(,, &i~- u A,!4ed,,, ,- TA .OL, /eLdd/ 9-S 1/ m, •
lnitials k!!ý Date
10. Quarter the lower fiberboard assembly including the bearing plate and cut at theplane of the included TCs. Record observations below, particularly notingchar depths, conduit effects, and the state of the region near each fiberboardTC. Also, observe any reasons why the 1/2 in. thick aluminum lid did not fitabove the lead sleeve at assembly.
SgA V~ ab4. 714 ~ý 4 Agre jdV
)'nrLr/,r ,jCw cddu, M ." 4 d da-,, a, . 7--Zi',,-..- ,I, 4 M
]2v" ." me- Oi .2. J , I I
-ý' 1- 251- ;. .4 2! .2e.J7yup4, Q' V#
5 .rA2 ' • A" l fs -M-'/'P5362V
InkA~ Tf le
I1. Record observations of the bottom &ru part-'with the condui h;ýg. "~PJk
-rL.~~ ~~ -4~ .C a- ~.r~J.~ d*i •,, i. cge• / ,,..i. /i,.. , 4 .4 4 .
Appendix 3.5- 101 of 106
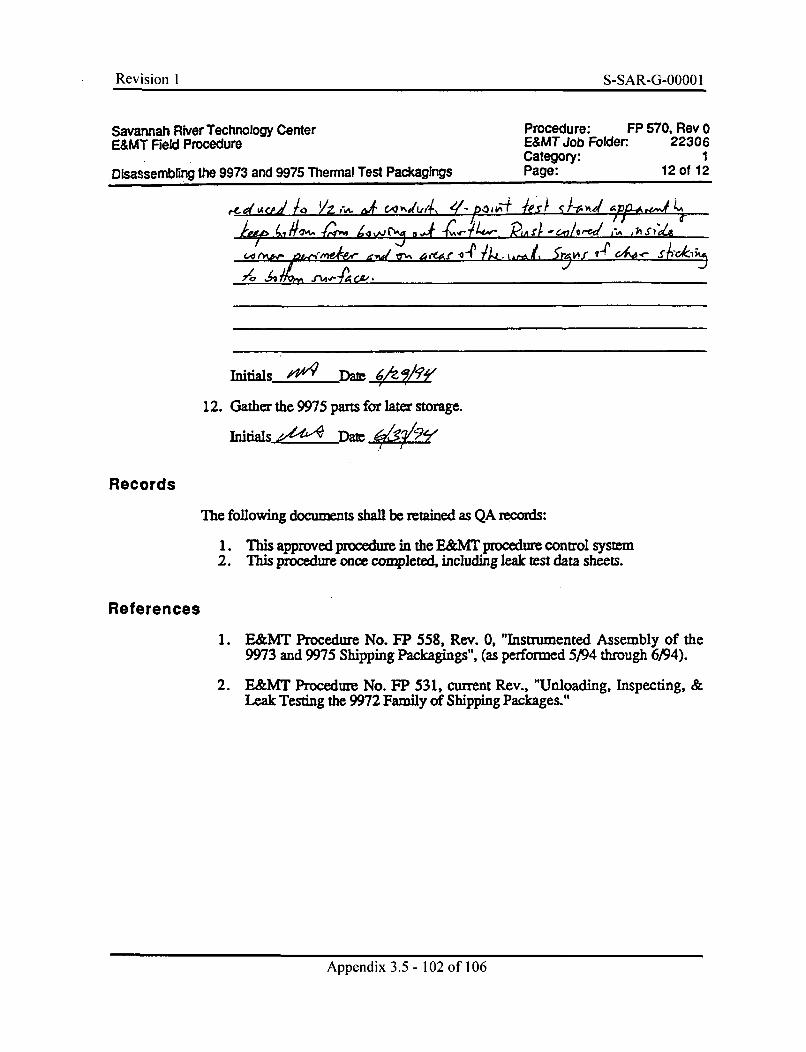
Revision I S-SAR-G-0000 1
Savannah River Technology Center Procedure: FP 570, Rev 0E&MT Field Procedure E&MT Job Folder: 22306
Category: 1Disassembling the 9973 and 9975 Thermal Test Packagings Page: 12 of 12
,6 , ,, A ..- ,.,."
Initials _Da• 6 '
12. Gather the 9975 parts for later storage.
Inials• Dam q
Records
The following documents shall be retained as QA records:
1. This approved procedure in the E&MT procedure control system2. This procedure once completed, including leak test data sheets.
References
1. E&MT Procedure No. FP 558, Rev. 0, "Instrumented Assembly of the9973 and 9975 Shipping Packagings", (as performed 5/94 through 6/94).
2. E&MT Procedure No. FP 531, current Rev., "Unloading, Inspecting, &Leak Testing the 9972 Family of Shipping Packages."
Appendix 3.5 - 102 of 106
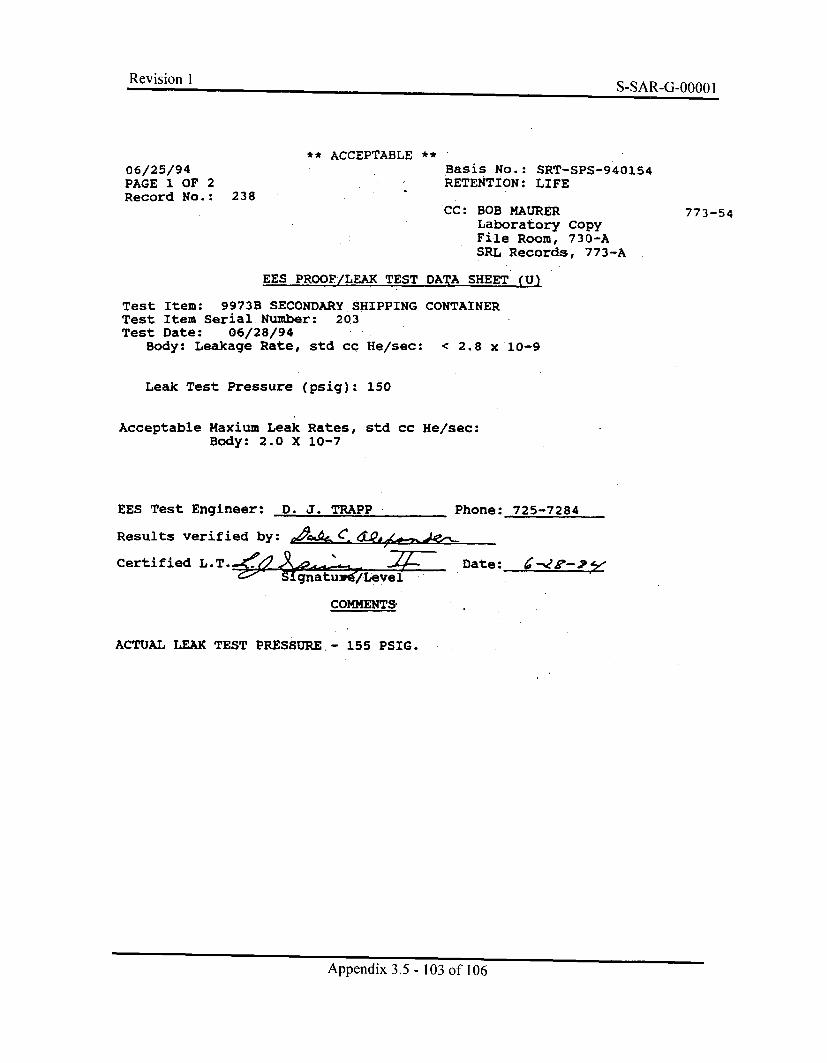
Revision I Q QAD C- -1k.J-VVVV I
** ACCEPTABLE **
06/25/94PAGE 1 OF 2Record No.: 238
Basis No.: SRT-SPS-940154RETENTION: LIFE
CC: BOB MAURERLaboratory CopyFile Room, 730-ASRL Records, 773-A
773-54
EES PROOF/LEAK TEST DATA SHEET (U)
Test Item: 9973B SECONDARY SHIPPING CONTAINERTest Item Serial-Number: 203Test Date: 06/28/94
Body: Leakage Rate, std cc He/sec: < 2.8 x 10⁻⁹
Leak Test Pressure (psig): 150
Acceptable Maxium Leak Rates, std cc He/sec:Body: 2.0 X 10⁻⁷
EES Test Engineer: D. J. TRAPP Phone: 725-7284
Results verified by: C _
Certified L.T.~SignatuC/Level
COMMENTS-
ACTUAL LEAK TEST PRESSURE.- 155 PSIG.
Date: C-2S-5;
Appendix 3.5 - 103 of 106
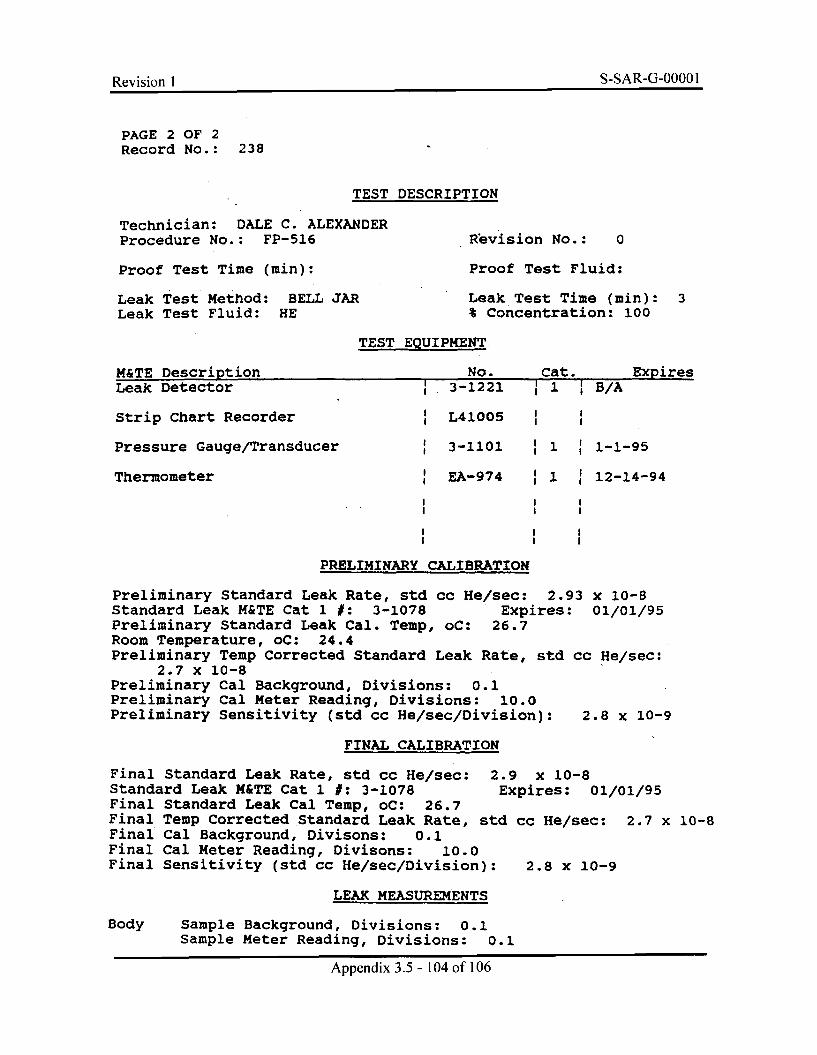
Revirion 1 S-SAR-G-0000 IRe~vision 1I-A-GOO
PAGE 2 OF 2Record No.: 238
TEST DESCRIPTION
Technician: DALE C. ALEXANDERProcedure No.: FP-516
Proof Test Time (min):
Leak Test Method: BELL JARLeak Test Fluid: HE
Revision No.: 0
Proof Test Fluid:
Leak Test Time (min): 3% Concentration: 100
TEST EQUIPMENT
M&TE DescriptionLeak Detector
Strip Chart Recorder
Pressure Gauge/Transducer
Thermometer
No. Cat.3-1221 1
ExpiresB/A
L41005 I II I
3-1101 1 1-1-95
EA-974 1 12-14-94
I II I
I II I
PRELIMINARY CALIBRATION
Preliminary Standard Leak Rate, std cc He/sec: 2.93 x 10⁻⁸Standard Leak M&TE Cat 1 1: 3-1078 Expires: 01/01/95Preliminary Standard Leak Cal. Temp, oC: 26.7Room Temperature, oC: 24.4Preliminary Temp Corrected Standard Leak Rate, std cc He/sec:
2.7 x 10⁻⁸Preliminary Cal Background, Divisions: 0.1Preliminary Cal Meter Reading, Divisions: 10.0Preliminary Sensitivity (std cc He/sec/Division): 2.8 x 10⁻⁹
FINAL CALIBRATION
Final Standard Leak Rate, std cc He/sec: 2.9 x 10⁻⁸Standard Leak M&TE Cat 1 1: 3-1078 Expires: 01/01/95Final Standard Leak Cal Temp, oC: 26.7Final Temp Corrected Standard Leak Rate, std cc He/sec: 2.7 x 10⁻⁸Final Cal Background, Divisons: 0.1Final Cal Meter Reading, Divisons: 10.0Final Sensitivity (std cc He/sec/Division): 2.8 x 10⁻⁹
LEAK MEASUREMENTS
Body Sample Background, Divisions: 0.1Sample Meter Reading, Divisions: 0.1
Appendix 3.5 - 104 of 106
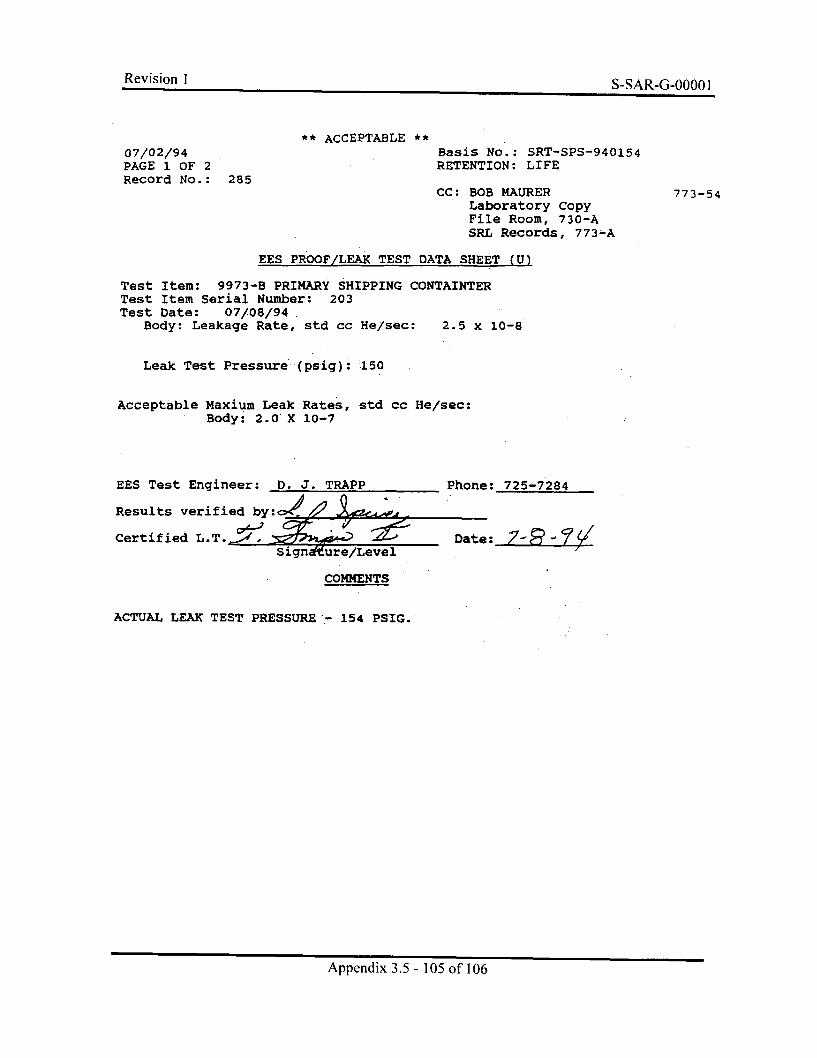
Revision I ,q-•q A R -•-/INON IRIsionS-SAL R -f- 0 1
** ACCEPTABLE **
07/02/94PAGE 1 OF 2Record No.: 285
Basis No.: SRT-SPS-940154RETENTION: LIFE
CC: BOB MAURERLaboratory CopyFile Room, 730-ASRL Records, 773-A
773-54
EES PROOF/LEAK TEST DATA SHEET (Ui
Test Item: 9973-B PRIMARY SHIPPING CONTAINTERTest Item Serial Number: 203Test Date: 07/08/94
Body: Leakage Rate, std cc He/sec: 2.5 x 10⁻⁸
Leak Test Pressure (psig): .150
Acceptable Haxium Leak Rates, std cc He/sec:Body: 2.0 X 10⁻⁷
EES Test Engineer: D. J. TRAPP Phone: 725-7284
Results verified by:.-/),
Certified L.T.. ' • Date: 7-Signakure/Level
COMMENTS
ACTUAL LEAK TEST PRESSURE - 154 PSIG.
Appendix 3.5 - 105 of 106
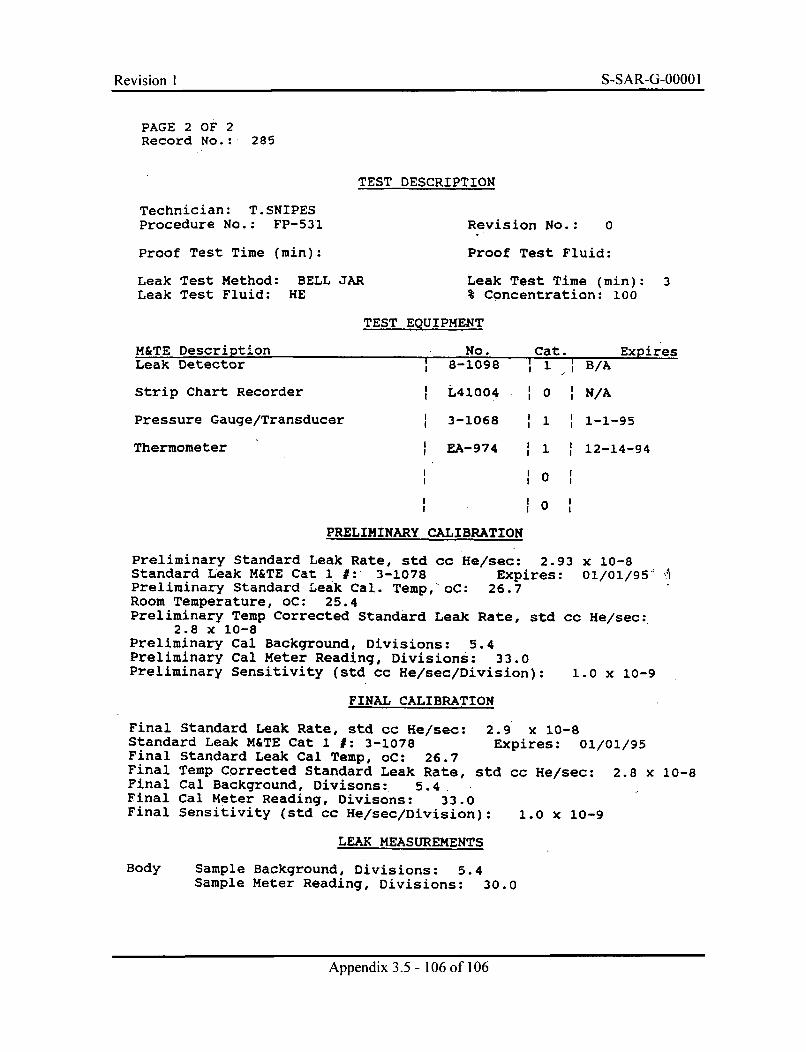
Revision I S-SAR-G-0000 IRevision 1 S-SAR-G-OOOO 1
PAGE 2 OF 2Record No.: 285
TEST DESCRIPTION
Technician: T.SNIPESProcedure No.: FP-531
Proof Test Time (min):
Leak Test Method: BELL JARLeak Test Fluid: HE
Revision No.: 0
Proof Test Fluid:
Leak Test Time (min):% Concentration: 100
3
TEST EQUIPMENT
M&TE DescriptionLeak Detector
Me% tým* V- iJJ.,
8-1098 1 B/A
Strip Chart Recorder
Pressure Gauge/Transducer
Thermometer
L41004 0 N/A
3-1068 1 1-1-95
EA-974 1 12-14-94
0
10
PRELIMINARY CALIBRATION
Preliminary Standard Leak Rate, std cc He/sec: 2.93 x 10⁻⁸Standard Leak M&TE Cat 1 #: 3-1078 Expires: 01/01/95Preliminary Standard Leak Cal. Temp, oC: 26.7Room Temperature, oC: 25.4Preliminary Temp Corrected Standard Leak Rate, std cc He/sec:
2.8 x 10⁻⁸Preliminary Cal Background, Divisions: 5.4Preliminary Cal Meter Reading, Divisions: 33.0Preliminary Sensitivity (std cc He/sec/Division): 1.0 x 10- 9
FINAL CALIBRATION
Final Standard Leak Rate, std cc He/sec: 2.9 x 10⁻⁸Standard Leak M&TE Cat 1 1: 3-1078 Expires: 01/01/95Final Standard Leak Cal Temp, oC: 26.7Final Temp Corrected Standard Leak Rate, std cc He/sec: 2.8 x 10⁻⁸Final Cal Background, Divisons: 5.4Final Cal Meter Reading, Divisons: 33.0Final Sensitivity (std cc He/sec/Division): 1.0 x 10⁻⁹
LEAK MEASUREMENTS
Body Sample Background, Divisions: 5.4Sample Meter Reading, Divisions: 30.0
Appendix 3.5 - 106 of 106
Revision I S-SAR-G-0000 IRevision 1 S-SAR-G-OOOO I
APPENDIX 3.6
DETERMINATION OF PRESSURES IN THE 9975 PACKAGEFOR IMPURE PU OXIDE CONTENTS
Appendix 3.6 - 1 of 14

Revision I S-SAR-G-0000 IRevision 1 S-SAR-G-OOOO 1
This Page Intentionally Left Blank
Appendix 3.6 - 2 of 14
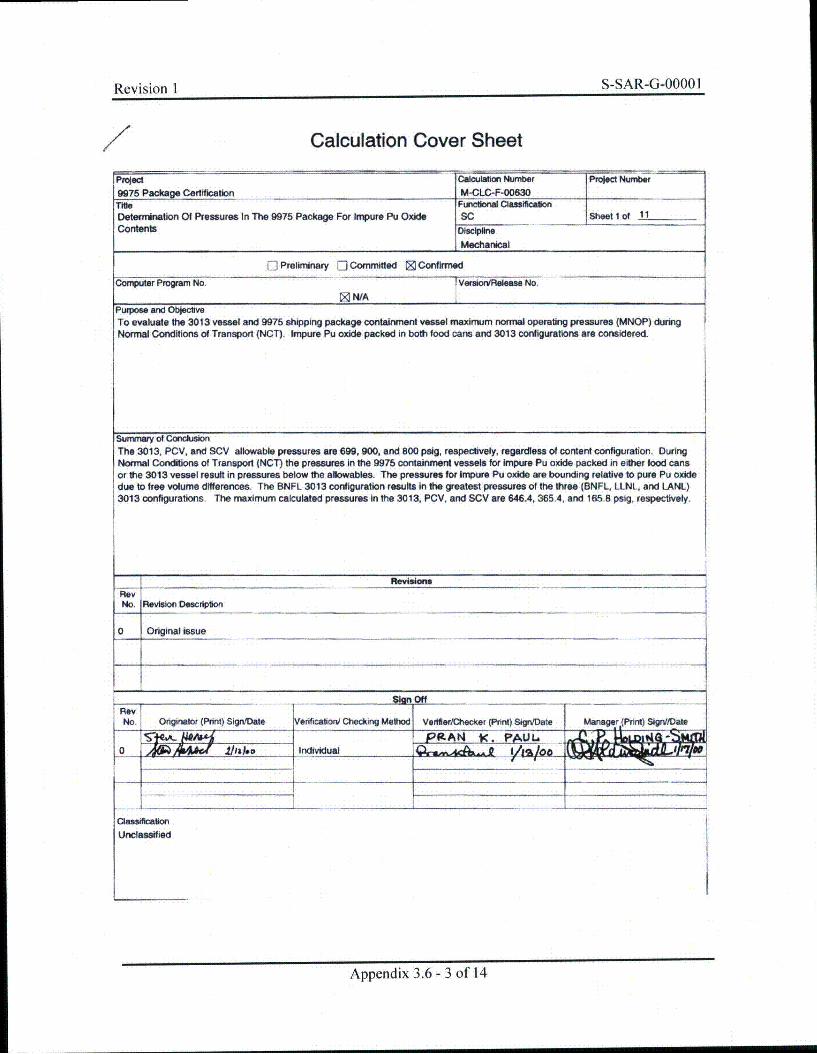
Revision 1 S-SAR-G-0000 IRevision 1I-A-GOO
Calculation Cover Sheet
Project
9975 Package CeoificationTileDeterminaion O Pressures In The 9975 Package For Impure Pu OxideContents
fl Prelimrinay [] Committed S Confirmed
Computer Program No. I VersioTIReleme No.
WNIAPurpose and ObjectvTo evaluate the 3013 vessel and 9975 shipping package containiment vessel maximum normal operating pressures (MNOP) duringNormal Conditions of Transport (NCT). Impure Pu oxide packed in both food cans and 3013 configurations are considered.
Sumvwy of ConcjusionThe 3013, PCV, and SCV allowable pressures are 699, 900, and 800 peig, respectively, regardless of content configuration. DuringNormal Conditions of Transport (NCT) the pressures in the 9975 containment vessels for Impure Pu oxide packed in either lood cansor the 3013 vessel result in pressures below the allowables. The pressures for Impure Pu oxide are bounding relative to pure Pu oxidedue to free volume differences. The BNFL 3013 configuration results in the greatest pressures of the three (BNFL, LLNL, and LANL)3013 configurations. The maximum calculated pressures in the 3013, PCV, and SCV are 646.4, 365.4, and 165.8 psig, respectively.
Appendix 3.6 - 3 of 14
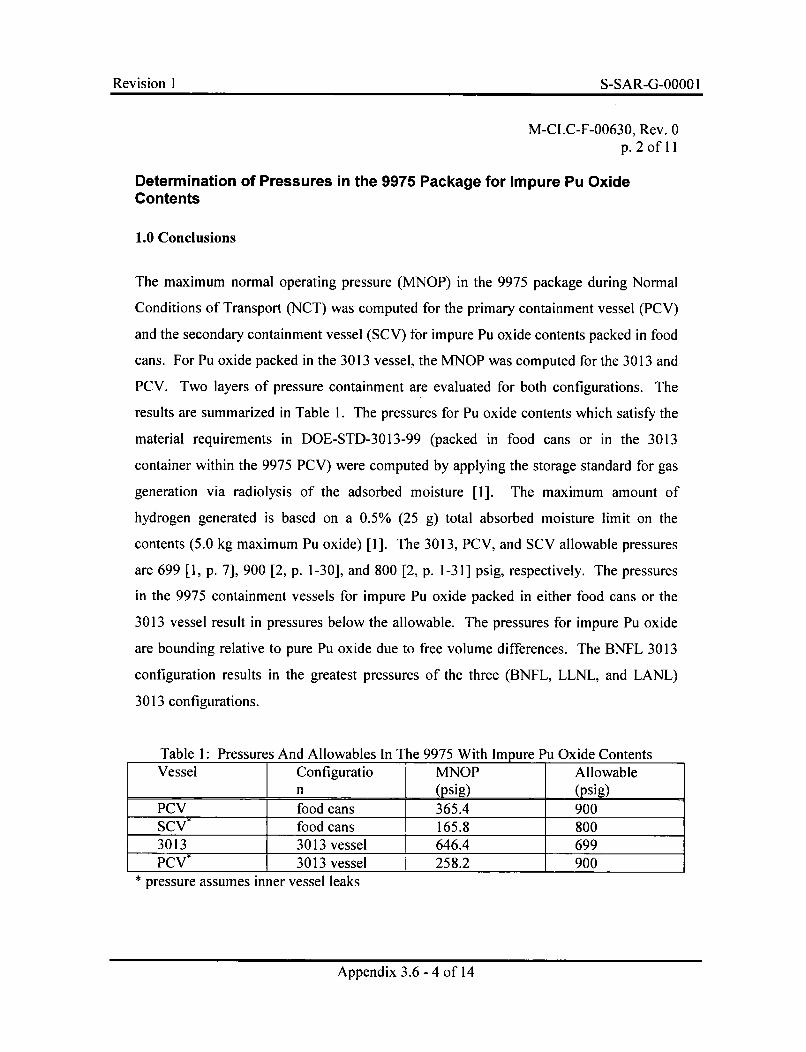
Revision I S-SAR-G-0000 I
M-CLC-F-00630, Rev. 0p. 2 of 11
Determination of Pressures in the 9975 Package for Impure Pu OxideContents
1.0 Conclusions
The maximum normal operating pressure (MNOP) in the 9975 package during Normal
Conditions of Transport (NCT) was computed for the primary containment vessel (PCV)
and the secondary containment vessel (SCV) for impure Pu oxide contents packed in food
cans. For Pu oxide packed in the 3013 vessel, the MNOP was computed for the 3013 and
PCV. Two layers of pressure containment are evaluated for both configurations. The
results are summarized in Table 1. The pressures for Pu oxide contents which satisfy the
material requirements in DOE-STD-3013-99 (packed in food cans or in the 3013
container within the 9975 PCV) were computed by applying the storage standard for gas
generation via radiolysis of the adsorbed moisture [1]. The maximum amount of
hydrogen generated is based on a 0.5% (25 g) total absorbed moisture limit on the
contents (5.0 kg maximum Pu oxide) [1]. The 3013, PCV, and SCV allowable pressures
are 699 [1, p. 7], 900 [2, p. 1-30], and 800 [2, p. 1-31] psig, respectively. The pressures
in the 9975 containment vessels for impure Pu oxide packed in either food cans or the
3013 vessel result in pressures below the allowable. The pressures for impure Pu oxide
are bounding relative to pure Pu oxide due to free volume differences. The BNFL 3013
configuration results in the greatest pressures of the three (BNFL, LLNL, and LANL)
3013 configurations.
Table 1: Pressures And Allowables In The 9975 With Impure Pu Oxide ContentsVessel Configuratio T MNOP Allowable
n (psig) (psig)PCV food cans 365.4 900SCV* food cans 165.8 8003013 3013 vessel 646.4 699PCV* 3013 vessel 258.2 900
* pressure assumes inner vessel leaks
Appendix 3.6 - 4 of 14
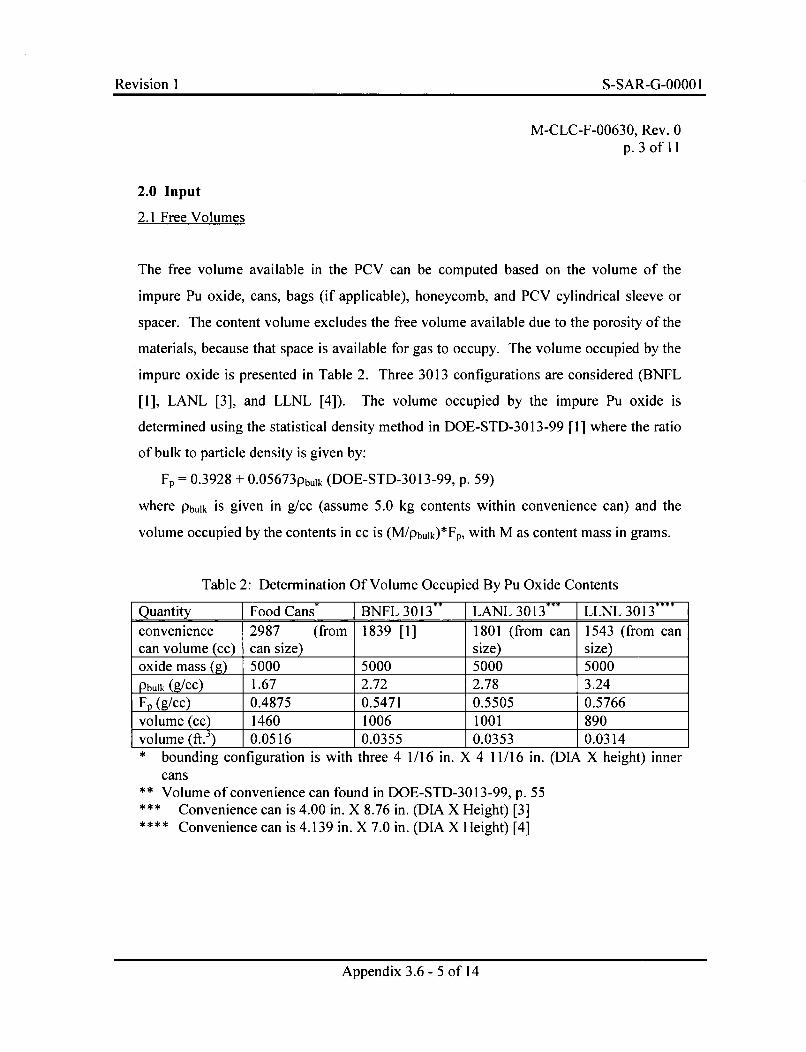
Revision I S-SAR-G-0000 I
M-CLC-F-00630, Rev. 0p. 3ofll
2.0 Input
2.1 Free Volumes
The free volume available in the PCV can be computed based on the volume of the
impure Pu oxide, cans, bags (if applicable), honeycomb, and PCV cylindrical sleeve or
spacer. The content volume excludes the free volume available due to the porosity of the
materials, because that space is available for gas to occupy. The volume occupied by the
impure oxide is presented in Table 2. Three 3013 configurations are considered (BNFL
[1], LANL [3], and LLNL [4]). The volume occupied by the impure Pu oxide is
determined using the statistical density method in DOE-STD-3013-99 [1] where the ratio
of bulk to particle density is given by:
Fp = 0.3928 + 0.056 7 3Pbulk (DOE-STD-3013-99, p. 59)
where Pbulk is given in g/cc (assume 5.0 kg contents within convenience can) and the
volume occupied by the contents in cc is (M/Pbulk)*FP, with M as content mass in grams.
Table 2: Determination Of Volume Occupied By Pu Oxide Contents
Quantity Food Cans* BNFL 3013" [ LANL 3013"* LLNL 3013convenience 2987 (from 1839 [1] 1801 (from can 1543 (from cancan volume (cc) can size) size) size)oxide mass (g) 5000 5000 5000 5000
Pbulk (g/cc) 1.67 2.72 2.78 3.24Fp (g/cc) 0.4875 0.5471 0.5505 0.5766volume (cc) 1460 1006 1001 890volume (ft.-) 0.0516 0.0355 0.0353 0.0314* bounding configuration is with three 4 1/16 in. X 4 11/16 in. (DIA X height) inner
cans** Volume of convenience can found in DOE-STD-3013-99, p. 55***~ Convenience can is 4.00 in. X 8.76 in. (DIA X Height) [3]****" Convenience can is 4.139 in. X 7.0 in. (DIA X Height) [4]
Appendix 3.6 - 5 of 14
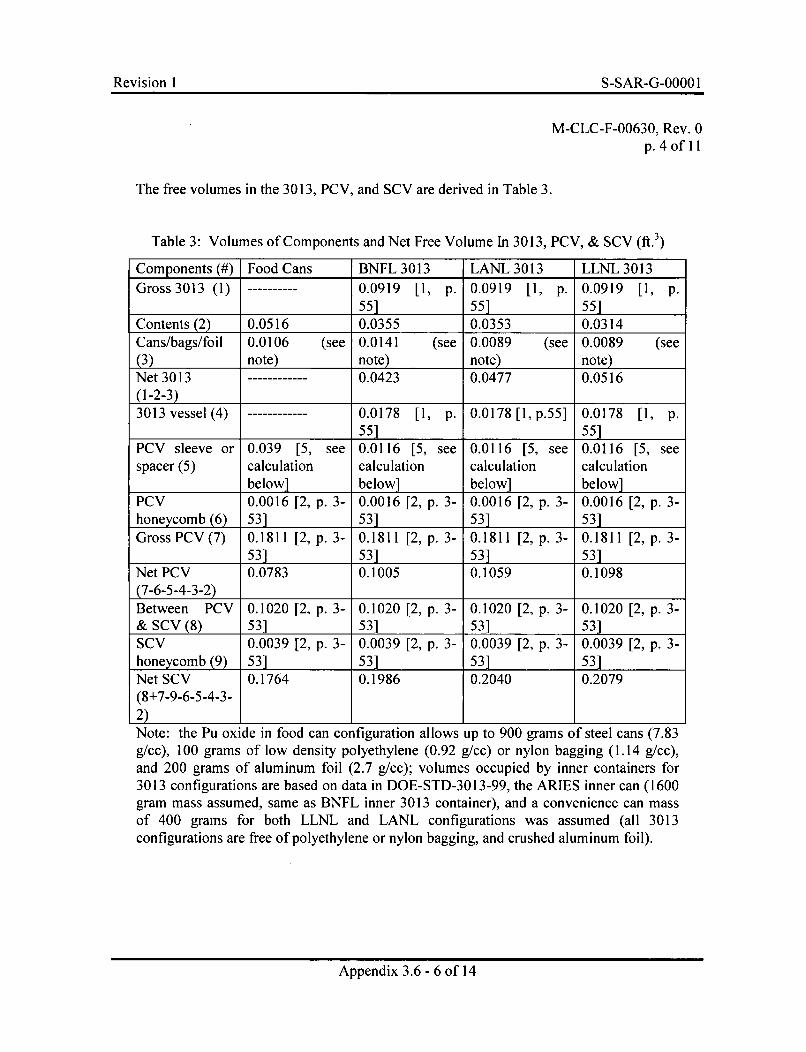
Revision I S-SAR-G-0000 1
M-CLC-F-00630, Rev. 0p. 4 of 11
The free volumes in the 3013, PCV, and SCV are derived in Table 3.
Table 3: Volumes of Components and Net Free Volume In 3013, PCV, & SCV (ft.3)
Components (#) Food Cans BNFL 3013 LANL 3013 LLNL 3013Gross 3013 (1) ----------- 0.0919 [1, p. 0.0919 [1, p. 0.0919 [1, p.
55] 55] 55]Contents (2) 0.0516 0.0355 0.0353 0.0314Cans/bags/foil 0.0106 (see 0.0141 (see 0.0089 (see 0.0089 (see(3) note) note) note) note)Net 3013 0.0423 0.0477 0.0516(1-2-3)3013 vessel (4) 0.0178 [1, p. 0.0178 [1, p.55] 0.0178 [1, p.
55] 551
PCV sleeve or 0.039 [5, see 0.0116 [5, see 0.0116 [5, see 0.0116 [5, seespacer (5) calculation calculation calculation calculation
below] below] below] below]PCV 0.0016 [2, p. 3- 0.0016 [2, p. 3- 0.0016 [2, p. 3- 0.0016 [2, p. 3-honeycomb (6) 53] 53] 53] 53Gross PCV (7) 0.1811 [2, p. 3- 0.1811 [2, p. 3- 0.1811 [2, p. 3- 0.1811 [2, p. 3-53] 53] 53] 531Net PCV 0.0783 0.1005 0.1059 0.1098(7-6-5-4-3-2)Between PCV 0.1020 [2, p. 3- 0.1020 [2, p. 3- 0.1020 [2, p. 3- 0.1020 [2, p. 3-& SCV (8) 53] 53] 53] 53]SCV 0.0039 [2, p. 3- 0.0039 [2, p. 3- 0.0039 [2, p. 3- 0.0039 [2, p. 3-honeycomb (9) 53] 53] 53] 53]Net SCV 0.1764 0.1986 0.2040 0.2079(8+7-9-6-5-4-3-2)Note: the Pu oxide in food can configuration allows up to 900 grams of steel cans (7.83g/cc), 100 grams of low density polyethylene (0.92 g/cc) or nylon bagging (1.14 g/cc),and 200 grams of aluminum foil (2.7 g/cc); volumes occupied by inner containers for3013 configurations are based on data in DOE-STD-3013-99, the ARIES inner can (1600gram mass assumed, same as BNFL inner 3013 container), and a convenience can massof 400 grams for both LLNL and LANL configurations was assumed (all 3013configurations are free of polyethylene or nylon bagging, and crushed aluminum foil).
Appendix 3.6 - 6 of 14
Revision I S-SAR-G-0000 I
M-CLC-F-00630, Rev. 0p. 5oflI
A cylindrical sleeve is required for food can shipments and a cylindrical spacer is
required for shipments utilizing the 3013 vessel [5].
Cylinder sleeve used in PCV with food can shipments:
Cylinder design: 4.385 in. ID and 5.0 in. OD
Volume of cylinder (14.9 in. tall): 3.14159(2.5*2.5 - 2.1925*2.1925)*14.9 = 67.5 in.3
(0.0390 ft.3)
Cylinder spacer used in PCV with 3013 vessel shipments:
Cylinder design: 4.38 in. ID and 4.92 in. OD [5]
Volume of cylinder (5.06 in. tall): 3.14159(2.46*2.46 - 2.19*2.19)*5.06 = 20.0 in. 3
(0.0116 ft.3)
2.2 Gas mixtures and temperatures
2.2.1 Pu oxide in food cans
Plutonium oxide contents with a decay power of 19 W are considered.
Conditions in the Primary Containment Vessel (PCV) during NCT with solar:
Temperature 313TF (772.6 R) [6, p. 2]
Free volume within PCV is 0.0783 ft.3
Content has up to 0.5 % wt. moisture (25 grams moisture)
Appendix 3.6 - 7 of 14
Revision I S-SAR-G-O000 1
M-CLC-F-00630, Rev. 0p. 6ofll
Hydrogen gas generation from radiolysis of the moisture is conservatively determined by
applying the 50 year storage standard for plutonium oxides [1]. This results in 1.389
gram-moles of hydrogen gas (complete radiolysis of the moisture). The radiolysis is
assumed to occur instantaneously once the PCV is closed. In addition, gas (in the form of
water vapor) can be generated by the thermal breakdown of nylon bagging. An additional
32.1 psia was measured from FB-Line nylon bagging when a sample was heated to 350'F
(sample size to test container volume was 793 g/ft. 3 ) [7]. Using a PCV temperature of
313TF and a bag mass to free volume ratio of 100 g to 0.1145 ft. 3 free volume (873 g/ft. 3 )
results in an equivalent 33.7 psia increase in pressure due to gas generation. FB-Line
nylon bagging was found to out gas more than RFETS nylon or low density polyethylene
[8,9].
Conditions in Secondary Containment Vessel (SCV) during NCT with solar:
Temperature 313°F (772.6 R) [6, p. 2]
Free volume within the combined PCV and SCV is 0.1764 ft. 3
2.2.3 Pu oxide in 3013 container
Plutonium oxide contents with a decay power of 19 W are considered. The BNFL
configuration results in the least free volume inside the 3013 vessel and therefore
pressures in the BNFL 3013 configuration bound those in the LLNL and LANL
configurations.
Conditions in the 3013 vessel during NCT with solar:
Temperature 360TF (819.6 R) (estimate of volume average of temperatures reported in
[6])
Free volume within PCV is 0.0423 ft.3
Content has up to 0.5 % wt. moisture (25 grams moisture)
Appendix 3.6 - 8 of 14
Revision I S-SAR-G-0000 I
M-CLC-F-00630, Rev. 0p. 7ofll
Hydrogen gas generation from radiolysis of the moisture is determined by conservatively
applying the 50 year storage standard for plutonium oxides [1]. This results in 1.389
gram-moles of hydrogen gas (complete radiolysis of the moisture). The radiolysis is
assumed to occur instantaneously once the PCV is closed.
Conditions in Primary Containment Vessel (PCV) during NCT with solar:
Temperature 308'F (767.6 R) [6, p. 2]
Free volume within the combined 3013 and PCV is 0.1005 ft. 3
3.0 Analytical Methods and Computations
3.1 Pu oxide in food cans
The total composition of gas in the PCV consists of:
Fill gas initially in the free space within the PCV (including food cans)-
Mgas = (14.7 psia)( 0.0783 ft. 3)/[( 10.73 psi-ft. 3/Ib-moles-R)(529.6 R)]
Mgas = 2.025E-04 lb-moles
Helium generated via radioactive decay- consider 19 W of Pu-239 decaying for 2
years (see [1], eq. 23) (R=547 psi-liters/lb-moles-K)
7.517E-05 *19*2/547=5.22E-06 lb-moles
Mhelium = 5.22E-06 lb-moles
Hydrogen generated via radiolysis of 25 g moisture (1.389 gram-moles)-
Mhydrogen = 3.062E-03 lb-moles
The partial pressure from thermal decomposition of low density polyethylene, nylon bagging
used at Rocky Flats, and nylon bagging used at FB-Line Savannah River Site
Appendix 3.6 - 9 of 14
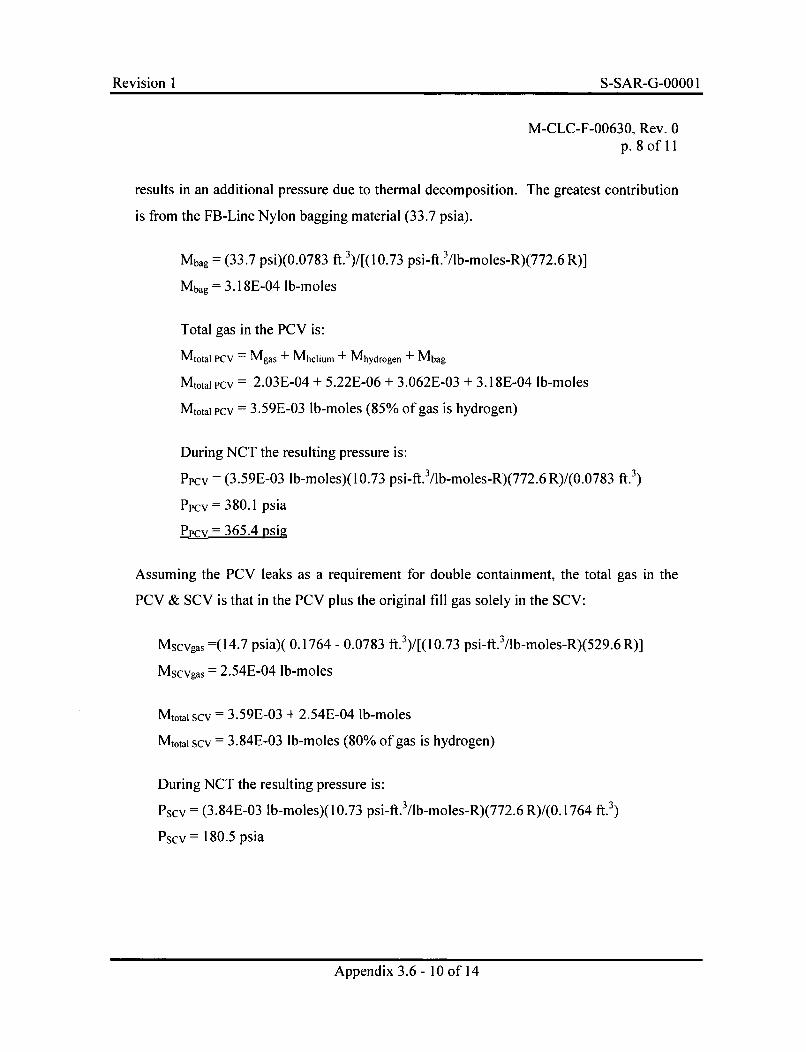
Revision 1 S-SAR-G-0000 1
M-CLC-F-00630, Rev. 0p. 8ofll
results in an additional pressure due to thermal decomposition. The greatest contribution
is from the FB-Line Nylon bagging material (33.7 psia).
Mbag = (33.7 psi)(0.0783 ft.3)/[( 10.73 psi-ft. 3/lb-moles-R)(772.6 R)]
Mbag = 3.18E-04 lb-moles
Total gas in the PCV is:
Mtota PCV = Mgas + Mhelium + Mhydrogen + Mbag
Mtotal PCV = 2.03E-04 + 5.22E-06 + 3.062E-03 + 3.18E-04 lb-moles
Mtotal PCV = 3.59E-03 lb-moles (85% of gas is hydrogen)
During NCT the resulting pressure is:
Ppcv = (3.59E-03 lb-moles)( 10.73 psi-ft. 3/lb-moles-R)(772.6 R)/(0.0783 ft.3)
Ppcv = 380.1 psia
Pcv = 365.4 psig
Assuming the PCV leaks as a requirement for double containment, the total gas in the
PCV & SCV is that in the PCV plus the original fill gas solely in the SCV:
Mscvgas =( 14.7 psia)( 0.1764 - 0.0783 ft.3)/[( 10.73 psi-ft.3/lb-moles-R)(529.6 R)]
Mscvgas = 2.54E-04 lb-moles
Mtotai scv = 3.59E-03 + 2.54E-04 lb-moles
Mtotal scv = 3.84E-03 lb-moles (80% of gas is hydrogen)
During NCT the resulting pressure is:
Pscv = (3.84E-03 lb-moles)(10.73 psi-ft.3/lb-moles-R)(772.6 R)/(0.1764 ft.3)
Pscv = 180.5 psia
Appendix 3.6 - 10 of 14

Revision I S-SAR-G-0000 I
M-CLC-F-00630, Rev. 0p. 9ofIl
Pscv = 165.8 psig
3.2 Pu oxide in 3013
The total composition of gas in the 3013 consists of:
Gas initially in the free space within the 3013 (including 3013 and interior vessels)-
Mgas = (14.7 psia)( 0.0423 ft.3)/[(10.73 psi-ft. 3/lb-moles-R)(529.6 R)]
Mgas = 1.09E-04 lb-moles
Helium generated via radioactive decay- consider 19 W of Pu-239 decaying for 2 years:
5.22E-06 lb-moles of helium
Mhelium = 5.22E-06 lb-moles
Hydrogen generated via radiolysis of 25 g moisture (1.389 gram-moles)-
Mhydrogen = 3.062E-03 lb-moles
Total gas in the 3013 is:
Mtotal 3013 = Mgas + Mhelium + Mhydrogen
Mtotal 3013 = 1.09E-04 + 5.22E-06 + 3.062E-03 lb-moles
Mtotai 3 0 13 = 3.18E-03 lb-moles (96% of gas is hydrogen)
During NCT the resulting pressure is:
P 3013 = (3.18E-03 lb-moles)(10.73 psi-ft.3/lb-moles-R)(819.6 R)/(0.0423 ft.3)
P 3013 = 661.1 psia
P3013= 646.4 psig
Appendix 3.6 - 11 of 14
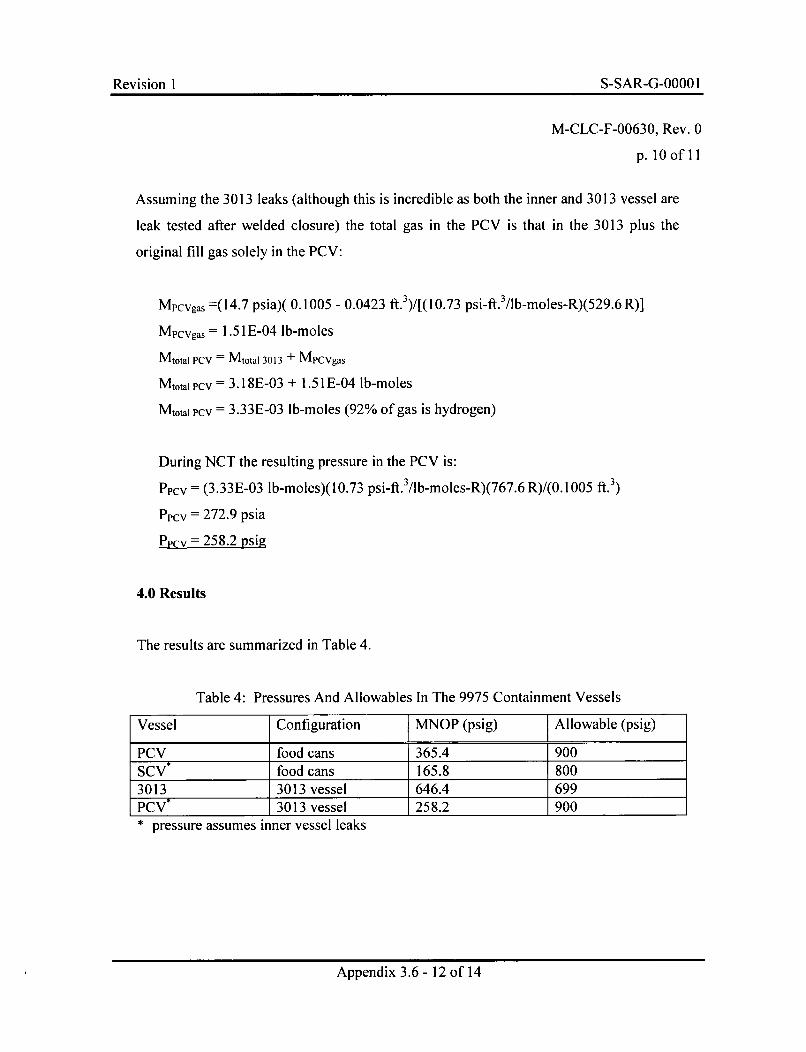
Revision I S-SAR-G-0000 I
M-CLC-F-00630, Rev. 0
p. 10ofll
Assuming the 3013 leaks (although this is incredible as both the inner and 3013 vessel are
leak tested after welded closure) the total gas in the PCV is that in the 3013 plus the
original fill gas solely in the PCV:
Mpcvgas =(14.7 psia)( 0.1005 - 0.0423 ft.3)/[(10.73 psi-ft. 3/lb-moles-R)(529.6 R)]
Mpcvgas = 1.5 1E-04 lb-moles
Mtotal PCV = Mtotai 3013 + Mpcvgas
Mtotal PCV = 3.18E-03 + 1.51E-04 lb-moles
Mtota, pcv = 3.33E-03 lb-moles (92% of gas is hydrogen)
During NCT the resulting pressure in the PCV is:
Ppcv = (3.33E-03 lb-moles)(10.73 psi-ft.3/lb-moles-R)(767.6R)/(0.1005 ft.3)
Ppcv = 272.9 psia
Ppcv = 258.2 psig
4.0 Results
The results are summarized in Table 4.
Table 4: Pressures And Allowables In The 9975 Containment Vessels
Vessel Configuration ] MNOP (psig) Allowable (psig)
PCV food cans 365.4 900SCV* food cans 165.8 8003013 3013 vessel 646.4 699PCV* 3013 vessel 258.2 900* pressure assumes inner vessel leaks
Appendix 3.6 - 12 of 14
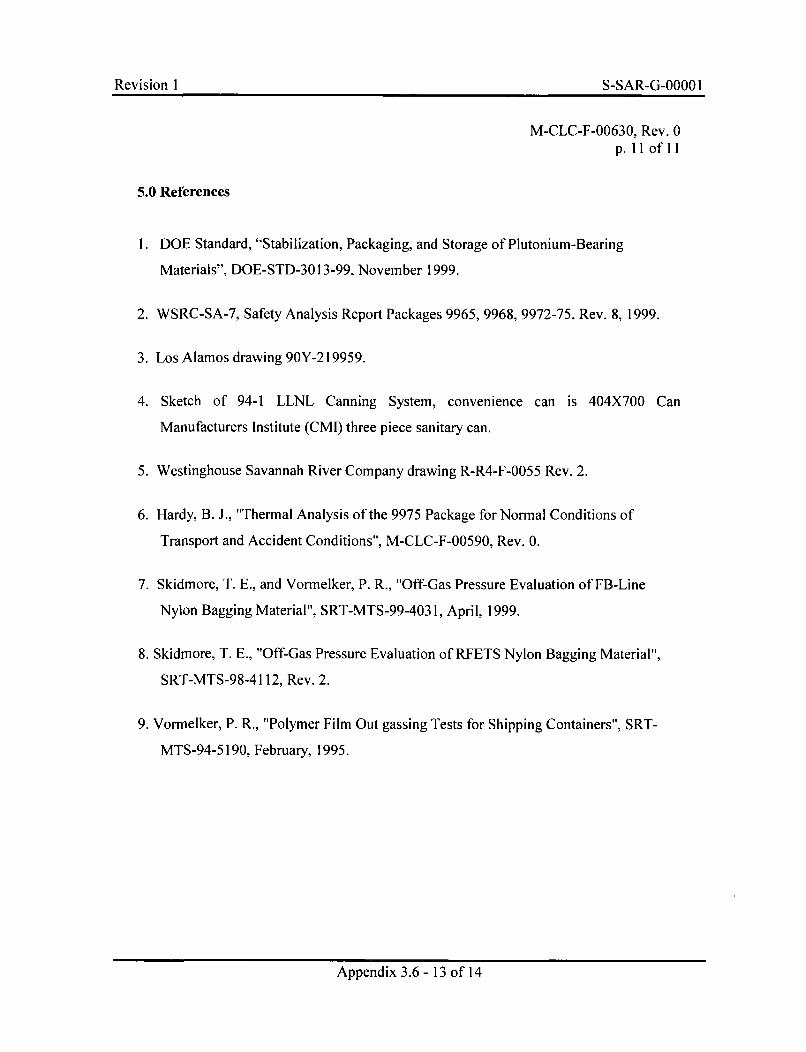
Revision 1 S-SAR-G-00001
M-CLC-F-00630, Rev. 0p. 11 of 1l
5.0 References
1. DOE Standard, "Stabilization, Packaging, and Storage of Plutonium-Bearing
Materials", DOE-STD-3013-99, November 1999.
2. WSRC-SA-7, Safety Analysis Report Packages 9965, 9968, 9972-75, Rev. 8, 1999.
3. Los Alamos drawing 90Y-219959.
4. Sketch of 94-1 LLNL Canning System, convenience can is 404X700 Can
Manufacturers Institute (CMI) three piece sanitary can.
5. Westinghouse Savannah River Company drawing R-R4-F-0055 Rev. 2.
6. Hardy, B. J., "Thermal Analysis of the 9975 Package for Normal Conditions of
Transport and Accident Conditions", M-CLC-F-00590, Rev. 0.
7. Skidmore, T. E., and Vormelker, P. R., "Off-Gas Pressure Evaluation of FB-Line
Nylon Bagging Material", SRT-MTS-99-4031, April, 1999.
8. Skidmore, T. E., "Off-Gas Pressure Evaluation of RFETS Nylon Bagging Material",
SRT-MTS-98-4112, Rev. 2.
9. Vormelker, P. R., "Polymer Film Out gassing Tests for Shipping Containers", SRT-
MTS-94-5190, February, 1995.
Appendix 3.6 - 13 of 14

Revision I S-SAR-G-0000 IRevision I S-SAR-G-OOOO I
This Page Intentionally Left Blank.
Appendix 3.6 - 14 of 14
Revision I S-SAR-G-0000 IRevision 1 S-SAR-G-OOOO 1
APPENDIX 3.7
PRESSURE IN THE 9975 PACKAGE
WITH THE 3013 CONTAINER, PCV, AND SCV GAS SPACES IN COMMUNICATION
Appendix 3.7 - I of 6

Revision I S-SAR-G-0000 IRevision 1 S-SAR-G-OOOO I
This Page Intentionally Left Blank.
Appendix 3.7 - 2 of 6
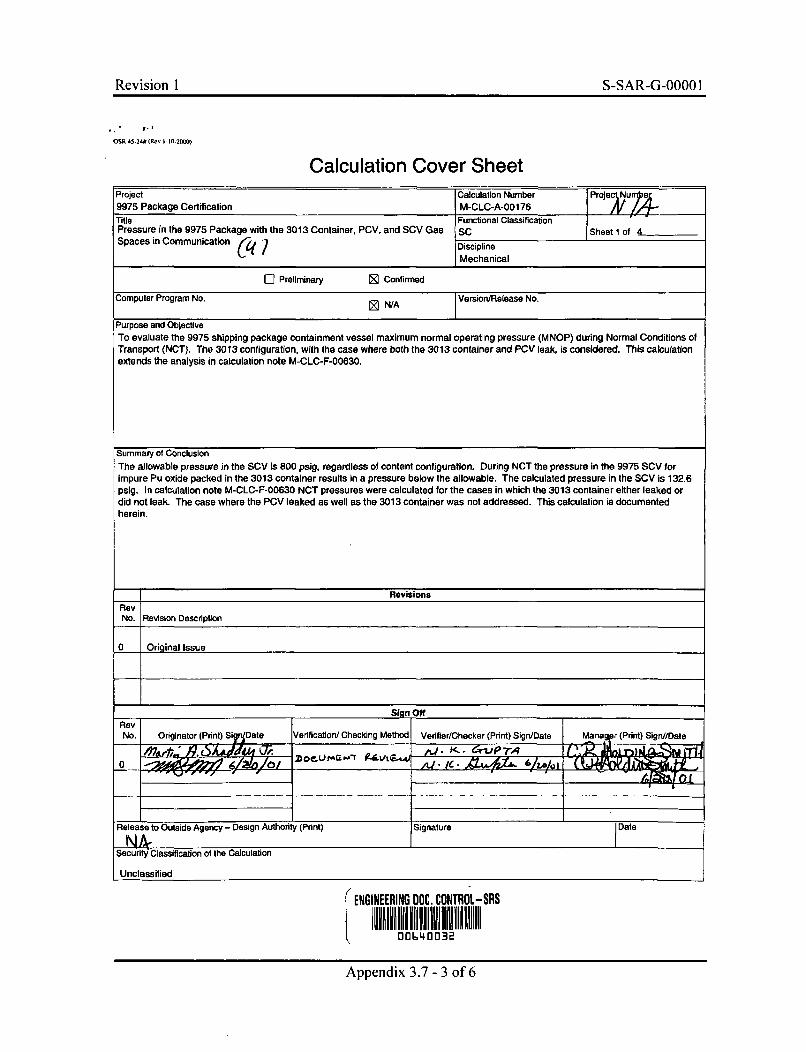
Revision 1 S-SAR-G-0000 1
OSH 45-24# (Rev I-10-220W)
Calculation Cover SheetProject Calculation Number Proje Num •9975 Package Certification M-CLC-A-00176
Title Functional ClassificationPressure in the 9975 Package with the 3013 Container, PCV, and SCV Gas SC Sheet 1 of 4Spaces in Communication (q / Discipline
Mechanical
[] Preliminary [ Confirmed
Computer Program No. N/A Version/Release No.
Purpose and ObjectiveTo evaluate the 9975 shipping package containment vessel maximum normal operating pressure (MNOP) during Normal Conditions ofTransport (NCT). The 3013 configuration, with the case where both the 3013 container and PCV leak, is considered. This catculationextends the analysis in calculation note M-CLC-F-00630.
Summary of ConclusionThe allowable pressure in the SCV is 800 psig, regardless of content configuration, During NCT the pressure in the 9975 SCV forimpure Pu oxide packed in the 3013 container results in a pressure below the allowable. The calculated pressure in the SCV is 132.6psig. In calculation note M-CLC-F-00630 NCT pressures were calculated for the cases in which the 3013 container either leaked ordid not leak. The case where the PCV leaked as well as the 3013 container was not addressed. This calculation is documentedherein.
Revisions
RevNo. Revision Description
0 Original Issue
Sign OffRevNo. Originator (Print) SiqnDate Verification/Checking Method Vedfier/Checker (Print) Sign/Date Manae r (Print) Sign//Date
0 AO 1 - X -
Release to Outside Agency- Design Authority (Print) Signature DateN&l,
SecuritV Classification of the Calculation
Unclassified
(ENGINEERING DOC. CONTROL-SRS
00640032
Appendix 3.7 - 3 of 6
Revision I S-SAR-G-0000 I
M-CLC-A-00176, Rev. 0Page 2 of 4
Pressure in the 9975 Package with the 3013 Container, PCV,and SCV Gas Spaces in Communication
Introduction and Summary
In reference [I] the results of maximum normal operating pressures (MNOP) duringNormal Conditions of Transport (NCT) calculations are presented. Pressures weredetermined for two scenarios of the 3013 configuration of the 9975 package, cases wherethe 3013 container does and does not leak. The case where both the 3013 container andthe PCV leak, and the contents of the gas spaces of the two containers mix with thecontents of the gas space of the SCV, is not addressed in reference [1]. This scenario isaddressed herein.
Plutonium oxide in a 9975 shipping package can generate hydrogen by radiolysis ofabsorbed water vapor, and alpha decay can generate helium. These gasses as well asheating of the gas by plutonium decay will pressurize the gas spaces inside of the SCV.If the 3013 container and the PCV leak, the internal gas space pressures will equilibrate.The calculated steady state pressure, consistent with the assumptions in reference [I] is132.6 psig.
Input
The 3013 configuration of the 9975 shipping package contains three nested containers.From the inside going out, the nested containers are: the 3013 container, the primarycontainment vessel (PCV), and the secondary containment vessel (SCV). The volumes ofthe gas spaces in the three containers are [1]:
V3013 = 1.1978 x 10⁻³ m3
Vpv = 1.6480 x 10⁻³ M3
Vscv = 2.7779 X 10⁻³ m3
The PCV volume is the volume of gas space inside of the PCV and outside of the 3013container. The SCV volume is the volume of gas space inside of the SCV and outside ofthe PCV.
The 9975 shipping package is packed by loading theplutonium oxide in the 3013container and then sequentially loading the nested containers, each in the next largercontainer, until the package is assembled. The initial temperature and pressure of thecontainer gas spaces are assumed to be 70'F and 14.7 psia. The initial composition of thefill gas is immaterial with respect to the final pressure.
The 9975 package internals will heat-up during shipping and storage due to radioactivedecay of the contents. The final temperatures of the gas spaces were determined with
Appendix 3.7 - 4 of 6
Revision I S-SAR-G-0000 I
M-CLC-A-00176, Rev. 0Page 3 of 4
steady-state heat transfer modelling of the 9975 package during NCT with insolation1 [2].The 3013 container gas space temperature is an estimate of the volume average gas spacetemperature [ 1,2]. The PCV and SCV gas space temperatures are conservativelyassumed to be equal to the peak surface temperatures of the gas space boundaries [2].The assumed temperatures are:
T 3 013 = 360'F = 455.2 KTpcv = 293°F = 418.2 KTscv = 283°F = 412.6 K
The internal gas space pressures will rise due to gas production as well as the radioactiveheating. Hydrogen is produced by radiolysis of absorbed water vapor in the plutoniumoxide. Alpha decay of the plutonium also produces helium. The hydrogen and heliumsource terms [1] are:
Nmv = 1.389 mols H2NHe = 2.3679 x 10"3 mols He
All of the hydrogen and helium is produced within the 3013 container. Gas spacepressures for the two scenarios where the 3013 container does and does not leak arepresented in reference [ 1]. For the scenario in which the 3013 container leaks, thecontents of the 3013 container and the PCV gas spaces are assumed to mix freely and thetwo gas space pressures equilibrate. The scenario in which the PCV also leaks was notaddressed, and this is the objective of this document. The contents of all three gas spacesare assumed to be well mixed after the initial loading and the 3013 hydrogen and heliumis produced. The steady-state temperature distribution in the 9975 package is assumed tobe independent of the gas mixing. This is reasonable and the only assumption that can bemade with the available information [2].
Analytical Methods and Computations
The number of moles in the three gas spaces initially at 70'F and atmospheric pressure, isdetermined with the ideal gas relation. The total gas space volume of the three vessels isused. Note that this quantity is independent of the gas composition.
PVn = _- (I)
RT
-(10 1 300)(5.6237xlO0-) 023
n,,•- (8.314X294.3) = 283 mols
The final value for the number of moles of gas in the three gas spaces is the sum of theinitial gas loading and the hydrogen and helium produced in the 3013 container:
Appendix 3.7 - 5 of 6
Revision I S-SAR-G-0000 I
M-CLC-A-00 176, Rev. 0
Page 4 of 4
nfjin = .23283 + 1.389 + 2.3679 x 10-3 = 1.6242 mols
The pressures in the three gas spaces will be equal after mixing, but the temperatures willdiffer. To determine the pressure, solve the continuity equation and the ideal gas relationfor each of the gas spaces simultaneously.
PV1. 0 3 = n3013 RT 301 3 (2)
Pvecv = n• -TvCv (3)
PVscv = ns5 vR Tscv (4)n3013 + n7pcv + nscv = n (5)
By judicious substitution these simultaneous equations can be reduced to a singleequation for the pressure:
P - nRT 013 (6)
V1013 + v, To + rV (.36
Results
The steady state pressure inside of the 3013 container, the PCV, and the SCV with thegas spaces communicating through leaks in the 3013 container and the PCV is calculatedwith equation (6).
P = (1.6242)(8.314X455.2) = 1014946.5 Pa
1.1978x10⁻³ +1.648x10_3 455.2 +2.7779x10_, 455.2418.2 412.6
P-= 147.3 psia (132.6 psig)
References
1. Hensel, S. J., "Determination of Pressures in the 9975 Package for Impure PuOxide Contents", M-CLC-F-00630, January 2000.
2. Gupta, N. K., "Thermal Analysis of the 9975 Package for Normal Conditions ofTransport and Accident Conditions", M-CLC-00590, Rev. 3, January 2000.
Appendix 3.7 - 6 of 6
Revision I S-SAR-G-0000 IRevision 1 S-SAR-G-OOOO 1
APPENDIX 3.8
DEFLAGRATION CALCULATIONS FOR THE 9975 PACKAGE WITH INERTING
Appendix 3.8 - 1 of 50

Revision I S-SAR-G-00001Revision I S-SAR-G-O000 1
This Page is Intentionally Blank.
Appendix 3.8 - 2 of 50
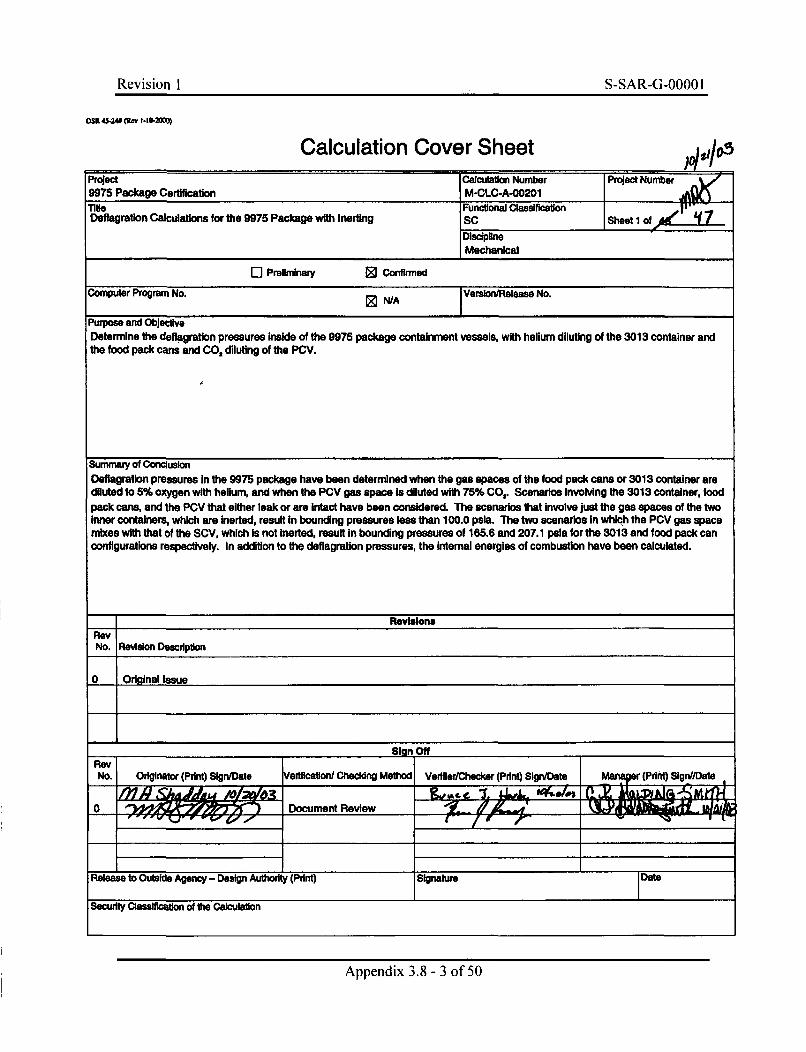
Revision I S-SAR-G-00001Revision 1 S-SAR-G-0000 I
MOSRW4(ft" 1.10-2OO0)
Calculation Cover SheetProject Calculationt Number Project Number9975 Package Certification MCLCA-0020 ITidle Functional ClassifecationDeflagratlon Calcuations for the 9975 Package with maerling SC Sheet 1 of
Discipline__ Mechanlcal
0 Prelmlnmuy 0 Confirmed
Computer Program No. 0 N/A Versn•Release No.
Purpose and ObjectiveDetermine the deflagration pressures inside of the 9975 package containment vessels, with helium diluting of the 3013 container andthe food pack cans and CO, diluting of the PCV.
Suinmay of ConclusionDeflagration pressures in the 9975 package have been determined when the gas spaces of the food pack cans or 3013 container arediluted to 5% oxygen with helium, and when the PCV gas space is diluted with 75% CO,. Scenarios Involving the 3013 container, foodpack cans, and the PCV that either leak or are Intact have been considered. The scenarios that involve just the gas spaces of the twoInner containers, which are inerted, result in bounding pressures less than 100.0 pals. The two scenarios In which the PCV gas spacemixes with that of the SCV, which Is not Inerted, result In bounding pressures of 165.6 end 207.1 pala for the 3013 and food pack canconfigurations respectively. In addition to the deflagration pressures, the Internal energies of combustion have been calculated.
Revisions
No. Revision Description
o Onginal IssueI_______________________ sign Off___________
RevNo. Originator (Prdn) Sign/Dae Verification/ Checking Method Vertfier/Checker (Print) Sign/O~ats a~r(rn)SgiMt
0 ! .'7•..• / • [ Document Review __-_-_-_,_-_-_,_
Release to Outside Agency - Design AuthorIty (Print) Signature Date
Security Classification of fte Calculation
Appendix 3.8 - 3 of 50
Revision I S-SAR-G-0000 IM-CLC-A-00201, Rev. 0, Pg.2 of 47
Deflagration Calculations for the 9975 Package with Inerting
Table of Contents
Introduction and Summary 3Input 3Analytical Methods and Computations 4Results and Discussion 6Conclusion 7References 8Nomenclature 8Appendix 9
Introduction and Summary
Plutonium oxide in a 9975 shipping package can generate hydrogen by radiolysis ofadsorbed water vapor. The gas spaces of the inner container, either a 3013 container orfood pack cans, and the primary containment vessel (PCV) are inerted with helium andCO2 respectively to preclude the possibility of detonable hydrogen/air mixtures, [1]. Thecriteria used to preclude detonations are based on detonation cell widths, and do notnecessarily preclude flammable mixtures. The pressures that would be generated bydeflagrations in the various gas spaces, for the several possible scenarios involvingcontainer integrity, have been calculated. The scenarios that involve just the two innercontainers result in bounding pressures less than 100.0 psia because, due to inerting, thereis very little available oxygen. The two scenarios in which the PCV leaks into thesecondary containment vessel (SCV) result in bounding pressures of 165.6 psia for the3013 configuration and 207.1 psia for the food can configuration, because the SCV is notinerted. In all cases the calculations were carried out at the upper flammability limit(UFL), which is bounding. In addition to the pressure, the available energies for heatingcontainer vessels and components are also calculated.
Input
The 9975 shipping package consists of nested containers. In the 3013 configuration, thecontainers from the inside out are: the 3013 container, the PCV, and the SCV. The foodpack can configuration consists of two stacked cans, one on top of the other, inside of thePCV, which is inside of the SCV. The gas spaces of the 3013 container and the foodpack cans are filled with sufficient helium to reduce the volume fraction of oxygen to 5%.The gas space of the PCV is filled with air mixed with 75% CO2 by volume, and the gasspace of the SCV is filled with air. These containers are assumed to have been sealed atatmospheric pressure and 70'F. "(x" radiation can produce a further 2.3815 x 10⁻³ molsof helium, [2]. The plutonium oxide can have up to 25 g of adsorbed water vaporavailable for the production of hydrogen by radiolysis, [3]. The oxygen is assumed to not
Appendix 3.8 - 4 of 50
Revision 1 S-SAR-G-0000 IM-CLC-A-00201, Rev. 0, Pg.3 of 47
be released as a gas. Complete dissociation of the water vapor will produce 1.3877 molsof H2 , more than enough to produce flammable mixtures in all three of the nested gasspaces.
Three scenarios with the 3013 configuration are considered, and two with the food packcan configuration. The first 3013 scenario is the integrity of the 3013 container isassumed to be intact and the hydrogen-air-helium mixture in the gas space burns. In thesecond scenario, the 3013 container leaks and the gas spaces of the 3013 and the PCV areconsidered as a single control volume with a hydrogen-air-helium-carbon dioxide mixturethat burns. The third scenario has the PCV also leaking, so all three gas spaces aretreated as a single control volume. The initial temperature of the gas spaces in the three3013 scenarios is 3080 F, [4]. The volumes of the three gas spaces are, [5]:
V 30 13 = 0.0516 ft 3
Vpcv= 0.0582 ft3
Vscv = 0.0981 ft3
No credit is taken for the integrity of the food cans, so the gas mixtures in the cans andthe PCV mix freely. The second food pack can scenario has the PCV leaking andhydrogen mixture in the PCV mixing with the air in the SCV. The initial temperature inof the gas spaces in the food pack can scenarios is 3130 F, [4]. The three gas spacevolumes are, [5]:
Vfp cans = 0.05535 ft3
VPCv = 0.02295 ft3Vscv = 0.0981 ft3
The two stacked outer food pack cans are assumed to be cylinders, each with an outsidediameter of 4.25 in. and a height of 7.0 in. Plastic bags enclose the plutonium oxideinside the food pack cans, and the cans are wrapped in aluminum foil. These facts arerequired to calculate the food can and PVC volumes. These calculations are included inthe hand written notes that constitute the appendix.
Analytical Methods and Computations
The pressure resulting from a deflagration of a gaseous mixture in a closed vessel can becalculated with the ideal gas relation:
PV = nRT (1)
The temperature of the products of combustion is determined from the first law ofthermodynamics. The combustion process is rapid and therefore reasonablyapproximated as adiabatic. For this case, the first law states that the internal energy ofthe products of combustion equals that of the reactants:
Appendix 3.8 - 5 of 50
Revision 1 S-SAR-G-00001M-CLC-A-00201, Rev. 0, Pg.4 of 47
Enji'i +A-h-RT)i = fle(-h +Ah--T) (2)r. p
Equation (2) is expressed in terms of enthalpy because tabulated values of the ideal gasenthalpies for various gases [6], as functions of temperature, are more readily availablethan tables for internal energy. The enthalpies all have a common basis temperature of250 C, at which the enthalpies of all elements are assumed to be zero. Since theenthalpies are functions of temperature, the solution of equation (2) is necessarilyiterative. Subtracting the product of the universal gas constant and the temperature fromthe enthalpy converts the property to internal energy.
The gaseous mixtures in the five scenarios are well mixed. The composition of thereactants in each container gas space, minus hydrogen and helium due to "cC" decay, isspecified at the time of packing. The container gas spaces are then mixed in accordancewith the scenario under consideration, and sufficient hydrogen is added to put the gaseousmixture at the upper flammability limit (UFL). While the highest combustion productstemperature occurs with stoichiometric hydrogen, the added moles of hydrogen at theUFL more than compensate for the lower combustion temperature and result in a higherpressure. Complete combustion is assumed in all calculations. This assumption isconservative in that it results in the highest combustion products temperature, and is quitereasonable for the low flame temperatures of these inerted gaseous mixtures. Below2000 K, dissociation of the products of combustion is negligible.
In addition to the temperature and pressure of the products of combustion, the internalenergy of combustion is also calculated for each deflagration scenario. The internalenergy of combustion is the difference in internal energies of the products of combustionat the completion of the reaction and the products cooled to the initial temperature of thereactants prior to the deflagration. This is the available energy for heating surroundingsurfaces and internals within the vessel.
The H2 volume fraction at UFL varies with both type and volume fraction of inert gas.The adiabatic flame temperature at UFL is 1200 K, [7], and this characteristic is used todetermine the required H2 for a specified air plus inert gasses mixture. The adiabaticflame temperature is defined for a steady-flow process, and the appropriate form of thefirst law is:
Eni Q- + Ali) n ne(-h± +Ah)e (3)r p
Figure 1 shows the UFL for hydrogen-air plus inert gas as a function of added volumefractions of N2 or CO 2. CO2 is a more effective inerting gas than N2 because of its highermolecular weight. The 02 volume fraction controls the reaction at the UFL. Figure 2shows the 02 volume fractions for the same hydrogen-air-inert gas mixtures as shown inFigure 1. For the N2 cases the percent oxygen is constant at 5.5%, and with CO2 the
Appendix 3.8 - 6 of 50
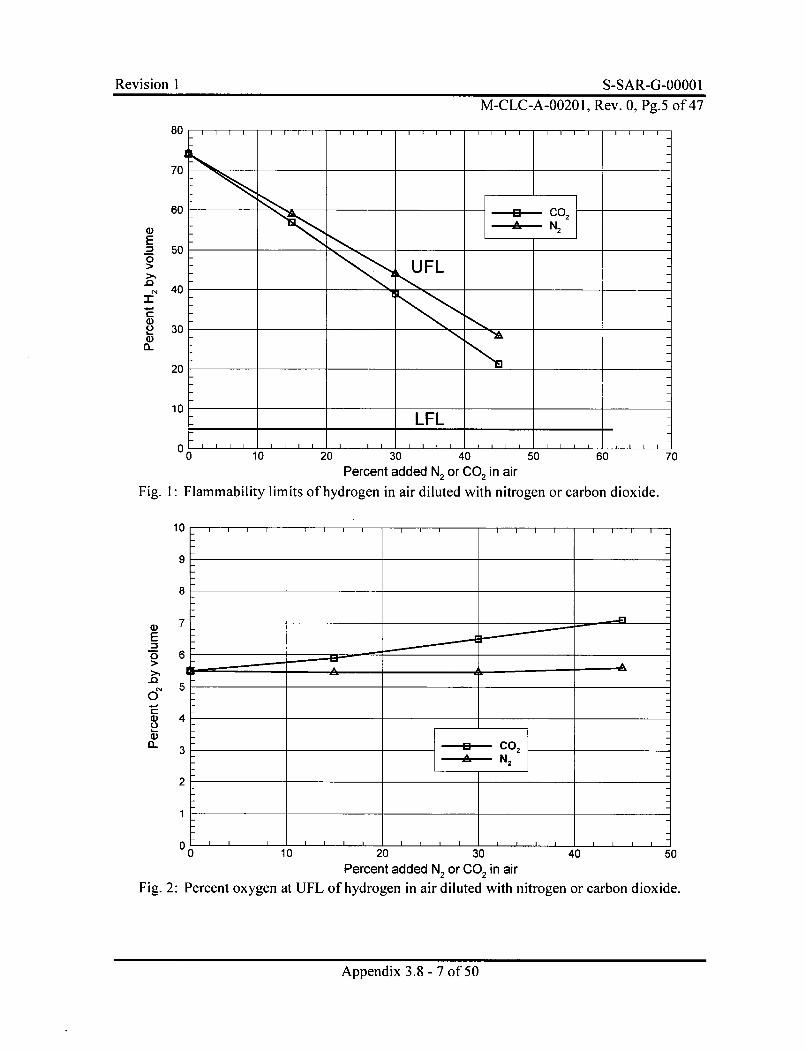
Revision I S-SAR-G-50 of1M-CLC-A-00201, Rev. 0. Pg.5 of 47
80
70
60
(DE
.0
IL'
50
40
30
20
10
00 10 20 30 40 50 60
Percent added N2 or CO 2 in air
Fig. 1: Flammability limits of hydrogen in air diluted with nitrogen or carbon dioxide.
70
10
W)E
.0
0
IL
9
8
7
6
5
4
3
2
1
-------- co2
-1A- N 2
I I I I I I I I
_0 10 20 30 40 50Percent added N2 or CO 2 in air
Fig. 2: Percent oxygen at UFL of hydrogen in air diluted with nitrogen or carbon dioxide.
Appendix 3.8 - 7 of 50
Revision 1 S-SAR-G-0000 1M-CLC-A-00201, Rev. 0, Pg.6 of 47
percent oxygen increases with increasing percent CO 2. These results are consistent withthe discussion in reference [7].
Results and Discussion
Hand written notes, showing all of the calculations that were done, are in the appendix.For scenario #1 of the 3013 configuration, the 3013 container only, the reaction forcomplete combustion at the UFL, per mole of H2, is:
H2 + .43302 + 1.628N2 + 6.939He --. 866H20 + .134H2 + 1.628N2 + 6.939He
The mole fractions of the reactants are respectively: 10% H2, 4.3% 02, 16.3% N2, and69.4% He. The temperature and pressure of the products of combustion, and the internalenergy of combustion are: 1743 K, 96.2 psia, and 1459.7 J.
For scenario #2 of the 3013 configuration, the 3013 container and the PCV combined, thereaction for complete combustion of stoichiometric H2, is:
H,+ .502 + 1.88N2 + 3.668He + 3.872C0 2 -->H20 + 1.88N2 + 3.668He + 3.872C02
The mole fractions of the reactants are respectively: 9.2% H2, 4.6% 02, 17.2% N2), 33.6%He, and 35.5% CO,. This mixture has an adiabatic flame temperature of 981 K, andtherefore is not flammable. There is, of course, some uncertainty in the flammabilitylimits, and therefore combustion calculations were carried out. The temperature andpressure of the products of combustion, and the internal energy of combustion are: 1267K, 67.7 psia, and 3190.9 J.
For scenario #3 of the 3013 configuration, the 3013 container the PCV and the SCVcombined, the reaction for complete combustion at the UFL, per mole of H2, is:
H2 + .10202 + .385N2 + .161He + .17C0 2 --k.204H20 + .796H2 + .385N2 + .161He +.17C0 2
The mole fractions of the reactants are respectively: 55% H2, 5.6% 02, 21.2% N2, 8.8%He, and 9.4% CO2. The temperature and pressure of the products of combustion, and theinternal energy of combustion are: 1566 K, 165.6 psia, and 14804 J.
For scenario #1 of the food pack can configuration, the food pack cans and the PCVcombined, the reaction for complete combustion of stoichiometric H2, is:
H2 + .502 + 1.88N2 + 5.564He + 2.166C0 2 --> H20 + 1.88N2 + 5.564He + 2.166C0 2
The mole fractions of the reactants are respectively: 9% H2 , 4.5% 02, 16.9% N2, 50.1%He, and 19.5% CO 2. This mixture has an adiabatic flame temperature of 1065 K, andtherefore is probably not flammable, but combustion calculations were carried out
Appendix 3.8 - 8 of 50
Revision I S-SAR-G-0000 1M-CLC-A-00201, Rev. 0, Pg.7 of 47
anyway. The temperature and pressure of the products of combustion, and the internalenergy of combustion are: 1428 K, 76.8 psia, and 2247 J.
For scenario #2 of the food pack can configuration, the food pack cans and the PCV andthe SCV combined, the reaction for complete combustion at the UFL, per mole of H2, is:
H, + .091802 + .345N? + .165He + .0643C0 2 -1.1836H 20 + .8164H2 + .345N2 +.165He +. 0643C02
The mole fractions of the reactants are respectively: 60% H2, 5.5% 02, 20.7% N2, 9.9%He, and 3.9% CO2. The temperature and pressure of the products of combustion, and theinternal energy of combustion are: 1640 K, 207.1 psia, and 14276.7 J.
Conclusions
As long as the gas tight integrity of the PCV is maintained, hydrogen generated byradiolysis of adsorbed water vapor in the plutonium oxide can result in gaseous mixturesthat are at best only marginally flammable. Wall effects, which retard the propagation ofa flame front, are completely ignored in this analysis. With narrow passages inside of thenested containers and the consequent large surface areas, it is unlikely that a deflagrationcould occur with a mixture that is within the flammability limits, such as scenario #1 withthe 3013 configuration. Treating the gas spaces of nested containers that leak as a singlevolume is also conservative. Constrictions in passages tend to quench flame fronts, so adeflagration in the 3013 container would not necessarily propagate into the PCV.
The SCV gas space is not inerted, and this is the source of a considerable amount ofoxygen when the inner containers leak. The two deflagration scenarios involving theSCV are considerably more energetic than the scenarios that take place within the PCV.
Higher molecular weight gasses are more effective inerting agents. The oxygen volumefraction at UFL for hydrogen-air with added nitrogen is approximately 5.5%. Withcarbon dioxide added to hydrogen-air, the oxygen volume fraction at UFL increasesabove 5.5% with increasing amounts of CO2. The hydrogen-air-helium mixture in the3013 container has 10% H, and 4.3% 0, at UFL.
References
1. Shadday, M. A., "Detonation Cell Widths in the 9975 Package with CO 2 Dilutingof the PCV Gas Space", M-CLC-A-00175, Rev. 1
2. Hensel, S. J., "Determination of Pressures in the 9975 Package", M-CLC-F-00491, Rev. 1.
3. DOE Standard, "Criteria for Preparing and Packaging Plutonium Metal and
Appendix 3.8 - 9 of 50
Revision 1 S-SAR-G-0000 1M-CLC-A-00201, Rev. 0, Pg.8 of 47
Oxides for Long Term Storage", DOE-STD-3013-2000.
4. Hardy, B. J., "Thermal Analysis of the 9975 Package for Normal Conditions ofTransport and Accident Conditions", M-CLC-F-00590, Rev. 0.
5. M-CLC-F-00630, Rev. 0.
6. Van Wylen, G. J., & Sonntag, R. E., "Fundamentals of Classical Thermodynamics",2nd Edition, John Wiley & Sons, New York, 1978.
7. Drell, I. L., & Belles, F. E., Survey of Hydrogen Combustion Properties", NACAReport 1383.
Nomenclature
f• Enthalpy of formation, (J/mol)
Ah Ideal gas enthalpy difference (T-298 K), (J/mol)
ni Number of moles of the ith constituent
P PressureR Universal gas constant
T TemperatureV Volume
Appendix 3.8 - 10 of 50
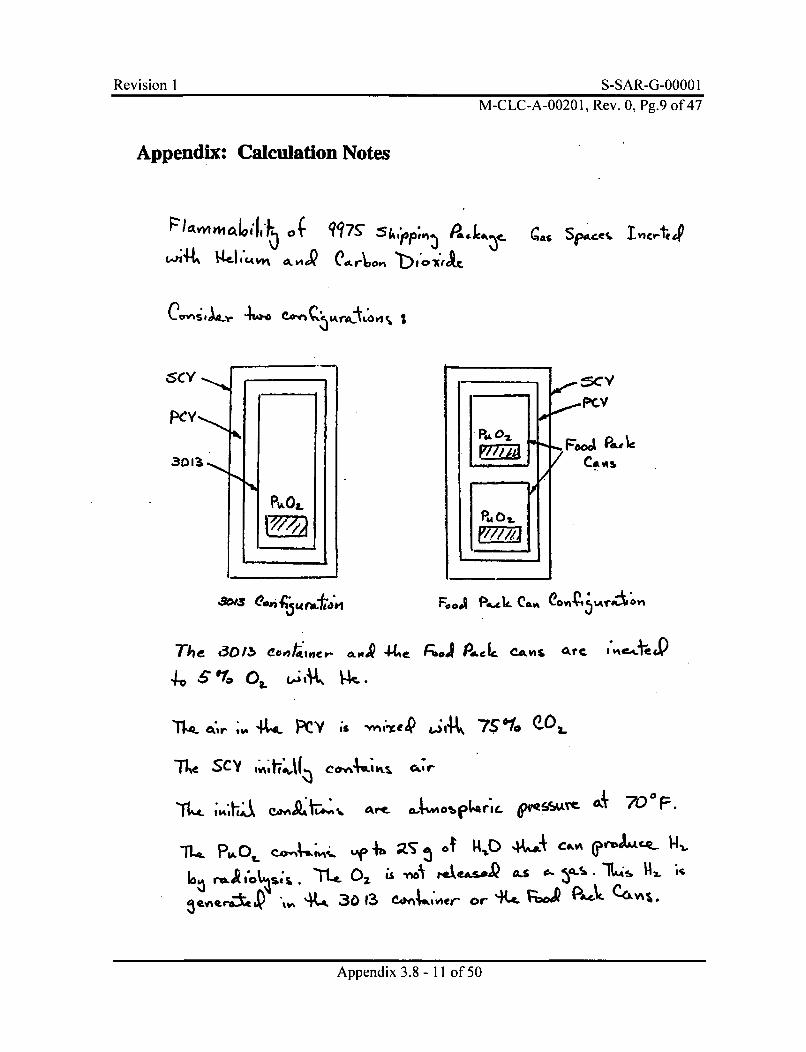
Re,vision I S-SAR-G-0000 1M-CLC-A-00201, Rev. 0, Pg.9 of 47
Appendix: Calculation Notes
PlaMaiv_, o q97S 54..p;,,_P. o.• s
.W3 & 13 u. mt ill~ FIO P"ýk C&V, eov~OI
The (30/5 0~r~e-111Pt -I4 C
4vS o5%OL C' u V~
Tk Q. 4km PCV 56 -nllcek &IA- 7S1O e-0L
T6e SCY 'Att &%v ~~
fk 4 ~;~;A ~iiA rt. o~a;~ e~~ca.4700 F.
6*ru ihis -1 0ý is nouI is.t .. .. ? 1A 4.
il.L3C) 13 C-M..44Oe( or 4,.RJPACCL"%
Appendix 3.8 - 11 of 50
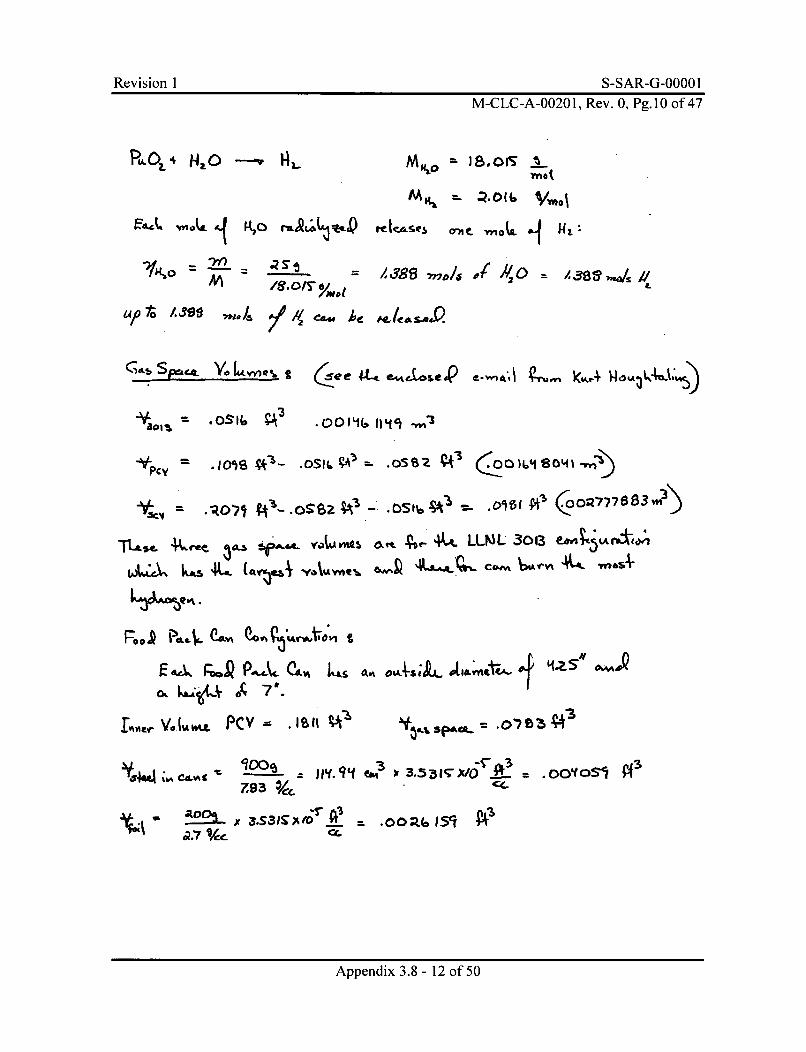
Revision I M-CLCA-0021, Re. 0, g.100 If4
M-CLC-A-00201, Rev. 0,. Pg. 10 of 47
R0L4 I4~O -' H~. m -8v A-HXO Vno'
Mgt~ ¶Y44
rel~se Oa 4 vom. 0 U4tk&-ý ".(X I M2o L~L~3~Q
(,,,• Spc,. Yo [4,,,,,
-2S7V3. ~,s-,~pIef
= 1.386 ,,.,,/ ,( J/2 -_ Al
A/ /c& he E4L.
~~~~~~~~1,, (Heg& .AiOeQ e-,, Ak~-
EYat i
-VPcy
= .OS16
-~~~~~~~ .u()~ oi~= oB 4
PIJ P114 e411%~.4Lo, A,•, 7• *.
_ý1r,,, v.. I,, ,., PCV -I . I 4s, 07 6v.,., ,,. -- 0 1+ ' .,
"y4,,l "=_ _ _- f il 13 3.5-"31_7 NO
z 9 3ýIcece4
AO~~j -r -
.A0pedx -si
Appendix 3.8 - 12 of 50
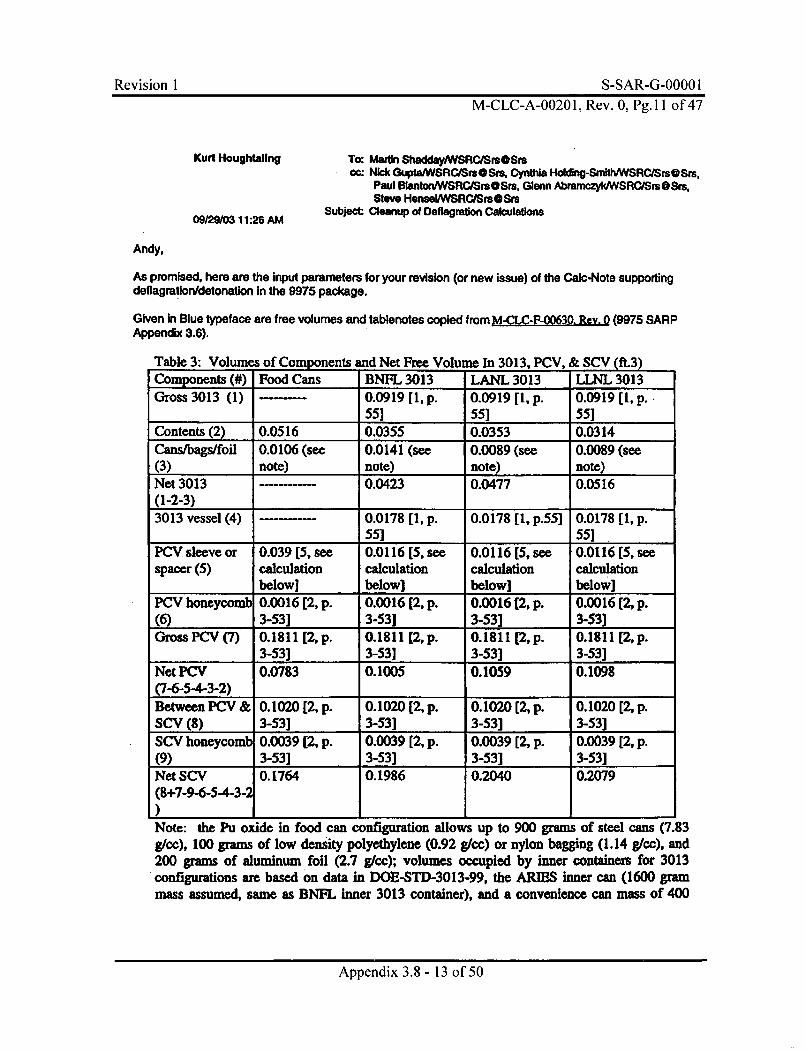
Revision I S-SAR-G-0000 IM-CLC-A-0020 1, Rev. 0, Pg.1I I of 47
Kurt Houghtaling
09/29/03 11:26 AM
To: Martin ShaddayiWSRC/Sr@Srs=c Nick GuptIWSRCISrsOSm, Cynthia Holdlng-SnMhWSRC/Srs@Srs,
Paul BtantonfMSRC/SrsOSm, Glenn Abramczyk/WSRC/SrmOSrs,Steve Hensel/WSRCISrs@Srm
Subject: Cleanup of Deflagratlon Calculations
Andy,
As promised, here are the input parameters for your revision (or new issue) of the Calc-Note supportingdeflagration/detonation in the 9975 package.
Given in Blue typeface are free volumes and tablenotes copied from M-CLC-F-00630. Rev. 0(9975 SARPAppendix 3.6).
Table 3: Volumes of Components and Net Free Volume In 3013, PCV, & SCV (f.3)Components (#) Food Cans BNFL 3013 LANL 3013 LLNL 3013Gross 3013 (1) --- 0.0919 [1, P. 0.0919 [1, P. 0.0919 [1, p.
55] 55] 55]Contents (2) 0.0516 0.0355 0.0353 0.0314Cans/bags/foil 0.0106 (see 0.0141 (see 0.0089 (see 0.0089 (see(3) note) note) note) note)Net 3013 0.0423 0.0477 0.0516(1-2-3)
3013 vessel (4) ------- 0.0178 [1, p. 0.0178 [1, p.55] 0.0178 [1, p.55] 55]
PCV sleeve or 0.039 [5, see 0.0116 [5, see 0.0116 [5, see 0.0116 (5, seespacer (5) calculation calculation calculation calculation
below] below] below] below]
PCV honeycomb 0.0016 [2, p. 0.0016 [2, p. 0.0016 [2, p. 0.0016 [2, p.(6) 3-53] 3-53] 3-53] 3-53]Gross PCV (7) 0.1811 [2,p. 0.1811 [2,p. 0.1811 [2,p. 0.1811 [2,p.
3-53] 3-53] 3-53] 3-53]Net PCV 0.0783 0.1005 0.1059 0.1098(7-6-5-4-3-2)Between PCV & 0.1020 [2, p. 0.1020 [2, p. 0.1020 (2, p. 0.1020 [2, p.SCV (8) 3-53] 3-53] 3-53] 3-53]SCV honeycomb 0.0039 [2, p. 0.0039 [2, p. 0.0039 [2, p. 0.0039 [2, p.(9) 3-53] 3-53] 3-53] 3-53]Net SCV 0.1764 0.1986 0.2040 0.2079(8+7-9-6-5-4-3-2
Note: the Pu oxide in food can configuration allows up to 900 grams of steel cans (7.83g/cc), 100 grams of low density polyethylene (0.92 g/cc) or nylon bagging (1.14 g/cc), and200 grams of aluminum foil (2.7 g/cc); volumes occupied by inner containers for 3013configurations are based on data in DOE-STD-3013-99, the ARIES inner can (1600 grammass assumed, same as BNFL inner 3013 container), and a convenience can mass of 400
Appendix 3.8 - 13 of 50
Revision I S-SAR-G-0000 IM-CLC-A-00201, Rev. 0, Pg. 12 of 47
grams for both LLJNL and LANL configurations was assumed (all 3013 configurations arefree of polyethylene or nylon bagging, and crushed aluminum foil).
Notice that the table above provides three set of 3013-related volumes. Which 3013 free volume Is theworst case must be determined by you before running the series of six analysis cases given below. Is itthe smallest volume to receive deflagration pressure or largest volume to maximize deflagration fuel?
Gas temperature used In your old Calc-Note revision M-CLM-F-00499. Rev. 3 (SARP Appendix 3.8) Isunchanged. However the gas compositions have. Gas mixtures to be evaluated are the following.
SCV = Normal airPCV - Normal air diluted by 75% C02Can = Normal air diluted to 5% 02 by helium (Can is either a 3013 can or a Food-pack can)
Hydrogen presence is limited by full dissociation of the 25g of water present Inside the Can (be it 3013 orFPC).
Cases to be analyzed are the following.
1 Bum Inside 30132 3013 leaks freely into PCV and gas mixture bums.3 3013 and PCV leak freely Into SGV and gas mixture bums.
4 Bum Inside Food-pack can (FPC)5 FPC leaks freely Into PCV and gas mixture bums.6 FPC and PCV leak freely into SCV and gas mixture bums.
Please charge Activity Code LSLDHBLNPThank you for your service.
Kurt Houghtailng 803/725-3360kurLhoughtaling@ em.gov
Appendix 3.8 - 14 of 50
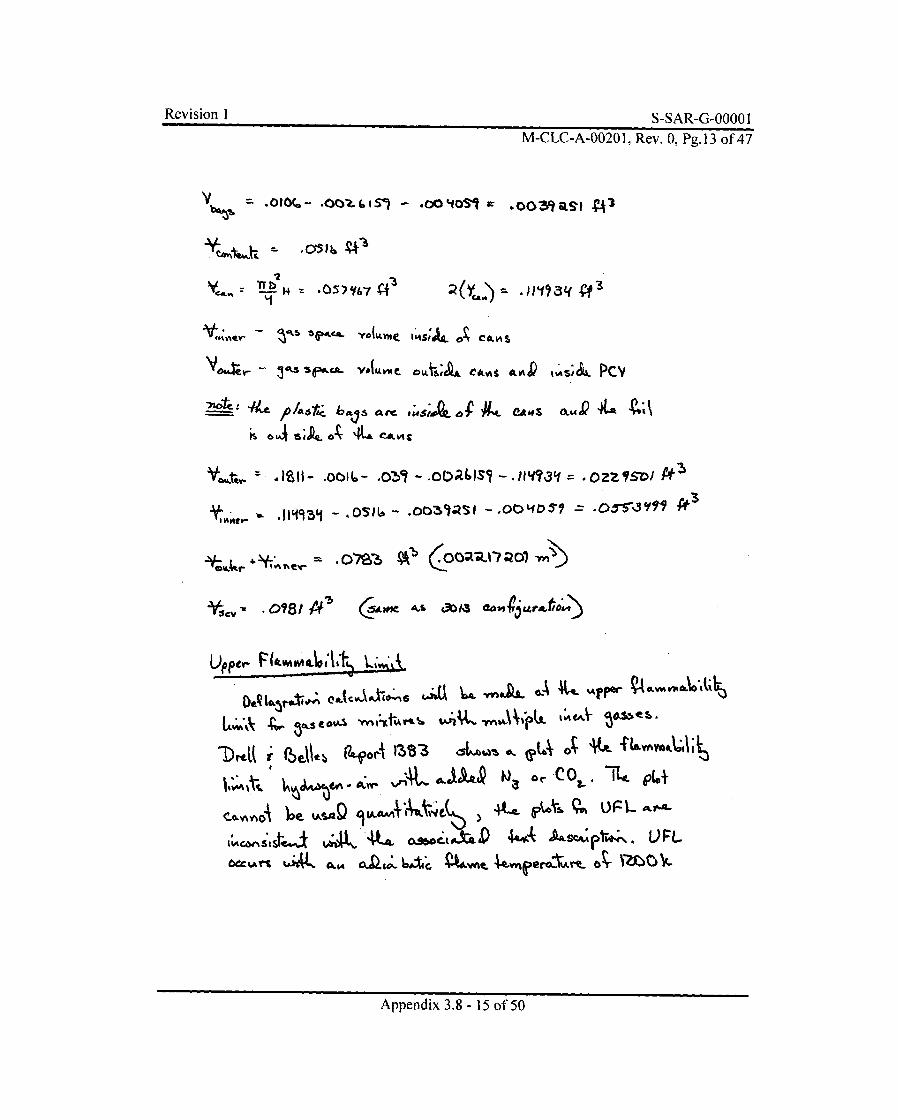
Revision I S-SAR-G-0000 I
M-CLC-A-00201, Rev. 0, Pg.13 of 47
V =.00(m - -011Sl - .00 O'1O .0039 as. A"
•,,,.lS ,II,1- .ooI(.- .OZ• - .O()•A6IS• - .n'It'l .OZZgS'ow "
•,,•,-• .11't9:5 - .0 1 - .o0Q•,;.SI - .o-:•O ' .c---"3•?f '/"
U116
.28L(IT&~ b jL ~~xA r'.v~ E
Yo,-re, Ottý;I& C&AS IIVk L4&PC
Appendix 3.8 - 15 of 50
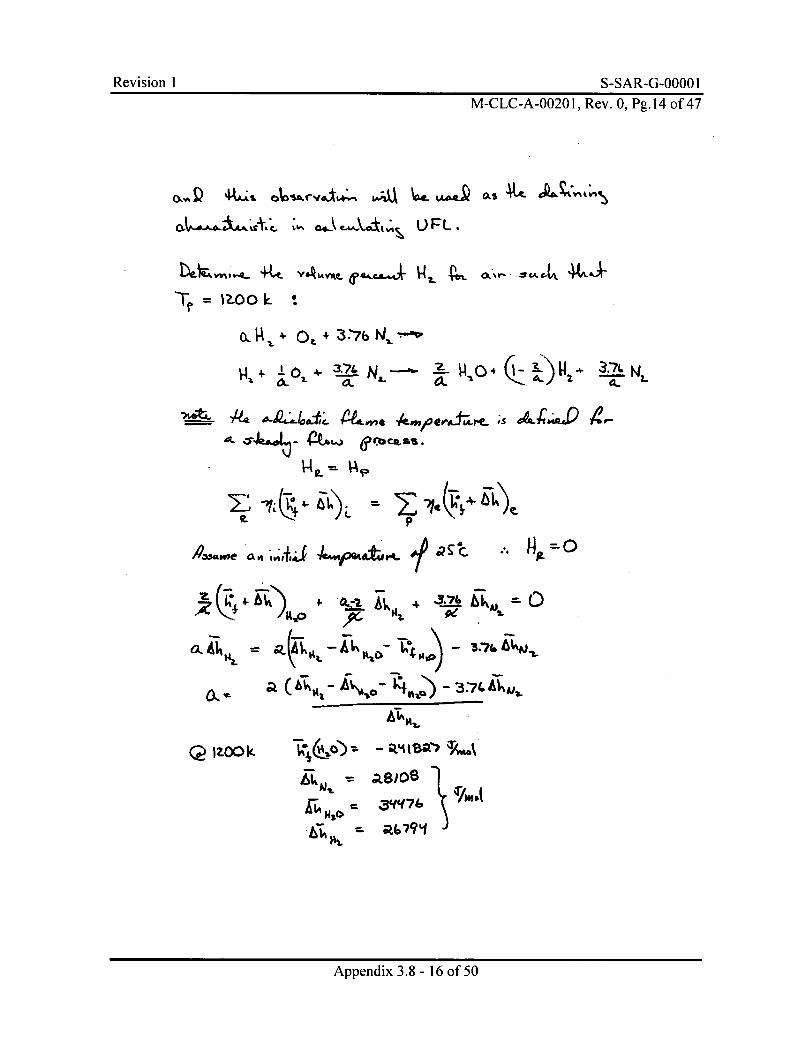
Revision I S-SAR-G-00001M-CLC-A-00201, Rev. 0, Pg.14 of 47
~~LUFL.
+ -1 0 ()4 L tO 0L 2 0 Na L.
P- P
a s. 101 '/~p4 ;aP" 9 d
... Nx =O
4~~~ '127-1. ~ CA06 . 2
Ol
HL ( 14,- A %0 -I ) - 3 -744-,
Q IZOok
MLh~i
e ix ; 1 of 5a ,qq7~
Appendix 3.8 - 16 of 50
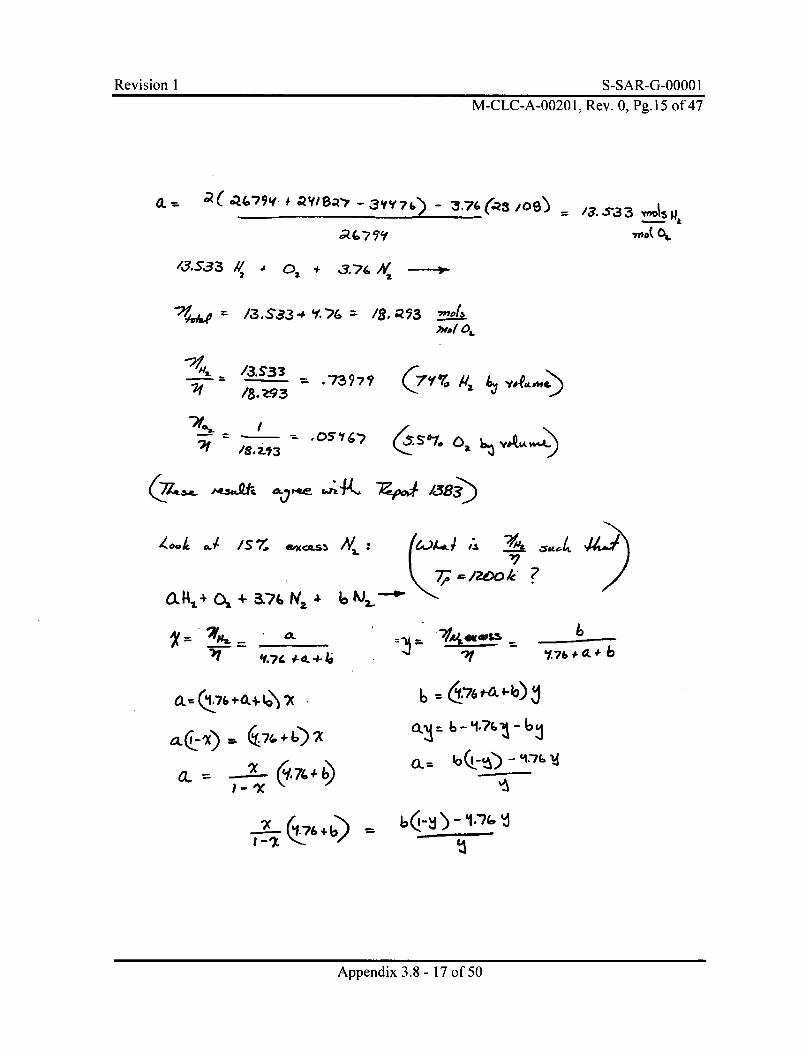
Revision I S-SAR-G-O0001
M-CLC-A-00201, Rev. 0, Pg.15 of 47
a, 8;1- - 3VY(7,6) - 3.7'(.Qs 0o),
"/J.S3/ 1 3S33+ 4 .'?6= /
ho/ O,.
-'I /,3..-,3 3 S.'7397y/8. 93
&s.t 1.
lo-k i*l /S7. N,.~s 4.)AdL A
am% 4 0, + 3.7 64 tJ7
Ook
44~1
1-7 &t&-f-4 3tA4~eIt.&S -
~37'.7k, i . + b
Oe.~' -
o..= 6-£ .•-- 61
Appendix 3.8 - 17 of 50
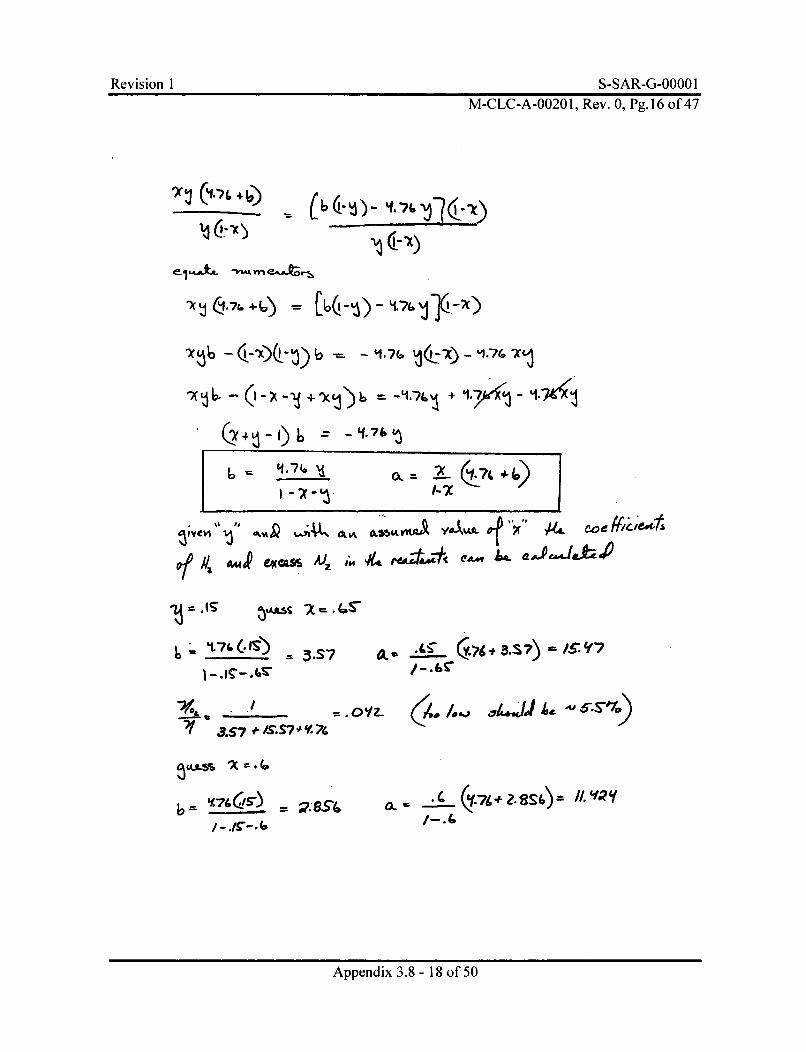
Revision I M-CL-A-0201,Rev.0, g.0016 f4M-CLC-A-0020 1, Rev. 0, Pg. 16 of 47
(4-744)
~ci-x)e1 .A.A*L -¶~1A&w~eA4~,-~
-X @ý (4 -7.+6 = C6 ý -4.7
6,- 0 -;.7' •, )- -- ,+
-74 (-,~- 1) *~j =~ ~~i+I~ -%1
-I--x
~Y A W of. #-C we -oe
41.rei-a-A 4 L aJj-jJ2hP
= -,(.-A) = . s
I - .• - .. S7 I-.L"
3.S7 '06S-SS74= . OYZ- (A. /., •,d/,A."l -,, us-. Y'll)
/-./-. -(a I-. 7I
Appendix 3.8 - 18 of 50
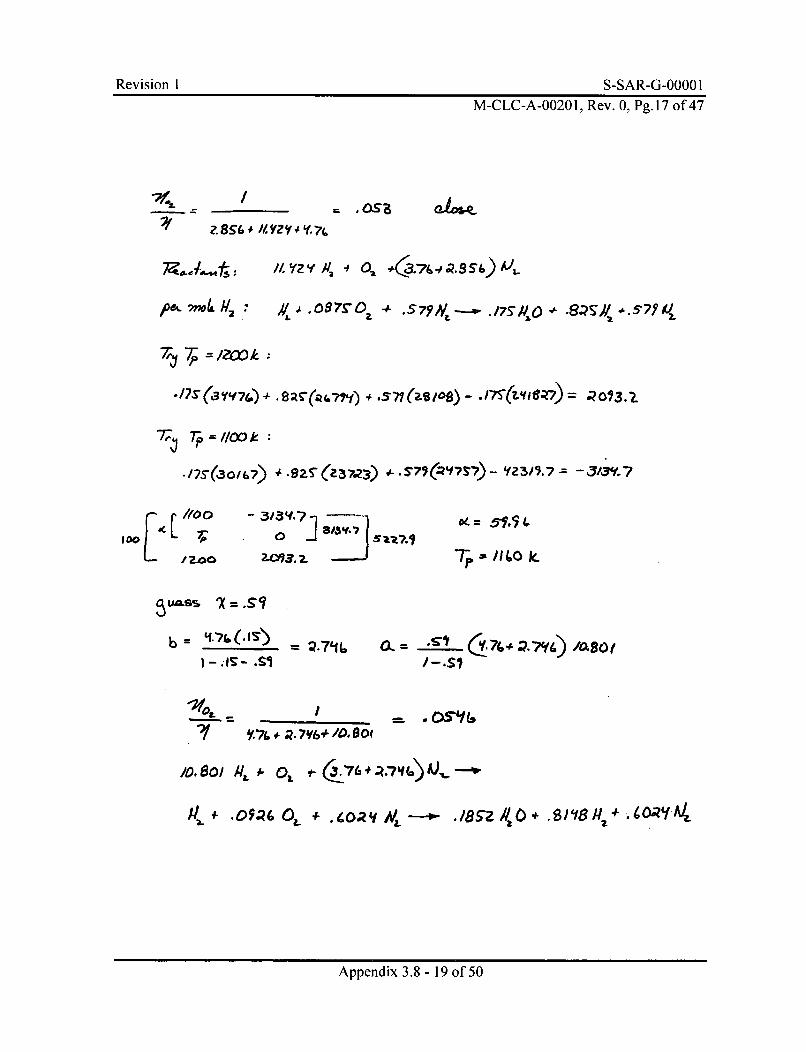
Revision I S-SAR-G-0000 1M-CLC-A-0020 1, Rev. 0, Pg. 17 of 47
SS. 0/ .OS VL..Y.
7,2Z.ýýt . 8// Y-7 Y 4 0.5fl(3.lO( -0 Q. 9 S vfe ) A)
7, -- T~
2-,p7.Tsi~k
7,~s j X=SIlo
/7 = ____p7% 0
/' .5
Appendix 3.8 - 19 of 50
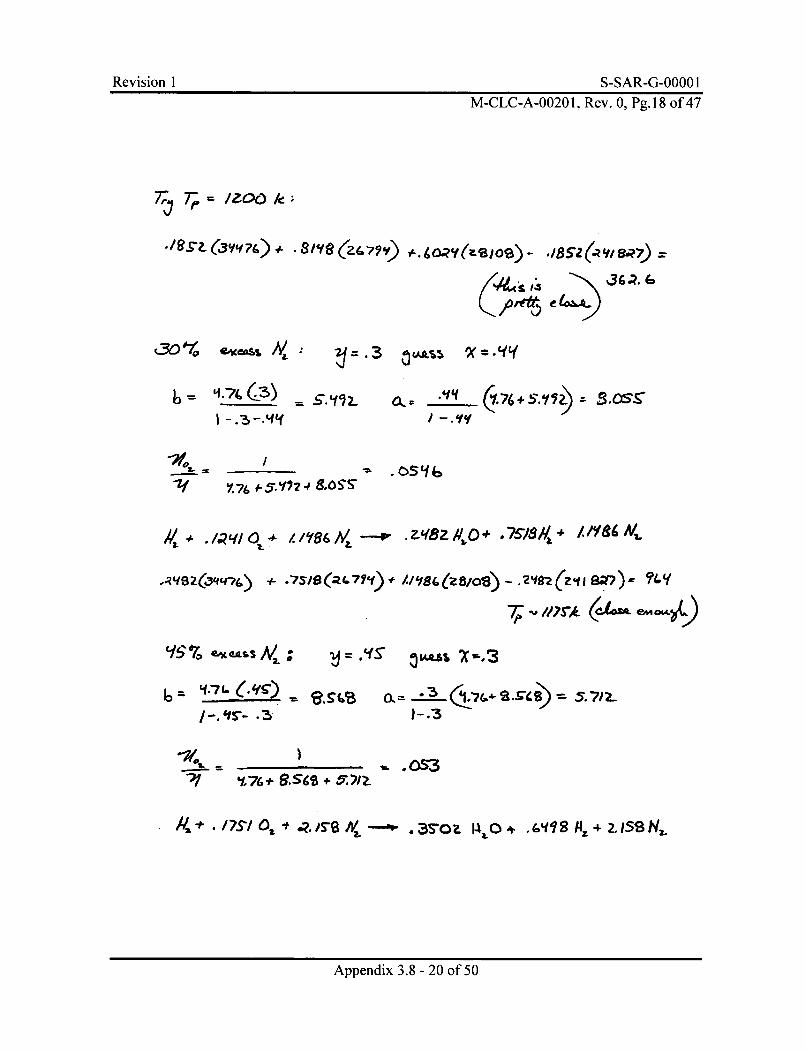
Revision I S-SAR-G-0000 IM-CLC-A-00201, Rev. 0, Pg.18 of 47
•/•S-(3YV (Z) .sa7Y) a9 ,, .?,,r-,o )- .,8IZ(QIR7) =
ý 1ý 136?.Z fi/ onk : " ~a') e
,X =qy
j 2 = 'ILC32-
I~ S...0fLT
-. f . V.
/-'1 I- .3I*
T..
Appendix 3.8 - 20 of 50
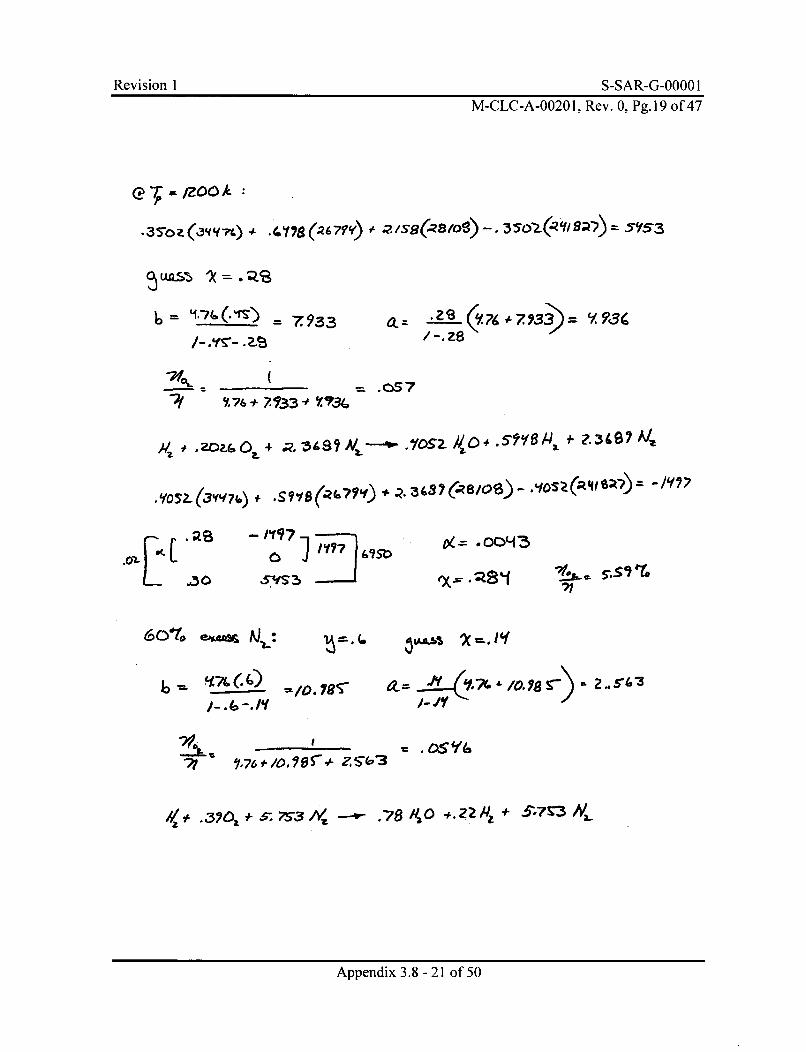
Revision I S-SAR-G-0000 IM-CLC-A-00201, Rev. 0, Pg.19 of 47
e7,OL oo Ix
4~.-7&.(.TE) 793
2/ 76+ 7-334 Y¶7,3G
-Z-a 0 7,1733)
.OS7
f4#+~~~(- )OS2 ~, 5/~~
-as.0111-1
zo
- 171110 1¥• 61?$' 9= M403
7/'7
601a"=%N,_
7b Z S(0'
z=~~ T2~t'Lo -) -
//?. -t 3ý02. * .5: 7S-3 t1, -- w- .78 /ý 0 4.2 2 Nz + 5ý'7V3k
Appendix 3.8 - 21 of 50
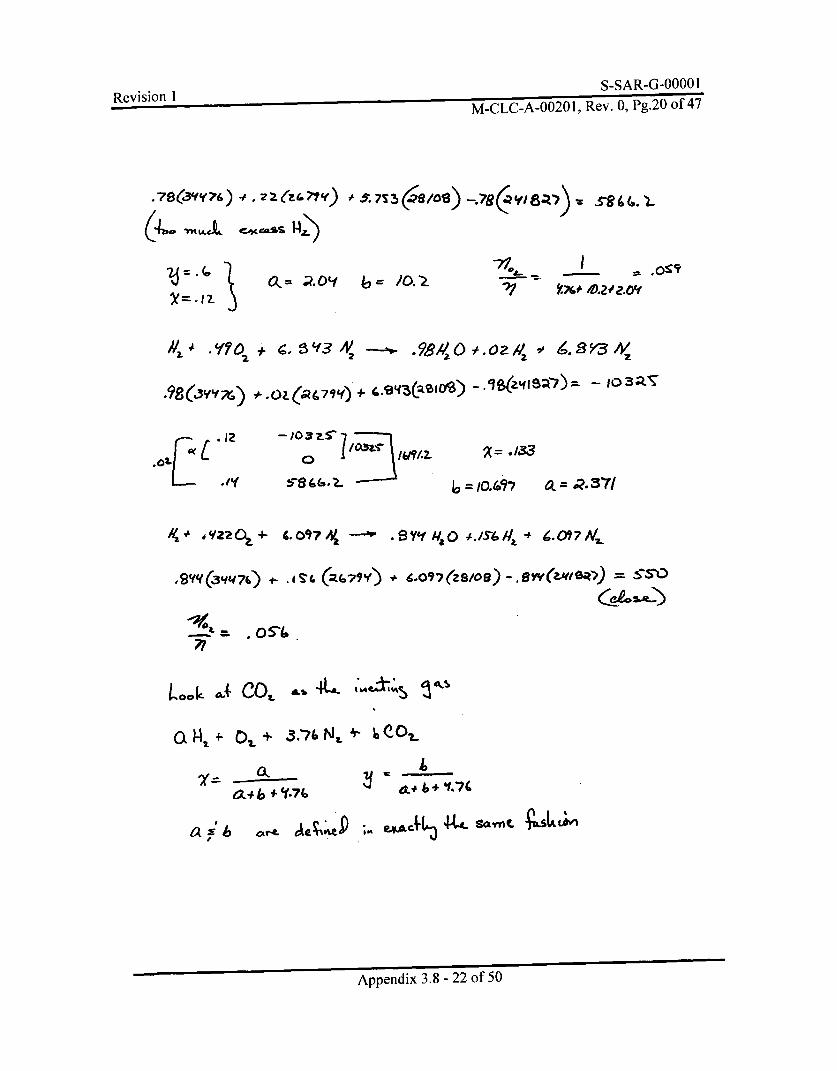
Revision 1 S-SAR-G-00001M-CLC-A-00201, Rev. 0, Pg.20 of 47
.78 (L3fY 6 ) 4 , z47y
(4b0 ¶I..1 CA.16St 14Ž) 787Y/A)
23 =. 1,,X=-.17_
0, = ;?.Ott to= =o.2. '17I - .0:C9
ý760- 10-2102.0'f
Y? 0~ +98C.O 5 3 N,
.98(,3YYv't&) + *OZ(Q 7 *1f) +,. 6 gq3S(;aeo 1 .%zS)S7) - g0
."/y
-103 7 '-T0 1 / 1 '66/2-
- S6&.z "
X = .133
/0 t.69'7 6L=•.7
#1 4Y22Da+.. 01 N -- . ~.9 (zS 14) -4.II&N 4 097W
,9q(ll4G) T (Z(7y)+ -97(2/8) 6W2elo
L 00 k46fCOL ,,, 4L. 1--4-
CQ HI + 01._ + 3.-7tN, * ~C07-
t6,b +'(.74
6~ -cL4 64 'V.7~
Appendix 3.8 - 22 of 50
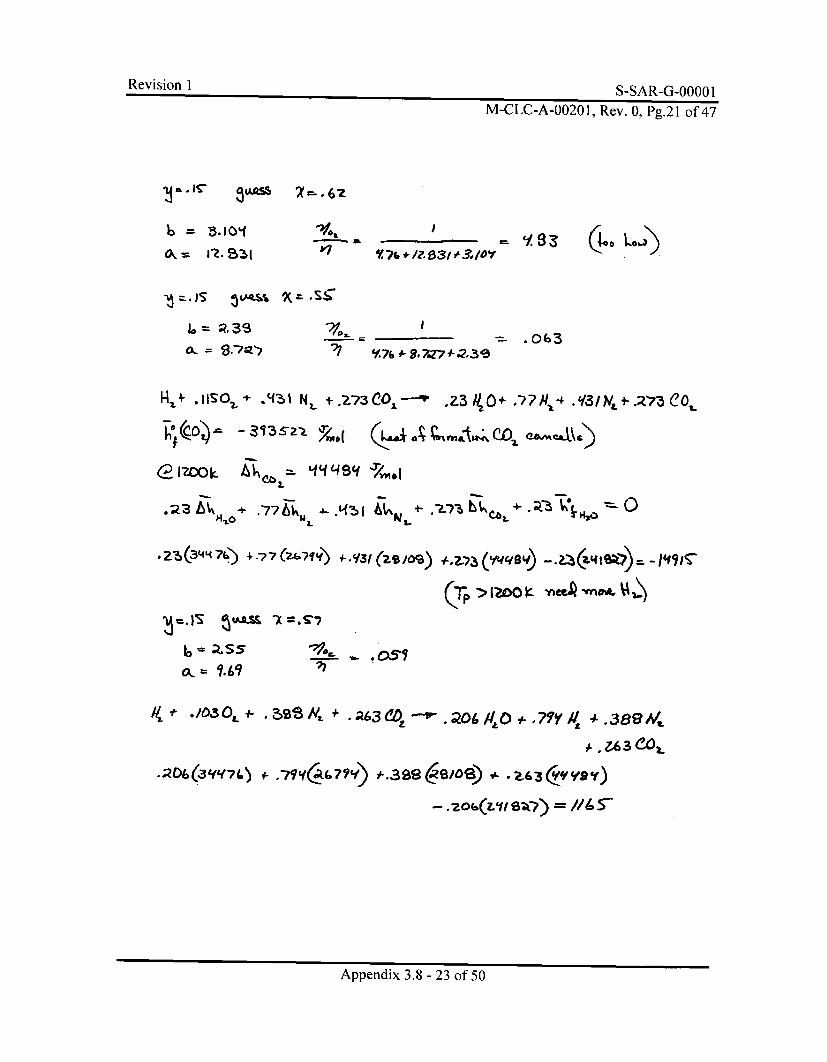
Revision I Q,-Q AD t/,l-z -UU nU
M-CLC-A-00201, Rev. 0, Pg.21 of 47
I - -"g' 3 00-*A 7 --- - 67
6 oi
a, B,- ~5.7
I
-6 r-IS JtAQ.A X=S4
6 =Q.S3,
I=- .0(03
gf.76 4- 9.7,27 4- Z3 6
H I* 11O2..+ .4'1?~ 4 Nl-. 3 01 Z3 k 0 + .7 7 N,, 4 . Y,3 I)V? J- .:Z'73 C 0,
-3¶3Sz~ Aý .bVa*4 \ O ~c W
Im77- 1141491
H+ ALAZ~ +~
.26(446
(T >170
F .'zoh((67¶/ 1-.399" 5
Appendix 3.8 - 23 of 50
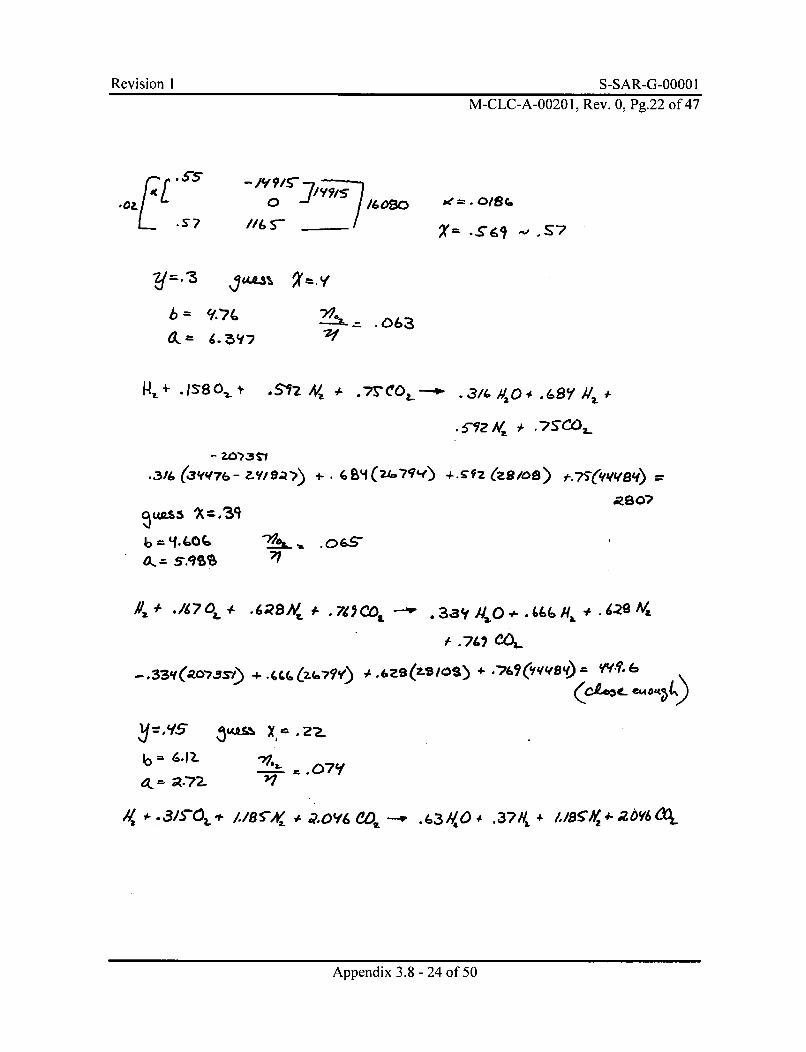
Revision I S-SAR-G-0000 IM-CLC-A-00201, Rev. 0, Pg.22 of 47
.S-
- /5O91/0
X_ .S'6 aS
b= 91N.
a,= 6-v--&.=- 06a
.S1521 A/?~
- wO)3cl
qAS'X=.396 .G&
O'=# T.9SIS
a 0'?
~o .76S
-. 33, (-O75s-) -CC. z(-7?) 4-6S(?S/S) '&9('Voy)= o'? (
10 6.7
0, ;R.72-07Yf
/a~ * -3ISOCL' -L //8 5Aý- 7. # Y 60, -- .63 ~#, .3' // 4 //-h4- 2OVf6 ML
Appendix 3.8 - 24 of 50
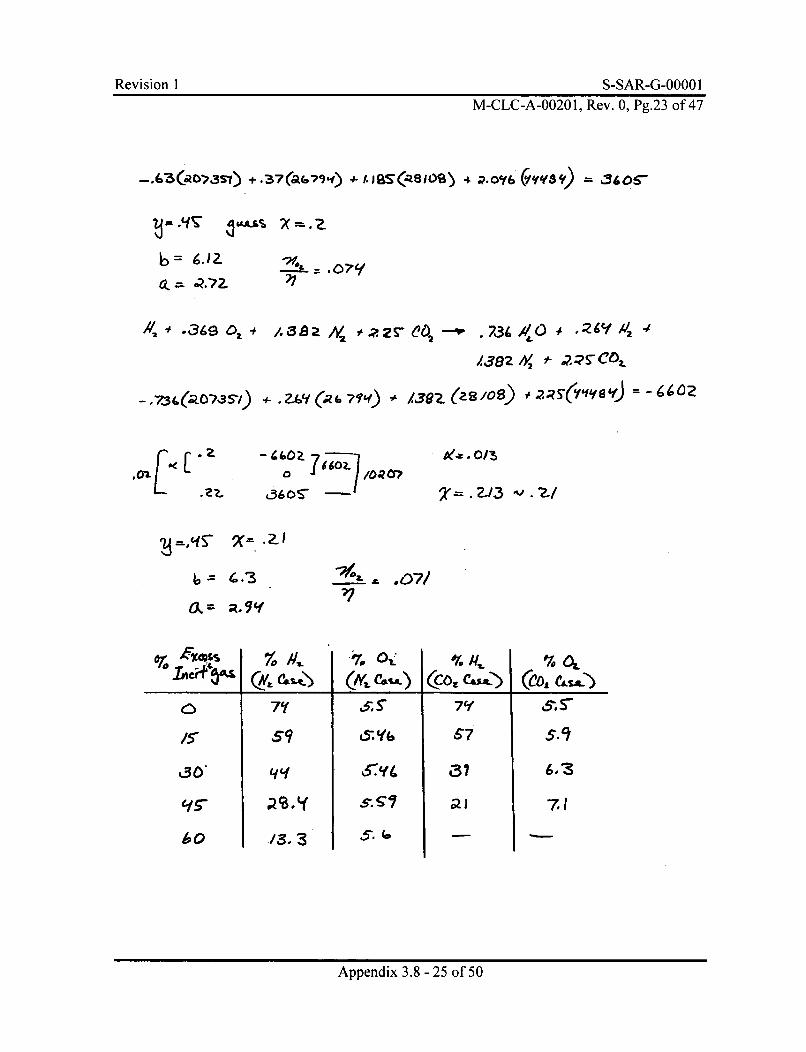
Revision I S-SAR-G-00001M-CLC-A-00201, Rev. 0, Pg.23 of 47
-. (63(aR"3S-1) +.37(&679uf) 1.1S(ZSiOB) 4 Q.O'f6 (YV-)=3.T
ý - IfT uV 2(.&S
6=~i
.7.3613 a A aN - eo ;Z6'f A12 4,34
39 2 4/2 Ce)z
-. 73,(a0-7-3S-/) Z,6Y (,R 6, -7-N) /39'Z (P-S /09) 0'2;ZS'(Y"y8'fJ
3g0 -,to 2-/-O3v
0.2.0w
-614 , SS %g2.;7P ~
-7. Ml,.(co'. Cas* (COS CAS..7)
0
1'5
,.30
6/5,
60
7Yf
sq
13.
151's,
6. Y6
,fn
S-- GI
5.16
7'1'
S7 5.9
6.3
7.1
Appendix 3.8 - 25 of 50
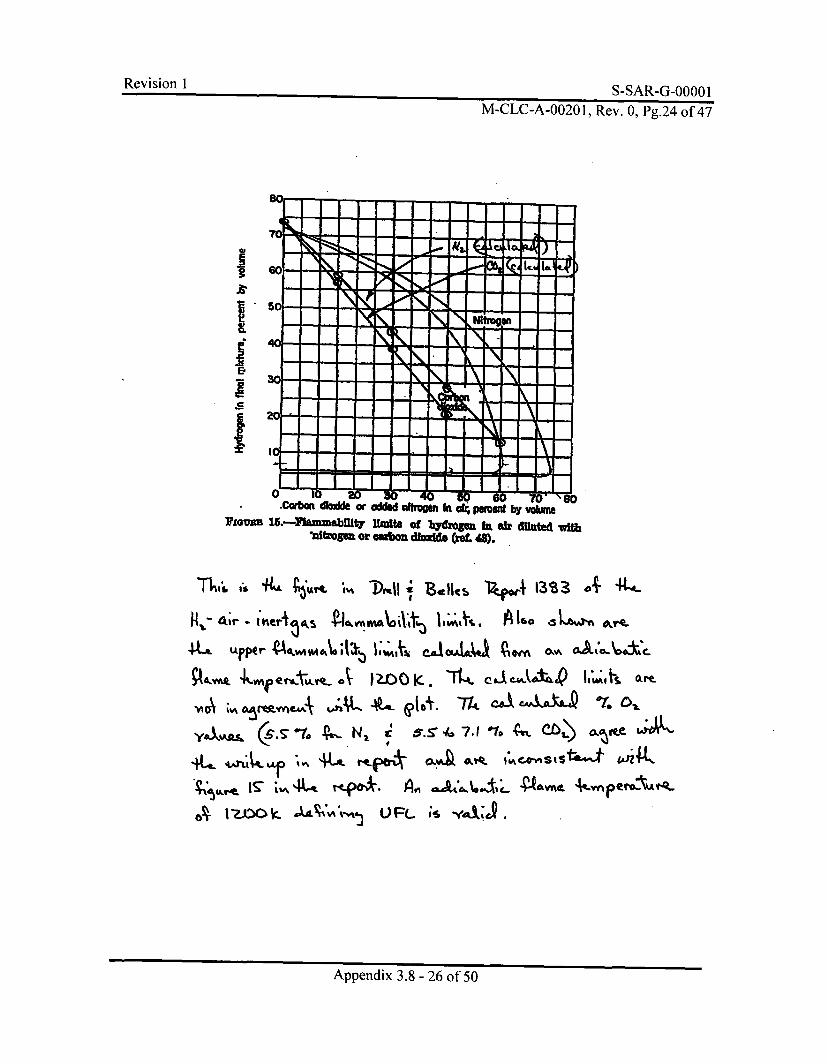
Revision 1 S-SAR-G-0000 1
M-CLC-A-00201, Rev. 0, Pg.24 of 47
Si
I
.Carbon dloid or odded ntmo In b percint by vobmeFlamm . J.-PlummabUty 10 of hbYdrgenu hah die with
. itzogie or oasio dkzie (Il. 4M).
is 4L is' fl* hn4\ ij~e~1 A ISO 3 a" 01"
A - ,A-ptr V ..k VA ,,odt7,• I*,. ej4 A e,, - a•1,f O . ,AIOA.Z c
ok•-t 1kV.. e Aoov, -,,r [n_ ;,, •. .' 0.M
Appendix 3.8 - 26 of 50
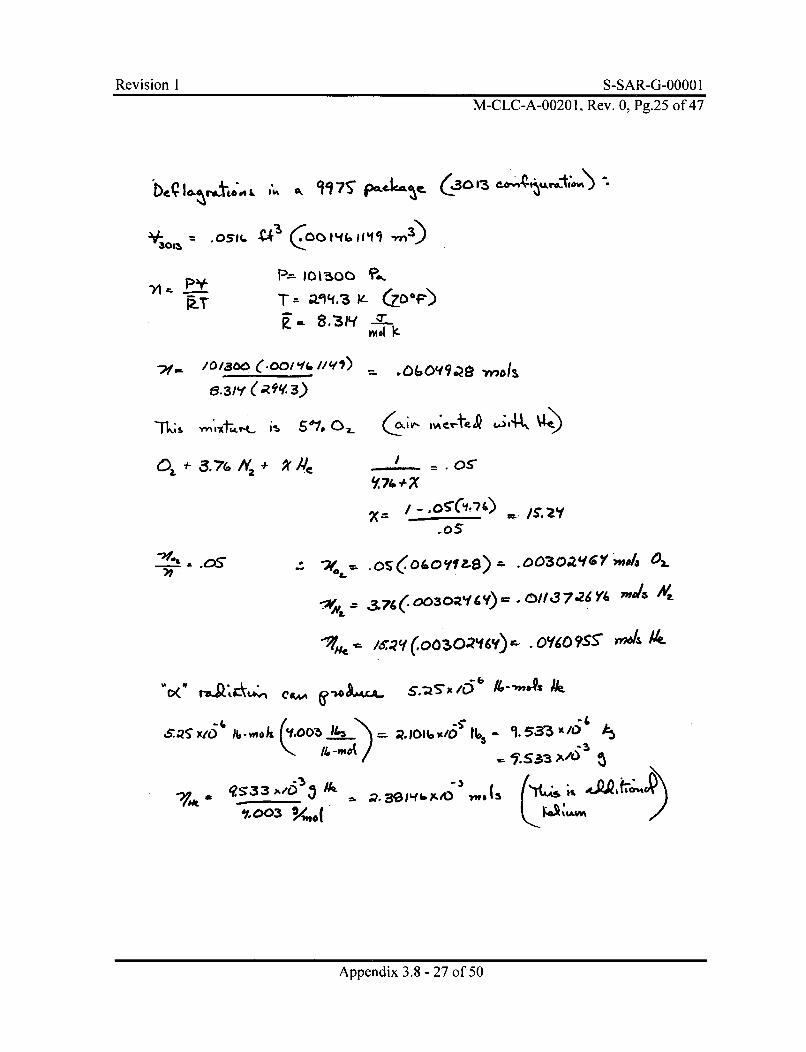
Revi sion 1 S-SAR-G-00001M-CLC-A-00201, Rev. 0, Pg.25 of 47
bedq 14~ri TAt ~, OIL¶ 47S 'm"e a -
'0-ol = .01_P_ 1(.lY_ m3
)-A I->= 13Q5?.
T al i-,.
8.-3 6Rfy 3)
oz .-F 3.76. ,% + t Ate< 05:.os
-= ]-.05'-",'i-7) =. /S'. 2
176 00 3'O0V- 4 0//,37.23Y2 mh AY6
" ; ,lgx) mkIfa OO/Z )L3 16 -,& ~ -mo
•. ,•'•..•'.('°•+-.t '--' ,,o,.'• •, . s• A/0,"•
's3 "" 3 A"L 3, ,. ,,;,
Appendix 3.8 - 27 of 50
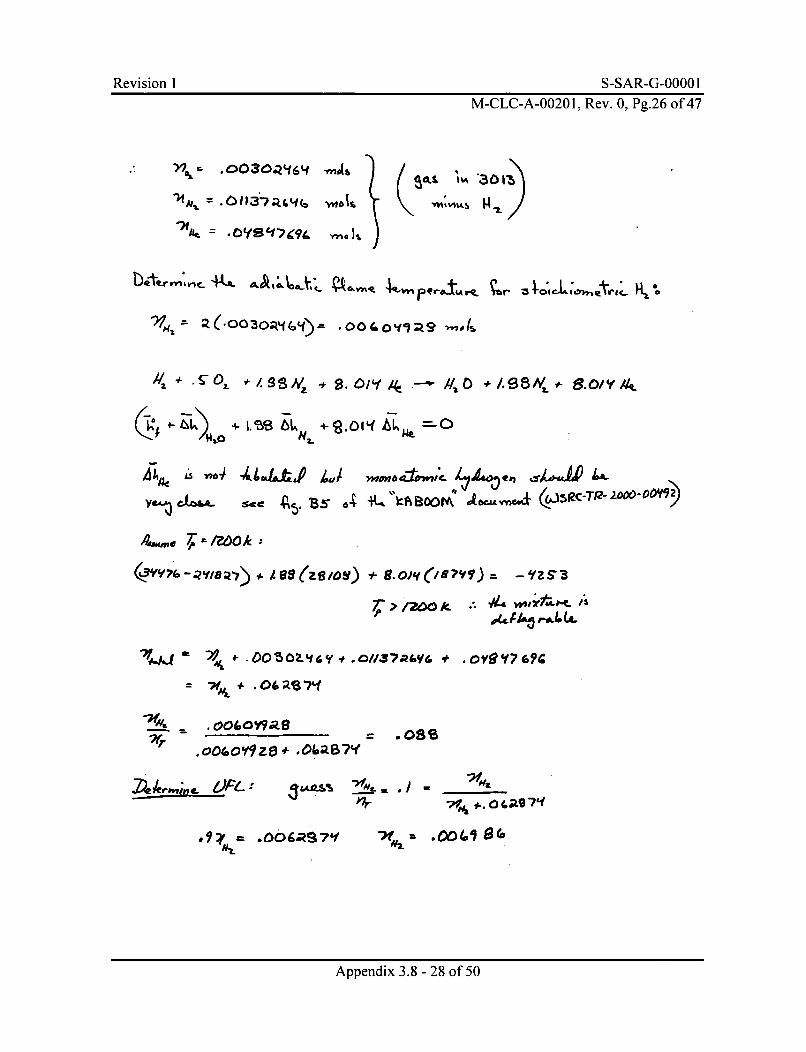
Revision 1 S-SAR-G-O000 1M-CLC-A-00201, Rev. 0, Pg.26 of 47
W.z .0030,.'f6L 4 -nA; -aO
.O0o~ + m N. 1.0/Y/
? /200 A. 0b6-00Ype .A e B '6 k , 'K. (w,*.I.
A.OV6f..ol7RY T, .ovBY?
+ ./WO k1npL A
Mr. ,o-~ z+.~B t= .086
1L~ .
.001.1 8'.006;S7'fAppndx M
Appendix 3.8 - 28 of 50
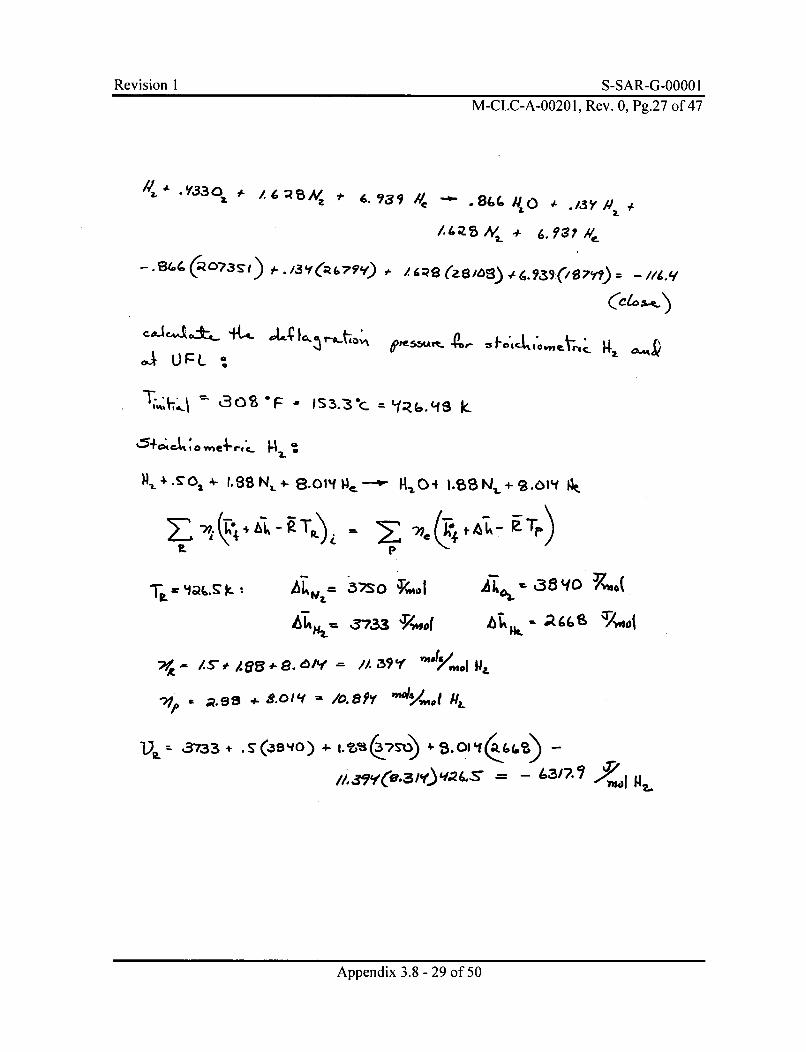
Revision 1 S-SAR-G-0000 IM-CLC-A-00201, Rev. 0, Pg.27 of 47
~~3O~~~ A/% +S2c ~~q
'540 .tXawertc 4
P'1L 1 .88 N. III,' -- V +o89 S.O/f
0 t9(.3f. =Y = /0.7
Appendix 3.8 - 29 of 50
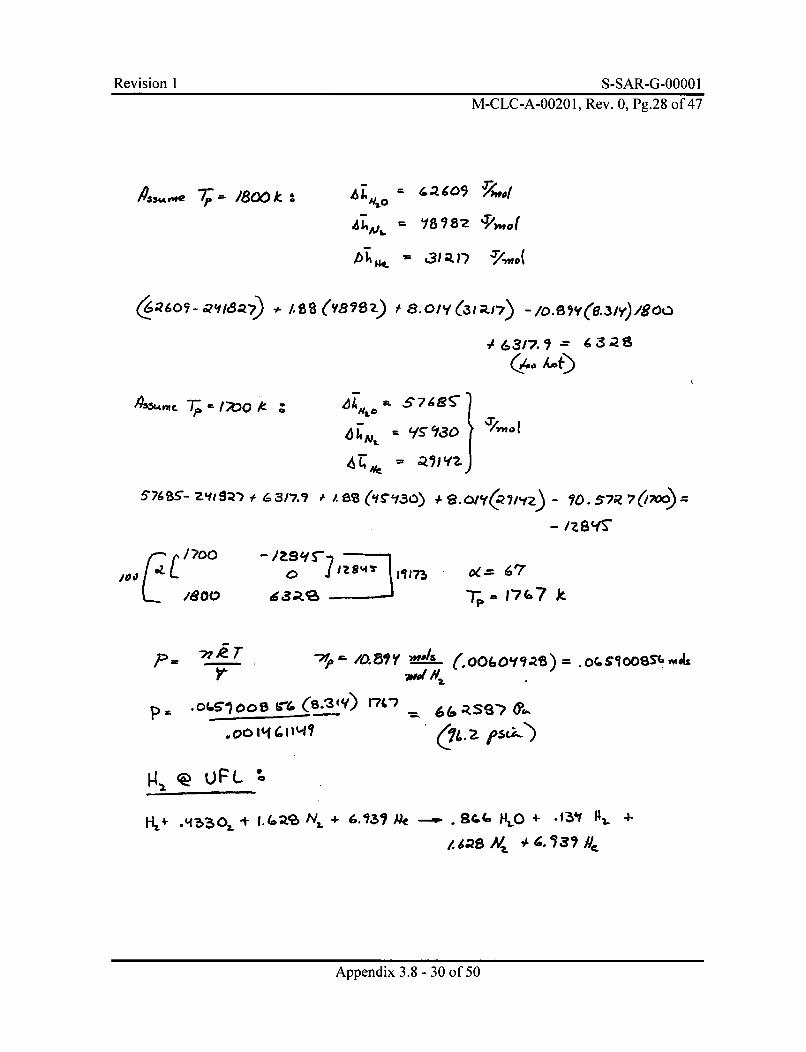
Revision 1 S-SAR-G-00001M-CLC-A-00201, Rev. 0, Pg.28 of 47
,#3re7p- J80 k .16 cPmos
-0 63/7.7 1 3Q(, ft
461mc Te X
Z47J'f2
/700o - /as if s
a.= 6-77k
'p.T10.51f 2l/S (06, .6 CSO 6s
Pa ~1-7f.
00 l'i 1114-966;ss? 16
H,4-~ + 6.1~3 7 i Ale -. B H4 O4 + 1' -
N? s4~ #6.737 N
Appendix 3.8 - 30 of 50
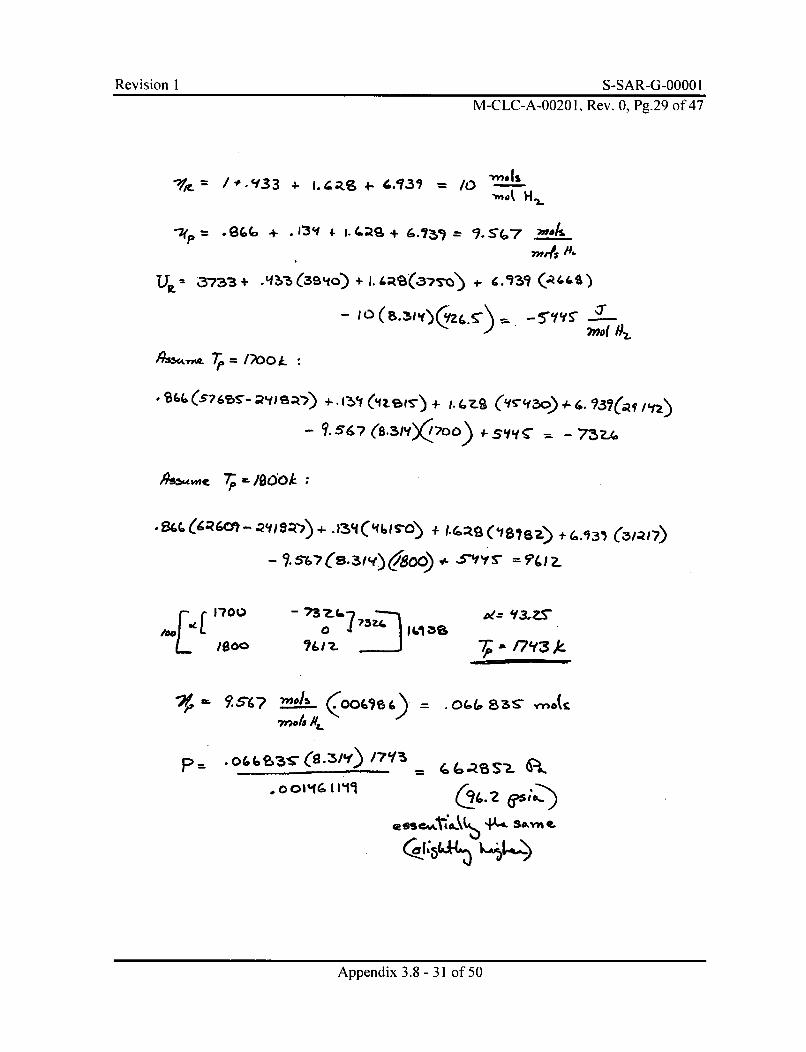
Revision I S-SAR-G-0000 IM-CLC-A-00201, Rev. 0, Pg.29 of 47
"fg /I .If3 3 /0 i"#-l. .•s'mat H -A-
.Q( G(o + +J3' I- (i.4'+ 6-7W) 9 SG 'wes
Up u3-733 +-4 !-6 3S40 + t'u j4.
- 10 (B.3I~)(~~•)mo( hl2~
Amukyr&.,i T, / 'L -
.9'~57~Lfi~) +1t'~eIS-') + 1. 4ZOO (Ijsq 3) L 6, .3(
9 .56 7 (S-.3N)Q70) +-$&f 73-
A9 Su'me 7- - 106k;
~ .3'( SO~+ .4(9QB~~)+4.1.3ý aQI
5-67( 1sv Y) C800) 1 5v,' J2..
L1700 -m 7 404 13ZS
4 1fUL 9.5-a )flDI =p 7 /~
P= .o~~e)3~C2.3"f) /7If~
.oo'1~ 1119c~t..2 65~;z)
OS &SL40 Pt- So-yn c
Appendix 3.8 - 31 of 50
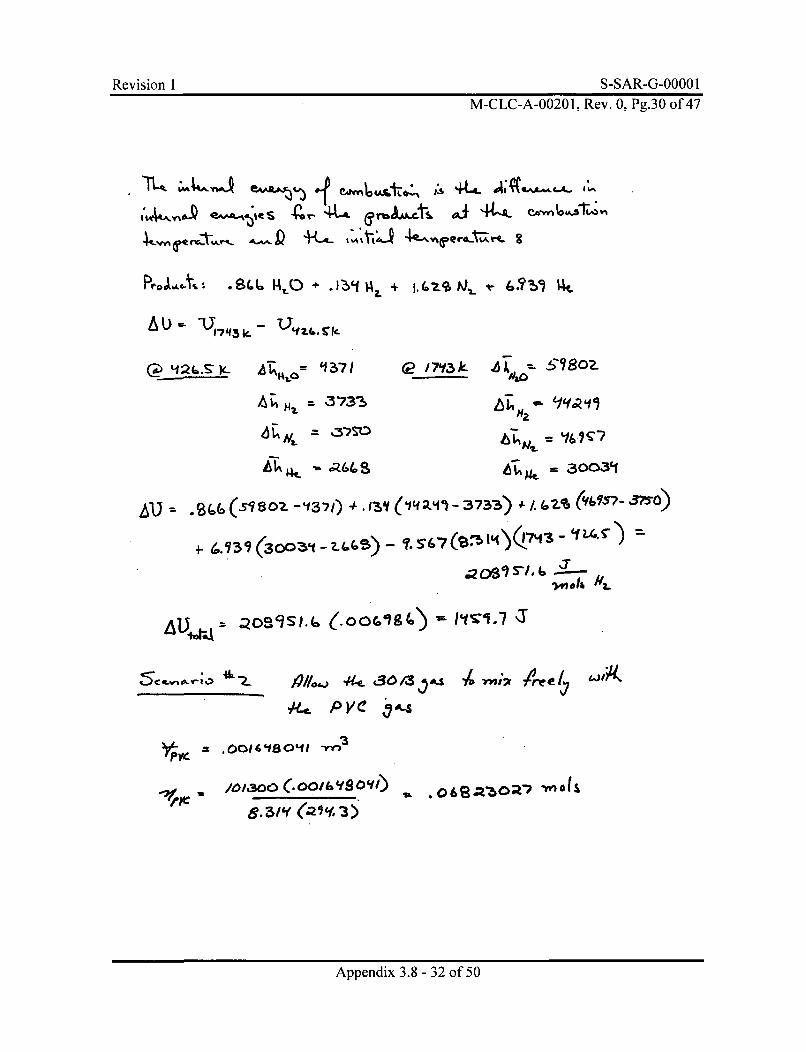
Revision I S-SAR-G-00001M-CLC-A-00201, Rev. 0, Pg.30 of 47
+g(A IS( H 6LO + 4 + I'.' laZ
A u -17q 3 "eT-L'V Z. TIC
ZTMO=1371
:3~73-6
LP/7,3kS?80264f .Q l
=3003cf
+-~3 (3coo~f -i(5 - l?. 56-S- I)1
~I
,41,& -l
L) C ~ V1. JAL gI,04~ 44.~LLL PVC! ~A4
V, -4;2r 4reet.ý7
6 OI'18O041. '
--. 069aO27 W"Ots
Appendix 3.8 - 32 of 50
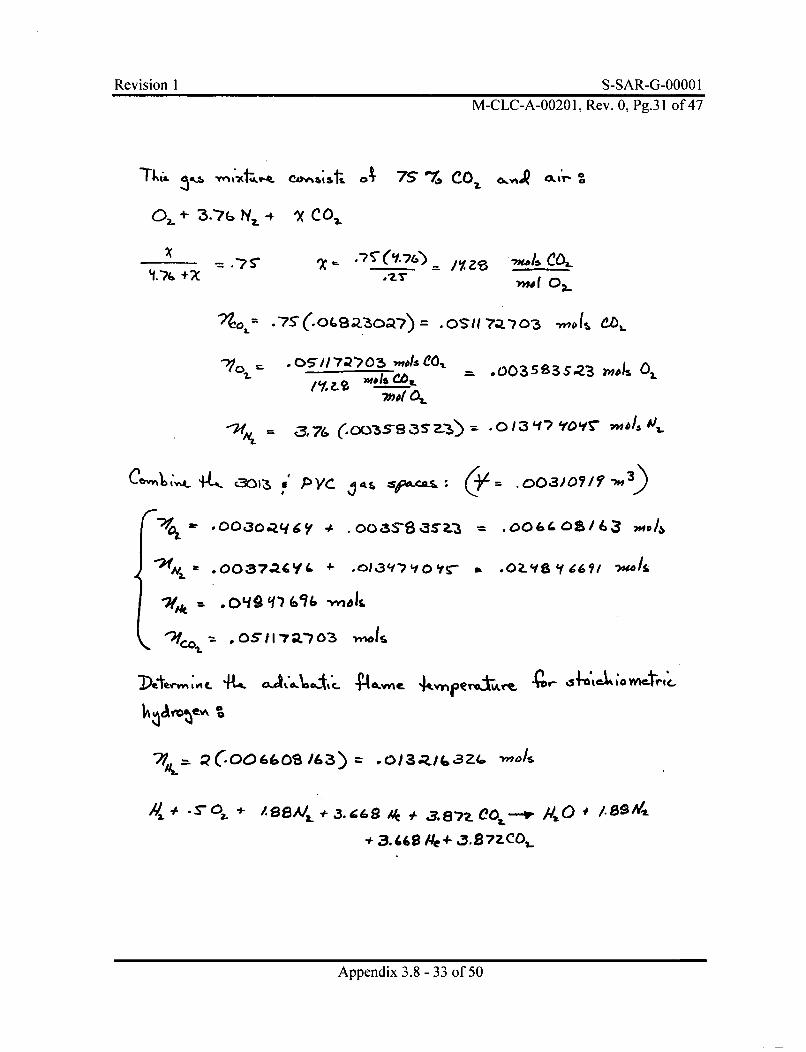
Revision I S-SAR-G-0000 1M-CLC-A-00201, Rev. 0, Pg.31 of 47
Tht.- IlkA .A 7 % COX O Ok~ ly %
0-+ 3-16N
,X CO0.
/Y CI~n4 O~
, a76 (.00- 9-83 S-3>S o3 'f Y1S T- 'j
C6tqV4 +4ýC301 5 Ps r At SPA~ 6-ns: ( .003)0719, -bl3)
-ýL .0037aCY&~ 4-.o3~~=.o6c/3,.
ML *L~)~¶ n2~
~fO17 q0s17a703 -malI.
??,c:L ~OS'tl'P'703) O3j3(
Na. *.S-0 2 - + /.eeA/LCO 89 3.A/t#382.~ ,
+ 3.6 //e+ 3.87Z(!02_
Appendix 3.8 - 33 of 50
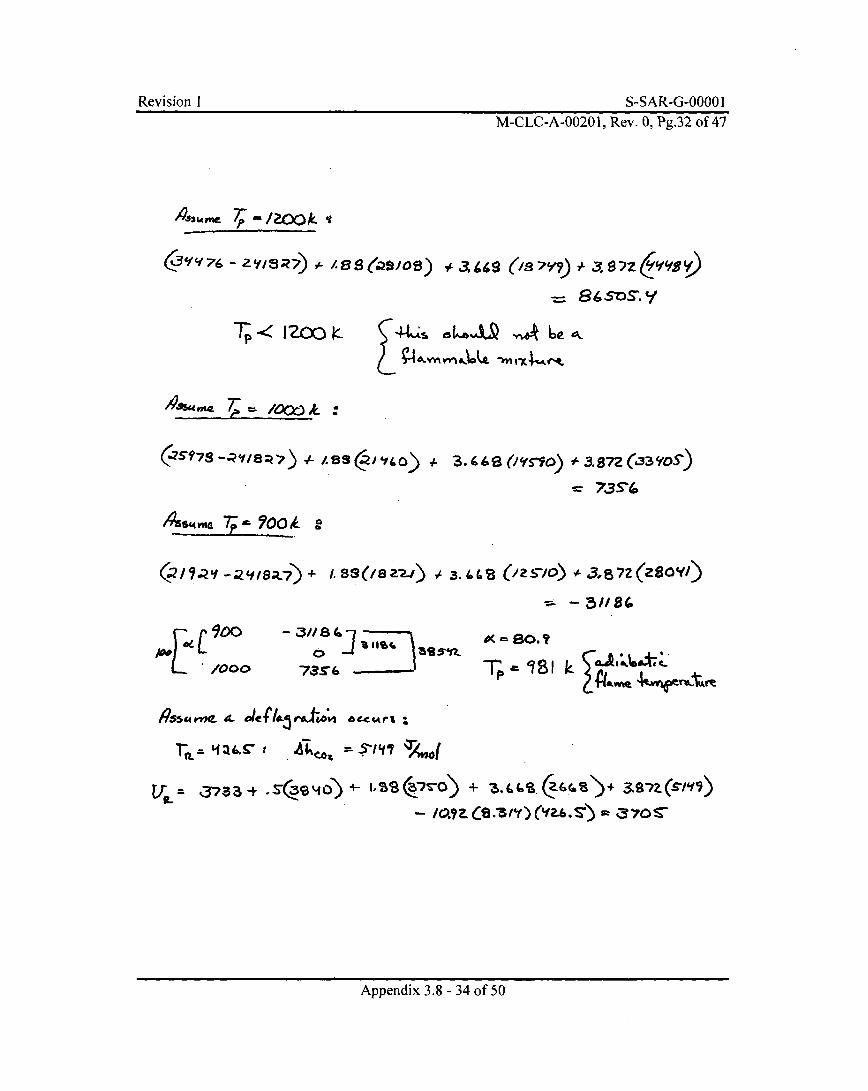
Revision I S-SAR-G-O0001
M-CLC-A-00201, Rev. 0, Pg.32 of 47
- 86-•'S.
Tv. -.< i zoo K"• 0".,,,,,, u. A e-,,,,•1 ,.',
;61{ 4L2 )64 -Yr4,-/-- o/ 0k. :
(a4? 0) L 3.4-6S (/'VS9) O.3. 872 (3 3
-= 73 S'(
700 k
+
[ 90 0
-/000
- ail a -
73&-
80 =B.?A~~S k
R$5.4"W- 0- &cc#Ar% -,
r1. '~-- 11 ,. I&C.07, = -ý-Iwr 7/,.[
/0? (- /o1e3 1Y) (VU a 70
Appendix 3.8 - 34 of 50
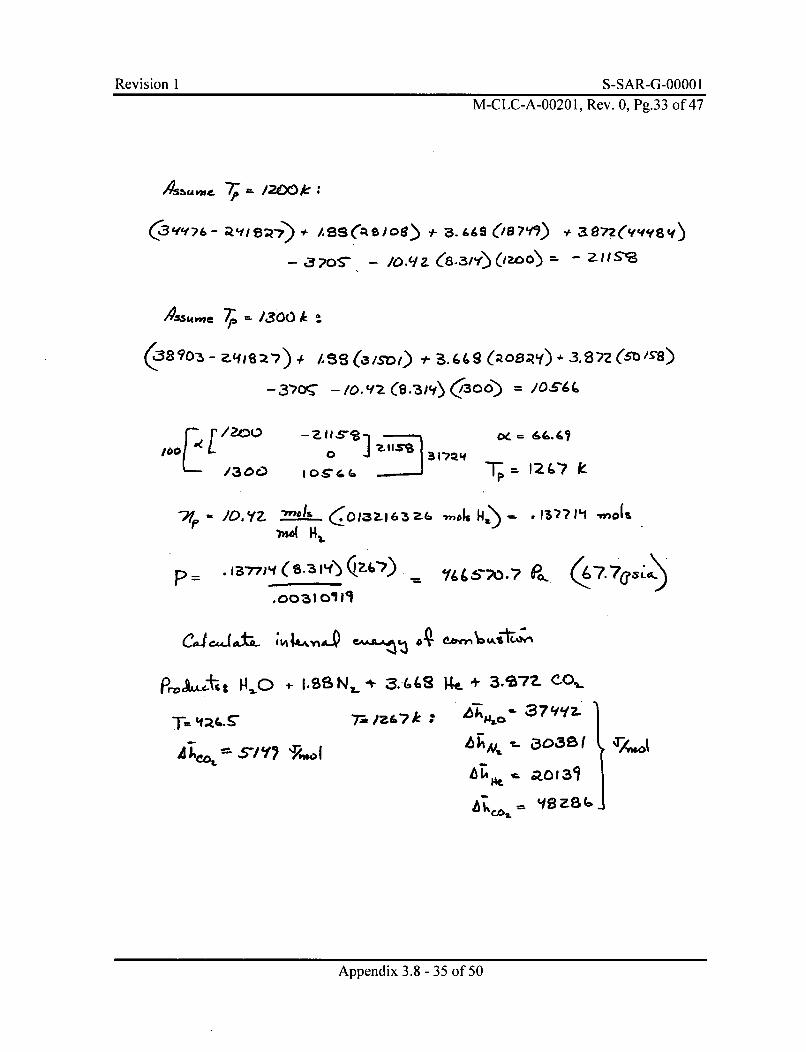
Revision I S-SAR-G-0000 I
M-CLC-A-00201, Rev. 0, Pg.33 of 47
C,(3,,,,6- aviB-, ) A. ,Ss(A eo .8 * ,/9 7 Y9) .. (y
- os- - Zo. (8.3/) (Izoo) 2 - Z IIS"
A.,,,e 7-- = 1/300 k :
-3? -701;(83/-(Od
E L /300) IOIV4(
o - 6t..&7
WF MOtls (ý.l32I63ZG~7)W 141.
IM015 W -) - - 1-57714 -mols
p- 13-77) 'f (98-Z sf (12-6-7
.OO031 01l M
1= /I t 670.7 P, (6 7. -7030)-
C-C4GuJatL 144A'nJ C-QbAtAý 04
Prv~jLct ,iC +O 4-S IeNL * 3.64 k4 + 3-S72. COi,
T= 'ial6.s. -r. /7e7k :
A~ qYI3'
Appendix 3.8 - 35 of 50
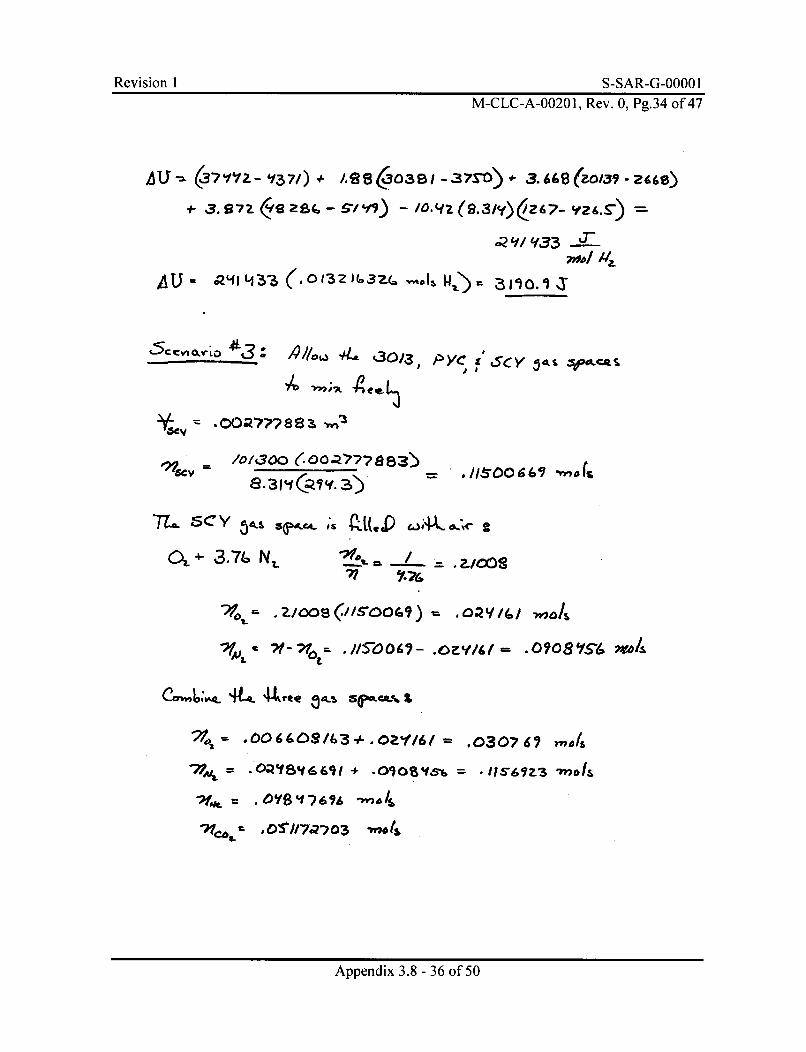
Revi sion 1 S-SAR-G-OOOO 1M-CLC-A-00201, Rev. 0, Pg.34 of 47
*-3.97Z2Y 24 - Sly)- /0-q7(9.3/y)(IZ,7- Sf26.S-)
'Au ~ ~ ~ ~ ~ 2~/3 ZZ1433W,- '0Jý
At-l4 ,L 3(O3U30/3 .IYC') L51Y 9o.¶Z C
zdv
7L. 3.L N L..aYoO t 4- ,7&'7
.0O~S/#.~tf/j¼~.0307 67 MA
Wok OYS069s *,a
Appendix 3.8 - 36 of 50
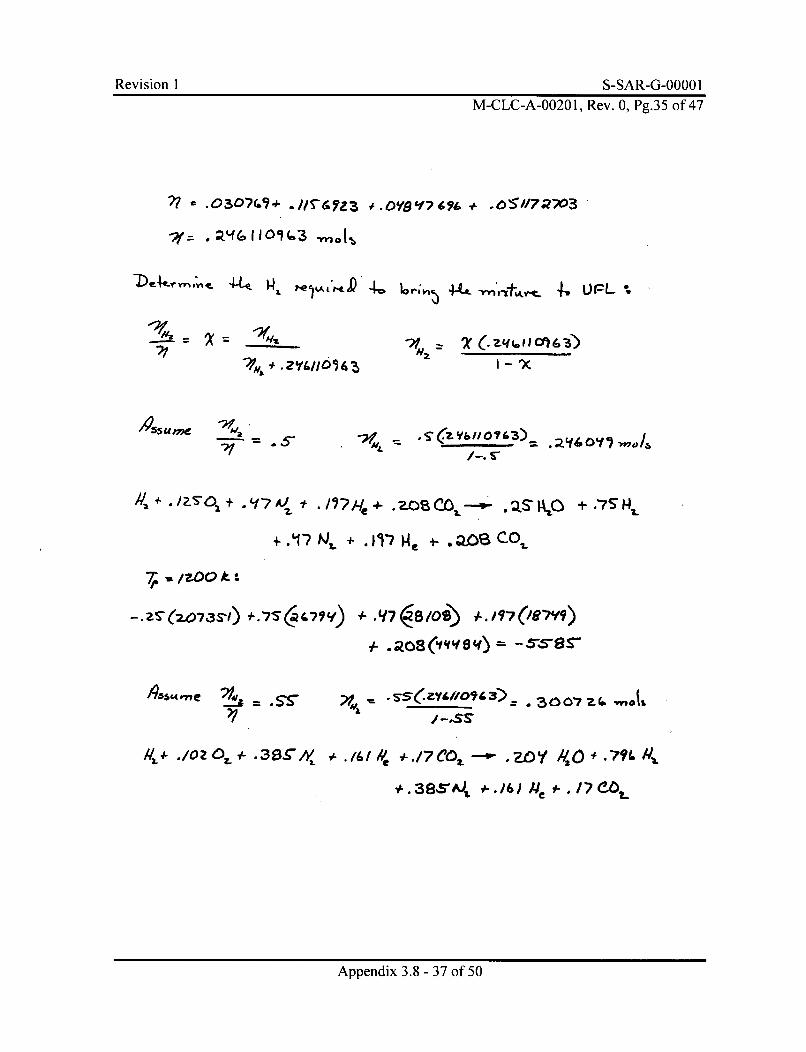
Revision I S-SAR-G-00001M-CLC-A-00201, Rev. 0, Pg.35 of 47
.3O7(1+ . ?Z:3 ,, .O' 7t+ .05#72W3
-Dr-4*-,rm,-v%4L 4-t-e- wX 4c, 6--;"ý 4-t& -m*,-tt,&Y-e- 4, U r-LI.
A'2 - ='7 zq1.1 C)6x ý
+ .2 yl.//563
A5.5-.
-71 S .2-460,fl,"0/6
All + t fA) MAI .,-, , oe+ . :OLS--~ k~1O+ .71-54L
+ .T7N,+ . 1 7N A i-o
7j. /ZOOk.
4-~ .;z8(-f4y~f6f = -558ses
'~55"me ?4~'2 ,-Iss.
.38S7AJ ~-.&.6114C 0-.7cl
Appendix 3.8 - 37 of 50
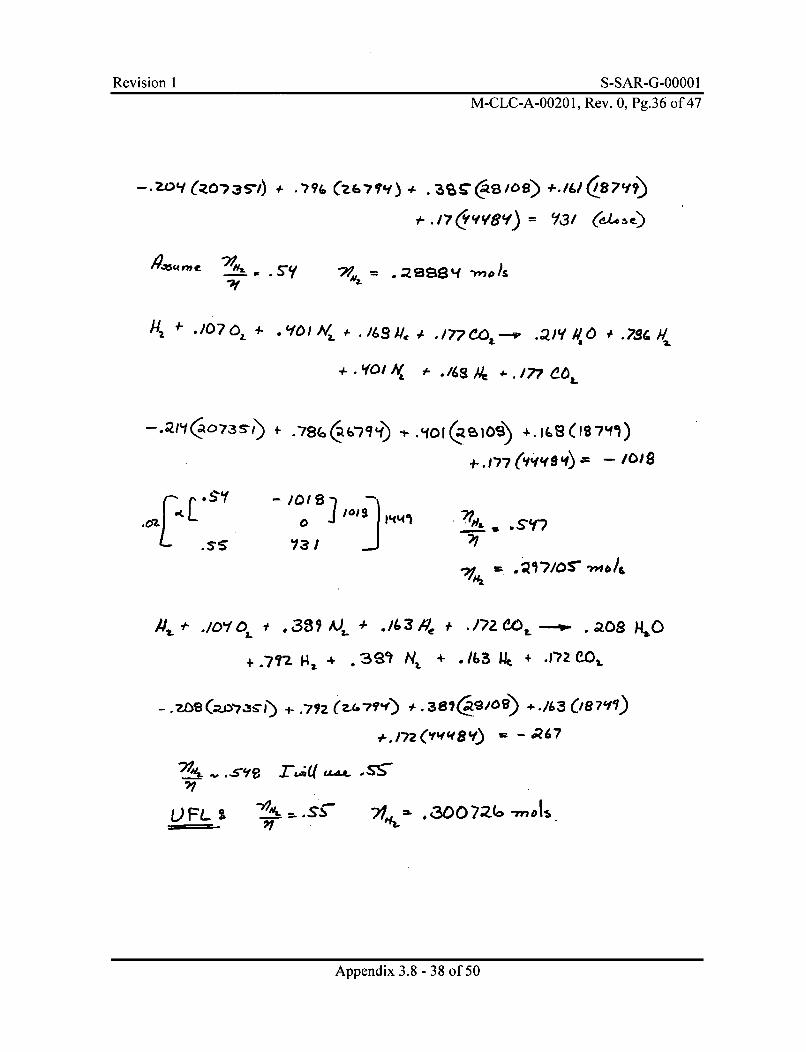
Revision I S-SAR-G-00001M-CLC-A-00201, Rev. 0, Pg.36 of 47
it-.1, 6 V8Y)= Y,3 / (el---se)
4"MeY 27& - 2 9913 " -Ma S
/07~~~~ -/7' CO Y176i
*.r,77(ytfyfeq> -/Oig
.SS2
-/01 8-~ ~~ .1
731 '7
At -1, /OYOL 89 A,_ ./ 3 , aS )4,C
+.'7' . 3911 N'4* + .163 j4k + 17Co
- .O9~zJ~aI) f-.79Z(L7w 379O).M(17)
,,, -7 (~f cf Q6
'7r &d(IUA. S!-
L)FL 2- '7omr A d 3-. .30072-6 -ml
Appendix 3.8 - 38 of 50
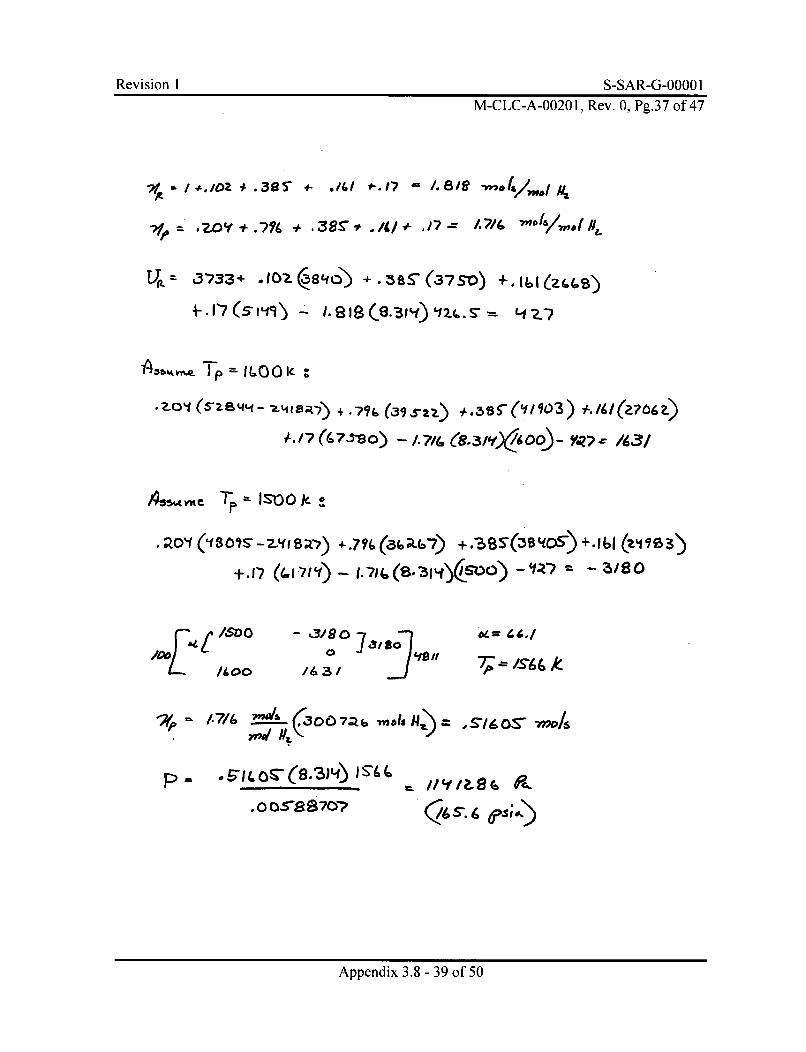
Revision I S-SAR-G-00001M-CLC-A-00201, Rev. 0, Pg.37 of 47
t7 3-73:3+ .IOZ2aSLfO' -Z.3BS'(37SV) +.I61ý1,4,6s)
4-.76I'7(s 9) -1 ~ e3')L2 L "Z.7
(SOf Z 6 44 - 7-41 St-) + ~& (J3S2l _ . s~I) ý., 5 (1/ -/(g e66Z~)
7Scv~ 7TTS0 - e, 1)(6 0 -Y? k/A3
IS 00
- .3/2a ]a80 731 Ife/I
/6 3/ S
*4= ~/4
7--/~&
,, -7L&
Poo/~ V?!~( o 7~ieiH)
571 = ! sý
.00152870?7
Appendix 3.8 - 39 of 50
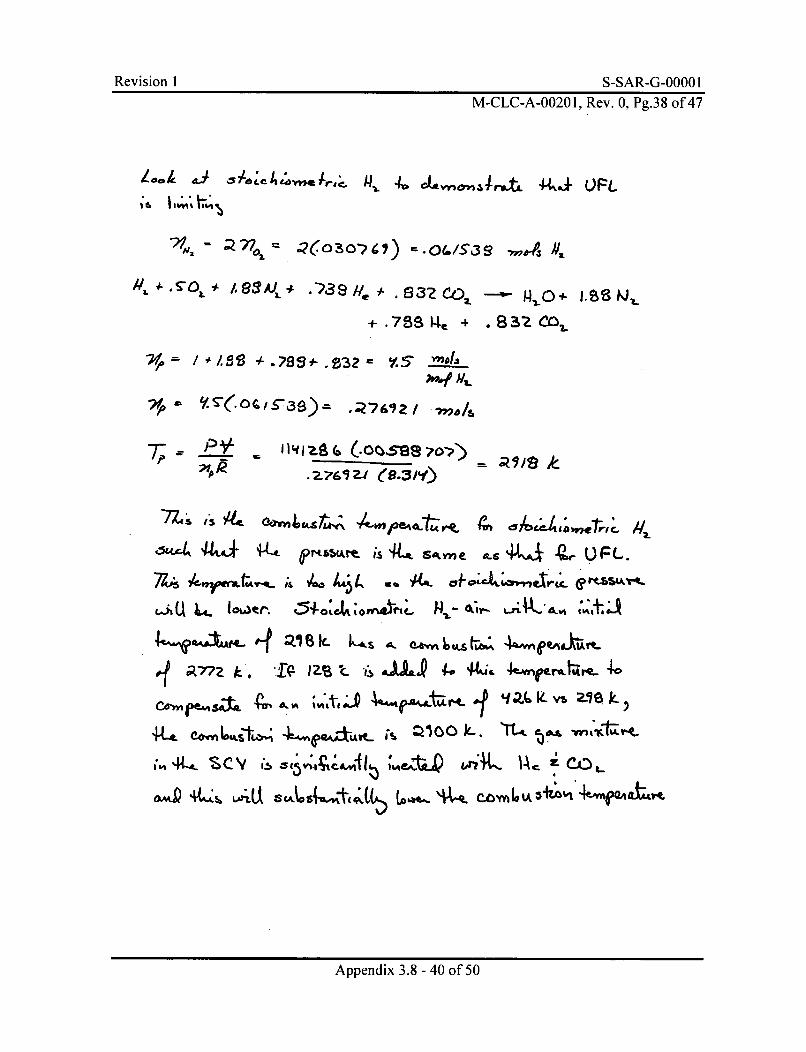
Revision 1 S-SAR-G-00001
M-CLC-A-00201, Rev. 0, Pg.38 of 47
h aJ e,,,, i. 4~ ,,, ... 4J- UF.
7/p/
"S 4" etLt,ý ktAtV
#, .s"•.÷/.9SAJ .)391,,+ .8,32¢_O1 -I-1•O*+ I.•,6tId
+.T 9 i4e 82--a
.2?63Z- -16 kY
a~ i-. ._r k Lzs •., &.0 •,, 4,hta ..
44-a N9Q,1,._ IL '-. •_
1-,44, SCV . a ,q.IAi. A i A, Icý-CX.OL
OAkP {L;u L&"*LU cstt- L0.4, CoLutA*4ml "QA&VtIL
Appendix 3.8 - 40 of 50
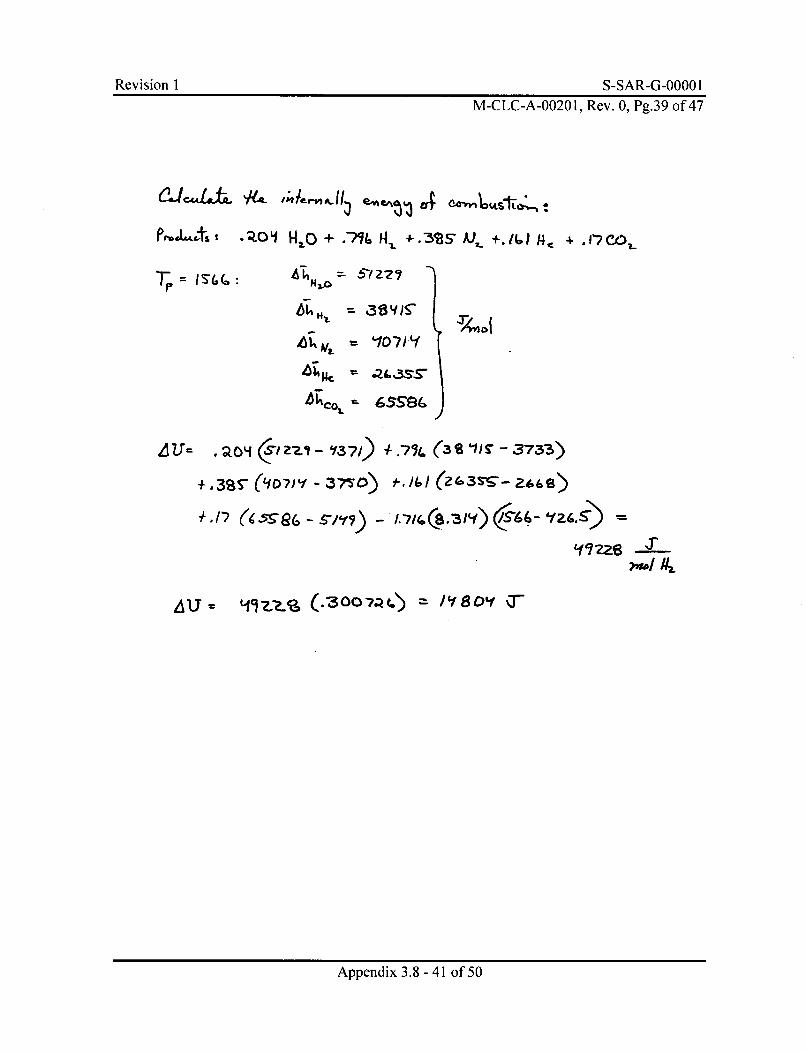
Revision I S-SAR-G-OOO0 1M-CLC-A-00201, Rev. 0, Pg.39 of 47
P~..L~~t o .4O' HIC + --M1 IiL +-3~ A), -. 161 14,c 1'7 .O
11071
~'6WIL
OL= m(1- 2I 3 04 -7JT 7.-
LfC -2z
+.3BST100nm =Loi -f 1wi ~3s Olt s
Appendix 3.8 - 41 of 50
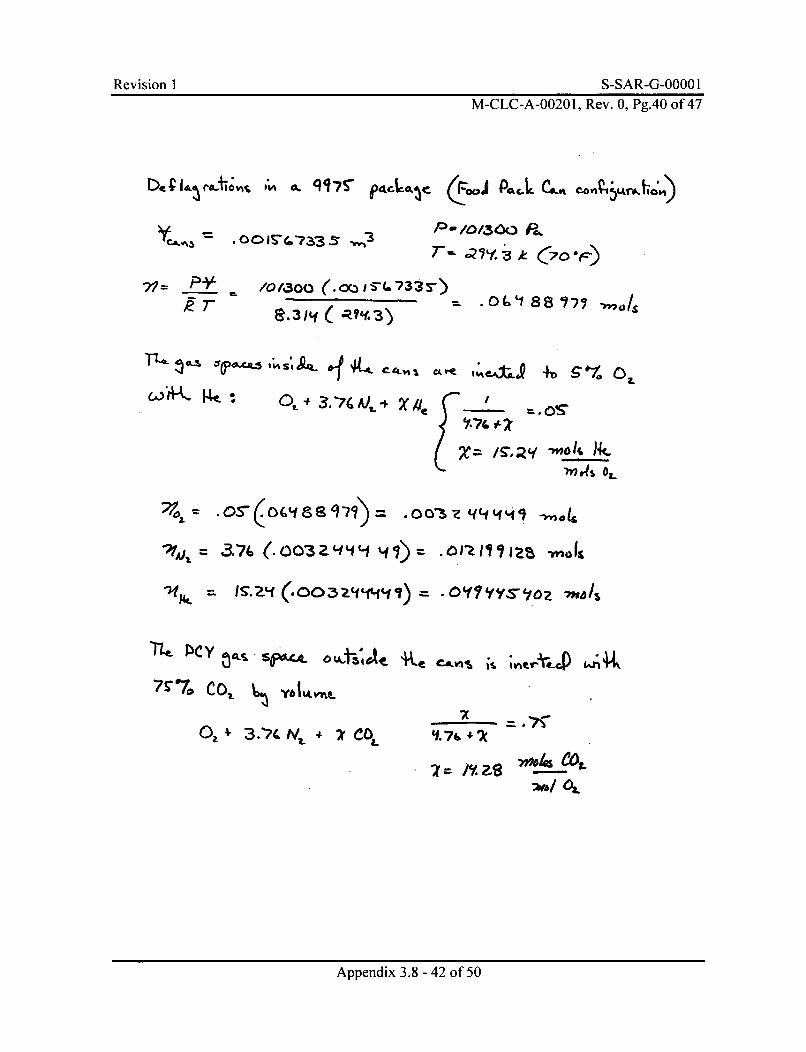
Revision I S-SAR-G-0000 I
M-CLC-A-00201, Rev. 0, Pg.40 of 47
Yca.,V%3 = QQIS(.73-3-5 ,'
(*c~ P.Mc c., "A d~tkm
P-/0/300 R,
T Y. 3?~
PY-R T-
/0(30a (.ocx.-'SG.7333.)= O' 887 " 17/S
itt4L C-- &O.G*. I~s;A 9Art I
wP k P~t -
7-0,4 0 2L
Wk~i VIS72 (- 003 vi -'*i¶) Ys ?ItYS'fa z m
TL..Dcy ~CY - - Se &. ACA- vcta~
7S'7o Co..I., YblLt1iLL
Oa + 3.'7( NI + COL >WA WI.
Appendix 3.8 - 42 of 50
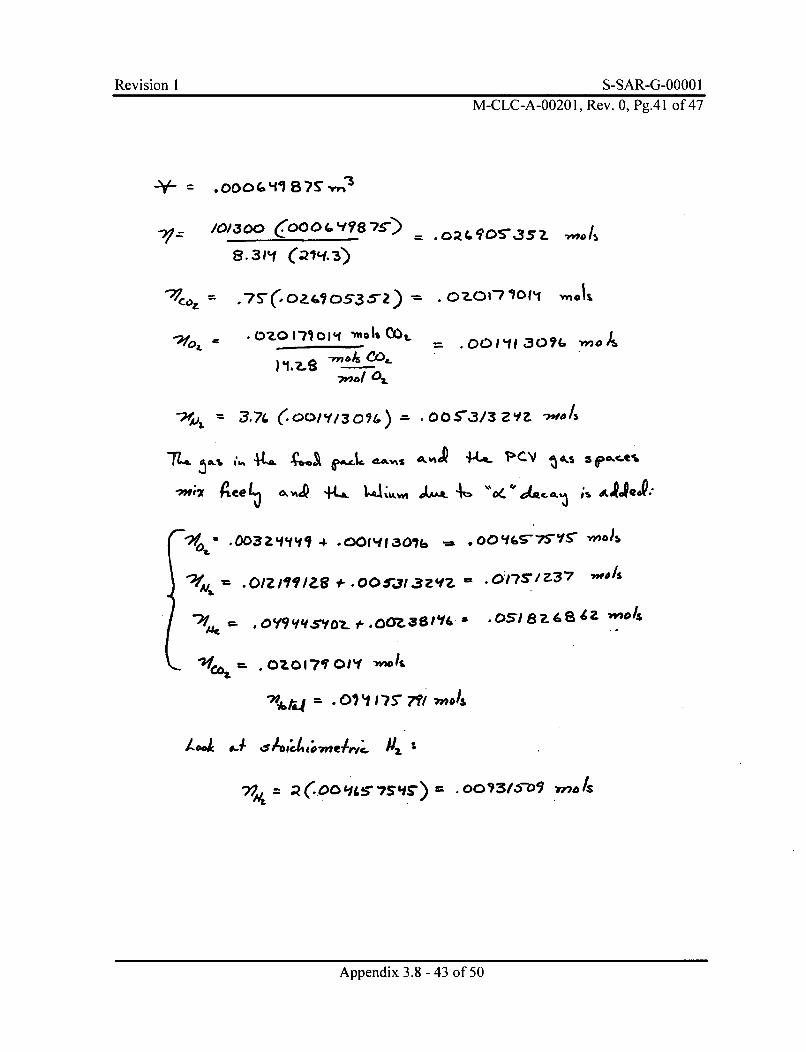
Revision 1 S-SAR-G-0000 1M-CLC-A-00201, Rev. 0, Pg.41 of 47
.O0004IIB7SVw?
10/301aw ~ fss = . 9OS J52,
S. 311 .2I~O 1,fc- ~ , -3
WoL .C)I'130
w70 /
Wb 0s
?4. mois~
-N
(.Onr V/ze* 0?&J)z'2 = OOS-,33Z'/a3 "'
1fcov - - *O2O7VI' 11 v6*.05163'
71 ' I7? 7ffwls
1- 3 -FJ ~ ,e,,c /
Appendix 3.8 - 43 of 50
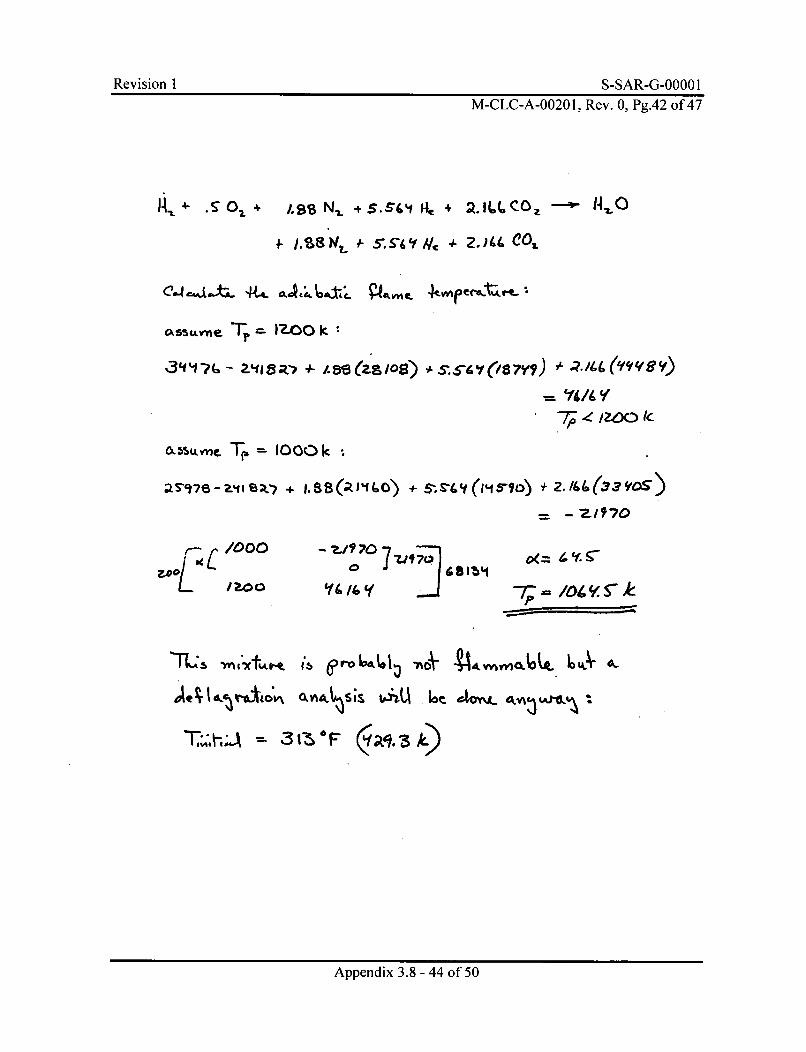
Revision 1 S-SAR-G-0000 1M-CLC-A-00201, Rev. 0, Pg.42 of 47
4- S"O4 .L9s N.L +$. st4e 1, + •2.1LL-Oz I- 7LO
I. t_/z 5- .S'' 4- 2.)tt 44 t
assume Tr IZOO k
O~y-7; Z~ /Z000
;L'16 741S;'?+ 1. 8B(;L)41-O) + *S14 1 -0 + 2. X16(33 VOS~)
/007 - Z/9 70
/ O 0\ c 7 Ol e.a3IVF Th~k
Appendix 3.8 - 44 of 50
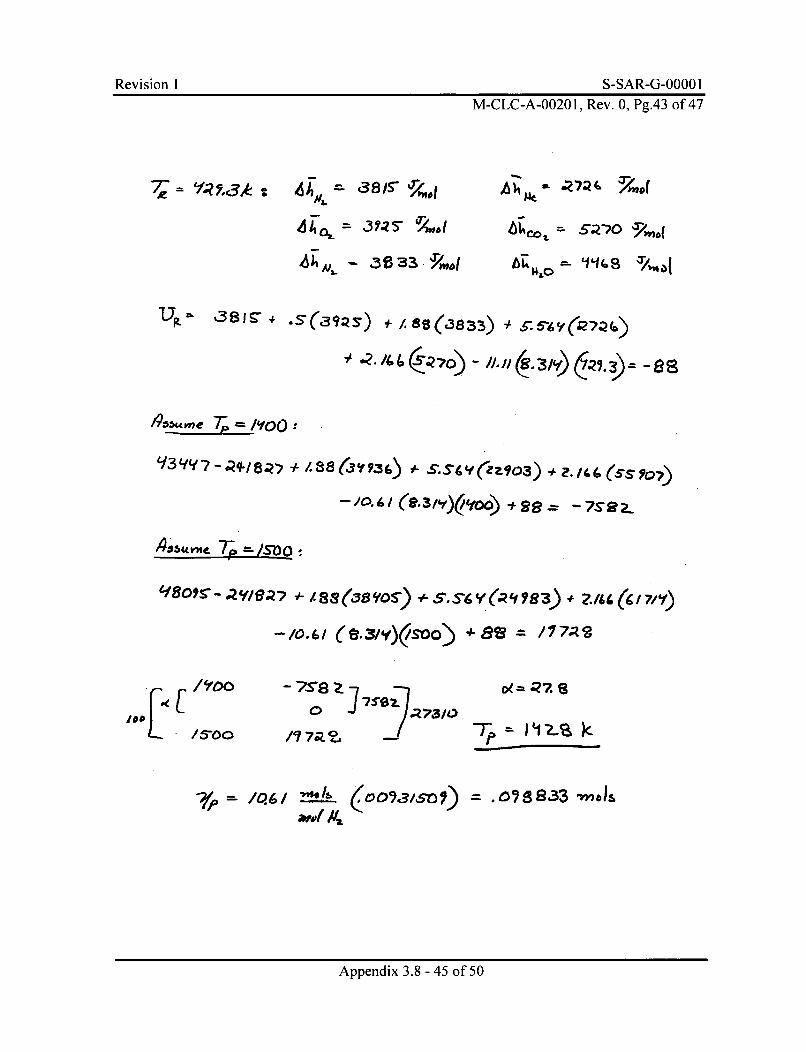
Revision 1 S-SAR-G-O000 1
M-CLC-A-00201, Rev. 0, Pg.43 of 47
&3 %
Ma.-ale 3-a a 14.
Up, ~38i 1 .S' 39-ZS ) ,+./8ais(.38 33) 4 _ ny6 GQ4)
74 Cs2o - 11n(,83y8(,93
4/ Y 7 Q9-/ I-7 /s s(3y 93 () ,, S. S/S& ( 903))
(9..6 3 9 g
/C:::1 /"O0
7
=.09 8 33 ,yr,.s/0,.6/ -"/ (POOISISOI)awlfdD &4
Appendix 3.8 - 45 of 50
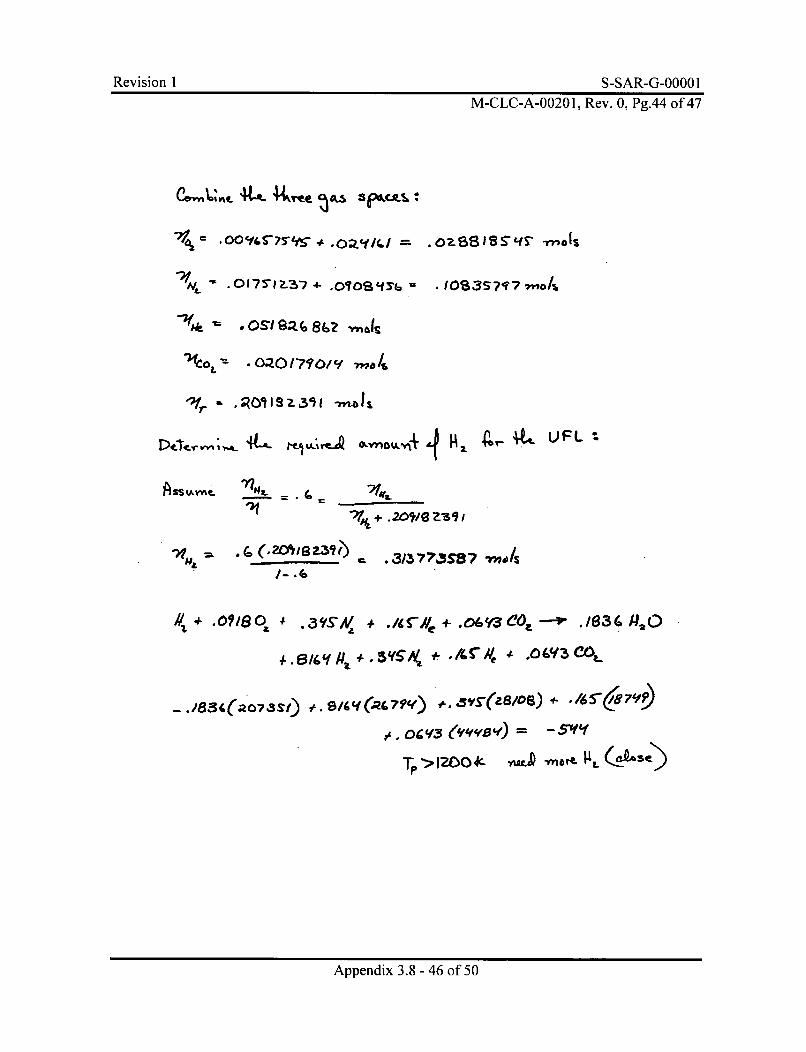
Revision 1 S-SAR-G-OOOO 1M-CLC-A-00201, Rev. 0, Pg.44 of 47
AL .01,75,1237 OJO cfT . OS3S7'I7vvo
R01I9za')l -rnid1
As;AI ')?1L ~ 0 4~ 1 4.t.U
S+5. WING 7-31
______ .3/3 77aS8? -mots
+ Of, IS 0 *S f11+.6Y --9V ./S 3 14.2
-~ ~ ~ ,( ./8?(o7si +t 4.3V(8O)~
or.-V &V- =
Appendix 3.8 - 46 of 50
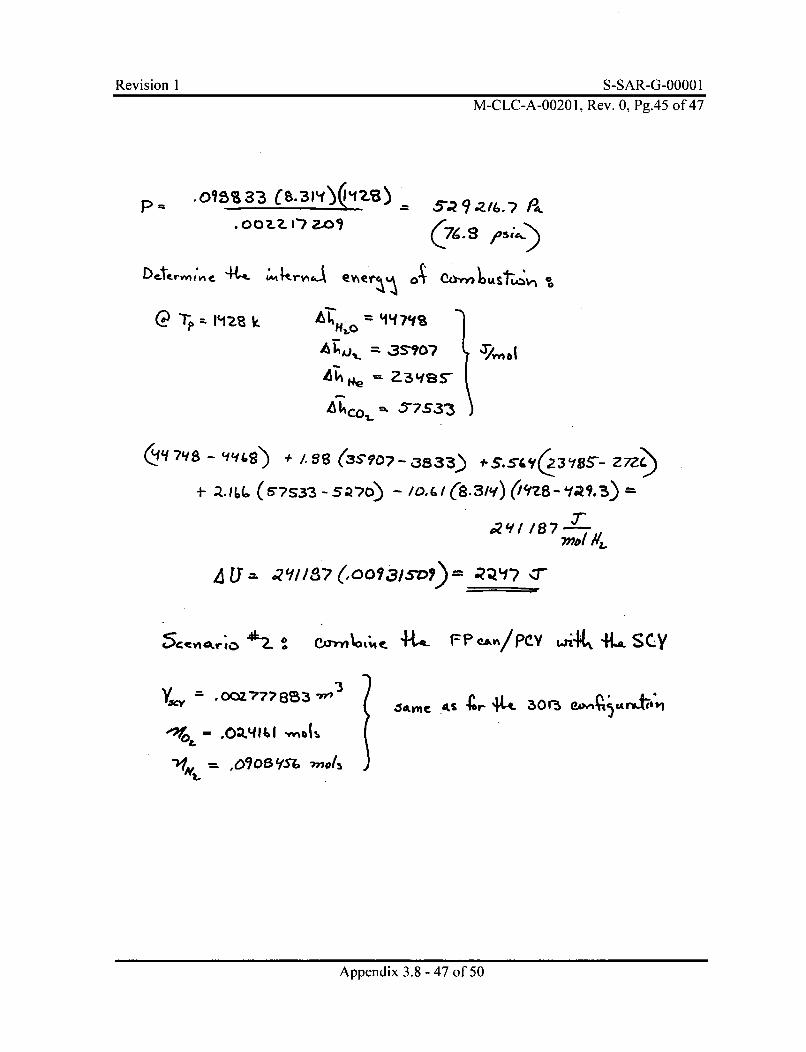
Revision I S-SAR-G-O000 1M-CLC-A-00201, Rev. 0, Pg.45 of 47
p~~~~ L¶~3(.1 ~~~ ,5'.7 9 /4 -9 .A
DJ-,VIle t ;Ir"Aey~t'rý A 00~
e T.~ = NZZ k
35?O
A 3ýCS5
- 9'f) + (3S.907- 3 3 ss(31s Z'zZ)
t- a- Q.I( (5-7s3-3 - Q-,O ,ou S.3/') ,1's-'aý
~ Clo~ 4-t, - F &n/Pcy wA 41.,*SCY
0908ý,Sr -Motsor
Appendix 3.8 - 47 of 50
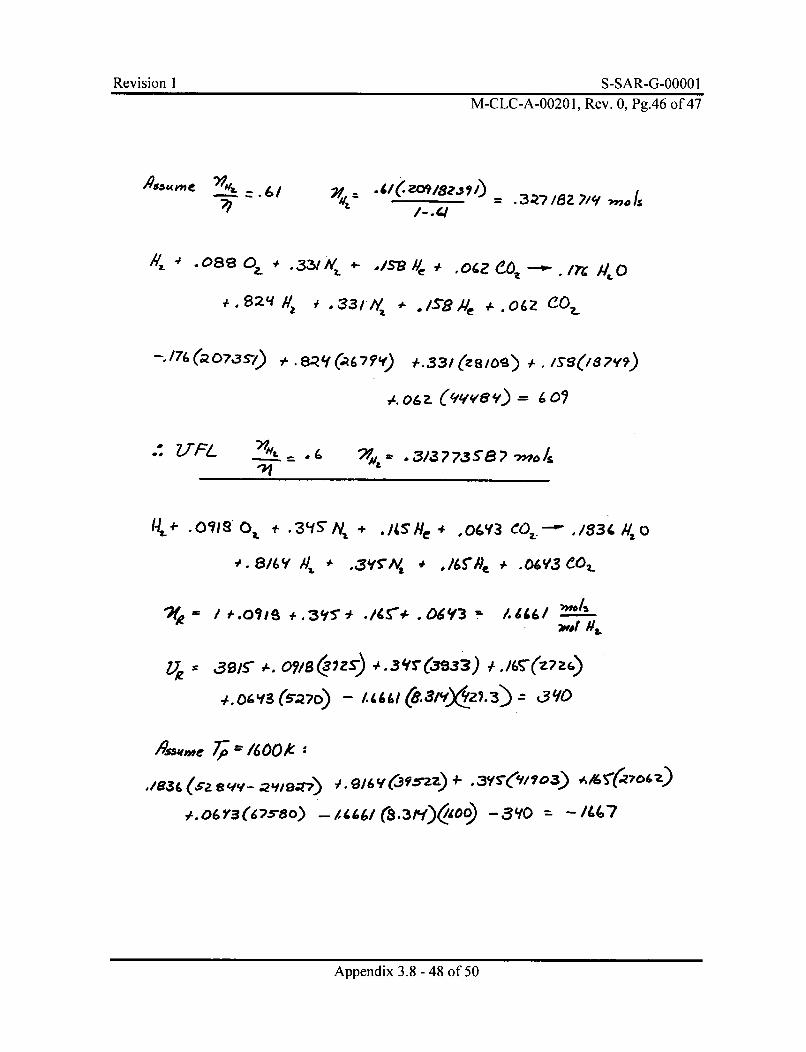
Revision I S-SAR-G-OOOO IM-CLC-A-00201, Rev. 0, Pg.46 of 47
/4 . 0 8 0 .331A' OZ ,
A 06 (Wy~e Y)= L 09
. ~ ~ ~ ~ ~ / i/F __.6 2 .3?7358 Aso/
-011 Oxi f 3fN + .1Se+ (,OGy3 eoz .8 N
g 0-.09ot 6 + . 3t5-* ./4S-# 06 c/3 414
06 Y '3 (975-8) -3Y
Appendix 3.8 - 48 of 50
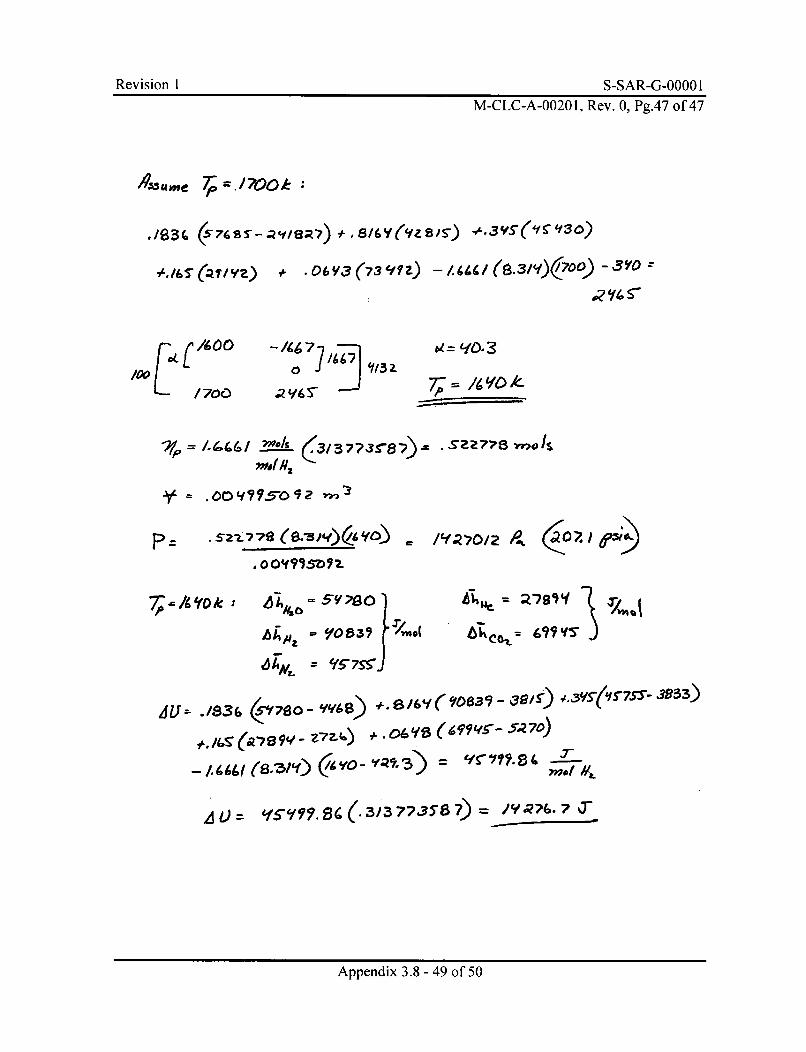
Revi'ision 1 S-SAR-G-OOOO 1
M-CLC-A-00201,. Rev. 0, Pg.47 of 47
Amsumee Z =.1700k:
./83(6 (5 76SS--Qv/SR7) * .S/6Y('tisis) S-(')3
4.165-* (a,/y) 0Y3 (-73 eff ) 644 / (8.31Y/)(1{700) -139'0
,00 - ]: /1 132.
.2 Y6 Y
d= £fO,3
=wo /.4/77I 7)?fL
*oc'flsoq m
. 00,?e4eIDIZ~~o(ý2 0?./ nv)#
0 hV /59-7Sj-
4dU= ./8336 (SY 78 0- V'9MS) a8/ 6 VXT(.R'7 f 9 9qo- Z-72-- 06Y =
Z14-= W79 1tl 9 W/~
( f9 kea' - -5-2/S) ~ ~ss-~s
L40= fs"fy'?. 86(-3/3 72-35'8) = /Y 74 -
Appendix 3.8 - 49 of 50

Revision I S-SAR-G-00001Revision I S-SAR-G-O000 1
This Page is Intentionally Blank
Appendix 3.8 - 50 of 50
Revision I S-SAR-G-0000 IRevision 1 S-SAR-G-OOOO 1
APPENDIX 3.9
DETONATION CELL WIDTHS IN THE 9975 PACKAGEWITH CO2 DILUTING OF THE PCV GAS SPACE
Appendix 3.9 - 1 of 16

Revision I S-SAR-G-00001Revision I S-SAR-G-OOOO I
This Page Intentionally Left Blank
Appendix 3.9 - 2 of 16
Revision I S-SAR-G-00001
ftF445 iZa thtI.IO.2U3
Calculation Cover SheetProject Calculation Number Project Number9975 Package Certification M-CLC-A-00175 WN/ATitle Functional ClassificationDetonation Cell Widths In the 9975 Package with CO. DUuting of t1he PCV SC Sheet I of 1UGas space L. Discipline
Mechanical
E0 Preliminary Confirmed
Computer Program No. Version/Releasm No.detcs.f (a code developed by the author) - WA (Reference: WSRC-TR-2001-00265)
Purpose and ObjecteTo determine the detonation cell widths In the 9975 package containment vessels with CO, diluting of the PCV. The Impact of a 75%diluting of the 3013 container with either helium, argon, or additional nitrogen on the cell width Is also assessed.
Summary of Conrukdo
Detonation cell widths in the 3013 container, the PCV, and the SCV of the 9975 package have been determined lor four dilutingscenarlos of the 3013 container and the PCV. Scenarios in which the PCV is diluted with 50% and 75% COC by volume areconsldered. with and without a 75% dIlk"Ung of the 3013 container. Both the 3013 container and the PCV are assumed to leak, so thegas mixtures within all three containment vessels mix freely. Sufficent hydrogen Is assumed to be generated after the 9975 packageIs sealed to form a stocitlometric hydrogen-alr-dluent mixture. With 50% CO, Initially In the PCV, the cell width are approximately 18mm and 26 mm respectively without and with helium diluting of the 3013 container. With 75% CO, Initially In the PCV, the cell widthsare approximately 61 mm and 98 mm respectively without and with helium dilkung of the 3013 container. Since the bounding radialgap Is 20.3 mm, 75% C0, diluting of the PCV effectively precludes a detonation in the 9975 package. Cell width considerations alsopreclude a detonation In the head spaces.
-f KsvEsImIsRIVUIIIN18
No leviAslon Description
0 Origlnal Issue
I The lower threshold percent CO. dlutinA of the PCV Is calculated for a bounding gap of 20.3 mm Instead of 18.6 mm.
Slta OffPAWrNo. Orlinator (Prnt SlgnoIDate sertlcaton/Cherdng Metod Ved.1Cuheckr (PMint) SlGOhlae Manager (Prkt) Signr/Dats
0 __________________________ _ I_,
.I / 6f Document Review X14- &a::. 6/ al
Relase io Outside Agency - Design Authotty (Print) Wisht
S•ea•ty Classification of the Calculation
Unclasslied
Appendix 3.9 - 3 of 16
Revision 1 S-SAR-G-00001M-CLC-A-000175, Rev. 1, Pg.2 of 13
DETONATION CELL WIDTHS IN THE 9975 PACKAGEWITH CO 2 DILUTING OF THE PCV GAS SPACE
Introduction and Summary
Plutonium oxide in a 9975 shipping package can generate hydrogen by radiolysis ofabsorbed water vapor. If the hydrogen is released into the gas space it can form acombustible and potentially detonable mixture with the oxygen in the air. The detonationcell width is a measure of the sensitivity of a particular flammable mixture to the onsetand propagation of a detonation wave. A large cell width, depending on the characteristicchannel dimension, can preclude the propagation of a detonation down a channel. Aslong as the detonation cell width is greater than the gap width, a detonation cannotpropagate down a channel. Detonation cell widths have been determined for the nestedcontainers in the 9975 package under several scenarios in which the air is diluted with theinert gases helium, or argon, or excess nitrogen, and/or carbon dioxide. Carbon dioxideis an especially effective diluent with respect to increasing the gaseous mixture cellwidth. Filling the PCV gas space with 51.8% CO2 by volume will result in a gaseousmixture with 11.2% CO2 when the gas spaces of the 3013 container, the PCV, and theSCV are connected by leaks and sufficient hydrogen is generated to render the hydrogenand oxygen stoichiometric. The cell width for this mixture is approximately 20.3 mmand the worst case radial gap, following a deforming impact, has a width of 20.3 mm. Aslong as the PCV is diluted with more than 51.8% CO2, a detonation is precluded in theradial gaps. Filling the PCV with 75% CO2 results in a gaseous mixture with 16.6% CO 2,when the contents of the three gas spaces mix, and the resultant cell width isapproximately 61.0 mm. There is sufficient margin between the detonation cell widthand the bounding gap width to conclude that a detonation is not possible in 3013configuration of the 9975 shipping package if the PCV gas space is filled with 75% CO2 .Cell width considerations also preclude a detonation in the axial head spaces between thenested vessels.
Input
The 3013 configuration of the 9975 shipping package contains three nested containers.From the inside going out, the nested containers are: the 3013 container, the primarycontainment vessel (PCV), and the secondary containment vessel (SCV). The volumes ofthe gas spaces in the three containers are [1]:
V 30 13 = 1.1978 x 10⁻³ m 3
Vpcv = 1.6480 x 10⁻³ m 3
Vscv = 2 .7 7 79 x 10-3 m 3
Appendix 3.9 - 4 of 16
Revision 1 S-SAR-G-00001
M-CLC-A-000175, Rev. 1, Pg.3 of 13
The PCV volume is the volume of gas space inside of the PCV and outside of the 3013container. The SCV volume is the volume of gas space inside of the SCV and outside ofthe PCV.
The 9975 shipping package is packed by loading the plutonium oxide in the 3013container and then sequentially loading the nested containers, each in the next largercontainer, until the package is assembled. The gas spaces of the containers are assumedto be filled with air at 70'F and 14.7 psia, unless filled with an inert gas. A proposal tofill the PCV gas space with CO2, to prevent the possibility of a detonation, is underconsideration. Since the fraction of PCV gas space that can be filled with CO2 during the9975 packing phase is unknown, two scenarios are considered, 50% and 75% by volumeof the PCV gas space initially filled with CO2 . The balance of the PCV gas space will befilled with air, and again the initial temperature and pressure are assumed to be 70'F and14.7 psia. There are also plans to fill the 3013 container with an inert gas (most likelyhelium but possibly argon or nitrogen), so the two PCV fill scenarios are considered, eachwith and without a 75% diluent fill of the 3013 container. The plutonium oxide isstored inside of the 3013 container, and all of the hydrogen is generated within thiscontainer. As long as the gas tight integrity of the 3013 container is maintained, only theinside of the 3013 container need be considered for a possible detonation. There will beno fuel in the gas spaces of the outer containers. Since the integrities of the 3013container and the PCV cannot be guaranteed, it is conservatively assumed that they leakand that the contents of the gas spaces of the three nested containers mix. Mixing is notassumed to dilute the hydrogen fuel. There is sufficient absorbed water vapor in theplutonium oxide to generate enough hydrogen to result in stoichiometric hydrogen-oxygen-inert gas mixtures in all three gas spaces. The oxygen generated by dissociationof water is assumed to remain absorbed in the plutonium oxide, and it is therefore notreleased to the gas space. The hydrogen will be generated after the 9975 package issealed, so it will increase the pressure in the gas spaces. Mixing will dilute the 3013container diluent and the PCV CO,.
Once the 9975 package is sealed the contents will he heated by plutonium decay. Thesteady-state temperature distribution in a 9975 package has been calculated numerically[2]. The gas space temperatures are conservatively assumed to be the peak surfacetemperature for each gas space. The assumed gas space temperatures are:
T 30 13 = 324 0F = 435.4 KTpcv = 293°F = 418.2 KTscv = 282°F = 412.0 K
Only stoichiometric hydrogen-oxygen gaseous mixtures are considered. This is abounding approach from the detonation cell width viewpoint. The cell width is verysensitive to the fuel-oxygen ratio, with a sharp minimum for stoichiometric mixtures.The cell width is a much weaker inverse function of pressure. If more hydrogen than thatrequired by a stoichiometric mixture is generated, the pressure will be greater than thatfor a stoichiometric mixture, but the fuel rich mixture will have a larger cell widthbecause of the non-optimum hydrogen-oxygen composition. To get to a fuel rich
Appendix 3.9 - 5 of 16
Revision I S-SAR-G-00001
M-CLC-A-000175, Rev. 1, Pg.4 of 13
composition, the mixture would necessarily pass through the bounding stoichiometriccomposition point. The minimum cell width for a stoichiometric mixture also boundsthose of fuel lean mixtures, in which there is less hydrogen. The amount of absorbedwater in the plutonium oxide is irrelevant with respect to this analysis, as long as there issufficient water to generate the hydrogen to make the hydrogen-air mixturestoichiometric. This criterion is easily satisfied, and as mentioned above an analysis of astoichiometric mixture bounds analysis of fuel lean mixtures.
Helium generation due to alpha decay is neglected in this analysis. This is a negligiblecontributor to the total number of moles of gas in the mixture, and helium is an inertdiluent that increases detonation cell widths. Ignoring this source is conservative.
Analytical Methods and Computations
Given the pressure, temperature, and constituency of the gaseous mixture that resultsfrom the mixing of the contents of the three container gas spaces, the detonation cellwidth can be calculated with the semi-empirical model described in reference [3]. Thismodel relates the Zeldovich, Doring, and Von Neumann (ZND) induction length [4] tothe cell width. Detonation cell width data was used to determine the correlation factor"A" between the theoretical ZND induction length and the cell width "A".
2 = ALZND (1)
For all hydrogen-air mixtures with helium, argon, or excess nitrogen the value of thecorrelation factor is assumed to be 51.0. For mixtures with CO 2 the value of thecorrelation factor is a function of the percent CO2 by volume in the mixture.
To determine the final state of the hydrogen-air-CO 2 mixture in the three connected gasspaces, the number of moles of each of the constituents in each of the gas spaces, initiallyat 70OF and atmospheric pressure, is determined. First the total number of moles in eachof the gas spaces is determined with the ideal gas relation:
PVn = -- (2)
RT
The number of moles of each constituent is the product of the constituent mole fractionand the total number of moles. For example, if the volume is filled with air
02 + 3.76 N2
the number of moles of oxygen and nitrogen are respectively:
1 3.76no, = n & nN, 3.76
4.76 4.76
Appendix 3.9 - 6 of 16
Revision 1 S-SAR-G-O000 1
M-CLC-A-000175, Rev. 1, Pg.5 of 13
To determine the constituency of the final mixture when the contents of the three gasspaces mix, the numbers of moles of each constituent in each gas space are summed andsufficient hydrogen is added to make the mixture stoichiometric. The pressures in thethree gas spaces will be equal after mixing, but the temperatures will differ. Todetermine the pressure, solve the continuity equation and the ideal gas relation for each ofthe gas spaces simultaneously.
PV3013 n 30 13 RT 3 0 13 (3)
P Vpc,, .. npcv RTcv (4)
+ + n5,?1: = n (6)
By judicious substitution these simultaneous equations can be reduced to a singleequation for the pressure:
P = nRT,0 3 (7)
V3013 PCI TC ' 13
With the gas mixture constituency the pressure and the three gas space temperaturesknown, the gas space cell widths can be determined by the semi-empirical model [3]. Asa result of the temperature differences, each gas space will have a different value for thecell width.
Results and Discussion
Four scenarios, in which the PCV is partially filled with CO2 and the 3013 container is oris not partially filled with an inert diluent, are considered. The 3013 container and thePCV are assumed to leak, allowing the contained gas mixtures to mix with that in theSCV. From the detonation standpoint this is a conservative assumption, since the airinitially in the SCV is not diluted with an inert gas and it supplies oxygen to the finalmixture. Since it is assumed that there is sufficient hydrogen available to match anyavailable oxygen, the more oxygen the more hydrogen and the volume percentage of inertdiluents is reduced. Since all of the hydrogen is generated in the 3013 container, if thiscontainer does not leak it alone will contain a combustible gaseous mixture. Inerting the3013 will preclude the possibility of a detonation in the container, as long as it does notleak. With 75% helium and 25% air initially in the container the initial gaseous mixtureis:
x
02 + 3.76 N2 +x He where X =0.754.76 + x
Appendix 3.9 - 7 of 16
Revision I S-SAR-G-00001M-CLC-A-000175, Rev. 1, Pg.6 of 13
The stoichiometric coefficient of helium is x = 14.28. Adding sufficient hydrogen tomake a stoichiometric mixture results in the following mixture:
2 H2 + 02 + 3.76 N2 + 14.28 He
% H2 = (2/21.04)x 100 = 9.5%
This mixture is 9.5% hydrogen by volume. This is just above the lean flammable limitfor hydrogen-air mixtures (9.0%, [5]). The lean hydrogen detonable limit will be greaterthan the flammable limit, so the conjecture that the hydrogen-air-helium mixture will notdetonate is reasonable.
At 14.7 psia and 70'F, the initial helium mixture will have 0.04959 moles, equation (2).The number of moles of oxygen is 0.0026045. Twice this number of moles of hydrogenis added to make the hydrogen-air-helium mixture stoichiometric. The ideal gas relationis used to calculate the final pressure (24.03 psia). With a temperature of 324°F, thepredicted detonation cell width [3] is 26.6 mm. This calculated cell width is independentof the flammability limit. The model will calculate a cell width, irrespective of whetherthe mixture is within the flammability limits. The cell width alone precludes a detonationsince the cell width is greater than the bounding radial gap (6.5 mm inside of the 3013container following an impact [6,8]).
PV 101300(0.001197803)n- - =.04959niols
RT 8.314(294.3)
0.04959n - = 0.0026045mnols
19.04
n.,,,,, = n + 2no,
p n n,,,,c-RT _ 0.054799(8.314)(435.4) = 165610.08Pa (24.03 psia)
V 0.0011978
If only the 3013 container leaks, the helium-air in the 3013 container will mix with theC0 2-air mixture in the PCV. This mixture will not be detonable because CO2 is a veryeffective diluent for raising the cell width. There is no diluent in the SCV, so mixing theSCV air with the contents of the other two containers is conservative. The additionaloxygen in the SCV air allows more hydrogen in the final stoichiometric mixture.
Scenario #1- 50% C0 2 in the PC V and no Dilution of the 3013 Container
The first scenario considered is the one in which the PCV is initially filled with 50% CO2and the 3013 container is initially filled with air. The number of moles of oxygen,nitrogen, and CO 2 initially in each of the three containers are shown in Table I along
Appendix 3.9 - 8 of 16
Revision I S-SAR-G-0000 IRevision 1 S-SAR-G-0000 1
M-CLC-A-000175, Rev. 1, Pg.7 of 13
with the total for the combined mixture. The number of moles of hydrogen added tomake the mixture stoichiometric is twice the total number of moles of oxygen.
Table 1: Number of moles of oxygen, nitrogen, and carbon dioxide initially in the 3013container, the PCV, and the SCV at 707F and 14.7 psia. The PCV is filledwith 50% by volume CO 2.
Container n (02) n (N2) n (C0 2)3013 0.010418 0.03917 _
PCV 0.007167 0.026948 0.034115SCV 0.024161 0.090846
Combined 0.041746 0.156964 0.034115
The final constituency of the mixture, based on a mole of hydrogen, is:
H2 + 0.5 02 + 1.88 N2 + 0.4086 CO 2
This mixture is 10.8% CO2 by volume. The pressure from equation (7) is 28.4 psia. Thepredicted cell widths are:
A3 0 13 = 18.1 mmApcv = 18.5 mmAscv = 18.6 mm
Scenario #2. 75% C0 2 in the PCV and no Dilution of the 3013 Container
The second scenario considered is the one in which the PCV is initially filled with 75%CO 2 and the 3013 container is initially filled with air. The number of moles of oxygen,nitrogen, and CO2 initially in each of the three containers are shown in Table 2 alongwith the total for the combined mixture. The number of moles of hydrogen added tomake the mixture stoichiometric is twice the total number of moles of oxygen.
Table 2: Number of moles of oxygen, nitrogen, and carbon dioxide initially in the 3013container, the PCV, and the SCV at 70'F and 14.7 psia. The PCV is filledwith 75% by volume CO 2.
Container n (02) n (N 2) n (C0 2)
3013 0.010418 0.03917 -PCV 0.003584 0.01347 0.051173SCV 0.024161 0.090846 -
Combined 0.038163 0.14349 0.051173
The final constituency of the mixture, based on a mole of hydrogen, is:
H2 + 0.5 02 + 1.88 N2 + 0.67046 CO2
Appendix 3.9 - 9 of 16
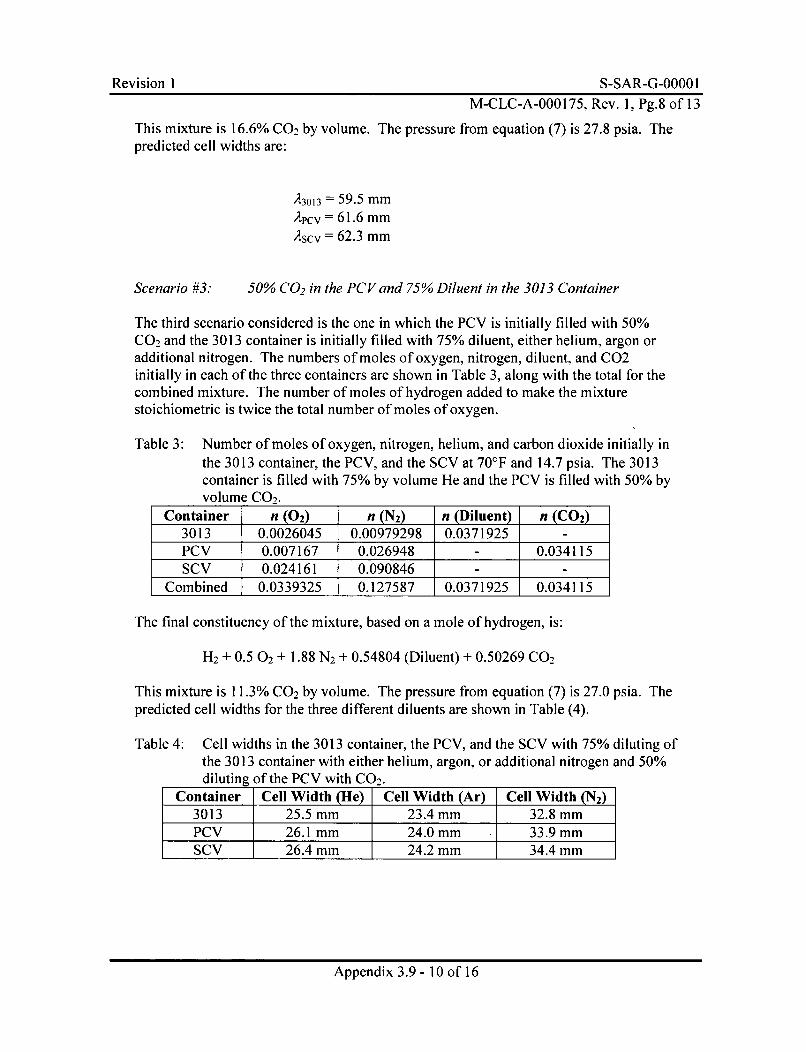
Revision I S-SAR-G-00001M-CLC-A-000175, Rev. 1, Pg.8 of 13
This mixture is 16.6% CO 2 by volume. The pressure from equation (7) is 27.8 psia. Thepredicted cell widths are:
23013 = 59.5 mm2 pcv = 61.6 mm2 scv = 62.3 mm
Scenario #3: 50% C0 2 in the PCV and 75% Diluent in the 3013 Container
The third scenario considered is the one in which the PCV is initially filled with 50%CO2 and the 3013 container is initially filled with 75% diluent, either helium, argon oradditional nitrogen. The numbers of moles of oxygen, nitrogen, diluent, and CO2initially in each of the three containers are shown in Table 3, along with the total for thecombined mixture. The number of moles of hydrogen added to make the mixturestoichiometric is twice the total number of moles of oxygen.
Table 3: Number of moles of oxygen, nitrogen, helium, and carbon dioxide initially inthe 3013 container, the PCV, and the SCV at 70'F and 14.7 psia. The 3013container is filled with 75% by volume He and the PCV is filled with 50% byvolume CO2 .
Container n (02) n (N2) n (Diluent) n (C0 2)3013 0.0026045 0.00979298 0.0371925 -
PCV 0.007167 0.026948 - 0.034115SCV 0.024161 0.090846 - -
Combined 0.0339325 0.127587 0.0371925 0.034115
The final constituency of the mixture, based on a mole of hydrogen, is:
H2 + 0.5 02 + 1.88 N2 + 0.54804 (Diluent) + 0.50269 CO2
This mixture is 11.3% CO 2 by volume. The pressure from equation (7) is 27.0 psia. Thepredicted cell widths for the three different diluents are shown in Table (4).
Table 4: Cell widths in the 3013 container, the PCV, and the SCV with 75% diluting ofthe 3013 container with either helium, argon, or additional nitrogen and 50%diluting of the PCV with CO2.
Container Cell Width (He) Cell Width (Ar) Cell Width (N2)3013 25.5 mm 23.4 mm 32.8 mmPCV 26.1 mm 24.0 mm 33.9 mmSCV 26.4 mm 24.2 mm 34.4 mm
Appendix 3.9 - 10 of 16
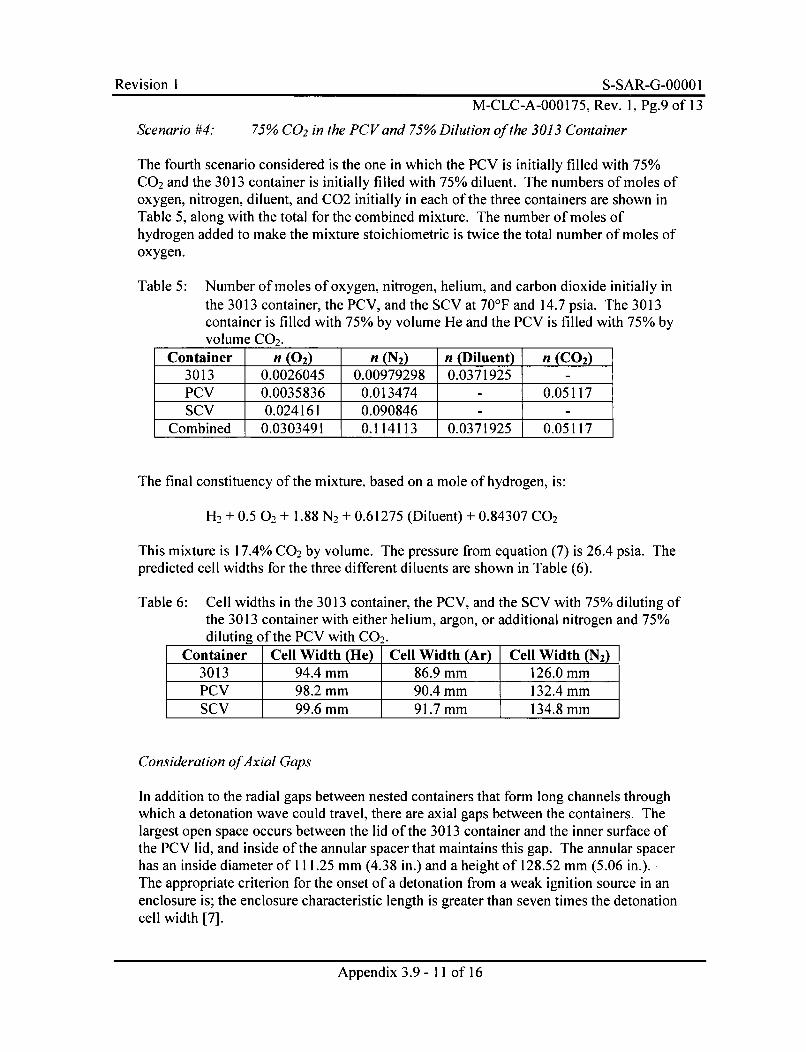
Revision I S-SAR-G-00001M-CLC-A-000175, Rev. 1, Pg.9 of 13
Scenario #4: 75% C0 2 in the PCV and 75% Dilution of the 3013 Container
The fourth scenario considered is the one in which the PCV is initially filled with 75%CO2 and the 3013 container is initially filled with 75% diluent. The numbers of moles ofoxygen, nitrogen, diluent, and C02 initially in each of the three containers are shown inTable 5, along with the total for the combined mixture. The number of moles ofhydrogen added to make the mixture stoichiometric is twice the total number of moles ofoxygen.
Table 5: Number of moles of oxygen, nitrogen, helium, and carbon dioxide initially inthe 3013 container, the PCV, and the SCV at 70'F and 14.7 psia. The 3013container is filled with 75% by volume He and the PCV is filled with 75% byvolume CO2.
Container n (02) n (N2) n (Diluent) n (C0 2)3013 0.0026045 0.00979298 0.0371925 -PCV 0.0035836 0.013474 - 0.05117SCV 0.024161 0.090846 - -
Combined 0.0303491 0.114113 0.0371925 0.05117
The final constituency of the mixture, based on a mole of hydrogen, is:
H- + 0.5 02 + 1.88 N2 + 0.61275 (Diluent) + 0.84307 CO 2
This mixture is 17.4% CO2 by volume. The pressure from equation (7) is 26.4 psia. Thepredicted cell widths for the three different diluents are shown in Table (6).
Table 6: Cell widths in the 3013 container, the PCV, and the SCV with 75% diluting ofthe 3013 container with either helium, argon, or additional nitrogen and 75%diluting of the PCV with CO2.
Container Cell Width (He) Cell Width (Ar) Cell Width (N 2)3013 94.4 mm 86.9 mm 126.0 mmPCV 98.2 mm 90.4 mm 132.4 mmSCV 99.6 mm 91.7 mm 134.8 mm
Consideration of Axial Gaps
In addition to the radial gaps between nested containers that form long channels throughwhich a detonation wave could travel, there are axial gaps between the containers. Thelargest open space occurs between the lid of the 3013 container and the inner surface ofthe PCV lid, and inside of the annular spacer that maintains this gap. The annular spacerhas an inside diameter of 111.25 mm (4.38 in.) and a height of 128.52 mm (5.06 in.).The appropriate criterion for the onset of a detonation from a weak ignition source in anenclosure is; the enclosure characteristic length is greater than seven times the detonationcell width [7].
Appendix 3.9 - 11 of 16
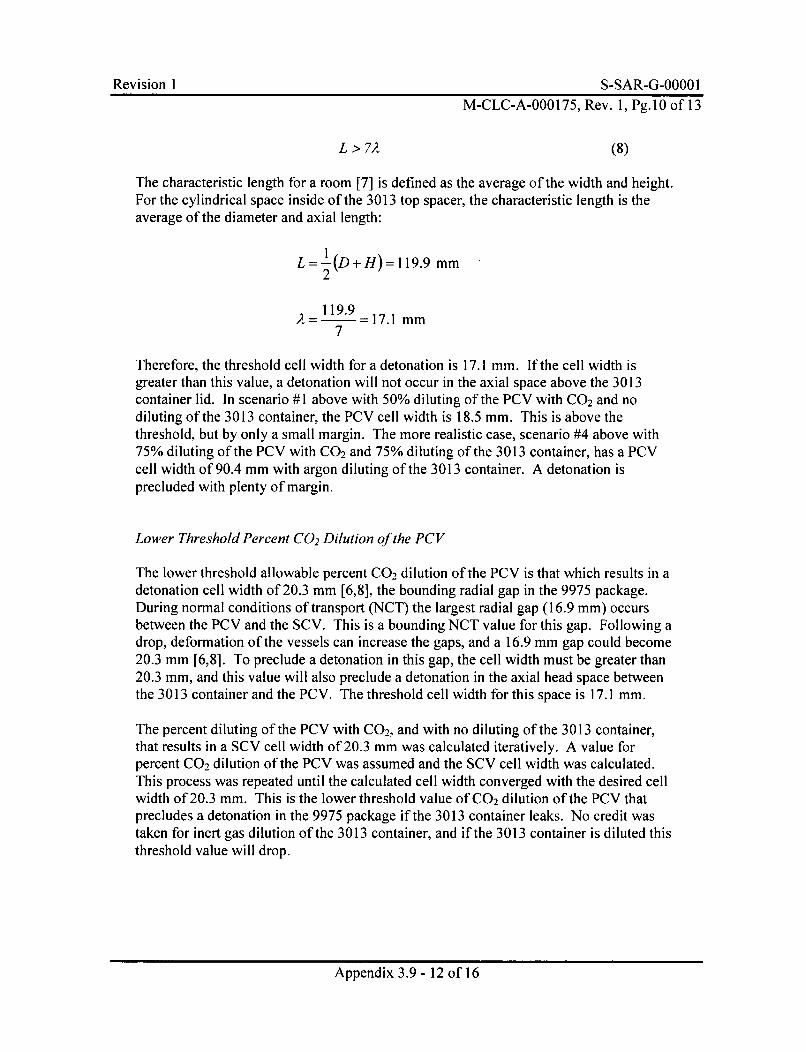
Revision I S-SAR-G-0000 IM-CLC-A-000175, Rev. 1, Pg.10 of 13
L > 72 (8)
The characteristic length for a room [7] is defined as the average of the width and height.For the cylindrical space inside of the 3013 top spacer, the characteristic length is theaverage of the diameter and axial length:
L=I(D+H)= 119.9mm2
1 19 .9A = 17.1 min7
Therefore, the threshold cell width for a detonation is 17.1 mm. If the cell width isgreater than this value, a detonation will not occur in the axial space above the 3013container lid. In scenario #1 above with 50% diluting of the PCV with CO 2 and nodiluting of the 3013 container, the PCV cell width is 18.5 mm. This is above thethreshold, but by only a small margin. The more realistic case, scenario #4 above with75% diluting of the PCV with CO2 and 75% diluting of the 3013 container, has a PCVcell width of 90.4 mm with argon diluting of the 3013 container. A detonation isprecluded with plenty of margin.
Lower Threshold Percent C0 2 Dilution of the PCV
The lower threshold allowable percent CO2 dilution of the PCV is that which results in adetonation cell width of 20.3 mm [6,8], the bounding radial gap in the 9975 package.During normal conditions of transport (NCT) the largest radial gap (16.9 mm) occursbetween the PCV and the SCV. This is a bounding NCT value for this gap. Following adrop, deformation of the vessels can increase the gaps, and a 16.9 mm gap could become20.3 mm [6,8]. To preclude a detonation in this gap, the cell width must be greater than20.3 mm, and this value will also preclude a detonation in the axial head space betweenthe 3013 container and the PCV. The threshold cell width for this space is 17.1 mm.
The percent diluting of the PCV with CO2, and with no diluting of the 3013 container,that results in a SCV cell width of 20.3 mm was calculated iteratively. A value forpercent CO 2 dilution of the PCV was assumed and the SCV cell width was calculated.This process was repeated until the calculated cell width converged with the desired cellwidth of 20.3 mm. This is the lower threshold value of CO 2 dilution of the PCV thatprecludes a detonation in the 9975 package if the 3013 container leaks. No credit wastaken for inert gas dilution of the 3013 container, and if the 3013 container is diluted thisthreshold value will drop.
Appendix 3.9 - 12 of 16
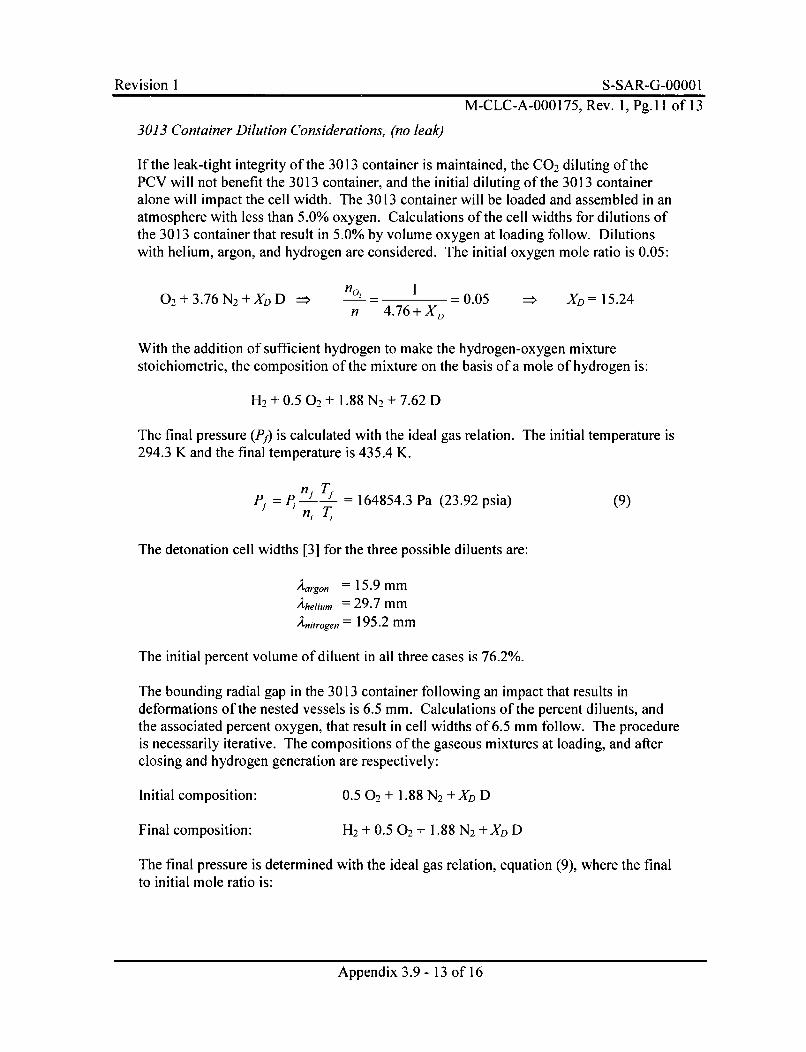
Revision 1 S-SAR-G-0000 1
M-CLC-A-000175, Rev. 1, Pg. I1 of 13
3013 Container Dilution Considerations, (no leak)
If the leak-tight integrity of the 3013 container is maintained, the CO2 diluting of thePCV will not benefit the 3013 container, and the initial diluting of the 3013 containeralone will impact the cell width. The 3013 container will be loaded and assembled in anatmosphere with less than 5.0% oxygen. Calculations of the cell widths for dilutions ofthe 3013 container that result in 5.0% by volume oxygen at loading follow. Dilutionswith helium, argon, and hydrogen are considered. The initial oxygen mole ratio is 0.05:
0 2 + 3.76 N2 + XD D • no_ 1 =0.05 = XD = 15.24n 4.76 + XD
With the addition of sufficient hydrogen to make the hydrogen-oxygen mixture
stoichiometric, the composition of the mixture on the basis of a mole of hydrogen is:
Hi + 0.5 0 + 1.88 N- + 7.62 D
The final pressure (Pf) is calculated with the ideal gas relation. The initial temperature is294.3 K and the final temperature is 435.4 K.
Pf= P n T = 164854.3 Pa (23.92 psia) (9)n, T,
The detonation cell widths [3] for the three possible diluents are:
Aargon = 15.9 mm
Aheli,,, = 29.7 mmAn,,oge,, = 195.2 mm
The initial percent volume of diluent in all three cases is 76.2%.
The bounding radial gap in the 3013 container following an impact that results indeformations of the nested vessels is 6.5 mm. Calculations of the percent diluents, andthe associated percent oxygen, that result in cell widths of 6.5 mm follow. The procedureis necessarily iterative. The compositions of the gaseous mixtures at loading, and afterclosing and hydrogen generation are respectively:
Initial composition: 0.5 02 + 1.88 N2 +XD D
Final composition: H2 + 0.5 02 + 1.88 N2 +"XD D
The final pressure is determined with the ideal gas relation, equation (9), where the finalto initial mole ratio is:
Appendix 3.9 - 13 of 16
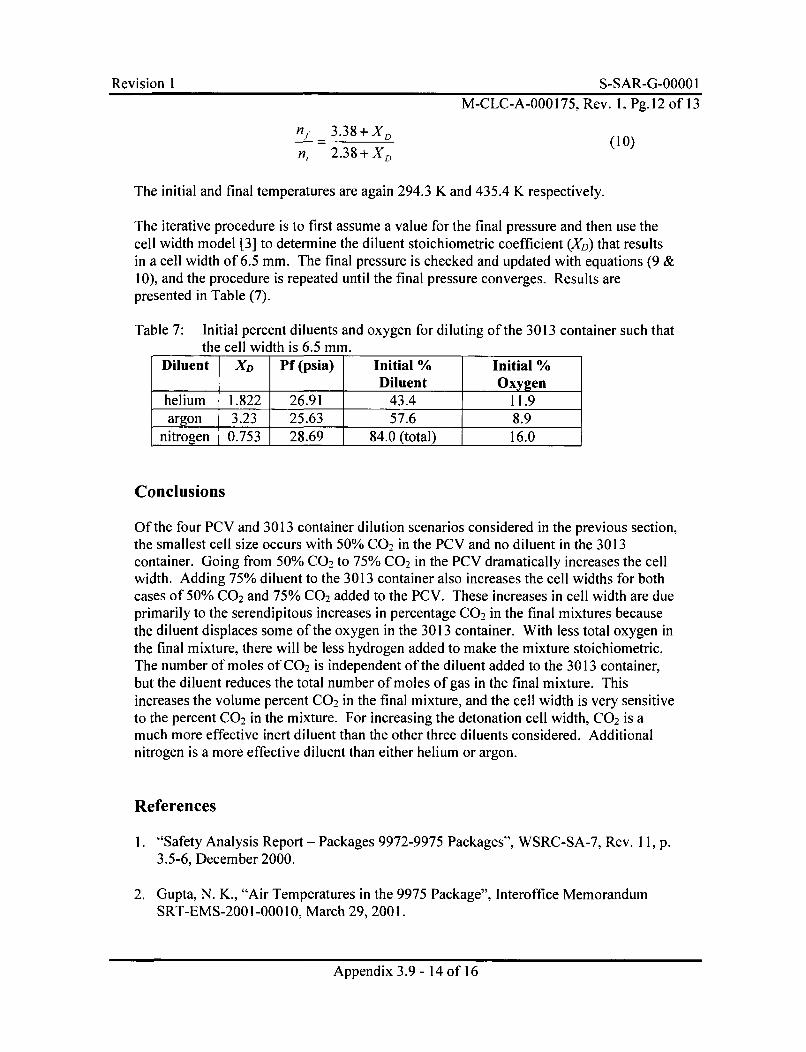
Revision I S-SAR-G-0000 IM-CLC-A-000175, Rev. 1, Pg.12 of 13
n - 3.38+ X D (10)n, 2.38 + -XD
The initial and final temperatures are again 294.3 K and 435.4 K respectively.
The iterative procedure is to first assume a value for the final pressure and then use thecell width model [3] to determine the diluent stoichiometric coefficient (XD) that resultsin a cell width of 6.5 mm. The final pressure is checked and updated with equations (9 &10), and the procedure is repeated until the final pressure converges. Results arepresented in Table (7).
Table 7: Initial percent diluents and oxygen for diluting of the 3013 container such thatthe cell width is 6.5 mm.
Diluent XD Pf (psia) Initial % Initial %Diluent Oxygen
helium 1.822 26.91 43.4 11.9argon 3.23 25.63 57.6 8.9
nitrogen 0.753 28.69 84.0 (total) 16.0
Conclusions
Of the four PCV and 3013 container dilution scenarios considered in the previous section,the smallest cell size occurs with 50% CO2 in the PCV and no diluent in the 3013container. Going from 50% CO2 to 75% CO 2 in the PCV dramatically increases the cellwidth. Adding 75% diluent to the 3013 container also increases the cell widths for bothcases of 50% CO 2 and 75% CO2 added to the PCV. These increases in cell width are dueprimarily to the serendipitous increases in percentage CO2 in the final mixtures becausethe diluent displaces some of the oxygen in the 3013 container. With less total oxygen inthe final mixture, there will be less hydrogen added to make the mixture stoichiometric.The number of moles of CO2 is independent of the diluent added to the 3013 container,but the diluent reduces the total number of moles of gas in the final mixture. Thisincreases the volume percent CO2 in the final mixture, and the cell width is very sensitiveto the percent CO2 in the mixture. For increasing the detonation cell width, CO2 is amuch more effective inert diluent than the other three diluents considered. Additionalnitrogen is a more effective diluent than either helium or argon.
References
1. "Safety Analysis Report - Packages 9972-9975 Packages", WSRC-SA-7, Rev. 11, p.3.5-6, December 2000.
2. Gupta, N. K., "Air Temperatures in the 9975 Package", Interoffice MemorandumSRT-EMS-2001-00010, March 29, 2001.
Appendix 3.9 - 14 of 16
Revision I S-SAR-G-00001M-CLC-A-000175, Rev. 1, Pg.13 of 13
3. Shadday, M. A., "A Semi-Empirical Model for Detonation Cell Widths", WSRC-TR-2001-00265, May 2001.
4. Kumar, R. K., "Detonation Cell Widths in Hydrogen-Oxygen-Diluent Mixtures",Combustion and Flame, 80(2): 157-169 (1990).
5. Drell, 1. L., & Belles, F. E., "Survey of Hydrogen Combustion Properties", NACAReport 1383.
6. Wu, T. T., "Analysis of Gap Sizes between Components of 9975 Package subjectedto 55-Foot Drop", M-CLC-00746, Rev. 0, June 2001.
7. Breitung, W., et. al., "Flame Acceleration and Deflagration to Detonation Transitionin Nuclear Safety", NEA/CSNI/R(2000)7, August 2000, available athttp://www.galcit.caltech.edu/-iesup/SOA R/index.htm 1.
8. Abramczyk, G. A., "Stack-up Dimensions of the 9975 Packaging Components inNormal Conditions of Transport (NCT) and Hypothetical Accident Conditions(HAC)", M-CLC-00177, Rev. 0, June 2001.
Appendix 3.9 - 15 of 16

Reiio S-SAR-G-0000 IRevision I S-SAR-G-OOOO 1
This Page Intentionally Left Blank
Appendix 3.9 - 16 of 16