
MONITORING CRACK PROPAGATION IN TURBINE BLADES CAUSED BY THERMOSONICS
Upload
independentCategory
view
1download
0
RESEARCH WORKS OF AFITIssue 25, pp. 15÷24, 2009 r.
Paweł LINDSTEDT Edward ROKICKI
Henryk BOROWCZYK Paweł MAJEWSKI Air Force Institute of Technology (AFIT)
ROTOR BLADES CONDITMETHOD BASED ON TH
OF THE ENVIRONM
The paper presents fundamentals of a new methodemonstrated by blades of rotor machines during the diagnostic model expressed as a quotient of thnostic signal y(t) that results from the blade impablade surrounding when the blade tip approachesamplification of these signals when the blade tip hand moves away. The adopted diagnostic model takes account for cuno need of measurements of its parameters [12, 1alterations of the technical condition demonstrated variations in the blade surroundings. Consequentlyplay an important role for diagnostics of rotor blades
Keywords: diagnostics of blades, correlation functtion, amplitude amplification
1. Introduction
Monitoring (on-line assessment) of techncial components of rotor machinery, such as bproblem associated with operation (use) of sushows that ripping off only a single blade (ohundred ones) nearly always leads to a verquently, very expensive) breakdown of the en
Downloaded from De G
DOI 10.2478/v10041-009-0005-y
ION MONITORING E ELIMINATION
ENT SIGNAL
d for monitoring of technical condition operation thereof. The method involves e amplitude amplification for the diag-
ct and the signal x(t) produced by the the sensor, divided by the amplitude as already passed the sensor position
rrent surrounding of the blade x(t) with 4, 15]. Thus, the model is sensitive to by the blade but very little vulnerable to , the proposed method may be able to during operation thereof.
ion, power spectral density (PSD) func-
ical condition demonstrated by cru-earings and blades, is an essential ch equipment. Practical experience f a several dozen or even several y serious breakdown (and conse-tire rotary machine (an axial com-
- 10.2478/v10041-009-0005-yruyter Online at 09/09/2016 05:18:57PM
via free access
Paweł LINDSTEDT, Edward ROKICKI, Henryk BOROWCZYK, Paweł MAJEWSKI
16
pressor, a turbine). It is why methods for on-line monitoring of technical condition demonstrated by rotor blades during regular operation of the equipment is the issue of constantly growing interest.
Currently, a number of various methods for monitoring of technical condition demonstrated by rotor blades are in use. These methods base on so called ‘con-tactless’ measurements of values for temporary displacements of a blade tip at moments when it passes the zone just below the measuring sensor. A huge num-ber of ‘contactless’ measuring methods have already been developed (with dedi-cated computer software) that can be used to record and process signals ac-quired from working blades during operation of a rotor machine. These include commonly known and used measuring systems offered by such companies as Hood, Agilis, Prat&Whithey (USA), Rolls Royce (UK), ABB Turbocharges (Swiss), MTU (Germany), AFIT (Poland) and also other suppliers from Russia, China and India [1, 3, 4, 5, 6, 7, 8, 9, 10, 11, 16, 18, 19, 20].
The already existing methods for monitoring of rotor blade technical condition base exclusively on processing of measurement signals acquired from working blades without sufficient account for varying environment of measurements. This probably results from the fact that measurements of fast changing environment of blades (with such variables as temperature, pressure, centrifugal forces, bending and twisting moments, clamping forces that fix the blade in its holder) are ex-tremely difficult or even unfeasible. Therefore one can state that all these meth-ods fail to fully adhere the major rule of the diagnostic technology that imposes the need to examine and analyze technical condition of the investigated facilities with due consideration to the effect of their environment and, consequently, all these methods are not enough accurate. It is why the need to develop a new me-thod to monitor technical condition of a blade during its operation with account to its environment but with no need to measure signals from its environment as they are frequently unavailable or immeasurable appeared.
2. Operation of a blade in a variable environment
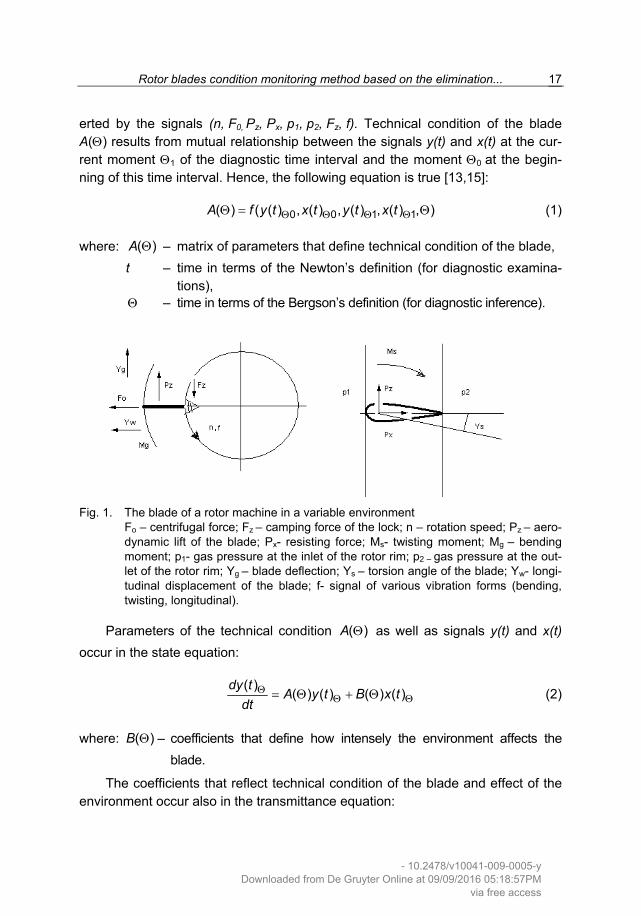
The blade that is operated in a variable environment is shown in Fig. 1. Fig. 1 exhibits that the blade is a rather simple technical item in terms of its
design but its operation represents a sophisticated system placed in a multidi-mensional variable environment. Current status of the blade operation is defined by the measurable signal y(t) of the blade tip displacement that is the resulting function of the signals (Yg, Yw, Ys f) whilst the blade environment is determined by the multidimensional signal x(t) that is, in turn, the result of combined effect ex-
- 10.2478/v10041-009-0005-yDownloaded from De Gruyter Online at 09/09/2016 05:18:57PM
via free access
Rotor blades condition monitoring method based on the elimination...
17
erted by the signals (n, F0, Pz, Px, p1, p2, Fz, f). Technical condition of the blade A(Θ) results from mutual relationship between the signals y(t) and x(t) at the cur-rent moment Θ1 of the diagnostic time interval and the moment Θ0 at the begin-ning of this time interval. Hence, the following equation is true [13,15]:
0 0 1 1( ) ( ( ) , ( ) , ( ) , ( ) , )A f y t x t y t x tΘ Θ Θ ΘΘ = Θ (1)
where: – matrix of parameters that define technical condition of the blade, ( )A Θ
t – time in terms of the Newton’s definition (for diagnostic examina-tions),
– time in terms of the Bergson’s definition (for diagnostic inference). Θ
Fig. 1. The blade of a rotor machine in a variable environment
Fo – centrifugal force; Fz – camping force of the lock; n – rotation speed; Pz – aero-dynamic lift of the blade; Px- resisting force; Ms- twisting moment; Mg – bending moment; p1- gas pressure at the inlet of the rotor rim; p2 – gas pressure at the out-let of the rotor rim; Yg – blade deflection; Ys – torsion angle of the blade; Yw- longi-tudinal displacement of the blade; f- signal of various vibration forms (bending, twisting, longitudinal).
Parameters of the technical condition ( )A Θ as well as signals y(t) and x(t)
occur in the state equation:
( )
( ) ( ) ( ) ( )dy t
A y t B x tdt
ΘΘ Θ= Θ + Θ (2)
where: – coefficients that define how intensely the environment affects the blade.
( )B Θ
The coefficients that reflect technical condition of the blade and effect of the environment occur also in the transmittance equation:
- 10.2478/v10041-009-0005-yDownloaded from De Gruyter Online at 09/09/2016 05:18:57PM
via free access
Paweł LINDSTEDT, Edward ROKICKI, Henryk BOROWCZYK, Paweł MAJEWSKI
18
2
2 12
2 1
........( )( ) ........
mn
nn
b s b s b s bY sGX s a s a s a s a
+ += =
+ +0
0
+
+ (3)
as well as in the function that suits for calculation of the square for the amplitude amplification W2 of the y(t) signal related to the environment signal x(t):
( )2222 2 1 0
22 1 0
( ) ........ ( ) ( )(j ) ........ (j ) (j )
myyn
nxxn
Sb j b j b j bW G j
Sa a a a
ω + ω + ω += ω = =
ω + ω + ω + (4)
where: G(jω) – spectral transmittance, (jω) – imaginary part of the complex variable S,
Syy, Sxx – functions for spectral density of signals y(t) and x(t).
The mathematic expressions (2), (3), (4) may serve as diagnostic models for the examined object as they express mutual relationships between the signals y(t) for the object operation and the environment signal x(t) on one side and technical parameters of the examined facility A(Q) on the other side.
The model (4) becomes the matter of particular importance as it enables to get rid (by means of special measures that are to be undertaken during examina-tion and diagnostic inference) of environmental signals x(t) expressed by the power signals Sxx and eliminate them from the diagnostic model.
3. Elimination of the environment signal – theoretic background
For subsequent time intervals T01 and T12 (Fig. 2) with very short distance be-tween them and assigned for recording of signals y(t) and x(t) the squares of am-plitude amplifications of the signal y(t) related to the signal x(t) can be calculated:
01
201 01
Tyy
T Txx
SW
S= (5)
12
212 12
Tyy
T Txx
SW
S= (6)
where: – power spectral densities (PSD) within the time interval T01 01,T Txx yyS S 01,
– power spectral densities (PSD) within the time interval T12 12,T Txx yyS S 12,
- 10.2478/v10041-009-0005-yDownloaded from De Gruyter Online at 09/09/2016 05:18:57PM
via free access
Rotor blades condition monitoring method based on the elimination...
19
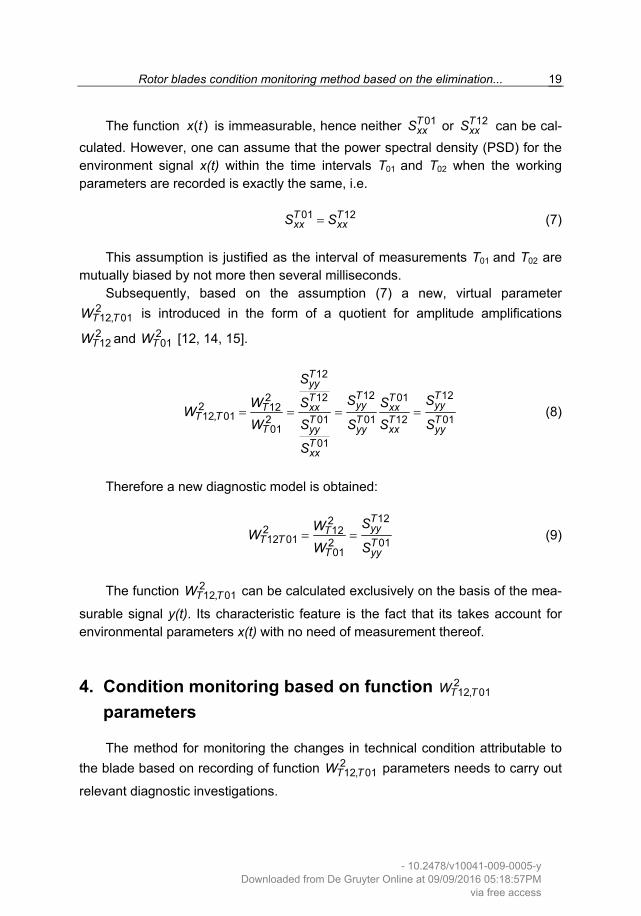
The function ( )x t is immeasurable, hence neither or can be cal-culated. However, one can assume that the power spectral density (PSD) for the environment signal x(t) within the time intervals T
01TxxS 12T
xxS
01 and T02 when the working parameters are recorded is exactly the same, i.e.
(7) 01 12T Txx xxS S=
This assumption is justified as the interval of measurements T01 and T02 are mutually biased by not more then several milliseconds.
Subsequently, based on the assumption (7) a new, virtual parameter is introduced in the form of a quotient for amplitude amplifications
and [12, 14, 15].
212, 01T TW
212TW 2
01TW
12
12 122 12 012 1212, 01 2 01 01 12
0101
Tyy
T TT T
01yyT xx xx
T T T T T TT yy yy xx yy
Txx
SS SW S S
WW S S S S
S
= = = = yy (8)
Therefore a new diagnostic model is obtained:
122
2 1212 01 2
01
T
01yyT
T T TT yy
SWW
W S= = (9)
The function can be calculated exclusively on the basis of the mea-
surable signal y(t). Its characteristic feature is the fact that its takes account for environmental parameters x(t) with no need of measurement thereof.
212, 01T TW
4. Condition monitoring based on function parameters
212, 01T TW
The method for monitoring the changes in technical condition attributable to the blade based on recording of function parameters needs to carry out
relevant diagnostic investigations.
212, 01T TW
- 10.2478/v10041-009-0005-yDownloaded from De Gruyter Online at 09/09/2016 05:18:57PM
via free access
Paweł LINDSTEDT, Edward ROKICKI, Henryk BOROWCZYK, Paweł MAJEWSKI
20
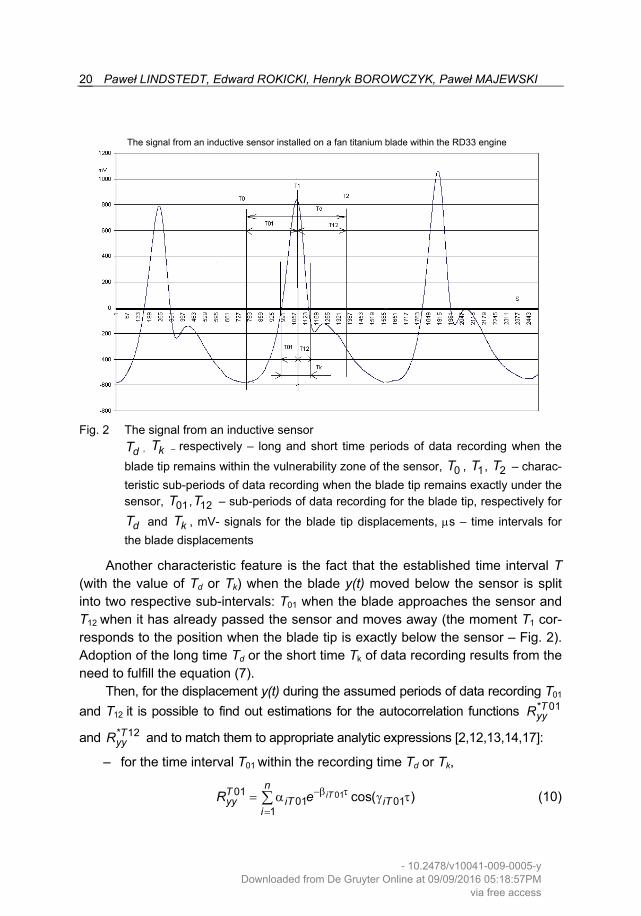
The signal from an inductive sensor installed on a fan titanium blade within the RD33 engine
Fig. 2 The signal from an inductive sensor
dT , kT – respectively – long and short time periods of data recording when the
blade tip remains within the vulnerability zone of the sensor, , , – charac-teristic sub-periods of data recording when the blade tip remains exactly under the sensor, , – sub-periods of data recording for the blade tip, respectively for
and , mV- signals for the blade tip displacements, µs – time intervals for the blade displacements
0T 1T 2T
01T 12T
dT kT
Another characteristic feature is the fact that the established time interval T (with the value of Td or Tk) when the blade y(t) moved below the sensor is split into two respective sub-intervals: T01 when the blade approaches the sensor and T12 when it has already passed the sensor and moves away (the moment T1 cor-responds to the position when the blade tip is exactly below the sensor – Fig. 2). Adoption of the long time Td or the short time Tk of data recording results from the need to fulfill the equation (7).
Then, for the displacement y(t) during the assumed periods of data recording T01
and T12 it is possible to find out estimations for the autocorrelation functions
and and to match them to appropriate analytic expressions [2,12,13,14,17]:
* 01TyyR
* 12TyyR
– for the time interval T01 within the recording time Td or Tk,
010101 01
1cos( )iT
nTyy iT iT
iR e−β τ
== α γ∑ τ (10)
- 10.2478/v10041-009-0005-yDownloaded from De Gruyter Online at 09/09/2016 05:18:57PM
via free access
Rotor blades condition monitoring method based on the elimination...
21
where: – parameters for the analytic form of the correlation function,
01 01 01, ,iT iT iTα β γ
– bias time (the space variable for the correlation function), τ – number of components for the correlation function. n
– for the time interval T12 within the recording time Td or Tk,
121212 12
1cos( )jT
mTyy jT jT
jR e−β τ
== α γ τ∑ (11)
where: – parameters for the analytic form of the correlation function,
01 01 01, ,iT iT iTα β γ
τ – bias time (different from the dynamic time variable t),
m – number of components for the correlation function.
The matching degree between the analytic form of the correlation function and their estimations should be higher than 0.9 and n should be equal to or higher than m. It can be achieved by assuming the necessary data recording time Td or Tk as well as appropriate measuring window (of rectangular, Hamming, Hanning or other types) [13].
The switchover from physical signals x(t) and y(t) to correlation functions Rxx(τ) and Ryy(τ) defined for the bias time interval τ is justified by the fact that the function C in the space t is associated with the function C2 in the space of the time of τ and, respectively, the function Csin(ωt) is associated with the function C2cos(ωt).
Analytic forms for the autocorrelation functions 01TyyR and 12T
yyR can be used
to determine corresponding functions of power spectral densities (PSD) and 01( )T
yyS ω 12( )TyyS ω by application of the Fourier transformation:
01 01( ) ( ( ))T Tyy yyS F Rω = τ (12)
12 12( ) ( ( ))T Tyy yyS F Rω = τ (13)
where: – operation of the continuous Fourier transformation. (.)F
Finally, the new virtual signal can be determined:
12 2
2 0 1 212 01 01 2
0 1 2
......
Tyy
T T Tyy
S L L s L sW
S M M s M s
+ + += =
+ + + (14)
- 10.2478/v10041-009-0005-yDownloaded from De Gruyter Online at 09/09/2016 05:18:57PM
via free access
Paweł LINDSTEDT, Edward ROKICKI, Henryk BOROWCZYK, Paweł MAJEWSKI
22
with parameters that bring information about technical condition of the examined blade.
The monitoring process for technical condition of a blade in a rotor machine looks like in the following way:
• for any moment of the machine operation 0Θ (start of the monitoring
process) one has to establish parameters of the function: L201, 12T TW 00, L10,
L20, … as well as M00, M10, M20, … • for a subsequent moment of the machine operation Θ1 (when the blade is
to be monitored for the next time) the new parameters of the function must be determined, namely L2
01, 12T TW 01, L11, L21,… and M01, M11, M21,…
• alteration of the technical condition is calculated by relative alterations of individual parameters:
1 0
0
1 0
0
; 1,...,
; 1,...,
i ii
i
i ii
i
L LL i
LM M
M iM
−∆ = =
−∆ = =
n
m
• the diagnostic information that can be used for the monitoring process of technical condition demonstrated by the blade during operation of the rotor machine is assumed as alteration of the iL and iM parameters.
The assumption seems to be justified that a series of iL and iM parameters along with huge number of their mutual configurations shall enable to identify great many possible alterations of technical condition demonstrated by the blade under investigation.
5. Conclusions
The presented method applicable to monitoring of changes in technical con-dition of a blade is an innovative approach to carry out diagnostic of the blade in its natural environment with no need to measure signals from that environment.
The monitoring method that can be used to keep track on technical condition of the blade bases on the diagnostic model when the quotient of amplitude ampli-fication is calculated for the output signal y(t) related to the environment signal x(t) for the data recording time T
212 01t TW
01 and T12. The method consists in the fact
- 10.2478/v10041-009-0005-yDownloaded from De Gruyter Online at 09/09/2016 05:18:57PM
via free access
Rotor blades condition monitoring method based on the elimination...
23
that the time interval T when the blade tip y(t) moves within the vulnerability zone of the sensor is split into two sub-intervals: T01 when the blade tip approaches the sensor position and T12 i.e. after passing this position and moving away.
The method for monitoring technical condition of an item is characterized in the fact that the virtual signal is calculated as a quotient of the power
spectral density (PSD)
212 01t TW
12TyyS for the signal y(t) that is monitored during a subse-
quent time period T12 divided by the power spectral density (PSD) for the
same signal y(t) but monitored during the preceding period of time T
01TyyS
01. The time intervals T01 and T12 to keep tracks on the signal y(t) are selected in such a way that the environment x(t) for these time periods when the signal y(t) is monitored can be considered as identical, i.e. . 01 12T T
xx xxS S=
In addition, the method for monitoring technical condition demonstrated by a blade is characterized in the fact that the power spectral density (PSD) values
and for the signal y(t) is calculated from analytic forms of the autocor-
relation functions
01TyyS 12T
yyS01T
yyR and 12TyyR that are determined with the matching coeffi-
cient higher than 0.9. The required matching factor is achieved by assuming the necessary data recording time Td or Tk as well as appropriate function of the measuring window (rectangular, Hamming, Hanning or other types).
The characteristic feature of the model is the advantage that it needs no measurements of signals from the environment, although indirectly they are taken into account by purposefully arranged diagnostic examinations (two time intervals for taking measurements, determination of the diagnostic model as a quotient of other diagnostic models that combine signals from the environment with parameters that reflect technical condition of the object).
212 01t TW
References
1. Bovishanskii K.N. et.al.: A method for continuous monitoring the vibrational state of the rotating blades of turbomachines. Thermal engineering (Teploenegetika), Vol 47 No 5 2000. St. Petersburg
2. Bendat J.S., Piersol A.G.: Metody analizy i pomiaru sygnałów losowych. (Methods for analysis and measurements of random signals) PWN, Warszawa 1976 (in Polish)
3. Duan F., Fang Z., Sun Y., Ye S.: Real–time vibration measurement technique based on tip – timing for rotating blades. Opto-Electronic Energineering 2005 30 (1) 29-31 htt://www.paper.edu.cn
- 10.2478/v10041-009-0005-yDownloaded from De Gruyter Online at 09/09/2016 05:18:57PM
via free access
Paweł LINDSTEDT, Edward ROKICKI, Henryk BOROWCZYK, Paweł MAJEWSKI
24
4. von Flotow A., Mercadal H.: Turbine rotor health management with blade-tip sensors; From Laboratory Tool To Fielded System. www hoodtech tlood River or USD 2000
5. High Cycle Fatigue S & program 1997 Annual Report http://stimet.dtic.mil 6. High Cycle Fatigue S & program 1998 Annual Report http://stimet.dtic.mil 7. High Cycle Fatigue S & program 1999 Annual Report http://stimet.dtic.mil 8. High Cycle Fatigue S & program 2000 Annual Report http://stimet.dtic.mil 9. High Cycle Fatigue S & program 2001 Annual Report http://stimet.dtic.mil
10. High Cycle Fatigue S & program 2002 Annual Report http://stimet.dtic.mil 11. Klein B.: Non-Contact Vibration measurements Turbocharges Turbine and Compres-
sor Blades. Proceedings of 1st EVI-GTI International Conference on Gas Turbine In-strumentation, Barcelona 2004
12. Kotowski A., Lindstedt P.: The using of signals of impulse acoustic response in tests of rotor blades in stationary conditions. The International Symposium on Stability Control of Rotating Machinery. ISCORMA 4, Calgary Alberta Canada 2007
13. Kurowski W.: Podstawy teoretyczne komputerowego miernictwa systemów mecha-nicznych. (Theoretical fundamentals for computer-aided measurement techniques in mechanical systems) Wyd. Politechniki Białostockiej, Białystok 1994
14. Lindstedt P., Kotowski A.: Basics for innovations in vibroacoustic diagnostics of trans-port machines rotor blades. The Archives of Transport Vd XVI No4 2004
15. Lindstedt P.: Application of the Correlation Function and Fourier Transform to Evalua-tion of the Technical Condition Demonstrated by Rotor Blades During the Operation Process. Journal of KONES, Vol. 16 No 2, Warsaw 2009
16. Roberts J.P.: Comparison of Tip Timing with strain gauges for rotor blade vibration measurement. Proceedings of lecture series on Tip Timing an Tip Clearance Problems in Turbomachines Von Karman Institute, Belgium 2007
17. Szabatin J.: Podstawy teorii sygnałów (Basics for signal theory), WKŁ Warszawa 2000,
18. Szczepanik R., Przysowa R.: Wykonanie badań i pomiarów drgań łopatek metodą bezstykową w odwirowni ALSTOM Power w Elblągu. Sprawozdanie ITWL nr 36/3 /2004 (Execution of tests and measurements of blade vibrations by means of a con-tactless methods on the rotation bench of ALSTOM Power in Elbląg. Report of AFIT No 36/3/2004). Warszawa 2004
19. Washburn R. S.: A State of The Art PC based NSMS Analysis Software Package. http://www.agilismeasurementsystems.com.
20. Zieliński M., Ziller G.: Non-contact Blade Vibration measurement system for aero en-gine application. 17th International Symposium on Airbreathing Engines, September 4-9 2005 Munich Germany Paper No ISABE – 2005-1220.
21. http://www.mtu.de/en/technologies/engineering_news/development/noncontact_blade_vibration.pdf
- 10.2478/v10041-009-0005-yDownloaded from De Gruyter Online at 09/09/2016 05:18:57PM
via free access
Copyright © 2022 FDOKUMEN