Simulation of fatigue failure in composite axial compressor blades
MONITORING CRACK PROPAGATION IN TURBINE BLADES CAUSEDBY THERMOSONICSG. Bolu, A. Gachagan, G. Pierce, G. Harvey, and L. Choong Citation: AIP Conf. Proc. 1211, 1654 (2010); doi: 10.1063/1.3362267 View online: http://dx.doi.org/10.1063/1.3362267 View Table of Contents: http://proceedings.aip.org/dbt/dbt.jsp?KEY=APCPCS&Volume=1211&Issue=1 Published by the American Institute of Physics. Related ArticlesInfluence of a localized defect on acoustic field correlation in a reverberant medium J. Appl. Phys. 110, 084906 (2011) Full-field imaging of nonclassical acoustic nonlinearity Appl. Phys. Lett. 91, 264102 (2007) Laser ablation of solid substrates in a water-confined environment Appl. Phys. Lett. 79, 1396 (2001) Estimation of lubricant thickness on a magnetic hard disk using acoustic emission Rev. Sci. Instrum. 71, 1915 (2000) A theoretical model for acoustic emission sensing process in contact/near-contact interfaces of magneticrecording system J. Appl. Phys. 85, 5609 (1999) Additional information on AIP Conf. Proc.Journal Homepage: http://proceedings.aip.org/ Journal Information: http://proceedings.aip.org/about/about_the_proceedings Top downloads: http://proceedings.aip.org/dbt/most_downloaded.jsp?KEY=APCPCS Information for Authors: http://proceedings.aip.org/authors/information_for_authors
Downloaded 23 Nov 2012 to 94.196.191.139. Redistribution subject to AIP license or copyright; see http://proceedings.aip.org/about/rights_permissions
MONITORING CRACK PROPAGATION IN TURBINE BLADES CAUSED BY THERMOSONICS G. Bolu1, A. Gachagan1, G. Pierce1 G. Harvey2, and L. Choong3
1Centre for Ultrasonic Engineering, Department of Electronic and Electrical Engineering, University of Strathclyde, Glasgow, G1 1XW, UK
2Rolls-Royce plc, East Kilbride, Scotland, UK 3Vibrant NDT Ltd, Smithfield, Sheffield, S3 7AR, UK
ABSTRACT. High-power acoustic excitation of components during a thermosonic (or Sonic IR) inspection may degrade the structural integrity of the component by propagating existing cracks. Process Compensated Resonance Testing (PCRT) technology can be used to detect changes in material properties by comparing a components resonant spectra to a reference spectra at regular intervals after systematic exposure to high-power excitation associated with thermosonic inspection. The objective of this work is to determine whether a typical thermosonic inspection degrades the structural integrity of a turbine blade. In this work, the resonant spectra of six cracked and six uncracked turbine blades are captured before and after a series of thermosonic inspections. Next, these spectra are analyzed using proprietary software for changes in resonant behavior. Results from this work indicate no change in blade resonant behavior for a typical thermosonic inspection.
Keywords: Thermosonic, PCRT, Turbine Blades, Crack Propagation PACS: 43.40.+s, 46.40.Ff, 46.50.+a
INTRODUCTION Gas turbine engines are the power plants of an aircraft that provide the necessary thrust for operation [1]. Key to the operation of these engines are turbine blades experiencing high loads and temperatures (up to 1600ºC) [1]. In these conditions, blades are liable to fatigue cracks, creep and corrosion, which are detrimental to their life cycle. Therefore, these blades are inspected at pre-designated times to maintain their performance and reliability. Thermosonics is seen as a quick NDT screening method capable of detecting cracks in metallic components [2-4]. It employs high-power ultrasound and thermal imaging for crack detection, as illustrated in Figure 1. An ultrasonic horn excites a component, the high frequency vibrations injected into the component causes crack faces to rub and generate heat, which can be detected using an IR camera [2]. These ultrasonic horns, although designed plastic welding, have been successful at generating the strain levels required for
1654
Downloaded 23 Nov 2012 to 94.196.191.139. Redistribution subject to AIP license or copyright; see http://proceedings.aip.org/about/rights_permissions
CREDIT LINE (BELOW) TO BE INSERTED ON THE FIRST PAGE OF EACH PAPER EXCEPT FOR ARTICLES ON PP. 295-302, 427-434, 910-917, 1021-1028, 1233-1240, 1452-1459,
1887-1894, and 2015-2022.
CP1211, Review of Quantitative Nondestructive Evaluation Vol.29, edited by D. O. Thompson and D. E. Chimenti
© 2010 American Institute of Physics 978-0-7354-0748-0/10/$30.00
FOR ARTICLES ONLY ON 295-302, 427-434, 910-917, 1021-1028, 1233-1240, 1452-1459, 1887-1894, and 2015-2022.
USE THE CREDIT LINE (ATTACHMENT II) BELOW:
CP1211, Review of Quantitative Nondestructive Evaluation Vol.29, edited by D. O. Thompson and D. E. Chimenti
2010 American Institute of Physics 978-0-7354-0748-0/10/$30.00

FIGURE 1. Typical thermosonic setup. crack detection. However, the high-power vibrations injected into components can degrade its structural integrity by propagation of existing cracks [5] or cause changes to the micro-structure of the component. Monitoring such changes using conventional NDT methods is not trivial due to limitations in crack sizing and inability to detect micro-structural changes. However, a novel NDT method called Process Compensated Resonance Testing (PCRT) offers a potential solution. PCRT was initially developed in the late 1980’s at Los Alamos National Laboratories [6]. It has since been employed successfully in the automotive manufacturing industry for detecting structurally unacceptable components [6]. PCRT accurately measures the resonant frequencies of a component, which are directly related to the components structural properties: stiffness (Young’s Modulus and cross-sectional area) and mass (volume and density) [6, 7]. This relationship is described in Equation 1. This equation holds true for an undamped single degree-of-freedom system; however, it can be used as an approximation for complex systems [7]. The presence of a defect reduces the stiffness of a component, which in turn decreases the components resonant frequencies.
(1)
This paper presents results from an initial investigation into the effect of thermosonic inspection on the structural integrity of turbine blades. The objective is to determine whether a typical or routine thermosonic inspection degrades the integrity of a turbine blade. The resonant spectra of six cracked and six uncracked turbine blades are captured before and after a series of thermosonic inspections, after which the spectra are analyzed, using proprietary software, for changes in resonant frequencies [6]. Results from this work show no apparent change in blade resonant behavior after a typical thermosonic inspection. However, a clear change in resonant behavior was observed for a cracked blade exposed to a very high number of inspections.
1655
Downloaded 23 Nov 2012 to 94.196.191.139. Redistribution subject to AIP license or copyright; see http://proceedings.aip.org/about/rights_permissions

METHODOLOGY Experimental Setup The experimental setup used to conduct the thermosonic inspections is shown in Figure 2(a). The ultrasonic excitation source is a Sonotronic [8] welding system, which consists a 400 W generator and a 40 kHz UST600-40 transducer with a horn attached. A blade is placed in a cork holder and then secured in the clamp. The cork holder acts a vibration isolation material, preventing the energy generated in the component dissipating to other parts of the experimental rig. The horn tip is coupled to the root of the blade with 107 N of static force applied using the tensioning arrangement associated with the transducer. A layer of electrical tape is used as a coupling material between the horn tip and blade to facilitate good contact for efficient energy transfer. The purpose of the microphone shown in Figure 2(a) is for vibration measurement; however, it was not required in this study. The turbine blades set out for this study are from the same aero-engine (Tay 650) and a representative sample is shown in Figure 2(b). The blades are made of high strength nickel alloy, 78 mm in height and 37 mm at the widest point (platform). The cracked blades have cracks in the shroud area, as indicated in Figure 2(c). It is should be noted that an IR camera is missing from the thermosonic setup shown in Figure 2(a). This is because only the acoustic excitation aspect was required to carry out this study.
(b)
(a) (c)
FIGURE 2. (a) Experimental thermosonics setup (b) turbine blade inspected (c) crack location.
1656
Downloaded 23 Nov 2012 to 94.196.191.139. Redistribution subject to AIP license or copyright; see http://proceedings.aip.org/about/rights_permissions
(a) (b)
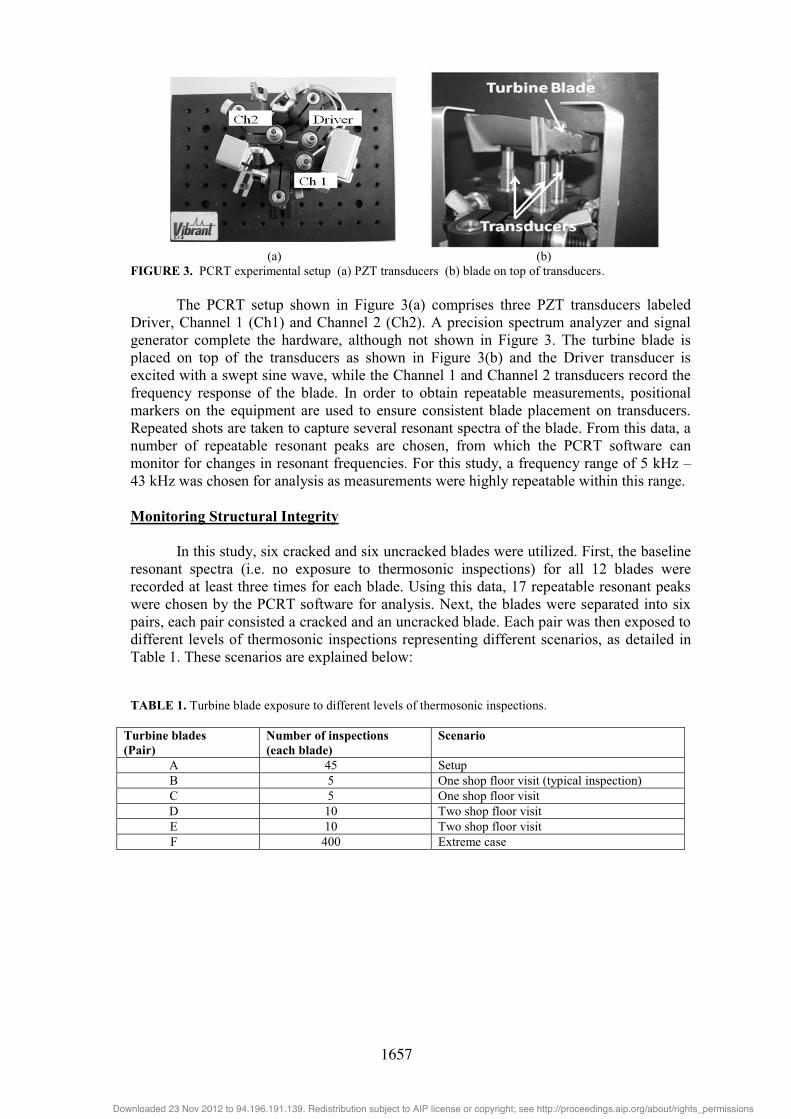
FIGURE 3. PCRT experimental setup (a) PZT transducers (b) blade on top of transducers. The PCRT setup shown in Figure 3(a) comprises three PZT transducers labeled Driver, Channel 1 (Ch1) and Channel 2 (Ch2). A precision spectrum analyzer and signal generator complete the hardware, although not shown in Figure 3. The turbine blade is placed on top of the transducers as shown in Figure 3(b) and the Driver transducer is excited with a swept sine wave, while the Channel 1 and Channel 2 transducers record the frequency response of the blade. In order to obtain repeatable measurements, positional markers on the equipment are used to ensure consistent blade placement on transducers. Repeated shots are taken to capture several resonant spectra of the blade. From this data, a number of repeatable resonant peaks are chosen, from which the PCRT software can monitor for changes in resonant frequencies. For this study, a frequency range of 5 kHz – 43 kHz was chosen for analysis as measurements were highly repeatable within this range. Monitoring Structural Integrity In this study, six cracked and six uncracked blades were utilized. First, the baseline resonant spectra (i.e. no exposure to thermosonic inspections) for all 12 blades were recorded at least three times for each blade. Using this data, 17 repeatable resonant peaks were chosen by the PCRT software for analysis. Next, the blades were separated into six pairs, each pair consisted a cracked and an uncracked blade. Each pair was then exposed to different levels of thermosonic inspections representing different scenarios, as detailed in Table 1. These scenarios are explained below: TABLE 1. Turbine blade exposure to different levels of thermosonic inspections.
Turbine blades (Pair)
Number of inspections (each blade)
Scenario
A 45 Setup B 5 One shop floor visit (typical inspection) C 5 One shop floor visit D 10 Two shop floor visit E 10 Two shop floor visit F 400 Extreme case
1657
Downloaded 23 Nov 2012 to 94.196.191.139. Redistribution subject to AIP license or copyright; see http://proceedings.aip.org/about/rights_permissions

Setup: This case was used for the initial setup and evaluation of the PCRT system. Shop floor visit: This is a ‘typical inspection’ case, which represents the maximum
number of inspections a blade would be exposed to in a real inspection. Extreme: This case was completed to ensure the blades were over-exposed to high-
power acoustic excitation in order to induce a change in resonance behavior. For this study, one inspection is defined as exciting a blade for one second, in combination with the other operating parameters set out for thermosonic inspection. Furthermore, prior to this study, these operating parameters were used successfully to detect the cracks in the cracked blades, hence, the operating parameters were deemed adequate for this study. After exposing the blades to different levels of thermosonic inspections, the resonance spectra of the blades were again recorded (at least two times), and then analyzed for changes in resonant frequencies. RESULTS AND DISCUSSION The precision of the PCRT equipment is ± 0.02% in frequency measurements, giving a maximum error of about ± 9 Hz at 43 kHz. Changes in resonant frequencies were calculated by taking the difference between the frequencies measured before and after thermosonic exposure. Therefore, the maximum possible error for a frequency shift is ± 18 Hz, which was used later in this paper. For the 10 different blades exposed to a typical inspection (i.e. 5 and 10 inspections) and 45 inspections, only 4 resonant peaks out of a total of 170 peaks analyzed had frequency shifts, which were less than 45 Hz. These frequency shifts were small compared to the affected resonant frequencies. In addition, the number of affected resonant peaks was also small compared to the total number analyzed. This was also the case for the uncracked blade exposed to 400 inspections, which had similar frequency shifts in 3 out of 17 peaks. However, there were higher frequency shifts seen in the resonant spectra for the cracked blade exposed to 400 inspections. Figures 4 – 6 shows the resonant spectra (5 kHz – 43 kHz) for this blade with the 17 resonance peaks selected for analysis. These spectra are split into three frequency bands for ease of visualization. In each Figure, the top spectrum was captured before thermosonic exposure and the other two captured after thermosonic exposure. From these Figures, frequency shifts can be seen in peaks 6, 7, 9, 10, 13, 14, 16 and 17, with some others more difficult to visualize. This is further illustrated in Figures 7 and 8. The former shows the frequencies corresponding to each numbered resonant peak, while the latter, the frequency shifts after thermosonic exposure. The maximum frequency shift in Figure 8 is 343 Hz, which is up to 10 times greater than the frequency shifts seen for the blades exposed to 5, 10 and 45 inspections. In addition, 15 out of 17 peaks were affected. It is not certain whether this change in resonance behavior is linked to propagation of the existing crack or initiation of a new one, as crack length was not monitored in this study. However, these results strongly indicate changes to the structural properties of the blade and this may be attributed to the 400 thermosonic inspections. This study was an initial investigation and a second phase is planned, in which crack size will be monitored.
1658
Downloaded 23 Nov 2012 to 94.196.191.139. Redistribution subject to AIP license or copyright; see http://proceedings.aip.org/about/rights_permissions

FIGURE 4. Resonant spectra (5 kHz – 15.95 kHz) for cracked blade (Pair F) before and after exposure to 400 thermosonic inspections.
FIGURE 5. Resonant spectra (15.8 kHz – 31 kHz) for cracked blade (Pair F) before and after exposure to 400 thermosonic inspections.
FIGURE 6. Resonant spectra (30.8 kHz – 43 kHz) for cracked blade (Pair F) before and after exposure to 400 thermosonic inspections.
Before
After
Before
After
After
Before
1659
Downloaded 23 Nov 2012 to 94.196.191.139. Redistribution subject to AIP license or copyright; see http://proceedings.aip.org/about/rights_permissions

FIGURE 7. Resonant peaks for cracked blade in Pair F, before (Series 1) and after (Series 2 & 3) exposure to 400 thermosonic inspections.
FIGURE 8. Series 1 and 2 correspond to the frequency shift of the two captured resonant frequencies after thermosonic exposure, for cracked blade exposed to 400 thermosonic inspections.
1660
Downloaded 23 Nov 2012 to 94.196.191.139. Redistribution subject to AIP license or copyright; see http://proceedings.aip.org/about/rights_permissions

CONCLUSIONS This paper presents an initial investigation into the effect of thermosonic inspection on the structural integrity of turbine blades. PCRT accurately measured the resonance pattern of six cracked and six uncracked turbine blades before and after exposure to a series of thermosonic inspections. Results show no apparent change in the resonance behavior of blades exposed to a typical thermosonic inspection. However, considerable changes were observed in the resonance pattern for the cracked blade exposed to 400 thermosonic inspections, which can be considered to be extreme. Results from this study demonstrates thermosonics as a safe NDT method for turbine blades, assuming the blade under test is not over-exposed to high power acoustic excitation. ACKNOWLEDGEMENTS The authors will like to acknowledge the support of the Engineering and Physical Sciences Research Council (EPSRC) and Rolls-Royce plc. REFERENCES
1. Rolls-Royce, “The Jet Engine”, Rolls-Royce Technical Publications, UK, 2005. 2. X. Han, L. D. Favro and R. L. Thomas,“Recent Developments in Sonic IR
Imaging” in Review of Progress in Quantitative Nondestructive Evaluation 22, edited by D. O. Thompson and D. E. Chimenti, AIP Conference Proceedings vol. 700, American Institute of Physics, Melville, NY (2003), pp. 500-505.
3. J. DiMambro, D. M. Ashbaugh, C. L. Nelson and F. W. Spencer, “Sonic Infrared (IR) Imaging and Fluorescent Penetrant Inspection Probability of Detection POD (Comparison)” in Review of Progress in Quantitative Nondestructive Evaluation, edited by D. O. Thompson and D. E. Chimenti, AIP Conference Proceeding, vol. 894, American Institute of Physics, Melville, NY (2006), pp.463-470.
4. W. Hassan, C. Homma, Z. Wen, F. Vensel and B. Hogan, “Detection of Tight Fatigue Cracks at the Root of Dampers in Fan Blades using Sonic IR Inspection: a Feasibility Demonstration” in Review of Progress in Quantitative Nondestructive Evaluation 26, edited by D. O. Thompson and D. E. Chimenti, AIP Conference Proceedings vol. 894, American Institute of Physics, Melville, NY (2007), pp. 455-462.
5. J. C. Chen, W. T. Riddell, K. Lick, and C. Wong, “Fracture mechanics of crack growth during Sonic-IR inspection” in Review of Progress in Quantitative Nondestructive Evaluation 26, AIP Conference Proceedings vol. 894, American Institute of Physics, Melville, NY (2007), pp. 507-514.
6. L. Hunter and R. Nath, in Quality NDT Conference, Clearwater, Florida, July 2008 7. C. Beards, “Engineering Vibration Analysis with Application to Control Systems”,
Butterworth-Heinemann, 1995, pp. 11-93. 8. Sonotronic USG400-40 welding system, User Manual, Sonotronic Ultrasonic
Technology UK.
1661
Downloaded 23 Nov 2012 to 94.196.191.139. Redistribution subject to AIP license or copyright; see http://proceedings.aip.org/about/rights_permissions
Copyright © 2022 FDOKUMEN