Histological features and histochemistry of the mucous glands ...
Upload
independentCategory
view
3download
0
ORIGINAL ARTICLE
Role of MRI in osteosarcoma for evaluation and predictionof chemotherapy response: correlationwith histological necrosis
Jyoti Bajpai & Shivanand Gamnagatti & Rakesh Kumar & Vishnubhatla Sreenivas &
Mehar Chand Sharma & Shah Alam Khan & Shishir Rastogi & Arun Malhotra &
Rajni Safaya & Sameer Bakhshi
Received: 21 June 2010 /Revised: 4 September 2010 /Accepted: 4 October 2010 /Published online: 27 October 2010# Springer-Verlag 2010
AbstractBackground Histological necrosis, the current standard forresponse evaluation in osteosarcoma, is attainable afterneoadjuvant chemotherapy.Objective To establish the role of surrogate markers ofresponse prediction and evaluation using MRI in the earlyphases of the disease.Materials and methods Thirty-one treatment-naïve osteo-sarcoma patients received three cycles of neoadjuvant
chemotherapy followed by surgery during 2006–2008. Allpatients underwent baseline and post-chemotherapy conven-tional, diffusion-weighted and dynamic contrast-enhancedMRI. Taking histological response (good response ≥90%necrosis) as the reference standard, various parameters ofMRIwere compared to it. A tumor was considered ellipsoidal;volume, average tumor plane and its relative value (averagetumor plane relative/body surface area) was calculated usingthe standard formula for ellipse. Receiver operating charac-teristic curves were generated to assess best threshold andpredictability. After deriving thresholds for each parameter inunivariable analysis, multivariable analysis was carried out.Results Both pre-and post-chemotherapy absolute andrelative-size parameters correlated well with necrosis.Apparent diffusion coefficient did not correlate withnecrosis; however, on adjusting for volume, significantcorrelation was found. Thus, we could derive a newparameter: diffusion per unit volume.Conclusion In osteosarcoma, chemotherapy response canbe predicted and evaluated by conventional and diffusion-weighted MRI early in the disease course and it correlateswell with necrosis. Further, newly derived parameterdiffusion per unit volume appears to be a sensitivesubstitute for response evaluation in osteosarcoma.
Keywords Neoadjuvant chemotherapy . Response .
Osteosarcoma .MRI . Children
Introduction
In osteosarcoma, chemotherapy-induced necrosis is awell-established predictive marker for prognosis. Post-chemotherapy tumor necrosis of more than 90% is
J. Bajpai : S. Bakhshi (*)Department of Medical Oncology,All India Institute of Medical Sciences,Dr. B. R. A. Institute Rotary Cancer Hospital,New Delhi 110029, Indiae-mail: [email protected]
S. GamnagattiDepartment of Radiodiagnosis,All India Institute of Medical Sciences,New Delhi, India
R. Kumar :A. MalhotraDepartment of Nuclear Medicine,All India Institute of Medical Sciences,New Delhi, India
V. SreenivasDepartment of Biostatistics,All India Institute of Medical Sciences,New Delhi, India
M. C. Sharma :R. SafayaDepartment of Pathology, All India Institute of Medical Sciences,New Delhi, India
S. A. Khan : S. RastogiDepartment of Orthopedics,All India Institute of Medical Sciences,New Delhi, India
Pediatr Radiol (2011) 41:441–450DOI 10.1007/s00247-010-1876-3

associated with significantly higher survival rate [1, 2].The degree of necrosis at the time of definitive surgeryseems to reflect either the effectiveness of the chemo-therapy regimen or the properties inherent to sometumors that make them intrinsically less responsive tochemotherapy. However, as necrosis can only be assessedafter completion of neoadjuvant chemotherapy, there is arisk of developing resistant clones with continuation ofineffective chemotherapy. Thus, it would be desirable tohave a non-invasive imaging surrogate to predictresponse to neoadjuvant chemotherapy before undergoingsurgical resection.
To define tumor response, World Health Organization(WHO) criteria [3] based on conventional imaging modal-ities such as CT and MRI have been described. Conven-tional anatomical imaging measures the size parameters.However, the cutoff criteria of 50% or 30% reduction intumor size on CT and MRI is an arbitrary percentage notbased on outcome studies. In addition, several cycles ofchemotherapy are required before CT or MRI can assessresponse. These limitations of conventional imaging can beovercome by functional imaging techniques such asdiffusion-weighted and dynamic contrast-enhanced MRI,which have the ability to detect response at the molecularlevel [4–8].
It would be useful to have surrogate markers of responseprediction at diagnosis in osteosarcoma using MRI to avoidineffectual chemotherapy in early disease phases. In viewof this, we conducted a prospective study in osteosarcomawherein we assessed anatomical as well as functionalaspects a tumor at baseline and post-neoadjuvant chemo-therapy by MRI scan and correlated the same withhistological necrosis.
Materials and methods
This prospective, diagnostic study was performed accord-ing to the approved guidelines of the institutional ethicalcommittee from January 2006 to December 2008. Awritten informed consent was obtained from all patientsprior to enrollment in this study. Treatment-naiveosteosarcoma patients with adequate organ function forreceiving neoadjuvant chemotherapy were eligible for thestudy. Patients with other serious concurrent systemicdisorders that would compromise the safety of the patientor the patient’s ability to complete the study wereexcluded. A total of 31 osteosarcoma patients wererecruited for the study with a median age of 17 years(range: 5–66 years); male-to-female ratio was 25:6, and23 out of 31 (74%) patients were non-metastatic.Osteoblastic osteosarcoma was the most common histo-pathological subtype in 14 patients (45%). The lower end
of femur was the most common site, seen in 13 (42%)patients. Patient distribution according to AJCC staging[9] was as follows: IIa in 9 (29%), IIb in 14 (45%), stageIVa in 2 (6%) and stage IV b in 6 (19%) patients (Table 1).After a detailed history and examination, all patientsunderwent conventional as well as diffusion-weightedand dynamic contrast-enhanced MRI for evaluation ofthe primary site and chest CT and bone scans formetastatic work-up. Neoadjuvant chemotherapy includedcisplatin (40 mg/m2) and doxorubicin (25 mg/m2) both for3 days, administered at three weekly intervals for threecycles. All patients underwent follow-up MRI after 3 to4 weeks following cycle 3 of neoadjuvant chemotherapy.All patients then underwent radical surgical resection ofthe tumor (limb salvage or amputation) within 1–4 weeksof the MRI. The MRI results at baseline and followingneoadjuvant chemotherapy were evaluated with referenceto the final histologically determined percentage ofnecrosis following surgery.
Table 1 Patient characteristics
Variable
Gender (male: female) 25:6
Age Years
Median age (range) 17 (5–66)
Mean age ± SD* 20±11.9
Metastatic: localised 8:23
Histological type Number of patients (%)
Osteoblastic 14 (45)
Mixed (osteoblastic + chondroblastic) 8 (25)
Chondroblastic 4 (13)
Mixed (osteoblastic + fibroblastic) 2 (7)
Others 3 (10)
Primary sites Number of patients (%)
Lower end of femur 13 (42)
Upper end of tibia 9 (29)
Upper end of fibula 3 (10)
Others 2 (6)
Axial skeleton 4 (13)
Metastasis (n=8) Number of patients (%)
Lung (isolated) 2 (25)
Lung + bone 2 (25)
Lymph nodes only 4 (50)
Stage Number of patients (%)
II a 9 (29)
II b 14 (45)
IV a 2 (7)
IV b 6 (19)
S.D. standard deviation
442 Pediatr Radiol (2011) 41:441–450

MRI scan procedure
MRI was performed on 1.5-T system (Magnetom SonataMaestro and Avanto scanners; Siemens Medical Solu-tions, Erlangen, Germany) using body-array surface coilor an extremity coil. A standard examination was doneincluding conventional T1-weighted, fat-saturated T2-weighted, and gradient echo sequences in axial, sagittaland coronal planes. The extent of marrow involvementwas evaluated by T1-W sequence, soft-tissue extent byfat-saturated T2-W sequence and vascular structure bygradient echo sequence.
Plane of imaging, sequences, slice thickness and thefield of view were selected according to the size of theanatomical region. Dynamic MRI was performed using3-D T1-weighted gradient echo volumetric interpolatedbreath-hold sequences. Gadopentetate dimeglumine wasused as a paramagnetic contrast agent at a concentrationof 0.1 mmol/L/kg and a flow rate of 2.0 mL/s through aperipheral venous catheter. A 20-mL saline flush wasadministered after contrast injection to ensure completemixing of the bolus on delivery. After contrast injection,this sequence was repeated every 8 s over a period of3 min. In each cycle, a minimum of six slices was usedto acquire the dynamic MRI images across the maximumdimensions of the tumor. Region of interest was chosenas the solid enhancing areas to generate the time–intensity curves using custom-made software. The curves
were classified as persistent (continuous rise), plateau(rapid rise followed by flattening) and washout (rapidrise followed by early or delayed fall) [8].
Patients underwent diffusion-weighted imaging using echoplaner sequences with varying gradient strengths (b values of0, 500 and 1,000) and an apparent diffusion coefficient (ADC)map was obtained in the region of interest. ADC maps wereanalyzed for the areas of restricted diffusion by means ofregion of interest, which was placed in the tumor and thenecrotic areas in multiple slices, the ADC value was recordedin different regions of the tumor; however, for statisticalpurposes we took the average value of the ROIs. Mean tumornecrosis was assessed in percentage by qualitative analysisbased on visual inspection method and compared withhistological necrosis.
Considering all tumor lesions as ellipsoidal, tumorvolumes were calculated with the standard mathematicalformula for ellipse, i.e. volume ¼ 4=3� p � abc (wherea = length/2, b = breadth/2, c = depth/2) (Fig. 1). A newlyderived parameter, diffusion per unit volume, was gener-ated by dividing the ADC value by the correspondingtumor volume (ADC/volume). Similarly, average tumorplane was calculated by the standard formula for ellipse,i.e. averagetumorplane ¼ p � ab ([where a = length/2, b =breadth or depth, whichever is larger/2]). Further, relative-average tumor plane was calculated at baseline by dividingindividual average tumor plane values by the respectivebody surface area.
Fig. 1 Spot image of MRIviewer shows tumor volumemeasurement. Measurementswere taken in at least twoorthogonal planes. In theseplanes, maximumtransverse and AP diameter (a)and maximum length (b) weremeasured
Pediatr Radiol (2011) 41:441–450 443

Histopathological response assessment
Two experienced pathologists, who were blinded to theclinical status and MRI results, evaluated all surgicalresection specimens. On histopathological examination,the tumor response was assessed on the basis of thepresence and extent of necrosis. Tumor necrosis wasgraded as grade I if 0–49%, grade II if 50–89%, grade IIIif 90–99% and grade IV if 100% necrosis was present.Patients with grades III and IV necrosis (≥90% necrosis)are considered good responders and those with grades Iand II necrosis (<90% necrosis) poor responders [10].
Statistical analysis
Stata software version 9.1 was used for data analysis. Takinghistopathological necrosis ≥90% as the standard for goodresponders, corresponding parameters of MRI were comparedwith response, and sensitivity and specificity were calculatedalong with 95% confidence intervals. Receiver operatingcharacteristic (ROC) curves were generated to assess the bestthreshold and the sensitivity and specificity of the respectiveparameters at that threshold value to predict good histologicalresponse. As sensitivity and specificity are equally important,the value of the best threshold is the cut-off value at which thesensitivity and specificity are almost equal. After deriving thebest threshold values for each parameter in univariable
analysis, using the respective cut-offs, each parameter wasdivided into two categories and stepwisemultivariable logisticregression analysis was carried out.
Results
Histopathology and MRI parameters at baselineand post-chemotherapy
On pathological examination, 21/31 (68%) were poorresponders and the remaining 10 (32%) were good respond-ers (Figs. 2 and 3). All 31 patients underwent surgery; in 23patients, limb salvage surgery could be performed whileeight patients underwent amputation. The mean values ofvarious parameters as obtained in the MRI pre- and post-chemotherapy are shown in Table 2. In our study, the meanpre-chemotherapy ADC value was 1.29±0.22 mm2/s(range 0.92–1.67 mm2/s) and post-chemotherapy it was1.9±0.37 mm2/s (range 1.08 to 2.24 mm2/s).
Comparison of MRI scan and histopathology
We generated best threshold values of various MRI parame-ters as determined by the ROC curve and the sensitivity andspecificity of the respective parameters at each threshold valueto predict good histological response (Figs. 4 and 5). Area
Fig. 2 MRI scans andhistopathology of a goodresponder. a Pre-chemotherapycoronal post-gadolinium T1-Wfat-saturated MRI shows alteredmarrow signal intensityinvolving the proximalmetaphysis, growth plate andepiphysis of left humerusassociated with a largesoft-tissue component withminimal necrosis. bPost-chemotherapy coronalpost-gadolinium T1-Wfat-saturated MRI. Compared tothe pre-chemotherapy image,there is no significant reductionin size of soft-tissue component;however, the soft-tissuecomponent shows significantincrease in amount of necrosis.Photomicrographs at (c) H&E ×400 and (d) H&E × 200 depictcomplete necrosis of differentcomponents of osteosarcoma(arrows). No viable tumor isseen
444 Pediatr Radiol (2011) 41:441–450

under curve (AUC) is used to determine the predictionpower of the given variable; for example, the area under theROC curve for baseline tumor volume predicting histolog-ical necrosis was 83% (95% CI=68–97%), which impliesthat histological necrosis in 83% of the patients could bedetermined correctly by baseline tumor volume. Further, at athreshold value of 204 cc, the sensitivity and specificity of
predicting a good histological response were 80% and76.2%, respectively.
In conventional MRI pre- and post-neoadjuvant chemo-therapy tumor volume, pre- and post-chemotherapy averagetumor plane and pre-chemotherapy relative-average tumorplane were found to have significant association withhistological necrosis (Table 3). In diffusion-weighted MRI,
Fig. 3 MRI scans and histopathology of a poor responder. PreChemotherapy Coronal T1W (a) and Axial Post Gadolinium T1W‐Fatsaturated MR images (b) showing altered marrow signal intensityinvolving the proximal metaphysis, growth plate and epiphysis of tibiaassociated with mild soft tissue component displacing the poplitealvessels (arrow). Post chemotherapy Coronal T1W (c) and Axial T1W‐
Fat saturated MR images (d) showing no significant radiologicalimprovement compared to the prechemotherapy MR images andvessels are displaced (arrow). Photomicrographs showing viablecellular areas, tumor necrosis 10% (arrow) in H&E x 200 (e) andatypical mitotic figures (arrow) in H&E x 400 (f)
Variable Pre-chemotherapy Post-chemotherapy
Mean max dimension in cm ± (SD) 10.87 (4.67) 8.49 (3.41)
Mean intramedullary extent in cm ± (SD) 11.35 (5) 10.42 (4.89)
Mean volume in cc ± (SD) 470 (477) 300 (317)
Mean necrosis ± (SD) 19 (18) 46 (32)
ADC (mm2/s) ± (SD) 1.29 (0.22) 1.9 (0.37)
Mean diffusion per unit volume (ADC/volume) ± (SD) 15 (60) 18 (66)
Time intensity curve:
Plateau 29 22
Washout 2 3
Persistent 0 6
Table 2 MRI results
Pediatr Radiol (2011) 41:441–450 445

pre- and post-chemotherapy diffusion per unit volume aswell as its change following chemotherapy showed signifi-cant association with histological necrosis (Table 3). Inmultivariable logistic regression analysis, post-chemotherapytumor volume was identified as an independent predictor ofhistological necrosis with an odds ratio of 38.25 (CI: 3.70–395.23). The variables wherein the sensitivity and specificityare <50% are considered to have poor predictability fordetermining histological necrosis. Based on these criteria, thevariables that did not significantly correlate with histological
necrosis included change in tumor volume, ADC andqualitative analysis based on change in pattern of time–intensity curves from baseline MRI to that obtained in theMRI following chemotherapy.
Discussion
The current standard of chemotherapy response assessmentis histological necrosis, which is available only after
Sen
siti
vity
Sen
siti
vity
Sen
siti
vity
Sen
siti
vity
1-SpecificityArea under ROC curve=0.8333
1- SpecificityArea under ROC curve=0.8476
1-SpecificityArea under ROC curve=0.8452
0.00 0.50 0.75
1-SpecificityArea under ROC curve=0.8238
1.000.25
0.00 0.50 0.75 1.000.25
0.00 0.50 0.75 1.000.25
0.00 0.50 0.75 1.000.25
0.00
0.50
0.75
1.00
0.25
0.00
0.50
0.75
1.00
0.25
0.00
0.50
0.75
1.00
0.25
0.00
0.50
0.75
1.00
0.25
a b
c d
Fig. 4 Correlation between conventional MRI parameters and histolog-ical necrosis. a Volume 1 versus histological necrosis. The area underthe receiver operating characteristic curve for baseline tumor volumepredicting histological necrosis is 83% (95% CI=68–97%), whichimplies that histological necrosis in 83% of the patients could bedetermined correctly by baseline tumor volume. Best threshold value asdetermined by receiver operating characteristic curves for baselinetumor volume was 204 cm2 and at this value the sensitivity andspecificity of predicting a good histological response were 80% and76.2%, respectively, and positive and negative predictive values were62% and 90%, respectively. By “best threshold,” we mean the cutoffvalue at which the sensitivity and specificity are equal or near equal.This is generally done if we consider sensitivity and specificity equally
important. b Volume 2 versus histological necrosis (AUC=85%, 95%CI=70–99%). Post-chemotherapy volume at the threshold value of141 cm2 could predict good histological response with a sensitivity of90%, specificity of 86%, PPV of 62% and NPV of 90%. c Pre-chemotherapy MR average tumor plane versus histological necrosisAUC=85%, 95% CI=70–98%. Pre-chemotherapy average tumor planeat the threshold value of 51 cm2 could predict good histologicalresponse with a sensitivity of 76%, specificity of 80%, PPVof 62% andNPV of 89%. d Post-chemotherapy MR average tumor plane versushistological necrosis (AUC=82%, 95% CI=65–99%). Pre-chemotherapy average tumor plane at the threshold value of43.41 cm2 could predict good histological response with a sensitivityof 90%, specificity of 86%, PPV of 75% and NPV of 95%
446 Pediatr Radiol (2011) 41:441–450

administration of neoadjuvant chemotherapy and resectionof tumor. Further, tailoring of adjuvant chemotherapy basedon histological response has been unsatisfactory invarious studies [11, 12]. Tumor size is available atbaseline and, thus, if size is a criterion to determineprognosis, then risk-adapted therapy can be initiated atbaseline and unnecessary exposure to ineffectual chemo-therapy can be avoided, preventing toxicities. Besides theintrinsic biological nature of the tumor, tumor size mightalso contribute to metastatic disease [13, 14]. Large tumorsize reflects an increased number of cells and, in turn,more cell cycles with which cells acquire metastatic
characteristics like adhesion, invasion, motility, proteoly-sis and interstitial fluid pressure [15]. Unlike that in othersolid tumors, good response in osteosarcoma not onlymeans the complete absence of residual disease; thepresence of <10% residual disease that is >90% necrosisafter chemotherapy is also considered good response.Thus, there is scope of incorporating volume change indetermining histological response in osteosarcoma. De-crease in volume is associated with good response invarious studies, but in some patients increased volume isalso associated with good response [16–18]. In our study,pre-chemotherapy and post-chemotherapy tumor volumes
Sen
siti
vity
1-SpecificityArea under ROC curve=0.8619
Sen
siti
vity
Sen
siti
vity
1-SpecificityArea under ROC curve=0.8476
0.00 0.50 0.751-Specificity
Area under ROC curve=0.8238
0.25 1.00
0.00 0.50 0.750.25 1.000.00 0.50 0.750.25 1.00
0.00
0.50
0.7
50.
251.
000.
000.
50 0
.75
0.25
1.00
0.00
0.50
0.7
50.
251.
00
a b
c
Fig. 5 Correlation between functional MRI parameters and histolog-ical necrosis. a Pre-chemotherapy diffusion per unit volume (ADC 1/vol 1) versus necrosis (AUC=86% (95% CI 72–99%). Pre-chemotherapy diffusion per unit volume at the threshold value of 0.6could predict good histological response with a sensitivity of 80%,specificity of 81%, PPV of 67% and NPVof 90%. This implies that ifdiffusion per unit volume is ≥0.6, it is a surrogate marker of goodhistological response with the above mentioned sensitivity, specificityand predictive values. b Post-chemotherapy diffusion per unit volume
(ADC 2/vol 2) versus necrosis (AUC=85% (95% CI=70–99%). Post-chemotherapy diffusion per unit volume at the threshold value of 1.73could predict good histological response, with a sensitivity of 90%,specificity of 86%, PPV of 75% and NPV of 95%. c Change indiffusion per unit volume (ADC 2/vol 2)—(ADC1/Vol 1) versusnecrosis (AUC=82% (95% CI 66–98%). Post-chemotherapy changein diffusion per unit volume at the threshold value of 0.6 could predictgood histological response with a sensitivity of 80%, specificity of76%, PPV of 67% and NPV of 90%
Pediatr Radiol (2011) 41:441–450 447
as measured by MRI correlated well with histologicalnecrosis, though a change in volume following chemo-therapy (pre-neoadjuvant chemotherapy volume-post-neo-adjuvant chemotherapy volume) did not show acorrelation. A discrepancy in between volume change asassessed by MRI and histological response might beexplained by the slow regression of osteoid matrix and cysticdegeneration in good responders with corresponding falla-cious increase in size on MRI [19]. There is evidence thatafter chemotherapy, the intraosseous component remainsalmost constant and it is only the extraosseous componentthat changes [20]. Therefore, we did separate analyses of theextraosseous component.
It has been suggested that a large tumor in a small childcarries a higher risk than a comparable tumor in an adultbecause of differences of pharmacokinetics among childrenwith variable tumor burden [21]. In pediatric patients,pharmacokinetic parameters have been reported to beinfluenced by patient characteristics such as age, gender,liver and renal functions and by intrinsic tumor natureincluding tumor burden [22]. The relative tumor sizeparameters are closely related to prognosis because thereare differences in pharmacokinetics among children withvariable tumor burden. Some studies assessed the relativemeasures (absolute measures adjusted by body surface area,i.e. relative average tumor plane) with variable results [18,21–23]. Our results confirm the importance of absolute aswell as relative size parameters.
In diffusion-weighted MRI, water diffusion is used as asurrogate marker to distinguish highly cellular regions oftumor (with restricted diffusion) from acellular and necroticregions (with free diffusion). This will detect treatmentresponse, which manifests as a change in cellularity withinthe tumor over time. Changes in the degree of restricteddiffusion, for example by an alteration in cell membraneintegrity or permeability to water, are reflected in changesin the diffusion-weighted signal and can be quantified by
change in ADC. Therefore, in diffusion-weighted imageswe would expect different degrees of signal change innecrotic and viable tumor tissue. In the viable tumor, we donot observe free diffusion of water with corresponding lowADC values, while necrotic areas have free diffusion ofwater with corresponding high ADC values [4]. Preclinicaland clinical studies have shown that diffusion-weightedimaging is a sensitive biomarker capable of detecting earlycellular changes in treated tumors, which precede macro-scopic volumetric response [5–7]. The kinetic curveassessment in dynamic contrast-enhanced MRI depicts thepermeability characteristics of the tumor, which might alterwith neoadjuvant chemotherapy. Thus, it was hypothesizedthat change in these kinetic curves from higher permeabilityto lower permeability characteristics correlates withresponse to chemotherapy.
In the present study, the absolute ADC values or changein ADC values did not significantly correlate with necrosis.In previous studies, ADC values and their change afterchemotherapy have correlated well with histological necro-sis in osteosarcoma [4, 24, 25]. Further, similar correlationhas been detected in other cancers, such as breastmetastases the liver [26], gliomas [27, 28] and hepatocel-lular carcinomas [29]. One possible reason for the widerange of measured ADC values in tumor tissue could be thesusceptibility of echo planer imaging sequences to artifactslike distortion and low signal-to-noise ratio. It is likely thatDW MRI using non-echo planer imaging sequences and ahigher field strength (3 T) can overcome these lacunae.Another possible reason for the wide range of ADC valuesmight be the inhomogeneity of tumor tissue with necrosis,bleeding and perfusion defects.
We then adjusted ADC with respective tumor volumeand derived a new parameter, namely diffusion per unitvolume (ADC/volume), and found that this parametersignificantly correlated with histological response frompre-neoadjuvant chemotherapy to post-neoadjuvant chemo-
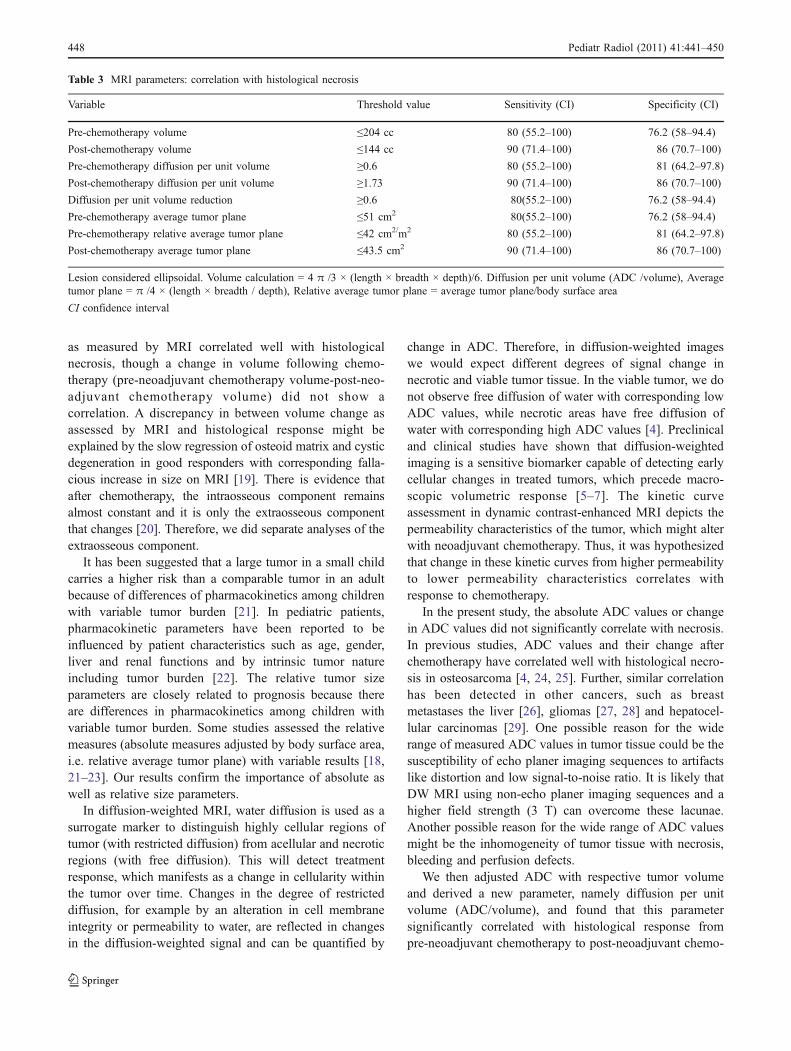
Table 3 MRI parameters: correlation with histological necrosis
Variable Threshold value Sensitivity (CI) Specificity (CI)
Pre-chemotherapy volume ≤204 cc 80 (55.2–100) 76.2 (58–94.4)
Post-chemotherapy volume ≤144 cc 90 (71.4–100) 86 (70.7–100)
Pre-chemotherapy diffusion per unit volume ≥0.6 80 (55.2–100) 81 (64.2–97.8)
Post-chemotherapy diffusion per unit volume ≥1.73 90 (71.4–100) 86 (70.7–100)
Diffusion per unit volume reduction ≥0.6 80(55.2–100) 76.2 (58–94.4)
Pre-chemotherapy average tumor plane ≤51 cm2 80(55.2–100) 76.2 (58–94.4)
Pre-chemotherapy relative average tumor plane ≤42 cm2/m2 80 (55.2–100) 81 (64.2–97.8)
Post-chemotherapy average tumor plane ≤43.5 cm2 90 (71.4–100) 86 (70.7–100)
Lesion considered ellipsoidal. Volume calculation = 4 π /3 × (length × breadth × depth)/6. Diffusion per unit volume (ADC /volume), Averagetumor plane = π /4 × (length × breadth / depth), Relative average tumor plane = average tumor plane/body surface area
CI confidence interval
448 Pediatr Radiol (2011) 41:441–450

therapy. The diffusion per unit volume (ADC/volume) is acomparative analysis of ADC values with respect tovolume. In other words, it depicts of diffusion with respectto tumor size. The diffusion per unit volume was moremeaningful in our population. One possible reason for thisis that our patients presented with relatively large tumors.Volume measurement is also an effective tool for gauginghistological response, as shown in this study; in fact, bothdiffusion and volume are effective tools. Diffusion pervolume also adds a functional component to the anatomicalparameter. However, the value of this newly derivedparameter needs to be tested in a larger cohort of patients.
In our study, change in pattern of enhancement did notcorrelate with necrosis. There is some evidence that dynamiccontrast-enhanced MRI measure of contrast kinetics of tumortissues correlates with histological necrosis. In one study, themean slope and time-to-peak values in necrotic and viabletumor areas were significantly different [24]. In another study,the initial slope from the tumor correlated well withhistological necrosis [30]. These studies used the sophisti-cated software-based compartment model calculations forcontrast kinetics; however, we did qualitative analysis basedon the shape of the time intensity curve, which may be oneof the reasons we could not find an association withhistological necrosis. However, in a study by Guo andReddick [31], it was shown that curve pattern analysismethod provides a feasible alternative to quantifying DCE-MRI studies. Another explanation could be that standardcontrast agents such as gadolinium complexes are distributedin the interstitial space and diffuse into necrotic tissue,thereby potentially obscuring tumor necrosis on contrastmedium-enhanced MR images [31].
A limitation of the study is the low prevalence ofgood responders (10/31), which could have affected thepredictive values of various parameters. Further, sizeparameters were calculated by simplified mathematicalformulas. An irregular shape might not fit well into anellipsoid formula and might be more accurately calculat-ed using a three-dimensional technique. Though Shin etal. [32] have shown that volume calculation by ellipsoidformula is in close correlation with that calculated by 3-DMRI, there is a risk of over- or underestimation of tumorvolume when using this method.
Conclusion
MRI could serve as a surrogate for histological necrosis and,in turn, it can be used as a noninvasive predictive marker toprognosticate osteosarcoma. In conventional MRI, pre- andpost-neoadjuvant chemotherapy tumor volume, pre- and post-chemotherapy average tumor plane, and pre-chemotherapyrelative average tumor plane were found to have significant
association with histological necrosis. In diffusion-weightedMRI, pre- and post-chemotherapy diffusion per unit volumeas well as its change following chemotherapy showedsignificant association with histological necrosis. In multivar-iable logistic regression analysis, post-chemotherapy tumorvolume was identified as an independent predictor forhistological necrosis. Thus, predicting a response inosteosarcoma might be done early in the disease course(even at baseline) quite reliably. This could not only shortenthe time required to evaluate the efficacy of neoadjuvantchemotherapy, but patients could be saved from ineffectualchemotherapy at baseline. Calculation of diffusion per unitvolume by MRI appears to be a sensitive quantitativesubstitute to monitor response to neoadjuvant chemother-apy in osteosarcoma, and it appears that attempting volumecorrection of absolute ADC values might give a moremeaningful prediction of histological response.
References
1. Saeter G, Hoie J, Stenwig AE et al (1995) Systemic relapse ofpatients with osteogenic sarcoma: prognostic factors for long termsurvival. Cancer 75:1084–1093
2. Enneking WF, Spanier SS, Goodman MA (1980) A system for thesurgical staging of musculoskeletal sarcoma. Clin Orthop153:106–120
3. Miller AB, Hoogstraten B, Staquet M et al (1981) Reportingresults of cancer treatment. Cancer 47:207–214
4. Uhl M, Saueressig U, Koehler G et al (2006) Evaluation of tumornecrosis during chemotherapy with diffusion-weighted MR imaging:preliminary results in osteosarcomas. Pediatr Radiol 36:1306–1311
5. Dudeck O, Zeile M, Pink D et al (2003) Diffusion-weightedmagnetic resonance imaging allows monitoring of anticancertreatment effects in patients with soft-tissue sarcomas. J MagnReson Imaging 27:1109–1113
6. Moffat BA, Chenevert TL, Meyer CR et al (2006) The functionaldiffusion map: an imaging biomarker for the early prediction ofcancer treatment outcome. Neoplasia 8:259–267
7. Koh DM, Collins DJ (2007) Diffusion-weighted MRI in the body:applications and challenges in oncology. AJR 188:1622–1635
8. Schnall MD, Blume J, Bluemke DA et al (2006) Diagnosticarchitectural and dynamic features at breast MR imaging:multicenter study 1. Radiology 238:42–53
9. Greene FL, Page DL, Fleming ID et al (2002) AJCC cancerstaging manual, 6th edn. Springer, New York
10. Picci P, Bacci G, Campanacci M et al (1985) Histologicalevaluation of necrosis in osteosarcoma induced by chemother-apy. Regional mapping of viable and nonviable tumor. Cancer56:1515
11. Bacci G, Picci P, Ruggieri P et al (1990) Primary chemotherapyand delayed surgery (neoadjuvant chemotherapy) for osteosarco-ma of the extremities. The Instituto Rizzoli experience in 127patients treated preoperatively with intravenous methotrexate(high versus moderate doses) and intraarterial cisplatin. Cancer65:2539–2553
12. Winkler K, Beron G, Delling G et al (1988) Neoadjuvantchemotherapy of osteosarcoma: results of a randomized cooper-ative trial (COSS-82) with salvage chemotherapy based onhistological tumor response. J Clin Oncol 6:329–337
Pediatr Radiol (2011) 41:441–450 449

13. Withers HR, Lee SP (2006) Modeling growth kinetics andstatistical distribution of oligometastases. Semin Radiat Oncol16:111–119
14. Pervaiz S (2002) Anti-cancer drugs of today and tomorrow: arewe close to making the turn from treating to curing cancer? CurrPharm Des 8:1723–1734
15. Nathan SS, DiResta GR, Casas-Ganem JE et al (2005) Elevatedphysiologic tumor pressure promotes proliferation and chemo-sensitivity in human osteosarcoma. Clin Cancer Res 11:2389–2397
16. Brisse H, Ollivier L, Edeline V et al (2004) Imaging of malignanttumors of the long bones in children: monitoring response toneoadjuvant chemotherapy and preoperative assessment. PediatrRadiol 34:595–605
17. Jones DN, McCowage GB, Sostman HD et al (1996) Monitoringof neoadjuvant therapy response of soft-tissue and musculoskel-etal sarcoma using fluorine-18-FDG PET. J Nucl Med 37:1438–1444
18. Kim MS, Lee SY, Cho WH et al (2008) Initial tumor size predictshistologic response and survival in localized osteosarcomapatients. J Surg Oncol 97:456–461
19. Vander Woude HJ, Bloem JL, Hogendoorn PC (1998) Preopera-tive evaluation and monitoring chemotherapy in patients withhigh-grade osteogenic and Ewing’s sarcoma: review of currentimaging modalities. Skeletal Radiol 27:57–71
20. Kim MS, Lee SY, Cho WH et al (2008) Tumor necrosis rateadjusted by tumor volume change is a better predictor of survivalof localized osteosarcoma patients. Ann Surg Oncol 15:906–914
21. Lee JA, Kim MS, Kim DH et al (2008) Relative tumor burdenpredicts metastasis-free survival in pediatric osteosarcoma. PediatrBlood Cancer 50:195–200
22. Groninger E, Proost JH, de Graaf SS (2004) Pharmacokinetic studiesin children with cancer. Crit Rev Oncol Hematol 52:173–197
23. Kaste SC, Liu T, Billups CA et al (2004) Tumor size as a predictorof outcome in pediatric non-metastatic osteosarcoma of theextremity. Pediatr Blood Cancer 43:723–728
24. Uhl M, Saueressig U, van Buiren M et al (2006) Preliminaryresults of in vivo assessment of tumor necrosis after chemotherapywith diffusion- and perfusion-weighted magnetic resonanceimaging. Invest Radiol 41:618–623
25. Hayashida Y, Yakushiji T, Awai K et al (2006) Monitoringtherapeutic responses of primary bone tumors by diffusion-weighted image: initial results. Eur Radiol 16:2637–2643
26. Theilmann RJ, Borders R, Trouard TP et al (2004) Changes inwater mobility measured by diffusion MRI predict response ofmetastatic breast cancer to chemotherapy. Neoplasia 6:831–837
27. Chenevert TL, Stegman LD, Taylor JM et al (2000) Diffusionmagnetic resonance imaging: an early surrogate marker of therapeu-tic efficacy in brain tumors. J Natl Cancer Inst 92:2029–2036
28. Mardor Y, Pfeffer R, Spiegelmann R et al (2003) Early detectionof response to radiation therapy in patients with brain malignan-cies using conventional and high b-value diffusion-weightedmagnetic resonance imaging. J Clin Oncol 21:1094–1100
29. Deng J, Miller FH, Rhee TK et al (2006) Diffusion-weighted MRimaging for determination of hepatocellular carcinoma response toyttrium-90 radioembolization. J Vasc Interv Radiol 17:1195–1200
30. Dyke JP, Panicek DM, Healey JH et al (2003) Osteogenic andEwing sarcomas: estimation of necrotic fraction during inductionchemotherapy with dynamic contrast enhanced MR imaging.Radiology 228:271–278
31. Guo JY, Reddick WE (2009) DCE-MRI pixel-by-pixel quantita-tive curve pattern analysis and its application to osteosarcoma. JMagn Reson Imag 30:177–184
32. Shin KH, Moon SH, Suh JS et al (2000) Tumor volume change asa predictor of chemotherapeutic response in osteosarcoma. ClinOrthop Relat Res 376:200–208
450 Pediatr Radiol (2011) 41:441–450
Copyright © 2022 FDOKUMEN