Role of Metabolic Syndrome and Antiretroviral Therapy in the Adiponectin Levels and Oxidative Stress...
7
Applied nutritional investigation Role of metabolic syndrome and antiretroviral therapy in adiponectin levels and oxidative stress in HIV-1 infected patients Helena K. Morimoto Ph.D. a , Andr ea N.C. Sim ~ ao Ph.D. a, * , Elaine R.D. de Almeida Ph.D. a , Luiz T. Ueda M.Sc. b , Sayonara R. Oliveira M.Sc. a , Natalia B. de Oliveira M.Sc. a , Diego L. Petenucci M.Sc. a , Carolina Panis Ph.D. c , Rubens Cecchini Ph.D. c , Isaias Dichi M.D., Ph.D. d , Edna M.V. Reiche Ph.D. a a Department of Pathology, Clinical Analysis and Toxicology, University of Londrina, Londrina, Paran a, Brazil b Integrated Center of Infectious Diseases, Secretariat Health of Paran a State, Londrina, Paran a, Brazil c Laboratory of Pathophysiology of Free Radicals, University of Londrina, Londrina, Paran a, Brazil d Department of Internal Medicine, University of Londrina, Londrina, Paran a, Brazil article info Article history: Received 13 December 2013 Accepted 17 March 2014 Keywords: Adiponectin HIV-1 Oxidative stress ART Metabolic syndrome abstract Objective: HIV-1 infection is accompanied by severe metabolic and immune dysfunction. The aim of this study was to evaluate the role of metabolic syndrome (MetS) and antiretroviral therapy (ART) utilization on the adiponectin levels and oxidative stress in patients infected with HIV-1. Methods: We allocated 285 patients into four groups: group 1: patients without MetS who were not using ART; group 2: patients without MetS using ART; group 3: patients with MetS who were not using ART; and group 4: patients with MetS using ART. Biochemical, immunologic, and oxidative stress parameters were measured. Results: Group 4 exhibited higher lipoperoxides when compared with group 1 (P < 0.0001) and higher advanced oxidation protein products (AOPP) compared with group 2 or group 1 (P < 0.0001). Group 3 also presented higher AOPP than group 2 (P < 0.05). Group 4 showed lower adiponectin levels compared with groups 1 or 2 (P < 0.0001). Similarly, group 3 presented lower adiponectin levels compared with group 2 (P < 0.05) or group 1 (P < 0.0001). Multivariate analysis showed that both an increase in AOPP and a decrease in total radical-trapping antioxidant parameter/uric acid were independently associated with MetS in HIV-1 patients. Regarding immunologic markers of HIV-1 disease progression and viral replication, group 4 exhibited significantly higher CD45 þ , CD3 þ , and CD4 þ T cells count compared with group 2 (P < 0.01). Conclusion: HIV-1–infected patients with MetS exhibited hypoadiponectinemia and increased oxidative stress, and these findings were not influenced by ART use. The findings of the present study allow the suggestion that MetS and inflammation might be mainly responsible for the aforementioned features. More studies are needed to verify whether drugs or food, which yield increased adiponectinemia and decreased oxidative stress, could reduce cardiovascular risk in HIV-infected patients. Ó 2014 Elsevier Inc. All rights reserved. Introduction HIV-1 infection is accompanied by severe metabolic and im- mune dysfunction. Introduction of highly active antiretroviral therapy for the treatment of individuals infected with HIV-1 was effective in suppressing viral replication and thus, reducing morbidity and mortality associated with AIDS, significantly improving the clinical course of the disease with increased sur- vival [1,2]. However, recent studies show that prolonged use of the antiretroviral therapy (ART), especially those including This study was supported by grants obtained from the Institutional Program for Scientific Initiation Scholarship (PIBIC) of the National Council for Scientific and Technological Development (CNPq). ANC Sim~ ao and EMV Reiche were respon- sible for the conception and design of the study. HK Morimoto, ERD de Almeida, LT Ueda, JA de Oliveira, SR Oliveira, NB Oliveira, DL Petenucci, C Panis, and R Cecchini were responsible for the acquisition of data. HK Morimoto, ANC Sim~ ao, I Dichi, and EMV Reiche analyzed and interpreted the data. ANC Sim~ ao and I Dichi drafted the article and revised it critically for important intellectual con- tent. EMV Reiche gave final approval of the article to be submitted. The authors declare there is no conflict of interest. * Corresponding author. Tel.: þ55 43 3371 2321; fax: þ55 43 3371 2619. E-mail address: [email protected] (A. N. C. Sim~ ao). 0899-9007/$ - see front matter Ó 2014 Elsevier Inc. All rights reserved. http://dx.doi.org/10.1016/j.nut.2014.03.017 Contents lists available at ScienceDirect Nutrition journal homepage: www.nutritionjrnl.com Nutrition 30 (2014) 1324–1330
-
Upload
universidadeestadualdelondrina -
Category
Documents
-
view
0 -
download
0
Transcript of Role of Metabolic Syndrome and Antiretroviral Therapy in the Adiponectin Levels and Oxidative Stress...

lable at ScienceDirect
Nutrition 30 (2014) 1324–1330
Contents lists avai
Nutrition
journal homepage: www.nutr i t ionjrnl .com
Applied nutritional investigation
Role of metabolic syndrome and antiretroviral therapy inadiponectin levels and oxidative stress in HIV-1 infected patients
Helena K. Morimoto Ph.D. a, Andr�ea N.C. Sim~ao Ph.D. a,*,Elaine R.D. de Almeida Ph.D. a, Luiz T. Ueda M.Sc. b, Sayonara R. Oliveira M.Sc. a,Natalia B. de Oliveira M.Sc. a, Diego L. Petenucci M.Sc. a, Carolina Panis Ph.D. c,Rubens Cecchini Ph.D. c, Isaias Dichi M.D., Ph.D. d, Edna M.V. Reiche Ph.D. a
aDepartment of Pathology, Clinical Analysis and Toxicology, University of Londrina, Londrina, Paran�a, Brazilb Integrated Center of Infectious Diseases, Secretariat Health of Paran�a State, Londrina, Paran�a, Brazilc Laboratory of Pathophysiology of Free Radicals, University of Londrina, Londrina, Paran�a, BrazildDepartment of Internal Medicine, University of Londrina, Londrina, Paran�a, Brazil
a r t i c l e i n f o
Article history:Received 13 December 2013Accepted 17 March 2014
Keywords:AdiponectinHIV-1Oxidative stressARTMetabolic syndrome
This study was supported by grants obtained from thScientific Initiation Scholarship (PIBIC) of the NationaTechnological Development (CNPq). ANC Sim~ao andsible for the conception and design of the study. HK MLT Ueda, JA de Oliveira, SR Oliveira, NB Oliveira, DLCecchini were responsible for the acquisition of data.I Dichi, and EMV Reiche analyzed and interpreted thDichi drafted the article and revised it critically for imtent. EMV Reiche gave final approval of the article todeclare there is no conflict of interest.* Corresponding author. Tel.: þ55 43 3371 2321; fa
E-mail address: [email protected] (A. N. C.
0899-9007/$ - see front matter � 2014 Elsevier Inc. Ahttp://dx.doi.org/10.1016/j.nut.2014.03.017
a b s t r a c t
Objective: HIV-1 infection is accompanied by severe metabolic and immune dysfunction. The aim ofthis study was to evaluate the role of metabolic syndrome (MetS) and antiretroviral therapy (ART)utilization on the adiponectin levels and oxidative stress in patients infected with HIV-1.Methods: We allocated 285 patients into four groups: group 1: patients without MetS who werenot using ART; group 2: patients without MetS using ART; group 3: patients with MetS who werenot using ART; and group 4: patients with MetS using ART. Biochemical, immunologic, andoxidative stress parameters were measured.Results: Group 4 exhibited higher lipoperoxides when compared with group 1 (P < 0.0001) andhigher advanced oxidation protein products (AOPP) compared with group 2 or group 1(P < 0.0001). Group 3 also presented higher AOPP than group 2 (P < 0.05). Group 4 showed loweradiponectin levels compared with groups 1 or 2 (P < 0.0001). Similarly, group 3 presented loweradiponectin levels compared with group 2 (P < 0.05) or group 1 (P < 0.0001). Multivariate analysisshowed that both an increase in AOPP and a decrease in total radical-trapping antioxidantparameter/uric acid were independently associated with MetS in HIV-1 patients. Regardingimmunologic markers of HIV-1 disease progression and viral replication, group 4 exhibitedsignificantly higher CD45þ, CD3þ, and CD4þ T cells count compared with group 2 (P < 0.01).Conclusion: HIV-1–infected patients with MetS exhibited hypoadiponectinemia and increasedoxidative stress, and these findings were not influenced by ART use. The findings of the presentstudy allow the suggestion that MetS and inflammation might be mainly responsible for theaforementioned features. More studies are needed to verify whether drugs or food, which yieldincreased adiponectinemia and decreased oxidative stress, could reduce cardiovascular risk inHIV-infected patients.
� 2014 Elsevier Inc. All rights reserved.
e Institutional Program forl Council for Scientific andEMV Reiche were respon-orimoto, ERD de Almeida,Petenucci, C Panis, and RHK Morimoto, ANC Sim~ao,e data. ANC Sim~ao and Iportant intellectual con-
be submitted. The authors
x: þ55 43 3371 2619.Sim~ao).
ll rights reserved.
Introduction
HIV-1 infection is accompanied by severe metabolic and im-mune dysfunction. Introduction of highly active antiretroviraltherapy for the treatment of individuals infected with HIV-1 waseffective in suppressing viral replication and thus, reducingmorbidity and mortality associated with AIDS, significantlyimproving the clinical course of the disease with increased sur-vival [1,2]. However, recent studies show that prolonged use ofthe antiretroviral therapy (ART), especially those including
H. K. Morimoto et al. / Nutrition 30 (2014) 1324–1330 1325
protease inhibitors (PIs), was related to metabolic syndrome(MetS) parameters, including dyslipidemia, insulin resistance(IR), and changes in body fat compartmentalization (peripherallipoatrophy and central fat accumulation), which are associatedwith an increased risk for cardiovascular disease (CVD) [3,4].The emergence of clinical and metabolic modifications inHIV-1–infected patients receiving ART has recently shownincreasing interest in the diagnosis of MetS in this population.However, to date, the studies have reported conflicting resultswith regard to the roles of both HIV-1 infection and ART indiagnosis of MetS [5,6].
Previous studies suggest that oxidative stress plays a crucialrole in several pathogenic mechanisms associated with HIV-1infection, including viral replication, inflammatory response,decreased immune cell proliferation, loss of immune function,chronic weight loss, and increased sensitivity to drug toxicity[4,7,8]. HIV-1 proteins and various components of current ARTregimens contribute to oxidative stress-induced disturbances,such as CVD [4].
Initially, proinflammatory cytokines produced in adipocytes,known as adipokines or adipocytokines, and positive acute-phase reactant proteins, demonstrated primarily by elevatedlevels of serum C to reactive protein, were considered the maintarget to avoid IR. Recently, however, adiponectin also hasemerged as one of the most robust candidates for therapeuticintervention [9]. Adiponectin is an adipokinewith powerful anti-inflammatory and antioxidant properties that is down-regulatedin obesity and IR [10], which are considered the core features ofMetS. Reduction in adiponectin levels has been considered animportant pathophysiological mechanism associated with IR,type 2 diabetes mellitus, and MetS [11], and there is a body ofevidence suggesting that hypoadiponectinemia is the link be-tween obesity and MetS [9]. In HIV-1 infection, release ofmacrophage cytokines production and viral proteins (Nef andVpr) might interfere with adipocyte homeostasis [12]. Patientstreated with ART, especially those with lipodystrophy, showedgradual down-regulation in adiponectin levels [13]. It has beendemonstrated that, in addition to proinflammatory cytokines,hypoadiponectinemia also favors oxidative stress [14,15].Although in HIV-1 infection, ART and MetS could decrease adi-ponectin levels and increase oxidative stress, the actual influenceof the aforementioned conditions on adiponectin levels andoxidative stress has, to our knowledge, not yet been evaluated.Therefore, the aim of the present study was to evaluate the roleof MetS and ART utilization on the adiponectin levels andoxidative stress in patients infected with HIV-1.
Methods
Participants and study design
Two hundred and eighty-five HIV-1–infected patients of both sexes, >18 y ofage, assisted by the Integrated Center for Infectious Diseases of the 17th RegionalHealth of the State of Paran�a and Clinical Hospital of the S Londrina State Uni-versity were enrolled in this study. The patients were initially allocated to twogroups, 284 patients with MetS and 101 patients without MetS; and were sex,age, and ethnicity matched. MetS was defined as per the Adult Treatment PanelIII criteria [16], when three of the following five characteristics were confirmed:
1. Abdominal obesity: waist circumference (WC)� 102 cm inmen and�88 cmin women;
2. Hypertriglyceridemia �150 mg/mL;3. Low levels of high-density lipoprotein cholesterol (HDL-C): �40 in men and
�50 mg/dL in women;4. High blood pressure: �130/85 mm Hg; and5. High fasting glucose: �110 mg/dL.
To verify the effects of ART utilization and the presence of MetS on adipo-nectin levels, oxidative stress, and the parameters related to HIV-1 disease pro-gression, patients with HIV-1 were allocated to four groups, as follows: group1: patients withoutMetS whowere not using ART (MetS–ART–); group 2 patientswithout MetS using ART (MetS–ARTþ); group 3 patients with MetS who werenot using ART (MetSþART–); and group 4: patients with MetS using ART(MetSþARTþ). These groups were also sex, age, and ethnicity matched.
Information on lifestyle factors and medical history were obtained at clinicalevaluation. Disease duration and therapies were recorded for each patient. Noneof the participants was receiving a specific diet and none of the patients in eithergroup (MetSþ and MetS–) drank alcohol regularly. None of the participantspresented heart, thyroid, renal, hepatic, gastrointestinal, or oncologic diseases,and none were receiving estrogen-replacement therapy, drugs for hyperlipid-emia, hyperglycemia, or antioxidant supplements. Patients who were takingantihypertensive drugs were not excluded for ethical reasons and were allowedto continue taking the same dose of the drugs. This study was conductedaccording to the guidelines of the Declaration of Helsinki, and the Ethical Com-mittee of the University of Londrina, Paran�a, Brazil approved all proceduresinvolving human subjects. Written informed consent was obtained from allindividuals.
Anthropometric and blood pressure measurements
Body weight was measured to the nearest 0.1 kg by using an electronic scale,with individuals wearing light clothing, but no shoes, in the morning. Height wasmeasured to the nearest 0.1 cm by using a stadiometer. Body mass index (BMI)was calculated as weight (kg) divided by height (m) squared. WC also wasmeasured and expressed as cm. Three blood pressure measurements taken at 1-min intervals after patients had been seated were recorded. The mean of thesemeasurements was used in the analysis [17].
Biochemical and immunologic biomarkers
After fasting for 12 h, the patients underwent the following laboratory bloodanalysis: serum uric acid (UA), total cholesterol (TC), low-density lipoproteincholesterol (LDL-C), HDL-C, triglycerides (TGs), and glucose were evaluated by abiochemical auto-analyzer Dimension� RxL Max Integrated Chemistry System(Newark, NJ, USA). Serum insulin levels were determined by chemiluminescencemicroparticule immunoassay (Architect, Abbott Laboratory, Abbott Park, IL, USA).The homeostasis model assessment of insulin resistance (HOMA-IR) was used asa surrogate measurement of insulin sensitivity [18] (HOMA-IR ¼ insulin fasting[mU/mL] � glucose fasting [nmol/L]/22.5). Plasma adiponectin levels weremeasured by a sandwich enzyme-linked immunosorbent assay (ELISA) using acommercial immunoassay ELISA (Ready-Set Go! Set, e-Bioscience, San Diego, CA,USA).
CD45þ, CD3þ, CD4þ, and CD8þ T cell counts were determined by flowcytometry using BD FACSCalibur� platform (BD Bioscience, San Jose, CA, USA)and the results were expressed as cells/mm3. The quantification of HIV-1 RNA inplasma was obtained using NY York, USA) and the results were expressed ascopies/mL and log10 RNA-HIV-1.
Oxidative stress measurements
Peripheral blood samples were obtained with EDTA as anticoagulant andantioxidant for evaluating oxidative stress. All samples were centrifuged at 3000gfor 15 min and plasma aliquots were stored in a freezer at �70�C until use.
Tert-butyl hydroperoxide-initiated chemiluminescence
Tert-butyl hydroperoxide-initiated chemiluminescence (CL-LOOH) in plasmawas evaluated as described previously [19]. This method is considered muchmore sensitive and specific than the thiobarbituric acid-reactive substancesmeasurement, the usual method to determine lipid oxidation. The results wereexpressed in counts per minute (cpm).
Determination of advanced oxidation protein products
Advanced oxidation protein products (AOPP) was determined in the plasmasamples using the semiautomated method described previously [20]. AOPP re-sults from oxidation of amino acid residues such as tyrosine, leading to the for-mation of dityrosine-containing protein cross-linking products detected byespectrophotometry. AOPP concentrations were expressed as micromoles perliter (mmol/L) of chloramines-T equivalents.
Total radical-trapping antioxidant parameter
The total radical-trapping antioxidant parameter (TRAP) was determined aspreviously reported [21]. This method detects hydrosoluble and/or liposoluble

H. K. Morimoto et al. / Nutrition 30 (2014) 1324–13301326
plasma antioxidants by measuring the chemiluminescence inhibition timeinduced by 2,2-azobis (2-amidinopropane). The system was calibrated with thevitamin E analog TROLOX, and the values of TRAPwere expressed in equivalent ofmM Trolox/mg UA.
Statistical analysis
Distribution of sex and ethnicity was analyzed with Fisher’s exact test or c2
test to compare patients infected with HIV-1 with or without MetS. Age and BMIwere analyzedwithMann-WhitneyU test to compare patients infectedwithHIV-1with or without MetS. Comparisons between the four groups were done using theKruskal-Wallis test with Dunn’s post-test and data were expressed as the medianand interquartile range (25th–75th percentiles). Correlations were evaluated by
Table 1Demographic, clinical, and laboratorial characteristics of patients infected with HIV-1
Variable Without MetS (n ¼Gender n (%)*Female 8 (53.3)Male 86 (46.7)
Ethnicity n (%)*White 97 (52.7)Others 87 (47.3)
Age (y) 42.0 (37.0–46.8)CD4þ T cells n (%)*<200/mm3 34 (18.5)200–500/mm3 87 (47.3)>500/mm3 63 (34.2)Detectable HIV-1 RNA copies/mL*Yes 92 (50.0)No 92 (50.0)
Log10 HIV-1 RNA n (%)y
�5.0 8 (4.3)<5.0 176 (95.7)
ART n (%)*Yes 141 (76.6)No 43 (23.4)
PIs n (%)*Yes 94 (51.1)No 90 (48.9)
NRTI s n (%)*Yes 140 (76.1)No 44 (23.9)
NNRTIs n (%)*Yes 49 (26.6)No 135 (73.4)
FI n (%)y
Yes 3 (1.6)No 181 (98.4)
ART use*Regular 96 (68.1)Irregular 45 (31.9)
BMI (kg/m2) 22.9 (20.8–25.6)WC (cm) 88.0 (81.0–94.0)SBP (mm Hg) 110.0 (100.0–120DBP (mm Hg) 72.0 (64.0–80.0)Triglyceride (mg/dL) 122.5 (91.0–183.8Cholesterol (mg/dL) 197.0 (162.3–227HDL cholesterol (mg/dL) 45.0 (38.0–53.0)LDL cholestrerol (mg/dL) 123.7 (92.3–147.1Glucose (mg/dL) 87.0 (82.0–94.0)Insulin (UI/mL) 7.4 (5.50–12.58HOMA-IR 1.60 (1.10–2.70)Adiponectin (mg/dL) 7.57 (5.68–10.55Hidroperoxides (cpm) 21610 (15530–294AOPP (mmol/L of chloramines-T equivalents) 127.9 (100.5–175Uric acid (mg/dL) 4.47 (3.44–5.56)GGT (U/L) 41.5 (28.0–73.0)TRAP/UA (mM Trolox/mg UA) 134.3 (116.8–164
AOPP, advanced oxidation protein products; ART, antiretroviral therapy; BMI, body mdensity lipoprotein; HOMA-IR, homeostasis model of assessment in insulin resistancNNRTI, non-nucleoside reverse transcriptase inhibitor; NRTI, nucleoside reverse transradical-trapping antioxidant parameter; UA, uric acid; WC, waist circumferenceData are median and interquartile range (25%–75%)
* c2 test.y Fisher’s exact test. Mann-Whitney U test.
Spearman’s rank correlation. A statistical analysis program (Graph Pad Prismversion 4.0) was used for evaluations. To determine which factors were indepen-dently associated with MetS and ART, the variables that presented P < 0.10 in theunivariate analyses and those values with supposed clinical relevance wereincluded in the multivariate logistic regression model, and were evaluated by theGraphPad Instat version 3.0 (GraphPad Software, San Diego, CA, USA). The resultswere considered significant when P < 0.05.
Results
Individuals infected with HIV-1 without MetS did not differsignificantly from those infected with HIV-1 with MetS in
with or without metabolic syndrome
184) With MetS (n ¼ 101) P-value
0.846655 (54.4)46 (45.5)
0.355259 (58.4)42 (41.6)
43.0 (38.5–50.5) 0.13510.0086
10 (9.9)39 (38.6)53 (52.5)
<0.00017 (6.9)
94 (93.1)0.1658
1 (0.9)100 (99.0)
0.133585 (84.2)16 (15.8)
0.046064 (63.4)37 (36.6)
85 (84.2)16 (15.8) 0.1099
0.985127 (26.7)74 (73.3)
0.55490 (0)
102 (100)
62 (72.9) 0.440723 (27.1)
26.9 (24.7–29.1) <0.000196.0 (90.0–103.5) <0.0001
.0) 132.0 (118.5–138.5) <0.000186.0 (76.0–94.0) <0.0001
) 220.0 (172.5–332.5) <0.0001.5) 220.0 (183.5–273.0) 0.0001
41.0 (34.0–49.0) 0.0372) 127.4 (89.6–164.0) 0.5133
96.0 (87.0–104.5) <0.0001) 13.20 (8.45–19.05) <0.0001
3.30 (2.05–4.70) <0.0001) 4.83 (3.64–7.07) <0.000180) 24090 (18250–31340) 0.0474.0) 183.9 (141.6–256.0) <0.0001
5.50 (4.40–6.65) <0.000148.0 (34.3–86.8) 0.0436
.9) 119.0 (106.0–141.2) 0.0006
ass index; DBP, diastolic blood pressure; GGT, g-glutamyltransferase; HDL, high-e; IF, fusion inhibitor; LDL, low-density lipoprotein; MetS, metabolic syndrome;criptase inhibitor; PI, protease inhibitor; SBP, systolic blood pressure; TRAP, total

Table 2Demographic, body composition, laboratory parameters, and oxidative stress markers of patients infected with HIV-1 with or without metabolic syndrome, using or notusing antiretroviral therapy
MS– ART – (G1) n ¼ 43 MS– ARTþ (G2) n ¼ 141 MSþ ART– (G3) n ¼ 20 MSþ ARTþ (G4) n ¼ 85
Age (y) 41.0 (35.0–46.0) 42.0 (38.0–47.0) 41.5 (34.8–44.8) 43.0 (39.0–51.0)Gender n (%)*Female 30 (69.8) 68 (48.2) 13 (65.0) 45 (52.9)Male 13 (30.2) 73 (51.8) 7 (35.0) 40 (47.1)
Ethnicity n (%)*White 25 (58.1) 71 16 (80.0) 49 (57.6)Others 18 (41.9) 70 4 (20.0) 36 (42.4)
BMI (kg/m2) 24.8 (20.9–26.9) 22.7 (20.8–25.2) 26.8 # (24.9–31.8) 26.9 * U (24.6–29.0)WC (cm) 88.0 (78.0–97.0) 88.0 (82.0–93.0) 95.0F # (90.0–103.5) 97.0 * U (90.5–103.5)Hydroperoxides (cpm) 18180 (13 600–24 020) 22090 (15 620–30 720) 25550 (15 690–33 000) 24090 * (18 620–31 450)AOPP (mmol/L of chloramines-T equivalents) 128.9 (101.9–162.7) 119.2 (100.0–168.3) 164.2 # (146.0–195.3) 186.6 * U (136.9–257.1)Uric acid (mg/dL) 4.40 (3.75–5.05) 4.48 (3.40–5.57) 5.53 (3.75–6.73) 5.50 * U (4.40–6.65)TRAP/UA (mM Trolox/mg UA) 131.0 (124.3–158.0) 134.4 (115.5–168.3) 122.9 (107.1–166.2) 118.2 U (105.2–139.3)
AOPP, advanced oxidation protein products; ART, antiretroviral therapy; BMI, body mass index; GGT, g-glutamyltransferase; MetS, metabolic syndrome; TRAP, totalradical-trapping antioxidant parameter, UA, uric acid; WC, waist circumferenceMS–ART– (G1): patients without MS who were not using ART; MS–ARTþ (G2): patients without MS using ART; MSþART– (G3): patients with MS who were not usingART; MSþARTþ (G4): patients with MS using ART.F G1 vs.G3: P < 0.001, * G1 vs.G4: P < 0.0001, # G2 vs.G3: P < 0.05, U G2 vs.G4: P < 0.0001.
* c2 test. Wilcoxon test. Data are median and interquartile range (25%–75%).
Fig. 1. Plasma adiponectin levels of patients infected with HIV-1 with or withoutmetabolic syndrome, using or not using antiretroviral therapy. G1: MetS–ART–; G2:MetS–ARTþ; G3 MetSþART–; G4: MetSþARTþ. jG1 vs. G3 (P < 0.0001); * G1 vs. G4(P < 0.0001); # G2 vs.G3 (P < 0.05), U G2 vs.G4 (P < 0.0001).
H. K. Morimoto et al. / Nutrition 30 (2014) 1324–1330 1327
relation to sex (P ¼ 0.8466), ethnicity (P ¼ 0.3552), and age(P ¼ 0.1351). However, patients with MetS presented higherBMI (P < 0.0001), WC (P < 0.0001), systolic blood pressure(P < 0.0001), diastolic blood pressure (P < 0.0001), TG,(P < 0.0001), TC (P ¼ 0.0001), glucose (P < 0.0001), insulin(P < 0.0001), HOMA-IR (P < 0.0001), and lower serum HDL-Clevels (P ¼ 0.0372) and plasmatic adiponectin (P < 0.0001)compared with those infected with HIV-1 without MetS. Therewas no significant difference in serum LDL-C between the fourgroups (P ¼ 0.5133). UAwas higher (P < 0.0001) in patients withMetS compared with patients without MetS (Table 1).
The group of patients with MetS exhibited a higher frequencyof patients with CD4þ T cells >500/mm3 and CD4þ T cells <200/mm3 (P ¼ 0.0086), as well as lower detectable HIV-1 RNA copies/mL (P < 0.0001) compared with the group of patients withoutMetS. However, there was no statistically significant differencebetween the groups in relation to the number of copies expressedas log10 copies/mL (P¼ 0.1658). In general, therewas no differencebetween the groups with regard to ART use (P ¼ 0.1335). Inrelation to the different classes of ART, there were no differencesin relation to nucleoside reverse transcriptase inhibitors (NRTIs;P ¼ 0.1099), non-nucleoside reverse transcriptase inhibitors(NNRTI; P ¼ 0.9851), and fusion inhibitors (FIs; 0.5549). However,patients with MetS used PIs more frequently than patientswithoutMetS (P¼ 0.0460). The adhesion to treatment was similarbetween the groups (P ¼ 0.4407) (Table 1).
Patients without MetS using ART (MetS–ARTþ) or not (MetS–ART–) and those with MetS using ART (MetSþARTþ) or not(MetSþART–) were paired by sex, ethnicity, and age.MetSþARTþ patients exhibited higher BMI and WC comparedwith MetS– ARTþ or MetS–ART– patients (P< 0.0001). Similarly,patients with MetSþART– (G3) presented higher BMI and WCthan MetS–ARTþ patients (P < 0.05) and higher WC comparedwith the MetS–ART– group (P < 0.001). There was no differencein the groups with MetS in relation to BMI and WC, independentof whether or not they were using ART. UA was higher inMetSþARTþ patients than in MetS–ART– or MetS–ARTþ in-dividuals (P < 0.0001) (Table 2).
With regard to oxidative stress, the MetSþARTþ grouppresented higher lipoperoxide levels compared with theMetS–ART– group (P < 0.0001) and higher AOPP com-pared with the MetS–ARTþ or MetS–ART– groups (P < 0.0001).
MetSþART� patients also presented higher AOPP levels thanMetS–ARTþ individuals (P < 0.05). In addition, MetSþARTþpatients showed lower TRAP levels than the MetS–ARTþ group(P < 0.0001) (Table 2).
MetSþARTþ patients showed lower adiponectin levelscompared with MetS– ARTþ or MetS–ART– groups (P < 0.0001).Similarly, patients with MetSþART– (G3) presented lower adi-ponectin levels compared with MetS–ARTþ (P < 0.05) or MetS–ART– (P < 0.0001). There was no difference in the groups withMetS, independent of whether they used ART or not (Fig. 1).
AlthoughMetS groups (groups 3 and 4) presented higher BMIand WC than those groups without MetS, multivariate analysisshowed that both increases in AOPP and decreases in TRAP/UAwere independently associated with MetS in HIV-1–infectedpatients. On the contrary, there was no association betweenoxidative stress biomarkers and ART (data not shown).
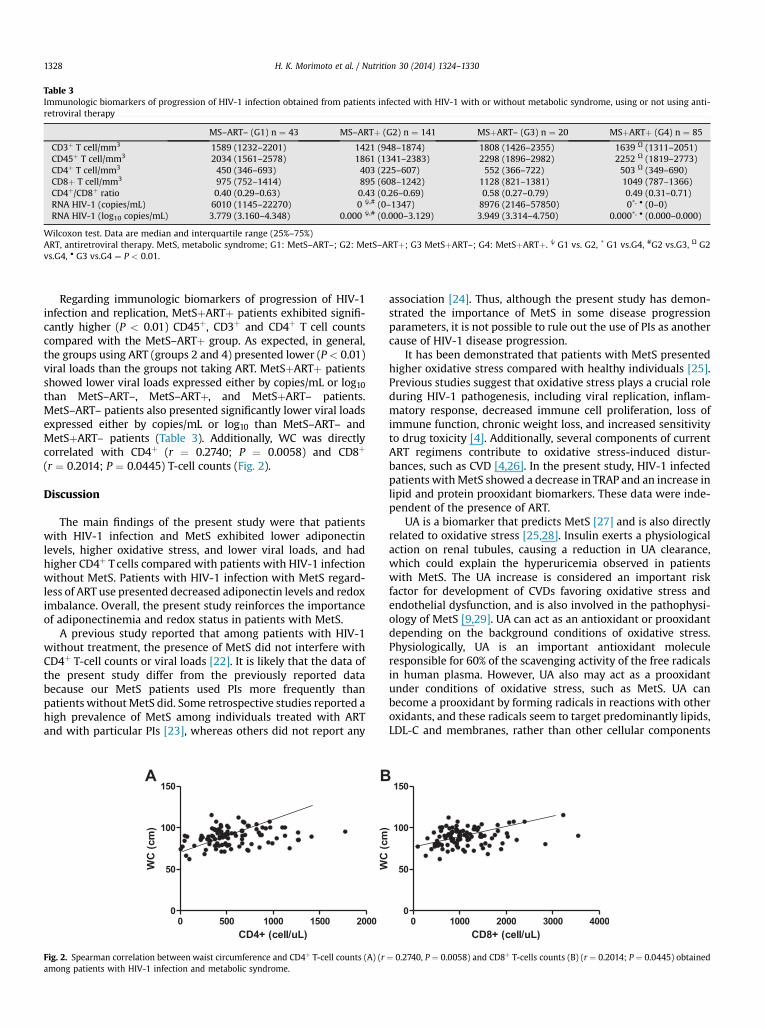
Table 3Immunologic biomarkers of progression of HIV-1 infection obtained from patients infected with HIV-1 with or without metabolic syndrome, using or not using anti-retroviral therapy
MS–ART– (G1) n ¼ 43 MS–ARTþ (G2) n ¼ 141 MSþART– (G3) n ¼ 20 MSþARTþ (G4) n ¼ 85
CD3þ T cell/mm3 1589 (1232–2201) 1421 (948–1874) 1808 (1426–2355) 1639 U (1311–2051)CD45þ T cell/mm3 2034 (1561–2578) 1861 (1341–2383) 2298 (1896–2982) 2252 U (1819–2773)CD4þ T cell/mm3 450 (346–693) 403 (225–607) 552 (366–722) 503 U (349–690)CD8þ T cell/mm3 975 (752–1414) 895 (608–1242) 1128 (821–1381) 1049 (787–1366)CD4þ/CD8þ ratio 0.40 (0.29–0.63) 0.43 (0.26–0.69) 0.58 (0.27–0.79) 0.49 (0.31–0.71)RNA HIV-1 (copies/mL) 6010 (1145–22270) 0 j,# (0–1347) 8976 (2146–57850) 0*, � (0–0)RNA HIV-1 (log10 copies/mL) 3.779 (3.160–4.348) 0.000 j,# (0.000–3.129) 3.949 (3.314–4.750) 0.000*, � (0.000–0.000)
Wilcoxon test. Data are median and interquartile range (25%–75%)ART, antiretroviral therapy. MetS, metabolic syndrome; G1: MetS–ART–; G2: MetS–ARTþ; G3 MetSþART–; G4: MetSþARTþ. j G1 vs. G2, * G1 vs.G4, #G2 vs.G3, U G2vs.G4, � G3 vs.G4 ¼ P < 0.01.
H. K. Morimoto et al. / Nutrition 30 (2014) 1324–13301328
Regarding immunologic biomarkers of progression of HIV-1infection and replication, MetSþARTþ patients exhibited signifi-cantly higher (P < 0.01) CD45þ, CD3þ and CD4þ T cell countscompared with the MetS–ARTþ group. As expected, in general,the groups using ART (groups 2 and 4) presented lower (P < 0.01)viral loads than the groups not taking ART. MetSþARTþ patientsshowed lower viral loads expressed either by copies/mL or log10than MetS–ART–, MetS–ARTþ, and MetSþART– patients.MetS–ART– patients also presented significantly lower viral loadsexpressed either by copies/mL or log10 than MetS–ART– andMetSþART– patients (Table 3). Additionally, WC was directlycorrelated with CD4þ (r ¼ 0.2740; P ¼ 0.0058) and CD8þ
(r ¼ 0.2014; P ¼ 0.0445) T-cell counts (Fig. 2).
Discussion
The main findings of the present study were that patientswith HIV-1 infection and MetS exhibited lower adiponectinlevels, higher oxidative stress, and lower viral loads, and hadhigher CD4þ T cells compared with patients with HIV-1 infectionwithout MetS. Patients with HIV-1 infection with MetS regard-less of ART use presented decreased adiponectin levels and redoximbalance. Overall, the present study reinforces the importanceof adiponectinemia and redox status in patients with MetS.
A previous study reported that among patients with HIV-1without treatment, the presence of MetS did not interfere withCD4þ T-cell counts or viral loads [22]. It is likely that the data ofthe present study differ from the previously reported databecause our MetS patients used PIs more frequently thanpatients withoutMetS did. Some retrospective studies reported ahigh prevalence of MetS among individuals treated with ARTand with particular PIs [23], whereas others did not report any
Fig. 2. Spearman correlation between waist circumference and CD4þ T-cell counts (A) (ramong patients with HIV-1 infection and metabolic syndrome.
association [24]. Thus, although the present study has demon-strated the importance of MetS in some disease progressionparameters, it is not possible to rule out the use of PIs as anothercause of HIV-1 disease progression.
It has been demonstrated that patients with MetS presentedhigher oxidative stress compared with healthy individuals [25].Previous studies suggest that oxidative stress plays a crucial roleduring HIV-1 pathogenesis, including viral replication, inflam-matory response, decreased immune cell proliferation, loss ofimmune function, chronic weight loss, and increased sensitivityto drug toxicity [4]. Additionally, several components of currentART regimens contribute to oxidative stress-induced distur-bances, such as CVD [4,26]. In the present study, HIV-1 infectedpatients withMetS showed a decrease in TRAP and an increase inlipid and protein prooxidant biomarkers. These data were inde-pendent of the presence of ART.
UA is a biomarker that predicts MetS [27] and is also directlyrelated to oxidative stress [25,28]. Insulin exerts a physiologicalaction on renal tubules, causing a reduction in UA clearance,which could explain the hyperuricemia observed in patientswith MetS. The UA increase is considered an important riskfactor for development of CVDs favoring oxidative stress andendothelial dysfunction, and is also involved in the pathophysi-ology of MetS [9,29]. UA can act as an antioxidant or prooxidantdepending on the background conditions of oxidative stress.Physiologically, UA is an important antioxidant moleculeresponsible for 60% of the scavenging activity of the free radicalsin human plasma. However, UA also may act as a prooxidantunder conditions of oxidative stress, such as MetS. UA canbecome a prooxidant by forming radicals in reactions with otheroxidants, and these radicals seem to target predominantly lipids,LDL-C and membranes, rather than other cellular components
¼ 0.2740, P ¼ 0.0058) and CD8þ T-cells counts (B) (r ¼ 0.2014; P ¼ 0.0445) obtained

H. K. Morimoto et al. / Nutrition 30 (2014) 1324–1330 1329
[29]. As in the present study, TRAP values could have beenoverestimated by hyperuricemia; the former was corrected byUA values [30]. It is worth noting that BMI was higher in HIV-1patients with MetS than without MetS. Many studies haveshown that obesity is a low-grade chronic inflammation processassociated with increased oxidative stress and proinflammatorycytokines [28,31,32]. However, in a previous study, it wasdemonstrated that overweight only increased oxidative stress inpatients with MetS, but not in those without MetS [30].
Adiponectin is an adipokine with anti-inflammatory andantioxidant properties [33]. Previous studies have demonstratedthat plasma adiponectin levels are decreased in patients withMetS [9,11,23,24]. A multicenter study showed that patients withHIV-1 and MetS exhibited reduced adiponectin levels [23].Another study [34] reported a decrease in adiponectin levels inpatients with HIV-1 infection and IR, one of the main patho-physiological factors in patients with MetS. Our data are inagreement with those studies, as it was found that patients withMetS exhibited lower adiponectin levels when compared withpatients without MetS. A previous study showed that PIs andsome NRTIs reduce adiponectin release by human adipocytesand increase reactive oxygen species production in parallel [15].In the present study, when the groups of HIV-1–infected patientswere subdivided according to presence or lack of MetS and ARTuse, a significant reduction in adiponectin levels was verifiedamong the groups that presented with MetS and increasedoxidative stress. The decrease in adiponectin levels withconcomitant increase in oxidative stress observed in theHIV-1–infected patients with MetS (groups 3 and 4) in thispresent study are partially in agreement with the in vitro resultsobtained previously [15]. However, different from the afore-mentioned study, the decrease in adiponectin levels in the pre-sent cohort seems to be mainly due to the presence of MetS andnot to the ART use.
One study [35] demonstrated that high levels of adiponectinare associated with a more beneficial oxidative profile in healthyindividuals. Oxidative stress is a relevant step toward regulatingadiponectin secretion at the level of adipose tissue. Reactiveoxygen species acts on adiponectin gene expression byincreasing the abundance of C/EBP homologous protein-10(CHOP-10), which forms a complex with CCAAT/enhancerbinding protein (C/EBP) beta, preventing its binding to the adi-ponectin promoter. However, adiponectin also modulates gen-eration of oxidative stress-related products. Adiponectin reducesoxidative stress in different cellular targets but the molecularmechanisms by which this action of adiponectin is exerted arestill unclear. Nevertheless, there is evidence that peroxisomeproliferator-activated receptor-a up-regulation increases theexpression of interleukin-10, ferritin heavy chain, and manga-nese superoxide dismutase [33]. Our data suggest the involve-ment of hypoadiponectinemia and ART use in the unfavorableredox state in HIV-1 patients with MetS. To our knowledge, thereis no study that has investigated oxidative stress and adiponectinlevels in HIV-1 patients with and without MetS to date.
Some studies have shown associations between HIV-1 viralload (HIV-VL) and risk for MetS. One study [36] showed signifi-cantly higher HIV-VL in those defined as having MetS than thosewithout MetS, in a cohort of 314 HIV-1–infected patients. Otherprevious studies have demonstrated that HIV-VL >50,000copies/mL conferred an increased risk for MetS in a large sampleof HIV-1–infected women [24]. This association has been previ-ously demonstrated [24,36] but in a non-homogeneous popula-tion of both naïve and treatment-experienced patients. Anotherstudy [37] reproduced this association in a more uniform cohort
of HIV-1 infected patients on stable ART use. However, these dataare still controversial and other studies failed to demonstrate anyassociation between HIV-VL and MetS [5,38,39]. In the presentstudy, the presence of MetS was not a determinant in explainingthe increase in HIV-VL but, as expected, the lack of ART use was.However, CD45þ, CD3þ, CD4þ, and CD8þ T-cell counts seeminfluenced by MetS, independently of ART use. MetS is a chronicinflammatory process that can provide an inflammatory stim-ulus favoring the aforementioned cell increases [28,40]. In in-flammatory chronic disease, secreted inflammatory mediatorscommunicate IR systemically, as well as locally, to recruitedleukocytes, biasing them toward an inflammatory phenotype.Additionally, obesity reorganizes the leukocyte landscape into aninsulin-resistant and proinflammatory milieu in which thetolerogenic leukocyte network is disrupted and replaced withinflammatory M1 macrophages (proinflammatory), CD8þ T cells,and CD4þ TH1 cells, and these lineages may exacerbate inflam-mation and disease. Shift of leukocytes also occurs in othersorgans, such as the pancreas and liver [40]. An integral role forresident leukocytes in local and tissue-specific manifestations ofmetabolic disease indicates that leukocyte dysregulation in evenone tissue bed increases systemic susceptibility to metabolicdisease. Although the results of the present study have demon-strated that both adiposity and MetS favor an inflammatorystimulus that may increase leukocyte counts, it is likely thatwhen the progression of the HIV-1 infection occurs, this stimulusmay be insufficient to maintain adequate cellular immunity, andthen ART use becomes indispensable.
When looking at the results obtained in the present study,some limitations have to be considered. First, the cross-sectionaldesign does not allow for inference causality. Second, althoughprevious studies have shown that MetS can be induced bythe inflammatory process and oxidative stress, we cannot un-derestimate the possible role of MetS in maintaining the afore-mentioned conditions.
Conclusion
HIV-1–infected patients with MetS exhibited hypo-adiponectinemia and increased oxidative stress, and thesefindings were not influenced by ART use. The findings of thepresent study suggest that MetS and inflammation are mainlyresponsible for the aforementioned features. More studies areneeded to verify whether drugs or food, which yield increasedadiponectinemia and decreased oxidative stress, could reducecardiovascular risk in HIV-infected patients.
References
[1] Carr A, Samaras K, Burton S, Law M, Freund J, Chisholm DJ, et al. A syn-drome of peripheral lipodystrophy, hyperlipidaemia and insulin resistancein patients receiving HIV protease inhibitors. AIDS 1998;12:F51–58.
[2] Lang S, Mary-Krause M, Cotte L, Gilquin J, Partisani M, Simon A, et al.Increased risk of myocardial infarction in HIV-infected patients in France,relative to the general population. AIDS 2010;24:1228–30.
[3] Grunfeld C. Insulin resistance in HIV infection: drugs, host response, orrestoration to health. Top HIV Med 2008;16:89–93.
[4] Kline ER, Sutliff RL. The roles of HIV-1 proteins and antiretroviral drugtherapy in HIV-1-associated endothelial dysfunction. J Investig Med2008;56:752–69.
[5] Estrada V, Martinez-Larrad MT, Gonzales-Sanchez JL, et al. Lipodystrophyand metabolic syndrome in HIV-infected patients treated with antiretro-viral therapy. Metabolism 2006;55:940–5.
[6] Bonfanti P, Giannattasio C, Ricci E, Facchetti R, Rosella E, Franzetti M, et al.HIV and metabolic syndrome. A comparison with the general population.Acquir Immune Defic Syndr 2007;45:426–31.
[7] Gulown K, Kamininski M, Darvas K, Süss D, Li-Weber M, Krammer PH. HIV-1 trans-activator of transcription substitutes for oxidative signaling inactivation-induced T cell death. J Immunol 2005;174:5249–60.
H. K. Morimoto et al. / Nutrition 30 (2014) 1324–13301330
[8] Aquaro S, Muscoli C, Ranazzi A, Pollicita M, Granato T, Masuelli L, et al. Thecontribuition of peroxinitrite generation in HIV replication in human pri-mary macrophages. Retrovirol 2007;4:76.
[9] Dichi I, Sim~ao ANC. Metabolic syndrome: new targets for an old problem.Expert Opin. Ther. Targets 2012;16:147–50.
[10] Sim~ao ANC, Lovozoy MAB, Dichi I. Oxidative Stress in Overweigh andObesity. In: Oxidative Stress in Chronic Diseases. 1st edition. Edited byDichi I, Bregan�o JW, Sim~ao ANC, Cecchini. Boca Raton: CRC Press; 2014:121-36.
[11] Matsuzawa Y, Funahashi T, Kihara S, Shimomura I. Adiponectin andmetabolic syndrome. Arterioscler Thromb Vasc Biol 2004;24:29–33.
[12] Caron-Debarle M, Lagathu C, Boccara F, Vigouroux C, Capeau J. HIV-asso-ciated lipodystrophy: from fat injury to premature aging. Trends Mol Med2010;16:218–29.
[13] Luo L, Zhang L, Tao M, Qiu Z, Xie J, Han Y, et al. Adiponectin and leptin levelsin Chineses patients with HIV-related lipodystrophy: a 30-month pro-spective study. AIDS Res Hum Retroviruses 2009;25:1265–72.
[14] Antonopoulos AS, Lee R, Margaritis M, Antoniades C. Adiponectin as aregulator of vascular redox state: therapeutic implications. Recent PatCardiovasc Drug Discov 2011;6:78–88.
[15] Lagathu C, Eustace B, Prot M, Frantz D, Gu Y, Bastard JP, et al. Some HIVantiretrovirals increase oxidative stress and alter chemokine, cytokine oradiponectin production in human adipocytes and macrophages. AntivirTher 2007;12:489–500.
[16] Grundy SM, Brewer HB, Cleeman JI, Smith SC, Lenfant C. Definition ofmetabolic syndrome. Report of the National Heart, lung, and Blood Insti-tute/American heart association conference on scientific issues related todefinition. Circulation 2004;109:433–8.
[17] Pickering TG, Hall JE, Appel LJ, Falkner BE, Graves J, Hill MN, et al. Rec-ommendations for blood pressure measurement in humans and experi-mental animals. Part 1: blood pressure measurement in humans: astatement for professionals from the Subcommittee of Professional andPublic Education of the American Heart Association Council on High BloodPressure Research. Hypertension 2005;45:142–61.
[18] Haffner SM, Miettinen H, Stern MP. The homeostasis model in the SanAntonio Heart Study. Diabetes Care 1997;20:1087–92.
[19] Flecha BG, Llesuy S, Boveris A. Hydroperoxide-initiated chem-iluminescence: an assay for oxidative stress in biopsies of heart, liver, andmuscle. Free Rad Biol Med 1991;10:93–100.
[20] Witko-Sarsat V, Friedlander M, Khoa TN, Capeillere-Blandin C, Nguyen AT,Canteloup S, et al. Advanced oxidation protein products as novel mediatorsof inflammation and monocyte activation in chronic renal failure. JImmunol 1998;161:2524–32.
[21] Repetto M, Reides C, Carretero MLG, Costa M, Griemberg G, Llesuy S.Oxidative stress in blood of HIV infected patients. Clin Chim Acta1996;255:107–17.
[22] Bonfanti P, De Socio GV, Ricci E, Antinori A, Martinelli C, Vichi F, et al. Thefeature of metabolic syndrome in HIV naive patients is not the same ofthose treated: results from a prospective study. Biomed Pharmacother2012;66:348–53.
[23] Samara K, Wand H, Law M, Emery S, Cooper D, Carr A. Prevalence ofmetabolic syndrome in HIV-infected patients receiving highly active anti-retroviral therapy using International Diabetes Foundation and Adult
Treatment Panel III criteria: associations with insulin resistance, disturbedbody fat compartmentalization, elevated C-reactive protein, and [cor-rected] hypoadiponectinemia. Diabetes Care 2007;30:113–9.
[24] Sobieszczyk ME, Hoover DR, Anatos K, Mulligan K, Tan T, shi Q, et al.Prevalence and predictors of metabolic syndrome among HIV-infected andHIV-uninfected women in the Women’s Interagency HIV Study. J AcquirImmune Defic Syndr 2008;48:272–80.
[25] Sim~ao ANC, Dichi JB, Barbosa DS, Cecchini R, Dichi I. Influence of uric acidand gamma-glutamyltransferase on total antioxidant capacity and oxidativestress in patients with metabolic syndrome. Nutrition 2008;24:675–81.
[26] Blas-Garc�ıa A, Apostolova N, Esplugues JV. Oxidative stress and mito-chondrial impairment after treatment with Anti-HIV drugs: clinical com-plications. Curr Pharm Des 2011;17:4076–86.
[27] Choi HK, Ford ES. Prevalence of the MS in individuals with hyperuricemia.Am J Med 2007;120:442–7.
[28] Lumeng CN, Saltiel AR. Inflammatory links between obesity and metabolicsyndrome. J Clin Invest 2011;121:2111–7.
[29] Sim~ao ANC, Lozovoy MAB, Dichi I. The uric acid metabolism pathway as atherapeutic target in hyperuricemia related to metabolic syndrome. ExpertOpin Ther Targets 2012;16:1175–87.
[30] Venturini D, Sim~ao AN, Scripes NA, Bahls LD, Melo PA, Belinetti FM, et al.Evaluation of oxidative stress in overweight subjects with or withoutmetabolic syndrome. Obesity 2012;20:2361–6.
[31] Tamakoshi K, Yatsuya H, Kondo T, Hori Y, Ishikawa M, Zhang H, et al. Themetabolic syndrome is associated with elevated circulating C-reactiveprotein in healthy reference range, a systemic low-grade inflammatorystate. Int J Obes Relat Metab Disord 2003;27:443–9.
[32] Warnberg J, Nova E, Moreno LA, Romeu J, Mesana MI, Ruiz JR, et al. Inflam-matory proteins are related to total and abdominal adiposity in a healthyadolescent population: the AVENA study. Am J Clin Nutr 2006;84:505–12.
[33] Parolla M, Marra F. Addipokines and redox signaling: impact on fatty liverdisease. Antioxid Redox Signal 2011;15:461–83.
[34] Arama V, Tiliscan C, Streinu-Cercel A, Ion D, Mihailescu R, Munteanu D,et al, SLD-ART study group. Insulin resistance and adipokines serum levelsin a caucasian cohort of HIV-positive patients undergoing antiretroviraltherapy: a cross-sectional study. BMC Endocr Disord 2013;13:4.
[35] Gustafsson S, Lind L, Söderberg S, Zilmer M, Hulthe J, Ingenson E. Oxidativestress and inflammatory markers in relation to circulating levels of adi-ponectin. Obesity (Silver Spring) 2012;21:1467–73.
[36] Mangili A, Jacobson DL, Gerrior J, Polak JF, Gorbach SL, Wanke CA. Meta-bolic syndrome and subclinical atherosclerosis in patients infected withHIV. Clin Infect Dis 2007;44:1368–74.
[37] Squillace N, Zona S, Stentarelli C, Orlando G, Beghetto B, Nardini G, et al.Detectavble HIV viral load associated with metabolic syndrome. J AcquirImmune Defic Syndr 2009;52:459–64.
[38] Jerico C, Knobel H, Montero M, Ordonez-Llanos J, Guelar A, Gimena JL, et al.Metabolic syndrome among HIV-infected patients: prevalence, character-istic, and related factors. Diabetes Care 2005;28:132–7.
[39] Wand H, Calmy A, Carey DL, Samaras K, Carr A, Law MG, et al. Metabolicsyndrome, cardiovascular disease and type 2 diabetes mellitus after initi-ation of antiretroviral therapy in HIV infection. AIDS 2007;21:2445–53.
[40] Odegaard JI, Chawla A. Pleiotropic actions of insulin resistance andinflammation in metabolic homeostasis. Science 2013;339:172–7.