Lipid profiles in HIV-infected patients receiving combination antiretroviral therapy: Are different...
19
1056 • JID 2004:189 (15 March) • Fontas et al. MAJOR ARTICLE Lipid Profiles in HIV-Infected Patients Receiving Combination Antiretroviral Therapy: Are Different Antiretroviral Drugs Associated with Different Lipid Profiles? E. Fontas, 1,a F. van Leth, 3,a C. A. Sabin, 5 N. Friis-Møller, 6 M. Rickenbach, 8 A. d’Arminio Monforte, 9 O. Kirk, 7 M. Dupon, 2 L. Morfeldt, 10 S. Mateu, 11 K. Petoumenos, 12 W. El-Sadr, 13 S. de Wit, 14 J. D. Lundgren, 5 C. Pradier, 1 and P. Reiss 4 , for the D:A:D Study Group b 1 Nice Cohort, Infectious Diseases Department, Nice University Hospital, Nice, and 2 Aquitaine, Section Biostatistique, Bordeaux University Hospital, Bordeaux, France; 3 International Antiviral Therapy Evaluation Center, and 4 AIDS Therapy Evaluation Project Netherlands Study Group and Department of Infectious Diseases, Tropical Medicine and AIDS, Academic Medical Center, University of Amsterdam, Amsterdam, The Netherlands; 5 Royal Free Centre for HIV Medicine and Department of Primary Care and Population Sciences, Royal Free and University College Medical School, London, United Kingdom; 6 Data Collection on Adverse Events of Anti-HIV Drugs Study Coordinating Centre, and 7 EuroSIDA, Copenhagen HIV Programme, Hvidovre University Hospital, Copenhagen, Denmark; 8 Swiss HIV Cohort Study, Division of Epidemiology, Centre Hospitalier Universitaire (CHU) Vaudois, University of Lausanne, Lausanne, Switzerland; 9 Italian Cohort of Naive for Antiretrovirals, Department of Infectious Diseases, L. Sacco Hospital, University of Milan, Milan, Italy; 10 HivBivus, Department of Infectious Diseases, Karolinska Hospital, Stockholm, Sweden; 11 Barcelona Antiretroviral for Surveillance Study, Department of Clinical Pharmacology and Therapeutics, Autonomous University of Barcelona, Barcelona, Spain; 12 Australian HIV Observational Database, National Centre in HIV Epidemiology and Clinical Research, University of New South Wales, Sydney, Australia; 13 Community Programs for Clinical Research on AIDS, Division of Epidemiology, Columbia University School of Public Health, New York, New York; 14 Brussels St. Pierre Cohort, Department of Infectious Diseases, CHU Saint Pierre Hospital, Brussels, Belgium Levels of triglycerides (TG), total cholesterol (TC), low-density lipoprotein cholesterol (LDL-c), and high-density lipoprotein cholesterol (HDL-c), as well as the TC:HDL-c ratio, were compared in patients receiving different antiretroviral therapy regimens. Patients receiving first-line regimens including protease inhibitors (PIs) had higher TC and TG levels and TC:HDL-c ratios than did antiretroviral-naive patients; patients receiving 2 PIs had higher levels of each lipid. Ritonavir-containing regimens were associated with higher TC and TG levels and TC:HDL-c ratios than were indinavir-containing regimens; however, receipt of nelfinavir was associated with reduced risk of lower HDL-c levels, and receipt of saquinavir was associated with lower TC:HDL-c ratios. Patients receiving non- nucleoside reverse-transcriptase inhibitors had higher levels of TC and LDL-c than did antiretroviral-naive patients, although the risk of having lower HDL-c levels was lower than that in patients receiving a single PI. Efavirenz was associated with higher levels of TC and TG than was nevirapine. The etiology of coronary heart disease (CHD) is mul- tifactorial [1, 2]. Among other factors, high levels of Received 3 June 2003; accepted 7 September 2003; electronically published 2 March 2004. Reprints or correspondence: Dr. Caroline A. Sabin, Dept. of Primary Care and Population Sciences, Royal Free and University College Medical School, Rowland Hill St., London NW3 2PF, UK ([email protected]). Financial support: Health Insurance Fund Council, Amstelveen, The Netherlands (grant CURE/97-46486 to AIDS Therapy Evaluation Project Netherlands); Agence Nationale de Recherches sur le SIDA (Action Coordonne ´e no. 7, Cohortes, grant to the Aquitaine Cohort); Commonwealth Department of Health and Ageing; Australian National Council on AIDS, Hepatitis C, and Related Diseases (grant to Australian HIV Observational Database); Fondo de Investigacio ´n Sanitaria (grant FIS 99/0887) and Fundacio ´n para la Investigacio ´n y la Prevencio ´n del SIDA en Espana ˜ (grant FIPSE 3171/00) (both to the Barcelona Antiretroviral Surveillance Study); National Institutes of Health The Journal of Infectious Diseases 2004; 189:1056–74 2004 by the Infectious Diseases Society of America. All rights reserved. 0022-1899/2004/18906-0014$15.00 low-density lipoprotein cholesterol (LDL-c) [3, 4] and low levels of high-density lipoprotein cholesterol (HDL- (grants 5U01AI042170-10 and 5U01AI046362-03 to the Terry Beirn Community Programs for Clinical Research on AIDS); European Commission BIOMED 1 (grant CT94-1637) and BIOMED 2 (grant CT97-2713) programs and the fifth framework program (grant QLK2-2000-00773); Bristol-Myers Squibb, GlaxoSmithKline, Boehringer Ingelheim, and Roche (grants to the EuroSIDA Study); Glaxo Wellcome, Italy (unrestricted educational grant to the Italian Cohort Naive to Antiretorivals network); Swiss National Science Foundation (grant 3345-062041 to the Swiss HIV Cohort Study); Oversight Committee for the Evaluation of Metabolic Complications of HAART (a collaborative committee with representation from academic institutions, the European Agency for the Evaluation of Medicinal Products, the US Food and Drug Administration, the community of patients, and all pharmaceutical companies with licensed anti-HIV drugs in the US market, including Abbott, Agouron, Boehringer Ingelheim, Bristol-Myers Squibb, GlaxoSmithKline, Merck, Pfizer, and Hoffman–La Roche). a E.F. and F.v.L. contributed equally to the preparation of the manuscript. b Study group members are listed after the text.
-
Upload
independent -
Category
Documents
-
view
1 -
download
0
Transcript of Lipid profiles in HIV-infected patients receiving combination antiretroviral therapy: Are different...

1056 • JID 2004:189 (15 March) • Fontas et al.
M A J O R A R T I C L E
Lipid Profiles in HIV-Infected Patients ReceivingCombination Antiretroviral Therapy: Are DifferentAntiretroviral Drugs Associated with DifferentLipid Profiles?
E. Fontas,1,a F. van Leth,3,a C. A. Sabin,5 N. Friis-Møller,6 M. Rickenbach,8 A. d’Arminio Monforte,9 O. Kirk,7 M. Dupon,2
L. Morfeldt,10 S. Mateu,11 K. Petoumenos,12 W. El-Sadr,13 S. de Wit,14 J. D. Lundgren,5 C. Pradier,1 and P. Reiss4,for the D:A:D Study Groupb
1Nice Cohort, Infectious Diseases Department, Nice University Hospital, Nice, and 2Aquitaine, Section Biostatistique, Bordeaux University Hospital,Bordeaux, France; 3International Antiviral Therapy Evaluation Center, and 4AIDS Therapy Evaluation Project Netherlands Study Group and Departmentof Infectious Diseases, Tropical Medicine and AIDS, Academic Medical Center, University of Amsterdam, Amsterdam, The Netherlands; 5Royal Free Centrefor HIV Medicine and Department of Primary Care and Population Sciences, Royal Free and University College Medical School, London, United Kingdom;6Data Collection on Adverse Events of Anti-HIV Drugs Study Coordinating Centre, and 7EuroSIDA, Copenhagen HIV Programme, Hvidovre University Hospital,Copenhagen, Denmark; 8Swiss HIV Cohort Study, Division of Epidemiology, Centre Hospitalier Universitaire (CHU) Vaudois, University of Lausanne, Lausanne,Switzerland; 9Italian Cohort of Naive for Antiretrovirals, Department of Infectious Diseases, L. Sacco Hospital, University of Milan, Milan, Italy; 10HivBivus,Department of Infectious Diseases, Karolinska Hospital, Stockholm, Sweden; 11Barcelona Antiretroviral for Surveillance Study, Department of ClinicalPharmacology and Therapeutics, Autonomous University of Barcelona, Barcelona, Spain; 12Australian HIV Observational Database, National Centre in HIVEpidemiology and Clinical Research, University of New South Wales, Sydney, Australia; 13Community Programs for Clinical Research on AIDS, Divisionof Epidemiology, Columbia University School of Public Health, New York, New York; 14Brussels St. Pierre Cohort, Department of Infectious Diseases, CHUSaint Pierre Hospital, Brussels, Belgium
Levels of triglycerides (TG), total cholesterol (TC), low-density lipoprotein cholesterol (LDL-c), and high-densitylipoprotein cholesterol (HDL-c), as well as the TC:HDL-c ratio, were compared in patients receiving differentantiretroviral therapy regimens. Patients receiving first-line regimens including protease inhibitors (PIs) had higherTC and TG levels and TC:HDL-c ratios than did antiretroviral-naive patients; patients receiving 2 PIs had higherlevels of each lipid. Ritonavir-containing regimens were associated with higher TC and TG levels and TC:HDL-cratios than were indinavir-containing regimens; however, receipt of nelfinavir was associated with reduced risk oflower HDL-c levels, and receipt of saquinavir was associated with lower TC:HDL-c ratios. Patients receiving non-nucleoside reverse-transcriptase inhibitors had higher levels of TC and LDL-c than did antiretroviral-naive patients,although the risk of having lower HDL-c levels was lower than that in patients receiving a single PI. Efavirenz wasassociated with higher levels of TC and TG than was nevirapine.
The etiology of coronary heart disease (CHD) is mul-
tifactorial [1, 2]. Among other factors, high levels of
Received 3 June 2003; accepted 7 September 2003; electronically published 2March 2004.
Reprints or correspondence: Dr. Caroline A. Sabin, Dept. of Primary Care andPopulation Sciences, Royal Free and University College Medical School, RowlandHill St., London NW3 2PF, UK ([email protected]).
Financial support: Health Insurance Fund Council, Amstelveen, The Netherlands (grantCURE/97-46486 to AIDS Therapy Evaluation Project Netherlands); Agence Nationale deRecherches sur le SIDA (Action Coordonnee no. 7, Cohortes, grant to the AquitaineCohort); Commonwealth Department of Health and Ageing; Australian National Councilon AIDS, Hepatitis C, and Related Diseases (grant to Australian HIV ObservationalDatabase); Fondo de Investigacion Sanitaria (grant FIS 99/0887) and Fundacion para laInvestigacion y la Prevencion del SIDA en Espana (grant FIPSE 3171/00) (bothto the Barcelona Antiretroviral Surveillance Study); National Institutes of Health
The Journal of Infectious Diseases 2004; 189:1056–74� 2004 by the Infectious Diseases Society of America. All rights reserved.0022-1899/2004/18906-0014$15.00
low-density lipoprotein cholesterol (LDL-c) [3, 4] and
low levels of high-density lipoprotein cholesterol (HDL-
(grants 5U01AI042170-10 and 5U01AI046362-03 to the Terry Beirn CommunityPrograms for Clinical Research on AIDS); European Commission BIOMED 1 (grantCT94-1637) and BIOMED 2 (grant CT97-2713) programs and the fifth frameworkprogram (grant QLK2-2000-00773); Bristol-Myers Squibb, GlaxoSmithKline, BoehringerIngelheim, and Roche (grants to the EuroSIDA Study); Glaxo Wellcome, Italy(unrestricted educational grant to the Italian Cohort Naive to Antiretorivals network);Swiss National Science Foundation (grant 3345-062041 to the Swiss HIV CohortStudy); Oversight Committee for the Evaluation of Metabolic Complications of HAART(a collaborative committee with representation from academic institutions, theEuropean Agency for the Evaluation of Medicinal Products, the US Food and DrugAdministration, the community of patients, and all pharmaceutical companies withlicensed anti-HIV drugs in the US market, including Abbott, Agouron, BoehringerIngelheim, Bristol-Myers Squibb, GlaxoSmithKline, Merck, Pfizer, and Hoffman–LaRoche).
a E.F. and F.v.L. contributed equally to the preparation of the manuscript.b Study group members are listed after the text.

Effect of PI and NNRTI on Lipid Profiles • JID 2004:189 (15 March) • 1057
c) [5–7] have been identified as risk factors for CHD in the
general population.
HIV-infected patients generally experience a decrease in HDL-
c and LDL-c levels, followed by an increase in plasma triglyceride
(TG) levels, in the years before they develop AIDS [8, 9]. The
treatment of HIV infection with protease inhibitors (PIs) and
nonnucleoside reverse-transcriptase inhibitors (NNRTIs) is also
associated with several metabolic disorders [10, 11], including
dyslipidemia, which may result in an increased risk of CHD [12–
17]. PI-containing combination antiretroviral therapy (CART),
in particular, is associated with increased TG, total cholesterol
(TC), and LDL-c levels [13, 15, 18–20]. There are data sug-
gesting that the extent of these metabolic disturbances could
differ according to different drugs within the PI class itself [11,
15, 19, 21–24]. Although regimens including an NNRTI may
induce increases in TC and LDL-c levels, they may also induce
a concurrent increase in HDL-c levels, in contrast to what is
observed with PI-containing CART [25]. Less data are available
on the comparison between different NNRTIs [26, 27], and the
results of those studies are inconsistent. More recently, some
studies have suggested that nucleoside reverse-transcriptase in-
hibitors (NRTIs) may also contribute to the development of
dyslipidemia [28, 29].
The possible relationship between receipt of CART and the
development of CHD has been investigated in studies of various
designs, with conflicting results [30–32]. The Data Collection
on Adverse Events of Anti-HIV Drugs (D:A:D) study recently
reported a 26% increase in the risk of myocardial infarction
(MI) per year of exposure to CART [33]. In the present study,
we use data collected as part of the baseline D:A:D data set to
perform a cross-sectional comparison of lipid profiles in pa-
tients enrolled in the D:A:D study who were receiving different
PIs and NNRTIs at enrollment. Furthermore, we also report
the results of a comparison of lipid profiles in patients receiving
specific drugs within each class. Although we have chosen not
to focus on the NRTIs received, all analyses do control for the
current and previous use of different NRTIs.
SUBJECTS, MATERIALS, AND METHODS
Study Population
The D:A:D study is a prospective observational study formed
by the collaboration of 11 previously established cohorts of
HIV-infected patients. The primary aim of the study is to es-
tablish whether an association exists between the use of CART
(defined in the study as any combination antiretroviral drug
regimen containing a PI and/or a NNRTI) and an increased
risk of CHD. The 11 cohorts currently contribute data on
123,000 HIV-infected patients monitored at 188 clinics in the
United States, Australia, and 19 countries in Europe. This article
presents a cross-sectional analysis of information collected as
part of the baseline D:A:D data set. Two of the 11 cohorts that
are part of the D:A:D study (the CPCRA cohort from the
United States and the St. Pierre Cohort from Belgium) did not
submit data until a later stage and have not been included in
this analysis. Thus, the total potential study population for the
current analyses contains 17,852 patients from 9 of the 11
cohorts.
The D:A:D study methodology has been described in detail
elsewhere [34]. In brief, patients eligible for inclusion in the
D:A:D study were all being actively followed up at the time of
initiation of the D:A:D protocol, irrespective of antiretroviral
treatment status. Patients were followed prospectively, and data
were obtained during visits to outpatient clinics scheduled as
part of regular medical care. Patients were enrolled between 1
December 1999 and 1 April 2001. At enrollment, and at least
every 8 months thereafter, standardized data collection forms
were completed. Data collected include sociodemographic
characteristics, clinical data (AIDS events and known risk fac-
tors for CHD), laboratory markers (CD4 cell counts, HIV RNA
load, and TC, HDL-c, and TG levels, where available), and
treatment variables (antiretroviral treatment and drugs that
may modify lipid levels or risk of CHD). Lipid levels were not
required to be obtained after an overnight fast, although, where
possible, information was obtained on whether fasting or non-
fasting samples had been analyzed. All collected data were trans-
formed into a standardized format and transferred to the co-
ordinating center (Copenhagen HIV Programme, Hvidovre
Hospital, Denmark) as anonymized computerized files, where
they are merged into a central data set.
Comparisons Performed
Two sets of analyses were performed: first, a between-class com-
parison of lipid profiles for patients receiving their first CART
regimen including either a PI or an NNRTI at enrollment in the
D:A:D study, and, second, a within-class comparison of lipid
profiles for patients receiving specific drugs within each class.
Between-class comparison. For this analysis, we selected
patients from the overall D:A:D cohort who, at the time of
enrollment, were either antiretroviral naive or were receiving a
first-line CART regimen that included either 1 PI (denoted as
“single PI”), 2 PIs (denoted as “dual PI”), or 1 NNRTI. Al-
though patients were receiving first-line CART regimens, they
could have previously used NRTIs. Information with regard to
the dose of ritonavir (RTV) received was not available; thus, it
was not possible to distinguish between patients receiving dual-
PI regimens in which RTV was used at a low dose for pharma-
cologic boosting of the other PI and patients receiving dual-PI
regimens in which RTV was used at higher doses with intrinsic
antiretroviral activity.
Within-class comparison. For this analysis, we selected
all patients who were receiving either a PI-containing or an

1058 • JID 2004:189 (15 March) • Fontas et al.
NNRTI-containing regimen at enrollment in the D:A:D study.
To maximize the power of the analyses and because some of
the PIs and NNRTIs were predominantly used in antiretroviral-
experienced patients, this comparison included all patients re-
ceiving these drugs, irrespective of treatment history.
For this within-class comparison, the effect on lipid profiles
of various antiretroviral agents was evaluated via 2 sets of analy-
ses. The first analysis considered patients receiving PI-containing
regimens and compared lipid profiles in patients receiving com-
binations including indinavir (IDV), nelfinavir (NLF), saquinavir
(SQV; soft-gel and hard-gel formulations were studied jointly),
amprenavir (AMP), RTV, 2 PIs including RTV, and 2 PIs not
including RTV. The group receiving IDV alone was designated
as the reference group for this analysis. As before, information
concerning the dose of RTV received was not available. The
second analysis considered patients receiving efavirenz (EFV)
and nevirapine (NVP). The NVP group was designated as the
reference group. The number of patients receiving other PIs or
NNRTIs was too small for comparison; therefore, these patients
have been excluded.
Definitions of Dyslipidemia
The association between dyslipidemia at enrollment in D:A:D
and the drugs received was explored by use of the following
dependent variables: TC, HDL-c, and TG levels; TC:HDL-c
ratio; and, for the between-class comparison only, LDL-c level
(calculated by use of the Friedewald formula only when fasting
values were available and when TG level was !4.52 mmol/L
[35]; otherwise, LDL-c level was treated as missing). In each
case, patients were classified as having dyslipidemia if their lipid
level at enrollment was above (or, for HDL-c, below) a pre-
specified threshold level, as described elsewhere [34]. The
threshold levels for TC (�6.2 mmol/L), HDL-c (�0.9 mmol/
L), LDL-c (�4.1 mmol/L), and TG (�2.3 mmol/L) were based
on cutoff values for high risk of CHD, as recommended in the
US National Cholesterol Education Program (NCEP) guide-
lines [36]. A cutoff value for the TC:HDL-c ratio was not
defined in the NCEP guidelines and was therefore chosen as
�6.5, on the basis of other published studies, to define a group
at high risk of CHD [2, 37].
Statistical Methods
The associations between the different treatment groups and var-
iables of interest were studied in univariable analyses by use of
the x2 test, for categorical variables, and by use of the Kruskal-
Wallis test, for continuous variables. Unless otherwise stated, all
P values reflect global comparisons across all treatment groups.
The relationships between the dependent variables (TC, HDL-
c, LDL-c, and TG levels and TC:HDL-c ratio) and treatment
group were studied by use of multiple logistic regression mod-
els. Associations were considered to be statistically significant
if . All statistical analyses were performed by use of Sta-P ! .05
tistical Analysis Software (version 6.12; SAS Institute).
The relationships between the dependent variables and treat-
ment group were adjusted for demographic factors (i.e., age
and sex), known risk factors for CHD (i.e., history of MI or
stroke before age 50 years in first-degree relatives, personal
history of MI or stroke, body mass index [BMI, classified sim-
ilarly for both sexes as !18 kg/m2, 18–26 kg/m2, 26.1–30 kg/m2,
and 130 kg/m2], smoking status [current, ex-smoker, unknown],
presence of physician-reported lipodystrophy, hypertension [sys-
tolic blood pressure �150 mmHg and/or diastolic blood pres-
sure �100 mmHg] or use of antihypertensive agents, diabetes
or use of antidiabetic agents, and use of lipid-lowering or an-
tiplatelet agents), and HIV-related variables (i.e., log2 CD4 T
cell count and log10 HIV RNA load at entry to the D:A:D study,
AIDS stage [defined according to 1993 CDC clinical classifi-
cation] [38], and HIV risk group [homosexual or bisexual,
heterosexual, injecting drug user, or other/unknown]). All re-
gression analyses were also adjusted for cohort, which captures
some differences in risk-factor profiles in different geographic
regions. Because the EuroSIDA cohort includes patients from
across Europe, with a wide gradient in both cardiovascular risk
and risk-factor profiles, this cohort was further divided into 3
subcohorts for the purposes of adjustment: EuroSIDA North,
EuroSIDA Central, and EuroSIDA South [39].
Adjustment for treatment history and the use of other con-
comitant NRTIs was performed differently for the 2 compar-
isons. For the between-class comparison, the analyses were ad-
justed to take into account the NRTIs received as part of the
current treatment combination, the cumulative duration of ex-
posure to NRTIs and to the current CART regimen at entry to
the D:A:D study, and the duration of time receiving the current
regimen (which were all set to zero for untreated patients).
Because this comparison included an untreated group, it was
not possible to adjust for the year of initiation of antiretroviral
therapy. In contrast, patients included in the within-class com-
parison were all receiving CART at enrollment in the D:A:D
study. Thus, for this comparison, analyses were adjusted for
the NRTIs received as part of the current treatment combi-
nation, the year of antiretroviral therapy initiation, and whether
the individual was antiretroviral naive at the time of initiating
the PI or NNRTI. In addition, because patients in this group
may have been heavily treatment experienced, the analyses also
adjusted for previous exposure to treatment by adjusting for
the number of and cumulative duration of exposure to NRTIs,
PIs, and NNRTIs at entry to the D:A:D study.
Sensitivity AnalysesTo confirm the robustness of the findings, several sensitivity
analyses were performed, including analyses of lipid measure-

Effect of PI and NNRTI on Lipid Profiles • JID 2004:189 (15 March) • 1059
Table 1. Characteristics of patients at time of enrollment in the Data Collection on Adverse Events of Anti-HIV Drugs study cohort:between-class comparison.
CharacteristicTotal
(N p 7483)Antiretroviral-naive
(n p 2315)Single PI
(n p 3444)Dual PI
(n p 607)NNRTI
(n p 1117) Pa
Female, % 24.0 31.5 20.7 16.3 22.7 .001
Age, median (IQR), years 38 (34–44) 36 (32–41) 39 (35–46) 39 (35–46) 38 (33–44) .0001
BMI, median (IQR) 23.1 (21.1–25.2) 22.9 (20.9–25.2) 23.2 (21.3–25.3) 22.9 (21.3–25.2) 22.9 (20.9–25.2) .04
HIV RNA load !500 copies/mL, % 38.8 17.1 81.7 84.0 75.1 .0001
CD4 cell count, median (IQR), cells/mm3 470 (309–667) 463 (305–658) 470 (308–670) 467 (302–657) 490 (320–686) .07
Previous AIDS, % 19.9 7.8 27.6 33.9 16.4 .0001
HIV risk behavior, %
Homosexual 39.7 30.0 41.5 54.2 45.8
Heterosexual 30.6 35.2 28.7 27.2 28.0
IDU 23.7 29.9 23.0 13.5 18.6
Other/unknown 6.2 4.9 6.9 5.1 7.6 .001
Year of starting antiretroviral therapy,median (IQR) … … 1997 (1996–1998) 1996 (1995–1998) 1998 (1996–1999) .0001
Antiretroviral naive at start of currentregimen, % … … 56.6 50.1 55.0 .01
No. of NRTIs exposed to by entry instudy, median (IQR) … … 2 (2–4) 3 (2–4) 2 (2–4) .0001
Cumulative exposure to NRTIs, median(IQR), years … … 2.7 (1.8–3.9) 3.1 (1.7–4.2) 1.7 (0.8–3.3) .0001
Cumulative exposure to current CARTregimen, median (IQR), years … … 2.4 (1.5–3.1) 2.8 (1.7–3.4) 1.1 (0.6–1.5) .0001
No. of NRTIs received as part of regimen
Zidovudine … … 51.0 44.5 48.7 .009
Didanosine … … 14.0 10.1 24.2 .001
Zalcitabine … … 2.6 0.8 1.5 .004
Stavudine … … 47.2 51.2 45.5 .07
Lamivudine … … 83.4 74.6 74.8 .001
Abacavir … … 1.4 2.1 4.0 .001
NOTE. BMI, body mass index; CART, combination antiretroviral therapy; IDU, injecting drug user; IQR, interquartile range; NNRTI, nonnucleoside reverse-transcriptase inhibitor; NRTI, nucleoside reverse transcriptase inhibitor; PI, protease inhibitor.
a Comparisons of variables related to treatment exposure were performed across the 3 treatment groups, after excluding the group of patients who wereantiretroviral naive at baseline.
ments known to be from fasting patients only, analyses that
only included cohorts for whom lipid values were routinely
measured in the majority of patients (cohorts were excluded
from this analysis if 110% of data were missing for TC and
TG levels and if 130% of data were missing for HDL-c and
LDL-c levels and TC:HDL-c ratio), and, for the within-class
comparison only, analyses based on the subpopulation of pa-
tients who were antiretroviral naive at the time of starting the
current PI or NNRTI. Because of the smaller numbers of pa-
tients with fasting values available at enrollment, analyses of
these measurements were not adjusted for current use of NRTIs
at enrollment. Furthermore, because of the very small numbers
of LDL-c level measurements included in the between-class
comparison, these were not included in sensitivity analyses.
RESULTS
Between-Class Comparison
A total of 7483 patients from the D:A:D cohort were either an-
tiretroviral naive ( [31%]) or were receiving a CARTn p 2315
regimen containing a single PI ( [46%]), a dual PI (nn p 3444
p607 [8%], 95% of whom used RTV), or an NNRTI (np1117
[15%]) for the first time at time of enrollment in the D:A:D
study. These 7483 patients were included in the between-class
comparison.
Patients receiving therapy were significantly older and more
likely to be male than were antiretroviral-naive patients (table
1). Between 75% and 84% of patients in the different CART
groups had an HIV RNA load !500 copies/mL, compared with

1060 • JID 2004:189 (15 March) • Fontas et al.
Table 2. Percentage of patients with known risk factors for coronary heart disease (CHD) or increased lipid levels, at time ofenrollment in the Data Collection on Adverse Events of Anti-HIV Drugs study cohort: between-class comparison.
CharacteristicTotal
(N p 7483)Antiretroviral-naive
(n p 2315)Single PI
(n p 3444)Dual PI
(n p 607)NNRTI
(n p 1117) P
Current smoker 44.5 49.3 43.1 45.9 38.0 .001
Lipodystrophy 16.6 2.2 24.4 33.3 13.5 .001
Previous cardiovascular event 0.9 0.6 0.9 1.2 1.1 .30
Hypertension (or use of antihypertensive agents) 6.8 5.9 7.7 7.4 5.3 .007
Use of antiplatelet agents 0.8 0.3 1.0 0.9 1.0 .001
Use of lipid-lowering agents 2.3 0.2 3.6 5.6 0.6 .001
Diabetes mellitus (or use of antidiabetic agents) 1.7 1.2 2.4 1.2 1.3 .003
Family history of CHD 7.8 8.6 7.5 8.9 6.7 .19
NOTE. NNRTI, nonnucleoside reverse-transcriptase inhibitor; PI, protease inhibitor.
only 17% of patients who were antiretroviral naive. Patients
receiving CART were more likely to have had an AIDS-defining
illness, although 8% of antiretroviral-naive patients were also
reported to have prior AIDS. Patients receiving a single PI–
containing regimen had been receiving their current PI for a
median of 2.4 years, whereas patients receiving dual PI–con-
taining regimens had been receiving these PIs for a median of
2.8 years. Patients receiving an NNRTI-containing regimen had
been exposed to their current regimen for a median of 1.1 years.
Cumulative exposure time to NRTIs differed significantly be-
tween the groups: 2.7, 3.1, and 1.7 years, for single PI–containing,
dual PI–containing, or NNRTI-containing CART, respectively.
Patients receiving therapy were less likely to be current smokers
but were more likely to have lipodystrophy, diabetes, and hy-
pertension and to be using antiplatelet or lipid-lowering drugs
than antiretroviral-naive patients (table 2).
Information on the number of patients with available lipid
measurements, including measurements obtained after patients
had fasted overnight, and the median concentrations of the
lipids and lipoproteins at enrollment in the D:A:D study are
shown, by therapy class, in table 3. Patients who were antiret-
roviral naive had the lowest TC and LDL-c levels, whereas levels
in the 3 treated groups were higher, particularly in patients
receiving dual PI–containing regimens. Similar patterns were
seen for TG levels, with the lowest levels in patients who were
antiretroviral naive and the highest levels in patients receiv-
ing PIs, although TG levels in patients receiving NNRTIs were
similar to those in antiretroviral-naive patients. Median HDL-
c levels did not differ greatly between patients who were an-
tiretroviral naive and patients receiving PI-containing regi-
mens, although levels were slightly higher in patients receiving
NNRTIs-containing regimens. As a result, trends in the TC:
HDL-c ratio generally mirrored those in TC levels, with the
exception of the NNRTI group, in which the ratio was similar
to that in antiretroviral-naive patients.
The prevalence of dyslipidemia in patients receiving each
CART regimen is shown in figure 1. For TC levels, the prevalence
of dyslipidemia was lowest in antiretroviral-naive patients and
progressively increased in patients receiving an NNRTI-contain-
ing regimen, a single PI–containing regimen, and a dual PI–
containing regimen, respectively. A similar trend was also seen
in LDL-c and TG levels and TC:HDL-c ratio. In terms of a low
HDL-c level, however, the prevalence of dyslipidemia was lower
in patients receiving NNRTIs than in patients in all other groups.
Compared with antiretroviral-naive patients (reference
group) and after adjustment for other potential confounding
factors, patients receiving either a single PI– or a dual PI–
containing regimen had a statistically significantly higher risk
of dyslipidemia with respect to TG level and TC:HDL-c ratio
(table 4). Although the risk estimates for these parameters for
patients receiving an NNRTI-containing regimen were likewise
increased, these differences were less marked. Patients receiving
a dual PI–containing regimen had a statistically significantly
increased risk of dyslipidemia with respect to TC level, whereas
increased risks in patients receiving a single PI–containing reg-
imen or an NNRTI-containing regimen did not reach statistical
significance. There were no statistically significant differences
between the CART regimens, in risk of dyslipidemia with re-
spect to either LDL-c or HDL-c level.
We used a similar model to compare the risk of dyslipidemia
directly between patients receiving a single PI–containing reg-
imen (reference group) and patients receiving a dual PI–con-
taining regimen or an NNRTI-containing regimen (table 4).
Compared with patients receiving a single PI–containing reg-
imen, patients receiving a dual PI–containing regimen were at
an increased risk of dyslipidemia for each of the lipid param-
eters, except LDL-c and HDL-c levels. In contrast, patients
receiving an NNRTI-containing regimen had a statistically sig-
nificant lower risk of dyslipidemia with regard to LDL-c, HDL-
c, and TG levels and TC:HDL-c ratio than did patients receiving
a single PI–containing regimen.
Between-class sensitivity analyses. Analyses of fasting
values yielded results similar to those of the models based on
all patients; however, because of the smaller number of patients

Effect of PI and NNRTI on Lipid Profiles • JID 2004:189 (15 March) • 1061
Table 3. Lipid and lipoprotein values at entry to the Data Collection on Adverse Events of Anti-HIV Drugs study, overall and stratifiedby treatment group: between-class comparison
CharacteristicTotal
(N p 7483)Antiretroviral-naive
(n p 2315)Single PI
(n p 3444)Dual PI
(n p 607)NNRTI
(n p 1117) P
TC level, median (IQR), mmol/L 5.0 (4.1–5.9) 4.4 (3.7–5.2) 5.3 (4.4–6.2) 5.7 (4.9–6.7) 5.1 (4.3–5.9) .0001
No. (%) of patients withmeasurement available 6151 (82.2) 1887 (81.5) 2886 (83.8) 504 (83.0) 874 (78.2)
No. (%) of patients with fastingmeasurement available 2486 (33.2) 1122 (48.5) 998 (29.0) 103 (17.0) 263 (23.5)
HDL-c level, median (IQR), mmol/L 1.1 (0.9–1.4) 1.1 (0.9–1.4) 1.1 (0.9–1.4) 1.1 (0.9–1.4) 1.3 (1.1–1.6) .0001
No. (%) of patients withmeasurement available 3460 (46.2) 1112 (48.0) 1641 (47.6) 321 (52.9) 386 (34.9)
No. (%) of patients with fastingmeasurement available 1411 (42.4) 578 (25.0) 614 (17.8) 82 (13.5) 137 (12.3)
LDL-c level, median (IQR), mmol/L 3.2 (2.6–4.0) 2.9 (2.4–3.5) 3.6 (2.8–4.4) 3.8 (3.1–4.5) 3.2 (2.7–4.0) .0001
No. (%) of patients withmeasurement available 1314 (17.6) 561 (47.6) 554 (47.2) 67 (52.4) 132 (33.9)
No. (%) of patients with fastingmeasurement availablea 1314 (17.6) 561 (47.6) 554 (47.2) 67 (52.4) 132 (33.9)
TC:HDL-c ratio, median (IQR) 4.4 (3.4–5.7) 3.9 (3.1–4.9) 4.7 (3.6–6.1) 5.3 (4.1–6.9) 3.8 (2.9–5.0) .0001
No. (%) of patients withmeasurement available 3424 (45.8) 1102 (47.6) 1625 (47.2) 318 (52.4) 379 (33.9)
No. (%) of patients with fastingmeasurement available 1409 (18.8) 577 (24.9) 614 (42.8) 82 (13.5) 136 (12.2)
TG level, median (IQR), mmol/L 1.5 (1.0–2.5) 1.3 (0.9–1.9) 1.8 (1.2–2.9) 2.5 (1.6–3.9) 1.3 (0.9–2.1) .0001
No. (%) of patients withmeasurement available 6180 (82.6) 1912 (82.6) 2891 (83.9) 485 (79.9) 892 (79.9)
No. (%) of patients with fastingmeasurement available 2599 (34.7) 1150 (49.7) 1059 (80.4) 120 (19.8) 270 (24.2)
NOTE. HDL-c, high-density lipoprotein cholesterol; IQR, interquartile range; LDL-c, low-density lipoprotein cholesteriol; NNRTI, nonnucleoside reverse-transcrip-tase inhibitor; PI, protease inhibitor; TC, total cholesterol; TG, triglycerides.
a LDL-c level was calculated using fasting values only.
included in the analyses (table 3), the results were, in some
cases, less significant. Results of analyses of HDL-c levels based
on fasting values, however, suggested stronger relationships. In
particular, the odds ratios (ORs) for an HDL-c level �0.9
mmol/L being associated with receipt of single PI– or dual PI–
containing regimens were 1.66 (95% confidence interval [CI],
0.93–2.97; ) and 2.25 (95% CI, 1.05–4.82; ),P p .09 P p .04
respectively, suggesting an increased risk of a lower HDL-c level
in patients receiving these treatment combinations. Results of
analyses from those cohorts with the lowest amounts of missing
data yielded results similar to those from the overall cohort.
Within-Class Comparison
Of the 17,852 patients included in the overall D:A:D cohort,
7729 (43.3%) were receiving �1 PI at the time of enrollment
(table 5), and 3476 (19.5%) were receiving an NNRTI (table
6). These 11,205 patients have been included in the within-
class comparison.
Patients receiving PIs. Patients receiving IDV, NLF, SQV,
and RTV were generally similar in terms of age, mode of in-
fection, BMI, AIDS status, CD4 cell count, and HIV RNA load
(table 5). The median CD4 cell count in these groups was 1350
cells/mm3, whereas the proportion of patients with an HIV
RNA load !500 copies/mL was 64% in patients receiving SQV
and 81% in patients receiving IDV. However, patients receiving
AMP or the different PI combinations were markedly different,
with lower CD4 cell counts and higher virus loads, which re-
flects the more-complex treatment histories of these patients.
These patients had also been exposed to antiretroviral treatment
for longer periods and had more-extensive exposure to PIs and
NNRTIs at the time of starting the current regimen. The pro-
portion of smokers was lowest in patients receiving RTV, as
were the proportions of patients with lipodystrophy and per-
sonal and family history of cardiovascular events, but the use
of lipid-lowering drugs was most prevalent in this group (table
7). Otherwise, the groups were broadly similar in terms of risk
factors for CHD at entry in the D:A:D study.
TC levels were highest in patients receiving RTV, either alone
or in combination with another PI, and were lowest in patients
receiving SQV (table 8). Results relating to the prevalence of

1062 • JID 2004:189 (15 March) • Fontas et al.
Figure 1. Prevalence of dyslipidemia in patients enrolled in the Data Collection on Adverse Events of Anti-HIV Drugs study, by type of antiretroviralregimen received at initiation of the study. Dyslipidemia is defined as total cholesterol (TC) level �6.2 mmol/L, high-density lipoprotein cholesterol level(HDL-c) �0.9 mmol/L, low-density lipoprotein cholesterol level (LDL-c) �4.1 mmol/L, TC:HDL-c ratio �6.5, or triglyceride (TG) level �2.3 mmol. NNRTI,nonnucleoside reverse-transcriptase inhibitor; NRTI, nucleoside reverse-transcriptase inhibitor; PI, protease inhibitor.
dyslipidemia confirmed these findings (figure 2); the propor-
tion of patients with TC levels �6.2 mmol/L was significantly
higher among patients receiving RTV and lower among patients
receiving SQV. HDL-c levels were highest in patients receiving
NLF, and, conversely, the proportion of patients with HDL-c
levels �0.9 mmol/L was lower in this group. The proportion
of patients whose TC:HDL-c ratio was �6.5 was highest in
patients receiving RTV, either alone or in combination with
another PI, and was lowest in patients receiving NLF and SQV.
TG levels were generally higher in patients receiving RTV, either
alone or in combination with another PI, and were lowest in
patients receiving SQV.
In multivariable logistic regression analyses (table 9), the risk
of a patient having a TC level �6.2 mmol/L remained signifi-
cantly higher in patients receiving RTV, either alone or in com-
bination, and, to a lesser extent, for patients treated with NLF.
The risk of having an HDL-c level �0.9 mmol/L was signifi-
cantly lower in patients receiving NLF than in patients receiving
IDV. The other PIs were associated with comparable risks of a
low HDL-c level. After adjustment for other potential con-
founding factors, the risk of having a TC:HDL-c ratio �6.5
was higher in patients receiving RTV, either alone or in com-
bination with another PI, than in patients receiving IDV. The
risk of having a TC:HDL-c ratio �6.5 was lower in patients
receiving SQV. The trend observed in univariate analysis for a
lower TC:HDL-c ratio in patients receiving NLF was maintained,
although this relationship was not significant ( ). AfterP p .08
adjustment for other potential confounding factors, only patients
receiving RTV or a PI combination containing RTV had a sig-
nificantly higher risk of having a TG level �2.3 mmol/L.
Patients receiving NNRTIs. Patients receiving NVP were
more likely to be antiretroviral naive when starting the current
treatment regimen than were patients receiving EFV (table 6).
The cumulative duration of exposure to NNRTIs was 1.2 years
in patients receiving NVP but only 0.7 years in patients re-
ceiving EFV, which reflects the more-recent licensing of the
latter drug. The duration of exposure to PIs was 0.6 years in
patients receiving NVP and 1.7 years in patients receiving EFV.
Although patients receiving NNRTIs were less likely to be cur-
rent smokers than were patients receiving PIs, there were few
differences between the levels of risk factors for CHD between
patients receiving NVP and those receiving EFV (table 10).
Although TC and TG levels were higher in patients receiving
EFV at enrollment, levels of HDL-c and TC:HDL-c ratios were
similar in the 2 treatment groups (figure 2 and table 11). After
adjustment for other potential confounding factors (table 9),
the risk of having a TG level �2.3 mmol/L was significantly
higher in patients receiving EFV than in patients receiving NVP;
the risk of having increased TC levels was similarly elevated.
There were, however, no significant differences between either
HDL-c level or the TC:HDL-c ratio between patients receiving
EFV and those receiving NVP, either before or after adjustment
for other factors.
Within-class sensitivity analyses. The analyses were re-
peated among patients whose lipid measurement had been ob-
tained after they had fasted overnight (see tables 8 and 11 for

Effect of PI and NNRTI on Lipid Profiles • JID 2004:189 (15 March) • 1063
Table 4. Multivariable regression analyses showing relationship between class of drug received and odds of developing dyslipidemia,among patients enrolled in the Data Collection on Adverse Events of Anti-HIV Drugs study: between-class comparison.
Reference category,antiretroviral regimen
TC level �6.2 mmol/LHDL-c level �0.9
mmol/LLDL-c level �4.1
mmol/L TC:HDL-c ratio �6.5 TG level �2.3 mmol/L
OR (95% CI) P OR (95% CI) P OR (95% CI) P OR (95% CI) P OR (95% CI) P
Antiretroviral-naive group
Antiretroviral naive 1 … 1 … 1 … 1 … 1 …
Single PI 1.77 (0.91–3.42) .09 1.20 (0.46–3.15) .71 2.13 (0.30–15.26) .45 4.77 (1.68–13.51) .003 3.26 (1.82–5.87) .0001
Dual PI 2.77 (1.44–5.35) .002 1.26 (0.49–3.27) .63 2.65 (0.36–19.68) .34 7.46 (2.70–20.62) .0001 5.87 (3.25–10.60) .0001
NNRTI 1.40 (0.73–2.68) .31 0.81 (0.31–2.14) .67 1.08 (0.15–7.69) .94 2.99 (1.04–8.60) .04 1.90 (1.06–3.39) .03
Single-PI group
Single PI 1 … 1 … 1 … 1 … 1 …
Dual PI 1.55 (1.23–1.96) .0003 1.04 (0.76–1.42) .87 1.24 (0.69–2.22) .48 1.58 (1.15–2.18) .005 1.81 (1.44–2.28) .0001
NNRTI 0.80 (0.62–1.02) .08 0.68 (0.47–0.98) .04 0.47 (0.26–0.85) .01 0.61 (0.39–0.95) .03 0.59 (0.47–0.74) .0001
NOTE. All analyses are adjusted for all demographic factors, risk factors for coronary heart disease, HIV factors, and previous exposure to nucleoside reverse-transcriptase inhibitor and combination antiretroviral therapy, as described in Subjects, Materials, and Methods. CI, confidence interval; HDL-c, high-density lipoproteincholesterol; LDL-c, low-density lipoprotein cholesterol; NNRTI, nonnucleoside reverse-transcriptase inhibitor; OR, odds ratio; PI, protease inhibitor; TC, total cholesterol;TG, triglycerides.
sample sizes) and also among cohorts with relatively small pro-
portions of missing data. In both cases, both for the PI and
NNRTI comparison, the results from the sensitivity analyses
confirmed the findings in the main analysis. Finally, the analyses
were repeated for the patients who were antiretroviral naive at
the time of starting the current therapy. The results from the
analysis of the groups receiving PIs generally confirmed the analy-
sis of patients from the full population, in that RTV, whether
administered alone or in combination with another PI, remained
the PI associated with the highest risk of both hypercholester-
olemia and hypertriglyceridemia. Analyses of previously antiret-
roviral-naive patients receiving NNRTIs yielded results broadly
similar to those for the full population, although the relationship
between EFV and an increased TG level did not remain in this
analysis (OR, 0.80; ).P p .57
DISCUSSION
HIV-infected patients enrolled in the D:A:D study and treated
with different types of CART demonstrated clearly different
plasma lipid profiles. In particular, patients receiving CART
regimens which, for the first time, included either 1 or 2 PIs
had higher TC and TG levels and TC:HDL-c ratios than did
patients who were antiretroviral naive, with patients who re-
ceived a dual PI–containing regimen having significantly higher
levels of each lipid than patients who received a single PI–
containing regimen. Although TC and LDL-c levels were still
increased in patients receiving NNRTIs, compared with anti-
retroviral-naive patients, the risk of having a low HDL-c level
was reduced in these patients, compared with patients receiv-
ing a single PI–containing regimen. HDL-c levels were slightly
higher in patients receiving an NNRTI, which contributed to
a lower TC:HDL-c ratio in this group.
Our results also suggest that the various PIs and NNRTIs
within each class are associated with different risks of dyslipi-
demia. RTV-containing regimens were associated with the most
pronounced elevations of TC and TG levels and TC:HDL-c ra-
tios, NLF-containing regimens were associated with a lower risk
of having a reduced HDL-c level, and SQV-containing regimens
were associated with a lower risk of having an elevated TC:HDL-
c ratio. Treatment regimens combining 2 PIs other than RTV
did not appear to be associated with a higher risk of dyslipidemia,
compared with single PI–containing regimens, with the exception
of RTV. In comparison to treatment with NVP, the use of EFV
was associated with higher TC and TG levels. HDL-c levels and
TC:HDL-c ratios, however, were similar in patients receiving
either EFV- or NVP-containing regimens.
Few other studies have reported differences in lipid profiles
between patients receiving different classes of drugs, per se,
although a number of clinical trials have reported comparisons
of lipids in patients receiving specific treatment combinations
involving different classes of drugs. In another study, [25] van
der Valk et al. compared patients randomly assigned to a first-
line regimen of stavudine and didanosine, together with either
IDV, NVP, or lamivudine (3TC). After 24 weeks of treatment,
patients receiving NVP had significantly higher increases in
HDL-c levels, compared with other patients. Although the TC
and LDL-c levels also increased, the TC:HDL-c ratio was sig-
nificantly reduced and was lowest in patients receiving NVP.
Virgili et al. [40] reported similar differential lipid changes in
antiretroviral-naive patients receiving a combination of zido-
vudine plus 3TC, together with either NLF or NVP.
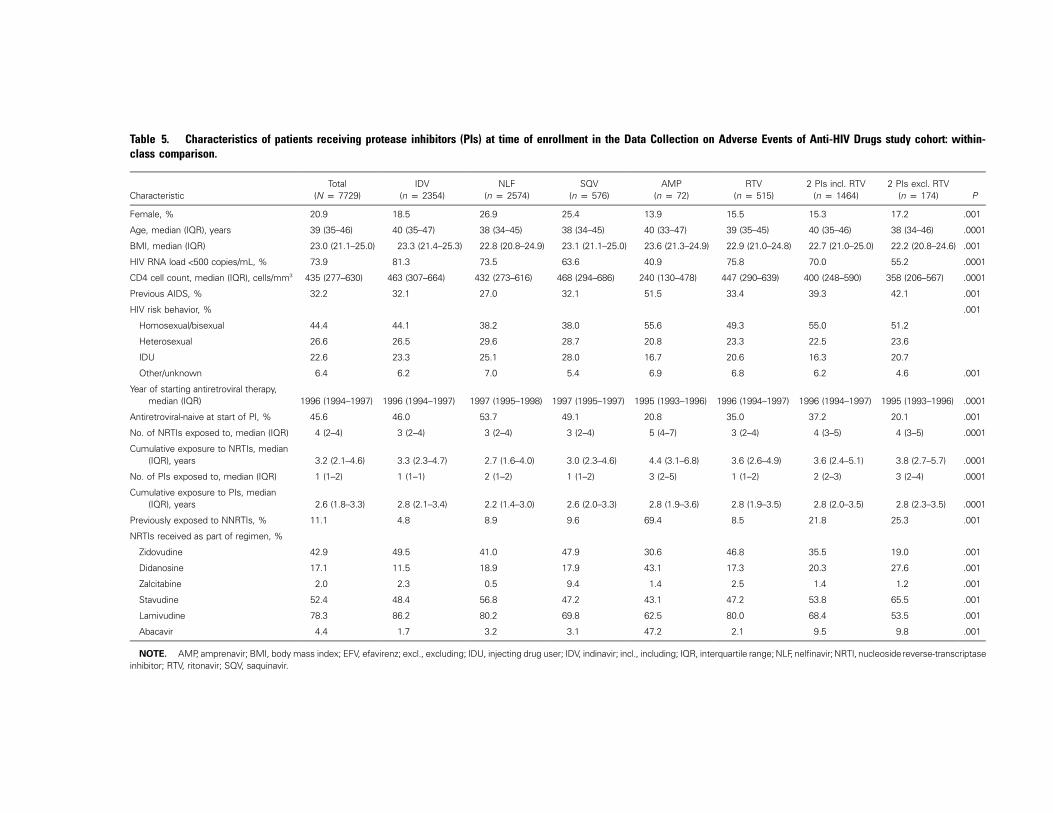
Table 5. Characteristics of patients receiving protease inhibitors (PIs) at time of enrollment in the Data Collection on Adverse Events of Anti-HIV Drugs study cohort: within-class comparison.
CharacteristicTotal
(N p 7729)IDV
(n p 2354)NLF
(n p 2574)SQV
(n p 576)AMP
(n p 72)RTV
(n p 515)2 PIs incl. RTV
(n p 1464)2 PIs excl. RTV
(n p 174) P
Female, % 20.9 18.5 26.9 25.4 13.9 15.5 15.3 17.2 .001
Age, median (IQR), years 39 (35–46) 40 (35–47) 38 (34–45) 38 (34–45) 40 (33–47) 39 (35–45) 40 (35–46) 38 (34–46) .0001
BMI, median (IQR) 23.0 (21.1–25.0) 23.3 (21.4–25.3) 22.8 (20.8–24.9) 23.1 (21.1–25.0) 23.6 (21.3–24.9) 22.9 (21.0–24.8) 22.7 (21.0–25.0) 22.2 (20.8–24.6) .001
HIV RNA load !500 copies/mL, % 73.9 81.3 73.5 63.6 40.9 75.8 70.0 55.2 .0001
CD4 cell count, median (IQR), cells/mm3 435 (277–630) 463 (307–664) 432 (273–616) 468 (294–686) 240 (130–478) 447 (290–639) 400 (248–590) 358 (206–567) .0001
Previous AIDS, % 32.2 32.1 27.0 32.1 51.5 33.4 39.3 42.1 .001
HIV risk behavior, % .001
Homosexual/bisexual 44.4 44.1 38.2 38.0 55.6 49.3 55.0 51.2
Heterosexual 26.6 26.5 29.6 28.7 20.8 23.3 22.5 23.6
IDU 22.6 23.3 25.1 28.0 16.7 20.6 16.3 20.7
Other/unknown 6.4 6.2 7.0 5.4 6.9 6.8 6.2 4.6 .001
Year of starting antiretroviral therapy,median (IQR) 1996 (1994–1997) 1996 (1994–1997) 1997 (1995–1998) 1997 (1995–1997) 1995 (1993–1996) 1996 (1994–1997) 1996 (1994–1997) 1995 (1993–1996) .0001
Antiretroviral-naive at start of PI, % 45.6 46.0 53.7 49.1 20.8 35.0 37.2 20.1 .001
No. of NRTIs exposed to, median (IQR) 4 (2–4) 3 (2–4) 3 (2–4) 3 (2–4) 5 (4–7) 3 (2–4) 4 (3–5) 4 (3–5) .0001
Cumulative exposure to NRTIs, median(IQR), years 3.2 (2.1–4.6) 3.3 (2.3–4.7) 2.7 (1.6–4.0) 3.0 (2.3–4.6) 4.4 (3.1–6.8) 3.6 (2.6–4.9) 3.6 (2.4–5.1) 3.8 (2.7–5.7) .0001
No. of PIs exposed to, median (IQR) 1 (1–2) 1 (1–1) 2 (1–2) 1 (1–2) 3 (2–5) 1 (1–2) 2 (2–3) 3 (2–4) .0001
Cumulative exposure to PIs, median(IQR), years 2.6 (1.8–3.3) 2.8 (2.1–3.4) 2.2 (1.4–3.0) 2.6 (2.0–3.3) 2.8 (1.9–3.6) 2.8 (1.9–3.5) 2.8 (2.0–3.5) 2.8 (2.3–3.5) .0001
Previously exposed to NNRTIs, % 11.1 4.8 8.9 9.6 69.4 8.5 21.8 25.3 .001
NRTIs received as part of regimen, %
Zidovudine 42.9 49.5 41.0 47.9 30.6 46.8 35.5 19.0 .001
Didanosine 17.1 11.5 18.9 17.9 43.1 17.3 20.3 27.6 .001
Zalcitabine 2.0 2.3 0.5 9.4 1.4 2.5 1.4 1.2 .001
Stavudine 52.4 48.4 56.8 47.2 43.1 47.2 53.8 65.5 .001
Lamivudine 78.3 86.2 80.2 69.8 62.5 80.0 68.4 53.5 .001
Abacavir 4.4 1.7 3.2 3.1 47.2 2.1 9.5 9.8 .001
NOTE. AMP, amprenavir; BMI, body mass index; EFV, efavirenz; excl., excluding; IDU, injecting drug user; IDV, indinavir; incl., including; IQR, interquartile range; NLF, nelfinavir; NRTI, nucleosidereverse-transcriptaseinhibitor; RTV, ritonavir; SQV, saquinavir.

Effect of PI and NNRTI on Lipid Profiles • JID 2004:189 (15 March) • 1065
Table 6. Characteristics of patients receiving nonnucleoside reverse-transcriptase inhibitors (NNRTIs) at time of enrollmentin the Data Collection on Adverse Events of Anti-HIV Drugs study cohort: within-class comparison.
CharacteristicTotal
(N p 3476)NVP
(n p 2040)EFV
(n p 1436) P
Female, % 23.1 20.9 26.2 .001
Age, median (IQR), years 39 (35–47) 39 (35–47) 39 (34–46) .14
BMI, median (IQR) 22.8 (20.9–25.0) 23.0 (21.0–25.2) 22.7 (20.7–24.8) .001
HIV RNA load !500/copies/mL, % 75.8 73.6 78.8 .0006
CD4 cell count, cells/mm3, median (IQR) 456 (289–648) 480 (308–663) 419 (265–613) .0001
Previous AIDS, % 28.9 30.1 27.6 .14
HIV risk behavior, %
Homosexual/bisexual 49.4 51.9 45.7
Heterosexual 25.9 24.2 28.3
IDU 17.0 16.4 17.8
Other/unknown 7.3 7.6 8.2 .004
Year of starting antiretroviral therapy, median (IQR) 1997 (1995–1998) 1997 (1995–1998) 1996 (1994–1998) .0005
Antiretroviral-naive at start of PI/NNRTI, no. (%) 19.5 21.4 16.9 .001
No. of NRTIs exposed to, median (IQR) 4 (2–5) 4 (2–4) 4 (2–5) .0008
Cumulative exposure to NRTIs, median (IQR), years 3.0 (1.7–4.4) 2.9 (1.7–4.2) 3.1 (1.7–4.7) .07
No. of PIs exposed to, median (IQR) 1 (0–2) 1 (0–1) 1 (0–2) .0001
Cumulative exposure to PIs, median (IQR), years 1.1 (0–2.3) 0.6 (0–2.0) 1.7 (0–2.6) .0001
No. of NNRTIs exposed to, median (IQR) 1 (1–1) 1 (1–1) 1 (1–1) .0001
Cumulative exposure to NNRTIs, median (IQR), years 1.0 (0.5–1.5) 1.2 (0.7–1.7) 0.7 (0.4–1.2) .0001
NRTIs received as part of regimen, %
Zidovudine 41.7 42.4 40.7 .34
Didanosine 22.6 20.5 25.4 .001
Zalcitabine 1.1 1.0 1.1 .94
Stavudine 50.0 50.3 49.7 .76
Lamivudine 75.6 78.8 71.1 .001
Abacavir 12.3 8.0 18.3 .001
NOTE. BMI, body mass index; EFV, efavirenz; IDU, injecting drug user; IQR, interquartile range; NRTI, nucleoside reverse-transcriptase inhibitor;NVP, nevirapine; PI, protease inhibitor.
A number of studies have reported differences in lipid pro-
files among patients receiving drugs from the same class. For
example, several studies have suggested that RTV, whether ad-
ministered alone or in combination, may induce more-severe
dyslipidemia than other PIs [15, 24, 41]. The results of the
present study confirm these results with regard to both TC and
TG levels. Furthermore, our finding that the TC:HDL-c ratio
was highest in patients receiving RTV is also of interest, because
the ratio may be a better indicator of ischemic coronary risk
than either the LDL:HDL-c ratio or TC level [42]. It should
be reiterated that we were not able to collect information on the
dose of RTV given to patients receiving dual PI combinations,
and, thus, we are unable to ascertain whether dyslipidemia is
more common in patients receiving RTV at high dose in com-
bination with another PI. It is of interest to note that combi-
nations of 2 PIs that do not include RTV do not appear to
induce a higher risk of dyslipidemia than these PIs alone, con-
firming the results published by Carr et al. [18].
In the present study, NLF-containing regimens were associ-
ated with a significantly lower risk of a low HDL-c level than
were IDV-containing regimens, which, in turn, resulted in a
lower TC:HDL-c ratio in these patients. In contrast, a study
conducted in 1998 of 129 patients did not report any effect on
HDL-c levels in patients receiving NLF [15]. It is unclear why
NLF may induce a smaller reduction in HDL-c level than other
PIs. This association is present even after adjusting for virus
load and CD4 cell count and, thus, is not explained by a par-
ticular indirect effect of NLF on virus load [43]. The results of
the present study also suggest that SQV, when used as a single
PI, is associated with a significantly lower risk of a high TC:
HDL-c ratio than is treatment with IDV. Because of its pref-
erential use in combination with other PIs, especially RTV, very
few studies have considered lipid changes in patients receiving
SQV per se, and only one has focused on its link with hyper-
cholesterolemia. Our results are consistent with those of a prior
study [44], in which !10% of patients treated with soft-gel

1066 • JID 2004:189 (15 March) • Fontas et al.
Table 7. Percentage of patients receiving protease inhibitors (PIs) with known risk factors for coronary heart disease (CHD) orincreased lipid levels, at time of enrollment in the Data Collection on Adverse Events of Anti-HIV Drugs study cohort: within-classcomparison.
CharacteristicTotal
(N p 7729)IDV
(n p 2354)NLF
(n p 2574)SQV
(n p 576)AMP
(n p 72)RTV
(n p 515)2 PIs incl. RTV
(n p 1464)2 PIs excl. RTV
(n p 174) P
Current smoker 44.4 41.5 47.4 45.1 43.7 36.8 45.6 45.7 .001
Lipodystrophy 29.4 28.8 27.1 25.9 37.5 21.9 36.6 42.5 .001
Previous cardiovascular event 1.3 1.6 1.2 1.1 … 0.4 1.8 0.6 .13
Hypertension (or use ofantihypertensive agents) 8.2 9.0 8.8 5.0 11.1 5.2 7.9 8.1 .007
Use of antiplatelet agents 1.2 1.5 1.1 1.4 … 0.8 1.3 0.6 .64
Use of lipid-lowering agents 4.2 4.4 2.1 3.7 4.2 9.3 5.9 5.8 .001
Diabetes mellitus (or use ofantidiabetic agents) 2.2 3.1 1.8 3.1 4.2 0.8 1.8 0.6 .001
Family history of CHD 7.8 7.1 7.8 7.7 13.0 5.9 9.7 7.1 .04
NOTE. AMP, amprenavir; excl., excluding; IDV, indinavir; incl., including; NLF, nelfinavir; RTV, ritonavir; SQV, saquinavir.
SQV had a TC level 16.5 mmol/L after a median exposure of
6.7 months. Similarly, in a clinical trial including 1300 patients
and comparing 2 boosted treatment strategies (IDV [800 mg]/
RTV [100 mg] twice daily and SQV [1000 mg]/RTV [100 mg]
twice daily) [45], Cahn et al. reported a larger increase of TG
and TC levels in the IDV group than in the SQV group. Several
hypotheses have been suggested to explain why SQV might
induce fewer cholesterol abnormalities than other PIs, including
lower bioavailability of the molecule in its capsule form [46]
and its lower affinity for the p450 cytochrome isoenzyme [47].
To our knowledge, limited data are available concerning the
comparison of the effects of EFV and NVP on the lipid profiles
of HIV-infected patients. Studies of patients successfully treated
with PI-containing CART, for whom their PI was replaced by
either NVP or EFV, have also shown an increase in HDL-c
levels [48–51]. Our findings suggest that, compared with PIs,
NNRTIs are associated with a lower risk of dyslipidemia but
that there are no significant differences between EFV and NVP
with regard to either HDL-c levels or TC:HDL-c ratios. Sta-
tistically significant differences were demonstrated for TG and
TC levels, although absolute differences were small. It is im-
portant to acknowledge that, at present, there is no conclusive
evidence that drug-induced elevations of HDL-c levels will be
associated with a lower risk of CHD [52]. Furthermore, if
CART-induced dyslipidemia in the context of HIV infection
translates into risk of CHD in a way similar to that of non-
pharmaceutically induced dyslipidemia in the general popu-
lation, a difference of 0.1 mmol/L in TC level (the difference
observed in our study for EFV and NVP) would be associated
with a difference of relative risk of CHD over 10 years of ∼3%
[53]. Results from the 2NN trial—a randomized comparison
of once-daily NVP, twice-daily NVP, EFV, and NVP plus EFV
in combination with 3TC and stavudine in antiretroviral-naive
patients [27]—suggested larger differences in lipid profiles of
the drugs and favored NVP. Further studies are required to
determine the clinical impact of these differences.
It should be recognized that, although the present study and
others have reported differences in lipid profiles between patients
receiving different CART regimens, the relationship between anti-
retroviral-induced changes in plasma lipids and lipoproteins in
HIV-infected patients and the risk of CHD remains unclear. In
particular, it is not known whether increases (or decreases) in
any of the lipid levels correlate with the same change in risk
of CHD as is seen in HIV-negative patients. There is accu-
mulating evidence that, among HIV-negative patients, abnor-
mal serum lipid levels, especially increased levels of TC and
TG, are correlated with increased thickening of the intima-
media layer (IMT) of the arterial wall [54], which is closely
correlated with increased risk of CHD [55]. A number of studies
have found that thickening of IMT was more pronounced in
patients receiving PI-containing regimens than in antiretro-
viral-naive patients and individuals without HIV infection [56,
57]; however, in 1 of these studies, this effect disappeared after
adjusting for known CHD risk factors [57], and the relationship
has not been reported in all studies [58]. Although preliminary
analyses from the D:A:D study have begun to investigate the
relationships between changes in plasma lipid levels and sub-
sequent development of CHD [33], further follow-up is re-
quired before a definitive answer can be reached.
The present study has a number of limitations. First, the
analysis is based on data obtained from a large number of
observational cohorts. In this type of cohort, treatment al-
location is rarely random, and, as a consequence, treatment
groups differ substantially at entry to the D:A:D study. In par-
ticular, patients receiving PIs (either single or dual combina-
tions) tended to have more-advanced disease than did patients
receiving NNRTIs. Even among patients receiving PIs, patients
receiving AMP or a combination of 2 PIs generally had more-

Table 8. Lipid and lipoprotein values in patients receiving protease inhibitors (PIs) at entry to Data Collection on Adverse Events of Anti-HIV Drugs study, overall andstratified by treatment group: within-class comparison.
CharacteristicTotal
(N p 7729)IDV
(n p 2354)NLF
(n p 2574)SQV
(n p 576)AMP
(n p 72)RTV
(n p 515)2 PI incl. RTV(n p 1464)
2 PIs excl. RTV(n p 174) P
TC level, median (IQR), mmol/L 5.3 (4.5–6.3) 5.3 (4.4–6.1) 5.2 (4.5–6.2) 4.8 (3.9–5.6) 5.1 (4.3–6.2) 5.7 (4.6–6.8) 5.6 (4.7–6.7) 5.4 (4.4–6.3) .0001
No. (%) of patients withmeasurement available 6497 (84.1) 1972 (83.8) 2207 (85.7) 431 (74.8) 63 (87.5) 452 (87.8) 1226 (83.7) 146 (83.9)
No. (%) of patients with fastingmeasurement available 1990 (25.7) 751 (30.5) 622 (24.2) 210 (53.4) 5 (5.9) 104 (20.2) 268 (18.3) 30 (17.2)
HDL-c level, median (IQR), mmol/L 1.1 (0.9–1.4) 1.0 (0.9–1.3) 1.2 (1.0–1.4) 1.0 (0.9–1.3) 0.9 (0.7–1.4) 1.1 (0.9–1.4) 1.1 (0.9–1.3) 1.1 (0.9–1.4) .0001
No. (%) of patients withmeasurement available 3785 (49.0) 1078 (45.8) 1431 (55.6) 175 (30.4) 31 (43.1) 223 (43.3) 782 (53.4) 65 (37.4)
No. (%) of patients with fastingmeasurement available 1314 (17.0) 469 (19.9) 437 (17.0) 102 (17.7) 5 (6.9) 64 (12.4) 212 (14.5) 25 (14.4)
TC:HDL-c ratio, median (IQR) 4.8 (3.7–6.3) 5.0 (3.9–6.4) 4.5 (3.5–5.9) 4.3 (3.3–5.4) 5.4 (3.8–6.7) 5.1 (4.0–6.9) 5.4 (4.0–6.9) 4.8 (3.4–6.3) .0001
No. (%) of patients withmeasurement available 3749 (48.5) 1064 (45.2) 1423 (55.3) 172 (29.9) 31 (43.1) 220 (42.7) 776 (53.0) 63 (36.2)
No. (%) of patients with fastingmeasurement available 1304 (16.9) 166 (7.1) 437 (17.0) 102 (17.7) 4 (5.6) 63 (12.2) 209 (14.3) 23 (13.2)
TG level, median (IQR), mmol/L 1.9 (1.2–3.1) 1.8 (1.2–2.8) 1.7 (1.2–2.8) 1.6 (1.0–2.5) 2.4 (1.6–3.3) 2.8 (1.7–4.3) 2.5 (1.6–4.2) 2.2 (1.4–3.0) .0001
No. (%) of patients withmeasurement available 6485 (83.9) 1996 (84.8) 2206 (85.7) 438 (76.0) 62 (86.1) 448 (87.0) 1190 (81.3) 145 (83.3)
No. (%) of patients with fastingmeasurement available 2137 (27.6) 800 (34.0) 650 (25.3) 227 (39.4) 8 (11.1) 113 (21.9) 299 (20.4) 40 (23.0)
NOTE. AMP, amprenavir; excl., excluding; HDL-c, high density lipoprotein cholesterol; IDV, indinavir; incl., including; IQR, interquartile range; NLF, nelfinavir; RTV, ritonavir; SQV, saquinavir; TC, total cholesterol;TG, triglycerides.

1068 • JID 2004:189 (15 March) • Fontas et al.
Figure 2. Prevalence of dyslipidemia in patients enrolled in the Data Collection on Adverse Events of Anti-HIV Drugs study, by type of antiretroviralregimen received at initiation of the study. Dyslipidemia is defined as total cholesterol (TC) level �6.2 mmol/L, high density lipoprotein cholesterol (HDL-c) level �0.9 mmol/L, TC:HDL-c ratio �6.5, or triglyceride (TG) level �2.3 mmol. Top, Comparison of protease inhibitors (PIs). Bottom, Comparison ofnonnucleoside reverse-transcriptase inhibitors. AMP, amprenavir; EFV, efavirenz; excl., excluding; IDV, indinavir; incl., including; NLF, nelfinavir; NVP, nevirapine;RTV, ritonavir; SQV, saquinavir.
advanced disease than did patients receiving other treatment
regimens. Although our analyses were adjusted to take account
of observed differences between treatment groups, it is possible
that some unmeasured differences may remain. Furthermore,
the complex treatment regimens received may complicate our
ability to quantify treatment accurately. Thus, it is not possible
to conclude that all potential bias has been eliminated.
Although we have reported relationships between specific
treatment combinations and risk of dyslipidemia, the cross-
sectional nature of the present study prevents us from estab-
lishing a causal relationship between the various drugs or classes
and dyslipidemia. In particular, because information on pre-
treatment lipid levels is unavailable for the majority of patients,
we are unable to exclude the possibility that dyslipidemia oc-
curred before exposure to CART. Because the routine moni-
toring of lipid measurements has only recently been recom-
mended for patients receiving CART, it is not surprising that
there are substantial amounts of data missing both at enroll-
ment in the D:A:D study and at the start of CART. However,
it is unlikely that these missing data will lead to a serious bias
in the results. These data are missing primarily because, at that
time, such information was not routinely collected by some of
the cohorts, rather than because they had only been collected
for patients thought to be at high risk of dyslipidemia. Fur-

Effect of PI and NNRTI on Lipid Profiles • JID 2004:189 (15 March) • 1069
Table 9. Multivariable regression analyses showing relationship between antiretroviral drugs and odds of developing dyslipidemia inpatients enrolled in the Data Collection on Adverse Events of Anti-HIV Drugs study: within-class comparison.
Patient group, drug
TC level �6.2 mmol/L HDL-c level �0.9 mmol/L TC:HDL-c ratio �6.5 TG level �2.3 mmol/L
OR (95% CI) P OR (95% CI) P OR (95% CI) P OR (95% CI) P
Patients receiving PIs
IDV 1 … 1 … 1 … 1 …
NLF 1.28 (1.07–1.54) .007 0.61 (0.48–0.76) .0001 0.80 (0.62–1.03) .08 1.05 (0.89–1.24) .54
SQV 0.75 (0.53–1.06) .11 0.85 (0.56–1.31) .47 0.52 (0.30–0.91) .02 0.90 (0.68–1.20) .48
AMP 1.16 (0.57–2.36) .69 0.92 (0.39–2.17) .84 0.81 (0.31–2.10) .66 1.33 (0.73–2.43) .36
RTV 1.99 (1.54–2.58) .0001 0.98 (0.69–1.40) .93 1.48 (1.02–2.14) .04 3.22 (2.51–4.12) .0001
2 PIs incl. RTV 2.13 (1.70–2.68) .0001 0.79 (0.59–1.04) .09 1.42 (1.06–1.91) .02 1.95 (1.57–2.41) .0001
2 PIs excl. RTV 1.19 (0.74–1.92) .48 0.74 (0.40–1.39) .35 0.81 (0.40–1.62) .55 1.18 (0.78–1.79) .44
Patients receiving NNRTIs
NVP 1 1 1 1
EFV 1.29 (1.00–1.66) .05 1.38 (0.94–2.02) .10 1.31 (0.86–1.98) .21 1.46 (1.16–1.83) .001
NOTE. All analyses are adjusted for demographic factors, risk factors for coronary heart disease and HIV factors, as described in Subjects, Materials, andMethods. AMP, amprenavir; CI, confidence interval; EFV, efavirenz; excl., excluding; IDV, indinavir; incl., including; NLF, nelfinavir; NNRTI, nonnucleoside reverse-transcriptase inhibitor; NVP, nevirapine; OR, odds ratio; PI, protease inhibitor; RTV, ritonavir; SQV, saquinavir.
Table 10. Percentage of patients receiving nonnucleoside re-verse-transcriptase inhibitors with known risk factors for coro-nary heart disease (CHD) or increased lipid levels, at time ofenrollment in the Data Collection on Adverse Events of Anti-HIVDrugs study: within-class comparison.
CharacteristicTotal
(N p 3476)NVP
(n p 2040)EFV
(n p 1436) P
Current smoker 38.5 38.5 38.4 .93
Lipodystrophy 30.8 30.0 32.1 .08
Previous cardiovascular event 1.7 1.9 1.6 .53
Hypertension (or use ofantihypertensive agents) 8.7 9.4 7.7 .08
Use of antiplatelet agents 1.4 1.6 1.0 .24
Use of lipid-lowering agents 3.7 3.6 3.8 .85
Diabetes mellitus (or use ofantidiabetic agents) 3.4 2.9 4.0 .12
Family history of CHD 8.6 7.8 9.7 .07
NOTE. EFV, efavirenz; NVP, nevirapine.
thermore, because knowledge about a possible relationship be-
tween CART and CHD risk is relatively recent, it is unlikely
that this influenced the choice of initial CART regimen or that
it could explain the differences in lipid profiles seen at baseline.
Sensitivity analyses in which cohorts with substantial amounts
of missing data were excluded reached conclusions similar to
those of the main analyses.
Not all blood samples for lipid measurements were obtained
after an overnight fast. The effect of fasting is of importance
when analyzing TG levels [59] but should be minimal when
analyzing TC or HDL-c levels [59–61]. We repeated the mul-
tivariable logistic regression analyses for each of the lipid pa-
rameters by use of only samples that were documented to have
been obtained after an overnight fast. With the exception of
the analyses for HDL-c levels for the between-class comparison,
results of our sensitivity analyses were generally similar to those
from the whole study population. For HDL-c levels, however,
analyses excluding nonfasting values suggested a stronger re-
lationship between PI-containing regimens and low HDL-c lev-
els. However, because of the smaller number of patients in this
analysis and because we could not adjust for current NRTI use
in these sensitivity analyses, these results should be interpreted
cautiously.
The study populations included in the analyses, particularly
in the within-class comparison, were heterogeneous, both in
terms of their treatment history and prior known risk factors
for CHD. All analyses were adjusted for treatment history, and
sensitivity analyses for the within-class comparison that con-
sidered only those patients who were naive for any treatment
before their current regimen gave very similar results. It is
possible that the NRTI backbone may have contributed to the
differences in lipid profiles [28, 29], although, because adjust-
ment was made for the current use of specific NRTIs, it is
unlikely that differential use of NRTIs in the treatment groups
can explain our findings. The proportion of patients who were
already known to be receiving lipid-lowering agents ranged
from 0.2% to 9.3% in the different treatment groups. Although
we did not exclude these patients from our analyses, we did
adjust for this factor in any multivariable analyses; therefore, it
is unlikely that these factors could lead to bias in our results.
Finally, because of the timing of recruitment for the D:A:D study,
we were unable to consider the role of newer drugs and com-
binations on lipid profiles, such as lopinavir/RTV, which has been
reported to have a greater impact on lipid profiles than NLF
[62], or tenofovir or atazanavir, both of which have been reported

1070 • JID 2004:189 (15 March) • Fontas et al.
Table 11. Lipid and lipoprotein values in patients receiving nonnucleoside reverse-transcriptase inhibitors at entry tothe Data Collection on Adverse Events of Anti-HIV Drugs study, overall and stratified by treatment group: within-classcomparison.
CharacteristicTotal
(N p 3476)NVP
(n p 2040)EFV
(n p 1436) P
TC level, median (IQR), mmol/L 5.3 (4.5–6.1) 5.2 (4.4–6.0) 5.3 (4.5–6.2) .03
No. (%) of patients with measurement available 2709 (77.9) 1451 (71.1) 1258 (87.6)
No. (%) of patients with fasting measurement available 785 (22.6) 448 (22.0) 337 (23.5)
HDL-c level, median (IQR), mmol/L 1.2 (1.0–1.5) 1.2 (1.0–1.5) 1.2 (1.0–1.5) .45
No. (%) of patients with measurement available 1299 (37.4) 558 (27.4) 741 (51.6)
No. (%) of patients with fasting measurement available 498 (14.3) 249 (12.2) 249 (17.3)
TC:HDL-c ratio, median (IQR) 4.3 (3.2–5.7) 4.2 (3.3–5.6) 4.4 (3.2–5.8) .28
No. (%) of patients with measurement available 1280 (36.8) 547 (26.8) 733 (51.0)
No. (%) of patients with fasting measurement available 493 (14.2) 246 (12.1) 247 (17.2)
TG level, median (IQR), mmol/L 1.6 (1.0–2.7) 1.5 (1.0–2.5) 1.7 (1.1–2.9) .0001
No. (%) of patients with measurement available 2750 (79.1) 1468 (72.0) 1282 (89.3)
No. (%) of patients with fasting measurement available 822 (23.6) 468 (22.9) 354 (24.7)
NOTE. EFV, efavirenz; HDL-c, high density lipoprotein cholesterol; IQR, interquartile range; NVP, nevirapine; TC, total cholesterol; TG,triglycerides.
to have smaller effects than earlier CART regimens [61, 63].
Further follow-up and a possible extension to the D:A:D study
may enable us to consider these drugs in the future.
Studies such as D:A:D investigate whether antiretroviral ther-
apy–associated metabolic disorders contribute to premature on-
set of CHD. Given the current need for lifelong therapy, con-
siderations of longer-term toxicities, in addition to virological
efficacy, are becoming increasingly important when choosing be-
tween different regimens that are anticipated to be similar vi-
rologically. Our results, particularly in terms of an increased
risk of dyslipidemia in patients receiving RTV and a reduced
risk of low HDL-c levels in patients receiving NNRTIs, partic-
ularly NVP, may be associated with differences in risk of CHD
and, therefore, may give the NNRTI regimens an advantage
over current PI-containing regimens, particularly in patients
with preexisting known risk factors for CHD. However, we
would like to underscore that, at this stage, this discussion
remains speculative. With additional follow-up and clinical end
points, the D:A:D study may, in due course, have data to assess
the association between different types of antiretroviral regi-
mens and risk of CHD.
DATA COLLECTION ON ADVERSE EVENTSOF ANTI-HIV DRUGS (D:A:D) STUDYPARTICIPANTS AND MEMBERSOF THE PARTICIPATING COHORTS
D:A:D: Study. Steering committee: F. Houyez, E. Loeliger, R.
Tressler, I. Weller, and all names marked with an asterisk (*)
below. Central coordination: N. Friis-Møller, C. A. Sabin, and
J. D. Lundgren. Data managers: A. Sawitz (coordinator), M.
Rickenbach, P. Pezzotti, E. Krum, R. Meester, V. Lavignolle, A.
Sundstrom, B. Poll, E. Fontas, F. Torres, K. Petoumenos, and
J. Kjær.
AIDS Therapy Evaluation Project Netherlands. Coordi-
nating center: F. de Wolf, E. van der Ven, S. Zaheri, I. van Val-
kengoed, and R. Meester. Participating physicians (city): W.
Bronsveld (Alkmaar); H. Weigel, K. Brinkman, P. Frissen, J. ten
Veen, M. Hillebrand, P. van Dam, S. Schieveld, J. Mulder, E. van
Gorp, P. Meenhorst, A. van Eeden, S. Danner, F. Claessen, R.
Perenboom, J. K. Eeftinck Schattenkerk, M. Godfried, J. Lange,
S. Lowe, J. van der Meer, F. Nellen, K. Pogany, T. van der Poll,
J. Prins, P. Reiss,* T. Ruys, M. van Agtmael, M. van der Valk,
and F. Wit (Amsterdam); C. Richter and R. van Leusen (Arn-
hem); R. Vriesendorp, F. Jeurissen, R. Kauffmann, and E. Koger
(Den Haag); B. Bravenboer (Eindhoven); C. ten Napel (En-
schede); H. G. Sprenger and G. Law (Groningen); R. W. ten Kate
(Haarlem); M. Leemhuis (Leeuwarden); F. Kroon and E. Schip-
pers (Leiden); G. Schrey, S. van der Geest, and A. Verbon (Maas-
tricht); P. Koopmans, M. Keuter, D. Telgt, and A. van der Ven
(Nijmegen); M. van der Ende, I. Gyssens, and S. de Marie (Rot-
terdam); J. Juttmann and C. van der Heul (Tilburg); M. Schnei-
der, J. Borleffs, I. Hoepelman, C. Jaspers, A. Matute, and C.
Schurink (Utrecht); and W. Blok (Vlissingen).
Aquitaine (Bordeaux, France). Scientific committee: R. Sal-
amon (chair), J. Beylot, M. Dupon, M. Le Bras, J. L. Pellegrin,
and J. M. Ragnaud. Coordinating center staff: F. Dabis,* G.
Chene, H. Jacqmin-Gadda, R. Thiebaut, S. Lawson-Ayayi, V.
Lavignolle, E. Balestre, M. J. Blaizeau, M. Decoin, A. M. For-
maggio, S. Delveaux, S. Labarerre, B. Uwamaliya, E. Vimard,
L. Merchadou, G. Palmer, D. Touchard, D. Dutoit, F. Pereira,
and B. Boulant. Participating physicians: J. Beylot, P. Morlat,

Effect of PI and NNRTI on Lipid Profiles • JID 2004:189 (15 March) • 1071
N. Bernard, M. Bonarek, F. Bonnet, B. Coadou, P. Gelie, D.
Jaubert, C. Nouts, D. Lacoste, M. Dupon, H. Dutronc, G. Cip-
riano, S. Lafarie, I. Chossat, J. Y. Lacut, B. Leng, J. L. Pellegrin,
P. Mercie, J. F. Viallard, I. Faure, P. Rispal, C. Cipriano, S.
Tchamgoue, M. Le Bras, F. Djossou, D. Malvy, J. P. Pivetaud,
J. M. Ragnaud, D. Chambon, C. De La Taille, T. Galperine, S.
Lafarie, D. Neau, A. Ochoa, C. Beylot, M. S. Doutre, J. H.
Bezian, J. F. Moreau, J. L. Taupin, C. Conri, J. Constans, P.
Couzigou, L. Castera, H. Fleury, M. E. Lafon, B. Masquelier, I.
Pellegrin, P. Trimoulet, F Moreau, C. Mestre, C. Series, and A.
Taytard.
Australian HIV Observational Database. Coordinating cen-
ter: M. Law* and K. Petoumenos (Sydney, New South Wales).
Participating physicians (city, state): J. Anderson, J. Bal, A. Mijch,
K. Watson, N. Roth, and H. Wood (Melbourne, Victoria); D.
Austin, A. Gowers, D. Baker, R. McFarlane, A. Carr, and D.
Cooper (Sydney, New South Wales); J. Chuah and W. Fank-
hauser (Gold Coast, Queensland); and S. Mallal and J. Skett
(Perth, Western Australia).
Barcelona Antiretroviral Surveillance Study. Coordinating
center: G. Calvo,* F. Torres, and S. Mateu (Barcelona). Partic-
ipating physicians (city): P. Domingo, M. A. Sambeat, J. Gatell,
E. Del Cacho, J. Cadafalch, and M. Fuster (Barcelona); and C.
Codina, G. Sirera, and A. Vaque (Badalona).
The Brussels St. Pierre Cohort (Belgium). N. Clumeck,
S. De Wit,* M. Gerard, M. Hildebrand, K. Kabeya, D. Kon-
opnicki, M. C. Payen, B. Poll, and Y. Van Laethem.
Community Programs for Clinical Research on AIDS
(United States). Central coordination: J. Neaton, G. Bartsch,*
W. M. El-Sadr, E. Krum, G. Thompson, and D. Wentworth.
Participating physicians (city, state): R. Luskin-Hawk (Chicago,
IL); E. Telzak and W. M. El-Sadr (Bronx, NY); D. I. Abrams
(San Francisco, CA); D. Cohn (Denver, CO); N. Markowitz
and L. R. Crane (Detroit, MI); R. Arduino (Houston, TX); D.
Mushatt (New Orleans, LA); G. Friedland (New Haven, CT);
G. Perez (Newark, NJ); E. Tedaldi (Philadelphia, PA); E. Fisher
(Richmond, VA); F. Gordin (Washington, DC); J. Sampson
(Portland, OR); and J. Baxter (Camden, NJ).
EuroSIDA Study Group (Multinational). Central coordi-
nation: O. Kirk,* A. Mocroft, A. N. Phillips,* and J. D. Lund-
gren* (chair). Participating countries and physicians (city): Aus-
tria: N. Vetter (Vienna); Belgium: N. Clumeck, S. De Wit, K.
Kabey, and B. Poll (Brussels); and R. Colebunders (Antwerp);
Czech Republic: L. Machala and H. Rozsypal (Prague); Denmark:
J. Nielsen, J. Gerstoft, T. Katzenstein, A. B. E. Hansen, and P.
Skinhøj (Copenhagen); and C. Pedersen (Odense); Estonia: K.
Zilmer and M. Rauka (Tallinn); France: C. Katlama, M. De Sa,
and J.-P. Viard (Paris); T. Saint-Marc and P. Vanhems (Lyon);
and C. Pradier (Nice); Germany: M. Dietrich, C. Manegold, J.
van Lunzen, and H.-J. Stellbrink (Hamburg); V. Miller, S. Stasz-
ewski, and M. Bieckel (Frankfurt); F. D. Goebel (Munich); B.
Salzberger (Cologne); J. Rockstroh (Bonn); and R. E. Schmitt
and M. Stoll (Hannover); Greece: J. Kosmidis, P. Gargalianos,
H. Sambatakou, J. Perdios, G. Panos, and A. Filandras (Athens);
Hungary: D. Banhegyi (Budapest); Ireland: F. Mulcahy (Dub-
lin); Israel: I. Yust and D. Turner (Tel Aviv); S. Pollack and J.
Hassoun (Haifa); Z. Sthoeger (Rehovot); and S. Maayan (Je-
rusalem); Italy: S. Vella, A. Chiesi, V. Vullo, P. Santopadre, P.
Narciso, A. Antinori, P. Franci, and M. Zaccarelli (Rome); C.
Arici (Bergamo); R. Pristera (Bolzano); F. Mazzotta and A.
Gabbuti (Florence); R. Esposito and A. Bedini (Modena); A.
Chirianni and E. Montesarchio (Naples); and A. Lazzarin, A.
Castagna, and A. d’Arminio Monforte (Milan); Latvia: L.
Viksna and B. Rozentale (Riga); Lithuania: S. Chaplinskas (Vil-
nius); Luxembourg: R. Hemmer and T. Staub (Luxembourg);
The Netherlands: P. Reiss (Amsterdam); Norway: J. Bruun, A.
Maeland, and V. Ormaasen (Oslo); Poland: B. Knysz and J.
Gasiorowski (Wroclaw); A. Horban (Warsaw); D. Prokopowicz
(Bialystok); A. Boron-Kaczmarska and M. Pynka (Szczecin); M.
Beniowski (Chorzow); and H. Trocha and T. Smiatacz (Gdansk);
Portugal: F. Antunes, K. Mansinho, and F. Maltez (Lisbon); Ro-
mania: D. Duiculescu and A. Streinu-Cercel (Bucharest); Slo-
vakia: M. Mokras and D. Stanekova (Bratislava); Spain: J. Gon-
zalez-Lahoz, B. Diaz, T. Garcıa-Benayas, L. Martin-Carbonero,
and V. Soriano (Madrid); B. Clotet, A. Jou, J. Conejero, L. Ruiz,
and C. Tural (Badalona); and J. M. Gatell, J. M. Miro, and L.
Zamora (Barcelona); Sweden: A. Blaxhult, A. Karlsson, and P.
Pehrson (Stockholm); Switzerland: B. Ledergerber and R. Weber
(Zurich); P. Francioli (Lausanne); B. Hirschel and V. Schiffer
(Geneva); and H. Furrer (Bern); Ukraine: N. Chentsova (Kyiv);
United Kingdom: M. Fisher (Brighton); R. Brettle (Edinburgh);
and S. Barton, A. M. Johnson, D. Mercey, C. Loveday, M. A.
Johnson, A. Pinching, J. Parkin, J. Weber, and G. Scullard
(London).
HivBivus (Sweden). Central coordination: L. Morfeldt,* G.
Thulin, and A. Sundstrom. Participating physicians (city): B.
Akerlund (Huddinge); K. Koppel and A. Karlsson (Stockholm);
and L. Flamholc and C. Hakangard (Malmo).
Italian Cohort of Naive for Antiretrovirals (Italy). Central
coordination: A. d’Arminio Monforte,* and P. Pezzotti. Partic-
ipating physicians (city): M. Moroni, A. d’Arminio Monforte,
A. Cargnel, S. Merli, G. M. Vigevani, C. Pastecchia, A. Lazzarin,
R. Novati, L. Caggese, C. Moioli (Milano); M. S. Mura, and
M. Mannazzu (Sassari); F. Suter and C. Arici (Bergamo); P. E.
Manconi and P. Piano (Cagliari); F. Mazzotta and S. Lo Caputo
(Firenze); A. Poggio and G. Bottari (Verbania); G. Pagano, A.
Alessandrini, N. Piersantelli, and R. Piscopo (Genova); A.
Scasso and A. Vincenti (Lucca); V. Abbadesse, S. Mancuso, A.
Colomba, and T. Prestileo (Palermo); F. Alberici and A. Ruggieri
(Piacenza); M. Arlotti and P. Ortolani (Rimini); F. De Lalla and
G. Tositti (Vicenza); E. Raise and S. Pasquinucci (Venezia); F.
Soscia and L. Tacconi (Latina); U. Tirelli and G. Nasti (Aviano);
1072 • JID 2004:189 (15 March) • Fontas et al.
D. Santoro and L. Pusterla (Como); G. Carosi, F. Castelli, G.
Cadeo, and D. Vangi (Brescia); G. Carnevale and D. Galloni
(Cremona); G. Filice and R. Bruno (Pavia); A. Sinicco, M.
Sciandra, P. Caramello, L. Gennero, M. L. Soranzo, and M.
Bonasso (Torino); G. Rizzardini and G. Migliorino (Busto Ar-
sizio); F. Chiodo, V. Colangeli, and O. Coronado (Bologna);
G. Magnani and M. Ursitti (Reggio Emilia); F. Menichetti and
C. Martinelli (Pisa); R. Esposito and C. Mussini (Modena); F.
Ghinelli and L. Sighinolfi (Ferrara); T. Zauli and G. Ballardini
(Ravena); M. Montroni and A. Zoli (Ancona); E. Petrelli and
A. Cioppi (Pesaro); L. Ortona, A. De Luca, N. Petrosillo, P.
Noto, P. Narciso, P. Salcuni, A. Antinori, P. De Longis, V. Vullo,
and M. Lichtner (Roma); G. Pastore and G. Minafra (Bari); A.
Chirianni, L. Loiacono, M. Piazza, S. Nappa, N. Abrescia, and
M. De Marco (Napoli); C. De Stefano and A. La Gala (Potenza);
T. Ferraro and A. Scerbo (Catanzaro); P. Grima and P. Tundo
(Lecce); E. Pizzigallo and M. D’Alessandro (Chieti); and B.
Grisorio and S. Ferrara (Foggia).
Nice Cohort (France). Central coordination: C. Pradier,*
E. Fontas, and C. Caissotti. Participating physicians: P. Della-
monica, L. Bentz, E. Bernard, S. Chaillou, F. De Salvador-Guil-
louet, J. Durant, R. Guttman, L. Heripret, V. Mondain-Miton,
I. Perbost, B. Prouvost-Keller, P. Pugliese, V. Rahelinirina, P.
M. Roger, and F. Vandenbos.
Swiss HIV Cohort Study. S. Bachmann, M. Battegay, E.
Bernasconi, H. Bucher, P. Burgisser, M. Egger, P. Erb, W. Fierz,
M. Fischer, M. Flepp, A. Fontana, P. Francioli (President), H.
J. Furrer (Chairman of the Clinical and Laboratory Commit-
tee), M. Gorgievski, H. Gunthard, B. Hirschel, L. Kaiser, C.
Kind, T. Klimkait, B. Ledergerber, U. Lauper, M. Opravil, F.
Paccaud, G. Pantaleo, L. Perrin, J.-C. Piffaretti, M. Rickenbach
(Head of Data Center), C. Rudin (Chairman of the Mother
and Child Substudy), J. Schupbach, R. Speck, P. Tarr, A. Telenti,
A. Trkola, P. Vernazza (Chairman of the Scientific Board), R.
Weber,* and S. Yerly.
Acknowledgment
We thank John Kastelein for guidance and helpful discussions
and for critically reviewing the manuscript.
References
1. Wilson P, D’Agostino R, Levy D, Belanger A, Silbershatz H, KannelW. Prediction of coronary heart disease using risk factor categories.Circulation 1998; 97:1837–47.
2. Criqui MH, Golomb BA. Epidemiologic aspects of lipid abnormalities.Am J Med 1998; 105:48S–57S.
3. Ross R. The pathogenesis of atherosclerosis: a perspective for the 1990s.Nature 1993; 362:801–9.
4. Berliner JA, Navab M, Fogelman AM, et al. Atherosclerosis: basic mech-
anisms. Oxidation, inflammation, and genetics. Circulation 1995; 91:2488–96.
5. Boden WE. High-density lipoprotein cholesterol as an independentrisk factor in cardiovascular disease: assessing the data from Framing-ham to the Veterans Affairs High-Density Lipoprotein InterventionTrial. Am J Cardiol 2000; 86:19L–22L.
6. Burchfiel CM, Laws A, Benfante R, et al. Combined effects of HDLcholesterol, triglyceride, and total cholesterol concentrations on 18-year risk of atherosclerotic disease. Circulation 1995; 92:1430–6.
7. Gordon DJ, Probstfield JL, Garrison RJ, et al. High-density lipoproteincholesterol and cardiovascular disease: four prospective American stud-ies. Circulation 1989; 79:8–15.
8. Grunfeld C, Pang M, Doerrler W, Shigenaga JK, Jensen P, FeingoldKR. Lipids, lipoproteins, triglyceride clearance and cytokines in humanimmunodeficiency virus infection and the acquired immunodeficiencysyndrome. J Clin Endocrinol Metab 1992; 74:1045–52.
9. Riddler SA, Smit E, Cole SR, et al. Impact of HIV infection and HAARTon serum lipids in men. JAMA 2003; 289:2978–82.
10. Carr A, Samaras K, Burton S, et al. A syndrome of peripheral lipo-dystrophy, hyperlipidaemia and insulin resistance in patients receivingHIV protease inhibitors. AIDS 1998; 12:F51–8.
11. Carr A, Cooper DA. Adverse effects of antiretroviral therapy. Lancet2000; 356:1423–30.
12. Egger M, Junghans C, Friis-Møller N, Lundgren JD. Highly active an-tiretroviral therapy and coronary heart disease: the need for perspective.AIDS 2001; 15(Suppl 5):S193–201.
13. Behrens G, Dejam A, Schmidt H, et al. Impaired glucose tolerance,beta cell function, and lipid metabolism: HIV patients under treatmentwith protease inhibitors. AIDS 1999; 13:F63–70.
14. Bonnet F, Saves M, Droz C, et al. Increase of atherogenic plasma profilein HIV-infected patients treated with protease inhibitor–containingregimens. J Acquir Immune Defic Syndr 2000; 25:199–200.
15. Periard D, Telenti A, Sudre P, et al. Atherogenic dyslipidemia in HIV-infected individuals treated with protease inhibitors. The Swiss CohortStudy. Circulation 1999; 100:700–5.
16. Stein JH, Klein MA, Bellehumeur JL, et al. Use of human immuno-deficiency virus–1 protease inhibitors is associated with atherogeniclipoprotein changes and endothelial dysfunction. Circulation 2001; 104:257–62.
17. Henry K, Melroe H, Huebsch J, et al. Severe premature coronary arterydisease with protease inhibitors. Lancet 1998; 351:1328.
18. Carr A, Samaras K, Thorisdottir A, Kaufmann GR, Chisholm DJ, Coo-per DA. Diagnosis, prediction, and natural course of HIV-1 protease-inhibitor–associated lipodystrophy, hyperlipidaemia, and diabetes mel-litus: a cohort study. Lancet 1999; 353:2093–9.
19. Jain RG, Furfine ES, Pedneault L, White AJ, Lenhard JM. Metaboliccomplications associated with antiretroviral therapy. Antiviral Res2001; 51:151–77.
20. Galli M, Ridolfo AL, Gervasoni C. Cardiovascular disease risk factorsin HIV-infected patients in the HAART era. Ann NY Acad Sci 2001;946:200–13.
21. Graham NM. Metabolic disorders among HIV-infected patients treatedwith protease inhibitors: a review. J Acquir Immune Defic Syndr 2000;25 (Suppl 1):S4–11.
22. Segerer S, Bogner JR, Walli R, Loch O, Goebel FD. Hyperlipidemiaunder treatment with protease inhibitors. Infection 1999; 27:77–81.
23. Tsiodras S, Mantzoros C, Hammer S, Samore M. Effects of proteaseinhibitors on hyperglycemia, hyperlipidemia, and lipodystrophy: a 5-year cohort study. Arch Intern Med 2000; 160:2050–6.
24. Thiebaut R, Dabis F, Malvy D, et al. Serum triglycerides, HIV infection,and highly active antiretroviral therapy, Aquitaine Cohort, France, 1996to 1998. J Acquir Immune Defic Syndr 2000; 23:261–5.
25. van der Valk M, Kastelein JJ, Murphy RL, et al. Nevirapine-containingantiretroviral therapy in HIV-1 infected patients results in an anti-atherogenic lipid profile. AIDS 2001; 15:2407–14.
26. Matthews GV, Moyle GJ, Mandalia S, Bower M, Nelson M, GazzardBG. Absence of association between individual thymidine analogues

Effect of PI and NNRTI on Lipid Profiles • JID 2004:189 (15 March) • 1073
or nonnucleoside analogues and lipid abnormalities in HIV-1–infectedpersons on initial therapy. J AIDS 2000; 24:310–5.
27. van Leth F, Phanuphak P, Gazzard B, et al. Lipid changes in a ran-domized comparative trial of first-line antiretroviral therapy with reg-imens containing either nevirapine alone, efavirenz alone, or bothdrugs combined, together with stavudine and lamivudine (2NN study)[abstract 752]. In: Program and abstracts of the 10th Conference onRetroviruses and Opportunistic Infections (Boston). Alexandria, VA:Foundation for Retrovirology and Human Health, 2003:328.
28. Kumar P, Rodriguez-French, Thompson M, et al. Prospective study ofhyperlipidemia in ART-naive subjects taking trizivir (TZV), combivir(COM)/nelfinavir (NFV), or stavudine (d4T)/lamivudine (3TC)/NFV.Antivir Ther 2003; 8(Suppl 1)S380.
29 Staszewski S, Gallant JE, Pozniak AL, et al. Efficacy and safety of ten-ofovir DF (TDF) versus stavudine (d4T) when used in combinationwith lamivudine and efavirenz in antiretroviral naıve patients: 96-weekpreliminary interim results [abstract 564b]. In: Program and abstractsof the 10th Conference on Retroviruses and Opportunistic Infections(Boston). Alexandria, VA: Foundation for Retrovirology and HumanHealth, 2003:259.
30. Bozzette SA, Ake C, Tam HC, Chang SW, Louis TA. Cardiovascularand cerebrovascular events in patients treated for human immuno-deficiency virus infection. N Engl J Med 2003; 348:702–10.
31. Klein D, Hurley LB, Quesenberry CP Jr, Sidney S. Do protease inhib-itors increase the risk for coronary heart disease in patients with HIV-1 infection? J Acquir Immune Defic Syndr 2002; 30:471–7.
32. Mary-Krause M, Cotte L, Simon A, Partisani M, Costagliola D. In-creased risk of myocardial infarction with duration of protease inhibitortherapy in HIV-infected men. AIDS 2003; 17:2479–86.
33. Friis-Møller N, Sabin CA, Weber R, et al. Combination antiretroviraltherapy and the risk of myocardial infarction. N Engl J Med 2003;349:1993–2003.
34. Friis-Møller N, Weber R, Reiss P, et al. Cardiovascular disease riskfactors in HIV patients—association with antiretroviral therapy. Resultsfrom the D:A:D Study. AIDS 2003; 17:1179–93.
35. Friedewald WT, Levy RI, Fredrickson DS. Estimation of the concen-tration of low-density lipoprotein cholesterol in plasma, without useof the preparative ultracentrifuge. Clin Chem 1972; 18:499–502.
36. Expert Panel on Detection, Evaluation, and Treatment of High BloodCholesterol in Adults. Executive Summary of The Third Report of TheNational Cholesterol Education Program (NCEP) Expert Panel on De-tection, Evaluation, and Treatment of High Blood Cholesterol in Adults(Adult Treatment Panel III). JAMA 2001; 285:2486–97.
37. Kinosian B, Glick H, Garland G. Cholesterol and coronary heart disease:predicting risks by levels and ratios. Ann Intern Med 1994; 121:641–7.
38. Centers for Disease Control and Prevention. 1993 Revised classificationsystem for HIV infection and expanded surveillance case definition forAIDS among adolescents and adults. JAMA 1993; 269:729–30.
39. Lundgren JD, Phillips AN, Vella S, et al. Regional differences in useof antiretroviral agents and primary prophylaxis in 3122 EuropeanHIV-infected patients. JAIDS 1997; 16:153–60.
40. Virgili N, Fisac C, Pita AM, Ferrer E, Lacarcel M, Podzamczer D.Preliminary results of anthropometric and metabolic changes observedin HIV-infected patients treated with combivir (ZDV/3TC) plus nel-finavir or nevirapine (a substudy of the COMBINE-study) [abstract1290]. In: Program and abstracts of the 40th Interscience Conferenceon Antimicrobial Agents and Chemotherapy (Toronto). Washington,DC: American Society for Microbiology, 2000:314.
41. Sullivan AK, Nelson MR. Marked hyperlipidemia on ritonavir therapy.AIDS 1997; 11:938–9.
42. Lemieux I, Lamarche B, Couillard C, et al. Total cholesterol/HDL cho-lesterol ratio vs. LDL cholesterol/HDL cholesterol ratio as indices ofischemic heart disease risk in men: the Quebec Cardiovascular Study.Arch Intern Med 2001; 161:2685–92.
43. Constans J, Pellegrin JL, Peuchant E, et al. Plasma lipids in HIV-infectedpatients: a prospective study in 95 patients. Eur J Clin Invest 1994;24:416–20.
44. Moyle GJ, Baldwin C. Lipid abnormalities during saquinavir soft-gel-based highly active antiretroviral therapy. J Acquir Immune Defic Syndr1999; 21:423–4.
45. Cahn P, Dragsted UB, Pedersen C, et al. Week 48 data of a randomizedtrial to evaluate safety and efficacy of indinavir/ritonavir (800/100 mgbid) versus saquinavir/ritonavir (1000/100 mg bid) in adult HIV-1infection [abstract WeOrB1265]. In: Program and abstracts of the XIVInternational AIDS Conference (Barcelona). Stockholm: InternationalAIDS Society, 2002:138.
46. Merry C, Barry MG, Mulcahy F, et al. Saquinavir pharmacokineticsalone and in combination with ritonavir in HIV-infected patients. AIDS1997; 11:F29–33.
47. Flexner C. HIV-protease inhibitors. N Engl J Med 1998; 338:1281–92.48. Martinez E, Conget I, Lozano L, Casamitjana R, Gatell JM. Reversion
of metabolic abnormalities after switching from HIV-1 protease in-hibitors to nevirapine. AIDS 1999; 13:805–10.
49. Martinez E, Romeu J, Garcia-Viejo MA, et al. An open randomizedstudy on the replacement of HIV-1 protease inhibitors by efavirenz inchronically suppressed HIV-1 infected patients with lipodystrophy [ab-stract 668]. In: Program and abstracts of the 8th Conference on Re-troviruses and Opportunistic Infections (Chicago). Alexandria, VA:Foundation for Retrovirology and Human Health, 2001:245.
50. Negredo E, Cruz L, Paredes R, et al. Virological, immunological, andclinical impact of switching from protease inhibitors to nevirapine orto efavirenz in patients with human immunodeficiency virus infectionand long-lasting viral suppression. Clin Infect Dis 2002; 34:504–10.
51. Ruiz L, Negredo E, Domingo P, et al. Antiretroviral treatment sim-plification with nevirapine in protease inhibitor–experienced patientswith HIV-associated lipodystrophy: 1-year prospective follow-up of amulticenter, randomized, controlled study. J Acquir Immune DeficSyndr 2001; 27:229–36.
52. Mantel-Teeuwisse AK, Kloosterman JM, Maitland-van der Zee AH,Klungel OH, Porsius AJ, de Boer A. Drug-induced lipid changes: areview of the unintended effects of some commonly used drugs onserum lipid levels. Drug Saf 2001; 24:443–56.
53. Sharrett AR, Ballantyne CM, Coady SA, et al. Coronary heart diseaseprediction from lipoprotein cholesterol levels, triglycerides, lipopro-tein(a), apolipoproteins A-I and B, and HDL density subfractions.Circulation 2001; 104:1108–13.
54. Ferrieres J, Elias A, Ruidavets JB, et al. Carotid intima-media thicknessand coronary heart disease risk factors in a low-risk population. JHypertens 1999; 17:743–8.
55. Chambless LE, Heiss G, Folsom AR, et al. Association of coronaryheart disease incidence with carotid arterial wall thickness and majorrisk factors: the Atherosclerosis Risk in Communities (ARIC) Study,1987–1993. Am J Epidemiol 1997; 146:483–94.
56. Seminari E, Pan A, Voltini G, et al. Assessment of atherosclerosis usingcarotid ultrasonography in a cohort of HIV-positive patients treatedwith protease inhibitors. Atherosclerosis 2002; 162:433–8.
57. Mercie P, Thiebaut R, Lavignolle V, et al. Evaluation of cardiovascularrisk factors in HIV-1 infected patients using carotid intima-mediathickness measurement. Ann Med 2002; 34:55–63.
58. Currier J, Kendall M, Henry K, et al. Carotid intima-media thicknessin HIV-infected and uninfected adults [abstract 131]. In: Program andabstracts of the 10th Conference on Retroviruses and OpportunisticInfections (Boston). Alexandria, VA: Foundation for Retrovirology andHuman Health, 2003:104.
59. Ferrario M, Kuulasmaa K, Grafnetter D, Moltchanov V. Quality assess-ment of total cholesterol measurements in the WHO MONICA Project.Available at: http://www.ktl.fi/publications/monica/tchol/tcholqa.htm.Accessed 15 October 2002.
60. Mayer KH, Stamler J, Dyer AR, Stamler R, Berkson D. Epidemiologicfindings on the relationship of time of day and time since last mealto five clinical variables: serum cholesterol, hematocrit, systolic anddiastolic blood pressure, and heart rate. Prev Med 1978; 7:22–7.

1074 • JID 2004:189 (15 March) • Fontas et al.
61. Cohn JS, McNamara JR, Cohn SD, Ordovas JM, Schaefer EJ. Post-prandial plasma lipoprotein changes in human subjects of differentages. J Lipid Res 1988; 29:469–79.
62. Walmsley S, Bernstein B, King M, et al. Lopinavir-ritonavir versus nel-finavir for the initial treatment of HIV infection. N Engl J Med 2002;346:2039–46.
63. Murphy R, Pokrovsky V, Rozenbaum W, et al. Long-term efficacy andsafety of Atazanavir with stavudine and lamivudine in patients previouslytreated with nelfinavir or ATV: 108-week results of BMS Study 008/044[abstract 555]. In: Program and abstracts of the 10th Conference onRetroviruses and Opportunistic Infections (Boston). Alexandria, VA:Foundation for Retrovirology and Human Health, 2003:254.