Activated neutrophil by endothelin-1 caused tissue damage in human umbilical cord
Upload
independentCategory
view
0download
0
Original Paper
Exp Nephrol 2000;8:161–172logy
Role of Intrarenal Endothelin 1, Endothelin 3,and Angiotensin II Expression inChronic Cyclosporin A Nephrotoxicity in Rats
César Ramırez Asuncion Olmo Francisco O’Valle Marco Masseroli
Mariano Aguilar Mercedes Gomez-Morales Francisco Revelles
Marıa José Garcıa-Chicano Francisco Arrebola Marıa Eugenia Reguero
Raimundo G. del Moral
Department of Pathology, School of Medicine and University Hospital, Granada, Spain
Received: November 20, 1998
Accepted: April 16, 1999
Dr. Raimundo G. del MoralDepartamento de Anatomıa Patologica, Facultad de MedicinaAvda. de Madrid 11E–18012 Granada (Spain)Tel. +34 958 243509, Fax +34 958 243510, E-Mail [email protected]
ABCFax + 41 61 306 12 34E-Mail [email protected]
© 2000 S. Karger AG, Basel1018–7782/00/0083–0161$17.50/0
Accessible online at:www.karger.com/journals/exn
Key WordsEndothelin 1 W Endothelin 3 W Angiotensin II W
Cyclosporin A W Nephrotoxicity
AbstractEndothelin 1 (Et1) is widely expressed in the kidney and
is related to several functions and to pathological condi-
tions with progression towards sclerosis. The function of
endothelin 3 (Et3) at the renal level is debatable, but it
could have an important regulatory function in the reab-
sorption of water through its action on tubular type B
receptors. Angiotensin II has recently been implicated as
the principal factor responsible for the progression of
interstitial fibrosis induced by cyclosporin A (CsA). We
investigated this relationship in vivo and analyzed the
modifications induced by CsA toxicity in Sprague-Daw-
ley rats treated with 25 mg/kg/day of CsA for 28 and 56
days. Immunohistochemical methods and molecular
analysis were used to study the expression of Et1 and Et3
and immunohistochemistry alone to determine the intra-
renal expression of angiotensin II. Rats treated with CsA
developed chronic nephrotoxicity lesions; semiquantita-
tive analyses of hyaline arteriolopathy revealed that the
passage of time affected the extent of this lesion and led
to the diminution of the total glomerular area. Immuno-
histochemical results showed that chronic CsA treatment
induced moderate secretion of Et1 and Et3 at tubular and
glomerular levels and that the local expression of angio-
tensin II in the treatment groups was more evident than
in control animals. Besides, the mRNA levels of pre-
proEt3 showed a dramatic increase from 28 days after
CsA treatment (control group 0.07 B 0.11 vs. CsA group
0.48 B 0.11, p ! 0.01), while the mRNA levels of pre-
proEt1 increased from 56 days (control group 0.15 B0.05 vs. CsA group 0.34 B 0.09, p ! 0.05). At 28 days,
renal lesions correlated strongly with the mRNA levels of
Et3 (r 1 0.50, p ! 0.01). However, at 56 days, the key find-
ing was the strong correlation of the most important ana-
lytical, histological, and immunohistochemical parame-
ters of CsA nephrotoxicity with Et1 mRNA levels (r 1 0.50,
p ! 0.01). These results support the hypothesis that the
clinical and morphological phenomena linked with CsA
nephrotoxicity are related to hypersecretion of endothe-
lins and local expression of angiotensin II in the outer
medulla and medullary rays; Et3 and angiotensin II are
the first to act, followed subsequently by Et1.Copyright © 2000 S. Karger AG, Basel

162 Exp Nephrol 2000;8:161–172 Ramırez et al.
Introduction
Cyclosporin A (CsA) induces immunosuppression byinterfering with normal T lymphocyte function [1, 2] andin the kidney induces P glycoprotein overexpression intubular cells [3–5] and produces upregulation of bothendothelin 1 (Et1) secretion [6] and transforming growthfactor beta 1 (TGF-ß1) [7].
One of the main secondary effects of CsA treatment isnephrotoxicity, reported in both clinical [8] and experi-mental studies [9, 10]. Morphological findings of CsAnephrotoxicity include vacuolar isometric degenerationof kidney tubules, hyaline arteriolopathy, and strippedand diffuse interstitial fibrosis [11–13].
Because most structural changes in experimental mod-els in rats are related to salt depletion [14], the role ofendothelins and the renin-angiotensin system (RAS) inchronic CsA nephrotoxicity must be considered. Experi-mental studies on CsA-induced nephropathy in rats foundthat (1) blockers of angiotensin II receptor and angioten-sin II converting enzyme inhibitors prevent the develop-ment of interstitial fibrosis [15] and retard the accumula-tion of TGF-ß1 and proteins of the extracellular matrix inCsA-induced chronic nephropathy [16], and (2) Et1, atleast during the first 30 days after CsA treatment, hasexclusively a renal vasoconstrictor role and does notdirectly participate in the genesis of interstitial fibrosis[17], implying that this disorder is directly linked with theoverproduction of TGF-ß1 [7, 16].
With respect to the synthesis of the possible mediatorsof interstitial fibrosis, macrophage infiltration is consis-tently associated with CsA nephrotoxicity, and its role hasbeen stressed as an agent both producing mediators offibrosis [18, 19] and synthesizing endothelin [20] andTGF-ß1 [21]. Sharma et al. [22] recently proposed TGF-ß1 as the key growth factor in progressive interstitialfibrosis observed in chronic allograft nephropathy.
However, the kidney is rich in Et1 [23], and it seemsproven that an excess of TGF-ß1 leads to the hypersecre-tion of Et1 through endothelial [24] and probably mesan-gial and epithelial cells of the kidney. This latter factorwould be responsible for the development of arterialhypertension, at least in the intrarenal vasculature, whichwould contribute to the progression of the chronic graftdysfunction [22].
With respect to the physiological role played by endo-thelin 3 (Et3) at the renal level, its mRNA has beendetected in human kidney, but not the active peptide;thus its function in normal kidney is debatable. However,an evident expression of the peptide has been demon-
strated at the tubular level in rats, even greater than thatof Et1 [25], and in rabbit proximal tubular cells in culture[26] which suggests an important regulatory function forEt3 in the reabsorption of water through its action ontubular type B receptors for endothelin (EtBr) [27].
The aims of the present study were to analyze thechanges induced by CsA in kidney endothelin secretion ina model of chronic nephrotoxicity in Sprague-Dawley ratsand to characterize the relationship between thesechanges and the analytical alterations and renal lesionsinduced by CsA, as well as their interaction with intrare-nal expression of angiotensin II.
Materials and Methods
Animals110 male Sprague-Dawley rats (Charles River, Saint-Aubin-lès-
Elbeuf, France) with an initial body weight between 265 and 315 gwere housed in metabolic cages in a temperature- and light-con-trolled environment before and after treatment. All received mainte-nance diet UAR A042 (UAR, Orge, France) with tap water ad libi-tum. All procedures were performed according to Spanish Govern-ment and European Union regulations (EEC Directive 86/609).
DrugsPowdered CsA (Novartis, Basel, Switzerland) was dissolved in
propylene glycol (PLG; Sigma Chemical, St. Louis, Mo., USA). Alzet2ML4 osmotic pumps (Alza, Palo Alto, Calif., USA) were filled withthis CsA solution to obtain 25-mg/kg/day doses, delivered at a con-stant rate of 2.5 Ìl/h. Control rats received PLG or 0.9% sodiumchloride solution (SC), also via osmotic pumps. The osmotic pumpswere implanted into rats according to the instructions provided bythe manufacturer. The rats were anesthetized with pentobarbitonesodium (40 mg/kg i.p.). The back of each animal was cleaned withpovidone-iodine, and a sagittal incision was made. The pump wasplaced beneath the skin, and the incision was then closed by sutureand treated with a plastic dressing spray. The pumps containedenough solution for 28 days, at which time they were replaced.
Experimental DesignThe rats were randomly divided into the following groups of ani-
mals: (1) CsA group: 60 rats with CsA treatment (25 mg/kg/day);(2) PLG group: 30 rats receiving PLG, and (3) SC group: 20 ratsreceiving 0.9% SC. All rats were housed in metabolic cages for 1 weekbefore treatment. After 28 and 56 days, 50% of the animals in eachgroup were killed by heart puncture under light ether anesthesia, andwhole blood was extracted for functional studies and to measurewhole-blood CsA levels. Both kidneys were removed and processedfor histological, immunohistochemical, and molecular analyses.
Functional StudiesThe whole-blood CsA levels were measured by radioimmunoas-
say (RIA; Cyclo-Trac SP – Incstar, Stillwater, Minn., USA). Theblood parameters (urea and creatinine) were measured using a Hita-chi 705 analyzer (Boehringer Mannheim, Germany). Plasma and uri-nary excretions of endothelins at 28 and 56 days were measured by

CsA Nephrotoxicity and Endothelins Exp Nephrol 2000;8:161–172 163
using the RPA 555 endothelin-1–21-specific (125I) RIA system withAmerlex®-M magnetic separation (Amersham, Little Chalfont, En-gland) which detected active Et1, Et2, and Et3.
Renal Histopathology and Digital Image Quantification ofInterstitial SclerosisFor histological examinations, buffered 4% formaldehyde-fixed,
paraffin-embedded longitudinal tissue sections in the sagittal planewere stained with hematoxylin and eosin, Masson-Goldner tri-chromic stain, and periodic acid-Schiff stain (PAS). The medullaryrays were identified following the criteria of Rosen et al. [13]. Prepa-rations of the renal cortex were examined by two experienced pathol-ogists who evaluated the presence of isometric vacuolization in tubu-lar cells and tubular atrophy. Lesions were scored on a four-pointintensivity semiquantitative scale (1, absence; 2, mild; 3, moderate,and 4, intense). The presence of hyaline arteriolopathy was also eval-uated in PAS-stained sections, and animals were considered positivewhen there was presence of PAS-positive granules on the wall of atleast 1 of 20 afferent glomerular arterioles.
To quantify interstitial fibrosis, slides were examined automati-cally with digital image analysis. Image analysis was done in paraffin-embedded tissues stained using the standard Sirius red procedure[28]. Because sclerosis in the renal cortex was distributed irregularly,images containing glomeruli (areas of periglomerular fibrosis) werequantified separately from images containing only tubules and inter-stitium. These images were selected mainly from the areas of themedullary rays, where the first signs of CsA-induced tubulointersti-tial nephropathy usually appear [13]. Peritubular and periglomerularareas were analyzed in 20 microscopic fields. The images were cap-tured using a BCD-700 CCD Vidamax video camera connected to aBH-2 Olympus microscope (!200 magnification), and the 256-gray-level scale (black and white) was processed with the fibrosis HR®
package (Master Diagnostica, Granada, Spain), this program runningunder Windows (Microsoft, Redmond, Wash., USA). The fibrosisHR package automatically extracted basal membranes and connec-tive tissue stained with Sirius red, eliminated the background oftubular cell nuclei, and extracted the glomerular area according to analgorithm that identifies the glomerular uriniferous space. Whenthere were zones of contact between the capillary area and the Bow-man capsule, it was occasionally necessary to discriminate them withthe manual interaction option of the program. The results wereexpressed as the percentage of fibrosis relative to the other elementsin the image after the glomerular area was subtracted. This methodyielded accurate automatic quantifications of peritubular and peri-glomerular fibrosis as well as the glomerular morphometry [28].
Primary AntibodiesTwo polyclonal antibodies were used to detect Et1 and Et3 (Pen-
insula Laboratories, Belmont, Calif., USA): rabbit anti-Et1 thatreacts with the human, porcine, bovine, mouse, and rat Et1 and rab-bit anti-Et3 that reacts with the human and rat Et3, each used atdilutions of 1:500. Angiotensin II was detected with a specific poly-clonal antibody at a dilution of 1:500 (Penınsula Laboratories). Thevimentin expression was assessed with a specific monoclonal anti-body (clone V9; Master Diagnostica) at a dilution of 1:50.
Immunohistochemical MethodsImmunostaining for vimentin, Et1 and Et3, and angiotensin II
was done in 4-Ìm paraffin-embedded kidney sections using standardmultilink streptavidin-biotin-peroxidase or alkaline phosphatase kits
(Master Diagnostica). For vimentin, deparaffinized sections weretreated with 0.3% H2O2 in methanol for 15 min and then with micro-waves at 700 W for 10 min in 0.01 M citrate buffer (pH 6.0) for anti-gen retrieval before immunostaining; as additional external control,a parallel slide was incubated with a nonspecific monoclonal isotypicantibody. For Et1 and Et3, the nonspecific immunostaining wasblocked with treatment for 30 min in 0.3% casein and 0.5% Tween20 before incubation with normal goat serum. The immunostainingof endothelium and collecting tubule was used as positive internalcontrol for Et1 and Et3, respectively. Additionally, a parallel slidewas incubated with nonspecific polyclonal antibody as negative con-trol. For angiotensin II, the constant and intense immunostaining ofthe internal medulla was considered as positive internal control and aparallel slide stained with a nonspecific polyclonal antibody as nega-tive control.
Immunostaining for the neoexpression of tubular vimentin wasevaluated semiquantitatively on a five-point scale (1, negative pat-tern; 2, !10% of the tubules stained; 3, 10–25% of the tubulesstained; 4, 25–50% of the tubules stained, and 5, 150% of the tubulesstained).
Immunostaining for Et1 and Et3 was evaluated semiquantitative-ly at tubular and glomerular levels using four categories (1, normalpattern; 2, mild overexpression; 3, moderate overexpression, and 4,intense overexpression – fig. 1). Intrarenal angiotensin II was alsoevaluated semiquantitatively (1, normal pattern; 2, mild overexpres-sion, and 3, moderately intense overexpression – fig. 2).
All immunostainings were evaluated in a double-blinded mannerby two experienced pathologists (R.G.M. and C.R.).
Northern Blot MethodsThe total RNA was isolated from 0.1 g of frozen renal cortex tis-
sue of treated/untreated rats, following the procedure of Chomczyns-ki and Sacchi [29]. About 40 Ìg of total RNA was electrophoresed in1% agarose gels with MOPS buffer (pH 7.0): 20 mM MOPS [3-(N-morpholino)propanesulfonic acid], 10 mM sodium acetate, 1 mMEDTA (ethylenediaminetetraacetic acid), and 2.2 M formaldehyde[30]. RNA was blotted into nylon filters (Hygond N; Amersham Iber-ica, Madrid, Spain), as described [30].
To determine the presence of the mRNA of Et1 and Et3 withNorthern blot, a homologous probe of the codifying rat gene of pre-proEt1 and preproEt3 was obtained with the reverse transcriptionand polymerase chain reaction (RT-PCR) [30]. Lung and spleen tis-sues were used as RNA templates for Et1 and Et3, respectively, asthese organs have a more intense expression of Et1 and Et3. To thisend, specific primers were designed from the nucleotide sequences ofrat preproEt1 and preproEt3 cDNA [31, 32] which provided PCRproducts of 380 and 340 pb, respectively, for Et1 and Et3.
Oligonucleotides:1 preproEt1: forward 5)-GCTCCTGCTCCTCCTTGATGG-3)
reverse 5)-TCTTGATGGTGTTGCTGATGG-3) 2 preproEt3: forward 5)-CGGCGCTGCACTTGCTTCACT-3)
reverse 5)-GACTTTATCTGTCCTTGACTT-3)The PCR products were cloned and the fragment sequences veri-
fied. The probes were isolated free from plasmid and radioactivelylabeled with 32P-dCTP by the ‘random-primer’ method, using a ran-dom primer DNA labeling kit (Boehringer Mannheim).
Hybridization was done by the method of Southern [33], incubat-ing for 12 h at 42 °C in hybridization solution and introducing theradioactively labeled probe; the filters were washed twice during20 min in a solution of 0.1 ! SSC and 0.1% SDS at 55°C and were
164 Exp Nephrol 2000;8:161–172 Ramırez et al.
Fig. 1. A Mild immunostaining of the glomerular endothelium for Et1. Control rat at 56 days, normal pattern. Streptavidin-biotin-alkalinephosphatase staining (SBAP). !400. B Mild immunostaining of the cytoplasm of distal convoluted and collecting tubules for Et3. Control ratat 56 days. SBAP. !200. C, D Immunostaining of mesangial cells and patches of the proximal convoluted tubules for Et1 (C; rat after 28 daysof CsA treatment, SBAP, !200) and Et3 (D; rat after 28 days of CsA treatment, SBAP, !200). E, F Massive immunostaining of proximalrenal tubules for Et1 (E; rat after 56 days of CsA treatment, SBAP, !200) and Et3 (F; rat after 56 days of CsA treatment, SBAP, !200).
A
C
E
B
D
F

CsA Nephrotoxicity and Endothelins Exp Nephrol 2000;8:161–172 165
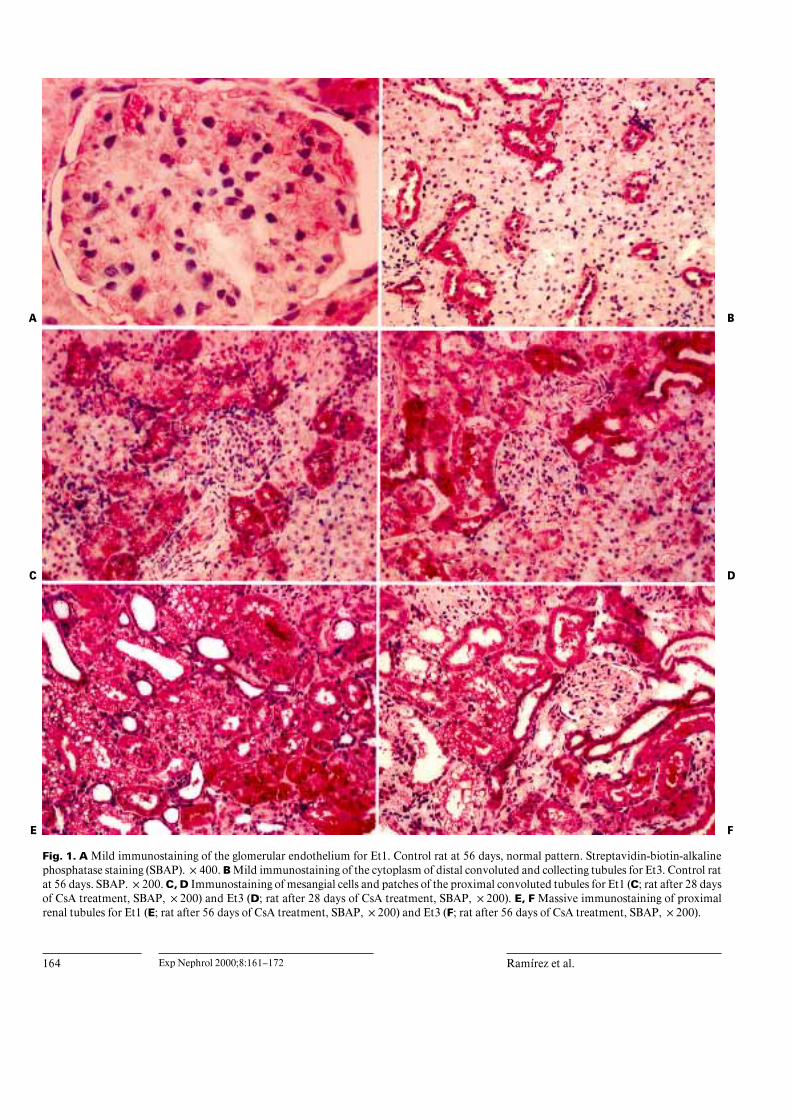
Fig. 2. Angiotensin II. A Immunostaining of the capillary network and peritubular connective tissue of the innermedulla. Control rat at 56 days. Streptavidin-biotin-alkaline phosphatase staining (SBAP). !100. B Diffuse immu-nostaining of peritubular connective tissue in the outer medulla with weak spread to the inner medulla. Rat after 56days of PLG treatment. SBAP. !100. C Focal staining of the cortical peritubular capillary network surroundingconnective tissue and cytoplasm of some cortical tubular cells. Rat after 56 days of CsA treatment. SBAP. !200.D Patent spreading to the medullary rays. Rat after 56 days of CsA treatment. SBAP. !100.
brought in contact with an X-OMAT radiography film (EastmanKodak, Rochester, N.Y., USA).
The films were developed after the exposures, revealing the spe-cific bands corresponding to the messenger RNA of both Et1 (2.3 kb)and Et3 (3 kb) that was recognized by the radioactive probe. Theamount of RNA contained in each of the samples was normalized byhybridizing again the same filters with the specific probe of the gly-ceraldehyde phosphate dehydrogenase gene of the rat.
The intensity was quantified with densitometry using the imagedigital analysis program Visilog 4.1 (Noesis, Vélizy, France). Thenormalized value of the levels of expression of Et1 and Et3 wasobtained by dividing the value obtained for glyceraldehyde phos-phate dehydrogenase by that obtained for each one.
Statistical AnalysisData are expressed as mean B SD. The normality of distribution
of the values was assessed with the Kolmogorov-Smirnov test. Two-way analysis of variance (Anova2) was used to compare Et1 and Et3,angiotensin II, TGF-ß1 and vimentin immunohistochemistry andmRNA expressions of the two endothelins, renal function and histo-pathological values, and their interactions with two points in time(28 and 56 days) in the different treatment groups. One-way analysisof variance (Anova) was used to compare RIA results. The relation-ships between parametric variables were evaluated with Pearson’stest, and those between nonparametric quantitative variables withthe Spearman test. Chi-squares and percentage comparison testswere used to compare qualitative variables and Student’s t test to
A
C
B
D

WC, g
166 Exp Nephrol 2000;8:161–172 Ramırez et al.
Table 1. Analytical, histological, and morphometric results after 28 and 56 days in the different treatment groups (mean B SD)
28 days
CsA PLG SC
56 days
CsA PLG SC
Statistical significance
Anova2
SBG SBD SIBG
NKT
49B43 80B33 119B29 81B33 121B25 148B25 p ! 0.001 p ! 0.001 no all vs. allCr, mg/dl 0.70B0.18 0.61B0.11 0.52B0.06 0.88B0.35 0.62B0.10 0.68B0.05 p ! 0.01 p ! 0.01 no CsA vs. allUrea, mg/dl 111B46 40B7 38B6 159B56 39B6 52B10 p ! 0.001 p ! 0.01 p ! 0.05 all vs. allTA 2.21B0.83 1.06B0.25 1.0B0.0 2.75B0.8 1.05B0.23 1.15B0.57 p ! 0.001 NS no CsA vs. allITV 1.53B0.74 1.0B0.0 1.0B0.0 1.64B0.8 1.10B0.31 1.0B1.0 p ! 0.01 NS no CsA vs. allPHA, % 57.1 0 0 76 0 0 p ! 0.001* NS** – –PGF, % 12.10B2.97 10.40B2.52 0.10B0.62 13.76B3.20 10.90B2.60 9.60B0.85 p ! 0.001 NS no all vs. allPTF, % 10.40B2.77 7.20B1.76 0.20B1.21 12.11B4.02 8.70B1.69 8.5B0.69 p ! 0.001 NS no CsA vs. allGA, Ìm2 8,993B1,892 9,775B1,444 8,620B438 7,736B2,046 9,711B2,368 8,506B1,241 p ! 0.05+ NS no –
WC = Weight change (final weight – initial weight); Cr = serum creatinine; TA = tubular atrophy; ITV = isometric tubular vacuolization;PHA = percentage hyaline arteriolopathy; PGF = percentage periglomerular fibrosis; PTF = percentage peritubular fibrosis;GA = glomerular area; CsA = cyclosporin A group; PLG = propylene glycol group; SC = sodium chloride group; SBG = significance between groups;SBD = significance between 28 and 56 days; SIBG = statistical interaction between groups and time variables; NS = not significant.* Chi-squared test at 28 and 56 days after treatment; ** percentage comparison test between both CsA-treated groups;+ significance between CsA groups at 28 and 56 days (Student’s t test); NKT = Newman-Keuls test.
evaluate quantitative variables. Correlation coefficients below 0.5were not considered. Differences at the 0.05 level of probability wereaccepted as significant.
Results
Functional and Histological ResultsAdministration of CsA for 28 and 56 days at a dose of
25 mg/kg/day produced a slight increase in serum creati-nine and a moderate increase in urea in the CsA-treatedgroup (table 1); the difference between treated and controlgroups was significant and progressed with time (Anova2,p ! 0.01). The weight increase with respect to the initialmean body weight was significantly smaller in the CsAgroup (days 28 and 56, table 1).
The mean whole-blood level of CsA in the treatedgroup was 4,895 B 2,573 ng/ml at 28 days and 7,116 B2,213 ng/ml at 56 days (Student’s t test, p ! 0.01). Themean plasma level of endothelins by RIA at 28 days was3.38 B 1.23 pg/ml in the treated group versus 3.20 B 0.78and 2.70 B 0.90 pg/ml in the PLG and SC control groups,respectively, and at 56 days was 3.74 B 0.75 pg/ml versus3.23 B 0.71 and 2.71 B 0.86 pg/ml (Anova, p ! 0.05).The urinary excretion rate of endothelins at 28 days was1.91 B 0.94 pg/ml/100 g in the treated group versus 1.91B 0.81 and 1.44 B 0.81 pg/ml/100 g in the PLG and SCcontrol groups (Student’s t test, p ! 0.05) and at 56 dayswas 2.58 B 1.13 pg/ml/100 g versus 2.02 B 0.92 and 1.64
B 0.62 pg/ml/100 g, respectively (Anova, p ! 0.05). Thedifferences between treated animals and controls were sig-nificant in all cases.
Histopathological examination of the kidney disclosedlesions typical of chronic CsA toxicity in the group oftreated animals. Although the differences between thegroups were significant at both 28 and 56 days, the mostimportant changes in isometric tubular vacuolization andtubular atrophy were evident at 28 days and did not pro-gress significantly over time (table 1). Interstitial fibrosiswas distributed irregularly and was more common in themedullary ray zone, although some spread to periglome-rular zones was also apparent. The mean values obtainedby automatic image analysis in the two zones are givenin table 1. There were significant differences betweentreated animals and controls receiving PLG solvent or SCsolution. Although the deposits of extracellular materialincreased in the CsA-treated and PLG groups versus SCcontrols, the differences between animals at 28 and 56days were not significant. However, semiquantitativeanalyses of hyaline arteriolopathy revealed that the pas-sage of time affected the extent of this lesion which wasmore severe in the animals at 56 days of CsA treatment(table 1).
An interesting morphometric finding is the evolutionof the total glomerular area during the experiment, withevidence of glomerular tuft size increase only in the PLGgroup and of tuft size decrease only in the CsA-treatedgroup after 56 days of administration (table 1).

VIM
CsA Nephrotoxicity and Endothelins Exp Nephrol 2000;8:161–172 167
Table 2. Immunohistochemical and Northern blot results after 28 and 56 days in the different treatment groups (mean B SD)
28 days
CsA PLG SC
56 days
CsA PLG SC
Statistical significance
Anova2
SBG SBD SIBG
NKT
2.29B0.60 1.25B0.44 1.0B0 2.55B0.75 1.15B0.37 1.0B0 p ! 0.001 NS no all vs. allAGII 1.77B0.75 1.55B0.47 1.50B0 2.50B0.75 1.64B0.36 1.37B0.25 p ! 0.001 NS no all vs. allET1-IHC 1.58B0.43 1.42B0.27 1.16B0.12 1.80B0.53 1.54B0.37 1.08B0.09 p ! 0.001 NS no all vs. allET3-IHC 1.65B0.39 1.44B0.38 1.20B0.23 1.75B0.39 1.51B0.26 1.11B0.08 p ! 0.001 NS no all vs. allET1-NB 0.20B0.10 0.18B0.09 0.23B0.05 0.34B0.09 0.17B0.07 0.15B0.05 p ! 0.05 NS p ! 0.05 CsA vs. allET3-NB 0.48B0.30 0.09B0.05 0.07B0.11 0.36B0.10 0.20B0.09 0.10B0.04 p ! 0.01 NS no all vs. all
VIM = Tubular vimentin; AGII = angiotensin II intrarenal expression; Et1-IHC = endothelin 1 immunohistochemistry;Et3-IHC = endothelin 3 immunohistochemistry; Et1-NB = Northern blot endothelin 1; Et3-NB = Northern blot endothelin 3.For explanation of the other abbreviations see table 1 footnote.
Immunohistochemical ResultsImmunostaining of paraffin sections for endothelins
revealed different patterns: (1) a normal pattern similar tountreated controls, with mild immunostaining only in theendothelium of glomerular and interstitial vessels for Et1(fig. 1A) and mild immunostaining of the cytoplasm ofdistal convoluted and collecting tubules for Et1 and Et3(fig. 1B); (2) like the previous patterns plus immunostain-ing of mesangial cells plus immunostaining in patches ofthe proximal convuluted tubules for Et1 (fig. 1C) and Et3(fig. 1D), and (3) like the previous patterns plus massiveimmunostaining of proximal renal tubules for both endo-thelins (fig. 1E, F). The animals in the SC group neverscored above 2 for the expression of either endothelin.
Semiquantitative analyses showed that chronic CsAtreatment induced moderate secretion of Et1 and Et3 attubular and glomerular levels (table 2), evident after 28days of treatment, and that overexpression tended to pro-gress with time. The solvent PLG also induced increasedsecretions of Et1 and Et3 with respect to the SC controlgroup (table 2).
Immunostaining of paraffin sections for angiotensin IIdemonstrated three different patterns: (1) a normal pat-tern similar to most of the animals in the SC controlgroup, with immunostaining of the capillary network andperitubular connective tissue of the inner medulla(fig. 2A); (2) a mild pattern consisting of normal signs plusdiffuse immunostaining of peritubular connective tissuein the outer medulla, with some focal spread to the medul-lary rays (fig. 2B), and (3) a moderate/severe pattern con-sisting of mild signs plus extensive immunostaining of theouter medulla with patent spreading to the medullary raysand focal staining of the cortical peritubular capillary net-
work, surrounding connective tissue and cytoplasm ofsome cortical tubular cells (fig. 2C, D). Semiquantitativeanalysis of immunostaining for angiotensin II showedthat its expression was more evident in CsA-treated ratsthan in PLG and SC control animals (Anova2, p ! 0.001;table 2). Angiotensin II accumulation increased withtime.
Northern Blot ResultsThe Northern blot study of the mRNA of preproEt3
(fig. 3A) showed a dramatic increase in mRNA levelsfrom 28 days after CsA treatment (0.48 B 0.30 vs. 0.09 B0.05 vs. 0.07 B 0.11, Anova2, p ! 0.05; table 2). In con-trast, the mRNA levels of Et1 remained unaltered duringthis time (fig. 3A). On the other hand, after 56 days oftreatment, and although the elevation of Et3 mRNA per-sisted (fig. 3B), the Et1 mRNA levels increased (fig. 3B) inparallel with the immunostaining of active Et1, with sta-tistical significance between the three groups (0.34 B 0.09vs. 0.17 B 0.07 vs. 0.15 B 0.05, Anova2, p ! 0.05;table 2).
Statistical Correlations between Analytical,Morphologic, Immunohistochemical, and MolecularDataWhen all the animals in each group were independent-
ly considered after 28 and 56 days of CsA treatment, wefound very different and interesting statistical correla-tions (tables 3, 4).
At 28 days (table 3), serum creatinine and urea, themain analytical parameters used in the study, showed astrong dependence on certain histological lesions, such astubular atrophy and vacuolization and in the case of urea

Cr
Cr
168 Exp Nephrol 2000;8:161–172 Ramırez et al.
Fig. 3. Northern blot analysis of preproEt1(Et1) and preproEt3 (Et3) mRNA in kidneysof sodium chloride controls (C) and CsA-treated rats at 28 days (A) and 56 days (B) oftreatment. Total RNA was hybridized with32P-labeled cDNA probes for rat preproEt1and preproEt3. The blots were rehybridizedwith glyceraldehyde-3-phosphate dehydro-genase (GAPDH) cDNA probe as an inter-nal control.
Table 3. Statistically significant correlations between analytical, morphologic, immunohistochemical, and molecular data at 28 days
Urea TA ITV PHA PGF PTF VIM AGII Et1-IHC Et3-IHC Et1-NB Et3-NB
0.60† 0.50† 0.55† NS 0.57† NS NS NS NS NS NS NSUrea – 0.80† 0.57† 0.63† NS 0.60† 0.65† NS NS NS NS NSTA 0.80† – 0.50† 0.60† NS 0.56† 0.67† NS NS NS NS 0.50++
ITV 0.57†t 0.50† – 0.52† 0.61† 0.57† 0.50† NS NS NS NS 0.53++
PHA 0.63† 0.60† 0.52† – NS NS 0.50++ NS NS NS NS 0.50*PGF NS NS 0.61† NS – 0.59† 0.57† NS NS NS NS 0.54++
PTF 0.60† 0.56† 0.57† NS 0.59† – NS NS NS NS NS 0.75†
VIM 0.65† 0.67† 0.50† 0.50++ 0.57† NS – NS NS NS NS NSAGII NS NS NS NS NS NS NS – NS NS NS NSEt1-IHC NS NS NS NS NS NS NS NS – NS NS NS
For explanation of abbreviations see table 1 and 2 footnotes.† p ! 0.001; ++ p ! 0.01; * p ! 0.05.
Table 4. Statistically significant correlations between analytical, morphologic, immunohistochemical, and molecular data at 56 days
Urea TA ITV PHA PGF PTF VIM AGII Et1-IHC Et3-IHC Et1-NB Et3-NB
0.63† 0.56† 0.53† 0.56† NS NS 0.57† 0.60† NS 0.51† 0.51† NSUrea – 0.80† NS 0.70† NS NS 0.71† NS NS NS 0.57† NSTA 0.80† – 0.51† 0.70† 0.55† 0.52† 0.85† 0.50++ NS NS 0.61† NSITV NS 0.51† – NS NS NS 0.60† 0.51++ NS 0.50† NS 0.53++
PHA 0.70† 0.70† NS – NS NS 0.71† 0.58† 0.50† NS 0.60† 0.56++
PGF NS 0.55† NS NS – 0.80† 0.60† 0.57† NS NS 0.50++ 0.50++
PTF NS 0.52† NS NS NS – 0.58† 0.68† NS NS 0.52++ NSVIM 0.71† 0.85† 0.60† 0.71† 0.60† 0.58† – 0.57† NS 0.53† 0.75† 0.66†
AGII NS 0.50++ 0.51++ 0.58† 0.57† 0.68† 0.57† – NS 0.60† 0.50* 0.65†
Et1-IHC NS NS NS 0.50† NS NS NS NS – 0.52† NS NS
For explanation of abbreviations see table 1 and 2 footnotes.† p ! 0.001; ++ p ! 0.01; * p ! 0.05.

CsA Nephrotoxicity and Endothelins Exp Nephrol 2000;8:161–172 169
also on the expression of tubular vimentin, the presence ofhyaline arteriolopathy, and the percentage of periglome-rular interstitial sclerosis. Among the immunohistochem-ical variables stand out the close relationship between theexpression of vimentin and the clinical and histologicalparameters that denote renal lesion (table 3) and also theabsence of a relationship with a coefficient over 0.5between these parameters and the intrarenal expression ofangiotensin II, Et1, or Et3. In contrast, renal lesions corre-lated strongly with mRNA levels of Et3 measured byNorthern blot (table 3).
At 56 days (table 4), there was a dramatic change in thecorrelations between clinical data, histological lesions,and immunohistochemical and Northern blot results. Therelationship between tubular vimentin neoexpression andCsA-induced clinical and histological modifications notonly persisted but increased, and this was also true forintrarenal angiotensin II and Et1 and Et3 expressions (ta-ble 4). Nevertheless, the finding of greatest interest is thestrong correlation of the most important analytical, histo-logical, and immunohistochemical parameters of CsAnephrotoxicity with Et1 mRNA levels. In contrast,mRNA levels of Et1 did not show a strong relationshipwith the immunostaining for this peptide inside the kid-ney. All the above suggests that during the 2nd month oftreatment with CsA, the role of Et3 in developing CsA-induced clinical and morphologic renal changes in rats isprogressively assumed by Et1.
Discussion
Our study analyzes Et1 and Et3 expressions in the kid-ney in an experimental in vivo model of chronic CsAnephrotoxicity in rats and examines their relationshipwith the intrarenal expression of angiotensin II.
CsA induces a reduction of renal blood flow by directvasoconstriction of the glomerular afferent arteriole inexperimental models in both rats [34] and humans [35].The following have been proposed as mediators of CsA-induced vasoconstriction: increases in thromboxane A2,angiotensin II, Et1 [16, 19, 36], or platelet-derived growthfactor [37] or a reduction in prostaglandin vasodilators [38]or in the intrarenal production of nitric oxide (NO) [39].
Because hyaline arteriolopathy is the most characteris-tic lesion of CsA-induced nephrotoxicity in humans [12]and in experimental models in rats [40], and since thislesion has been linked with increased activity of the RAS[4, 41], the role of angiotensin II in the origin of CsA neph-rotoxicity should be considered.
In our experimental model we observed some degree ofhyaline arteriolopathy in a relatively high percentage ofanimals, mainly after 56 days of CsA treatment, associat-ed with an increase in the intrarenal expression of angio-tensin II (r = 0.58 Spearman test, p ! 0.001). The presenceof evident hyaline arteriolopathy has largely been re-ported in chronic CsA nephrotoxicity models using low-salt diets [14, 42]. However, in an earlier work [4], wewere able to identify some afferent arterioles with PAS-positive hyaline deposits even in rats on a standard diet.In the present study, the immunohistochemical localexpression of angiotensin II after 56 days was very direct-ly related to the severity of the histological lesions (ta-ble 4), to the tubular neoexpression of vimentin (indicat-ing chronic tubular lesion associated with CsA-inducednephrotoxicity) [43], and also to analytical parameters.Nevertheless, the repercussions of the long-term CsAtreatment on renal function were trivial in our model. Inother models using a low-salt diet [15, 17], the RAS acti-vation was already seen after the first few weeks of CsAtreatment. In contrast, in our experiment, the intrarenalexpression of angiotensin II only clearly started during the2nd month of CsA treatment (table 2), and we believe thisdelay may be related to the non-salt-depleted diet of ourrats.
Sodium depletion has been shown to produce an earlyactivation of the RAS [4, 44] through tubular osteopontinsecretion and consequent intrarenal expression of TGF-ß1 [45]. Shihab et al. [46] recently demonstrated that boththe characteristic lesions of nephropathy by CsA and theintrarenal expression of TGF-ß1 are much more evidentin rats on a low-salt diet than in those on a normal diet.We believe that our finding of a statistically significantincrease in rats on a standard diet is related to our use ofthe fibrosis HR automatic quantification system whichdetects oscillations of the renal stroma !5% [4, 28].
Further evidence of the role of angiotensin II in theproduction of interstitial fibrosis comes from the observa-tion that progression of the fibrosis is detained by blockersof angiotensin II converting enzyme and losartan [15, 16].In contrast, the use of blockers of the A/B receptors ofendothelin normalized renal hemodynamics, but did notinfluence the progression of the fibrosis [15].
Our immunohistochemical and Northern blot resultsfor the endothelins offer a new perspective on the physio-pathology of chronic CsA-induced nephrotoxicity in rats.We demonstrated with these techniques a dramatic in-crease in the secretion of Et3 in the animals after 28 daysof CsA treatment as compared with controls, correlatingin the case of Northern blot results with the histological

170 Exp Nephrol 2000;8:161–172 Ramırez et al.
lesions present in the animals. The Et1 mRNA levels didnot vary at this time, whereas the immunohistochemicalexpression of Et1 was slightly increased (table 2, fig. 3).We consider that these findings could be attributed toan overregulation at the posttranslational level of Et1mRNA, as similarly demonstrated in (1) human endothe-lial cells after their stimulation with bacterial lipopolysac-charides [47]; (2) an experiment with renal mass reduc-tion in rats demonstrating that tubulointerstitial lesionsprecede Et1 gene overexpression [48], and (3) another invivo model showing that treatment with the angiotensin-converting enzyme inhibitor quinapril blocks the progres-sion of histological lesions, improves proteinuria, andmarkedly reduces Et1 mRNA levels in spontaneouslyhypertensive rats [49].
Our immunohistochemical and Northern blot resultsfor Et1 and Et3 after 56 days of treatment show that Et1assumed a major complementary role in relation to theanalytical and morphological changes that indicate CsA-induced nephrotoxicity (tables 3, 4). Of particular interestis the strong relationship between vimentin expressionand mRNA levels of Et1 and Et3, suggesting a possiblerole for the endothelins in the generation of CsA-inducedchronic tubular lesions [43].
The delay in the overexpression of the mRNA of Et1may be related to the intrarenal expression of angiotensinII and TGF-ß. Shihab et al. [16, 46] reported that treat-ment of sodium-depleted rats with CsA for 28 daysinduced an increase in TGF-ß mRNA which accumulatedmainly in outer medulla and medullary rays of the kidney[7], a site where the intrarenal deposition of angiotensin IIwas demonstrated in our present experimental model. Onthe basis of these findings and some in vitro models [50,51], both angiotensin II and TGF-ß have been implicatedas main factors in the transcription of the big Et1. Ourresults suggest a possible relationship between these twomediators in the appearance of CsA-induced interstitialfibrosis [7, 19, 41] and in the recruitment of renal cells tostimulate the transcription of Et1 gene, mainly after 56days of treatment with CsA.
The absence of a strong correlation (!0.5) between theintrarenal deposition of endothelins at 28 and 56 daysafter treatment and their mRNA levels demonstrated byNorthern blot deserves discussion. The correlations areprobably weaker because immunohistochemical evalua-tion is semiquantitative, producing nonparametric vari-ables, whereas the densitometric valuation of Northernblot gels is quantitative. This imposed the use of the verydemanding Spearman test, with which it is very difficultto achieve results of high statistical significance in sam-
ples of less than 50 animals (considering only the CsA-treated rats). However, there were evident differences inboth immunohistochemical and Northern blot values be-tween each group of rats (table 2).
A possible argument against the role of endothelins inthe progression of interstitial fibrosis is the absence in ourmodel of a clear increase in free endothelins in urine. Thisunexpected finding may be because a patent increase inendothelins in urine has only been demonstrated in acuteexperimental models of CsA nephrotoxicity in rats [52].Furthermore, we used a RIA that determines the totalquantity of endothelins which may mask any early in-crease in the amount Et3 after 1 month of treatment.Although it might arguably have been better to use inde-pendent RIAs for every endothelin, the present studyunequivocally demonstrates that the global accumulationof endothelins in urine is significant at 56 days after treat-ment, supporting the immunohistochemical and molecu-lar data gathered at that time. In other similar models ofCsA nephrotoxicity in rats, when the vehicle is cremophoror analogue (PLG in our case), it induces isometric tubu-lar vacuolization and changes in the percentage of inter-stitial fibrosis [4]. Probably for this reason, and in ourview unsurprisingly, our vehicle-treated animals (PLG)showed an increase in their urine endothelin levels. Thishas also been reported in proximal tubular cells withinnocuous stimulation such as with delipidated albuminin an in vitro study [53]. In fact, in our study, the Stu-dent’s t test showed clear differences in urine endothelinlevels between the SC control group and the CsA-treatedanimals.
Our finding of an earlier increase in Et3 peptide andmRNA followed by a delayed increase in Et1 peptide andmRNA was unexpected. However, a similar behavior wasrecently described as an effect of CsA and tacrolimus in aculture of rabbit proximal tubular cells, where the releaseof Et3 was present 4 h after starting the culture, whilst thesecretion of Et1 was time dependent with release onlyafter 36 h in culture [26].
The role of Et3 in the kidney is very controversial. It isknown that low doses of Et3 induce a vasodilatoryresponse [54] mediated by EtBr of smooth vascular mus-cle cells through the activation of NO synthase by cyclicguanosine monophosphate [55–57]. In the case of CsAnephrotoxicity, this action may be favored by the abilityof CsA to increase the number of type B receptors, at leastin mesangial cells [55]. Alternatively, as the doses of Et3are increased, this effect could be inverted, and the pep-tide would have a vasoconstrictor action similar to that ofEt1 [58].

CsA Nephrotoxicity and Endothelins Exp Nephrol 2000;8:161–172 171
Based on the contradictory effects reported for Et3 andthe proven correlations between histological lesions andthe mRNA levels of preproEt3 (tables 3, 4), it could beproposed, at least for CsA nephrotoxicity in rats, that dur-ing the first weeks of the process the drug induces activa-tion of the RAS with progressive local expression of angio-tensin II and TGF-ß1 [4, 7, 16] and could also stimulateEt3 synthesis at tubular and glomerular levels. Althoughthis event may produce compensatory vasodilationthrough the NO synthase system [55, 57], it has been pro-posed in rats that EtBr seems crucial for mediating a renalvasoconstrictor effect [58]. This circumstance is suggestedby the correlation in our model between Et3 mRNA levelsand histological lesions of CsA nephrotoxicity after thefirst weeks of treatment (table 3).
On the other hand, it has been demonstrated in prima-ry cultures of human renal tubules that incubation withagonists of EtBr is one of the most potent signals to stimu-late the neosynthesis of Et1 [59]. Thus, it could be pro-posed that the Et3 overexpression may consecutivelystimulate the Et1 system and aggravate the progressivevascular ischemia characteristic of the more advancedstages of chronic CsA nephrotoxicity [60]. In support ofthis proposal, we observed by morphometry that after 56days of CsA treatment, there is already a patent ischemic
contraction of the glomerular tuft with statistically signifi-cant differences versus SC controls. In contrast, the ani-mals treated with the solvent PLG showed an increase intuft area, likely indicating hyperfiltration by osmoticeffect, classically attributed to these types of polymers atthe renal level [61].
In summary, we show that chronic CsA treatment inrats leads to the hypersecretion of endothelins in the kid-ney and to the local expression of angiotensin II in outermedulla and medullary rays. Both phenomena are relatedto the clinical and morphological features linked with CsAnephrotoxicity, thus the endothelins may constitute acomplex regulatory system of the renal blood flow, animbalance of which would be responsible in the mediumterm and the long term for the ischemia. This would rein-force the direct fibrogenic action of TGF-ß and angioten-sin II itself.
Acknowledgments
We thank Maria Dolores Rodrıguez and Francisca Saez for theirtechnical assistance and Richard Davies for translating parts of themanuscript into English. This work was supported by the Fondode Investigaciones Sanitarias through FIS grant 960021-2 and byNovartis through University of Granada contract 418/94 ATR.
References
1 Flanagan WM, Corthesy B, Bram RJ, CrabtreeGR: Nuclear association of a T-cell transcrip-tion factor blocked by FK-506 and cyclospo-rine A. Nature 1991;352:803–807.
2 Jain JN, McCaffrey PG, Miner Z, KerppolaTK, Lambert JN, Verdine GL, Curran T, RaoA: The T-cell transcription factor NFAT(p) is asubstrate for calcineurine and interacts withFos and Jun. Nature 1993;365:352–355.
3 Garcıa del Moral R, O’Valle F, Andujar M,Aguilar M, Lucena MA, Lopez-Hidalgo J,Ramırez C, Medina-Cano MT, Aguilar D,Gomez-Morales M: Relationship between P-glycoprotein expression and cyclosporin A inkidney: An immunohistological and cell cul-ture study. Am J Pathol 1995;146:398–408.
4 Del Moral RG, Andujar M, Ramırez C, Gom-ez-Morales M, Masseroli M, Aguilar M, OlmoA, Arrebola F, Guillén M, Garcıa-Chicano MJ,Nogales FF, O’Valle F: Chronic cyclosporin Anephrotoxicity, P-glycoprotein overexpression,and relationships with intrarenal angiotensin IIdeposits. Am J Pathol 1997;151:1705–1714.
5 Del Moral RG, Olmo A, Aguilar M, O’Valle F:P-glycoprotein: A new mechanism to controldrug-induced nephrotoxicity. Exp Nephrol1998;6:89–97.
6 Abassi ZA, Pieruzzi F, Nakhoul F, Keiser HR:Effects of cyclosporin A on the synthesis, excre-
tion, and metabolism of endothelin in the rat.Hypertension 1996;27:1140–1148.
7 Shihab FS, Andoh TF, Tanner AM, Noble NA,Border WA, Franceschini N, Bennett WM:Role of transforming growth factor beta-1 inexperimental chronic cyclosporine nephropa-thy. Kidney Int 1996;49:1141–1151.
8 Myers BD: Cyclosporine nephrotoxicity. Kid-ney Int 1986;30:964–974.
9 Rossi NF, Churchill PC, McDonald FD, EllisVR: Mechanism of cyclosporin A-induced re-nal vasoconstriction in the rat. J PharmacolExp Ther 1989;250:896–901.
10 Nast C, Adler SG, Artishevsky A, Kresser CT,Ahmed K, Anderson PS: Cyclosporine induceselevated procollagen alpha 1 (I) mRNA levelsin the rat renal cortex. Kidney Int 1991;39:631–638.
11 Racusen LC, Solez K: Nephrotoxicity of cyclos-porine and other immunosuppressive and im-munotherapeutic agents; in Hook JB, Gold-stein RS (eds): Toxicology of the Kidney, ed 2.New York, Raven Press, 1993, pp 319–360.
12 Mihatsch MJ, Antonovych T, Bohman SO, Ha-bib R, Helmchan U, Noel LH, Olsen S, SibleyRK, Kemeny E, Feutren G: Cyclosporin Anephropathy: Standardization of the evalua-tion of kidney biopsies. Clin Nephrol 1994;41:23–32.
13 Rosen S, Greenfeld Z, Brezis M: Chronic cy-closporine-induced nephropathy in the rat: Amedullary ray and inner stripe injury. Trans-plantation 1990;49:445–452.
14 Elzinga LW, Rosen S, Bennett WM: Dissocia-tion of glomerular filtration rate from tubuloin-terstitial fibrosis in experimental chronic cy-closporine nephropathy: Role of sodium in-take. J Am Soc Nephrol 1993;4:214–221.
15 Burdmann EA, Andoh TF, Nast CC, Evans A,Connors BA, Coffman TM, Lindsley J, BennettWM: Prevention of experimental cyclosporin-induced interstitial fibrosis by losartan and en-alapril. Am J Physiol 1995;269:F491–F499.
16 Shihab FS, Bennett WM, Tanner AM, AndohTF: Angiotensin II blockade decreases TGF-beta-1 and matrix proteins in cyclosporine ne-phropathy. Kidney Int 1997;52:660–673.
17 Kon V, Hunley TE, Fogo A: Combined antago-nism of endothelin A/B receptors links endothe-lin to vasoconstriction whereas angiotensin IIaffects fibrosis: Studies in chronic nephrotoxici-ty in rats. Transplantation 1995;60:89–95.
18 Young BA, Burdmann EA, Johnson RJ, AlpersCE, Giachelli CM, Eng E, Andoh A, BennettWM, Couser WG, Lindsley J, Duyn J: Cellularproliferation and macrophage influx precedeinterstitial fibrosis in cyclosporine nephrotox-icity. Kidney Int 1995;48:439–448.

172 Exp Nephrol 2000;8:161–172 Ramırez et al.
19 Bennett WM, DeMattos A, Meyer MM, AndohT, Barry JM: Chronic cyclosporine nephropa-thy: The Achilles’ heel of immunosuppressivetherapy. Kidney Int 1996;50:1089–1100.
20 Ehrenreich H, Anderson RW, Fox CH, Riek-mann P, Hoffman GS, Travis WD, Coligan JE,Kehrl J, Fauci AS: Endothelins, peptides withpotent vasoactive properties, are produced byhuman macrophages. J Exp Med 1990;172:1741–1748.
21 Border WA, Noble NA: Transforming growthfactor ß in tissue fibrosis. N Engl J Med 1994;331:1286–1292.
22 Sharma VK, Bologa RM, Xu GP, Li B, Moura-dian J, Wang J, Serur D, Rao V, SuthanthiranM: Intragraft TGF-ß1 mRNA: A correlate ofinterstitial fibrosis and chronic allograft ne-phropathy. Kidney Int 1996;49:1297–1303.
23 Karet FE, Davenport AP: Localization of endo-thelin peptides in human kidney. Kidney Int1996;49:382–387.
24 Murata S, Matsumura Y, Takada K, Asai Y,Takaoka M, Morimoto S: Role of transforminggrowth factor beta-1 on platelet-induced en-hancement of endothelin-1 production in cul-tured vascular endothelial cells. J PharmacolExp Ther 1995;274:1524–1530.
25 Wilkes BM, Pearl AR, Mento PF, Maita ME,Macica CM, Girardi EP: Glomerular endothe-lin receptors during initiation and maintenanceof ischemic acute renal failure in rats. Am JPhysiol 1991;260:F110–F118.
26 Haug G, Grill C, Schmid-Kotsas A, GruenertA, Jehle PM: Endothelin release by rabbit prox-imal tubule cells: Modulating effects of cyclos-porine A, tacrolimus, HGF and EGF. KidneyInt 1998;54:1626–1636.
27 Schnermann J, Lorenz JN, Briggs JP, KeiserJA: Induction of water diuresis by endothelinin rats. Am J Physiol 1992;263:F516–F526.
28 Masseroli M, O’Valle F, Andujar M, RamırezC, Gomez-Morales M, Luna JD, Aguilar M,Aguilar D, Rodrıguez-Puyol M, Del Moral RG:Design and validation of a new image analysismethod for automatic quantification of inter-stitial fibrosis and glomerular morphometry.Lab Invest 1998;78:511–522.
29 Chomczynski P, Sacchi N: Single-step methodof RNA isolation by acid guanidinium thiocya-nate-phenol-chloroform extraction. Anal Bio-chem 1987;162:156–159.
30 Sambrook J, Fritsch EF, Maniatis T: MolecularCloning: A Laboratory Manual, ed 2. ColdSpring Harbor, Cold Spring Harbor LaboratoryPress, 1989.
31 Sakurai T, Yanagisawa M, Inoue A, Ryan US,Kimura S, Mitsui Y, Goto K, Masaki T: cDNAcloning, sequence analysis and tissue distribu-tion of rat preproendothelin-1 mRNA. Bio-chem Biophys Res Commun 1991;175:44–47.
32 Shiba R, Sakurai T, Yamada G, Morimoto H,Saito A, Masaki T, Goto K: Cloning and ex-pression of rat preproendothelin-3 cDNA. Bio-chem Biophys Res Commun 1992;186:588–594.
33 Southern EM: Detection of specific genesamong DNA fragments separated by gel elec-trophoresis. J Mol Biol 1975;98:503–517.
34 English J, Evan A, Houghton DC, BennettWM: Cyclosporine-induced acute renal dys-function in the rat: Evidence of arteriolar vaso-constriction with preservation of tubular func-tion. Transplantation 1987;44:135–141.
35 Curtis JJ, Luke RG, Duvosvky E, DiethelmAG, Whelchel JD, Jones P: Cyclosporin intherapeutic doses increases renal allograft vas-cular resistance. Lancet 1986;ii:477–479.
36 Conger JD, Kim GE, Robinette JB: Effects ofANGII, ETA and TXA2 receptor antagonistson cyclosporin A renal vasoconstriction. Am JPhysiol 1994;267:F443–F449.
37 Shehata M, El Nahas AM, Barkworth E, CopeGH, Raftery AT: Increased platelet-derivedgrowth factor in the kidneys of cyclosporin-treated rats. Kidney Int 1994;46:726–732.
38 Stahl RAK, Adler S, Baker PJ, Johnson RJ,Chen YP, Pritzl P, Couser WG: Cyclosporin Ainhibits prostaglandin E2 formation by rat me-sangial cells in culture. Kidney Int 1989;35:1161–1167.
39 Bobadilla NA, Tapia E, Franco M, Lopez P,Mendoza S, Garcıa-Torres R, Alvarado JA,Herrera-Acosta J: Role of nitric oxide in renalhemodynamic abnormalities of cyclosporinnephrotoxicity. Kidney Int 1994;46:773–779.
40 Young BA, Burdmann EA, Johnson RJ, AndohT, Bennett WM, Couser WG, Alpers CE: Cy-closporine A induced arteriopathy in a ratmodel of chronic cyclosporine nephropathy.Kidney Int 1995;48:431–438.
41 Johnson RJ, Alpers CE, Yoshimura A, Lom-bardi D, Pritzi P, Floege J, Schwartz SM: Renalinjury from angiotensin II-mediated hyperten-sion. Hypertension 1992;19:464–474.
42 Kon V, Hunley TE, Fogo A: Combined antago-nism of endothelin A/B receptors links endo-thelin to vasoconstriction whereas angiotensin-II effects fibrosis: Studies in chronic cyclospo-rine nephrotoxicity in rats. Transplantation1995;60:89–95.
43 Garcıa del Moral R, Navarro N, Montes A,Aguilar D, Aneiros J: Immunohistochemicalmarkers of renal tubular injury and cyclosporinnephrotoxicity in kidney allograft biopsies.Nephron 1992;62:121–122.
44 Bennett WM: Drug interactions and conse-quences of sodium restriction. Am J Clin Nutr1997;65(suppl):678–681.
45 Pichler RH, Franceschini N, Young BA, HugoC, Andoh TF, Burdmann EA, Shankland SJ,Alpers CE, Bennett WM, Couser WG, JohnsonRJ: Pathogenesis of cyclosporine nephropathy:Role of angiotensin II and oestopontin. J AmSoc Nephrol 1995;6:1186–1196.
46 Shihab FS, Andoh TF, Tanner AM, BennettWM: Sodium depletion enhances fibrosis andthe expression of TGF-beta-1 and matrix pro-teins in experimental chronic cyclosporine ne-phropathy. Am J Kidney Dis 1997;30:71–81.
47 Ros J, Leivas A, Jimenez W, Morales M, Bosh-Marce M, Arroyo V, Rivera F, Rodes J: Effectof bacterial lipopolysaccharide on endothelin-1production in human vascular endothelialcells. J Hepatol 1997;26:81–87.
48 Bruzzi I, Corna D, Zoja C, Orisio S, SchiffrinEL, Cavallotti D, Remuzzi G, Benigni A: Timecourse and localization of endothelin-1 geneexpression in a model of renal disease progres-sion. Am J Pathol 1997;151:1241–1247.
49 Largo R, Gomez-Garre D, Liu XH, Alonso J,Blanco J, Plaza JJ, Egido J: Endothelin-1upregulation in the kidney of uninephrecto-mized spontaneously hypertensive rats and itsmodification by the angiotensin-converting en-zyme inhibitor quinapril. Hypertension 1997;29:1178–1185.
50 Imai T, Hirata Y, Emori T, Yanagisawa M,Masaki T, Marumo F: Induction of endothelin-1 gene by angiotensin and vasopressin in endo-thelial cells. Hypertension 1992;19:753–757.
51 Kurihara H, Yoshizumi M, Sugiyama T, Taka-ku F, Yanagisawa M, Masaki T, Hamaoki M,Kato H, Yasaki Y: Transforming growth fac-tor-ß stimulates the expression of endothelinmRNA by vascular endothelial cells. BiochemBiophys Res Commun 1989;159:1435–1440.
52 Abassi ZA, Pieruzzi F, Nakhoul F, Keiser HR:Effects of cyclosporin A on the synthesis, excre-tion, and metabolism of endothelin in the rat.Hypertension 1996;27:1140–1148.
53 Zoja C, Morigi M, Figliuzzi M, Bruzi I, OldroydS, Benigni A, Ronco P, Remuzzi G: Proximaltubular cell synthesis and secretion of endothe-lin-1 on challenge with albumin and other pro-teins. Am J Kidney Dis 1995;26:934–941.
54 Schramek H, Willinger CC, Gstraunthaler G,Pfaller W: Endothelin-3 modulates glomerularfiltration rate in the isolated perfused rat kid-ney. Renal Physiol Biochem 1992;15:325–333.
55 Takeda M, Iwasaki S, Hellings SE, Yoshida H,Homma T, Kon V: Divergent expression ofEtA and EtB receptors in response to cyclospo-rine in mesangial cells. Am J Pathol 1994;144:473–479.
56 Tack I, Marin Castaño E, Bascands JL, PecherC, Ader JL, Girolami JP: Cyclosporine A-induced increase in glomerular cyclic GMP inrats and the involvement of the endothelin Breceptor. Br J Pharmacol 1997;121:433–440.
57 Yang CW, Kim YS, Kim J, Kim YO, Min SY,Choi EJ, Bang BK: Oral supplementation of L-arginine prevents chronic cyclosporine nephro-toxicity in rats. Exp Nephrol 1998;6:50–56.
58 Cristol JP, Warner TD, Thiemermann C, VaneJR: Mediation via different receptors of thevasoconstrictor effects of endothelins and sara-fotoxins in the systemic circulation and renalvasculature of the anesthetized rat. Br J Phar-macol 1994;108:7765–7779.
59 Ong ACM, Jowett TP, Firth JD, Burton S, Kar-et FE, Fine LG: An endothelin-1 mediatedautocrine growth loop involved in human renaltubular regeneration. Kidney Int 1995;48:390–401.
60 Wastchinger B, Sayegh MH: Endothelin in or-gan transplantation. Am J Kidney Dis 1996;27:151–161.
61 Hermansky SJ, Neptun DA, Loughran KA,Leung HW: Effects of polyethylene glycol 400(PEG 400) following 13 weeks of gavage treat-ment in Fisher-344 rats. Food Chem Toxicol1995;33:139–149.
Copyright © 2022 FDOKUMEN