Evaluation of the reproducibility of intrarenal R2* and ?R2* measurements following administration...
16
Evaluation of the Reproducibility of Intrarenal and Measurements Following Administration of Furosemide and During Waterload Lu-Ping Li, PhD 1,2,* , Pippa Storey, PhD 1,2 , Linda Pierchala, MS 1,2 , Wei Li, MD 1,2 , Jason Polzin, PhD 3 , and Pottumarthi Prasad, PhD 1,2 1 Department of Radiology, Evanston Northwestern Healthcare, Evanston, Illinois 2 Department of Radiology, Northwestern University Medical School, Chicago, Illinois 3 General Electric Medical Systems, Milwaukee, Wisconsin Abstract Purpose—To estimate the reproducibility of BOLD MRI measurements in the evaluation of intrarenal oxygenation levels. Materials and Methods—In this study, the reproducibility of semiquantitative BOLD MRI measurements performed on a 1.5 T scanner with a multiple gradient-echo sequence in the renal medulla and cortex, and their response to furosemide and waterload, were assessed in eight healthy young subjects (25.6 ± 4.1 years). Each subject underwent an identical experimental procedure on two separate days. Results—Renal measurements were shown to be reproducible within ~12% from day to day based on a coefficient of variance (CV) analysis. The changes in following administration of furosemide were statistically significant, as shown by ANOVA and a paired Student’s t-test, and were deemed reliable based on the reliable change index (RCI). However, values following waterload were not statistically significant, and were not deemed reliable. Conclusion— measurements were reproducible over 270 days within 12%. Furosemide produced a significant and reliable change (~30%), and the magnitude of change (5.7 s −1 ) was reproducible and consistent with our previous data. The response to waterload, however, did not reach statistical significance, and the magnitude did not reach the level that we had previously reported. Keywords Kidney; BOLD MRI; reproducibility; oxygenation; furosemide; water diuresis It is now well recognized that the renal medulla operates at a low oxygenation level (renal medullary hypoxia) (1), which makes it highly susceptible to even mild reductions in blood flow. Renal ischemia accounts for almost 50% of the observed cases of acute renal failure (2). Over the years, in several in vitro and in vivo animal studies, it has been shown that this type of acute renal failure usually involves hypoxic injury to the renal medullary tubules (3). Renal dysfunction may also play a role in the development of all forms of hypertension in * Address reprint requests to: L.P.L., Department of Radiology, Rm. 5108, Evanston Northwestern Healthcare, 2650 Ridge Avenue, Evanston, IL 60201. [email protected]. NIH Public Access Author Manuscript J Magn Reson Imaging. Author manuscript; available in PMC 2010 August 4. Published in final edited form as: J Magn Reson Imaging. 2004 May ; 19(5): 610–616. doi:10.1002/jmri.20043. NIH-PA Author Manuscript NIH-PA Author Manuscript NIH-PA Author Manuscript
Transcript of Evaluation of the reproducibility of intrarenal R2* and ?R2* measurements following administration...
Evaluation of the Reproducibility of Intrarenal and Measurements Following Administration of Furosemide andDuring Waterload
Lu-Ping Li, PhD1,2,*, Pippa Storey, PhD1,2, Linda Pierchala, MS1,2, Wei Li, MD1,2, JasonPolzin, PhD3, and Pottumarthi Prasad, PhD1,21 Department of Radiology, Evanston Northwestern Healthcare, Evanston, Illinois2 Department of Radiology, Northwestern University Medical School, Chicago, Illinois3 General Electric Medical Systems, Milwaukee, Wisconsin
AbstractPurpose—To estimate the reproducibility of BOLD MRI measurements in the evaluation ofintrarenal oxygenation levels.
Materials and Methods—In this study, the reproducibility of semiquantitative BOLD MRImeasurements performed on a 1.5 T scanner with a multiple gradient-echo sequence in the renalmedulla and cortex, and their response to furosemide and waterload, were assessed in eighthealthy young subjects (25.6 ± 4.1 years). Each subject underwent an identical experimentalprocedure on two separate days.
Results—Renal measurements were shown to be reproducible within ~12% from day to daybased on a coefficient of variance (CV) analysis. The changes in following administrationof furosemide were statistically significant, as shown by ANOVA and a paired Student’s t-test,and were deemed reliable based on the reliable change index (RCI). However, valuesfollowing waterload were not statistically significant, and were not deemed reliable.
Conclusion— measurements were reproducible over 270 days within 12%. Furosemideproduced a significant and reliable change (~30%), and the magnitude of change (5.7 s−1) wasreproducible and consistent with our previous data. The response to waterload, however, did notreach statistical significance, and the magnitude did not reach the level that we had previouslyreported.
KeywordsKidney; BOLD MRI; reproducibility; oxygenation; furosemide; water diuresis
It is now well recognized that the renal medulla operates at a low oxygenation level (renalmedullary hypoxia) (1), which makes it highly susceptible to even mild reductions in bloodflow. Renal ischemia accounts for almost 50% of the observed cases of acute renal failure(2). Over the years, in several in vitro and in vivo animal studies, it has been shown that thistype of acute renal failure usually involves hypoxic injury to the renal medullary tubules (3).Renal dysfunction may also play a role in the development of all forms of hypertension in
*Address reprint requests to: L.P.L., Department of Radiology, Rm. 5108, Evanston Northwestern Healthcare, 2650 Ridge Avenue,Evanston, IL 60201. [email protected].
NIH Public AccessAuthor ManuscriptJ Magn Reson Imaging. Author manuscript; available in PMC 2010 August 4.
Published in final edited form as:J Magn Reson Imaging. 2004 May ; 19(5): 610–616. doi:10.1002/jmri.20043.
NIH
-PA Author Manuscript
NIH
-PA Author Manuscript
NIH
-PA Author Manuscript
humans and laboratory animals (4). Many experiments have shown that medullary bloodflow (and presumably medullary oxygenation status) is reduced in hypertension, and, moreimportantly, that reduced medullary blood flow is sufficient to produce hypertension (4,5).All of these studies were performed with the use of invasive microelectrodes or Dopplerflow probes in rat kidneys. The availability of a noninvasive technique to monitor renalmedullary blood flow in humans under normal conditions and during physiological andpharmacological stresses may allow for an extension of these observations to humans.
Blood oxygenation level-dependent (BOLD) MRI has been used extensively in variousorgans, such as the brain (6,7). The BOLD MRI technique exploits the fact that the magneticproperties of hemoglobin vary depending on whether it is in the oxygenated ordeoxygenated form. This affects the relaxation time of the neighboring water molecules,and in turn influences the MRI signal on - weighted images. The rate of spin dephasing
is closely related to the tissue content of deoxyhemoglobin. Since the oxygentension (pO2) of capillary blood is thought to be in equilibrium with the surrounding tissue,changes estimated by BOLD MRI can be interpreted as changes in tissue pO2 (8). A strongcorrespondence has been demonstrated between BOLD MRI measurements in humans andearlier animal data obtained with the use of invasive microelectrodes (9).
In previous studies, we used BOLD MRI to measure the response of the renal medulla tofurosemide in healthy volunteers (8,10). Furosemide is one of the so-called “loop” diuretics.These diuretics have been reported to improve medullary oxygenation, presumably becausethey selectively decrease oxygen use by blocking active transport in the thick ascendinglimbs (1,9). One of the main findings in previous studies was that the increased averagelevel of medullary oxygenation in young healthy subjects following pharmacologicalmaneuvers can be monitored noninvasively with BOLD MRI (8,11).
Water diuresis is the result of reduced osmotic reabsorption of water, which leads toincreased solute- free water clearance and hypoosmotic urine. Water diuresis can potentially“washes out” obstructing cellular debris and casts, and thus may protect against acute renalfailure (12). Water diuresis can be induced by drinking large amounts of hypotonic fluid.During water diuresis, the amount of water reabsorbed in the proximal tubules is normal,and the maximal urine flow that can be produced is about 16 ml/min. Our previous studiesshowed that water diuresis decreased intrarenal in young healthy human subjectsevaluated by BOLD MRI (10,13,14).
Since BOLD MRI is primarily used to assess changes following a physiological orpharmacological maneuver, it is essential that we understand the level of reproducibility ofbaseline measurements (i.e., how close are the measurements obtained in the samesubject under similar conditions on two different days or times?). This is usually estimatedby means of a test-retest analysis. Another significant measurement is the response to amaneuver ( ). In this case, it is important to know how the magnitudeof response compares to variations in baseline , and how much this magnitude varies fromday to day. The reproducibility of baseline and would depend not only on thevariability associated with the measurement system, but also on the physiological status ofthe subject at these two different time points (especially in a water diuresis study). Tominimize the effects of ingested substances on the BOLD test, an overnight fast is requiredto ensure that the volunteer is in the basal state. However, the pre- fast ingestion of a salty,sweet, or fatty food, or alcohol or coffee may still induce some physiological variations.Exercise and emotional or physical stress may also contribute to physiological variations.
Li et al. Page 2
J Magn Reson Imaging. Author manuscript; available in PMC 2010 August 4.
NIH
-PA Author Manuscript
NIH
-PA Author Manuscript
NIH
-PA Author Manuscript
In this study, we investigated the degree of reproducibility of BOLD measurements in therenal medulla and cortex in the same group of healthy individuals before and afteradministration of furosemide and induction of water diuresis on different days.
MATERIALS AND METHODSSubjects
Eight healthy young subjects (four females and four males, mean age 25.6 ± 4.1 years)participated in this study. None of the subjects had any known history of renal disease. Afterthe study was explained to them, each volunteer gave informed consent according to aprotocol approved by the institutional review board.
The subjects took part in the study after they abstained from food and water for about 12hours overnight. A coronal plane passing through the center of both kidneys was prescribedfor the scout images, and baseline BOLD MRI images were acquired along several axialplanes. For the furosemide studies, 20 mg of furosemide were injected intravenously. Post-furosemide images were acquired starting about 5 minutes following administration tomeasure the BOLD response. For the waterload studies, the subjects were taken out of themagnet after the baseline measurements were performed, and were asked to drink 20 mL ofwater per kilogram of body weight within 15 minutes in order to induce water diuresis.Urinary output was measured every 15 minutes. After it exceeded 5 mL per minute, thesubject returned to the magnet and another set of BOLD MRI measurements was obtained tomeasure the BOLD response to water diuresis. Each volunteer came to the MRI facility fourtimes on different days. The first time was for the waterload study, the second time for thefurosemide study, the third time for a repeated furosemide study, and the fourth time for arepeated waterload study. These four studies gave us four base-line BOLD data ( ) sets foreach individual, and two sets of data each for the response ( ) to furosemide andwaterload, respectively.
MRI TechniqueWe performed all of the studies on a 1.5 T scanner (CV/i; General Electric Medical Systems,Milwaukee, WI) using a multiple gradient-echo (mGRE) sequence (TR/TE/flip angle = 63msec/7− 49.1 msec/30°) to acquire 16 -weighted images within a single breath-hold ofabout 12 seconds. The choice of the range of TEs was consistent with our previous estimateof in the renal medulla of about 50 ms (8). We constructed maps on the scannerplatform using inbuilt FUNC-TOOL by fitting a single exponential function to the signalintensity vs. TE data. A multicoil array was used for signal reception.
Data AnalysisAll data were acquired by L.P.L and analyzed by P.P. Regions of interest (ROIs) covering atleast 20 pixels were drawn on the anatomic template. Typically, 10–20 ROIs for each cortexand medulla were obtained from several slices and both kidneys. We combined the data toobtain a single representative mean value of per subject per time point.
Statistical MethodsWe analyzed the data using repeated measures analysis of variance (ANOVA) models.These models are flexible and can accommodate the multiple within-subject measurementsof acquired before and after a maneuver, in different renal regions (e.g., the medulla andcortex), and replicated a different number of times.
Li et al. Page 3
J Magn Reson Imaging. Author manuscript; available in PMC 2010 August 4.
NIH
-PA Author Manuscript
NIH
-PA Author Manuscript
NIH
-PA Author Manuscript
Measurements—To determine the reproducibility of , we examined the repeatedbaseline measures (prior to experimental intervention) across the four separate assessments.We also compared the baseline values on four different days using the coefficient ofvariance (CV) obtained by calculating the overall standard deviation (SD) divided by themean for different days and/or different subjects on each day.
Measurements—Because of the nature of BOLD MRI contrast, the absolutemagnitude of the change in is less important than relative changes and consistency fromday to day. With this in mind, we considered two types of statistical analysis. For thefollowing analyses, the BOLD response is defined as the difference in signal responsebetween baseline and the experimental intervention (furosemide and waterload). Weanalyzed the data with repeated-measures ANOVA to examine the BOLD response tofurosemide and waterload at the two separate assessments for effects of region (medulla vs.cortex) and time (time 1 vs. time 2). The first was a group analysis, and an ANOVA test wasused to compare measurements performed on two different days. When the ANOVA testshowed significant differences, a Student’s t-test was used to determine which mean wassignificantly different.
The other analysis was based on each individual subject. For this analysis, we used thereliable change index (RCI) to evaluate the BOLD response ( ) to furosemide andwaterload for each individual. The RCI (14) is defined as
(1)
Sdiff is the standard error of difference between two test scores, and SEM is the mean within-subject SD. The advantage of this index is that it takes into account information about inter-and intrasubject variability. The RCI is widely used to assess clinical significance aftertreatment. Whereas the ANOVA and t-test only determine whether the average variationbetween two groups is “significant,” the RCI helps to determine whether a significantchange observed in each individual is reliable (i.e., it is not just a fluctuation caused by animprecise measuring instrument or by chance (15)). If the RCI is >1.96, the difference isdeemed reliable (i.e., the difference observed is unlikely to be due to chance).
RESULTSBaseline Reproducibility of Measurements
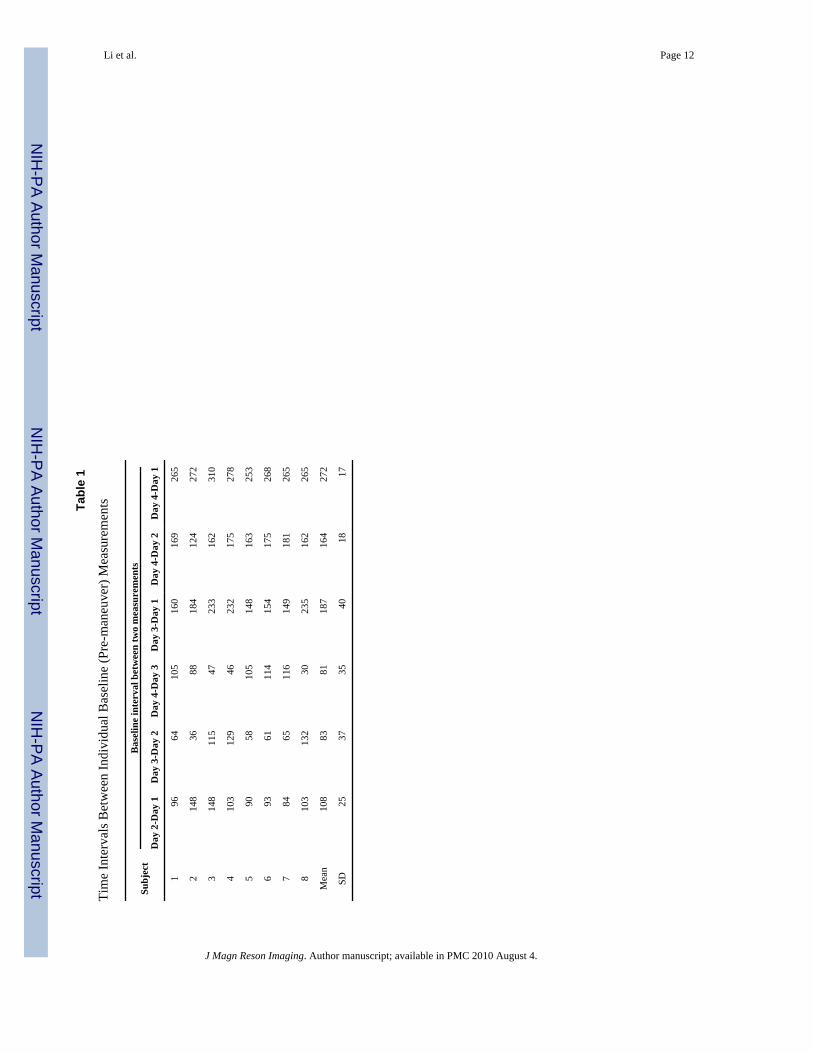
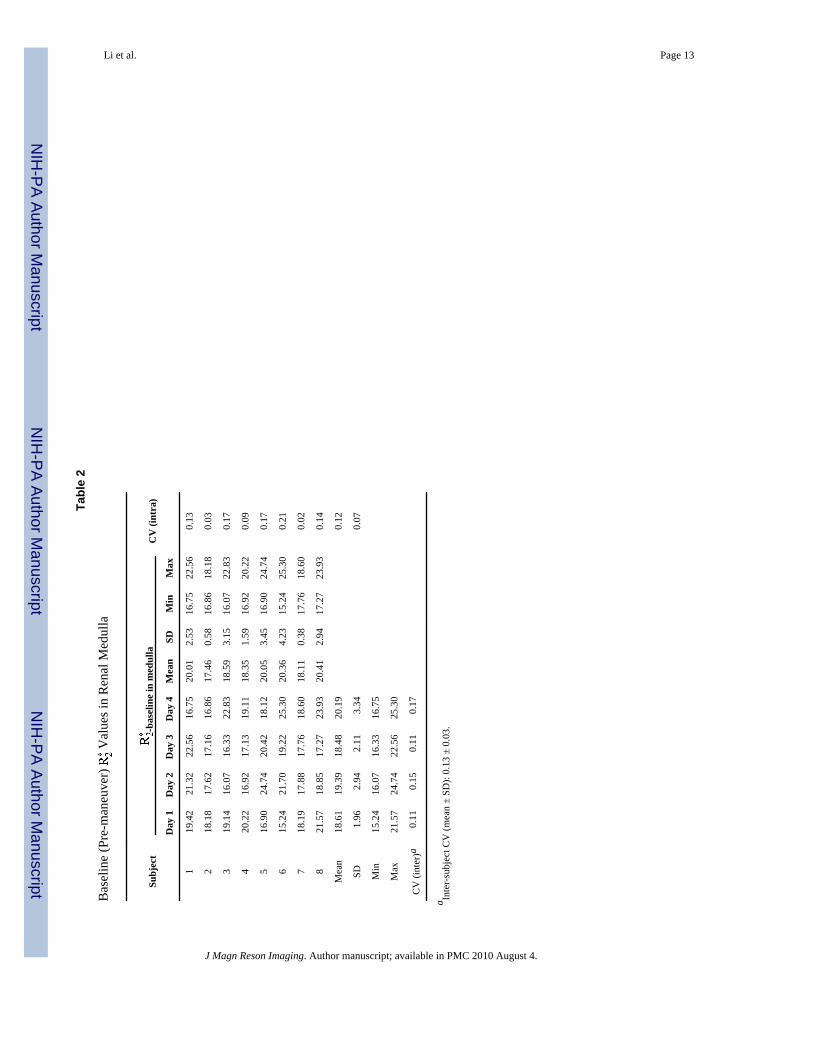
The shortest interval was 81 ± 35 and the longest interval was 272 ± 17 days (Table 1) overthe four baseline measurements. The data in Tables 2 and 3 show the baseline BOLD measurements and statistical results. There were no significant differences between the fourassessments in the baseline measures obtained for either the medulla or the cortex (P ≥0.05 by ANOVA test). The average of the intraindividual CV over 4 days was 12 ± 0.07%(mean ± SD) in the medulla (Table 2), and 12 ± 0.05% (mean ± SD) in the cortex (Table 3).The average of the interindividual CV over eight volunteers was 13 ± 0.03% (mean ± SD) inthe medulla (Table 2), and 12 ± 0.01% (mean ± SD) in the cortex (Table 3).
Li et al. Page 4
J Magn Reson Imaging. Author manuscript; available in PMC 2010 August 4.
NIH
-PA Author Manuscript
NIH
-PA Author Manuscript
NIH
-PA Author Manuscript

BOLD Response ( ) to FurosemideThe average interval between the two furosemide studies was 83 ± 37 days. Typicalanatomical images and maps are shown in Fig. 1a. (Note that the windowing is identicalon both the pre- and post- maps.) On the pre-furosemide map, the medulla is relativelybright, implying lower tissue oxygenation. On the post-furosemide map of the same slice,the medulla shows reduced brightness, indicating increased tissue oxygenation. Theindividual and mean values (averaged over all subjects) pre- and post-furosemide areshown in Fig. 2a and b. A statistically significant decrease in medullary post-furosemidewas observed on both days, but the change in the cortex did not reach statistical significanceon either day by a paired two-tailed Student’s t-test. The BOLD response to furosemide wasmore pronounced in the medulla than in the cortex, and no significant difference was foundin the BOLD responses obtained at day 2 vs. day 3 for either region. Figure 2c summarizesthe BOLD response ( ) following furosemide administration from studies on bothoccasions. There was a statistically significant change in at both time points in themedulla, but not in the cortex, according to the paired two-tailed Student’s t-test. Themagnitude of the change in the medulla (5.7 s−1) was similar to previous findings (8,11).Individual measurements for baseline and furosemide conditions obtained on different dayswere further examined for evidence of reliable change in each subject. These findingsindicated that all of the studies showed a reliable response in the medulla at both time points(Table 4), except for two subjects on day 2 (shown in bold). The changes in the cortex werenot deemed reliable (Table 4). The average response on day 2 vs. day 3 was not statisticallydifferent in the medulla or the cortex, as shown in Fig. 2. The average normalized BOLDMRI response to furosemide (i.e., ) was 27 ± 11.2% on day 2, and 32 ± 3.6% on day3. This is significantly higher than the 12% variation in the baseline measurements.
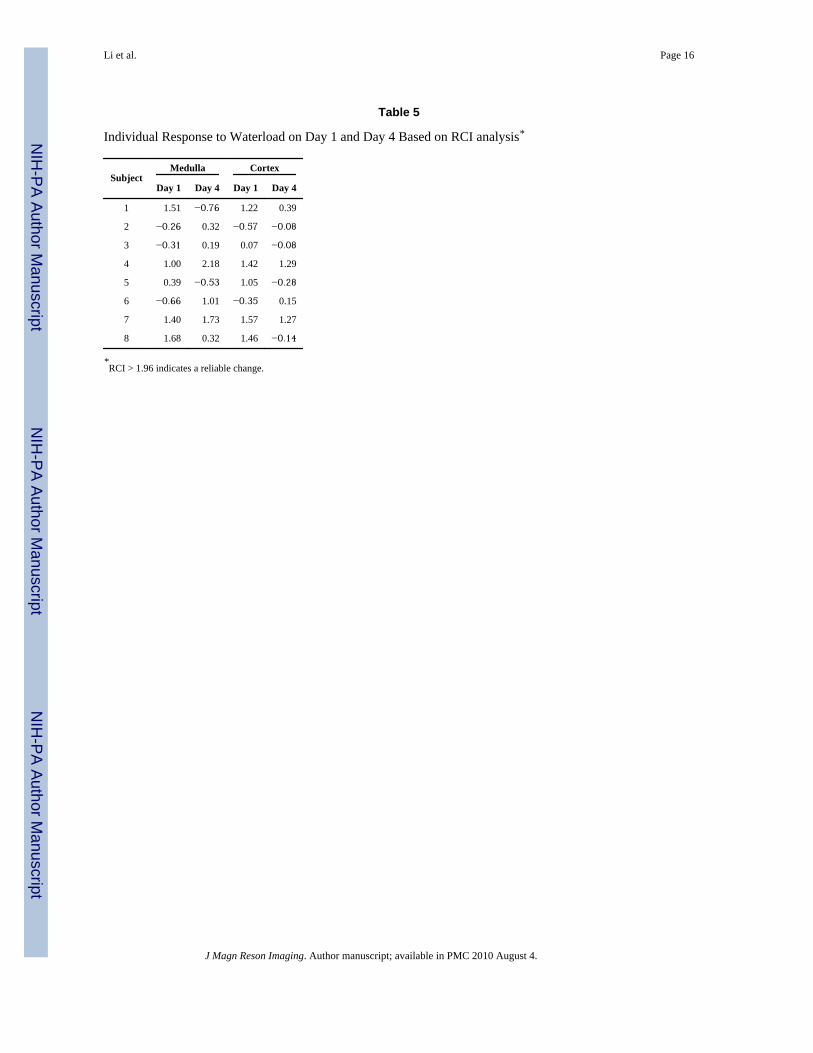
BOLD Response ( ) to WaterloadThe average interval between the two waterload studies was 272 ± 17 days. Typicalanatomical images and maps are shown in Fig. 1b. Note that on the pre-waterload map, the medulla is slightly brighter than on the post-waterload map, implying lowertissue oxygenation. On the post-waterload map of the same slice, the medulla showsslightly reduced brightness, indicating increased tissue oxygenation. The individual andmean values (averaged over all subjects) pre- and post-waterload are shown in Fig. 3aand b. The data were analyzed for the BOLD response to waterload at the two differenttimes (day 1 vs. day 4). The results indicated no significant differences between the twodifferent times (i.e., the BOLD response to waterload did not differ significantly betweenday 1 and day 4). Figure 3c summarizes the mean over all subjects pre- and post-waterload on two different days. Note the absence of significant change in both the medullaand the cortex on both days. Based on the RCI, none of the subjects (Table 5) showed asignificant response to waterload on either day, except for one at one time point (shown inbold). Also note that the sign of RCI is variable, indicating that in some subjects at eithertime point the actually increased post-waterload.
DISCUSSIONBefore we discuss specific observations, a few remarks must be made. While it is ourobjective to use the BOLD MRI technique to follow changes in tissue oxygenation, the relaxation rate is only indirectly related to tissue oxygenation, and there is no simplequantitative relationship between the two. Hence, the absolute magnitude of the observed
Li et al. Page 5
J Magn Reson Imaging. Author manuscript; available in PMC 2010 August 4.
NIH
-PA Author Manuscript
NIH
-PA Author Manuscript
NIH
-PA Author Manuscript

change in each individual is of less relevance than the relative changes and their statisticalsignificance. For example, it is not so important if the magnitude of the change observedfollowing furosemide in a single individual was 50% different on two different days, as longas the change was deemed reliable on each occasion in this long-term reproducibility study.The group analysis on the other hand, is useful in terms of summarizing the individual data,and allowing comparisons to be made at different time points or from different sites. In thisregard, in addition to statistical measures, average magnitude changes could be useful (e.g.,for comparing age-related changes). We also need to keep in mind that both and canbe affected by both measurement uncertainty and physiological differences between eachindividual subject and at different times. Future studies may have to control for suchphysiological differences, probably by acquiring additional information. However, it is notclear at this time what parameters would be most useful.
The test-retest reproducibility of renal BOLD measurements has not previously beenreported. The average of baseline values from all ROIs in each individual showed nosignificant difference over 4 days (Tables 2 and 3) in the renal medulla or cortex asevaluated by the ANOVA test. The magnitude of the baseline value in the medulla andcortex was similar to that in our previous reports (8,10,11,13,14). The intrasubject CV as ameasure of baseline reproducibility (~12%) is acceptable considering that several factorsmay potentially influence baseline variation, such as individual’s biological andphysiological variations, difficulty in prescribing exactly the same imaging slice in a givensubject between days, relatively long intervals between repeated studies (from 30 days to310 days), drift in the scanner, performance, etc. We also observed that the inter- andintrasubject CVs were approximately equal (Tables 2 and 3).
The changes in the medulla following furosemide administration (Fig. 2a) wereconsistent among all individuals and between the two days. All subjects showed a positiveresponse, with the pre- to post-furosemide difference in reaching statisticalsignificance in the medulla. The magnitude of the change was comparable to our previousreported values (8,11). Furthermore, 88% of the measurements had an RCI of >1.96. Thisresult suggests that the change with furosemide as evaluated by BOLD MRI was highlyreliable.
The renal cortex did not show significant changes in after furosemide injection (see Fig.2). The RCI was <1.96 for 94% of the measurements. This result agrees with our previousobservation that furosemide improves oxygenation only in the renal medulla (8,11). It alsosuggests that is an effective indicator of relative intrarenal oxygenation status.
The waterload response did not show significant changes in by t-test on either occasion(Fig. 3). The fact that the RCI was <1.96 for 97% of the individual measurements suggeststhat waterload did not produce a reliable change in the medulla or the cortex as evaluated byBOLD MRI. There was considerable temporal and intersubject variability in the BOLD MRIresponse to waterload ( ), as shown in Table 5 (note, for example, the change in the signof at the two time points for certain individuals).
The waterload response results do not agree with our previous data obtained at a differentsite with a different scanner (10,13). However, the lack of response to waterload was alsoapparent in a subsequent study at the same site and on the same scanner, but with a differentset of subjects (F. H. Epstein, personal communication). It is not yet clear why furosemideproduces a reliable and reproducible change in while waterload does not. However, apossible hypothesis is that furosemide inhibits water reabsorption in the ascending loop of
Li et al. Page 6
J Magn Reson Imaging. Author manuscript; available in PMC 2010 August 4.
NIH
-PA Author Manuscript
NIH
-PA Author Manuscript
NIH
-PA Author Manuscript
Henle. This reduced reabsorption means there is reduced oxygen demand, which in turnresults in an increase in medullary oxygenation. This can be considered as a directpharmacological effect, and may explain the degree of consistency and the relativemagnitude of the BOLD MRI response in each subject following furosemide administration.On the other hand, we believe that the change in medullary oxygenation during waterload isprobably related to the stimulation of endogenous prostaglandins. This can be considered asan indirect, physiological effect. It is therefore possible that there is a greater degree ofvariability in intrasubject (performed at two different times) and intersubject measurements.The apparent endothelial dependence makes waterload an attractive physiological paradigm(10). However, the lack of a significant and reliable response following the water diuresismust be taken into consideration for experiments designed to be used with the waterloadparadigm. Direct stimulation/inhibition of the prostaglandin system may be a more robustparadigm, similar to our recent finding that nitric oxide inhibition has a reduced response inhypertensive kidneys (16). A recent report from Zuo et al (17) illustrated the spatialheterogeneity in response to waterload within an individual kidney. In that study, aqualitative visual index was used, and the ROIs represented only the “borderline” region(between the cortex and medulla). Statistical significance was observed post-waterload;however, the magnitude of change reported was still considerably smaller than that in ourprevious study and that of furosemide.
In conclusion, the major findings of this study were that could be measured in areproducible way (within ~12% over four measurements carried out over a period of 270days) in the renal medulla and cortex, and that changes in following furosemideadministration were on the order of 30% and were not significantly different over twomeasurements performed about 83 days apart. While there was considerable variation inindividual response in terms of absolute magnitude, the changes were deemed reliable basedon RCI analysis. Waterload, on the other hand, did not produce any significant change(group analysis) on either occasion, nor were the changes deemed reliable at either timepoint.
AcknowledgmentsThis work was supported in part by a grant from the National Institutes of Health (DK 53221) to P.V.P. We thankDr. Ann Ragin and Ms. Linda Odom for their help with the statistical analyses. We thank Dr. Belinda Li of GEMedical Systems (Milwaukee, WI) for her editorial help during the preparation of this manuscript.
References1. Brezis M, Rosen S. Hypoxia of the renal medulla—its implications for disease. N Engl J Med
1995;332:647–655. [PubMed: 7845430]2. Lindner A, Sherrard DJ. Acute renal failure. N Engl J Med 1996;335:1320–1321. Author reply
1321–1322. [PubMed: 8992330]3. Heyman SN, Brezis ML, Reubinoff CA. Acute renal failure with selective medullary injury in the
rat. J Clin Invest 1988;82:401–412. [PubMed: 3403711]4. Cowley AW Jr. Long-term control of arterial blood pressure. Physiol Rev 1992;72:231–300.
[PubMed: 1731371]5. Mattson DL, Roman RJ, Cowley AW Jr. Role of nitric oxide in renal papillary blood flow and
sodium excretion. Hypertension 1992;19(Pt 2):766–769. [PubMed: 1592478]6. Kwong KK, Belliveau JW, Chesler DA, et al. Dynamic magnetic resonance imaging of human brain
activity during primary sensory stimulation. Proc Natl Acad Sci U S A 1992;89:5675–5679.[PubMed: 1608978]
Li et al. Page 7
J Magn Reson Imaging. Author manuscript; available in PMC 2010 August 4.
NIH
-PA Author Manuscript
NIH
-PA Author Manuscript
NIH
-PA Author Manuscript

7. Wacker CM, Wacker CM, Hartlep AW, et al. Susceptibility-sensitive magnetic resonance imagingdetects human myocardium supplied by a stenotic coronary artery without a contrast agent. J AmColl Cardiol 2003;41:834–840. [PubMed: 12628730]
8. Prasad PV, Edelman RR, Epstein FH. Noninvasive evaluation of intrarenal oxygenation with BOLDMRI. Circulation 1996;94:3271–3275. [PubMed: 8989140]
9. Brezis M, Agmon Y, Epstein FH. Determinants of intrarenal oxygenation. I. Effects of diuretics.Am J Physiol 1994;267(Pt 2):F1059–F1062. [PubMed: 7810692]
10. Prasad PV, Epstein FH. Changes in renal medullary pO2 during water diuresis as evaluated byblood oxygenation level-dependent magnetic resonance imaging: effects of aging andcyclooxygenase inhibition. Kidney Int 1999;55:294–298. [PubMed: 9893139]
11. Epstein FH, Prasad PV. Effects of furosemide on medullary oxygenation in younger and oldersubjects. Kidney Int 2000;57:2080–2083. [PubMed: 10792627]
12. Garber SL, Garber SL, Salmassi J, Arruda JA, Dunea G. Xanthopterin-induced renal dysfunction: areversible model of crystal nephropathy. Nephron 1995;69:71–78. [PubMed: 7891801]
13. Epstein FH, Veves A, Prasad PV. Effect of diabetes on renal medullary oxygenation during waterdiuresis. Diabetes Care 2002;25:575–578. [PubMed: 11874950]
14. Prasad PV, Chen Q, Goldfarb JW, Epstein FH, Edelman RR. Breath-hold R2* mapping with amultiple gradient-recalled echo sequence: application to the evaluation of intrarenal oxygenation. JMagn Reson Imaging 1997;7:1163–1165. [PubMed: 9400864]
15. Jacobson NS, Truax P. Clinical significance: a statistical approach to defining meaningful changein psychotherapy research. J Consult Clin Psychol 1991;59:12–19. [PubMed: 2002127]
16. Li L, Storey P, Kim D, Li W, Prasad PV. Kidneys in hypertensive rats show reduced response tonitric oxide synthase inhibition as evaluated by BOLD MRI. J Magn Reson Imaging 2003;17:671–675. [PubMed: 12766896]
17. Zuo CS, Rofsky NM, Mahallati H, et al. Visualization and quantification of renal R2* changesduring water diuresis. J Magn Reson Imaging 2003;17:676–682. [PubMed: 12766897]
Li et al. Page 8
J Magn Reson Imaging. Author manuscript; available in PMC 2010 August 4.
NIH
-PA Author Manuscript
NIH
-PA Author Manuscript
NIH
-PA Author Manuscript
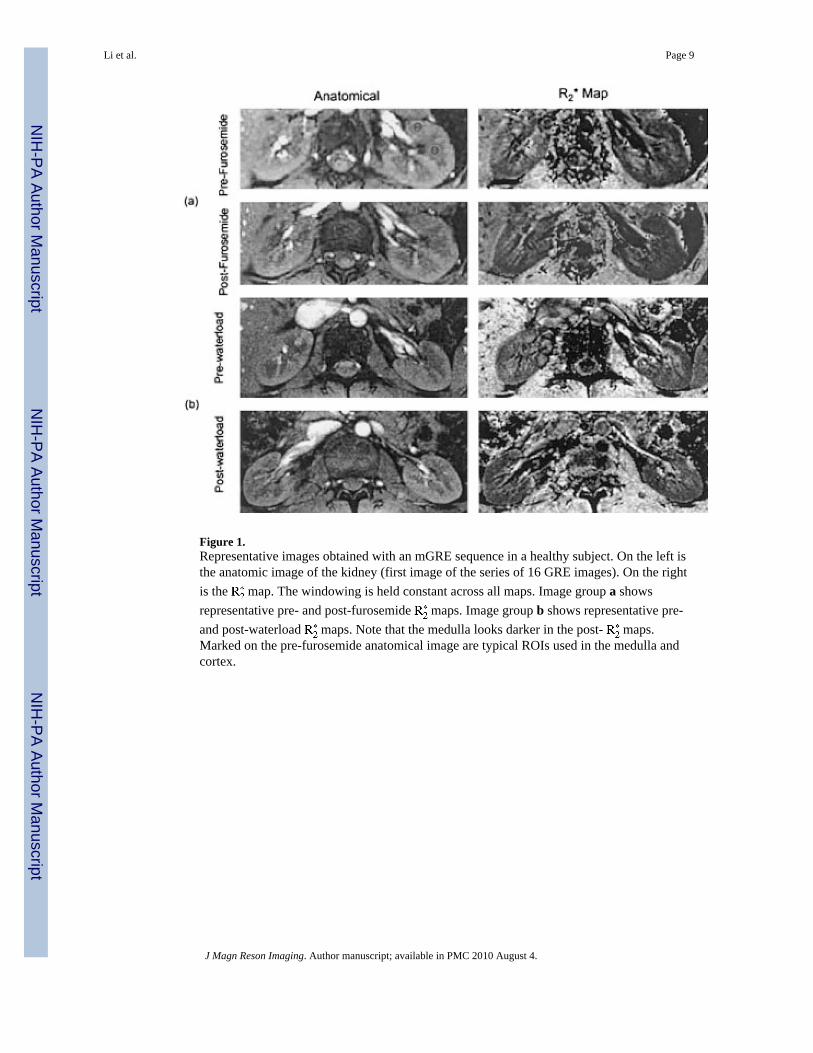
Figure 1.Representative images obtained with an mGRE sequence in a healthy subject. On the left isthe anatomic image of the kidney (first image of the series of 16 GRE images). On the rightis the map. The windowing is held constant across all maps. Image group a showsrepresentative pre- and post-furosemide maps. Image group b shows representative pre-and post-waterload maps. Note that the medulla looks darker in the post- maps.Marked on the pre-furosemide anatomical image are typical ROIs used in the medulla andcortex.
Li et al. Page 9
J Magn Reson Imaging. Author manuscript; available in PMC 2010 August 4.
NIH
-PA Author Manuscript
NIH
-PA Author Manuscript
NIH
-PA Author Manuscript
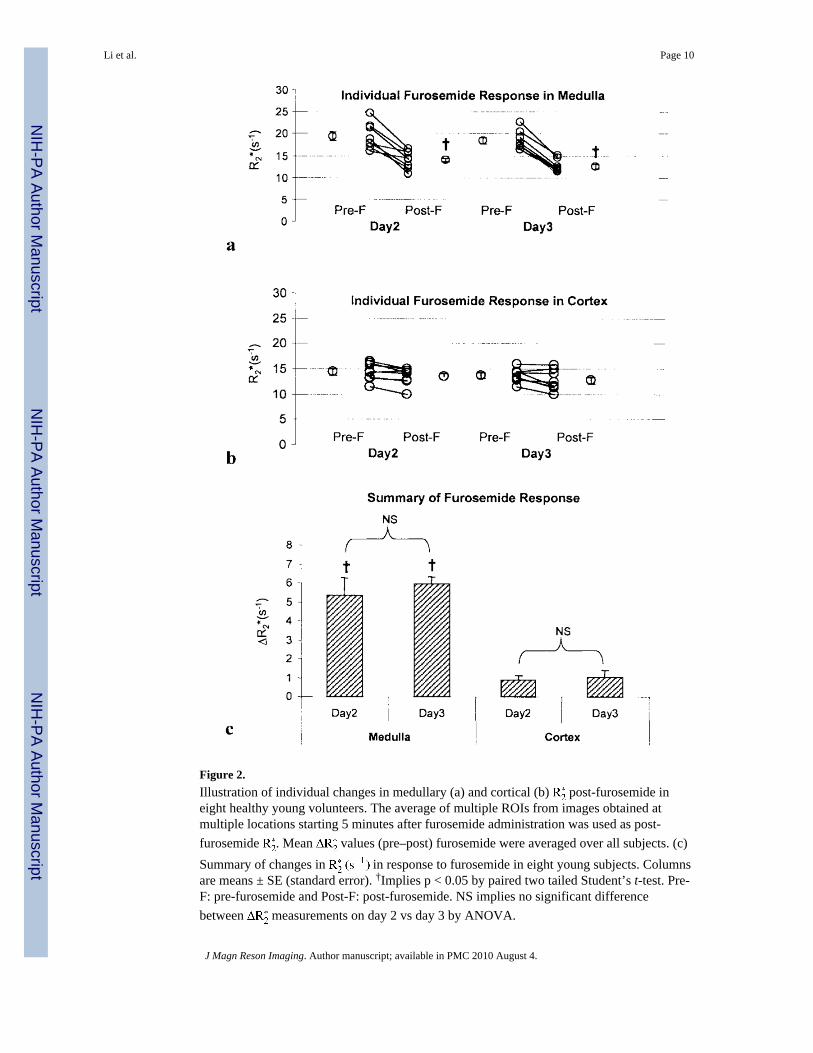
Figure 2.Illustration of individual changes in medullary (a) and cortical (b) post-furosemide ineight healthy young volunteers. The average of multiple ROIs from images obtained atmultiple locations starting 5 minutes after furosemide administration was used as post-furosemide . Mean values (pre–post) furosemide were averaged over all subjects. (c)Summary of changes in in response to furosemide in eight young subjects. Columnsare means ± SE (standard error). †Implies p < 0.05 by paired two tailed Student’s t-test. Pre-F: pre-furosemide and Post-F: post-furosemide. NS implies no significant differencebetween measurements on day 2 vs day 3 by ANOVA.
Li et al. Page 10
J Magn Reson Imaging. Author manuscript; available in PMC 2010 August 4.
NIH
-PA Author Manuscript
NIH
-PA Author Manuscript
NIH
-PA Author Manuscript
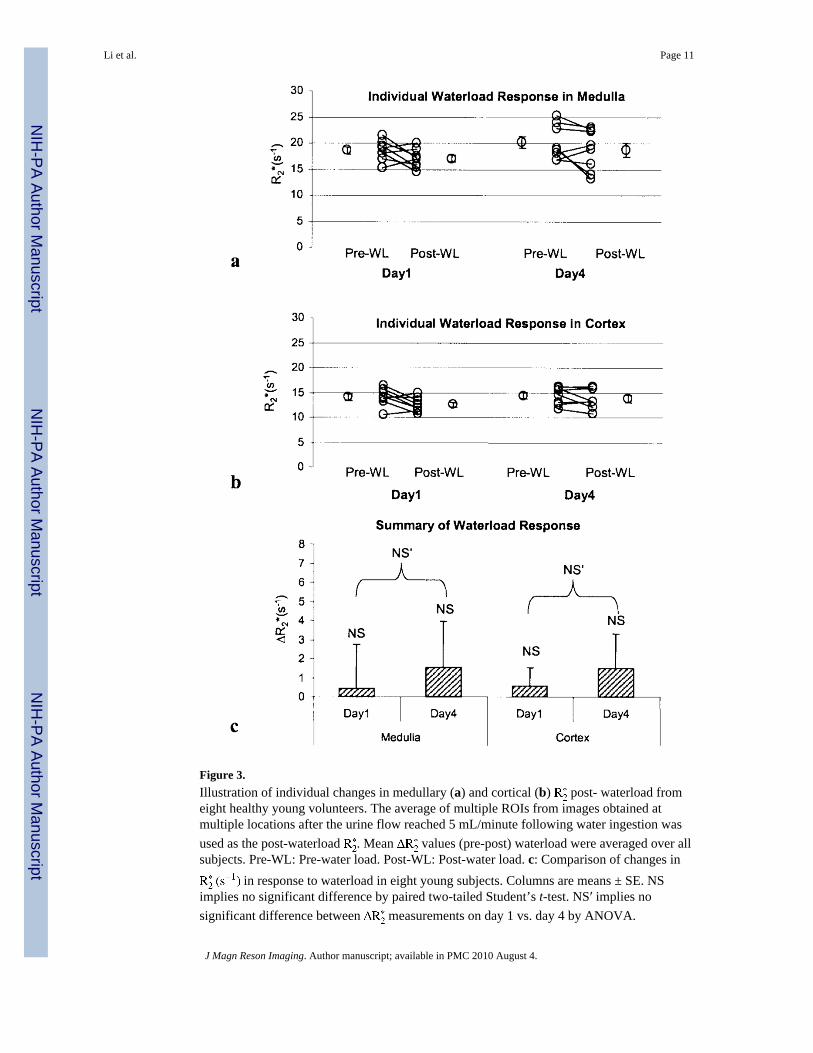
Figure 3.Illustration of individual changes in medullary (a) and cortical (b) post- waterload fromeight healthy young volunteers. The average of multiple ROIs from images obtained atmultiple locations after the urine flow reached 5 mL/minute following water ingestion wasused as the post-waterload . Mean values (pre-post) waterload were averaged over allsubjects. Pre-WL: Pre-water load. Post-WL: Post-water load. c: Comparison of changes in
in response to waterload in eight young subjects. Columns are means ± SE. NSimplies no significant difference by paired two-tailed Student’s t-test. NS′ implies nosignificant difference between measurements on day 1 vs. day 4 by ANOVA.
Li et al. Page 11
J Magn Reson Imaging. Author manuscript; available in PMC 2010 August 4.
NIH
-PA Author Manuscript
NIH
-PA Author Manuscript
NIH
-PA Author Manuscript
NIH
-PA Author Manuscript
NIH
-PA Author Manuscript
NIH
-PA Author Manuscript
Li et al. Page 12
Tabl
e 1
Tim
e In
terv
als B
etw
een
Indi
vidu
al B
asel
ine
(Pre
-man
euve
r) M
easu
rem
ents
Subj
ect
Bas
elin
e in
terv
al b
etw
een
two
mea
sure
men
ts
Day
2-D
ay 1
Day
3-D
ay 2
Day
4-D
ay 3
Day
3-D
ay 1
Day
4-D
ay 2
Day
4-D
ay 1
196
6410
516
016
926
5
214
836
8818
412
427
2
314
811
547
233
162
310
410
312
946
232
175
278
590
5810
514
816
325
3
693
6111
415
417
526
8
784
6511
614
918
126
5
810
313
230
235
162
265
Mea
n10
883
8118
716
427
2
SD25
3735
4018
17
J Magn Reson Imaging. Author manuscript; available in PMC 2010 August 4.
NIH
-PA Author Manuscript
NIH
-PA Author Manuscript
NIH
-PA Author Manuscript
Li et al. Page 13
Tabl
e 2
Bas
elin
e (P
re-m
aneu
ver)
V
alue
s in
Ren
al M
edul
la
Subj
ect
-bas
elin
e in
med
ulla
CV
(int
ra)
Day
1D
ay 2
Day
3D
ay 4
Mea
nSD
Min
Max
119
.42
21.3
222
.56
16.7
520
.01
2.53
16.7
522
.56
0.13
218
.18
17.6
217
.16
16.8
617
.46
0.58
16.8
618
.18
0.03
319
.14
16.0
716
.33
22.8
318
.59
3.15
16.0
722
.83
0.17
420
.22
16.9
217
.13
19.1
118
.35
1.59
16.9
220
.22
0.09
516
.90
24.7
420
.42
18.1
220
.05
3.45
16.9
024
.74
0.17
615
.24
21.7
019
.22
25.3
020
.36
4.23
15.2
425
.30
0.21
718
.19
17.8
817
.76
18.6
018
.11
0.38
17.7
618
.60
0.02
821
.57
18.8
517
.27
23.9
320
.41
2.94
17.2
723
.93
0.14
Mea
n18
.61
19.3
918
.48
20.1
90.
12
SD1.
962.
942.
113.
340.
07
Min
15.2
416
.07
16.3
316
.75
Max
21.5
724
.74
22.5
625
.30
CV
(int
er)a
0.11
0.15
0.11
0.17
a Inte
r-su
bjec
t CV
(mea
n ±
SD):
0.13
± 0
.03.
J Magn Reson Imaging. Author manuscript; available in PMC 2010 August 4.

NIH
-PA Author Manuscript
NIH
-PA Author Manuscript
NIH
-PA Author Manuscript
Li et al. Page 14
Tabl
e 3
Bas
elin
e (P
re-m
aneu
ver)
V
alue
s in
Ren
al C
orte
x
Subj
ect
bas
elin
e in
cor
tex
CV
(int
ra)
Max
Day
1D
ay 2
Day
3D
ay 4
Mea
nSD
Min
113
.26
16.0
816
.02
11.6
114
.24
2.19
11.6
116
.08
0.15
213
.79
14.5
013
.23
13.0
013
.63
0.67
13.0
014
.50
0.05
314
.06
14.2
314
.37
16.0
614
.68
0.93
14.0
616
.06
0.06
415
.63
13.1
612
.77
15.9
014
.37
1.63
12.7
715
.90
0.11
514
.06
16.5
414
.17
12.5
714
.33
1.64
12.5
716
.54
0.11
610
.53
15.8
414
.35
16.1
414
.21
2.58
10.5
316
.14
0.18
715
.17
13.3
113
.06
14.5
814
.03
1.01
13.0
615
.17
0.07
816
.37
11.4
311
.48
15.5
213
.70
2.62
11.4
316
.37
0.19
Mea
n14
.11
14.3
913
.68
14.4
20.
12
SD1.
781.
731.
361.
790.
05
Min
10.5
311
.43
11.4
811
.61
Max
16.3
716
.54
16.0
216
.14
CV
(int
er)a
0.13
0.12
0.10
0.12
a Inte
r-su
bjec
t CV
(mea
n ±
SD):
0.12
± 0
.01.
J Magn Reson Imaging. Author manuscript; available in PMC 2010 August 4.

NIH
-PA Author Manuscript
NIH
-PA Author Manuscript
NIH
-PA Author Manuscript
Li et al. Page 15
Table 4
Individual Response to Furosemide on Day 2 and Day 3 Based on RCI Analysis*
SubjectMedulla Cortex
Day 2 Day 3 Day 2 Day 3
1 3.88 4.18 1.02 0.14
2 0.93 2.76 0.25 1.26
3 0.96 2.46 −0.17 1.85
4 2.58 3.23 0.17 0.22
5 4.40 2.79 0.79 0.12
6 3.31 3.50 0.46 −0.36
7 2.81 2.89 0.45 1.03
8 4.30 3.08 0.79 0.98
*RCI > 1.96 indicates a reliable change.
J Magn Reson Imaging. Author manuscript; available in PMC 2010 August 4.
NIH
-PA Author Manuscript
NIH
-PA Author Manuscript
NIH
-PA Author Manuscript
Li et al. Page 16
Table 5
Individual Response to Waterload on Day 1 and Day 4 Based on RCI analysis*
SubjectMedulla Cortex
Day 1 Day 4 Day 1 Day 4
1 1.51 −0.76 1.22 0.39
2 −0.26 0.32 −0.57 −0.08
3 −0.31 0.19 0.07 −0.08
4 1.00 2.18 1.42 1.29
5 0.39 −0.53 1.05 −0.28
6 −0.66 1.01 −0.35 0.15
7 1.40 1.73 1.57 1.27
8 1.68 0.32 1.46 −0.14
*RCI > 1.96 indicates a reliable change.
J Magn Reson Imaging. Author manuscript; available in PMC 2010 August 4.