
Rock Salt vs. Wurtzite Phases of Co1-xMnxO
133
RICE UNIVERSITY Rock Salt vs. Wurtzite Phases of Col-xMnxO: Control of Crystal Lattice and Morphology at the Nanoscale by Sean Robert Walsh A THESIS SUBMITTED IN PARTIAL FULFILLMENT OF THE REQUIREMENTS FOR THE DEGREE Doctor of Philosophy APPROVED, THESIS CO MITTEE enton H. Whitmire, Chair Professor of Chemistry Associate Dean for Academic Affairs, Weiss School of Natural Sciences ical & Bi Michae rofessor of '-.d. Engineering Lon J. ilson Professor of Chemis • HOUSTON , TEXAS December 2012 •
-
Upload
khangminh22 -
Category
Documents
-
view
3 -
download
0
Transcript of Rock Salt vs. Wurtzite Phases of Co1-xMnxO

RICE UNIVERSITY
Rock Salt vs. Wurtzite Phases of Col-xMnxO: Control ofCrystal Lattice and Morphology at the Nanoscale
by
Sean Robert Walsh
A THESIS SUBMITTEDIN PARTIAL FULFILLMENT OF THEREQUIREMENTS FOR THE DEGREE
Doctor of Philosophy
APPROVED, THESIS CO MITTEE
enton H. Whitmire, ChairProfessor of ChemistryAssociate Dean for Academic Affairs,Weiss School of Natural Sciences
ical & BiMichae ~
rofessor of '-.d.
Engineering
Lon J. ilsonProfessor of Chemis
•
HOUSTON , TEXASDecember 2012
•

ii
Abstract
Rock Salt vs. Wurtzite Phases of Co1-xMnxO: Control of Crystal Lattice and
Morphology at the Nanoscale
by
Sean Robert Walsh
Diamond cuboid-, rhombohedron- and hexagon-shaped nanocrystals as
well as branched rods of the solid solution Co1-xMnxO (0.01 ≤ x ≤ 0.9) have been
synthesized via a solvothermal synthetic route from manganese formate and
cobalt acetate at elevated temperature. Rhombohedra and hexagons have
dimensions no larger than 50 nm on the longest axis, rods have branches up to
150 nm long and cuboids grow up to 250 nm on a side. X-ray and electron
diffraction and transmission electron microscopy analyses show that these
nanoparticles are single crystals of wurtzite-type and rock salt-type Co1-xMnxO.
Varying the surfactant, water and precursor ratios allows control of particle size,
morphology and stoichiometry. Extending growth time at high temperatures
(>370°C) leads to the disappearance of the wurtzite phase due to Ostwald
ripening. Longer reaction times at temperatures between 345-365°C lead to more
crystalline wurtzite-lattice particles. These results show that nanoparticle
morphologies and crystal lattices arise from crystal growth and Ostwald ripening
at different rates selecting for either small, smooth-surfaced wurtzite lattice
particles or large, dendritically-grown rock salt lattice particles.

Acknowledgements
I have not had the smoothest of paths through graduate school, with many
of my issues being of my own making. I would first like to thank my advisor
Professor Kenton H. Whitmire for being willing to give me second and third
chances at transforming from a prone-to-procrastination and, frankly, lazy
Kentucky almost-hillbilly who lucked into a good undergraduate institution to
becoming a successful graduate student and researcher; this is not a debt that I
will ever be able to repay. I also would like to thank Professor Lon J. Wilson for
being willing to be on my thesis committee, as well as being someone who always
seemed to have an appropriate insight for the situation at hand, as well as a crack
about Notre Dame’s struggles in whatever sport was in season that day. I also
thank Dr. Michael Wong for joining this thesis committee.
Other members of the Whitmire lab, namely Dr. Christina Hofmann, Dr.
Anna Kelly, Dr. Trinanjana Mandal and Dr. Adam Colson, have been wonderful
people to know and work with. Adam especially has been a true friend and
constant source of both chemistry and non-chemistry discussions, news,
enlightenment and humor.
I would like to thank the scientists of the Shared Equipment Authority,
particularly Richard Crouse and Dr. Wenh Guo, for their daily efforts to
ensure that the instruments we need are well maintained and ready for
experiments. I would also like to thank the Rice Chemistry Department and

iv
Dr. Seiichi Matsuda for their assistance in ensuring I reached this point of my
education.
During my time at Rice I have met a great number of people that I
consider to be dear friends, and I would not have made it through these five years
without them. Dr. David Fortunato, Dr. Brent Carey, Dr. Purvez Capitan, Eileen
Meyer, and John Stanley are all people I will never forget and hope to never lose
track of – they accompanied me through one of the biggest learning experiences
of my life, and certainly the best bad decision I’ve ever made, managing Valhalla.
I would especially like to thank my parents, Robert and Colleen Walsh, for
their support for my whole life leading up to this point. I don’t know where I
would be without their love and guidance. I would also like to thank my uncle
and aunt, Tom and Astrid Walsh, whose presence in Houston during my time at
Rice has ensured that I would always have someone to fall back on in times of
immediate need, but also knew when to let me walk on my own.

Table of Contents
Abstract ......................................................................................................................... ii
Acknowledgements ...................................................................................................... iii
Table of Contents ......................................................................................................... v
List of Figures ............................................................................................................. vii
List of Tables................................................................................................................ xi
Chapter 1. Introduction ........................................................................................ 1
1.1 Transition Metal Oxides ........................................................................................ 1
1.1.1 Mixed-Metal Oxides ......................................................................................... 1
1.2 Materials at the Nanoscale ..................................................................................... 4
1.2.1 Polymorphism ................................................................................................... 5
1.2.2 Binary Oxides and Their Polymorphs ............................................................... 6
1.3 Synthetic Methods at the Nanoscale ..................................................................... 9
1.4 Thesis Topic: Cobalt-Manganese Oxides ........................................................... 11
Chapter 2. Experimental .................................................................................... 13
2.1 Materials ............................................................................................................... 13
2.2 Procedure for Synthesis of Co1-xMnxO nanoparticles ....................................... 14
2.3 Analysis of Nanoparticles .................................................................................... 16
2.3.1 X-ray powder diffraction (XRD) .................................................................... 16
2.3.2 Transmission electron microscope (TEM) ...................................................... 16
2.3.3 Inductively Coupled Plasma Optical Emission Spectroscopy (ICP-OES) ...... 17
Chapter 3. Results ............................................................................................... 18
3.1 Crystal Lattice Determination ............................................................................ 18
3.2 Issues with reproducibility of synthesis .............................................................. 19
3.3 Effect of altering Co:Mn precursor ratio ........................................................... 24
3.3.1 Crystal lattice .................................................................................................. 24
3.3.2 Nanoparticle morphology ................................................................................ 33
3.4 Effect of varying TOA:OA volume ratio ............................................................ 40
3.4.1 Crystallinity and lattice of products ................................................................ 40

vi
3.4.2 Nanoparticle size and morphology .................................................................. 44
3.5 Effect of Adding H2O to Reaction Solution ........................................................ 50
3.6 Effect of Changing Molecular Precursor: OA Ratio ......................................... 56
3.7 Effect of Extending Growth Time ....................................................................... 62
3.8 Effect of Varying the Solution Heating Rate ..................................................... 68
3.9 Grain size dependence on Co-Mn stoichiometry ............................................... 74
Chapter 4. Discussion .......................................................................................... 84
4.1 Previous work in the Whitmire Lab ................................................................... 84
4.2 Identification of nanoparticle crystal lattice ...................................................... 84
4.3 Change in crystal lattice with metal content ...................................................... 85
4.4 Effect of Co:Mn ratio on morphology of products ............................................ 86
4.5 Oleic acid and its role in oxide formation .......................................................... 88
4.6 Oleic acid and its effect on nanoparticle morphology ....................................... 90
4.7 Effect of Added Water on Nanoparticle Morphology ....................................... 93
4.8 Effect of molecular precursor:OA ratio on nanoparticle structure ................. 95
4.9 Extending reaction growth time .......................................................................... 97
4.10 Separation of rs-Co1-xMnxO and w-Co1-xMnxO ............................................... 99
4.11 Nanoparticle growth processes ........................................................................ 100
4.11.1 “Cuboid”-shaped nanoparticles ................................................................... 103
4.11.2 Faceted particles .......................................................................................... 106
4.12 Presence of Multiple Phases ............................................................................ 110
4.13 Grain size dependence on Co-Mn stoichiometry ........................................... 113
4.14 Heating effects and heterogeneous vs. homogeneous nucleation ................. 113
Chapter 5. Conclusions ..................................................................................... 115
References ................................................................................................................. 116

vii
List of Figures
Figure 1.1. Spinel lattice viewed to emphasize coordination environment of M
and M’ in the spinel structure. M is shown as blue spheres, M’ as orange
spheres and O as black spheres. Image made in Diamond software using
MnFe2O4 CIF file from the American Mineralogical Database. 3
Figure 1.2. Idealized cubic perovskite unit cell. The crosshatched circle is A,
filled black circles are B. Each octahedron vertex is an oxygen atom.
Adapted from Deer.1 3
Figure 1.3. Zinc Blende and Wurtzite crystal structures. Shown are the
ABCABC cubic close pack layer ordering and ABABAB hexagonal
close pack layer ordering. 6
Figure 1.4. Rock salt lattice of MnO. 7
Figure 2.1. Reaction setup for nanoparticle synthesis 15
Figure 3.1. Example XRD pattern for polycrystalline rs-Co1-xMnxO nanoparticles.
Lattice indices marked are marked above each peak. Reference peak
positions for MnO (a = 4.44 Å) and rs-CoO (a = 4.26 Å) are shown in
green and red respectively. 18
Figure 3.2. (a) Co1-xMnxO nanoparticles and (b) the indexed polycrystalline
SAED pattern from the sample shown in Figure 3.1. Both images were
taken by Dr. Irene Rusakova at the University of Houston. 19
Figure 3.3. XRD pattern of metallic cobalt resulting from failed nanoparticle
synthesis. Cubic close pack and hexagonal close pack lattice cobalt phases
(PDF#00-015-0806 and PDF#04-002-1029) are shown as reference in
orange and blue respectively. 20
Figure 3.4. XRD pattern of mixture of rs-Co1-xMnxO and metallic cobalt cubic
and hexagonal phases). Oxide peaks are marked in green; ccp and hcp
metallic cobalt peaks are orange and blue respectively. 20
Figure 3.5. XRD pattern of a mixture of multiple rock salt-structure oxide phases.
Reference phases with lattice constant a = 4.403 Å and 4.326 Å are shown
in green and purple respectively. 21

viii
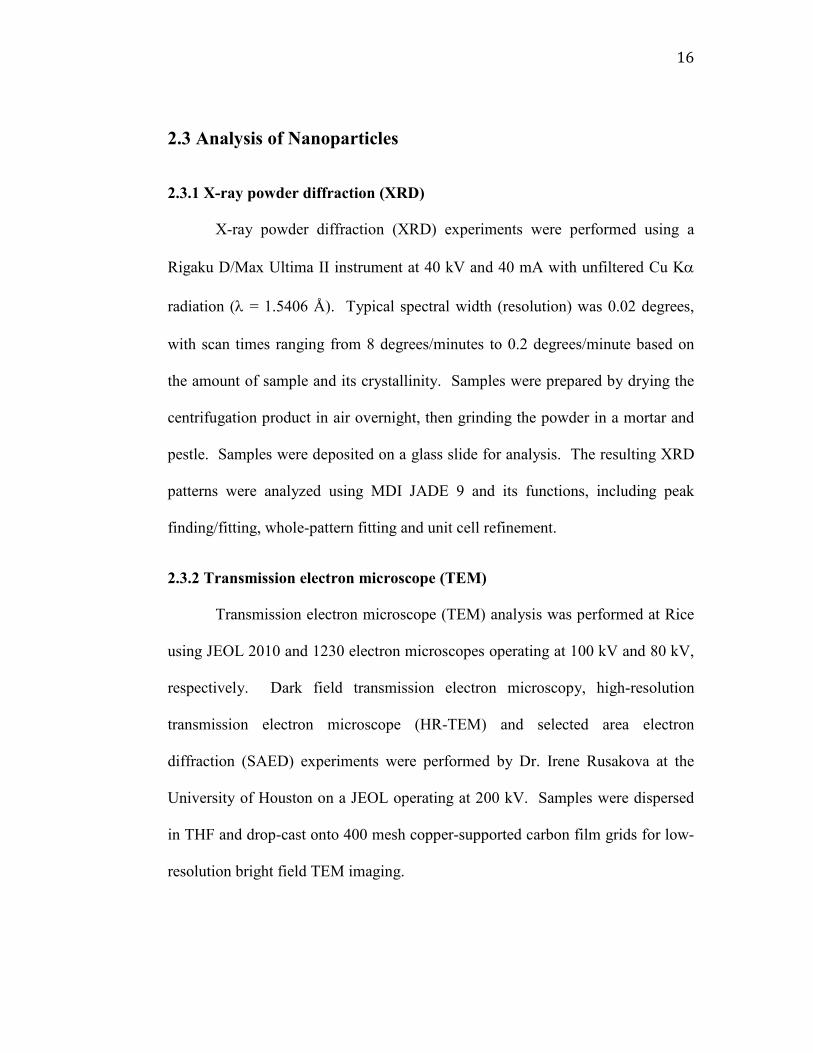
Figure 3.6. Glassware setup for distillation of OA. Not shown: aluminum foil
wrapping. 23
Figure 3.7. XRD patterns for select nanoparticle samples of varying Co-Mn
content as determined by ICP-OES analysis. MnO and CoO are shown in
red and green respectively. 30
Figure 3.8. Change in (220) peak position with increasing cobalt content in
sample. Sample data is in black diamonds; MnO and CoO positions
are in red squares. The direct-line correlation between MnO and
CoO is shown as a red line. 31
Figure 3.9. Change in calculated unit cell volume versus cobalt content of sample.
Sample data is in black diamonds; MnO and CoO positions are in red
squares. The direct correlation between MnO and CoO (as expected from
Vegard’s Law) is shown as a red line. 32
Figure 3.10. Example powder XRD pattern for all products recovered by
centrifugation in hexanes for TOA:OA ratios of 7:1 to 5:3; trace amounts
of Co metal are present in some, but not all, samples. 42
Figure 3.11. Example powder XRD pattern of nanoparticles recovered from the
supernatant of reaction with 5 mL TOA and 3 mL OA. ZnO (PDF#04-
008-8199) is shown in green; zinc blende CoO (ZB-CoO) is shown above
in black. 42
Figure 3.12. Powder XRD pattern of the product of a reaction run in 8 mL TOA,
with no OA present. Face-centered cubic-lattice MnO and CoO are shown
in red and blue, respectively, whereas hexagonal-lattice ZnO is shown in
green. 43
Figure 3.13. HR-TEM images and SAED patterns of cubic lattice and hexagonal
lattice nanoparticles. The sample in (a) was synthesized in 6 mL TOA: 2
mL OA; the SAED pattern in (b) indexes to a single cubic phase Fmm
(225), a = 4.3 Å. The sample in (c) is from the supernatant of the 5 mL
TOA: 3 mL OA reaction; the SAED pattern in (d) indexes to a single
hexagonal phase P63mc (186), a = 3.3 Å and c = 5.2 Å. 44

ix
Figure 3.14. XRD pattern of product recovered from supernatant of reaction with
1 mmol metal precursors. Reference pattern for hexagonal ZnO-type
lattice is shown in green; for face centered cubic MnO-type lattice in blue.
61
Figure 3.15. XRD pattern of product recovered from precipitate of reaction with 1
mmol metal precursors. The lack of sharp peaks indicates a non-
crystalline, amorphous solid. 61
Figure 3.16. Change in XRD patterns for the material collected from the
supernatant of reactions with extended growth times under conditions 6
mL TOA: 2 mL OA, no water and 0.5 mmol each of Co(OAc)2 and
Mn(HCOO)2. Reference pattern for a rock salt-structure lattice with a =
4.3 Å is shown in blue; reference P63mc lattice with a = 3.2 Å and c = 5.2
Å shown in green. 67
Figure 3.17. Reaction temperature vs. time profile for a standard nanoparticle
synthesis reaction. The reaction conditions and results for this particular
reaction are discussed along with Table 3.18. 70
Figure 3.18. Reaction temperature vs. time comparison for a failed nanoparticle
synthesis. 70
Figure 3.19. Reaction temperature vs. time comparison for a reaction that
still yielded some nanoparticles. 71
Figure 3.20. Sharpening of w-Co1-xMnxO nanoparticle XRD peaks with
increasing particle size and crystallinity. Representative TEM image
of each sample is shown on the right. The largest particles are 25-30
nm in diameter, the smallest 5 nm. Reference peaks for hexagonal
ZnO are shown in gray at the bottom. 73
Figure 3.21. Crystallite size (average of Scherrer fit for the (111) and (200)
peaks) vs. Co content from ICP-OES with quadratic fit to the data. 79
Figure 3.22. Crystallite size (average of Scherrer fit for the (111) and (200) peaks)
vs. Co content from ICP-OES with cubic fit to the data. 80
Figure 3.23. Crystallite size (average of Scherrer fit for the (111), (200) and (220)
peaks) vs. Co content from ICP-OES with quadratic fit to the data. 81

x
Figure 3.24. Crystallite size (average of Scherrer fit for the (111), (200) and (220)
peaks) vs. Co content from ICP-OES with cubic fit to the data. 82
Figure 3.25. Crystallite size (average of Scherrer fit for the (111), (200) and (220)
peaks) vs. Co content from ICP-OES. These are Co1-xMnxO particles
where 0.1 ≤ x ≤ 0.9. The fit is linear. 83
Figure 4.1. Crystal growth rate vs. crystal growth driving force. Curve A depicts
spiral growth, curve B two-dimensional layer-by-layer growth and curve C
adhesive growth. From Sunagawa p46.92 102
Figure 4.2. Different morphologies achieved under different growth mechanisms
from the same cubic seed crystal bounded only by the (111) face. From
Sunagawa p 52.92 102
Figure 4.3. TEM images (a) and (c) with SAED patterns (b) and (d) of
nanoparticles from reaction of 7 mL TOA: 1 mL OA with 1 mmol each of
Co(OAc)2 and Mn(HCOO)2. (e) and (f) Schematic illustration of the
growth conditions and internal texture of a diamond cuboid (figure derived
from literature).92 104
Figure 4.4 Schematic of the growth process of a spherulite formed by split
growth. From Sunagawa, p158.92 105
Figure 4.5 Schematic of the growth process for two octahedrons forming
interpenetrating cubic crystals. From Sunagawa, p136.92 106
Figure 4.6 Illustration of steps of growth from a cubic lattice nucleus in the [100]
directions via a spiral mechanism. Adapted from Sunagawa, p 79.92 108
Figure 4.7 SAED pattern of surface-oxidized nanoparticle along the [001] axis (a)
and dark field TEM images of a nanoparticle taken with grock salt = 200 (b)
and gspinel = 2 0 (c). SAED pattern of a nanoparticle displaying long-
range superlattice ordering (d) with dark field TEM images with gintense =
220 (e) and gweak = 110 (f). 111
Figure 4.8 Bright field TEM (a) and SAED pattern down the [011] axis showing
superlattice ordering (b) of a nanoparticle synthesized 6 ml TOA: 2 ml OA
with no water and a 2:1 Co:Mn precursor ratio; final product
stoichiometry was c-Co0.75Mn0.25O. 113
2

xi
List of Tables
Table 1.1. Crystallographic data for binary oxides with the rock salt structure2 .... 8
Table 1.2. Crystallographic data for binary oxides with the wurtzite structure ...... 9
Table 1.3. Single-metal oxides synthesized at the nanoscale8 ......................... 11
Table 3.1 Example of a cell refinement report for an XRD pattern using JADE 9
software. .................................................................................................... 25
Table 3.2. XRD data from JADE and ICP-OES elemental analysis of samples... 26
Table 3.3. XRD data from JADE and ICP-OES elemental analysis of samples,
continued. .................................................................................................. 27
Table 3.4. XRD data from JADE and ICP-OES elemental analysis of samples,
continued. .................................................................................................. 28
Table 3.5. XRD data from JADE and ICP-OES elemental analysis of samples,
continued. .................................................................................................. 29
Table 3.6. TEM images of nanoparticles synthesized with a 9:1 ratio of Mn:Co
molecular precursors ................................................................................. 33
Table 3.7. TEM images of nanoparticles synthesized with a 5:1 ratio of Mn:Co
molecular precursors ................................................................................. 34
Table 3.8. TEM images of nanoparticles synthesized with a 2:1 ratio of Mn:Co
molecular precursors ................................................................................. 35
Table 3.9. TEM images of nanoparticles synthesized with a 1:1 ratio of Mn:Co
molecular precursors ................................................................................. 36
Table 3.10. TEM images of nanoparticles synthesized with a 1:2 ratio of Mn:Co
molecular precursors ................................................................................. 37
Table 3.11. TEM images of nanoparticles synthesized with a 1:5 ratio of Mn:Co
molecular precursors ................................................................................. 38
Table 3.12 TEM images of nanoparticles synthesized with a 1:9 ratio of Mn:Co
molecular precursors ................................................................................. 39
Table 3.13. TEM images of nanoparticles synthesized in 8 mL TOA and 0 mL
OA ............................................................................................................. 45

xii
Table 3.14. TEM images of nanoparticles synthesized in 7 mL TOA and 1 mL
OA ............................................................................................................. 46
Table 3.15. TEM images of nanoparticles synthesized in 6.5 mL TOA and 1.5 mL
................................................................................................................... 47
Table 3.16. TEM images of nanoparticles synthesized in 5 mL TOA and 3 mL
OA– supernatant from centrifugation in hexanes (w-Co1-xMnxO)............ 48
Table 3.17. TEM images of nanoparticles synthesized in 5 mL TOA and 3 mL
OA – precipitate from centrifugation in hexanes (rs-Co1-xMnxO) ............ 49
Table 3.18. TEM images of nanoparticles synthesized with 20 µL (1.11 mmol)
added ........................................................................................................ 51
Table 3.19. TEM images of nanoparticles synthesized with 36 µL (2 mmol) added
................................................................................................................... 52
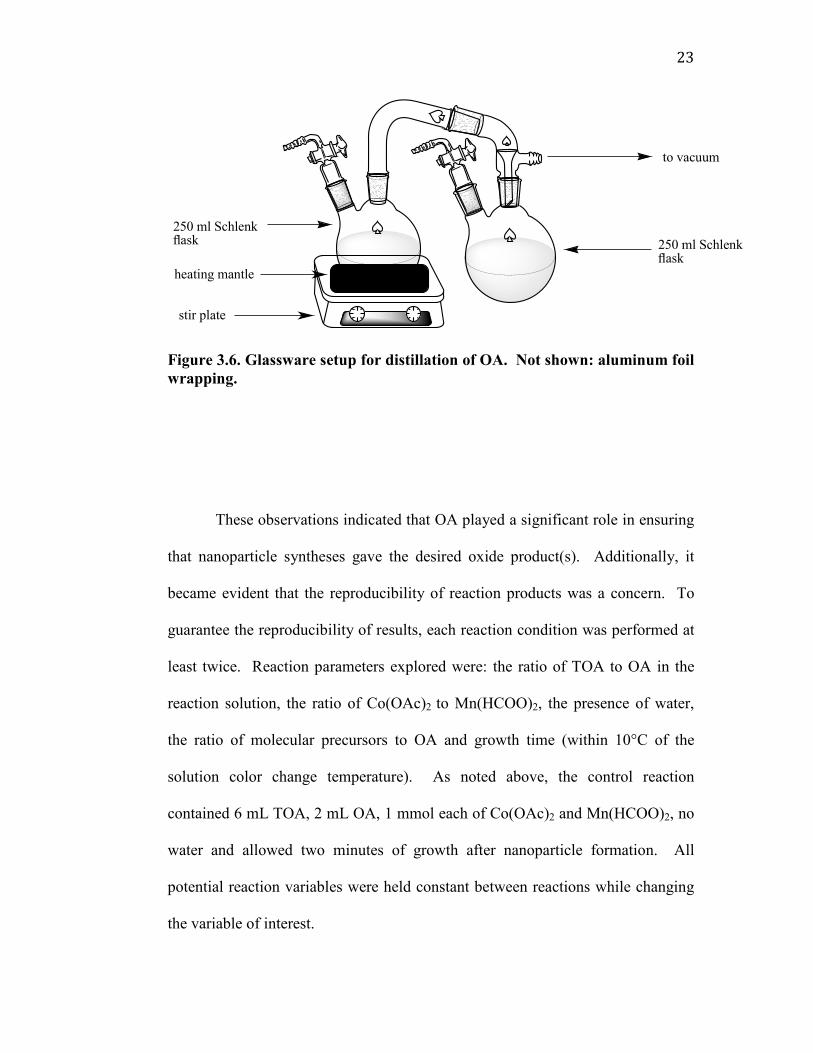
Table 3.20. TEM images of nanoparticles synthesized with 54 µL (3 mmol) added
................................................................................................................... 53
Table 3.21. TEM images of nanoparticles synthesized with Co(OAc)2·4H2O that
was not dried beforehand .......................................................................... 54
Table 3.22. TEM images of nanoparticles synthesized with a 9:1 ratio of Mn:Co
molecular precursors with 100 µL H2O added; SAED pattern is for the
doubly branched particle at the bottom ..................................................... 55
Table 3.23. TEM images of nanoparticles synthesized with 1 mmol metal
precursors that precipitated upon centrifugation in hexanes ..................... 57
Table 3.24. TEM images of nanoparticles synthesized with 1 mmol metal
precursors recovered from hexanes centrifugation supernatant ................ 58
Table 3.25. TEM images of nanoparticles synthesized with 3 mmol metal
precursors .................................................................................................. 59
Table 3.26. TEM images of nanoparticles synthesized with 4 mmol metal
precursors .................................................................................................. 60
Table 3.27. 5 minutes growth for reaction with 6 mL TOA, 2 mL OA with no
water and 0.5 mmol of each precursor. This material (5-SN) was
recovered from the supernatant after centrifugation in hexanes. .............. 63

xiii
Table 3.28. 5 minutes growth for reaction with 6 mL TOA, 2 mL OA with no
water and 0.5 mmol of each precursor. This material (5-PP) was
recovered from the precipitate after centrifugation in hexanes. ................ 64
Table 3.29. 10 minutes growth for reaction with 6 mL TOA, 2 mL OA with no
water and 0.5 mmol of each precursor. This material (10-SN) was
recovered from the supernatant after centrifugation in hexanes. .............. 65
Table 3.30. 10 minutes growth for reaction with 6 mL TOA, 2 mL OA with no
water and 0.5 mmol of each precursor. This material (10-PP) precipitated
upon centrifugation in hexanes. ................................................................ 66
Table 3.31. TEM images of reactions that had inconsistent heating. The pairs of
images on each row are from different reactions, with different starting
conditions. ................................................................................................. 72
Table 3.32. Scherrer analysis data after processing raw XRD data in JADE 9. ... 75
Table 3.33. Scherrer analysis data after processing raw XRD data in JADE 9,
cont’d. ........................................................................................................ 76
Table 3.34. Scherrer analysis data after processing raw XRD data in JADE 9,
cont’d. ........................................................................................................ 76
Table 3.35. Scherrer analysis data after processing raw XRD data in JADE 9,
cont’d. ........................................................................................................ 77
Table 3.36. Scherrer analysis data after processing raw XRD data in JADE 9,
cont’d. ........................................................................................................ 78
Table 4.1 TEM images of CoO nanoparticles synthesized in 6 mL TOA, 2 mL
OA, 2 mmol Co(OAc)2 and no water. ....................................................... 88
Table 4.2 Stoichiometries of nanoparticles discussed in Section 4.9. ................... 99

1
Chapter 1. Introduction
1.1 Transition Metal Oxides
Transition metal oxides have been studied for centuries due to their
abundance, stability and wide range of properties, structures and combinations.
There are 28 naturally occurring transition metals that form oxides (i.e. the d
block minus gold and technetium) and the number of possible permutations of
crystal lattices, oxidation states, electronegativities, bonding types, coordination
numbers, atomic or ionic radii is truly staggering. Adding in all of the s and p
block elements that can (and do) mix in with the transition metals leads to even
more interesting and varied substances. While mineralogists, crystallographers
and materials chemists have made great strides in discovering, characterizing and
investigating the properties of this class of materials, the sheer number of
potential compounds means that there are still myriad avenues for exploration.1-3
1.1.1 Mixed-Metal Oxides
Oxides with more than a single cationic metal species are very common.
Generally, there are two structural forms from which they arise: (1) materials
with two dissimilar cations and (2) materials with two similar metals. The first
type leads to compounds such as spinel (MgAl2O4) and perovskite (CaTiO3), in
which the structure is the result of the two cations always occupying different,
ordered lattice positions. The spinel structure, more generally MM’2O4, where M
is a 2+ cation and M’ is a 3+ cation, has a face-centered cubic unit cell, space

2
group Fd3m, with Z = 8. This means that there are 32 oxygen ions and 24 metal
ions per unit cell, with M and M’ either octahedrally or tetrahedrally coordinated
by oxygen. In the “regular” spinel form shown in Figure 1.1, all 8 M cations are
in the tetrahedral sites and the 16 M’ cations are wholly in the octahedral sites; in
“inverse spinels” M and 8 M’ are octahedrally coordinated with 8 M’ cations in
the tetrahedral sites. Common examples of spinels are magnetite (Fe2+)(Fe3+)2O4,
jacobsite (Mn2+)(Fe3+)2O4 and franklinite (Zn2+)(Fe3+)2O4. In the perovskite
structure, more generally ABO3 where A is a large 2+ cation and B a smaller 4+
cation, the size mismatch between the A and B cations leads to a body-centered
crystal lattice, which may be cubic, tetragonal or orthorhombic depending on the
distortion. The B cations are positioned at the corners of the lattice octahedrally
coordinated by oxygen, while the A cation occupies the body center in 12-fold
coordination. This is shown in Figure 1.2. Spinel and perovskite crystal
structures are the result of mismatches between the two different metals
combined in the material. In the case of spinels, the mismatch is in the
oxidation state, leading to a different preferred coordination environment. In
perovskites the larger size of the A cation forces the BO6 octahedra apart and
frequently at different stacking angles from the perfect cubic alignment, as
noted above.

Figure 1.1. Spinel lattice viewed to emphasize coordination environment of M and M’ in the spinel structure. M is shown as blue spheres, M’ as orange spheres and O as black spheres.MnFe2O4 CIF file from the American Mineralogical Database.
Figure 1.2. Idealized filled black circles are B. Each octahedron vertex is an oxygen atom.Adapted from Deer.1
Spinel lattice viewed to emphasize coordination environment of M nd M’ in the spinel structure. M is shown as blue spheres, M’ as orange
spheres and O as black spheres. Image made in Diamond software using CIF file from the American Mineralogical Database.
Idealized cubic perovskite unit cell. The crosshatched circle is A, filled black circles are B. Each octahedron vertex is an oxygen atom.
1
3
Spinel lattice viewed to emphasize coordination environment of M nd M’ in the spinel structure. M is shown as blue spheres, M’ as orange
Image made in Diamond software using
perovskite unit cell. The crosshatched circle is A, filled black circles are B. Each octahedron vertex is an oxygen atom.

4
In the case where two metals of similar size, charge and electronegativity
are present in the same oxide material, the insertion of multiple cations may not
interrupt the original structure of the single oxide nearly as much as in the case of
spinels or perovskites. Instead, a “solid solution” of the two pure oxides forms,
with one metal included into the lattice by replacing the other (substitutional) or
interstitially. In a true solid solution the placement of each different metal cation
is random and with no positional bias. There are solid solutions that do show
ordering with respect to the placement of each constituent part of the lattice, what
are referred to in metallurgy as “superlattices,” which are distinct from the
nanoscience/metamaterials term that refers to extended arrays of components on
surfaces.4
1.2 Materials at the Nanoscale
Research in the past two decades has revealed that unstable or difficult-to-
synthesize phases of materials may become accessible when “bottom-up”
methods are used.5-8 Existing transition metal oxides have been investigated for a
wide array of interesting properties including superconductivity,9 colossal
magnetoresistance,10 metal-insulator transitions11 and the ability to catalyze many
different reactions.12-14 There is often structural similarity between materials with
similar properties, leading to the conclusion that crystal structure has a significant
effect on material properties. It is therefore of interest to explore metal oxide
materials and synthetic methods at the nanoscale to discover new structural
phases that may have other appealing properties.

5
1.2.1 Polymorphism
The ability of a single material to assume different arrangements of atoms is
called polymorphism or polytypism. In the realm of transition metal oxides
perhaps the best-known example of this is TiO2, which preferentially forms the
anatase structure over that of rutile at the nanoscale;15 this is far from the sole case
where this is found. Another mineralogical example is the mineral sphalerite,
ZnS, which has a face-centered cubic crystal lattice, space group F-43m, in its
low-temperature form.1,2,16,17 In this arrangement, four S atoms coordinate every
Zn atom in a tetrahedral manner, with every S atom being likewise surrounded by
four Zn atoms. The anions form arrays of close-packed spheres; cations sit in
interstitial sites between the anions. The close-packed anion layers most
commonly adopt one of two regular repeating arrangements: ABAB or ABCABC.
More complex arrangements are also possible, however. In the case of
sphaerulite the ABCABC layering system is used, which is a cubic close packing
of atoms. This is called the “zinc blende” structure and is the prototypical crystal
structure for many other materials, as will be discussed. Upon heating to 1020°C,
sphalerite shifts from the zinc blende structure to the “wurtzite” structure.1 The
wurtzite structure also consists of tetrahedrally-coordinated Zn and S atoms, but
the crystal lattice is a hexagonal lattice, space group P63mc, in which the anion
layers are arranged ABAB in what is called hexagonal close packing of atoms.
The differences between the zinc blende and wurtzite structure are illustrated in
Figure 1.3. Zinc blende-wurtzite polymorphism has been a topic of significant
research interest because many semiconductors of interest have one or both of

these structures, such as AlN, GaN, InN, AlP, AlAs, GaP, GaAs, ZnS, ZnSe,
ZnTe, CdS and CdSe.
Figure 1.3. Zinc Blende ABCABC cubic close pack layer ordering and ABABAB hexagonal close pack layer ordering.
1.2.2 Binary Oxides and Their Polymorphs
The binary oxides
any metal; the simplest stoichiometry is for the divalent (+2 charge) metal ions
These materials, unlike the other chalcogenides mentioned in Section 1.2.1,
not tend to form stable zinc blende or wurtzite structures, showing a marked
preference for the str
“NaCl” structures. This structure has a face
group Fm3m, in which both the ca
stacked in cubic closed packed layers; see
representation. Lattice
oxides that assume the rock salt structure are shown in
structures, such as AlN, GaN, InN, AlP, AlAs, GaP, GaAs, ZnS, ZnSe,
ZnTe, CdS and CdSe.18
Blende and Wurtzite crystal structures. Shown areABCABC cubic close pack layer ordering and ABABAB hexagonal close pack layer ordering.
and Their Polymorphs
The binary oxides are a class of compounds with formula MxOy
metal; the simplest stoichiometry is for the divalent (+2 charge) metal ions
These materials, unlike the other chalcogenides mentioned in Section 1.2.1,
not tend to form stable zinc blende or wurtzite structures, showing a marked
preference for the structure referred to variously as the “rock salt,” “halite” and
“NaCl” structures. This structure has a face-centered cubic crystal lattice, space
, in which both the cation and anion are octahedrally-coordinated and
in cubic closed packed layers; see Figure 1.4 for a graphical
Lattice constants, formula weights and ionic radii of some
oxides that assume the rock salt structure are shown in Table 1.1.
6
structures, such as AlN, GaN, InN, AlP, AlAs, GaP, GaAs, ZnS, ZnSe,
n are the ABCABC cubic close pack layer ordering and ABABAB hexagonal close
y, where M =
metal; the simplest stoichiometry is for the divalent (+2 charge) metal ions.
These materials, unlike the other chalcogenides mentioned in Section 1.2.1, do
not tend to form stable zinc blende or wurtzite structures, showing a marked
ucture referred to variously as the “rock salt,” “halite” and
centered cubic crystal lattice, space
coordinated and
for a graphical
constants, formula weights and ionic radii of some binary
. Among the

binary transition metal oxides that have a perfect 1:1 M:O ratio (MnO, FeO, CoO,
NiO), the unit cell becomes smaller and the density increases as the ionic radius
of the metal ion decreases
investigated binary oxides due to their strong preference to be in the 3+ oxidation
state over 2+, which leads to
metals and 2nd and 3rd
their much larger size
binary transition metal oxides that have a perfect 1:1 M:O ratio (MnO, FeO, CoO,
NiO), the unit cell becomes smaller and the density increases as the ionic radius
of the metal ion decreases. Titanium, vanadium and chromium do not have well
tigated binary oxides due to their strong preference to be in the 3+ oxidation
state over 2+, which leads to vacancies and defects in the lattice.
rd row transition metals deviate from the pattern also due to
rger size.
Figure 1.4. Rock salt lattice of MnO.
7
binary transition metal oxides that have a perfect 1:1 M:O ratio (MnO, FeO, CoO,
NiO), the unit cell becomes smaller and the density increases as the ionic radius
Titanium, vanadium and chromium do not have well-
tigated binary oxides due to their strong preference to be in the 3+ oxidation
The alkaline
deviate from the pattern also due to

8
Table 1.1. Crystallographic data for binary oxides with the rock salt structure2
Chemical Formula
Formula Weight
a (Å) Unit Cell Volume (Å3)
Density (calc, g/cm3)
Ionic radius (6-coord. HS, pm)16,19
TiO* 63.90 4.204 74.23 5.711 100 V0.9O*20 61.85 4.1121 69.53 5.91 93 MnO 70.937 4.446 87.88 5.365 97 FeO 71.848 4.3108 80.11 5.956 92 rs-CoO 74.93 4.2612 77.37 6.433 88.5 NiO 74.703 4.1769 72.43 6.850 83 “rs-ZnO”21 81.39 4.272 77.96 6.93 88 “rs-ZnO”22 81.39 4.203 74.25 7.273 88 MgO 40.312 4.211 74.67 3.585 86 CaO 56.079 4.1684 111.32 3.346 114 CdO 128.41 4.6953 103.51 8.24 109 PdO 122.40 5.65 180.36 4.508 100 PtO 211.09 5.15 136.59 10.265 94 * = Both M and O vacancies unavoidable; are not stoichiometric oxides “rs-ZnO” parameters are generated from samples that were under high pressures, grown epitaxially or derived computationally; no standard temperature and pressure values exist
Zinc oxide, ZnO, proves to be a special case. It is found in nature as the
mineral zincite, which has the wurtzite crystal structure. Both zinc blende and
rock salt polymorphs exist, with the zinc blende form being the only one that has
been found to be stable at standard temperature and pressure. W-ZnO is a
semiconductor with a 3.4 eV band gap that has shown many different properties,
such as photoluminescence, photoconduction, piezoelectricity, and has been
investigated for use many different devices in both the bulk and at the nanoscale,
such as: nanowire lasers, field effect transistors, chemical sensing,.23-34 Cobaltous
oxide (CoO) is the only other naturally occurring transition metal oxide that
displays a similar structure transition, being most stable in the rock salt phase but

9
also existing in wurtzite and zinc blende forms. Some crystallographic data for
both indexed and hypothetical wurtzite oxides are shown in Table 1.2.
Table 1.2. Crystallographic data for binary oxides with the wurtzite structure
Chemical Formula
Formula Weight
a (Å) c (Å) Unit Cell Volume (Å3)
Density (g/cm3)
Ionic radius (4-coord., pm)16,19
BeO2 25.012 2.6984 4.277 26.970 3.080 41 MgO35(H) 40.312 3.169 5.175 71 MnO36 (H) 70.937 3.284 5.178 48.36 4.871 80 w-CoO37 74.93 3.2440 5.2030 46.76 5.322 72 w-ZnO2 81.38 3.250 5.207 47.62 5.675 74 CdO35(H) 128.41 3.660 5.856 92 (H) denotes a hypothetical phase that has been derived computationally
Aa
1.3 Synthetic Methods at the Nanoscale
Just as there are a large number of metal oxides that exist, both single-
metal and mixed-metal, there are also a number of methods exist for making them
at the nanoscale. Solution-phase synthetic methods with “bottom-up” and “soft
chemical” processes the most common type, such as the sol, sol-gel, micelle,
hydrothermal, and solvothermal methods – with the distinctions between each
term not necessarily being well defined. Generally, each of these involves a
molecular metal precursor reacting to begin polymerization and formation of
metal µ-oxo (M-O-M) bridges that create a “sol,” or colloidal suspension, that
serves as an intermediate to the solid crystalline oxide material. The primary
differences arise in the precursors used and the process that initiates M-O-M
bridge formation, which can be dependent on the precursor. Inorganic metal salts
and metal alkoxides are prone to hydrolysis, which lend them to sol, sol-gel,

10
micelle and hydrothermal routes to metal oxides. These processes utilize pH,
ionic strength and, in the case of hydrothermal reactions, high temperatures and
pressures to control the growth of crystals and ensure particle uniformity and the
constraint of particle size. Metal carboxylates and alkoxides can be used in the
nonhydrolytic sol-gel and the solvothermal routes, which utilize hydroxylation
and aprotic condensation reactions in the presence of high-boiling coordinating
solvents to form oxo bridges and control the growth of crystal faces.5,7,8,15,38-41
Table 1.3 contains some example metal oxide nanomaterials that have
been synthesized using some of the various methods mentioned above. In this
chart, the methods listed are: hydrolytic sol-gel (HSG), nonhydrolytic sol-gel
(NSG), hydrothermal (HT) and solvothermal (ST). Surfactants are:
trioctylphosphine oxide (TOPO), oleylamine (Oam), tri-N-octylamine (TOA),
oleic acid (OA) and sodium acetate (NaOAc). Solvents are 1-octadecene (ODE)
and oleylamine (OE).

11
Table 1.3. Single-metal oxides synthesized at the nanoscale8
Material Precursor Surfactant Solvent Method TiO2 Ti(OiPr)4,Ti(OnBu)4
TiCl4, Ti(OiPr)4 Me4NOH TOPO
H2O, iPrOH heptadecane
HSG42,43 NSG44
ZrO2 Zr(OiPr)4, ZrCl4 TOPO NSG45 Cu2O Cu(acac)2
Cu(OAc)2 OAm TOA, OA
ST ST
MnO Mn(HCOO)2 Mn(OAc)2
Mn(acac)2
Mn2(CO)10
TOA, OA TOA, OA OAm, H2O OAm, TOP
ST46,47 ST ST ST
Mn3O4 Mn(HCOO)2 OAm ST α-Fe2O3 FeCl3·6H2O NaCl, NaOAc H2O HT48 γ-Fe2O3 FeCl3·6H2O
Fe(CO)5 OA OA
ODE OE
ST ST49
Co3O4 Co(NO3)2· 6H2O,C6H13OH
- octanol ST
1.4 Thesis Topic: Cobalt-Manganese Oxides
The Whitmire lab has explored the synthesis and applications of
anisotropic MnO, FeO and mixed Fe1-xMnxO nanoparticles.47 Based on our
discoveries and considering the possible applications of other mixed oxides, we
have turned to the manganese-cobalt oxide system. These materials in particular
have been examined for their uses in catalysts,50,51 lithium-ion battery
electrodes,52-56 supercapacitors57-60 and for their interesting magnetic properties.
Of primary interest for lithium-ion batteries are the spinel-type oxides, i.e. Mn3O4,
LiMnO2, Co3O4, LiCoO2 and solid solutions thereof.61-66 At the nanoscale the
rock salt phases of MnO and CoO (cubic crystal lattice, space group ) are
much more stable than in the bulk minerals and may be synthesized very easily.
We have shown that they may be partially oxidized to the spinel forms without
loss of nanoparticle morphology.67,68
Fm3m

12
Manganese and cobalt have also been probed as dopants for ZnO due to
the doped material’s potential for high-temperature ferromagnetism and its
semiconducting properties.69 These unique and interesting properties were tied to
the wurtzite structure (hexagonal crystal lattice, space group P63mc). As
discussed, ZnO is not alone in having the wurtzite structure among the binary
oxides, however. Wurtzite-type CoO (w-CoO) and zinc blende-type CoO (zb-
CoO) were first reported in 196270 and have since been studied experimentally
and theoretically for similar applications.37,71-77 The two forms were always found
together when originally synthesized (by thermal decomposition of cobalt (II)
acetate tetrahydrate) but more recent reports have shown that solution synthetic
processes will preferentially select for w-CoO, especially at the nanoscale and in
thin films. This has led to samples being of much higher purity than those
synthesized using bulk methods. Additionally, theoretical studies have been done
on a hypothetical wurtzite-type MnO to determine the effect of Mn2+ substitution
on the magnetic and electronic properties of the wurtzite structure.36 There have
been only a few of reports of rock salt-type mixed cobalt-manganese oxide in the
literature, and those materials were synthesized via electrodeposition.78-80
We report herein the synthesis of rock salt-type Co1-xMnxO and the
metastable phase wurtzite-type Co1-xMnxO (rs-Co1-xMnxO and w-Co1-xMnxO)
using a mixture of tri-N-octylamine and oleic acid. By controlling reaction
variables closely, a wide variety of nanoparticle sizes, morphologies and
stoichiometries can be formed.

13
Chapter 2. Experimental
2.1 Materials
Tri-n-octylamine (TOA; 98%), oleic acid (OA; 90%), manganese (II)
formate hydrate (Mn(HCOO)2⋅xH2O) and cobalt (II) acetate tetrahydrate
(Co(OAc)2⋅4H2O) were purchased from Sigma Aldrich Chemical Company.
TOA and Mn(HCOO)2 ⋅ xH2O were dried separately under vacuum at 110°C for
four hours before use and stored under argon. OA was dried under vacuum at
110°C for four hours then distilled under vacuum and stored under argon in the
dark. Co(OAc)2⋅4H2O was dried immediately before use under vacuum for two
hours at 160°C, accompanied by a color change from pink to purple. The
temperature needed to completely dehydrate Co(OAc)2⋅4H2O has been reported to
be 150°C. HPLRS-grade H2O was purchased from EMD Chemicals, Inc.; it was
stored in a Schlenk flask and degassed by bubbling with argon for 15 minutes
with stirring. After degassing and in between uses the water was stored under
argon. Surfactants (TOA and OA) were added to the reaction flask using
disposable plastic syringes; water was added using a VWR 20-1000 µL
micropippetor.

14
2.2 Procedure for Synthesis of Co1-xMnxO nanoparticles
All reactions were carried out under an inert argon atmosphere
using standard Schlenk techniques. In a typical reaction, Co(OAc)2⋅4H2O was
initially dried in a 100 mL 3-neck round bottom flask with attached reflux
condenser and outlet to a bubbler (see Figure x below). The anhydrous
Mn(HCOO)2,TOA and OA were then added to the flask along with a magnetic
stir bar. The solution temperature was measured by insertion of a steel-jacketed
electronic thermocouple (Fisher Scientific Traceable Thermometer) through a
septum on one neck of the flask. The septum/thermocouple interface was
wrapped in several layers of parafilm to prevent gas leaking into or out of the
system. The solution was then rapidly heated (>20°C/min) with a heating mantle
until decomposition occurred, which was marked by the solution changing color
from its original purple. Consideration was made for the quality and durability of
the heating mantle used, as some nanoparticles would not be formed if the heating
mantle could not achieve the decomposition temperature, sometimes in excess of
380°C, for the required time. The solution temperature was held within 10°C of
the decomposition point until nanoparticle growth was halted by removal of the
heating mantle, with the solution color further changing based on the size,
composition and crystal lattice of the particles being formed. Typically, wurtzite-
type nanoparticles of Co1-xMnxO resulted in a dark green solution that did not
vary in color during growth. This color has been reported for pure w-CoO37,70,71
and some Mn-doped w-ZnO materials.1 Different starting ratios of Co and Mn

precursors led to several different colors of rock salt
nanoparticles – majority cobalt samples were yellow, majority manganese
samples were pale green and balanced samples were green
minutes of cooldown, ethanol was added to ensure that growth was fully halted.
Samples were recovered by centr
hexane supernatant was not clear and colorless, an equal volume of ethanol was
added to it and it was centrifuged separately to precipitate nanoparticles.
Figure 2.1. Reaction setup for nanoparticle synthesis
precursors led to several different colors of rock salt-type Co
majority cobalt samples were yellow, majority manganese
samples were pale green and balanced samples were green-gray. After two
minutes of cooldown, ethanol was added to ensure that growth was fully halted.
Samples were recovered by centrifugation then washed twice in hexanes. If the
hexane supernatant was not clear and colorless, an equal volume of ethanol was
added to it and it was centrifuged separately to precipitate nanoparticles.
Reaction setup for nanoparticle synthesis
15
type Co1-xMnxO
majority cobalt samples were yellow, majority manganese
gray. After two
minutes of cooldown, ethanol was added to ensure that growth was fully halted.
ifugation then washed twice in hexanes. If the
hexane supernatant was not clear and colorless, an equal volume of ethanol was
added to it and it was centrifuged separately to precipitate nanoparticles.
16
2.3 Analysis of Nanoparticles
2.3.1 X-ray powder diffraction (XRD)
X-ray powder diffraction (XRD) experiments were performed using a
Rigaku D/Max Ultima II instrument at 40 kV and 40 mA with unfiltered Cu Kα
radiation (λ = 1.5406 Å). Typical spectral width (resolution) was 0.02 degrees,
with scan times ranging from 8 degrees/minutes to 0.2 degrees/minute based on
the amount of sample and its crystallinity. Samples were prepared by drying the
centrifugation product in air overnight, then grinding the powder in a mortar and
pestle. Samples were deposited on a glass slide for analysis. The resulting XRD
patterns were analyzed using MDI JADE 9 and its functions, including peak
finding/fitting, whole-pattern fitting and unit cell refinement.
2.3.2 Transmission electron microscope (TEM)
Transmission electron microscope (TEM) analysis was performed at Rice
using JEOL 2010 and 1230 electron microscopes operating at 100 kV and 80 kV,
respectively. Dark field transmission electron microscopy, high-resolution
transmission electron microscope (HR-TEM) and selected area electron
diffraction (SAED) experiments were performed by Dr. Irene Rusakova at the
University of Houston on a JEOL operating at 200 kV. Samples were dispersed
in THF and drop-cast onto 400 mesh copper-supported carbon film grids for low-
resolution bright field TEM imaging.

17
2.3.3 Inductively Coupled Plasma Optical Emission Spectroscopy (ICP-OES)
Inductively Coupled Plasma Optical Emission Spectroscopy (ICP-OES)
analysis was done on a Perkin Elmer Inductively Coupled Plasma Optical
Emission Spectrometer. Standard solutions of manganese, cobalt, iron and nickel
were acquired from Sigma Aldrich Chemical Company. Iron and nickel were
included to determine if leeching of metal ions from the thermocouple probe into
nanoparticles occurred; in no cases was this discovered. ICP samples were
prepared by digesting the dried nanoparticle powder in 70% nitric acid, then
diluting to make 5% by weight nitric acid solutions.

Chapter 3. Results
3.1 Crystal Lattice Determination
Initial reactions used the following conditions: 6
mL (6.3 mmol) OA, 249 mg (1 mmol) Co(OAc)
Mn(HCOO)2 and 2 minutes of growth time after nanoparticle formation. The
polycrystalline XRD pattern for the product of this reaction, shown in Figure 2.2,
corresponded to a face
parameter a = 4.36 Å.
Figure 3.1. Example XRD pattern for polycrystalline rsnanoparticles. Lattice indices markedReference peak positions for MnO (shown in green and red respectively.
Results
Crystal Lattice Determination
Initial reactions used the following conditions: 6 mL (13.7 mmol) TOA, 2
(6.3 mmol) OA, 249 mg (1 mmol) Co(OAc)2 ⋅ 4H2O, 145 mg (1 mmol)
and 2 minutes of growth time after nanoparticle formation. The
polycrystalline XRD pattern for the product of this reaction, shown in Figure 2.2,
corresponded to a face-centered cubic lattice with space group
.
Example XRD pattern for polycrystalline rs-Co1-xMnx
attice indices marked are marked above each peakReference peak positions for MnO (a = 4.44 Å) and rs-CoO (a = 4.26 Å) are shown in green and red respectively.
m3Fm
18
(13.7 mmol) TOA, 2
O, 145 mg (1 mmol)
and 2 minutes of growth time after nanoparticle formation. The
polycrystalline XRD pattern for the product of this reaction, shown in Figure 2.2,
and lattice
xO are marked above each peak.
= 4.26 Å) are
m

Figure 3.2. (a) Co1-xMnSAED pattern from the sample shown in Figure by Dr. Irene Rusakova at the University of Houston.
3.2 Issues with reproducibility of synthesis
Further attempts to explore the Co
success. Several issues arose that resulted in the failure of reactions to produce
nanoparticles. Examples included: (1) the reaction solution turning clear and
colorless, with a shiny gray material precipitating; (2) formation of more than one
oxide phase; and (3) inconsistent heating by the heating mantle. The issue of
heating was addressed by
fluctuations in its output, especially at temperatures above 330°C, the typical
nanoparticle formation temperature range. The gray precipitate was identified by
XRD as a mixture of metallic cobalt phases
present on some occasions when the reaction appeared to have given the desired
oxide nanoparticles (Figure 2.5). The presence of multiple oxide phases was
indicated by the presence of severe peak broadening or overlapp
shown in Figure 2.6.
MnxO nanoparticles and (b) the indexed polycrystalline SAED pattern from the sample shown in Figure 3.1. Both images were taken
. Irene Rusakova at the University of Houston.
Issues with reproducibility of synthesis
Further attempts to explore the Co1-xMnxO system were met with limited
success. Several issues arose that resulted in the failure of reactions to produce
icles. Examples included: (1) the reaction solution turning clear and
colorless, with a shiny gray material precipitating; (2) formation of more than one
oxide phase; and (3) inconsistent heating by the heating mantle. The issue of
heating was addressed by ensuring the mantle used was fresh and did not have
fluctuations in its output, especially at temperatures above 330°C, the typical
nanoparticle formation temperature range. The gray precipitate was identified by
XRD as a mixture of metallic cobalt phases (see Figure 2.4) and was found to be
present on some occasions when the reaction appeared to have given the desired
oxide nanoparticles (Figure 2.5). The presence of multiple oxide phases was
indicated by the presence of severe peak broadening or overlapping peaks, as
hown in Figure 2.6.
19
O nanoparticles and (b) the indexed polycrystalline
Both images were taken
O system were met with limited
success. Several issues arose that resulted in the failure of reactions to produce
icles. Examples included: (1) the reaction solution turning clear and
colorless, with a shiny gray material precipitating; (2) formation of more than one
oxide phase; and (3) inconsistent heating by the heating mantle. The issue of
ensuring the mantle used was fresh and did not have
fluctuations in its output, especially at temperatures above 330°C, the typical
nanoparticle formation temperature range. The gray precipitate was identified by
(see Figure 2.4) and was found to be
present on some occasions when the reaction appeared to have given the desired
oxide nanoparticles (Figure 2.5). The presence of multiple oxide phases was
ing peaks, as

Figure 3.3. XRD pattern of metallic cobalt resulting from synthesis. Cubic close pack and hexagonal close pack lattice cobalt phases (PDF#00-015-0806 and PDF#04and blue respectively.
Figure 3.4. XRD pattern of mixture of cubic and hexagonal phases). Oxide peaks ametallic cobalt peaks are orange and blue respectively.
XRD pattern of metallic cobalt resulting from failed nanoparticle Cubic close pack and hexagonal close pack lattice cobalt phases
0806 and PDF#04-002-1029) are shown as reference in orange and blue respectively.
XRD pattern of mixture of rs-Co1-xMnxO and metallic cobalt cubic and hexagonal phases). Oxide peaks are marked in green; ccp and hcp metallic cobalt peaks are orange and blue respectively.
20
failed nanoparticle Cubic close pack and hexagonal close pack lattice cobalt phases
are shown as reference in orange and blue respectively.
O and metallic cobalt re marked in green; ccp and hcp

Figure 3.5. XRD pattern of a mixture of multiple rock saltphases. Reference phases with lattice constant shown in green and purple respectively.
The problem of reproducing nanoparticle syntheses was determined to be
linked to the quality of OA used in the reaction. Initially, the TOA and OA used
was dried under vacuum at 110°C for 4 hours. Both of these sol
and colorless when first received. After some time (at least one month) however,
the OA gained a yellow tint. Attempts to re
yellow coloration. Further inspection of the literature concerning OA revealed a
quality of OA that had been neglected in the original experiments: upon exposure
to oxygen, light or a combinatio
functionality. This may lead to the formation of peroxides and secondary
alcohols in the case of oxygen and a bis
signaled by a color change to yellow and then on to b
XRD pattern of a mixture of multiple rock salt-structure oxide phases. Reference phases with lattice constant a = 4.403 Å and 4.326 Å are shown in green and purple respectively.
The problem of reproducing nanoparticle syntheses was determined to be
d to the quality of OA used in the reaction. Initially, the TOA and OA used
was dried under vacuum at 110°C for 4 hours. Both of these sol-vents were clear
and colorless when first received. After some time (at least one month) however,
yellow tint. Attempts to re-dry the OA failed to remove the
yellow coloration. Further inspection of the literature concerning OA revealed a
quality of OA that had been neglected in the original experiments: upon exposure
to oxygen, light or a combination of the two, OA reacts at the central alkene
functionality. This may lead to the formation of peroxides and secondary
alcohols in the case of oxygen and a bis-OA dimer in the case of light; each being
signaled by a color change to yellow and then on to brown.81-85
21
structure oxide
= 4.403 Å and 4.326 Å are
The problem of reproducing nanoparticle syntheses was determined to be
d to the quality of OA used in the reaction. Initially, the TOA and OA used
vents were clear
and colorless when first received. After some time (at least one month) however,
dry the OA failed to remove the
yellow coloration. Further inspection of the literature concerning OA revealed a
quality of OA that had been neglected in the original experiments: upon exposure
n of the two, OA reacts at the central alkene
functionality. This may lead to the formation of peroxides and secondary
OA dimer in the case of light; each being

22
The separation of pristine OA from its degradation byproducts was
achieved by careful vacuum distillation of the mixture at 10-2 torr. First, the OA
was placed into a 250 mL Schlenk flask with a magnetic stir bar and dried for 2 h
at 110°C. The setup for the distillation is shown in Figure 3.6. Due to OA’s
extremely high boiling point (360°C at 760 torr, ~270°C at 10-2 torr) and low
volatility all glassware except for the receiving flask was wrapped tightly with
aluminum foil to ensure continuous mass transfer. The rate of transfer was
constrained to approximately 1 drop/sec; the entire process of distilling 150 mL
OA took, on average, four hours. To prevent the OA from becoming
contaminated again, the flask of OA was stored in a cabinet in the dark, under
argon gas, only being exposed to light for at most five minutes per day. After
taking these precautions, nanoparticle synthesis reactions saw a significant
reduction in the rate of reaction failure due to the production of metallic cobalt. A
similar separation was performed with TOA, but no deter-minable effect on
reaction results was found.
23
Figure 3.6. Glassware setup for distillation of OA. Not shown: aluminum foil wrapping.
These observations indicated that OA played a significant role in ensuring
that nanoparticle syntheses gave the desired oxide product(s). Additionally, it
became evident that the reproducibility of reaction products was a concern. To
guarantee the reproducibility of results, each reaction condition was performed at
least twice. Reaction parameters explored were: the ratio of TOA to OA in the
reaction solution, the ratio of Co(OAc)2 to Mn(HCOO)2, the presence of water,
the ratio of molecular precursors to OA and growth time (within 10°C of the
solution color change temperature). As noted above, the control reaction
contained 6 mL TOA, 2 mL OA, 1 mmol each of Co(OAc)2 and Mn(HCOO)2, no
water and allowed two minutes of growth after nanoparticle formation. All
potential reaction variables were held constant between reactions while changing
the variable of interest.
250 ml Schlenkflask
to vacuum
250 ml Schlenkflask
heating mantle
stir plate

24
3.3 Effect of altering Co:Mn precursor ratio
3.3.1 Crystal lattice
The first variable investigated was the starting molar ratio of cobalt and
manganese precursors. These experiments were performed with a constant total
molar amount of metal precursor equal to 2 mmol. Reactions were done in 6 mL
TOA, 2 mL OA, with no water present and 2 minutes of nanoparticle growth time
after the solution color change. Seven different reaction conditions were
explored: 1:9 Co:Mn, 1:5 Co:Mn, 1:2 Co:Mn, 1:1 Co:Mn, 2:1 Co:Mn, 5:1 Co:Mn
and 9:1 Co:Mn. Example XRD patterns of four samples with a variety of cobalt-
to-manganese content ratios are shown in Figure 3.7. All of these reactions gave
products that had rock salt-type face-centered cubic crystal lattices (rs-
Co1-xMnxO).
Using JADE 9, XRD peaks and patterns of cubic-lattice products were
fitted to Gaussian curves and used to refine unit cell data. Both peak positions
and unit cell volumes were plotted against the Co fraction of the oxide, taken
from ICP-OES. In the cases where metallic cobalt was present in the XRD
pattern, whole-pattern fitting (WPF) refinement was utilized to determine the
amount of cobalt in the oxide phase and correct the elemental analysis. The (220)
peak was chosen as the indicator for the peak position graph due to its moderate-
to-high intensity and the fact that it shifts position the most based on changing
unit cell parameters. Attempts to determine lattice constants for hexagonal lattice
products were frustrated by low crystallinity and small crystallite sizes, which
caused most diffraction patterns to have poor signal to noise ratios and very broad

25
peaks. An example peak fitting report is shown in Table 3.1 with the unit cell
calculated from the sample shown in Figure 3.2. Note that the while the peak
positions are proportional to the relative amounts of cobalt and manganese in the
sample, there is some variance between samples. This can be seen in Figure 3.8,
which shows data correlating the (220) peak position as found in JADE and
sample cobalt content as derived from ICP-OES measurements. As mentioned
above, unit cell parameters were calculated in JADE via peak data. Unit cell
volumes determined in this manner were compared to cobalt content, as shown in
Table 3.2 to Table 3.5 and Figure 3.9. Additionally, while the ratio of cobalt and
manganese molecular precursors does significantly influence the ratio of cobalt
and manganese in the final oxide product, the starting and final ratios are not
necessarily equal.
Table 3.1 Example of a cell refinement report for an XRD pattern using JADE 9 software.
Cell Type = Cubic, Fm-3m (225) Initial Cell = 4.3 x 4.3 x 4.3 <90.0 x 90.0 x 90.0> Refined Cell = 4.356223(0.000663) � Vol= 82.67 �3, Density(c)= (Chemical Formula =(Unknown), Z=4.0) Two-Theta Error Window = 0.3(deg), Zero Offset = 0.0(deg), Displacement = 0.0(deg) ESD of Fit = 0.0697°, |Delta 2-Theta| = 0.05406°, |Delta d| = 0.00235(Å), F(5) = 18.5(5) (hkl) 2T(cal) 2T(cor) 2T(obs) Delta d(cal) d(cor) d(obs) Del-d I% (111) 35.669 35.574 35.574 0.095 2.5151 2.5216 2.5216 0.0065 60.9 (200) 41.422 41.348 41.348 0.073 2.1781 2.1818 2.1818 0.0037 100.0 (220) 60.019 60.002 60.002 0.016 1.5402 1.5405 1.5405 0.0004 73.3 (311) 71.813 71.833 71.833 -0.019 1.3135 1.3131 1.3131 0.0003 28.0 (222) 75.547 75.481 75.481 0.066 1.2575 1.2585 1.2585 0.0009 9.3
a

26
Tab
le 3
.2. X
RD
dat
a fr
om J
AD
E a
nd I
CP
-OE
S el
emen
tal a
naly
sis
of s
ampl
es.
Sam
ple
Uni
t cel
l vo
lum
e, Å
3 (2
20) p
eak
posi
tion,
deg
rees
(2
20) p
eak
erro
r C
o fr
actio
n fr
om IC
P C
o fr
actio
n er
ror
Mn
frac
tion
from
ICP
Mn
frac
tion
erro
r SR
W-4
-7
85.5
9 59
.156
0.
028
0.18
0.
0038
0.
82
0.00
18
SRW
-4-8
85
.76
59.1
87
0.00
7 0.
18
0.00
24
0.82
0.
0088
SR
w-4
-13
79.2
8 60
.854
0.
045
0.75
0.
0192
0.
25
0.00
16
SRW
-4-1
4 79
.78
60.8
10
0.04
4 0.
64
0.01
28
0.36
0.
0015
SR
W-4
-24
86.2
1 59
.230
0.
019
0.21
0.
0346
0.
79
0.00
25
SRW
-4-2
7 78
.26
61.2
62
0.01
0 0.
95
0.01
20
0.05
0.
0010
SR
W-4
-28
78.0
4 61
.313
0.
003
0.93
0.
0123
0.
07
0.00
13
SRW
-4-3
2 79
.74
60.8
54
0.00
8 0.
75
0.01
52
0.25
0.
0012
SR
W-4
-33
85.5
7 59
.257
0.
006
0.17
0.
0035
0.
83
0.00
23
SRW
-4-3
4 84
.53
59.5
27
0.01
0 0.
25
0.00
25
0.75
0.
0035
SR
W-4
-36
82.3
7 60
.076
0.
013
0.44
0.
0074
0.
56
0.00
45
SRW
-4-3
8 81
.34
60.4
39
0.01
2 0.
57
0.01
15
0.43
0.
0012
SR
W-4
-40
82.8
0 59
.866
0.
021
0.38
0.
0069
0.
62
0.00
28
SRW
-4-4
1 83
.17
59.8
93
0.01
3 0.
45
0.01
25
0.55
0.
0037
SR
W-4
-43
80.7
3 60
.484
0.
018
0.55
0.
0083
0.
45
0.00
21
SRW
-4-4
7 78
.27
61.2
40
0.01
1 0.
83
0.01
08
0.17
0.
0007
SR
W-4
-49
78.2
1 61
.198
0.
015
0.82
0.
0986
0.
18
0.01
89
SRW
-4-1
80
79.6
7 60
.875
0.
009
0.81
0.
0154
0.
19
0.00
45
SRW
-4-1
91
83.3
0 59
.827
0.
017
0.41
0.
0072
0.
59
0.00
16
SRW
-4-1
93
78.6
0 61
.145
0.
004
0.91
0.
0178
0.
09
0.00
14
a

27
Tab
le 3
.3. X
RD
dat
a fr
om J
AD
E a
nd I
CP
-OE
S el
emen
tal a
naly
sis
of s
ampl
es, c
onti
nued
.
Sam
ple
Uni
t cel
l vo
lum
e, Å
3 (2
20) p
eak
posi
tion,
de
gree
s (2
20) p
eak
erro
r C
o fr
actio
n fr
om IC
P C
o fr
actio
n er
ror
Mn
frac
tion
from
ICP
Mn
frac
tion
erro
r SR
W-5
-17
80.4
4 60
.605
0.
017
0.56
60
0.01
46
0.43
4 0.
0019
SR
W-5
-19a
82
.67
59.9
35
0.01
7 0.
5210
0.
0132
0.
479
0.00
32
SRW
-5-1
9b
79.7
3 60
.755
0.
015
0.65
60
0.00
91
0.34
4 0.
0004
SR
W-5
-21a
81
.92
60.2
92
0.04
6 0.
5092
0.
0147
0.
491
0.00
84
SRW
-5-2
1b
79.9
9 60
.789
0.
027
0.77
87
0.01
87
0.22
1 0.
0033
SR
W-5
-22a
79
.42
60.7
89
0.02
9 0.
7680
0.
0182
0.
232
0.00
42
SRW
-5-2
3a
84.1
3 59
.509
0.
024
0.33
90
0.00
87
0.66
1 0.
0036
SR
W-5
-24b
86
.32
58.9
45
0.02
3 0.
1000
0.
0025
0.
900
0.00
22
SRW
-5-2
5a
85.7
1 59
.166
0.
016
0.23
61
0.00
56
0.76
4 0.
0149
SR
W-5
-26b
78
.03
61.3
05
0.00
6 0.
9247
0.
0102
0.
075
0.00
11
SRW
-5-2
7b
80.7
9 60
.559
0.
017
0.57
80
0.00
81
0.42
2 0.
0020
SR
W-5
-28a
85
.85
59.1
47
0.01
7 0.
1006
0.
0000
0.
899
0.00
00
SRW
-5-2
8b
79.0
1 60
.976
0.
030
0.74
62
0.01
87
0.25
4 0.
0007
SR
W-5
-29a
81
.09
60.4
92
0.02
0 0.
6978
0.
0207
0.
302
0.00
11
SRW
-5-3
2a
79.3
7 60
.910
0.
011
0.68
99
0.01
22
0.31
0 0.
0186
SR
W-5
-32b
82
.19
60.1
66
0.01
3 0.
5937
0.
0104
0.
406
0.00
21
SRW
-5-3
4a
85.0
0 59
.363
0.
021
0.16
39
0.00
50
0.83
6 0.
0062
SR
W-5
-34b
82
.64
59.9
37
0.04
2 0.
4914
0.
0104
0.
509
0.01
45
SRW
-5-3
6b
79.6
7 60
.831
0.
013
0.67
03
0.01
01
0.33
0 0.
0051
SR
W-5
-37a
81
.12
60.3
90
0.01
9 0.
5340
0.
0084
0.
466
0.00
93
SRW
-5-3
7b
80.9
0 60
.480
0.
029
0.65
81
0.01
35
0.34
2 0.
0093
SR
W-5
-38a
83
.15
59.8
82
0.01
8 0.
4981
0.
0223
0.
502
0.03
93
SRW
-5-3
8b
81.2
4 60
.394
0.
013
0.59
23
0.01
40
0.40
8 0.
0269
a

28
Tab
le 3
.4. X
RD
dat
a fr
om J
AD
E a
nd I
CP
-OE
S el
emen
tal a
naly
sis
of s
ampl
es, c
onti
nued
.
Sam
ple
[Co]
, mg/
L (f
rom
ICP)
[C
o],
mM
[C
o] s
td
dev,
mg/
L
[Co]
std
dev
, m
M
[Mn]
, mg/
L (f
rom
ICP)
[M
n], m
M
[Mn]
std
de
v, m
g/L
[M
n] s
td
dev,
mM
SR
W-4
-7
0.76
6 0.
0130
0 0.
0164
0.
0002
8 3.
360
0.06
116
0.00
74
0.00
0135
SR
W-4
-8
0.68
7 0.
0116
6 0.
0091
0.
0001
5 2.
857
0.05
200
0.03
09
0.00
0562
SR
w-4
-13
7.83
7 0.
1329
8 0.
2001
0.
0034
0 2.
385
0.04
341
0.01
57
0.00
0286
SR
W-4
-14
4.99
7 0.
0847
9 0.
1005
0.
0017
1 2.
643
0.04
811
0.01
13
0.00
0206
SR
W-4
-24
2.99
2 0.
0507
7 0.
5010
0.
0085
0 10
.72
0.19
513
0.03
40
0.00
0619
SR
W-4
-27
10.0
5 0.
1705
3 0.
1260
0.
0021
4 0.
458
0.00
834
0.00
99
0.00
0180
SR
W-4
-28
10.9
2 0.
1852
9 0.
1440
0.
0024
4 0.
721
0.01
312
0.01
38
0.00
0251
SR
W-4
-32
6.89
7 0.
1170
3 0.
1396
0.
0023
7 2.
158
0.03
928
0.01
00
0.00
0182
SR
W-4
-33
1.34
2 0.
0227
7 0.
0272
0.
0004
6 5.
968
0.10
863
0.01
65
0.00
0300
SR
W-4
-34
1.95
2 0.
0331
2 0.
0196
0.
0003
3 5.
437
0.09
897
0.02
57
0.00
0468
SR
W-4
-36
5.43
6 0.
0922
4 0.
0917
0.
0015
6 6.
454
0.11
748
0.05
16
0.00
0939
SR
W-4
-38
4.64
3 0.
0787
8 0.
0970
0.
0016
5 3.
528
0.06
422
0.00
92
0.00
0167
SR
W-4
-40
2.83
2 0.
0480
5 0.
0510
0.
0008
7 4.
262
0.07
758
0.01
92
0.00
0349
SR
W-4
-41
4.21
9 0.
0715
9 0.
1180
0.
0020
0 4.
868
0.08
861
0.03
25
0.00
0592
SR
W-4
-43
6.10
3 0.
1035
6 0.
0965
0.
0016
4 5.
174
0.09
418
0.02
27
0.00
0413
SR
W-4
-47
7.59
7 0.
1289
1 0.
0993
0.
0016
8 1.
468
0.02
672
0.00
64
0.00
0116
SR
W-4
-49
7.53
7 0.
1278
9 0.
9016
0.
0153
0 1.
499
0.02
729
0.16
09
0.00
2929
SR
W-4
-180
2.
456
0.04
167
0.03
73
0.00
063
0.53
8 0.
0097
9 0.
0128
0.
0002
33
SRW
-4-1
91
5.10
5 0.
0866
2 0.
0907
0.
0015
4 6.
979
0.12
703
0.01
84
0.00
0335
SR
W-4
-193
6.
517
0.11
058
0.12
77
0.00
217
0.61
5 0.
0111
9 0.
0095
0.
0001
73
a

29
Tab
le 3
.5. X
RD
dat
a fr
om J
AD
E a
nd I
CP
-OE
S el
emen
tal a
naly
sis
of s
ampl
es, c
onti
nued
.
Sam
ple
[Co]
, mg/
L (f
rom
ICP)
[C
o], m
M
[Co]
std
dev
, m
g/L
[C
o] s
td d
ev,
mM
[M
n], m
g/L
(fro
m IC
P)
[Mn]
, mM
[M
n] s
td
dev,
mg/
L
[Mn]
std
de
v, m
M
SRW
-5-1
7 4.
133
0.07
013
0.10
63
0.00
180
2.95
4 0.
0537
7 0.
0127
0.
0002
31
SRW
-5-1
9a
4.30
8 0.
0731
0 0.
1091
0.
0018
5 3.
692
0.06
720
0.02
43
0.00
0442
SR
W-5
-19b
6.
005
0.10
190
0.08
31
0.00
141
2.93
7 0.
0534
6 0.
0031
0.
0000
56
SRW
-5-2
1a
0.45
9 0.
0077
9 0.
01
0.00
017
0.20
5 0.
0037
3 0.
0053
0.
0000
96
SRW
-5-2
1b
0.58
0 0.
0098
4 0.
0133
0.
0002
3 0.
122
0.00
222
0.00
22
0.00
0040
SR
W-5
-22a
0.
625
0.01
061
0.01
48
0.00
025
0.17
6 0.
0032
0 0.
0032
0.
0000
58
SRW
-5-2
3a
2.14
4 0.
0363
8 0.
055
0.00
093
3.90
4 0.
0710
6 0.
0212
0.
0003
86
SRW
-5-2
4b
1.10
4 0.
0187
3 0.
0278
0.
0004
7 9.
217
0.16
777
0.02
28
0.00
0415
SR
W-5
-25a
0.
261
0.00
443
0.00
62
0.00
011
0.78
7 0.
0143
3 0.
0154
0.
0002
80
SRW
-5-2
6b
6.67
9 0.
1133
3 0.
0735
0.
0012
5 0.
507
0.00
923
0.00
73
0.00
0133
SR
W-5
-27b
1.
635
0.02
774
0.02
29
0.00
039
1.11
3 0.
0202
6 0.
0054
0.
0000
98
SRW
-5-2
8a
0.39
6 0.
0067
2
0.00
000
3.30
2 0.
0601
0
0.00
0000
SR
W-5
-28b
6.
439
0.10
926
0.16
16
0.00
274
2.04
2 0.
0371
7 0.
0056
0.
0001
02
SRW
-5-2
9a
3.91
8 0.
0664
8 0.
116
0.00
197
1.58
2 0.
0288
0 0.
0060
0.
0001
09
SRW
-5-3
2a
5.44
1 0.
0923
2 0.
0963
0.
0016
3 2.
280
0.04
150
0.13
67
0.00
2488
SR
W-5
-32b
2.
169
0.03
680
0.03
8 0.
0006
4 1.
384
0.02
519
0.00
73
0.00
0133
SR
W-5
-34a
0.
657
0.01
115
0.02
01
0.00
034
3.12
5 0.
0568
8 0.
0231
0.
0004
20
SRW
-5-3
4b
1.90
9 0.
0323
9 0.
0405
0.
0006
9 1.
842
0.03
353
0.05
25
0.00
0956
SR
W-5
-36b
1.
564
0.02
654
0.02
35
0.00
040
0.71
7 0.
0130
5 0.
0110
0.
0002
00
SRW
-5-3
7a
1.25
9 0.
0213
6 0.
0199
0.
0003
4 1.
024
0.01
864
0.02
05
0.00
0373
SR
W-5
-37b
2.
919
0.04
953
0.05
97
0.00
101
1.41
4 0.
0257
4 0.
0386
0.
0007
03
SRW
-5-3
8a
0.85
6 0.
0145
2 0.
0383
0.
0006
5 0.
804
0.01
463
0.06
29
0.00
1145
SR
W-5
-38b
3.
090
0.05
243
0.07
31
0.00
124
1.98
3 0.
0361
0 0.
1310
0.
0023
85
a

30
Figure 3.7. XRD patterns for select nanoparticle samples of varying Co-Mn content as determined by ICP-OES analysis. MnO and CoO are shown in red and green respectively.

Figure 3.8. Change in (220) peak position with increasing cobalt content in sample. Sample data is in black diamonds; MnO and CoO red squares. The directa red line.
Change in (220) peak position with increasing cobalt content in sample. Sample data is in black diamonds; MnO and CoO positions are in red squares. The direct-line correlation between MnO and CoO is shown as
31
Change in (220) peak position with increasing cobalt content in
positions are in line correlation between MnO and CoO is shown as

Figure 3.9. Change in calculated unit cell volume versus cobalt content of sample. Sample data is in red squares. The direct correlation between MnO and CoO (as expected from Vegard’s Law) is shown as a red line.
Change in calculated unit cell volume versus cobalt content of sample. Sample data is in black diamonds; MnO and CoO positions are in red squares. The direct correlation between MnO and CoO (as expected from Vegard’s Law) is shown as a red line.
32
Change in calculated unit cell volume versus cobalt content of
black diamonds; MnO and CoO positions are in red squares. The direct correlation between MnO and CoO (as expected

3.3.2 Nanoparticle morphology
Nanoparticle shapes and sizes were considerably impacted by the ra
Mn:Co molecular precursors in the reaction. These reactions were done with 6
mL TOA, 2 mL OA, 2 mmol total molecular precursors, no water and with 2
minutes of growth time after decomposition of the molecular precursors. The
results are shown in Table
which a solution color
precursor increased, from 355°C at 1:9 Co:Mn precursor ratio, 365°C at 1:1
Co:Mn and 370°C at 9:1 Co:Mn.
were taken by Dr. Irene Rusakova at the Unive
Table 3.6. TEM images of nanoparticles synthesized with a 9:1 ratio of Mn:Co molecular precursors
a
morphology
Nanoparticle shapes and sizes were considerably impacted by the ra
molecular precursors in the reaction. These reactions were done with 6
OA, 2 mmol total molecular precursors, no water and with 2
minutes of growth time after decomposition of the molecular precursors. The
Table 3.6 through Table 3.12 below. The temperature at
ution color changed increased slightly as the relative amount of cobalt
precursor increased, from 355°C at 1:9 Co:Mn precursor ratio, 365°C at 1:1
C at 9:1 Co:Mn. Images marked with an asterisk in all tables
were taken by Dr. Irene Rusakova at the University of Houston.
TEM images of nanoparticles synthesized with a 9:1 ratio of Mn:Co molecular precursors
*
33
Nanoparticle shapes and sizes were considerably impacted by the ratio of
molecular precursors in the reaction. These reactions were done with 6
OA, 2 mmol total molecular precursors, no water and with 2
minutes of growth time after decomposition of the molecular precursors. The
The temperature at
as the relative amount of cobalt
precursor increased, from 355°C at 1:9 Co:Mn precursor ratio, 365°C at 1:1
Images marked with an asterisk in all tables
TEM images of nanoparticles synthesized with a 9:1 ratio of
*

Table 3.7. TEM images of nanoparticles synthesized with a Mn:Co molecular precursors
* A
TEM images of nanoparticles synthesized with a 5:1 ratio of Mn:Co molecular precursors
*
34
:1 ratio of

Table 3.8. TEM images of nanoparticles synthesized with a 2:1 ratio of Mn:Co molecular precursors
* a
M images of nanoparticles synthesized with a 2:1 ratio of Mn:Co molecular precursors
35
M images of nanoparticles synthesized with a 2:1 ratio of

Table 3.9. TEM images of nanoparticles synthesized with a 1:1 ratio of Mn:Co molecular precursors
* A
TEM images of nanoparticles synthesized with a 1:1 ratio of Mn:Co molecular precursors
*
36
TEM images of nanoparticles synthesized with a 1:1 ratio of

Table 3.10. TEM images of Mn:Co molecular precursors
* a
TEM images of nanoparticles synthesized with a 1:2 ratio of Mn:Co molecular precursors
*
*
37
nanoparticles synthesized with a 1:2 ratio of

Table 3.11. TEM images of nanoparticles synthesized with a 1:5 ratio of Mn:Co molecular precursors
* a
TEM images of nanoparticles synthesized with a 1:5 ratio of Mn:Co molecular precursors
*
38
TEM images of nanoparticles synthesized with a 1:5 ratio of

Table 3.12 TEM images of nanoparticles synthesized with a 1:9 ratio of Mn:Co molecular precursors
*
* a
TEM images of nanoparticles synthesized with a 1:9 ratio of Mn:Co molecular precursors
*
39
TEM images of nanoparticles synthesized with a 1:9 ratio of

40
3.4 Effect of varying TOA:OA volume ratio
3.4.1 Crystallinity and lattice of products
The most immediately noticeable change in the way the Co1-xMnxO
system reacts to alterations in the TOA:OA ratio is in the decomposition
/nanoparticle formation temperature. Decomposition of precursors without OA
occurred at 305°C, giving a black solution. When OA is introduced at a 7:1
TOA:OA volume ratio, the decomposition occurs at 335-340°C and is marked by
a solution color change to light blue that becomes dark yellow over the growth
time. With 6.5 mL TOA: 1.5 mL OA, decomposition occurred at 360-365°C, with
the final solution color being green-gray; the 6 mL TOA: 2 mL OA solution
turned green-gray at 365-370°C. The 5 mL TOA: 3 mL OA reaction changes
color at the highest temperature, over 370°C, and the solution turns a dark
emerald green. Attempts to use 5.5 mL TOA: 3.5 mL OA solutions did not lead
to reproducible results; 4.5 mL TOA: 3.5 mL OA solutions (and those with higher
volumes of OA) did not reproducibly lead to decomposition of molecular
precursors at temperatures up to 390°C.
All of these experimental conditions except for the 5 mL TOA: 3 mL OA
case always gave nanoparticles that could be precipitated via centrifugation in
hexanes after the initial ethanol washing. In approximately 25% of the reactions
performed with 5 mL TOA and 3 mL OA no precipitate at all was recovered upon
centrifugation in hexanes; in all cases a significant amount of material remained
in the supernatant. This was indicated by to the supernatant being so darkly

41
colored as to be opaque. This material was recovered by adding an equal volume
of ethanol to the centrifuge tube and centrifuging again.
Example XRD patterns of these products are shown in Figure 3.10 and
Figure 3.11. Nanoparticles that precipitated in hexanes for all reactions where
OA was present (Figure 3.10) always had the same face-centered cubic lattice
structure seen in earlier reactions. Nanoparticles recovered from the supernatant
(Figure 3.11), however, had a significantly different diffraction pattern. JADE 9
search-matching software identified these patterns as matching the crystal lattice
of ZnO (PDF#04-008-8199, hexagonal, P63mc, no. 186, a = 3.2648 Å, c =
5.21939 Å, Z = 2), a metal oxide with the wurtzite crystal structure. Elemental
analysis using ICP-OES indicated that no zinc was present, only manganese and
cobalt. Also, not all products had XRD patterns with identical peak positions.
Examination of the literature showed that a hexagonal-lattice form of CoO has
been reported a handful of times, and while no powder diffraction file (PDF) has
been catalogued, the calculated lattice parameters from published papers are a =
3.244 Å and c = 5.203 Å.37,70

Figure 3.10. Example powder XRD pattern for all products recovered by centrifugation in hexanes for TOA:OA ratios of 7:1 to 5:3; trace amounts of Co metal are present in some, but not all, samples
Figure 3.11. Example powder XRD pattern of nanoparticles recovered from the supernatant of reaction with 5008-8199) is shown in greenblack.
Example powder XRD pattern for all products recovered by centrifugation in hexanes for TOA:OA ratios of 7:1 to 5:3; trace amounts of Co metal are present in some, but not all, samples.
xample powder XRD pattern of nanoparticles recovered from the supernatant of reaction with 5 mL TOA and 3 mL OA. ZnO (PDF#04
8199) is shown in green; zinc blende CoO (ZB-CoO) is shown above in
42
Example powder XRD pattern for all products recovered by centrifugation in hexanes for TOA:OA ratios of 7:1 to 5:3; trace amounts of
xample powder XRD pattern of nanoparticles recovered from OA. ZnO (PDF#04-
CoO) is shown above in

Experiments performed where no OA was added to the reaction gave
results that were initially difficult to explain. An example XRD pattern of such a
reaction is shown in
hexagonal-lattice oxide (
diagram that these results became understandable. Without OA in a reaction, the
molecular precursors form their
solution desired. It is possible that some mixing occurs, as there is not a pattern
that corresponds directly to pure CoO, but there are clearly two cubi
one hexagonal-lattice materials present.
a zinc-blende polymorph in the XRD pattern.
Figure 3.12. Powder XRD pattern of the product of a reaction run in 8 mL TOA, with no OA present. Faceshown in red and blue, respectively, whereas hexagonalin green.
Experiments performed where no OA was added to the reaction gave
results that were initially difficult to explain. An example XRD pattern of such a
reaction is shown in Figure 3.12. It was only after the realization that a
lattice oxide (w-Co1-xMnxO) was also part of the Co1-x
diagram that these results became understandable. Without OA in a reaction, the
molecular precursors form their individual oxides, without forming the solid
solution desired. It is possible that some mixing occurs, as there is not a pattern
that corresponds directly to pure CoO, but there are clearly two cubi
lattice materials present. There is no indication of the presence of
blende polymorph in the XRD pattern.
Powder XRD pattern of the product of a reaction run in 8 mL TOA, with no OA present. Face-centered cubic-lattice MnO and CoO are shown in red and blue, respectively, whereas hexagonal-lattice ZnO is shown
43
Experiments performed where no OA was added to the reaction gave
results that were initially difficult to explain. An example XRD pattern of such a
. It was only after the realization that a
xMnxO phase
diagram that these results became understandable. Without OA in a reaction, the
individual oxides, without forming the solid
solution desired. It is possible that some mixing occurs, as there is not a pattern
that corresponds directly to pure CoO, but there are clearly two cubic-lattice and
here is no indication of the presence of
Powder XRD pattern of the product of a reaction run in 8 mL ttice MnO and CoO are
lattice ZnO is shown

Figure 3.13. HR-TEM images and SAED patterns of cubic lattice and hexagonal lattice nanoparticles. The sample in (a) was synthesized in 6TOA: 2 mL OA; the SAED pattern in (b) indexes to a single cubic phase Fm m (225), a = 4.3 Å. The sample in (c) is from the supernatant of the 5mL TOA: 3 mL OA reaction; the SAED pattern in (d) hexagonal phase P63
3.4.2 Nanoparticle size and
Several TEM images of each reaction condition are shown in
3.13 through Table
Co(OAc)2, 1 mmol Mn(HCOO)
after decomposition of the molecular precursors. Images marked with an
asterisk (*) were obtained by Dr. Irene Rusakova at the University
Houston.
TEM images and SAED patterns of cubic lattice and nanoparticles. The sample in (a) was synthesized in 6
OA; the SAED pattern in (b) indexes to a single cubic phase = 4.3 Å. The sample in (c) is from the supernatant of the 5
OA reaction; the SAED pattern in (d) indexes to a single 3mc (186), a = 3.3 Å and c = 5.2 Å.
size and morphology
Several TEM images of each reaction condition are shown in
Table 3.17 below. These reactions were done with 1 mmol
, 1 mmol Mn(HCOO)2, no water and with 2 minutes of growth time
position of the molecular precursors. Images marked with an
asterisk (*) were obtained by Dr. Irene Rusakova at the University
44
TEM images and SAED patterns of cubic lattice and nanoparticles. The sample in (a) was synthesized in 6 mL
OA; the SAED pattern in (b) indexes to a single cubic phase = 4.3 Å. The sample in (c) is from the supernatant of the 5
indexes to a single
Several TEM images of each reaction condition are shown in Table
below. These reactions were done with 1 mmol
utes of growth time
position of the molecular precursors. Images marked with an
asterisk (*) were obtained by Dr. Irene Rusakova at the University of

Table 3.13. TEM images of nanoparticles synthesized in 8 mL TOA and 0 mL OA
* a
TEM images of nanoparticles synthesized in 8 mL TOA and 0
*
*
45
TEM images of nanoparticles synthesized in 8 mL TOA and 0

Table 3.14. TEM images of nanoparticles mL OA
* a
TEM images of nanoparticles synthesized in 7 mL TOA and 1
*
46
synthesized in 7 mL TOA and 1

Table 3.15. TEM images of nanoparticles synthesized in 6.5 mL TOA and 1.5 mL
* a
TEM images of nanoparticles synthesized in 6.5 mL TOA and 1.5
*
*
47
TEM images of nanoparticles synthesized in 6.5 mL TOA and 1.5

Table 3.16. TEM images of nanoparticles synthesized in 5 mL TOA and 3 mL OA– supernatant from centrifugation in hexanes (w
*
* A
TEM images of nanoparticles synthesized in 5 mL TOA and 3 supernatant from centrifugation in hexanes (w-Co1-xMn
*
48
TEM images of nanoparticles synthesized in 5 mL TOA and 3 MnxO)

Table 3.17. TEM images of nanoparticles synthesized in 5 mL TOA and 3 mL OA – precipitate from centrifugation in hexanes (rs
*
* a
TEM images of nanoparticles synthesized in 5 mL TOA and 3 precipitate from centrifugation in hexanes (rs-Co1-xMnx
*
49
TEM images of nanoparticles synthesized in 5 mL TOA and 3 xO)

50
3.5 Effect of Adding H2O to Reaction Solution
After investigating how altering the ratios of surfactants and metal
precursors affected nanoparticle products, the next variable examined was the
presence of water in the reaction solution. In these cases degassed HPLC-grade
water was added to the solution immediately after drying the metal precursors and
adding the surfactants TOA and OA. These reactions were done with 1 mmol of
each metal precursor, 6 mL TOA, 2 mL OA and 2 minutes of growth after
nanoparticle formation began. The volumes of water added were rounded to the
nearest mmol of water, with a minimum of 20 µL (1.11 mmol, Table 3.18) due to
the limitation of the micropipette used. Other amounts investigated were 2, 3 and
4 mmol H2O, shown in Tables 3.19, 3.20 and 3.21. The former were achieved by
adding 36 µL H2O and 54 µL H2O respectively; the latter by not drying the cobalt
precursor, Co(OAc)2·4H2O. All nanoparticles formed in these reactions had the
rock salt-type face-centered cubic crystal lattice. The final Co-to-Mn ratios of the
anhydrous and 1.11 mmol H2O reactions are approximately 1:1 (Co0.49Mn0.51O),
the 2 mmol H2O reaction has a stoichiometry of Co0.58Mn0.42O,the 3 mmol H2O
reaction has a stoichiometry of Co0.75Mn0.25O and the reaction with 4 mmol H2O
has a stoichiometry of Co0.69Mn0.31O. Using reaction conditions similar to those
by which MnO hexapods47 were synthesized (6 mL TOA, 2 mL OA, 9:1 Mn:Co
precursor ratio, 100 µL added H2O) gives rise to the variety of shapes shown in
Table 3.22.

Table 3.18. TEM images of nanoparticles synthesized with 20 µL (1.11 mmol) added
* a
TEM images of nanoparticles synthesized with 20 µL (1.11
*
51
TEM images of nanoparticles synthesized with 20 µL (1.11

Table 3.19. TEM images of nanoparticles synthesized with 36 µL (2 mmol) added
* A
TEM images of nanoparticles synthesized with 36 µL (2 mmol)
*
52
TEM images of nanoparticles synthesized with 36 µL (2 mmol)
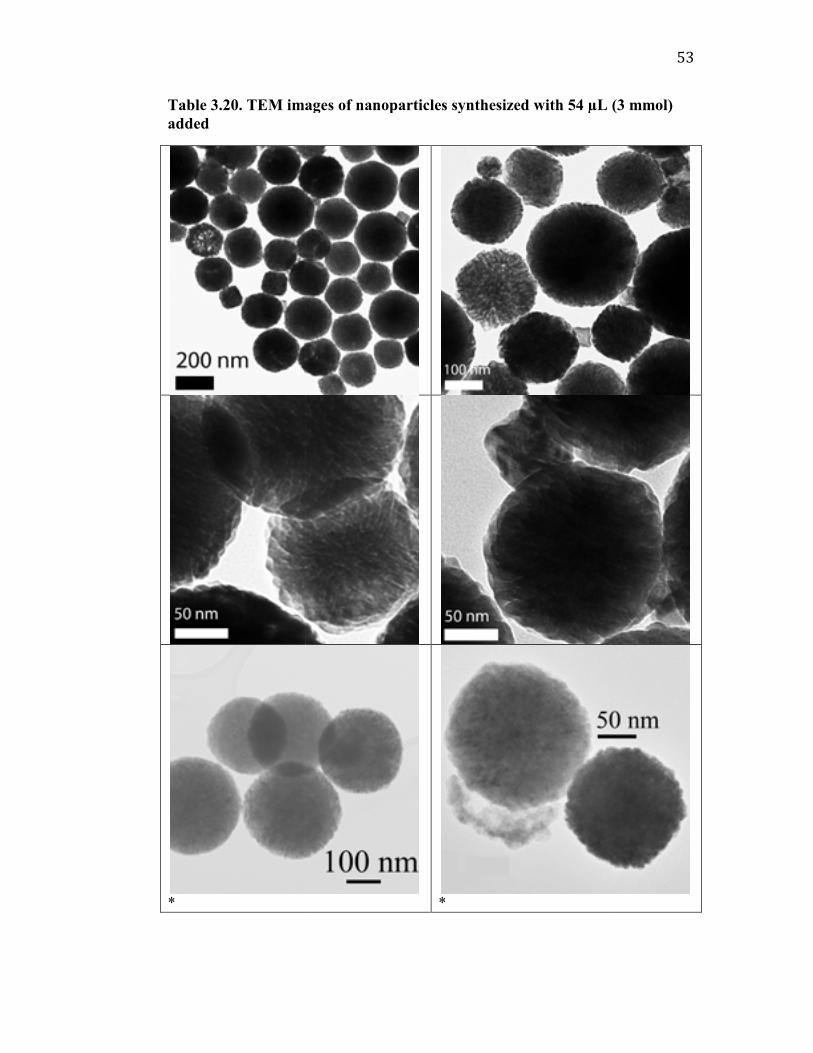
Table 3.20. TEM images of nanoparticles synthesized with 54 µL (3 mmol) added
* a
TEM images of nanoparticles synthesized with 54 µL (3 mmol)
*
53
TEM images of nanoparticles synthesized with 54 µL (3 mmol)

Table 3.21. TEM images of nanoparticles synthesized with Co(OAc)that was not dried beforehand
* a
TEM images of nanoparticles synthesized with Co(OAc)that was not dried beforehand
*
54
TEM images of nanoparticles synthesized with Co(OAc)2·4H2O
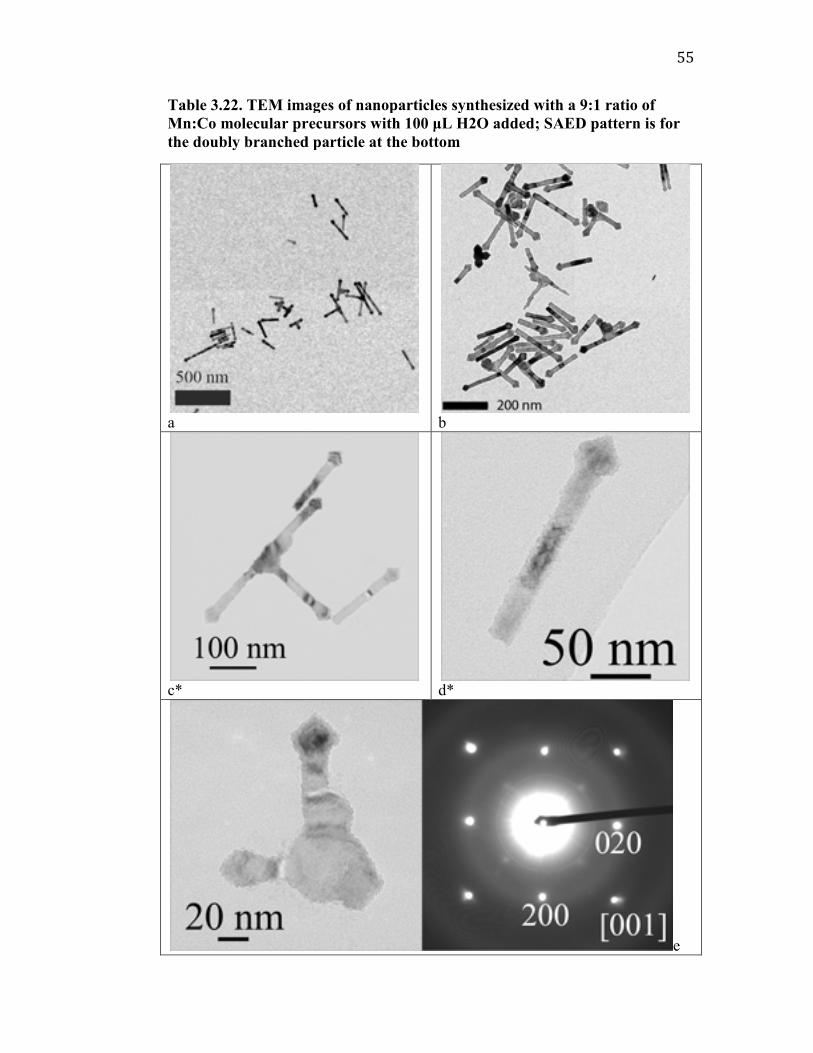
Table 3.22. TEM images of nanoparticles synthesized with a 9:1 ratio of Mn:Co molecular precursors with 100 µL H2O added; SAED pattern is for the doubly branched particle at the bottom
a
c*
TEM images of nanoparticles synthesized with a 9:1 ratio of Mn:Co molecular precursors with 100 µL H2O added; SAED pattern is for
doubly branched particle at the bottom
b
d*
55
TEM images of nanoparticles synthesized with a 9:1 ratio of Mn:Co molecular precursors with 100 µL H2O added; SAED pattern is for
e

56
3.6 Effect of Changing Molecular Precursor: OA Ratio
This series of reactions tested the way changing the amount of metal
precursors in the reaction altered nanoparticle crystal structure and morphology.
All experiments were done with a 1:1 ratio of Mn:Co in 6 mL TOA, 2 mL OA
(6.2 mmol), no added water and with 2 minutes of growth after nanoparticle
formation. Amounts investigated were 1, 2, 3 and 4 total mmol of metal
precursors. These results are shown in Tables 3.23 through 3.26; the results for
reaction condition of 2 mmol precursor has already been shown in Table 3.9.
Reactions with 2 mmol metal precursors or more gave products with the
rs-Co1-xMnxO structure. With 0.5 mmol of each precursor present (i.e., 1 mmol
total metal carboxylate precursor: 6.3 mmol OA), two products are recovered
from the reaction, very much like those found when reacting 5 mL TOA: 3 mL
OA with 1 mmol of each metal precursor. As in that experiment, the solution
color change occurred above 370°C with a transition to dark emerald green. One
difference is that only a very small amount of material (less than 1 mg) was
recovered after centrifugation in hexanes and no x-ray diffraction could be
obtained from the sample. The supernatant product was a mixture of rs- and w-
Co1-xMnxO. These XRD results are shown in Figures 3.14 and 3.15. Increasing
the amount of precursor to 2 mmol (Table x) decreases the solution color change
temperature to ~365ºC and gives a green-gray solution; for 3 mmol solution color
changes at 340º-345ºC to green-yellow; and with 4 mmol at 330º-335ºC to gray.
Each of the products shown in Tables 3.25 and 3.26 precipitated upon
centrifugation in hexanes and had x-ray diffraction patterns that indexed to rs-Co1-

xMnxO. Stoichiometries for the samples shown in Tables
3.26are Co0.67Mn0.33O and Co
Table 3.23. TEM images of nanoparticles synthesized with 1 mmol metal precursors that precipitated upon centrifugation in hexanes
* a
. Stoichiometries for the samples shown in Tables Table 3.25
O and Co0.54Mn0.46O, respectively.
TEM images of nanoparticles synthesized with 1 mmol metal precursors that precipitated upon centrifugation in hexanes
*
57
25 and Table
TEM images of nanoparticles synthesized with 1 mmol metal

Table 3.24. TEM images of precursors recovered from hexanes centrifugation supernatant
* a
TEM images of nanoparticles synthesized with 1 mmol metal precursors recovered from hexanes centrifugation supernatant
*
58
nanoparticles synthesized with 1 mmol metal

Table 3.25. TEM images of nanoparticles synthesized with 3 mmol metal precursors
a
TEM images of nanoparticles synthesized with 3 mmol metal
59
TEM images of nanoparticles synthesized with 3 mmol metal

Table 3.26. TEM images of nanoparticles synthesized with 4 mmol metal precursors
* a
TEM images of nanoparticles synthesized with 4 mmol metal
*
*
60
TEM images of nanoparticles synthesized with 4 mmol metal

Figure 3.14. XRD pattern of product recovered from supernatant of reaction with 1 mmol metal precursors. Reference pattern for hexagonal ZnOface centered cubic MnO
Figure 3.15. XRD pattern of product recovered from precipitate of reaction with 1 mmol metal precursors. The lack of sharp peaks indicates a non
pattern of product recovered from supernatant of reaction with 1 mmol metal precursors. Reference pattern for hexagonal ZnO-type lattice is shown in green; for face centered cubic MnO-type lattice in blue.
XRD pattern of product recovered from precipitate of reaction with 1 mmol metal precursors. The lack of sharp peaks indicates a non-crystalline, amorphous solid.
61
pattern of product recovered from supernatant of reaction with 1 mmol type lattice is shown in green; for
XRD pattern of product recovered from precipitate of reaction with 1 mmol
crystalline, amorphous solid.

62
3.7 Effect of Extending Growth Time
In all reaction presented in the preceding sections, the reaction was heated
for two minutes after the color change to allow for nanoparticle growth and
ripening. One set of reaction conditions was chosen to examine how longer
reaction times might alter nanoparticle formation: 6 mL TOA, 2 mL OA with no
water and 0.5 mmol each of Co(OAc)2 and Mn(HCOO)2. This reaction condition,
discussed earlier and with results in Tables 3.23 and 3.24, resulted in
nanoparticles of both types of lattices: rs- and w-Co1-xMnxO, with w-Co1-xMnxO
particles retrieved from the supernatant after centrifugation in hexanes. Growth
times were extended out to 5 and 10 minutes after solution color change to dark
emerald green (at or above 370°C) with solution temperatures kept elevated above
360°C. Attempts were made to extend the growth time further than 10 minutes,
but in every case the heating mantle was unable to consistently keep the solution
temperature near the decomposition temperature for that length of time. The case
of 2 minutes growth time gave nearly no precipitate upon centrifugation in
hexanes, but reactions with extended growth time did yield increasing amounts of
material – the amount did not exceed 10% of that recovered from the supernatant,
however. Figure 3.16 shows how the XRD pattern of the material recovered from
the supernatant of each of these reactions evolves with increasing growth time.

Table 3.27. 5 minutes growth for reaction with 6water and 0.5 mmol of each precursor. This material from the supernatant after centrifugation in hexanes.
*
A
5 minutes growth for reaction with 6 mL TOA, 2 mL OA with no mmol of each precursor. This material (5-SN) was recovered
from the supernatant after centrifugation in hexanes.
*
63
OA with no was recovered

Table 3.28. 5 minutes growth for reaction with 6water and 0.5 mmol of each precursor. This material from the precipitate
* a
5 minutes growth for reaction with 6 mL TOA, 2 mL OA with no water and 0.5 mmol of each precursor. This material (5-PP) was recovered
after centrifugation in hexanes.
*
64
OA with no was recovered

Table 3.29. 10 minutes growth for reaction withno water and 0.5 mmol of each precursor. This material recovered from the supernatant after centrifugation in hexanes.
*
aaaa
10 minutes growth for reaction with 6 mL TOA, 2 mL no water and 0.5 mmol of each precursor. This material (10-SN) recovered from the supernatant after centrifugation in hexanes.
*
*
65
mL OA with SN) was

Table 3.30. 10 minutes no water and 0.5 mmol of each precursor. This material upon centrifugation in hexanes.
*
*
10 minutes growth for reaction with 6 mL TOA, 2 mL no water and 0.5 mmol of each precursor. This material (10-PP) upon centrifugation in hexanes.
*
*
66
mL OA with PP) precipitated

Figure 3.16. Change in supernatant of reactions with extended growth times under conditions 6TOA: 2 mL OA, no water and 0.5 mmol each of Co(OAc)Reference pattern for a rock saltblue; reference P63mc lattice with
Change in XRD patterns for the material collected from the supernatant of reactions with extended growth times under conditions 6
OA, no water and 0.5 mmol each of Co(OAc)2 and Mn(HCOO)Reference pattern for a rock salt-structure lattice with a = 4.3 Å is shown in
mc lattice with a = 3.2 Å and c = 5.2 Å shown in green.
67
XRD patterns for the material collected from the supernatant of reactions with extended growth times under conditions 6 mL
and Mn(HCOO)2. = 4.3 Å is shown in
= 5.2 Å shown in green.

68
3.8 Effect of Varying the Solution Heating Rate
One experimental variable (unintentionally) tested was the role consistent
heating rates and the ability of the reaction setup to remain at elevated
temperatures had on reaction outcomes. This came about due to issues with the
inconsistency in heat output of the variable autotransformer-heating mantle setup
used to heat the reaction solution. As mentioned in the experimental, all metal
precursors and surfactants were mixed together at room temperature and then
heated to an elevated temperature, at which a color change occurred marking the
decomposition of metallic precursors and beginning of nanoparticle formation. An
example of what the heating vs. time curve for a successful reaction is shown in
Figure 3.17: the temperature rises at a rate of 25-30°C per minute until
approximately 300-350°C, then the heating rate slows due to equipment
limitations. Decomposition occurs at 359°C, 14.5 minutes after heating begins
and 2 minutes after reaching 350°C. The maximum temperature achieved is
363°C at 16 minutes; when the heating mantle is removed at 16.5 minutes the
temperature is 361°C.
As mentioned above, in some cases the heating mantle was unable to
maintain sufficient output to keep solution temperatures elevated. Typically, a
reaction needed to maintain a temperature within 10°C of the decomposition
temperature for one to three minutes before the color change occurred. Failure to
do so generally resulted in three possible outcomes: no solution color change;
reduction of the cobalt (II) acetate to cobalt metal; or formation of nanoparticles
of different morphology and/or crystal lattice than expected for the reaction

69
conditions. Example heating profiles for such reactions are shown in Figure 3.18
and Figure 3.19. In the cases where no color change was observed, the solution
would be cooled to room temperature, combined with ethanol and centrifuged to
attempt to precipitate nanoparticles. These attempts failed in every case.
Representative TEM images for the products of reactions that had variable
heating are shown in Table 3.31. Note that these similar nanoparticle
morphologies were the result of a wide variety of starting conditions; the failure
to maintain constant heating is the only commonality. Powder XRD analysis of
all products resulting from these reactions corresponded to the face-centered cubic
lattice seen in previous nanoparticle types. In a few cases the heating mantle
output dropped after the solution color change occurred. The solution was kept
heated and the reactions were allowed to proceed for various times. Figure 3.20
shows XRD and TEM images for the products of these reactions: Figure 3.20a
for 30 min, Figure 3.20b for 45 min, Figure 3.20c for 60 min, and Figure 3.20d
for 75 min. The solution temperature did not drop below 345°C for of these
reactions.

Figure 3.17. Reaction temperature vs. time profile for a standard nanoparticle synthesis reaction. The reaction conditions and results for this particular reaction are discussed along with
Figure 3.18. Reaction temperature vs. time comparison for a failed nanoparticle synthesis.
Reaction temperature vs. time profile for a standard nanoparticle synthesis reaction. The reaction conditions and results for this particular reaction are discussed along with Table 3.18.
Reaction temperature vs. time comparison for a failed nanoparticle synthesis.
70
Reaction temperature vs. time profile for a standard nanoparticle synthesis reaction. The reaction conditions and results for this
Reaction temperature vs. time comparison for a failed

Figure 3.19. Reaction temperature vs. time comparison for a reaction that still yielded some nanoparticles.
Reaction temperature vs. time comparison for a reaction that still yielded some nanoparticles.
71
Reaction temperature vs. time comparison for a reaction that

Table 3.31. TEM images of reactions that had inconsistent heating. The pairs of images on each row are from diffstarting conditions.
a
TEM images of reactions that had inconsistent heating. The pairs of images on each row are from different reactions, with different
72
TEM images of reactions that had inconsistent heating. The erent reactions, with different

73
Figure 3.20. Sharpening of w-Co1-xMnxO nanoparticle XRD peaks with increasing particle size and crystallinity. Representative TEM image of each sample is shown on the right. The largest particles are 25-30 nm in diameter, the smallest 5 nm. Reference peaks for hexagonal ZnO are shown in gray at the bottom.

74
3.9 Grain size dependence on Co-Mn stoichiometry
The Scherrer equation relates diffraction peak position and width at half
intensity (full width at half maximum, FWHM) to determine the size of
diffraction domains in each sample. This was done utilizing XRD data in JADE
9. The data is shown in Tables 3.32 through 3.36. The data were plotted against
the Co content of the nanoparticles as determined by ICP-OES. Additional data
from several MnO nanoparticle samples were included, due to the imbalance of
Co-Mn stoichiometries in samples made in this study (which tended to be Co-
rich). In these tables “XS” stands for crystallite size, “2-peak average” is the
average of the sizes based on the (111) and (200) diffraction peaks and “3-peak
average” is the average of sizes based on the (111), (200) and (220) diffraction
peaks. The data were analyzed using both quadratic and cubic relations; the
section of 0.1 ≤ Co ≤ 0.9 was separately fitted to a linear relation as shown in
Figures 3.21 to 3.25.

75
Table 3.32. Scherrer analysis data after processing raw XRD data in JADE 9.
Sample Co content
Co content error
(111) XS (Å)
(111) error (Å)
(200) XS (Å)
(200) error (Å)
SRW-4-7 0.18 0.0038 209 19 203 13 SRW-4-8 0.18 0.0024 267 9 278 7 SRw-4-13 0.75 0.0192 249 10 202 6 SRW-4-14 0.64 0.0128 131 8 108 5 SRW-4-24 0.21 0.0346 281 18 299 15 SRW-4-27 0.95 0.012 724 71 550 41 SRW-4-28 0.93 0.0123 719 23 562 14 SRW-4-29 0.99 0 1000 0 867 36 SRW-4-32 0.75 0.0152 368 11 271 6 SRW-4-33 0.17 0.0035 300 9 311 7 SRW-4-34 0.25 0.0025 240 11 263 9 SRW-4-36 0.44 0.0074 258 11 253 9 SRW-4-38 0.57 0.0115 202 5 176 4 SRW-4-40 0.38 0.0069 130 4 145 4 SRW-4-41 0.45 0.0125 220 8 195 5 SRW-4-43 0.55 0.0083 196 10 178 6 SRW-4-47 0.83 0.0108 263 9 148 7 SRW-4-49 0.82 0.0986 205 12 172 6 SRW-4-191 0.41 0.0072 200 7 173 5 SRW-4-193 0.91 0.0178 1000 0 780 35 SRW-5-17 0.566 0.0146 160 4 139 3 SRW-5-19a 0.521 0.0132 196 5 191 4 SRW-5-19b 0.656 0.0091 176 4 182 3 SRW-5-21a 0.676 0.0147 153 6 145 5 SRW-5-21b 0.816 0.0187 172 5 149 3 SRW-5-22a 0.768 0.0182 182 7 161 4 SRW-5-23a 0.339 0.0087 159 7 134 4 SRW-5-24b 0.1 0.0025 177 6 185 4 SRW-5-25a 0.236 0.0056 159 4 154 3 SRW-5-26b 0.925 0.0102 229 7 232 5 SRW-5-27b 0.578 0.0081 133 3 135 2 SRW-5-28a 0.101 0 224 7 208 4 SRW-5-28b 0.746 0 240 9 199 5 SRW-5-29a 0.698 0.0207 150 6 158 4 SRW-5-32a 0.69 0.0122 205 5 178 3 SRW-5-32b 0.594 0.0104 204 4 192 3 SRW-5-34a 0.164 0.005 156 5 141 3 SRW-5-34b 0.491 0.0104 181 9 163 6

76
Table 3.33. Scherrer analysis data after processing raw XRD data in JADE 9, cont’d.
Sample Co content
Co content error
(111) XS (Å)
(111) error (Å)
(200) XS (Å)
(200) error (Å)
SRW-5-36b 0.67 0.0101 205 6 201 4 SRW-5-37a 0.534 0.0084 155 5 155 3 SRW-5-37b 0.658 0.0135 171 10 159 7 SRW-5-38a 0.498 0.0223 190 8 178 5 SRW-5-38b 0.592 0.014 204 5 178 3 SRW-5-40b 0.284 0.0061 106 3 96 2 SRW-5-41a 0.787 0.013 119 7 115 3 SRW-5-42a 0.474 0.0149 97 5 109 9 SRW-5-47b 0.511 0.0071 126 4 121 3 MnOx - 1 0 0 416 0 326 0 SRW-3-182 0 0 352 0 240 0 SRW-3-187 0 0 400 0 413 0 SRW-3-188 0 0 327 0 323 0 SRW-3-189 0 0 377 0 359 0 SRW-5-91a ox 0 0 297 0 261 0 SRW-5-97b 0 0 296 0 285 0 A Table 3.34. Scherrer analysis data after processing raw XRD data in JADE 9, cont’d.
Sample (220) XS (Å)
(220) error (Å)
2 peak average (Å)
2 peak error (Å)
3 peak average (Å)
3 peak error (Å)
SRW-4-7 158 46 206 32 190.00 26.00 SRW-4-8 251 10 272.5 16 265.33 8.67 SRW-4-13 169 11 225.5 16 206.67 9.00 SRW-4-14 85 6 119.5 13 108.00 6.33 SRW-4-24 259 24 290 33 279.67 19.00 SRW-4-27 602 68 637 112 625.33 60.00 SRW-4-28 579 20 640.5 37 620.00 19.00 SRW-4-29 1000 933.5 36 955.67 12.00 SRW-4-32 229 7 319.5 17 289.33 8.00 SRW-4-33 310 13 305.5 16 307.00 9.67 SRW-4-34 279 13 251.5 20 260.67 11.00 SRW-4-36 267 16 255.5 20 259.33 12.00 SRW-4-38 141 4 189 9 173.00 4.33 SRW-4-40 117 5 137.5 8 130.67 4.33 SRW-4-41 161 7 207.5 13 192.00 6.67 SRW-4-43 158 6 187 16 177.33 7.33 SRW-4-47 204 8 205.5 16 205.00 8.00 A
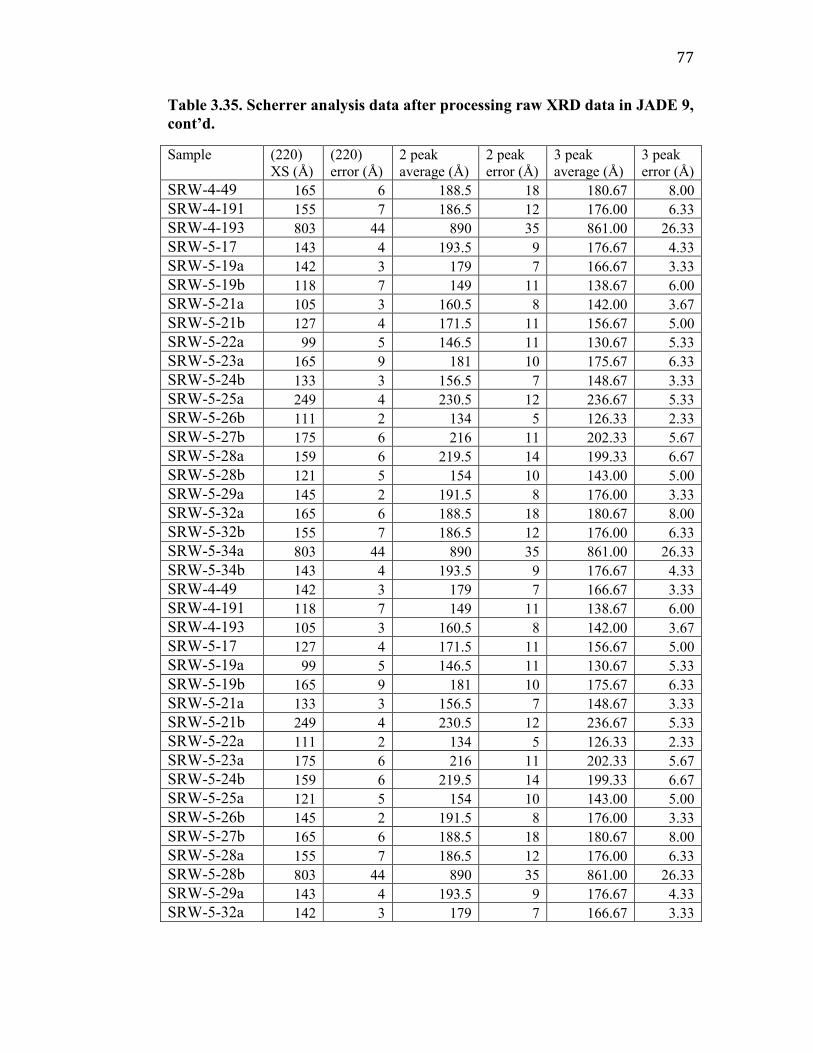
77
Table 3.35. Scherrer analysis data after processing raw XRD data in JADE 9, cont’d.
Sample (220) XS (Å)
(220) error (Å)
2 peak average (Å)
2 peak error (Å)
3 peak average (Å)
3 peak error (Å)
SRW-4-49 165 6 188.5 18 180.67 8.00 SRW-4-191 155 7 186.5 12 176.00 6.33 SRW-4-193 803 44 890 35 861.00 26.33 SRW-5-17 143 4 193.5 9 176.67 4.33 SRW-5-19a 142 3 179 7 166.67 3.33 SRW-5-19b 118 7 149 11 138.67 6.00 SRW-5-21a 105 3 160.5 8 142.00 3.67 SRW-5-21b 127 4 171.5 11 156.67 5.00 SRW-5-22a 99 5 146.5 11 130.67 5.33 SRW-5-23a 165 9 181 10 175.67 6.33 SRW-5-24b 133 3 156.5 7 148.67 3.33 SRW-5-25a 249 4 230.5 12 236.67 5.33 SRW-5-26b 111 2 134 5 126.33 2.33 SRW-5-27b 175 6 216 11 202.33 5.67 SRW-5-28a 159 6 219.5 14 199.33 6.67 SRW-5-28b 121 5 154 10 143.00 5.00 SRW-5-29a 145 2 191.5 8 176.00 3.33 SRW-5-32a 165 6 188.5 18 180.67 8.00 SRW-5-32b 155 7 186.5 12 176.00 6.33 SRW-5-34a 803 44 890 35 861.00 26.33 SRW-5-34b 143 4 193.5 9 176.67 4.33 SRW-4-49 142 3 179 7 166.67 3.33 SRW-4-191 118 7 149 11 138.67 6.00 SRW-4-193 105 3 160.5 8 142.00 3.67 SRW-5-17 127 4 171.5 11 156.67 5.00 SRW-5-19a 99 5 146.5 11 130.67 5.33 SRW-5-19b 165 9 181 10 175.67 6.33 SRW-5-21a 133 3 156.5 7 148.67 3.33 SRW-5-21b 249 4 230.5 12 236.67 5.33 SRW-5-22a 111 2 134 5 126.33 2.33 SRW-5-23a 175 6 216 11 202.33 5.67 SRW-5-24b 159 6 219.5 14 199.33 6.67 SRW-5-25a 121 5 154 10 143.00 5.00 SRW-5-26b 145 2 191.5 8 176.00 3.33 SRW-5-27b 165 6 188.5 18 180.67 8.00 SRW-5-28a 155 7 186.5 12 176.00 6.33 SRW-5-28b 803 44 890 35 861.00 26.33 SRW-5-29a 143 4 193.5 9 176.67 4.33 SRW-5-32a 142 3 179 7 166.67 3.33 A

78
Table 3.36. Scherrer analysis data after processing raw XRD data in JADE 9, cont’d.
Sample (220) XS (Å)
(220) error (Å)
2 peak average (Å)
2 peak error (Å)
3 peak average (Å)
3 peak error (Å)
SRW-5-32b 162 3 198 7 186.00 3.33 SRW-5-34a 131 5 148.5 8 142.67 4.33 SRW-5-34b 120 9 172 15 154.67 8.00 SRW-5-36b 186 4 203 10 197.33 4.67 SRW-5-37a 122 4 155 8 144.00 4.00 SRW-5-37b 116 6 165 17 148.67 7.67 SRW-5-38a 138 6 184 13 168.67 6.33 SRW-5-38b 156 3 191 8 179.33 3.67 SRW-5-40b 72 3 101 5 91.33 2.67 SRW-5-41a 115 3 117 10 116.33 4.33 SRW-5-42a 108 4 103 14 104.67 6.00 SRW-5-47b 111 4 123.5 7 119.33 3.67 MnOx - 1 342 0 371 0 361.3333333 0 SRW-3-182 269 0 296 0 287 0 SRW-3-187 447 0 406.5 0 420 0 SRW-3-188 324 0 325 0 324.6666667 0 SRW-3-189 337 0 368 0 357.6666667 0 SRW-5-91a ox 293 0 279 0 283.6666667 0 SRW-5-97b 311 0 290.5 0 297.3333333 0

Figure 3.21. Crystallite size (average of peaks) vs. Co content from ICP
. Crystallite size (average of Scherrer fit for the (111) and (200) ks) vs. Co content from ICP-OES with quadratic fit to the data.
79
Scherrer fit for the (111) and (200) OES with quadratic fit to the data.

Figure 3.22. Crystallite size (average of Scherrer fit for the (111) and (200) peaks) vs. Co content
. Crystallite size (average of Scherrer fit for the (111) and (200) peaks) vs. Co content from ICP-OES with cubic fit to the data.
80
. Crystallite size (average of Scherrer fit for the (111) and (200)

Figure 3.23. Crystallite size (average of Scherrer fit for the (111), (200) and (220) peaks) vs. Co content from ICP
. Crystallite size (average of Scherrer fit for the (111), (200) and (220) peaks) vs. Co content from ICP-OES with quadratic fit to the data.
81
. Crystallite size (average of Scherrer fit for the (111), (200) and OES with quadratic fit to the data.

Figure 3.24. Crystallite size (average of Scherrer fit for the (111), (200) and (220) peaks) vs. Co content from ICP
. Crystallite size (average of Scherrer fit for the (111), (200) and (220) peaks) vs. Co content from ICP-OES with cubic fit to the data.
82
. Crystallite size (average of Scherrer fit for the (111), (200) and
OES with cubic fit to the data.

Figure 3.25. Crystallite size (average of Scherrer fit for the (111), (200) and (220) peaks) vs. Co content from ICPwhere 0.1 ≤ x ≤ 0.9. The fit is linear.
. Crystallite size (average of Scherrer fit for the (111), (200) and (220) peaks) vs. Co content from ICP-OES. These are Co1-xMnxO particles
≤ x ≤ 0.9. The fit is linear.
83
. Crystallite size (average of Scherrer fit for the (111), (200) and O particles

84
Chapter 4. Discussion
4.1 Previous work in the Whitmire Lab
As mentioned in the introduction, the Whitmire lab has synthesized iron
and manganese metal oxide nanoparticles in the past. The insights gained during
those projects helped guide the exploration of the cobalt-manganese oxide system.
First and foremost, the influence that tri-N-octylamine and oleic acid have as
surfactants/solvents was such that several base nanoparticle shapes could be
made, such as squares and hexagons. Another important lesson learned in these
studies was that inclusion of water in the system led to more complex growth
processes, giving hexapod, cross and “tetracube”-shaped nanoparticles. Also
possible was the synthesis of mixed manganese-iron nanoparticles, which
assumed “dogbone” and elongated dogbone shapes.
4.2 Identification of nanoparticle crystal lattice
Experiments to explore the Co1-xMnxO system were first performed to
determine the feasibility of the project and compare how the system responded to
similar reaction conditions to the MnO and FeO systems. Initial reactions used
the following conditions as a control: 6 mL (13.7 mmol) TOA, 2 mL (6.3 mmol)
OA, 249 mg (1 mmol) Co(OAc)2⋅4H2O, 145 mg (1 mmol) Mn(HCOO)2 and 2
minutes of growth time after nanoparticle formation. The polycrystalline XRD
pattern for the product of this reaction (shown in Figure 3.1) initially
corresponded to the solid solution (FeO)0.664(MnO)0.336 (PDF#01-077-2358; face-
centered cubic, space group , no. 225, a = 4.36 Å, Z = 4). Further m3Fm

85
reactions corresponded with Fe0.9712O (PDF#01-074-1885; face-centered cubic,
space group , no. 225, a = 4.301 Å, Z = 4) and (NiO)0.5(MnO)0.5 (PDF#01-
078-0426; face-centered cubic, space group , no. 225, a = 4.294 Å, Z = 4).
Elemental analysis of these samples, however, confirmed that no iron or nickel
was present, only varying amounts of manganese and cobalt.
It should be noted that the JADE search-match function is not itself an
elemental analysis. It compares the sample’s XRD pattern with experimentally
and theoretically derived patterns stored at the International Centre for Diffraction
Data (ICDD). The search algorithm uses peak positions and intensities to derive
crystal lattice systems and parameters, meaning materials with similar unit cells
will be found using the search-match protocol. This led to the determination that
the face-centered cubic solid solution Co1-xMnxO (rs-Co1-xMnxO) was being
formed – the lattice parameters of the mixture changing proportionally to the
makeup of the mixture.
4.3 Change in crystal lattice with metal content
Vegard’s Law is an observation derived from experimental evidence
concerning solid solutions. It states: “in continuous solid solutions of ionic
salts…the lattice parameter of the solution is directly proportional to the atomic
percent solute present.”4 This specifically refers to random substitutional solid
solutions, where one ion is seen replacing another ion of a similar type. X-ray
diffraction data has been correlated with elemental analysis for each sample (via
ICP-OES) and is presented in Table 3.2 through Table 3.5 and Figure 3.8 and
Figure 3.9.
m3Fm
m3Fm

86
There are a few explanations for the observed deviations from a perfect
linear proportionality. First is to note that Vegard’s Law is not in fact an
inviolable physical law; it is, as mentioned above, based solely on empirical
observations. Also of importance are the limitations of the analytical methods
used. Powder XRD can be used to determine the lattice parameters of the
crystalline oxide present, but it will not reveal the presence of amorphous or non-
crystalline substances. A common problem encountered was the decomposition
of all Co(OAc)2 into metallic cobalt; it is entirely possible that trace amounts
convert into amorphous metallic cobalt. This is in fact seen in some samples, as
shown in the XRD pattern presented in Figure 3.4. Such samples would register
higher values for cobalt than is present in the oxide form, and while WPF was
performed to correct for this effect, some bias may have been introduced by
excessive manipulation of data
4.4 Effect of Co:Mn ratio on morphology of products
Varying the starting amounts of cobalt and manganese substantially
altered the resulting nanoparticle morphologies. All of these reaction had the
same surfactant ratios and total amount of metal carboxylate precursors: 6 mL
TOA, 2 mL OA, 2 mmol total precursor, with no water added and 2 minutes of
growth time. The control reaction with 1 mmol Co(OAc)2 and 1 mmol
Mn(HCOO)2 is shown in Table 3.9. There is a narrow distribution of particle
sizes and shapes; nanoparticles are clearly well defined as individual particles or
stacks of particles. Surfaces appear to have facets, leading to particles that look
like hexagons and rhombohedra. Some nanoparticles appear elongated, but the

87
degree of shape anisotropy is minimal. Increasing the amount of manganese
relative to cobalt does not significantly affect the nanoparticle morphology except
when there is a 1:9 Co:Mn ratio. Here the particles formed resemble MnO
crosses and multipod pieces reported previously with the etching of surfaces
clearly visible. Moving toward cobalt-heavy reactions, nanoparticles assume
shapes very similar to those seen in the 7 mL TOA: 1 mL OA reaction condition
(Table 3.14), with a similar distribution of nanoparticle sizes. Having even more
cobalt precursor present in the reaction solution leads to square- and hexagon-
shaped particles that are thick enough to be unable to discern features on the inner
faces, if any. The distribution of particles heavily favors the larger particles;
indeed, the vast majority of these particles appear to have edges longer than 100
nm. Literature reports on the synthesis of pure rock salt CoO nanoparticles show
that rhombohedra and octahedrons of size 30-300 nm are a common crystal
habit.46,75,86 To ensure completeness, as rock salt-lattice CoO nanoparticles have
been synthesized in several ways, but not in a TOA-OA surfactant mixture, some
example reactions were performed, with TEM results shown in Table 4.1. The
conditions were 6 mL TOA, 2 mL OA, 2 mmol Co(OAc)2 and no water; metal
amounts tested were Co0.95Mn0.05O, Co0.99Mn0.01O and CoO. The particles
formed in these reactions have very similar morphologies to those seen in Tables
Table 3.11 and Table 3.12, and are approaching a size regime where the term
“nanoparticle” is a misnomer. The conclusion we may reach is that reaction
conditions with an excess of manganese precursor result in shapes similar to those
seen in MnO: crosses, hexagons and rods, which will be of smaller size; whereas

an excess of cobalt precursor results in large hexagons and cubes.
ratios are between 2:1 and 1:2
that are more complex in nature
Table 4.1 TEM images of CoO nanoparticles synthesized in 6OA, 2 mmol Co(OAc)
4.5 Oleic acid and its role in
The initial conclusion that may be drawn
Chapter 3 is that oleic acid is the most important factor in the synthesis of
mixed-metal oxide nanoparticles.
shown in Figure 3.
molecular precursors in the absence of
segregation into their separate
clearly visible as two distinct sets of peaks in the XRD pattern
slight amount of w-CoO (
peaks visible at 2θ =
an excess of cobalt precursor results in large hexagons and cubes.
ratios are between 2:1 and 1:2, nanoparticles may form with shapes and features
are more complex in nature.
TEM images of CoO nanoparticles synthesized in 6 mL OA, 2 mmol Co(OAc)2 and no water.
Oleic acid and its role in oxide formation
The initial conclusion that may be drawn from the data presented in
is that oleic acid is the most important factor in the synthesis of
metal oxide nanoparticles. Example XRD patterns for these reactions are
.10, Figure 3.11 and Figure 3.12. Decomposition of
molecular precursors in the absence of OA leads to manganese and cobalt
into their separate rock salt-lattice oxides (Figure 3.12
clearly visible as two distinct sets of peaks in the XRD pattern. There is also
CoO (P63mc) present, with the more intense (100) and (002)
= 32° and 34°. Introducing OA into the reaction mixture
88
an excess of cobalt precursor results in large hexagons and cubes. Where the
s and features
mL TOA, 2 mL
from the data presented in
is that oleic acid is the most important factor in the synthesis of these
Example XRD patterns for these reactions are
. Decomposition of
manganese and cobalt
12), which are
There is also a
present, with the more intense (100) and (002)
into the reaction mixture

89
results in a single crystalline phase that is a solid solution of a single
lattice. As would be expected of a solid solution, the peak positions lie between
those of the binary oxides. The pattern shown (Figure 3.1) corresponds to a
product stoichiometry of Co0.57Mn0.43O by ICP-OES analysis. All of the reactions
done with varying TOA:OA ratios but constant 1:1 starting Co:Mn ratio were
slightly manganese deficient, with the values ranging from Co0.57Mn0.43O to
Co0.51Mn0.49O. In the Fe1-yMnyO system a similar preference for one metal to be
incorporated into the product lattice was observed, with a 1:1 metal precursor
ratio yielding particles with a stoichiometry of Fe0.7Mn0.3O. This effect was
rationalized by the difference in Ksp values for the respective metal hydroxides.
The Ksp values of Mn(OH)2, Fe(OH)2 and Co(OH)2 are respectively 1.6 x 10⁻¹³,
4.9 x 10⁻¹⁶ and 1.6 x 10⁻¹⁵; Co(OH)2 is just over three times as soluble as Fe(OH)2.
In rs-Co1-xMnxO the metal with a more insoluble hydroxide precipitates and is
incorporated into the nanoparticle lattice preferentially but to a lesser extent than
in Fe1-yMnyO, due to the smaller difference in solubility compared to Mn(OH)2.68
In the reaction of 5 mL TOA: 3 mL OA, the product recovered from the
supernatant (Figure 3.11) indexes to the P63mc space group, indicating the
formation of wurtzite-type mixed manganese cobalt oxide (w-Co1-xMnxO). ICP-
OES data gives product stoichiometry for this particular sample as Co:Mn =
0.64:0.36. Unit cell refinement in JADE gave estimated cell parameters a = 3.265
Å and c = 5.210 Å. Confirmation of cubic and hexagonal lattices was done with
SAED experiments, shown in Figure 3.13. The particles shown in Figure 3.13a
are from the sample shown in Table 3.9 synthesized with 6 mL TOA: 2 mL OA,
Fm3m
90
with the corresponding SAED pattern given in Figure 3.13b. Figure 3.13c and
Figure 3.13d likewise correspond to the sample shown in Table 3.16 recovered
from the supernatant after centrifugation of the mixture synthesized in 5 mL
TOA: 3mL OA.
Additional evidence of oleic acid’s importance in nanoparticle formation
is found in the way its quality affected reaction outcomes. Previous work in the
Whitmire lab synthesizing MnO, FeO and Fe1-xMnxO had used OA that was dried
under vacuum at 110°C for 4h and then stored under argon gas. Initial
experiments, as described in the previous chapter, used this method to purify OA
and were successful in yielding nanoparticles. However, attempts to reproduce
these results were quickly frustrated due to the tendency for Co(OAc)2 to reduce
to metallic cobalt, which occurred in a significant number of reactions. This issue
was resolved by distillation of the OA, as mentioned in the results, but the
presence of impurities in the oleic acid (and their effects on reaction outcomes)
was a major factor in necessitating that each reaction condition be repeated
multiple times.
4.6 Oleic acid and its effect on nanoparticle morphology
Further reactions in the series shown in Table 3.13 – Table 3.17 show
very different results once OA is introduced and as its concentration increases. In
the case of 7 mL TOA: 1 mL OA, this leads to square- or cube-shaped
nanoparticles with a bimodal distribution of sizes, some 20-30 nm per side and
other 50-250 nm per side, with the larger particles having some outward-
projecting internal texture visible (Table 3.14) and some appearing to be large

91
circles/spheres. There is some ambiguity as to the size of the particles in the
direction of the electron beam, but the significant amount of detail visible on the
inner texture of the 50-250 nm per side squares indicates a shallower profile along
that axis. These features appear to be growth emanating from the center in a
cross-shaped pattern, but still filling the area between each “arm.”
As the ratio of TOA:OA is raised to 6.5 ml: 1.5 ml, nanoparticles grow as
rods (Table 3.15) that show significant interpenetration. There are no
nanoparticles that are clearly recognizable as the squares or cubes seen in the 7
mL TOA: 1 mL OA case, and indeed the act of finding individual particles
themselves proves to be a challenge. The arms have a narrow distribution of arm
widths, ~20 nm, and some be identified to extend upward of 200 nm in length.
Determining the distribution is hindered by the degree of infringement and
intergrowth present.
In the 6 mL TOA: 2 mL OA case (Table 3.9), the control reaction for all
reaction variables, there is a narrow distribution of particle sizes and shapes.
Surfaces of nanoparticles are much better defined and appear as facets, leading to
particles that look like hexagons and rhombohedra, something not seen in the
previous two reaction conditions. Some nanoparticles appear elongated, but the
degree of shape anisotropy is also much decreased from the rods seen in Table
3.15 – or, put another way, the “rods” formed in this reaction have aspect ratios
much closer to one.
The 5 mL TOA: 3 mL OA instance yields two different products – the
nanoparticles that remain in the supernatant upon centrifugation in hexanes which

92
require addition of ethanol to precipitate (Table 3.16), and the material that
precipitates from hexanes (Table 3.17). The material recovered from the
supernatant is significantly different from all other products so far – its XRD and
SAED patterns correspond to the P63mc space group, a hexagonal crystal lattice.
There is a bimodal mix of nanoparticle sizes, with populations of very small (5
nm or less) and larger (20-30 nm) square and rectangular particles that have
discreet, well-defined crystallite surfaces. The material that precipitates from
hexanes, however, is a complex mixture of small amorphous particles and 50 –
100 nm flowerlike particles. XRD analysis of this material shows only the
presence of the rock salt-type rs-Co1-xMnxO, even though these particles are
formed in the same reaction solution as the w-Co1-xMnxO. Closer inspection of
the internal features of the flowerlike particles reveals that they are polycrystalline
aggregates of smaller, sub-20 nm particles.
From this series of reactions, a few trends become clear. OA must be
present to control nanoparticle shape and increasing the amount of OA present
leads to smaller particles with narrower size distributions. Also, the issues seen
with nanoparticles growing together at lower OA concentrations are gone, leaving
distinct separate particles. This only seems to change at the highest levels of OA
in the 5 mL TOA: 3 mL OA reaction, and the particles recovered there are
aggregates of discreet smaller particles. These aggregates are similar to those
seen in pure CoO by Zhang et al.87 This deviation from the observed trend is also
concurrent with alternate reaction products (w-Co1-xMnxO), so it appears that
those reaction conditions create a special case, which may be supported by the

93
lack of nanoparticles formed at higher OA levels. The rodlike (Table 3.15) and
small hexagon-shaped (Table 3.9) particles are similar in morphology to those
seen in the synthesis of MnO.47 The increase in decomposition temperature with
increasing OA content is likely due to OA’s role as a surface-passivating agent
increasing the stability of nucleation clusters.
4.7 Effect of Added Water on Nanoparticle Morphology
Water played an important role in the MnO, FeO and Fe1-xMnxO
nanoparticles synthesized previously in the Whitmire lab. It was found that
introducing water into the TOA-OA surfactant mixture promoted the formation of
anisotropic nanoparticles. This was hypothesized to be due to enhanced etching
of growing crystallite faces, a theory which was supported by the observation of
nanoparticles in various stages of being etched from squares into crosses (in the
case of MnO) and cubes into tetracubes (in the case of FeO). Water also clearly
has an effect on the morphology of nanoparticles in the Co1-xMnxO system.
Adding 1.11 mmol H2O to the solution of 6 mL TOA, 2 mL OA and 1 mmol of
each metal precursor encourages the growth of faceted hexagon and rhombohedra
that are similar to those with no water added (Table 3.18), but some have also
begun to extend into rodlike shapes. Further addition of water, however, leads to
products that are similar in size, shape and internal structure to those seen in the 7
mL TOA, 1 mL OA reaction in Table 3.14 and 1:2 Mn:Co reaction seen in Table
3.10. Whereas adding 2 and 3 mmol H2O to the solution (Table 3.19 and Table
3.20) seems to promote relatively uniform particle sizes, by not drying the
Co(OAc)2·4H2O (Table 3.21) a bimodal distribution of particle types is

94
reintroduced. All of the particles seen in the last three reaction conditions are
variations on the same cube/square small particle with growth leading to unusual
features and then eventually large spheres/circles. Also of note is that whereas the
final Co-to-Mn ratios of the anhydrous and 1.11 mmol H2O reactions are
approximately 1:1, the 2 mmol H2O reaction has a stoichiometry of
Co0.58Mn0.42O, the 3 mmol H2O reaction has a stoichiometry of Co0.75Mn0.25O.
The trend of increasing cobalt amounts is not perfectly linear, though; the non-
dried reaction has a stoichiometry of Co0.69Mn0.31O. This increase in cobalt
content with increasing water indicates that more ripening-
dissolution/precipitation processes occur with greater water content, based on the
hypothesis that the metal hydroxide solubility relates to that metal ion’s
preferential deposition into the oxide lattice.
Using reaction conditions similar to those by which MnO hexapods were
synthesized (6 mL TOA, 2 mL OA, 9:1 Mn:Co precursor ratio, 100 µL added
H2O) gives rise to the variety of shapes shown in Table 3.22;47 this reaction has a
stoichiometry of Co0.1Mn0.9O from ICP-OES analysis. These NPs are similar to
those found in the related MnO system, however, no actual hexapods are seen in
these samples – instead only rodlike and branched structures are present. Some of
the rods (see Table 3.22d) lack the characteristic barbell heads at each end as seen
in MnO. The maximum number of “arms” per particle is three, resembling a “T;”
a higher magnification image of one such branched particle is shown with its
SAED pattern. The SAED pattern from this individual particle shows one set of
cubic lattice planes, indicating that it is a single crystal. The arms of this

95
branched particle are considerably shorter than those seen in other particles in
Table 3.22 (50 nm vs. 150 nm), indicating a particle in a different stage of growth
than the larger ones. Additionally, the branches are aligned with the <001>
diffraction spots, indicating that the arms have grown from the faces of the
original cubic seed. Similarities in morphology between MnO and rs-Co1-xMnxO
under these conditions suggest similar growth processes are occurring in each
case. However, the introduction of cobalt to the reaction limits the number of
faces of the initial seed from which the arms grow. These factors support our
hypothesis that the process of MnO hexapod formation is based on a core
nucleation-dendritic arm growth mechanism.47,67,68 This is similar to tetrapod
formation as observed by Alivisatos and coworkers for the Cd chalcogenides,88 in
contrast to the oriented-attachment mechanism described by Penn and Banfield89
and proposed by Belin and coworkers for MnO.90 The oriented attachment
mechanism was based on a presumption that small nanoparticles were defect-
free.91 Our observations, however, are that even the smallest nanoparticles exhibit
a variety of defects.
4.8 Effect of molecular precursor:OA ratio on nanoparticle
structure
The experiments varying the TOA:OA ratio with constant metal precursor
indicated that the amount of OA present had a significant effect on nanoparticle
size, shape and crystal lattice. The results of further experiments where the
amount of TOA:OA was held constant and the amount of precursors varied are
displayed in Table 3.23 through Table 3.26. With 0.5 mmol of each precursor

96
present (i.e., 1 mmol total metal carboxylate precursor: 6.3 mmol OA), two
products are recovered from the reaction, very much like those found when
reacting 5 mL TOA: 3 mL OA with 1 mmol of each metal precursor. As in that
experiment, the solution color change occurred above 370ºC with a transition to
dark emerald green. One difference is that only a very small amount of material
(less than 1 mg) was recovered after centrifugation in hexanes and no x-ray
diffraction could be obtained from the sample (Figure 3.15). TEM analysis
(Table 3.23) shows that it consists of a large amount of amorphous solid with a
very few 20-30 nm squares or rhombohedra with small (5-10 nm) spheres. What
is recovered from the supernatant of this reaction (Table 3.24) looks very similar
to the precipitate: a mixture of 5-10 nm and 20-30 nm faceted particles; there are
however many more of the smaller particles than larger ones. The product
recovered from the supernatant was confirmed to be a mixture of rs- and w-
Co1-xMnxO by XRD (Figure 3.14). Increasing the amount of precursor yields
shapes similar to those presented here previously: etched rhombohedra (Table
3.9), with decomposition ~365ºC to give a green-gray solution; rough squares
shapes showing roughened internal texture (Table 3.25), solution color change at
340º-345ºC to green-yellow; and large, randomly-shaped crystallites (Table
3.26), solution color change at 330º-335ºC to gray. Each of the products shown
in Table 3.9, Table 3.25 and Table 3.26 precipitated upon centrifugation in
hexanes and had x-ray diffraction patterns that indexed to rs-Co1-xMnxO.
Stoichiometries for the samples shown in Figures Table 3.25 and Table 3.26 are
Co0.67Mn0.33O and Co0.54Mn0.46O, respectively. These results suggest that while

97
the TOA:OA ratio and related acid-base dynamics have a role in nanoparticle
formation, the molar ratio of metal to surfactant is more likely to be the
underlying cause of the rock salt/wurtzite crystal lattice differentiation as well as
playing a part in controlling nanoparticle shape.
4.9 Extending reaction growth time
As shown in Table 3.23, Table 3.24 and Table 3.27 through Table 3.30,
each of the three reactions done with 6 mL TOA, 2 mL OA with no water and 1
mmol total precursor produced two products upon centrifugation in hexanes - the
material that precipitated and the material recovered from the supernatant by
adding ethanol. These are labeled in their respective Table captions as “# minutes
growth – recovered from precipitate (PP) or supernatant (SN).” All products from
each reaction have a mix of particles present: small 5-10 nm spheres and larger
20-50 nm faceted hexagons and rhombohedra. Comparing the PP and SN
products from each reaction, there is a difference in the relative distributions of
each type of particle – the precipitate contains more of the faceted 20-50 nm
particles than the 5-10 nm particles and also contains aggregates of 20-50 nm
particles. Extending the nanoparticle growth time from 2 minutes to 5 minutes
increases the relative numbers of the 20-50 nm particles compared to the 5-10 nm
particles in both the SN (Table 3.27) and the PP (Table 3.28). This trend
becomes more clear at 10 minutes’ growth time (Table 3.29 and Table 3.30); in
10-PP there are aggregates of 20-50 nm particles that resemble those found in the
5 mL TOA: 3 mL OA precipitate (Table 3.17). Only in the SN is there any trace
of a hexagonal lattice XRD pattern, and each growth time shows there to be a

98
mixture of both rs-Co1-xMnxO and w-Co1-xMnxO (Figure 3.16). The amount of
hexagonal oxide decreases with increasing growth time with the cubic oxide
diffraction pattern overwhelming any hexagonal lattice signal at 10 minutes’
growth. SAED patterns of individual faceted 20-50 nm nanoparticles (as in Table
3.27) index to a face-centered cubic lattice.
Based on these results, some conclusions may be drawn. The
nanoparticles in the 20 – 50 nm size range with facets and regular shapes are of
the rs-Co1-xMnxO phase and give rise to that XRD pattern. These are clearly
related to particles seen in 6 mL TOA: 2 mL OA with 2 mmol precursors (Table
3.9), but appear to be at different stages of crystalline growth. Based on
Ostwald’s step rule, the small particles are w-Co1-xMnxO. The step rule is an
empirical observation that metastable crystalline phases nucleate before more
stable phases due to the difference in surface area-to-volume ratio altering the
energetic favorability at different sizes; i.e. small particles have less stabilization
due to internal ionic and crystalline interactions and more stabilization due to
surface interactions, such as with the surfactants.92 Another conclusion is that the
small particles of w-Co1-xMnxO are of low crystallinity, due to the weakness of
the w-Co1-xMnxO diffraction signal compared to the rs-Co1-xMnxO even when the
smaller particles greatly outnumber the larger (Figure 3.16, 2 min). Extending
the time the nanoparticles are allowed to grow causes Ostwald ripening to occur,
with the small, metastable w-Co1-xMnxO particles to dissolve and redeposit on the
larger, more stable rs-Co1-xMnxO particles. The stoichiometries of the particles
are shown in Table. More cobalt is present in the samples that precipitated from
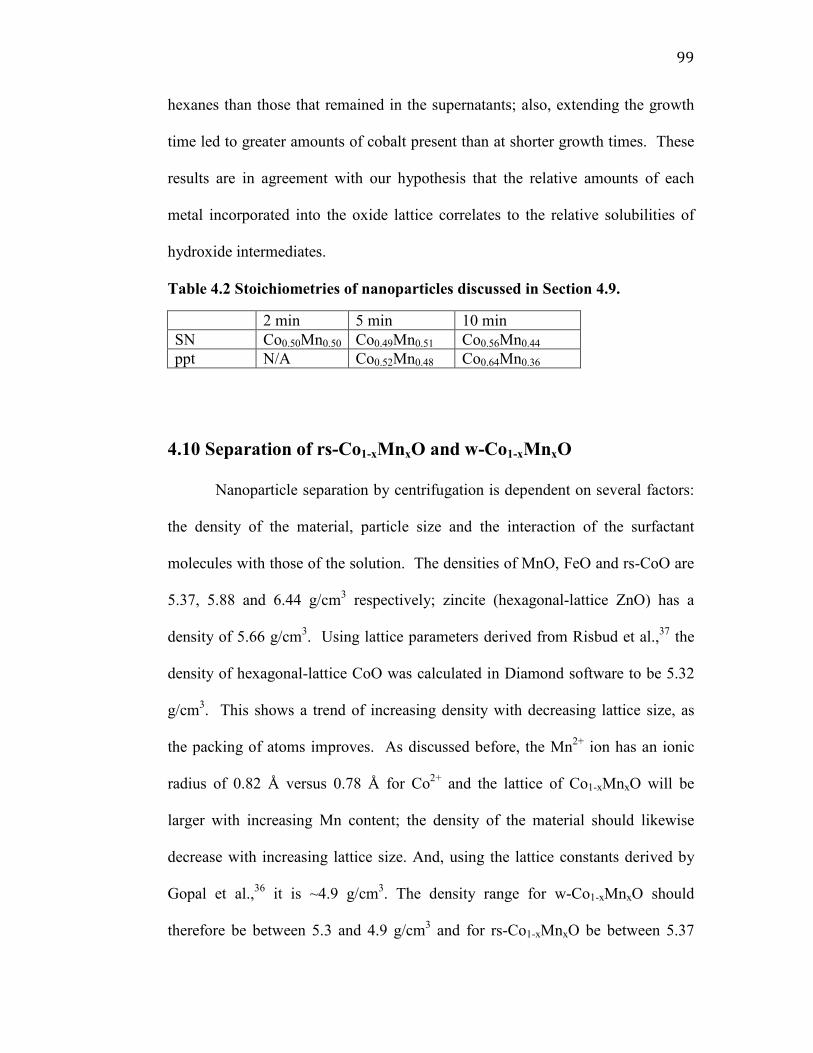
99
hexanes than those that remained in the supernatants; also, extending the growth
time led to greater amounts of cobalt present than at shorter growth times. These
results are in agreement with our hypothesis that the relative amounts of each
metal incorporated into the oxide lattice correlates to the relative solubilities of
hydroxide intermediates.
Table 4.2 Stoichiometries of nanoparticles discussed in Section 4.9.
2 min 5 min 10 min SN Co0.50Mn0.50 Co0.49Mn0.51 Co0.56Mn0.44 ppt N/A Co0.52Mn0.48 Co0.64Mn0.36
4.10 Separation of rs-Co1-xMnxO and w-Co1-xMnxO
Nanoparticle separation by centrifugation is dependent on several factors:
the density of the material, particle size and the interaction of the surfactant
molecules with those of the solution. The densities of MnO, FeO and rs-CoO are
5.37, 5.88 and 6.44 g/cm3 respectively; zincite (hexagonal-lattice ZnO) has a
density of 5.66 g/cm3. Using lattice parameters derived from Risbud et al.,37 the
density of hexagonal-lattice CoO was calculated in Diamond software to be 5.32
g/cm3. This shows a trend of increasing density with decreasing lattice size, as
the packing of atoms improves. As discussed before, the Mn2+ ion has an ionic
radius of 0.82 Å versus 0.78 Å for Co2+ and the lattice of Co1-xMnxO will be
larger with increasing Mn content; the density of the material should likewise
decrease with increasing lattice size. And, using the lattice constants derived by
Gopal et al.,36 it is ~4.9 g/cm3. The density range for w-Co1-xMnxO should
therefore be between 5.3 and 4.9 g/cm3 and for rs-Co1-xMnxO be between 5.37

100
and 6.44 g/cm3. Additionally, all of the w-Co1-xMnxO particles are much smaller
than the rs-Co1-xMnxO particles and have higher surface area/volume ratios,
meaning they have higher relative amounts of surfactant/oxide ratios. Both of the
surfactants used will bind the surfaces with their polar headgroups, exposing their
hydrophobic tails to the centrifugation solution. In hexanes the interaction
between solution and surfactant tail is strong due to their similar (low) polarities,
whereas the 1:1 ethanol:hexanes solution is much more polar. Another point of
consideration is that all supernatants in this reaction series contained a mixture of
rs-Co1-xMnxO and w-Co1-xMnxO, whereas the 5 mL TOA: 3 mL OA reaction
condition (Table 3.16 and Table 3.17) had complete segregation between the
supernatant and the precipitate; the 5 mL TOA: 3 mL OA condition did not give
any discreet 20-50 nm particles, only aggregates thereof. Once rs-Co1-xMnxO has
been precipitated based on its higher density and average particle size, the
addition of ethanol causes all remaining particles to precipitate. This indicates
that the separation of w-Co1-xMnxO and rs-Co1-xMnxO is achieved due to
combination of density, particle size and solvent polarity effects.
4.11 Nanoparticle growth processes
In general, there are three types of crystal growth mechanisms: spiral, two-
dimensional and adhesive. A comparison of how these mechanisms relate to the
driving force of crystallization (∆µ/kT) and growth rate is shown in Figure 4.1.
Spiral growth is the lowest-energy and involves the formation of a spiral
dislocation defect on the surface. This dislocation provides a position for a new
surface to grow around, appearing in a spiral pattern; this has the slowest rate.

101
Two-dimensional growth arises from the precipitation of a new crystal “growth
unit” onto a flat face of the crystal, creating a nucleus on the surface from which
further growth arises. Two-dimensional growth tends to produce layer-by-layer
growth and has an intermediate rate of growth. Adhesive growth is the deposition
of larger crystallite growth units on the surface and is the fastest to occur, giving
roughened surfaces and dendritic growth. It has been observed (the Berg effect)
that concentrations of growth pieces are not uniform across growing crystal faces,
tending to be higher at the edges and corners. This leads to faster growth at those
positions of the crystal resulting in more varied morphologies than the three
growth mechanisms may suggest; e.g., the spiral growth mechanism is what leads
to smooth surfaces and polyhedral morphology. A schematic of how this may
present itself is shown in Figure 4.2.

Figure 4.1. Crystal growth rate vs. crystal growth driving force. Curve A depicts spiral growth, curve B twocurve C adhesive growth. From Sunagawa p46.
Figure 4.2. Different morphologies achieved under different growth mechanisms from the same cubic sFrom Sunagawa p 52.
Crystal growth rate vs. crystal growth driving force. Curve A ts spiral growth, curve B two-dimensional layer-by-layer growth and
curve C adhesive growth. From Sunagawa p46.92
Different morphologies achieved under different growth mechanisms from the same cubic seed crystal bounded only by the From Sunagawa p 52.92
102
Crystal growth rate vs. crystal growth driving force. Curve A
layer growth and
Different morphologies achieved under different growth eed crystal bounded only by the (111) face.

103
There are a few common groupings of crystal types observed in this
investigation: small (under 20 nm per side) squares/cubes, larger squares/cubes up
to 200 nm on a side and spheres over 200 nm in diameter, all with a cubic lattice;
20-50 nm hexagons and octahedrons with a face-centered cubic lattice; and a
mixture of 5-10 nm and 20-30 nm particles with a hexagonal lattice. How these
different crystal lattices and morphologies arose can be understood using the
mechanisms discussed above.
4.11.1 “Cuboid”-shaped nanoparticles
Prototypical nanoparticles displaying the internal textures found in Table
3.10, Table 3.14, Table 3.19, Table 3.20, Table 3.21, Table 3.25 and Table
3.26 are shown in Figure 4.3. They are taken from the 7 mL TOA: 1 mL OA
with 1 mmol each of Co and Mn precursor reaction condition. Close inspection
of these rs-Co1-xMnxO nanoparticles show small squares beginning to grow in the
direction of their corners (Figure 4.3a) and a later stage in this process (Figure
4.3c) where channels running along the diagonals of the square are visible. These
resemble diamond crystals of the “cuboid” type, an illustration of which is shown
in Figure 4.3f.92 Cuboid crystals arise when the nucleation of a diamond lattice
occurs below the crystal growth driving force of (∆µ/kT)*, in the spiral growth-
smooth surface regime, followed by a rapid shift into the dendritic growth-rough
surface regime above (∆µ/kT)** (Figure 4.3e). This causes the formation of a
mantle consisting of a columnar internal texture emanating from the central seed
in the <110> and <100> directions giving the cuboid (Figure 4.3f). One of the

104
defining characteristics of cuboid is that the cross-section of the dendritic mantle
region is much larger than that of the seed polyhedron, as we have observed in
this case. The crystal habit and lattice are fundamentally related; the size, shape
and symmetry of the crystal lattice will almost always be the basis from which the
crystal takes its form or habit. Because both rock salt-type oxides and diamond
have face-centered cubic Bravais lattices, crystal growth will proceed along
similar directions in both. A growth mechanism that is based upon a transition
from slow growth to rapid growth suggests that the decomposition of the metal-
oleate complex is a rate-determining step, after which precipitation onto the
nucleus is very rapid.
Figure 4.3. TEM images (a) and (c) with SAED patterns (b) and (d) of nanoparticles from reaction of 7 mL TOA: 1 mL OA with 1 mmol each of Co(OAc)2 and Mn(HCOO)2. (e) and (f) Schematic illustration of the growth conditions and internal texture of a diamond cuboid (figure derived from literature).92

Some alternate mechanisms for achieving similar nanoparticle shapes
exist. One possibility relates to the sp
(Figure 4.4) which would involve the dendritic growth of arms in a similar
manner to the MnO hexapods, then twinning along the arms to give the bundle of
outward-projecting features seen. Another possibility is
penetration twin (Figure
face and grow outwards into cubes. SAED analysis of these nanoparticles reveals
them to be single crystals, however, which disallow any mechanisms based o
crystal twinning. An argument could be made that the textures seen are channels
in the crystallite caused by etching or ripening at the corners of the growing
particle. This is contrary to the Berg effect, however
primary growth/precipitation of monomers is occurring.
Figure 4.4 Schematic of the growth process of a spherulite formed by split growth. From Sunagawa, p158.
Some alternate mechanisms for achieving similar nanoparticle shapes
exist. One possibility relates to the spherulite crystal form grown by split growth,
) which would involve the dendritic growth of arms in a similar
manner to the MnO hexapods, then twinning along the arms to give the bundle of
projecting features seen. Another possibility is the formation of a
penetration twin (Figure 4.5) where two individual octahedra join along a single
face and grow outwards into cubes. SAED analysis of these nanoparticles reveals
them to be single crystals, however, which disallow any mechanisms based o
crystal twinning. An argument could be made that the textures seen are channels
in the crystallite caused by etching or ripening at the corners of the growing
particle. This is contrary to the Berg effect, however - the corners are where the
owth/precipitation of monomers is occurring.
Schematic of the growth process of a spherulite formed by split growth. From Sunagawa, p158.92
105
Some alternate mechanisms for achieving similar nanoparticle shapes
herulite crystal form grown by split growth,
) which would involve the dendritic growth of arms in a similar
manner to the MnO hexapods, then twinning along the arms to give the bundle of
the formation of a
join along a single
face and grow outwards into cubes. SAED analysis of these nanoparticles reveals
them to be single crystals, however, which disallow any mechanisms based on
crystal twinning. An argument could be made that the textures seen are channels
in the crystallite caused by etching or ripening at the corners of the growing
the corners are where the
Schematic of the growth process of a spherulite formed by split

Figure 4.5 Schematic of the growth process for two octahedrons forming interpenetrating cubic crystals. From Sunagawa, p136.
4.11.2 Faceted particles
There are three commonalities between the sets of reactions that gave the
shapes seen in Figure
water present and lower temperatures at which solution color changes occur. The
7 mL TOA: 1 mL (3.15 mmol) OA with 2 mmol total metal gives a molar ratio of
1.56 OA per metal ion; the 6
precursor gives an OA/metal ratio of 2.1; and 6
metal precursor again gives an OA/metal ratio of 1.56. This indicates that the full
replacement of acetate by oleate may be a key step in slowing do
growth. Face-centered cubic CoO nanoparticles synthesized from pre
Co(oleate)2 in 1-octadecene do, in fact form
nanoparticles.86,93 All
from reactions with higher OA/metal molar ratios. For 6
mmol) OA with 2 mmol metal precursor, the molar ratio increased a full integer
value to 3.2.
Schematic of the growth process for two octahedrons forming interpenetrating cubic crystals. From Sunagawa, p136.92
.2 Faceted particles
There are three commonalities between the sets of reactions that gave the
Figure 4.3: low molar ratio of OA to metals, increased amounts of
water present and lower temperatures at which solution color changes occur. The
(3.15 mmol) OA with 2 mmol total metal gives a molar ratio of
1.56 OA per metal ion; the 6 mL TOA: 2 mL (6.3 mmol) OA with 3 mmol metal
precursor gives an OA/metal ratio of 2.1; and 6 mL TOA: 2 mL OA with 4 mmol
metal precursor again gives an OA/metal ratio of 1.56. This indicates that the full
replacement of acetate by oleate may be a key step in slowing down nanoparticle
centered cubic CoO nanoparticles synthesized from pre
octadecene do, in fact form rhombohedral- and octahedral
All rs-Co1-xMnxO particles with similar polyhedral shapes arise
ions with higher OA/metal molar ratios. For 6 mL TOA: 2
mmol) OA with 2 mmol metal precursor, the molar ratio increased a full integer
106
Schematic of the growth process for two octahedrons forming
There are three commonalities between the sets of reactions that gave the
: low molar ratio of OA to metals, increased amounts of
water present and lower temperatures at which solution color changes occur. The
(3.15 mmol) OA with 2 mmol total metal gives a molar ratio of
6.3 mmol) OA with 3 mmol metal
OA with 4 mmol
metal precursor again gives an OA/metal ratio of 1.56. This indicates that the full
wn nanoparticle
centered cubic CoO nanoparticles synthesized from pre-made
octahedral-shaped
particles with similar polyhedral shapes arise
TOA: 2 mL (6.3
mmol) OA with 2 mmol metal precursor, the molar ratio increased a full integer

107
The addition of water to the reaction gives cuboid-shaped particles and
some (Table 3.21) that have anisotropic, unconstrained dendrites, which indicates
growth conditions similar to those with a low OA/metal molar ratio. This is likely
due to the increased formation of metal hydroxide intermediates, which are
hypothesized to have a role in the formation of these and similar nanoparticles.
Metal hydroxides have long been shown to promote the hydrolytic formation of
M-O-M bridges important in starting the formation of nanoscale metal oxides.41
The lower decomposition temperature is likely the result of incomplete dioleate
formation, leaving metals with open coordination sites and enhances the
favorability of oxo-metal bridge formation. Another consideration is that several
proposed mechanisms for the nonhydrolytic routes to create metal oxides from
carboxylates have water as a final product. This is yet another reason why the
cuboid forms appear – when OA decomposes, thereby being unable to coordinate
nanoaprticle surfaces, it also releases water in doing so and allows hydrolytic
processes to occur, which are faster than the nonhydrolytic processes.8,38,94
Co1-xMnxO nanoparticles with a hexagonal crystal lattice are only formed
in reaction conditions of 5 mL TOA: 3 mL (9.5 mmol) OA with 2 mmol
precursors and 6 mL TOA: 2 mL (6.3 mmol) OA with 1 mmol precursors, with no
water, at higher decomposition temperatures than all other reactions and are
always produced alongside a face-centered cubic lattice nanoparticle product.
These reaction conditions correspond to molar ratios of 6.3 and 4.8 OA molecules
per metal ion. Ostwald’s step rule states that the earliest phase that appears by
nucleation is a metastable phase; this effect has been well investigated at the

108
nanoscale in materials such as ZnS, CdSe, and ZnO which exhibit cubic-
hexagonal polytypism (zinc-blende to wurtzite).1,95-97 In this case, the metastable
wurtzite-type Co1-xMnxO is only produced under conditions that significantly
slow the rate of nuclei precipitation and dissolution. The shapes of NPs formed in
these reactions indicate that crystallization is occurring slowly via a spiral or two-
dimensional growth mechanism, in agreement with the hypothesis that crystal
growth is occurring below the driving force (∆µ/kT)*. The habits of crystals
formed from a cubic lattice growing in the [100] directions via spiral growth are
shown in Figure 4.6. All of the faceted particles seen in the 20-50 nm range can
be seen as having similar growth processes – rhombohedra and hexagons are the
result of growth along one axis stopping at different points. An OA/metal molar
ratio higher than 3 and lack of water are what differentiate these reaction
conditions from those that form cuboids. The elongated and rodlike particles in
Figure 1c, by comparison, have even further growth along one particular axis at
the expense of the other two, due to the intermediate OA/metal ratio of the
reaction.
Figure 4.6 Illustration of steps of growth from a cubic lattice nucleus in the [100] directions via a spiral mechanism. Adapted from Sunagawa, p 79.92

109
In the reaction condition where no OA is added to the solution, TEM and
XRD analysis shows randomly sized and shaped nanoparticles with completely
segregated MnO, rs-CoO and w-CoO lattices. This indicates that crystallites of
each phase are nucleating separately and persist in solution with no selective
dissolving/precipitation to form the cubic solid-solution lattice, which means that
no Ostwald ripening is occurring. Therefore, OA must play a key role in the
mechanism of Ostwald ripening in this system, likely through a strong association
between oleate and metal ions during nanoparticle growth. With no OA present in
solution, there are no processes by which already-formed hexagonal nuclei can
redissolve to give the thermodynamically favored cubic lattice. Addition of OA
allows any single-metal lattices to be dissolved and reformed into the entropically
favored solid solution Co1-xMnxO.
There is also a 35°C discontinuity in solution color change temperatures
when comparing the 8 mL TOA: 0 mL OA and 7 mL: 1 mL OA reaction
conditions; the temperature of color change further increases as the OA
concentration increases. The rate of growth also decreases with increasing OA
concentration. One explanation for this effect that is suggested by the results is
that OA is strongly bound to both the surface of crystallites as well as crystallite
growth intermediates, increasing the barrier to nanoparticle nucleation,
precipitation and dissolution processes with increasing OA concentration. The
inability for OA to completely bind both the nanocrystallite seed as well as
“CoMnO” intermediates when the OA/metal ratio is 2 or lower, in addition to
increased metal-carboxylate bond cleavage with increased water, leads to the

110
heterogeneous nucleation and accelerated growth rates that produce the cuboids
found under those conditions. At higher OA/metal ratios, however, OA is better
able to bind species in solution, slowing the growth rate and making nucleation
more homogeneous.
4.12 Presence of Multiple Phases
In most of the electron diffraction patterns of single particles (as
performed by Dr. Irene Rusavkoa at the University of Houston), weak spots are
seen in addition to the primary pattern. Similar patterns have been observed
previously in MnO and FeO systems and attributed to the formation of a spinel
phase with unit cell edge length a nearly double the size of the cubic lattice.67,68 In
MnO and FeO the spinel phase is the result of oxidation to Mn3O4 or Fe3O4 at the
surface of the particle, which can be seen by dark field TEM (DF-TEM). In
Figure 4.7a-c, a similar effect can be seen. The dark field TEM image recorded
using grock salt = 200 (Figure 4.7b) shows the distribution of rs-Co1-xMnxO is even
throughout the entire particle; however, DF-TEM on gspinel = 2 0 (Figure 4.7c)
shows that the spinel phase is present at the surface. This is consistent with the
previous results and calculated diffraction patterns for the different phases may be
found in those reports. There is no evidence in the XRD data to suggest the
presence of the spinel phases, indicating the total amount present is very small.
However, the XRD analysis does show that the correlation of rs-Co1-xMnxO
lattice parameters is not perfectly linear between CoO and MnO. It is possible
that Mn2+ and Co2+ could be selectively leeched from the rock salt core as
oxidation occurs to give the spinel material. Mn3O4, Mn2CoO4, Co3O4 and
2

111
MnCo2O4 are known and characterized ordered spinels; the Co-heavy structures
have face-centered cubic lattices while the Mn-rich structures have tetragonal
lattices. The lattice parameters of the cubic spinels (a = 8.269 Å for MnCo2O4; a
= 8.084 Å for Co3O4) are almost double that of the rock salt lattices (a = 4.25 to
4.45 Å). In fact, the faceted nanoparticles of size 30-50 nm with Co:Mn
stoichiometry of approximately 2:1 are where the most amount of surface
oxidation is observed. In our system, even the Mn-rich showed cubic spinel
rather than the tetragonal structure as found in Mn3O4. This suggests that there is
a difference in the Co:Mn ratio of the spinel phase compared to the bulk
measurement, meaning that one ion or the other is selectively leached from the
rock salt phase to achieve the correct spinel stoichiometry.
Figure 4.7 SAED pattern of surface-oxidized nanoparticle along the [001] axis (a) and dark field TEM images of a nanoparticle taken with grock salt = 200 (b) and gspinel = 2 0 (c). SAED pattern of a nanoparticle displaying long-range superlattice ordering (d) with dark field TEM images with gintense = 220 (e) and gweak = 110 (f).
2

112
With a mixed-metal oxide, however, another possible explanation exists
for diffraction spots at one-half those of the regular lattice: an ordered solid
solution, or “superlattice.” Intensity of the superlattice reflections is related to the
difference in atomic scattering factors of the ordering elements. So their intensity
is weaker compared to the regular reflections. The position of the extra spots in
the diffraction pattern depends on the lattice parameter of the new unit cell
created by the ordering process. In our case the new unit cell is doubled.
Superlattice reflections are observed in materials that have long-range order and
their real space unit cell is larger. The images in Figure 4.7d-f illustrate this
phenomenon. The electron diffraction pattern shows the superlattice reflections
to be at precisely one-half the spacing of the regular reflections. Dark field TEM
images (recorded using the basic and superlattice reflections are shown in Figure
4.7e and f (respectively). They show similar intensity distribution across the
entire particle image for both reflection types, confirming that they belong to the
same crystalline phase, indicating lattice doubling in all directions. SAED
patterns taken down the [011] zone axis (Figure 4.8) are consistent with lattice
doubling in all directions. This effect was seen in the electron diffraction patterns
of multiple nanoparticles from samples with stoichiometries (from ICP) of
c-Co0.69Mn0.31O, c-Co0.75Mn0.25O and c-Co0.93Mn0.07O. It should be noted that
short-range cation ordering has been observed in the related spinels Fe3O4 and
NiFe2O4, suggesting a similar effect occurs in this system.98,99

113
Figure 4.8 Bright field TEM (a) and SAED pattern down the [011] axis showing superlattice ordering (b) of a nanoparticle synthesized 6 ml TOA: 2 ml OA with no water and a 2:1 Co:Mn precursor ratio; final product stoichiometry was c-Co0.75Mn0.25O.
4.13 Grain size dependence on Co-Mn stoichiometry
Scherrer analysis of the XRD data shows little variance in the crystallite
size at 0.1 ≤ Co ≤ 0.9. Particles with less than 10% Co had larger grain sizes, and
those with more than 90% present had much larger grain sizes, however. Two
main factors likely contribute to this: particle size and metal distribution through
the lattice. The large Scherrer crystallite sizes of Co-rich particles is due to their
being very large (>100 nm), solid particles – see Tables 3.11, 3.12 and 4.1. This
is in contrast to MnO hexapods (shown at 0% Co content on Figures 3.21 through
3.24) and Co1-xMnxO cuboids, which contain many dendritic arms with small
cross-sections. Samples with more than 10% doping of either metal tended to be
smaller particles – the maximum size of rhombohedra and hexagons is 50 nm,
with most being much smaller. Also, while individual nanoparticles appear to be

114
single crystals based on SAED images, it’s very possible that not the entire
particle is completely crystalline – the surface is still growing and not completely
incorporated into the lattice, creating a crystalline core and amorphous shell. This
can be seen in some TEM images, for example Tables 3.24, 3.27, 3.28 and 3.30. It
is also possible that individual particles have different Co-Mn stoichiometries,
which, if similar enough, would give overlapping XRD peaks, causing
linebroadening and skewing the Scherrer analysis to smaller particles. If this is
occurring, it could be determined using the GIF (Gatan Image Filter) mode on a
HRTEM, which allows for the elemental composition of individual particles to be
mapped. In general, however, due to the lack of correlation found in the region
0.1 ≤ Co ≤ 0.9 it cannot be said that metal content had a significant effect on
crystallite size..
4.14 Heating effects and heterogeneous vs. homogeneous
nucleation
It has been shown that variations in solution heating have a significant
effect on the outcomes of reactions. It is hypothesized that this is due to the
temperature shock causing extremely heterogeneous nucleation of nanoparticles;
the local growth conditions will vary wildly, leading to the cuboid nanoparticles
seen. The issues encountered with degassing and drying both TOA and OA, and
the need to distill OA, are likely due to similar processes.

115
Chapter 5. Conclusions
Rock salt- and wurtzite-type Co1-xMnxO with a wide variety of
nanoparticle morphologies, sizes and stoichiometries have been synthesized via a
solvothermal route. This is the first report of Mn-doped h-CoO and second report
of mixed Mn-Co rock salt oxide. Several types of particle shapes were recurring
throughout the investigation and represent different types of crystal growth
kinetics: 20-50 nm cubes with 50-200 nm cuboids; 20-50 nm hexagons and
rhombohedra; and 5-20 nm hexagonal-lattice spheres. Oleic acid is shown to have
several roles in nanoparticle formation – it is necessary for the incorporation of
both metals into the oxide lattice; it inhibits the rate of crystallite nucleation and
growth, stabilizing the metastable w-Co1-xMnxO phase; and also contributes to the
Ostwald ripening of particles that selects for rs-Co1-xMnxO. Water has also been
shown to speed the growth rate of crystallites and increase ripening, leading to rs-
Co1-xMnxO cuboid-shaped particles. The reliable synthesis of w-Co1-xMnxO
required very precise reaction conditions with relatively homogeneous nucleation
and no particles ever grew larger than 30 nm in diameter as a result of its
metastable nature. High surface area Co1-xMnxO showing dendritic growth may
prove to be of great interest as battery electrode materials. Understanding and
overcoming the synthetic challenges presented here will lead to the ability to
investigate the physical properties of both rs- and w-Co1-xMnxO in depth.

References
References
(1) Deer, W. A.; Howie, R. A.; Zussman, J. An Introduction to the Rock-Forming Minerals; 2nd ed.; Longman Group UK Limited, 1992. (2) Ahrens, T. J. Mineral physics and crystallography : a handbook of physical constants; American Geophysical Union: Washington, D.C., 1995. (3) Rao, C. N. R. Annu. Rev. Phys. Chem. 1989, 40, 291-326. (4) Cullity, B. D. Elements of X-Ray Diffraction; 2nd ed.; Addison-Wesley Publishing Company, Inc.: Reading, Massachusetts, 1978. (5) Mutin, P. H.; Vioux, A. Chem. Mater. 2009, 21, 582-596. (6) Gopalakrishnan, J. Chem. Mater. 1995, 7, 1265-1275. (7) Rousset, A.; Chassagneux, F.; Paris, J. J. Mater. Sci. 1986, 21, 3111-3115. (8) Park, J.; Joo, J.; Kwon, S. G.; Jang, Y.; Hyeon, T. Angewandte Chemie International Edition 2007, 46, 4630-4660. (9) Subramanian, M. A.; Torardi, C. C.; Calabrese, J. C.; Gopalakrishnan, J.; Morissey, K. J.; Askew, T. R.; Flippen, R. B.; Chowdhry, U.; Sleight, A. W. Science 1988, 239, 1015-1017. (10) Dagottoa, E.; Hotta, T.; Moreo, A. Phys. Rep. 2001, 344, 1-153. (11) Imada, M.; Fujimori, A.; Tokura, Y. Rev. Mod. Phys. 1998, 70, 1039-1263. (12) Voorhoeve, R. J. H.; Johnson, D. W.; Remeika, J. P.; Gallagher, P. K. Science 1977, 195, 827-833. (13) Kolmakov, A.; Moskovits, M. Annu. Rev. Mater. Res. 2004, 34, 151-180. (14) Comini, E. Analytica Chimica Acta 2006, 568, 28-40. (15) Chen, X.; Mao, S. S. Chem. Rev. 2007, 107, 2891-2959. (16) Huheey, J. E.; Keiter, E. A.; Keiter, R. L. Inorganic Chemistry: principles of structure and reactivity; 4th ed.; HarperCollins College Publishers: New York, Ny, 1993. (17) Yamanaka, T.; Tokonami, M. Acta Cryst 1985, 298-304. (18) Yeh, C.-Y.; Lu, Z. W.; Froyen, S.; Zunger, A. Physical Review B 1992, 46, 10086-10097. (19) Shannon, R. D. Acta Cryst. 1975, A32, 751-767. (20) Iwasaki, K.; Takizawa, H.; Yamane, H.; Kubota, S.; Takahashi, J.; Uheda, K.; Endo, T. Materials Research Bulletin 2003, 38, 141-148. (21) Karzel, H.; Potzel, W.; Köfferlein, M.; Schiessl, W.; Steiner, M.; Hiller, U.; Kalvius, G. M.; Mitchell, D. W.; Das, T. P.; Blaha, P.; Schwarz, K.; Pasternak, M. P. Physical Review B 1996, 53, 11425-11438. (22) Bobade, S. M. Appl. Phys. Lett. 2012, 100, 072102.

117
(23) Look, D. C. Materials Science and Engineering: B 2001, 80, 383-387. (24) Huang, M. H.; Mao, S.; Feick, H.; Yan, H.; Wu, Y.; Kind, H.; Weber, E.; Russo, R.; Yang, P. Science 2001, 292, 1897-1899. (25) Wang, Z. L. J. Phys. Cond. Matt. 2004, 16. (26) Wróbel, J.; Piechota, J. physica status solidi (b) 2007, 244, 1538-1543. (27) Wrobel, J.; Piechota, J. Solid State Communications 2008, 146, 324-329. (28) Clavel, G.; Willinger, M.-G.; Zitoun, D.; Pinna, N. Adv. Funct. Mater. 2007, 17, 3159-3169. (29) Dietl, T.; Ohno, H.; Matsukura, F.; Cibert, J.; Ferrand, D. Science 2000, 287, 1019-1022. (30) Kane, M. H.; Shalini, K.; Summers, C. J.; Varatharajan, R.; Nause, J.; Vestal, C. R.; Zhang, Z. J.; Ferguson, I. T. J. Appl. Phys. 2005, 97, 023906. (31) Kundaliya, D. C.; Ogale, S. B.; Lofland, S. E.; Dhar, S.; Metting, C. J.; Shinde, S. R.; Ma, Z.; Varughese, B.; Ramanujachary, K. V.; Salamanca-Riba, L.; Venkatesan, T. Nature Mater. 2004, 709-714. (32) Fukumura, T.; Zhengwu, J.; Ohtomo, A.; Koinuma, H.; Kawasaki, M. Appl. Phys. Lett. 1999, 75, 3366-3368. (33) Fukumura, T.; Zhengwu, J.; Kawasaki, M.; Shono, T.; Hasegawa, T.; Koshihara, S.; Koinuma, H. Appl. Phys. Lett. 2001, 78, 1348323. (34) Gilliand, S. G.; Sans, J. A.; Sanchez-Royo, J. F.; Almonacid, G.; Segura, A. Appl. Phys. Lett. 2010, 96, 241902. (35) Schleife, A.; Fuchs, F.; Furthm√ºller, J.; Bechstedt, F. Physical Review B 2006, 73, 245212. (36) Gopal, P.; Spaldin, N.; Waghamare, U. Phys. Rev. B 2004, 70, 205104. (37) Risbud, A.; Snedeker, L.; Elcombe, M.; Cheetham, A.; Seshadri, R. Chem. Mater. 2005, 17, 834-838. (38) Vioux, A. Chemistry of Materials 1997, 9, 2292-2299. (39) Burda, C.; Chen, X. J.; Narayanan, R.; El-Sayed, M. A. Chem. Rev. 2005, 105, 1025-1102. (40) Kwon, S. G.; Hyeon, T. Accounts of Chemical Research 2008, 41, 1696-1709. (41) Niederberger, M.; Garnweitner, G. Chem. Eur. J. 2006, 12, 7282-7302. (42) Moritz, T.; Reiss, J.; Diesner, K.; Su, D.; Chemseddine, A. The Journal of Physical Chemistry B 1997, 101, 8052-8053. (43) Chemseddine, A.; Moritz, T. European Journal of Inorganic Chemistry 1999, 1999, 235-245. (44) Trentler, T. J.; Denler, T. E.; Bertone, J. F.; Agrawal, A.; Colvin, V. L. J. Am. Chem. Soc. 1999, 121, 1613-1614.

118
(45) Joo, J.; Yu, T.; Kim, Y. W.; Park, H. M.; Wu, F.; Zhang, J. Z.; Hyeon, T. Journal of the American Chemical Society 2003, 125, 6553-6557. (46) Sun, X.; Zhang, Y.-W.; Si, R.; Yan, C.-H. Small 2005, 1, 1081-1086. (47) Ould-Ely, T.; Prieto-Centurion, D.; Kumar, A.; Guo, W.; Knowles, W. V.; Asokan, S.; Wong, M. S.; Rusakova, I.; Lüttge, A.; Whitmire, K. H. Chem. Mater 2006, 18, 1821-1829. (48) Wu, X.-L.; Guo, Y.-G.; Wan, L.-J.; Hu, C.-W. J. PHys. Chem. C 2008, 112, 16824-16829. (49) Hyeon, T.; Lee, S. S.; Park, J.; Chung, Y.; Bin Na, H. J. Am. Chem. Soc. 2001, 123, 12798-12801. (50) Jiao, F.; Frei, H. Energy Envir. Sci. 2010, 3, 1018-1027. (51) Numata, K.; Sakaki, C.; Yamanaka, S. Solid State Ionics 1999, 117, 257-263. (52) Cheng, F.; Shen, J.; Peng, B.; Pan, Y.; Tao, Z.; Chen, J. Nature Chem. 2011, 3, 79-84. (53) Li, W.-Y.; Xu, L.-N.; Chen, J. Adv. Funct. Mater. 2005, 15, 851-857. (54) Manthiram, A.; Kim, J. Chem. Mater. 1998, 10, 2895-2909. (55) Tan, L.; Liu, H. Solid State Ionics 2010, 181, 1530-1533. (56) Thackeray, M. M. Prog. Sold. St. Chem. 1997, 25, 1-71. (57) Dubal, D. P.; Dhawale, D. S.; Salunkhe, R. R.; Pawar, S. M.; Lokhande, C. D. Appl. Surf. Sci. 2010, 256, 4411-4416. (58) Lokhande, C. D.; Dubal, D. P.; Joo, O.-S. Curr. Appl. Phys. 2011, 11, 255-270. (59) Nakayama, M.; Suzuki, K.; Okamura, K.; Inoue, R.; Athouel, L.; Crosnier, O.; Brousse, T. J. Electrochem. Soc. 2010, 157, A1067-A1072. (60) Prasad, K. R.; Miura, N. Electrochem. Comm. 2004, 4, 1004-1008. (61) Ammundsen, B.; Paulsen, J. Adv. Mater. 2001, 13, 943-956. (62) Armstrong, A. R.; Robertson, A. D.; Bruce, P. G. Electrochimica Acta 1999, 45, 285-294. (63) Banov, B.; Todorox, A.; Trifonova, A.; Momchilov, A.; Manev, V. J. Power Sources 1997, 68, 578-581. (64) Kang, S.-H.; Kim, J.; Stoll, M. E.; Abraham, D.; Sun, Y. K.; Amine, K. J. Power Sources 2002, 112, 41-48. (65) Koksbang, R.; Barker, J.; Shi, H.; Saidi, M. Y. Solid State Ionics 1996, 84, 1-21. (66) Peng, Z. S.; Wan, C. R.; Jiang, C. Y. J. Power Sources 1998, 72, 215-220. (67) Rusakova, I.; Ould-Ely, T.; Hofmann, C.; Prieto-Centurin, D.; Levin, C. S.; Halas, N. J.; Lüttge, A.; Whitmire, K. H. Chem. Mater. 2007, 19, 1369-1375. (68) Hofmann, C.; Rusakova, I.; Ould-Ely, T.; Prieto-Centurion, D.; Hartman, K. B.; Kelly, A. T.; Luttge, A.; H., W. K. Adv. Funct. Mater. 2008, 18, 1661-1667.

119
(69) Zhang, L.-J.; Wang, J.-Q.; Li, J.; Zhou, J.; Cai, W.-P.; Cheng, J.; Xu, W.; Yin, G.; Wu, X.; Jiang, Z.; Zhang, S.; Wu, Z.-Y. Chemical Communications 2012, 48, 91-93. (70) Redman, M.; Steward, E. Nature 1962, 48, 867. (71) Seo, W. S.; Shim, J. H.; Oh, S. J.; Lee, E. K.; Hur, N. H.; Park, J. T. J. Am. Chem. Soc. 2005, 127, 6188-6189. (72) Grimes, R.; Fitch, A. J. Mater. Chem 1991, 1, 461-468. (73) An, K.; Le, N.; Park, J.; Kim, S. C.; Hwang, Y.; Park, J.-G.; Kim, J.-Y.; Park, J.-H.; Han, M. J.; Yu, J.; Hyeon, T. J. Am. Chem. Soc. 2006, 128, 9753-9760. (74) Han, J. J.; Yu, J. J. Korean Phys. Soc. 2006, 48, 1496-1500. (75) Liu, J. F.; Yin, S.; Wu, H. P.; Zeng, Y. W.; Hu, X. R.; Wang, Y. W.; Lv, G. L.; Jiang, J. Z. J. Phys. Chem. B 2006, 110, 21588-21592. (76) Meyer, W.; Hock, D.; Biedermann, K.; Gubo, M.; Muller, S.; Hammer, L.; Heinz, K. Phys. Rev. Lett. 2008, 101, 016103. (77) Nam, K. M.; Shim, J. H.; Han, D.-W.; Kwon, H. S.; Kang, Y.-M.; Li, Y.; Song, H.; Seo, W. S.; Park, J. T. Chem. Mater. 2010, 22, 4446-4454. (78) Wei, W.; Chen, W.; Ivey, D. G. J. Phys. Chem. C 2007, 111, 10398-10403. (79) Wei, W.; Chen, W.; Ivey, D. G. Chem. Mater. 2008, 20, 1941-1947. (80) Wei, W.; Egilmez, M.; Chen, W.; Jung, J. A.; Ivey, D. G. J. Mater. Sci. 2010, 45. (81) Juita; Dlugogorski, B. Z.; Kennedy, E. M.; Mackie, J. C. Proceedings of the Combustion Institute, 33, 2625-2632. (82) Wang, Y.; Wang, Q.; Artz, W. E.; Padua, G. W. Journal of Agricultural and Food Chemistry 2008, 56, 3043-3048. (83) Khan, N. A.; Cone, J. W.; Hendriks, W. H. Animal Feed Science and Technology 2009, 154, 183-192. (84) Mallégol, J.; Lemaire, J.; Gardette, J.-L. Progress in Organic Coatings 2000, 39, 107-113. (85) Lazzari, M.; Chiantore, O. Polymer Degradation and Stability 1999, 65, 303-313. (86) Ye, Y.; Yuan, F.; Li, S. Mater. Lett. 2006, 60, 3175-3178. (87) Zhang, Y.; Zhu, J.; Song, X.; Zhong, X. J. Phys. Chem. C 2008, 112, 5322-5327. (88) Manna, L.; Milliron, D. J.; Meisel, A.; Scher, E. C.; Alivisatos, A. P. Nat Mater 2003, 2, 382-385. (89) Penn, R. L.; Banfield, J. F. Science (Washington, D. C.) 1998, 281, 969-971. (90) Zitoun, D.; Pinna, N.; Frolet, N.; Belin, C. J. Am. Chem. Soc. 2005, 127, 15034-15035. (91) Alivisatos, A. P. Ber. Bunsen-Ges. 1997, 101, 1573-1577. (92) Sunagawa, I. Crystals Growth, Morphology and Perfection; Cambridge University Press, 2005.

120
(93) Chen, Z.; Xu, A.; Zhang, Y.; Gu, N. Curr. Appl. Phys. 2010, 10, 967-970. (94) Jun, Y.-w.; Choi, J.-s.; Cheon, J. Angewandte Chemie International Edition 2006, 45, 3414-3439. (95) Navrotsky, A.; Ma, C.; Lilova, K.; Birkner, N. Science 2010, 330, 199-201. (96) Özgür, Ü.; Alivov, Y. I.; Liu, C.; Teke, A.; M. A. Reshchikov, M. A.; S. Doğan, S.; Avrutin, V.; Cho, S.-J.; Morkoç, H. Appl. Phys. Rev. 2005, 98, 041301. (97) Trindade, T.; O'Brien, P.; Pickett, N. L. Chemistry of Materials 2001, 13, 3843-3858. (98) Ivanov, V. G.; Abrashev, M. V.; Iliev, M. N.; Gospodinov, M. M.; Meen, J.; Aroyo, M. I. Physical Review B 2010, 82, 024104. (99) Senn, M. S.; Wright, J. P.; Attfield, J. P. Nature 2012, 481, 173-176.