
Road tunnels and the environment
31
Road tunnels and the environment (§) E.J. Jacques (*) & L. Possoz (**) (*) Department of Mechanical Engineering, Unité TERM, Université Catholique de Louvain, Belgium, (**) Mitec sa, Belgium. INTRODUCTION « Environment » is one of these in-words, that is a subject for many discussions and publications, but the content of which is not always very well defined and therefore does not always cover the same concept. Obviously, environment is everything that surrounds. Webster’s dictionary defines it more precisely as : “ The surrounding conditions, influences, or forces that influence or modify : as : “ a) the whole complex of climatic, edaphic and biotic factors that act upon an organism or an “ ecological system and ultimately determine its form and survival; “ b) the aggregate of social and cultural conditions as customs, laws, language, religion and “ economic and political organisation that influence the life of an individual or community. An engineer in his professional activities would often use the word « environment » as a sort of opponent to pollution which again, is a word difficult to define. Environment to him then would mean a set of standards and recommendations that he must comply with and threshold values that must not be exceeded. His technical solutions would be developed keeping in mind that the inevitable outputs as noise nuisance, waste or effluents do not debase the living and working conditions inside and outside the process that he is designing or operating. But, environment would also mean that he should pay attention to safeguarding the natural resources by using as much as possible of the e.g. renewable energy sources and recycled materials, and strive to achieve long-lasting developments. OBJECTIVE OF THE PAPER : The objective of this paper is to look at one particular achievement, i.e. urban road tunnels, the ventilation of which directly concerns the environmental problems. Indeed, ventilation is precisely designed and operated to secure an ambient atmosphere inside the tunnel that is clean, healthy and possibly pleasant for the user. But the immediate surroundings of the tunnel should also not be overlooked. Indeed, the environmental conditions near the tunnel portals must be preserved. This is specially true in urban sites. Moreover, controlling the discharge of pollutants through chimneys or exhaust openings in the ceiling is also an important issue. (§) TEMPUS STRUCTURAL JOINT EUROPEAN PROJECT S JEP-07397-94, 1996, Proceedings of a workshop on "Measurement techniques in energy systems and processes",pp. 83-108.
Transcript of Road tunnels and the environment
Road tunnels and the environment(§)
E.J. Jacques (*) & L. Possoz (**)(*) Department of Mechanical Engineering, Unité TERM, Université Catholique de Louvain,Belgium,(**) Mitec sa, Belgium.
INTRODUCTION
« Environment » is one of these in-words, that is a subject for many discussions andpublications, but the content of which is not always very well defined and therefore does notalways cover the same concept. Obviously, environment is everything that surrounds.
Webster’s dictionary defines it more precisely as :“ The surrounding conditions, influences, or forces that influence or modify : as :“ a) the whole complex of climatic, edaphic and biotic factors that act upon an organism or an“ ecological system and ultimately determine its form and survival;“ b) the aggregate of social and cultural conditions as customs, laws, language, religion and“ economic and political organisation that influence the life of an individual or community.
An engineer in his professional activities would often use the word « environment » as asort of opponent to pollution which again, is a word difficult to define. Environment to him thenwould mean a set of standards and recommendations that he must comply with and thresholdvalues that must not be exceeded. His technical solutions would be developed keeping in mindthat the inevitable outputs as noise nuisance, waste or effluents do not debase the living andworking conditions inside and outside the process that he is designing or operating.
But, environment would also mean that he should pay attention to safeguarding the naturalresources by using as much as possible of the e.g. renewable energy sources and recycledmaterials, and strive to achieve long-lasting developments.
OBJECTIVE OF THE PAPER :
The objective of this paper is to look at one particular achievement, i.e. urban road tunnels, theventilation of which directly concerns the environmental problems. Indeed, ventilation isprecisely designed and operated to secure an ambient atmosphere inside the tunnel that is clean,healthy and possibly pleasant for the user.
But the immediate surroundings of the tunnel should also not be overlooked. Indeed, theenvironmental conditions near the tunnel portals must be preserved. This is specially true inurban sites. Moreover, controlling the discharge of pollutants through chimneys or exhaustopenings in the ceiling is also an important issue.
(§)TEMPUS STRUCTURAL JOINT EUROPEAN PROJECT S JEP-07397-94, 1996, Proceedings of a workshopon "Measurement techniques in energy systems and processes",pp. 83-108.

ROAD TUNNELS
Building road tunnels is today a manner of responding to the unavoidable problem of the everincreasing traffic volumes in densely populated areas.
Besides the psychological and stress aspects, driving through tunnels adds new problems tothe ones already created by traffic on open roads. The new problems concerned include :• air pollution with subsequent possible health hazards,• absence of escape lanes which constitutes a severe risk for people who have to stop their cars,• reduced visibility that causes higher accident rates,• fire hazards and subsequent smoke development which could be a real threat in tunnels,• etc ...
In the context of creating a healthy and safe environment in tunnels, one has to maintain ahigh standard air quality, good visibility, an acceptable noise level, and reduce as much aspossible all potential hazards by carefully designing the tunnel management system. This goal isachieved mainly by :
∗ identifying correctly the different characteristic parameters of the traffic flow, such asspeed, concentration, congestion and/or presence of stopped cars, and so on, ...,
∗ predicting, based on this traffic information, the forthcoming pollution,∗ acting subsequently on the mechanical ventilation equipment (injecting and extracting
fans, jet-fans, and so on, ...) in order to maintain the required air quality level, yet atminimum energy costs,
∗ detecting, instantaneously, all kind of hazards, and,∗ taking adequate decisions by e.g. dispatching the alarms according to some priority
rules, sending effective and efficient messages to the user, if and when needed, and soon, ....
Since the complexity of tunnels is increasing and users are ever more demanding, especiallywhen their health and safety are concerned, there is an undeniable need to install sophisticatedand expensive equipment such as high-sensitive pollution meters, fire detection systems, trafficsensing devices and video cameras. Unfortunately, most of this equipment, sometimes installedat different life stages of the tunnel, operates in a stand-alone mode, the first concern being onlythe display of the measured data.
Nevertheless, one could gain more from these valuable measurements and information byintegrating them into a single processing system, making not only the expenses more profitable,but there could also be other benefits too, such as :• information of different nature and origin, processed together may increase the reliability of
the system, and hence reduce false alarms,• part of the operator's decision making may be supported by proposals issued by an artificial
intelligence processing unit, the so-called "expert system",• operational ventilation costs due to pollution could be reduced, either by controlling the
traffic through changeable road signs and variable message panels, or by anticipating certainactions on the ventilation. In the latter case, traffic data would be processed together withpollution measurements. The calculated pollution trend could then help predict theforthcoming concentrations, thus enabling to smooth out critical pollution peaks byanticipating the necessary actions on the fans.

With the help of a representative example of a long, complex and well equipped tunnel, forexample, the Belliard tunnel in Brussels, Belgium, most aspects of the environmental problemswill be tackled.

SOURCES OF POLLUTION
Traffic is undoubtedly one of the important sources of environmental and air pollution. It doesnot only have a harmful impact on health but also indirectly debases quality of life by disturbingthe eco-system, destroying our urbanistic and cultural inheritance, and so on. Despite all effortsand all kinds of recommendations to reduce, specially in large cities, both traffic flow and one ofits first nuisances, i.e. the pollutant emissions, it may be expected for the next few decades thattraffic will remain an important source of pollution. Therefore a lot of money has been investedin installing monitoring equipment, developing data transmission networks and buildingsupervision centres.
The combustion of fuels (gasoline, LPG, diesel oil, and so on, ...) in vehicle enginesproduces a lot of substances. Depending on their concentration, their chemical stability and theiradverse effects on environment and human being, the most relevant compounds in the exhaustgas are : SO2 The production of SO2 due to the traffic is related to the sulphur content of the fuel.
Today, diesel contains a mass concentration lower than 0.2%. For gasoline it is even lowerand for LPG it is virtually zero. Since the traffic contributes only 5% of the total SO2emission, the possible presence of this pollutant is usually not taken into account as far astunnel ventilation is concerned.
CO2 This compound is the main product of the combustion of a fossil fuel. The substance is
not directly responsible for health damage, but could contribute to what is called the« greenhouse » effect. Although a non negligible amount of the produced CO2 has to betaken on account of the traffic, the problem, if real, has a world-wide extent and as such is notspecific to tunnel ventilation.
CO This pollutant is produced in a reducing atmosphere, either by an overall shortness of the
combustive, or by a local deficiency due to the non-homogeneous character of the mixture offuel with air. As a rule, spark ignited engines produce more CO at lower speeds. Theintroduction of a catalyst, however, drastically reduces the emission of CO by a factor of 10.
NOx The mixture of NO and NO2, of which the latter is a very toxic substance, is often
referred to as NOx. Measurements show that traffic contributes for about 60% to the entireNOx pollution. This compound is not related to the kind of fuel used but to the fact that air isused for combustion. At high temperatures, its two main compounds combine in order toform NO (together with small amounts of N2O) and this reaction is sufficiently fast enough toproduce a measurable quantity. On the other hand, the cooling down after the combustionprocess is too fast to allow a reversible dissociation of NO into its two compounds. A smallamount of this NO is then transformed by oxidation into NO2 at the exhaust pipe of thevehicle. The mutual interactions of the triangle NO, NO2 and O3 in a pure atmosphere underthe influence of solar light irradiation are already very complex. But, if we additionally takeinto account that other polluting free radicals such as (CHO)-, (OH)- and (HO2)- are present orproduced in exhaust gases, then the production of NO2, together with some other pollutantsand fog, becomes extremely complex and may involve hundreds of equations. More detailscould be found in Chovin, [1].

It is worth noting that the rate of oxidation is very dependant on the NO concentration, andthat the formation of NO2 is favoured by a higher pressure and a lower temperature (<160°C).
VOC Subjective and unpleasant impressions often reported in some tunnels makes one
assume that other pollutants than CO and NO2 must be present in the air. Among them wecan identify substances such as aromatic and aliphatic hydrocarbons that are produced by thevaporisation of the incombusted liquids and their partially burnt compounds CxHyOz as aresidue of incomplete combustion. Usually, these HC’s are measured as a whole, mostly by atechnique of flame ionisation (FID).
Congested traffic situations with a lot of accelerations will inevitably increase this kind ofpollutant production. Typical concentrations can be found in (Haerter, [2]), see table 1.
Particles They constitute a different kind of pollution. Although some of them, such as
polycyclic aromatic hydrocarbons are known for their cancer producing effects andasbestos for causing malignant pneumoconiosis, their presence, after a certain concentra-tion, has mainly the inconvenience to reducing visibility.
Threshold limit values and biological exposure indices can be found in ACGIH, [3].Fortunately, the quantities involved are only of the order of a few µg /km/vehicle. Typicalconcentrations can be found in table 1 (Haerter, [2]).
fluid trafficaverage 60 km/h
congested trafficaverage 20 km/h
congested trafficaverage 5 km/h
pass.cars
citytrucks
pass.cars
citytrucks
pass.cars
citytrucks
Carbon monoxide CO
Hydrocarbons HC
Nitric oxides NOx
Sulphur dioxide SO2
Lead Pb
Soot C
6
1
2
0,02
0,01
-
4
3
14
1,5
-
0,2
16
2,5
1,5
0,04
0,02
-
12
8
15
2
-
0,4
42
5,5
1,5
0,1
0,03
-
38
28
21
3
-
1
Table 1. Emissions in g/km of German passenger cars, reference year 1985
Of course, all these chemical substances don’t show the same damaging hazards : some can,even in very low concentrations, be harmful to one’s health (toxic) while others may cause onlyinconveniences that, nevertheless, could lead to a poor safety level.
Toxicity is defined by Lauwerys, [4], as the capacity inherent in a substance to producinga deleterious effect on the living organism. One could define it as a limit above which theorganism is no longer capable of neutralising the permanent influence of the considered

substance without leaving visible irreversible damage, the so-called after-effects. Thesesubstances cover, of course, a lot of different meanings and almost each of them acts in adifferent manner on the human body. Tolerated quantities are given by Lauwerys, [4].
LEGISLATION
As a rule, standards limit the emission of noxious substances produced by vehicles. Afortunate interaction between the legislator and the vehicle building industry has enabled thereto be a significant reduction in the tolerable limits over the past decades, mainly where CO isconcerned.
It is only recently that NOx has also been taken into account. Lately, equipment has beeninstalled to also measure this substance inside the tunnel. Today, there is at least one officialdecree known that enforces an upper limit value of the NO2 concentration in tunnel air.
It is also important to be aware that in the vicinity of the ventilation stations and theportals, the NO2 limits imposed are most likely to be exceeded. Thus the NOx emission, which almost exclusively occur in the form of NO, and the conversion from NO into NO2, must beknown in order to assess the situation.
Even though the HC’s are most unpleasant pollutants, there is no hygienic limit value fortotal HC, making it difficult to use concentration levels for the assessment of environmentalimpact.
The effectiveness of emission standards depends, of course, on the level of averageemission that can be achieved and that can be monitored. Practically, there are three categoriesaccepted in their authority in setting standards :− US standards;− EU standards;− Japanese standards.These standards were put together in table 2 by Pischinger, [5].
From the point of view of air quality in tunnels, a general basic idea seems to prevail :short time exposure would allow a higher pollutant concentration than a prolonged exposure.This would be in the case, for example, of traffic being congested.
Tunnel ventilation is usually designed and monitored with regard to CO and smoke. Butin order to have some information about the possible concentrations of other pollutants,Patigny, [6], made a comparative study. It was aimed at defining the minimum air flowvolume that would be sufficient enough to dilute all the other known substances below theirTLV. Based on values in literature (ACGIH, [3]), (Lauwerys, [4]), (A.P.P.A., [7]), whichunfortunately for some compounds show a lot of dispersion, this study concluded roughly that,except for the aldehydes, which act in a similar manner as the NO2, and therefore their effectsshould be added, all the pollutant substances stayed well below their threshold value if theTLV of NO2 was not exceeded. Nevertheless this result should be taken with precaution.
What legislation in Belgium is concerned with, is that the district of Brussels-Capital,Belgium, ordered a decree that, summarised, limits the average value of the CO concentration(i.e. the averaged value of all the sensors) at 100 ppm and the maximum value of NO2concentration at 500 ppb.
Moreover, according to this same official decree, the TLV’s applicable for CO and NO2 aredependent on the travel time through the tunnel.
Figure 1 shows how the TLV of CO is related to the travel time, i.e. the time needed by avehicle to drive through the tunnel. This diagram is based on the FORBES formula given byLauwerys, [4],

TABLE 2

log10 HbCO(%) = .85753log10 CO(ppm) + .62995log10 t(min) - 2.29519,
evaluated for a permissible concentration of2.24 % carboxyhemoglobine in the blood.Defining the values of maximum allowable NO2concentrations as a function of exposure time is
much more difficult to achieve, since thereare only a few values available for short termexposures (STEL values) and some for 8hour exposures (TWA values). Guided by the W.H.O., [8], the authorities resolved on enforcingthe diagram of figure 2. Acceptable TLV’s are situated within the hatched area.
VENTILATION SYSTEMS
Tunnel ventilation systems can be classified into three basic ventilation schemes, i.e.longitudinal, transverse and semi-transverse ventilation.
Longitudinal ventilation
The principle of the longitudinal ventilation is to favour the natural draft by acting in such amanner that the mean air flow velocity has a sufficient value. For this purpose, one installs, closeto the walls or the ceiling, one or more jet-fans that provide the necessary driving force. Thiskind of ventilation system is particularly suitable for one way traffic, i.e. the air is blown in thesame direction as the traffic goes.
With regard to pollutant concentrations, their maximum values are to be expected at thetunnel exit, or, if several sections are present, at the end of each section. The growing rate is, ofcourse, a function of the amount of emitted pollutants which, for a constant traffic flow may beassumed as being approximately constant.
Transverse ventilation
Inlet, as well as outlet air, is ducted along the tunnel. It is blown into the tunnel through more orless equally spaced openings (slots) along one of the walls. The vitiated air is sucked off at the
Figure 1. TLV of CO.
Figure 2. TLV of NOx.
opposite wall also through equally spaced openings and let into a collecting duct. In this mannerthe air will theatrically flow perpendicular to the axis of the tunnel and thus also to the traffic.Therefore, this ventilation scheme is particularly suitable for all kinds of traffic and for longtunnels. Of course, the air volumes that are supplied and sucked off may be different, whichallows for a number of combinations. Since the air moves transversely to the traffic, one canexpect that the pollutant concentration over the entire length of the tunnel will be nearlyconstant, certainly if the longitudinal velocity component of the air flow is reasonably low. Semi-transverse system
This ventilation scheme could be considered as a combination of both the transverse andlongitudinal ventilation system. The fresh air is supplied through openings in the walls or theceiling, and the vitiated air flows along the tunnel and leaves it through one of the portalsaccording to the combined action of the pressure difference between them and the piston effect.If there is no driving force available that would create a longitudinal velocity component, thenthe tunnel air flow would be zero in the middle and maximum at both portals. Depending on theextend of a longitudinal driving force (piston effect, wind, and so on ...) the resulting zero pointvelocity would shift along the longitudinal direction until it leaves one of the portals. Assuminga linear variation of the air velocity, the subsequent pollution concentration will follow alogarithmic function along the tunnel.
It is quite obvious that assuming the traffic flow and speed to be constant, is not veryrealistic. Nevertheless, the above basic ventilation schemes may give some indications about thesuitable locations where the measurement devices should be installed for higher efficiency. SURROUNDINGS
Due to their confining character, it is beyond doubt that for equally dense traffic, the airbornepollutant concentrations in the tunnel are much higher than the ones on the open road, even inseverely polluted cities. Table 3 taken from Haerter, [2], shows some typical concentrations thathave been measured in different areas.
The uncontrolled discharge of vitiated air through portals and roof openings or shortchimneys may make the pollutant concentrations in the surrounding area exceed the standards.Particularly for longitudinal and semi-transverse ventilation systems, a certain number ofsolutions to this problem may be applied :• dilute the tunnel air, just before it leaves the portals, by an adequate fresh air supply,• provide a chimney through which most of the tunnel air is extracted,• clean the tunnel air from certain pollutants by off-line precipitating and filter systems
(Hennings, [9]),• design the portal geometry in order to favour the dispersion of pollutants.In this environmental perspective, several studies have been carried out in order to evaluate theimpact of the tunnel air discharge on the surrounding residential areas. So far, three techniques,all successful, have been used :• local measurement sessions with portable instruments in the vicinity of exhaust grids located
in streets or recreation areas (Elisabeth park, de Jamblinne-de-Meux place),• small scale modelling (Nadel, [10]), a technique that has been used to simulate the dispersion
of the CO and NO2 substances released by an exhaust chimney. For example, in view ofdetermining the location and geometry of an exhaust chimney at the de-Jamblinne-de-Meuxplace, a 1/200 model has been built. It assisted in evaluating the impact of the resulting

TABLE 3
pollution on the surrounding buildings. Three measurement sessions on site, one beforeconstruction of the chimney and two afterwards, could confirm the predicted values.
• CFD simulation allows the study of, for example, the influence of the size of a roof openingon the re-entrainment of polluted exit air into the next section of the tunnel. This kind ofsimulation could give an answer to the question of whether leaving part of a tunnel uncoveredis efficient or not, and if so, what the dimensions of the opening should be.
BELLIARD TUNNEL
General description
The Belliard tunnel is an urban road tunnel in the centre of Brussels. It is a complex tunnel, notonly because of its length and its several access and exit roads, but also because of its Y-shape.Considered as a single tunnel, this particular Y-shape is due to the assembling of parts of threepreviously existing tunnels. It links the inner ring road of Brussels with the east of the countrythrough the E40 highway, and with the south of the country toward the E411 highway. Moreover, it serves a local area in Brussels as may be seen on figure 3, and allows access to theindependent underground parking areas of two EC-buildings, viz. the Berlaymont and theConseil buildings.
With its three-lane entrance, the tunnel is an extension of the important five-lane Belliardstreet. These three lanes, joined by an additional lane from the Conseil parking lot, form a four-lane road in the first part of the tunnel. Then, after some 460m, it splits into two separate two-lane roads. The length between the entrance at Belliard street and the most distant exit i.e. theeast portal, is nearly 2 km. The southern branch of the tunnel is much closer to the split,extending only 300m.
The ventilation is of the longitudinal type, but with intermediate air extraction andsubsequent fresh air injection. The air flow volumes match at least the fresh air demands in eachof the sections of the tunnel. As may be seen on figure 3, there are altogether 13 slots, denotedby Innn for an injection slot, and Ennn for an extraction slot, nnn being a sequence number, eachslot being supplied by a twin fan system. These twenty six fans are all equipped with variablepitch angles.
Since it was not always possible to install fans and injection slots at locations where apreliminary theoretical study indicated that they should be, ventilation needed to be boosted insome parts of the tunnel by means of jet-fans. These are indicated on figure 3 by GRnn., nnbeing the number of the group of jet-fans. Heavy traffic is not allowed in the tunnel. Therefore,the ventilation has been calculated for an exclusive use by light traffic, of which 10% is assumedto be equipped with diesel engines. For this reason, it is expected that there will be no problemswith opacity and only minor problems with NOx pollution.
The main criteria and standards for calculating its minimum ventilation capacity form thesubject matter of an official ministerial decree, that is already been mentioned.
It is also important to be aware that the ventilation capacity in certain sections has been re-inforced to respond to emergency cases, particularly fire hazards. However, this aspect is out ofthe scope of this paper.
MEASUREMENT EQUIPMENT
Tunnel monitoring systems which operate entirely exposed to the grim tunnel environmentsuffer a great deal from getting dirty where e.g. the optical surfaces are concerned. This is a

considerable problem, particularly if visibility measuring equipment is involved. The detrimentaleffects of tunnel washdowns and the constant exposure to suspended exhaust carbons and otherparticles,

FIGURE 3

necessitate a large amount of maintenance resulting in a low availability rate. Problems likethese have resulted in the equipment having a poor reputation. Any tunnel monitoring equipmentmust, to a certain extent, come into contact with the tunnel atmosphere.
Some criteria for good measurement devices are :∗ in the case of tunnels, the most important is certainly their reliability, i.e. the capacity to
measure and give out the needed information without failing even after long periods of time.The MTBF should preferably be years, rather than months;
∗ robustness should be preferred to accuracy;∗ if sophisticated equipment is used, the measurement should be accompanied by a kind of
validity status that informs the user on the quality of the information;∗ Automatic self-checking and calibration will offer an higher level of confidence.
Traffic
Flow volume and speedSince traffic is the source of pollution in a road tunnel, it is obvious, although only recently putin practice, that the measurement of certain traffic parameters has to be considered in the firstplace. The traffic variables, which are the traffic flow volume, i.e. number of vehicles perunit of time, and the traffic speed in km/h, are measured by analysing the successive pictures ofthe traffic taken by video cameras. More can be learned in Versavel et al., [11].
However, from the pollution emission point of view, much more useful data would betraffic concentration, i.e. the number of vehicles per km.
A correct prediction scheme of the traffic flow volumes would certainly be the mostadequate application in the scheduling of ventilation fans. It is believed that accurate predictionsof the traffic flow volume will both reduce ventilation costs and improve air quality. Severalalgorithms have been developed (Edie et al., [21]) and tried out to predict both flow and speedparameters and to calculate the average travel time. The latter result may also be directlyobtained by tracing marked vehicles or license plate recognition, but it needs the implementationof more sophisticated equipment.
Each camera will normally monitor two lanes. The implementation of the cameras isindicated as TCnn on figure 3.
Pollution
CO pollution meterThis device uses the well proven non-dispersive infrared (NDIR) absorption technique, which iscapable of operating on a real time basis. CO absorbs infrared in a very specific manner,producing an absorption spectrum. Infrared radiation is split into two parallel beams, one passingthrough the sample compartment and one to a reference cell. The differential signal indicatingthe CO level is converted into a standard 4-20 mA output. Threshold levels can be set via akeypad to trigger alarms to warn of high CO concentrations. Within the useful operationaldomain, i.e. between 0 to 200 ppm, the accuracy is 10 ppm or 10% of the reading. This accuracyis achieved by using a cylindrical sample compartment that has a length of no less than 3m.
Of interest is its auto-calibration capability, therefore requiring very little maintenance.Besides an analogue output signal from 4 to 20 mA, the device signals a faulty functioning andany transgression of a level setting.
Their location, indicated as CO01 through CO08, may be seen on figure 3.
NO2 pollution meterThe sensor is based on the physical principle of chemiluminescence : NO molecules are oxidisedby the chemical reaction between ozone and NO. This reaction gives a light output that isproportional to the quantity NO2 being produced and thus also to the initial NO quantity present.
The real NO2 concentration in the air is calculated by the difference between twomeasurements obtained by a double application of the aforementioned principle : the sample issplit and travels through two separate test-channels. In the first one all the NO is transformedinto NO2 and measured. In the second one, the initial NO2 is first reduced into NO and then theentire NO content is oxidised and measured. The method is accurate and reliable only if verylow concentrations are to be measured (0 to 1 mg/m3), but its implementation as a practicalmeasure-ment technique results in a very sophisticated and expensive instrument that must behandled with care. To our knowledge no such devices have ever been specially designed to beinstalled in the adverse environmental conditions that exist in a tunnel. Since they are veryexpensive, only three have been installed. Their locations are indicated on figure 3 as NO21,NO22 and NO23.
The instrument itself is not installed in the tunnel but behind its walls. The actualmeasurement is done on the basis of samples continuously taken by a small pump system. Thefull scale measurement range is programmed to be 1 ppm.
Flow volume
In the tunnelThere is still no reliable method for measuring the air flow volumes in tunnels. Devices based onthe ultrasonic principle may provide an acceptable solution to this problem.
The measurement technique uses two ultrasonic devices, each facing the other on theopposite wall of the tunnel, making a line that is at an angle of approximately 45° to the axis ofthe tunnel. Each of them emits and receives, in turn, a beam of short ultrasonic pulses. Themeasured difference in travel time between the two beams, is due to the axial velocitycomponent of the air flow, which multiplied by the cross-section is precisely the quantity that weseek to estimate.
Three of such devices, referenced as QT01, QT02 and QT03 on figure3 have been installed.They allow to measure air velocities, averaged on a straight line, in the range of -10 to 10 m/s.
Of the fansThe air flow rate through the fans is calculated from the velocity pressure measured at the inletpiece of each fan by means of an electronic differential pressure sensor. Since ventilation controlinvolves only flow variations, this method, properly calibrated, was expected to providesatisfactory results. In fact, due to the manner that most fans have been installed within their ductsystems, the velocity pattern at their inlet is far from uniform and steady. This problem is stillunder study.
OpacitySmoke concentration often provides the actuating signal in ventilation control. However, sincethe Belliard tunnel does allow heavy traffic to pass through, visibility problems were notexpected. This was later confirmed.
Fire detectors

Fire detection uses a dual rate-of-rise/maximum-temperature sensor. The sensors are locatedapproximately every 15m along the length of the tunnel. Grouped into so-called zones whichcorrespond roughly to the different theoretically possible fire scenarios, each zone is served byone collective signal line. Therefore, all sensors in the same zone have a common address.
Since this information does not contribute to the environment problematic, no furtherthought will be given.
MECHANICAL VENTILATION EQUIPMENT
Fans
The fans, altogether 26, are axial, anti-stall fans with variable pitch angle, each equipped with adamper. They are set up in groups of two fans operating in parallel, each pair being controlledas a single operating unit.
The ventilation capacity of each fan has been calculated in such a manner that itcorresponds to approximately 50% of the estimated capacity in case of fire. This solution offers,besides maintenance advantages, also the possibility to run alternatively one fan and then theother, mostly at maximum efficiency. The difficulty however, is the transition from one to twofans, and vice versa without disturbing too much the ventilation in the tunnel. This problem hasbeen studied on a small scale model and will soon be published.
The single control unit allows to monitor the different information coming from the fanssuch as heating problems of the bearings, protection against overload of the motor, the start-and-stop procedures, the opening and closing of the dampers, and the pitch angle settings in order tomatch the required air flow quantity.
Jet-fans
Since it was not always possible to install air injecting slots where needed, 44 jet-fans,irregularly distributed along the tunnel, were additionally required to ensure a sufficientventilation capacity at any one of its sections. From the functional point of view, they aresubdivided into 11 groups. When full ventilation capacity is not needed, this logical subdivisionhas the advantage that either one fan within the same group can be started up, so allowing tooperate them in turn.
MONITORING SYSTEM
The responsibility of the government to meet legal obligations requires the set-up of amonitoring system that takes account of the need to obtain representative measurements andperform accurate analyses on these data. Carefully designed monitoring programs are alsorequired by engineers who investigate improved environmental control technology, by operatorswho run the ventilation process and by rescue officers who are in charge of safety.
The frequency of sampling, averaging in space as well as in time, need to be carefullyconsidered. A reasonable monitoring cycle time that comes close to a real time response inrelation to the ventilation and pollution process, has been considered to be 1 minute.
The system architecture is depicted in figure 4. Basically it consists of three logical entities:

1. the controlling unit, which is mainly set up by two independent and parallel workingsupervision automatons, each exchanging data with six programmable datalogging systems,and assisted by an expert system;
2. the left part, which is the set of measurement devices and;3. the right part, which assembles the fans.It should not be overlooked that the transmission of the data must also have full attention. Thereis no point in spending a lot of money in high quality measurement sensors, if too often itsoutput

FIGURE 4
data is lost or its content is distorted during transmission. Therefore, higher level transmissionsystems i.e. digital telegrams, should be preferred to analogue connections.
CONTROL SYSTEM
Problem statement
As already mentioned, the first objective of a good ventilation system is to provide a safe,comfortable and clean environment inside the tunnel, and minimise the adverse effects outsidethe tunnel. Therefore, the air quality must comply with existing standards and recommendations.Deviating from these norms inevitably calls alarms to be triggered, and actions to be taken. Acorrect interpretation of these alarms with subsequent proposals, and, if necessary, the adequateactions on the mechanical equipment according to an in advance prepared scheme, could well beovertaken by an « intelligent » processing unit. This unit, the so-called expert system, extendsthe capabilities of the monitoring system to a control system.
The objective of the ventilation control is two-fold :� first, it must provide ventilation systems that are economical in routine operation, i.e.
adapt the ventilation to the real but minimum fresh air needs. Adequate air flow rate isindeed a compromise between two conflicting requirements. But on the one hand, the airflow volume must be sufficient to dilute the pollutants emitted by the vehicles. On theother hand, the air flow quantities should be as low as possible to save energy and reducerunning costs. Hence, an efficient control system is the one that, at any time, willguarantee these optimal air flow quantities in every section of the tunnel.
� second, it must control the ventilation as safely and efficiently as possible in emergencycases resulting from breakdowns, accidents or fire. Fires are unfortunately among themost hazardous situations. In this particular case, it is important that the ventilationsystem be capable of controlling the direction of smoke motion in order to provide aclear and safe path for escaping and rescuing people, as well as an easy access for the firebrigade (Heselden, [12]).
Any gains from greater operational security are difficult to estimate. However, the energysavings which accrue from optimal management of the ventilation system are obvious. Indeed,for important tunnels the electrical power may well exceed 1 MW per km. A reduction of thisamount by only 10%, a figure that seems easily within the reach of a good control system, wouldallow savings of around 1 million BEF (approximately $33,000-) per year/km. But, what is evenmore important is that each kWh saved will undeniably reduce the pollution, whatever kind, atthe location where this kWh is produced.
Basic considerations
The knowledge gained through our studies concerning the application of computer controlledprocesses in the field of mine ventilation (Patigny, [13]), (Jacques, [14], [15]), led us to considera few basic guide-lines :- since instabilities in ventilation must be avoided at all times, it is advisable to pay more
attention to this aspect than in reaching the optimum. A less optimal, but stable solutionshould be preferred to any sophisticated control system that tries to follow too closely thefluctuations in traffic and pollution. Moreover, the time lag between pollution build-up,detection and pick-up by instruments, and resulting actions of the fans upon the ventilation,could well take from up to several minutes to a quarter of an hour. Thus, averaging over a

longer time period which would possibly take into account the forthcoming pollution, is astrategy to be welcomed.
- the ventilation of a complex tunnel should always be controlled from a central point of view.Indeed, complex tunnels with longitudinal ventilation behave like networks where, accordingto Kirchhoff laws, all flow rates are linked (Wang, [16]). Trying to change one of them,inevitably results in disturbing, to a greater or lesser extent, all other flows, and thus also thepollutant concentration. Moreover, one should be aware that, in contrast to single tubetunnels, the pressure distribution in such a network can play a significant role. Mainly forthese two reasons, it is vital that, before any action is taken, the potentially disturbed sectionsbe predicted. Proceeding otherwise could result in a kind of "bouncing" game betweeninteracting but not necessarily adjacent fans. The control problem is in fact even morecomplex, since other aerodynamic sources, such as traffic induced ventilation and naturalventilation, may interfere.
- measured data should always be checked and validated. One must never rely on a singlemeasurement, even if the equipment is ascertained to work properly. Validation could makeuse of statistical tools and, more important, of information obtained by different measuringtechniques. Redundancy and diversification of the measured data are therefore never aluxury !
Application to tunnel ventilation
With these considerations in view, the ventilation control system may make use of the followingmeasurements :. concentration of the different pollutants in each part of the tunnel,. throughflow of the fans, as well as the flow rates in the tunnel sections,. mean speed and traffic flow or concentration in each section,. wind velocity and its direction, and,. alarm-signals of smoke and fire detectors.
Basically most of these data are provided by the sensors installed in the tunnel for monitoringpurposes. Some of the measurements, such as the air flow rates and the traffic data are thencombined and used to assess the concentrations of the pollutants by means of empirical laws(PIARC, [17], [18]). In this way, they constitute a first hand estimation of the future pollution.
Others, such as the pollutant concentrations, would be used in a direct manner in order tomake sure of the efficiency of the ventilation.
A comparison between the estimated pollution values and the direct measurements, possiblydelayed over a certain time, may well provide some sort of validation technique, which wouldincrease the confidence level of the entire control system.
Next, the measurements, if compared to the previously recorded values, can provideinformation about the rate of growth of the pollution. The latter information is particularlyuseful to determine the urgency with which the control devices should be programmed torespond. Moreover, it allows to anticipate the up-coming pollution, and may therefore reducethe number of compensating actions over a given time period, and thus the mechanical wear.
Of course, the new set points of the fans are related to the fresh air quantities that one needsto cut the pollution level back below the TLV's for each of the considered pollutants.
Unfortunately, as far as complex tunnel structures are concerned, this relationship betweenthe required fresh air flow rates at any section of the tunnel, and the amount of air to be input byeach fan is not linear. Since jet-fans also interfere in these calculations, it becomes obvious that

a reliable numerical model (Jacques, [19]), (Ferro, [20]), is an essential tool if ventilation controlis to be achieved. Once calculated, the new set points are transmitted to the controller of eachfan. They will act on either blade angle setting or rotational speed. In case of jet-fans, thesesignals usually take only Boolean values, i.e. "on" or "off".
CONTROL STRATEGY
The required air flow volume of fresh air is usually calculated with the following formula :
where NV is the number of vehicles, qPL the volume of pollutants, nL the number of lanes, L thelength of the tunnel, and where the TLV, in the case of the tunnels in Brussels, is furthermorerelated to the average travel time of the vehicles.
In the case of single tube tunnels, the control procedure, briefly summarised, would look asfollows :
Measured values of a certain pollutant component, e.g. CO, possibly averaged over morethen one sensor, are compared with the TLV. This procedure, repeated for each of thepollutants to be monitored, would, by taking the maximum value, determine theminimum required air flow rate in the tunnel by means of the beforementioned formula. This quantity, possibly increased by a small amount that would account for losses, woulddetermine the duty point of the fan, or, in case of several fans, that of the fan system.Though not linear, this process can easily be operated as if it were. Probably aproportionally working controller could do the job, since time is not a critical variable,and that moreover, the number of fans that may start up within a given time period islimited.
Although the difficulty of working out such an application should not be overlooked, itsadvantageous feature remains the one-to-one correspondence between pollution level andrequired fresh air flow volume.
Unfortunately, in complex tunnels this univocal relationship is no longer true (Jacques, [22]).Since complex tunnels consist of several independently ventilated sections, the above expressionshould be applied to each of them if one wishes, in view of energy savings, to achieve theminimum required fresh air flow volumes. Indeed, the pollution level in any section that must betaken into account, is not only due to the local pollutant emissions of the traffic, but also the onecoming in from the upstream section or sections.
Moreover, in a complex tunnel such as the Belliard tunnel, traffic congestion’s may occuronly in one part of the tunnel, and may unexpectedly disturb or modify the ventilation in otherparts where ventilation was supposed to be satisfactory.
The resulting concentration must then be calculated by the following expression :
[P]f = Σ q+[P]f+ / Σ q+ + qPL / q ,
where q is the air volume, and where the subscript + denotes the up-stream sections and thesubscript f refers to the exit of these sections.
Written for each section, it results in a system of equations. Taking further into account thatthe pollutant concentration [P]f must not exceed the corresponding TLV values, i.e. that thedifference ∆[P]f = TLV - [P]f should ideally be zero, the unknown air flow volumes q wouldbe the mathematical solution, if it were not that the mass conservation law had to be satisfied.
Therefore a certain number of equations need to be added which makes the final systemover-determined. According to the applied optimisation criterion, only an approximate solutionmay be found.
q = N q n LTLV
10V PL L 6
One could, of course take the most critical section and apply the same air flow volumealong the entire tunnel. It would mean a non-negligible waste of energy. Since there are severalfresh air injecting points available and several adjustable fans that can be operated, there iscertainly an optimal distribution of minimum fresh air volumes for which less energy is usedwhile still satisfying the pollution constraints.
However, for complex tunnels the previous one to one relationship is no longer true. Thereis no way to link a particular measurement, or set of measurement devices, to a particular fansystem that would have an exclusive control over it. In fact we are dealing with a multi-variablesystem. The underlying problem is that a concentration, which is precisely the quantity to becontrolled, is a ratio of two volumes, i.e. the pollutant volume to the air flow volume. Therefore,any increase in concentration may be a result of either an increasing pollution or a decreasing airflow volume. Since a variation of a local flow rate may be the consequence of a demandelsewhere, or, could simply be due to a different pressure distribution, induced e.g. by the traffic,an action would only be appropriate if the control unit has been informed as to both these twoquantities :- the flow distribution in the tunnel, and,- the pollution concentration distribution.
Therefore, an adequate control system must not only be capable of boosting the ventilationwhere the additional pollution due to congestion is increasing, but must also restore theventilation in those parts of the tunnel where it has been disturbed.
Simulation with somewhat complex ventilation systems shows that a certain number ofthese situations may hide traps, and indeed exceed what was thought to be the worst casesituation when the tunnel ventilation had been designed.
Lots of computer simulations confirmed the above mentioned phenomena. Additionaldifficulties, arise with the numerical problem of inverting a matrix which is sometimes near-singular, and the lack of experience with the quality of the newly installed measurement devices.
For these, and other reasons for which there is no room in this paper, the above solutionscheme would be far too risky to be applied in the present state of the art. Therefore a differentapproach to this problem has been elaborated. The basic guidelines could be stated as follows :* since traffic is the source of pollution, it not unreasonable to control its concentration based
on the variables which characterise the traffic;* by relaxing optimality of the control function, it would be possible to subdivide the operating
domain of the controlling traffic variables into a certain number of smaller domains wherethese variables stay reasonably constant.
This procedure allows to prepare in advance, by means of numerical simulations, a certainnumber of tables, each containing the set points of all the fans. These tables are addressed by acombination of the traffic variables.
The advantages are obvious :− a table may easily be replaced by a more adequate one as experience with the real ventilation
proceeds,− the software is less complicated and thus guarantees a higher reliability, and,− any configuration of the ventilation is entirely predictable and, therefore, can be reproduced.These advantages greatly simplify the testing of the software.
Conversely, the weak point of this solution is certainly the lack of any guarantee thatpollution never will exceed the TLV's. A built in protection mechanism should prevent this.Besides setting an alarm, the control algorithm will automatically adapt the subdomainboundaries of the traffic variables, if a repeated and significant pollution transgression within acertain time span is noticed.

The four control variables are the traffic concentration variables, i.e. the number of vehiclesper km, the average traffic speed, the unbalance between both the exit sections, first where theconcentration is concerned, and second where the speed is concerned. All these variables are, ofcourse, time dependent.
Where the concentration is concerned, numerical simulations allow to divide its entire rangeinto five domains. Since speed influences pollution to a lesser extent, only three domains wereconsidered. The unbalance, for both concentration and speed is quantified by values -1 and 1,zero assuming almost equal traffic conditions in both the exit sections.
Since these boundary values had to be determined by simulation, they may not represent themost suitable subdivision. However, there has been no need, till now, to adjust these values.
The combination of the four above defined variables yields 135 (= 5 x 3 x 3 x 3)possibilities and therefore may address 135 tables. Each of these tables contains the settingpoints of all the fans in the system, and therefore clearly defines one operating point of the tunnelventilation, which would, at least if the underlying model is simulating the reality properly,satisfy the fresh air requirements in each part of the tunnel. In the case of a systematicdiscrepancy the boundaries of the domains of the traffic variables may, as previously mentioned,be automatically adapted.
One of the real difficulties of this kind of approach are the boundary effects. Indeed, it isalmost impossible to study in advance all possible call sequences of the above mentioned tables.Therefore, it will never be sure that no conflicting situations would occur, e.g. starting up a fanthat was ordered to stop during the previous control cycle.
However, during the 3 last years that the application ran, we never noticed such aconflicting situation, but this does not prove that there were not any.
OPERATIONAL EXAMPLE
To illustrate the working and efficiency of the Belliard tunnel ventilation control algorithms, letus describe, with real-time recordings at hand, a situation where the traffic starts to jam.
Traffic
On the recording of camera TC09R (fig. 5), dated 26 July 95, one can see that, between 17:00and 17:15, a traffic incident is about to happen : the vehicle flow leaving the Cortenberg sectionis decreasing slowly and progressively while the number of vehicles entering the tunnel remainsconstant (see fig.6).
0
5
10
15
20
25
30
16:00 17:00 18:00 19:00 20:00
TC09Rcar/min 26/07/95
h
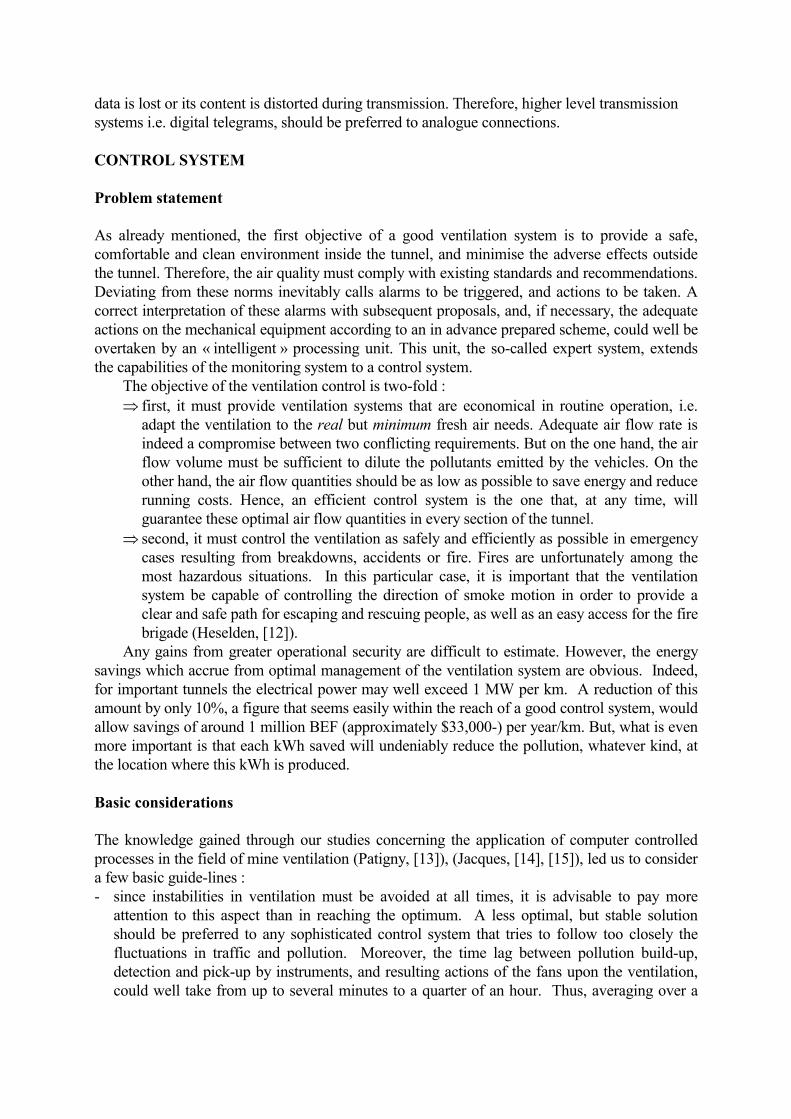
Figure 5. traffic flow at exit of Cortenberg (right lane)
0
5
10
15
20
25
30
35
40
16:00 17:00 18:00 19:00 20:00
TC03Rcar/min 26/07/95
h
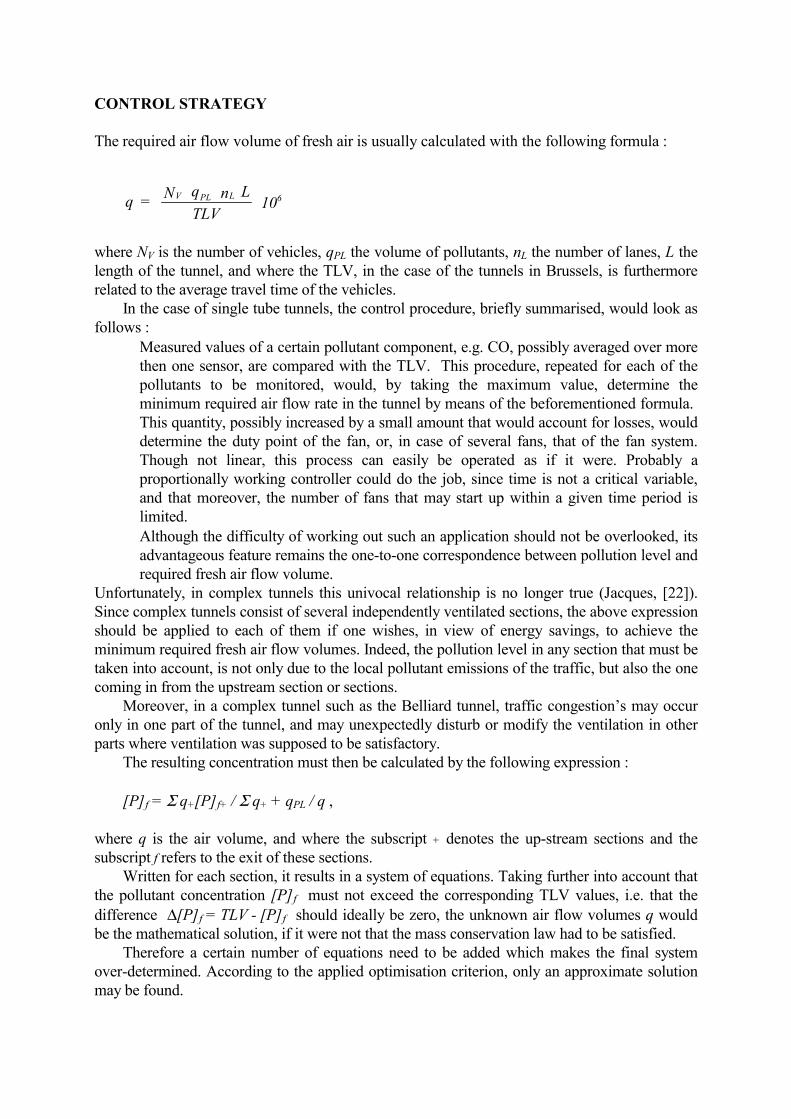
Figure 6. traffic flow at entrance of Cortenberg (right lane)
After 17:14, one can read from the same recording of camera TC03R (fig.6) that the trafficstarts also to congest at the entrance of the Cortenberg section. Within 3 min, the average speedhas dropped from 77 km/h to 40 km/h, and then further still to 29 km/h. At 17:54, at the samelocalisation, the traffic jam has suddenly disappeared, and within 3 min the traffic speed hasincreased from 27 km/h, to 33, and finally up to 62 km/h. The traffic flow on this lane has nowdropped from 25 vehicles/min to 15 vehicles/min.
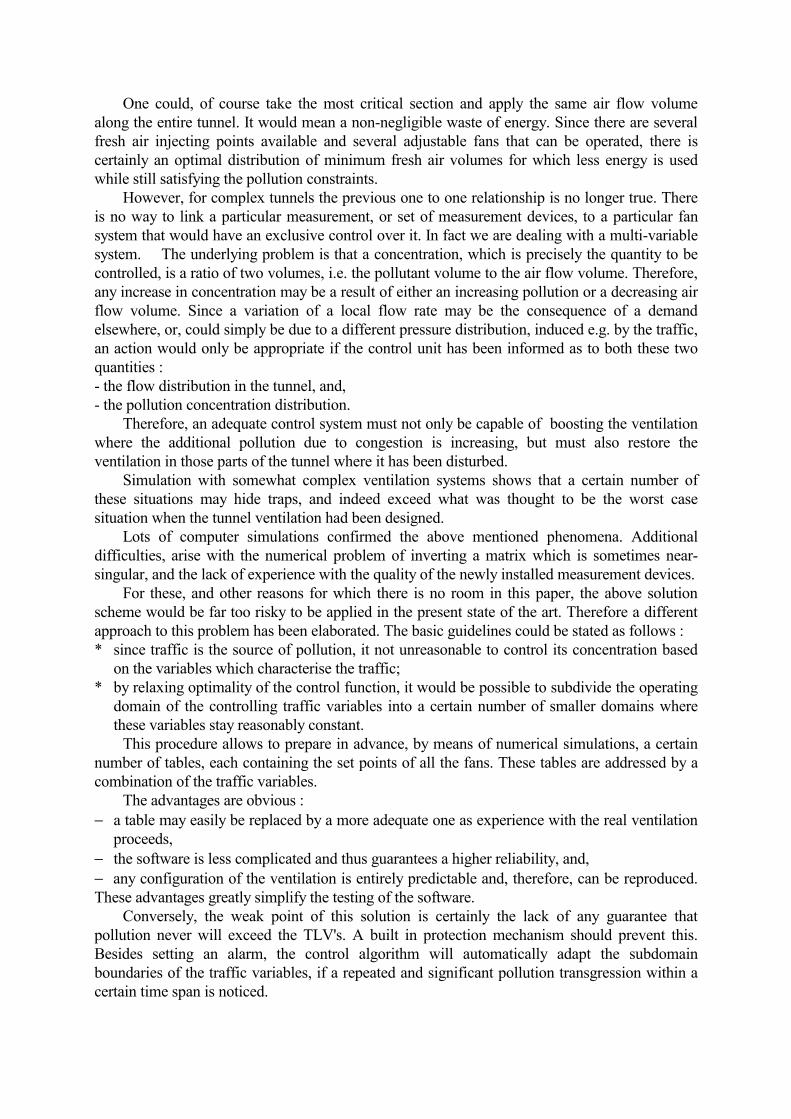
At 17:50, and until 18:01, at the exit of the Cortenberg section, on the left lane, the cameraTC09L (fig. 7) shows that the traffic flow has suddenly increased from 11 up to 30 vehicles/min,while it has been interrupted for 2 minutes on the right lane (see fig.5). This shows the end of theincident.
0
5
10
15
20
25
30
35
16:00 17:00 18:00 19:00 20:00
TC09Lcar/min 26/07/95
h
Figure 7. traffic flow at exit of Cortenberg (left lane)
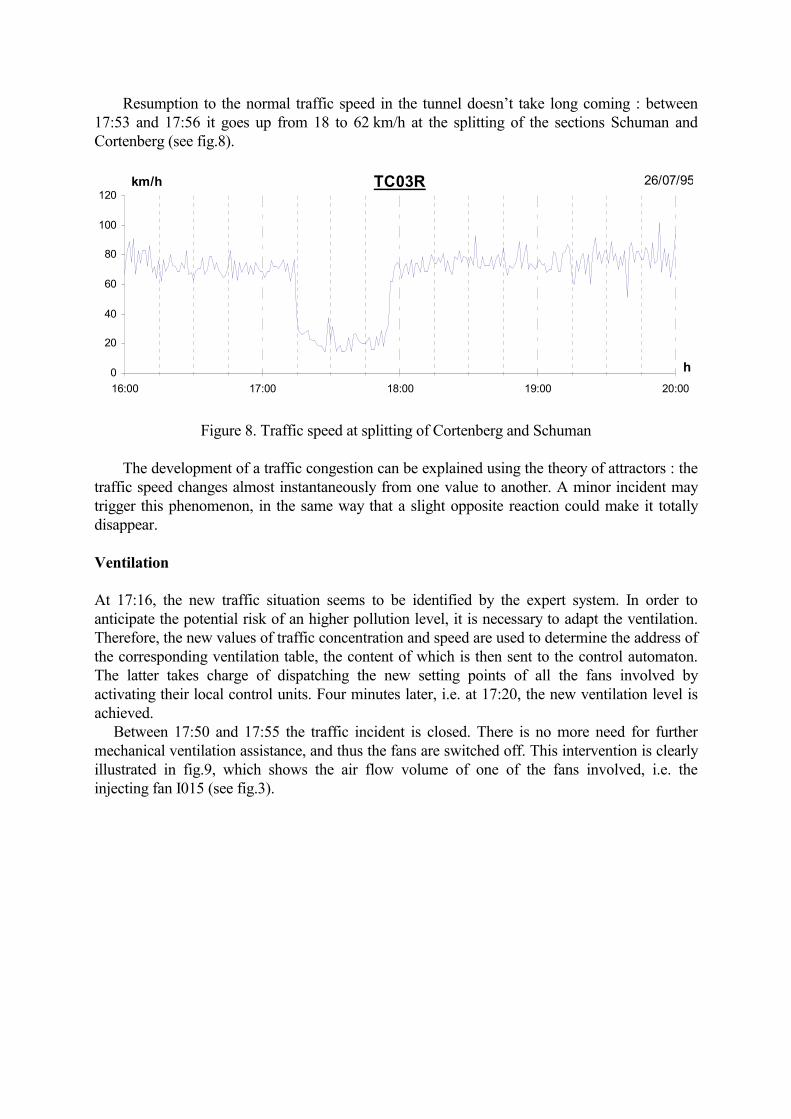
Resumption to the normal traffic speed in the tunnel doesn’t take long coming : between17:53 and 17:56 it goes up from 18 to 62 km/h at the splitting of the sections Schuman andCortenberg (see fig.8).
0
20
40
60
80
100
120
16:00 17:00 18:00 19:00 20:00
TC03Rkm/h 26/07/95
h
Figure 8. Traffic speed at splitting of Cortenberg and Schuman
The development of a traffic congestion can be explained using the theory of attractors : thetraffic speed changes almost instantaneously from one value to another. A minor incident maytrigger this phenomenon, in the same way that a slight opposite reaction could make it totallydisappear.
Ventilation
At 17:16, the new traffic situation seems to be identified by the expert system. In order toanticipate the potential risk of an higher pollution level, it is necessary to adapt the ventilation.Therefore, the new values of traffic concentration and speed are used to determine the address ofthe corresponding ventilation table, the content of which is then sent to the control automaton.The latter takes charge of dispatching the new setting points of all the fans involved byactivating their local control units. Four minutes later, i.e. at 17:20, the new ventilation level isachieved.
Between 17:50 and 17:55 the traffic incident is closed. There is no more need for furthermechanical ventilation assistance, and thus the fans are switched off. This intervention is clearlyillustrated in fig.9, which shows the air flow volume of one of the fans involved, i.e. theinjecting fan I015 (see fig.3).

0
10
20
30
40
50
60
70
16:00 17:00 18:00 19:00 20:00
QI15m3/s 26/07/95
h
Figure 9. Air flow volume of fan I015
Air flow volumes
0
1
2
3
4
5
6
7
8
9
16:00 17:00 18:00 19:00 20:00
QT03m/s 26/07/95
h
Figure 10. Air velocity at the Cortenberg exit portal
The velocity of the air flow recorded by the ultrasonic device QT03 (see figures 3 &10) locatednear the exit portal of the Cortenberg tunnel, is decreasing gradually between 17:02 and 17:11.Clearly it is due to the piston effect of the traffic that slows down from 6 to 3 m/s. After theventilation has been started up, at 17:20, the velocity went up again to a value of 6 m/s.
After 17:50, the velocity increased up to 9 m/s, then dropped to its normal value at 18:05.This is explained in the first moments by faster traffic and later on, by the switching off of themechanical ventilation.
Pollution
Up to a certain point the growth of the pollution is « normal ». This is due to the increasingtraffic leaving the city at the end of the afternoon. This is also true for the CO concentration,recorded by the CO07 meter (see fig.11), as well as for the NO2 concentration, measured by theNO23 meter (see fig.12), both sensors being located near the exit of the Cortenberg section.

0
10
20
30
40
50
60
70
16:00 17:00 18:00 19:00 20:00
CO07ppm 26/07/95
h
Figure 11. CO concentration near the Cortenberg exit portal
0
100
200
300
400
500
600
16:00 17:00 18:00 19:00 20:00
NO23ppb 26/07/95
h
Figure 12. NO2 concentration near the Cortenberg exit portal
Then, the local pollution concentration at the same location, while remaining small, indicates thebeginning of a traffic problem. The pollution increase at the entrance of the Cortenberg tunnelonly appears at 17:19. This increase is mainly due to the reduced air flow volume by a smallerpiston effect, rather then to the increasing traffic flow.
When the traffic jam starts to develop, the expert system expects an excessive forthcomingpollution and decides to start up the mechanical ventilation. As a consequence, the air velocity inthis part of the tunnel is boosted up, so compensating the lack of piston effect. The COconcentration decreases towards the exit while it remains unchanged in the entrance part of theCortenberg section. In the case of NO2, the concentration fades away significantly after theventilation has been switched on.
By way of conclusion, it is worth noting that the action on the ventilation would not havebeen as fast, if the recording of the CO concentration, and respectively the NO2 concentration,was used instead of the traffic information. This is due to the fact that the cause is taken intoaccount rather than its consequence, i.e. the pollution, which is further more dependent on theventilation itself.
The direct result is, therefore, not only energy saving, but also a much smoother pollutionprofile.
NOMENCLATURE & ABBREVIATIONS
CCATS Camera & Computer Aided Traffic SensorCFD Computational Fluid DynamicsFID Flame Ionisation DetectorHC HydroCarbonMTBF Mean Time Between FailureSTEL Short Term Exposure LimitTLV Threshold Limit ValueTWA Time Weighted AverageVMS Variable Message SignsVOC Volatile Organic Compounds
REFERENCES
1. Chovin, Physico-chimie des polluants de l’atmosphère (Physical chemistry of pollutants inthe atmosphere). Pollution Atmospherique, N°85, Journées scientifiques de l’A.P.P.A.,Pollution Atmosphérique, 1980, pp.13-19.
2. Haerter, A., Road tunnel air and the environment. Aerodynamics and Ventilation of VehicleTunnels, Elsevier Science Publishers Ltd., England, 1991, pp.3-20.
3. ACGIH (American Conference of Governmental Industrial Hygienists), , Threshold LimitValues and Biological Exposure Indices for 1994-1995. Cincinnati, OH 45240, USA, ISBN:1-882417-06-2.
4. Lauwerys, R., Précis de toxicologie industrielle et des intoxications professionnelles(Handbook of the industrial toxicology and the professional poisoning). Masson, Paris,France, 1990, ISBN 2-225-81855-X.
5. Pischinger, R., Exhaust gas legislation and exhaust gas emissions of motor vehicles : aglobal survey. Aerodynamics and Ventilation of Vehicle Tunnels, Elsevier SciencePublishers Ltd., England, 1991, pp.21-51.
6. Patigny, J., Analyse des poluants autres que CO et NO2 (Analysis of pollutants other thanCO and NO2), personal communication.
7. Journées scientifiques de l’A.P.P.A., N°85, Pollution Atmosphérique, 1980.8. World Health Organisation, Regional Office for Europe, Air Quality Guideline for Europe,
Copenhagen, Denmark, 1987.9. Henning, J.E., & Berge, K.O., Ventilation et traitement de l’air dans les tunnels routiers
(Ventilation and air treatment in road tunnels). PIARC, XX World Road Congress, Communications individuelles des Comités et Groupes de Travail, Montreal, Canada, 1995,pp.180-186.
10. Nadel, C., et al. Physical Modelling of Dispersion of a Tunnel Portal Exhaust Plume. 8thInternational Symposium on Aerodynamics and Ventilation of Vehicle Tunnels, MechanicalEngineering Publications Ltd., London, England, 1994, pp.847-870.
11. Versavel, J., Lemaire, F., Van Der Stede, D., Maes, W. & Mortelmans, J., ‘CCATS’ -Camera and computer aided traffic sensor, CCCT ‘89 Conference, IFAC, Paris, France, 1989, pp.63-68.
12. Heselden., A.J.M., Studies of fire and smoke behaviour relevant to tunnels. Proc. 2ndI.S.A.V.V.T., BHRA Fluid Engineering, Cambridge, England, 1976, paper J1.
13. Patigny, J., Cerulus, J. & Jacques, E., Commande centralisée des ventilateurs et portesrégulatrices sous contrôle d'ordinateur (Centralised computer control of fans and regulators),Revue de l'I.H.M., Belgium, 1982, vol 37/1, pp.5-55.
14. Jacques, E., Skúsenosti s Automatickou Kontrolou Vetrania (Some Experience withAutomatic Ventilation Control), Proceedings of the Ventilation and Climate Seminar,Kosice, Czechoslovakia, 1985, pp.48-58.
15. Jacques, E., A solution to the optimal setting of air flow-control devices in a ventilationnetwork, Proceedings of the 5th US Mine Ventilation Symposium, SME, Littleton,Colorado, 1991, pp.411-418.
16. Wang, Y.J., Ventilation Network Theory. In Mine Ventilation and Air Conditioning, Hartman H.L., ed., John Wiley & Sons, New York, 1982, pp. 483-516.
17. PIARC (Permanent International Association of Road Congresses), XVIII World RoadCongress, Technical Committee on Road Tunnels, Report N°5, Brussels, Belgium, 1987.
18. PIARC (Permanent International Association of Road Congresses), XIX World RoadCongress, Technical Committee on Road Tunnels, TC5, Marrakech, Morocco, 1991.
19. Jacques, E., Numerical Simulation of Complex Road Tunnels. Aerodynamics andVentilation of Vehicle Tunnels, Elsevier Science Publishers Ltd., England, 1991, pp.467-486.
20. Ferro, V., Borchiellini, R. & Giaretto, V., Description and application of a tunnel simulationmodel. Aerodynamics and Ventilation of Vehicle Tunnels, Elsevier Science Publishers Ltd.,England, 1991, pp.487-512.
21. Jacques, E., Study of the automatic control of the longitudinal ventilation of a complex roadtunnel. 8th International Symposium on Aerodynamics and Ventilation of Vehicle Tunnels,Mechanical Engineering Publications Ltd., London, England, 1994, pp.943-957.
22. Edie, L.C., Gazis, D.C., Helly, W., McNeil D.R. & Weiss, G.H., Traffic Science. Gazis,D.C., ed., John Wiley & Sons, New York, 1974, ISBN 0-471-29480-2.