Methodology of using CFD-based risk assessment in road tunnels
28
METHODOLOGY OF USING CFD-BASED RISK ASSESSMENT IN ROAD TUNNELS by Peter VIDMAR and Stojan PETELIN Original scientific paper UDC: 519.876.5:656.085.5:628.83 BIBLID: 0354-9836, 11 (2007), 2, 223-250 The definition of the deterministic approach in the safety analyses comes from the need to understand the conditions that come out during the fire ac- cident in a road tunnel. The key factor of the tunnel operations during the fire is the ventilation, which during the initial fazes of the fire, impact strongly on the evacuation of people and latter on the access of the interven- tion units in the tunnel. The paper presents the use of the computational fluid dynamics model in the tunnel safety assessment process. The model is validated by comparing data with experimental and quantifying the differ- ences. The set-up of the initial and boundary conditions and the require- ment for grid density found during the validation tests is used to prepare three kind of fire scenarios 20 MW, 50 MW, and 100 MW, with different ventilation conditions; natural, semi transverse, full transverse, and longi- tudinal ventilation. The observed variables, soot density and temperature, are presented in minutes time steps trough the entire tunnel length. Compar- ing the obtained data in a table, allows the analyses of the ventilation condi- tions for different heat releases from fires. The second step is to add addi- tional criteria of human behaviour inside the tunnel (evacuation) and human resistance to the elevated gas concentrations and temperature. What comes out is a fully deterministic risk matrix that is based on the calculated data where the risk is ranged on five levels, from the lowest to a very danger level. The deterministic risk matrix represents the alternative to a probabil- istic safety assessment methodology, where the fire risk is represented in de- tail as well as the computational fluid dynamics model results are physically correct. Key words: fire, tunnel ventilation, benchmarking, risk analysis Introduction Fire and smoke behaviour inside the tunnel depend mostly on ventilation, either natural or forced. Different ventilation analyses are present in the literature, empirical models that are often combined with a network approach for complex tunnel networks [1]. Computational fluid dynamics (CFD) models [2, 3] are usually used for the analyses of the ventilation system, the operation regime during the fire and the assessment of the optimal air velocity and the ventilators set-up [4, 5]. Authors like [6] present simple mod- els for the computation of critical velocities, where differential conservation equations 223
Transcript of Methodology of using CFD-based risk assessment in road tunnels

METHODOLOGY OF USING CFD-BASED RISK ASSESSMENT IN ROAD TUNNELS
by
Peter VIDMAR and Stojan PETELIN
Original scientific paperUDC: 519.876.5:656.085.5:628.83
BIBLID: 0354-9836, 11 (2007), 2, 223-250
The def i ni tion of the de ter min is tic ap proach in the safety anal y ses co mesfrom the need to un der stand the con di tions that come out dur ing the fire ac -ci dent in a road tun nel. The key fac tor of the tun nel op er a tions dur ing thefire is the ven ti la tion, which dur ing the ini tial fazes of the fire, im pactstrongly on the evac u a tion of peo ple and lat ter on the ac cess of the in ter ven -tion units in the tun nel. The pa per pres ents the use of the computationalfluid dy nam ics model in the tun nel safety as sess ment pro cess. The model isval i dated by com par ing data with ex per i men tal and quan ti fy ing the dif fer -ences. The set-up of the ini tial and bound ary con di tions and the re quire -ment for grid den sity found dur ing the val i da tion tests is used to pre parethree kind of fire sce nar ios 20 MW, 50 MW, and 100 MW, with dif fer entven ti la tion con di tions; nat u ral, semi trans verse, full trans verse, and lon gi -tu di nal ven ti la tion. The ob served vari ables, soot den sity and tem per a ture,are pre sented in min utes time steps trough the en tire tun nel length. Com par -ing the ob tained data in a ta ble, al lows the anal y ses of the ven ti la tion con di -tions for dif fer ent heat re leases from fires. The sec ond step is to add ad di -tional cri te ria of hu man be hav iour in side the tun nel (evac u a tion) andhu man re sis tance to the el e vated gas con cen tra tions and tem per a ture. What co mes out is a fully de ter min is tic risk ma trix that is based on the cal cu lateddata where the risk is ranged on five lev els, from the low est to a very dan gerlevel. The de ter min is tic risk ma trix rep re sents the al ter na tive to a proba bil -is tic safety as sess ment meth od ol ogy, where the fire risk is rep re sented in de -tail as well as the computational fluid dy nam ics model re sults are phys i cally cor rect.
Key words: fire, tunnel ventilation, benchmarking, risk analysis
Introduction
Fire and smoke be hav iour in side the tun nel de pend mostly on ven ti la tion, ei thernat u ral or forced. Dif fer ent ven ti la tion anal y ses are pres ent in the lit er a ture, em pir i calmod els that are of ten com bined with a net work ap proach for com plex tun nel net works[1]. Computational fluid dy namics (CFD) mod els [2, 3] are usu ally used for the anal y sesof the ven ti la tion sys tem, the op er a tion re gime dur ing the fire and the as sess ment of theop ti mal air ve loc ity and the ven ti la tors set-up [4, 5]. Au thors like [6] pres ent sim ple mod -els for the com pu ta tion of crit i cal ve loc i ties, where dif fer en tial con ser va tion equa tions
223

are solved in two or at least in one di men sion [7]. Math e mat i cal mod els are gen er ally val -i dated on stan dard ex per i ments [8] or on small-scale ex per i ments. How ever, it is clearlynoted that find ings and re sults are very rare in di cated for the im me di ate use in prac tice for tun nel con struc tors, safety sys tems pro ject ants, fire man’s, and oth ers [9].
Fol low ing this idea we be lieve, that a meth od ol ogy of fire safety val u a tion,which im proves ex ist ing meth od ol o gies and is based on de ter min is tic ap proach, is nec es -sary. The pre sented anal y sis in cludes the fire pirolisys, shar ing the tun nel into sec tors ofdif fer ent sizes, and the cal cu la tion of fire dy nam ics with a CFD model. The ob tained dataare still too much sci en tific, thought they are pre sented in a graphs and di a grams. Theprob lem co mes when 15 or 20 sce nar ios are re quired in a safety as sess ment and a num berof graphs be come too large. This kind of re port should be very com pre hen sive and dif fi -cult to un der stand by the user (tun nel op er a tor). The idea is there fore to de sign a tun nelrisk anal y ses tool, which is based on CFD re sults for dif fer ent fire sce nar ios and in cludesba sic hu man be hav iour e. g. re sis tance on height tem per a ture and gas con cen tra tion,evac u a tion ve loc ity, re ac tion times, and other fea tures [10].
Methodological approach on tunnel safety
In or der to iden tify the in ter ac tive and unit ing re la tion ships in a sys tem, anal y sis is nec es sary to re place the ap par ent struc ture of in di vid ual state ments on the com po nents of asys tem and their re la tion ships with their un der ly ing com mon log i cal struc ture (sys temanal y sis). For ex am ple, if we are deal ing with a sys tem which we call “a chem i cal pro cessplant”, we get at its var i ous com po nents suc ces sively, by means of de duc tive anal y sis: thebuild ings, the op er a tors, the stor age tanks, the con trol sys tems, the op er at ing pro ce dures,etc. [11]. Each such com po nent is thrown into the mod el ling re al ity by a dis tinct act of no -tic ing, and is steadily held to gether with those com po nents al ready seg re gated. The aim ofsys tem anal y sis is to in ves ti gate the sys tem’s be hav iour (i. e. the suc ces sion of its statesover time) on the ba sis of its com po nents’ changes with time. The re sults of sys tem anal y sis can be ex pressed in qual i ta tive and quan ti ta tive terms (state ments re sult ing from “qual i ta -tive anal y sis” and num bers re sult ing from “quan ti ta tive anal y sis”).
There are dif fer ent types of sys tems with re gard to pre dict ing be hav iour [12].– Deterministic systems are perfectly predictable. That is, they follow an entirely
known rule (law, equation, or fixed procedure) so that the state of each componentand of the entire system can be given at any time for any time in the past and future.The states of deterministic systems can be described by statements or by numbersspecifying, for example, physical characteristics of the system (observables, such aslength and mass of a physical object).
– Probabilistic systems involve some degree of uncertainty in predicting theirbehaviour and require “random variables” to describe the system’s components andtheir interactions. There is no general agreement on what “randomness” of a systemactually means (it could, for example, mean generated by chance mechanism, beingunpredictable, showing a lack of an apparent order, etc.). By describing the states ofprobabilistic systems by probability numbers, it uses past knowledge to predict futurestates [13].
224
THERMAL SCIENCE: Vol. 11 (2007), No. 2, pp. 223-250

– Chaotic systems are systems whose future is difficult or impossible to predict over along period of time because it strongly depends on arbitrarily small and thus notobservable variations in the current state. Small variations in the current state of thesystem can result in large and unpredictable differences in a subsequent state.
De pend ing on the avail able data, pos si bil i ties, re quire ments and re sults of in ter -est, we should de cide the best ap proach to de scribe the phys i cal sys tem. If we are able tode scribe the sys tem with phys i cal equa tions, the de ter min is tic ap proach should be ap -plied. Oth er wise, if the val ues of the in ter est ing vari ables are un de fined and only sta tis ti -cal data are avail able, the proba bil is tic ap proach is used. The event of fire in side a tun nelis a very com plex phe nom e non with a great num ber of de pend ing vari ables. How evermany au thors, as we in the fol low ing sec tions, have dem on strated that it should be ef fi -ciently mod elled and sim u lated, in clud ing the most in flu en tial ini tial and bound ary con -di tions. The de ter min is tic ap proach breathe into the anal y sis of the greater part of phys i -cal events like fire source char ac ter is tic and its dy nam ics, the op er a tion of the ven ti la tionsys tem and other con di tions as well as their re cip ro cal in ter ac tions. The ap proach leadsalso to the def i ni tion of the tech ni cal sys tem “safety ef fi ciency” in the range of pos si bil i -ties that ex ist in a real word and are func tion ally de scrip tive. When the ap proach is usedin prac tice, we should de fine a num ber of “safety cat e go ries” base on events prob a bil ityand con se quences for the in di vid ual risk. The ex am ple in pre sented in tab. 1.
Table 1. Deterministic safety analysis – supposed safety categories [12]
(a) Like li hood cat e go ries
Se ver ity cat e gory(fre quen cies)
Qual i ta tive def i ni tionUn der ly ing quan ti ta tive def i ni tion
(times per year)
AProb a bil ity once in a
year0.3-3
B Pos si ble but not likely 0.03-0.3
C Un likely 0.003-0.03
D Very un likely 0.0003-0.003
E Re mote 0.00003-0.0003
(b) Con se quence cat e go ries
Se ver ity cat e gory(con se quences)
Qual i ta tive def i ni tion Un der ly ing semi-quan ti ta tive def i ni tion
1 Cat a strophic Mul ti ple fa tal i ties
2 Ma jor Sin gle fa tal ity, mul ti ple in ju ries
3 Very se ri ous Per ma nently dis able in ju ries
4 Se ri ous Se ri ous in jury, full re cov ery
5 Mi norLost time in jury, short ab sence from
work
225
Vidmar, P., Petelin, S.: Methodology of Using CFD-Based Risk Assessment in ...

Note that, in these schemes, a quan ti ta tive def i ni tion is of ten given in ad di tion tothe qual i ta tive def i ni tion, mainly to en sure con sis tency in the course of the anal y sis andpro vide benchmarks (“semi-quan ti ta tive anal y sis”). In schemes of this type, the as sess -ment team, usu ally com pris ing mem bers of line man age ment, safety en gi neers and op er -a tions per son nel, will first iden tify all haz ards, us ing HAZOP or sim i lar ap proaches, andthen as signs a se ver ity cat e gory to each of these, for both like li hood and con se quences[14].
Fol low ing the as sump tions in tab. 1, a “risk ma trix” would then be de fined as a 5 ́´ 5 ma trix with each side cor re spond ing to one se ver ity cat e gory (tab. 2).
Table 2. Deterministic safety analysis – example of risk matrix [12]
“Like li hood”
“Se ver ity cat e gory”
Con se quences “Se ver ity cat e gory”
5 4 3 2 1
A
B
C
D
E
Dif fer ent shad ing in a ta ble in di cates dif fer ent risk lev els. Haz ards with high as -sess ments, such as A1, B1, and A2 in the black squares, are thought of as be ing very se -vere and re quir ing im me di ate ac tion to re duce. Haz ards with low as sess ments, such asE5, E4, and D5 in the white squares, are con sid ered to re quire no fur ther ac tion. Haz ardsbe tween these two (grey squares) are con sid ered wor thy of some im prove ment if acost-ef fec tive so lu tion can be found.
The two meth ods of risk anal y sis (qual i ta tive and quan ti ta tive) are of ten not sep -a ra ble but up grade each other. Fig ure 1 shows the event tree for the ex am ple of a fuel leak out. The quan ti ta tive ap proach is ap plied be cause the event prob a bil i ties are de fined. There sults of the event tree are sev eral pre dicted sce nar ios with cal cu lated fi nal event fre -quen cies. Be tween nine fi nal sce nar ios, there are three fire sce nar ios with a ma jor fre -quency; G2, G5, and G8. Fur ther work leads in two di rec tions, with proba bil is tic ap -proach on de ter min is tic ap proach. In the fol low ing sec tions the meth od ol ogy andre quire ments of us ing a de ter min is tic ap proach is ex plained more is de tail.
Computer models and simulations
De ter min is tic mod els that would con sider all phys i cal pa ram e ters are al most un -fea si ble in prac tice and if fea si ble would re quire very com plex and time con sum ing com -pu ta tions. The ap pli ca tion of de ter min is tic anal y ses re sults in prac tice is con di tioned bythe sim pli fi ca tion of some phys i cal phe nom ena (like tur bu lence) [15, 16]. The ge om e try
226
THERMAL SCIENCE: Vol. 11 (2007), No. 2, pp. 223-250

of the tun nel is eas ily de fined, how ever the def i ni tion of wall bound ary con di tions re -quire a good un der stand ing of tube the ory, es pe cially re gard ing wall fric tion. In tun nelmod el ling ap pli ca tion and re search sev eral mod el ling ap proaches ex ist, whose use de -pends on the ap pli ca tion of re sults. Here are em pir i cal and lumped pa ram e ter mod els,one-di men sional mod els, zone mod els, and CFD mod els [18]. The last ap proach and aprac ti cal use of re sults are pre sented in the fol low ing sec tions.
Physical background
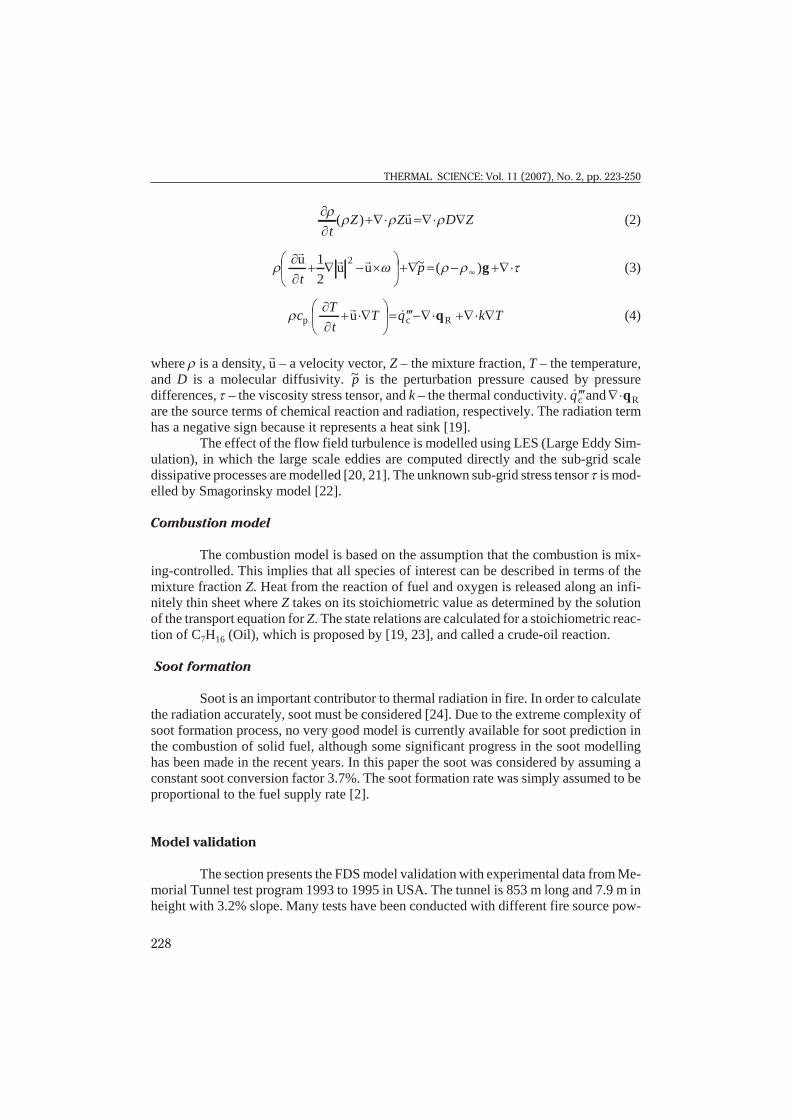
The com puter code name is FDS (Fire Dy nam ics Sim u la tor). The fluid flow ismod elled by solv ing the ba sic con ser va tion equa tions. Those are con ser va tion of mass(1), con ser va tion of mix ture frac tion (2), con ser va tion of mo men tum (3), and con ser va -tion of en ergy (4) us ing a form for low Mach num ber [19, 20]. The ap prox i ma tion in -volves the fil ter ing out of acous tic waves.
rr
t+Ñ× =
ru 0 (1)
227
Vidmar, P., Petelin, S.: Methodology of Using CFD-Based Risk Assessment in ...
Figure 1. Event tree for fuel leak out scenario [17]
rr r r
tZ Z D Z( )+Ñ× =Ñ× Ñ
ru (2)
r w r r t
rr ruu u
tp+ Ñ - ´
æ
èç
ö
ø÷+Ñ = - +Ñ×
1
2
2 ~ ( )4 g (3)
rcT
tT q k Tp c Ru
¶+ ×Ñ
æ
èç
ö
ø÷= ¢¢¢-Ñ× +Ñ× Ñ
r& q (4)
where r is a density, ru – a velocity vector, Z – the mixture fraction, T – the temperature,
and D is a molecular diffusivity. ~p is the perturbation pressure caused by pressuredifferences, t – the viscosity stress tensor, and k – the thermal conductivity. &¢¢¢qc and Ñ×qRare the source terms of chemical reaction and radiation, respectively. The radiation termhas a negative sign because it represents a heat sink [19].
The ef fect of the flow field tur bu lence is mod elled us ing LES (Large Eddy Sim -u la tion), in which the large scale ed dies are com puted di rectly and the sub-grid scaledissipative pro cesses are mod elled [20, 21]. The un known sub-grid stress ten sor t is mod -elled by Smagorinsky model [22].
Combustion model
The com bus tion model is based on the as sump tion that the com bus tion is mix -ing-con trolled. This im plies that all spe cies of in ter est can be de scribed in terms of themix ture frac tion Z. Heat from the re ac tion of fuel and ox y gen is re leased along an in fi -nitely thin sheet where Z takes on its stoichiometric value as de ter mined by the so lu tionof the trans port equa tion for Z. The state re la tions are cal cu lated for a stoichiometric re ac -tion of C7H16 (Oil), which is pro posed by [19, 23], and called a crude-oil re ac tion.
Soot formation
Soot is an im por tant con trib u tor to ther mal ra di a tion in fire. In or der to cal cu latethe ra di a tion ac cu rately, soot must be con sid ered [24]. Due to the ex treme com plex ity ofsoot for ma tion pro cess, no very good model is cur rently avail able for soot pre dic tion inthe com bus tion of solid fuel, al though some sig nif i cant prog ress in the soot mod el linghas been made in the re cent years. In this pa per the soot was con sid ered by as sum ing acon stant soot con ver sion fac tor 3.7%. The soot for ma tion rate was sim ply as sumed to bepro por tional to the fuel sup ply rate [2].
Model validation
The sec tion pres ents the FDS model val i da tion with ex per i men tal data from Me -mo rial Tun nel test pro gram 1993 to 1995 in USA. The tun nel is 853 m long and 7.9 m inheight with 3.2% slope. Many tests have been con ducted with dif fer ent fire source pow -
228
THERMAL SCIENCE: Vol. 11 (2007), No. 2, pp. 223-250

ers and dif fer ent ven ti la tion pro grams. The val i da tion pres ents two dif fer ent val i da tionsce nar ios, with 50 MW fire and nat u ral ven ti la tion and 100 MW fire with forced lon gi tu -di nal ven ti la tion. The fuel used on the ex per i ment and sim u lated is oil filled into a flatcon tainer [25]. Us ing the same fuel, dif fer ent fire heat re lease rates are ob tained only bychang ing the burn ing sur face [26].
Geometry of the model
The ge om e try, ini tial and bound ary con di tions are ar ranged to the tun nel ge om e try andfire pa ram e ters. Fig ure 2 shows the ge om e try of the tun nel from the ex ter nal view. The up -per clo sure is just few me ters long andis a ven ti la tor room. The fire is lo cated 615 m from the west por tal and is sym -met ri cal to the cross-sec tion. The fireis as sumed a heat re lease source with a spe cific power 2700 kW/m2, wherethe ox y gen and fuel con sump tion andthe re lease of com bus tion prod ucts de -pend on the stoichiometric equa tion11O2 + C7H16 ® 7CO2 + 8H2O. HereC7H16 is a heptane, which burns verysim i lar to a crude-oil just with lesssoot re lease. This is ad di tion allyadded to the com bus tion model as ex -plained in sub sec tion Soot for ma tion.The model in cludes other com bus tionprod ucts (H2, N2, H2O, O2, ...) that arede fault con sid ered and are not mat terof our re search.
Initial and boundary conditions
Ini tial bound ary con di tions are di vided to ge om e try ob sta cle con di tions andfluid ini tial con di tions. Walls of the tun nel are de fined as ther mally thick walls in themodel, where heat trans fer is com puted to and through the walls. The ini tial tem per a tureof any ob sta cle is de fined the same as am bi ent (20 °C) tem per a ture. The ve loc ity be sidethe wall is cal cu lated as the av er age value of the ve loc ity in the first cell touches the walland zero ve loc ity on the wall cell (zero ve loc ity). The heat re lease from the fire source isde fined as full power on the be gin ning of the sim u la tion, be cause data avail able from theex per i ment are only for full-de vel oped fire. Ther mal ra di a tion ini tial con di tions are de -fined with ra di a tion in ten sity based on the ini tial tem per a ture of ob jects (am bi ent tem per -a ture) and the air wave length that is mostly formed by ni tro gen. Heat of ra di a tion emit tedfrom walls is cal cu lated as black wall ra di a tion in ten sity.
229
Vidmar, P., Petelin, S.: Methodology of Using CFD-Based Risk Assessment in ...
Figure 2. Geometry of the memorial tunnel –north side

The model sim u lates the 3.2 % tun nel slope with the ad di tional grav ity vec torcom po nent in the di rec tion of the slope of 0.314 m/s2.
The por tals are de fined as open bound ary con di tions that link the tun nel do mainwith the am bi ent.
The ap plied nu mer i cal grid is non-uni form. The ge om e try is di vided in threesec tions over the tun nel length; 560 m, 120 m and the third 185 m. The rea son is the re -quire ment of the com bus tion model, which com pute the re ac tion and the heat re lease inthe sec ond sec tion where the fire is lo cated. Other parts of the ge om e try do not re quiresuch a dense grid be cause of lower ve loc ity gra di ents.
50 MW fire results
The size of the pool is 20 m2 and the heat re lease rate is 2700 kW/m2. The nu mer -i cal grid den sity is con stant around the fire source area 0.3 ́ 0.27 ́ 0.3 m in x, y, and z di -rec tions.
The ini tial and bound ary con di tions used are as de fined in the up per sec tion andthe re sults are pre sented in the fol low ing fig ures.
The first com par i son is of the lower and the up per tem per a ture on fig. 3. Af ter 5min., the up per tem per a ture oc curs over the fire and is around 600 °C, the tem per a turecon tour 60 °C also agree well com par ing ex per i men tal and sim u la tion re sults. The ac cu -racy of the sim u la tion is also con firmed com par ing other tem per a ture con tours and theirdis tance from the fire. The ma jor ity of stream lines move into the slope di rec tion (up -stream) and a short tail of 150 m is formed down stream (back lay er ing ef fect).
Other pa ram e ters, mea sured on the ex per i ment are not pre sented in the val i da -tion be cause they are strongly de pend ent of tem per a ture.
230
THERMAL SCIENCE: Vol. 11 (2007), No. 2, pp. 223-250
Figure 3. Temperature field along the tunnel centreline for 50 MW fire and 5 min. after theignition (experiment and simulation)

Fig ure 4 shows the com par i son of tem per a ture fields 15 min. af ter the ig ni tion.The qual i ta tive es ti ma tion of booth re sults is quite good. Ob serv ing the con tour of 100 °C we found that its av er age height is al most the same around 2.5 m. In ad di tion, other con -tours, for ex am ple 300 °C, reach in booth cases the dis tance around 450 m.
The con clu sion of com par ing the re sults is that the model ge om e try, ini tial andbound ary con di tions and the set ting of nu mer i cal grid, con form to the nu mer i cal re quire -ments for the cal cu la tion of fluid dy nam ics in side the tun nel, against the ex per i men taldata. The ob tained in for ma tion’s are fur ther used in the con struc tion of other sim i larmod els.
100 MW fire results
The val i da tion ex per i ment on Me mo rial Tun nel Test [25], known un der thenum ber 615 B is a 100 MW fire with lon gi tu di nal ven ti la tion.
The set ting up of ven ti la tors and their signs are pre sented in fig. 5.
231
Vidmar, P., Petelin, S.: Methodology of Using CFD-Based Risk Assessment in ...
Figure 4. Temperature field along the tunnel centreline for 50 MW fire and 15 min. after theignition (experiment and simulation)
Figure 5. Experiment setup

The size of the fire source is 2 times 24 m2. The heat re lease rate is, on other tests, 2700 kW/m2. The se quence of events, dy nam ics of fire burn out and the ven ti la tors dy -nam ics is pre sented in tab. 3.
232
THERMAL SCIENCE: Vol. 11 (2007), No. 2, pp. 223-250
Table 3. Chronological events sequence on the fire experiment [25]
Me mo rial tun nel fire ven ti la tion test pro gram
Sum mary of test615B
Test date: 22.02.1995
Test type: Longitudinal ventilation with jet fans
15 jet fans installed
Fire size: 100 MW (nominal)
Test events sequence
Real time[hr:min.:s]
Elapsed time[s]
Ignitor ignition: 11:50:35
Fuel oil ignition: 11:50:42
Full pan engulfment: 11:51:13 00:00
Fuel oil shut-off: 12:16:13 25:00
Pan fuel oil burnout: 12:43:55 52:42
Fan operation
Fan response time: 2 minutes elapsed time
Jet fan(s) running
Pe riod of fan op er a tion
Real time[hr:min.:s]
Elapsed time[s]
1, 3, 4, 6, 7, 9 11:53:13-12:05:13 2:00-14:00
1, 3, 4, 6, 9 12:05:13-12:13:13 14:00-22:00
1, 3, 4, 6, 7, 9 12:13:13-12:17:06 22:00-25:53
None 12:17:06-12:17:16 25:53-26:03
5, 8, 11 (REV) 12:17:16-12:25:32 26:03-34:19
5, 8, 11, 14 (REV) 12:25:32-12:26:24 34:19-35:11
5, 8, 11, 13, 14, 15 (REV) 12:26:24-12:34:35 35:11-43:22
None 12:34:35 – End of test 43:22 – End of test

The com po si tion of the com puter model pre sented a great ef fort, be cause of in -suf fi cient knowl edge of ini tial and bound ary con di tions. Fur ther more the min i mum re -quire ments for space and time discretization have to be found, to ob tain sat is fied qual ityof sim u la tion re sults against ex per i men tal data.
The ap pro pri ate nu mer i cal grid den sity was de ter mined above all by con tin u oussim u la tion rep e ti tion and com par i son of re sults. Based upon pre ce dent cal cu la tion andpre dicted ve loc i ties around ven ti la tors, which is around 30 m/s, the most op ti mal grid res -o lu tion is:– in the ventilator surrounding (10 m upstream and 20 m downstream in the direction of
ventilation blowing): 0.4 ´ 0.3 ´ 0.26 m in x, y, and z direction,– in the fire surrounding (50 m upstream and 50 m downstream): 0.32 ́ 0.3 ́ 0.33 m in
x, y, and z direction, and– the remnant area, where fluid characteristics are much more stationary: 0.48 ´ 0.36 ´
´ 0.39 m in x, y, and z direction.Ini tial and bound ary con di tions are more dif fi cult to pre scribe as in the 50 MW
fire, es pe cially for ven ti la tors def i ni tion. Ven ti la tors are pre sented as the source and sinkof mass flow and are de fined as a thin vent in two di men sions. It means that the ven ti la torge om e try is not mod elled. The as sump tion ex posed has not a par tic u lar ef fect on theover all fluid dy nam ics through the tun nel as found dur ing tests. The ve loc ity bound arycon di tion, de fin ing the ven ti la tor, is 30 m/s and has the same sign on both side to al lowthe through out flow.
The cri te rion of the cor rect space discretization is the com pa ra ble sim u la tion ofgrav ity cur rents [27] that form tem per a ture fields pre sented in the fol low ing fig ures.
Com par ing booth tem per a ture fields mea sured on the ex per i ment and sim u latedwith FDS af ter 300 s shows few dif fer ences be tween re sults. Up stream the fire on fig. 6(left side) the cal cu lated tem per a tures field well agrees with ex per i men tal re sults, whiledown stream (right side) the sim u lated tem per a tures are lower for about 40% from ex per i -
233
Vidmar, P., Petelin, S.: Methodology of Using CFD-Based Risk Assessment in ...
Figure 6. Temperature field along the tunnel centreline for 100 MW fire and 5 min. after theignition (experiment and simulation)

men tal. The main rea son found is a tran sient of grid den sity from 0.3 to 0.57 m, where agreat part of the com pu ta tion ac cu racy is lost. Com par ing the 50 MW fire with nat u ralven ti la tion and 100 MW forced ven ti la tion fire we found a great dif fer ence of ve loc itygra di ents that are higher in forced ven ti lated test. This im plies the re quire ment of moreac cu rate grid res o lu tion [28], par tic u larly in the fire sur round ing. The sec ond is the limitof the mix ture frac tion model that un der es ti mates the real fire size in the case of coarsemesh and in tro duces an em pir i cal cor re la tion to the model to cor rect the fire ac tual size.This has an im por tant in flu ence on the cal cu la tion of the air en trance to the fire sur faceand con se quently to the cor rect com pu ta tion of heat re lease rate and tem per a tures.
Fig ure 7 shows the com par i son of tem per a ture fields for 100 MW fire, 14 min.af ter the fire ig ni tion. The ma jor dif fer ences are ob tained on the up stream (left) side,where the grav ity cur rent is not com pletely in verted down stream as pre sented on the ex -per i men tal mea sure ment. The first idea was the dif fer ences came from the dif fi cult set -ting-up of ini tial and bound ary con di tions on the model, but af ter many re peats, sim i larre sults have come. Other rea sons of such dif fer ences should be: – difficult definition of initial and boundary conditions,– unsuitable numerical grid density (finest grid would extend the simulation time),– insufficient understanding of the geometry and experiment performance conditions,
and– defectiveness of the turbulent model.
The set ting of fin est mesh was dif fi cult to ex e cute, be cause the sim u la tion would re quire a long com pu ta tion time. Fur ther more, re sults should be treated con ser va tivelywith a cer tain de gree of de vi a tion [29]. The dif fer ence should be quan ti fied from the fig -ure where the ma jor de vi a tion is pre sented in a 100 m up stream flow.
234
THERMAL SCIENCE: Vol. 11 (2007), No. 2, pp. 223-250
Figure 7. Temperature field along the tunnel centreline for 100 MW fire and 14 min. afterthe ignition (experiment and simulation)

The con clu sions of val i da tion tests are that re sults from forced ven ti la tion mod -els have to be han dled with care and with a good de gree of con ser va tion. Sim u la tionmod els with low ve loc ity gra di ents e. g. nat u ral or low speed forced ventilations shouldbe ac cepted with a good de gree of ac cu racy. The ob tained knowl edge in set ting-up dif fer -ent mod els is then used in the prep a ra tion of other model sce nar ios, theirs ge om e try char -ac ter is tics and other con di tions.
Tunnel fire analysis
The search for a uni ver sal method is prac ti cally im pos si ble be cause of the prob -lems com plex ity and the safety con cep tion. Most re search ers are avoid ing the uni ver salmeth ods be cause of their high com plex ity level and their rel a tively low re sult re al itylevel. It is known that uni ver sal meth ods turn out right only as the o ries but their ap pli ca -tion is hard to trans fer to real prob lems.
The meth od ol ogy pre sented in the dis ser ta tion is based on a model ac ces sion.The re al ity of the meth od ol ogy is proved with valid model re sults and nu mer ous sce nar -ios with which a whole spec tre of tun nel fire prob lems is taken into ac count, con sid er ingdif fer ent types of ven ti la tion and dif fer ent fire sizes. Other pa ram e ters like: en vi ron mentin flu ence, traf fic den sity, and other char ac ter is tics of the tun nel are han dled sep a rately.
The idea is based on the mak ing of a de ter min is tic risk matrice as it is showed intab. 2. The safety cat e gory is rep re sented by the power of the fire and the type of ven ti la -tion at dif fer ent strengths. The con se quences are eval u ated in the time dur ing the prog ress of the fire. The risk cri te ria are de fined as a re la tion be tween the hot smoke layer height,the dis tance from the fire po si tion, and the evac u a tion time of the us ers. In case the speedof the smoke is higher than the speed of the evac u a tion and in case the height of the hotlayer is higher than the speed of the evac u a tion, the risk is high.
Tunnel fire scenario
Val i da tion tests from the sec tion Model val i da tion show the first suc cess ful sim -u la tion mea sure be cause they de fine the re li abil ity of the re sults. The first sim u la tion re li -abil ity con di tion, are suit able phys i cal mod els and the nu meric re li abil ity of the trans ferequa tions res cue method. These facts are shown within the sub sec tion Com puter mod elsand sim u la tions. The com puter pro gram FDS is a con sol i dated pro gram that en closesphys i cal mod els needed for the list of cir cum stances dur ing the fire in a tun nel. The pre ci -sion while solv ing the trans fer equa tions is very de pend ent on the ge om e try and the ini tial and bound ary con di tions. In greater fire forces or high start ing speed the scale of the nu -meric net rep re sents a key con di tion for the ac cu racy of the re sults. That is why val i da tion tests are of key im por tance in the search for suit able mod els discretization.
All to gether 12 tun nel fire sce nar ios are pre sented. Three lev els of fire force aresim u lated, each with four dif fer ent types of ven ti la tion. The span of the fire force is be -tween 20, 50, and 100 MW whilst the ven ti la tion is sorted from the less to the more ef fec -
235
Vidmar, P., Petelin, S.: Methodology of Using CFD-Based Risk Assessment in ...

tive: 1 – nat u ral, 2 – lon gi tu di nal, 3 – semi trans verse, and 4 – trans verse or im provedtrans verse ven ti la tion.
The whole sec tion of the sim u lated tun nel is 650 m long, the other di men sionsare: width 10 m and height 8 m or 6 m when the roof is low ered. Though the di men sionsand shape of the tun nel tube partly differenciate among them that does not in flu ence what hap pens dur ing the fire. That is why or di nary skel e ton mea sure ments are cho sen. The ge -om e try of the tun nel model, the type of ven ti la tion, and the lo ca tion of the fire are shownin fig. 9.
The fire is placed on a dis tance of 300 m in all the mod els, it dif fers only in thesize of the burn ing area. The fo cus point is de fined as the heat source to which thecombusted model cal cu lates the mass trans fer on the base of the ac corded combusting re -ac tion and the ox y gen con sump tion. The fo cus point is shown in sketch (fig. 8). When we de fine the base ig nit ing tem per a ture, heat con duc tiv ity, cal o rific value, etc. (de pend ingon the mod els de mands) it is treated in the model as com bus ti ble sub stance and it co op er -ates with the gen er a tion of heat in the combusting model. In case of the de scribed sce nar -ios, the base is rel a tively small or of small vol ume, that is why the heat con tri bu tion of theburn ing base is only a few per cent of the de fined freed heat of the bound ary con di tion.
Fire simulation
As pre vi ously men tioned in pre vi ous chap ters, for the sim u la tion of cur rent dy -nam ics and com bus tion dur ing a fire, the com puter pro gram FDS ver sion 4 is used whichis de vel oped by the NIST, USA. The CFD res cue model on per sonal com put ers is inwider use only in re cent years be cause of the suf fi cient ca pac ity of these com put ers. Un til then such sim u la tions could only be ex e cuted on work ing sta tions that were not avail ableto ev ery one. Par al lel con nec tions be tween com put ers in a lo cal net work are used fre -quently be cause each per sonal com puter has lim ited hard ware ca pac ity. Be cause the lim -i ta tion in avail able mem ory of each com puter is im por tant we ac quire mul ti ple in creasesin com puter mem ory with a par al lel con nec tion. This means that we can com prise graterge om e try of the tun nel or a more dense nu meric net in a given sec tor.
236
THERMAL SCIENCE: Vol. 11 (2007), No. 2, pp. 223-250
Figure 8. Sketch of the focus point and way of laying theboundary conditions

Even though the ca pac ity of the mem ory in creases so many times as there ismore work ing mem ory avail able, that does not count for the cal cu la tion speed of themodel. In the di vi sion of the model in sep a rate sec tors or par ti tions, the ex change ofbound ary con di tions be tween par ti tions is de fined by pro gram. This de mands ad di tionalcom puter ca pac i ties, es pe cially be cause of the con ver gence of so lu tions on lim its of twopar ti tions. In this case it is rec om mended to per form a par ti tion cover on the lim its withwhich we achieve a more ac cu rate so lu tion on cross ings. To the weak nesses of par al lelmod el ling, we can add the time spent on ex chang ing the data over the net work con nec -tion in case it is not fast enough.
For the cal cu la tion of the 12 pre sented sce nar ios were used 4 con nected com put -ers – PC 2.8 MHz with a join mem ory ca pac ity of 2.5 GB. The discretization of eachmodel amounts to near 800.000 com puter points which does not oc cupy all of the avail -able work ing mem ory. From a com put ers view point this is im por tant be cause while cal -cu lat ing each op er a tion there is no writ ing on the com puter disk, which takes ad di tionalcal cu lat ing time. Op ti mal re la tion be tween nu mer i cal grid den sity, cal cu la tion time andre sult re li abil ity has been cho sen af ter mul ti ple sim u la tion rep e ti tions, cal cu la tion timescom par i son, and re sult val i da tion (nu meric and sen si tive com puter model anal y sis is notpre sented in this pa per).
Initial, boundary conditions and discretization
The def i ni tion of the ini tial and bound ary con di tions is a pe cu liar ity of eachmodel. Four el e men tary types of ven ti la tion are dis cussed: nat u ral, lon gi tu di nal, semitrans verse, and trans verse. In def i ni tion of the ge om e try of the tun nel tube, the nat u raland lon gi tu di nal ven ti la tion are dis cussed to gether and the semi trans verse and trans verse ones also in the same way. The com par i son is shown in fig. 9.
It is clear that the tun nel mod els with nat u ral and lon gi tu di nal ven ti la tion takethe whole sec tion of the tun nel, how ever the tun nel mod els with semi trans verse andtrans verse ven ti la tion con sider only the light sec tion of the tun nel (with out the ven ti la tion drains). The suc tion flaps are de fined with the speed mar gin con di tion on the limit of thecal cu lat ing do main. The same goes for the in take ca nals in the trans verse ven ti la tion withthe dif fer ence that the cur rent has the op po site di rec tion. The bound ary and ini tial con di -tions of all of the four mod els shows tab. 4.
The space discretization of the mass equa tions, mo tive quan tity and heat en ergyis de rived with the method of fi nite dif fer ence in the cen tral dif fer en tial scheme in asquare net. The time discretization of the trans fer equa tions is made on an ex plicit scheme of pre dic tor-corrector.
Parameters and approach to the result analysis
The sim u la tion re sults are pre sented on lev els of fire force and types of tun nelven ti la tion shown in fig. 9. The con se quences of the dis tance of the smoke and the tem -per a ture are qual i ta tively eval u ated from the cur rent and tem per a ture field. With this, itmust be noted that mis takes are pos si ble in cal cu lat ing the av er age value in dif fer ent time
237
Vidmar, P., Petelin, S.: Methodology of Using CFD-Based Risk Assessment in ...

and space steps, which are lim ited with the uni fied way of av er age cal cu lat ing. With that,it is true that the risk of ex po sure to smoke is that the par tic i pant is ex posed in the mo ment when the smoke reaches him. The most risky ex am ples are the ones when the par tic i pantdoes not start with the im me di ate self-res cue pro ce dure af ter the start of the fire and thesec ond when the spread ing speed of the smoke is higher then the self-res cue pro ce durespeed of the par tic i pants in the tun nel. The other risk cri te rion is high tem per a ture thatusu ally has a lower con tri bu tion to the risk than smoke. In most cases this de pends on theway of ven ti la tion.
The limit value of the con cen tra tion of smoke par ti cles (PM10 heavy par ti cles withthe di am e ter up to 10 mm) is 1000 mg/m3 [18] and the limit tem per a ture is 50 °C [18]. Though the smoke par ti cles are less prob lem atic from a poi son ous point of view, than other com bus ti -ble prod ucts (CO2 – car bon di ox ide, CO – car bon mon ox ide, HCN – hy dro gen cy a nide, HCl– hy dro gen chlo ride, etc.) their re la tion to the con cen tra tion is con di tional and of ten very sim -i lar. From dif fer ent ex per i ments in the Me mo rial Tun nel [26] it can be found, for ex am ple,con cen tra tions of smoke par ti cles and CO in re la tion around 10:1. A sim i lar re la tion can bealso found on toxic lev els of these prod ucts. LC50 (le thal con cen tra tion 50%) for soot par ti -cles is 30 g/m3 in a 30 min. ex po sure or 1-3 g min./m3 LC50, for CO is 2000-3500 ppm, whichis 2300-4000 mg/m3 in a 30-60 min ex po sure [18]. The limit tem per a ture val ues of hu man en dur ance are ac cord ing to Gann [18] 100 °C for 30 min. and 75 °C for 60 min. of ex po sure.
238
THERMAL SCIENCE: Vol. 11 (2007), No. 2, pp. 223-250
Figure 9. Model geometry in different types of ventilation(a) natural ventilation, (b) longitudinal ventilation, (c) semi transverseventilation, (d) transverse ventilation

239
Vidmar, P., Petelin, S.: Methodology of Using CFD-Based Risk Assessment in ...
Table 4. Boundary and initial conditions for different types of ventilation
Ventilation/boundary and
initialconditions
Natural Alongside Semi transverse Transverse
PortalsOpen boundary
conditionOpen boundary
conditionOpen boundary
conditionOpen boundary
condition
Walls
Tinitial = Tenvironment
Iradiation = Iblack body
vwall = 1/2 v0
Tinitial = Tenvironment
Iradiation = Iblack body
vwall = 1/2 v0
Tinitial = Tenvironment
Iradiation = Iblack body
vwall = 1/2 v0
Tinitial = Tenvironment
Iradiation = Iblack body
vwall = 1/2 v0
Focus point
· 20 MW– 6 ´ 3 m
– 1333 kW/m2
· 50 MW – 10 ´ 3m
· – 1666 kW/m2
· 100 MW – 15 ´ 4 m · – 1666 kW/m2
· 20 MW – 6 ´ 3 m· – 1333 kW/m2
· 50 MW – 10 ´ 3 m · – 1666 kW/m2
· 100 MW – 15 ´ 4 m
· – 1666 kW/m2
· 20 MW – 6 ´ 3 m· – 1333 kW/m2
· 50 MW – 10 ´ 3 m · – 1666 kW/m2
· 100 MW – 15 ´ 4 m
· – 1666 kW/m2
· 20 MW – 6 ´ 3 m· – 1333 kW/m2
· 50 MW – 10 ´ 3 m · – 1666 kW/m2
· 100 MW – 15 ´ 4 m
· – 1666 kW/m2
Longitudinalventilators
–6 ´ 2 ventilators
vvent. = 30 m/s– –
Transverseventilators
– –Exhaust:3 ´ 53 m3/s
Intake:101 ´ 0.64 m3/sExhaust:3 ´ 53 m3/s
Smokeexhaust
– – – –
Air intake Through portals Through portals Trough portals
· Trough import
· ventilators
· Through portals
Sourcedynamics
T = 0.0,* F = 0.5*
T = 120.0, F = 1.0
T = 500.0, F = 1.0
T = 900.0, F = 1.0
T = 0.0, F = 0.5
T = 120.0, F = 1.0
T = 500.0, F = 1.0
T = 900.0, F = 1.0
T = 0.0, F = 0.5
T = 120.0, F = 1.0
T = 500.0, F = 1.0
T = 900.0, F = 1.0
T = 0.0, F = 0.5
T = 120.0, F = 1.0
T = 500.0, F = 1.0
T = 900.0, F = 1.0
Longitudinalventilationdynamics
–
T = 0.0, F = 0.0
T = 500.0, F = 0.0
T = 560.0, F = 0.5
T = 720.0, F = 1.0
T =1800.0, F = 1.0
– –
Transverseventilationdynamics
T = 0.0, F = 0.0
T = 60.0, F = 0.0
T = 120.0, F = 1.0
T = 0.0, F = 0.0
T = 60.0, F = 0.0
T = 120.0, F = 1.0
* T = time [s], F = max. variable value factor [0...1]
Be cause this in for ma tion is true for an adult man it is the most op ti mal. But within the samere search there are dif fi cul ties in breath ing al ready at 65 °C of air tem per a ture. Tak ing this into ac count there are two val ues that are used in the re sult anal y sis. The cho sen limit con cen tra -tion of smoke par ti cles is 1000 mg/m3 and the limit tem per a ture is 50 °C.
The risk or con se quences are di vided in five cat e go ries that are shown in tab. 1:
1. LR – low risk: smaller injury
2. MR – medium risk: serious injury with full recovery
3. SR – serious risk: permanent injury
4. VHR – very high risk: low casualty number (1-3), numerous injured
5. EHR – extremely high risk: numerous casualties
In the re sult anal y sis each cat e gory matches a log i cal in scrip tion and it con di -tions with the time from the start of the sim u la tion, any dis tance from the fire area, fireforce, way of ven ti la tion, limit value of the con cen tra tion of smoke par ti cles, and the limit tem per a ture. Then fol low the con di tional clauses of each cat e gory:
LR: ASD < 500.MR: ASDL > 500. Ù SLH > ASLHSR: ASD > 500.VHR: ASDL > 500. Ù SLH < ASLHEHR: ((SR Ú VHR) Ù AT > 50.) Ú ATL > 50.
where the abbreviations mean:
ASD – average smoke density value in profile, [mg/m3],ASDL – average smoke density value in layer, [mg/m3],SLH – smoke layer height, [m],ASLH – allowed smoke layer height, [m],AT – average temperature in profile, [°C], ATL – average temperature in layer, [°C],TLH – temperature layer height, [m], andATLH – allowed temperature layer height, [m].
The CFD sim u la tion re sults are dis creet in space and time with ex tremely smallspace and time steps. An anal y sis of so many in for ma tion is log i cal only in a graphic form ei ther with a graphic in ter me di ate start ing point (smokeview, ...) or with dis creet ness inonly one vari able (space and time) in form of di a grams. From a safety view point andfrom a point of view of in ter ven tion dur ing the fire in the tun nel such a large quan tity ofin for ma tion is il log i cal, un clear, and as such use less. From the whole data base mostlyspa tially av er age val ues in height lon gi tu di nal the tun nel axis are im por tant to gether withthe time av er age val ues with the in ter val of 60 sec onds. The in for ma tion is av er age alsoin the tun nel height with that the tun nel is di vided in four equal lay ers in which an av er age value for layer height is cal cu lated for each spa tial step. For an eas ier un der stand ing theac ces sion is pre sented graph i cally on fig. 10.
240
THERMAL SCIENCE: Vol. 11 (2007), No. 2, pp. 223-250
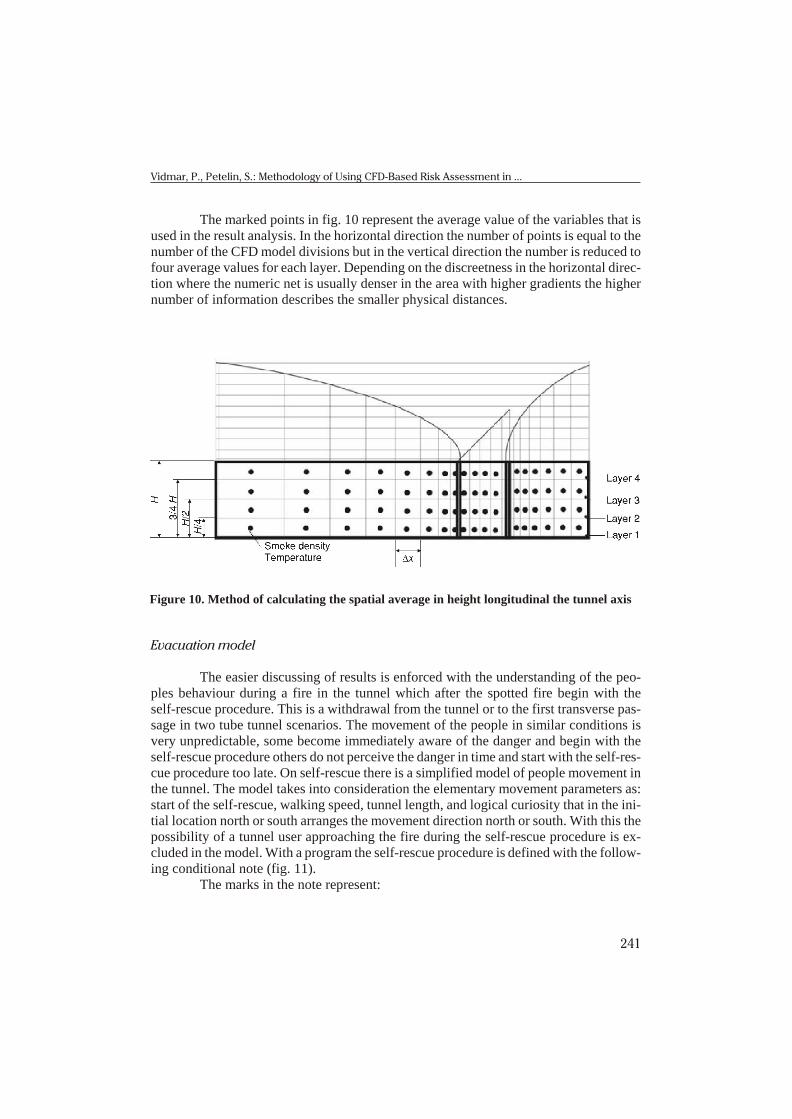
The marked points in fig. 10 rep re sent the av er age value of the vari ables that isused in the re sult anal y sis. In the hor i zon tal di rec tion the num ber of points is equal to thenum ber of the CFD model di vi sions but in the ver ti cal di rec tion the num ber is re duced tofour av er age val ues for each layer. De pend ing on the dis creet ness in the hor i zon tal di rec -tion where the nu meric net is usu ally denser in the area with higher gra di ents the highernum ber of in for ma tion de scribes the smaller phys i cal dis tances.
Evacuation model
The eas ier dis cuss ing of re sults is en forced with the un der stand ing of the peo -ples be hav iour dur ing a fire in the tun nel which af ter the spot ted fire be gin with theself-res cue pro ce dure. This is a with drawal from the tun nel or to the first trans verse pas -sage in two tube tun nel sce nar ios. The move ment of the peo ple in sim i lar con di tions isvery un pre dict able, some be come im me di ately aware of the dan ger and be gin with theself-res cue pro ce dure oth ers do not per ceive the dan ger in time and start with the self-res -cue pro ce dure too late. On self-res cue there is a sim pli fied model of peo ple move ment inthe tun nel. The model takes into con sid er ation the el e men tary move ment pa ram e ters as:start of the self-res cue, walk ing speed, tun nel length, and log i cal cu ri os ity that in the ini -tial lo ca tion north or south ar ranges the move ment di rec tion north or south. With this thepos si bil ity of a tun nel user ap proach ing the fire dur ing the self-res cue pro ce dure is ex -cluded in the model. With a pro gram the self-res cue pro ce dure is de fined with the fol low -ing con di tional note (fig. 11).
The marks in the note rep re sent:
241
Vidmar, P., Petelin, S.: Methodology of Using CFD-Based Risk Assessment in ...
Figure 10. Method of calculating the spatial average in height longitudinal the tunnel axis

XtSJ -1
– position of the user regarding the location of the fire (N or S) in precedent timestep, [m],
XL0 – starting location of the self-rescue observed from a starting portal, [m],XLt – users location in the observed time period, [m],Xpoz – locations of the fire observed form a starting portal, [m],vH – walking speed, [m/s],t – momentarily observed time period, [s], andtSR – delay of the self-rescue after the start of the fire, [s].
With the pre sented model the pos si bil i ties of the anal y sis or the fol low ing of themove ment of the us ers in the tun nel in crease ad di tion ally. The cal cu lated lo ca tions arethen used for check ing the tem per a ture and the smoke con cen tra tion on the ground inthese places and con se quently the level of risk.
Results
The pre sen ta tion of the re sults in a form of cur rent char ac ter is tic graph hasproved to be un suit able. The shape of the cur rent pro file can give use ful in for ma tion onlyto an ex pe ri enced user and an ex pert of the tun nel ven ti la tion prob lems. More use ful in -
242
THERMAL SCIENCE: Vol. 11 (2007), No. 2, pp. 223-250
Users’ location N-(north)or S-(south) from the fire
Distance fromthe fire
DistanceN ® S
Distance fromthe fire
Distance fromthe fire
Distance fromthe fire
DistanceN ® S
DistanceN ® S
DistanceN ® S
Evaquation:Initial location
380.00 28.00 S 515.00 163.00 S 605.00 253.00 S OUT OUT S
24018012060
IF (X = ’S’Ù Xl – v (t – t )£ 0) then ’OUT’SJ 0 H SRt–1
else
IF (X = ’S’) then XL – v (t – t )SJ 0 H SRt–1
else
IF (X = ’J’Ù XL – v (t – t )³ Lp) then ’OUT’SJ 0 H SRt–1
else
XL + v (t – t )0 H SR
END IF
END IF
END IF
IF (Xl = ’OUT’) then ’OUT’t
else
ABS (X – Xl )poz t
END IF
Figure 11. Evacuation model

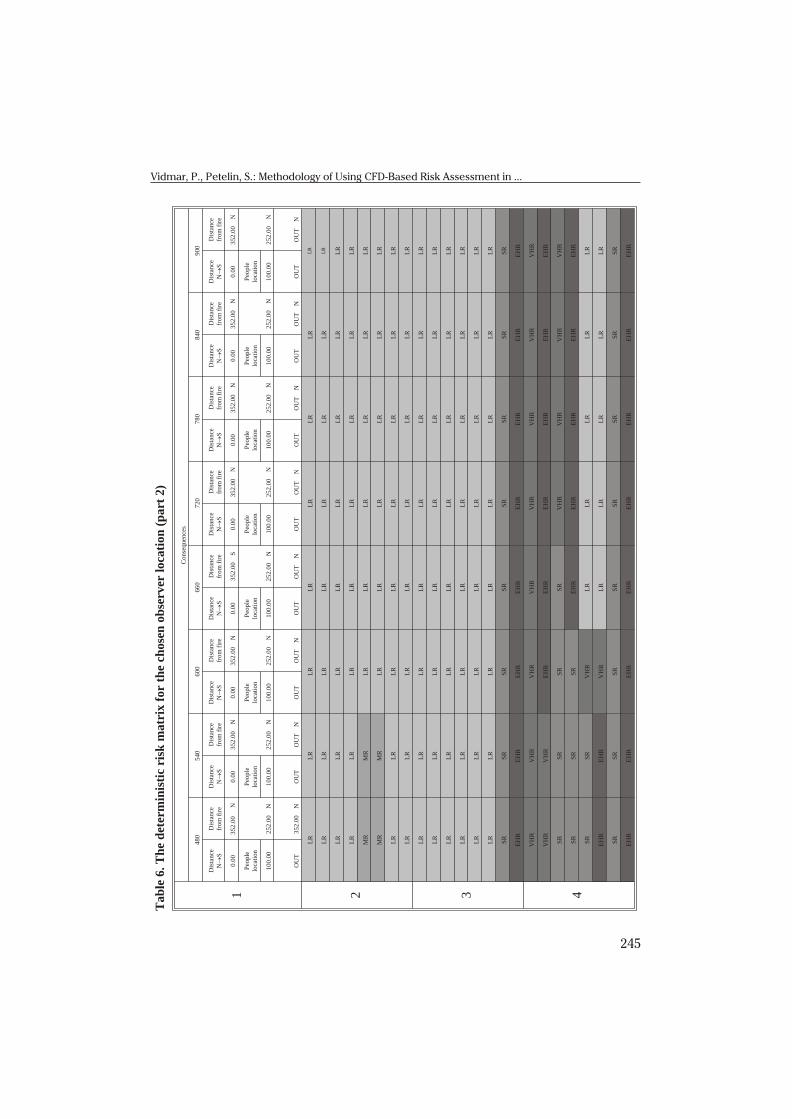
for ma tion is the nu mer i cal value of the re quested vari able that is given in a spa tial andtime step as it shows in tab. 5. In the ta ble, the tem per a ture and smoke val ues are given asthe most in flu en tial risk pa ram e ters in the tun nel. In the sec ond part the ma trix gives a risk level on the ba sis of nu mer i cal val ues and con di tional de pend ence pre sented in sub sec -tion Pa ram e ters and ap proach to the re sult anal y sis . The first level of risk is pre sentedby the pres ence of smoke that in cludes the first four risk stages, the pres ence of high tem -per a ture con trib utes ad di tional (the high est) risk stage. Ta ble 6 pres ents a de ter min is ticma trix of risk dur ing a fire for a con stant lo ca tion in a tun nel that is 252 m north of the
fire. The pic ture that we get whit this is very rep re sen ta tive be cause it con firms the the oryon safety anal y ses from the sec tion Meth od olog i cal ap proach on tun nel safety. From theta ble the safety cat e go ries can be seen and ap pro pri ate con se quences can be al lo cated.
Ta ble 6 has es pe cially a com par a tive pur pose for find ing the in flu ence of dif fer -ent types of ven ti la tion on the fire dy namic, smoke, and tem per a ture de vel op ment. Wecan log i cally as sume that the risk in low fire force is lower in com par i son with big gerfires. Fol low ing the same logic along with the con sid er ation of dif fer ent types of ven ti la -tion and man ner of man age ment it soon be comes dif fi cult. One of the no tice able dif fer -ences is the level of the cal cu lated risk (MR – me dium risk) in lon gi tu di nal ven ti la tion ofa 20 MW fire. It is ex pected that the in creased risk also ap pears in the 50 MW fire but it isnot so. The search for a cause is dif fi cult be cause this is hid den in the fluid dy nam ics dur -
243
Vidmar, P., Petelin, S.: Methodology of Using CFD-Based Risk Assessment in ...
Table 5. Matrix of soot density and temperature (cut-out)

244
THERMAL SCIENCE: Vol. 11 (2007), No. 2, pp. 223-250
)1 trap(
noitacol revresbo
nesohc e
ht rof xirtam
ksir citsini
mreted e
hT .6 el
baT
1
yrogetac ytefa
Ssecneu
qesno
C
06
02
10
81
04
20
03
06
30
24
ecnatsiD
N®
Secnatsi
Derif
morf
ecnatsiD
N®
Secnatsi
Derif
morf
ecnatsiD
N®
Scnatsi
Derif
morf
ecnatsiD
N®
Scnatsi
Derif
morf
ecnatsiD
N®
Scnatsi
Derif
morf
ecnatsiD
N®
Secnatsi
Derif
morf
ecnatsiD
N®
Secnatsi
Derif
morf
00.
03
3N
00.
22
00.
05
3N
00.
20
0.0
N 0
0.2
53
00.
00
5S
00.
84
10
0.0
5N
00.
20
30
0.0
N 0
0.2
53
00.
0N
00.
25
3
laitini elp
oeP
noitac
ol
N 0
0.2
52
elp
oeP
noitac
ol
N 0
0.0
01
elp
oeP
noitac
ol
N 0
0.2
52
elp
oeP
noitac
ol
N 0
0.2
52
elp
oeP
noitac
ol
N 0
0.2
52
elp
oeP
noitac
ol
N 0
0.2
52
elp
oeP
noitac
ol
N 0
0.2
52
00.
00
10
0.0
01
00.
00
10
0.0
01
00.
00
10
0.0
01
00.
00
1
noitau
qavE
:laitinIn
oitacol
N 0
0.2
53
TU
ON
TU
OT
UO
N T
UO
TU
ON
TU
OT
UO
N T
UO
TU
ON
TU
OT
UO
N T
UO
00.
0
2
esrevsnarT
RL
RL
RL
RL
RL
RL
RL
RL
RL
RL
RL
RL
RL
RL
ime
Sesrevsnart
RL
RL
RL
RL
RL
RL
RL
RL
RL
RL
RL
RL
RL
RL
lanidutign
oL
RL
RL
RL
RM
RM
RM
RM
RL
RL
RL
RM
RM
RM
RM
larutaN
RL
RL
RL
RL
RL
RL
RL
RL
RL
RL
RL
RL
RL
RL
3
esrevsnarT
RL
RS
RL
RL
RL
RL
RL
RL
RS
RL
RL
RL
RL
RL
ime
Sesrevsnart
RL
RL
RL
RL
RL
RL
RL
RL
RL
RL
RL
RL
RL
RL
lanidutign
oL
RL
RL
RL
RL
RL
RL
RL
RL
RL
RL
RL
RL
RL
RL
larutaN
RL
RL
RL
RS
RS
RS
RS
RL
RL
RL
RH
ER
HE
RH
ER
HE
4
esrevsnarT
RL
RS
RL
RS
RS
RS
RS
RL
RS
RL
RS
RS
RS
RS
ime
Sesrevsnart
RL
RS
RL
RL
RS
RS
RS
RL
RS
RL
RL
RS
RS
RS
lanidutign
oL
RL
RL
RL
RL
RL
RL
RL
RL
RL
RL
RL
RL
RL
RL
larutaN
RL
RL
RS
RS
RS
RS
RS
RL
RL
RH
ER
HE
RH
ER
HE
RH
E
245
Vidmar, P., Petelin, S.: Methodology of Using CFD-Based Risk Assessment in ...
)2 trap(
noitacol revresbo
nesohc e
ht rof xirtam
ksir citsini
mreted e
hT .6 el
baT
1
secneuqesn
oC
08
40
45
00
60
66
02
70
87
04
80
09
ecnatsiD
N®
Secnatsi
Derif
morf
ecnatsiD
N®
Secnatsi
Derif
morf
ecnatsiD
N®
Secnatsi
Derif
morf
ecnatsiD
N®
Secnatsi
Derif
morf
ecnatsiD
N®
Secnatsi
Derif
morf
ecnatsiD
N®
Secnatsi
Derif
morf
ecnatsiD
N®
Secnatsi
Derif
morf
ecnatsiD
N®
Secnatsi
Derif
morf
00.
0N
00.
25
30
0.0
N 0
0.2
53
00.
0N
00.
25
30
0.0
S 0
0.2
53
00.
0N
00.
25
30
0.0
N 0
0.2
53
00.
0N
00.
25
30
0.0
N 0
0.2
53
elp
oeP
noitac
ol
N 0
0.2
52
elp
oeP
noitac
ol
N 0
0.2
52
elp
oeP
noitac
ol
N 0
0.2
52
elp
oeP
noitac
ol
N 0
0.2
52
elp
oeP
noitac
ol
N 0
0.2
52
elp
oeP
noitac
ol
N 0
0.2
52
elp
oeP
noitac
ol
N 0
0.2
52
elp
oeP
noitac
ol
N 0
0.2
52
00.
00
10
0.0
01
00.
00
10
0.0
01
00.
00
10
0.0
01
00.
00
10
0.0
01
N 0
0.2
53
TU
ON
TU
OT
UO
N T
UO
TU
ON
TU
OT
UO
N T
UO
TU
ON
TU
OT
UO
N T
UO
TU
ON
TU
OT
UO
2
RL
RL
RL
RL
RL
RL
RL
RL
RL
RL
RL
RL
RL
RL
RL
RL
RL
RL
RL
RL
RL
RL
RL
RL
RL
RL
RL
RL
RL
RL
RL
RL
RM
RM
RL
RL
RL
RL
RL
RL
RM
RM
RL
RL
RL
RL
RL
RL
RL
RL
RL
RL
RL
RL
RL
RL
RL
RL
RL
RL
RL
RL
RL
RL
3
RL
RL
RL
RL
RL
RL
RL
RL
RL
RL
RL
RL
RL
RL
RL
RL
RL
RL
RL
RL
RL
RL
RL
RL
RL
RL
RL
RL
RL
RL
RL
RL
RL
RL
RL
RL
RL
RL
RL
RL
RL
RL
RL
RL
RL
RL
RL
RL
RS
RS
RS
RS
RS
RS
RS
RS
RH
ER
HE
RH
ER
HE
RH
ER
HE
RH
ER
HE
4
RH
VR
HV
RH
VR
HV
RH
VR
HV
RH
VR
HV
RH
VR
HV
RH
ER
HE
RH
ER
HE
RH
ER
HE
RS
RS
RS
RS
RH
VR
HV
RH
VR
HV
RS
RS
RS
RH
ER
HE
RH
ER
HE
RH
E
RS
RS
RH
VR
LR
LR
LR
LR
L
RH
ER
HE
RH
VR
LR
LR
LR
LR
L
RS
RS
RS
RS
RS
RS
RS
RS
RH
ER
HE
RH
ER
HE
RH
ER
HE
RH
ER
HE

ing the fire, tak ing into ac count that the ge om e try, the dis creet ness, and the ini tial andbound ary con di tions (ex cept the force of the fire) are un al tered.
The sec ond im por tant re sult in the ta ble is the pos si bil ity of ana lys ing the in flu -ence of turn ing on the ven ti la tors on the form ing of the smoke cur tain. It is es pe cially no -tice able in the trans verse ven ti la tion of 50 and 100 MW fires where on the turn ing on, lo -cal in creased tem per a tures and smoke con cen tra tions oc cur.
Fur ther ob ser va tions and anal y ses are pos si ble with chang ing the ob served lo ca -tion in dif fer ent time in ter vals.
Ta ble 6 is made as a func tion ally de pend ent dy namic ma trix, which chooses thecal cu lated val ues from the data base with the chang ing of the ob served lo ca tion and onthe ba sis of the con di tions from sub sec tion Pa ram e ters and ap proach to the re sult anal y -sis cal cu lates the risk. The ta ble is made with the programme Ex cel.
The fields that in clude the eas ier evac u a tion model are marked in the ta ble in arow – Evacuation: Ini tial location. With it is pos si ble to de fine the tun nel us ers lo ca tion in time in ter vals of one min ute on the bases of the start ing us ers po si tion, de lay with theself-res cue pro ce dure and the walk ing speed. In this way it is pos si ble to pre dict the tun -nel us ers move ment for the fol low ing 15 min. and check the smoke con cen tra tion and thetem per a ture height to which they will be ex posed or es tab lish the risk level.
The ta ble rep re sents a con cep tual model for a gen eral pre sen ta tion of the risk intun nels with dif fer ent types of ven ti la tion and dif fer ent fire forces. The ap pli ca ble use forthe cho sen tun nel would dis cuss for ex am ple dif fer ent fire lo ca tions in stead of the dif fer -ent types of ven ti la tion.
50 MW tunnel fire scenario with natural ventilation
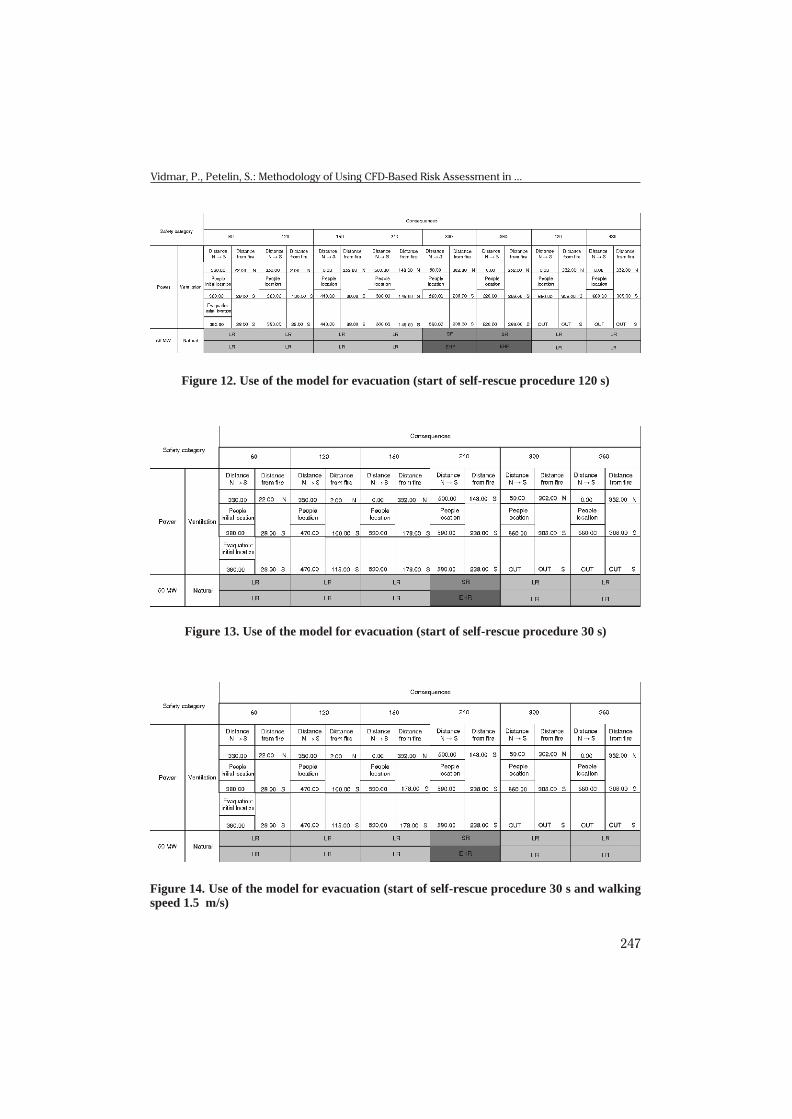
A 50 MW fire in a 650 m long tun nel is as sumed. The fire lo ca tion is on 352 m.The re ac tion and start ing self-res cue time are es ti mated to 120 s af ter the start of the fire.The lo ca tion of the ob served tun nel us ers is on 380 m or 28 m south of the fire. The av er -age walk ing speed is es ti mated to 1 m/s.
The model cal cu lates the lo ca tion in time in ter vals on the bases of con di tionsfrom sub sec tion Pa ram e ters and ap proach to the re sult anal y sis, and the risk on thebases of the pres ent smoke den sity and tem per a ture.
From the model it is clear that the smoke and high tem per a ture threaten the es -cap ing peo ple when they have not yet reached the tun nel por tal. This hap pens 300 s af terthe start of the fire. Be cause of the de layed start of the self-res cue pro ce dure the evac u a -tion time is over 6 min utes long and with it a suc cess ful es cape out of the tun nel is veryques tion able (fig. 12).
Pro vided that the self-res cue pro ce dure be gins 30 s af ter the start of the fire, theevac u a tion time re duces to less than 5 min utes. The es cape suc cess is es sen tially greaterwhich proves the sim u la tion sce nario on the fig. 13.
With the in crease of the walk ing speed to 1.5 m/s the evac u a tion time re duces toapp. 3.5 min. with which we avoid high smoke con cen tra tion and high tem per a ture. Inthese con di tions it can be as sumed that the self-res cue pro ce dure is suc cess ful.
246
THERMAL SCIENCE: Vol. 11 (2007), No. 2, pp. 223-250
247
Vidmar, P., Petelin, S.: Methodology of Using CFD-Based Risk Assessment in ...
Figure 12. Use of the model for evacuation (start of self-rescue procedure 120 s)
Figure 13. Use of the model for evacuation (start of self-rescue procedure 30 s)
Figure 14. Use of the model for evacuation (start of self-rescue procedure 30 s and walkingspeed 1.5 m/s)

The re sults obtained are use ful for us ers and es pe cially to tun nel di rec tors forplan ning fire pro ce dures and fire drills and for fire men and res cu ers.
Conclusions
For a ma trix of a fire in a tun nel and a safety eval u a tion, the prob a bil ity ac ces -sion is too gen eral be cause a greater event num ber of phys i cal le gal ity is shown with asta tis ti cal prob a bil ity. A rel a tively ac cu rate fire dy nam ics ma trix, which is pos si ble withmath e mat i cal mod els, is of ten meant only for sci ence. That is why the dis ser ta tion is ide -ally ori ented in the use of math e mat i cal CFD mod els for the mak ing of a sys tem of sce -nar ios that can be fur ther used for de vel op ing an ef fec tive fire plan or fire man age ment,fire drills, etc. A com plex of fire sce nar ios in dif fer ent tun nel ventilations and fire forcesis pre sented in the work. The work in cludes a qual i ta tive anal y sis of the cur rent cir cum -stances in four dif fer ent ven ti la tion con di tions; nat u ral, lon gi tu di nal, trans verse, andsemi trans verse. In this way a com par i son of in di vid ual types of ven ti la tion sys tems, ven -ti la tion plans and their ef fec tive ness in as sur ing suf fi cient evac u a tion times is pos si ble.Also a pos si bil ity of us age on a sin gu lar tun nel is pre sented, for which a de ter min is ticsafety anal y sis within a se lected num ber of sce nar ios would be made. Such an ac ces sionre quires a lot of cal cu lat ing time but it is change able in the de vel op ment of the safetyanal y sis and fire plan. The ge om e try and some ven ti la tion plans are “con stants” in thiscase and only the fire lo ca tion can be changed.
Apart from the num ber and way of set ting the sce nar ios, the sim u la tion re sultsare val ues of the se lected vari ables. The dis cussed vari ables are mostly the smoke den sity and the tem per a ture which de fine the dif fer ent risk lev els on the ba sis of the hu man en -dur ance in in creased val ues and con di tional in ter act ing de pend ence. On this ba sis the de -ter min is tic risk ma trix is made which is the key el e ment of the dis ser ta tion. The ma trixpres ents a pas sage be tween a prac ti cal way of us ing the CFD model and the user whoneeds clear and fast ac ces si ble data of the sit u a tion dur ing a fire in a tun nel.
References
[1] Cheng, L. H., Ueng, T. H., Liu, C. W., Sim u la tion of Ven ti la tion and Fire in the Un der groundFa cil i ties, Fire Safety Jour nal, 18 (2003), 5, pp. 597-619
[2] Jojo, S. M. L., Chow, W. K., Nu mer i cal Stud ies on Per for mance Eval u a tion of Tun nel Ven ti -la tion Safety Sys tems, Tun nel ling and Un der ground Space Tech nol ogy, 18 (2003), 5, pp.435-452
[3] Lowndes, I. S., Crossley, A. J., Yang, Z.-Y., The Ven ti la tion and Cli mate Mod el ling ofRapid De vel op ment Tun nel Drivages, Tun nel ling and Un der ground Space Tech nol ogy, 19(2004), 2, pp. 139-150
[4] Carvel, R. O., Beard, A. N., Jowitt, P. W., The In flu ence of Lon gi tu di nal Ven ti la tion Sys temson Fires in Tun nels, Tun nel ling and Un der ground Space Tech nol ogy, 16 (2001), 1, pp. 3-21
[5] Bread, A. N., A Model for Pre dict ing Fire Spread in Tun nels, Jour nal of Fire Sci ence, 15(1997), 4, pp. 277-307
248
THERMAL SCIENCE: Vol. 11 (2007), No. 2, pp. 223-250

[6] Kunsch, J. P., Crit i cal Ve loc ity and Range of a Pre-Gas Plume in a Ven ti lated Tun nel, At mo -spheric En vi ron ment, 33 (1998), 1, pp. 13-24
[7] Megret, O., Vauquelin, O., A Model to Eval u ate Tun nel Fire Char ac ter is tics, Fire SafetyJour nal, 34 (2000), 4, pp. 393-401
[8] Haack A., Fire Pro tec tion in Traf fic Tun nels: Gen eral and Re sults of the EUREKA Pro ject,Tun nel ling and Un der ground Space Tech nol ogy, 13 (1998), 4, pp. 377-381
[9] Haack, A., Cur rent Safety Is sues in Traf fic Tun nels, Tun nel ling and Un der ground SpaceTech nol ogy 17 (2002), 2, pp. 117-127
[10] Amundsen, F. H., Ranes, G., Stud ies on Traf fic Ac ci dents in Nor we gian Road Tun nels, Tun -nel ling and Un der ground Space Tech nol ogy, 15 (2000), 1, pp. 3-11
[11] ***, Commision of the Eu ro pean Com mu ni ties, Di rec tive of the Eu ro pean Par lia ment and ofthe Coun cil on min i mum safety re quire ments for tun nels in the Trans-Eu ro pean Road Net -work, Brussels, 2004
[12] Kirchsteiger, C., On the Use of Proba bil is tic and De ter min is tic Meth ods in Risk Anal y sis,Jour nal of Loss Pre ven tion in the Pro cess In dus tries, 12 (1999), 5, pp. 399-419
[13] Gann, R. G., Hall, J. R., Fire Con di tions for Smoke Tox ic ity Mea sure ment, Fire and Ma te ri -als, 18 (1994), 3, pp. 193-199
[14] ***, PIARC Tech ni cal Com mit tee on Tun nel Op er a tion, Fire and Smoke Con trol in RoadTun nels, Com mis sion re port, Paris, 2003
[15] Gas ser, I., Struckmeier, J., Teleaga, I., Mod el ling and Sim u la tion of Fires in Ve hi cle Tun nels, Com pu ta tional Fluid Dy nam ics and Data Anal y ses (Ed. F. Reihe), No. 19, Uni ver sity ofHam burg, Ham burg, Ger many, 2002
[16] Floyd, J. E., Wieczorek, C. J., Vandsburger, U., Sim u la tion of the Vir ginia Tech. Fire Re -search Lab o ra tory Us ing Large Eddy Sim u la tions with Mix ture Frac tion Chem is try and Fi -nite Vol ume Ra di a tive Heat Trans fer, Pro ceed ings, In ter na tional Sym po sium INTERFLAM2001, Ed in burgh, Scot land, UK, 2001, pp. 767-778
[17] Persson, M., Quan ti ta tive Risk Anal y sis, Pro ce dure for the Fire Evac u a tion of a Road Tun nel, 2nd In ter na tional Con fer ence on Safe and Re li able Tunels, Lausanne, Swit zer land, 2006
[18] Vidmar, P., Petelin, S., An Anal y sis of a Fire Re sult ing from a Traf fic Ac ci dent, Jour nal ofMe chan i cal En gi neer ing (Strojniski Vestnik), 49 (2003), 5, pp. 1-13
[19] McGrattan, K., Baum, H., Rehm, R., Hamins, A., Forney, G. P., Floyd, J. E., Hostikka, S., Fire Dy nam ics Sim u la tor, Tech ni cal ref er ence guide, Na tional In sti tute of Stan dard andTech nol ogy, NISTIR 6783, Gaithersburg, Md., USA, 2001
[20] Fletcher, C. A. J., Com pu ta tional Tech niques of Fluid Dy nam ics, 2nd ed., Vol. 2,Springer-Verlag, Berlin, Hei del berg, 1991
[21] Sagaut, P., Large Eddy Sim u la tions for In com press ible Flows, 2nd ed., Springer-Verlag,Berlin, Hei del berg, 2002
[22] Lesieur, M., Tur bu lence in Flu ids, Kluwer Ac a demic Pub lisher, Dodrecht, The Neth er lands,1997
[23] Heskestad, G., SFPE Hand book, Chap ter Fire Plumes, 2nd ed., Na tional Fire Pro tec tion As so -ci a tion, Quincy, Ma., USA, 1995
[24] Drys dale, D., An In tro duc tion to Fire Dy nam ics, John Wiley & Sons Ltd, New York, USA,1998
[25] ***, Me mo rial Trun nel Fire Ven ti la tion Test Pro gram, Mas sa chu setts High way De part ment,Cen tral Ar tery/Tun nel Pro ject, Boston, Ma., USA, 1996
[26] McGrattan, K., Hamins, A., Nu mer i cal Sim u la tion of the Howard Street Tun nel Fire, Na -tional In sti tute of Stan dard and Tech nol ogy, Gaithersburg, Md., USA, 2002
[27] Wood burn, P. J., Britter, R. E., CFD Sim u la tions of a Tun nel Fire, Fire Safety Jour nal, 26(1996), 1, pp. 35-62
[28] Jang, H. M., Chen, F., A Novel Ap proach to the Tran sient Ven ti la tion of Road Tun nels, Jour -nal of Wind En gi neer ing and In dus trial Aero dy nam ics, 86 (2000), 1, pp. 15-36
[29] Trucano, T. G., Pre dic tion and Un cer tainty in Com pu ta tional Mod el ing of Com plex Phe nom -ena, Sandia Na tional Lab o ra to ries, Albuquerque, N. Mex., USA, 1998
249
Vidmar, P., Petelin, S.: Methodology of Using CFD-Based Risk Assessment in ...

Authors' address:
P. Vidmar, S. PetelinUniversity of Ljubljana,Faculty of Maritime Studies and Transportation4, Pot pomorš~akov, Portorož, Slovenija
Au thors' e-mails: pe [email protected], [email protected]
Paper submitted: April 12, 2006Paper revised: September 15, 2006Paper accepted: November 23, 2006
250
THERMAL SCIENCE: Vol. 11 (2007), No. 2, pp. 223-250