
Measurements and Modeling of Distributed Antenna Systems in Railway Tunnels
10
2870 IEEE TRANSACTIONS ON VEHICULAR TECHNOLOGY, VOL. 56, NO. 5, SEPTEMBER 2007 Measurements and Modeling of Distributed Antenna Systems in Railway Tunnels Cesar Briso-Rodríguez, Javier M. Cruz, and Jose I. Alonso, Member, IEEE Abstract—This paper covers some of the work carried out in the planning of the Global System for Mobile Communication for Railway (GSM-R) of the tunnels on the new high-speed trains in Spain. Solutions based on distributed antenna systems have been tested by installing several 900-MHz transmitters inside and out- side of a 4000-m tunnel and measuring the propagation in different conditions. The measurements have been used to model the effects of tunnel propagation, including curves, trains passing from the outside to the inside, and the effect of two trains passing inside the tunnel. All cases have been tested by comparing solutions using isofrequency and multifrequency distributed transmitters inside the tunnel. The improvements of signal-to-noise ratio and the reduction of the blocking effects of two trains passing have demonstrated the advantages of using isofrequency distributed antenna systems in tunnels. Finally, a complete propagation model combining both modal analysis and ray tracing has been applied to predict the propagation loss inside and outside these tunnels, and results have been compared with the measurements. The model has proven to be very useful for radio planning in new railway networks. Index Terms—Distributed antenna, Global System for Mobile Communication for Railway (GSM-R), modal analysis, propaga- tion in tunnels. I. I NTRODUCTION T RADITIONALLY, radio coverage inside the tunnels for railway trains is usually achieved using leaky feeders. This technique does not require special planning, and a good coverage in all types of tunnel is obtained. Nevertheless, the main disadvantages of leaky feeders are high cost, maintenance, and installation difficulties. These problems are easily solved in short tunnels, but new high-speed trains frequently require medium or long tunnels, and in this case, the leaky feeder Manuscript received January 27, 2005; revised May 17, 2006, November 2, 2006, and January 16, 2007. This work was supported in part by the Spanish high-speed railway infrastructure operator (GIF) and in part by the National Board of Scientific and Technology Research (Comisión Interministerial de Ciencia y Tecnología) under Project TEC 2005-07010-C02-01/TCM. The review of this paper was coordinated by Prof. D. Michelson. C. Briso-Rodríguez is with the Departamento de Ingeniería Audiovisual y Comunicaciones, Escuela Universitaria de Ingeniería Técnica de Telecomu- nicación, Universidad Politécnica de Madrid, 28031 Madrid, Spain (e-mail: [email protected]). J. M. Cruz is with the Metropolian of Tenerife, Santa Cruz de Tenerife, 38003 Spain. J. I. Alonso is with the Departamento de Señales, Sistemas y Radio- comunicaciones, Escuela Técnica Superior de Ingenieros de Telecomuni- cación, Universidad Politecnica de Madrid, 28040 Madrid, Spain (e-mail: [email protected]). Color version of one or more of the figures in the paper are available online at http://ieeexplore.ieee.org. Digital Object Identifier 10.1109/TVT.2007.900500 solution becomes too expensive. For these reasons, solutions that are based on the use of antennas are becoming more interesting. Radio coverage with antennas requires an accurate prediction of propagation loss inside and outside the tunnel, particularly when the communication system must maintain a high qual- ity of service along the entire track [1]–[4]. New European high-speed trains have adopted a Global System for Mobile Communication (GSM)-based communication system for data and voice communications, which is called GSM Railway (GSM-R) [5], [6]. This system has a proprietary frequency band (876–880 MHz uplink and 921–925 MHz downlink), and the network must have a very high quality of service because it is used for the signaling and control of the trains. This paper presents measurements that are taken in one of the longest tunnels of the new 450-km high-speed train line from Madrid to Lleida in Spain. The measurements have been applied to develop a propagation model for railway tunnel coverage that is based on the use of distributed antennas. The model uses modal analysis combined with ray tracing to predict the propagation attenuation inside the tunnel. II. MEASUREMENTS Propagation prediction and modeling of radio coverage in- side a tunnel depend on the section, curves, and construction characteristics of the walls. Several reports on measurements have been published [7]–[10], but there are important differ- ences between tunnels for cars or trains, as well as in the rail- way environment between subway, light trains, or high-speed trains. Railway tunnels have special characteristics: ballast on the ground, variable semicircular section, overhead cables, con- struction in concrete, smooth curves, etc. On a high-speed train line, there are usually several tunnels with lengths ranging from several hundred meters to several kilometers, and these tunnels are part of a cellular network, so that a handover must be made in some part of the tunnel: at the entrance, in the middle, or at the exit. Therefore, the objective of the measurements was to model radio coverage inside and outside the tunnel to determine the optimum distance between repeaters, the number of repeaters required, handover points, and signal margins. It was also necessary to test new solutions based on the use of isofrequency repeaters and directional antennas and the influ- ence of trains passing inside the tunnel. The final objective was to get high-quality communications inside long tunnels using distributed antenna systems. 0018-9545/$25.00 © 2007 IEEE
-
Upload
justo-sierra -
Category
Documents
-
view
0 -
download
0
Transcript of Measurements and Modeling of Distributed Antenna Systems in Railway Tunnels

2870 IEEE TRANSACTIONS ON VEHICULAR TECHNOLOGY, VOL. 56, NO. 5, SEPTEMBER 2007
Measurements and Modeling of DistributedAntenna Systems in Railway Tunnels
Cesar Briso-Rodríguez, Javier M. Cruz, and Jose I. Alonso, Member, IEEE
Abstract—This paper covers some of the work carried out inthe planning of the Global System for Mobile Communication forRailway (GSM-R) of the tunnels on the new high-speed trains inSpain. Solutions based on distributed antenna systems have beentested by installing several 900-MHz transmitters inside and out-side of a 4000-m tunnel and measuring the propagation in differentconditions. The measurements have been used to model the effectsof tunnel propagation, including curves, trains passing from theoutside to the inside, and the effect of two trains passing insidethe tunnel. All cases have been tested by comparing solutionsusing isofrequency and multifrequency distributed transmittersinside the tunnel. The improvements of signal-to-noise ratio andthe reduction of the blocking effects of two trains passing havedemonstrated the advantages of using isofrequency distributedantenna systems in tunnels. Finally, a complete propagation modelcombining both modal analysis and ray tracing has been applied topredict the propagation loss inside and outside these tunnels, andresults have been compared with the measurements. The modelhas proven to be very useful for radio planning in new railwaynetworks.
Index Terms—Distributed antenna, Global System for MobileCommunication for Railway (GSM-R), modal analysis, propaga-tion in tunnels.
I. INTRODUCTION
T RADITIONALLY, radio coverage inside the tunnels forrailway trains is usually achieved using leaky feeders.
This technique does not require special planning, and a goodcoverage in all types of tunnel is obtained. Nevertheless, themain disadvantages of leaky feeders are high cost, maintenance,and installation difficulties. These problems are easily solvedin short tunnels, but new high-speed trains frequently requiremedium or long tunnels, and in this case, the leaky feeder
Manuscript received January 27, 2005; revised May 17, 2006, November 2,2006, and January 16, 2007. This work was supported in part by the Spanishhigh-speed railway infrastructure operator (GIF) and in part by the NationalBoard of Scientific and Technology Research (Comisión Interministerial deCiencia y Tecnología) under Project TEC 2005-07010-C02-01/TCM. Thereview of this paper was coordinated by Prof. D. Michelson.
C. Briso-Rodríguez is with the Departamento de Ingeniería Audiovisual yComunicaciones, Escuela Universitaria de Ingeniería Técnica de Telecomu-nicación, Universidad Politécnica de Madrid, 28031 Madrid, Spain (e-mail:[email protected]).
J. M. Cruz is with the Metropolian of Tenerife, Santa Cruz de Tenerife, 38003Spain.
J. I. Alonso is with the Departamento de Señales, Sistemas y Radio-comunicaciones, Escuela Técnica Superior de Ingenieros de Telecomuni-cación, Universidad Politecnica de Madrid, 28040 Madrid, Spain (e-mail:[email protected]).
Color version of one or more of the figures in the paper are available onlineat http://ieeexplore.ieee.org.
Digital Object Identifier 10.1109/TVT.2007.900500
solution becomes too expensive. For these reasons, solutionsthat are based on the use of antennas are becoming moreinteresting.
Radio coverage with antennas requires an accurate predictionof propagation loss inside and outside the tunnel, particularlywhen the communication system must maintain a high qual-ity of service along the entire track [1]–[4]. New Europeanhigh-speed trains have adopted a Global System for MobileCommunication (GSM)-based communication system for dataand voice communications, which is called GSM Railway(GSM-R) [5], [6]. This system has a proprietary frequency band(876–880 MHz uplink and 921–925 MHz downlink), and thenetwork must have a very high quality of service because itis used for the signaling and control of the trains. This paperpresents measurements that are taken in one of the longesttunnels of the new 450-km high-speed train line from Madridto Lleida in Spain. The measurements have been applied todevelop a propagation model for railway tunnel coverage that isbased on the use of distributed antennas. The model uses modalanalysis combined with ray tracing to predict the propagationattenuation inside the tunnel.
II. MEASUREMENTS
Propagation prediction and modeling of radio coverage in-side a tunnel depend on the section, curves, and constructioncharacteristics of the walls. Several reports on measurementshave been published [7]–[10], but there are important differ-ences between tunnels for cars or trains, as well as in the rail-way environment between subway, light trains, or high-speedtrains.
Railway tunnels have special characteristics: ballast on theground, variable semicircular section, overhead cables, con-struction in concrete, smooth curves, etc. On a high-speed trainline, there are usually several tunnels with lengths ranging fromseveral hundred meters to several kilometers, and these tunnelsare part of a cellular network, so that a handover must bemade in some part of the tunnel: at the entrance, in the middle,or at the exit. Therefore, the objective of the measurementswas to model radio coverage inside and outside the tunnel todetermine the optimum distance between repeaters, the numberof repeaters required, handover points, and signal margins. Itwas also necessary to test new solutions based on the use ofisofrequency repeaters and directional antennas and the influ-ence of trains passing inside the tunnel. The final objective wasto get high-quality communications inside long tunnels usingdistributed antenna systems.
0018-9545/$25.00 © 2007 IEEE

BRISO-RODRÍGUEZ et al.: MEASUREMENTS AND MODELING OF DISTRIBUTED ANTENNA IN RAILWAY TUNNELS 2871
Fig. 1. Tunnel and train used in the measurements.
Fig. 2. Configuration of repeaters and BTSs.
A. Environment and Measurement System
The tunnel measured has a total length of 4000 m with asmooth curve in the middle. The section is arched, with acircular shape of radius R = 6.2 m and floor width a = 10.7 m.Fig. 1 shows a photograph of the tunnel.
The objective of the trial was to evaluate the radio coveragethroughout the tunnel; for this purpose, an initial estimationsuggested that four transmitters were needed. This estimationwas based on the modal analysis propagation model that wasused and on the minimum signal level that was specified bythe GSM-R system, which is −70 dBm inside the tunnel and−85 dBm outside.
The final configuration can be implemented using repeatersand base stations. Fig. 2 shows this configuration with oneGSM-R base transmitter station (BTS) at the entrance withthree repeaters connected to it and another BTS at the outputof the tunnel. Because of the length of the tunnel, the repeatersuse “radio over fiber technology.” This technology permits theelectrical 900-MHz signal of the BTS to be converted to opticaland transmit it to and receive it from the repeaters througha monomode fiber optic. In the repeaters, the signal is con-verted again into an electrical signal amplified and transmitted/received. This configuration permits a maximum separationof 20 km from the BTS to the repeaters. In the tunnel, eachrepeater has two high gain antennas: one pointing to each sideof the tunnel to achieve overlapping of the coverage, and atthe exit of the tunnel, where there is a second BTS with anantenna pointing into the tunnel. At this point, the trains makea handover to the second BTS. As the output signal of theBTS is converted (i.e., electrical–optical–electrical), the outputfrequency of the repeaters is coherent with the frequency of
Fig. 3. Test transmitter.
the BTS inside the coherence bandwidth of the GSM-R chan-nels (200 kHz).
To test the tunnel, four 900-MHz transmitters were used.Three transmitters were located inside the tunnel to emulatethe repeaters at 1000, 2300, and 3500 m with two antennas:one pointing to each side of the tunnel. The fourth transmitterwas located 2000 m from the other entrance with a line-of-sight propagation to the tunnel entrance to emulate the externalGSM-R BTS. The external transmitter has only one antennapointing to the entrance of the tunnel. The first BTS was notemulated to simplify measurements.
The transmitters used are proprietary portable equipment(see Fig. 3) that covers the 900-MHz GSM-R band in 200-kHzsteps with an output power of 2 W. Each transmitter has afrequency synthesizer and a high-stability 10-MHz referencethat provides a high-output frequency accuracy. The transmit-ters are small and can be powered with a 12-V battery. Inthe measurements, the output signal of each transmitter insidethe tunnel was divided with a 3-dB power splitter to feedtwo antennas, with one pointing to each extreme of the tun-nel. The entire equipment was individually calibrated using apower meter.
The antenna used in all transmitters was a 15-dBi gain helicalantenna with 60◦ E and H main lobe, circular polarization, and20-dB front-to-back ratio. Inside the tunnel, the antennas werelocated on a 4-m mast 20 cm from the tunnel walls. Outside thetunnel, at the north entrance, another transmitter was installed toemulate the future location of a GSM-R BTS. This transmitterhas 2 W of power and uses only one 15-dB gain helical antennapointing to the entrance of the tunnel. There was a line ofsight from the location of the transmitter to the north entranceof the tunnel.
Two trains were used for the measurements, one was themobile station and the other was used to reproduce blockingeffects inside the tunnel. The trains have three carriages, 60 m

2872 IEEE TRANSACTIONS ON VEHICULAR TECHNOLOGY, VOL. 56, NO. 5, SEPTEMBER 2007
Fig. 4. Coverage of tunnels with multifrequency transmitters. Tunnel from0 to 4000 m.
in length. The measurement equipment deployed in the locomo-tive cabin of one of the trains was made up of a spectrum ana-lyzer, a portable computer, a control software, and an externalantenna. The receiving antenna was a λ/4 vertical monopolewith a 2.15-dBi gain installed on the top of a train locomotive.This test system was able to take one measurement every 60 ms.Speed and position were also recorded with an electronicodometer that was installed in the train to maintain a constantmeasuring speed.
B. Measurements Results
Measurements were taken with the transmitters in two con-figurations: 1) multifrequency and 2) isofrequency.
In the first case, all the transmitters had different frequencies.This configuration was used to analyze the individual responsesof the tunnel, homogeneity, and influence of curves and tocompare with the improvements that were obtained with theuse of isofrequency transmitters. This measurement also repro-duces the coverage of the tunnel with GSM-R base stationsand therefore permits the possibility of making handovers inbetween two transmitters to be analyzed inside the tunnel. Thissolution can be used in long tunnels or in any case when it isnecessary to make a handover inside the tunnel. Fig. 4 showsthe root-mean-square (rms) power level in the entire tunnel formultifrequency transmitters.
The second test trial uses the same frequency (isofrequency)for the three transmitters that are located inside the tunnel anddifferent frequencies for the external transmitter. This configu-ration reproduces the coverage of the tunnel with the scheme ofFig. 2 without the first BTS. Results of this configuration areshown in Fig. 5.
Both graphs show how the signal reached high levels inthe proximity of the repeaters and decreased very quickly at200–300 m from it. After that, the propagation loss is muchslower. This phenomenon is due to multimode propagationclose to the source and to monomode when it is far from thesource. The separation of these two regions can be computed,as described in [17].
Another interesting fact is the moderate signal decay whenthe train passes from inside to outside the tunnel. We havedetailed the value measured in Fig. 5 on one side of the
Fig. 5. Coverage of tunnels with three isofrequency transmitters inside thetunnel and one transmitter outside. Tunnel from 0 to 4000 m.
tunnel. We considered that this fading is caused by the waveimpedance change and diffraction effects in the edge of thetunnel, and it depends mainly on the tunnel section. The signaltransmitted at the edges of the tunnel is attenuated 15–20 dBwhen it passes from inside to outside or from outside to inside.This effect is observed mainly in the transmission coefficientbecause the reflected wave is rapidly attenuated; nevertheless,we can also appreciate in Fig. 5 moderate signal fluctuations onboth sides of the tunnel. The result is important for networkplanning because it affects the location of the first and lastrepeaters inside the tunnel and the transmitter outside it. Wecan find a detailed model based on a ray-tracing technique thatis described in [20].
Another of the objectives of the measurements was to test thebenefits of using isofrequency transmitters with several anten-nas (multiple-input–multiple-output techniques) and simulcasttransmission inside the tunnels. On a real network, the tunnelwill have three repeaters, each one with two antennas and allconnected to a GSM-R base station. With this configuration,the repeaters transmit the same information at the same fre-quency; therefore, the receiver located in between two repeatersreceives two signals with equal frequency and without phasecoherence. In this configuration, as there is no phase coherence,the received power is the power sum of signals received in thecoherence bandwidth of the receiver. Therefore, if the coverageof the tunnels is designed correctly, there is an important qualityof signal improvements in the central region between two re-peaters. To evaluate the real signal improvement, first, we haverepresented the fast variations of the received signal throughoutthe tunnel for multifrequency transmitters, as detailed in Fig. 6.This measurement is computed as the difference between thesamples recorded, i.e., y′[n] = y[n] − y[n − 1], and representsthe fast variations of the signal. To process these data usingdifferent frequency transmitters, we have considered that thereceiver is always taking the best received signal, thereforemaking a handover when the signal of a new transmitter ishigher than the signal of the precedent transmitter. In Fig. 6,we can see that the standard deviation of the fast signal varia-tions for multifrequency transmitters is σ = 4.9 dB, whereasthe same measurement for isofrequency transmitters has a

BRISO-RODRÍGUEZ et al.: MEASUREMENTS AND MODELING OF DISTRIBUTED ANTENNA IN RAILWAY TUNNELS 2873
Fig. 6. Fast fading variations with multifrequency transmitters inside thetunnel. Standard deviation is σ = 4.9 dB.
Fig. 7. Comparison of SNR for isofrequency transmitters and multifrequencytransmitters.
standard deviation of σ = 4.0 dB as result of moderate re-duction of the fast variations in the center point between twotransmitters. To quantify the real quality improvement, we havecompared the cumulative signal-to-noise ratio (SNR) for bothcases in Fig. 7. We can see that there is a typical improvement of2.5 dB for isofrequency transmitters. Similar results have beenreported [13], [14] in measurements in subway tunnels withantennas. This result is important for the quality of serviceof the network because it improves signal level at the worstpoint of the coverage, which is the central point between twotransmitters.
The second group of measurements was oriented towardevaluating the signal shadowing resulting from the blockingeffect of two trains passing inside the tunnel. The problematicsituation could be that a train stopped inside the tunnel couldblock the communications of other trains. To evaluate this situ-ation, two trains were used, where one was stopped at differentpoints in the tunnel on track 1, and the other runs through thetunnel on track 2. The results of these measurements are shownin Figs. 8 and 9.
In the first case, two transmitters with different frequencies,which were separated 1300 m inside the tunnel, were used. Thetrain with the measuring equipment was stopped close to one ofthe transmitters on track 1, and other train went through the tun-
Fig. 8. Influence of two trains passing. Multifrequency transmitters. One trainstopped close to one transmitter inside the tunnel.
Fig. 9. Influence of two trains passing. Multifrequency transmitters. One trainstopped in the center between two transmitters inside the tunnel.
nel on track 2. The detailed result in Fig. 8 shows that the shad-owing effects are reduced considerably in this situation. Whenthe moving train passes the stationary train, we can appre-ciate a fade in the signal level that was received from bothtransmitters.
The second case was a train stopped in the middle, betweentwo transmitters. In this case, as shown in Fig. 9, we can appre-ciate a moderate shadowing of up to 20 dB while the movingtrain passed the fixed train. The moving train first blocks thefront transmitter, and when it passes the stationary train, itblocks the rear transmitter. This shadowing has a length of200 m front and rear of the stationary train and could havesome impact on the communications if the crossing point corre-sponds to a handover point in between two cells or if the signalmargin is very limited inside the tunnel. The phenomenon isreduced when isofrequency transmitters are used. As we cansee in Fig. 10, the signal received by the fixed train changesby ±5 dB, whereas the moving train passes close to it. Thissignal is the power sum of the signal of the front transmitterand rear transmitter and, when the second train approaches,gives rise to multiple diffraction and reflection phenomena pro-ducing fast fading. The received signal is alternatively blockedand reflected by the moving train. Using coherent transmitters,the signal received by the fixed train changes by ±5 dB.Therefore, there is a significant improvement as compared with

2874 IEEE TRANSACTIONS ON VEHICULAR TECHNOLOGY, VOL. 56, NO. 5, SEPTEMBER 2007
Fig. 10. Influence of two trains passing. Isofrequency transmitters. One trainstopped in the center between two transmitters inside the tunnel.
multifrequency transmitters, where the moving train producesup to 20-dB fades.
III. PROPAGATION MODEL
The radio planning of the different tunnels of the new high-speed railway lines requires an accurate propagation modelto be able to use it on the ground, combining measurementswith simulations, in a railway environment where the taking ofmeasurements is complex and expensive. The required calcula-tions are principally oriented toward predicting the number ofrepeaters needed and their location inside and outside the tunnelfor a specification of signal level, tunnel geometry, curves,and fading margins. Basically, two techniques can be used tocalculate the propagation inside a tunnel: 1) modal analysisand 2) ray-optical modeling. Both techniques have been widelyused for tunnel propagation analysis and are well described inthe literature. Modal analysis has been widely applied to theaforementioned path loss in tunnels [11]–[18], and ray-opticaltracing has been described in [19]–[21], wherein it has beenapplied to tunnels and indoor propagation. We have combinedboth methods to calculate the propagation inside the tunnels.Modal analysis is used in straight tunnels, and ray tracing isused only to calculate extra attenuation in curves and in theentrance and exit of the tunnel. Correction factors are appliedto compute losses by roughness and wall tilt. In the followingsection, we describe the bases of the model that is used, and acomparison of results with measurements is presented.
If we consider the tunnel as a waveguide, only the prop-agation of modes with frequencies higher than the tunnel’scutoff frequency is possible. Due to the size of the tunnels, thecutoff frequency of the fundamental modes is very low (i.e.,some megahertz); therefore, at high frequencies, we find a widerange of Emn hybrid modes propagating inside the tunnel fora rectangular waveguide-based model of the tunnel. Usingmodal theory, we can quantify the losses of horizontally andvertically polarized Emn modes applying modal analysis.
Nowadays, many tunnels have a circular section, but con-sidering that propagation losses are similar in rectangular andcircular waveguides and establishing the appropriate correctioncoefficient, the propagation in circular tunnels can be approxi-
TABLE IMODE LOSSES UP TO THE ORDER (3, 3)
mated by a rectangular waveguide that is inscribed in a tunnelof radius R. The size of the rectangular waveguide that is usedin the model can be computed by taking the main horizontaldimension a close to the tunnel’s floor size and computing thevertical dimension b using the “rule of thumb,” i.e.,
b =√
4R2 − a2. (1)
This equation gives good results when the tunnel’s shapeis greater than a semicircle, in the range 1.4R < a < 1.8R,which is common in modern road and railway tunnels. Thisidealized geometry has been described [9], and deviations canbe corrected by including a wall “tilt” factor in the model, asdescribed in [11]. Finally, the model is completed, including at-tenuation resulting from roughness and tilt of the walls, curves,and antenna coupling factor to model the variation of antennagain in the near-field region; therefore, the overall propagationattenuation at a distance z is computed as
L(z) = L(m,n)v/h(z) + Lroughness(z)
+ Ltilt(z) + Lcurv(z′) + Lant (2)
and the calculation of these coefficients is described inSection III-B.
A. Near-Field and Far-Field Regions
If we compute the propagation losses inside the tunnel ofthe first (m,n) modes for vertical and horizontal polarizations(see Table I), we can clearly distinguish two regions, namelynear-field and far-field regions.
In the near-field region, the field amplitude suffers strongfading and rapid decreases resulting from the contributionof many rays propagating from different grazing angles withhigh losses. We can also define a far-field region, where theattenuation factor is smaller because we can assume that thereis only one mode propagating throughout the tunnel, namelythe Eh
11. If we compute the attenuation of the first propagationmodes (Table I), we can consider the point as the separationof both regions where Eh
22 (horizontally polarized E-field) andEv
22 (vertically polarized E-field) have been strongly attenuatedand higher modes have disappeared (they have greater losses).We are going to use the ray-tracing theory to compute theseparation of the two propagation zones, and then, we will
BRISO-RODRÍGUEZ et al.: MEASUREMENTS AND MODELING OF DISTRIBUTED ANTENNA IN RAILWAY TUNNELS 2875
apply modal analysis to compute the propagation attenuationin both regions.
Ehmn and Eν
mn modes are defined by the following phaserelation:
sin(φ1) =mλ
2a, m = 1, 2, 3, . . . (3)
sin(φ2) =nλ
2b, n = 1, 2, 3, . . . (4)
where φ1 and φ2 are the grazing angles of incidence of therays with the vertical and horizontal walls, respectively, and aand b are the horizontal and vertical dimensions of the tunnel,respectively. We can assume that the wavelength λ is smallin comparison with a and b and approximate the sine by itsargument. This is sensible at the frequencies that are studied.For instance, at 900 MHz, λ = 33 cm, and the typical valuesfor tunnel dimensions are of several meters. Thus
φ1 =mλ
2a, n = 1, 2, 3, . . . (5)
φ2 ≈ znλ
2b, n = 1, 2, 3, . . . . (6)
The attenuation depends on the number of reflections of therays, i.e., N1 and N2, and the reflection coefficient of the signalover the vertical and horizontal walls along a distance z. Thenumber of reflections is easily obtained from (5) and (6). Thus
N1 ≈ zmλ
2a2(7)
N2 ≈ znλ
2b2. (8)
With these numbers, we can define the breaking point or limitof the near-field and far-field regions as the distance where thefundamental modes Eh
11 and Ev11 have suffered one reflection,
considering vertical and horizontal walls. At this distance, theremaining modes have suffered several reflections and havebeen considerably more attenuated because of both the highernumber of reflections and the lower reflection coefficient result-ing from a lower incident angle.
With both N1 = 1 and N2 = 1 in (7) and (8), the distancefrom the transmitter to the “breaking point” is defined by
ZNF ≈ Max
(a2
λ,b2
λ
). (9)
ZNF is directly proportional to the square of the largest dimen-sion of the tunnel and inversely proportional to the wavelength;therefore, from the transmitter to a distance ZNF, we considerthat there are horizontally and vertically polarized Emn modes,and from ZNF, we consider that only Eh
11 mode propagates.With this consideration, we are going to define a dual-slopepropagation model for propagation losses in the near field andin the far field.
B. Propagation Attenuation
The signal propagating through the tunnel is made up ofseveral modes that propagate with different attenuations. Thecalculation of the overall propagation attenuation from a trans-mitter to a receiver can be simplified if we consider thatthe power of each mode that travels through the tunnel isindependent of the others; therefore, we can assume that thetotal power is the power sum of each mode. This suppositionis based on the fact that modes are approximately orthogonal.With this approximation„ we can compute the following modeloss expressions for horizontal and vertical polarizations thatare applicable for each (m,n) mode:
α(m,n)h =4.343λ2
(m2εr1
a3√
εr1 − 1+
n2
b3√
εr2 − 1
)dB/m
(10)
α(m,n)ν =4.343λ2
(m2
a3√
εr1 − 1+
n2εr2
b3√
εr2 − 1
)dB/m
(11)
where εr1 and εr2 are the relative permittivities of the verti-cal and horizontal walls, respectively. The bigger the tunnelsection, the smaller is the attenuation that is experienced bythe modes propagating throughout the tunnel, because lossesare inversely proportional to the cube of the height and widthof the tunnel. With this propagation constant, we can com-pute the propagation attenuation at a certain distance z, con-sidering losses as the rms contribution of modes for bothpolarizations, i.e.,
Lv/hmn (z)=10 log10
m∑
i=1
n∑j=1
×√
102α(i,j)hz+102α(i,j)νz
dB.
(12)
In addition to this, losses are directly proportional to thesquare of the order of the modes, so that higher modes expe-rience stronger attenuation. In fact, we can consider that froma certain distance, there is no propagation of modes except forthe main one, namely the Eh
11 and Eν11. Losses are also directly
proportional to the square of the wavelength.Additional corrections to the model must be considered be-
cause of the roughness and tilt of the walls. Both factors, whichwere modeled by Emslie et al. [11] and Zhang and Hwang [17],generate diffuse radiation that reduces the power of the modesthat propagate through the tunnel. This phenomenon increasesthe losses of all modes, but it is particularly sensitive in thefar-field region, where it moderately increases the losses ofthe fundamental mode Eh
11. Roughness losses are particularlyimportant at low frequencies and in old subway tunnels. Inmodern tunnels, wall roughness is usually low.
Tilt losses are more important in semicircular tunnels andmust be adjusted carefully for each tunnel.
2876 IEEE TRANSACTIONS ON VEHICULAR TECHNOLOGY, VOL. 56, NO. 5, SEPTEMBER 2007
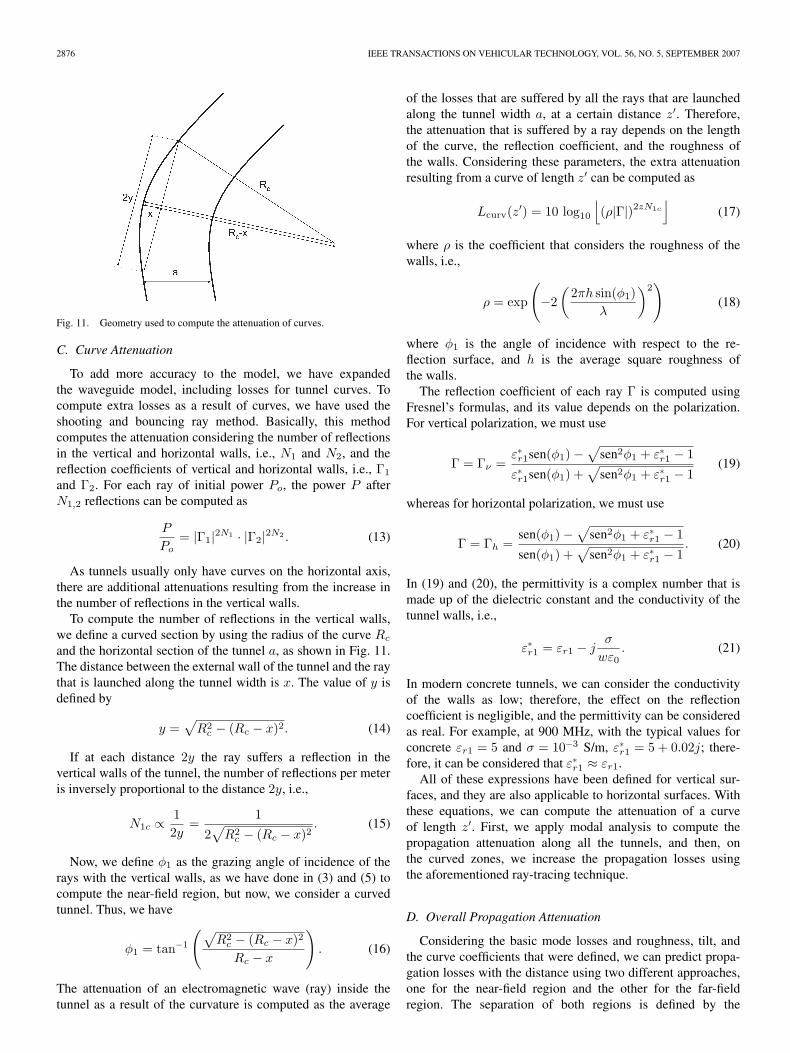
Fig. 11. Geometry used to compute the attenuation of curves.
C. Curve Attenuation
To add more accuracy to the model, we have expandedthe waveguide model, including losses for tunnel curves. Tocompute extra losses as a result of curves, we have used theshooting and bouncing ray method. Basically, this methodcomputes the attenuation considering the number of reflectionsin the vertical and horizontal walls, i.e., N1 and N2, and thereflection coefficients of vertical and horizontal walls, i.e., Γ1
and Γ2. For each ray of initial power Po, the power P afterN1,2 reflections can be computed as
P
Po= |Γ1|2N1 · |Γ2|2N2 . (13)
As tunnels usually only have curves on the horizontal axis,there are additional attenuations resulting from the increase inthe number of reflections in the vertical walls.
To compute the number of reflections in the vertical walls,we define a curved section by using the radius of the curve Rc
and the horizontal section of the tunnel a, as shown in Fig. 11.The distance between the external wall of the tunnel and the raythat is launched along the tunnel width is x. The value of y isdefined by
y =√
R2c − (Rc − x)2. (14)
If at each distance 2y the ray suffers a reflection in thevertical walls of the tunnel, the number of reflections per meteris inversely proportional to the distance 2y, i.e.,
N1c ∝ 12y
=1
2√
R2c − (Rc − x)2
. (15)
Now, we define φ1 as the grazing angle of incidence of therays with the vertical walls, as we have done in (3) and (5) tocompute the near-field region, but now, we consider a curvedtunnel. Thus, we have
φ1 = tan−1
(√R2
c − (Rc − x)2
Rc − x
). (16)
The attenuation of an electromagnetic wave (ray) inside thetunnel as a result of the curvature is computed as the average
of the losses that are suffered by all the rays that are launchedalong the tunnel width a, at a certain distance z′. Therefore,the attenuation that is suffered by a ray depends on the lengthof the curve, the reflection coefficient, and the roughness ofthe walls. Considering these parameters, the extra attenuationresulting from a curve of length z′ can be computed as
Lcurv(z′) = 10 log10
⌊(ρ|Γ|)2zN1c
⌋(17)
where ρ is the coefficient that considers the roughness of thewalls, i.e.,
ρ = exp
(−2(
2πh sin(φ1)λ
)2)
(18)
where φ1 is the angle of incidence with respect to the re-flection surface, and h is the average square roughness ofthe walls.
The reflection coefficient of each ray Γ is computed usingFresnel’s formulas, and its value depends on the polarization.For vertical polarization, we must use
Γ = Γν =ε∗r1sen(φ1) −
√sen2φ1 + ε∗r1 − 1
ε∗r1sen(φ1) +√
sen2φ1 + ε∗r1 − 1(19)
whereas for horizontal polarization, we must use
Γ = Γh =sen(φ1) −
√sen2φ1 + ε∗r1 − 1
sen(φ1) +√
sen2φ1 + ε∗r1 − 1. (20)
In (19) and (20), the permittivity is a complex number that ismade up of the dielectric constant and the conductivity of thetunnel walls, i.e.,
ε∗r1 = εr1 − jσ
wε0. (21)
In modern concrete tunnels, we can consider the conductivityof the walls as low; therefore, the effect on the reflectioncoefficient is negligible, and the permittivity can be consideredas real. For example, at 900 MHz, with the typical values forconcrete εr1 = 5 and σ = 10−3 S/m, ε∗r1 = 5 + 0.02j; there-fore, it can be considered that ε∗r1 ≈ εr1.
All of these expressions have been defined for vertical sur-faces, and they are also applicable to horizontal surfaces. Withthese equations, we can compute the attenuation of a curveof length z′. First, we apply modal analysis to compute thepropagation attenuation along all the tunnels, and then, onthe curved zones, we increase the propagation losses usingthe aforementioned ray-tracing technique.
D. Overall Propagation Attenuation
Considering the basic mode losses and roughness, tilt, andthe curve coefficients that were defined, we can predict propa-gation losses with the distance using two different approaches,one for the near-field region and the other for the far-fieldregion. The separation of both regions is defined by the
BRISO-RODRÍGUEZ et al.: MEASUREMENTS AND MODELING OF DISTRIBUTED ANTENNA IN RAILWAY TUNNELS 2877
TABLE IIDATA APPLIED IN THE SIMULATION OF THE
PROPAGATION IN THE TUNNEL
breaking point ZNF, as computed in (9). The following expres-sions provide a way of calculating the losses in decibels.
In the near-field region, z < ZNF, we consider losses of(m,n) modes as the rms contribution of modes up to (10, 10)for both polarizations, i.e.,
L(z) = Lant + Lv/hmn (z)
+ Lroughness(z) + Ltilt(z) + Lcurv(z′). (22)
In the far-field region, z > ZNF, we only consider losses atthe first-order (1, 1) vertical or horizontal mode, i.e.,
L(z) = Lant + Lv/h11 (z)
+ Lroughness(z) + Ltilt(z) + Lcurv(z′). (23)
In both cases, it is also necessary to add a constant attenuationfactor between antennas, which is called the “antenna couplingloss” Lant. This factor depends on the near-field characteristicsof the antennas and can be easily measured in the laboratory orcomputed, as defined in [18].
IV. SIMULATION RESULTS
To validate the proposed model, simulations have beencompared with the previously described measurements. Theinput data for the simulations are the tunnel and transmitterparameters, as detailed in Table II.
With these data, the propagation model has been applied inthe entire tunnel considering up to (m = 10, n = 10) rays.Extra attenuation in the curves has been computed using raytracing.
The antenna coupling factor has been measured in the labora-tory in an anechoic chamber with the transmitting and receiving
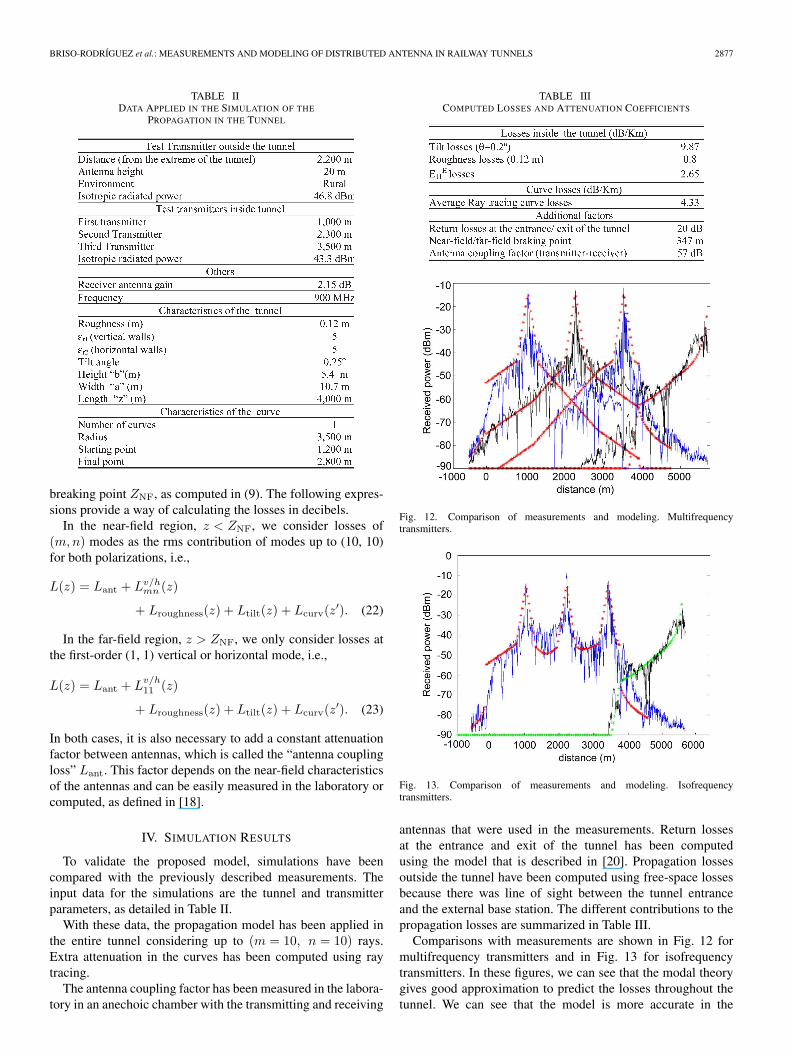
TABLE IIICOMPUTED LOSSES AND ATTENUATION COEFFICIENTS
Fig. 12. Comparison of measurements and modeling. Multifrequencytransmitters.
Fig. 13. Comparison of measurements and modeling. Isofrequencytransmitters.
antennas that were used in the measurements. Return lossesat the entrance and exit of the tunnel has been computedusing the model that is described in [20]. Propagation lossesoutside the tunnel have been computed using free-space lossesbecause there was line of sight between the tunnel entranceand the external base station. The different contributions to thepropagation losses are summarized in Table III.
Comparisons with measurements are shown in Fig. 12 formultifrequency transmitters and in Fig. 13 for isofrequencytransmitters. In these figures, we can see that the modal theorygives good approximation to predict the losses throughout thetunnel. We can see that the model is more accurate in the
2878 IEEE TRANSACTIONS ON VEHICULAR TECHNOLOGY, VOL. 56, NO. 5, SEPTEMBER 2007
far-field region than in the near-field region. This is becausein the near-field region, which is in the first 347 m in ourtunnel, there are a lot of modes propagating at the same time,and the overall losses are much more variable than in the far-field region, where most modes have been extinguished. In thisregion, we only consider the dominant modes with (m,n) upto the order of ten, and the model gives a total attenuation of13.31 dB/km in the straight part of the tunnel.
These extra losses have been computed with ray tracing andgive a factor of 4.33 dB for the parameters of the tunnel andcurve, as given in Table II. This coefficient is added as anincrease in the losses throughout the entire length of the curve,and as we can see in Figs. 12 and 13, the results show goodagreement with the measurements.
We can conclude that the model is easy to apply and accurateenough to predict losses in a tunnel and to determine the numberof transmitters, power, antenna gain, and location to obtaingood coverage for a specific signal power level inside andoutside the tunnel.
In the curved area, it is necessary to add the extra losses.
V. CONCLUSION
A complete measurement and modeling of a long railwaytunnel has been reported. Measurements have demonstrated thegood propagation characteristics of the railway tunnels and theviability of using distributed antennas inside, even if a highsignal level is specified.
We have verified how, in a straight tunnel, the signalfrom a transmitter propagates in the multimode for the first300 m with strong losses, and after the first 100 m, onlythe TE11 mode survives, and therefore, propagation loss ismuch lower.
Another important aspect is the strong fade when the trainpasses from inside to outside the tunnel due to wave impedancechange and diffraction effects. In our measurements, a 20-dBloss was measured. This loss must be taken into account whenfeeding a tunnel with external antenna or when there are severaltunnels with a gap of open track between them.
Other interesting results are the improvements achievedusing simultaneous transmission using frequency coherenttransmitters. With this solution, fast fading is reduced, thusimproving average signal to noise of 2.5 dB. This improve-ment is equivalent to the use of spatial diversity in openareas.
Fading resulting from passing inside the tunnels is anotherimportant result for the planning of the network. Measurementssuggest that a 15- to 20-dB margin must be considered tomitigate losses resulting from a train passing inside the tunnelsin multifrequency operation. This margin can be reduced to3–5 dB using isofrequency repeaters, as it has been demon-strated with the measurements that were taken.
Finally, a complete propagation model for railway applica-tions has been proposed. The model has combined the use ofmodal analysis in straight zones with the use of ray tracing tocalculate extra attenuation in curves at the entrance/exit of thetunnel. A complete table with correction factors has been givenand verified with measurements.
The model is easy to use, fast, and accurate enough for radioplanning in a railway environment. It has been successfullyused in the radio planning of 40 km of tunnels of the newSpanish Madrid–Lleida high-speed line, and it has been veryuseful in predicting the location, number of repeaters, handoverpoint, and signal margins that are required for the coverage of aspecific tunnel with antennas.
REFERENCES
[1] ERRI Committee A 175, Railway Radio Propagation Including Aspectsof Transmission of Safety Information. ERRI A 175/RP2, Utrecht, TheNetherlands, 7/1992.
[2] M. V. S. N. Prasad and R. Singh, “Terrestrial mobile communicationstrain measurements in Western India,” IEEE Trans. Veh. Technol., vol. 52,no. 3, pp. 671–682, May 2003.
[3] N. Monk and H. S. Winbigler, “Communication with moving trains intunnels,” IRE Trans. Veh. Commun., vol. PGVC-7, no. 1, pp. 21–28,Dec. 1956.
[4] Y. P. Zhang, “Practical performance of digital cellular system in massrapid transit environments,” Int. J. Commun. Syst., vol. 18, pp. 143–157,Dec. 2004.
[5] [Online]. Available: http://www.uic.asso.fr[6] C. Briso-Rodríguez, C. Cortes, F. J. Arques, and I. Alonso, “Requirements
of GSM technology for the control of high speed trains,” in Proc. Pers.,Indoor, Mobile Radio Commun. Conf., Feb. 2002, pp. 792–793.
[7] D. Didascalou, J. Maüer, and W. Wiesbeck, “Subway tunnel guidedelectromagnetic wave propagation at mobile communications frequen-cies,” IEEE Trans. Antennas Propag., vol. 49, no. 11, pp. 1590–1596,Nov. 2001.
[8] M. Lienard and P. Degauque, “Propagation in wide tunnels at 2 GHz:A statistical analysis,” IEEE Trans. Veh. Technol., vol. 47, no. 4, pp. 1322–1328, Nov. 1998.
[9] P. Mariage, M. Lienard, and P. Degauque, “Theoretical and experi-mental approach of the propagation of high frequency waves in roadtunnels,” IEEE Trans. Antennas Propag., vol. 42, no. 1, pp. 75–81,Jan. 1994.
[10] Y. P. Zhang, Z. R. Jiang, T. S. Ng, and J. H. Sheng, “Measurements of thepropagation of UHF radio waves on an underground railway train,” IEEETrans. Veh. Technol., vol. 49, no. 4, pp. 1342–1347, Jul. 2000.
[11] A. G. Emslie, R. L. Lagace, and P. F. Strong, “Theory of the propagationof UHF radio waves in coal mine tunnels,” IEEE Trans. Antennas Propag.,vol. AP-23, no. 2, pp. 192–205, Mar. 1975.
[12] S. H. Chen and S. K. Jeng, “SBR image approach for radio wave prop-agation in tunnels with and without traffic,” IEEE Trans. Veh. Technol.,vol. 45, no. 3, pp. 570–578, Aug. 1996.
[13] A. Coraiola and B. Sturani, “Using a pair of phased antennas to improveUHF reception/transmission in tunnels,” IEEE Antennas Propag. Mag.,vol. 42, no. 5, pp. 40–47, Oct. 2000.
[14] R. J. Jakubowski, “Results of distributed antenna and leaky feeder systemstests at 800 MHz in Washington D.C. metro system tunnels,” in Proc.IEEE 44th Veh. Technol. Conf., 1994, vol. 2, pp. 1113–1116.
[15] C. L. Holloway, D. A. Hill, R. A. Dalke, and G. A. Hufford, “Radio wavepropagation characteristics in lossy circular waveguides such as tunnels,mine shafts and boreholes,” IEEE Trans. Antennas Propag., vol. 48, no. 9,pp. 1354–1366, Sep. 2000.
[16] Y. P. Zhang and Y. Hwang, “Theory of the radio-wave propagation inrailway tunnels,” IEEE Trans. Veh. Technol., vol. 47, no. 3, pp. 1027–1036, Aug. 1998.
[17] Y. P. Zhang and Y. Hwang, “Enhancement of rectangular tunnelwaveguide model,” in Proc. APMC, 1997, vol. 1, pp. 197–200.
[18] Y. P. Zhang, “Novel model for propagation loss prediction in tunnels,”IEEE Trans. Veh. Technol., vol. 52, no. 5, pp. 1308–1314, Sep. 2003.
[19] M. Lienard and P. Degauque, “Characterization of the propagationchannel in a high speed train environment,” in Proc. 9th MELECON,May 18–20, 1998, vol. 1, pp. 260–262.
[20] F. Martí Pallarés, F. J. P. Juan, and L. Juan-Llácer, “Analysis of path lossand delay spread at 900 MHz and 2.1 GHz while entering tunnels,” IEEETrans. Veh. Technol., vol. 50, no. 3, pp. 767–776, May 2001.
[21] M. Nilsson, J. Slettenmark, and C. Beckman, “Wave propagation incurved road tunnels,” in Proc. IEEE Antennas Propag. Soc. Int. Symp.,Jun. 21–26, 1998, vol. 4, pp. 1876–1879.
[22] Y. P. Zhang and H. J. Hong, “Ray-optical modeling of simulcast radiopropagation channels in tunnels,” IEEE Trans. Veh. Technol., vol. 53,no. 6, pp. 1800–1808, Nov. 2004.

BRISO-RODRÍGUEZ et al.: MEASUREMENTS AND MODELING OF DISTRIBUTED ANTENNA IN RAILWAY TUNNELS 2879
Cesar Briso-Rodríguez was born in Valladolid,Spain. He received the Ingeniero de Telecomuni-cación and Ph.D. degrees from the UniversidadPolitécnica de Madrid, Madrid, Spain, in 1996 and1999, respectively.
Since 1996, he has been an Assistant Profes-sor with the Escuela Universitaria de IngenieríaTécnica de Telecomunicación, Universidad Politéc-nica de Madrid. He has taught courses in microwavecircuit design, digital communications, and com-munications applied to transportation systems. His
research activity has been focused in the area of design and development ofhigh-frequency communication systems for complex environments.
Prof. Briso-Rodríguez was a recipient of an award for the best Ph.D. thesisin GSM communications from the Spanish Association of TelecommunicationsEngineers.
Javier M. Cruz was born in Tenerife, Spain, in 1980.He received the Ingeniero de Telecomunicacion de-gree from the Universidad Politécnica de Madrid,Madrid, Spain, in 2004.
From 2005 to 2006, he was with Agilent Tech-nologies, Barcelona, Spain. Since 2006, he has beenin charge of the communication systems of themetropolitan tramway from Tenerife. His researchinterests are focused on the propagation model-ing and instrumentation equipment applied to high-frequency communications.
Jose I. Alonso (M’90) was born in Villacañas,Toledo, Spain. He received the Ingeniero de Teleco-municación and Ph.D. degrees from the UniversidadPolitécnica de Madrid, Madrid, Spain, in 1982 and1989, respectively.
From 1982 to 1985, he was a Microwave DesignEngineer with Telettra Spains S.A. (now AlcatelStandard S.A.). In 1985, he joined the Departamentode Señales, Sistemas y Radiocomunicaciones, Es-cuela Técnica Superior de Ingenieros de Telecomu-nicación, Universidad Politécnica de Madrid, where
he is currently a Full Professor. He has taught courses in microwave circuitdesign, electrical networks and filter theory, test and measurements of mi-crowave circuits, and laboratories related to analog and digital communicationsystems. He has been with the Grupo de Microondas y Radar, where he workson research in the areas of the analysis and simulation of high-speed/high-frequency integrated circuits (MMIC) and their interconnections. He is alsoinvolved in the development of circuits and systems for local multipointdistribution systems and wireless local-area networks.