Tunnel Operations, Maintenance, Inspection, and Evaluation ...
Upload
independentCategory
view
3download
0
Journal of Loss Prevention in the Process Industries 16 (2003) 561–573www.elsevier.com/locate/jlp
Risk-based maintenance (RBM): a quantitative approach formaintenance/inspection scheduling and planning
Faisal I. Khan∗, Mahmoud M. HaddaraFaculty of Engineering and Applied Science, Memorial University of Newfoundland, St. John’s, Nfld, Canada A1B 3X5
Abstract
The overall objective of the maintenance process is to increase the profitability of the operation and optimize the total life cyclecost without compromising safety or environmental issues. Risk assessment integrates reliability with safety and environmentalissues and therefore can be used as a decision tool for preventive maintenance planning. Maintenance planning based on riskanalysis minimizes the probability of system failure and its consequences (related to safety, economic, and environment). It helpsmanagement in making correct decisions concerning investment in maintenance or related field. This will, in turn, result in betterasset and capital utilization.
This paper presents a new methodology for risk-based maintenance. The proposed methodology is comprehensive and quantitative.It comprises three main modules: risk estimation module, risk evaluation module, and maintenance planning module. Details ofthe three modules are given. A case study, which exemplifies the use of methodology to a heating, ventilation and air-conditioning(HVAC) system, is also discussed. 2003 Elsevier Ltd. All rights reserved.
Keywords:Maintenance; Risk assessment; Risk-based maintenance; Risk-based inspection; Maintenance planning
1. Introduction
The last two decades witnessed major progress in thedevelopment of new maintenance strategies. Progress inthe maintenance area has been motivated by the increasein the number, size, complexity, and variety of physicalassets; growing awareness of the impact of maintenanceon the environment, safety of personnel, the profitabilityof the business, and quality of the products.
Unexpected failures usually have adverse effects onthe environment and may result in major accidents. Stud-ies by Kletz (1994), Khan and Abbasi (1998), andKumar (1998) show the close relationship betweenmaintenance practices and the occurrence of major acci-dents. Profitability is closely related to availability andreliability of the equipment, while product quality is verymuch dependent on equipment condition. The majorchallenge for a maintenance engineer is to implement a
∗ Corresponding author. Tel.:+1-709-737-8939/7652; fax:+1-709-737-4042.
E-mail address:[email protected] (F.I. Khan).
0950-4230/$ - see front matter 2003 Elsevier Ltd. All rights reserved.doi:10.1016/j.jlp.2003.08.011
maintenance strategy which maximizes availability andefficiency of the equipment; controls the rate of equip-ment deterioration; ensures a safe and environmentallyfriendly operation; and minimizes the total cost of theoperation. This can only be achieved by adopting a struc-tured approach to the study of equipment failure and thedesign of an optimum strategy for inspection and mainte-nance.
Maintenance management techniques have beenthrough a major process of metamorphosis, from focus-ing on periodic overhauls to the use of condition moni-toring, reliability-centered maintenance, and expert sys-tems. Most recently, risk-based maintenancemethodologies started to emerge.
Chen and Toyoda (1990)proposed a strategy formaintenance scheduling based on equalizing incrementalrisk. The risk-based inspection and maintenance strategydeveloped by theAmerican Society of MechanicalEngineers (1991)was used as a basis for developing a“base resource document on risk-based inspection” bythe American Petroleum Institute,API (1995).
Work by Aller, Horowitz, Reynolds, and Weber(1995) and Reynolds (1995)constituted the basis for thedevelopment of a risk-based inspection policy for equip-
562 F.I. Khan, M.M. Haddara / Journal of Loss Prevention in the Process Industries 16 (2003) 561–573
Nomenclature
A system performance loss factor (dimensionless)B financial loss factor (dimensionless)C human health loss factor (dimensionless)D environmental loss factor (dimensionless)AR area under the damage radius (m2)AD asset density in the vicinity of the event (up till �500 m radius) ($/m2)PDI population density in the vicinity of the event (up till �500 m radius) (persons/m2)IM importance factor can be derived from Fig. 4 (dimensionless)i number of events, fire, explosion, toxic release, etc.t failure time (h)h characteristics life of the component (scale of Weibull distribution) (h)β slope or shape factor of Weibull distributionF(t) failure probability functionPDF1 population distribution factor (dimensionless)
ment owned by Brunei Shell Petroleum (Hagemeijer andKerkveld (1998)).
A risk-based approach has been applied successfullyto the maintenance of oil pipelines. Dey, Ogunlana,Gupta, and Tabucanon (1998) discussed a simple risk-based model for the maintenance of a cross-countrypipeline. Nessim and Stephens (1998) proposed a quanti-tative risk analysis model, and recently Dey (2001)described a more general model for risk-based inspectionand maintenance of cross-country pipelines.
The use of a risk-based policy in the maintenance ofmedical devices has been tackled by Capuano and Kor-itko (1996) and Ridgway (2001).
The review of the literature indicates that there is anew trend to use the level of risk as a criterion to planmaintenance tasks. However, most of the previous stud-ies focused on a particular equipment type. It seems thatthere is a need for a more generalized methodology thatcan be applied to all types of assets irrespective oftheir characteristics.
There is also a need for a more realistic quantificationof risk factors. The quantitative description of risk isaffected by the quality of the consequence study and theaccuracy of the estimates of the probability of failure.This study will focus, among other things, on these twofactors. It is hoped that this study will lead to a math-ematical model that can be used to develop an optimummaintenance strategy.
1.1. Concept of risk and its relevance in maintenance
One of the main objectives of a sound maintenancestrategy is the minimization of hazards, both to humansand to the environment, caused by the unexpected failureof the equipment. In addition, the strategy has to be costeffective. Using a risk-based approach ensures a strat-egy, which meets these objectives. Such an approach
uses information obtained from the study of failuremodes and their economic consequences.
Risk analysis is a technique for identifying, charac-terizing, quantifying, and evaluating the loss from anevent. Risk analysis approach integrates probability andconsequence analysis at various stages of the analysisand attempts to answer the following questions:
� What can go wrong that could lead to a system fail-ure?
� How can it go wrong?� How likely is its occurrence?� What would be the consequences if it happens?
In this context, risk can be definedqualitatively/quantitatively as the following set ofduplets for a particular failure scenario.
Risk � probability of failure
� consequence of the failure
Risk assessment can be quantitative or qualitative. Theoutput of a quantitative risk assessment will typically bea number, such as cost impact ($) per unit time. Thenumber could be used to prioritize a series of items thathave been risk assessed. Quantitative risk assessmentrequires a great deal of data both for the assessment ofprobabilities and assessment of consequences. Fault treeor decision trees are often used to determine the prob-ability that a certain sequence of events will result in acertain consequence. Qualitative risk assessment is lessrigorous and the results are often shown in the form ofa simple risk matrix where one axis of the matrix rep-resents the probability and the other represents theconsequences. If a value is given to each of the prob-ability and a consequence, a relative value for risk canbe calculated. It is important to recognize that the quali-

563F.I. Khan, M.M. Haddara / Journal of Loss Prevention in the Process Industries 16 (2003) 561–573
tative risk value is a relative number that has little mean-ing outside the framework of the matrix. Within theframework of the matrix, it provides a natural prioritiz-ation of items assessed using the matrix. However, asthese risk values are subjective, prioritizations based onthese values are always debatable.
The proposed risk-based maintenance (RBM) strategyaims at reducing the overall risk of failure of theoperating facilities. In areas of high and medium risk, afocused maintenance effort is required, whereas in areasof low risk, the effort is minimized to reduce the totalscope of work and cost of the maintenance program ina structured and justifiable way. The quantitative valueof the risk is used to prioritize inspection and mainte-nance activities. RBM suggests a set of recommen-dations on how many preventive tasks (including thetype, means, and timing) are to be performed. Theimplementation of RBM will reduce the likelihood of anunexpected failure. Detailed description of the method-ology is presented in subsequent sections.
2. Risk-based maintenance methodology
The risk-based maintenance methodology is brokendown into three main modules, see Fig. 1:
(1) risk determination, which consists of risk identifi-cation and estimation,
Fig. 1. Architecture of RBM methodology.
(2) risk evaluation, which consists of risk aversion andrisk acceptance analysis, and
(3) maintenance planning considering risk factors.
3. Module I: risk estimation
This module comprises four steps, which are logicallylinked as shown in Fig. 2. A detailed description of eachstep is presented below.
3.1. Step I.1. Failure scenario development
A failure scenario is a description of a series of eventswhich may lead to a system failure. It may contain asingle event or a combination of sequential events. Usu-ally, a system failure occurs as a result of interactingsequence of events. The expectation of a scenario doesnot mean it will indeed occur, but that there is a reason-able probability that it would occur. A failure scenariois the basis of the risk study; it tells us what may happen
Fig. 2. Description of risk estimation module.
564 F.I. Khan, M.M. Haddara / Journal of Loss Prevention in the Process Industries 16 (2003) 561–573
so that we can devise ways and means of preventing orminimizing the possibility of its occurrence. Such scen-arios are generated based on the operational character-istics of the system; physical conditions under whichoperation occur; geometry of the system, and safetyarrangements, etc. Recently, Khan (2001) has proposeda systematic procedure—maximum credible accidentscenario (MCAS)—to evaluate failure (accidents) scen-arios in a process system. The procedure introduces theconcept of maximum credible scenarios as an alternativeto the current methodology based on the worst-casescenario as recommended by many regulatory agencies.
The developed failure scenarios are then screened toshort list the ones that are more relevant to the system athand. MCAS provides the criteria to form this short list.
3.2. Step I.2. Consequence assessment
The objective here is to prioritize equipment and theircomponents on the basis of their contribution to a systemfailure. For example, in the case of a pressure contain-ment, a pinhole leak on a process line may not lead toa total loss of production. This is in contrast to a failureof a pipe valve which may cause a shut down of the line.
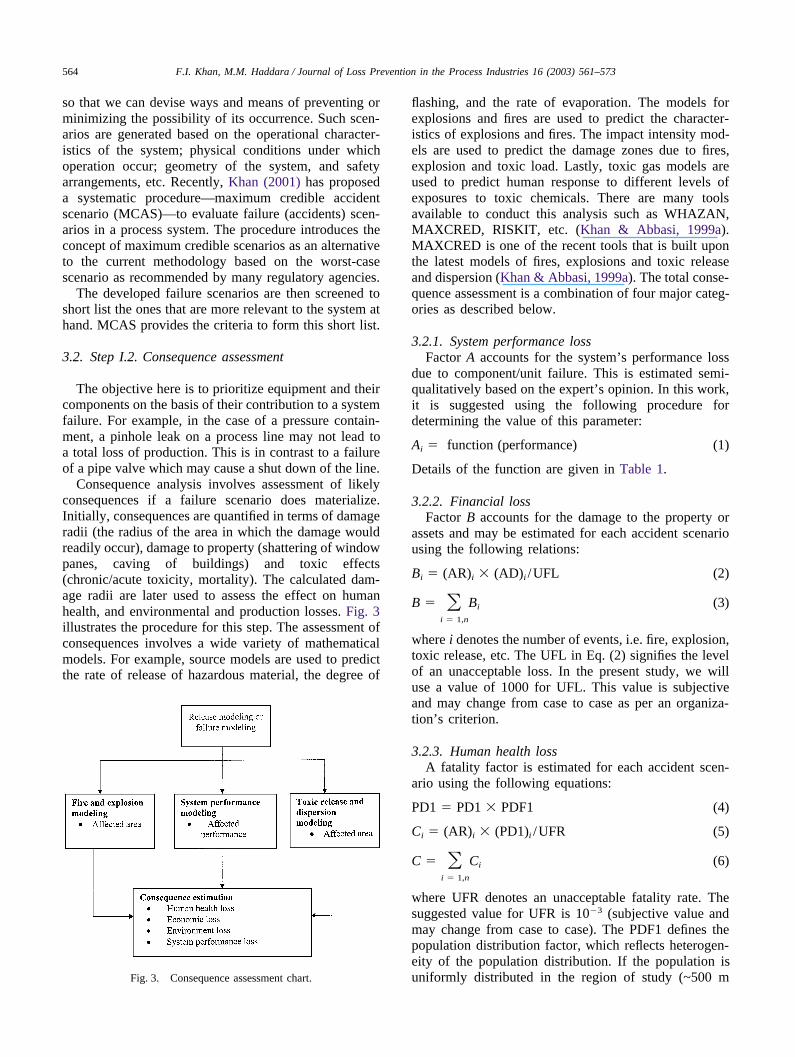
Consequence analysis involves assessment of likelyconsequences if a failure scenario does materialize.Initially, consequences are quantified in terms of damageradii (the radius of the area in which the damage wouldreadily occur), damage to property (shattering of windowpanes, caving of buildings) and toxic effects(chronic/acute toxicity, mortality). The calculated dam-age radii are later used to assess the effect on humanhealth, and environmental and production losses. Fig. 3illustrates the procedure for this step. The assessment ofconsequences involves a wide variety of mathematicalmodels. For example, source models are used to predictthe rate of release of hazardous material, the degree of
Fig. 3. Consequence assessment chart.
flashing, and the rate of evaporation. The models forexplosions and fires are used to predict the character-istics of explosions and fires. The impact intensity mod-els are used to predict the damage zones due to fires,explosion and toxic load. Lastly, toxic gas models areused to predict human response to different levels ofexposures to toxic chemicals. There are many toolsavailable to conduct this analysis such as WHAZAN,MAXCRED, RISKIT, etc. (Khan & Abbasi, 1999a).MAXCRED is one of the recent tools that is built uponthe latest models of fires, explosions and toxic releaseand dispersion (Khan & Abbasi, 1999a). The total conse-quence assessment is a combination of four major categ-ories as described below.
3.2.1. System performance lossFactor A accounts for the system’s performance loss
due to component/unit failure. This is estimated semi-qualitatively based on the expert’s opinion. In this work,it is suggested using the following procedure fordetermining the value of this parameter:
Ai � function (performance) (1)
Details of the function are given in Table 1.
3.2.2. Financial lossFactor B accounts for the damage to the property or
assets and may be estimated for each accident scenariousing the following relations:
Bi � (AR)i � (AD)i /UFL (2)
B � �i � 1,n
Bi (3)
where i denotes the number of events, i.e. fire, explosion,toxic release, etc. The UFL in Eq. (2) signifies the levelof an unacceptable loss. In the present study, we willuse a value of 1000 for UFL. This value is subjectiveand may change from case to case as per an organiza-tion’s criterion.
3.2.3. Human health lossA fatality factor is estimated for each accident scen-
ario using the following equations:
PD1 � PD1 � PDF1 (4)
Ci � (AR)i � (PD1)i /UFR (5)
C � �i � 1,n
Ci (6)
where UFR denotes an unacceptable fatality rate. Thesuggested value for UFR is 10�3 (subjective value andmay change from case to case). The PDF1 defines thepopulation distribution factor, which reflects heterogen-eity of the population distribution. If the population isuniformly distributed in the region of study (~500 m

565F.I. Khan, M.M. Haddara / Journal of Loss Prevention in the Process Industries 16 (2003) 561–573
Table 1Quantification scheme for system performance function used in Eq. (1)
Class Description Function (operation)
I � Very important for system operation 8–10� Failure would cause system to stop functioning
II � Important for good operation 6–8� Failure would cause impaired performance and adverse consequences
III � Required for good operation 4–6� Failure may affect the performance and may lead to subsequent failure of the system
IV � Optional for good performance 2–4� Failure may not affect the performance immediately but prolonged failure may cause system to fail
V � Optional for operation 0–2� Failure may not affect the system’s performance
radius), the factor is assigned a value of 1; if the popu-lation is localized and away from the point of accidentthe lowest value 0.2 is assigned. Values for this para-meter have been adapted from the latest work of Hirstand Carter (2000).
3.2.4. Environment and/or ecological lossThe factor C signifies damage to the ecosystem, which
can be estimated as:
Di � (AR)i � (IM)i /UDA (7)
D � �i � 1,n
Di (8)
UDA indicates a level for the unacceptable damagingarea, the suggested value for this parameter is 1000 m2
(subjective value and may change from case to case).IM denotes importance factor. IM is unity if the damageradius is higher than the distance between an accidentand the location of the ecosystem. This parameter isquantified using Fig. 4, see Khan and Abbasi (1997).
Finally, these three factors are combined together toyield the factor Con.
Fig. 4. Quantification of importance factor (IM).
Con � [0.25A2 � 0.25B2 � 0.25C2 � 0.25D2]0.5 (9)
3.3. Step I.3. Probabilistic failure analysis
Probabilistic failure analysis is conducted using faulttree analysis (FTA). The use of FTA, together withcomponents’ failure data and human reliability data,enables the determination of the frequency of occurrenceof an accident. Developing probabilistic fault trees ismade easier using a methodology called “analyticalsimulation” , see Khan and Abbasi (2000).
The key features of this step are:
(1) Fault tree development: The top event is identifiedbased on the detailed study of the process, controlarrangement, and behavior of components of theunit/plant. A logical dependency between the causesleading to the top event (failure) is developed.
(2) Boolean matrix creation: The fault tree developed istransformed to a Boolean matrix. If the dimensionof the Boolean matrix is too large to be handled bythe available computer, a structural moduling tech-nique may be applied (Shafaghi, 1988; Yllera,1988). This technique proposes moduling of the faulttree into a number of smaller submodules withdependency relations among them. This reduces thememory allocation problem as well as makes thecomputation faster.
(3) Finding of minimum cutsets and optimization: Mini-mum cutsets are determined from the Boolean(Greenberg & Slater, 1992). If the problem has beenstructurally moduled, then each module is solvedindependently, and the results are combined. Theminimum cutsets are then optimized using an appro-priate technique. Optimization is necessary in orderto eliminate the unimportant paths (cutsets).
(4) Probability analysis: The optimized minimum cut-sets are used to estimate probabilities. The presentauthors recommend the use of Monte–Carlo simul-ation method (Rauzy, 1993; Soon, Joo, & Myung,1985) for this purpose. The simulation methods not

566 F.I. Khan, M.M. Haddara / Journal of Loss Prevention in the Process Industries 16 (2003) 561–573
only give the probability of the top event but theyalso provide information on the sensitivity of theresults. In addition, simulation is helpful in studyingthe impact of each of the initiating events. Toincrease the accuracy of the computations andreduce the margin of error due to inaccuraciesinvolved in the reliability data of the basic events(initiating events), we recommend the use of a fuzzyprobability set (Dubois & Prade, 1980; Lai,Shenoi, & Fan, 1988; Noma, Tankara, & Asai, 1981;Tanaka, Fan, Lai, & Toguchi, 1983). Fuzzy prob-ability set theory is used in analytical simulationalgorithm and coded in PROFAT software (Khan &Abbasi, 1999b).
(5) Improvement index estimation: The improvementindex provides a measure of the impact of each rootcause on the final failure event. Improvement indicesare estimated using the simulation results. To esti-mate the impact of a root cause, the simulation iscarried out twice: with and without the cause. The“ improvement index” is then obtained as a measureof the change in the probability of occurrence of thefinal event.
3.4. Step I.4. Risk estimation
The results of the consequence and the probabilisticfailure analyses are then used to estimate the risk thatmay result from the failure of each unit. In the next mod-ule, we will show how the estimated risk is evaluatedagainst an acceptance criteria.
4. Module II: risk evaluation
The objective of this module is to evaluate the esti-mated risk using the methodology explained above. Thealgorithm used is shown in Fig. 5. This evaluation algor-ithm comprises two steps as detailed below.
4.1. Step II.1. Setting up an acceptance criteria
In this step, we identify the specific risk acceptancecriteria to be used in our study. To allow for differentcriteria for the acceptable level of risk depending on thesystem nature and type, an open-ended methodology hasbeen used in this study. Different acceptance risk criteriaare available in the literature, see ALARP (as low asreasonably possible), Dutch acceptance criteria, andUSEPA acceptance criteria (Lees, 1996).
4.2. Step II.2. Risk comparison against acceptancecriteria
In this step, we apply the acceptance criteria to theestimated risk for each unit in the system. Units whose
estimated risk exceeds the acceptance criteria are ident-ified. These are the units that should have an improvedmaintenance plan.
5. Module III: maintenance planning
Units whose level of estimated risk exceeds theacceptance criteria are studied in detail with the objec-tive of reducing the level of risk through a better mainte-nance plan. The details of this analysis are given below,see Fig. 6.
5.1. Step III.1. Estimation of optimal maintenanceduration
The individual failure causes are studied to determinewhich one affects the probability of failure adversely. Areverse fault analysis is carried out to determine therequired value of the probability of failure of the rootevent. A maintenance plan is then completed.
5.2. Step III.2. Re-estimation and re-evaluation of risk
The last step in this methodology aims at verifyingthat the maintenance plan developed produces accept-able total risk level for the system.
6. Case study: a maintenance plan for an HVACsystem
6.1. System description
Heating, ventilation and air-conditioning (HVAC)systems control the temperature, humidity, and total airquality in residential, commercial, and industrial build-ings. Efficient and failure free operation of HVAC sys-tem is critical for the safety of patients. A typical HVACsystem is critical for the safety of patients. A typicalHVAC system consists of various mechanical, electrical,and electronic components such as motors, compressors,pumps, fans, ducts, pipes, thermostats, and switches. Asimplified block diagram of an HVAC system is shownin Fig. 7. To maintain an uninterrupted operation of anHVAC system requires a plan for early correction ofanticipated problems. Further, planned maintenanceensures conservation, recovery, and recycle of chloro-fluorocarbon (CFC) and hydrochlorofluorocarbon(HCFC) refrigerants used in systems. The release ofCFCs and HCFCs contributes to the depletion of thestratospheric ozone layer, which protects plant and ani-mal life from ultraviolet radiation.
The present case study deals with the analysis of anHVAC system (Wong, 2000) and the development ofa maintenance plan to provide efficient and failure free

567F.I. Khan, M.M. Haddara / Journal of Loss Prevention in the Process Industries 16 (2003) 561–573
Fig. 5. Description of risk evaluation module.
operation. The process flow diagram of the HVAC isshown in Fig. 7.
6.2. Risk estimation
6.2.1. Failure scenariosThe complete HVAC system has been divided into 10
different functional units according to their operationalcharacteristics (Table 2). Two most probable failurescenarios have been developed for most of the units andlisted in Table 2. These failure scenarios have been sub-jected to consequence analysis.
6.2.2. Consequence analysisConsequence analysis has been carried out for envis-
aged failure scenarios for each of the 10 units. The oper-ation of an HVAC system does not involve the pro-cessing of chemicals and the effect of its stoppage cannotbe measured in terms of the lost production. Thus, theconsequences related to financial and to human healthloss have been ignored. The focus in this study is onthe consequences related to system performance and theeffect on the environment. The consequences for thesetwo major classes are combined by applying Eq. (9).They are then normalized on a scale of 1–10 for each
failure scenario. The results of consequence analysis forenvisaged failure scenarios of the different units of thesystem are presented in Table 3. It is evident from Table3 that the highest impact on the system performanceresults from three units: the air supply fan, the EP relay,and the freeze protection system.
6.2.3. Probabilistic failure analysisAn analysis to determine the failure probability distri-
bution for each unit is listed in Table 3. For units havingmore than one failure scenario, the scenarios that havethe maximum consequences are selected for sub-sequent analysis.
Memorial University facility management division hasbeen maintaining performance data of all of the compo-nents of the HVAC system. In the present study, 5 yeardata have been used (1993–1998) (Wong, 2000). Thesedata have been used to verify various failure functions(distribution) and it has been observed that two-para-meter Weibull distribution define them the best (Eq. (8)).
F(t) � 1�exp��� th�b� (10)
The two parameters, h and b, are estimated for the dif-

568 F.I. Khan, M.M. Haddara / Journal of Loss Prevention in the Process Industries 16 (2003) 561–573
Fig. 6. Description maintenance planning module.
Fig. 7. Simplified block diagram of a typical HVAC system.
ferent units and their subcomponents and are presentedin Tables 4 and 5 (Wong, 2000).
Subsequently, fault trees have been developed for theenvisaged failure scenarios of the different units. Fig. 8depicts the fault tree for the whole system, while Fig. 9shows the fault tree for the air supply fan. These faulttrees are used to estimate the probability of occurrenceof failure according to the different scenarios. Theresults of this analysis are shown in Tables 4 and 5. Itis evident from Table 4 that the failure of the air supplyfan, the humidifier, the EP relay system, and the dampermotor are the most probable causes for the failure of theHVAC system.
6.2.4. Risk estimationThe results of the consequence and the probabilistic
analyses are combined to quantify the risk factors.Tables 4 and 5 provide the values estimated for the riskfactors of the different units of the HVAC system.
The risk for the HVAC system failure is estimated at1.01 (for 1 year duration), which is far above the accept-ance level of 1.0E�02.
6.3. Risk evaluation
The results in Table 4 show that in order to reducethe risk of the HVAC system failure, we need to reducethe probability of failure of the air supply fan, thehumidifier, the EP relay system, and the damper motor.This will be dealt with through the use of a more effec-tive maintenance program. For illustration purpose, step-wise detailed risk calculations for damper motor areshown in Appendix A.

569F.I. Khan, M.M. Haddara / Journal of Loss Prevention in the Process Industries 16 (2003) 561–573
Table 2Units in a typical HVAC system
Unit number in Fig. 8 Unit name Failure scenarios
1 Outdoor louver � Louver is blocked by foreign material� Louver is damaged or removed
2 Damper motor � Failed to allow fresh air intake during system operation� Failed to stop fresh air to HVAC during system shut down
3 Air filter unit Filter failed to remove particles from intake air� Pre-filter failed� Main filter failed
4 Freeze protection unit � Unit failed to operate on demand5 Heating unit � Failed to provide adequate heating
� Provide excess heating6 Cooling unit � Cooling coil failed to provide adequate cooling
� Coiling coil provide excess cooling7 Humidification unit � Failed to supply adequate moisture
� Supplied excess moisture8 EP relay unit � Failed to provide enough control air
� Failed to energize the final control element (electric control system)9 Computer control unit � Control system failed10 Air supply fan � Failed to supply adequate condition air with acceptable noise level
Fig. 8. Fault tree for air supply fan failure scenario; numbers areexplained in Table 2.
6.4. Maintenance planning
One of the objectives of this study is to develop atechnique to design maintenance plans for reducing thelevel of risk resulting from the failure of a system. The
approach suggested in this work is explained briefly inthis section using the air supply fan unit as an example.
� A value of the probability of the top event on the faulttree of the unit is determined. This value is chosensuch that the resulting risk meets the risk acceptancecriterion. In the case of air supply fan system, thevalue of risk is �1.0E�03.
� Using the value of the probability of failure of thetop event, a reverse fault tree analysis is conductedto determine the required probabilities of the rootevents. The probability of failure of a root event isthen used to estimate the time interval between con-secutive inspection/maintenance tasks. Using thisanalysis, we were able to determine the values for thetime intervals between consecutive maintenance tasksof 41 days for external accessories such as fan belts,etc., and 75 days for internal accessories such as fanbearing, etc.
This exercise was repeated for the other units of thesystem and the estimates determined for the maintenanceintervals are given in Table 6.
These values are then used to develop a maintenanceplan using the RBM methodology as shown in Table 6.
7. Summary and conclusion
Maintenance is aimed at increasing the availability ofany system taking account of safety or environmentissues and optimizing total life cycle cost. Risk assess-ment integrates reliability analysis with safety and

570 F.I. Khan, M.M. Haddara / Journal of Loss Prevention in the Process Industries 16 (2003) 561–573
Table 3Results of consequence analysis for different accident scenarios
Unit name Failure scenarios Consequence analysis results
Outdoor louver � Louver is blocked by foreign material 6� Louver is damaged or removed 4
Damper motor � Failed to allow fresh air intake during system operation 6� Failed to stop fresh air to HVAC during system shut down 4
Air filter unit Filter failed to objects/particles from intake air� Pre-filter failed 4� Main filter failed 4
Freeze protection unit � Units failed to operate on demand 8Heating unit � Failed to provide adequate heating 4
� Provide excess heating 3Cooling unit � Cooling coil failed to provide adequate cooling 4
� Coiling coil provided excess cooling 3Humidification unit � Failed to supply adequate moisture 5
� Supplied excess moisture 4EP relay unit � Failed to provide enough control air 6
� Failed to energize the final control element (electric control system) 8Computer control unit � Control system failed 6Air supply fan � Failed to supply adequate conditional air with acceptable level of noise 8HVAC system � Fail to perform as desired 5
Table 4Results of risk estimation module; units in italicized exceeding the acceptance level
Unit name h b Probability of failure in 1 year Risk factor
Outdoor louvera Not available Not available 1.0E�04 6.0E�04Damper motor 51,996.6 3.85 1.05E�03 6.3E�03Air filter unita Not available Not available 1.0E�04 5.0E�04Freeze protection unita Not available Not available 1.0E�04 6.0E�04Heating unita Not available Not available 1.0E�04 4.0E�04Cooling unita Not available Not available 1.0E�04 4.0E�04Humidification unit 57,608.6 2.99 3.58E�03 1.8E�02EP relay unit 69,366.5 3.04 1.86E�03 1.5E�02Computer control unita Not available Not available 1.0E�04 8.0E�04Air supply fan See Table 5 See Table 5 0.1965 1.57Overall HVAC system failure as per Fig. 8 0.2021 1.01
a Failure data for these units were not available, as they did not ever fail on operation; the failure probability for these units is adopted fromthe literature (Lees, 1996).
Table 5Details of air supply fan failure
Component number used in Fig. 9 Unit name h b Probability of failure in 1 year Risk factor
1 Fan belt failure 20,464.3 2.146 1.49E�01 1.1922 Vortex vanes failed 68,043.1 1.638 3.42E�02 2.73E�013 Fan bearing failed 62,328.5 2.466 7.88E�03 6.3E�024 Fan assembly failed 121,417.4 2.035 4.74E�03 3.8E�025 Fan motor failed 132,780.2 1.712 9.47E�03 7.6E�02Air supply fan failure as per Fig. 9 0.1965 1.572
environmental issues. Risk-based maintenance attemptsto answer five important questions related to integrityand fault free operation of the system:
� What can cause the system to fail?
� How can it cause the system to fail?� What would be the consequences if it fails?� How probable is it to occur?� How frequent an inspection/maintenance of what
components would avert such failure?

571F.I. Khan, M.M. Haddara / Journal of Loss Prevention in the Process Industries 16 (2003) 561–573
Fig. 9. Fault tree for air supply fan failure scenario; numbers areexplained in Table 5.
Having known the answers to these five questions, itis safe to say that maintenance planning based on riskanalysis is expected to provide cost effective mainte-nance, which minimizes the consequences (related tosafety, economic, and environment) of a systemoutage/failure. This will, in turn, result in a better assetand capital utilization. Risk-based maintenance stra-tegies can be used to improve the existing maintenancepolicies through optimal decision procedures in differentphases of the life cycle of a system.
This paper presents a new methodology for risk-basedmaintenance. The proposed methodology is more com-prehensive and quantitative. It comprises three mainmodules: (i) risk estimation module, (ii) risk evaluationmodule, and maintenance planning module. Each mod-ule consists of many steps, i.e. risk estimation moduleinvolves: (i) failure scenario development, (ii) conse-
Table 6Results of optimal maintenance duration computations
Unit name Optimal maintenance duration Revised frequency of failure (year�1) Un-revised risk factor Revised risk factor(days)
Damper motor 132 2.1E�05 6.2E�03 1.26E�04Humidification unit 172 3.77E�04 1.8E�02 1.88E�03EP relay unit 81 1.91E�05 1.5E�02 1.57E�04Air supply fan� Fan belt and vortex 41 3.42E�03 1.57 2.73E�02� Fan bearing, etc. 75
Overall HVAC risk prior to implementing maintenance plan 1.01Overall HVAC risk after implementing maintenance plan 2.2E�02
quence assessment, (iii) probabilistic failure analysis,and (iv) risk estimation.
This paper illustrates the applicability of the proposedmethodology by applying it to a HVAC system. Initially,the complete HVAC system is divided into 10 differentunits. Among these units, four—damper motor, freezeprotection unit, EP relay unit, and supply air fan—wereidentified to be most risky, and contributing themaximum in the overall risk of HVAC failure. Aninspection/maintenance schedule has been worked for allfour units. It is further demonstrated analytically that theimplementation of this inspection/maintenance schedulewould bring down the high level of unacceptable risk toan acceptable level.
Appendix A. Detailed calculations for dampermotor unit of HVAC system
A.1. Failure scenarios
Two scenarios are envisaged for this unit, they are:
� Scenario 1: failed to allow fresh air� Scenario 2: failed to stop fresh air to HVAC during
shut down.
A.2. Consequence analysis
A.2.1. Scenario 1
System performance loss is 100%, A = 10No financial loss, B = 0Due to non availability of fresh air serious human healtheffects, C = 6

572 F.I. Khan, M.M. Haddara / Journal of Loss Prevention in the Process Industries 16 (2003) 561–573
No environmental and ecological loss, D = 0Con = [0.25 × 10² + 0.25 × 62]0.5 = 5.83 = 6
A.2.2. Scenario 2
Significant loss of system performance, A = 8No financial loss, B = 0Moderately serious human health effects, C = 4No environmental and ecological loss, D = 0Con = [0.25 × 82 + 0.25 × 42]0.5 = 4.47 = 4
Final consequence results = maximum of 4 and 6 =6
A.3. Probabilistic failure analysis
Failure probability in 1 year of operation
Failure probability � 1�e�(t/h)b � 1�e(365×24/51966.6)3.85
� 1.05 � 10�3
A.4. Risk estimation
Risk factor due to damper motor = 6×1.05 × 10�3 =6.3 × 10�3
Total calculated risk of the HVAC system = 1.01
A.5. Risk evaluation and maintenance planning
HVAC Target risk = 2.2 × 10�2
Target risk calculated for damper motor based onHVAC target risk and reverse fault tree analysis = 2.1× 10�5
Based on target risk, preventive maintenance time,132 days.
References
Aller, J. E., Horowitz, N. C., Reynolds, J. T., & Weber, B. J. (1995).Risk based inspection for petrochemical industry. In Risk and safetyassessment where is the balance? New York: American Society ofMechanical Engineers.
API (1995). Base resource document on risk based inspection for APIcommittee on refinery equipment. Washington, DC: American Pet-roleum Institute.
ASME (1991). Research task force on risk based inspection guidelines,risk based inspection development of guidelines. In General docu-ment CRTD 20-1. Washington, DC: American Society of Mechan-ical Engineers.
Capuano, M., & Koritko, S. (1996). Risk oriented maintenance. Biom-edical Instrumentation and Technology, January/February, 25–37.
Chen, L. N., & Toyoda, J. (1990). Maintenance scheduling based on
two level hierarchical structure to equalize incremental risk. IEEETruncations on Power Systems, 5(4), 1510–1561.
Dey, P. M. (2001). A risk-based model for inspection and maintenanceof cross-country petroleum pipeline. Journal of Quality in Mainte-nance Engineering, 7(1), 25–41.
Dey, K. P., Ogunlana, S. O., Gupta, S. S., & Tabucanon, M. T. (1998).A risk-based maintenance model for cross-country pipelines. CostEngineering, 40(4), 24–31.
Dubois, D., & Prade, H. (1980). Fuzzy sets and systems: Theory andapplications. New York: Academic Press.
Greenberg, H. R., & Slater, B. B. (1992). Fault tree and event treeanalysis. New York: Van Nostrand Reinhold.
Hagemeijer, P. M., & Kerkveld, G. (1998). A methodology for risk-based inspection of pressurized systems. Proceedings of the Insti-tute of Mechanical Engineers, Part E, 212, 37–47.
Hirst, I. L., & Carter, D. A. (2000). A “Worst Case” methodologyfor risk assessment of major accident installations. Process SafetyProgress, 19(2), 78–82.
Khan, F. I. (2001). Maximum credible accident scenario for realisticand reliable risk assessment. Chemical Engineering Progress, Nov-ember, 55–67.
Khan, F. I., & Abbasi, S. A. (1997). Accident hazard index: A multi-attribute scheme for process industry hazard rating. Institution ofChemical Engineers (IChemE) of UK (Environmental Protectionand Safety), IChemE, UK, 75B, 217.
Khan, F. I., & Abbasi, S. A. (1998). Safe maintenance practice. Chemi-cal Industry Digest, March, 91–105.
Khan, F. I., & Abbasi, S. A. (1999a). MAXCRED—a new softwarepackage for rapid risk assessment in chemical process industries.Environment Modeling and Software, 14, 11–25.
Khan, F. I., & Abbasi, S. A. (1999b). PROFAT: A user-friendly systemfor probabilistic fault tree analysis. Process Safety Progress, 18(1),42–49.
Khan, F. I., & Abbasi, S. A. (2000). Analytical simulation and PRO-FAT II: A new methodology and a computer automated tool forfault tree analysis in chemical process industries. Journal of Haz-ardous Materials, 75, 1–27.
Kletz, T. A. (1994). What went wrong. Houston, TX: Gulf Publi-cation House.
Kumar, U. (1998). Maintenance strategies for mechanized and auto-mated mining systems: a reliability and risk analysis basedapproach. Journal of Mines, Metals and Fuels, Annual review,343–347.
Lai, F. S., Shenoi, S., & Fan, L. T. (1988). Fuzzy fault tree analysistheory and applications. In Kandel, & Avni (Eds.), (pp. 139–167).Engineering risk and hazard assessment, vol. 1. Florida: CRCPress Inc.
Lees, F. P. (1996). Loss prevention in chemical process industries, vol.1. London: Butterworths.
Nessim, M., & Stephens, M. (1998). Quantitative risk-analysis modelguides maintenance budgeting. Pipe Line and Gas Industry, 81(6),1–33.
Noma, K., Tankara, H., & Asai, K. (1981). Fault tree analysis withfuzzy probability. Journal of Ergonomics, 17, 291–297.
Rauzy, A. (1993). New algorithms for fault tree analysis. ReliabilityEngineering and System Safety, 40, 203–211.
Reynolds, J. T. (1995). Risk based inspection improves safety of press-ure equipment. Oil and Gas Journal, special 16 January issue.
Ridgway, M. (2001). Classifying medical devices according to theirmaintenance sensitivity: A practical, risk-based approach to PMprogram management. Biomedical Instrumentation and Tech-nology, May/June, 167–176.
Shafaghi, A. (1988). Structure modeling of process systems for riskand reliability analysis. In Kandel, & Avni (Eds.), (pp. 45–64).Engineering risk and hazard assessment, vol. 2. Florida: CRCPress Inc.
Soon, H. C., Joo, Y. P., & Myung, K. K. (1985). The Monte–Carlo

573F.I. Khan, M.M. Haddara / Journal of Loss Prevention in the Process Industries 16 (2003) 561–573
method without sorting for uncertainty propagation analysis inPRA. Reliability Engineering, 10, 233.
Tanaka, H., Fan, L. T., Lai, F. S., & Toguchi, K. (1983). Fault treeanalysis by fuzzy probability. IEEE Transactions on Reliability, R-32, 453–456.
Wong, D. (2000). A knowledge-based decision support system inreliability-centered maintenance of HVAC systems. PhD thesis,Memorial University of Newfoundland, St. John’s, Canada.
Copyright © 2022 FDOKUMEN