Interpretacion articulo 296 Constitucion periodo de los rectores CNE
J. Limnol., 69(2): 287-296, 2010 DOI: 10.3274/JL10-69-2-10
Selectivity of plankton nets over mesozooplankton taxa: implications for abundance, biomass and diversity estimation
Nicoletta RICCARDI
C.N.R. Institute of Ecosystems Study, L. Tonolli 50, 28922 Verbania-Pallanza, Italy e-mail: [email protected]
ABSTRACT The importance of the smaller copepod species is often underestimated as a result of the use of standard 200 µm mesh size nets,
even though the small copepods probably represent the dominant component of the mesozooplankton community. Although the inadequacy of relatively coarse nets in providing reliable descriptions of the mesozooplankton assemblage is increasingly well-documented, such nets continue to be commonly used. A major reason for this unwillingness to break with tradition is the belief that samples remain comparable even though the absolute values are biased. A one-year study of the abundance and size distribution of zooplankton collected in the Venice Lagoon using an 80 µm mesh size net showed an overwhelming abundance of small taxa. These data were used to derive estimates of the mesh selection effects of standard WP-2 nets on zooplankton abundance and biomass. Only 11% of numbers and 54% of biomass of lagoon zooplankton are likely to be caught with standard WP-2 nets. A comparison of seasonal changes in diversity, estimated from the fine and coarse datasets, confirmed that retention efficiency is seasonally dependent, which results in serious implications when extrapolating temporal patterns in community structure from WP-2 mesozooplankton counts. Key words: mesh selection, abundance, biomass, species diversity
1. INTRODUCTION
It is not easy to select a sampler for quantitative plankton collection, as demonstrated by the abundant literature commenting on the advantages and drawbacks of various sampling methods and devices (e.g., UNESCO 1968; Bottrell et al. 1976; de Bernardi 1984; Hernroth 1987; Greene 1990; Gallienne & Robins 2001). The efficiency of a particular instrument is gen-erally related to the composition, structure and density of the population to be sampled and the characteristics of the environment. However, for many reasons including ease of transport and handling, plankton nets are still the most widespread collecting tool. Among the many factors affecting sampling efficiency that cannot be ignored (e.g., avoidance, escape and clogging), mesh selectivity is undoubtedly a major source of error. According to de Bernardi (1984), assuming that nets can theoretically select the lower size limit of organisms, the mesh must be as small as the abundance of organisms permits without clogging. In practice, the use of mesh sizes from 50 µm to 126 µm is recommended in fresh-water environments. The finer net is used to collect the smaller species (excluding rotifers) and the coarser one for the larger species (de Bernardi 1984). A mesh aper-ture size of about 80 µm is therefore the most com-monly used in different lake typologies, followed by the 126 µm size, while mesh sizes of 50 µm (or even lower) are only exceptionally used, as they clog easily. While the 80 µm mesh has also been recommended for marine environments (Gallienne & Robins 2001), coarser nets
are commonly used in marine studies in spite of the fact that several dominant components of marine mesozoo-plankton, such as many Oithona, Oncaea and Clauso-calanus species, are smaller than or similar in size to most freshwater copepod and cladoceran species. In fact, despite studies over the past few decades demon-strating that the use of relatively coarse nets yields an inadequate representation of the zooplankton assem-blage (e.g., Saville 1958; Banse 1962; Vannucci 1968; Colton et al. 1980; Turner 1994), the WP-2 plankton net (mesh size 200 µm) (UNESCO 1968; Sameoto et al. 2000) is still the most commonly used for marine zoo-plankton sampling.
In marine studies, the widespread use of coarse plankton nets (200-330 µm) has led researchers to largely underestimate the abundance of the smaller copepod species and of early developmental stages, although they can be numerically dominant in several pelagic communities and in confined coastal areas (e.g., Turner 2004; Hwang et al. 2007; Pitois et al. 2009; Vasilyeva et al. 2009). However, as pointed out by Hopcroft et al. (1998), "many still believe that the use of relatively coarse nets […] yields an adequate repre-sentation of the community structure and its dynamics". Conventional WP-2 nets have been estimated to capture <10% of zooplankton numbers (Gallienne & Robins 2001), and therefore lead to severely biased estimates of biomass and secondary production. Although these data should be sufficient to encourage researchers to use a smaller mesh size, an objection which often arises is that sample comparability is maintained even though
N. Riccardi 288
absolute values are biased. However, this claim does not make sense when one considers the fact that the size structure of the zooplankton assemblage changes over time as a result of seasonal effects on adult body size and variations in population age structure. Sampling performance should therefore reasonably be expected to be seasonally dependent, which would also cause rela-tive estimates to be internally inconsistent. Contrary to this hypothesis, a similar seasonal sequence in the abundance of the dominant taxa was reported for both fine and coarse sampling devices (Villate 1991). Should a certain regularity in the effects of mesh selection be confirmed, the interpretation of data obtained by con-ventional sampling methods could be enhanced. This study sought to explore the potential bias caused by the use of standard WP-2 nets in assessing the seasonal abundance patterns and species composition of mesozooplankton. To accomplish this purpose, the abundance and biomass col-lected with an 80 µm mesh size net over an annual cycle were compared to estimates of the corresponding values obtained using a 200 µm mesh size net.
The Venice Lagoon was chosen as a suitably repre-sentative site for this study for two main reasons: 1) the small size zooplankton fraction is generally recognized to be largely dominant in semi-enclosed coastal areas (e.g., Patriti 1984; Fulton 1984; Uye 1994; Calbet et al. 2001; Jamet et al. 2001); 2) although this lagoon is one of the best-known examples of an ecosystem maintained through the centuries by human management (e.g., Ravera 2000), ecological knowledge of the lagoon is far from satisfactory. On the one hand, traditional fisheries still play an important role in the lagoon economy (Ravera 2000), but on the other hand, reliable estimates of the mesozooplankton assemblage are still lacking despite its pivotal role in aquatic food chains. If it is true that "conventional sampling methods used by zoo-plankton ecologists are woefully inadequate for addressing many of the most crucial questions […] in holoplankton ecology" (Greene 1990), a reliable char-acterization of this component of the lagoon ecosystem has yet to be obtained.
2. METHODS
Quantitative zooplankton samples were collected fortnightly at high tide from January 1995 to January 1996 in the central Venice Lagoon, Italy (45°26'N, 12°19'E), in a shallow area located in between Murano and the northern limit of the historical centre of Venice (Arsenale). Since the water depth in the area fluctuates between 0.8 and 1.5 meters depending on the tide level, a plankton net was not suitable for sampling; a gasoline-powered on-deck pump was used instead. The water was passed through a flow-meter, and the zooplankton was collected with a 80 µm net. This mesh size was chosen because it has been estimated to retain 90% of abundance and 98% of biomass and is therefore believed to be sufficient for most purposes (Gallienne &
Robins 2001). High suspended particle concentrations in the water of the lagoon waters discouraged a switch to smaller mesh sizes because of the likely reduction of filtration efficiency due to clogging.
Samples were collected from a drifting motorboat at a depth of 10-70 cm in the water column, to obtain a 1200-liter composite sample without repeated sampling from the same point. Because of the shallowness of the lagoon at the study site and the consequent well-mixed nature of the water, this sample of the water column was considered to be representative of the zooplankton assemblage. Repeti-tive sampling in the same area at the same time confirmed this assumption (Riccardi, unpublished data).
Zooplankton samples were fixed and preserved immediately after collection in a 4% formaldehyde-seawater solution. Specimens of the most abundant spe-cies were identified and counted in subsamples taken with a Stempel pipette; at least 100 individuals of each sex or developmental stage were counted for each abun-dant species. The whole sample was examined to count rare species. Taxonomic identification was performed to species level for the majority of holoplankters, except for copepod nauplii and early copepodites of calanoids. Copepodites of cyclopoids, poecilostomatoids and har-pacticoids and late copepodites of calanoids were identi-fied to species or genus. Meroplankters were identified to order or class. Since length is commonly used to define the lower end of the mesozooplankton range (tra-ditionally taken to be 200 µm), the size classification was based on individual body length and individuals were grouped into classes at 100 µm intervals. The body length and width of 30 specimens of each taxon from each sample were measured with an ocular micrometer (100 subdivisions) at a magnification of 100×. In deca-pod larvae, the length, height and width of the cephalo-thorax and the abdomen length were measured. For rare species, all adult individuals present in the sample were measured. The minimum number of measurements required to obtain an estimate error lower than 10% around the mean was calculated according to the fol-lowing formula (Bakus 1990):
2
22
LZN σ
= (1
where N is the number of measurements, L is the error around the mean, and Z is the value of the distance from the mean in standard deviation units. To provide a 95% level of confidence, the Z (0.5) value must be 1.96. For most of our samples and species, the minimum number of estimates needed was lower than 30; when a higher number of estimates was needed, more individuals were measured.
Copepod males and females were considered sepa-rately. Copepod body length was measured from the rostral tip to the posterior margin of the caudal rami (excluding furcal setae) and width was measured at the widest point of the cephalotorax. Length referred to the
Selectivity of plankton nets over mesozooplankton taxa 289
shell in mollusc larvae, and to the sum of cephalothorax and abdomen measurements (including telson) in deca-pod larvae. Gelatinous organisms, such as Noctiluca, medusae, Siphonophora, Ctenophora and dolioloids, were not included in the size classification. Protozoans (tintinnids and foraminifers) were not considered because they are generally assigned to the microzoo-plankton (conventionally defined as the fraction <200 μm), which is never sampled using nets.
Individual biovolume was estimated by geometric approximation (e.g., Halliday 2001): the geometric formula for the ellipsoid of revolution was used for most taxa, while a cylinder was used for chaetognats and polychaete larvae. To minimize errors due to linear shrinkage of formalin-preserved specimens, all measurements were made within two weeks of sample collection. Assuming that changes in cephalotorax length after preservation in formalin are minimal (Williams & Robins 1982; Böttger & Schnack 1986), I used this measure, instead of total body length, to estimate copepod volumes.
The number of individuals (NCT) theoretically caught with a 200 µm net was calculated using equation of Nichols and Thompson (Nichols & Thompson 1991):
( )[ ]0.19.8exp1/1/ −−+= RNNCT (2
where R is the ratio between body width and mesh size (= coefficient of retention). The mean body width measured for each taxa on each sampling date was used to calculate the coefficient of retention (R) for each sample. The biovolume collected was then calculated as NCT × individual biovolume. Although the data obtained using this procedure are based on approximations and assumptions, I relied on the considerations reported by Gallienne & Robins (2001) and deemed them to be rea-sonable estimates of likely net mesh selection effects on zooplankton abundance and biovolume.
To test whether the 80 µm and 200 µm data sets produced similar descriptions of seasonal abundance patterns and community changes, species richness (i.e. number taxa per sample) and taxonomic diversity were estimated for the fine and coarse fractions. Two indices were used: 1) the Shannon index, the most popular and most criticized index (e.g., May 1975; Magurran 1988), which takes into consideration both of the components of diversity (equitability and species richness) but tends to be weighted slightly towards species richness; and 2) the Berger-Parker index, which is a dominance index (equitability-biased) and is highly recommended as a simple but effective way of measuring diversity (Magurran 1988). The similarity between the diversity index patterns calculated from the two data sets was tested via a Pearson correlation analysis.
3. RESULTS
A total of 46 taxonomic groups were identified (Tab. 1), with copepod species contributing an average of
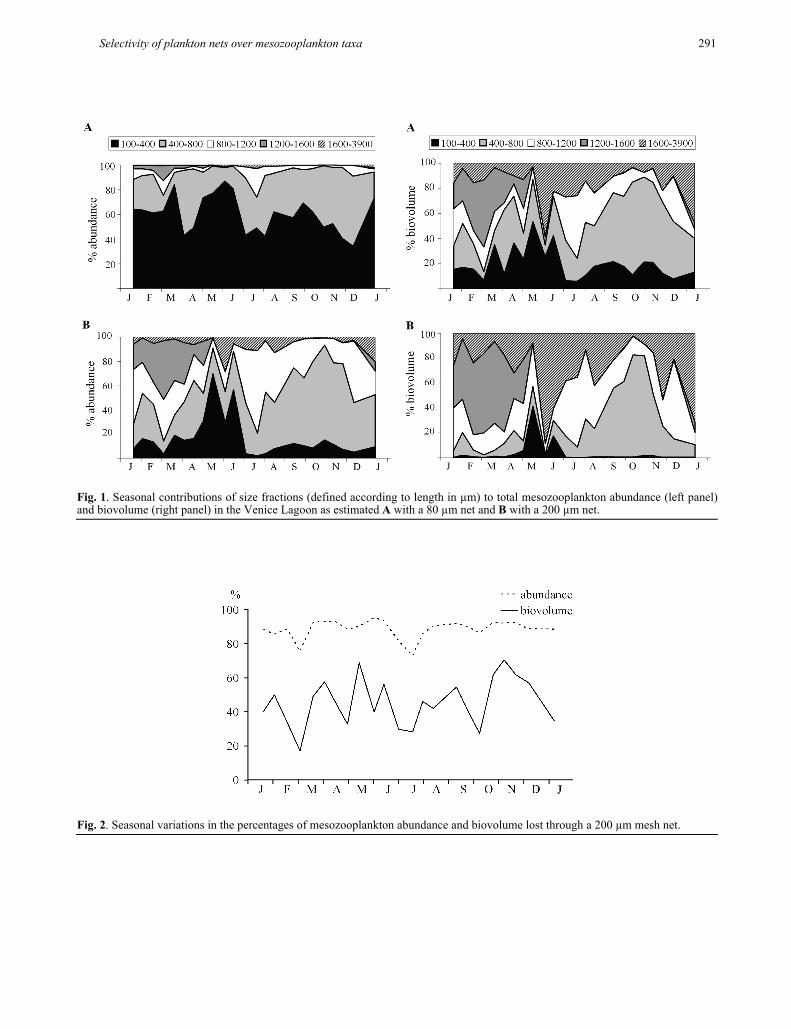
81% of mean annual abundances. Total seasonal abun-dances in samples collected with an 80 µm mesh net ranged from about 1.5 × 10³ to 67.3 × 10³ m-3; the range based on samples collected with a 200 µm mesh net was between 0.2 × 10³ and 12.3 × 10³ m-3. In fact, the zoo-plankton assemblage (Fig. 1a) was largely dominated by the smallest size fraction (100-400 µm), which accounted for 34% to 87% of total density, followed by the fraction of individuals with a maximum length of 800 µm. This value was estimated to be the lower length limit of organisms retained by a 200 µm mesh net, given the 3.6:1 length-to-width ratio measured for the various taxa in our samples. The two classes together accounted for about 90% of total density over the entire annual period, a value corresponding to the mean percentage of missing individuals in a hypothetical sample collected with a WP-2 net (Fig. 2). Under-sampling the smaller fraction would cause an average reduction of total abundance of 88%, and would also have significant effects in terms of biomass (biovolume), which would suffer from average losses of 44% (Fig. 2). The highest losses were observed in the smallest size fraction, which was reduced by two orders of magnitude in abundance. However, the contribution to total biovolume of organ-isms in the 400-800 µm length range (including most copepod species) was also drastically reduced, espe-cially during the first six months of the year (Fig. 1).
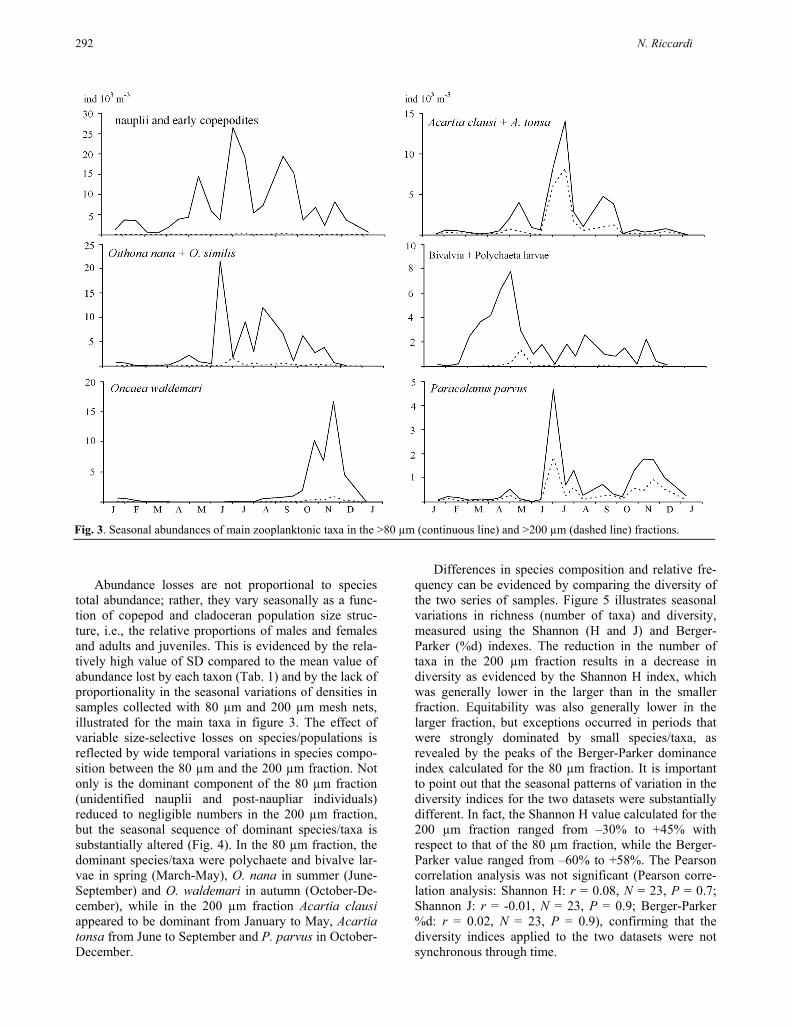
Figure 3 illustrates the annual cycle of the most abundant taxa in the 80 µm fraction and in the 200 µm fraction. The major component of the smallest size fraction was made up of larval and early juvenile stages of many copepod species, which were abundant in every season. This abundance reflected both the continuous recruitment of perennial species and the reproductive efforts of species appearing in seasonal succession (Fig. 3). A lower density and a larger seasonal variability characterized the meroplanktonic component (Fig. 3) of this size fraction, whose abundance mainly reflected the seasonal reproductive cycle of polychaetes and molluscs (both dominant components of the lagoon benthic assemblage). However, not only the larval and juvenile stages but also the adults of small copepod species are lost when WP-2 nets are used, as is clearly exemplified by the consistent reduction in the abundance of such dominant species as Oithona nana, Oithona similis and Oncaea waldemari. A progressive reduction in the per-centage of abundance lost through the 200 µm mesh net was clearly observed, along with an increase in species size (Tab. 1). It is, however, worthwhile to note that relatively small species, such as Paracalanus parvus, are retained more efficiently than expected based on their prosome length because of their relatively higher width:length ratio compared to more tiny copepod spe-cies like Oithona spp. The contribution of each species to total population density is modified as a result of size-selective losses of abundance, causing relative spe-cies frequency to be over- or underestimated (Tab. 1).
N. Riccardi 290
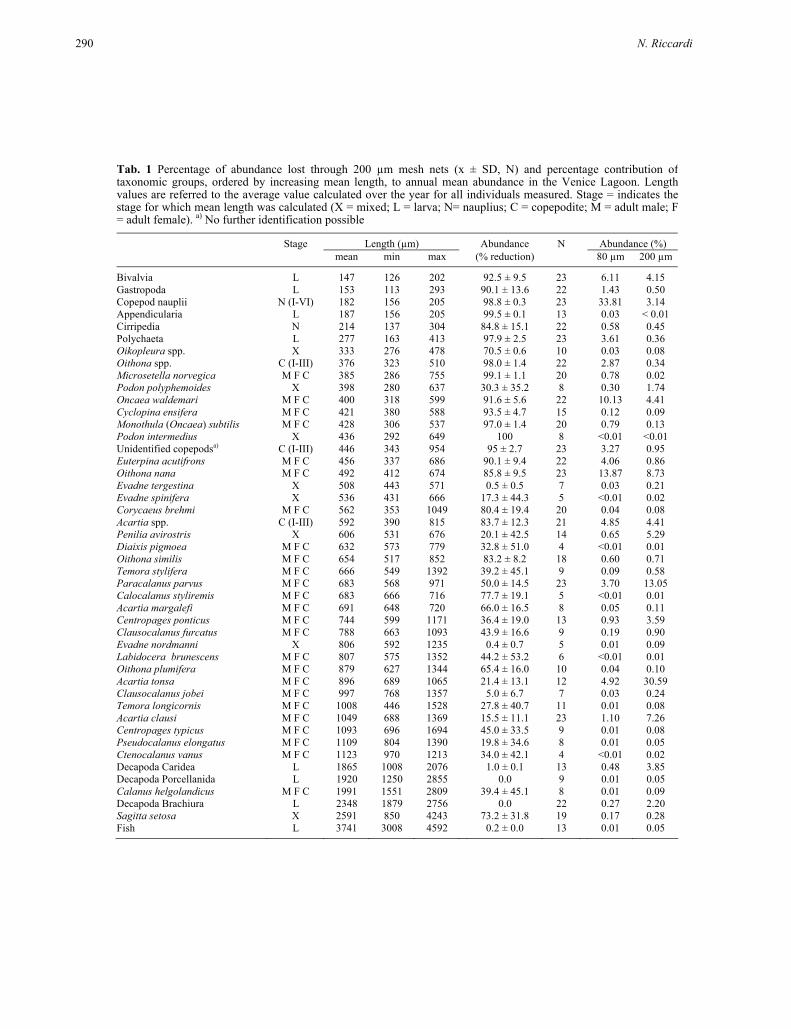
Tab. 1 Percentage of abundance lost through 200 µm mesh nets (x ± SD, N) and percentage contribution of taxonomic groups, ordered by increasing mean length, to annual mean abundance in the Venice Lagoon. Lengthvalues are referred to the average value calculated over the year for all individuals measured. Stage = indicates the stage for which mean length was calculated (X = mixed; L = larva; N= nauplius; C = copepodite; M = adult male; F= adult female). a) No further identification possible
Stage Length (µm) Abundance N Abundance (%) mean min max (% reduction) 80 µm 200 µm
Bivalvia L 147 126 202 92.5 ± 9.5 23 6.11 4.15 Gastropoda L 153 113 293 90.1 ± 13.6 22 1.43 0.50 Copepod nauplii N (I-VI) 182 156 205 98.8 ± 0.3 23 33.81 3.14 Appendicularia L 187 156 205 99.5 ± 0.1 13 0.03 < 0.01 Cirripedia N 214 137 304 84.8 ± 15.1 22 0.58 0.45 Polychaeta L 277 163 413 97.9 ± 2.5 23 3.61 0.36 Oikopleura spp. X 333 276 478 70.5 ± 0.6 10 0.03 0.08 Oithona spp. C (I-III) 376 323 510 98.0 ± 1.4 22 2.87 0.34 Microsetella norvegica M F C 385 286 755 99.1 ± 1.1 20 0.78 0.02 Podon polyphemoides X 398 280 637 30.3 ± 35.2 8 0.30 1.74 Oncaea waldemari M F C 400 318 599 91.6 ± 5.6 22 10.13 4.41 Cyclopina ensifera M F C 421 380 588 93.5 ± 4.7 15 0.12 0.09 Monothula (Oncaea) subtilis M F C 428 306 537 97.0 ± 1.4 20 0.79 0.13 Podon intermedius X 436 292 649 100 8 <0.01 <0.01 Unidentified copepodsa) C (I-III) 446 343 954 95 ± 2.7 23 3.27 0.95 Euterpina acutifrons M F C 456 337 686 90.1 ± 9.4 22 4.06 0.86 Oithona nana M F C 492 412 674 85.8 ± 9.5 23 13.87 8.73 Evadne tergestina X 508 443 571 0.5 ± 0.5 7 0.03 0.21 Evadne spinifera X 536 431 666 17.3 ± 44.3 5 <0.01 0.02 Corycaeus brehmi M F C 562 353 1049 80.4 ± 19.4 20 0.04 0.08 Acartia spp. C (I-III) 592 390 815 83.7 ± 12.3 21 4.85 4.41 Penilia avirostris X 606 531 676 20.1 ± 42.5 14 0.65 5.29 Diaixis pigmoea M F C 632 573 779 32.8 ± 51.0 4 <0.01 0.01 Oithona similis M F C 654 517 852 83.2 ± 8.2 18 0.60 0.71 Temora stylifera M F C 666 549 1392 39.2 ± 45.1 9 0.09 0.58 Paracalanus parvus M F C 683 568 971 50.0 ± 14.5 23 3.70 13.05 Calocalanus styliremis M F C 683 666 716 77.7 ± 19.1 5 <0.01 0.01 Acartia margalefi M F C 691 648 720 66.0 ± 16.5 8 0.05 0.11 Centropages ponticus M F C 744 599 1171 36.4 ± 19.0 13 0.93 3.59 Clausocalanus furcatus M F C 788 663 1093 43.9 ± 16.6 9 0.19 0.90 Evadne nordmanni X 806 592 1235 0.4 ± 0.7 5 0.01 0.09 Labidocera brunescens M F C 807 575 1352 44.2 ± 53.2 6 <0.01 0.01 Oithona plumifera M F C 879 627 1344 65.4 ± 16.0 10 0.04 0.10 Acartia tonsa M F C 896 689 1065 21.4 ± 13.1 12 4.92 30.59 Clausocalanus jobei M F C 997 768 1357 5.0 ± 6.7 7 0.03 0.24 Temora longicornis M F C 1008 446 1528 27.8 ± 40.7 11 0.01 0.08 Acartia clausi M F C 1049 688 1369 15.5 ± 11.1 23 1.10 7.26 Centropages typicus M F C 1093 696 1694 45.0 ± 33.5 9 0.01 0.08 Pseudocalanus elongatus M F C 1109 804 1390 19.8 ± 34.6 8 0.01 0.05 Ctenocalanus vanus M F C 1123 970 1213 34.0 ± 42.1 4 <0.01 0.02 Decapoda Caridea L 1865 1008 2076 1.0 ± 0.1 13 0.48 3.85 Decapoda Porcellanida L 1920 1250 2855 0.0 9 0.01 0.05 Calanus helgolandicus M F C 1991 1551 2809 39.4 ± 45.1 8 0.01 0.09 Decapoda Brachiura L 2348 1879 2756 0.0 22 0.27 2.20 Sagitta setosa X 2591 850 4243 73.2 ± 31.8 19 0.17 0.28 Fish L 3741 3008 4592 0.2 ± 0.0 13 0.01 0.05
Selectivity of plankton nets over mesozooplankton taxa 291
Fig. 1. Seasonal contributions of size fractions (defined according to length in µm) to total mesozooplankton abundance (left panel)and biovolume (right panel) in the Venice Lagoon as estimated A with a 80 µm net and B with a 200 µm net.
Fig. 2. Seasonal variations in the percentages of mesozooplankton abundance and biovolume lost through a 200 µm mesh net.
N. Riccardi 292
Abundance losses are not proportional to species
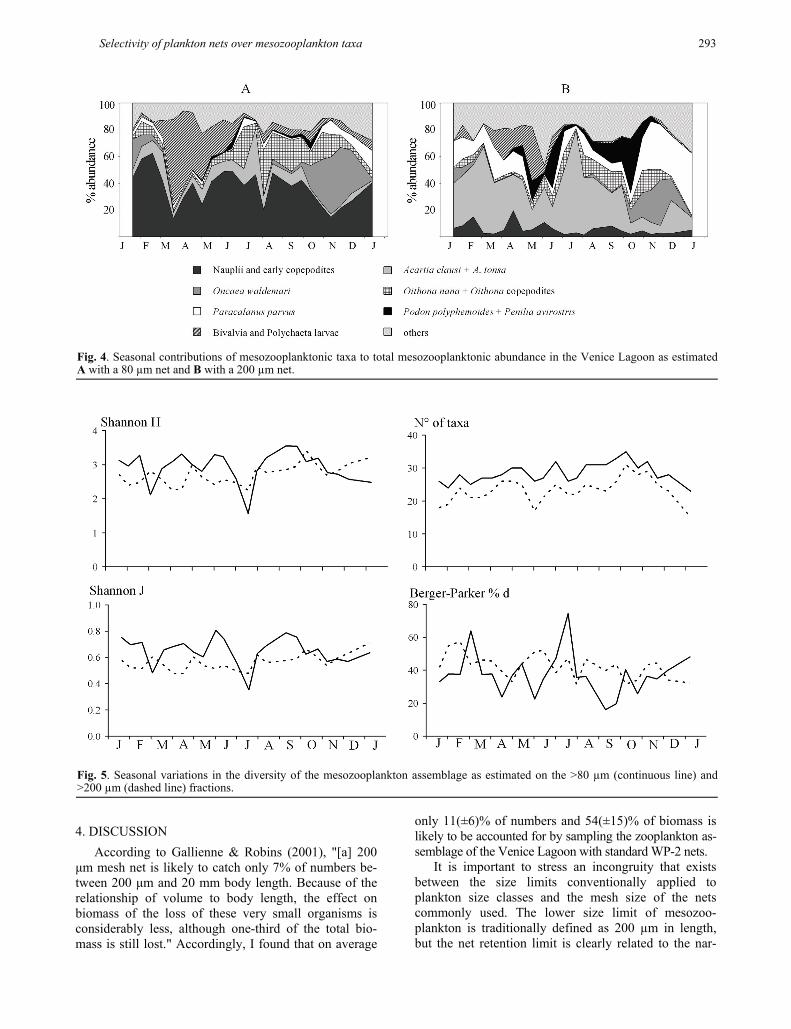
total abundance; rather, they vary seasonally as a func-tion of copepod and cladoceran population size struc-ture, i.e., the relative proportions of males and females and adults and juveniles. This is evidenced by the rela-tively high value of SD compared to the mean value of abundance lost by each taxon (Tab. 1) and by the lack of proportionality in the seasonal variations of densities in samples collected with 80 µm and 200 µm mesh nets, illustrated for the main taxa in figure 3. The effect of variable size-selective losses on species/populations is reflected by wide temporal variations in species compo-sition between the 80 µm and the 200 µm fraction. Not only is the dominant component of the 80 µm fraction (unidentified nauplii and post-naupliar individuals) reduced to negligible numbers in the 200 µm fraction, but the seasonal sequence of dominant species/taxa is substantially altered (Fig. 4). In the 80 µm fraction, the dominant species/taxa were polychaete and bivalve lar-vae in spring (March-May), O. nana in summer (June-September) and O. waldemari in autumn (October-De-cember), while in the 200 µm fraction Acartia clausi appeared to be dominant from January to May, Acartia tonsa from June to September and P. parvus in October-December.
Differences in species composition and relative fre-quency can be evidenced by comparing the diversity of the two series of samples. Figure 5 illustrates seasonal variations in richness (number of taxa) and diversity, measured using the Shannon (H and J) and Berger-Parker (%d) indexes. The reduction in the number of taxa in the 200 µm fraction results in a decrease in diversity as evidenced by the Shannon H index, which was generally lower in the larger than in the smaller fraction. Equitability was also generally lower in the larger fraction, but exceptions occurred in periods that were strongly dominated by small species/taxa, as revealed by the peaks of the Berger-Parker dominance index calculated for the 80 µm fraction. It is important to point out that the seasonal patterns of variation in the diversity indices for the two datasets were substantially different. In fact, the Shannon H value calculated for the 200 µm fraction ranged from –30% to +45% with respect to that of the 80 µm fraction, while the Berger-Parker value ranged from –60% to +58%. The Pearson correlation analysis was not significant (Pearson corre-lation analysis: Shannon H: r = 0.08, N = 23, P = 0.7; Shannon J: r = -0.01, N = 23, P = 0.9; Berger-Parker %d: r = 0.02, N = 23, P = 0.9), confirming that the diversity indices applied to the two datasets were not synchronous through time.
Fig. 3. Seasonal abundances of main zooplanktonic taxa in the >80 µm (continuous line) and >200 µm (dashed line) fractions.
Selectivity of plankton nets over mesozooplankton taxa 293
4. DISCUSSION According to Gallienne & Robins (2001), "[a] 200
μm mesh net is likely to catch only 7% of numbers be-tween 200 μm and 20 mm body length. Because of the relationship of volume to body length, the effect on biomass of the loss of these very small organisms is considerably less, although one-third of the total bio-mass is still lost." Accordingly, I found that on average
only 11(±6)% of numbers and 54(±15)% of biomass is likely to be accounted for by sampling the zooplankton as-semblage of the Venice Lagoon with standard WP-2 nets.
It is important to stress an incongruity that exists between the size limits conventionally applied to plankton size classes and the mesh size of the nets commonly used. The lower size limit of mesozoo-plankton is traditionally defined as 200 µm in length, but the net retention limit is clearly related to the nar-
Fig. 4. Seasonal contributions of mesozooplanktonic taxa to total mesozooplanktonic abundance in the Venice Lagoon as estimatedA with a 80 µm net and B with a 200 µm net.
Fig. 5. Seasonal variations in the diversity of the mesozooplankton assemblage as estimated on the >80 µm (continuous line) and >200 µm (dashed line) fractions.
N. Riccardi 294
rower organism diameter (usually width). Gallienne & Robins (2001) stated that "a 200 µm mesh WP-2 net quantitatively samples organisms larger in width than ~270 µm," a value corresponding to ~880 µm in length based on their assumption of a 3:1 length-to-width ratio. For the lagoon organisms examined in this study, the mean length-to-width ratio was 3.6:1; consequently, a width ~270 µm corresponded to a length of ~970 µm. This value can reasonably be considered the lower size limit of lagoon organisms that can be quantitatively sampled with WP-2 nets. Since most of the dominant lagoon taxa fall below this value, it is not surprising that abundance patterns are portrayed in a completely differ-ent way when sampler mesh size changes.
If this study had followed the recommended stan-dard procedures for marine zooplankton sampling (UNESCO 1968; Sameoto et al. 2000), I would have agreed with previous studies affirming that the cope-pods Acartia spp. are the most abundant mesoplanktonic organisms in the Venice Lagoon (e.g., Comaschi 1977, 1987; Comaschi & Martino 1981; Socal et al. 1987; Comaschi & Dalla Palma 1988; Bianchi et al. 2003; Acri et al. 2004; Bandelj et al. 2008). All these studies agreed in identifying A. clausi and A. tonsa as the domi-nant components, while finding that P. parvus, Cen-tropages ponticus (previously reported as C. kroyeri), Temora longicornis and Oithona spp., with their con-siderably lower abundances, contribute to the composi-tion of the typical assemblage in euhaline areas. Accordingly, the present research shows that in the 200 µm fraction A. clausi and A. tonsa together accounted for 42% of mean annual abundance, followed by P. parvus (13%) and Oithona spp (10%), while C. ponticus (3.6%) and T. longicornis (0.1%) were less representa-tive of the lagoon assemblage than other taxa, such as Penilia avirostris and O. waldemari.
Like assemblage composition, total zooplankton abundance in the 200 µm fraction of the present study was similar to that reported by previous studies (Tab. 2). However, compared to the abundance observed in the 80 µm fraction, a difference as large as one order of magnitude is evident. The large difference observed is probably due to the loss of the smaller size classes through the 200 µm mesh size net, causing a 73% to 95% decrease in total abundance. This conclusion can be corroborated by comparing our data with those reported by a summer (August-September) sampling
campaign that employed a 45 µm mesh size net (So-rokin et al. 2002). In fact, the mean abundance values reported by Sorokin et al. (2002) for the area around Murano are of the same order of magnitude as those I measured in summer-autumn.
The percentage of abundance lost through the coarser net was higher in spring and autumn than in winter and summer (Tab. 2), reflecting seasonal changes in the dominant taxa and, consequently, in the size structure of the assemblage. Beside nauplii, which con-tributed an average of 30% to total abundance losses over the year, the small larval component (lamelli-branchs and polychaetes) contributed a further 30% in spring and O. waldemari alone contributed around 40% in autumn.
The fine mesh dataset obtained by this study sub-stantially alters our perception of species abundances compared to previously published work on the zoo-plankton assemblage in the Venice Lagoon. Overall, copepod nauplii were the most abundant component of the holoplanktonic assemblage, followed by O. nana and O. waldemari; the meroplanktonic component was also very important in the Venice Lagoon, with lamelli-branch, gastropod and polychaete larvae being dominant during the spring months. Other important copepod spe-cies observed in the lagoon include Oncaea (Mono-thula) (Böttger-Schnack & Huys 2001) subtilis, which can be dominant in winter, and Euterpina acutifrons, which is very abundant in late summer-autumn. All these species/taxa have never been thought to be important in the lagoon of Venice because less than 10% of their numbers was collected with conventional sampling nets. Beside the above-mentioned dominant taxa, other organisms were almost completely missed when using coarse net sampling, e.g., the harpacticoid copepod Microsetella norvegica, the cladoceran Podon intermedius and the larval stages of appendicularians. Consequently, species richness has also been underes-timated by previous research, contributing to an errone-ous assessment of diversity. Our data suggest that this underestimation of species richness is not negligible, since 7% to 35% of the species present in the fine net samples were likely to be missing in the coarse net samples.
Under-representation of many dominant taxa was probably one reason for the lack of effort dedicated to their taxonomy. For example, the genera Oithona and Oncaea were not identified to species level in previ-
Tab. 2. Comparison between the median values of total zooplankton density (ind m-3) in the periods 1975-1979 and 1997-2002 (Acri et al. 2004; samples collected by 200 µm mesh size net) and in 1995 (this study; samples collected by80 µm mesh size net and relative values estimated for a 200 µm mesh size net).
winter spring summer autumn Authors 200 µm 80 µm 200 µm 80 µm 200 µm 80 µm 200 µm 80 µm
1975 - 1979 1339 - 6335 - 5263 - 3183 - Acri et al. 20041997 - 2002 59 - 928 - 1287 - 135 - Acri et al. 20041995 389 2884 530 9257 3782 38088 1865 22981 this study loss (%) 88 93 86 91 this study
Selectivity of plankton nets over mesozooplankton taxa 295
ously published work. One exception is the study by Sorokin et al. (2002), which used a 45 µm mesh net and identified Oncaea subtilis (Monothula subtilis), O. media (probably O. waldemari) and O. nana as domi-nant components of the summer lagoon assemblage.
Although underestimating species richness is the most obvious (and expected) effect of mesh size enlargement, it is not the only, and perhaps not the most serious, risk. In fact, I observed a lack of proportionality between the patterns of diversity calculated from the two datasets. I therefore disagree with Villate (1991), who observed that despite underestimates of the smaller species in the coarse fraction, seasonal abundance pat-terns were similar to those in the fine fraction. On the contrary, it seems important to stress that not only are absolute numbers underestimated, but seasonal abun-dance patterns and community changes cannot be expected to be depicted equally by both sampling nets. I must therefore conclude that, unsurprisingly, neither the absolute nor the relative estimates obtained using WP-2 net counts can be considered reliable.
A failure to adequately sample the smaller fraction is not only significant in terms of species distribution and biomass but can have still greater effects on the meas-urement of rates and processes, with consequent impacts on biogeochemical and food-web models (Gallienne & Robins 2001; Turner 2004). Therefore, improved esti-mates of the actual components of mesozooplankton are urgently needed to further our understanding of ecologi-cal processes and to verify hypotheses and interpreta-tions based on severely biased data. Since the impor-tance of small copepods in the Venice Lagoon has been largely underestimated until now, previous conclusions about zooplankton-mediated fluxes need to be re-evalu-ated based on a more reliable assessment of this compo-nent.
In conclusion, this study contributes to increasing awareness of the inadequacy of conventional sampling methods in producing reliable data, which are essential for forming and testing hypotheses (Greene 1990; Galli-enne & Robins 2001).
Reliable data on the mesozooplankton assemblage is essential to our understanding of ecological processes, and is also important in view of the recent European Directives which require both the definition of the typology of water bodies and the identification of refer-ence conditions for each of the typology classes. On the one hand, "the description of phytoplankton and zoo-plankton communities and their seasonal and geo-graphical variability is specifically requested for the initial assessment of the environmental status of marine waters in the EU Marine Strategy Framework Direc-tive", as pointed out by Bandelj et al. (2008). On the other hand, studies which combine chemical and bio-logical parameters to define quality standards and refer-ence terms are being stimulated by new regulations enforced by water conservation authorities. As an
example, a model for the Venice Lagoon was developed by Bandelj et al. (2008) to provide an "ideal representa-tion of the plankton assemblage which […] can also be used as a reference term to identify and evaluate anomalous situations, as required by the implementation of the EU Water Framework Directive." Providing eco-system modelers with reliable descriptions of the tem-poral and spatial patterns of zooplankton abundance is both a challenge and a responsibility.
ACKNOWLEDGEMENTS This work was made possible by a University of
Venice postdoctoral grant to N. Riccardi. UNESCO-ROSTE (Venice Regional Office, A. Marzollo) pro-vided the boat used for sampling. I am grateful to R. Böttger-Schnack (Institut für Meereskunde-Kiel) for the identification of Oncaea specimens. I would like to thank O. Ravera, A. Marchetto (CNR-ISE, Verbania Pallanza) and G. Rossetti (University of Parma) for their constructive comments on drafts of this manuscript and Elisa Peters for the English revision. I also tank the reviewers for substantially improving the manuscript.
REFERENCES Acri, F., F. Bernardi Aubry, A. Berton, F. Bianchi, A. Boldrin,
E. Camatti, A. Comaschi, S. Rabitti & G. Socal. 2004. Plankton communities and nutrients in the Venice Lagoon. Comparison between current and old data. J. Mar. Sys., 51: 321-329.
Bakus, G.J. 1990. Quantitative ecology and marine biology. Balkema A.A., Rotterdam, The Netherlands: 157 pp.
Bandelj, V., G. Socal, Y.-S. Park, S. Lek, J. Coppola, E. Ca-matti, E. Capuzzo, L. Milani & C. Solidoro. 2008. Analy-sis of multitrophic plankton assemblages in the Lagoon of Venice. Mar. Ecol. Prog. Ser., 368: 23-40.
Banse, K. 1962. Net zooplankton and total zooplankton. Rapp. P.-V. Reun. Cons. Int. Explor. Mer., 153: 211-215.
Bianchi, F., F. Acri, F. Bernardi Aubry, A. Berton, A. Boldrin, E. Camatti, D. Cassin & A. Comaschi. 2003. Can plankton communities be considered as bio-indicators of water quality in the Lagoon of Venice? Mar. Pollut. Bull., 46: 964-971.
Böttger, R. & D. Schnack. 1986. On the effect of formaldeide fixation on the dry weight of copepods. Meeresforschung, 31: 141-152.
Böttger-Schnack, R. & R. Huys. 2001. Taxonomy of Oncaei-dae (Copepoda, Poecilostomatoida) from the Red Sea. III. Morphology and phylogenetic position of Oncaea subtilis Giesbrecht, 1892. Hydrobiologia, 453/454: 467-481.
Bottrell, H.H., A. Duncan , Z.M. Gliwicz , E. Grygierek, A. Herzing, A. Hillbricht-Ilkowaska, P. Larsson & T. Weglenska. 1976. A review of some problems in zoo-plankon production studies. Norw. J. Zool., 4: 419-456.
Calbet, A., S. Garrido, E. Saiz, M. Alcaraz & C.M. Duarte. 2001. Annual zooplankton succession in coastal NW Mediterranean waters: the importance of the smaller size fractions. J. Plankton Res., 23: 319-331
Colton, J.B. Jr., J.R. Green, R.R. Byron & J.L. Frisella. 1980. Bongo net retention rates as affected by towing speed and mesh size. Can. J. Fish. Aquat. Sci., 37: 606-623.
Comaschi, A. 1977. Osservazioni qualitative sullo zooplan-cton nella Laguna di Venezia Novembre 1971 - Novembre 1972. Atti Ist. Veneto Sci., 136: 13-31.
Comaschi, A. 1987. Studio di popolazioni di Copepodi plan-ctonici nel bacino settentrionale della Laguna di Venezia.
N. Riccardi 296
Giugno 1977 – Giugno 1978. Arch. Oceanogr. Limnol., 21: 1-17.
Comaschi, A. & M. Dalla Palma. 1988. Studio di popolazioni di Copepodi planctonici nel bacino centrale della laguna veneta. Agosto 1979 - settembre 1980. Arch. Oceanogr. Limnol., 21: 73-93.
Comaschi, A. & E. Martino. 1981. Ciclo annuale dei copepodi planctonici e loro distribuzione nel bacino settentrionale della Laguna di Venezia. Maggio 1975 - Luglio 1976. Arch. Oceanogr. Limnol., 20: 91-111.
de Bernardi, R. 1984. Methods for the estimation of zoo-plankton abundance. Ch. 3 In: Downing, J.A. &, F.H. Rigler (Eds), A Manual on Methods for the Assessment of Secondary Productivity in Fresh Waters. IBP Handbook 17. Blackwell, Oxford: 59-86 pp.
Fulton, R.S. III. 1984. Distribution and community structure of estuarine copepods. Estuaries, 7: 38-50.
Gallienne, C.P. & D.B. Robins. 2001. Is Oithona the most im-portant copepod in the world's oceans? J. Plankton Res., 23: 1421-1432.
Greene, C.H. 1990. A brief review and critique of zooplankton sampling methods: Copepodology for the larval ecologist. Ophelia, 32: 109-113.
Halliday, N.C. 2001. A comparison of morphometric and geometric methods for estimation of individual zooplank-ton volumes. Sarsia, 86: 101-105.
Hernroth, L. 1987. Sampling and filtration efficiency of two commonly used plankton nets. A comparative study of the Nansen net and the Unesco WP 2 net. J. Plankton Res., 9: 719-728.
Hopcroft, R.R., J.C. Roff & D. Lombard. 1998. Production of tropical copepods in Kingston Harbour, Jamaica: the im-portance of small species. Mar. Biol., 130: 593-604.
Hwang, J.-S., R. Kumar, H.-U. Dahms, L.-C. Tseng & Q.-C. Chen. 2007. Mesh size affects abundance estimates of Oithona spp. (Copepoda, Cyclopoida). Crustaceana, 80: 827-837.
Jamet, J.-L., G. Bogé, S. Richard, C. Geneys & D. Jamet. 2001. The zooplankton community in bays of Toulon area (northwest Mediterranean Sea, France). Hydrobiologia, 457: 155-165.
Magurran, A.E. 1988. Ecological diversity and its measure-ment. Croom Helm Ltd., London, U.K.: 179 pp.
May, R.M. 1975. Patterns of species abundance and diversity. In: Cody, M.L. & J.M. Diamond (Eds), Ecology and Evo-lution of Communities. Harvard University Press, Cam-bridge, MA : 81-120.
Nichols, J.H. & A.B. Thompson. 1991. Mesh selection of co-pepodite and nauplius stages of four calanoid copepod species. J. Plankton Res., 13: 661-671.
Patriti, G. 1984. Remarques sur la structuration des popula-tions zooplanctoniques dans la zone de l'émissaire de-Marqeille-Cortiou. Mar. Biol., 82: 157-166.
Pitois, S.G., M. Shaw, C.J. Fox & C.L.J. Frid. 2009. A new fine-mesh zooplankton time series from the Dove sam-pling station (North Sea). J. Plankton Res., 31: 337-343.
Ravera, O. 2000. The lagoon of Venice: the result of both natural factors and human influence. J. Limnol., 59: 19-30.
Sameoto, D., P.H. Wiebe, J. Runge, L. Postel, J. Dunn, C. Miller & S. Coombs. 2000. Collecting zooplankton. In: Harris, R.P., P.H. Wiebe, J. Lenz, H.R. Skjoldal & M. Huntley (Eds), ICES Zooplankton Methodology Manual. Academic Press, London/San Diego: 55-81.
Saville, A. 1958. Mesh selection in plankton nets. J. Cons. Perm. Int. Explor. Mer., 23: 192.
Socal, G., F. Bianchi, A. Comaschi & F. Cioce. 1987. Spatial distribution of plankton communities along a salinity gra-dient in the Venice Lagoon. Arch. Oceanogr. Limnol., 21: 19-43.
Sorokin, P.Yu., Yu.I. Sorokin, O.Yu. Zakuskina & G.-P. Ravagnan. 2002. On the changing ecology of Venice la-goon. Hydrobiologia, 487: 1-18.
Turner, J.T. 1994. Planktonic copepods of Boston Harbour, Massachussets Bay and Cape Cod Bay, 1992. Hydro-biologia, 292/293: 405-414.
Turner, J.T. 2004. The importance of small planktonic cope-pods and their roles in pelagic marine food webs. Zoologi-cal Studies, 43: 255-266.
UNESCO. 1968. Zooplankton Sampling Monographs on Oceanographic Methodology. N. 2. UNESCO Press, Paris: 174 pp.
Uye, S.I. 1994. Replacement of large copepods by small ones with eutrophication of embayments: cause and conse-quence. Hydrobiologia, 292/293: 513-519.
Vannucci, M. 1968. Loss of organisms through the meshes. In: Tranter, D.J. (Ed.), Zooplankton Sampling Monographs on Oceanographic Methodology. N. 2. UNESCO Press, Paris: 77-86.
Vasilyeva, Yu.V., A.F. Pasternak & A.G. Timonin. 2009. Role of the small-size fraction of mesozooplankton in the pe-lagic community of the northeastern part of the Black Sea in the autumn. Oceanology, 49: 480-487.
Villate, F. 1991. Annual cycle of zooplankton community in the Abra Harbour (Bay of Biscay): abundance, composi-tion and size spectra. J. Plankton Res., 13: 691-706.
Williams, R. & D.B. Robins. 1982. Effects of preservation on wet weight, dry weight, nitrogen and carbon contents of Calanus helgolandicus (Crustacea: Copepoda). Mar. Biol., 71: 271-281.
Received: February 2010 Accepted: May 2010
Copyright © 2022 FDOKUMEN