Dimethylated sulfur compounds in seawater, seston and mesozooplankton in the seas around Turkey
19
Deep-Sea Research I 51 (2004) 1179–1197 Dimethylated sulfur compounds in seawater, seston and mesozooplankton in the seas around Turkey S. Besiktepe a, *, K.W. Tang b,1 , M. Vila c , R. Sim ! o c a Institute of Marine Sciences, Middle East Technical University, 33731 Erdemli-Mersin, Turkey b Danish Institute for Fisheries Research, Charlottenlund, Denmark c Institut de Ci " encies del Mar, CMIMA-CSIC Pg. Mar ! ıtim de la Barceloneta, 37-49 08003 Barcelona, Catalonia, Spain Received 11 July 2003; accepted 20 May 2004 Abstract The spatial distribution of dimethylated sulfur compounds among particulate, dissolved matter and mesozooplank- ton in the Black, Marmara, Aegean and NE Mediterranean Seas were studied during October 2000. The surface concentration of particulate dimethylsulfoniopropionate (DMSP p ) ranged from 5.4 (NE Mediterranean Sea) to 51.3 nM (Marmara Sea), and dimethylsulfoxide (DMSO p ) from 0.8 (NE Mediterranean Sea) to 6.2 nM (Marmara Sea). Total particulate DMSP and DMSO concentrations from the depth of fluorescence maximum were comparable to or lower than those at the surface. Most of the particulate DMSP and DMSO were associated with particles o18 mm. The dissolved dimethylsulfide (DMS)+DMSP d pool in surface waters varied from a minimum of 5 nM in the NE Mediterranean Sea to a maximum of 17 nM in the Marmara Sea. Values of DMS:chlorophyll a (Chl-a), DMSP p :Chl-a and DMSO p :Chl-a ratios were lower in productive surface waters of the Black Sea and the Marmara Sea than in the oligotrophic waters of the Aegean and NE Mediterranean. None of the dimethylated sulfur compounds correlated significantly with Chl-a in the Black Sea. On the other hand, significantly negative correlation between Chl-a and DMSP p was found in surface waters of Aegean and NE Mediterranean Seas (data from the two seas were combined). We also found no significant correlations between the distribution of any particulate or dissolved dimethylated sulfur compounds and the abundance of mesozooplankton. Mesozooplankton constituted only p5% of the total particulate DMSP in the water column. A preliminary estimate for average flux of dimethyl sulfide from the NE Mediterranean basin (including the Black Sea) to the atmosphere is 17.6 mmol m 2 d 1 , indicating the potential importance of NE Mediterranean basin as a source of biogenic sulfur to the atmosphere, even in the less productive period. r 2004 Elsevier Ltd. All rights reserved. Keywords: Dimethylsulfoniopropionate; Dimethylsulfide; Mesozooplankton; Black Sea; Mediterranean Sea; Emission flux 1. Introduction Dimethylsulfide (DMS) is the most abundant volatile sulfur compound in the surface ocean. It makes the largest contribution to biogenic sulfur emissions from the ocean, and forms ARTICLE IN PRESS *Corresponding author. Fax: +90-324-521-2327. E-mail addresses: [email protected] (S. Besiktepe), [email protected] (K.W. Tang), [email protected] (R. Sim ! o). 1 Current address: Virginia Institute of Marine Science, Gloucester Point, VA 23062, USA. 0967-0637/$ - see front matter r 2004 Elsevier Ltd. All rights reserved. doi:10.1016/j.dsr.2004.05.008
Transcript of Dimethylated sulfur compounds in seawater, seston and mesozooplankton in the seas around Turkey
ARTICLE IN PRESS
Deep-Sea Research I 51 (2004) 1179–1197
*Correspond
E-mail addr
kamtang@vims
(R. Sim !o).1Current ad
Gloucester Poin
0967-0637/$ - se
doi:10.1016/j.ds
Dimethylated sulfur compounds in seawater, seston andmesozooplankton in the seas around Turkey
S. Besiktepea,*, K.W. Tangb,1, M. Vilac, R. Sim !oc
a Institute of Marine Sciences, Middle East Technical University, 33731 Erdemli-Mersin, TurkeybDanish Institute for Fisheries Research, Charlottenlund, Denmark
c Institut de Ci"encies del Mar, CMIMA-CSIC Pg. Mar!ıtim de la Barceloneta, 37-49 08003 Barcelona, Catalonia, Spain
Received 11 July 2003; accepted 20 May 2004
Abstract
The spatial distribution of dimethylated sulfur compounds among particulate, dissolved matter and mesozooplank-
ton in the Black, Marmara, Aegean and NE Mediterranean Seas were studied during October 2000. The surface
concentration of particulate dimethylsulfoniopropionate (DMSPp) ranged from 5.4 (NE Mediterranean Sea) to
51.3 nM (Marmara Sea), and dimethylsulfoxide (DMSOp) from 0.8 (NE Mediterranean Sea) to 6.2 nM (Marmara Sea).
Total particulate DMSP and DMSO concentrations from the depth of fluorescence maximum were comparable to or
lower than those at the surface. Most of the particulate DMSP and DMSO were associated with particles o18 mm. Thedissolved dimethylsulfide (DMS)+DMSPd pool in surface waters varied from a minimum of 5 nM in the NE
Mediterranean Sea to a maximum of 17 nM in the Marmara Sea. Values of DMS:chlorophyll a (Chl-a), DMSPp:Chl-a
and DMSOp:Chl-a ratios were lower in productive surface waters of the Black Sea and the Marmara Sea than in the
oligotrophic waters of the Aegean and NE Mediterranean. None of the dimethylated sulfur compounds correlated
significantly with Chl-a in the Black Sea. On the other hand, significantly negative correlation between Chl-a and
DMSPp was found in surface waters of Aegean and NE Mediterranean Seas (data from the two seas were combined).
We also found no significant correlations between the distribution of any particulate or dissolved dimethylated sulfur
compounds and the abundance of mesozooplankton. Mesozooplankton constituted only p5% of the total particulate
DMSP in the water column. A preliminary estimate for average flux of dimethyl sulfide from the NE Mediterranean
basin (including the Black Sea) to the atmosphere is 17.6 mmolm�2 d�1, indicating the potential importance of NE
Mediterranean basin as a source of biogenic sulfur to the atmosphere, even in the less productive period.
r 2004 Elsevier Ltd. All rights reserved.
Keywords: Dimethylsulfoniopropionate; Dimethylsulfide; Mesozooplankton; Black Sea; Mediterranean Sea; Emission flux
ing author. Fax: +90-324-521-2327.
esses: [email protected] (S. Besiktepe),
.edu (K.W. Tang), [email protected]
dress: Virginia Institute of Marine Science,
t, VA 23062, USA.
e front matter r 2004 Elsevier Ltd. All rights reserve
r.2004.05.008
1. Introduction
Dimethylsulfide (DMS) is the most abundantvolatile sulfur compound in the surface ocean. Itmakes the largest contribution to biogenicsulfur emissions from the ocean, and forms
d.
ARTICLE IN PRESS
S. Besiktepe et al. / Deep-Sea Research I 51 (2004) 1179–11971180
methanesulfonate and sulfate aerosols in theatmosphere, leading to the formation of cloudcondensation nuclei and thereby influencing cloudalbedo.The Eastern Mediterranean and adjacent seas
are under the influence of negative radiationbalance by backscattering because of sulfateaerosols (Charlson et al., 1991 cf. Kouvarakiset al., 2002). Studies on the seasonal variation ofatmospheric DMS and its oxidation products(non-sea salt sulfate (nss-SO4
=) and methanesulfo-nic acid (MSA)) over the Eastern MediterraneanSea suggest that there is an important, yetunidentified, marine biogenic contribution toatmospheric sulfur during summer time (Ganoret al., 2000; Kouvarakis and Mihalopoulos, 2002;Kouvarakis et al., 2002; Kubilay et al., 2002).Furthermore, Kubilay et al. (2002), based on airmass back trajectory and SeaWiFS data, suggestedthat the majority of MSA over Erdemli (Turkishcoast of the Eastern Mediterranean) is related tosummer blooms of coccolithophores, a prominentdimethylsulfoniopropionate (DMSP) producinggroup of phytoplankton, in the Black Sea (Coka-car et al., 2001). To fully understand the regionalsulfur biogeochemistry and climate processes,these atmospheric measurements need to be ana-lyzed in relation to the regional sea surfacedistribution of related sulfur compounds and theirproduction processes. Unfortunately, basic infor-mation such as the distribution of methylated sulfurcompounds in the Turkish seas is very limited.DMS is a breakdown product of DMSP, an
abundant cellular component in some marinephytoplankton taxa, particularly haptophytesand dinoflagellates (Keller et al., 1989). DMSP isfound ubiquitous in oceanic seston (Malin andKirst, 1997; Kiene et al., 2000) together with theoxidized form of DMS, dimethylsulfoxide(DMSO, Sim !o et al., 1998a; Sim !o and Vila, inpreparation). There is accumulating evidence thatunicellular algae synthesize DMSP from methio-nine, as a compatible solute, for its importantphysiological roles in osmoregulation, chemicalsignaling and excess sulfur regulation (Malin andKirst, 1997; Wolfe et al., 1997; Stefels, 2000).Although the intracellular production of DMSO isnot so well constrained, recent observations
indicate that DMSO, DMSP and DMS may allbe part of a radical scavenging system thatprotects the cell from reactive oxygen speciesunder oxidative stress (Sunda et al., 2002).The conversion of algal DMSP into volatile
DMS is not direct but tightly coupled with anumber of biochemical and trophic processes inthe water column (Sim !o et al., 2002), such asenzymatic activities (Stefel et al., 1995; Steinkeet al., 1998), bacterial activities (Kiene, 1992;Ledyard and Dacey, 1996), herbivorous andcarnivorous grazing (Dacey and Wakeham, 1986;Belviso et al., 1990; Kwint et al., 1996; Archeret al., 2001). Heterotrophic bacteria have thecapability of transforming DMSP to both DMSand non-DMS products, and therefore they play akey role in controlling the fate of DMSP once thiscompound is released from algal cells (Kiene et al.,2000; Sim !o, 2001). But in order to understand whyand how a small fraction only of the large amountsof DMSP produced in phytoplankton cells ends upas extracellular volatile DMS, the role of micro-and mesozooplankton has to be taken into account.If grazers do not accumulate or transform ingestedDMSP, they promote the release of undegradedDMSP into solution, thus making it more availableto bacteria (Archer et al., 2001, 2002; Sim!o et al.,2002; Tang and Sim!o, 2003). When grazing oncertain microalgae, however, herbivorous zooplank-ton facilitate the mixture of DMSP with algalDMSP-lyases that cleave it into DMS and acrylate(Wolfe et al., 1997). That is, in some cases grazersincrease the efficiency at which DMSP is convertedinto DMS. On the other hand, grazers that doaccumulate DMSP either in tissues or guts orvacuoles, transfer this DMSP to higher trophiclevels, thus uncoupling DMSP and DMS production(Tang et al., 1999, 2000a; Tang and Sim!o, 2003).There have been few studies of the contribution
of mesozooplankton to the pool of DMSP (DMSPin organisms) (Tang et al., 1999, 2000a) or itstransformation rates (Kwint and Kramer, 1995;Daly and DiTullio, 1996; Kwint et al., 1996;Levasseur et al., 1996; Tang et al., 1999, 2000a, b).In a coastal site, Tang et al. (2000a) observed thatmesozooplankton make up a significant pool ofparticulate DMSP at certain times and insignif-icant over the rest of the year.
ARTICLE IN PRESS
S. Besiktepe et al. / Deep-Sea Research I 51 (2004) 1179–1197 1181
We present data on the fall concentrations ofdissolved DMS and DMSP, particulate DMSPand DMSO in the Black, Marmara, Aegean andNE Mediterranean Seas, based on which weestimate the sea-to-air emission of DMS in theregion. In addition, we report DMSP concentra-tions in size-fractionated mesozooplankton andassess their contribution to the total dimethylatedsulfur in the water column.
2. Material and methods
Sampling concentrations of DMS, dissolvedDMSP (DMSPd), particulate DMSP (DMSPp),particulate DMSO (DMSOp) and DMSP in
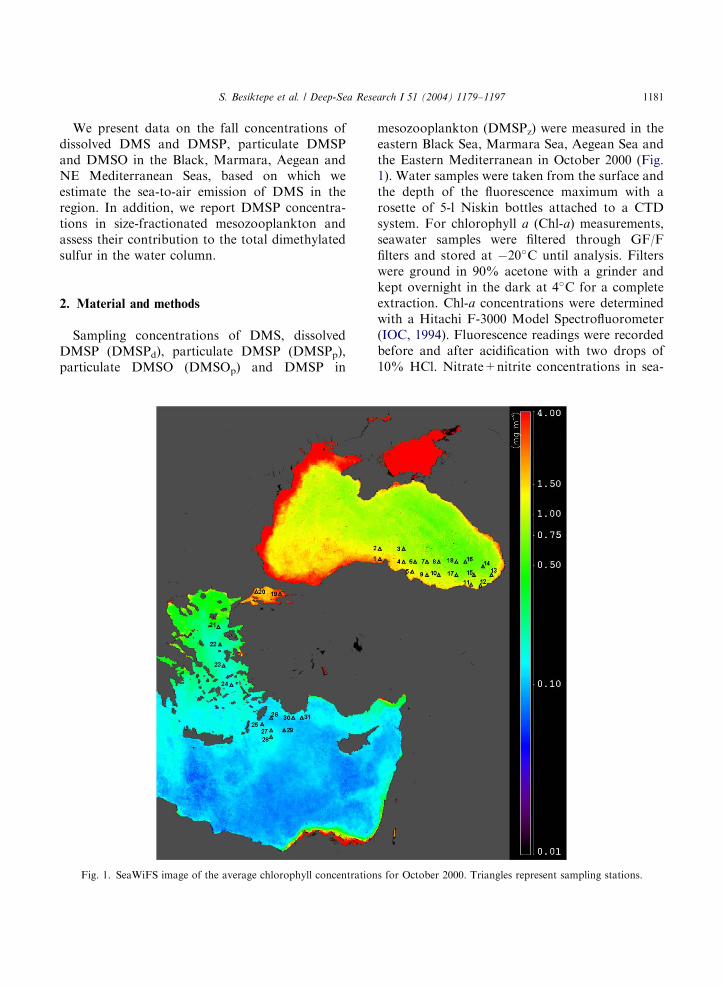
Fig. 1. SeaWiFS image of the average chlorophyll concentration
mesozooplankton (DMSPz) were measured in theeastern Black Sea, Marmara Sea, Aegean Sea andthe Eastern Mediterranean in October 2000 (Fig.1). Water samples were taken from the surface andthe depth of the fluorescence maximum with arosette of 5-l Niskin bottles attached to a CTDsystem. For chlorophyll a (Chl-a) measurements,seawater samples were filtered through GF/Ffilters and stored at �20�C until analysis. Filterswere ground in 90% acetone with a grinder andkept overnight in the dark at 4�C for a completeextraction. Chl-a concentrations were determinedwith a Hitachi F-3000 Model Spectrofluorometer(IOC, 1994). Fluorescence readings were recordedbefore and after acidification with two drops of10% HCl. Nitrate+nitrite concentrations in sea-
s for October 2000. Triangles represent sampling stations.
ARTICLE IN PRESS
S. Besiktepe et al. / Deep-Sea Research I 51 (2004) 1179–11971182
water were determined with a Technicon Modeltwo-channel Autoanalyzer using the modifiedmethod of Strickland and Persons (1972).
2.1. Dissolved DMS, DMSP and DMSO
Seawater samples were transferred to 500-mlpre-washed glass vials. In all, 100ml of seawaterwas filtered by gentle pressure through 25mmWhatman GF/F filter. Filtrates forDMSPd+DMS measurements were immediatelytreated with 2ml of 10M NaOH in air-tight serumbottles. In parallel, 100-ml seawater filtrates weresparged on board for 15min with high puritynitrogen to remove the ambient DMS, then treatedwith NaOH in air-tight serum bottles to hydrolyzeDMSPd. All alkalinized samples were kept at�20�C for 6 months until they were analyzed by apurge-and-trap gas chromatographic method(Sim !o et al., 1996). Aliquots of 40ml were run induplicate. The DMS concentrations in the sampleswere calculated by subtracting the DMSPd fromDMSPd+DMS. The average difference betweenthe two amounts subtracted was 2673%, n ¼ 24;i.e. well above the average coefficient of variationbetween replicate analyses (471%, n ¼ 48). Thedetection limit was 12 pmol DMS, equivalent to aconcentration of 0.3 nM in a 40-ml aliquot.Because of time constraints, dissolved DMSOwas not measured.
2.2. Particulate DMSP and DMSO
A volume of 50ml of seawater was filteredgently through a GF/F filter with a syringe tocollect total DMSPp. Another 50-ml aliquot wasfirst passed through a 18-mm nylon sieve, and thenfiltered through a GF/F filter to collect DMSPp ofthe size fraction o18 mm. DMSPp filter sampleswere immediately transferred to cryogenic vialsand preserved in liquid nitrogen. The samples weretransported in abundant dry ice and stored at�75�C for 12 months until analysis. Total DMSOp
was determined in the same GF/F-retained parti-cles after removal of DMSPp and reduction withborohydride (Sim !o et al., 1998b).
2.3. DMSP in zooplankton
Zooplankton samples were collected by towinga Nansen net (70 cm mouth diameter with 200 mmmesh) from the depth of the fluorescence max-imum to the surface. Zooplankton from the firsttow were fractionated into different size classes(200–1000 and 1000–2000 mm) by filtering throughmesh filters; each size fraction was then collectedon GF/F filters and preserved in liquid nitrogen.The samples were transported in abundant dry iceand stored at �75�C for 12 months until DMSPanalysis. Zooplankton from the second tow werefractionated into the same size classes and eachsize class was subsampled into two: one subsamplewas preserved with 4% borax-buffered formalde-hyde for species identification, enumeration andbiovolume estimation under a stereomicroscopeand the second was collected on a pre-weighedGF/C filter and kept at �20�C. In the laboratory,zooplankton on GF/C filters were dried at 65�Cfor 24 h and weighed for dry weight. Spatialconcentration of DMSP associated with zooplank-ton (DMSPz) is the amount of DMSP attributed tozooplankton per unit volume of water. Weightspecific (DMSPz–B) zooplankton DMSP is theamount of DMSP attributed to zooplankton perunit dry weight. Assuming a cylindrical shape forthe zooplankton, we estimated their body volumebased on their linear dimensions, and the bodyconcentration of DMSP in zooplankton (DMSPz–v)is then estimated as DMSP per unit biovolume ofzooplankton.
3. Results
3.1. General characteristics of the waters of the
studied regions
The SeaWiFS derived surface Chl-a image (Fig.1) of the studied regions for monthly average ofOctober 2000 clearly shows the difference betweenthe productive waters of the Black Sea andoligotrophic waters of the Mediterranean Sea.The cruise track did not include stations in thevery high Chl-a areas, except in the Sea ofMarmara (Table 1). Fig. 2 shows temperature,
ARTICLE IN PRESS
S. Besiktepe et al. / Deep-Sea Research I 51 (2004) 1179–1197 1183
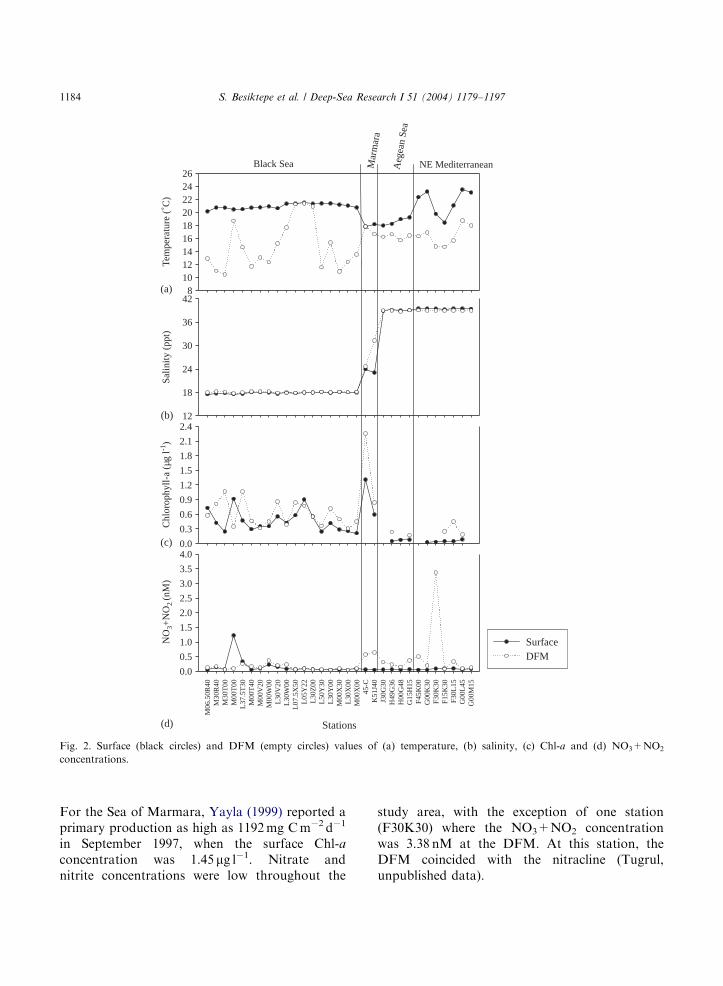
salinity, Chl-a and NO3+NO2 concentration fromthe surface and the depth of fluorescence max-imum (DFM) of the four interconnected seas. Seasurface temperature and salinity of the Black Seawere almost constant at all stations, at around21�C and 18, respectively. Temperature at theDFM varied between 10�C and 21�C. Note thatthe temperature at the subsurface maximum ofchlorophyll was almost equal to that at the surfaceat the few stations where the DFM occurredwithin the mixed layer. The Sea of Marmara andAegean Sea exhibited lower temperature andhigher salinity than the Black Sea. The salinity ofthe Marmara Sea clearly shows its transitionalposition between the low salinity waters of theBlack Sea and the highly saline waters of the
Table 1
Locations, sampling dates and surface temperature of the stations vis
Station no. Station name Latitude (E) Longitude (N)
1 M06.50R40 34.4 42.065
2 M30R40 34.4 42.3
3 M30T00 36 42.3
4 M00T00 36 42
5 L37.5T30 36.3 41.375
6 M00T40 36.4 42
7 M00V20 37.2 42
8 M00W00 38 42
9 L30V20 37.2 41.3
10 L30W00 38 41.3
11 L07.5� 50 39.50 41.075
12 L05Y22 40.22 41.05
13 L30Z00 41 41.3
14 L50Y30 40.3 41.5
15 L30Y00 40 41.3
16 M00� 30 39.3 42
17 L30� 00 39 41.3
18 M00� 00 39 42
19 45-C 29 40.46
20 K51J40 27.4 40.51
21 J30G30 25.3 39.3
22 H49G36 25.36 38.49
23 H00G48 25.48 38
24 G15H15 26.15 37.15
25 F45K00 28 35.45
26 G00K30 28.3 36
27 F30K30 28.3 35.3
28 F15K30 28.3 35.15
29 F30L15 29.15 35.3
30 G00L45 29.45 36
31 G00M15 30.15 36
Note: Wind speeds are also presented at the stations at which DMS
Aegean Sea. The temperature of NE Mediterra-nean varied between 14�C and 23�C, with asalinity of nearly 39. Chl-a concentrations weregenerally low during the cruise, varying between0.03 (NE Mediterranean) and 1.31 mg l�1 (Mar-mara) at the surface, and between 0.18 (NEMediterranean) and 2.25 mg l�1 (Marmara) at theDFM. The station with the highest Chl-a concen-tration, station 45-C in the Sea of Marmara, isunder the influence of domestic and industrialwastes, as well as productive waters from theBlack Sea via the Bosphorus Strait. Estimatedaverage primary production was low in theregions: 209, 179 and 127mg Cm�2 d�1 for theBlack Sea, Aegean Sea and NE Mediterraneanstations, respectively (Yilmaz, unpublished data).
ited during study period
Sampling date Surface temp. (�C) Wind speed (m s�1)
06.10.2000 20.17
06.10.2000 20.75 5
07.10.2000 20.72
08.10.2000 20.47
09.10.2000 20.52 9
09.10.2000 20.72
10.10.2000 20.8 12
10.10.2000 20.95
11.10.2000 20.65
11.10.2000 21.33
13.10.2000 21.35
13.10.2000 21.5 6
14.10.2000 2.32
14.10.2000 21.41
14.10.2000 21.4
15.10.2000 21.19
16.10.2000 21.04 8
16.10.2000 20.77 2
20.10.2000 17.82 20
21.10.2000 18.19 18
25.10.2000 18 13
25.10.2000 18.23 15
26.10.2000 18.98
26.10.2000 19.25
27.10.2000 22.36 1
27.10.2000 23.21
27.10.2000 19.78 1
28.10.2000 18.42 8
29.10.2000 21.09
29.10.2000 23.52
29.10.2000 23.07
concentrations were measured.
ARTICLE IN PRESS
Tem
pera
ture
(˚C
)
8101214161820222426
Salin
ity (
ppt)
12
18
24
30
36
42
SurfaceDFM
Chl
orop
hyll-
a (µ
g l-1
)
0.0
0.3
0.6
0.9
1.2
1.5
1.8
2.1
2.4
Stations
M06
.50R
40M
30R
40M
30T
00M
00T
00L
37.5
T30
M00
T40
M00
V20
M00
W00
L30
V20
L30
W00
L07
.5X
50L
05Y
22L
30Z
00L
50Y
30L
30Y
00M
00X
30L
30X
00M
00X
0045
-CK
51J4
0J3
0G30
H49
G36
H00
G48
G15
H15
F45K
00G
00K
30F3
0K30
F15K
30F3
0L15
G00
L45
G00
M15
NO
3+N
O2
(nM
)
0.0
0.5
1.0
1.5
2.0
2.5
3.0
3.5
4.0
Black Sea Mar
mar
a
NE MediterraneanAeg
ean
Sea
(a)
(b)
(c)
(d)
Fig. 2. Surface (black circles) and DFM (empty circles) values of (a) temperature, (b) salinity, (c) Chl-a and (d) NO3+NO2
concentrations.
S. Besiktepe et al. / Deep-Sea Research I 51 (2004) 1179–11971184
For the Sea of Marmara, Yayla (1999) reported aprimary production as high as 1192mg Cm�2 d�1
in September 1997, when the surface Chl-aconcentration was 1.45 mg l�1. Nitrate andnitrite concentrations were low throughout the
study area, with the exception of one station(F30K30) where the NO3+NO2 concentrationwas 3.38 nM at the DFM. At this station, theDFM coincided with the nitracline (Tugrul,unpublished data).
ARTICLE IN PRESS
S. Besiktepe et al. / Deep-Sea Research I 51 (2004) 1179–1197 1185
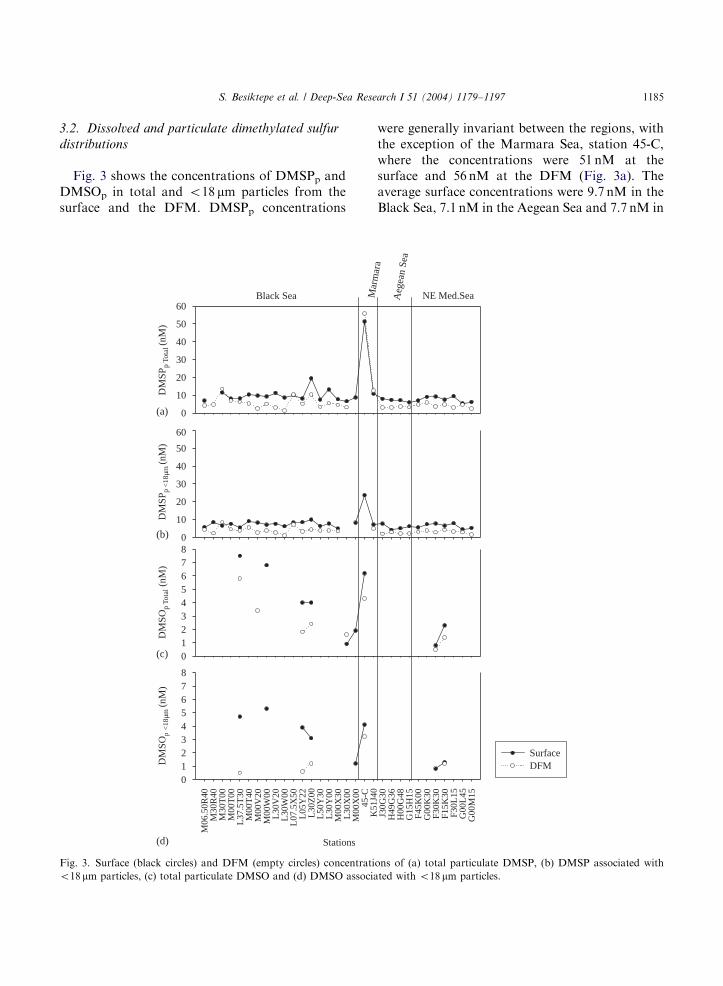
3.2. Dissolved and particulate dimethylated sulfur
distributions
Fig. 3 shows the concentrations of DMSPp andDMSOp in total and o18 mm particles from thesurface and the DFM. DMSPp concentrations
DM
SPp
Tota
l (nM
)
0
10
20
30
40
50
60
DM
SPp
<18
µm (n
M)
0
10
20
30
40
50
60
Black Sea
(a)
(b)
DM
SOp
Tota
l (nM
)
012345678
Stations
M06
.50R
40M
30R
40M
30T
00M
00T
00L
37.5
T30
M00
T40
M00
V20
M00
W00
L30
V20
L30
W00
L07
.5X
50L
05Y
22L
30Z
00L
50Y
30L
30Y
00M
00X
30L
30X
00M
00X
0045
-C
DM
SOp
<18
µm (n
M)
012345678
(c)
(d)
Fig. 3. Surface (black circles) and DFM (empty circles) concentrati
o18 mm particles, (c) total particulate DMSO and (d) DMSO associa
were generally invariant between the regions, withthe exception of the Marmara Sea, station 45-C,where the concentrations were 51 nM at thesurface and 56 nM at the DFM (Fig. 3a). Theaverage surface concentrations were 9.7 nM in theBlack Sea, 7.1 nM in the Aegean Sea and 7.7 nM in
SurfaceDFM
Mar
mar
a
Aeg
ean
Sea
NE Med.Sea
K51
J40
J30G
30H
49G
36H
00G
48G
15H
15F4
5K00
G00
K30
F30K
30F1
5K30
F30L
15G
00L
45G
00M
15
ons of (a) total particulate DMSP, (b) DMSP associated with
ted with o18 mm particles.
ARTICLE IN PRESS
Table 2
DMS, dissolved DMSP (DMSPd) and particulate DMSP (DMSPp) and DMSO (DMSOp) (nM) and total Chl-a (mg l�1) concentrations(mean7standard deviation) from the surface and depth of fluorescence maximum (DFM) in the Black Sea, Marmara Sea, Aegean Sea
and Mediterranean Sea
Black Sea Marmara Sea Aegean Sea Mediterranean Sea
Surface DFM Surface DFM Surface DFM Surface DFM
DMSPp
Total 9.773.1 5.673.1 31.1728.6 34.15730.8 7.170.8 3.270.25 7.771.6 4.171.1
(6.6–19.5) (1.5–13.5) (10.8–51.3) (12.4–55.9) (6.0–7.9) (2.9–3.5) (5.4–9.5) (2.5–5.8)
n ¼ 17 n ¼ 17 n ¼ 2 n ¼ 2 n ¼ 4 n ¼ 4 n ¼ 7 n ¼ 7
o18 mm 7.471.4 4.171.8 15.4711.7 5.0 5.871.5 2.270.5 6.471.3 3.170.8
(4.9–9.9) (1.1–8.5) (7.1–23.7) (4.1–7.6) (1.9–2.9) (4.5–7.9) (1.5–4.1)
n ¼ 16 n ¼ 16 n ¼ 2 n ¼ 1 n ¼ 4 n ¼ 4 n ¼ 7 n ¼ 7
DMSOp
Total 4.272.4 3.471.6 6.2 4.3 — — 1.671.1 1.070.6
(0.9–7.5) (1.6–5.8) (0.8–2.3) (0.5–1.4)
n ¼ 6 n ¼ 6 n ¼ 1 n ¼ 1 n ¼ 2 n ¼ 2
o18 mm 3.271.3 0.870.3 4.1 3.2 — — 1.170.4 1.2
(1.2–5.3) (0.5–1.2) (0.8–1.3)
n ¼ 4 n ¼ 3 n ¼ 1 n ¼ 1 n ¼ 2 n ¼ 1
DMS 1.470.8 0.870.4 4.273.8 5.476.3 2.470.45 1.470.4 2.470.9 1.670.3
(0.6–2.6) (0.3–1.5) (1.5–7.0) (0.8–9.8) (2.1–2.7) (1.1–1.7) (1.5–3.3) (1.4–1.9)
n ¼ 6 n ¼ 6 n ¼ 2 n ¼ 2 n ¼ 2 n ¼ 2 n ¼ 3 n ¼ 2
DMSPd 7.272.56 3.672.5 7.772.8 9.678.0 9.274.1 3.770.86 5.772.2 2.671.03
(5.1–12.2) (0.9–7.7) (5.7–9.6) (4.1–15.3) (6.3–12.1) (3.1–4.3) (3.2–7.4) (1.4–3.3)
n ¼ 6 n ¼ 6 n ¼ 2 n ¼ 2 n ¼ 2 n ¼ 2 n ¼ 3 n ¼ 3
DMSPd+DMS 8.872.3 4.072.4 11.976.6 14.9714.3 8.773.9 4.770.9 7.271.7 3.570.8
(6.4–13.2) (1.7–8.0) (7.3–16.6) (4.8–25.1) (5.6–14.2) (4.0–6.0) (5.0–8.9) (2.9–4.7)
n ¼ 7 n ¼ 7 n ¼ 2 n ¼ 2 n ¼ 4 n ¼ 4 n ¼ 5 n ¼ 4
Chl-a 0.4670.22 0.670.25 0.9570.51 1.5571.0 0.0770.015 0.2170.05 0.05170.02 0.2970.14
(0.21–0.91) (0.31–1.1) (0.59–1.31) (0.84–2.25) (0.05–0.08) (0.17–0.24) (0.03–0.09) (0.18–0.45)
n ¼ 18 n ¼ 18 n ¼ 2 n ¼ 2 n ¼ 3 n ¼ 2 n ¼ 5 n ¼ 3
Note: Values in parenthesis are data range, n is the number of samples.
S. Besiktepe et al. / Deep-Sea Research I 51 (2004) 1179–11971186
the NE Mediterranean Sea (Table 2). In theMarmara Sea, only two stations were sampled,one (45-C) is under the domestic and industrialwastes and with high measurements of dimethy-lated sulfur compounds, and other is K51J40, itsdimethylated sulfur concentrations are within therange of the studied area. So, averaging these twostations may not represent well enough theconcentrations of dimethylated sulfur compoundsin the Marmara Sea. At the DFM, the DMSPpconcentrations were comparable to or lower
(down to half) than those at the surface, whereasChl-a levels were generally 1.2–8.8 times higher. Inthe Black and the Marmara Seas, the contributionof DMSPpo18 mm to the total DMSPp was around75% and 50% at the surface and the DFM,respectively (Fig. 3b). In the Aegean and theEastern Mediterranean Seas, around 80% of theDMSPp in surface waters was associated withparticles o18 mm, whereas at the DFM thecontribution of the smaller particles was nearly70%.
ARTICLE IN PRESS
S. Besiktepe et al. / Deep-Sea Research I 51 (2004) 1179–1197 1187
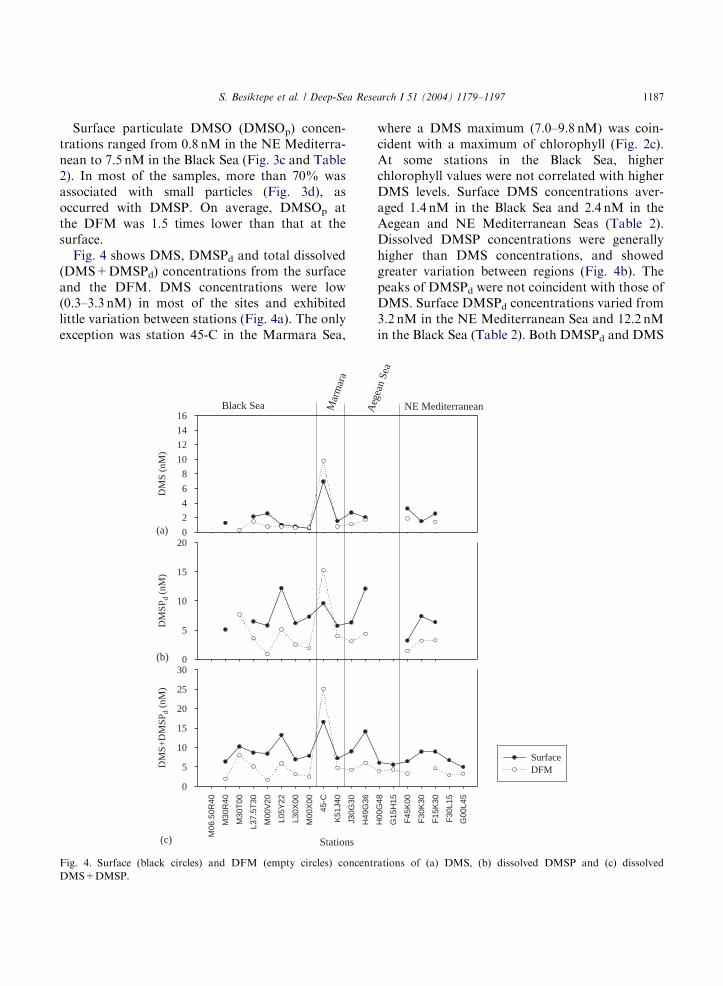
Surface particulate DMSO (DMSOp) concen-trations ranged from 0.8 nM in the NE Mediterra-nean to 7.5 nM in the Black Sea (Fig. 3c and Table2). In most of the samples, more than 70% wasassociated with small particles (Fig. 3d), asoccurred with DMSP. On average, DMSOp atthe DFM was 1.5 times lower than that at thesurface.Fig. 4 shows DMS, DMSPd and total dissolved
(DMS+DMSPd) concentrations from the surfaceand the DFM. DMS concentrations were low(0.3–3.3 nM) in most of the sites and exhibitedlittle variation between stations (Fig. 4a). The onlyexception was station 45-C in the Marmara Sea,
DM
SPd
(nM
)
0
5
10
15
20
DM
S (n
M)
0
2
4
6
8
10
12
14
16
Stations
M06
.50R
40
M30
R40
M30
T00
L37.
5T30
M00
V20
L05Y
22
L30X
00
M00
X00
45-C
K51
J40
J30G
30
H49
G36
DM
S+D
MSP
d (n
M)
0
5
10
15
20
25
30
Black Sea AMar
mar
a
(a)
(b)
(c)
Fig. 4. Surface (black circles) and DFM (empty circles) concentr
DMS+DMSP.
where a DMS maximum (7.0–9.8 nM) was coin-cident with a maximum of chlorophyll (Fig. 2c).At some stations in the Black Sea, higherchlorophyll values were not correlated with higherDMS levels. Surface DMS concentrations aver-aged 1.4 nM in the Black Sea and 2.4 nM in theAegean and NE Mediterranean Seas (Table 2).Dissolved DMSP concentrations were generallyhigher than DMS concentrations, and showedgreater variation between regions (Fig. 4b). Thepeaks of DMSPd were not coincident with those ofDMS. Surface DMSPd concentrations varied from3.2 nM in the NE Mediterranean Sea and 12.2 nMin the Black Sea (Table 2). Both DMSPd and DMS
H00
G48
G15
H15
F45
K00
F30
K30
F15
K30
F30
L15
G00
L45
SurfaceDFM
egea
n Se
a
NE Mediterranean
ations of (a) DMS, (b) dissolved DMSP and (c) dissolved
ARTICLE IN PRESS
S. Besiktepe et al. / Deep-Sea Research I 51 (2004) 1179–11971188
concentrations from the DFM were lower thanthose at the surface, except in the Marmara Sea.Total dissolved (DMS+DMSPd) concentrationsin surface waters varied from a minimum of 5 nMin the NE Mediterranean Sea (average 7.2 nM) toa maximum of 17 nM in the Marmara Sea (Fig. 4cand Table 2). Dissolved concentrations at theDFM ranged between 1.7 nM (Black Sea) and25.1 nM (Marmara), and were always lower thanthose at the surface with the exception of station45-C (Fig. 4c).Spearman rank correlation analysis was applied
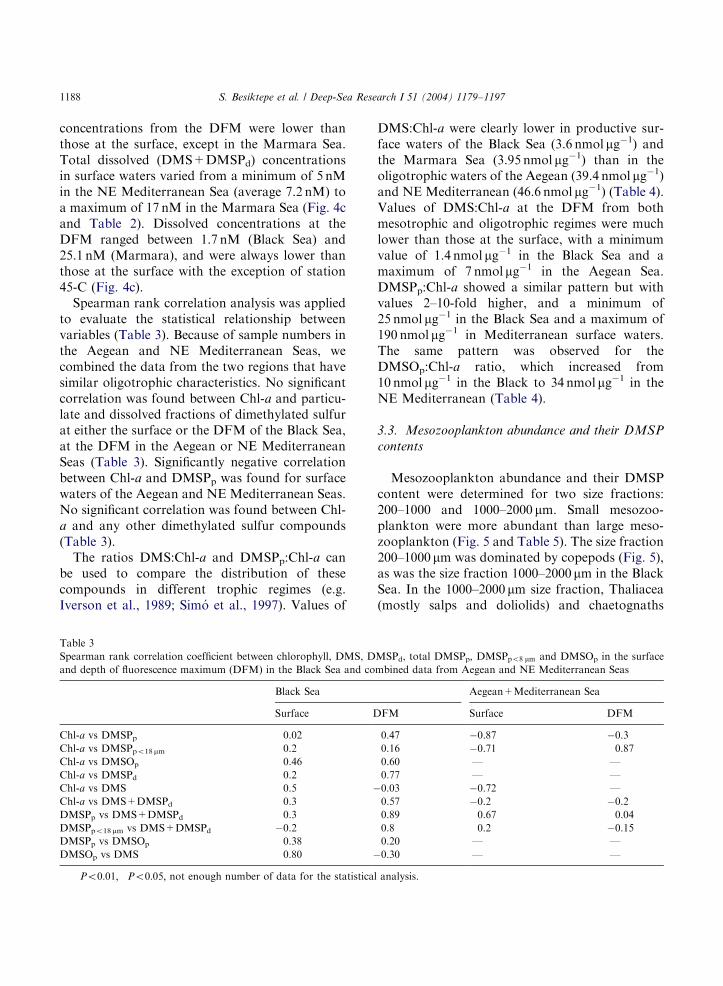
to evaluate the statistical relationship betweenvariables (Table 3). Because of sample numbers inthe Aegean and NE Mediterranean Seas, wecombined the data from the two regions that havesimilar oligotrophic characteristics. No significantcorrelation was found between Chl-a and particu-late and dissolved fractions of dimethylated sulfurat either the surface or the DFM of the Black Sea,at the DFM in the Aegean or NE MediterraneanSeas (Table 3). Significantly negative correlationbetween Chl-a and DMSPp was found for surfacewaters of the Aegean and NE Mediterranean Seas.No significant correlation was found between Chl-a and any other dimethylated sulfur compounds(Table 3).The ratios DMS:Chl-a and DMSPp:Chl-a can
be used to compare the distribution of thesecompounds in different trophic regimes (e.g.Iverson et al., 1989; Sim !o et al., 1997). Values of
Table 3
Spearman rank correlation coefficient between chlorophyll, DMS, D
and depth of fluorescence maximum (DFM) in the Black Sea and co
Black Sea
Surface D
Chl-a vs DMSPp 0.02
Chl-a vs DMSPpo18 mm 0.2
Chl-a vs DMSOp 0.46
Chl-a vs DMSPd 0.2
Chl-a vs DMS 0.5 �Chl-a vs DMS+DMSPd 0.3
DMSPp vs DMS+DMSPd 0.3
DMSPpo18 mm vs DMS+DMSPd �0.2DMSPp vs DMSOp 0.38
DMSOp vs DMS 0.80 �
��� Po0:01; �Po0:05; not enough number of data for the statistica
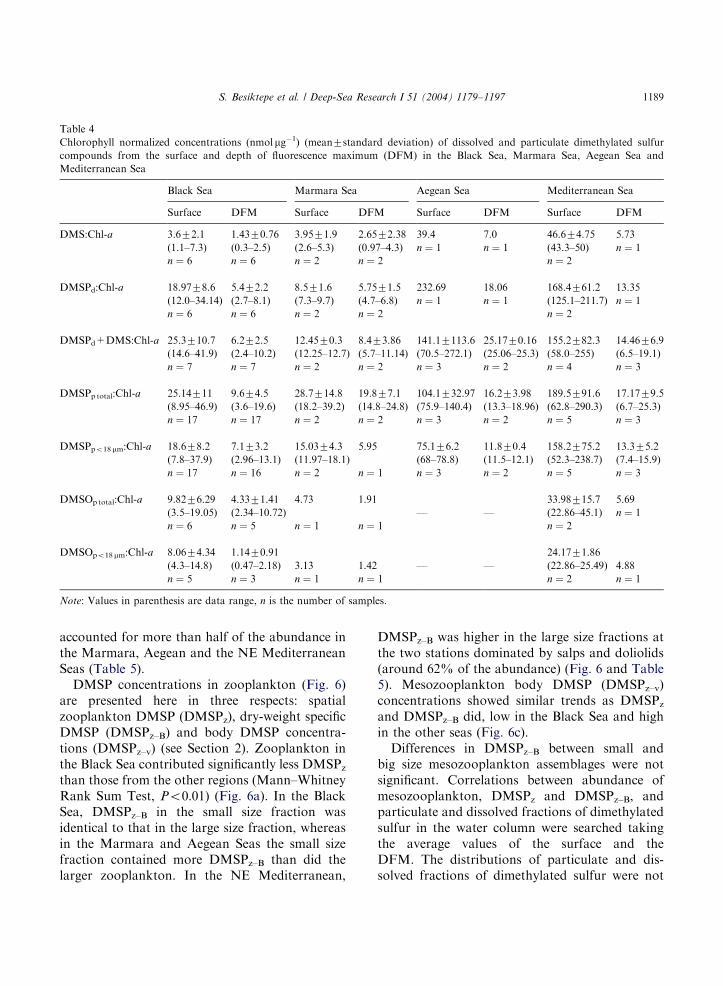
DMS:Chl-a were clearly lower in productive sur-face waters of the Black Sea (3.6 nmol mg�1) andthe Marmara Sea (3.95 nmol mg�1) than in theoligotrophic waters of the Aegean (39.4 nmol mg�1)and NE Mediterranean (46.6 nmol mg�1) (Table 4).Values of DMS:Chl-a at the DFM from bothmesotrophic and oligotrophic regimes were muchlower than those at the surface, with a minimumvalue of 1.4 nmol mg�1 in the Black Sea and amaximum of 7 nmol mg�1 in the Aegean Sea.DMSPp:Chl-a showed a similar pattern but withvalues 2–10-fold higher, and a minimum of25 nmol mg�1 in the Black Sea and a maximum of190 nmol mg�1 in Mediterranean surface waters.The same pattern was observed for theDMSOp:Chl-a ratio, which increased from10 nmol mg�1 in the Black to 34 nmol mg�1 in theNE Mediterranean (Table 4).
3.3. Mesozooplankton abundance and their DMSP
contents
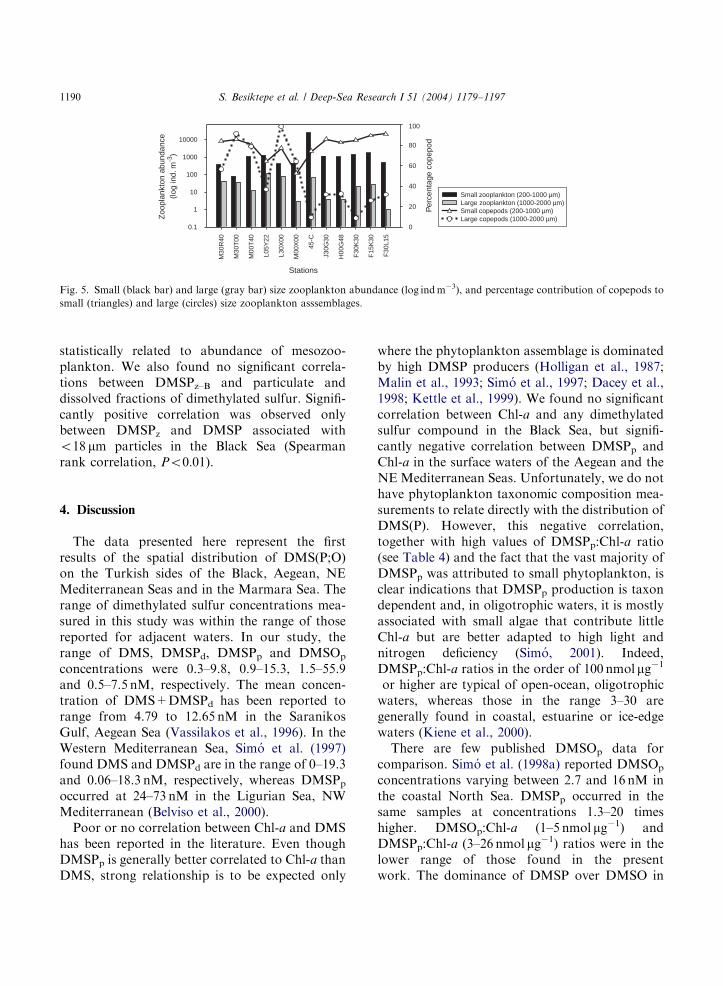
Mesozooplankton abundance and their DMSPcontent were determined for two size fractions:200–1000 and 1000–2000 mm. Small mesozoo-plankton were more abundant than large meso-zooplankton (Fig. 5 and Table 5). The size fraction200–1000 mm was dominated by copepods (Fig. 5),as was the size fraction 1000–2000 mm in the BlackSea. In the 1000–2000 mm size fraction, Thaliacea(mostly salps and doliolids) and chaetognaths
MSPd, total DMSPp, DMSPpo8 mm and DMSOp in the surface
mbined data from Aegean and NE Mediterranean Seas
Aegean+Mediterranean Sea
FM Surface DFM
0.47 �0.87��� �0.30.16 �0.71� 0.87
0.60 — —
0.77 — —
0.03 �0.72 —
0.57 �0.2 �0.20.89� 0.67� 0.04
0.8 0.2 �0.150.20 — —
0.30 — —
l analysis.
ARTICLE IN PRESS
Table 4
Chlorophyll normalized concentrations (nmol mg�1) (mean7standard deviation) of dissolved and particulate dimethylated sulfur
compounds from the surface and depth of fluorescence maximum (DFM) in the Black Sea, Marmara Sea, Aegean Sea and
Mediterranean Sea
Black Sea Marmara Sea Aegean Sea Mediterranean Sea
Surface DFM Surface DFM Surface DFM Surface DFM
DMS:Chl-a 3.672.1 1.4370.76 3.9571.9 2.6572.38 39.4 7.0 46.674.75 5.73
(1.1–7.3) (0.3–2.5) (2.6–5.3) (0.97–4.3) n ¼ 1 n ¼ 1 (43.3–50) n ¼ 1
n ¼ 6 n ¼ 6 n ¼ 2 n ¼ 2 n ¼ 2
DMSPd:Chl-a 18.9778.6 5.472.2 8.571.6 5.7571.5 232.69 18.06 168.4761.2 13.35
(12.0–34.14) (2.7–8.1) (7.3–9.7) (4.7–6.8) n ¼ 1 n ¼ 1 (125.1–211.7) n ¼ 1
n ¼ 6 n ¼ 6 n ¼ 2 n ¼ 2 n ¼ 2
DMSPd+DMS:Chl-a 25.3710.7 6.272.5 12.4570.3 8.473.86 141.17113.6 25.1770.16 155.2782.3 14.4676.9
(14.6–41.9) (2.4–10.2) (12.25–12.7) (5.7–11.14) (70.5–272.1) (25.06–25.3) (58.0–255) (6.5–19.1)
n ¼ 7 n ¼ 7 n ¼ 2 n ¼ 2 n ¼ 3 n ¼ 2 n ¼ 4 n ¼ 3
DMSPp total:Chl-a 25.14711 9.674.5 28.7714.8 19.877.1 104.1732.97 16.273.98 189.5791.6 17.1779.5
(8.95–46.9) (3.6–19.6) (18.2–39.2) (14.8–24.8) (75.9–140.4) (13.3–18.96) (62.8–290.3) (6.7–25.3)
n ¼ 17 n ¼ 17 n ¼ 2 n ¼ 2 n ¼ 3 n ¼ 2 n ¼ 5 n ¼ 3
DMSPpo18 mm:Chl-a 18.678.2 7.173.2 15.0374.3 5.95 75.176.2 11.870.4 158.2775.2 13.375.2
(7.8–37.9) (2.96–13.1) (11.97–18.1) (68–78.8) (11.5–12.1) (52.3–238.7) (7.4–15.9)
n ¼ 17 n ¼ 16 n ¼ 2 n ¼ 1 n ¼ 3 n ¼ 2 n ¼ 5 n ¼ 3
DMSOp total:Chl-a 9.8276.29 4.3371.41 4.73 1.91 33.98715.7 5.69
(3.5–19.05) (2.34–10.72) — — (22.86–45.1) n ¼ 1
n ¼ 6 n ¼ 5 n ¼ 1 n ¼ 1 n ¼ 2
DMSOpo18 mm:Chl-a 8.0674.34 1.1470.91 24.1771.86
(4.3–14.8) (0.47–2.18) 3.13 1.42 — — (22.86–25.49) 4.88
n ¼ 5 n ¼ 3 n ¼ 1 n ¼ 1 n ¼ 2 n ¼ 1
Note: Values in parenthesis are data range, n is the number of samples.
S. Besiktepe et al. / Deep-Sea Research I 51 (2004) 1179–1197 1189
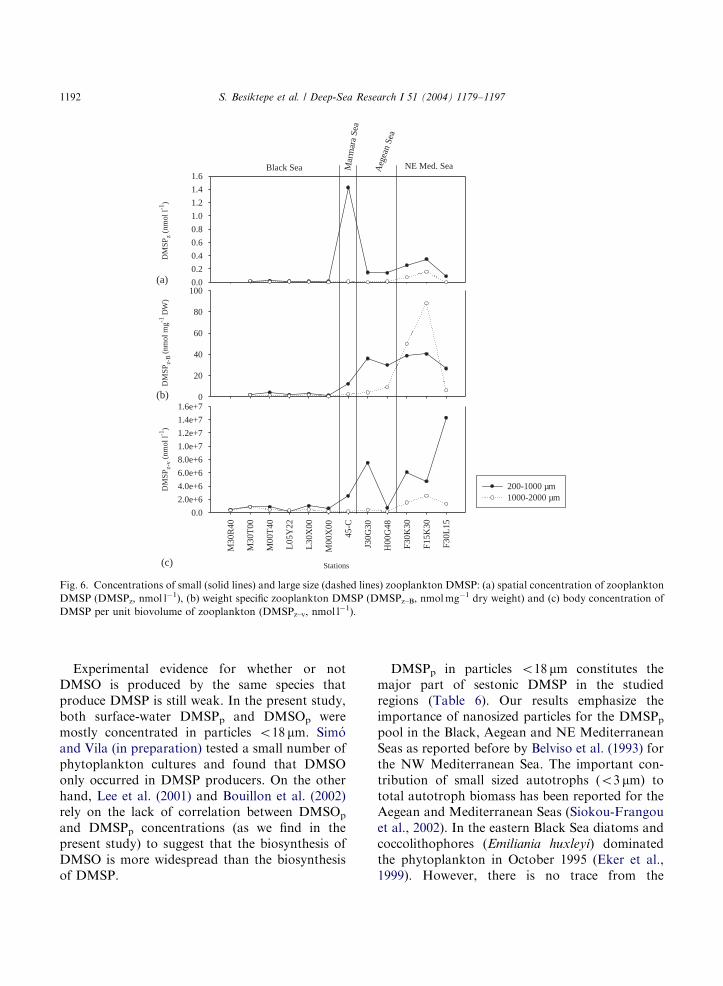
accounted for more than half of the abundance inthe Marmara, Aegean and the NE MediterraneanSeas (Table 5).DMSP concentrations in zooplankton (Fig. 6)
are presented here in three respects: spatialzooplankton DMSP (DMSPz), dry-weight specificDMSP (DMSPz–B) and body DMSP concentra-tions (DMSPz–v) (see Section 2). Zooplankton inthe Black Sea contributed significantly less DMSPzthan those from the other regions (Mann–WhitneyRank Sum Test, Po0:01) (Fig. 6a). In the BlackSea, DMSPz–B in the small size fraction wasidentical to that in the large size fraction, whereasin the Marmara and Aegean Seas the small sizefraction contained more DMSPz–B than did thelarger zooplankton. In the NE Mediterranean,
DMSPz–B was higher in the large size fractions atthe two stations dominated by salps and doliolids(around 62% of the abundance) (Fig. 6 and Table5). Mesozooplankton body DMSP (DMSPz–v)concentrations showed similar trends as DMSPzand DMSPz–B did, low in the Black Sea and highin the other seas (Fig. 6c).Differences in DMSPz–B between small and
big size mesozooplankton assemblages were notsignificant. Correlations between abundance ofmesozooplankton, DMSPz and DMSPz–B, andparticulate and dissolved fractions of dimethylatedsulfur in the water column were searched takingthe average values of the surface and theDFM. The distributions of particulate and dis-solved fractions of dimethylated sulfur were not
ARTICLE IN PRESS
Stations
M30
R40
M30
T00
M00
T40
L05Y
22
L30X
00
M00
X00
45-C
J30G
30
H00
G48
F30
K30
F15
K30
F30
L15
Zoo
plan
kton
abu
ndan
ce
(log
ind.
m-3
)
0.1
1
10
100
1000
10000
Per
cent
age
cope
pod
0
20
40
60
80
100
Small zooplankton (200-1000 µm)Large zooplankton (1000-2000 µm)Small copepods (200-1000 µm)Large copepods (1000-2000 µm)
Fig. 5. Small (black bar) and large (gray bar) size zooplankton abundance (log indm�3), and percentage contribution of copepods to
small (triangles) and large (circles) size zooplankton asssemblages.
S. Besiktepe et al. / Deep-Sea Research I 51 (2004) 1179–11971190
statistically related to abundance of mesozoo-plankton. We also found no significant correla-tions between DMSPz–B and particulate anddissolved fractions of dimethylated sulfur. Signifi-cantly positive correlation was observed onlybetween DMSPz and DMSP associated witho18 mm particles in the Black Sea (Spearmanrank correlation, Po0:01).
4. Discussion
The data presented here represent the firstresults of the spatial distribution of DMS(P;O)on the Turkish sides of the Black, Aegean, NEMediterranean Seas and in the Marmara Sea. Therange of dimethylated sulfur concentrations mea-sured in this study was within the range of thosereported for adjacent waters. In our study, therange of DMS, DMSPd, DMSPp and DMSOp
concentrations were 0.3–9.8, 0.9–15.3, 1.5–55.9and 0.5–7.5 nM, respectively. The mean concen-tration of DMS+DMSPd has been reported torange from 4.79 to 12.65 nM in the SaranikosGulf, Aegean Sea (Vassilakos et al., 1996). In theWestern Mediterranean Sea, Sim !o et al. (1997)found DMS and DMSPd are in the range of 0–19.3and 0.06–18.3 nM, respectively, whereas DMSPpoccurred at 24–73 nM in the Ligurian Sea, NWMediterranean (Belviso et al., 2000).Poor or no correlation between Chl-a and DMS
has been reported in the literature. Even thoughDMSPp is generally better correlated to Chl-a thanDMS, strong relationship is to be expected only
where the phytoplankton assemblage is dominatedby high DMSP producers (Holligan et al., 1987;Malin et al., 1993; Sim !o et al., 1997; Dacey et al.,1998; Kettle et al., 1999). We found no significantcorrelation between Chl-a and any dimethylatedsulfur compound in the Black Sea, but signifi-cantly negative correlation between DMSPp andChl-a in the surface waters of the Aegean and theNE Mediterranean Seas. Unfortunately, we do nothave phytoplankton taxonomic composition mea-surements to relate directly with the distribution ofDMS(P). However, this negative correlation,together with high values of DMSPp:Chl-a ratio(see Table 4) and the fact that the vast majority ofDMSPp was attributed to small phytoplankton, isclear indications that DMSPp production is taxondependent and, in oligotrophic waters, it is mostlyassociated with small algae that contribute littleChl-a but are better adapted to high light andnitrogen deficiency (Sim !o, 2001). Indeed,DMSPp:Chl-a ratios in the order of 100 nmol mg�1
or higher are typical of open-ocean, oligotrophicwaters, whereas those in the range 3–30 aregenerally found in coastal, estuarine or ice-edgewaters (Kiene et al., 2000).There are few published DMSOp data for
comparison. Sim !o et al. (1998a) reported DMSOp
concentrations varying between 2.7 and 16 nM inthe coastal North Sea. DMSPp occurred in thesame samples at concentrations 1.3–20 timeshigher. DMSOp:Chl-a (1–5 nmol mg�1) andDMSPp:Chl-a (3–26 nmol mg�1) ratios were in thelower range of those found in the presentwork. The dominance of DMSP over DMSO in
ARTICLE IN PRESSTable5
Abundance
(ind.m
�3)ofmajortaxonomic
groupsoftwosize
fractionated(200–1000and1000–2000mm
)mesozooplanktontowed
from
thedepth
offluorescence
maximum
tothesurface
intheBlack
Sea,Marm
ara
Sea,AegeanandNEMediterraneanSea
inOctober
2000
Majortaxonomicgroups
Black
Sea
Marm
ara
Sea
AegeanSea
NEMediterraneanSea
200–1000mm
1000–2000mm
200–1000mm
1000–2000mm
200–1000mm
1000–2000mm
200–1000mm
1000–2000mm
Chaetognatha
31.1730.03
11.3718.13
310.6
53.38
90.95
6.7373.7
1.3271.15
Appendicularia
27.3724.9
6.4
443.69
2.1
39.15
0.092
33.38715.38
Copepoda
435.67323.4
32.03727.32
18280.2
6.24
980.7
1.1
1009.87462.4
2.5672.98
Cladocera
125.67133.04
23.47
3105.85
2.1
9.1
7.8772.3
0.065
Other
crustaceans
5.19
2.473.23
88.74
14.4
0.25
12.16710.1
0.3270.25
Thaliacea(m
ostlysalps
anddoliolids)
0.86
33.8175.98
7.0476.86
Mollusc
larvae
34.13
2174.1
41.11
39.8749.58
Fisheggsandlarvae
0.06
0.032
Polychaetelarvae
177.48
0.06
7.39
Total
658.97511.4
75.6748.7
24580.6
63.78
1094.2
3.36
1150.97549.4
11.34711.23
S. Besiktepe et al. / Deep-Sea Research I 51 (2004) 1179–1197 1191
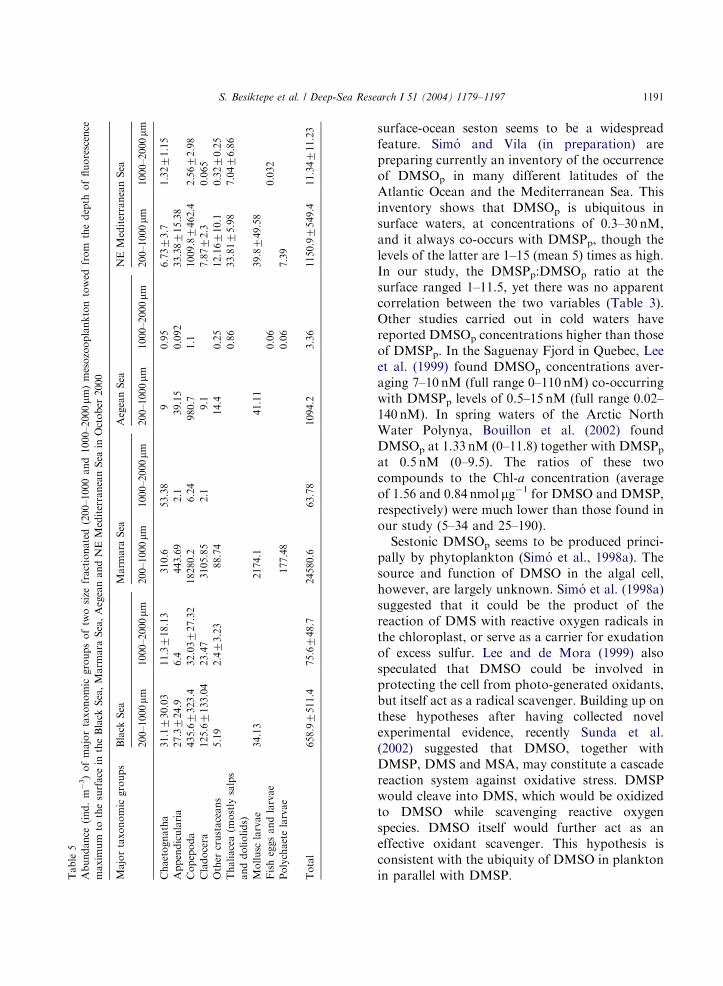
surface-ocean seston seems to be a widespreadfeature. Sim !o and Vila (in preparation) arepreparing currently an inventory of the occurrenceof DMSOp in many different latitudes of theAtlantic Ocean and the Mediterranean Sea. Thisinventory shows that DMSOp is ubiquitous insurface waters, at concentrations of 0.3–30 nM,and it always co-occurs with DMSPp, though thelevels of the latter are 1–15 (mean 5) times as high.In our study, the DMSPp:DMSOp ratio at thesurface ranged 1–11.5, yet there was no apparentcorrelation between the two variables (Table 3).Other studies carried out in cold waters havereported DMSOp concentrations higher than thoseof DMSPp. In the Saguenay Fjord in Quebec, Leeet al. (1999) found DMSOp concentrations aver-aging 7–10 nM (full range 0–110 nM) co-occurringwith DMSPp levels of 0.5–15 nM (full range 0.02–140 nM). In spring waters of the Arctic NorthWater Polynya, Bouillon et al. (2002) foundDMSOp at 1.33 nM (0–11.8) together with DMSPpat 0.5 nM (0–9.5). The ratios of these twocompounds to the Chl-a concentration (averageof 1.56 and 0.84 nmol mg�1 for DMSO and DMSP,respectively) were much lower than those found inour study (5–34 and 25–190).Sestonic DMSOp seems to be produced princi-
pally by phytoplankton (Sim !o et al., 1998a). Thesource and function of DMSO in the algal cell,however, are largely unknown. Sim !o et al. (1998a)suggested that it could be the product of thereaction of DMS with reactive oxygen radicals inthe chloroplast, or serve as a carrier for exudationof excess sulfur. Lee and de Mora (1999) alsospeculated that DMSO could be involved inprotecting the cell from photo-generated oxidants,but itself act as a radical scavenger. Building up onthese hypotheses after having collected novelexperimental evidence, recently Sunda et al.(2002) suggested that DMSO, together withDMSP, DMS and MSA, may constitute a cascadereaction system against oxidative stress. DMSPwould cleave into DMS, which would be oxidizedto DMSO while scavenging reactive oxygenspecies. DMSO itself would further act as aneffective oxidant scavenger. This hypothesis isconsistent with the ubiquity of DMSO in planktonin parallel with DMSP.
ARTICLE IN PRESS
DM
SPz
(nm
ol l-1
)
0.0
0.2
0.4
0.6
0.8
1.0
1.2
1.4
1.6
200-1000 µm1000-2000 µm
DM
SPz-
B (n
mol
mg-1
DW
)
0
20
40
60
80
100
Stations
M30
R40
M30
T00
M00
T40
L05
Y22
L30
X00
M00
X00
45-C
J30G
30
H00
G48
F30K
30
F15K
30
F30L
15
DM
SPz-
v (n
mol
l-1)
0.0
2.0e+6
4.0e+6
6.0e+6
8.0e+6
1.0e+7
1.2e+7
1.4e+7
1.6e+7
Black Sea Mar
mar
a Se
a
Aeg
ean
Sea
NE Med. Sea
(a)
(b)
(c)
Fig. 6. Concentrations of small (solid lines) and large size (dashed lines) zooplankton DMSP: (a) spatial concentration of zooplankton
DMSP (DMSPz, nmol l�1), (b) weight specific zooplankton DMSP (DMSPz–B, nmolmg
�1 dry weight) and (c) body concentration of
DMSP per unit biovolume of zooplankton (DMSPz–v, nmol l�1).
S. Besiktepe et al. / Deep-Sea Research I 51 (2004) 1179–11971192
Experimental evidence for whether or notDMSO is produced by the same species thatproduce DMSP is still weak. In the present study,both surface-water DMSPp and DMSOp weremostly concentrated in particles o18 mm. Sim !oand Vila (in preparation) tested a small number ofphytoplankton cultures and found that DMSOonly occurred in DMSP producers. On the otherhand, Lee et al. (2001) and Bouillon et al. (2002)rely on the lack of correlation between DMSOp
and DMSPp concentrations (as we find in thepresent study) to suggest that the biosynthesis ofDMSO is more widespread than the biosynthesisof DMSP.
DMSPp in particles o18 mm constitutes themajor part of sestonic DMSP in the studiedregions (Table 6). Our results emphasize theimportance of nanosized particles for the DMSPppool in the Black, Aegean and NE MediterraneanSeas as reported before by Belviso et al. (1993) forthe NW Mediterranean Sea. The important con-tribution of small sized autotrophs (o3 mm) tototal autotroph biomass has been reported for theAegean and Mediterranean Seas (Siokou-Frangouet al., 2002). In the eastern Black Sea diatoms andcoccolithophores (Emiliania huxleyi) dominatedthe phytoplankton in October 1995 (Eker et al.,1999). However, there is no trace from the
ARTICLE IN PRESS
Table 6
Percentage contributions of particles o18 mm, particles
>18mm and mesozooplankton to the total particulate DMSP
in the Black Sea, Marmara Sea, Aegean Sea and NE
Mediterranean Sea
Regions DMSPpo18 mm DMSPp>18mm DMSPz total
Black Sea 74.6 25.1 0.3
Marmara Sea 43.7 52.1 4.2
Aegean Sea 74.8 22.4 2.8
NE Mediterranean
Sea
76.0 19.0 5.0
S. Besiktepe et al. / Deep-Sea Research I 51 (2004) 1179–1197 1193
SeaWiFS imagery that coccolithophores wereabundant during our sampling period (see Fig.1). The lowest contribution of nanosized particlesto total DMSPp was observed in the Sea ofMarmara (B50% DMSPp from o18 mm sizefraction). Phytoplankton assemblages in the Mar-mara (particularly at station 45-C) are dominatedby dinoflagellates (especially Gymnodinium, Pro-
rocentrum and Ceratium sp.) throughout the year(Polat-Beken et al., 2000). Since dinoflagellates arealso major DMSP producers, this could explainthe relatively large contribution by the large sizefraction to the total DMSPp in the Marmara.The appearance of DMSP in mesozooplankton
and the roles of mesozooplankton in DMSPdynamics have been discussed (Dacey and Wake-ham, 1986; Kwint et al., 1996; Tang et al., 1999,2000a; Tang and Sim !o, 2003). Tang et al. (1999,2000a) showed that ingestion and assimilation ofphytoplankton-DMSP by mesozooplanktonhighly depend on both prey and grazer speciescomposition. In the present study, because most ofthe DMSPp was associated with particles o18 mm(Table 6), it was more likely consumed andretained by particle feeders rather than predatoryzooplankters. Consistent with this hypothesis isthat DMSPz was always higher in the 200–1000 mmsize fraction (Fig. 6), which was dominated byparticle feeders such as copepods, cladocerans,appendicularians and mollusc larvae (Table 5).The maximum DMSPz for the 200–1000 mmfraction in Marmara Sea (Fig. 6) also coincidedwith elevated abundances of copepods, cladocer-ans and mollusc larvae at that location (Table 5).Overall, mesozooplankton were a small compo-nent of the DMSP budget, constituting p5% of
the total planktonic DMSP (Table 6). Dry-weightspecific DMSPz–B did not correlate with DMSPp,implying that the ingestion or assimilation ofDMSP by zooplankton and DMSPp productionwere uncoupled. An interesting observation is thatDMSPz–B for the large size fraction increased inthe NE Mediterranean Sea (Fig. 6). A fair numberof salps and doliolids were found in this region(Table 5) and they both are efficient filter feedersof small particles. Thus, the high DMSPz–B (1000–2000 mm) may reflect the accumulation of DMSPpin these filter feeders. The highest observedDMSPz–B was B90 nmol DMSPmg�1 DW inNE Mediterranean (Fig. 6b), equivalent to 5.8 mgDMSP-Cmg�1 DW. Assuming that carbon ac-counts for 60% of the zooplankton dry weight(Harris et al., 2000), the contribution of DMSP-Cto the total zooplankton carbon biomass would beo1%, much lower than that for DMSP-producingphytoplankton (Matrai and Keller, 1994). Thisanalysis shows that DMSP was not an importanttissue component of these zooplankton. Instead,the zooplankton likely simply retained ingestedDMSP temporarily in their guts after ingestion (cf.Temora longicornis; Tang et al., 1999, 2000b).Assuming a cylindrical shape for mesozooplank-
ton, we estimated their body volume based ontheir linear dimensions, and calculated their bodyDMSP concentrations (DMSPz–v). DMSPz–v wasaround six orders of magnitude higher thansestonic DMSPp and total dissolved DMS(P) (seeFigs. 3a, 4c and 6c). These results are in agreementwith the study by Tang et al. (1999, 2000a) in theLong Island Sound. As far as we know, zooplank-ton do not synthesize DMSP de novo, and only afew are known to accumulate DMSP in bodytissues; e.g. T. longicornis (Tang et al., 1999,2000b). Thus, the high DMSPz�v probably repre-sents DMSP-containing food transiting zooplank-ton guts. Zooplankton species that do notassimilate DMSP may repackage ingested DMSPinto fecal material, which may subsequently bedegraded or exported to deep water (Kwint et al.,1996; Tang, 2001). Another less studied aspect isthat the zooplankton gut environment may func-tion as microbial hotspots for DMSP reactions.Zooplankton guts are often heavily colonized bybacteria, including DMSP-consuming bacteria
ARTICLE IN PRESS
S. Besiktepe et al. / Deep-Sea Research I 51 (2004) 1179–11971194
(DCB) (Tang et al., 2001). The reported half-saturation constant for free-living DCB in coastalto oligotrophic waters ranges from 24 to>500 nM, 5–50 folds higher than the ambientdissolved DMSP concentrations (Ledyard andDacey, 1996); thus, free-living DCB likely con-sume ambient dissolved DMSP at suboptimalrates. In contrast, through feeding zooplanktoncan accumulate DMSP in their guts and fecalpellets to mM–mM level (Kwint et al., 1996; Tanget al., 1999; Tang, 2001), which could allowturnover of DMSP by DCB at maximum rate.Tang et al. (2001) estimated that DCB thatcolonize the copepod Acartia tonsa in Long IslandSound could consume all seston-DMSP thatpasses through the copepod population by graz-ing. Thus, while zooplankton may account foronly a small fraction of the DMSP standing stock,nonetheless they may represent an active anddynamic fraction of the DMSP budget. Thesignificance of the coupling between zooplanktonand bacteria in driving DMSP reactions awaitsfurther study.Using the few surface DMS concentrations, wind
speeds and sea surface temperature data, we haveestimated the instantaneous sea–air DMS fluxaccording to the piston velocity parameterization ofNightingale et al. (2000) applied to DMS as follows:
Kw;DMS ¼ ðð5:88u210Þ þ ð1:49u10ÞÞSc�1=2;
FDMS ¼ ½DMSsurf Kw;DMS 0:24;
where Kw;DMS is the piston velocity or air–seaexchange constant (cmh�1), u10 is the wind speedat 10m height (m s�1), Sc is the Schmidt numberof DMS calculated from the sea surface tempera-ture according to Saltzman et al. (1993), [DMS]surfis the DMS concentration at the surface (nM) andFDMS is the air–sea exchange flux of DMS(mmolm�2 d�1).Wind speeds were measured during the cruise at
around 15m elevation from the surface, and itvaried between 1 and 20m s�1 (see Table 1). Fluxesaveraged 5.4, 73.5, 20.8 and 2.6 mmolm�2 d�1 forthe Black, Marmara, Aegean and NE Mediterra-nean Seas, respectively. Highest emission fluxesmostly coincided with highest wind speeds. Theaverage of the estimated instantaneous fluxes from
NE Mediterranean was in good agreement withthat observed in open areas of the NorthwesternMediterranean (average 2.5 mmolm�2 d�1; Sim !oand Grimalt, 1998). The overall mean of all fourregions (17.6 mmolm�2 d�1) fell at the upper end ofthe range proposed for the Western Europeanshelves and adjacent oceanic waters (Uher et al.,2000, see their Fig. 9).This study provides the first joint measurements
of DMS, DMSP and DMSO among the dissolved,particulate and zooplankton pools in the NEMediterranean basin including the Black Sea.The results indicate that dimethylated sulfurcompounds are not proportionally associated withChl-a concentrations (hence phytoplankton bio-mass), neither spatially nor with depth. Thetaxonomic composition of phytoplankton andthe structure of the food web are the likely criticalfactors that shift sulfur compounds from matchingChl-a distributions. Several studies have shownthat mesozooplankton may be significant actors inthe processing of algal DMSP, including DMSproduction. However, the contribution of thesehigher predators to the standing stock of DMSPhas received much less attention. Should meso-zooplankton accumulate DMSP in the body, theymight contribute significantly to the removal ofthis substance from the surface ocean by verticalmigration. The present study shows that, eventhough the levels of ingested DMSP per individualvolume can be very high, mesozooplanktonaccount for a very small fraction of totalparticulate DMSP.Also, our estimates of the sea-to-air flux of
DMS indicate that the NE Mediterranean basincan be an important source of biogenic sulfur tothe atmosphere even in the low productive periodof the region. To obtain a more precise picture onthe importance of NE Mediterranean basin for theregional biogenic sulfur budget, a comprehensiveseries of measurements over different seasonsshould be carried out.
Acknowledgements
This study was supported by METU-AFP-99-06-01-01 and NATO-SfP-971818 ODBMS Pro-
ARTICLE IN PRESS
S. Besiktepe et al. / Deep-Sea Research I 51 (2004) 1179–1197 1195
jects. Participation of M.V. and R.S. was fundedby Spanish McyT through project REN2000-2457-E. K.W.T.’s visit to Institute of Marine Sciences,METU was supported by TUBITAK-NATO DProgramme. We are indebted to Drs. AysenYılmaz and Suleyman Tugrul for providingprimary production, chlorophyll and nitrate+ni-trite data. We thank Serkan Sancak for his help inretrieval and analysis of the SeaWiFS data. TheSeaWiFS Project and the Distributed ActiveArchive Center at the Goddard Space FlightCenter are thanked for the production anddistribution of the data. Suggestions from threeanonymous reviewers and the editor are greatlyappreciated.
References
Archer, S.D., Widdicombe, C.E., Tarran, G.A., Rees, A.P.,
Burkill, P.H., 2001. Production and turnover of particulate
dimethylsulphoniopropionate during a coccolithophore
bloom in the northern North Sea. Aquatic Microbial
Ecology 24, 225–241.
Archer, S.D., Gilbert, F.J., Nightingale, P.D., Zubrov, M.V.,
Taylor, A.H., Smith, G.C., Burkill, P.H., 2002. Transfor-
mation of DMSPp to DMS during summer in the North
Sea, an examination of key processes via a modeling
approach. Deep-Sea Research II 49 (15), 3067–3101.
Belviso, S., Kim, S.K., Rassoulzadegan, F., Krajka, B.,
Nyugen, B.C., Mihalopoulos, N., Buat-Menard, P., 1990.
Production of dimethylsulfoniumpropionate (DMSP) and
dimethylsulfide (DMS) by a microbial food web. Limnology
and Oceanography 35, 1810–1821.
Belviso, S., Buat-Menard, P., Putaud, J.P., Nyugen, B.C.,
Claustre, H., Neveux, J., 1993. Size distribution of
dimethylsulfoniopropionate (DMSP) in areas of the tropical
northeastern Atlantic Ocean and the Mediterranean Sea.
Marine Chemistry 44, 55–71.
Belviso, S., Christaki, U., Vidussi, F., Marty, J.C., Vila, M.,
Delgado, M., 2000. Diel variations of the DMSP-to-
chlorophyll a ratio in Northwestern Mediterranean surface
waters. Journal of Marine Systems 25, 119–128.
Bouillon, R.-C., Lee, P.A., de Mora, S.J., Levasseur, M.,
Lovejoy, C., 2002. Vernal distribution of dimethylsulphide,
dimethylsulphoniopropionate, and dimethylsulphoxide in
the North Water in 1998. Deep-Sea Research II 49,
5171–5189.
Cokacar, T., Kubilay, N., Oguz, T., 2001. Structure of
Emiliania huxleyi blooms in the Black Sea surface waters
as detected by SeaWiFS imagery. Goephysical Research
Letters 28 (24), 4607–4610.
Dacey, J.W.H., Wakeham, S.G., 1986. Oceanic dimethylsulfide:
production during zooplankton grazing on phytoplankton.
Science 233, 1314–1316.
Dacey, J.W.H., Howse, F.A., Michaels, A.F., Wakeham, S.G.,
1998. Temporal variability of dimethylsulfide and dimethyl-
sulfoniopropionate in the Sargasso Sea. Deep-Sea Research
I 45 (12), 2085–2104.
Daly, K.L., DiTullio, G.R., 1996. Particulate dimethylsulfonio-
propionate removal and dimethyl sulfide production by
zooplankton in the Southern Ocean. In: Kiene, R.P., Visscher,
P.T., Keller, M.D., Kirst, G.O. (Eds.), Biological and
Environmental Chemistry of DMSP and Related Sulfonium
Compounds. Plenum Press, New York, pp. 223–238.
Eker, E., Georgieva, L., Senichkina, L., Kideys, A.E., 1999.
Phytoplankton distribution in the western and eastern Black
Sea in spring and autumn 1995. ICES Journal of Marine
Science 56, 15–22.
Ganor, E., Foner, H.A., Bingemer, H.G., Udisti, R., Setter, I.,
2000. Biogenic sulphate generation in the Mediterranean
Sea and its contribution to the sulphate anomaly in the
aerosol over Israel and the Eastern Mediterranean. Atmo-
spheric Environment 34, 3453–3462.
Harris, R.P., Wiebe, P.H., Lenz, J., Skjoldal, H.R., Huntley, M.
(Eds.), 2000. Zooplankton Methodology Manual. Academic
Press, San Diego, 684pp.
Holligan, P.M., Turner, S.M., Liss, P.S., 1987. Measurement of
dimethyl sulphide in frontal regions. Continental Shelf
Research 7, 213–224.
Iverson, R.L., Nearhoof, F.L., Andreae, M.O., 1989. Produc-
tion of dimethylsulfonium propionate and dimethylsulfide
by phytoplankton in estuarine and coastal waters. Limnol-
ogy and Oceanography 34 (1), 53–67.
IOC, 1994. Protocols for the joint global ocean flux core
measurements. Manual and Guides 29, 170pp.
Keller, M.D., Bellows, W.K., Guillard, R.R.L., 1989. Dimethyl
sulfide production in marine phytoplankton. In: Saltzman,
E., Cooper, W.J. (Eds.), Biogenic Sulfur in the Environ-
ment. American Chemical Society, Washington, DC,
pp. 167–182.
Kettle, A.J., Andreae, M.O., Amouroux, D., Andreae, T.W.,
Bates, T.S., Berresheim, H., Bingemer, H., Boniforti, R.,
Curran, M.A.J., DiTullio, G.R., Helas, G., Jones, G.B.,
Keller, M.D., Kiene, R.P., Leck, C., Levasseur, M., Malin,
G., Maspero, M., Matrai, P., McTaggart, A.R., Mihalo-
poulos, N., Nguyen, B.C., Novo, A., Putaud, J.P.,
Rapsomanikis, S., Roberts, G., Schebeske, G., Sharma, S.,
Simo, R., Staubes, R., Turner, S., Uher, G., 1999. A global
database of sea surface dimethylsulfide (DMS) measure-
ments and a procedure to predict sea surface DMS as a
function of latitude, longitude, and month. Global Biogeo-
chemical Cycles 13 (2), 399–444.
Kiene, R.P., 1992. Dynamics of dimethyl sulfide and dimethyl-
sulfoniopropionate in oceanic water samples. Marine
Chemistry 37, 29–52.
Kiene, R.P., Linn, L.J., Bruton, J.A., 2000. New and important
roles for DMSP in marine microbial communities. Journal
of Sea Research 43 (3–4), 209–224.
ARTICLE IN PRESS
S. Besiktepe et al. / Deep-Sea Research I 51 (2004) 1179–11971196
Kouvarakis, G., Mihalopoulos, N., 2002. Seasonal variation of
dimethylsulfide in the gas phase and of methanesulfonate
and non-sea-salt sulfate in the aerosol phase in the Eastern
Mediterranean atmosphere. Atmospheric Environment 36,
929–938.
Kouvarakis, G., Bardouki, H., Mihalopoulos, N., 2002. Sulfur
budget above the Eastern Mediterranean: relative contribu-
tion of anthropogenic and biogenic sources. Tellus Series B
54, 201–212.
Kubilay, N., Kocak, M., Cokacar, T., Oguz, T., Kouvarakis,
G., Mihalopoulos, N., 2002. Influence of Black Sea and
local biogenic activity on the seasonal variation of aerosol
sulfur species in the Eastern Mediterranean atmosphere.
Global Biogeochemical Cycles 16 (4), 1079 (doi:10.1029/
2002GB001880).
Kwint, R.L.J., Kramer, K.J.M., 1995. Dimethylsulphide
production by plankton communities. Marine Ecology-
Progress Series 121 (1–3), 227–237.
Kwint, R.L.J., Irigoien, X., Kramer, K.J.M., 1996. Copepods
and DMSP. In: Kiene, R.P., Visscher, P.T., Keller, M.D.,
Kirst, G.O. (Eds.), Biological and Environmental Chemistry
of DMSP and Related Sulfonium Compounds. Plenum
Press, New York, pp. 239–252.
Ledyard, K.M., Dacey, J.W.H., 1996. Microbial cycling of
DMSP and DMS in coastal and oligotrophic seawater.
Limnology and Oceanography 41 (1), 33–40.
Lee, P.A., de Mora, S.J., 1999. Intracellular dimethylsulfoxide
(DMSO) in unicellular marine algae: speculations on its
origin and possible biological role. Journal of Phycology 35,
8–18.
Lee, P.A., Haase, R., de Mora, S.J., Chanut, J.-P., Gosselin,
M., 1999. Dimethylsulfoxide (DMSO) and related s
ulfur compounds in the Saguenay Fjord, Quebec.
Canadian Journal of Fisheries and Aquatic Sciences 56,
1631–1638.
Lee, P.A., de Mora, S.J., Gosselin, M., Levasseur, M.,
Bouillon, R.-C., Nozais, C., Michel, C., 2001. Particulate
dimethylsulfoxide in Arctic sea-ice algal communities: the
cryoprotectant hypothesis revisited. Journal of Phycology
37, 488–499.
Levasseur, M., Michaud, S., Egge, J., Cantin, G., Nejstgaard,
J.C., Sanders, R., Fernandez, E., Solberg, P.T., Heimdal, B.,
Gosselin, M., 1996. Production of DMSP and DMS during
a mesocosm study of an Emiliania huxleyi bloom: influence
of bacteria and Calanus finmarchicus grazing. Marine
Biology 126 (4), 609–618.
Malin, G., Kirst, G.O., 1997. Algal production of dimethyl
sulfide and its atmospheric role. Journal of Phycology 33
(6), 889–896.
Malin, G., Turner, S., Liss, P., Holligan, P., Harbour, D.,
1993. Dimethylsulphide and dimethylsulphoniopropio-
nate in the Northeast Atlantic during the summer cocco-
lithophore bloom. Deep-Sea Research Part I 40 (7),
1487–1508.
Matrai, P.A., Keller, M.D., 1994. Total organic sulfur and
dimethylsulfoniopropionate in marine phytoplankton: in-
tracellular variations. Marine Biology 119, 61–68.
Nightingale, P.D., Liss, P.S., Schlosser, P., 2000. Measurements
of air–sea gas transfer during an open ocean algal bloom.
Geophysical Research Letters 27, 2117–2120.
Polat-Beken, S.C., Okus, E., Altiok, H., Yuksek, A., Kiratli,
N., 2000. Marmara Denizi-Karadeniz Etkilesiminin zaman
serisi verileri (1997–1998) ile incelenmesi. In: Uysal, Z.,
Salihoglu, I. (Eds.), Proceeding on National Marine
Sciences Conference, Ankara, pp. 42–46.
Saltzman, E.S., King, D.B., Holmen, K., Leck, C., 1993.
Experimental determination of the diffusion coefficient of
dimethylsulfide in water. Journal of Geophysical Research
98, 16481–16486.
Siokou-Frangou, I., Bianchi, M., Christaki, U., Christou, E.D.,
Giannakourou, A., Gotsis, O., Ignatiades, L., Pagou, K.,
Pitta, P., Psarra, S., Souvermezoglu, E., Van Wanbeke, F.,
Zervakis, V., 2002. Carbon flow in the planktonic food web
along a gradient of oligotrophy in the Aegean Sea
(Mediterranean Sea). Journal of Marine Systems 33–34,
335–353.
Sim !o, R., 2001. Production of atmospheric sulfur by oceanic
plankton: biogeochemical, ecological and evolutionary
links. Trends in Ecology and Evolution 16, 287–294.
Sim !o, R., Grimalt, J.O., 1998. Spring–summer emission
of dimethyl sulphide from the north-western Mediterranean
Sea. Estuarine, Coastal and Shelf Science 47, 671–677.
Sim !o, R., Vila, M., Ubiquity of dimethylsulfoxide in marine
plankton: distribution patterns and controlling factors (in
preparation).
Sim !o, R., Grimalt, J.O., Albaig!es, J., 1996. Sequential method
for the field determination of nanomolar concentrations of
dimethyl sulfoxide in natural waters. Analytical Chemistry
68, 1493–1498.
Sim !o, R., Grimalt, J.O., Albaiges, J., 1997. Dissolved
dimethylsulphide, dimethylsulphoniopropionate and di-
methylsulphoxide in the western Mediterranean waters.
Deep-Sea Research II 44 (3–4), 929–950.
Sim !o, R., Hatton, A.D., Malin, G., Liss, P.S., 1998a.
Particulate dimethyl sulphoxide in sea water: production
by microplankton. Marine Ecology-Progress Series 167,
291–295.
Sim !o, R., Malin, G., Liss, P.S., 1998b. Refinement of the
borohydride reduction method for the analysis of dissolved
and particulate dimethyl sulfoxide in marine water samples.
Analytical Chemistry 70, 4864–4867.
Sim !o, R., Archer, S.D., Pedr !os-Ali !o, C., Gilpin, L., Stelfox-
Widdicombe, C.E., 2002. Coupled dynamics of
dimethylsulfoniopropionate and dimethylsulfide cycling
and the microbial food web in surface waters of
the North Atlantic. Limnology and Oceanography 47,
53–61.
Stefel, J., Dijkhuizen, L., Gieskes, W.W.C., 1995. DMSP-lyase
activity in a spring phytoplankton bloom off the Dutch
coast, related to phaeocyctis sp abundance. Marine Ecol-
ogy-Progress Series 123 (1–3), 235–243.
Stefels, J., 2000. Physiological aspects of the production and
conversion of DMSP in marine algae and higher plants.
Journal of Sea Research 43 (3–4), 183–197.
ARTICLE IN PRESS
S. Besiktepe et al. / Deep-Sea Research I 51 (2004) 1179–1197 1197
Steinke, M., Wolfe, G.V., Kirst, G.O., 1998. Partial character-
isation of dimethylsulfoniopropionate (DMSP) lyase iso-
zymes in 6 strains of Emiliania huxleyi. Marine Ecology-
Progress Series 175, 215–225.
Sunda, W., Kieber, D.J., Kiene, R.P., Huntsman, S., 2002. An
antioxidant function for DMSP and DMS in marine algae.
Nature 418, 317–320.
Strickland, J.D.H., Persons, T.R., 1972. A practical handbook
of seawater analysis. Fisheries Research Board of Canada,
Ottawa, 310pp.
Tang, K.W., 2001. Defecation of dimethylsulfoniopropionate
(DMSP) by the copepod Acartia tonsa as functions of
ambient food concentration and body DMSP content.
Journal Plankton Research 23, 549–553.
Tang, K.W., Sim !o, R., 2003. Trophic uptake and transfer of
DMSP in simple planktonic food chains. Aquatic Microbial
Ecology 31, 193–202.
Tang, K.W., Dam, H.G., Visscher, P.T., Fenn, T.D., 1999.
Dimethylsulfoniopropionate (DMSP) in marine copepods
and its relation with diets and salinity. Marine Ecology-
Progress Series 179, 71–79.
Tang, K.W., Rogers, D.R., Dam, H.G., Visscher, P.T., 2000a.
Seasonal distribution of DMSP among seston, dissolved
matter and zooplankton along a transect in the Long Island
Sound estuary. Marine Ecology-Progress Series 206, 1–11.
Tang, K.W., Fenn, T.D., Visscher, P.T., Dam, H.G., 2000b.
Regulation of body dimethyl-sulfoniopropionate (DMSP)
content by the copepod Temora longicornis: a test of four
mechanisms. Marine Biology 136, 749–757.
Tang, K.W., Visscher, P.T., Dam, H.G., 2001. DMSP-
consuming bacteria associated with the calanoid copepod
Acartia tonsa (Dana). Journal of Experimental Marine
Biology and Ecology 256, 185–198.
Uher, G., Schebeske, G., Barlow, R.G., Cummings, D.G.,
Mantoura, R.F.C., Rapsomanikis, S.R., Andreae, M.O.,
2000. Distribution and air–sea gas exchange of dimethyl
sulphide at the European western continental margin.
Marine Chemistry 69, 277–300.
Vassilakos, C., Ignatiades, L., Kwint, R., Kozanoglu, C., 1996.
Studies of DMS+DMSP and its relationship with the
phytoplanktonic populations in the Eastern Mediterranean
Sea. In: Kiene, R.P., Visscher, P.T., Keller, M.D., Kirst,
G.O. (Eds.), Biological and Environmental Chemistry of
DMSP and Related Sulfonium Compounds. Plenum Press,
New York, pp. 203–211.
Wolfe, G.V., Steinke, M., Kirst, G.O., 1997. Grazing-activated
chemical defence in a unicellular marine alga. Nature 387,
894–897.
Yayla, M.K., 1999. Primary production, availability and
uptake of nutrients and photoadaptation of phytoplankton
in the Black Sea, the Sea of Marmara and the Eastern
Mediterranean. M.S. Thesis, Middle East Technical Uni-
versity, Institute of Marine Sciences, Mersin, Turkey,
128pp.