(r) bangladesh, bhutan, maldives and nepal. iso 22000 food ...
Upload
khangminh22Category
view
1download
0
Review of the Reef Fishery of the
North Province of Maldives
Shahaama Abdul Sattar
Marine Research Centre Ministry of Fisheries and Agriculture
H. White Waves Moonlight Hingun
Male’ 20025 Republic of Maldives
A World Bank funded Project under the Maldives Environment Management Project
June 2010
To be cited as:
Sattar, S. A. (2010) Review of the Reef Fishery in the North Province of Maldives. Marine Research Centre/World Bank Maldives Environment Management Project. 45 pages
Cover photos by: Shahaama A. Sattar, Hassan Hamid, Mariyam Nazeefa, Mohamed Ushan

Table of Contents
List of Figures .......................................................................................................................................... 2
List of Tables ........................................................................................................................................... 2
Executive Summary ................................................................................................................................ 3
1. Introduction ....................................................................................................................................... 5
2. Survey methodology ........................................................................................................................... 7
3. Results ................................................................................................................................................. 9
3.1 Fishing methods and daily fishing trips ......................................................................................... 9
3.1.2 Raa Atoll ............................................................................................................................... 10
3.1.3 Baa Atoll ............................................................................................................................... 12
3.1.4 Lhaviyani Atoll ...................................................................................................................... 14
3.2 Bait haul and fishing locations .................................................................................................... 16
3.2.1 Time and effort spent on bait haul ...................................................................................... 16
3.2.2 Time and effort spent on fishing ......................................................................................... 17
3.3 Species Composition of Catch ..................................................................................................... 22
3.4 Size composition of catch ........................................................................................................... 28
3.5 Catch Per Unit Effort ................................................................................................................... 31
3.6 Income from the fishery ............................................................................................................. 32
3.7 Estimation catch per area ........................................................................................................... 33
4. Conclusion ......................................................................................................................................... 35
5. Recommendations from the Project ................................................................................................ 38
6. Limitations of the Project ................................................................................................................. 39
7. References ........................................................................................................................................ 39
Acknowledgements .............................................................................................................................. 40
Appendix 1: Data collection form used during the survey ................................................................... 41
Appendix 2: Photo plates depicting fishing trips in Noonu, Raa, Baa and Lhaviyani Atolls ................. 42
Noonu Atoll ....................................................................................................................................... 42
Raa Atoll ............................................................................................................................................ 43
Baa Atoll ............................................................................................................................................ 44
Lhaviyani Atoll ................................................................................................................................... 45
2 | M E M P R e e f F i s h e r y R e v i e w – M a r i n e R e s e a r c h C e n t r e
List of Figures
Figure 1. Illustration of how the length of individuals was measured during the survey ..................... 8
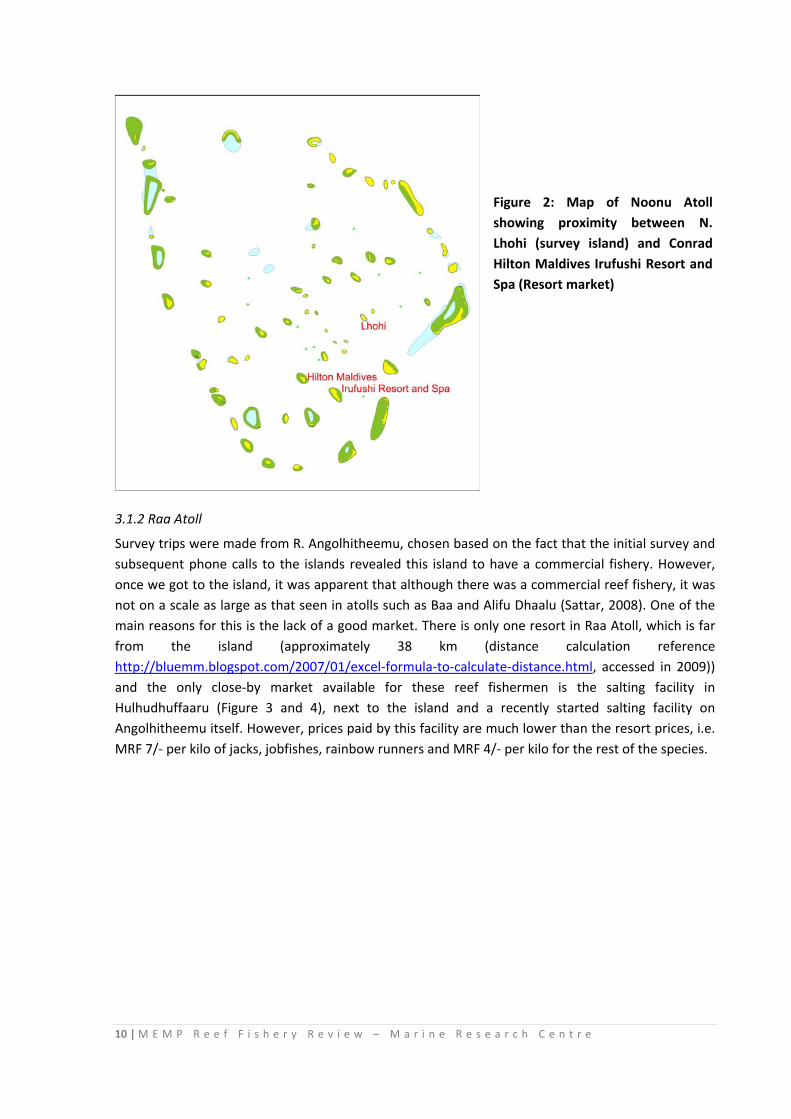
Figure 2: Map of Noonu Atoll showing proximity between N. Lhohi (survey island) and Conrad Hilton Maldives Irufushi Resort and Spa (Resort market) ............................................................................... 10
Figure 3: Map of Raa Atoll showing proximity between R. Angolhitheemu (survey island), Hulhudhuffaaru (salting facility) and Adaarana Select Meedhupparu (Resort – potential market) .... 11
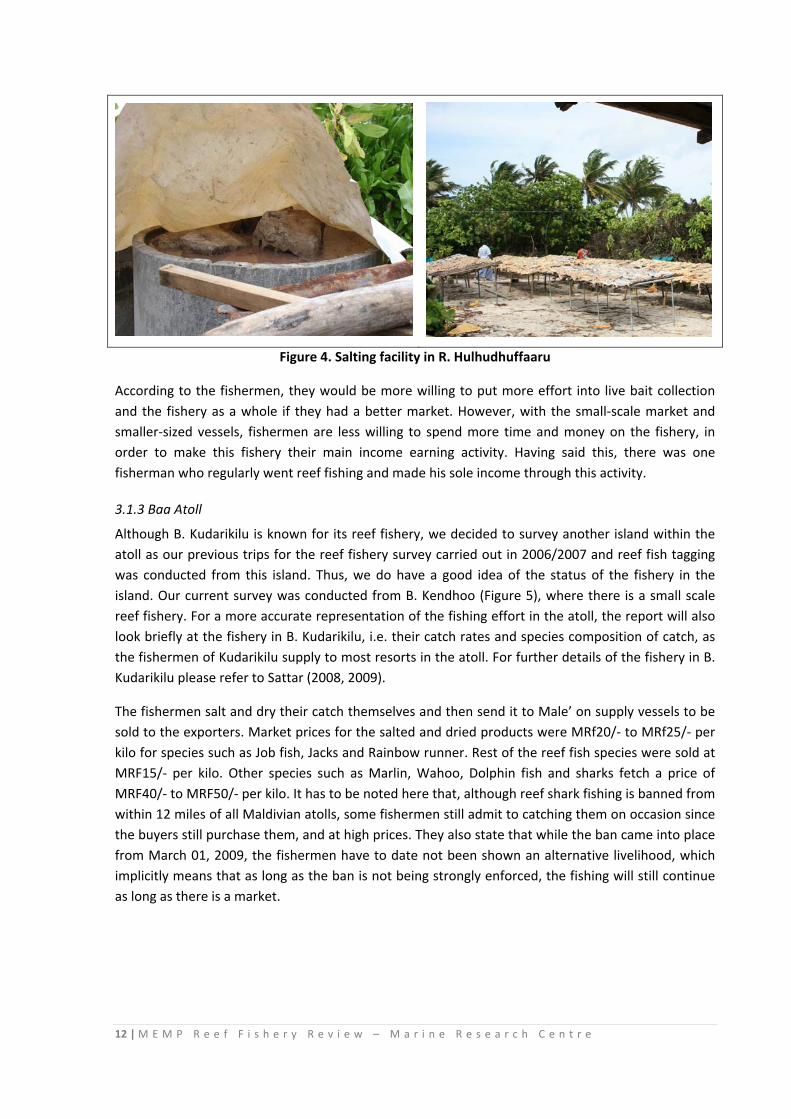
Figure 4. Salting facility in R. Hulhudhuffaaru ...................................................................................... 12
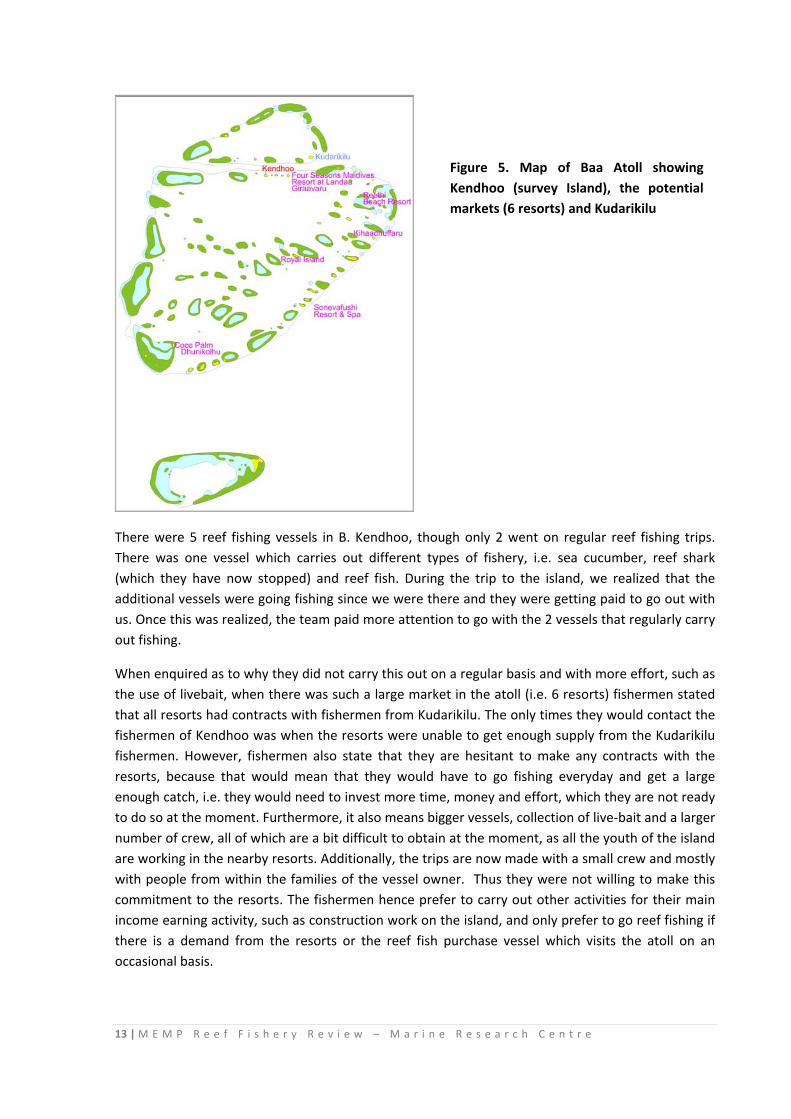
Figure 5. Map of Baa Atoll showing Kendhoo (survey Island), the potential markets (6 resorts) and Kudarikilu .............................................................................................................................................. 13
Figure 6. Various stages of the line assembly of traditional drop line used in B. Kendhoo ................. 14
Figure 8. Purchase of salt ice from Lh. Felivaru, to keep the catch fresh/chilled before being sold to the resort .............................................................................................................................................. 15
Figure 7. Map of Lhaviyani Atoll showing Hinnavaru (survey island) and the resort market within the atoll ....................................................................................................................................................... 15
Figure 9. Bait haul locations of fishermen of Noonu (red), Baa (orange) and Lhaviyani (blue) atolls.. 17
Figure 10: Fishing locations of the fishermen of a) Noonu, b) Raa, c) Baa and d) Lhaviyani Atolls. .... 21
Figure 11. Catch composition of total catch from the 4 survey atolls, divided into the families ......... 25
Figure 12. Catch composition of total catch for the survey trips, divided into the 10 most commonly caught species and “others” ................................................................................................................. 26
Figure 13. Catch composition by species of the 10 most commonly caught species from each atoll and “others” ......................................................................................................................................... 27
Figure 14. Length frequency plots for the most 6 commonly caught species based on the total catch from all atolls ........................................................................................................................................ 29
Figure 15. Length frequency distribution of A. virescens sampled in the 4 atolls, during the survey .. 30
Figure 16. Average effort spent on fishing and average CPUE in weight and numbers for the 4 survey atolls ..................................................................................................................................................... 31
Figure 17. Total catch from Raa, Baa, Lhaviyani, Alifu Alifu/Alifu Dhaalu and Vaavu atolls versus the total reef area of the atolls ................................................................................................................... 34
List of Tables Table 1. Islands within the project region where commercial reef fishing is carried out and the reported number of vessels .................................................................................................................... 7
Table 2. Atolls/Islands visited and number of fishing trips made from these islands ............................ 8
Table 3. Average time spent on fishing (i.e. without time for bait haul).............................................. 18
Table 4. Scientific, English and Dhivehi names of all species caught during the 4 survey trip ............. 22
Table 5. Comparison of average length of commonly caught species with commonly reported lengths for same species in the Maldives and worldwide ................................................................................ 28
Table 6. Average income earned per vessel per day of fishing (prior to cutting costs incurred) ......... 33
Table 7. Number of reported fishing vessels and estimated number of fishing trips and total catch per month ............................................................................................................................................. 34

3 | M E M P R e e f F i s h e r y R e v i e w – M a r i n e R e s e a r c h C e n t r e
Executive Summary
The Maldives Environment Management Project (MEMP), supported by World Bank and funded by the Board of International Development Assistance was initiated in 2008. MEMP is a 5 year project which aims to strengthen the national technical capacity in environmental monitoring and management. The project area covers the North Province of the Maldives, i.e. Noonu, Raa, Baa and Lhaviyani Atolls.
MRC plays a crucial role in the third component of the project which provides technical assistance for environmental monitoring. The technical assistance provided under this component would address the following areas of environmental management subcomponents; Beach erosion, Coral reefs, Mangroves, Bait fishery and Spatial Planning. The reef fishery review is a subcomponent of the Coral reef monitoring component and areview of the reef fishery within the region would help to assess the pressure on coral reef resources, specifically the reef fish within the region.
The reef fishery of the Maldives being mainly targeted at the tourism industry has expanded over the years with the spread of the tourism industry to the whole of Maldives. Furthermore, realization of its export value increased the fishing pressure on high valued reef fish or reef associated varieties. The demands for reef fish both by the domestic and an export market is expected to further increase over the next years.
Main findings from the survey revealed that the 4 atolls in the region had varying methods of fishing, which mainly depended on the market availability. More time an effort was invested into the fishery, if the fishermen had easy access to the tourism market within the atoll. In the absence of such a market, fishermen either sold their catch to the nearby salting facilities or processed the fish themselves and then sent to Male’.
Most commonly caught species differed from atoll to atoll, depending on the fishery, but overall a common species between all atolls was Aprion virescens. This mirrors the observations of the previous reef fishery surveys as well. For some of the heavily exploited species, the most commonly observed length of the species was less than the average length of the species, which could indicate that the population is mainly composed of smaller individuals with a few larger individuals which contribute towards a greater average length.
Catch per unit effort (CPUE) and income of the fishery was also a reflection of the method of the fishery, market availability and the energy and time invested into the fishery. As observed, fishermen of Lhaviyani atoll who were targeting the resort market within the atoll were seen to invest more time and energy, with the use of live bait. They were also observed to get the highest income from the fishery. Resorts pay a higher value for the reef fish in comparison to the salting facilities.
Comparison of catch estimation per area using area of reefs and total surface area gives 13350Metric tonnes and 11900 Metric tonnes respectively. Since fishing locations are very specific and on reef edges and reef passes, the former value of catch estimation using only reef area would be more relevant and accurate. While this value is lower than that estimated in Sattar (2008) it should still be taken with precaution given the representative nature of the data. In reality, it is expected that catch quantities would be greater than this estimated value, given that fishing is
4 | M E M P R e e f F i s h e r y R e v i e w – M a r i n e R e s e a r c h C e n t r e
carried out by a greater number of vessels than that estimated here, inclusive of all the vessels which carry out recreational fishery within Male’ atoll, as well as from all the resorts.
Survey findings from this survey and previous reef surveys show that the fishery needs to be monitored managed properly, for it to be carried out sustainably. Given the increasing pressure on the fishery, it is inevitable that the fishery will decline over time, given that reef fish are long lived species which have a biology which renders them vulnerable to high exploitation levels.
The report also highlights a few recommendations for management measures which could be initiated inorder to ensure sustainability of the fisheries. These are also measures which have been previously highlighted and which need to be implemented in the immediate future. Recommendations include the implementation of logbooks for long term data monitoring, imposition of size limits on catch and increased awareness regarding these management measures and the need for management. Awareness is crucial to ensure that whatever management measures are implemented, will be followed through properly. Without awareness, fishermen will not see the need for them to fill out logbooks at the end of their fishing trips and will only see the logbooks as a burden imposed on them only for the need of the fisheries management authorities.
5 | M E M P R e e f F i s h e r y R e v i e w – M a r i n e R e s e a r c h C e n t r e
1. Introduction The Maldives Environment Management Project (MEMP) supported by the World Bank and funded by the Board of International Development Assistance was initiated in 2008. MEMP is a 5 year project which aims to strengthen the national technical capacity in environmental monitoring and management. The project area covers the North Province of the Maldives, i.e. Noonu, Raa, Baa and Lhaviyani Atolls.
The project has four main components; i) Regional Solid Waste Management in the North Province (North Central Region of Maldives), ii) Capacity Building for Environment Management, iii) Technical Assistance for strengthening environmental monitoring, in which MRC plays a key role and iv) Project Management and communications.
MRC is a key stakeholder of the project, especially in the 3rd component. The main objective of this component is to assess the impact of human activities, global warming and other factors on the local environment in the North Central Region of the country. The technical assistance provided under this component would address the following areas of environmental management subcomponents; Beach erosion, Coral reefs, Mangroves, Bait fishery and Spatial Planning.
MRC is directly involved in both the Coral reef and Bait fishery components:
• Coral Reef component: One of the key outputs for the Coral Reef component is the formulation of an internationally accepted framework and a set of protocols for Monitoring coral reef ecosystem health which are based on ecological and socioeconomic indicators.
• Bait Fishery component: This component assesses the status of the bait fishery. It will also launch a community‐based monitoring program and provide critical inputs into the formulation of a national bait fishery management plan.
The Reef fishery review of the region falls under the Coral Reef component of the project. A review of the reef fishery within the region would help to assess the pressure on coral reef resources, specifically the reef fish within the region.
The reef fishery of the Maldives being mainly targeted at the tourism industry has expanded over the years with the spread of the tourism industry to the whole of Maldives. Tourism which was initially carried out in the central atolls of the Maldives now has resorts in all atolls, North through to the South of Maldives. Furthermore, realization of its export value increased the fishing pressure on high valued reef fish or reef associated varieties. The demands for reef fish both by the domestic and an export market is expected to further increase over the next years. It is therefore critical that some sort of management be implemented before these resources are over exploited or exploited at levels which would bring about their eventual over exploitation.
MRC carried out a survey of the reef fishery over a 2 year period in 2006 and 2007. Results of this survey are published in Sattar (2008). This survey was carried out in 2 parts, i.e. by participating in daily fishing trips with the fishermen, as well as by obtaining reef fish purchase data from the tourist resorts. This survey obtained data on size and species composition of catch, bait haul and fishing locations, fishing methodology and time spent and procedures followed when selling to the resorts. In 2008, MRC with the aid of the AEC project conducted a reef fish tagging project in Baa Atoll, where commonly caught species of reef fish were tagged and released. The purpose of this project is
6 | M E M P R e e f F i s h e r y R e v i e w – M a r i n e R e s e a r c h C e n t r e
to study the movements and growth of various species of reef fish. Results of the study revealed that although most reef fish species have a small home‐range, some species (e.g. Aprion virescens) do travel larger distances within and between the atolls (Sattar, 2009). Reasons for such migrations are unknown, although literature reports groupers to travel large distances to form spawning aggregations of 1000s of individuals, during certain times of the year (Sadovy and Eklund, 1999).
The current review of the Reef Fishery in the North Province, carried out under the Coral Reef component of the World Bank Maldives Environmental Management Project continued the work which was carried out in the 2 year reef fishery survey in 2006/2007. Survey activities were carried out in the designated atolls of Noonu, Raa, Baa and Lhaviyani atolls. Main issues addressed by the project were:
1. Extent of reef fishing in the region? 2. Estimated total catch, catch composition, average catch, average income per trip, bait species
used, bait haul and fishing locations 3. Characteristics of reef fishing trips/activities. Are they done on an opportunistic basis or is this
the main source of income? 4. How has the introduction of tourism affected the previously existing reef fishery in the atoll? 5. How important is reef fishing as a livelihood activity in the region? How much do they earn from
this activity
It was also planned to select Reef fishery field officers (fishermen who carry out fishing as their main income earning activity and who go fishing on a frequent basis) from different islands in the region. The original plan was to train these field officers in data collection and form filling, so that they could be responsible for sampling the catch on their daily trips, i.e. provide length/weight measurements of the catch, as well as other details which will be on forms supplied to them. This would have enabled MRC to collect reef fish data on a continuous basis and give us a complete picture of the reef fishery in the region and thereby enriching the RSEA component of the project. However, due to fund allocations as well as other complications, we were unable to implement this part of the reef fishery component.
7 | M E M P R e e f F i s h e r y R e v i e w – M a r i n e R e s e a r c h C e n t r e
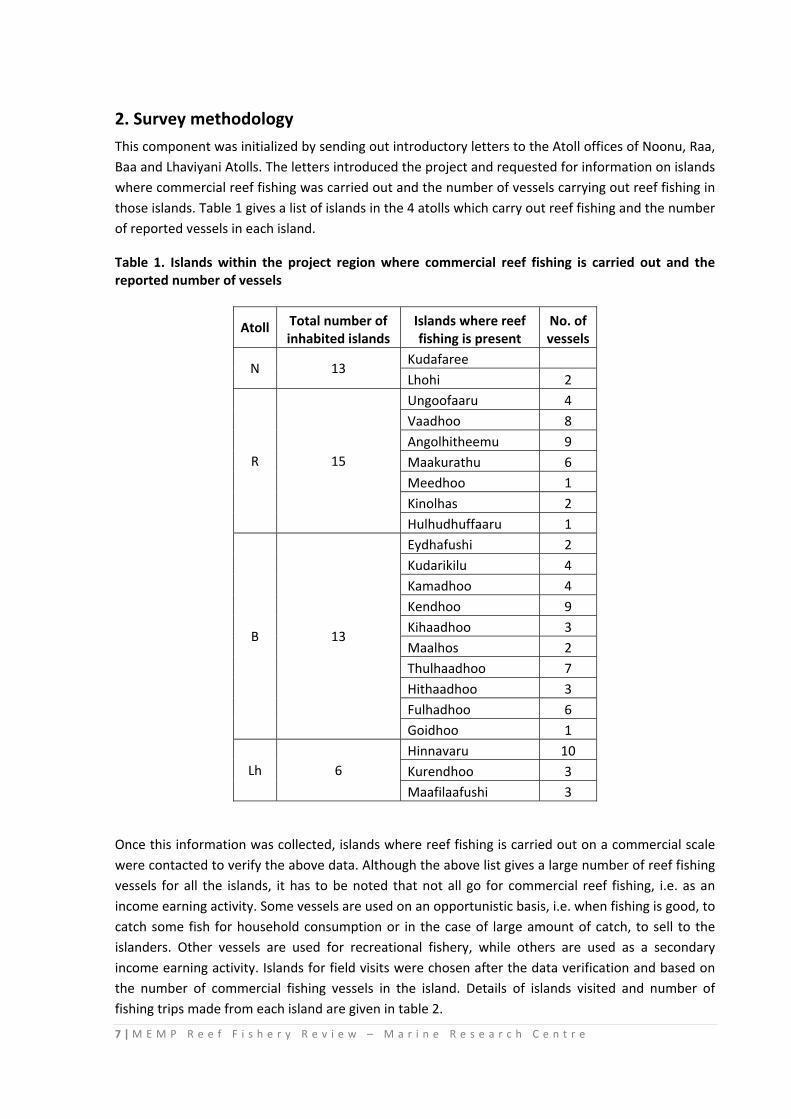
2. Survey methodology This component was initialized by sending out introductory letters to the Atoll offices of Noonu, Raa, Baa and Lhaviyani Atolls. The letters introduced the project and requested for information on islands where commercial reef fishing was carried out and the number of vessels carrying out reef fishing in those islands. Table 1 gives a list of islands in the 4 atolls which carry out reef fishing and the number of reported vessels in each island.
Table 1. Islands within the project region where commercial reef fishing is carried out and the reported number of vessels
Atoll Total number of inhabited islands
Islands where reef fishing is present
No. of vessels
N 13 Kudafaree Lhohi 2
R 15
Ungoofaaru 4 Vaadhoo 8 Angolhitheemu 9 Maakurathu 6 Meedhoo 1 Kinolhas 2 Hulhudhuffaaru 1
B 13
Eydhafushi 2 Kudarikilu 4 Kamadhoo 4 Kendhoo 9 Kihaadhoo 3 Maalhos 2 Thulhaadhoo 7 Hithaadhoo 3 Fulhadhoo 6 Goidhoo 1
Lh 6 Hinnavaru 10 Kurendhoo 3 Maafilaafushi 3
Once this information was collected, islands where reef fishing is carried out on a commercial scale were contacted to verify the above data. Although the above list gives a large number of reef fishing vessels for all the islands, it has to be noted that not all go for commercial reef fishing, i.e. as an income earning activity. Some vessels are used on an opportunistic basis, i.e. when fishing is good, to catch some fish for household consumption or in the case of large amount of catch, to sell to the islanders. Other vessels are used for recreational fishery, while others are used as a secondary income earning activity. Islands for field visits were chosen after the data verification and based on the number of commercial fishing vessels in the island. Details of islands visited and number of fishing trips made from each island are given in table 2.
8 | M E M P R e e f F i s h e r y R e v i e w – M a r i n e R e s e a r c h C e n t r e
Table 2. Atolls/Islands visited and number of fishing trips made from these islands
Island No. of
fishing trips
N. Lhohi 9 R. Angolhitheemu 10 B. Kendhoo 9 Lh. Hinnavaru 9
Total 37
Field data was collected by participating in the daily fishing trips of the reef fish fishermen. If there were more than 2 active vessels, it was ensured that all vessels who wanted to take part in the survey were given the opportunity by carrying out the trips on a rotational basis. A team of 2 MRC staff joined the fishermen on a daily basis for a week. Information collected on these trips includes:
• Time spent at sea: Time of departure to time of arrival at port • Time spent on bait haul: time elapsed from the point when the fishermen first jump into the
water in search of bait, to when they haul the net out of water after the last haul • Time spent fishing: time elapsed from the point when the fishermen throw in their lines into
the water at the first fishing location, to when they reel in the lines out of water at the end of the days fishing
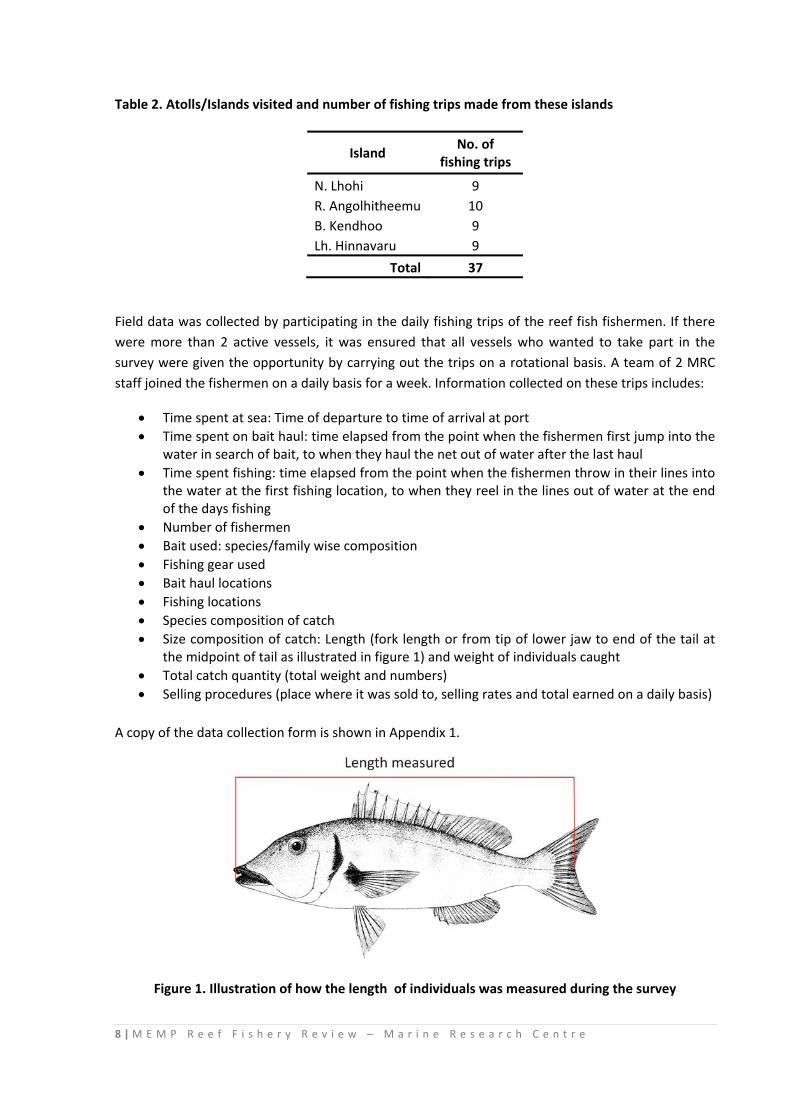
• Number of fishermen • Bait used: species/family wise composition • Fishing gear used • Bait haul locations • Fishing locations • Species composition of catch • Size composition of catch: Length (fork length or from tip of lower jaw to end of the tail at
the midpoint of tail as illustrated in figure 1) and weight of individuals caught • Total catch quantity (total weight and numbers) • Selling procedures (place where it was sold to, selling rates and total earned on a daily basis)
A copy of the data collection form is shown in Appendix 1.
Figure 1. Illustration of how the length of individuals was measured during the survey
9 | M E M P R e e f F i s h e r y R e v i e w – M a r i n e R e s e a r c h C e n t r e
Details of various fishing methodologies observed as well as analysis of data collected and results and of the survey are described in Section 3.
3. Results Results of the survey are presented in sections, a breakdown of which is as follows:
• Section 3.1 ‐ Fishing methods employed in the 4 atolls surveyed
• Section 3.2 ‐ Details the bait haul and fishing locations used by the fishermen of various atolls
• Section 3.3 ‐ Species composition of total catch and comparison of species composition between atolls
• Section 3.4 ‐ Size composition of total catch and comparison between atolls
• Section 3.5 ‐ Catch per Unit Effort
• Section 3.6 ‐ Income earned by reef fish fishermen of the various survey atolls
• Section 3.7 ‐ Estimation of catch per unit area
3.1 Fishing methods and daily fishing trips
In contrast to the earlier review of the reef fishery that is carried out in the central tourism region of the Maldives (Sattar, 2008), it was interesting to note that the 4 atolls within the project region used different methods of fishing. Method used mainly depended on the target species and the availability of market. One of the most important observations was that in the absence of a good high‐priced market, fishermen were less willing to put the effort and time into the fishery, as those who had access to such a market did in the central region of Maldives.
3.1.1 Noonu Atoll
Survey trips with the fishermen were made from N. Lhohi where there are 2 reef fishing vessels. Both vessels were small sized and had an average crew of 4 fishermen every day. Both vessels sold to the Conrad Hilton Maldives Irufushi Resort and Spa in Noonu atoll (Figure 2) at the rate of MRF 10/‐ per kilo.
During the time of survey, only one vessel hauled live bait and this was mainly silver sprats and species of cardinalfishes. These were used when carrying out pole and line fishing inside the atoll, which targeted schools of kawakawa (Euthynnus affinis) and rainbow runner (Elagatis bipinnulata) (Refer to table 4, section 3.3 for a detailed list of Scientific, English and Dhivehi names of all species caught in the reef fishery). For the main reef fishery, both vessels used drop lines with their own home made artificial lure (made with raffia) and lead weights. These lines once at the bottom were slowly reeled in, while giving sudden jerks to the line (Kooh’thun) such that the artificial lure makes sudden movements so as to make it similar to movements of livebait.
10 | M E M P R e e f F i s h e r y R e v i e w – M a r i n e R e s e a r c h C e n t r e
3.1.2 Raa Atoll
Survey trips were made from R. Angolhitheemu, chosen based on the fact that the initial survey and subsequent phone calls to the islands revealed this island to have a commercial fishery. However, once we got to the island, it was apparent that although there was a commercial reef fishery, it was not on a scale as large as that seen in atolls such as Baa and Alifu Dhaalu (Sattar, 2008). One of the main reasons for this is the lack of a good market. There is only one resort in Raa Atoll, which is far from the island (approximately 38 km (distance calculation reference http://bluemm.blogspot.com/2007/01/excel‐formula‐to‐calculate‐distance.html, accessed in 2009)) and the only close‐by market available for these reef fishermen is the salting facility in Hulhudhuffaaru (Figure 3 and 4), next to the island and a recently started salting facility on Angolhitheemu itself. However, prices paid by this facility are much lower than the resort prices, i.e. MRF 7/‐ per kilo of jacks, jobfishes, rainbow runners and MRF 4/‐ per kilo for the rest of the species.
Figure 2: Map of Noonu Atoll showing proximity between N. Lhohi (survey island) and Conrad Hilton Maldives Irufushi Resort and Spa (Resort market)
11 | M E M P R e e f F i s h e r y R e v i e w – M a r i n e R e s e a r c h C e n t r e
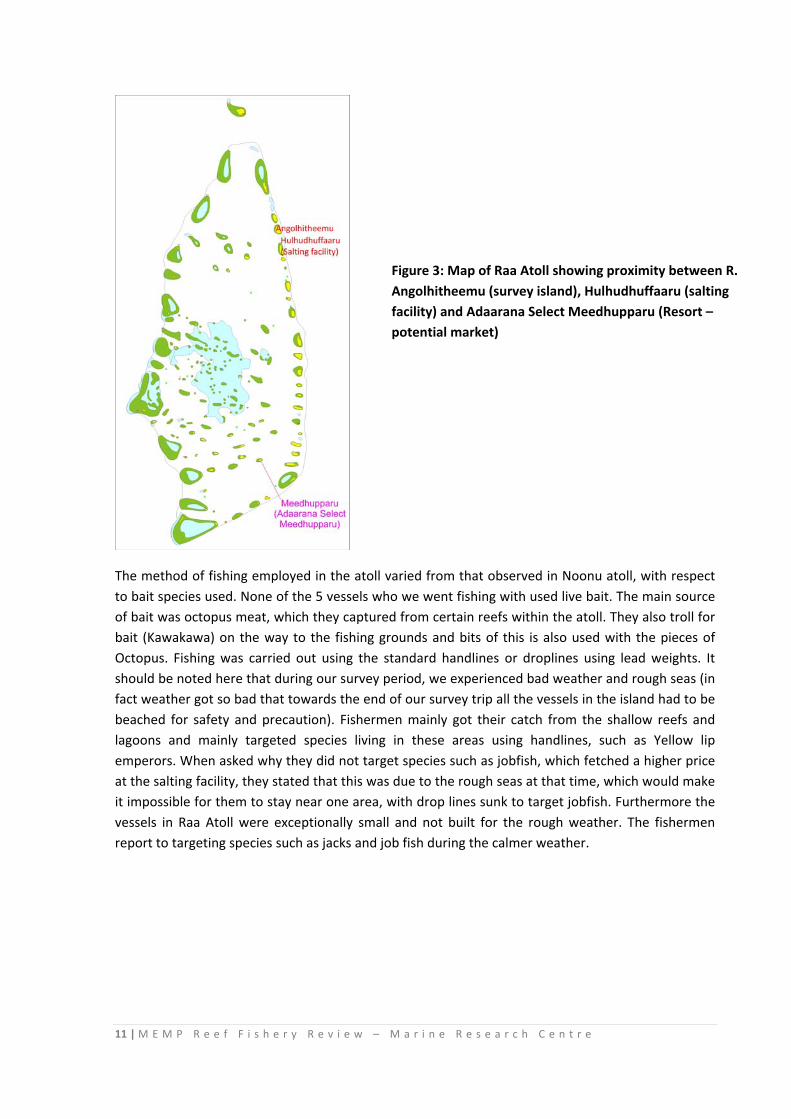
The method of fishing employed in the atoll varied from that observed in Noonu atoll, with respect to bait species used. None of the 5 vessels who we went fishing with used live bait. The main source of bait was octopus meat, which they captured from certain reefs within the atoll. They also troll for bait (Kawakawa) on the way to the fishing grounds and bits of this is also used with the pieces of Octopus. Fishing was carried out using the standard handlines or droplines using lead weights. It should be noted here that during our survey period, we experienced bad weather and rough seas (in fact weather got so bad that towards the end of our survey trip all the vessels in the island had to be beached for safety and precaution). Fishermen mainly got their catch from the shallow reefs and lagoons and mainly targeted species living in these areas using handlines, such as Yellow lip emperors. When asked why they did not target species such as jobfish, which fetched a higher price at the salting facility, they stated that this was due to the rough seas at that time, which would make it impossible for them to stay near one area, with drop lines sunk to target jobfish. Furthermore the vessels in Raa Atoll were exceptionally small and not built for the rough weather. The fishermen report to targeting species such as jacks and job fish during the calmer weather.
Figure 3: Map of Raa Atoll showing proximity between R. Angolhitheemu (survey island), Hulhudhuffaaru (salting facility) and Adaarana Select Meedhupparu (Resort – potential market)
12 | M E M P R e e f F i s h e r y R e v i e w – M a r i n e R e s e a r c h C e n t r e
Figure 4. Salting facility in R. Hulhudhuffaaru
According to the fishermen, they would be more willing to put more effort into live bait collection and the fishery as a whole if they had a better market. However, with the small‐scale market and smaller‐sized vessels, fishermen are less willing to spend more time and money on the fishery, in order to make this fishery their main income earning activity. Having said this, there was one fisherman who regularly went reef fishing and made his sole income through this activity.
3.1.3 Baa Atoll
Although B. Kudarikilu is known for its reef fishery, we decided to survey another island within the atoll as our previous trips for the reef fishery survey carried out in 2006/2007 and reef fish tagging was conducted from this island. Thus, we do have a good idea of the status of the fishery in the island. Our current survey was conducted from B. Kendhoo (Figure 5), where there is a small scale reef fishery. For a more accurate representation of the fishing effort in the atoll, the report will also look briefly at the fishery in B. Kudarikilu, i.e. their catch rates and species composition of catch, as the fishermen of Kudarikilu supply to most resorts in the atoll. For further details of the fishery in B. Kudarikilu please refer to Sattar (2008, 2009).
The fishermen salt and dry their catch themselves and then send it to Male’ on supply vessels to be sold to the exporters. Market prices for the salted and dried products were MRf20/‐ to MRf25/‐ per kilo for species such as Job fish, Jacks and Rainbow runner. Rest of the reef fish species were sold at MRF15/‐ per kilo. Other species such as Marlin, Wahoo, Dolphin fish and sharks fetch a price of MRF40/‐ to MRF50/‐ per kilo. It has to be noted here that, although reef shark fishing is banned from within 12 miles of all Maldivian atolls, some fishermen still admit to catching them on occasion since the buyers still purchase them, and at high prices. They also state that while the ban came into place from March 01, 2009, the fishermen have to date not been shown an alternative livelihood, which implicitly means that as long as the ban is not being strongly enforced, the fishing will still continue as long as there is a market.
13 | M E M P R e e f F i s h e r y R e v i e w – M a r i n e R e s e a r c h C e n t r e
There were 5 reef fishing vessels in B. Kendhoo, though only 2 went on regular reef fishing trips. There was one vessel which carries out different types of fishery, i.e. sea cucumber, reef shark (which they have now stopped) and reef fish. During the trip to the island, we realized that the additional vessels were going fishing since we were there and they were getting paid to go out with us. Once this was realized, the team paid more attention to go with the 2 vessels that regularly carry out fishing.
When enquired as to why they did not carry this out on a regular basis and with more effort, such as the use of livebait, when there was such a large market in the atoll (i.e. 6 resorts) fishermen stated that all resorts had contracts with fishermen from Kudarikilu. The only times they would contact the fishermen of Kendhoo was when the resorts were unable to get enough supply from the Kudarikilu fishermen. However, fishermen also state that they are hesitant to make any contracts with the resorts, because that would mean that they would have to go fishing everyday and get a large enough catch, i.e. they would need to invest more time, money and effort, which they are not ready to do so at the moment. Furthermore, it also means bigger vessels, collection of live‐bait and a larger number of crew, all of which are a bit difficult to obtain at the moment, as all the youth of the island are working in the nearby resorts. Additionally, the trips are now made with a small crew and mostly with people from within the families of the vessel owner. Thus they were not willing to make this commitment to the resorts. The fishermen hence prefer to carry out other activities for their main income earning activity, such as construction work on the island, and only prefer to go reef fishing if there is a demand from the resorts or the reef fish purchase vessel which visits the atoll on an occasional basis.
Figure 5. Map of Baa Atoll showing Kendhoo (survey Island), the potential markets (6 resorts) and Kudarikilu
14 | M E M P R e e f F i s h e r y R e v i e w – M a r i n e R e s e a r c h C e n t r e
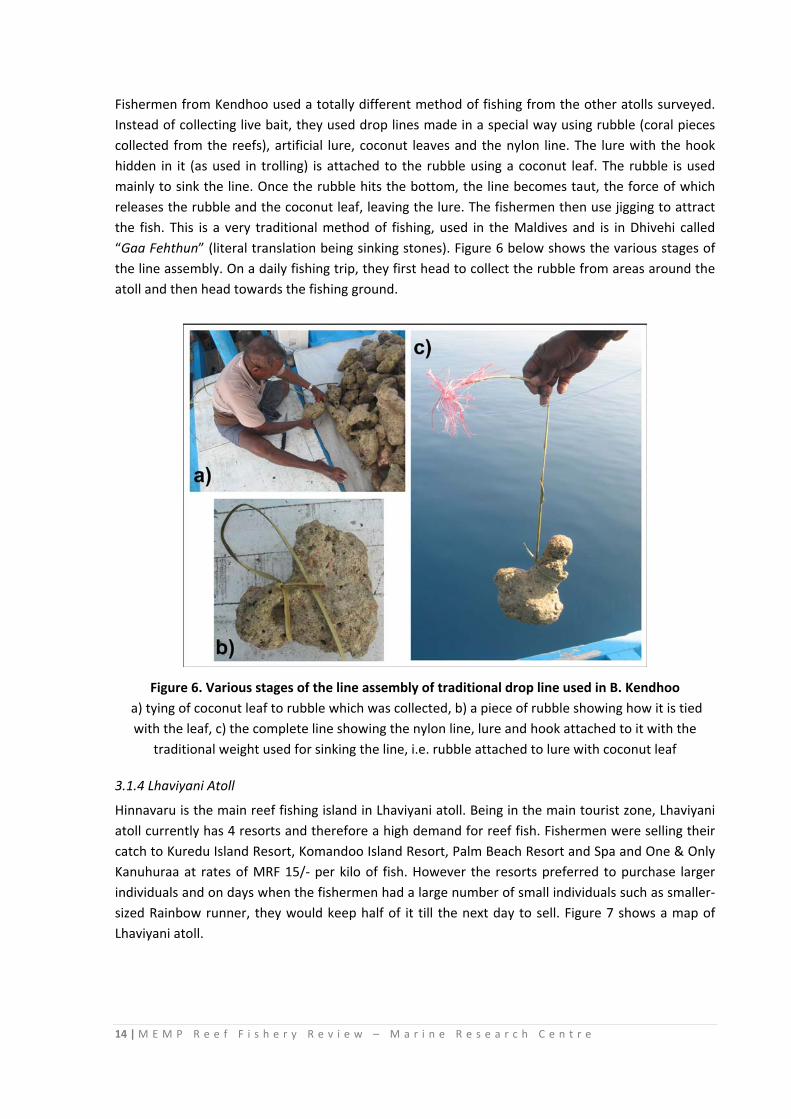
Fishermen from Kendhoo used a totally different method of fishing from the other atolls surveyed. Instead of collecting live bait, they used drop lines made in a special way using rubble (coral pieces collected from the reefs), artificial lure, coconut leaves and the nylon line. The lure with the hook hidden in it (as used in trolling) is attached to the rubble using a coconut leaf. The rubble is used mainly to sink the line. Once the rubble hits the bottom, the line becomes taut, the force of which releases the rubble and the coconut leaf, leaving the lure. The fishermen then use jigging to attract the fish. This is a very traditional method of fishing, used in the Maldives and is in Dhivehi called “Gaa Fehthun” (literal translation being sinking stones). Figure 6 below shows the various stages of the line assembly. On a daily fishing trip, they first head to collect the rubble from areas around the atoll and then head towards the fishing ground.
Figure 6. Various stages of the line assembly of traditional drop line used in B. Kendhoo a) tying of coconut leaf to rubble which was collected, b) a piece of rubble showing how it is tied with the leaf, c) the complete line showing the nylon line, lure and hook attached to it with the
traditional weight used for sinking the line, i.e. rubble attached to lure with coconut leaf
3.1.4 Lhaviyani Atoll
Hinnavaru is the main reef fishing island in Lhaviyani atoll. Being in the main tourist zone, Lhaviyani atoll currently has 4 resorts and therefore a high demand for reef fish. Fishermen were selling their catch to Kuredu Island Resort, Komandoo Island Resort, Palm Beach Resort and Spa and One & Only Kanuhuraa at rates of MRF 15/‐ per kilo of fish. However the resorts preferred to purchase larger individuals and on days when the fishermen had a large number of small individuals such as smaller‐sized Rainbow runner, they would keep half of it till the next day to sell. Figure 7 shows a map of Lhaviyani atoll.
15 | M E M P R e e f F i s h e r y R e v i e w – M a r i n e R e s e a r c h C e n t r e
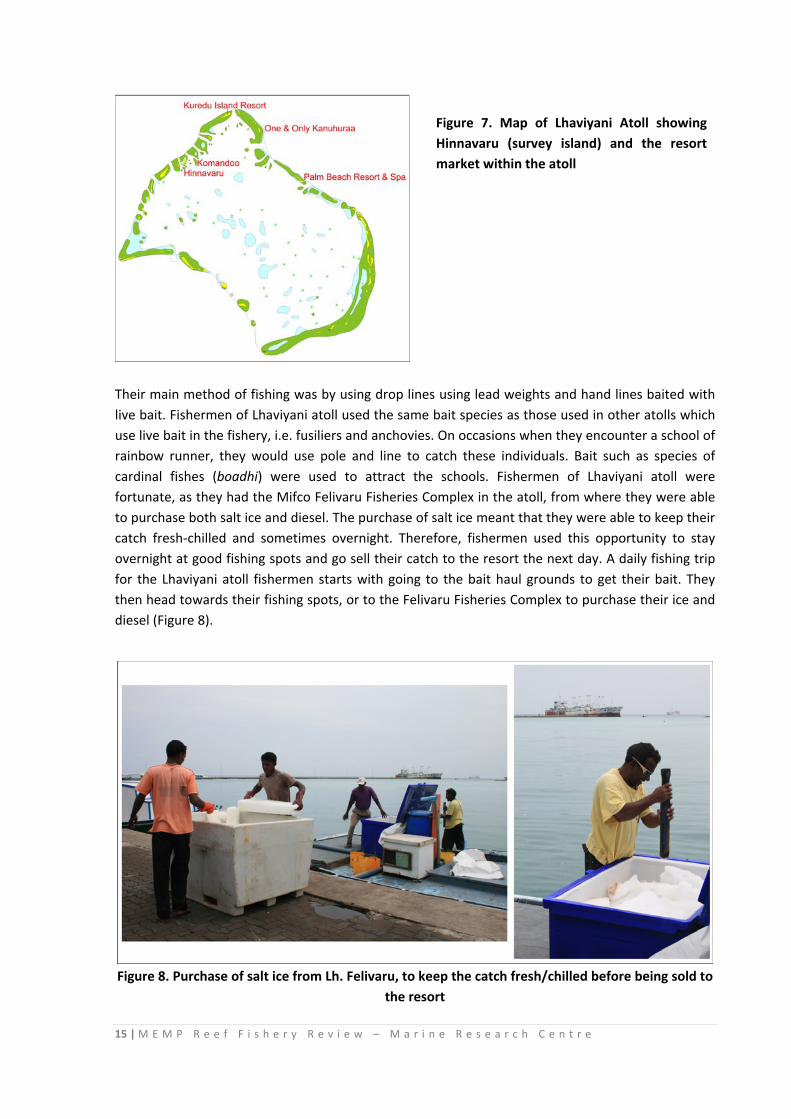
Their main method of fishing was by using drop lines using lead weights and hand lines baited with live bait. Fishermen of Lhaviyani atoll used the same bait species as those used in other atolls which use live bait in the fishery, i.e. fusiliers and anchovies. On occasions when they encounter a school of rainbow runner, they would use pole and line to catch these individuals. Bait such as species of cardinal fishes (boadhi) were used to attract the schools. Fishermen of Lhaviyani atoll were fortunate, as they had the Mifco Felivaru Fisheries Complex in the atoll, from where they were able to purchase both salt ice and diesel. The purchase of salt ice meant that they were able to keep their catch fresh‐chilled and sometimes overnight. Therefore, fishermen used this opportunity to stay overnight at good fishing spots and go sell their catch to the resort the next day. A daily fishing trip for the Lhaviyani atoll fishermen starts with going to the bait haul grounds to get their bait. They then head towards their fishing spots, or to the Felivaru Fisheries Complex to purchase their ice and diesel (Figure 8).
Figure 8. Purchase of salt ice from Lh. Felivaru, to keep the catch fresh/chilled before being sold to
the resort
Figure 7. Map of Lhaviyani Atoll showing Hinnavaru (survey island) and the resort market within the atoll
16 | M E M P R e e f F i s h e r y R e v i e w – M a r i n e R e s e a r c h C e n t r e
Salt ice was sold to the fishermen at a rate of approximately 37 Laari per kilo of salt ice. The ice is kept in large ice chests on board. The fishermen then head towards the fishing grounds, where if the catch is good, they at times choose to spend the night at the spot as this is when the best fishing occurs. They then sell their catch prior to returning to the island the next day or go to the resort at the time specified by the resort. Photo plates in Appendix 2 depict the various operations carried out by the fishermen of the 4 atolls on their daily fishing trips.
3.2 Bait haul and fishing locations
3.2.1 Time and effort spent on bait haul
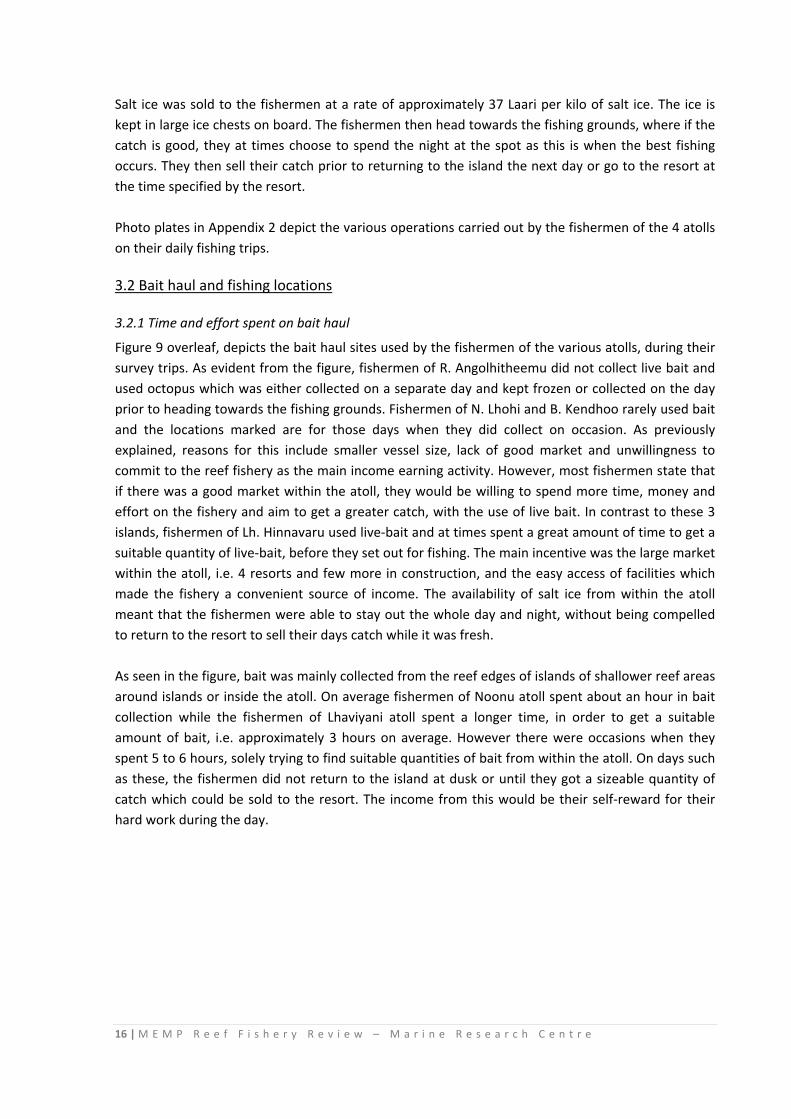
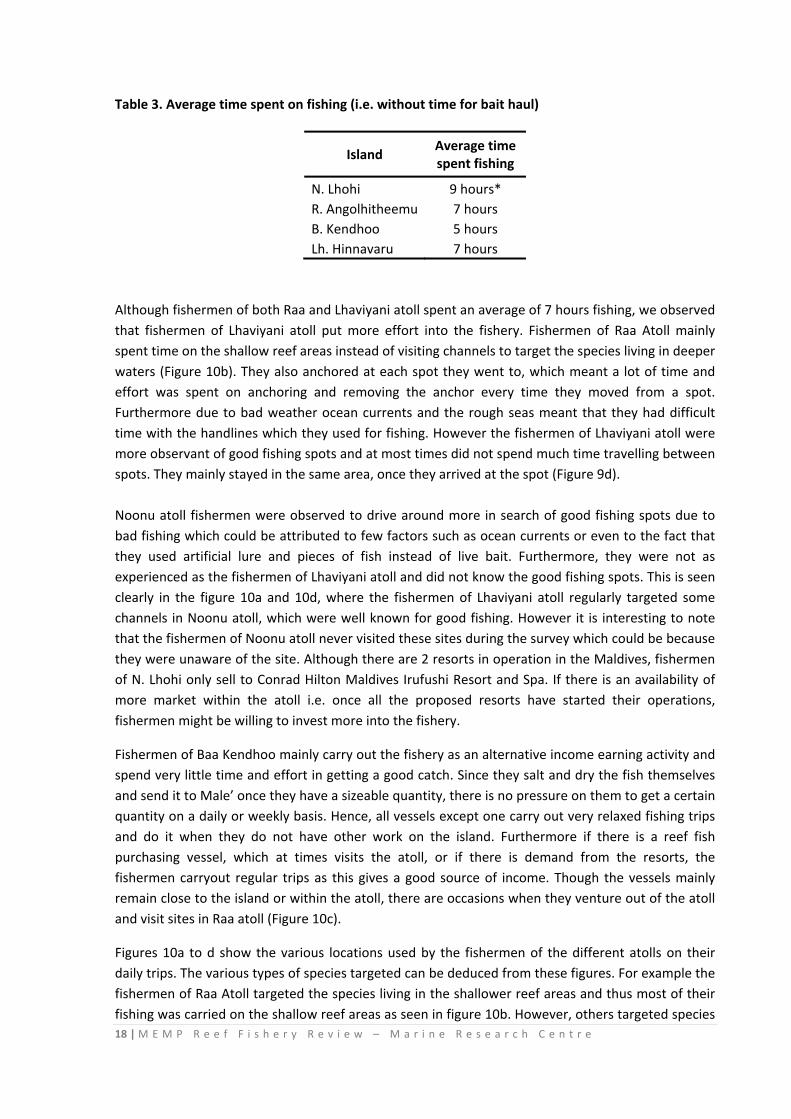
Figure 9 overleaf, depicts the bait haul sites used by the fishermen of the various atolls, during their survey trips. As evident from the figure, fishermen of R. Angolhitheemu did not collect live bait and used octopus which was either collected on a separate day and kept frozen or collected on the day prior to heading towards the fishing grounds. Fishermen of N. Lhohi and B. Kendhoo rarely used bait and the locations marked are for those days when they did collect on occasion. As previously explained, reasons for this include smaller vessel size, lack of good market and unwillingness to commit to the reef fishery as the main income earning activity. However, most fishermen state that if there was a good market within the atoll, they would be willing to spend more time, money and effort on the fishery and aim to get a greater catch, with the use of live bait. In contrast to these 3 islands, fishermen of Lh. Hinnavaru used live‐bait and at times spent a great amount of time to get a suitable quantity of live‐bait, before they set out for fishing. The main incentive was the large market within the atoll, i.e. 4 resorts and few more in construction, and the easy access of facilities which made the fishery a convenient source of income. The availability of salt ice from within the atoll meant that the fishermen were able to stay out the whole day and night, without being compelled to return to the resort to sell their days catch while it was fresh. As seen in the figure, bait was mainly collected from the reef edges of islands of shallower reef areas around islands or inside the atoll. On average fishermen of Noonu atoll spent about an hour in bait collection while the fishermen of Lhaviyani atoll spent a longer time, in order to get a suitable amount of bait, i.e. approximately 3 hours on average. However there were occasions when they spent 5 to 6 hours, solely trying to find suitable quantities of bait from within the atoll. On days such as these, the fishermen did not return to the island at dusk or until they got a sizeable quantity of catch which could be sold to the resort. The income from this would be their self‐reward for their hard work during the day.
17 | M E M P R e e f F i s h e r y R e v i e w – M a r i n e R e s e a r c h C e n t r e
Figure 9. Bait haul locations of fishermen of Noonu (red), Baa (orange) and Lhaviyani (blue) atolls
3.2.2 Time and effort spent on fishing
Time spent on fishing varied between the islands depending on time and effort invested into the fishery as well as the weather. Table 3 shows the average time spent on fishing by the fishermen of the 4 atolls. This is the time elapsed between the point in time when fishing lines were thrown into the water at the first fishing spot and the point in time when the lines were reeled in at the end of the days fishing. It should be noted that time spent travelling between fishing spots have not been deducted.
18 | M E M P R e e f F i s h e r y R e v i e w – M a r i n e R e s e a r c h C e n t r e
Table 3. Average time spent on fishing (i.e. without time for bait haul)
Island Average time spent fishing
N. Lhohi 9 hours* R. Angolhitheemu 7 hours B. Kendhoo 5 hours Lh. Hinnavaru 7 hours
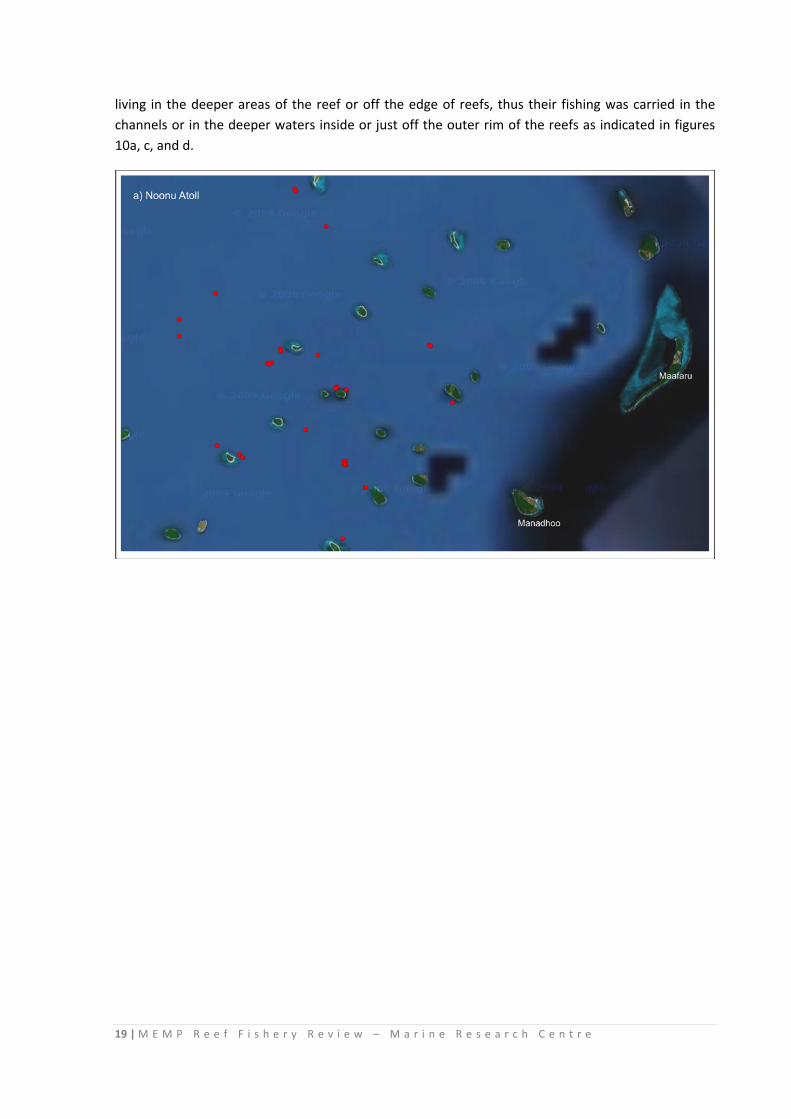
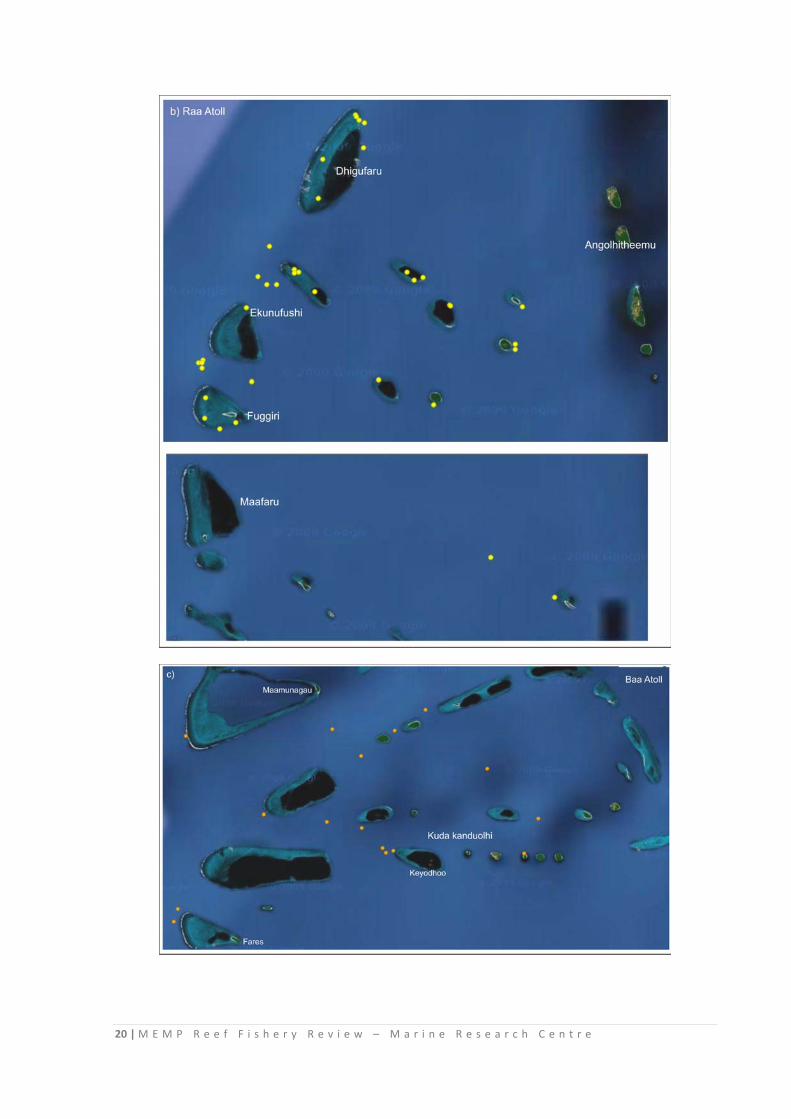
Although fishermen of both Raa and Lhaviyani atoll spent an average of 7 hours fishing, we observed that fishermen of Lhaviyani atoll put more effort into the fishery. Fishermen of Raa Atoll mainly spent time on the shallow reef areas instead of visiting channels to target the species living in deeper waters (Figure 10b). They also anchored at each spot they went to, which meant a lot of time and effort was spent on anchoring and removing the anchor every time they moved from a spot. Furthermore due to bad weather ocean currents and the rough seas meant that they had difficult time with the handlines which they used for fishing. However the fishermen of Lhaviyani atoll were more observant of good fishing spots and at most times did not spend much time travelling between spots. They mainly stayed in the same area, once they arrived at the spot (Figure 9d). Noonu atoll fishermen were observed to drive around more in search of good fishing spots due to bad fishing which could be attributed to few factors such as ocean currents or even to the fact that they used artificial lure and pieces of fish instead of live bait. Furthermore, they were not as experienced as the fishermen of Lhaviyani atoll and did not know the good fishing spots. This is seen clearly in the figure 10a and 10d, where the fishermen of Lhaviyani atoll regularly targeted some channels in Noonu atoll, which were well known for good fishing. However it is interesting to note that the fishermen of Noonu atoll never visited these sites during the survey which could be because they were unaware of the site. Although there are 2 resorts in operation in the Maldives, fishermen of N. Lhohi only sell to Conrad Hilton Maldives Irufushi Resort and Spa. If there is an availability of more market within the atoll i.e. once all the proposed resorts have started their operations, fishermen might be willing to invest more into the fishery.
Fishermen of Baa Kendhoo mainly carry out the fishery as an alternative income earning activity and spend very little time and effort in getting a good catch. Since they salt and dry the fish themselves and send it to Male’ once they have a sizeable quantity, there is no pressure on them to get a certain quantity on a daily or weekly basis. Hence, all vessels except one carry out very relaxed fishing trips and do it when they do not have other work on the island. Furthermore if there is a reef fish purchasing vessel, which at times visits the atoll, or if there is demand from the resorts, the fishermen carryout regular trips as this gives a good source of income. Though the vessels mainly remain close to the island or within the atoll, there are occasions when they venture out of the atoll and visit sites in Raa atoll (Figure 10c).
Figures 10a to d show the various locations used by the fishermen of the different atolls on their daily trips. The various types of species targeted can be deduced from these figures. For example the fishermen of Raa Atoll targeted the species living in the shallower reef areas and thus most of their fishing was carried on the shallow reef areas as seen in figure 10b. However, others targeted species
19 | M E M P R e e f F i s h e r y R e v i e w – M a r i n e R e s e a r c h C e n t r e
living in the deeper areas of the reef or off the edge of reefs, thus their fishing was carried in the channels or in the deeper waters inside or just off the outer rim of the reefs as indicated in figures 10a, c, and d.
20 | M E M P R e e f F i s h e r y R e v i e w – M a r i n e R e s e a r c h C e n t r e
21 | M E M P R e e f F i s h e r y R e v i e w – M a r i n e R e s e a r c h C e n t r e
Figure 10: Fishing locations of the fishermen of a) Noonu, b) Raa, c) Baa and d) Lhaviyani Atolls.
Another point of interest is the difference in sites used by the fishermen from Lhaviyani atoll who visited Noonu atoll on their fishing trips and the local fishermen of Noonu atoll. There was no overlap in these sites during the survey trip although the sites visited by the Lhaviyani atoll fishermen were not very far from those used by the Noonu atoll fishermen. This could be for various
22 | M E M P R e e f F i s h e r y R e v i e w – M a r i n e R e s e a r c h C e n t r e
reasons such as lack of knowledge regarding these sites, or smaller vessels used by the Noonu atoll fishermen.
Furthermore, one critical point is the fact that fishermen of Lhaviyani atoll still carry on fishing in Kuredu Express (i.e. Kuredu kanduolhi or Kuredu channel), although it has been declared a protected area. Although we informed them that this is a protected area, they feigned ignorance and stated that they thought it was the other side of the resort which was protected. Fishermen also state that although it is protected, even the resort vessels fish from the site which is why they fish from there as well. However, for the duration of our trip, we did not come across any vessels from the resort that was using the site. However, what makes it more difficult for us to enforce these rules with the fishermen is the fact that resorts at times break these rules as well, and fishermen feel that since the resorts are able to get away with it, there is no reason they should be penalized, which is just. We came across resort vessels which were dumping waste inside the atoll, which is not allowed. However no action is taken against these vessels, thus it is always difficult for us to enforce rules for one party while the other gets away with breaking the rules.
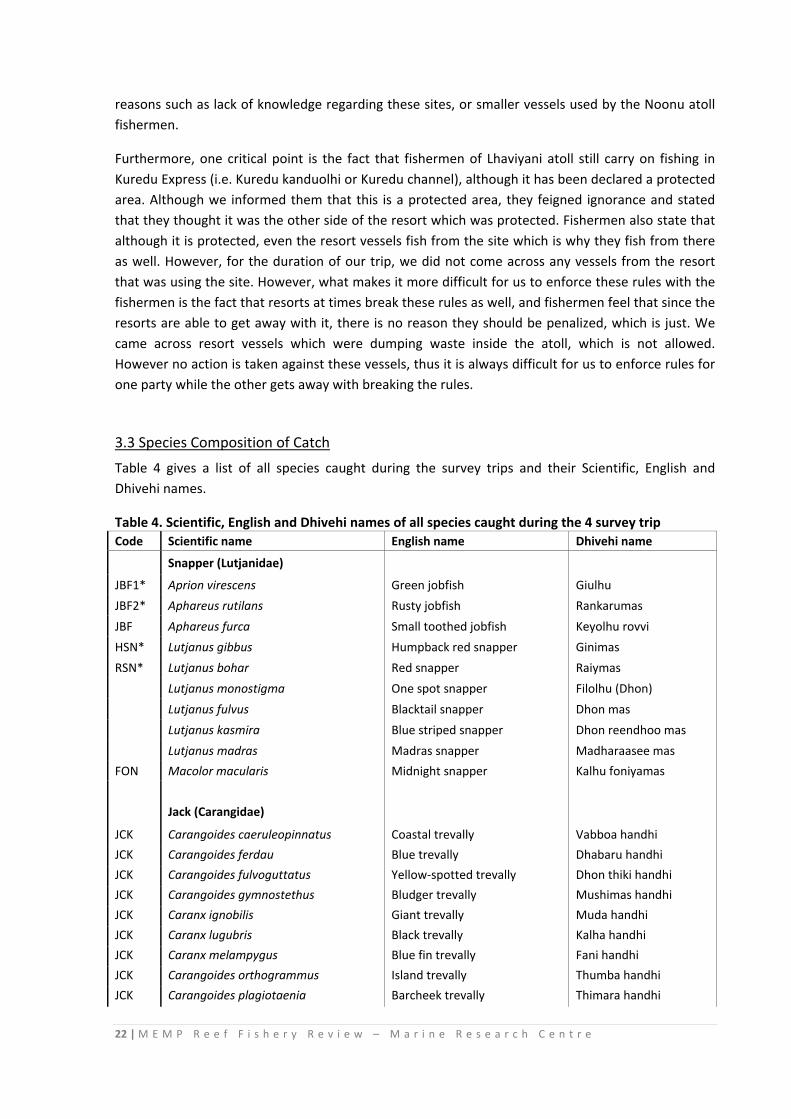
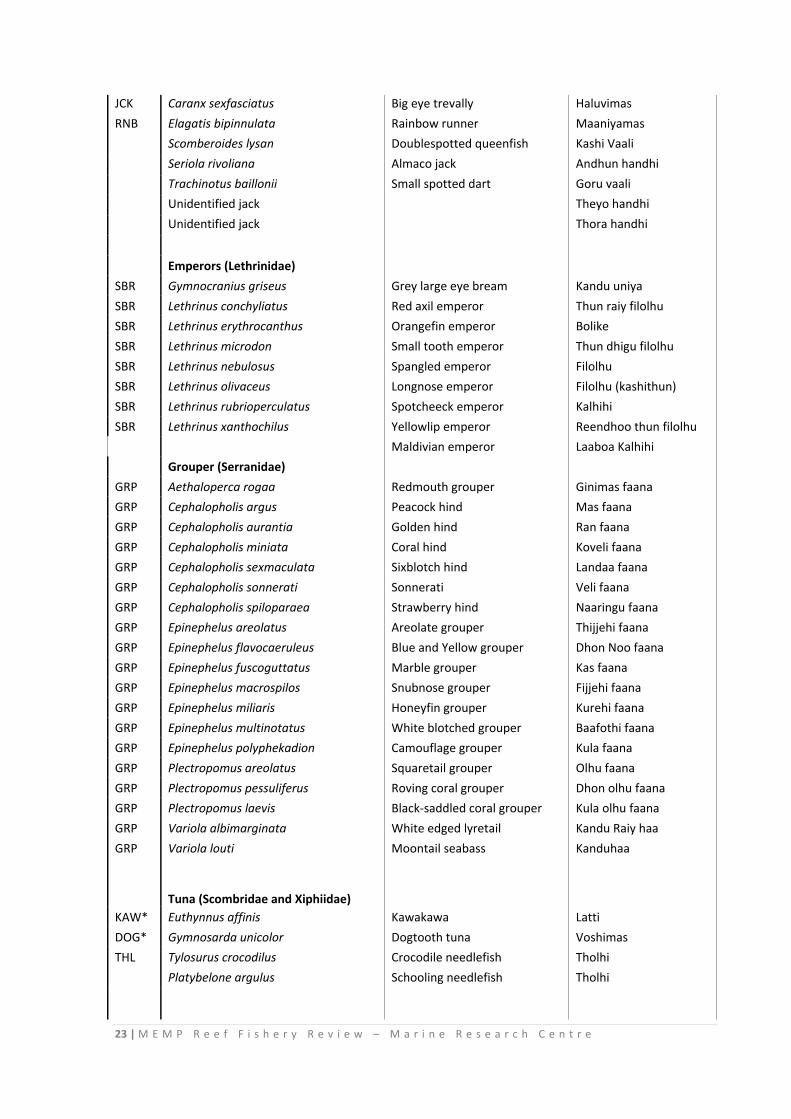
3.3 Species Composition of Catch
Table 4 gives a list of all species caught during the survey trips and their Scientific, English and Dhivehi names.
Table 4. Scientific, English and Dhivehi names of all species caught during the 4 survey trip Code Scientific name English name Dhivehi name
Snapper (Lutjanidae)
JBF1* Aprion virescens Green jobfish Giulhu
JBF2* Aphareus rutilans Rusty jobfish Rankarumas
JBF Aphareus furca Small toothed jobfish Keyolhu rovvi
HSN* Lutjanus gibbus Humpback red snapper Ginimas
RSN* Lutjanus bohar Red snapper Raiymas
Lutjanus monostigma One spot snapper Filolhu (Dhon)
Lutjanus fulvus Blacktail snapper Dhon mas
Lutjanus kasmira Blue striped snapper Dhon reendhoo mas
Lutjanus madras Madras snapper Madharaasee mas
FON Macolor macularis Midnight snapper Kalhu foniyamas
Jack (Carangidae)
JCK Carangoides caeruleopinnatus Coastal trevally Vabboa handhi
JCK Carangoides ferdau Blue trevally Dhabaru handhi
JCK Carangoides fulvoguttatus Yellow‐spotted trevally Dhon thiki handhi
JCK Carangoides gymnostethus Bludger trevally Mushimas handhi
JCK Caranx ignobilis Giant trevally Muda handhi
JCK Caranx lugubris Black trevally Kalha handhi
JCK Caranx melampygus Blue fin trevally Fani handhi
JCK Carangoides orthogrammus Island trevally Thumba handhi
JCK Carangoides plagiotaenia Barcheek trevally Thimara handhi
23 | M E M P R e e f F i s h e r y R e v i e w – M a r i n e R e s e a r c h C e n t r e
JCK Caranx sexfasciatus Big eye trevally Haluvimas
RNB Elagatis bipinnulata Rainbow runner Maaniyamas
Scomberoides lysan Doublespotted queenfish Kashi Vaali
Seriola rivoliana Almaco jack Andhun handhi
Trachinotus baillonii Small spotted dart Goru vaali
Unidentified jack Theyo handhi
Unidentified jack Thora handhi
Emperors (Lethrinidae)
SBR Gymnocranius griseus Grey large eye bream Kandu uniya
SBR Lethrinus conchyliatus Red axil emperor Thun raiy filolhu
SBR Lethrinus erythrocanthus Orangefin emperor Bolike
SBR Lethrinus microdon Small tooth emperor Thun dhigu filolhu
SBR Lethrinus nebulosus Spangled emperor Filolhu
SBR Lethrinus olivaceus Longnose emperor Filolhu (kashithun)
SBR Lethrinus rubrioperculatus Spotcheeck emperor Kalhihi
SBR Lethrinus xanthochilus Yellowlip emperor Reendhoo thun filolhu
Maldivian emperor Laaboa Kalhihi
Grouper (Serranidae)
GRP Aethaloperca rogaa Redmouth grouper Ginimas faana
GRP Cephalopholis argus Peacock hind Mas faana
GRP Cephalopholis aurantia Golden hind Ran faana
GRP Cephalopholis miniata Coral hind Koveli faana
GRP Cephalopholis sexmaculata Sixblotch hind Landaa faana
GRP Cephalopholis sonnerati Sonnerati Veli faana
GRP Cephalopholis spiloparaea Strawberry hind Naaringu faana
GRP Epinephelus areolatus Areolate grouper Thijjehi faana
GRP Epinephelus flavocaeruleus Blue and Yellow grouper Dhon Noo faana
GRP Epinephelus fuscoguttatus Marble grouper Kas faana
GRP Epinephelus macrospilos Snubnose grouper Fijjehi faana
GRP Epinephelus miliaris Honeyfin grouper Kurehi faana
GRP Epinephelus multinotatus White blotched grouper Baafothi faana
GRP Epinephelus polyphekadion Camouflage grouper Kula faana
GRP Plectropomus areolatus Squaretail grouper Olhu faana
GRP Plectropomus pessuliferus Roving coral grouper Dhon olhu faana
GRP Plectropomus laevis Black‐saddled coral grouper Kula olhu faana
GRP Variola albimarginata White edged lyretail Kandu Raiy haa
GRP Variola louti Moontail seabass Kanduhaa
Tuna (Scombridae and Xiphiidae)
KAW* Euthynnus affinis Kawakawa Latti
DOG* Gymnosarda unicolor Dogtooth tuna Voshimas
THL Tylosurus crocodilus Crocodile needlefish Tholhi
Platybelone argulus Schooling needlefish Tholhi
24 | M E M P R e e f F i s h e r y R e v i e w – M a r i n e R e s e a r c h C e n t r e
Barracuda (Sphyraenidae)
THL Sphyreana forsteri Bigeye barracuda Faru tholhi
THL Sphyreana barracuda Great barracuda Maa tholhi
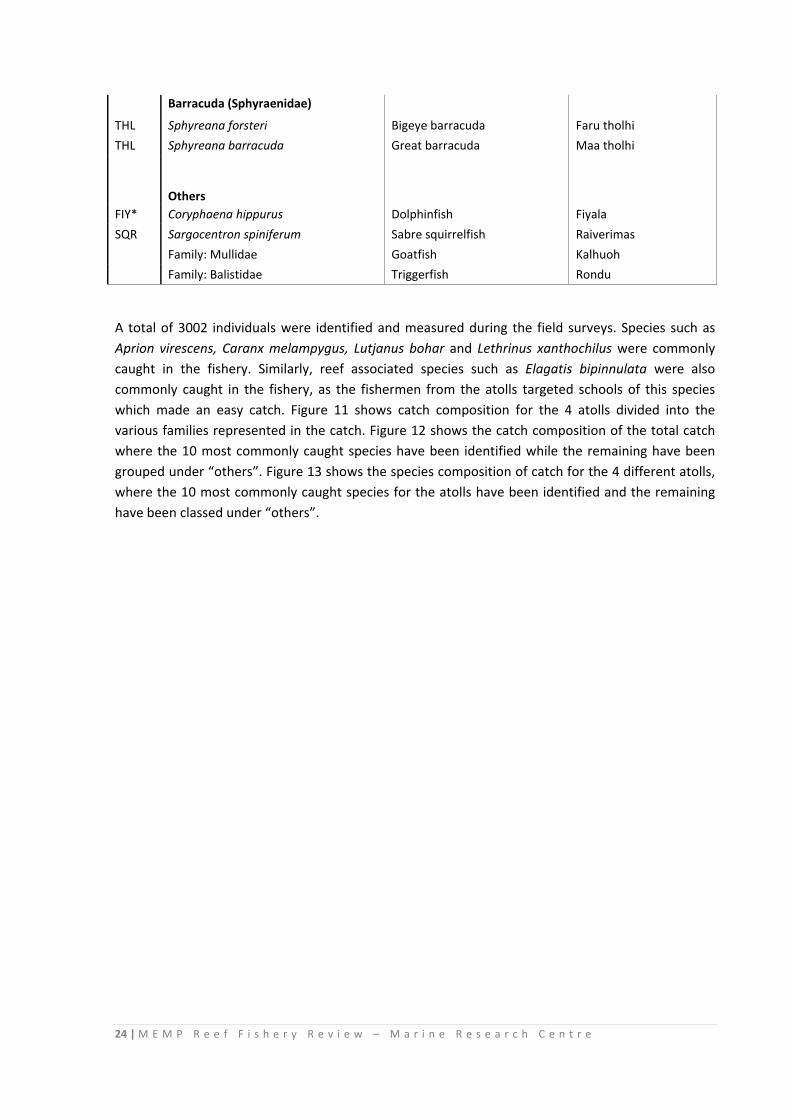
Others
FIY* Coryphaena hippurus Dolphinfish Fiyala
SQR Sargocentron spiniferum Sabre squirrelfish Raiverimas
Family: Mullidae Goatfish Kalhuoh
Family: Balistidae Triggerfish Rondu
A total of 3002 individuals were identified and measured during the field surveys. Species such as Aprion virescens, Caranx melampygus, Lutjanus bohar and Lethrinus xanthochilus were commonly caught in the fishery. Similarly, reef associated species such as Elagatis bipinnulata were also commonly caught in the fishery, as the fishermen from the atolls targeted schools of this species which made an easy catch. Figure 11 shows catch composition for the 4 atolls divided into the various families represented in the catch. Figure 12 shows the catch composition of the total catch where the 10 most commonly caught species have been identified while the remaining have been grouped under “others”. Figure 13 shows the species composition of catch for the 4 different atolls, where the 10 most commonly caught species for the atolls have been identified and the remaining have been classed under “others”.
25 | M E M P R e e f F i s h e r y R e v i e w – M a r i n e R e s e a r c h C e n t r e
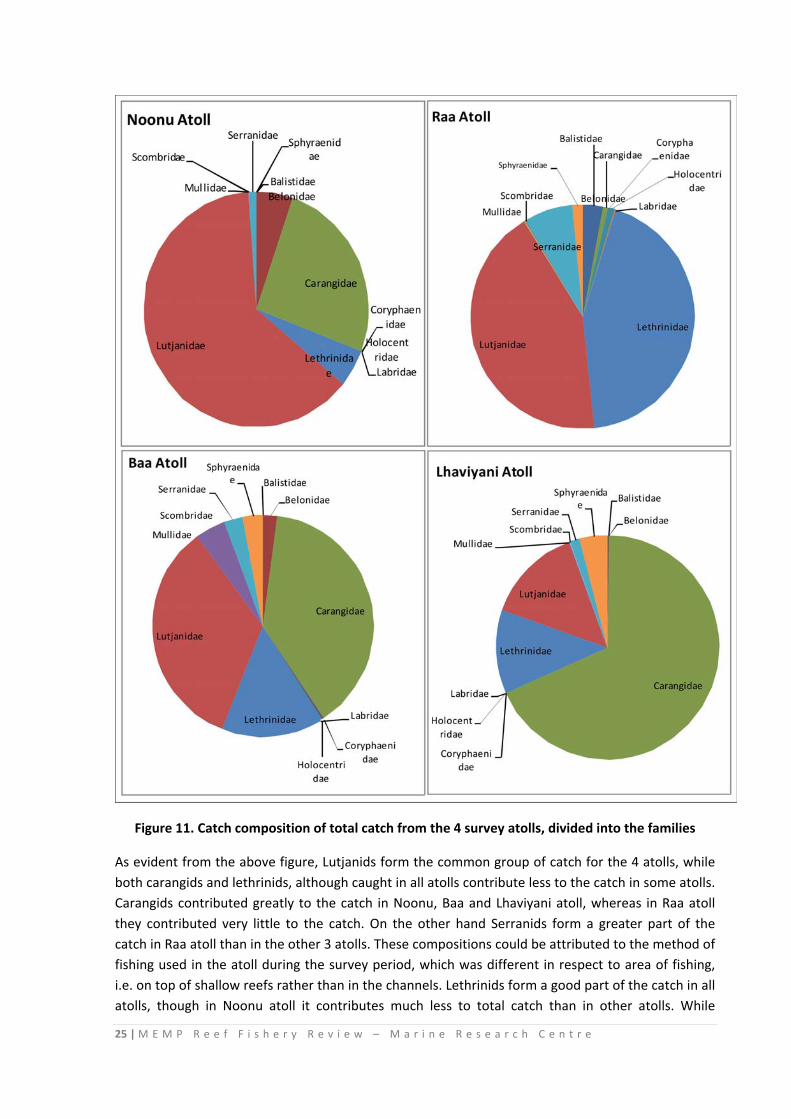
Figure 11. Catch composition of total catch from the 4 survey atolls, divided into the families
As evident from the above figure, Lutjanids form the common group of catch for the 4 atolls, while both carangids and lethrinids, although caught in all atolls contribute less to the catch in some atolls. Carangids contributed greatly to the catch in Noonu, Baa and Lhaviyani atoll, whereas in Raa atoll they contributed very little to the catch. On the other hand Serranids form a greater part of the catch in Raa atoll than in the other 3 atolls. These compositions could be attributed to the method of fishing used in the atoll during the survey period, which was different in respect to area of fishing, i.e. on top of shallow reefs rather than in the channels. Lethrinids form a good part of the catch in all atolls, though in Noonu atoll it contributes much less to total catch than in other atolls. While
26 | M E M P R e e f F i s h e r y R e v i e w – M a r i n e R e s e a r c h C e n t r e
fishermen from Lhaviyani atoll visited Noonu atoll and got a good catch of Lethrinids from the atoll, the local fishermen from the atoll however did not visit the areas used by the Lhaviyani atoll fishermen. This could be a possible contributing factor towards the varying family compositions. Figure 13 looks at the species composition of the catch from the 4 atolls and differences in the species shows the reason for the varying family compositions for the 4 atolls.
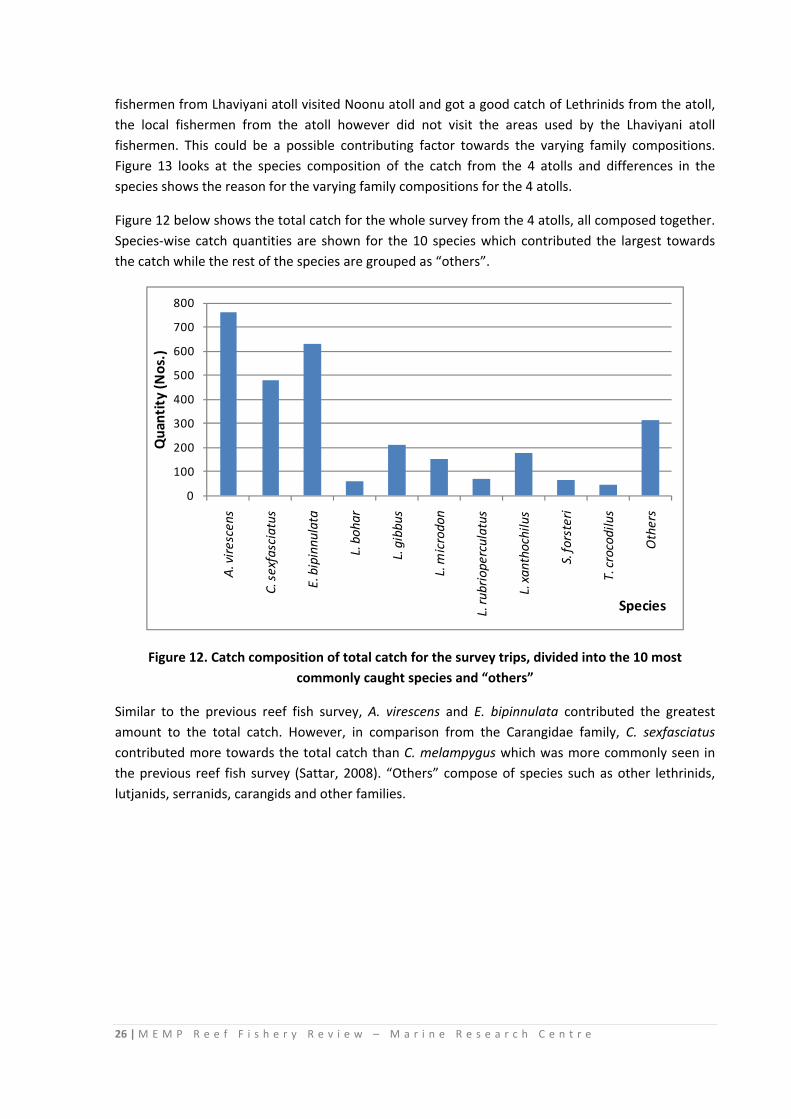
Figure 12 below shows the total catch for the whole survey from the 4 atolls, all composed together. Species‐wise catch quantities are shown for the 10 species which contributed the largest towards the catch while the rest of the species are grouped as “others”.
0
100
200
300
400
500
600
700
800
A. virescens
C. sexfasciatus
E. bipinnulata
L. bohar
L. gibbus
L. microdon
L. rubrioperculatus
L. xanthochilus
S. forsteri
T. crocodilus
Others
Quantity (Nos.)
Species
Figure 12. Catch composition of total catch for the survey trips, divided into the 10 most commonly caught species and “others”
Similar to the previous reef fish survey, A. virescens and E. bipinnulata contributed the greatest amount to the total catch. However, in comparison from the Carangidae family, C. sexfasciatus contributed more towards the total catch than C. melampygus which was more commonly seen in the previous reef fish survey (Sattar, 2008). “Others” compose of species such as other lethrinids, lutjanids, serranids, carangids and other families.

27 | M E M P R e e f F i s h e r y R e v i e w – M a r i n e R e s e a r c h C e n t r e
0
100
200
300
400
500
A. virescens
C. sexfasciatus
E. bipinnu
lata
L. boh
ar
L. gibbu
s
L. microdon
L. ru
brioperculatus
L. xan
thochilus
S. forsteri
T. crocodilus
Others
Quantity (Nos)
Species
Noonu
0
60
120
180
A. virescens
C. sexfasciatus
E. bipinnu
lata
L. boh
ar
L. gibbu
s
L. microdon
L. ru
brioperculatus
L. xan
thochilus
S. forsteri
T. crocodilus
Others
Quantity (Nos)
Species
Raa
0
100
200
300
400
500
A. virescens
C. sexfasciatus
E. bipinnu
lata
L. boh
ar
L. gibbu
s
L. microdon
L. ru
brioperculatus
L. xan
thochilus
S. forsteri
T. crocodilus
Others
Quantity (Nos.)
Species
Lhaviyani
0
20
40
60
80
100
120
A. virescens
C. sexfasciatus
E. bipinnu
lata
L. boh
ar
L. gibbu
s
L. microdon
L. ru
brioperculatus
L. xan
thochilus
S. forsteri
T. crocodilus
Others
Quantity (Nos.)
Species
Baa
Figure 13. Catch composition by species of the 10 most commonly caught species from each atoll and “others”
As with the total catch, one common species amongst all atolls is A. virescens, which although contributed varying amounts to catch in varying atolls, were caught in all the atolls. While it contributed between 11‐13% in Raa, Baa and Lhaviyani atolls, A. virescens composed the majority of the catch (61%) in Noonu atoll. T. crocodilus, which was rarely caught from other atolls, was the 3rd most common species to be caught in the Noonu Atoll fishery. Although this is a commonly seen fish in other atolls, fishermen discard these or throw them back into the ocean as these are not valued or preferred by the resorts. E. bipinnulata which has always been commonly caught in the reef fisheries surveys, was very rarely caught in Raa Atoll (0.1% of total catch from the atoll), due to their fishing method employed at the time of survey, i.e. fishing on top of shallow reef areas. On the other hand, L. xanthochilus which rarely occurred in the catch from other atolls formed the main catch component of Raa Atoll. However, E. bipinnulata contributed most to the total catch of Baa Atoll fishermen, as these fishermen especially target schools of this species which enter the atoll. Since the fishermen of Baa Atoll salt, dry and sell the fish themselves they prefer to get their catch from fish which are easily caught and in high quantities, thus spending less time and effort on the actual fishing. However, fishermen of B. Kudarikilu put the same effort into the fishery as those of Lhaviyani
28 | M E M P R e e f F i s h e r y R e v i e w – M a r i n e R e s e a r c h C e n t r e
atoll and previous studies show that their main catch comprises of A. virescens, C. melampygus, E. bipinnulata, L. bohar and L. olivaceus as well as other species belonging to the Carangid, Lutjanid and Lethrinid families.
In comparison to fishermen of B. Kendhoo, fishermen of other atolls have to cater to the resorts and thus target species which are preferred by the resorts such as larger individuals or individuals which have a longer shelf life. Although fishermen of Lhaviyani atoll also caught large numbers of E. bipinnulata, it was observed that they had difficulty selling them since the individuals were of smaller size. Resorts in Lhaviyani atoll preferred larger species, which determines the reason for large number of C. sexfasciatus which were caught by the fishermen. The fishermen especially target larger individuals of these species and those of the Lethrinid species such as L. microdon and have identified sites around the atoll and in other atolls where they are likely to get aggregations of these species.
3.4 Size composition of catch
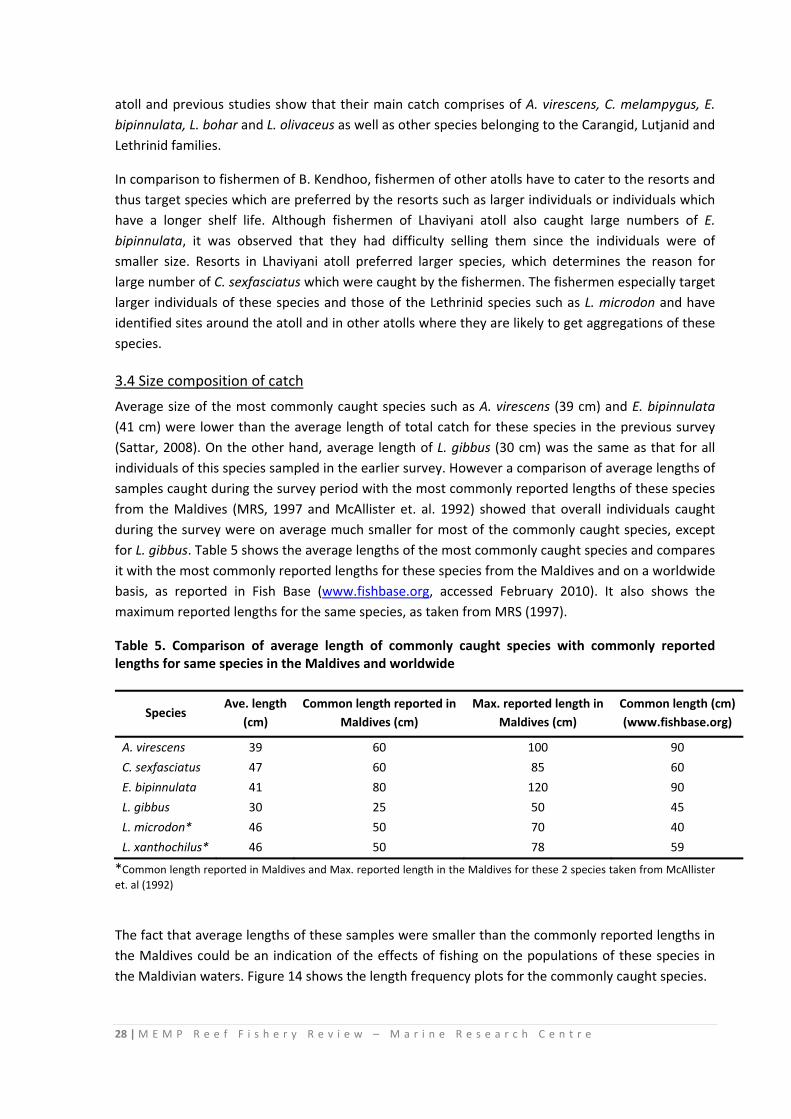
Average size of the most commonly caught species such as A. virescens (39 cm) and E. bipinnulata (41 cm) were lower than the average length of total catch for these species in the previous survey (Sattar, 2008). On the other hand, average length of L. gibbus (30 cm) was the same as that for all individuals of this species sampled in the earlier survey. However a comparison of average lengths of samples caught during the survey period with the most commonly reported lengths of these species from the Maldives (MRS, 1997 and McAllister et. al. 1992) showed that overall individuals caught during the survey were on average much smaller for most of the commonly caught species, except for L. gibbus. Table 5 shows the average lengths of the most commonly caught species and compares it with the most commonly reported lengths for these species from the Maldives and on a worldwide basis, as reported in Fish Base (www.fishbase.org, accessed February 2010). It also shows the maximum reported lengths for the same species, as taken from MRS (1997).
Table 5. Comparison of average length of commonly caught species with commonly reported lengths for same species in the Maldives and worldwide
Species Ave. length
(cm) Common length reported in
Maldives (cm) Max. reported length in
Maldives (cm) Common length (cm) (www.fishbase.org)
A. virescens 39 60 100 90
C. sexfasciatus 47 60 85 60
E. bipinnulata 41 80 120 90
L. gibbus 30 25 50 45
L. microdon* 46 50 70 40
L. xanthochilus* 46 50 78 59
*Common length reported in Maldives and Max. reported length in the Maldives for these 2 species taken from McAllister et. al (1992)
The fact that average lengths of these samples were smaller than the commonly reported lengths in the Maldives could be an indication of the effects of fishing on the populations of these species in the Maldivian waters. Figure 14 shows the length frequency plots for the commonly caught species.
29 | M E M P R e e f F i s h e r y R e v i e w – M a r i n e R e s e a r c h C e n t r e
0
50
100
150
20 24 28 32 36 40 44 48 52 56 60 64 68 72 76 80 84
Freq
uency
Length (cm)
A. virescensAve. length ‐ 39 cmn = 763
0
20
40
60
80
100
34 38 42 46 50 54 58 62 66 70 74 78
Freq
uency
Length (cm)
C. sexfasciatusAve. length ‐47 cmn = 479
0
50
100
150
20 24 28 32 36 40 44 48 52 56 60 64 68 72 76 80 84
Freq
uency
Length (cm)
E. bipinnulataAve. length ‐41 cmn = 630
0
10
20
30
40
50
20 22 24 26 28 30 32 34 36 38 40 42 44 46 48 50
Freq
uency
Length (cm)
L. gibbusAve. length ‐30 cmn = 210
0
5
10
15
20
25
20 24 28 32 36 40 44 48 52 56 60 64 68 72 76 80
Freq
uency
Length (cm)
L. microdonAve. length ‐ 46cmn = 155
0
10
20
30
40
20 26 32 38 44 50 56 62 68 74 80 86 92 98
Freq
uency
Length (cm)
L. xanthochilusAve. length ‐46cmn = 176
*
*
**
* *
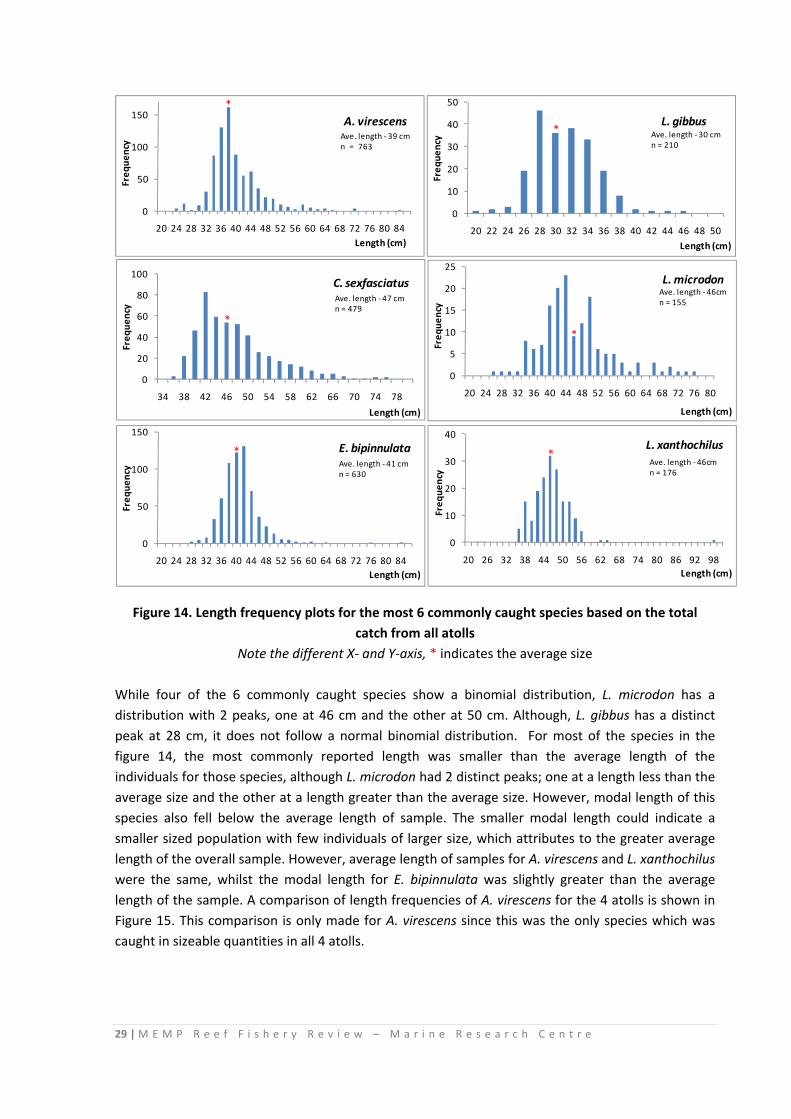
Figure 14. Length frequency plots for the most 6 commonly caught species based on the total catch from all atolls
Note the different X‐ and Y‐axis, * indicates the average size While four of the 6 commonly caught species show a binomial distribution, L. microdon has a distribution with 2 peaks, one at 46 cm and the other at 50 cm. Although, L. gibbus has a distinct peak at 28 cm, it does not follow a normal binomial distribution. For most of the species in the figure 14, the most commonly reported length was smaller than the average length of the individuals for those species, although L. microdon had 2 distinct peaks; one at a length less than the average size and the other at a length greater than the average size. However, modal length of this species also fell below the average length of sample. The smaller modal length could indicate a smaller sized population with few individuals of larger size, which attributes to the greater average length of the overall sample. However, average length of samples for A. virescens and L. xanthochilus were the same, whilst the modal length for E. bipinnulata was slightly greater than the average length of the sample. A comparison of length frequencies of A. virescens for the 4 atolls is shown in Figure 15. This comparison is only made for A. virescens since this was the only species which was caught in sizeable quantities in all 4 atolls.
30 | M E M P R e e f F i s h e r y R e v i e w – M a r i n e R e s e a r c h C e n t r e
0
20
40
60
80
100
120
22 26 30 34 38 42 46 50 54 58 62 66 70 74 78 82Freq
uency
Length (cm)
Noonu Atoll
0
5
10
15
20
22 26 30 34 38 42 46 50 54 58 62 66 70 74 78 82
Freq
uency
Length (cm)
Raa Atoll
0
1
2
3
4
5
6
7
8
22 26 30 34 38 42 46 50 54 58 62 66 70 74 78 82
Freq
uency
Length (cm)
Baa Atolln= 38
0
5
10
15
20
22 26 30 34 38 42 46 50 54 58 62 66 70 74 78 82
Freq
uency
Length (cm)
Lh. Atolln= 133
n= 510
n= 82
*
*
*
*
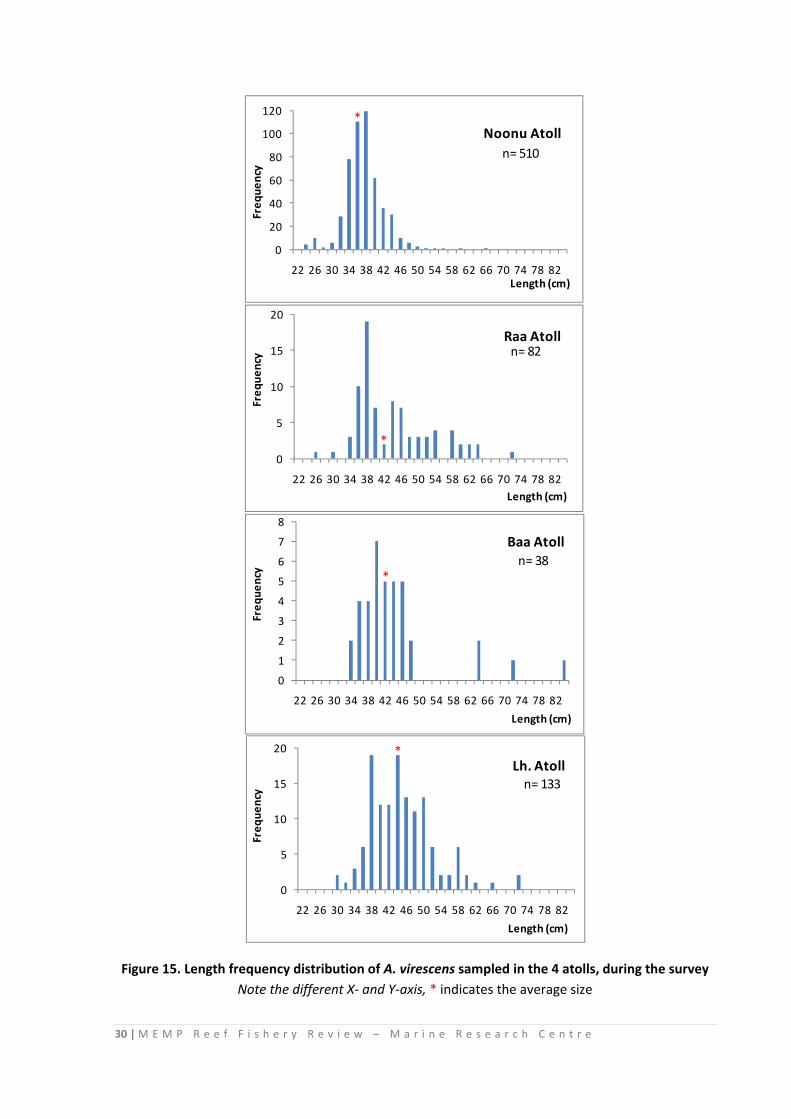
Figure 15. Length frequency distribution of A. virescens sampled in the 4 atolls, during the survey Note the different X‐ and Y‐axis, * indicates the average size
31 | M E M P R e e f F i s h e r y R e v i e w – M a r i n e R e s e a r c h C e n t r e
Average lengths of A. virescens caught during the survey varied between 37 and 44 cm and was not equivalent to the modal length of the sample, though in the sample for Lhaviyani atoll which had 2 distinct peaks, the average length was equivalent to the peak at the larger size of individual (i.e. 44 cm). Samples from all atolls were mainly of the small to medium size classes, while there were a few individuals of the larger size classes being caught from all the atolls. The main difference in all the figures is the number of individuals of the species which were caught from each atoll. While fishermen of Noonu atoll especially targeted these species, this is reflected in their high catch numbers. On the other hand fishermen of Baa atoll were mainly targeting the schools of E. bipinnulata which entered the atoll, thus having a low catch of A. virescens. In comparison, fishermen of B. Kudarikilu who cater for the tourism industry within the atoll, target species such as A. virescens and these form a major component of their catch. Furthermore their catch of A. virescens, besides being greater in numbers also have a wider size range, with more of larger individuals being caught in the fishery than that of the B. Kendhoo fishery (Sattar 2008 & 2009).
3.5 Catch Per Unit Effort
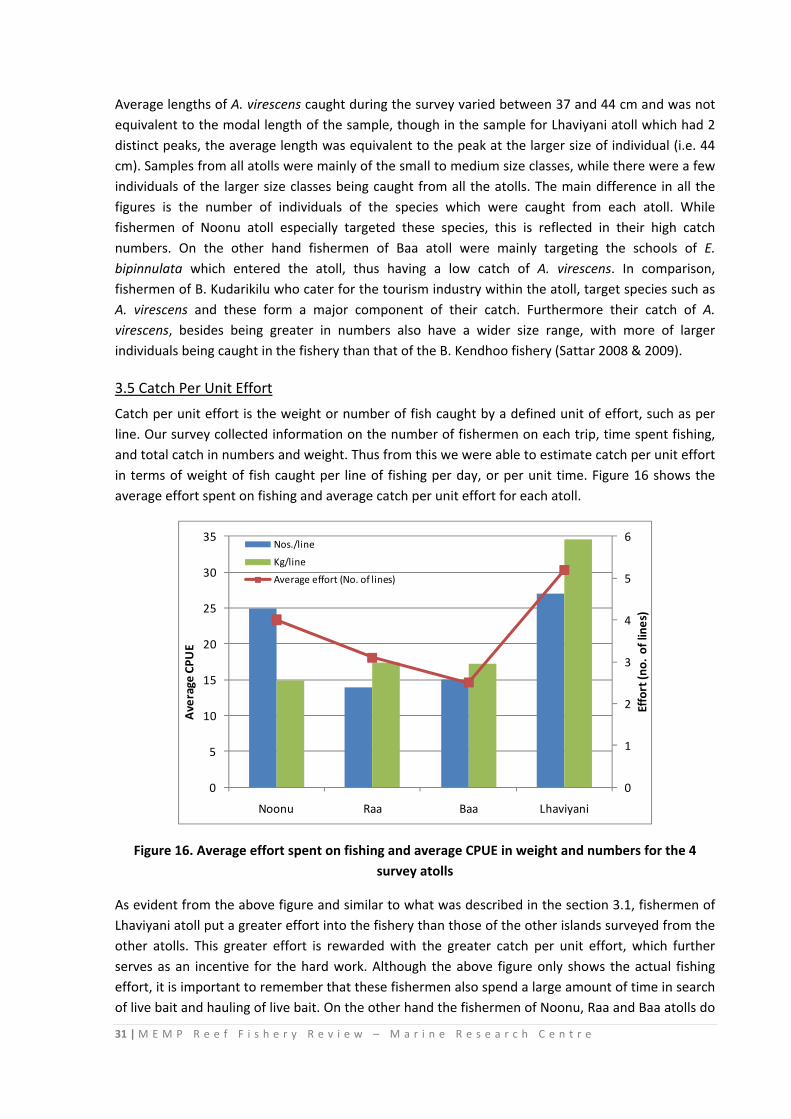
Catch per unit effort is the weight or number of fish caught by a defined unit of effort, such as per line. Our survey collected information on the number of fishermen on each trip, time spent fishing, and total catch in numbers and weight. Thus from this we were able to estimate catch per unit effort in terms of weight of fish caught per line of fishing per day, or per unit time. Figure 16 shows the average effort spent on fishing and average catch per unit effort for each atoll.
0
1
2
3
4
5
6
0
5
10
15
20
25
30
35
Noonu Raa Baa Lhaviyani
Effort (no. of lines)
Average
CPU
E
Nos./line
Kg/line
Average effort (No. of lines)
Figure 16. Average effort spent on fishing and average CPUE in weight and numbers for the 4 survey atolls
As evident from the above figure and similar to what was described in the section 3.1, fishermen of Lhaviyani atoll put a greater effort into the fishery than those of the other islands surveyed from the other atolls. This greater effort is rewarded with the greater catch per unit effort, which further serves as an incentive for the hard work. Although the above figure only shows the actual fishing effort, it is important to remember that these fishermen also spend a large amount of time in search of live bait and hauling of live bait. On the other hand the fishermen of Noonu, Raa and Baa atolls do
32 | M E M P R e e f F i s h e r y R e v i e w – M a r i n e R e s e a r c h C e n t r e
not use live bait (although fishermen of Raa atoll use octopus which they collect from the reefs) and do not spend much time on acquiring bait for their trip. Thus the actual effort put into the fishery by the fishermen of Lhaviyani atoll should consider the time spent on bait collection and bait haul. Similarly for the fishermen of R. Angolhitheemu, this should include the time spent on looking for bait, i.e. Octopus.
Another point of interest is that Noonu atoll fishermen were observed to have put a greater effort into the fishery in terms of number of lines, and correspondingly have the 2nd largest CPUE in terms of number caught per line. However, they have the lowest CPUE in terms of weight which indicates that although in terms of numbers, they caught almost similar quantities per line; their catch consisted of smaller individuals than those caught in the other atolls. This might be a result of their use of artificial lure, which although a good bait, lacks certain properties of live bait or fish pieces such as the chemicals released which play a part in attracting the predators (i.e. catch).
Although fishermen of Baa atoll were noted to have put the least effort into the fishery, it is important once again to note that the fishermen of B. Kendhoo carryout the fishery as a secondary income earning activity. A brief look at the CPUE of fishermen of B. Kudarikilu using data collected in previous surveys of the year show that they have on average they spent 6.5 hours fishing, and have a CPUE of 32 kg/line or 19 individuals per line (Sattar, 2008). Overall, these are comparable to the fishing effort and CPUE of the fishermen of Lhaviyani atoll (Figure 16), which is reasonable given that both groups of fishermen target the same industry, i.e. the tourism industry.
3.6 Income from the fishery
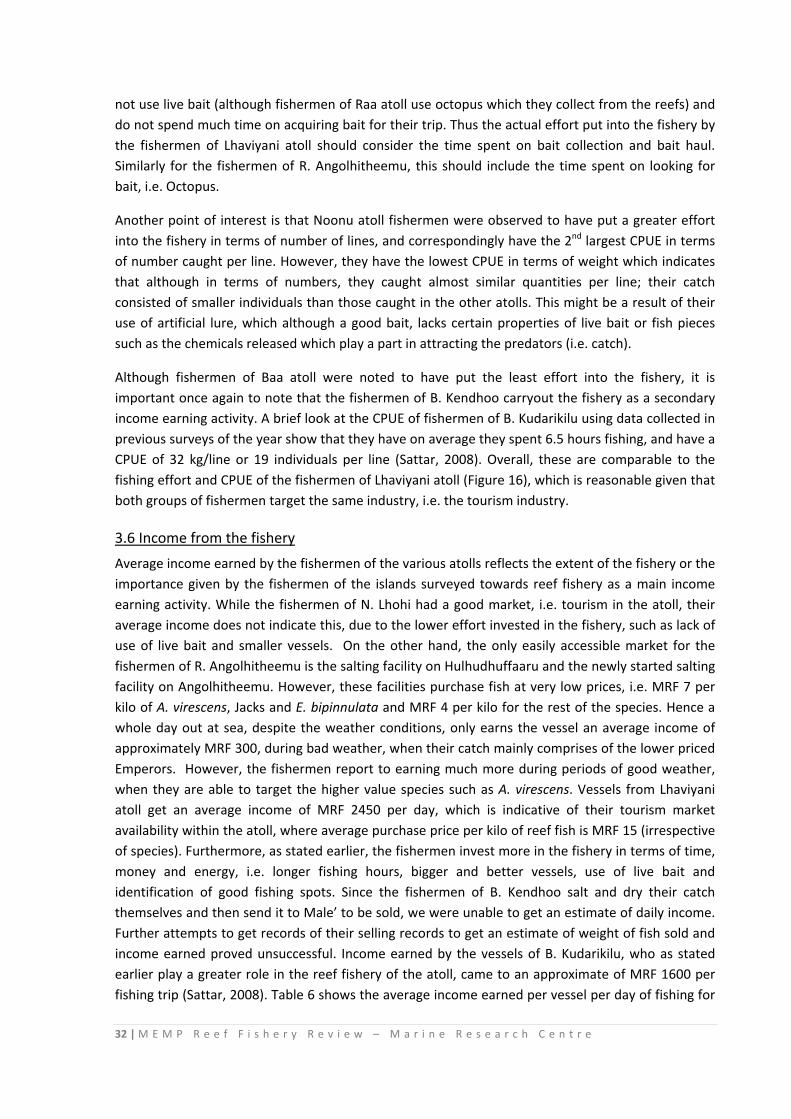
Average income earned by the fishermen of the various atolls reflects the extent of the fishery or the importance given by the fishermen of the islands surveyed towards reef fishery as a main income earning activity. While the fishermen of N. Lhohi had a good market, i.e. tourism in the atoll, their average income does not indicate this, due to the lower effort invested in the fishery, such as lack of use of live bait and smaller vessels. On the other hand, the only easily accessible market for the fishermen of R. Angolhitheemu is the salting facility on Hulhudhuffaaru and the newly started salting facility on Angolhitheemu. However, these facilities purchase fish at very low prices, i.e. MRF 7 per kilo of A. virescens, Jacks and E. bipinnulata and MRF 4 per kilo for the rest of the species. Hence a whole day out at sea, despite the weather conditions, only earns the vessel an average income of approximately MRF 300, during bad weather, when their catch mainly comprises of the lower priced Emperors. However, the fishermen report to earning much more during periods of good weather, when they are able to target the higher value species such as A. virescens. Vessels from Lhaviyani atoll get an average income of MRF 2450 per day, which is indicative of their tourism market availability within the atoll, where average purchase price per kilo of reef fish is MRF 15 (irrespective of species). Furthermore, as stated earlier, the fishermen invest more in the fishery in terms of time, money and energy, i.e. longer fishing hours, bigger and better vessels, use of live bait and identification of good fishing spots. Since the fishermen of B. Kendhoo salt and dry their catch themselves and then send it to Male’ to be sold, we were unable to get an estimate of daily income. Further attempts to get records of their selling records to get an estimate of weight of fish sold and income earned proved unsuccessful. Income earned by the vessels of B. Kudarikilu, who as stated earlier play a greater role in the reef fishery of the atoll, came to an approximate of MRF 1600 per fishing trip (Sattar, 2008). Table 6 shows the average income earned per vessel per day of fishing for
33 | M E M P R e e f F i s h e r y R e v i e w – M a r i n e R e s e a r c h C e n t r e
the 4 atolls. This is subjective to the time of survey and weather conditions at the time. It should also be noted here that the income values estimated here are prior to deduction of costs.
Table 6. Average income earned per vessel per day of fishing (prior to cutting costs incurred)
Atoll Average earning per vessel per day (MRF)
N. Lhohi 680
R. Angolhitheemu 300
B. Kendhoo ‐
Lh. Hinnavaru 2450
Given for reasons such as other fishing islands within the atoll, as is the case with Baa Atoll, these results although considered a representative of what applies to the atoll, should be taken with some measure of precaution.
3.7 Estimation catch per area
Anderson et al. (1992) estimated a Maximum Sustainable Yield of 30,000 + 13,000 tonnes per year for a multi‐species reef fishery. This was obtained after exploratory surveys which were carried out in the Maldives, using various fishing gears. It is believed that reef fish are being exploited at levels below this MSY. Sattar (2008) estimated a total catch of 16,000 tonnes per year from the whole of Maldives. In the current report, we aim to revise this value, by using additional catch data from atolls which were not previously surveyed.
A very critical point to note here is that the number of actual fishing vessels which carry out reef fishing on a commercial scale is very few in each atoll in comparison to the numbers given in Table 1. As earlier stated, table 1 is a list which was compiled by the atoll offices with the aid of the island offices. Hence these numbers at most times include vessels, which on occasion carry out recreational reef fishery. However, although the number of vessels identified for Raa, Baa and Lhaviyani atolls were quite high, it was our observation during our trips that the actual number of vessels within the atoll were much less. For instance, although Baa atoll is listed as having 41 vessels, previous study carried out 2 years back notes that Baa atoll had 17 vessels carrying out reef fishery within the atoll. Furthermore, all resorts in Baa atoll are catered to by the fishermen of one island, i.e. Kudarikilu, thus indicating that there is no market for the other fishermen. This in itself is a deterrent for fishermen and an indication of the number of currently reported vessels being a large overestimate of the actual number of vessels. However, for the purpose of this report, I will use results from the current survey in terms of number of fishing vessels since we do not have results for comparison for other atolls. But it is important to keep in mind, that catch estimates obtained using these figures is most likely a great overestimate of the actual catch quantities.

34 | M E M P R e e f F i s h e r y R e v i e w – M a r i n e R e s e a r c h C e n t r e
Table 7. Number of reported fishing vessels and estimated number of fishing trips and total catch per month
Atoll Noonu Raa Baa Lhaviyani
No. of vessels 2 31 41 16
Estimated # of fishing trips per month
42 651 861 336
Total catch/month (tonnes)
3 36 40 58
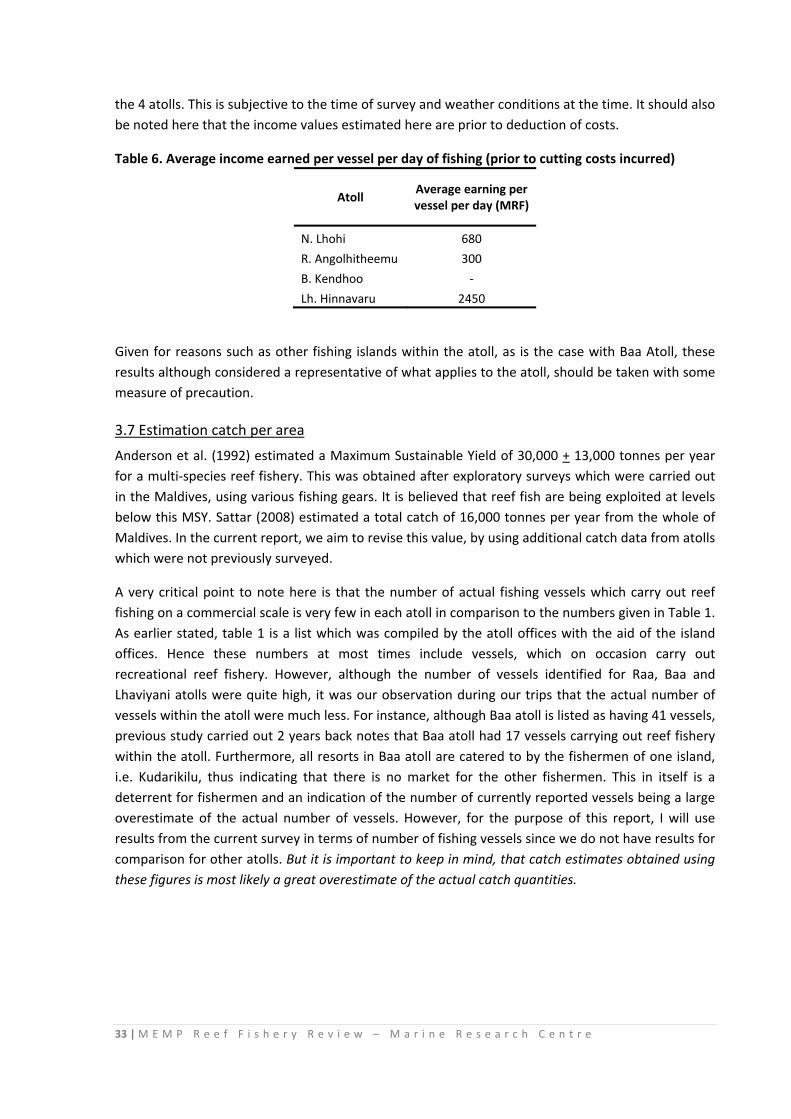
Naseer and Hatcher (2004) report reef areas and total atoll surface areas for all atolls of Maldives. They report the total surface area of Maldives to be 21,372.72 km, while a total of 2041 reefs have a total area of 4493.85 km area. While Sattar (2008) calculates the annual catch estimates from the whole of Maldives using the surface area estimates by Naseer and Hatcher (2004), it would be more accurate to calculate the estimates based on reef area estimates by Naseer and Hatcher (2004). Reasons for this are evident from figure 10, i.e. reef fishing spots visited by the fishermen are quite specific and mainly on the reef edges, passes and shallow reefs within the atoll. Thus taking the whole surface area of the Maldives (inclusive of vast areas of atoll lagoons) adds a serious bias to the area used in the fishery. Figure 17 shows a plot of total catch per month against the reef area of the atolls, for the 4 atolls within the MEMP region and 2 additional atolls previously surveyed (Alifu Alifu/Alifu Dhaalu and Vaavu atolls).
Raa
Baa
Lhaviyani
AA/ADh
Vaavu
y = 0.2489x ‐ 6.3772
0
20
40
60
80
100
120
0 100 200 300 400 500 600
Total catch
per mon
th (M
T)
Reef Area of atoll (sqkm)
Total annual catch from the whole reef area of Maldives (i.e. 4493.85 km2) is calculated using the equation for the linear regression and comes to approximately 13350 metric tonnes. For comparison, the total annual catch from the whole of Maldives (using whole surface area of atolls), calculated in the same way comes to approximately 11900 Metric tonnes. While this is approximately 4000 tonnes less than that estimated by Sattar (2008), this includes data from more atolls and hence the probability of it being more accurate is higher. However, it is important to keep in mind that the above values are estimates of catch quantities, based on the fishery of a single island from most atolls. It is important that such calculations be carried out after obtaining data from different sources, so that it encompasses the variety and diversity of catch as well as greater number of catch quantities.
Figure 17. Total catch from Raa, Baa, Lhaviyani, Alifu Alifu/Alifu Dhaalu and Vaavu atolls versus the total reef area of the atolls
Note: Baa Atoll value is inclusive of catch from Kudarikilu (Sattar 2008), as they play a more dominant role in the fishery than those of Kendhoo
35 | M E M P R e e f F i s h e r y R e v i e w – M a r i n e R e s e a r c h C e n t r e
4. Conclusion One of the most interesting observations was the contrasting difference between the four atolls, with respect to their mode of fishing. What is even more interesting is that this difference was not seen in the survey carried out on the central atolls of Maldives in 2008 (Sattar, 2008). One of the main reasons for this major difference is the market availability in the atolls. Whilst all the atolls surveyed in the previous survey had tourism markets (Sattar, 2008) and was chosen for the survey based on this precursor, this was not the case in the 4 atolls of the Northern Province. While tourism was a possible market in all the atolls, factors such as distance and competition made this market inaccessible to some islands within the atoll.
Investment into the fishery in terms of money, energy and time spent also varied between atolls. These details are highlighted in section 3.2.2. The average number of hours spent on actual fishing activity (minus time spent on bait haul) was 7 hours. It should be noted here that not all islands surveyed used live bait and hence did not spend any time on bait haul or looking for bait. Live bait was substituted with artificial hand‐made or ready‐made lure or Octopus meat.
Method of fishing used depended largely on the species being targeted. As detailed in Sections 3.1.1‐3.1.4, various atolls targeted various species, which was mainly dependent on the demand from the resorts. However it should be noted here that weather conditions also played a part in this as explained in section 3.1.2. Survey in Raa Atoll was conducted during very bad weather conditions, which affected the distance they could travel and their location of fishing, i.e. fishermen were limited to getting their catch from the shallow reef areas instead of from channels and reef passes. The small sized vessels used in the island were not suitable for such weather conditions.
This immediately raises the question as to why the fishermen do not invest in better vessels, which would enable them to carryout fishing even during periods of bad weather. The answer to this is very simple; the unavailability of a good market with guarantee of their catch being bought plays the biggest role in this matter. The amount of time, money and energy invested into the fishery was dependent on the availability of this market. If the fishermen were selling to the salting facilities, demand for fish supplies was greatly dependent on their space availability and demand on them from the exporters. Added to this, the low price paid by the buyers meant that the fishermen did not find it worth to make a heavy investment in the fishery. Availability of a high‐priced good market was stated as the biggest possible incentive for greater investments in the fishery.
Market price varied greatly, depending on the buyer. Salting facilities paid MRF 7 per kilo for A. virescens, E. bipinnulata and species of Jacks/Trevallies (‘hulhunbu’ or ‘scaled fish’ as they called them), and MRF 4 per kilo for the rest of the species. Resort prices varied from MRF 10 to MRF 15 per kilo of reef fish, irrespective of the species.
Most commonly caught species/families differed from atoll to atoll, depending on the method and area of fishing. Additionally, resorts also had preferences for certain species and individuals of certain sizes; smaller individuals or high number of individuals of species such as E. bipinnulata were not purchased. The refusal to purchase smaller sized individuals is a useful fishery management tool, as this indirectly imposes a size limit on the catch. It was observed that fishermen were careful to release smaller sized individuals unharmed, since they would not be of any benefit to them even if they were caught.
36 | M E M P R e e f F i s h e r y R e v i e w – M a r i n e R e s e a r c h C e n t r e
Overall the most commonly caught species was observed to be Aprion virescens, Caranx melampygus, Lutjanus bohar and Lethrinus xanthochilus. Similarly, reef associated species such as Elagatis bipinnulata were also commonly caught, especially since fishermen of certain atolls targeted schools of this species at times of low fishery. These results are similar to the species composition of catch from the previous survey (Sattar, 2008). Comparison of the size composition of catch for all atolls in this survey with that of results from Sattar (2008) shows that the average length of the commonly caught species such as A. virescens and E. bipinnulata was smaller in the current survey. A more alarming observation was that the average lengths of the most commonly caught species was much smaller than the most commonly reported lengths for individuals of these species from the Maldives (Section 3.4, Table 5). While these lengths were taken in the earlier days of the fishery, and the lesser numbers sampled then could be a contributing factor for this, this result could also be interpreted as a possible sign of detrimental effects of fishing on the larger size classes of the population ‐ i.e. truncation of size structure of the population. Furthermore, the most commonly observed length in the survey, for most of the commonly exploited species was less than the average length of the sample, which could mean that overall populations of these species consists of many individuals of smaller size, but with few larger individuals. Catch per Unit Effort for all atolls were estimated based on the number of lines used for fishing as a unit of effort. CPUE both in terms of weight and numbers was highest in Lhaviyani atoll, where the effort was also the highest, i.e. greater number of lines used for fishing. Effort in terms of energy and time invested in the fishery was also observed to be greater for Lhaviyani atoll than in other atolls. Fishermen of Lhaviyani atoll target the resort market within the atoll and therefore ensure that their fishing trips will guarantee a good catch. They also invest time and energy to find live bait, which sometimes could take a number of hours. In comparison, although Baa atoll also had a high resort market, the CPUE for Baa atoll was low due to the nature of the fishery carried out by the fishermen of Kendhoo who were surveyed in the project. These fishermen do not sell to the resorts, due to reasons outlined in Section 3.1.3. On the other hand they salt/dry the catch themselves and send to Male’ to be sold to the exporters. However CPUE by fishermen of Kudarikilu who dominate the market in the atoll, is similar to the CPUE of the fishermen of Lhaviyani atoll (Sattar 2008). Overall, these are comparable to the fishing effort and CPUE of the fishermen of Lhaviyani atoll (Figure 15), which is realistic given that both groups of fishermen target the same industry, i.e. the tourism industry. Income from the fishery varied greatly, depending on the target/available market. The fishermen who were able to sell to the resort market earned a higher income than those who either sold to the salting facilities or processed the fish themselves. The income earned is also a reflection of the importance given to the fishery as an income earning activity and investment made by the fishermen in the fishery. Hence the fishermen of N. Lhohi, who although sold to the resort market, on average earned much less than the fishermen of Lh. Hinnavaru, which possibly is due to their very relaxed
37 | M E M P R e e f F i s h e r y R e v i e w – M a r i n e R e s e a r c h C e n t r e
attitude towards the fishery. We were unable to get an idea of income by the Baa Atoll fishermen (B. Kendhoo) as they process the fish themselves (salt/dry) and sell to Male’. Exporters purchase the dry fish at MRF 15 per kilo of salt/dried fish irrespective of the species. When enquired as to how much they earn from the fishery per month, fishermen were hesitant to answer, though they estimated the amount to be around MRF 2000 for the vessel. It should be noted here that the income values estimated in the report are prior to deduction of costs. The report does not estimate profits from the fishery. Sattar (2008) estimates a catch of 16,000 metric tonnes per km2 of Maldives. This was calculated using surface area estimates provided by Naseer and Hatcher (2004) and catch data from 3 atolls. A similar estimate of catch estimate per unit area using data collected during this survey estimates a catch of 11900 metric tonnes per km2. Although this value is lower than that estimated by Sattar (2008), the current calculation uses more data points, which increases the probability of accuracy. Since fishing is mainly carried out on reef edges and reef passes, the actual area used for fishing would be much less than the whole surface area of all atolls. A comparison of catch estimation per area using both whole surface area of all atolls and the area of reefs (excluding large lagoon areas) throughout Maldives shows the catch per unit area to be greater for the latter scenario. Catch estimation per unit area, using only the area of reefs approximates to 13350 metric tonnes per area. This would be more representative of the actual catch per area due to the specificity of the fishing locations; i.e. reef edges and reef passes instead of all over the atoll. However, all values above should be taken with a certain degree of precaution, because catch statistics used does not take account of all the recreational fishing vessels, which carry out reef fishing trips on a large scale. Especially with the large number of resorts throughout the Maldives, who conduct such fishing trips on a daily basis, the amount of catch certainly would not be an insignificant value.
38 | M E M P R e e f F i s h e r y R e v i e w – M a r i n e R e s e a r c h C e n t r e
5. Recommendations from the Project The reef fishery within the atolls surveyed in the project is still in the initial stages, with the exception of reef fishermen in Lhaviyani atoll. Given the small scale market in the other atolls, the demand for reef fish in the other atolls is comparatively small. However, given the introduction of tourism and resorts within these atolls, the demand for reef fish expected to increase in the near future. Therefore, it would best to incorporate management measures into the fishery while it is still at the infant stage so that the escalating fishery is carried out under a management regime which will ensure its sustainability. Recommendations for management include:
Imposition of size limits on catch: this is to ensure that the smaller sized individuals are given the chance to grow and mature prior to being taken out as a consequence of fishing. As resorts prefer the smaller sized individuals, and some fishermen already release the smaller sized individuals due to this, this step should not be hard to enforce and implement.
Logbooks: implementation of logbooks from the early stages of the fishery would mean that the fishermen would be trained to do this prior to an increased workload. It is known that once the demand increases for the fishery, the fishermen put more time and effort into fishing, and hence have less time and are less willing to fill out logbooks etc. However, as we experience now, to get them to fill out logbooks while they are well established in the fishery, is always hard. Thus training and the awareness on the use and need of logbooks and continuous data needs to be given from the very beginning in order to have better participation of the fishermen.
Awareness on diversity of species and provision of assistance and guidance in identification to a species level: Currently, fishermen tend to class species of the same family into one group, i.e. a generic family group, although they are aware that these are different species. Fishermen need to be made aware of the importance of correct identification and species wise data for proper management of such multispecies fisheries.
While the above are some of the more crucial recommendations, it is also recommended that there be a better system for data collection, either through logbooks or fishery officers who will report to the Ministry of Fisheries and Agriculture on a regular basis. It is also recommended that this data reporting is regularly monitored and enforced. One of the main hindrances to the work of MRC and the Fisheries Management unit has always been the lack of long term data on fish catch, especially on a species level. The lack of this data makes it very hard to formulate properly informed management plans when required.
39 | M E M P R e e f F i s h e r y R e v i e w – M a r i n e R e s e a r c h C e n t r e
6. Limitations of the Project
• The biggest limitation of the project is the fact that survey for each atoll was conducted from only one island in the atoll. A better representation of the situation in the atoll would have been obtained if it had been possible to conduct the survey from different islands within the atoll.
• Incorrect representation in terms of vessels carrying out reef fishing during the survey period: On occasion we faced the issue of additional vessels carrying out reef fishery during the survey period. This came about due to the incentive of the payment made by the project for the days the vessels took the teams out fishing. However, we were able to eliminate this bias to some extent by stressing that this did not help with the study and refusing to go out on survey trips on these vessels.
• Failure to hire the Reef fishery field officers: however the Ministry of Fisheries and Agriculture will soon be implementing catch logbooks for all fisheries, including the reef fisheries. This will enable us to collect data on the fishery status and catch statistics over a longer period and on a continuous timescale.
7. References Anderson, R. C., Z. Waheed, M. Rasheed and A. Arif (1992). Reef Fish Resources Survey in the
Maldives ‐ Phase II Reef Fish Research and Resources Survey. B. o. B. Programme. Madras, Bay of Bengal Programme/ FAO: 54 pp.
M.R.S. (1997) Fishes of the Maldives. Marine Research Section, Ministry of Fisheries and Agriculture. Republic of Maldives. 408pp.
McAllister, D.E., Anderson, C. and Alfonso, N. (1992) Guide to Selected Fishes of the Maldives. Halifax, N.S.; International Centre for Ocean Development; 92 pp.
Naseer, A. and B. G. Hatcher (2004). "Inventory of the Maldives' coral reefs using morphometrics generated from Landsat ETM+ imagery." Coral Reefs 23: 161 ‐ 168.
Sadovy, Y. and Eklund, A.M. (1999) Synopsis of Biological Data on the Nassau Grouper, Epinephelus striatus (Bloch, 1792) and the Jewfish, E. itajara (Lichtenstein, 1822). NOAA NMFS Technical Report 146. 65 pp.
Sattar, S. A. (2008) Review of the Reef Fishery of Maldives, Marine Research Centre, Male’, Maldives. 62 pp.
Sattar, S. A. (2009) Reef Fish Tagging Programme – Baa Atoll Pilot Project, Marine Research Centre/Atoll Ecosystem Conservation Programme, Male’, Maldives. 44 pp.
Fish Base website accessed February 2010: www.fishbase.org
40 | M E M P R e e f F i s h e r y R e v i e w – M a r i n e R e s e a r c h C e n t r e
Acknowledgements I would like to thank the World Bank and the Board of International Development Assistance for funding this project.
Much appreciation to the MRC staff that took part in the field trips and spent large amounts of time at sea, despite bad weather and rough conditions, in order to collect the necessary field data. In this respect I would like to thank Hassan Hamid, Yoosuf Rilwan, Ibrahim Faizan, Ibrahim Asghar, Mohamed Ushan, Ahmed Najeeb and Mariyam Nazeefa. I would also like to thank Hussein Irufan who joined the trip on a voluntary basis at times of staff shortage. My gratitude to the other staff of MRC who have assisted during various stages of the project.
The trips and data collection would not have been possible with the cooperation and collaboration of the Atoll/Island offices of the four survey atolls and islands. Many thanks to those from that end, who provided us with all the required assistance and support. Most importantly, many thanks and much gratitude to all the fishermen who took part in the survey and assisted us every step of the way, as well as sharing their knowledge and information with our teams.
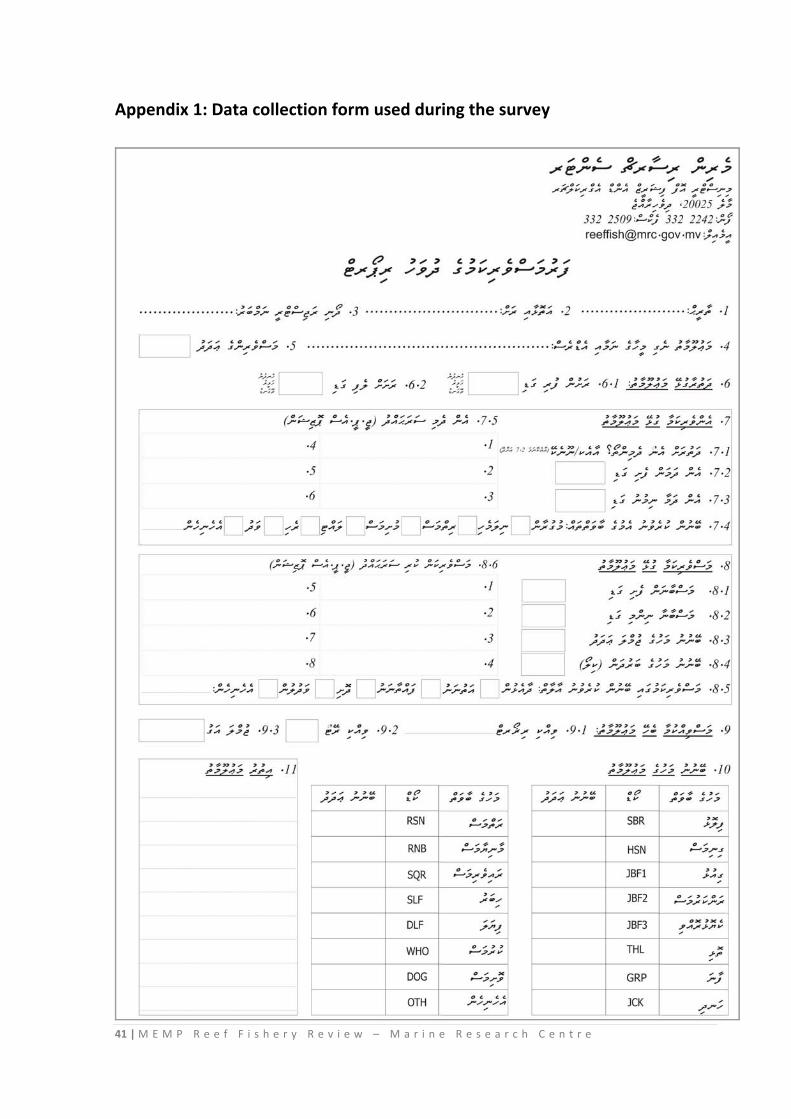
41 | M E M P R e e f F i s h e r y R e v i e w – M a r i n e R e s e a r c h C e n t r e
Appendix 1: Data collection form used during the survey
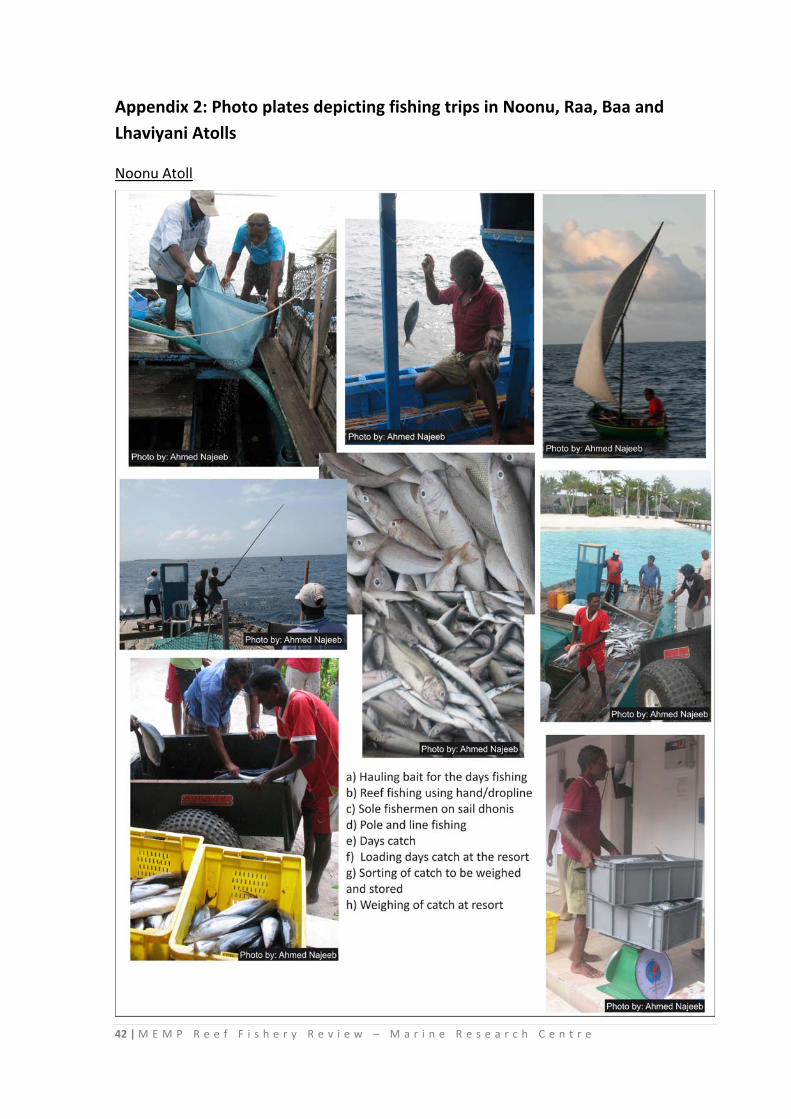
42 | M E M P R e e f F i s h e r y R e v i e w – M a r i n e R e s e a r c h C e n t r e
Appendix 2: Photo plates depicting fishing trips in Noonu, Raa, Baa and Lhaviyani Atolls
Noonu Atoll
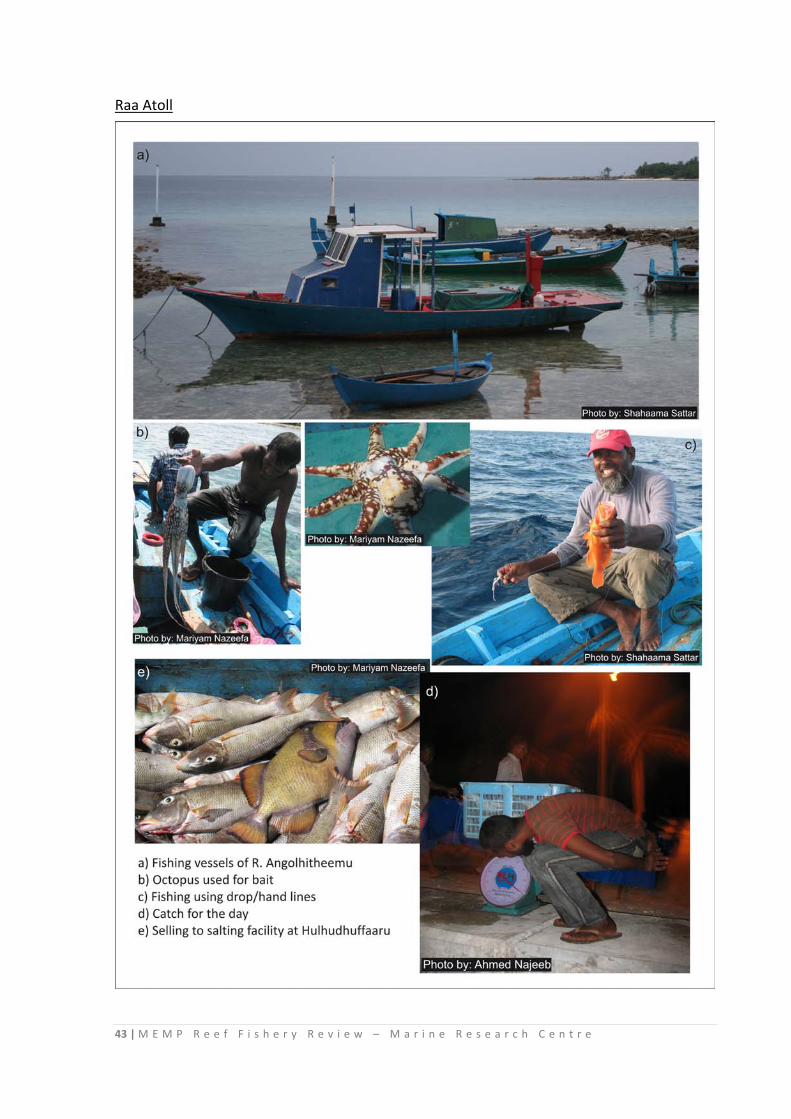
43 | M E M P R e e f F i s h e r y R e v i e w – M a r i n e R e s e a r c h C e n t r e
Raa Atoll
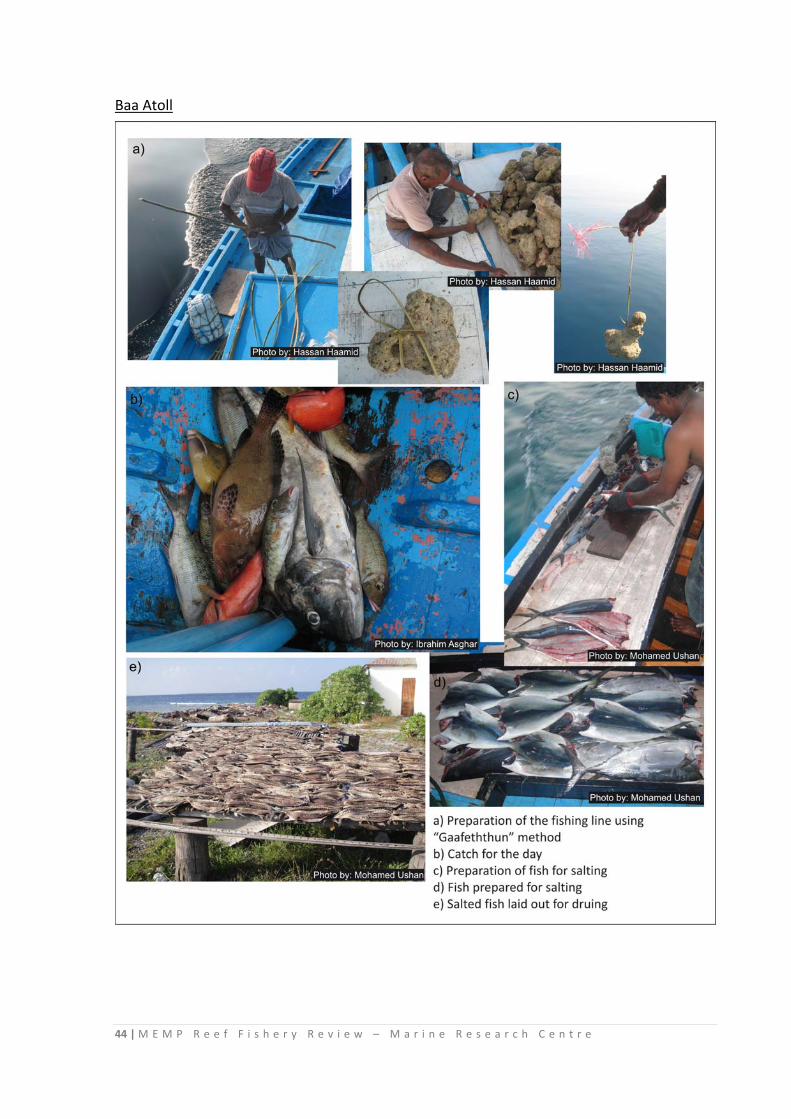
44 | M E M P R e e f F i s h e r y R e v i e w – M a r i n e R e s e a r c h C e n t r e
Baa Atoll
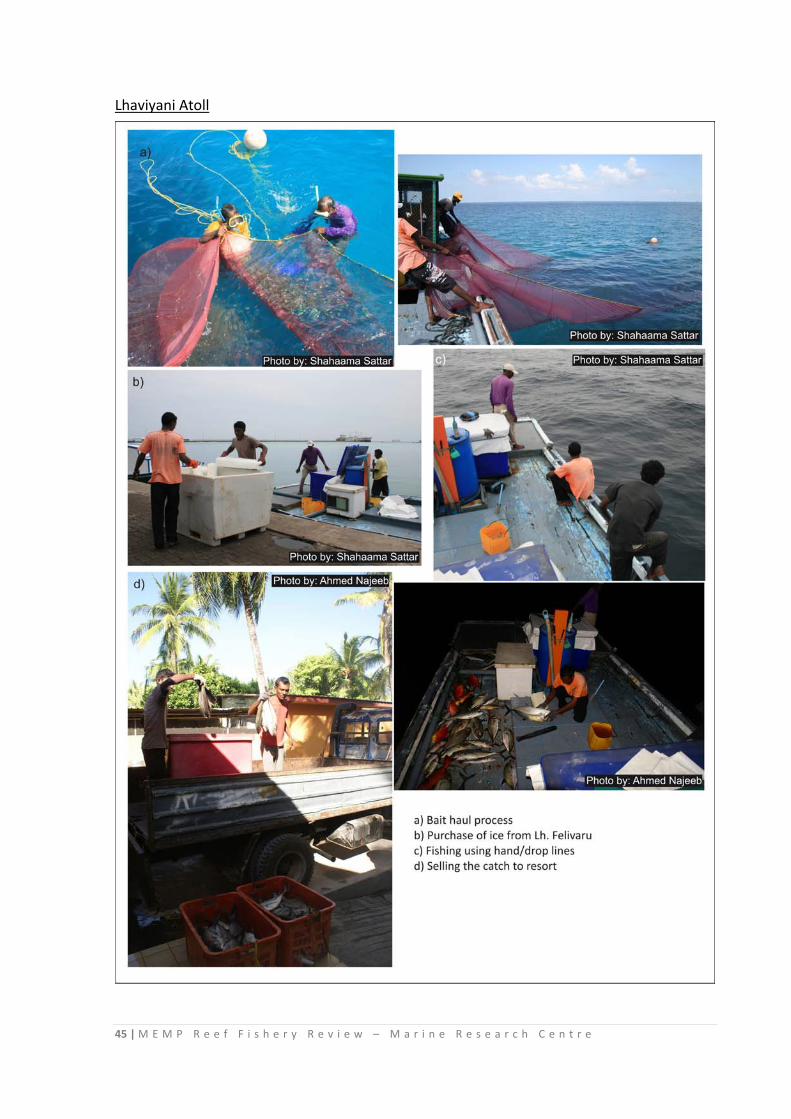
45 | M E M P R e e f F i s h e r y R e v i e w – M a r i n e R e s e a r c h C e n t r e
Lhaviyani Atoll
Copyright © 2022 FDOKUMEN