
review and preparation of the bulawayo master plan (2019
297
Review and Preparation of Bulawayo Master Plan (2019 – 2034) Report of Study ------------------------------------------------------------------------------------------------------------------------------ i Bulawayo City Council REVIEW AND PREPARATION OF THE BULAWAYO MASTER PLAN (2019 – 2034) VOLUME TWO (2) REPORT OF SURVEY Prepared by Job Jika & Associates (Pty) Ltd
-
Upload
khangminh22 -
Category
Documents
-
view
3 -
download
0
Transcript of review and preparation of the bulawayo master plan (2019

Review and Preparation of Bulawayo Master Plan (2019 – 2034) Report of Study
------------------------------------------------------------------------------------------------------------------------------
i
Bulawayo City Council
REVIEW AND PREPARATION OF THE
BULAWAYO MASTER PLAN (2019 – 2034)
VOLUME TWO (2)
REPORT OF
SURVEY
Prepared by Job Jika & Associates (Pty) Ltd

Review and Preparation of Bulawayo Master Plan (2019 – 2034) Report of Study
------------------------------------------------------------------------------------------------------------------------------
ii
TABLE OF CONTENTS CHAPTER 1............................................................................................................. 1
1.0 INTRODUCTION .............................................................................................................. 1
1.1 GENERAL BACKGROUND ................................................................................................... 1
1.2 FORM AND CONTENT OF THE MASTER PLAN......................................................................... 2
1.3 NEED AND JUSTIFICATION FOR THE PLAN .............................................................................. 3
1.4 PURPOSE AND SCOPE OF THE PLAN ....................................................................................... 4
1.5 SCOPE, FUNCTIONS AND UNDERLYING PRINCIPLES ............................................................... 6
1.6 STATUTORY PROVISIONS ........................................................................................................ 8
1.7 INSTITUTIONAL AND ADMINISTRATIVE ARRANGEMENTS ................................................... 11
1.8 NATIONAL LEVEL INSTITUTIONS ........................................................................................... 12
1.9 SUB NATIONAL LEVEL INSTITUTIONS ................................................................................... 13
1.10 CONSULTATIONS................................................................................................................... 18
1.11 STUDY AREA .......................................................................................................................... 18
1.12 REPORT STRUCTURE ............................................................................................................. 19
1.13 THE PLAN PREPARATION PROCESS ....................................................................................... 22
CHAPTER 2........................................................................................................... 26
2.0 GEOGRAPHIC AND CONTEXTUAL SETTING .................................................................... 26
2.1 GEOGRAPHIC LOCATION, SIZE AND BOUNDARIES ............................................................... 26
2.2 THE PLANNING AREA IN REGIONAL AND NATIONAL CONTEXTS .......................................... 27
2.2.1 INTRODUCTION .............................................................................................................. 27
2.3 NATIONAL CONTEXT ............................................................................................................. 28
2.4 REGIONAL AND NATIONAL FUNCTIONS, LINKAGES AND IMPACTS ..................................... 28
2.5 ECONOMIC LINKAGES ........................................................................................................... 29
2.6 ADMINISTRATIVE AND SOCIAL LINKAGES ............................................................................ 30
2.7 TRANSPORT AND COMMUNICATION LINKAGES .................................................................. 30
2.8 ROAD LINKAGES .................................................................................................................... 30
2.9 RAILWAY LINKAGES .............................................................................................................. 31
2.10 AIR LINKAGES ........................................................................................................................ 31
2.11 TELECOMMUNICATION AND POSTAL LINKAGES .................................................................. 32
2.12 THE MEDIA ............................................................................................................................ 32

Review and Preparation of Bulawayo Master Plan (2019 – 2034) Report of Study
------------------------------------------------------------------------------------------------------------------------------
iii
CHAPTER THREE .................................................................................................. 34
3.1 INTRODUCTION ........................................................................................................... 34
3.2 NATURAL ENVIRONMENT ..................................................................................................... 34
3.3 GEOLOGY AND SOILS ............................................................................................................ 34
3.4 TOPOGRAPHY AND HYDROLOGY .......................................................................................... 35
3.5 CLIMATE ................................................................................................................................ 35
3.6 TEMPERATURE ...................................................................................................................... 36
3.7 SOLAR RADIATION ................................................................................................................ 36
3.8 RELATIVE HUMIDITY ............................................................................................................. 36
3.9 WIND ..................................................................................................................................... 36
3.10 VEGETATION ......................................................................................................................... 36
3.11 NATURAL RESOURCES BASE AND INVENTORY ..................................................................... 37
3.12 GROUNDWATER RESOURCES ............................................................................................... 37
3.13 MINERAL RESOURCES ........................................................................................................... 38
3.14 MINERAL EXPLOITATION ...................................................................................................... 38
3.15 AREAS OF SCENIC BEAUTY, CULTURAL AND HISTORICAL SIGNIFICANCE ............................. 39
3.16 INXWALA FESTIVAL SITE ....................................................................................................... 39
3.17 BULAWAYO AND THE INDABA TREE ..................................................................................... 39
3.18 BUILDINGS OF ARCHITECTURAL & HISTORIC INTEREST ....................................................... 40
3.19 FOREST RESOURCES .............................................................................................................. 40
3.20 WILDLIFE ............................................................................................................................... 41
3.21 NATURAL RESOURCE UTILISATION AND CONSERVATION PRACTICES ................................. 41
3.22 REGULATORY AND MANAGEMENT PROGRAMMES FOR THE SUSTAINABLE ....................... 42
3.23 IMPACTS OF NATURAL RESOURCE ENDOWMENT AND UTILISATION IN THE PLANNING .... 42
3.24 PHYSICAL CONSTRAINTS AND IMPACTS OF DEVELOPMENT ON THE PHYSICAL .................. 43
3.25 ENVIRONMENTAL, ECOLOGICAL AND CONSTRAINTS ZONING OF THE PLANNING AREA .... 43
CHAPTER 4........................................................................................................... 45
LAND, LAND USE AND RESERVATIONS .................................................................................... 45
4.0 LAND AS A RESOURCE ........................................................................................................... 45
4.1 INTRODUCTION .............................................................................................................. 45
4.2 LAND OWNERSHIP ................................................................................................................ 45
4.3 LAND TENURE ....................................................................................................................... 47

Review and Preparation of Bulawayo Master Plan (2019 – 2034) Report of Study
------------------------------------------------------------------------------------------------------------------------------
iv
4.4 LAND USES ............................................................................................................................ 48
4.5 LAND AVAILABLE FOR RESIDENTIAL DEVELOPMENT ........................................................... 51
4.6 INDUSTRIAL ........................................................................................................................... 52
4.7 COMMERCIAL ....................................................................................................................... 58
4.8 URBAN AGRICULTURE IN THE CITY ....................................................................................... 60
4.9 THE HINTERLAND .................................................................................................................. 63
CHAPTER 5........................................................................................................... 67
POPULATION AND ECONOMIC PROFILE .................................................................................. 67
5.1 INTRODUCTION .......................................................................................................... 67
5.2 POPULATION AND DEVELOPMENT PLANNING .................................................................... 67
5.3 CONSIDERATIONS IN ESTIMATING OR PROJECTING POPULATION SIZE .............................. 68
5.4 POPULATION COMPOSITION BY AGE AND SEX .................................................................... 68
5.5 POPULATION BY AGE GROUP ............................................................................................... 71
5.6 CRUDE BIRTH RATE AND CRUDE DEATH RATE ..................................................................... 72
5.7 POPULATION SIZE AND GROWTH ......................................................................................... 81
5.8. POPULATION GROWTH AT A DECREASING RATE BETWEEN 1982 AND 2002 CENSUSES .... 84
5.9 HOUSEHOLD CHARACTERISTICS ........................................................................................... 85
CHAPTER 6........................................................................................................... 87
THE LOCAL ECONOMY ...................................................................................................... 87
6.1 INTRODUCTION .............................................................................................................. 87
6.2 BULAWAYO’S LOCAL ECONOMY ........................................................................................... 87
6.3 THE CURRENT STATE OF BULAWAYO’S FORMAL ECONOMY ............................................... 88
6.4 ECONOMIC ACTIVITIES, ECONOMIC GROWTH PATTERNS AND ECONOMIC INDICATORS,
LABOUR FORCE, EMPOYMENT, UNEMPLOYMENT AND POVERTY .................................................. 88
6.5 CURRENT ECONOMIC ACTIVITIES AND EMPLOYMENT PATTERNS ....................................... 89
6.6 EMPLOYMENT ....................................................................................................................... 89
6.7 UNEMPLOYMENT.................................................................................................................. 90
6.8 REMITTANCES ....................................................................................................................... 94
6.9 TYPE OF ECONOMIC ACTIVITIES ........................................................................................... 94
6.10 ECONOMIC ACTIVITY ............................................................................................................ 95
6.11 THE INFORMAL SECTOR ........................................................................................................ 96
6.12 POVERTY AND POVERTY ALLEVIATION PROGRAMMES ....................................................... 98

Review and Preparation of Bulawayo Master Plan (2019 – 2034) Report of Study
------------------------------------------------------------------------------------------------------------------------------
v
6.13 ECONOMIC VIABILITY ASSESSMENT OF THE REGION ......................................................... 101
CHAPTER 7......................................................................................................... 105
HOUSING ............................................................................................................................. 105
7.1 INTRODUCTION ............................................................................................................ 105
7.2 NATIONAL HOUSING POLICY .............................................................................................. 105
7.3 INSTITUTIONAL FRAMEWORK FOR HOUSING DELIVERY .................................................... 106
7.4 BULAWAYO CITY COUNCIL.................................................................................................. 107
7.5 NATIONAL AND INTERNATIONAL DEVELOPMENT ORGANIZATIONS ................................. 108
7.6 PRIVATE SECTOR ................................................................................................................. 109
7.7 GOVERNMENT MINISTRIES AND DEPARTMENTS ............................................................... 109
7.8 PRIVATE SECTOR INVOLVEMENT IN HOUSING DELIVERY .................................................. 109
7.9 HOUSING SECTOR PLAN AND HOUSING DEVELOPMENT STRATEGY ................................. 111
7.10 RESIDENTIAL SPATIAL STRUCTURE ..................................................................................... 111
7.11 EXISTING HOUSING STOCK ................................................................................................. 112
7.12 URBAN RENEWAL ............................................................................................................... 112
7.13 MODELS OF HOUSING DELIVERY AND ALTERNATIVE BUILDING TECHNOLOGIES .............. 113
7.14 ALTERNATIVE BUILDING TECHNOLOGIES ........................................................................... 113
7.15 DWELLING CONSTRUCTION ................................................................................................ 113
7.16 HOUSING CHARACTERISTICS AND CONDITIONS ................................................................ 117
7.17 QUALITY AND STANDARDS OF RESIDENTIAL NEIGHBOURHOODS ..................................... 121
CHAPTER 8......................................................................................................... 124
EDUCATIONAL FACILITIES ..................................................................................................... 124
8.1 INTRODUCTION ........................................................................................................ 124
8.2 THE ZIMBABWEAN CONSTITUTION & EDUCATION ACT .................................................... 124
8.3 EXISTING EDUCATIONAL FACILITIES ................................................................................... 125
8.4 PRIMARY SCHOOLS ............................................................................................................. 135
8.5 SECONDARY SCHOOLS ........................................................................................................ 139
8.6 POPULATION OF SCHOOL-GOING AGE IN BULAWAYO ...................................................... 143
8.7 SCHOOL ATTENDANCE ........................................................................................................ 144
8.8 PRIVATE COLLEGES ............................................................................................................. 145
8.9 VOCATIONAL TRAINING ...................................................................................................... 146
8.10 TERTIARY AND VOCATIONAL EDUCATIONAL FACILITIES .................................................... 148

Review and Preparation of Bulawayo Master Plan (2019 – 2034) Report of Study
------------------------------------------------------------------------------------------------------------------------------
vi
8.11 LUPANE STATE UNIVERSITY .......................................................................................... 153
8.12 CATHOLIC UNIVERSITY ................................................................................................. 153
8.13 THE ZIMBABWE SCHOOL OF MINES ............................................................................ 154
8.14 HILLSIDE TEACHERS COLLEGE....................................................................................... 157
8.15 UNITED COLLEGE OF EDUCATION ................................................................................ 158
8.16 BULAWAYO POLYTECHNIC ........................................................................................... 159
8.17 SCHOOL OF HOSPITALITY AND TOURISM .................................................................... 160
8.18 WESTGATE INDUSTRIAL TRAINING COLLEGE ............................................................... 161
CHAPTER 9 ...................................................................................................... 162
9. PRIMARY HEALTH CARE HEALTH FACILITIES ................................................................. 162
9.1 INTRODUCTION ............................................................................................................ 162
9.2 THE LEGISLATIVE FRAMEWORK .......................................................................................... 162
9.3 PRIMARY HEALTH CARE ...................................................................................................... 163
9.4 MINISTRY OF HEALTH AND CHILD CARE ............................................................................. 164
9.5 BULAWAYO CITY COUNCIL.................................................................................................. 165
9.6 HEALTH ASSESSMENTS APPROACHES ................................................................................ 167
9.7 SPATIAL DISTRIBUTION OF HEALTH FACILITIES .................................................................. 167
9.8 STAFFING SITUATION AT THE CITY OF BULAWAYO HEALTH SECTOR ................................ 178
9.9 TRADITIONAL HEALERS ....................................................................................................... 179
9.10 COMMUNITY HEALTH ASSESSMENT ................................................................................... 179
9.11 MENTAL HEALTH PREVALENCE IN ZIMBABWE ................................................................... 182
9.12 ENVIRONMENTAL HEALTH ................................................................................................. 183
9.13 BULAWAYO CITY COUNCIL ENVIRONMENTAL HEALTH SERVICES ...................................... 184
9.14 LEGISLATIVE FRAMEWORK ................................................................................................. 185
9.15 WASTE HIERARCHY .............................................................................................................. 186
9.16 WASTE GENERATION .......................................................................................................... 186
9.17 REFUSE COLLECTION .......................................................................................................... 187
9.19 THE LANDFILL SITE .............................................................................................................. 190
9.20 PEST CONTROL .................................................................................................................... 191
9.21 ABBATOIRS .......................................................................................................................... 192

Review and Preparation of Bulawayo Master Plan (2019 – 2034) Report of Study
------------------------------------------------------------------------------------------------------------------------------
vii
CHAPTER 10 ....................................................................................................... 194
10.1 GOVERNMENT OFFICES – CENTRAL AND LOCAL GOVERNMENT ....................................... 194
10.2 COMMUNITY FACILITIES & YOUTH CENTRES ..................................................................... 195
10.3 YOUTH CENTRES ................................................................................................................. 197
10.4 ZIMBABWE INTERNATIONAL EXHIBITION CENTRE ............................................................. 198
10.5 DIPLOMATIC MISSION ........................................................................................................ 199
10.6 ZIMBABWE REPUBLIC POLICE ............................................................................................. 199
10.7 ZIMBABWE PRISONS AND CORRECTIONAL SERVICES ....................................................... 201
10.8 ZIMBABWE NATIONAL ARMY ............................................................................................ 202
10.9 ZIMBABWE POSTAL SERVCES ............................................................................................ 202
10.10 COMMUNITY INFORMATION CENTRE .............................................................................. 203
10. 11 OTHER SOCIAL AND COMMUNITY FACILITIES .................................................................. 204
10.12 OLD AGE HOMES ............................................................................................................... 205
10.13 CHILD CARE FACILITIES ...................................................................................................... 215
10.14 FIRE STATIONS .................................................................................................................. 218
10.15 CEMETERIES AND CREMATORIA ..................................................................................... 219
10.16 LIBRARIES ......................................................................................................................... 221
10.17 NATIONAL FREE LIBRARY ................................................................................................. 225
10.18 PLACES OF WORSHIP ...................................................................................................... 226
10.20. PARKS AND OPEN SPACES ............................................................................................... 228
10.21 PUBLIC CONVENIENCES .................................................................................................. 229
10.22 NATIONAL MUSEUM ....................................................................................................... 233
CHAPTER 11 ....................................................................................................... 234
INFRASTRUCTURE AND UTILITIES .......................................................................................... 234
11.0 INTRODUCTION ............................................................................................................. 234
11.1 WATER SOURCES, SUPPLIES AND DEMAND ....................................................................... 234
11.2 BULK WATER TREATMENT AND STORAGE ......................................................................... 236
11.3 BULK WATER SUPPLY MAINS .............................................................................................. 238
11.4 RESERVOIR STORAGE CAPACITY AND REQUIREMENTS ...................................................... 240
11.5 WATER DEMAND ................................................................................................................ 240
11.6 SEWER RETICULATION AND TREATMENT ........................................................................... 241
11.7 PRESENT AND FUTURE PROJECTIONS OF THE TREATMENT WORKS ................................. 247

Review and Preparation of Bulawayo Master Plan (2019 – 2034) Report of Study
------------------------------------------------------------------------------------------------------------------------------
viii
11.8 ROADS, TRAFFIC AND TRANSPORTATION.......................................................................... 247
11.9 CLASSIFICATION OF NETWORK ......................................................................................... 248
11.10 STORMWATER DRAINAGE ................................................................................................ 252
11.11 ELECTRICITY/POWER SUPPLIES ......................................................................................... 253
11.12 TELECOMMUNICATIONS ................................................................................................... 256
11.13 TRAFFIC AND TRANSPORTATION ..................................................................................... 258
11.14 PUBLIC TRANSPORT ......................................................................................................... 263
11.15 SPEED LIMITS .................................................................................................................... 264
CHAPTER 12 ....................................................................................................... 273
ENVIRONMENTAL AUDITS OF KEY PHYSICAL DEVELOPMENTS AND STATE OF THE
ENVIRONMENT .................................................................................................................... 273
12.1 AIM AND OBJECTIVES ......................................................................................................... 273
12.2 ENVIRONMENTAL SETTINGS OF KEY EXISTING DEVELOPMENTS ....................................... 273
12.3 ENVIRONMENTAL ELEMENTS IMPACTED BY EXISTNG KEY DEVELOPMENTS AND ............ 274
12.4 ENVIRONMENTAL STATUS AND CONCLUSION ................................................................... 278

Review and Preparation of Bulawayo Master Plan (2019 – 2034) Report of Study
------------------------------------------------------------------------------------------------------------------------------
ix
LIST OF MAP
Map 1 - Historical Growth of the City Map 2 - Study Area Boundary Map 3 - Bulawayo in its Regional Setting Map 4 - Bulawayo within its National Setting Map 5 - Soils Map 6 - Drainage Map 7 - Height zones and ground water elevation Map 8 - Existing Land uses Map 9 - Educational Facilities Map 10 - Existing Health Facilities Map 11 - Exising Sewer Catchment Areas Map 12 - Existing Road Network Map 13 - Public Transport Service Areas Map 14 - Electricity Distribution
LIST OF TABLES
Table 1: Major institutions involved in the preparation and implementation of Bulawayo Master Plan
Table 2: Demographic Characteristics of the Urban settlements in Zimbabwe (2002 – 2012) Table 3: Municipal Properties, Land areas and values Table 4: Existing residential stands by density Table 5: Existing industrial areas

Review and Preparation of Bulawayo Master Plan (2019 – 2034) Report of Study
------------------------------------------------------------------------------------------------------------------------------
x
Table 6: Bulawayo Province Population Pyramid 2012 Table 7: Summary of Population Composition Table 8: Crude Birth Rate, General Fertility Rate and Total Fertility Rate for Bulawayo, Harare
and Zimbabwe
Table 9: Crude Birth Rate and Crude Death Rate: Bulawayo, Harare and Zimbabwe Table 10: Early childhood mortality rates, 2015 Table 11: Crude Birth, Crude Deaths and Natural Increase for Bulawayo, Harare and
Zimbabwe Table 12: Interprovincial Migration Table 13: Inter-Provincial Lifetime Migration Proportion Matrix, Zimbabwe ICDS 2017 Table 14: Population Size and Growth Rates: Bulawayo, Harare and Zimbabwe Table 15: Population and Households, Bulawayo, Harare and Nationally Table 16: Employment and Unemployment as a percentage of the Total Economically Active Table 17: Current occupation by Gender – 2012 Table 18: Average and Total Annual Remittances from Abroad received by households by
Province, Rural and Urban Areas Table 19: Economic Activity by Gender 2012 Table 20: Number of people employed in the Informal Sector by Sex and Province Table 21: Income Levels in Bulawayo Table 22: Private Sector Housing Development in the City Table 23: Housing needs in Bulawayo as at October 2018 Table 24: Acquisition methods of Housing units in Bulawayo, 2002 & 2012 Table 25: Types of Dwelling Units in Bulawayo 2002 & 2012

Review and Preparation of Bulawayo Master Plan (2019 – 2034) Report of Study
------------------------------------------------------------------------------------------------------------------------------
xi
Table 26: Households access to services in Bulawayo 2012 Table 27: Sources of cooking by households Table 28: Early Childhood Development Centres in Bulawayo Table 29: Existing Primary Schools in Bulawayo Table 30: Secondary/High Schools in Bulawayo Table 31: Population of School-going Age in Bulawayo as at 2012 Table 32: Percent Total Population aged 3 – 14 yrs who never attended school by Province, Table 33: Private Colleges in the City Table 34: Vocational Training Colleges and skills offered at the centres Table 35: Number of graduates at the various Vocational Training Colleges, 2012 -2017 Table 36: Location of NUST Campuses in the Country Table 37: Faculties and Departments at inception - NUST 1991 Table 38: Faculties and Departments as at 2018 Table 39: Student enrolment between 2012 – 2018 Table 40: Enrolment Statistics of international students: 2012 – 2018 Table 41: Physical Infrastructure at NUST Table 42: Student enrolment at the Zimbabwe School of Mines, 2012 – 2018 Table 43: Enrolment Statistics of foreign students over the past six (6) years: 2012 – 2018. Table 44: Graduation Statistics over the past 5 years Table 45: Staff Compliment at the Zimbabwe School of Mines Table 46: Social and Physical Infrastructure at the Zimbabwe School of Mines Table 47: Number of Graduates at Hillside Teachers College, 2012 - 2018

Review and Preparation of Bulawayo Master Plan (2019 – 2034) Report of Study
------------------------------------------------------------------------------------------------------------------------------
xii
Table 48: Social and Physical Infrastructure at Hillside Teachers College Table 49: Number of Graduates over the past five years Table 50: Social/Physical infrastructure at the United college of Education Table 51: Existing Physical Infrastructure at the Bulawayo Polytechnic Table 52: Major Health Facilities in Bulawayo Table 53: Municipal Clinics and Population Served Table 54: Staffing situation at the Bulawayo City Council health facilities Table 55: HIV Prevalence by Age and Sex: 15-49, 15-24 and 0-14 Age Groups Table 56: Available equipment for refuse removal Table: 57: Service Levels by the Municipality Table 58: Coverage of spraying and Baiting in the City – 2017 Table 59: Animals slaughtered at Abbatoirs – 2017 Table 60: Community Halls in the Bulawayo Table 61: Youth Centres in the City Table 62: Crime Statistics in Bulawayo Table 63: Sites allocated for ZRP developments Table 64: Prison Facilities within the Planning Area Table 65: Post Offices in Bulawayo Table 66: Existing situation at Garden Park Trust Table 67: Existing situation at Edith Duly Table 68: Existing situation coronation cottages Table 69: Existing situation at Rhodes Jubilee

Review and Preparation of Bulawayo Master Plan (2019 – 2034) Report of Study
------------------------------------------------------------------------------------------------------------------------------
xiii
Table 70: Existing situation at Barbra Burrell Table 71: Existing situation at Ekuphumuleni Geriatric Nursing Home Table 72: Existing situation at Railstein Home Table 73: Existing situation at Savyon Lodge Table 74: Existing situation at Queen Mary House Table 75: Existing situation at Bartley Memorial Block Table 76: Registered Child Care facilities Table 77: Staff compliment at existing child care facilities Table 78: Existing Fire Stations Table 79: Existing cemeteries in the City Table 80: Libraries being managed by the City of Bulawayo Table 81: Other Public Libraries in the City Table 82: Swimming pools in the city Table 83: Status of Public conveniences in the city Table 84: Main water sources for Bulawayo Table 85: Present and Future annual average daily water demands for growth with a medium level demand scenario Table 86: Capacity projections for WWTW Table 87: City of Bulawayo total road network Table 88: Condition of sealed roads in the city Table 89: Condition of sealed roads in the city Table 90: Condition of gravel roads in the city

Review and Preparation of Bulawayo Master Plan (2019 – 2034) Report of Study
------------------------------------------------------------------------------------------------------------------------------
xiv
Table 91: Condition of earth roads in the city Table 92: Drainage condition in the city Table 93: Substations serving the city, installed capacities and loading Table 94: Tel connections 2014 - 2018 Table 95: Registered vehicles in the city Table 96: Accident Statistics along major routes Jan – August 2018 Table 97: Accident statistics along major intersections Table 98: Major causes of road accidents in the city Table 99: National Railways passenger service provision from Bulawayo Table 100: Freight tonnage handled between 2013 - 2017
LIST OF FIGURES
Figure 1: Population Distribution by Age Group and Sex, Bulawayo 2002 and 2012
Figure 2: Crude Birth, Death and Average Annual growth rate for Bulawayo and Harare Figure 3: Crude death rate, Bulawayo & Harare 1979 - 2017
Figure 4: Bulawayo In migration and Out migration 2002, 2012 & 2017
Figure 5: Migration Rates between Bulawayo and Harare & Net Migration per 1 000
Figure 6: Bulawayo’s average annual growth rate 1962 to 2017
Figure 7: Unemployment Rate % Bulawayo, Harare & Zimbabwe
Figure 8: Unemployment Rate, Bulawayo, Harare & Zimbabwe
Figure 9: Distribution of poor and non poor households in Bulawayo by WARD

Review and Preparation of Bulawayo Master Plan (2019 – 2034) Report of Study
------------------------------------------------------------------------------------------------------------------------------
xv
Figure 10: Economically Inactive Population by Age, Bulawayo, Census 2012 Figure 11: Poverty Prevalence in Bulawayo by WARD Figure 12: Households by tenure status 2002, 2012 and 2017 Figure 13: Tenure Status Figure 14: Main sources of water in the city Figure 15: Main types of toilet facilities in the city Figure 16: Suggested modes of housing delivery in the city Figure 17: Adequacy of ECD facilities in the city Figure 18: Adequacy of Primary Schools in the City Figure 19: Health Care System in Bulawayo Figure 20: Provision of Health facilities in the City Figure 21: Access to the nearest health facility Figure 22: HIV prevalence in females and males among 15 – 49 and 15 – 24 Age groups Figure 23: Comparison of HIV prevalence between females and males 15 – 49 yr age group Figure 24: Mental Health in Zimbabwe Figure 25: Waste Hierarchy Figure 26: Riding Quality of the city of Bulawayo Road network LIST OF BOXES Box 1.1 Plans, Acts, Policies and Regulations considered relevant to the Review and
Preparation of Bulawayo Master Plan (2019 – 2034)
Review and Preparation of Bulawayo Master Plan (2019 – 2034) Report of Study
------------------------------------------------------------------------------------------------------------------------------
xvi
LIST OF ANNEXES Annex 1 Household Questionnaire Annex 2 Industrial Questionnaire Annex 3 Health Facilities in Bulawayo Annex 4 Staff Establishment City of Bulawayo Health Facilities
LIST OF ABBREVIATIONS
ADB African Development Bank
AIDS Acquired Immune Deficiency Syndrome
ARV Anti Retroviral Therapy
BCC Bulawayo City Council
BBR Bulawayo Beitbridge Railways
CABS Central African Building Society
CBD Central Business District
CBO Community Based Organisations
CBR Crude Birth Rate
CIDA Canadian International Development Agency
CVR Central Vehicle Registry
DDC District Development Committee
ECD Early Childhood Development
EMA Environmental Management Agency
EMP Environmental Management Plan
EIA Environmental Impact Assessment
EID Early Infant Diagnosis
ESAP Economic Structural Adjustment Programme
FBC FBC Bank Limited
FGD Focus Group Discussion
GFR General Fertility Rate
HAART Highly Active Antiretroviral Therapy
HTC Hillside Teachers College
HIV Human Immune Virus
HPZ Housing People of Zimbabwe
ICT Information Communication Technology
ICU Intensive Care Unit

Review and Preparation of Bulawayo Master Plan (2019 – 2034) Report of Study
------------------------------------------------------------------------------------------------------------------------------
xvii
IDBZ Infrastructure Development Bank of Zimbabwe
IDS Intercensal Demographic Survey
I – PRSP Interim Poverty Reduction Strategy Paper
JJA Jairos Jiri Association
KG VI King George 6
LA Local Authority
LSU Lupane State University
MBA Masters in Business Admnistration
MDGs Millenium Development Goals
MDP Municipal Development Partnership
MLGPW&NH Ministry of Local Government Public Works and National Housing
MoA Ministry of Agriculture
MoHTE Ministry of Higher and Tertiary Education
MoPSE Ministry of Primary and Secondary Education
NGO Non Governmental Organisation
NHF National Housing Fund
NRZ National Railways of Zimbabwe
NSSA National Social Security Authority
NUST National University of Science and Technology
O – Level Ordinary Level
PDC Provincial Development Committee
PDL Poverty Datum Line
PMTCT Prevention of Mother to Child Transmission
POSB Post Office Savings Bank
PPP Public Private Partnership
PSMI Premier Service Medical Investment
RUAF Resource Centre for Urban Agriculture and Forestry
RTCPA Regional Town and Country Planning Act
SADC Southern African Development Corporation
SDCs School Development Committees
SDGs Sustainable Development Goals
SEIA Strategic Environmental Impact Assessment
SIDA Swedish International Development Agency
STIs Sexually Transmitted Infections
TB Tuberculosis
ToR Terms of Reference
UBH United Bulawayo Hospitals
UCE United College of Education
UDI Unilateral Declaration of Independence
UN United Nations Development

Review and Preparation of Bulawayo Master Plan (2019 – 2034) Report of Study
------------------------------------------------------------------------------------------------------------------------------
xviii
UNAIDS United Nations Programme on HIV and AIDS
UNFPA United Nations Fund for Population Activities
UNICEF United Nations Children’s Fund
USAID United States International Development
VCT Voluntary Counseling and Testing
WB World Bank
WHO World Health Organisation
WITC Westgate Industrial Training College
ZDF Zimbabwe Defence Forces
ZECO Zimbabwe Engineering Company
ZETDC Zimbabwe Electricity Transmission and Distribution Company
ZHPF Zimbabwe Homeless Peoples Federation
ZITF Zimbabwe International Trade Fair
ZIMASSET Zimbabwe Agenda for Sustainable Socio Economic Transformation
ZIMSTAT Zimbabwe National Statistics Agency
ZINACHO Zimbabwe National Association of Housing Co-operatives
ZINARA Zimbabwe National Road Authority
ZINATHA Zimbabwe National Traditional Healers Association
ZPC Zimbabwe Power Corporation
ZPCS Zimbabwe Prison and Correctional Services
ZRP Zimbabwe Republic Police
ZSM Zimbabwe School of Mines
ZTV Zimbabwe Television

Review and Preparation of Bulawayo Master Plan (2019 – 2034) Report of Study
------------------------------------------------------------------------------------------------------------------------------
1
CHAPTER 1 1.0 INTRODUCTION 1.1 GENERAL BACKGROUND 1.1.1 Bulawayo is the second largest city in Zimbabwe and the capital of Matabeleland Province in the South Western part of Zimbabwe. The city was founded as a centre by Lobengula, King of the Ndebele in 1870. It was occupied by the pioneer column under the leadership of Rhodes on 4 November 1893 and was declared a town by Dr. Jameson on 1 June 1894. The city became a municipality on 27 October 1897 and was elevated to city status in 1943. 1.1.2 As at 1946 the city had a population estimate of 33 322 and in 1956 the population had increased to 65 5001. In 1962 the city had a population of 210 600 people growing to 236 320 people in 1969. The 1st Master Plan for Bulawayo became operative on the 18th March 1980 and had a population projection of 392 3002. The population grew to 495 317 in 1982 and 620 935 a decade later. The moderate population growth continued to 676 650 in 2002 before taking a downward turn to 655 675 in 2012. According to the Intercensal Demographic Survey of 2017 there were about 741052 people in 2017 during the intercensal survey. 1.1.3 Over the past fifty six (56) years, the city has recorded considerable growth in terms of
population and residential expansion which has called on the need for up to date integrated comprehensive development guides for the entire city. See Map 1 which shows the City’s Historical Growth.
1.1.4 The preparation of the operative Master Plan for Bulawayo commenced in the year 2000
but was approved on the 29th January 2004. That was more than eighteen (18) years ago and with the passage of time, the physical, economic, social and environmental conditions upon which the plan’s proposals were premised have changed significantly. There are new planning challenges and issues which have emerged and some of the old issues as indicated in the Terms of Reference (ToR) have continued to persist. This is more so given that planned activities are not always developing as intended as conditions are ever changing and dynamic. Under such circumstances, the review of the current plan and the preparation of a new plan for Bulawayo Planning Area is in line with international best practices where periodic revisions should be the norm.
1.1.5 The present study for all practical purposes comprises of two major components which
are, the review of the Bulawayo Master Plan (2000 – 2015) and the preparation of Bulawayo Master Plan (2018 – 2033). The plan review exercise should be seen as a stage
1 The City of Bulawayo – Official Guide, 2nd Edition, March 1957 2 Bulawayo Master Plan, The Written Statement, November 1981

Review and Preparation of Bulawayo Master Plan (2019 – 2034) Report of Study
------------------------------------------------------------------------------------------------------------------------------
2
in the planning process aimed at enhancing the plan’s responsiveness to changes in the planning environment which calls for appropriate planning intervention measures. In view of the foregoing, this project may be viewed as a re-planning exercise, since some new proposals and recommended strategies in the operational plan will change.
1.1.6 The decision to review and prepare a new Master Plan for Bulawayo stems from the
high priority accorded to the city which was once the industrial hub of the country and it’s role as a major catchment and service centre for the western region. There is a need to address the planning issues and challenges facing the city as identified in the ToR, the need to prepare a Master Plan for Bulawayo cannot be over emphasized. There is need for the preparation of a Master Plan which is comprehensive and which will ensure that envisaged developments proceed in a plan-led orderly manner resulting in the creation of an image and character befitting of Bulawayo as a well-planned since its establishment in 1893. It is against this background that the City of Bulawayo engaged the services of a planning consultancy, given capacity constraints, to work in close liaison with their staff in order to prepare a revised Master Plan for the City of Bulawayo covering the period 2018 – 2033.
1.2 FORM AND CONTENT OF THE MASTER PLAN 1.2.1 The plan is presented in two parts that are largely integrated. Part 1 consists of a study
of the area, presents data on the existing situation in the City of Bulawayo, including an analysis of such data. In addition, problems, constraints, issues and potential in terms of development are identified, plan considerations, development growth scenarios are evaluated and the preferred development growth scenario. The Study is also aimed at understanding and analyzing trends so that future issues can be identified. The Study is intended as a background and leads into part two, called the Written Statement. The Written Statement presents the spatial structure of the chosen development growth scenario, sets out a set of strategies, policies and programmes for the future development and growth of the area. Traditionally Master Plans have been mainly concerned with allocating sufficient land in appropriate locations to enable settlements to grow and develop in an efficient and harmonious way and setting down detailed proposals to control development. It has become apparent that while this is still a key requirement modern Master Plans need to go further and suggest policies and programmes that may strengthen the local economy and where possible assist in employment creation. A modern Master Plan also needs to take due regard of the need for sustainable development and therefore place environmental considerations in the fore front.
1.2.2 Overall the Study will seek to come up with a set of issues, based upon thorough
research and understanding of Bulawayo’s situation which will provide the basis for preparing proposals for future development in the Written Statement.

Review and Preparation of Bulawayo Master Plan (2019 – 2034) Report of Study
------------------------------------------------------------------------------------------------------------------------------
3
1.3 NEED AND JUSTIFICATION FOR THE PLAN 1.3.1 The current Master Plan for the City of Bulawayo was prepared eighteen years ago in
2000 and since then the city’s population has continued to grow. Population increase has continued to exert pressure on available services and facilities and has resulted in increased needs by the communities. At the same time, there is pressure to redirect city growth in a new growth path during an era where the city has endured a long drawn out period of economic depression. In addition, most of the physical, social, economic and environmental conditions and considerations upon which the current plan was prepared have changed and there are new emerging issues and challenges which the operational plan had not anticipated at the time of preparation. All these necessitate the preparation of a revised Plan for the City of Bulawayo.
1.3.2 The need for a review of the 2000 plan and the preparation of the Bulawayo Master
Plan (2018 – 2033) becomes more compelling and justified due to the fact:
i) There have been a lot of new developments which have taken place in the city since then which necessitates that an up to date existing and land use map be prepared;
ii) With an increase in the demand for various land use categories, there is a need
to prepare local area development plans, detailed layout plans, precinct and subject development plans to satisfy the development demands and pressures in the city;
iii) An increase in development applications and the intensification of development
ensures the efficient use of land and prevents urban sprawl. This however, strains existing infrastructure capacities. Such developments call for intervention by way of aligning demands and corresponding infrastructure capacity.
iv) The operational plan was prepared without the benefit of a Strategic
Environmental Impact Assessment Study resulting in the production of an Environmental Management Plan (EMP) is an important aspect in view of the need to assess and evaluate the environmental implications of recommended proposals prior to their implementation so as to put in place appropriate mitigation measures.
v) The 2000 plan downplayed the issue of urban agriculture in the city. It is
important that the city be self-sustaining with regards to agricultural production and for this reason the revised plan should recommend strategies for developing agriculture in the planning area.
vi) The city has always been the industrial hub for the country but most industries in

Review and Preparation of Bulawayo Master Plan (2019 – 2034) Report of Study
------------------------------------------------------------------------------------------------------------------------------
4
the city relocated or closed down. As a result, there is need for the revised plan to formulate strategies and policies aimed at inducing economic growth in the City and also to guide investment decisions.
vii) The city has over the years faced challenges with strategic infrastructure services
particularly regarding the security of water supply, electricity supply, sewage disposal and protection of natural resources. Service infrastructure master plans become essential requirements in charting a definitive way forward in providing services for the population and for planning for the city’s local economic development;
1.3.3 The above requirements and considerations largely inform the need and justification for
the preparation of a new Master Plan for the City of Bulawayo. The new Master Plan (2018 – 2033) for the City of Bulawayo will deal with all issues not addressed in the current plan such as economic and tourism development, quality and standards of residential neighbourhoods which will make Bulawayo a liveable, functional, safe and environmentally friendly city in line with the principles of new urbanism and mordenity. Importantly, it is expected that the revised plan would lead to an improved quality of life for the residents by addressing key issues such as housing, social and community facilities, infrastructure and economic activities amongst others.
1.4 PURPOSE AND SCOPE OF THE PLAN 1.4.1 The primary purpose of the Bulawayo Master Plan is for the City to have a
comprehensive document which is founded on a development trajectory which has a clear development vision, mission and explicitly articulates the goal, objectives and policies which will guide and shape the future development of the city in a sustainable manner. In addition, the plan will contain policy statements and proposals which deal with major issues of population, housing, the economy, employment, social and community needs, infrastructural services, transport, the environment and the overarching budgetary element for the city boundary over the span of the Master Plan.
1.4.2 A well-planned city will place the Bulawayo Metropolitan area on a developmental path
underpinned by a rational spatial structure and form that will make it cost effective and efficient for the Local Authority to fulfill its service delivery mandate. A clearly articulated plan for service delivery in the short, medium to long term in terms of the provision of planned infrastructure, creation of a decent living environment and leveraging for local economic development and the associated spinoffs. This exercise should be a pivot and axle aimed at reasserting Bulawayo’s status as major investment destination in this critical development stretching from the Cape through Bulawayo to Cairo. This Master should in the long term synchronise itself with government’s economic revival agenda and serve as a magnet to reassert it as part of critical movement and investment corridor. The idea should be geared towards breaking the

Review and Preparation of Bulawayo Master Plan (2019 – 2034) Report of Study
------------------------------------------------------------------------------------------------------------------------------
5
isolationist regional policies and initiatives which have over the years resulted in the creation of secondary transportation and investment corridors between the southern and northern tips of the African continent. Bulawayo is undoubtedly a strategically positioned regional growth node in southern Africa.
1.4.3 The role, functions and Purpose of the Master Plan area as follows: i) Developing a spatial model informed by a spatial vision which takes into account
city spatial expansion, compact poly-centricity and encouraging spatial integration;
ii) To provide a spatial development framework by which the City of Bulawayo can establish priorities and prepare Capital Improvement Budgets and Programmes.
iii) To review the existing land uses, make proposals for changes where required and zone land for specific purposes with a view to meeting future development needs.
iv) To provide Bulawayo City Council with a technical document which will provide a framework to inform development control decisions through land use management tools within the city limits
vi) To provide a coordinating role for the programmes of private, state and parastatal organisations
vii) To promote the physical environment of Bulawayo as a setting for human activities which is functional, efficient, healthy and conducive
viii) To promote optimum use of land underpinned with a need to safeguard the environment.
ix) To focus attention and discussion on the future development character of the City of Bulawayo by encouraging public participation in the planning process and formulation of proposals.
x) To take into consideration professional and technical knowledge to ensure that informed political decisions are made concerning the utilization of land within the city boundary.
xi) Development of clear urban development zones and spatial development policy regulations
1.4.4 Although the Bulawayo Master Plan has a bias towards land use, it none the less
addresses key issues of environmental concerns, the informal sector, investment promotion and urban agriculture. The plan is much wider in scope than traditional Master Plans. The challenge facing the city is to promote economic growth strategies in light of the economic stagnation and decline which has characterized the city in recent years.

Review and Preparation of Bulawayo Master Plan (2019 – 2034) Report of Study
------------------------------------------------------------------------------------------------------------------------------
6
1.5 SCOPE, FUNCTIONS AND UNDERLYING PRINCIPLES 1.5.1 The scope of this project is such that it entails the review of the current Bulawayo
Master Plan (2000 – 2015) and the preparation of a long term forward development guide for Bulawayo covering a period of 15 years (2019 – 2034). The revised Master Plan is meant to be used as a development guide and framework for land use management tool by the City of Bulawayo. At this scale of planning, the Master Plan provides strategies, policy statements, proposals, recommendations and guidelines that deal with major issues of population dynamics, land use dispositions and land use activities and spatial modelling. It also deals with economic growth, investment promotion and employment creation, housing provision, social and community services and requirements, sustainable development and natural resources conservation and infrastructure provision and requirements. Importantly the plan should also make recommendations on how land in the Planning area will be utilised during the plan period, in terms of land use and zoning arrangements. The scope of the plan requires that it not only addresses physical elements but also addresses issues of environmental concern which will necessitate that all the development proposals be subjected to a Strategic Environmental Impact Assessment (SEIA). The Master Plan is expected to be comprehensive and multi sectoral in content and coverage.
1.5.2 As a technical and working document, the Bulawayo Master Plan (2019 – 2034) will
serve the following functions:
i) To provide the City of Bulawayo with a tool for spatial development guidance and a framework for land use management within the Planning Area.
ii) To provide a framework for city economic revival and development of the local economy;
iii) To provide a spatial framework by which the City of Bulawayo can model city growth, establish development priorities and draw up estimates of funds that will be used to provide social and community facilities and infrastructure;
iv) To promote the rational use of land, while at the same time balancing the requirements of developing the physical environment and the need to safeguard and protect the natural environment in order to ensure sustanable development;
v) To project future population estimates as a basis to project future land use requirements, identify and reserve land to meet these requirements within the constraints and opportunities identified
vi) To provide technical and professional information to the political decision making process to aid in making informed decisions regarding the physical developments in the Planning Area.

Review and Preparation of Bulawayo Master Plan (2019 – 2034) Report of Study
------------------------------------------------------------------------------------------------------------------------------
7
1.5.3 In addition, the preparation of Bulawayo Master Plan (2019 – 2034) is informed by the following underlying principles;
i) Consultations and Consensus Building – Community members and
stakeholders must be given the opportunity to participate in the plan preparation process and make valuable inputs in the areas of spatial analysis, establishment of planning issues/challenges and making proposals;
iii) Use of Credible Data on which the plan preparation process is based; iv) Adoption of a spatial model for a new developmental spatial outlook; iii) Sustainable Development, the developments should meet the needs of
the present generation without compromising the ability of future generations to meet their own needs. This implies the protection as well as conservation of the natural and built environment;
iv) Implementability and Cost Effectiveness of the Development Plan’s proposals and recommendations
1.5.4 In addition, the preparation of the Master Plan for the City of Bulawayo will be informed
by the following general guiding principles:
i) An action oriented and proactive plan that primarily addresses areas of conflicts, existing planning issues/challenges and at the same time identify development opportunities on a new growth trajectory;
ii) Instilling public participation and promotion of a strong sense of ownership of the plan by the community and stakeholders;
i) A dynamic approach to planning based on a spatial development model with clear monitoring and review mechanisms in place to ensure the accommodation of ever changing conditions upon which the plan is premised;
ii) Putting in place mechanisms for enabling implementation of the plan by the various role-players including government as well as evaluation of the plan’s performance periodically or through implementation of various elements through subordinate plans and instruments;
iv) Responsibility and accountability among institutions and stakeholders which have a stake in the development of the city;
v) Integration of physical, social, economic and environmental consideration and elements into the plan;
vi) Capacity building and training as part of the planning process and output; vii) Observance of international environmental conventions and protocols of
which Zimbabwe is a signatory, especially with regards to sustainable human settlements e.g. Agenda 21 and other relevant national policies and Acts relating to development planning.

Review and Preparation of Bulawayo Master Plan (2019 – 2034) Report of Study
------------------------------------------------------------------------------------------------------------------------------
8
1.5.5 The plan will also be aligned to Sustainable Development Goals (SDGs). This is because the SDGs concepts resonate well with the country’s development ideas which puts a lot of emphasis on themes such as sustainable development, environmental protection, consultation etc.
1.5.6 It is therefore important that the preparation of this plan is underpinned by these
principles and that all the other underlying and general principles indicated above be applied in the preparation of this plan and be reflected in the development proposals. Finally during the preparation of lower level plans down to detailed layout plans, principles of social integration will be key in the provision of residential plots and other social facilities and amenities.
1.6 STATUTORY PROVISIONS 1.6.1 The legal provisions for the preparation of Bulawayo Master Plan are enshrined in part
IV of the Regional, Town and Country Planning Act (1976) Chapter 29: 12 revised edition 1996, as read with the Regional Town and Country Planning, Master and Local Plans Regulations. The provisions of these sections of the Act apply to Bulawayo on account of it being a Local Authority. The preparation ad revision of Master Plans are statutorily provided by Sections 13 1 (b) and (c) of the Act. Section 13 (1) mandates a Local Planning Authority to undertake a study of the planning area to the extent it considers necessary of any neighbouring area examining matters it considers may be likely to affect the development or redevelopment of the area.
1.6.2 The study area for the Master Plan will constitute a 10 km radius from the current
Master Plan Boundary. In terms of Section 13 (b), before altering or replacing any Master or Local Plan, the Local authority must undertake a fresh study of the planning area or any part thereof or of a neighbouring area in this case Umguza Rural District Council, examining matters which are likely to affect development. Section 13 (2) further indicates that when reviewing a Master or Local Plan any matters relating to a neighbouring area, the Local Planning Authority shall consult with any local planning authority or local authority which has jurisdiction in that area concerning those matters.
1.6.3 Section 14 (2) states that a master plan prepared in terms of subsection (1) shall:
(a) formulate the policies of that authority and its general proposals for the planning area in respect of the co-ordinated and harmonious development or re-development and other uses of land, including measures for:
(i) the regulation of the use of land and the construction and use of buildings; (ii) the conservation and improvement of the physical environment, including the preservation of buildings of special architectural merit or historic interest; (iii) the economic development of the planning area; and (iv) the movement of traffic therein, including the closure and diversion of roads

Review and Preparation of Bulawayo Master Plan (2019 – 2034) Report of Study
------------------------------------------------------------------------------------------------------------------------------
9
(b) set out the relationship of the proposals to the major proposals for land use and traffic in any neighbouring area which may affect the planning area; and
(c) indicate the manner in which the policies and proposals are justified by the study and by any other information obtained by the local planning authority;
(d) indicate the parts of the planning area which are of high scenic value and should be protected
1.6.4 Section 14 (3) provides that in preparing the master plan, the local planning authority
shall: (a) consult neighbouring local planning authorities and local authorities and any
other statutory or other body whose activities or plans may affect the master plan with the objective of ensuring co-ordination of polices; and
(b) have regard to- (i) the information obtained in the study and any other information obtained by that authority
(ii) the provisions of any regional plan, whether in operation or in the course of preparation, which may affect the planning area or, in the absence of such a plan, the relationship between the planning area and the surrounding area and (iii) the current economic and social circumstances prevailing in the area and the surrounding areas; and (iv) the phasing of any development in terms of the master plan, the order of priorities in respect of proposals and the reasons therefore and
(v) the resources likely to be available 1.6.5 Section 14 (4) : the Local Planning Authority shall indicate in its master plan any part of
the planning area which it has selected for comprehensive development, redevelopment or improvement as a matter of priority.
1.6.6 Section 14 (5) : he master plan shall consist of a written statement with proposals
illustrated on a map as appropriate and accompanied by other maps, diagrams, illustrations and descriptive matter as the local authority considers appropriate.
1.6.7 Section 14 (6) : A master plan may include proposals in relation to any neighbouring area if the Minister after consultation with any other local planning authority concerned has authorized the local planning authority to include that area within the master plan, but the inclusion of such neighbouring area shall not be construed as meaning that the local planning authority which has prepared the master plan shall be the local planning authority for that neighbouring area for the purposes of any other provision of the Act.
1.6.8 Section 15 (1) : In formulating and before finally determining the contents of the master plan, the local planning authority shall take such steps as will in its opinion ensure that

Review and Preparation of Bulawayo Master Plan (2019 – 2034) Report of Study
------------------------------------------------------------------------------------------------------------------------------
10
there is adequate consultation in connection with the matters proposed to be included in the master plan.
1.6.9 Section 15 (2): After adopting the master plan but before submitting it to the Minister, the local planning authority shall;
(a) place on public exhibition for two months a copy of the draft master plan with a statement indicating the time within which objections to or representation in connection with the draft master plan may be made to the Minister with copies thereof being sent to the local planning authority; and (b) give public notice of the place or places at which and the period for which the draft master plan will be exhibited and the time within which objections to or representations in connection with the draft master plan may be made.
1.6.10 Section 16 (1): At the expiary of the two (2) months the local planning authority shall submit to the Minister (a) the draft master plan exhibited (b) a report of the study carried out (c) a report on the objections and representations received indicating the views of the local planning authority on such objections or representations
1.6.11 Section 16 (2): The Minister may return a draft master plan submitted with directions as to- (a) the submission to him of additional information; (b) the giving of further publicity in respect of any particular matter
1.6.12 Section 16 (3): In considering a draft master plan submitted or resubmitted the Minister shall- (a) take into account the reports submitted and any other matter which appears
to him to be relevant, whether or not it was taken into account by the local planning authority; and
(b) consider any objections or representations made in so far as they have not been met or withdrawn, may refer them to the Administrative Court for determination or to a local inquiry for investigation; and (c) cause a local inquiry to be made into any matter which n his opinion should be the subject of such as enquiry
1.6.13 Section 16 (4): The Minister may approve the draft master plan submitted or resubmitted subject to such modifications or reservations if any as he deems fit or reject such draft master plan and shall thereafter give notice in the gazette of his decision which notice shall if he has approved such draft master plan specify the date on which the master plan shall become operative.

Review and Preparation of Bulawayo Master Plan (2019 – 2034) Report of Study
------------------------------------------------------------------------------------------------------------------------------
11
1.6.14 Apart from the provisions of the RTCPA mandating the preparation and review of Master Plans, there are Acts, Policies and Regulations whose provisions are considered relevant to the Review and Preparation of Bulawayo Master Plan. These are listed in Box 1.1. This is in the sense that the proposals and recommendations of the plan must be in harmony with and be guided by these relevant Acts, Policies and Regulations. The Bulawayo Master Plan must be seen as a sub set of the national development planning framework upon which other levels of plans and policies draw inspiration from. There are interrelationships, complementarities and linkages between these various levels of plans and policies in the sense that lower order plans and policies are informed and draw inspiration from the higher order plans and policies.
Box 1.1: Plans, Acts, Policies and Regulations considered Relevant to the Preparation of Bulawayo Master Plan (2019 – 2034)
• Regional Town and Country Planning Act 29: 12
• Urban Councils Act (Chapter 29:15)
• Sustainable Development Goals
• National Housing Policy 2012
• Environmental Impact Assessment Act 2007
• Statutory Instrument 216
• Mines and Minerals Act
• Interim Poverty Reduction Strategy Paper
• Forestry Act CAP 19:05
• Education Act 25:04
1.7 INSTITUTIONAL AND ADMINISTRATIVE ARRANGEMENTS
1.7.1 This section is aimed at documenting the existing institutional and administrative
structures that underpin the planning and implementation of projects, programs and
strategies within the Bulawayo planning area. It highlights and analyses the major roles

Review and Preparation of Bulawayo Master Plan (2019 – 2034) Report of Study
------------------------------------------------------------------------------------------------------------------------------
12
and responsibilities, coordination and cooperation linkages between various
development agents within Bulawayo. The major purpose of this analysis is to establish
unnecessary duplication of efforts as well as ways to enhance efficiency in the delivery
of services.
1.7.2 Central and Local Government institutions undertake various development projects that
have a bearing on the successful implementation of the Bulawayo Planning Area. At the
national level, all Ministries, Departments and parastatals are involved in one way or the
other in the development of Bulawayo. However, Ministries such as the Ministry of
Local Government, Public Works and National Housing, Ministry of Lands and
Resettlement, Ministry of Health and Child Care, Ministry of Education and Skills
Development and the Ministry of Water and Energy Resources play a pivotal role in the
city.
1.8 NATIONAL LEVEL INSTITUTIONS
1.8.1 The main pieces of legislation which define the operations of the Local Government Sector are the Provincial Councils and Administration Act, The Urban Councils Act, the Rural District Councils Act, the Traditional leaders Act and the Regional Town and Country Planning Act. As shown in table 1 Local Government is responsible for Urban and Rural Local Authority services, Traditional Leadership Support Services, Physical Planning services and Civil Protection services while Public Works is responsible for Architectural Services, Engineering Services, Quantity Surveying, Construction and Maintenance, Valuation and Estates Management Services, National Housing and Social Amenities. The Ministry also co-ordinates policies, plans, programmes and strategies for rural and urban development at national, provincial and local levels – that is between Central Government Ministries and Departments and Local Authorities in the various provinces.
1.8.2 Under the Regional, Town and Country Planning Act (1976) Chapter 29: 12 revised
edition 1996, as read with the Regional Town and Country Planning, Master and Local
Plans Regulations, the Minister responsible for the Ministry of LGPW & NH is currently
responsible for the orderly and progressive development of land in both urban and rural
areas. On a day to day basis, the Minister’s responsibilities have been delegated to
several Departments such as the department of Physical Planning and Urban State Land.
The Department of Physical Planning is responsible for formulating national policies and
guidelines on all aspects of physical planning. At present, responsibilities for preparing
Master and Local Plans have been delegated to Local Authorities although the
Department of Physical Planning prepares Master and Local Plans on behalf of the
Minister especially for the Local Authorities which do not have the capacity.

Review and Preparation of Bulawayo Master Plan (2019 – 2034) Report of Study
------------------------------------------------------------------------------------------------------------------------------
13
1.8.3 The MLGPW & NH provides national leadership and directions on customary and
traditional policy matters to all tribal administrative institutions across the country as
well as provision and management of senior human resources for all Local Authorities
(through the Local Government Board). The Department of housing is responsible for
the formulation of housing policies and advising Local Authorities on all issues related to
implementation of housing policies.
1.9 SUB NATIONAL LEVEL INSTITUTIONS
1.9.1 The Minister of State for Provincial Affairs
1.9.1.2 The Minister of State for Provincial Affairs represents the office of the president and
cabinet at the Provincial level. The Minister of state is the interface between the general
public and the office of the President and Cabinet. In addition to being a political head
of provincial government official the roles of the Ministers of State includes the
following amongst others:
• To be the interface between the general public and the office of the President
and Cabinet.
• To preside over state occasions such as Independence Day Celebrations and
burial of Provincial Heroes within the province.
1.9.2 Provincial Administration
1.9.2.1 The Provincial Administration is headed by the Provincial Administrator who in principle
heads and coordinates all Central Government Departments in the Province. As the
chairperson of the Provincial Development Committee, which consists of heads of
Central Government Departments, Local Authorities, Non Governmental organisations
and other key stakeholders in the Province. The Provincial Administrator is responsible
coordinating the various activities of Central Government ministries and agencies at
Provincial level to ensure coordinated planning, development and implementation as
well as overseeing the preparation, implementation and monitoring of Provincial
Development Plans. As a result the Provincial Development Committee is the fulcrum of
Provincial development and planning.
1.9.3 Bulawayo City Council – The Local Authority
1.9.3.1 The Planning Area for the Bulawayo Master Plan is administered by the City of
Bulawayo, the 2nd largest city on Zimbabwe. The powers and functions of the Bulawayo
City Council are derived from the Constitution of the Republic of Zimbabwe and a range
of local government legislation such as the Urban Councils Act (Chapter 29:15) provides

Review and Preparation of Bulawayo Master Plan (2019 – 2034) Report of Study
------------------------------------------------------------------------------------------------------------------------------
14
for the setting up of town and municipal councils by the President. The Act empowers
the Minister of Local Government to give direction to the local councils concerning
administration, control and management of the council. The Local Authorities are
mandated with powers to exercise good governance and promote development within
their areas of jurisdiction including the provision of:
• Primary Health Roads
• Primary Education Environmental Health
• Housing Sanitation
• Water Supply Electrical Department
1.9.3.2 Other activities which LAs are undertaking include Town Planning, social and community
development and trade licensing. Although the provision of water is being under taken
by the city of Bulawayo, in practice ZINWA provides water and sewerage.
1.9.3.3 Bulawayo City Council is composed of 29 wards with an elected councilor residing within
the ward. The Local Authority is tasked with responsibilities of performing all functions
as per Urban Councils Act. The main offices for the city are located at the city hall and
tower block but there are sub offices in the various high density residential areas.
1.9.4 District Administration
1.9.4.1 The District Administration is headed by the District Administrator who in principle
heads and coordinates all Central Government Departments in the district. As the
chairperson of the District Development Committee, which consists of heads of Central
Government Departments, Local Authorities, Non Governmental organisations and
other key stakeholders in the district. The District Administrator is responsible
coordinating the various activities of Central Government ministries and agencies at
District level to ensure coordinated planning, development and implementation as well
as overseeing the preparation, implementation and monitoring of Provincial
Development Plans. As a result the District Development Committee is the fulcrum of
district development and planning. However, there is a weak link between central
government district administrators and the City’s officers responsible for residential
areas such as housing officers.

Review and Preparation of Bulawayo Master Plan (2019 – 2034) Report of Study
------------------------------------------------------------------------------------------------------------------------------
15
Table: 1 - Major institutions involved in the preparation and implementation of
Bulawayo Master Plan
LEVEL INSTITUTION RESPONSIBILITIES
NATIONAL
Ministry of Local
Government Public
Works & National
Housing
Various Departments in the Ministry are
responsible for:
• Formulation and implementation of housing policies
• Formulation of policies and guidelines on physical planning matters
• Approval of Master Plans
• Overseeing Tribal Administration
• Coordinating, formulation and implementation of rural and urban development plans
PROVINCIAL
Office of the Resident
Minister
• To be the interface between the general public and the office of the President and cabinet.
• To preside over state occasions such as independence day celebrations and burial of Provincial Heroes within the province.
• To ensure the successful implementation and completion of all Government Programs and projects at district and provincial level.
• To assist members of the public the public with information on
Government programmes and projects in the Province.
• To direct members of the public to relevant Ministries for assistance.
• To liaise with Local Authorities and residents to ensure adequate and efficient service delivery.

Review and Preparation of Bulawayo Master Plan (2019 – 2034) Report of Study
------------------------------------------------------------------------------------------------------------------------------
16
Office of the Provincial
Administrator
• Coordination of preparation and implementation of Provincial Development Plans,
• Overseeing implementation of projects and programmes funded through Central Government departments and other stakeholders at Provincial level
DISTRICT
Local Authority
• Good Governance
• Spearheading developments
• Provision of roads, water, health, education etc
• Physical Planning,
District Administration • Coordination of preparation and implementation of District Development Plans
• Overseeing implementation of projects and programmes funded through Central Government departments and other stakeholders at District level
LOCAL AUTHORITY Bulawayo City Council • Preparation and implementation of Bulawayo Master Plan through line function departments in conjunction with relevant stakeholders
LOCAL COMMUNITY Residents and interested and affected parties
• Expression of needs and aspirations for incorporation into the master plan
Source: Job Jika & Associates
1.9.4.2 While there is a well-defined institutional hierarchy, there is no strong alignment of the
respective institutional or sector plans (either bottom up or vice versa) with the
Bulawayo Master Plan and this is generally the case nationally. Line function or internal
departmental sector plans are not structurally integrated as they find expression in the
master plan. Successful master proposals implementation is best achieved through
integrated and coordinated roles in the service delivery process.
1.9.4.3 Communities in Bulawayo are consulted in the planning and development process but this can be strengthened through ward-based planning where community needs are

Review and Preparation of Bulawayo Master Plan (2019 – 2034) Report of Study
------------------------------------------------------------------------------------------------------------------------------
17
captured under the microscope. More can be done public consultation in order to gather views on how the people desire their spaces to be shaped as well as their vision for the future of their city in line with the city’s development vision.
1.9.5 CHALLENGES AND OPPORTUNITIES
1.9.5.1 The existence of various institutions involved in development planning and
administration reflect the evolution and development of various Government structures
and the country’s development needs. Provincial and District Administration structures
were a common phenomenon in the rural areas and pre-date the country’s
independence while Local Authorities were later established. District Administration
structures were established to co-ordinate and support the various sector programs in
the districts while Local Authorities were established to perform similar functions within
the districts. This has created dual structures – one coordinating vertical linkages and
the other horizontal linkages – which creates a new problem of coordinating vertical
and horizontal linkages. Planning functions are assigned to the City Council as well as
the Department of Physical Planning. In fact, local authorities, district, provincial and
national tiers of government should be viewed as spheres of government which are
equal, distinctive, interdependent and interrelated. The prevailing intergovernmental
relations where the tiers of government are hierarchically ordered in a top-down
subordinate relationship is problematic.
1.9.5.2 The establishment of Provincial Development Committees (PDC) and District
Development committees (DDC) is an attempt to provide a forum for various
institutions to co-ordinate development as well as align their various initiatives. As
coordinating committees, the Provincial and District Development Committees are
composed of staff from the District Administration, Central Government, Local Authority
and various development agencies. To date these committees co-ordinate the
preparation of Provincial and District Development Plans which are largely socio-
economic plans. Despite these efforts, the program activities of the various stakeholders
are hardly synchronized as there is not enough consultation with the Local Authority on
some of the Government programs. Government departments tend to operate as
separate entities, those in the district report to their provincial headquarters, while
those in the provinces report to the resident Minister or report directly to their
headquarters in Harare.
1.9.5.3 In summary, Bulawayo Planning Area has multi layered administrative structures with
overriding powers and at times overlapping responsibilities. In addition, the city has to
compete for attention and resources with Harare. There is need to rationalize these

Review and Preparation of Bulawayo Master Plan (2019 – 2034) Report of Study
------------------------------------------------------------------------------------------------------------------------------
18
structures in order to improve on decision making processes and improve on service
delivery.
1.10 CONSULTATIONS
1.10.1 The preparation of this Report of Study has been undertaken in through consultation
with both Department of Physical Planning and the Bulawayo City Council/ They have provided key information and have acted as a reference panel to review progress. Widespread consultation has also been attempted with the full range of both the public and private sectors in Bulawayo in order to obtain up to date and relevant information as well as to appreciate the point of view of different sections of opinion in the city. A consultation letter was sent to more than one hundred (100) organisations including the Minister of State and the Provincial Administrator. More detailed letters and meetings requesting specific information were also sent to a number of critical agencies who held vital information concerning the development potential of Bulawayo. Some households and industrialists were involved through a household and industrial questionnaire.
1.11 STUDY AREA
1.11.1 From the onset of the study an important decision had to be made about the area to be
covered as simply studying the area currently gazette as the Municipal boundary would not provide sufficient along term vision. A Master Plan needs to look at least 15 year ahead. It was therefore agreed to widen the study area to incorporate properties within a 10km radius from the existing boundary so that consideration could be given to possible expansion area in future. In accordance within this decision it was agreed for purposes of the Report alone to incorporate into the study the following:
• The gazette Municipal boundary
• Umguza Irrigation Schemes
• Khami Prison
• Worringham
• Sihlengeni communal lands
• Heany Junction 1.11.2 The Study area is shown on Map Two (2). It should emphasized again that the whole
point of this wide coverage is simply to provide a relatively unconstrained view of Bulawayo and its surrounding areas. It should not be interpreted in any way as an attempt to incorporate the areas into the Bulawayo Municipal boundary. The Written Statement of the Master Plan will need to address issues of additional land that may need to be incorporated into the long term if it can be shown that such a need exists. The Report of Study will among other analyse the need, the prospects and existing land availability and suitability to meet the development needs.

Review and Preparation of Bulawayo Master Plan (2019 – 2034) Report of Study
------------------------------------------------------------------------------------------------------------------------------
19
1.12 REPORT STRUCTURE 1.12.1 This project being a review of an operational Master Plan and consequently the
preparation of a new plan will mean the review of the current plan in terms of proposals and the recommendation of new proposals, strategies and policies in the light of current planning challenges facing the city. The review process will cut across all the sectors which were dealt with by the 2000 Master Plan by way of benchmarking each sector against issues identified, proposals made to address the challenges identified per sector. The review process will also establish the extent to which the various sectoral proposals were addressing the issues identified in each sector and the extent to which the proposals have been implemented as well as implementation constraints.
1.12.2 The Report of Study is presented as a situational profile of Bulawayo Planning Area
reflecting our basic findings of our studies into all aspects of Bulawayo’s development and likely future trends. It is a combination of data collection, data analysis and issue highlighting. The report is structured into 3 parts. The 1st part consists of background matters and includes this introduction and chapters of the Regional context and historic setting of Bulawayo and its natural resource base. Part 2 looks at the existing situation with regard to the demographic profile, land use dispositions, activities and practices; state of social and physical infrastructure, traffic, connectivity of land uses and transport modes, state of the environment, economic structure and indicators amongst others. Part 3 is a concluding section designed to bring together the main problems and issues which have to be addressed in the Written Statement. In addition the Report of Survey presents a spatial analysis of the Planning Area both from an urban planning and urban design perspective in order to establish land use conflicts and assess if the City of Bulawayo meets the liveability, safety, functionality and local character/image befitting the second city in Zimbabwe.
1.12.3 The report has been structured in such a manner that all the required information
follows a logical and sequential order. This is intended to facilitate a clearer understanding of the whole report. Below is an outline of the report structure:
Chapter 1 - This chapter serves as a general introduction to the Report of Survey, as it gives a general background and overview about the project. This is in terms of explaining the nature of the project, a review and preparation of the Master Plan for Bulawayo Planning Area. The chapter goes on to provide information for understanding the statutory framework under which the plan is currently being reviewed and highlighting its justification. This chapter also assesses the existing institutional and administrative arrangements within the Bulawayo Planning Area to facilitate governance, project implementation and delivery of services. In the process the chapter notes the levels of coordination and cooperation among the various structures and departments responsible for plan implementation, services delivery and governance in the Planning Area. The chapter also assesses and evaluates the existing institutional

Review and Preparation of Bulawayo Master Plan (2019 – 2034) Report of Study
------------------------------------------------------------------------------------------------------------------------------
20
framework for physical planning within the Planning Area. It concludes by highlighting the limitations and constraints of existing institutional and administration arrangements in the Planning Area. It further provides the underlying principles guiding the review and plan preparation process. Chapter 2 – This chapter contextualizes the Planning Area in terms of location, size and boundaries and assesses the extent to which the 2000 plan captured the functions, linkages and impacts of the Planning Area in national, regional and international contexts. In this chapter changes in Planning dynamics and give an update on such changes since the plan was prepared in an effort to reflect the existing situation. This chapter will serve in providing the base line information necessary for understanding the role and place of Bulawayo both regionally and nationally. Chapter 3 – This chapter provides information on the physical environment of Bulawayo Planning Area and deals with variables such as vegetation, climate, physiography and landforms, geology etc as well as an analysis of these elements and implications for physical developments. The chapter also provides an inventory of the natural resource base of the area, mineral resources on the environment as well as programmes for the sustainable utilization of natural resources. Also presented in this chapter is information on prevailing physical constraints to developments in the Planning Area and an analysis of the impacts of developments on the physical environment. The chapter concludes by providing a constraints zoning map of the Planning Area. The information and analysis presented in this chapter lays the foundation upon which some spatial development decisions are recommendations area made later. Chapter 4 – This is a critical and important chapter of the Study in that it presents a situational profile of the existing land use disposition, activities and practices as they obtain in the Planning Area. The chapter also focuses on assessing the form and structure of Bulawayo in terms of general morphology, connectivity and liveabilility. Informal sector activities (as land use activities); urban agriculture practices; use and management of open spaces and recreational parks; tourism development. These various land uses will be assessed and evaluated as they presently exist. Importantly also, the chapter examines the implications of intensification of land uses and concludes by presenting a summary of all identified issues and challenges facing the Planning Area with regards to land use activities and practices. The formulation and generation of revised land use proposals will be based on emerging land use issues, challenges and present realities. Chapter 5 – This chapter reviews population growth trends, structure, composition, distribution and densities in the Planning Area and takes cognizance of changes in population dynamics since the 2000 plan was prepared and the implications on developments in the Planning Area.

Review and Preparation of Bulawayo Master Plan (2019 – 2034) Report of Study
------------------------------------------------------------------------------------------------------------------------------
21
Chapter 6 - This chapter also presents an existing economic profile in terms of economic indicators – employment, unemployment and labour force amongst others. It further examines economic indices such as growth patterns, poverty levels and poverty alleviation programmes which are in place. The current economic challenges facing Bulawayo are also presented. An economic viability assessment of the Planning Area will also be presented in this chapter by identifying Bulawayo’s areas of comparative advantages which may be harnessed to make Bulawayo competitive nationally and also induce economic growth. Areas of tourism development and the informal sector economy will be closely examined so that issues and challenges from an economic point of view are be highlighted. Chapter 7 – This chapter deals with housing, begins by presenting the National Housing Policy and the institutional framework for housing in the country so as to put the issues of housing into perspective. The chapter examines and analyses the available housing stock, housing conditions and household characteristics in Bulawayo. Importantly also, the chapter examines the housing stock. The quality and standards of residential neighbourhoods in Bulawayo is also dealt with in this chapter. From an analysis of all the variables in the housing sector as they presently exist in Bulawayo, key housing issues and challenges facing the city will be clearly highlighted in the chapter. Chapter 8 – This chapter deals with various educational facilities in the city. It begins by presenting the National Educational Policy and the institutional framework for education in the country so as to put the issues of education into perspective. The chapter examines and analyses the available educational facilities, their adequacy with regards to types, numbers and spatial distribution within the Planning Area. From an analysis of all the variables in the educational sector as they presently exist in Bulawayo, key issues and challenges relating to educational facilities in the city will be clearly highlighted in the chapter. Chapter 9 – This chapter focuses on the health sector in city and begins by outlining the national health policy and the institutional framework for health delivery in the country. It goes on to examine primary health care services and analyses the available health facilities in the Planning Area in terms of their types, numbers, conditions and spatial distribution bearing in mind the population being served. This chapter presents an overview of the health status in Bulawayo as well as examines the question of environmental health. It also deals with environmental health. In the course of all these analyses, key health issues that emerge are highlighted. Chapter 10 – This chapter deals with existing social and community facilities. It examines the levels, types and spatial distribution of social and community facilities in the city with a view of determining their adequacies and the population served. It further highlights the issues and challenges identified.

Review and Preparation of Bulawayo Master Plan (2019 – 2034) Report of Study
------------------------------------------------------------------------------------------------------------------------------
22
Chapter 11 – This is an important chapter as it deals with the extent and adequacy of infrastructural services in the Bulawayo. It assesses the sources of water supply and the degree to which demand is met; examines the sanitation situation; assesses the road network and conditions of roads by analyzing their hierarchies, connectivity and functionality; assesses traffic flows and transportation modes as well as issues of parking and transport terminals in the city; examines the sources of energy and extent of electricity supply, reticulation and also levels of communication infrastructure. All these will be undertaken with a view of determining infrastructure capacities as well as identifying issues and challenges facing infrastructure developments within the Planning Area. Chapter 12 – This chapter seeks to examine and assess environmental concerns as an important component in the plan preparation process. The chapter constitutes an Environmental Audit of selected key and major physical infrastructural developments within the Planning Area aimed at identifying environmental elements which have been impacted by such developments. In this chapter it would be important to clearly indicate how such environmental elements are impacted by such developments. The chapter further assesses existing environmental practices in the planning area and the state of the environment in Bulawayo. Outcomes of the environmental audit in this chapter will constitute a base for mitigation measures that will be recommended at the development proposals stage.
1.13 THE PLAN PREPARATION PROCESS 1.13.1 The review and plan preparation process of Bulawayo Master Plan (2018 – 2033)
constitutes of nine (9) project execution stages and 5 milestone reports as presented below.
Project Stage 1
i. Mobilisation and start up, leading to the production of an Inception Report.
Project Stage 2
i. Extensive and allembracing consultation process with stakeholders that runs
throughout the duration of the project;
ii. Carry out a skills transfer and training of BCC planners attached to the consultancy firm during the duration of the project;
iii. Literature review, sourcing and collection of all existing relevant schemes, plans,
reports, policy documents, maps etc;

Review and Preparation of Bulawayo Master Plan (2019 – 2034) Report of Study
------------------------------------------------------------------------------------------------------------------------------
23
iv. Desktop studies and reviews of all collected literature/reports and plans.
Project Stage 3 i. Carrying out an indepth review and assessment of Bulawayo Master Plan (2000 -
2015), including an appraisal of the prevailing conditions upon which the plan’s proposals were predicted;
ii. Assessment of the plan’s proposals and recommendations, as well as its
performance and implementation; iii. Identification of implementation constraints and also the identification of
emerging planning issues and challenges.
Project Stage 4 i. Field Surveys and data collection on all sectoral aspects as they presently exist in
Bulawayo; ii. Situational, spatial and resource analyses relating to all collected data from field
surveys and desktop studies; iii. Demographic and Economic Analysis; iv. Identification of land use issues, emerging planning challenges, growth
management issues and development opportunities; v. Carrying out of an Environmental Audit of key and major existing developments
and determine the state of the environment; vi. Mapping of all information obtained from the various surveys and analyses in a
remote sensed and GIS generated manner; vii. Projections and Forecasts of future requirements
The completion of tasks in projects stages 2 to 4 will result in the production and submission of the Report of Survey.
Project Stage 5
i. Generation and formulation of development goals and vision for Bulawayo that
will be reflective of the time frame of the plan;

Review and Preparation of Bulawayo Master Plan (2019 – 2034) Report of Study
------------------------------------------------------------------------------------------------------------------------------
24
ii. Translation of the results of the spatial, situational, land use and resource analysis into frameworks that identify possible options, proposals, guidelines, strategies, policies and programmes which may be adopted in an effort to address the identified planning issues and challenges;
iii. Generation of alternative Spatial Development Framework and Growth
Management options; iv. Generation of options and strategies to address the identified planning
challenges; v. An evaluation of the spatial Development Framework and growth management
options and strategies; vi. An evaluation of all possible physical development options and proposals,
guidelines, policies, strategies and programmes to come up with those preferred based on appropriate evaluation criteria.
Project Stage 6
i. Prepare a spatial Development Framework and growth management strategy; ii. Generate sectoral proposals, recommend development guidelines, policies and
programs; iii. Integration of all the preferred options, strategies and proposals into a Draft
Master Plan; iv. Prepare a SEIA of Development Proposals; v. Map all the Development Proposals
The completion of tasks in project stages 5 and 6 will result in the production of Draft Master Plan.
Project Stage 7
i. Address all comments from consultations and public scrutiny on the Draft
Master Plan.
ii. Produce a Draft Final Master Plan and present to Physical Planning.
iii. Present the Draft Final Master Plan to the Minister.

Review and Preparation of Bulawayo Master Plan (2019 – 2034) Report of Study
------------------------------------------------------------------------------------------------------------------------------
25
Project Stage 8
Incorporate all the comments from the Minster and produce a Final Master Plan Document.
Project Stage 9: Project Completion Report
This report will briefly highlight the issues encountered during the preparation of the Master Plan including challenges and lessons learnt including recommendations for embarking on this project in future.

Review and Preparation of Bulawayo Master Plan (2019 – 2034) Report of Study
------------------------------------------------------------------------------------------------------------------------------
26
CHAPTER 2 2.0 GEOGRAPHIC AND CONTEXTUAL SETTING 2.1 GEOGRAPHIC LOCATION, SIZE AND BOUNDARIES 2.1.1 In terms of location, Bulawayo is a separate provincial area from Matabeleland – it is a
Metropolitan Province. Bulawayo Metropolitan is located in the south western region. The region covers Bulawayo Metropolitan, Matabeleland North, Matabeleland South, Midlands and Masvingo. Map 3 shows the location of Bulawayo within its regional setting.
2.1.2 In geographical terms Bulawayo lies on latitude 29° 9" south of the equator and
longitude 28° 58" East of the Greenwich Meridian. In terms of Spatial Size, Bulawayo’s area of coverage is 439 000 hectares (439km2). Bulawayo is the largest settlement in the south western region. According to the 2002 census of population and housing the city had a population size of 650 000 and in 2012 it was 655 675. The city’s population represents 45.6% of Matabeleland North & South’s population and 21.4% of the south western region’s population of 3 047 851. It is worthy to note that Bulawayo ranks as the 2nd largest city as well as 2nd largest in terms of population size (2012 census). Table 2 below shows how Bulawayo compares with other urban settlements in the country in 2002 and 2012.
Table 2: Demographic Characteristics of the Urban settlements in Zimbabwe (2002 – 2012)
Settlement Population Annual Growth (%)
2002 - 2012
2002 2012
Harare Bulawayo Chitungwiza Mutare Urban Epworth Gweru Urban Kwekwe Urban Kadoma Urban Masvingo Urban Chegutu Urban Marondera Urban Ruwa Zvishavane Urban Bindura Urban
1 435 784 676 650 323 260 170 466 114 067 140 806 93 608 76 351 36 408 43 424 51 847 23 681 35 128 98 018
1 468 767 655 675 354 472 188 243 161 840 158 233 100 455 92 469 88 554 49 832 62 120 56 333 45 325 44 033
2.3 -3.0
9.7 10.4
41.8 12.4 7.3 21.1
143.2 14.8 19.8
137.9 29.0
-55.1

Review and Preparation of Bulawayo Master Plan (2019 – 2034) Report of Study
------------------------------------------------------------------------------------------------------------------------------
27
Beitbridge Urban Hwange Urban Redcliff Victoria Falls Rusape Urban Chiredzi Town Kariba Urban Chipinge Urban Gokwe Urban Shurugwi Urban Gwanda Urban Plumtree Lupane Urban
N/A 39 543 32 453 31 519
N/A 25 849 23 820
N/A N/A
16 863 13 363
N/A N/A
42 218 37 602 35 924 33 710 30 718 30 594 26 742 25 675 24 136 22 456 20 420 11 660 6 171
N/A -4.9 10.6 6.9 N/A 18.4 12.3
N/A N/A 33.2 52.8 N/A N/A
Total 3 502 908 3 874 377
Source: Zimstats
Note: As at 2002 the settlements which are indicated as N/A had not been accorded town status
and hence the populations were counted as part of the rural population in the respective
District Councils/Provinces.
2.2 THE PLANNING AREA IN REGIONAL AND NATIONAL CONTEXTS 2.2.1 INTRODUCTION
2.2.1.1 In examining, Bulawayo in its regional context, its place and role in the south western
region and its immediate environments where Bulawayo’s boundaries are focused. The south western regions under which Bulawayo falls is endowed with mineral resources with gold, coal, platinum being amongst the most dominant minerals. In addition, the southwestern region has good surface water resources as represented the river systems. With all these resources and with good infrastructure the region has the potential to grow. This is not surprising given the fact that the favourable conditions and resources available are bound to serve as pull factors for the attraction of population. With a population of 653 337 and representing 5% of the total national population, what this means is that nearly half of the country’s population reside in the south western region under which Bulawayo lies. The locational factor of Bulawayo within a region endowed with substantial amount of natural resources, good climatic conditions, good levels of infrastructure services and established markets has largely contributed to the growth and development of Bulawayo. The city can be classified as the regional capital of southern Zimbabwe.

Review and Preparation of Bulawayo Master Plan (2019 – 2034) Report of Study
------------------------------------------------------------------------------------------------------------------------------
28
2.3 NATIONAL CONTEXT 2.3.1 Bulawayo is strategically located and form the axis of the road and rail network links to
the rest of the country and the southern African region providing important railway linkages to South Africa, Botswana and Zambia. The city can be classified as junction settlement to Victoria Falls and Zambia to the West, Plumtree and Botswana to the South, East to Beitbridge and South Africa, North to Harare. As a result of the locational advantage in a national context, the city reaps the benefits of transit trade, tourism and other spin-off economic benefits. Map 4 show Bulawayo in its national setting.
2.3.2 Bulawayo is some distance in relation to some major and other centres in the country.
Bulawayo is some road distance of 438 km to Harare, the capital city of Zimbabwe, 438 km to the major tourist attraction of Victoria Falls, 320 km to Beitbridge and 100 km to Plumtree. Distances to some other centres from Bulawayo are as follows; 655 km to Kariba; 412 km to Binga and 282.5 km to Masvingo. The long distances to these centres has financial and social implications on the people who originate from Bulawayo.
2.3.3 In terms of population size in a national context, Bulawayo’s population of 653 337.
Which represents 5 % of the total national population of 13 061 239 (2012 population census). Compared to the 2002 census figures, there was a decrease in Bulawayo’s population unlike in some cities in the country. The population then was 676 650 With regards to spatial size in the national context, Bulawayo with a land coverage of 439 000 hectares (439km2 ) hectares represents just 0,1% of the country’s total land area of 390 757 km².
2.4 REGIONAL AND NATIONAL FUNCTIONS, LINKAGES AND IMPACTS 2.4.1 Bulawayo benefits from resources in the south western region in the form of water
supplies, energy for electricity, food products and other consumer goods, as a primary centre, catchment area and headquarters of Bulawayo Metropolitan Province. The province performs key administrative functions and provides services to surrounding areas within its area of jurisdiction and immediate regions in five districts namely Bulawayo Central, Imbizo, Khami, Mzilikazi and Reigate. The districts ensure delivery of administration and other services to settlements in the region while at the same time coordinating service delivery between Local Government and Central Government departments. In terms of the Urban Councils Act (Chapter 29:15) Bulawayo provides such services as primary health care, primary education, road maintenance, social and community development as well as environmental health in its area of jurisdiction.
2.4.2 In order to facilitate its role as an administration centre and primary centre, a number of
Central Government Departments are located in Bulawayo to provide services to residents within the Bulawayo and the hinterland. These include departments such as Agriculture, District Administration, Police, Veterinary Services, Agritex, Zimbabwe

Review and Preparation of Bulawayo Master Plan (2019 – 2034) Report of Study
------------------------------------------------------------------------------------------------------------------------------
29
Power Corporation, ZETDC, Tel One maintain offices in Bulawayo. The Resident Minister and Provincial Administrators office for Bulawayo are located in Bulawayo. The Resident Minister and Provincial Administrator are the head of government representative in the Bulawayo Metropolitan under which the Planning area falls.
2.4.3 Bulawayo also serves as the major regional centre servicing smaller towns such as
Victoria Falls, Hwange, Gweru, Zvishavane, Gwanda, Beitbridge and Plumtree in adjoining provinces namely; Matabeleland North, Midlands and Matabeleland South.
2.5 ECONOMIC LINKAGES 2.5.1 In terms of economic linkages and impacts within the region, nationally and to some
extent internationally, Bulawayo is well located and endowed with resources that are tapped by other centres within and outside its region. There are several industrial establishments and a power station in the planning area. Furthermore, the presence of such facilities has in turn played a significant role in boosting employment opportunities in the planning area historically although the city’s dominance as the major economic and industrial hub has diminished in recent years. In addition, Bulawayo has strong economic linkages with other areas outside its region. It receives most of its goods for commercial trade from within the city though others are received from Harare in view of a limited number of operational industrial and manufacturing concerns in Bulawayo. This situation is a matter of great concern because Bulawayo has always been the industrial hub of Zimbabwe and it has all the potential to regain its status as the major industrial hub if its comparative and competitive advantages are exploited to the fullest as the city has adequate electricity supply, good national road linkages, availability of water supply and the railway lines passing through and linking Bulawayo to other parts of the country and broader trans-boundary region. There are some designated industrial sites in the city but what is lacking is adequate servicing of these industrial stands for the attraction of major industrial and manufacturing concerns. These are issues that should be addressed in the plan.
2.5.2 Bulawayo to a very large extent depends on the hinterland surrounding farms in
Nyamandlovu for food products in the form of vegetables, maize meal and other cereals. However. It should be noted however, that some residents in the city especially those who own large plots also produce a lot of food products to supply the city. The situation should be seen as a pointer to the need for developing strategies for sustainable agricultural practices in the planning area. Some people who grew up in Bulawayo but work outside the city in places such as Harare, Mutare, Masvingo, Victoria falls etc as well as those who are in the diaspora still maintain strong economic and social relations with the city. As a result, they invest some of their disposable incomes back into the local economy in the construction industry and household support.

Review and Preparation of Bulawayo Master Plan (2019 – 2034) Report of Study
------------------------------------------------------------------------------------------------------------------------------
30
2.5.3 As a primary centre and a catchment area for the hinterland in the region, Bulawayo serves as a major commercial and shopping hub in the Planning Area. Regular monthly shopping trips are made to Bulawayo by the retail customer population from the hinterland for the purchase of basic goods ranging from groceries, clothes and household goods. This results in the injection of cash into the local economy of Bulawayo. However an issue which should be noted is that while Bulawayo has the benefits of being the secondary capital city, its strategically located and is also a primary centre with a higher level of infrastructure and service provision there are other competing urban centres within the region which are major catchment centres. These include Plumtree, Gwanda, Hwange, Victoria Falls, Beitbridge, Masvingo and Gweru. The challenge is therefore how to identify areas of Bulawayo’s comparative advantages and exploit them to the fullest so that it remain competitive and continues to attract developments and investments as well as create additional employment opportunities.
2.6 ADMINISTRATIVE AND SOCIAL LINKAGES 2.6.1 As the second largest urban area in Zimbabwe, there are several government ministries
found in the city. The headquarters of the National Railways of Zimbabwe, other government ministries, state house and some Non Governmental Organisations are located in Bulawayo.
2.6.2 Bulawayo falls within the 3rd tier of government (Local Government) responsible for
running the city. It is constituted of elected councillors headed by the Mayor. However, the chief administrative officer of the Local Authority is the City Clerk. The Ministry of Local Government, Public Works and National Housing (MLGPW & NH) is the supervisory ministry in charge of the city and other Local Governments in the country.
2.6.3 Bulawayo is an educational and cultural hub of the country and it used to be an
industrial city. It is a final destination for most migrants from the south western part of the country and who still maintain contacts with their roots.
2.7 TRANSPORT AND COMMUNICATION LINKAGES 2.7.1 Bulawayo is a focal point and terminus for the various types of transportation systems in
Zimbabwe. These include, air, road and rail transportation systems. Map 5 shows the air, road and rail transportation network between Bulawayo and major settlements in the country and the SADC region.
2.8 ROAD LINKAGES 2.8.1 The good road linkages to all the major centres in the region and other parts of the
country have been stated earlier on in the document. To emphasize the point, these linkages are represented by the main Southeast – Northwest road linking Bulawayo to

Review and Preparation of Bulawayo Master Plan (2019 – 2034) Report of Study
------------------------------------------------------------------------------------------------------------------------------
31
Beitbridge and Victoria Falls as well as South Africa, Namibia and Zambia. To the west it is linked with a good tarred road and has a direct link to Botswana through Plumtree. To the Northeast it has a directly link with other urban centres such as Gweru, Kwekwe, Chegutu as well as the capital city of Harare. To the east the city has a direct link with Zvishavane, Masvingo and Mutare through to Mozambique. The good road network and linkages have improved intercity connectivity resulting in good public transportation between Bulawayo and other settlements in the country including transboundary linkages.
2.8.2 This means that Bulawayo is in a good position to easily receive goods and services from
other parts of the country and beyond. The city has a high potential for investment and tourism development as a result of easy movement of people into its area of influence. However, there still remains a challenge with regards to some of the poor road links between Bulawayo and some of settlements in the region as a result of poor road conditions due to wear and tear and lack of maintenance e.g. Nkayi road.
2.9 RAILWAY LINKAGES 2.9.1 Viewed as part of the proposed Cape to Cairo railway line, there has always been strong
linkages between the National Railways of Zimbabwe (NRZ) and Botswana and South Africa. Today NRZ forms a crucial link in the railway systems of the Southern African region. Equally to the advantage of Bulawayo is that the headquarters of the National railways of Zimbabwe (NRZ) and Bulawayo - Beitbridge Railway (BBR) line are located in the city. The good rail links with all the urban centres in the country as well as neighbouring countries such as South Africa, Botswana and Zambia give the city an added advantage in terms of rail transport. The NRZ provides an unbroken railway line to Zambia, the Democratic Republic of Congo, Angola, Mozambique, Tanzania and Malawi The rail line currently handles bulk freight particularly petroleum and other products from these neighbouring countries. The railway line is also well linked to several industrial areas in the city.
2.10 AIR LINKAGES 2.10.1 Air transport has become important in the facilitation of socio-economic development
especially with increased globalization over the last decade and which has boosted the local tourism industry. Joshua Mqabuko Nkomo International airport located about 21km from the city centre handles regional flights and direct passenger services are available to South Africa. This route is plied by Air Zimbabwe and South African Airways through Air link. On the domestic scene Fast Jet and Air Zimbabwe are in operation.

Review and Preparation of Bulawayo Master Plan (2019 – 2034) Report of Study
------------------------------------------------------------------------------------------------------------------------------
32
2.11 TELECOMMUNICATION AND POSTAL LINKAGES 2.11.1 With regards to telecommunication, the Planning Area is well linked to all areas in the
city, region, nationally and internationally by a good national telecommunication network system operated by Tel One, a government parastatal. Automatic telephone exchanges have been installed and direct dialing services to all parts of the country and abroad are available. Public sector institutions, businesses and commercial enterprises as well as the residential areas have good quality telecommunication services. In addition, due to technological development internet connectivity has greatly improved in the city which has resulted in the availability of full complement of electronic information technology in the city. To date most public institutions, large medium, small scale as well as a growing number of residences are connected to the system. Mobile telephone networks provided by Buddie, Easy Call and Telecel have improved communication as these have become affordable to a majority of the residents in the city and country. The improved telecommunication network situation is a good development for Bulawayo in so far as meeting the needs of investors wishing to invest in the city. This is more so given the fact that an effective and reliable means of communication is very important for business.
2.11.2 Bulawayo enjoys linkages with the international fibre optic cable network. This is a fiber
optic cable which connects one country to the rest of the globe for voice and data transmission. It transmits most of the world’s telecommunications and internet traffic. These cables carry telecommunication signals across the ocean; carrying telephone, internet, and private data traffic. Tapping into this network will radically change communications in the plan area.
2.12 THE MEDIA 2.12.1 Local Radio as well as local television and foreign broadcasting networks play an
important role in keeping Bulawayo residents well informed and entertained. The majority of households in the city own or have access to a television or radio set. There are 8 radio stations in the country namely, Khulumani FM, Skies FM, S FM, Star FM, Zimbabwe FM, National FM, Power FM and Radio Two. However, only three radio stations namely Zimbabwe FM (ZIM FM), Khulumanai FM and Skyz FM are located operating from thecity. ZIM FM is owned by government and broadcasts throughout the country while Skyz FM and Khulumani FM are privately owned and are limited to Bulawayo and the surrounding area approximately within a 40km radius. On the other hand there is only one public owned television station – ZTV.
2.12.2 The print medium is dominated by the private sector. Government publishes The
Chronicle, Sunday News, as well as the Herald and Sunday Mail. However, the Chronicle and Sunday News are the newspapers which are mostly in circulation in the South Western Region and Bulawayo in particular. However, other well-established privately

Review and Preparation of Bulawayo Master Plan (2019 – 2034) Report of Study
------------------------------------------------------------------------------------------------------------------------------
33
owned newspapers such as the Daily News, News Day, Financial Gazette and the Zimbabwean Independent are also in circulation in Bulawayo. These are all commercial newspapers which compete with South African newspapers especially the Sunday Times which is readily available. The country has not yet implemented digital migration which is a process of moving from analogue to digital broadcasting with clearer sound and superior picture.

Review and Preparation of Bulawayo Master Plan (2019 – 2034) Report of Study
------------------------------------------------------------------------------------------------------------------------------
34
CHAPTER THREE THE PHYSICAL ENVIRONMENT AND NATURAL RESOURCES
3.1 INTRODUCTION
3.1 The aim of this chapter is to analyse the physical environment in terms of the natural context i.e. physiology and land forms; geology; surface hydrology; soils; climate; vegetation; wildlife and scenic features. In addition the man-made environment i.e. settlement pattern and spatial layouts are also analysed.
3.2 NATURAL ENVIRONMENT
3.2.1 The Physical environment is generally described in terms of features that are a result of the natural processes influenced mainly by climate and time. The description of the physical environment in this chapter is limited to the planning area. A 10km boundary from the existing boundary with Bulawayo at the centre was dermacated as study area. It is this area which is described under the headings below.
3.2.2 Within the study area, there is the built up area of Bulawayo which is the main centre and is characterised by buildings for residential, commercial, industrial, recreational and other civic purposes. The main land uses abutting Bulawayo are residential, agricultural namely farms, small scale agricultural plots as well as cattle ranching. The various agricultural activities in the urban periphery are being undertaken on a subsistence a well as commercial level and the produce is being sold in Bulawayo.
3.3 GEOLOGY AND SOILS
3.3.1 Geology and soils are important in development as they are indicators of possible directions of expansion. The rocks in the Bulawayo area are of the Bulawayan Group sequence of the Archaean age (Garson, 1995). Topographically the area is of the Post-African erosion surface of Miocene age. In broad terms, the geology of Bulawayo is divided into two main formations underlain by a rather complex crystalline geology, mostly based on a granite and greenstone belt. Towards the east and south there are potential gold deposits and some mining claims already exist. Towards the west the granite rock is dominant and is close to the surface which may result in additional costs during development. Map 5 shows the general soil characteristics in the plan area.
3.3.2 Soils in Bulawayo fall into two broad categories, the regosal and siallitic group. These type of soils are found in low rainfall areas and they have a high base status and clay content. The soils have low water holding capacity and tend to limit root depth. Throughout the plan area there are some pockets of clay deposits which may cause construction challenges due to expansion and contraction. There is need for some soil tests to be undertaken in the new development areas.

Review and Preparation of Bulawayo Master Plan (2019 – 2034) Report of Study
------------------------------------------------------------------------------------------------------------------------------
35
3.4 TOPOGRAPHY AND HYDROLOGY
3.4.1 Bulawayo lies on a plain in the south – west of Zimbabwe on the western extreme of the central watershed of the country which divides the Shashe-Limpopo drainage system from the Zambezi drainage system. The city slopes gently down to the north and north west whereas to the south the terrain is more undulating merging into Matobo Hills. The study area is generally flat and featureless but becomes more rugged to the south and south – east of the study area, where there are a number of granite kopjes. To the north east there are a series of low flat-topped hills. Bulawayo is underlain by the Balawayan formation that comprises the Upper Greenstone Belt and the surrounding granitic terrain, both of Achaean age, which is cut by Protezoic plugs and dykes of grabbo and dolerites (Garson & Mutsvangwa, 1995; Rusinga & Taigbenu, 2004). Its topography is closely controlled by the geology and to some extent by the horizontal tectonic processes. The topography is characterised by abrupt slopes resulting in napes of metabasalt rocks being transported over older greenstone. Minor, but fairly persistent, thin-branded iron-formation horizons in parts of northern Ilanda and eastern Greenhill are interflow exhalites formed during interruptions in volcanic activity. The hilly areas have excellent exposures of both volcanic types, and also of associated sills and minor intrusions of very resistant metadolerite and metagrabbo (Garson & Mutsvangwa, 1995). Map 6 shows the drainage within the planning area.
3.4.2 At an altitude of 1 350m above sea level and mostly cooled by a south – eastern airflow, Bulawayo enjoys a subtropical climate. The study area is crossed by a number of rivers and watercourses which are seasonal. The water courses are important sources for open space and vegetation and in some cases for horticulture. However, the water courses can also become a hazard during the rainy season especially when storms create severe and dangerous water courses running through residential areas.
3.4.3 There also exists some boreholes throughout the city. In the high density areas, the boreholes are a source of water for the residents while in the low density areas, boreholes have been sunk by individuals for use in the gardens or for agricultural purposes. This points to the importance of groundwater resources in the plan area.
3.5 CLIMATE
3.5.1 The city is characterised by variations in both rainfall and temperature with a semi – arid climatic condition. The city's average annual rainfall is 594 mm though it varies considerably from year to year. Bulawayo experiences three broad seasons, a dry cool winter season from May to August, a hot dry period in early summer from late August to early November and warm wet period from early November to April. However, throughout the year, there are occasional days of cool cloudy weather with drizzle at times. The rainfall is not very reliable which makes the planning area vulnerable to droughts as rainfall tends to vary sharply from one year to another. Much of the rainfall is due to showers and thunderstorms activity, hail is infrequent.

Review and Preparation of Bulawayo Master Plan (2019 – 2034) Report of Study
------------------------------------------------------------------------------------------------------------------------------
36
3.6 TEMPERATURE
3.6.1 Temperatures are generally warm in summer with periods of hot weather of 30 Degrees Celsius or even more when the skies are clear. The mean annual temperature is 19.16 °C. Like much of southern and eastern Zimbabwe, Bulawayo is cooled by a prevailing south easterly airflow. The hottest month is October, which is usually the peak of the dry season but the temperatures fall as the rainy season becomes established. The average maximum temperature ranges from 21 °C in July to 30 °C in October. During the rainy season, daytime maxima are around 26 °C, nights are always cool, ranging from 8 °C in July to 16 °C in January. During the winter months the weather is mild by day and a short period cold night with occasional frosts. Apart from such days a generous measure of sunshine is available each day.
3.7 SOLAR RADIATION
3.7.1 There is a fair amount of sunshine throughout the year (7 – 9 hours daily) with the highest sunshine occurring during the months of May to October. On the other hand, the least amount of sunshine occurs during the months of November to March. Bulawayo is ideal for the promotion of green energy sources.
3.8 RELATIVE HUMIDITY
3.8.1 Relative humidity is moderate in most months and there are few days that are very warm and humid. It is highest during the early hours of the morning and lowest in the afternoon. Low relative humidity of under 10% is often experienced on hot afternoons.
3.9 WIND
3.9.1 The prevailing wind direction in the city is from the south east as the wind rose recorded in Bulawayo. Throughout the year, the winds from the South East quadrant are predominant and the speeds are usually moderate at about 10 knots, while there are some days when a speed of 20 - 25 notes is reached. Despite the calm conditions the winds can become dusty towards the end of winter. Strong winds can also be experienced during rainy seasons, particularly at the beginning and at the end of the rainy seasons. These winds are associated with thunderstorms resulting in damage to property and causing wind erosion. Wind direction is important in built-environment design processes such as siting of polluting industries.
3.10 VEGETATION
3.10.1 The ecological zone within which Bulawayo falls is covered by a generation of secondary vegetation that is closely related to the underlying rock type and environmental changes that occurred. The planning area falls within an ecological zone which is characterised

Review and Preparation of Bulawayo Master Plan (2019 – 2034) Report of Study
------------------------------------------------------------------------------------------------------------------------------
37
by vegetation which is mainly shrub and tree savanna with favourable grazing resources. There is some variation in vegetation type based on the main soil types. On the granitic sandy soils to the west of the study area, Mopane woodland is the main vegetation type whilst acacia woodland dominates the brown and red clays to the east. Tree species that produce fruits and those with medicinal properties like Z. mucronata, S. birea and A. garckeana are also found in the some parts of the city. The river valleys and water courses naturally maintain thicker vegetation covers due to the availability of water most of the time.
3.11 NATURAL RESOURCES BASE AND INVENTORY
3.11.1 This section focuses on undertaking an inventory, analyzing and examining the natural resource base of the Planning Area with a view to determining the utilization and conservation practices; impacts of current utilization practices; what regulatory and management instruments and programmes are in place for the sustainable utilization of these resources. Bulawayo Planning Area is evidently endowed with natural resources and these include groundwater resources, mineral resources, forest resources and wildlife resources. The identified natural resources in the Planning Area are presented and analysed as outlined hereunder.
3.12 GROUNDWATER RESOURCES
3.12.1 The major part of the city is underlain by the Matsheumhlope aquifer and the rest underlain by a low yielding granitic aquifer. These two aquifer systems form the Bulawayo urban aquifer system (Hlatywayo et al., 2013). Matsheumhlope Wellfield is the main underground water resource aquifer serving the City. It is in the greenstone formation which has two variations, namely the ‘Avalon’ formation and the ‘Umganin’ formation. The Matshemhlophe wellfield is a marginally good acquifer but it cannot support large drawdowns which could make it vulnerable to contamination from urban sewer and the landfill. Rusinga and Taigbenu (2004) reported that the Matsheumhlope wellfield is demarcated into three aquifers according to the abstraction rate per day (namely: the high yielding aquifer (yield of more than 120 m per day), medium yielding aquifer (20-120 m per day) and the low yielding aquifer (less than 20 m per day). The granite formation is low water yielding while the greenstone is classified as possessing a reasonable groundwater development potential (Martinelli and Hubert, 1985).
3.12.2 Average hydraulic conductivity is moderate (0.55 m/d) and sustainable yields are in the
range of 100 to 250 m3 /d (Rusinga, 2002). The aquifer under consideration is mainly unconfined and relatively shallow with an average saturated thickness of 40 m. Depth to the water table varies spatially throughout the aquifer. The general direction of flow is north-easterly with average hydraulic gradient of 1:250 and average flow velocity of 0.4 m/d. Borehole failure within the area is attributed to the occurrence of shallow depth of the bedrock underlying some parts of the acquifer. The pattern of groundwater flow

Review and Preparation of Bulawayo Master Plan (2019 – 2034) Report of Study
------------------------------------------------------------------------------------------------------------------------------
38
generally follows the surface topography with seasonal variations in water levels characterised by rising water levels during the wet months from November to March and declining water levels during the dry months.
3.12.3 Groundwater quality is good but there is a potential risk to underground pollution due
to the sceptic tanks, industrial effluent and the landfill. An acquifer vulnerability map can be used for planning purposes to protect the groundwater resource.
3.13 MINERAL RESOURCES 3.13.1 The main resource in the Planning Area is Gold and is being mined by Old Nick. The
Planning Area is endowed with this resource such that the mineral constitutes more than 80 % of the rock volume in the area.
3.13.2 There are several mining claims and special grants within the Municipal boundary and
the study area. Some of the claims are in Cement Siding, Umganini, Norwood, Umvutcha, Richmond, Upper Rangemore, Aisbley Farm, Umvutcha, Windermere, Three Fountains and Heany Junction. There are some mining activities within the Municipal boundary being undertaken illegally by small scale miners (artisanal miners). Mining claims within the Municipal boundary cannot be mined without the consent of key stakeholders such as the Local Authority.
3.13.3 There are deposits of sand and gravel in the bed of the major rivers as well as alluvial
mud and silt are used for brick making. Notable in this regard is Macdonald Brick Manufacturing which is the largest brick manufacturing company in the region.
3.13.4 From the foregoing it is evident that the Study Area is endowed with mineral resources
which have the potential of transforming the local economy of Bulawayo in all aspects.
3.14 MINERAL EXPLOITATION
3.14.1 Gold is the main mineral being exploited and mined in the planning area. The main methods being used are open cast methods. The major challenge with the open cast method are the mine dumps which remain exposed to the surface leaving the area not available for any other uses.
3.14.2 There are mining claims on the outskirts of the built environment and the city receives applications for prospecting permits within the city limits including farms which are owned by the municipality. Some mining claims are located within dam servitudes such as those of Ncema and Inyankuni dam. There are implications of mining activities on the city’s river system.
3.14.3 Construction aggregates in the form of gravel stones, river and pit sand are being mined from within the city at Davies Granite, from the river banks and in the bush. These

Review and Preparation of Bulawayo Master Plan (2019 – 2034) Report of Study
------------------------------------------------------------------------------------------------------------------------------
39
practices especially river and pit sand have serious environmental implications in terms destroying the river line and general landscape as well as erosion. There are also a number of unrehabilitated burrow pits which not only deface the landscape but also become a major constraint to physical developments. Uncontrolled extraction of sand has had adverse environmental impacts as manifested through land degradation, loss of vegetation and soil erosion.
3.15 AREAS OF SCENIC BEAUTY, CULTURAL AND HISTORICAL SIGNIFICANCE
3.15.1 The Planning Area and areas around it are endowed with a number of interesting areas/sites of scenic beauty, cultural and historical/archaelogical significance. Most of the sites have opportunities for tourism and recreational development as well as the preservation of the cultural heritage of the city. However, some of the sites of scenic beauty, historical or cultural importance are not being maintained and preserved, hence they have become derelict and in bad condition.
3.15.2 Some of the important sites and areas in and around Bulawayo have been identified, discussed and presented as follows:
3.16 INXWALA FESTIVAL SITE
3.16.1 The Inxwala Festival site is located between Masotsha Avenue and Selous Street in North End and over the years the local authority has been hiring it out to the Lunar Park. Historically, the site was set aside by the council after the realisation of its importance in terms of cultural heritage. Inxwala is a sacrificial ceremony of giving the first fruits in a harvest to the ancestors, who are believed to be responsible for the abundance of food. Traditionally, it marked a time of prosperity in the good harvests experienced after the seasonal agricultural period. The activity also brought the nation together, unifying people at a time of merry-making and quashing fears of famine. However, at the time of the study some individuals had turned the Inxwala festival site into churches as they conducted illegal open air services.
3.17 BULAWAYO AND THE INDABA TREE
3.17.1 When King Lobengula succeeded Mzilikazi, after a succession struggle and established
his first royal kraal and associated settlement just south of present day Bulawayo near Hope Fountain. It is then that the name Bulawayo was given to the settlement and became an important component of Zimbabwean history. After 10 years at what has now come to be called ‘’Old Bulawayo ‘’, Lobengula moved the capital in 1881 to the site which is partly occupied by the State House in Bulawayo. King Lobengula continued to direct the affairs of the Ndebele State from Bulawayo. The site for the indaba tree is an important historical site which used to be in the goat kraal under which the king held his court and received state visitors.

Review and Preparation of Bulawayo Master Plan (2019 – 2034) Report of Study
------------------------------------------------------------------------------------------------------------------------------
40
3.18 BUILDINGS OF ARCHITECTURAL & HISTORIC INTEREST
3.18.1 Bulawayo has a number of buildings which are of Architectural or Historic interest. Below is a list of the buildings in the city.
• St. Mary’s Cathedral Basilica (Cnr 9thAvenue and Lobengula Street)
• Wesleyan Methodist Church (Cnr J. M. Nkomo and 11thAvenue)
• Anglican Church (6thAvenue and George Silundika street)
• Jewish Synagogue (Cnr Jason Moyo Street and 3rdAvenue)
• St Georges Building (J.M Nkomo and 10th Avenue)
• Grand Hotel / The Grand Hotel Extension (J.M Nkomo and 9th Avenue)
• Drill Hall (Cnr Basch Street and 10th Avenue)
• Fairway Hotel (102 George Silundika Avenue)
• Preece and Mackenzie Bookshop (80A Jason Moyo street)
• A. Radowsky Building (Jason Moyo Street)
• Exchange Building (Cnr J.M Nkomo & L. Takawira Avenue)
• Post Office Building/Exchange Bar (J.M Nkomo Street)
• Post Office Gardens (J.M Nkomo street)
• Douslin House/Willoughby’s Building (Cnr Leopold Takawira Avenue and J.M
Nkomo Street)
• Goldfields Building (J.M Nkomo Street between L. Takawira & 6thAvenue )
• Barclays Bank (Cnr J.M Nkomo and 8th Avenue)
• Taramel House (Imperial Building) J.M. Nkomo Street between L. Takawira & 6th
Avenue
• Rhodes Building (Along 9th Avenue)
• Beverly Court (101 Herbert Chitepo Street)
• Railway Offices (Top end of Railway Avenue)
• Old Memorial Hospital (Cnr Herbert Chitepo Street and 10th Avenue)
3.19 FOREST RESOURCES 3.19.1 Forest resources in the Planning Area consist of woody tree species, medicinal and some
veld products. The Forestry Act CAP 19:05 and EMA Act CAP 20:27 are the principal Acts in the regulation and management of forest resources. The dominant tree species in the city constitutes of the following though exotic trees are the dominant tree species:
i) Colophospermum mopane ii) Acacia, iii) Ziziphus mucronata iv) Schlerecyrea birea

Review and Preparation of Bulawayo Master Plan (2019 – 2034) Report of Study
------------------------------------------------------------------------------------------------------------------------------
41
v) Pine vi) Jacaranda vii) Eucalyptus viii) Azanza garkeana ix) Z. mucronata x) S. birea and xi) A. garckeana x) Jacket Plum, Indaba tree; Ndebele: Isagogwane 3.20 WILDLIFE
3.20.1 The urban fauna in the city is related to the vegetation, open spaces and areas with virgin landscape. In most urban areas there is very little wildlife except smaller mammals, reptiles and birds. In the low density suburbs (residential/agricultural areas) in the southern and eastern areas there is a greater variety of smaller mammals and reptiles and occasional small antelope and an increased number of birds. In the peri-urban areas there is a large number of all forms of wildlife within the farms. This is also complemented by game parks and game sanctuaries which are being run by the Department of National parks and Wildlife management and the City of Bulawayo such as Tshabalala, Mguza and Mazwi where wildlife species can be found. In addition, other areas such as Chipangali Wildlife Orphanage is located within the Study area. The parks, sanctuaries and Chipangali are mainly for educational and conservation purposes as they host a number of wildlife species. However, due to urban expansion, the number of wildlife in these game parks and sanctuaries has reduced due to poaching and migration away from the urban periphery.
3.21 NATURAL RESOURCE UTILISATION AND CONSERVATION PRACTICES
3.21.1 The existing natural resources in the Planning Area are being out to use for different purposes including the provision of income for households. In this regard, the major consideration is whether these resources are being used in a sustainable manner for the benefit of future generations. For example, with regards to forest resources which comprise of woody tree species, their utilization is mainly for fuel wood for cooking by a majority of the households. The demand for fuel wood has even become higher due to an increasing number of households who cannot afford electricity costs and have resorted to wood for cooking. Some households cut trees for sale as sources of income. Such practices lead to unsustainable utilization of this resource. Another problem which is related to the conservation of forest resources are high incidences of bush fires in the Planning Area.
3.21.2 Human activities and practices also put groundwater and surface water resources at the risk of pollution. The extensive use of pit latrines in some parts of the city, discharge of industrial effluent, discharge of treated effluent into the river systems and the land fill

Review and Preparation of Bulawayo Master Plan (2019 – 2034) Report of Study
------------------------------------------------------------------------------------------------------------------------------
42
are some of the potential sources of pollution. In addition to the above other sources of potential pollution include agricultural practices, fuel spillages and the power station.
3.22 REGULATORY AND MANAGEMENT PROGRAMMES FOR THE SUSTAINABLE UTILISATION OF NATURAL RESOURCES INCLUDING MINERAL EXPLOITATION
3.22.1 There are a number of statutory instruments in place used to regulate the utilization of natural resources to ensure sustainability. The conservation and sustainable utilization of mineral resources in the planning area and whole country is guided by the Mines and Mineral Act 21:05 which is being administered by the Ministry of Mines, Minerals and Energy Resources. The Department is responsible for regulating the extraction of mineral resources. The provisions of the Act is important for the operations of all mines in the sense that it empowers the Department of Mines to monitor all the mining activities to ensure sustainable extraction. Furthermore, the mines are obliged to put in place management programmes to preserve land as much as possible for the conservation of the natural environment.
With regards to forest resources, the regulatory instruments for the sustainable utilization include the Forestry Act. The Forestry Commission is responsible for the management and protection of forestry resources. Through its various regulations, it prohibits the exploitation of forestry resources without permits. The Commission organizes forestry and conservation clubs in schools as well as undertaking tree planning campaigns.
3.23 IMPACTS OF NATURAL RESOURCE ENDOWMENT AND UTILISATION IN THE PLANNING
AREA
3.23.1 The natural resources which Bulawayo and the surrounding environments are endowed with have some social, economic and environmental impacts. Some of the impacts are positive while others are negative as highlighted below:
i) Mineral Resources – The presence and exploitation of gold deposits in the planning area has presented opportunities for economic growth and diversification as well as the creation of employment opportunities for Bulawayo residents. Some businesses have been established in Bulawayo to supply the mining industry with material, spare parts and chemicals. However, there are some negative aspects relating to the environmental impacts as a result of mining activities.
ii) The exploitation of trees and other woody species is gradually leading to the depletion of forest resources particularly to areas in close proximity to the settlement. This is mainly attributed to the rampant felling of trees since the majority of the households use this resource for cooking while others make a living out of selling fire wood. The environmental implications of such practices

Review and Preparation of Bulawayo Master Plan (2019 – 2034) Report of Study
------------------------------------------------------------------------------------------------------------------------------
43
relate to a loss of amenity, habitat for small animal species and the implications of such practices on the atmospheric conditions.
3.24 PHYSICAL CONSTRAINTS AND IMPACTS OF DEVELOPMENT ON THE PHYSICAL ENVIRONMENT
3.24.1 Some of the Physical constraints to development identified in the Planning Area include;
i) The flood plain areas along the banks of rivers though they are a constraint to physical developments, they have ecological and environmental value;
ii) Existing burrow pits limit the use of some areas for physical developments, save if they are properly rehabilitates;
iii) Former dumpsites limit the use of some physical developments;
iv) The railway line running through the city means that the railway reserve is precluded from developments.
3.24.2 With regards to developments on the physical environment, it is important to note that developments come with a price of the physical and indeed the natural environment. These are in the form of impacts resulting from developments such as infrastructure service provision, commercial and physical infrastructural developments. Within the Planning Area these have been realized in the form of: i) The increased use of concrete for surfacing of large area for example in shopping
complex (car parks) has resulted in increased runoff which if not properly channeled may lead to problems of erosion. Such developments also lead to land surface impermeability and often ponding in the car parks.
ii) Air and noise pollution from the activities of industrial developments such as Delta brewery, the power station, Macdonald bricks, PPC and other industrial establishments in the city. These have long term implications with regards to the health of the population.
iii) Degradation of the physical environment as a result of extraction of gravel and pit sand for road construction which are never rehabilitated. In addition, indiscriminate dumping of construction rubble defaces the landscape, making such areas not available for development.
3.25 ENVIRONMENTAL, ECOLOGICAL AND CONSTRAINTS ZONING OF THE PLANNING AREA
3.25.1 An analysis and assessment of the physical environment of the planning area is
important to overlay the physical, ecological and constraints which have been established in an effort to come up with an environmental zoning analysis of the Planning Area. The primary purpose of the exercise is to establish from the onset site

Review and Preparation of Bulawayo Master Plan (2019 – 2034) Report of Study
------------------------------------------------------------------------------------------------------------------------------
44
suitability analysis for future development and areas more likely suitable for settlement expansion bearing in mind limitations of environmental zones.
3.25.2 The following factors have been taken into account in establishing the environmental zones;
i) Site Slope
ii) Ground water Vulnerability iii) Land Suitability for agriculture (as defined by the MOA) iv) Groundwater protection zones (as defined by BCC & ZINWA) v) Flood Plains vi) Physical constraints to developments (line infrastructure servitudes, railway corridor and mobility corridors, airport etc)
3.25.3 Should there be need to extend the Municipal boundary at the development proposals stage, this type of environmental zoning and constraints analysis shall be extended to such areas.

Review and Preparation of Bulawayo Master Plan (2019 – 2034) Report of Study
------------------------------------------------------------------------------------------------------------------------------
45
CHAPTER 4 LAND, LAND USE AND RESERVATIONS
4.0 LAND AS A RESOURCE 4.1 INTRODUCTION 4.1 Land is a national resource that is a gift from God and constitutes the wealth of many
nations. It is endowed with many natural resources such as minerals, flora/natural vegetation and fauna / wildlife. Land has economic and social values. As a commodity land is considered as one of the three factors of production.
4.1.1 In Bulawayo land is endowed with many types of minerals however of note is the
presence of the precious mineral gold as shown by the operational Old Nick Mine which used to be one of the largest mines in the country many years ago, the defunct Mamba Mine next to Masiyephambili Junior School, numerous old gold diggings around the city as well as current small scale mining activities within the city’s boundary.
4.1.2 Land as natural resource in Bulawayo which covers some 643 square kilometres
including the northern areas that were incorporated through Statutory Instrument 212 of 1999 and most of it lies within a radius of 10 to 20 kilometres. Since expansion of the city is heavily dependent on the surrounding hinterland, it is considered prudent to examine the city’s hinterland in terms of its land uses, potential for agriculture and suitability for urban development.
4.2 LAND OWNERSHIP
4.2.1 Land ownership is an important aspect in terms of the city’s development as well as
financial considerations as private land could be charged rates to provide the much needed revenue for the local authority. Although most of the land in the Master Plan Area is privately owned, the city council owns a considerable amount of land (developed or undeveloped) especially in the western areas of the CBD and most of this land has been developed for high density/low cost residential purposes. In the south eastern areas of the city for example 97% of properties are privately owned (Local Plan NO 14-South Eastern Areas) whilst few properties are owned by the government and public institutions such as schools and post offices have been developed on such sites. Government also owns a number of residential properties housing civil servants. Council on the other hand owns public open spaces, public recreational areas leased to clubs (e.g. Bulawayo Country Golf Club), road ways and road reservations that have been transferred to it.

Review and Preparation of Bulawayo Master Plan (2019 – 2034) Report of Study
------------------------------------------------------------------------------------------------------------------------------
46
4.2.2 Most of the land owned by council in the western areas has now been taken up by low cost housing development as the city continues to sprawl outwards in many directions. As a result of exhaustion of developable land within the city’s boundaries particularly for housing and industrial purposes, there is urgent need for acquisition of more land in the immediate hinterland of the city. According to council records Bulawayo City Council properties are scattered all over the city and cover some 5 499.3355 hectares of land. This land includes water and sewerage pump stations, water reservoirs, community halls, stadia, primary schools amongst others. Table 3 below shows municipal properties and their sizes.
Table 3: Municipal Properties, Land Areas and values
DESCRIPTION Land size (ha) Land value
Water and Sewerage Pumps 3 171.1521 $805 895.87
Communal Halls 12.5019 $180 531.00
Clinics and Hospitals 21.0214 $388 800.00
Swimming Pools 4.6250 $69 800.00
Primary Schools 172.7574 $777 600.00
Community Administration Offices 13.5707 $158 920.00
Pre Schools 5.2105 $182 900.00
Parks and Camp Sites 2036.8640 $483 528.00
Stadiums 26.8331 $91 000.00
Fire Stations 4.7970 $80 200.00
Residential Flats 2.9037 $179 900.00
Depots and Stores 2.6639 $42 000.00
Arts and Crafts 1.3581 $42 000.00
Youth Centre and Recreational Facilities
8.1089 $297 600.00
Bus Terminus 2.1050 $155 900.00
Public Conveniences 0.7000 $15 000.00
Industrial 8.9775 $176 968.00
Other Properties 3.1853 $245 700.00
Total 5 499.3355 $4 374 242.87
Source: City Valuation Branch-BCC

Review and Preparation of Bulawayo Master Plan (2019 – 2034) Report of Study
------------------------------------------------------------------------------------------------------------------------------
47
4.2.3 Government properties are found in various suburbs around the city and these cover some 3 500 hectares. There are 46 state owned properties in the city and these include residential properties and stands, hospitals, schools, police stations, post offices, tertiary educational institutions, magistrate courts, the High Court and government offices among others. Some government properties which are not on records are those that have recently been transferred to government through endowment for example those emanating from subdivision processes. Development of government land by the Local Authority does not pause any serious problems/delays since exchange of land with central government is relatively easy. A list of government properties is provided in the appendices.
4.3 LAND TENURE
4.3.1 Land tenure is the way or system land is held or owned by individuals, groups of people, associations and companies. It forms the basis of development policy performing both an indirect facilitating role and a direct and active role. Land tenure interacts strongly with other elements of the urban economy being closely linked to the mortgage market which takes a substantial proportion of borrowed funds in most countries. It is a major determinant of the tax base, significantly affects the quality of and returns on investments undertaken in land structures (World Bank). Land tenure is more than a relationship between people and land as it embraces cultural, social and political concerns.
4.3.2 Before the colonial period the whole of Zimbabwe was made up of communal/tribal
land. However, when the country was colonized two other land tenure categories were introduced state land and freehold land. Zimbabwe has three land tenure systems, namely tribal (communal), state and freehold land. The main distinctions in these land tenure systems are in their title holdings and authorities responsible for their administration. Communal land is owned by tribal authorities in trust for communities since it is communally owned and they perform land administration functions which include the granting of usage rights. On the other hand, state land is held and administered on behalf of the Government by the State Lands Office, while its allocation is on a Fixed Period State Grant (FPSG) basis. Freehold land is freely and wholly owned by individuals and held in perpetuity.
Types of Land Tenure
4.3.2 In the city there are two (2) main types of land tenure namely freehold and leasehold. (i) Freehold tenure: is absolute ownership of land where no land right holder is
superior to the other. A freehold is of indefinite duration and is inheritable. A
freeholder has title deeds and is bound by laws of the country/land and nothing
else.

Review and Preparation of Bulawayo Master Plan (2019 – 2034) Report of Study
------------------------------------------------------------------------------------------------------------------------------
48
(ii) Leasehold is a contract granting exclusive rights to possession of land or
buildings for a fixed or determinable period shorter in duration than the interest
of the person making the grant. All leases are necessarily derived directly or
indirect from leasehold. To obtain freehold title several processes have to be
followed. In Zimbabwe’s urban areas those who are offered land by councils,
first obtain and sign an agreement of sale with the local authority. Development
conditions are stipulated in the agreement including the period within which the
beneficiary is expected to complete the construction. Title to the property may
be obtained after development has reached a certain stage, in terms of the local
authority’s laid down rules.
4.3.3 Lease agreements are also entered into by individuals and institutions with council for utilisation of pieces of land for a certain period. Sometimes leases with option to purchase are offered to the applicant.
4.3.4 In Bulawayo most properties are held under freehold tenure although in the high
density areas a substantial number of beneficiaries from council land sales still hold agreements of sale awaiting freehold tenure after fulfilling development conditions.
4.4 LAND USES
4.4.1 Map 8 depicts existing land uses dispositions within the Municipal boundary and the
hinterland. An analysis/assessment of the existing land uses from a spatial point of view and in terms of land use practices is made with a view to identify land use conflicts and issues as well as taking into consideration spatial development potential and opportunities. Outcomes of such assessments/analysis will help in addressing the identified land use issues and conflicts as well as taking advantage of the spatial development potentials and opportunities when it comes to drawing up of development proposals.
Residential
4.4.2 This zone is the most predominant land use and consists of both developed and vacant properties. Residential areas cover approximately more than 70% of the total land areas which includes all density categories. The 2000-2015 Bulawayo Master Plan projected that there would be an additional 13 560 hectares of land required for housing during the 15-20 year plan period. Bulawayo City Council received 71 096 building plans over these years which is 35% of the projected demand of 200 000 houses (assuming residential was 70 000 plans and the remainder to other uses) therefore it can be assumed that some 35% of land required for housing development was taken up, that is 4 070 hectares. Therefore from the Master Plan’s projection roughly 9 490 hectares are still needed to meet the Master Plan’s projected land requirements.

Review and Preparation of Bulawayo Master Plan (2019 – 2034) Report of Study
------------------------------------------------------------------------------------------------------------------------------
49
4.4.3 During the last 15 – 20 years some residential neighbourhoods were developed in the city. In Cowdray Park more than 22 000 stands were created on 1 049 hectares, in Emganwini more than 4 000 stands were developed on 760 hectares while in Pumula South and Pelandaba West developments are still ongoing. Layouts in the high density areas have been prepared for Magwegwe North, Magwegwe West and in fills of Emganwini. Overall in the high density areas 29 264 stands were planned in the last 2 decades and of these 12 969 had been developed as at the end of 2017, over 15 000 stands remained undeveloped as shown in the table 4 below. It is important to note that land for residential development within Bulawayo municipal boundary is fast depleting due to high demand for housing especially low cost housing in order to meet the ever increasing housing waiting list which is now over 115 000. The development of residential stands has continued in the high density areas at a reasonable pace despite the unfavourable economic situation in the country. The most notable were developments in Cowdray Park, Emganwini and Pumula South.
4.4.4 In the medium density housing Mahatshula underwent a substantial development with
over 2 000 stands developed. It is noted that there has been a substantial increase in the demand and provision of medium income housing and therefore more land should be set aside for this housing category. In pursuit of this objective the remainder of Umganwini has been set aside and layouts providing more than 6 000 stands have prepared.
4.4.5 In the low density areas stands were created at Emhlangeni (391), Parklands East (418)
and these where allocated and development is ongoing, meanwhile the development in Selbourne Park phase 2 and 3 continues. Table 4 below gives details on the position of stands with regard their development status. The 2 400 hectares of land proposed for this low density residential development have almost been depilated. There are tracks of developable land for this sector in Richmond area and part of Trenance as well as the northern areas that need to be considered for low and medium density housing.
Table: 4 - Existing Residential Stands by Density
Type No of Stands Planned
No of Stands Developed/Developing
No of Stands undeveloped
High Density 29 264 12 969 15 295
Medium Density 3 289 2 835 454
Low Density 3 839 2 019 1 820
Total 36 392 17 823 17 569
Source: Department of Housing and Community Services-BCC
4.4.6 As at mid-2017 there were 17 569 undeveloped stands in all different density areas as shown in the table above. Most of these stands had been allocated and some of them

Review and Preparation of Bulawayo Master Plan (2019 – 2034) Report of Study
------------------------------------------------------------------------------------------------------------------------------
50
were being developed. The main areas where such stands occur are Cowdray Park, Pumula South, Pelandaba West, Luveve, Magwegwe North, Magwegwe West, Emganwini, Mqabuko Heights, Selbourne Park, Mahatshula, Parklands East, Emhlangeni, B2 of Bellevue and RE of Umganwini (stands not serviced, not allocated).
4.4.7 The above table may not create a correct picture on the actual scenario on the ground
for the following reasons;
(i) Vacant stands do not have any structures or buildings on them, regardless of
ownership. In almost all low density areas most of the stands are privately
owned (e.g. Mqabuko Heights) and may not be relied upon to satisfy housing
demand as owners would develop at their own pace.
(ii) Those vacant stands that have been sold by council are subject to an Agreement
of Sale and cannot be sold to another party without consent of the local
authority. The current difficult economic situation means that a number of
vacant stands that have been bought will remain undeveloped for a long time.
Even if the repossession procedure is undertaken, there is no guarantee that the
next purchasers will develop the stands, therefore the availability of these stands
does not give any assurance for any housing program implementation.
(iii) Persons that have bought council stands are automatically removed from the
housing waiting list but this is not matched properly with the pool of vacant
stands.
(iv) Apart from newly serviced residential stands all other stands would be
considered non-available even though they are vacant.
(v) At the present moment except for layouts at RE of Umganwini, Cowdray Park
(new area next to Luveve High), Magwegwe West infill, Emganwini infills, most
vacant stands are subject of agreements of sale implying that they are non-
available.
4.4.8 It is necessary therefore that there is integrated planning and co-operation amongst relevant stakeholders to ensure that suitable land is zoned, planned, allocated and developed to satisfy housing demand and reduction of the housing waiting list.
4.4.9 With regard to areas outside the current Municipal boundary land for residential
development has been identified particularly in the south, northwest, north and east of the city. In Lower Rangemore Lot 27A, remainder of Lot 27A and Emthunzini township a total of 3 214 hectares for residential development is currently under development. The development of Emthunzini (293 hectares) is almost complete whilst a layout for Lot 27A providing for some 4 000 stands has been prepared. In Upper Rangemore, there is a total of 1 029 hectares of land earmarked for residential development. Eight private properties in the area have approved layouts with a total of 411.5 hectares.

Review and Preparation of Bulawayo Master Plan (2019 – 2034) Report of Study
------------------------------------------------------------------------------------------------------------------------------
51
4.4.10 To the north, Reigate has had substantial medium density development whilst a new suburb, Hopeville is currently constructing 1 039 houses occupying 149.8 hectares. Other peri-urban areas that have private residential development on - going include Helenvale Block (over 7 000 stands), Montgomery (mostly 2 hectare plots), Douglasdale, Willsgrove (over 8 000 stands) and Kensington. With these developments being undertaken in the immediate hinterland of the city it is of paramount importance that the incorporation efforts/negotiations or memorandum of understandings that have been undertaken in the past years or so should be concluded as a matter of urgency in order to facilitate co-ordinated development.
4.5 LAND AVAILABLE FOR RESIDENTIAL DEVELOPMENT
High Density
4.5.1 Land for high density development is scarce within the Municipal boundary as almost all large vacant stands in areas set aside for high density residential development within the municipal boundary have been planned through detailed layouts. However, there is still a large piece of vacant land available in Hyde Park measuring approximately 5 164 hectares which could be developed into low cost housing. The challenge facing this land is sewer ability since the area lies on lower ground than the Southern Areas Sewage Treatment Works (SAST). However, due to a great demand for low cost residential development means must be found to connect this area to the existing sewerage works or to the proposed Northern Areas Sewage Treatment Works (NAST).
4.5.2 Lot 27A, Lower and Upper Rangermore and Dunkirk currently outside the municipal
boundary present a natural area for expansion calculated for detailed proposals in the Written Statement. To the northwest of the city in the Helenvale Block there still exists some 5 000 hectares of land immediately adjacent to Cowdray Park but this is privately owned and hence development in the area is likely to be slow. Council may need to enter into negotiations with the owner to determine how there could co-operation to facilitate the development of low cost housing in this area. This potential high density residential area would be close to Cowdray Park Sewerage ponds and hence sewer connectivity would be easy. The solution again may lie in the development of NAST. More tracks of land in this area can be available for low cost residential development but this will ensure that there is acquisition of private land up to Siphaziphazi Siding.
Medium Density
4.5.3 This income bracket of residential development has been growing fast as witnessed by the springing up of Mahatshula and areas such as Emhlangeni. A layout plan for the provision of 760 stands is available in Mahatshula East and this is already planned and awaits funding to facilitate service provision. To the south of the city there is RE of Umganwini that is planned for medium density housing as mentioned before providing

Review and Preparation of Bulawayo Master Plan (2019 – 2034) Report of Study
------------------------------------------------------------------------------------------------------------------------------
52
for over 6 000 stands. However, there shall be provision for medium cost housing in all land acquisitions for residential development in the immediate hinterland of the city.
Low Density
4.5.4 Municipal land for low density/high cost residential development exists within the municipal boundary, in areas such as Richmond and the northern areas. The site lying between Princess Road, Masiyephambili Drive and Gleinvile Road appears suitable for low density residential development although more investigations to establish land suitability are needed. In northern areas to the west of Airport Road from Umguza River northwards the area could be used for high cost residential development in the near future using Aisebly farm for waste water disposal. Montgomery immediately to the east of Woodville provides a natural growth in that direction for high cost/low density residential development. The demand for stands in this income category continues to increase and to cater for this Selborne Park, Parklands Extension, Parklands East, Killarney East and Emhlangeni are being developed by council. However, this is not enough and as a result the Local Authority should encourage subdivisions of large properties that are found in the east and north of the city centre and also undertake large scale infill development to cater for this sector.
4.5.5 There over 5 000 flats and hostels scattered throughout the city with the highest
concentration being in the central business district and older high density suburbs. Development of flats has been slow since Independence due to prohibitive costs although sites are planned for this type of development in almost all new layouts. There is a huge potential for flat development once the economic conditions in the country improve.
4.6 INDUSTRIAL
4.6.1 In the last decade there has been a decline in industrial activity in the city with industrial companies scaling down or completely closing down. Some of the industries affected in include textiles/clothing, furniture, food processing, Cold Storage Commission and related industries like canning, polish making and tanneries. Some industries have even scaled down to as low as 25%. The decline/shutdown of industry has resulted in serious unemployment in the city resulting in high levels of poverty. Recently Bulawayo was declared a Special Economic Zone and preparations for this program’s implementation are underway with Belmont industrial having been selected as the first study area. This Special Economic Zone will encourage the development of industries that are linked to the raw materials coming from the hinterland and resuscitation of old industries where necessary. Industries that are based on local raw materials include abattoirs (CSC) e.g. based on livestock as Matabeleland region is largely a ranching area, textiles based on cotton, foundry and steel industries, furniture industries based on the hardwood forests such as teak and mukwa which are abundant in Matabeleland North. It is therefore

Review and Preparation of Bulawayo Master Plan (2019 – 2034) Report of Study
------------------------------------------------------------------------------------------------------------------------------
53
imperative that development of Special Economic Zone leads to improved agricultural production and mining in the hinterland and beyond in order to supply the industries with the much needed raw materials.
Existing industrial Development
4.6.2 The industrial area of Bulawayo is well developed and consists of these major industrial areas as shown in the table below.
Table 5: Existing Industrial Area
Area Industrial use
Barham Green General
Belmont General
Belmont East Light
Belmont South Light
Daviston General
Donnington General
Donnington West Light
Kelvin General/Special
Kelvin North Light/Service
Luveve Light/Service
Steeldale General
Thorngrove Light
Westerndale Light
Source: Job Jika & Associates
4.6.3 In addition to these industrial areas there is a small amount of light and service industry in the central area (small workshops) and to the east of the city in the vicinity of Cement Siding there is an industrial complex specialising in cement and clay products and bricks which are important to the construction industry. Willsgrove also to east of the city along Gwanda road manufactures bricks.

Review and Preparation of Bulawayo Master Plan (2019 – 2034) Report of Study
------------------------------------------------------------------------------------------------------------------------------
54
4.6.4 At the time of the study there were 1 517 industrial properties in the city inclusive of all types of industries as well as the undeveloped industrial areas at Umvumila and Hyde Park industrial area which belongs to Old Mutual Properties.
Industrial Zoning Zone 1: Service Industry
4.6.5 This comprises of industrial operations conducted for the express purpose of rendering services concerned with the day to day needs of the community. These types of industries include repairing, servicing, cleansing and general maintenance. Service industries are mainly located in Kelvin north and Luveve and they are mainly located near residential areas. Reservations for service industries have also been made in all shopping centres particularly in the high density areas. The development of service industrial stands has been rather slow which may be attributed to a lack of funding. There has been an increase in the development of overnight car parks in almost all high density residential areas and the ancillary activities which have emerged include tyre mending, firewood and gas sales.
Zone 2: Light Industry
4.6.6 Industrial operations in this zone are geared solely towards light manufacturing of articles and include altering, repairing and finishing off of various articles. This zone includes the present light industrial area in Belmont, including the industrial park in Doncaster Road up to 23th Avenue. Donnington West is also in this category of industrial zone.
Zone 3: Light Service Industry
4.6.7 This is a combination of zones 1 and 2. Industrial activities permitted in this zone are those permitted in light and service industrial zone. Three main areas which have been reserved for this zone include Daviston, Thorngrove and a portion of (undeveloped) Umvumila industrial areas.
Zone 4: General Industry
4.6.8 This zone includes the present industrial areas that is Donnington, Steeldale and Kelvin West.
Zone 5: Warehousing/Storage
4.6.9 These areas, strategically located adjacent to major distributor roads have been reserved for this purpose, include Thorngrove which serves the western industrial zone

Review and Preparation of Bulawayo Master Plan (2019 – 2034) Report of Study
------------------------------------------------------------------------------------------------------------------------------
55
and the southern area which can be linked to National Railways of Zimbabwe containerisation depot near Donnington. The northwest (Umvumila) may serve as an export processing zone.
Zone 6: Special Industry
4.6.10 This type of industry constitutes of works and processes (which in the opinion of local planning authority) are considered to be detrimental and potentially injurious to the health and safety in the surrounding areas. Such types of industries are noxious and highly polluting in nature. Most of the special industries are located in Kelvin and Donnington, as well as a portion of Steeldale has been zoned as a special industrial area. Future special industrial development has been considered in Westgate. In addition the area adjacent to the Cold Storage Commission which incorporates Sidojiwe residential flats has been zoned as a special industry.
Industrial Parks 4.6.11 Three main areas have been set aside for industrial parks namely a triangle covered by
Gleinvile drive, Victoria Falls and Stuterford Road. These constitute of: (a) An area between Famona and Doncaster Road (existing)
(b) An area between Old Falls Road to the north and unnamed stream to the south
(c) The strip of land in west Summerton between Plumtree Road and the railway
line to the south of Ianvale farm could be considered for an industrial park.
This type of industrial development (industrial parks) allows for an attractive mixture of uses with good landscape settings, well designed buildings and some supportive facilities and has been located along principal routes and adjacent to residential areas and proposed nature parks since they present good visual appearance.
Rail Provision
4.6.12 Rail service is of paramount importance to industrial development. A considerable number of properties in the old industrial areas of Steeldale, Belmont, Donnington and Kelvin are served by rail. There is potential for expansion of rail services in the developed industrial areas.
4.6.13 The future industrial area that could be economically rail serviced is the area is around
cement siding, due to the following reasons: (i) Relatively flat to gentle sloping terrain.
(ii) Close proximity of industries dependent on rail for ferrying their goods
e.g. Portland Cement and Clay products. These could satisfy the
requirements of National Railways of Zimbabwe.
Review and Preparation of Bulawayo Master Plan (2019 – 2034) Report of Study
------------------------------------------------------------------------------------------------------------------------------
56
(iii) Vast expanses of undeveloped land.
(iv) Well developed road infrastructure (Harare Road in close proximity).
Future Industrial Land Needs
4.6.14 The land presently zoned for industrial development within the city’s boundary has almost been depleted. However, there are two distinct areas that have not yet been developed namely:
(i) Hyde Park close to Kelvin North owned and serviced by Old Mutual.
(ii) North-western Commonage/Umvumila proposed for Export Processing
Zone (EPZ) and partially serviced (256 stands). Westwards this piece of
land stretches up to Masiyephambili Drive although there are a few
residential properties within it.
4.6.15 There is also a smaller piece of land which is designated industrial in Cowdray Park area along the railway line and this can be developed for light/service industries.
4.6.16 There is need to identify suitable land for industrial development around the city. It
should be pointed out that industrial land use by virtue of its nature lends itself to the challenge of suitable siting. Various factors such as soil types, wind direction, accessibility and railway links need to be considered at the onset. Thus these factors limit the land that can be considered for future industrial development.
4.6.17 Other constraints that heavily influence the location of industrial areas are:
(i) The need to maintain links with established industrial areas and the
Central Area.
(ii) The need for good transportation linkages, including rail with the rest of
the city. Some areas are therefore difficult to zone industrial because
they cannot be provided with rail services economically. Also there is
need for an effective public transport system for industrial-residential
areas linkages.
(iii) The polluting nature of some industries tends to keep them away from
incompatible land uses e.g. residential areas as well as from the Airport
safeguarded area, and this also has the effect of reducing the options on
the choice of land.
(iv) The need to separate residential and industrial development through
effective buffers to protect residence from pollution and the need to
effectively monitor pollution. However, at the same time there is even
more pressing need to locate industry at points where they are easily
accessible to labour.

Review and Preparation of Bulawayo Master Plan (2019 – 2034) Report of Study
------------------------------------------------------------------------------------------------------------------------------
57
Possible Land within Municipal Boundary
4.6.18 There is very little land within greater Bulawayo boundary that can be considered for future industrial development and this includes:
(i) Railway operational land stretching from Donnington to Luveve Road.
This area could provide a substantial amount of land but the local
authority would be required to engage NRZ.
(ii) Land sandwiched between Plumtree Road and the railway line running
from Lanvale farm to Hlekweni turnoff. This site could be used as an
industrial park due to its location as a gate way into the city from the
south, so that an attractive and well landscaped environment is created.
(iii) The above mentioned industrial areas of Hyde Park (Old Mutual) and
Umvumila (EPZ) need to be prioritised as they have been lying idle for
many years.
4.6.19 Important to note is the national vision 2030 which forecasts Zimbabwe as an upper middle income nation. Industrialisation and modernisation take centre stage in efforts to achieve this vision. Bulawayo as a selected Special Economic Zone is expected to play a leading raw in this noble national program.
Possible Land outside the Municipal Boundary
4.6.20 With the shortage of industrial land within the Municipal boundary it would appear the
best option for council is acquisition and incorporation of the identified suitable areas. Identification of some suitable land for the foreseable has to be done. This option immediately lends itself to one major problem/obstacle that industrialists prefer to agglomerate and benefit from economies of scale. This factor is evidenced by the fact that industrial areas in the city have links to each other. It should also be noted that the land identified immediately outside the Municipal boundary is at least some 20 kilometres away causing accessibility problems from the Central Area. As a result there is a likelihood of reluctance or resistance to the development of this land as demonstrated by the slow pace of developing Luveve industrial area.
4.6.21 The identified areas are as follows:
(i) The 400 hectares in a new estate in the Cement Siding area will
complement the cement and clay industries as there is good access to
Harare Road
(ii) The 100 hectares in Willsgrove area are earmarked for light industry,
service industry, small businesses, workshops and the informal sector

Review and Preparation of Bulawayo Master Plan (2019 – 2034) Report of Study
------------------------------------------------------------------------------------------------------------------------------
58
(iii) Land to the west of Cowdray Park along the railway line up to
Siphaziphazi Siding. Access will be from Tsholotsho Road or through
Cowdray Park.
4.6.21 It will be prudent for this study to identify more prospective and suitable land for future industrial development immediately outside the city.
4.7 COMMERCIAL
The Central Area
4.7.1 The Central Area constitutes the hub of all commercial activity in the city. It has 95 blocks between 3rd and 15th Avenue, J Tongogara and Lobengula Street. According to the City Valuation records the CBD has 1 480 properties.
4.7.2 Development in the Central Area is controlled through Local Plan NO 4-Central Area and
has been delimited by that plan as shown on Plan NO TPD 276/1. This local plan constitutes the main legal document for development control in the Central Area. Local Subject Plan NO 15 guides development of proposed 8th Avenue - Jason Moyo Street Mall. As a result this study will not detail activities of the Central Area, but refer to these plans. However, a few notable features that are of significance to this study are presented below:
Land Uses in the City Centre
4.7.3 Commercial activities constitute the dominant land uses in the Central Area but there also exists some residential, recreational, governmental uses, local authority uses, educational, industrial, railway, transportation, informal sector and office uses in the area. Local Plan NO 4 currently constitutes the guiding framework in terms of land uses but needs to be revised to accommodate current needs and development trends. For example there is an increasing number of applications to change the residential zone to commercial zone. Local Plan NO 18 has been prepared to establish the feasibility of such changes.
4.7.4 In response to the deteriorating economic situation in the country affecting all urban
and rural areas there has been a move by the local authority to provide an enabling environment for the informal sector as demonstrated by its actions to accommodate the activity in the CBD. Fifth Avenue from R.G Mugabe Way to Lobengula Street has been designated as a vending area for the informal sector. The southern lane of the avenue has been closed and vendor bays created and allocated to the informal sector thus establishing a one-way, west-east vehicular traffic movement. The resultant vending area sites have been divided into sections for different types of informal sector

Review and Preparation of Bulawayo Master Plan (2019 – 2034) Report of Study
------------------------------------------------------------------------------------------------------------------------------
59
activities such as fruits and vegetables, odds and ends, old and new clothing, electrical goods amongst others.
4.7.5 Council has also authorised the establishment of 6 indoor flea-markets within the CBD demonstrating its progressive and responsible approach to local economic trends. Of note also is the establishment of outdoor flea-markets on 2nd Avenue and Lobengula Street, and the site next to Highlanders Football Club at corner Masotsha Ndlovu Avenue/Fife Street, as well as 3rd Avenue/Lobengula Street bus terminus which was converted into an informal trader’s site.
Undeveloped Stands in the City Centre
4.7.6 There are many undeveloped stands in the Central Area whose owners do not appear to be eager to develop or sell them. In some instances some of the buildings have become derelict and unsightly. The local authority should enforce existing relevant statutary instruments to encourage or compel the owners to develop or sell these stands to facilitate meaningful development.
4.7.7 In general development within the CBD has been very slow since Independence and
certain parts are viewed as underdeveloped as single storey buildings predominate. The envisaged large scale development in the Central Business Area is the proposed redevelopment of Lobengula/Basch Street bus terminus into an up market public transportation interchange hub that will also produce an upmarket commercial complex. Work on the project has just started and its completion is bound to improve the CBD’s outlook and behavioural patterns.
Suburban Areas
4.7.8 In addition to the Central Business District there are numerous suburban shopping centres scattered throughout the various residential areas. Under ideal circumstances each suburb should have a commercial centre serving that locality. However the newly developed suburbs of Selborne Park, Buenia Vista, Burnside and the old suburb of Killarney are some of the few that do not have commercial centres or even small corner shops for convenience shopping.
4.7.9 There over 300 local commercial centres in all residential areas. There are 3 established
district commercial centres in the city namely Entumbane and Nkulumane district commercial centres in the high density areas and Ascot Shopping Centre in the eastern suburbs. Other large commercial centres in the low density residential areas include Hillside, Zonkizizwe (Famona). Retreat, Bellevue Spar, South world and Bon Marche serve as neighbourhood commercial centres. City Council has proposed the redeveloping of former Ascot Race Course into a multi-purpose complex that will consist

Review and Preparation of Bulawayo Master Plan (2019 – 2034) Report of Study
------------------------------------------------------------------------------------------------------------------------------
60
of commercial uses, health centre, town house development, hotel, amusement/recreational uses as well as limited horse related sports.
4.7.10 Entumbane and Nkulumane District Commercial Centres also have country bus termini
which help boost customer clientele of these shopping centres. However it is worthy to note that several shops at these District Commercial Centres are not occupied due to the current economic situation. The effect of these district commercial centres on the viability of local commercial centres in the neighbourhood is unknown. A study of this phenomenon would be of interest to the city.
4.7.11 Almost all local shopping centres particularly in the high density areas have informal
sector sites particularly for informal traders who sell fruit and vegetables, odds and ends and old clothing.
Future Needs
4.7.12 The number and location of future commercial centres will be determined at local plan level and more accurately at layout preparation stage. The siting and provision of district commercial centres would be determined in this Master Plan Review proposals.
4.8 URBAN AGRICULTURE IN THE CITY
Introduction 4.8.1 Urban agriculture is the growing of plants and rearing of livestock for food and other
uses within the urban and peri-urban areas. This may also include related activities such as production and delivery of inputs and the processing and marketing of products. The scale of agricultural activities is determined by the land size, availability of water, skills, labour, legislative framework as well as finance.
Urban Agriculture as an Important Land Use
4.8.2 Bulawayo City Council showed interest in promoting urban agriculture in 1995 when it
sent an official to Washington to attend a workshop on urban agriculture. During that time urban agriculture was a relatively a newly recognised land use and very few countries appreciated its existence and importance. The Local Authority established an
interdepartmental committee to study urban agriculture in the city and recommend how it could be supported. A first draft policy document on urban agriculture was produced and adopted by council in 2000.
4.8.3 The City Council also entered into a partnership agreement with Municipal Development Partnership (MDP) –RUAF in 2005 for a four (4) year urban agriculture development program. During the program implementation a number of activities were undertaken
Review and Preparation of Bulawayo Master Plan (2019 – 2034) Report of Study
------------------------------------------------------------------------------------------------------------------------------
61
such as the formation of a multi-stakeholder Urban Agriculture Forum which steered the promotion of urban agriculture activities and formulation of Bulawayo Urban Agriculture Policy in an effort to promote urban agriculture. The policy was approved by council in 2008, meanwhile for the first time urban agriculture had been incorporated into the city’s budget in 2007.
Types of Urban Agriculture
4.8.4 Urban agriculture in the city is practiced under difference practices and arrangements. It
is undertaken by households, groups or companies on designated plots or off plots, permitted or unauthorized, on a river/stream bank, on road reserves, on a farm or on illegally occupied land through rainfed or irrigation. At the time of the study some of the dominant urban agricultural activities in the city constituted of the following:
Designated/Zoned Areas
4.8.5 Residential/agricultural areas mainly constitute of land areas which are over 2 hectares that have been designated through the city’s master or local plans. These plots are largely in peri-urban areas such as Douglasdale, Montgomery, Umvutsha, Upper and Lower Rangemore, Umguza agricultural plots, Norwood and Hyde Park. In addition to the above some of the areas where urban agricultural activities are being undertaken include the low density residential areas of Burnside, Lochview, Waterford, Buenia Vista, Riverside, Trenance and Richmond. Cropping in these areas is mostly dependent on irrigation through the use of boreholes as the city is in a low rainfall area. Produce includes crops such as vegetables, maize, fruit, fodder crops, poultry, goats, sheep and dairy cows. The produce is marketed in the city especially at the wholesale markets which are in the central business district.
Special Consent Areas 4.8.6 Applications for special consent are mostly being received from the low density
residential areas and involves applying for certain types of urban agricultural practices that require Council’s special consent. Poultry and market gardening are the dominant agricultural uses being applied for. Sometimes applications are considered for cattle pen feeding, horse keeping and dairy production. Permits are granted by council with special health and environmental conditions. Council Farms
4.8.7 Council has two (2) productive farms within its boundaries namely Aisleby and Goodhope. Aisleby Farm covers an area of 1 286 hectares and lies to the north of the city and this is where Aisleby sewerage works are situated. Treated effluent from the works is used for irrigating the farm pastures. A successful livestock production project

Review and Preparation of Bulawayo Master Plan (2019 – 2034) Report of Study
------------------------------------------------------------------------------------------------------------------------------
62
is being run by Ingwebu Breweries at Aisleby. There is also a project for keeping sheep which started in 2004.
4.8.8 Goodhope Farm adjacent to Aisleby produces maize and wheat. At a yield of 3 tonness
per hectare production is being harvested and this is considered low. This may be attributed to imbalances in nutrients as a result of shortages of farming inputs.
Garden Allotments 4.8.9 Over many years the city council has set aside areas for garden allotments in the high
density areas. These were established in selected areas especially those with relatively fertile soils on vleis and along rivers or streams. There are twelve (12) garden allotments in the city, wholly funded by council which are scattered throughout the low cost residential areas. Some of the garden allotments are located in Makokoba near St Columbus, West Park near Mzilikazi, in Mabutweni, Mpopoma and Njube. These garden allotments were created particularly for the underprivileged members of society such as the elderly, destitute, the poorest and widows. There are more than 1 000 beneficiaries and each plot averages 130 square meters. The size of each garden allotment ranges from 0.42 to 4 hectares.
4.8.10 Poultry, mushroom production, rabbit rearing and the gardening project referred as
PMRG was an initiative of NGOs in an effort to alleviate poverty. The project is operational in wards 15, 16, 17, 18, 19, 28 and 29. The project is located at Luveve near Luveve cemetery. It was initially funded by World Vision Zimbabwe but SNV later joined the project. The two NGO’s have since pulled out and the Local Authority through the Housing and Community Services Department has since taken over.
Gumtree Plantation Project 4.8.11 The Gumtree Plantation project is located near Old Luveve Cemetery. This project was
initiated in the late 1980’s after the abandonment of sorghum fields by Ingwebu Breweries. The project beneficiaries are from wards: 9, 10, 11, 12, 13, 14, 15, 16, 17, 18 and 29. The beneficiaries are mainly the elderly and pensioners. The selection was done by the Local Authority’s Social Services section. The project was later funded by MDP and RUAF who constructed the canal and supplied inputs to the group e.g. seed and fertilizer. The project has more than one hundred (100) participants. The beneficiaries were recruited by the council social workers. Currently the project is striving on its own and council is coming in with the capacity building and irrigation system.
Khami School Leavers and Co-operatives 4.8.12 Khami School Leavers Training Centre is located near the Southern Areas Treatment
Works (SAST). This is one of Bulawayo City Council’s initiatives for training youths and

Review and Preparation of Bulawayo Master Plan (2019 – 2034) Report of Study
------------------------------------------------------------------------------------------------------------------------------
63
co-operatives. The centre offers general agriculture training practice and theory in both livestock husbandry and agronomy. In the livestock section emphasis is on cattle and piggery.
Unauthorized Urban Agriculture activity 4.8.13 This is the most prevalent form of urban agriculture in the city although it is seasonal,
occurring mostly during the rainy season. Maize is the dominant crop under cultivation although other crops like sweet potatoes, melons, beans and pumpkins are also grown. This type of urban agriculture is being undertaken almost everywhere where there is an open space and during the rainy season maize fields become so much part of the city’s landscape that goes even unnoticed as one moves around the city. Urban agricultural activities are being undertaken within residential stands, on open spaces, along road servitudes, on vleis, water courses and stream banks, on hill slopes, on old rubbish dumps, along servitudes for electricity water and sewers. A lot of urban agriculture is carried out on land that is planned, surveyed and even serviced, awaiting development in some cases.
4.8.14 The majority of households who are engaged in urban agricultural activities constitute
of those in the low income groups who grow crops on part time basis for subsistence and improving food security and generate income. Usually the whole family is involved in maize cultivation although women appear to take a leading part. The sizes of the maize fields range from small patches measuring a few square meters to a number of hectares. There are no records on the yields and overall production of these unauthorized cultivations but the activity contributes to staple food production for the majority of the poor households.
4.9 THE HINTERLAND
4.9.1 The city’s hinterland bordering the east, north and south of Bulawayo mainly consists of
privately owned properties. In these areas developments are mainly privately initiated as demonstrated by residential development projects in the Rangemore area, but the Local Authority may encourage subdivision of properties within its boundaries and areas immediately outside, and the sale of such properties so as stimulate development.
4.9.2 The area surrounding Bulawayo has basically similar climatic and physical environmental
characteristic to the city. Surveys by Agritex during preparation of this plan and earlier have shown that the areas immediately around the city are devoted to different agricultural activities with varying scale and intensity. The city is surrounded by commercial farming entities, that is large farms and plots whilst new resettlement areas are within some 20 to 30 kilometres and the nearest communal land area is some 40 kilometres away. It is therefore clear that the expansion of the city will require the acquisition of some of these properties albeit considering their agricultural potential
Review and Preparation of Bulawayo Master Plan (2019 – 2034) Report of Study
------------------------------------------------------------------------------------------------------------------------------
64
and contribution to the city’s and national economy. A more detail study will be required on the utilization of theses farms/plots in order to determine which plots can be acquired without seriously affecting agricultural production in the area.
4.9.3 In addition to the recommended study by Agritex, individual farmers were also
consulted during the preparation of this plan through a questionnaire on their day to day activities and linkages and relationships with the city of Bulawayo pertaining to what they contribute to the city and what services they benefit from the city. A summary of the findings is outlined below.
Rangemore
4.9.3.1 Rangemore area lies about 14km from the city centre. The main land use in these agricultural plots is horticulture. The main source of water is from boreholes and produce comprises of a variety of fruits and vegetables sold locally and in Bulawayo. Of late there is substantial high density residential development initiated by private land developers such as Mbundane township, Nkulumane township and Nhlalo township. Although this area has a high agricultural potential its closeness to Emganwini and Nkulumane makes it suitable for immediate city expansion for high density residential development.
Douglasdale
4.9.3.2 It is about 16 kilometres from the city centre and is adjacent to Waterford suburb to south east from city centre. The major form of land use in the area is horticulture which is complimented by maize, small stock, piggery, dairy, poultry. Most of the farmers in the area depend mostly on borehole water with a few connected to the municipal system. Also there are specialised farming activities such as horse breeding, fruit and vegetable seedlings, dog kennels and cattery. Agricultural potential is limited due to poor availability of water. Many plots have an average size of 2 hectares and these can be readily incorporated into the city boundary.
Sauerdale Block
4.9.3.3 A large portion of Sauerdale has been invaded by gold panner’s who have caused serious damage to the land by digging all over and making the area environmental vulnerable to soil erosion. The northern part of Sauerdale is used for agricultural research, forestry research and a game sanctuary.
4.9.3.4 There area has a huge potential for agriculture. Part of this land has been used for long
term experiments on indigenous and exotic tress. Soils are suitable for mixed farming. Otherwise the portion close to the city’s low density residential areas like Hillside South are considered suitable for residential expansion.

Review and Preparation of Bulawayo Master Plan (2019 – 2034) Report of Study
------------------------------------------------------------------------------------------------------------------------------
65
Pioneers Rest and Claremont
4.9.3.5 The major form of land use in these area is semi intensive livestock production coupled with horticulture and dryland farming.
4.9.3.6 The agricultural potential of these areas is limited by poor underground water supplies.
There would be no immediate need to incorporate these areas into the city’s boundary due to their location.
Kensington
4.9.3.7 The major land use in this area is agriculture namely piggery, poultry, semi intensive livestock production coupled with horticulture and dryland farming. Intensive agriculture is limited due isolated parches of suitable sites mostly in valley sections and isolated upland areas. The underground water is also very low. Kensington is considered suitable for inclusion into the city’s boundary because of its closeness to the city.
Montgomery
4.9.3.8 The major land use in the area is horticulture and poultry supported by semi-intensive livestock production with dryland crop farming. Specialised farming such as dairy and greenhouse horticulture production is found in this area. There is a high potential for horticulture in areas with suitable soils and sufficient water. However, there is a section with deep Kalahari sands where limited agricultural activity is taking place. As Montgomery adjoins Woodville suburb in the north eastern part of Bulawayo, it forms a potential natural area for the city’s expansion in that direction and more so, the soils are suitable for development.
Reigate and Umvutsha
4.9.3.9 The major form of land use in the area is dry land cropping supported by irrigation, poultry and some mining. There is substantial new development of medium density housing in Reigate as well as newly established suburb of Hopeville with 1 029 stands. There is also specialised farming in certain areas, notably dairying and ostrich farming. In terms of agricultural potential the soils are suitable for crop production as long as there is sufficient water but in addition there is potential for horticulture and specialised agriculture. This area was incorporated into the city for election purposes in 1999 through Statutory Instrument 212 of 1999, although it was not taken over by Bulawayo City Council for administration purposes. It is a natural area for Bulawayo’s expansion to the north extending up to the airport and this is supported by proposals of Local Plan NO 10- Northern Areas as well as the 2000 Master Plan.

Review and Preparation of Bulawayo Master Plan (2019 – 2034) Report of Study
------------------------------------------------------------------------------------------------------------------------------
66
Dunkirk and Dunstal
4.9.3.10 Properties in this area constitute of small plots whose main activities include limited horticulture under irrigation, small stock production (i.e. piggery) and semi-extensive livestock production. In recent years council has subdivided parts of the area to the west of Khami River and offered plots to residents for horticulture on 25 year leases. If this area was to be incorporated for urban expansion the zoning may remain as residential/agricultural.
4.9.3.11 Agricultural potential in this area is most appropriate as horticulture under irrigation,
although the soils are sandy with isolated patches of heavier soils.
Springs
4.9.3.12 The major form of land use is semi-intensive ranching. There is agricultural potential supported by irrigation development and intensification of livestock production. The current infrastructure makes the area suitable for ranching.
Upper and Lower Nondwene
4.9.3.13 The major form of land use is ranching with wildlife. The terrain is relatively flat to undulating.
4.9.3.14 In terms of agricultural potential the western part of Upper Nondwene lies on Kalahari
sands where the potential is limited to extensive ranching. This area has already been incorporated into the city’s boundary through Statutory Instrument 212 of 1999.
Willsgrove
4.9.3.15 The major form of land use is extensive ranching with quarrying for clay. There is limited agricultural potential on this property. Due to its closeness to the city it lends itself to incorporation. The owners have already taken the initiative as they have prepared a residential layout of mixed densities.

Review and Preparation of Bulawayo Master Plan (2019 – 2034) Report of Study
------------------------------------------------------------------------------------------------------------------------------
67
CHAPTER 5
POPULATION AND ECONOMIC PROFILE
5.1 INTRODUCTION
5.1.1 An analysis of population characteristics in urban and other spheres of planning is
important in both urban and regional planning contexts. This population and economic
profile chapter is founded on the principled need to attempt to have a good
understanding the demographic characteristics and economic situation in the plan area
through past trends, present situation and the likely future population and economic
scenarios in the short, medium to long term. The demographic analysis will feed into
other sectoral studies dovetailed towards successful achievement of the task at hand:
Review and Preparation of a new Master Plan for the City of Bulawayo.
5.1.2 The coordinated efforts of the various role-players in the built-environment (City of
Bulawayo in this case) i.e. experts and communities is aimed at not only shaping the city
at present and in the future, but planning for, satisfying and making provision for the
needs of the population presently and in future. The needs of the population and shape
of the city’s physical environment find expression through spatial planning; population
distribution; provision of service infrastructure; community facilities and amenities.
5.2 POPULATION AND DEVELOPMENT PLANNING
5.2.1 In this chapter, various population factors and dynamics will be studied as they relate to
the plan area. The analysis focuses on understanding population in terms of its size,
distribution, growth and trends over time and the three key population factors, namely:
fertility, mortality and migration as they impact on city planning and general service
delivery.
5.2.2 Focussing the study solely on the City of Bulawayo would not give a good picture and
fair understanding of the abovementioned population characteristics at a wider
geographic context. The study will therefore draw comparisons with other towns and
cities, provinces, the country at large and elsewhere as they impact on the city. In the
national context, comparison is made with the capital city Harare and Zimbabwe’s
population characteristics, dynamics and trends.

Review and Preparation of Bulawayo Master Plan (2019 – 2034) Report of Study
------------------------------------------------------------------------------------------------------------------------------
68
5.3 CONSIDERATIONS IN ESTIMATING OR PROJECTING POPULATION SIZE
5.3.1 In analyzing the population trends in the City of Bulawayo it would be essential taking
note of the following:
i. Estimating or projecting population size at a given time is a critical aspect for
planning purposes at various scales, be it national, regional or local scale;
ii. Established through the Census and Statistics Act of 2007, the Zimbabwe
National Statistics Agency (ZIMSTAT). The agency is the main source of official
statistics in Zimbabwe and is mandated to play a coordination and supervisory
role within the National Statistical System. ZIMSTAT has the authority to certify
and designate any statistics produced in the country as official statistics having
been satisfied that all the quality requirements of good statistics were met.
iii. There are alternative methods for estimating population size and projection and
these can neither be precluded nor excluded;
iv. Population figures are an estimate at any given time due to the difficulty in
confirming the figure as definitively accurate for a variety of reasons;
v. When estimating the population size or projection, it would be useful to
“compare with an equally accurate or more accurate method”;
vi. Estimating population size is based on a scientifically grounded method tends to
have a good measure of reliability and dependable results.
5.4 POPULATION COMPOSITION BY AGE AND SEX
5.4.1 Age and sex characteristics are critical factors in the demographics of an area. At the
various age categories, people demand a wide variety of public services and programs,
including facilities for children, jobs, schools, and needs for the for the elderly. The
human sex ratio for Bulawayo has been in favour of females over males and the country
falls within the category of countries with more females than males. The population of
Bulawayo has consistently exhibited a preponderance of females over males in recent
demographic historical population composition by sex. There was a marginal increase in
the female composition from 52.2% in 2002 to 53.6% in 2012. Males on the other hand
constituted 47.8% in 2002 declining to 46.4% in 2012. This calls for policies,
interventions, programmes, etc. to ensure that females are catered for or empowered
by not only the city but national government as well.

Review and Preparation of Bulawayo Master Plan (2019 – 2034) Report of Study
------------------------------------------------------------------------------------------------------------------------------
69
Table 6: Bulawayo Province Population 2012
Age Group Number Males % of
Total
Number Females % of
Total
Total Population
Total 232 0.03 235 0.04 467
8422 3378 0.5 5044 0.8 8422
5499 2266 0.3 3233 0.5 5499
7652 3375 0.5 4277 0.7 7652
11186 5392 0.8 5794 0.9 11186
16812 8144 1.2 8668 1.3 16812
22125 9945 1.5 12180 1.9 22125
23251 10475 1.6 12776 2.0 23251
30848 15119 2.3 15729 2.4 30848
38995 18691 2.9 20304 3.1 38995
50660 23831 3.6 26829 4.1 50660
64078 28817 4.4 35261 5.4 64078
73239 31803 4.9 41436 6.3 73239
78205 33923 5.2 44282 6.8 78205
69510 32940 5.0 36570 5.6 69510
67679 32980 5.0 34699 5.3 67679
85176 42035 6.4 42674 6.5 84709
653337 303 346 46.4 349 991 53.6 653 337
Source: ZIMSTATS
5.4.2 The female 15 to 64 years age group increased from 33.6% in 2002 to 34.2% of the
population in 2012. Meanwhile, the male population decreased from 30.2% in 2002 to
28.5% in 2012.
5.4.3 There was a decline for both males and females in the 15 to 24 year age group.
Furthermore, there a decline in the composition of the 15 to 49 age group for males
while there was an increase in female representation. The decline was from 27.1% down
to 24.9% in 2012 for male representation. Female representation generally increased
between the censuses. It is likely that considering that this is the labour force, the male
composition decrease (183 265 in 2002 to 162 659 in 2012 (i.e. by 20 606 males within
the labour force) could be attributed to migration for economic reasons and possibly
emigration to destinations out of the country. The city’s economy is currently depressed
and tends to be a push factor for the labour force. This is further explored on the section
dealing with migration.

Review and Preparation of Bulawayo Master Plan (2019 – 2034) Report of Study
------------------------------------------------------------------------------------------------------------------------------
70
5.4.4 Table 7 is a summary of the population composition for Bulawayo in 2002 and 2012
Censuses respectively as extracted from Table 3 above. A graphic presentation of the
population profile in 2002 and 2012 is depicted on the population pyramids in Figure 1.
The population pyramids are wide at the base showing the presence of a youthful
population while the bulge in the middle parts of the pyramids showing a significant
number within the labour force and marked continuity in the growth of this age group.
The old age population has the least representation as shown by the thinning of the
pyramid towards the top.
Table: 7 Summary of the Population Composition
Age
Group
2002 2012
Total
Population Percentage (%) Total Population Percentage (%)
65+ 18699 2,76 21573 3,3
50 to 64 39177 5,79 50123 7,67
15 to 49 392785 58,05 359276 54,99
0 to 14 225989 33,4 222365 34,04
Total 676650 100 653337 100
Source: ZIMSTATS
5.4.5 The population of Bulawayo was characterised by a youthful population where the age
group 0 to 14 years constituted a third of the population in 2002 and 2012. There was a
slight increase in the composition from 33.4% in 2002 to 34.04% in 2012. The working
age group 15 to 64 years has been the dominant cohort at 63.84% in 2002 decreasing to
62.66% in 2012. The fact that a third of the population were youthful in Bulawayo in
2012, means that the municipality will have to focus the provision of services for the
youth such as public facilities and amenities for example early childhood learning
centres, schools, healthcare and other public amenities in the short term. In the medium
to long term, the youthful population will contribute to population growth and demand
for jobs.
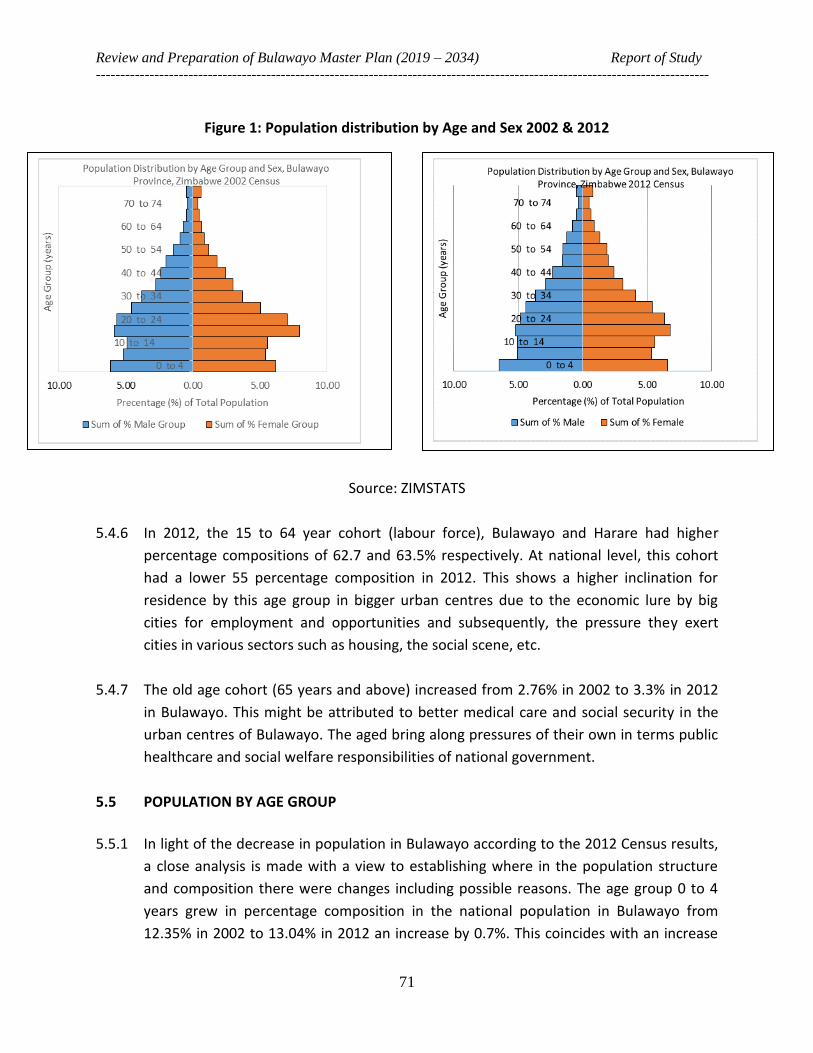
Review and Preparation of Bulawayo Master Plan (2019 – 2034) Report of Study
------------------------------------------------------------------------------------------------------------------------------
71
Figure 1: Population distribution by Age and Sex 2002 & 2012
Source: ZIMSTATS
5.4.6 In 2012, the 15 to 64 year cohort (labour force), Bulawayo and Harare had higher
percentage compositions of 62.7 and 63.5% respectively. At national level, this cohort
had a lower 55 percentage composition in 2012. This shows a higher inclination for
residence by this age group in bigger urban centres due to the economic lure by big
cities for employment and opportunities and subsequently, the pressure they exert
cities in various sectors such as housing, the social scene, etc.
5.4.7 The old age cohort (65 years and above) increased from 2.76% in 2002 to 3.3% in 2012
in Bulawayo. This might be attributed to better medical care and social security in the
urban centres of Bulawayo. The aged bring along pressures of their own in terms public
healthcare and social welfare responsibilities of national government.
5.5 POPULATION BY AGE GROUP
5.5.1 In light of the decrease in population in Bulawayo according to the 2012 Census results,
a close analysis is made with a view to establishing where in the population structure
and composition there were changes including possible reasons. The age group 0 to 4
years grew in percentage composition in the national population in Bulawayo from
12.35% in 2002 to 13.04% in 2012 an increase by 0.7%. This coincides with an increase

Review and Preparation of Bulawayo Master Plan (2019 – 2034) Report of Study
------------------------------------------------------------------------------------------------------------------------------
72
in the Crude Birth Rate in Bulawayo from 26.99 per 1000 in 2002 to 27.3 per 1000 in
2012 and decreased to 26 per 1000 in 2017. On the other hand there was a decrease in
the Crude Death Rate from 13.9 per 1000 to 9.3 per 1000 in 2012 with a further
decrease to 4.7 per 1000 in 2017.
5.5.2 The composition of the 10 to 14 years age group grew marginally in Bulawayo’s
population composition from 10.5% in 2002 to 10.6% in 2012. There was a 3,3 percent
decrease in composition of the 15 to 24 year age group from 26.5% in 2002 to 23.2% in
2012. This is part of the working age population.
5.5.3 It can be deduced from these figures the crude birth and crude death in Bulawayo was
likely not responsible for the decline in population. In fact, as would be seen in the
ensuing sections, there a natural increase of 0.5% from 1.3% in 2002 to 1.8% in 2012. It
is likely that migration for economic reasons cannot be ruled out for this decrease
considering that this cohort is also of child-bearing age and when they migrate, it does
affect population growth.
5.5.4 The 25 to 39 cohort experienced an increase from 22.9% in 2002 to 23.5% in 2012.
There was however a slight dip in population percentage composition from 8.62% in
2002 to 8.28% in 2012 for the age group 40 to 49 years. The 50 to 64 year cohort
increased from 5.79% to 7.67% in 2012. These age groups cumulatively accounted for a
decrease of 35 956 people as a result of decreases in the age cohorts 5 to 9 years, 15 to
19 years, 40 to 44 years and 45 to 49 years from 2002 to 2012. The reasons vary from
cohort survival to the economic migratory tendencies of this group. Those aged 65 years
and above increased from 2.8% in 2002 to 3.3% in 2012 which may be attributed to
improved medical care for the aged, decrease in the crude death rate from 13.9 per
1000 in 2002 to 9.3 per 1000 in 2012 and an increased in life expectancy.
5.6 CRUDE BIRTH RATE AND CRUDE DEATH RATE 5.6.1 Fertility
5.6.1.1 The number of women of childbearing age women was 209 160 (31%) in 2002
decreasing to 196 617 (30%) in 2012. The 2012 Census indicates that there was a decline
in the number of women of childbearing age by 12 543 women in this category. The
Total Fertility Rate for Bulawayo increased 2.6% in 2002 to 2.8% in 2012. The Total
Fertility Rate increased for Harare and the country during this time. Table 8 below
shows the Crude Birth Rate (CBR), General Fertility Rate (GFR) and Total Fertility Rate

Review and Preparation of Bulawayo Master Plan (2019 – 2034) Report of Study
------------------------------------------------------------------------------------------------------------------------------
73
(TFR) for Bulawayo, Harare and Zimbabwe. Comparison is made between the Crude
Birth Rate and the General Fertility Rate which is the number of births per 1000 of
reproductive ages for Bulawayo, Harare and Zimbabwe at large. The General Fertility
Rate, like the Crude Birth Rate has consistently been lower for Bulawayo compared to
Harare and the country from 2002 to 2012 save that it was higher than that for the
country in 2002. When the General Fertility Rate was 87 per 1000 women in Bulawayo it
was 100 and 117 in Harare and Zimbabwe respectively. It increased to 91 per 1000
women in 2012 but was again lower than Harare (110) and Zimbabwe (127). The
intercensal demographic survey of 2017 showed a decline for Bulawayo, Harare and
Zimbabwe. This trend has an impact on the population growth rate for the city in that it
has an inclination for lower growth compared to the capital and the country meaning
that even other provinces registered higher rates than the City of Bulawayo.
Table: 8 Crude Birth Rate, General Fertility Rate and Total Fertility Rate for
Bulawayo, Harare and Zimbabwe.
Year Crude Birth Rate per 1000
General Fertility Rate per 1000 women 15 to 49 yrs
Total Fertility Rate
Crude Birth Rate per 1000
General Fertility Rate per 1000 women 15 to 49 yrs
Total Fertility Rate
Crude Birth Rate per 1000
General Fertility Rate per 1000 women 15 to 49 yrs
Total Fertility Rate
Bulawayo Harare Zimbabwe
2002 26,99 87 2,6 30,56 100,5 2,8 33,8 30,2 3,6
2012 27,3 91 2,8 33,3 110 3,1 31,9 127 3,8
2017 26 85,5 2,6 30,6 99,8 3 29,8 119,9 3,7
Source: ZIMSTATS
5.6.1.2 The Crude Birth Rate for Bulawayo is analysed within the national context with
particular comparison with the country at large and the capital city, Harare. Table 9 and
Figure 2 show that the Crude Birth Rate for Bulawayo declined for 33.9 per 1000 in 1992
to 26.99 per 1000 in 2002. During the same period the Crude Death Rate doubled from
7 per 1000 in 1992 to 13.9 per 1000 in 2002 resulting in a decrease in the average
annual growth rate from 2.54% in 1992 to 0.9% in 2002. The Crude Birth Rate increased
slightly from 27 per 1000 between 2002 and 2012 while the Crude Death Rate further
declined from 13.9 per 1000 in 2002 to 9.3 per 1000 in 2012. This situation prevailed
while the population declined at an annual average decrease of 0.34% or by 23 313
people. This decline has generated debate among the relevant stakeholders regarding
the city’s population status and growth over the years. By 2017 the Crude Birth Rate in
Bulawayo declined to 26 per 1000 while the Crude Death Rate has continued to decline
since 2002 reaching a low rate of 4.7 per 1000 in 2017.

Review and Preparation of Bulawayo Master Plan (2019 – 2034) Report of Study
------------------------------------------------------------------------------------------------------------------------------
74
Table 6: Crude Birth Rate and Crude Death Rate: Bulawayo, Harare and Zimbabwe
Bulawayo Harare Zimbabwe
Year Total
Population
Crude Birth
Rate per 1000
Crude Death
Rate per 1000 Year
Total
Population
Crude
Birth Rate per 1000
Crude
Death
Rate per
1000
Year Total
Population
Crude Birth
Rate per 1000
Crude Death
Rate per
1000
1992 620935 33,9 7 1992 1478810 32,99 6,52 1992 10412548 36 10,6
2002 676650 26,99 13,9 2002 1896134 30,56 10,6 2002 11631657 33,8 17,22
2012 653337 27,3 9,3 2012 2123132 33,3 7,7 2012 13061239 31,9 10,2
2017 738600 26 4,7 2017 1973906 30,6 8,8 2017 13572560 29,8 10,2
Source: Zimstat Census 1992, 2002, 2012, 2017 ICDS
5.6.1.3 The Crude Birth Rate for Bulawayo has consistently been lower than that of Harare and
the nation from 1992 to 2012 Census through to the Intercensal Demographic Survey
undertaken in 2017. While a lower birth rate may be perceived in a positive light in
terms of management of population growth, it can adversely affect the future
development and growth of the city especially in terms of strengthening of the
population momentum of the city and its sustainability in the future development of the
City of Bulawayo.
Figure 2: Crude Birth, Death and Average Annual growth rate for Bulawayo and Harare
Source: 2017 ICDS

Review and Preparation of Bulawayo Master Plan (2019 – 2034) Report of Study
------------------------------------------------------------------------------------------------------------------------------
75
5.6.2 Mortality Rate 5.6.2.1 The death rate for Bulawayo reduced between 1979 and 1982 and declined at a reduced
rate between 1982 and 1984 rising again between 1985 and 1988. As from 1988, the
crude death rate for the city grew alarmingly peaking at 14 per 1000 in 2002. The spike
in the crude death rate may be due to deaths arising from the HIV/AIDS pandemic.
When the death rate began to decline after the introduction of Antiretroviral Therapy in
2004.
5.6.2.2 The high death rate can be attributed to high prevalence of HIV/AIDS across the country.
The Crude Death Rate fell from 13.9% in 2002 to 9.3 percent in 2012 with a further fall
to 4.7% in 2017. In terms of the Intercensal Demographic Survey: 2017, the Crude Death
in Bulawayo fell further by 4.6% from 9,3% in 2012 to 4,7 percent in 2017.
5.6.2.3 Figure 3 shows that the crude death rate for Bulawayo has historically been higher than
that for Harare since 1979 to 2012. The death rate for Bulawayo reduced between 1979
and 1982 and declined at a reduced rate between 1982 and 1984 rising again between
1985 and 1988. As from 1988, the crude death rate for the city grew alarmingly peaking
at 14 per 1000 in 2002. The spike in the crude death rate was due to deaths arising from
the HIV/AIDS pandemic. When the death rate began to decline after the introduction of
Antiretroviral Therapy in 2004, although it still remained higher than that of Harare.
Despite the decrease in the death rate, City of Bulawayo’s health sector faces the
challenge of ensuring that this rate declines even further. The death rate should serve as
a guide for planners to properly plan for not only medical facilities burial land uses.
5.6.2.4 HIV/AIDS had a devastating effect in the country where in Bulawayo and Harare the
death rate increased alarmingly between 1989 and 2002 where after it subsided in 2004
increasing again before falling again in 2006.

Review and Preparation of Bulawayo Master Plan (2019 – 2034) Report of Study
------------------------------------------------------------------------------------------------------------------------------
76
Figure 3: Crude death rate, Bulawayo and Harare 1979 to 2017
Source: ICDS 2017
5.6.2.5 According to the Zimbabwe Demographic and Health Survey, 2015 Bulawayo had the lowest under 5 years mortality rate of 50 deaths per 1000 live births compared to Harare’s 58 and Mashonaland’s 112 deaths per 1000 live births respectively. Child mortality was 40 per 1000, infant mortality at 40 per 1000, post neonatal mortality was 14 per 1000 and neonatal mortality was 26 per 1000 population in 2015. This is a positive reflection on the health sector achievements in lowering child mortality.
Table: 10 Early childhood mortality rates, 2015
City Neonatal mortality per 1000
Post neonatal mortality per 1000
Infant mortality per 1000
Child mortality per 1000
Under-5 mortality per 1000
Bulawayo 26 14 40 10 50
Harare 23 20 42 16 58
Source: Zimbabwe Demographic and Health Survey 2015
5.6.2.6 Anti Retroviral Therapy has had a huge impact in reducing the number of deaths in Bulawayo and other centres in the country. Despite the decrease in the death rate, City of Bulawayo’s health sector faces the challenge of ensuring that this rate declines even further. The death rate should serve as a guide for planners to properly plan for not only medical facilities but burial land uses.
5.6.3 Natural increase
5.6.3.1 The rate of natural increase in Bulawayo has gone up from a period of high in death
rates between 1992 and 2002 from which there has been an upward trend in the

Review and Preparation of Bulawayo Master Plan (2019 – 2034) Report of Study
------------------------------------------------------------------------------------------------------------------------------
77
natural increase from 1.3% in 2002 to 1.8% in 2012 with a further increase to 2.1% in
2017 during the intercensal demographic survey. What is noticeable from table 11 is
that as the natural increase went up from 2002 to 2012, the net migration was going
down during the same period. The decline in population during this period could likely
be a result of a decline in net migration than natural increase. The Intercensal
Demographic Survey 2017 shows an increase in both the Net Migration and Natural
increase. This has resulted in population growth from an annual average decline by
0.34% to 2.6 an annual average population growth of 2.68%. Should this trend be
sustained into the future, Bulawayo will see its population grow considerably meaning
that the city should have adequate plans to service the population needs.
Table: 11 Crude Birth, Crude Deaths and Natural Increase for Bulawayo, Harare and
Zimbabwe
Year Population
Crude
Birth
Rate per
1000
Crude
Death
Rate per
1000
Natural
Increase
(%)
Population
Crude Birth
Rate per
1000
Crude
Death
Rate per
1000
Natural
Increase
(%)
Population
Crude
Birth
Rate per
1000
Crude
Death
Rate per
1000
Natural
Increase
(%)
Bulawayo Harare Zimbabwe
2002 676650 26,99 13,9 1,3 1896134 30,56 10,6 2 11631657 33,8 17,22 1,3
2012 653337 27,3 9,3 1,8 2123132 33,3 7,7 2,6 13061239 31,9 10,2 2,2
2017 738600 26 4,7 2,1 1973906 30,6 8,8 2,2 13572560 29,8 10,2 2
Source: ICDS
5.6.4 Migration
5.6.4.1 Bulawayo like other provinces in the country is subject to the processes of migration
through in-migration as people coming into the city and out-migration being people
leaving the city. The movement of people occurs internally between towns, districts,
provinces, etc and across international borders. These migration types would be
assessed through net migration as a measure of either population gain or loss. In-
migration increases the population while out-migration decreases it. Table 12 below
shows migration statistics from 2002 to 2017 by way of a comparison between
Bulawayo and Harare.

Review and Preparation of Bulawayo Master Plan (2019 – 2034) Report of Study
------------------------------------------------------------------------------------------------------------------------------
78
Table 12: Interprovincial Migration Province Population Born and
Residing
in
Province
Born in
Province
In-
migration
Out
Migration
Net
Migration
In-migration
Rate %/1000
Out-
migration
Rate % /1000
Net-
migration
Rate
%/1000
2002 Census
Bulawayo 664973 328008 539466 336965 211458 125507 50,67 (507) 39,2 (392) 23,27 (233)
Harare 1826075 868136 1430422 957939 562286 395653 52,46 (525) 39,31 (393) 27,66 (277)
2012 Census
Bulawayo 652592 332103 547745 320489 215642 104847 49,1 (491) 39,4 (394) 19,1 (191)
Harare 2050699 1040864 1695303 1009835 654439 355396 49,2 (492) 38,6 (386) 21 (210)
2017 Intercensal Demographic Survey
Bulawayo 738600 366 658 552 962 336 218 186 304 149 914 47,8 (478)* 26,5 (265)* 21,3 (213)
Harare 1973906 995 547 1 791 721 974 358 796 174 178 184 49,5 (495)* 40,4 (404)* 0.09 ( 90)
Source: ZIMSTATS
5.6.5 In-migration and Out-migration
5.6.5.1 In-migration
5.6.5.1.1Bulawayo had about half (50%) of its population as immigrants at 507 per 1000 people
in 2002, decreasing to 491 per 1000 people in 2012 and further down to 478 per 1000
people in 2017 as shown on Table 12 above and Figure 4 below. This had the effect of a
decline in population growth especially in a scenario where in-migration was declining
and out-migration was increasing between 2002 and 2012 resulting in a decline in net
migration from 233 to 191 per 1000 between the respective censuses. The same trend is
noticeable in Harare between 2002 and 2017. In 2012 Bulawayo and Harare had high in-
migration rates of 491 and 492 per 1000 people. By 2017 Bulawayo and Harare
maintained high levels of in-migration save that while Harare’s in-migration rate rose,
Bulawayo saw a decline in in-migration rate from 491 to 478 per 1000 between 2002
and 2012 respectively. It would be noted that although Bulawayo experienced a decline
in the in-migration rate, it had the highest net migration rate at 213 per 1000 in 2017
compared to Harare’s 90 per 1000 during the same period.

Review and Preparation of Bulawayo Master Plan (2019 – 2034) Report of Study
------------------------------------------------------------------------------------------------------------------------------
79
Figure: 4 Bulawayo In migration and Out migration 2002, 2012 & 2017
Source: ZIMSTATS 2002, 2012 & ICDS 2017
5.6.5.1.2 On the other hand, Bulawayo is a major urban centre in the south western region of
the country and it still possesses a huge population pull force in the region due to an
array of opportunities it offers to people. These high levels of immigration put pressure
on the service delivery mandates of the city and therefore calls for various sectors to
gear up and have appropriate plans in place to cater for the needs of a growing
population.
5.6.5.2 Out-migration
5.6.5.2.1 On the other hand, out-migration has marginally changed in Bulawayo during the
intercensal periods 2002 to 2012. Out-migration increased from 392 per 1000 in 2002 to
394 per 1000 in 2012. As a result of a decline in the in-migration rate and an increase in
the out-migration, the resultant effect has been a decline in the rate of net migration.
This could be a contributory factor in the decline of the city’s population between 2002
and 2012 without discounting the effect of fertility and mortality and natural increase in
the city’s population decline during the same period. Out-migration decreased
significantly from 394 to 265 people per 1000 during a period when in-migration
increased to 478 per 1000 between 2012 and 2017. Put differently, Bulawayo is on an
immigration-induced population.

Review and Preparation of Bulawayo Master Plan (2019 – 2034) Report of Study
------------------------------------------------------------------------------------------------------------------------------
80
Figure: 5 Migration Rates between Bulawayo and Harare & Net Migration per 1 000
Source: ICDS 2017
5.6.5.3 Net migration
5.6.5.3.1 Net migration in Bulawayo decreased from 23.27% (233 per 1000) in 2002 to 19.1%
(191 per 1000) in 2012. This translates to a decline in net migration from 125 507 people
in 2002 to 104 847 people in 2012. However, this was a positive net migration rate
meaning that there were more people coming into the city than those leaving despite
the decline referred to above. In 2017, as shown on table 13 below, Bulawayo had the
highest net migration of 213 per 1000 while the rest of the provinces had lower net
migration rates or negative net migration where the number of people leaving the
province was higher than those entering.
Table 13: Inter-Provincial Lifetime Migration Proportion Matrix, Zimbabwe ICDS 2017
Province of Usual
Residence
De jure
Population
Born and
residing in
Province
Born in
Province
In
Migration
Out
Migration
Net
Migration
In
migration
Rate/1000
Out
migration
Rate/1000
Net
migration
Rate/1000
Bulawayo 702 876 366 658 552 962 336 218 186 304 149 914 478.3 265.1 213.3
Manicaland 1 897 563 1 369 553 2 101 891 528 010 732 338 -204 328 278.3 385.9 -107.7
Mashonaland
Central
1 455 856 961 182 1 449 104 494 674 487 922 6 752 339.8 335.1 4.6
Mashonaland East 1 337 984 761 429 1 310 078 576 555 548 649 27 906 430.9 410.1 20.9
Mashonaland West 1 556 807 969 758 1 494 885 587 049 525 127 61 922 377.1 337.3 39.8

Review and Preparation of Bulawayo Master Plan (2019 – 2034) Report of Study
------------------------------------------------------------------------------------------------------------------------------
81
Matabeleland
North
756 649 551 940 800 340 204 709 248 400 -43 691 270.5 328.3 -57.7
Matabeleland
South
807 221 551 827 801 930 255 394 250 103 5 291 316.4 309.8 6.6
Midlands 1 519 324 927 771 1 521 698 591 553 593 927 -2 374 389.4 390.9 -1.6
Masvingo 1 524 399 1 050 046 1 703 975 474 353 653 929 -179 576 311.2 429.0 -117.8
Harare 1 969 905 995 547 1 791 721 974 358 796 174 178 184 495 404.2 90.5
Total 13 528 584 8 505 711 13 528 584 5 022 873 5 022 873 0
Source: ICDS
5.7 POPULATION SIZE AND GROWTH
5.7.1 The analysis now focuses on understanding population in terms of its size, distribution,
growth and trends over time and the three key population factors, namely: fertility,
mortality and migration as presented above. The rate at which the population grows has
implications for city development, employment and the provision of services such as
infrastructure, housing, the environment and socio-economic development for a
country, its regions and impacts beyond its territorial space.
5.7.2 The City of Bulawayo’s population grew from 236 320 in 1962 to in 495 317 in 1982, 620
935 in 1992, 676 650 in (2002), 653 337 in 2012 and 738 600 in 2017 as shown on table
14 and graphically on figure 6 below. A trend analysis of the population growth in the
City of Bulawayo between 1962 census and the intercensal demographic survey of 2017
is shown on Figure 6. The population had a somewhat low annual average growth rate
of 1.74% between 1962 and 1969. The period 1965 to 1979 is evidently below an
established trend (i.e. population growth is below the trend line). This is a period before
independence and its attendant colonial restraints on movement of black people. There
were low rates of rural to urban migration by the black majority population who were
largely confined to the countryside. There is however, a considerable increase in
population between 1970 and 1979 as people moved to urban areas as the war of
liberation intensified although it was still below the noticeable growth trend which
peaked at a phenomenally high annual average growth rate of 8.43 percent.

Review and Preparation of Bulawayo Master Plan (2019 – 2034) Report of Study
------------------------------------------------------------------------------------------------------------------------------
82
Figure 6: Bulawayo’ average annual growth rate 1962 to 2017
[]; []; []
Annual Average Growth Rate (%); []; []
[]; []; []
[]; []; []
[]; []; []
[]; []; []
Projected: []; []
2012, 6533372002, 676650
1992, 620935
1982, 495317
1969, 236320
1962, 210600
0
100000
200000
300000
400000
500000
600000
700000
800000
-1
0
1
2
3
4
5
6
7
8
9
1950 1960 1970 1980 1990 2000 2010 2020
Po
pu
lati
on
(0
00
s) p
er
Ce
nsu
s Y
ear
Census Year and Average Annual Growth RateAxis Title
Annual Average Growth Rate (%) Population Poly. (Population)
Source: ZIMSTATS & ICDS
5.7.3 The effect has been that while the City of Bulawayo’s population grew at an annual
average growth rate of 2,68 percent in 2017, Harare experienced a 0,7 percent decline
in the annual average growth rate by 2017 while the country grew marginally at 0,39
percent. This may be attributed to improved healthcare, family planning or a decrease in
the prevalence of HIV/AIDS.

Review and Preparation of Bulawayo Master Plan (2019 – 2034) Report of Study
------------------------------------------------------------------------------------------------------------------------------
83
Table 14: Population Size and Growth Rates: Bulawayo, Harare and Zimbabwe
Bulawayo Harare Zimbabwe
Year Total
Population
Crude
Birth
Rate per
1000
Crude
Death
Rate per
1000
Annual
Average
Growth
Rate (%)
Growth Year Total
Population
Crude
Birth
Rate
per
1000
Crude
Death
Rate per
1000
Annual
Average
Growth
Rate (%)
Growth Year Total
Population
Crude
Birth Rate
per 1000
Crude
Death Rate
per 1000
Annual
Average
Growth
Rate (%)
Growth
1992 620935 33,9 7 2,54 125618 1992 1478810 32,99 6,52 1992 10412548 36 10,6
2002 676650 26,99 13,9 0,9 55715 2002 1896134 30,56 10,6 2,82 417324 2002 11631657 33,8 17,22 1,17 1219109
2012 653337 27,3 9,3 -0,34 -23313 2012 2123132 33,3 7,7 1,2 226998 2012 13061239 31,9 10,2 1,22 1429582
2017 738600 26 4,7 2,68 87715 2017 1973906 30,6 8,8 -0,7 -149226 2017 13572560 29,8 10,2 0,39 511321
Source : Zimstat Census 1992, 2002, 2012, 2017 ICDS

Review and Preparation of Bulawayo Master Plan (2019 – 2034) Report of Study
------------------------------------------------------------------------------------------------------------------------------
84
5.8. POPULATION GROWTH AT A DECREASING RATE BETWEEN 1982 AND 2002 CENSUSES
5.8.1.1 The 1982 Census revealed that the population of Bulawayo had doubled from 236 320
in 1969 to 495 317 in 1982 (i.e. over 13 years). The cessation of the war in the
transitional independence in 1979 saw population growing above the established trend
with the annual average growth rate peaking at a high of 8.43% in 1982.
5.8.1.2 Population growth in the city post-independence may be termed an independence-
induced population momentum which unlike the effects of high fertility (during baby
booms) was however, not sustained over several decades. This would be discernible on
figure 6 where unlike the high annual average growth rate of 8.43% in 1982 (495 317
people), the population grew to 620 935 in 1992 at a declining annual average growth
rate of 2.54%. This was a period when HIV/AIDS ravaged the country resulting in
increased mortality and population decline. The City of Bulawayo’s population further
grew to 676 650 in 2002 albeit at a further declining annual average growth rate of
0.9%. On the other hand, Harare’s population grew at a higher annual average growth
rate of 2.82% between 1992 and 2002. Meanwhile the country’s population grew at an
annual average growth rate of 1.17% during the same period.
5.8.2 Population Decline between 2002 and 2012 Censuses
5.8.2.1 The 2012 Census revealed that the City of Bulawayo continued to experience further
decline in population at an average annual rate of 0.34% decreasing from 676 650 in
2002 to 653 337 in 2012. The population decreased by 23 313 people. As would be seen
from table 14, the City of Harare also witnessed a decline in annual average growth rate
from 2.82% between 1992 and 2002 to 1.2% between 2002 and 2012. This decline was
also slightly felt nationally at 1.22% (2002 to 2012) down from 1.17% during the
preceding intercensal decade 1992 to 2002. As a result Harare and the country at large
experienced growth in the population even though at a declining rate. The Bulawayo
situation is different in that it did not experience growth but a decline in population by
23 313 people. 5.8.3 The Bulawayo Population Decline Debate Explored
5.8.3.1 The publication of the 2012 Census results has been accompanied by consternation,
dissatisfaction and debate on the results. The City of Bulawayo disputed the 2012
Census results and has based its argument through the application of the Housing Unit
method as according to the local planning authority, it has the statistics to back its case.

Review and Preparation of Bulawayo Master Plan (2019 – 2034) Report of Study
------------------------------------------------------------------------------------------------------------------------------
85
The housing unit method is premised on the fact that almost everyone lives in some
type of housing structure, be it a single family residential unit, an apartment, a mobile
home, a college campus accommodation, or a prison. This method is equally reliable but
depends on sound and reliable information being used.
5.8.3.2 Zimstat projected based on the 2012 census that Bulawayo would have a population of
728 680 people using the high population growth scenario. They estimate instead that
the population grew to 738 600 in 2017. Zimstat indicates that Bulawayo had the
highest net-migration of 213.3 people per thousand in 2017 and an annual average
growth rate of 2.68 percent per annum. The municipality used an average household
size of 6 people per household in 2012. According to Zimstat there were 165 345 and 184
692 households in the city in 2012 and 2017 respectively. If one were to adopt an
intermediate average household size between the Zimstats figure and Bulawayo City
Council, an average household size of 5 would yield an estimated 826 725 people in
2012 and 923 460 people in 2017. The difficulty however, is that an average household
size of 5 would be the highest in the country excluding that of provinces with a higher
rural population composition.
5.9 HOUSEHOLD CHARACTERISTICS 5.9.1 Number of Households
5.9.1.1 Table 15 below shows that Bulawayo had 165 124 households in 2002. The number
grew by an incredibly low number of 221 households between 2002 and 2012. There
was an upsurge in the number of households with a massive growth by 19 347
households between 2012 and 2017. It has been noted under the migration section that
Bulawayo had the highest net-migration rate between 2012 and the Intercensal
Demographic Survey of 2017. The marginal increase in the number of households
coupled by a decline in the population between 2002 and 2012 has been a bone of
contention between Bulawayo City Council and Zimstats. The low number of people
enumerated in 2002 and 2012 has contributed to a negative growth in the population of
the city such that it is beginning to grow after a low growth period.
Table 15: Population and Households, Bulawayo, Harare and Nationally
Population No. of Households Average Household Size
Bulawayo
2002 676650 165124 4,06
2012 653337 165345 3,9
2017 738600 184 692 4

Review and Preparation of Bulawayo Master Plan (2019 – 2034) Report of Study
------------------------------------------------------------------------------------------------------------------------------
86
Harare
2002 1896134 491002 3,82
2012 2123132 534106 3,9
2017 1973906 530668 3,7
Zimbabwe
2002 11631657 2649921 4,35
2012 13061239 3059016 4,2
2017 13572560 3255463 4,2
Source: ZIMSTATS 2002, 2012 & ICDS 2017
5.9.1.2 Bulawayo’s average household size has remained at about 4 people per household since
2002. This is consistent with the national scenario save that the average household size
was higher in provinces with a larger rural population component.
5.9.1.3 The housing unit method is used as a method of estimating the population for an area
but it must be accompanied by a determination of the average household size otherwise
the population estimate becomes inaccurate. The fact that new suburbs have been
developed and occupied cannot be simplistically advanced as an indicator that the
population has increased. If there was an element of natural increase or a positive net-
migration that would be justification for a population increase otherwise it can be
argued that occupiers of new housing sites are part of the enumerated population
either as lodgers or accommodated through other various forms of housing tenure such
as living with relatives.
5.9.2 Average Household Size
5.9.2.1 The average household size for Bulawayo in 2017 was 4 persons per household. This is
only an average meaning that there are some households with more than 4 people and
some with less. It should be emphasized that the ICDS OF 2017 was not a fully-fledged
census and that the full population census would emerge after the 2022 census. If one
were to adopt an intermediate household size between the Zimstats figure and that of
the Bulawayo City Council, an average household size of 5 would yield 923 460 people in
2017 based on 184 682 households in 2017. The problem with this average household of
5 is that the housing population register for the Bulawayo City council is not based on a
scientifically undertaken exercise.

Review and Preparation of Bulawayo Master Plan (2019 – 2034) Report of Study
------------------------------------------------------------------------------------------------------------------------------
87
CHAPTER 6 THE LOCAL ECONOMY
6.1 INTRODUCTION
6.1.1 Bulawayo’s economic region mainly consists of the South Western region namely the
Matabeleland regions and part of the midlands regions and Masvingo. Historically the economy of this region has been heavily dominated by the mining and beef industries which depended on Bulawayo for inputs, services and marketing. More recently tourism has become a major local industry. Poverty within the region has been one of the factors limiting the growth of the city and preventing the city realizing its true potential.
6.2 BULAWAYO’S LOCAL ECONOMY
6.2.1 Bulawayo is an important industrial, commercial, administrative and cultural centre. The
city has enjoyed these functions from the outset. After the Second World war, Bulawayo’s economy enjoyed a period of boom and new industrial areas were developed. The city has traditionally been the industrial hub of the country with textile, tyre manufacturing, food processing, leather industries, heavy and light engineering concerns, to name a few. Notable industries were the Zimbabwe Engineering Company (ZECO), G & D, Radar Metal Industries, National Blankets, Merlin, Treger, Hunyani and the Cold Storage Commission. In addition there are many commercial enterprises, formal sector employment in the public sector and arable agriculture. The economic base and structure of Bulawayo cannot be described as strong at the moment but the city has all the potentials of transforming into a viable economy.
6.2.2 As a result of Unilateral Declaration of Independence (UDI) in 1965, there was another
economic boom as the imposition of international sanctions fueled the creation of further manufacturing industries as a means of import substitution. The maintenance of a protective environment for industry between 1965 and 1990 helped to maintain a high level of employment in manufacturing but reduced competitiveness. The introduction of the Economic Structural Adjustment Programme (ESAP) in 1991 and the opening up of cheap imports especially from South Africa and Asia exposed many industries in the city to a harsh climate. Since then the manufacturing sector has continued to struggle and those factories and concerns that have survived have done so with a reduced labour force. Due to its links with South Africa and Botswana cross border trade and informal sector activities constitute one of the most common sources of livelihood.

Review and Preparation of Bulawayo Master Plan (2019 – 2034) Report of Study
------------------------------------------------------------------------------------------------------------------------------
88
6.3 THE CURRENT STATE OF BULAWAYO’S FORMAL ECONOMY
6.3.1 The lack of recent data for Bulawayo on employment, output and value by different
sectors of the economy hampers detailed analysis of the current state of the economy. Similarly, lack of comparative data across the country also makes it difficult to perceive the strengths and weaknesses of the local economy. The most recent data used for the Study is the Zimsts report of 2012. As would be expected there are a number of differences between the local economy of Bulawayo and the national economy. For example agriculture is the dominant national economic sector while manufacturing dominates Bulawayo’s economy. Distribution, transport and communication are noticeable locally and nationally. While more recent figures may alter some weightings in some sectors the overall picture will remain the same. The employment structure of the peri – urban will not alter the overall picture a lot as the numbers involved are small. In addition, a large number of the economically active within the peri-urban will travel to work in Bulawayo and be included as part of Bulawayo’s employment figures.
6.3.2 The socio-economics of Bulawayo are inevitably influenced by the City’s periphery which is characterised by vibrant cattle ranching interests together with other agricultural activities such as horticulture (vegetable, flowers production, etc.,) and general crop production (maize, sorghum, wheat, cotton, paprika, etc.,). Bulawayo is also surrounded by gold mines of varying sizes and natural ecosystem goods of interest such as forestry, rivers, lakes, dams, the Matopos hills and wildlife sanctuaries.
6.4 ECONOMIC ACTIVITIES, ECONOMIC GROWTH PATTERNS AND ECONOMIC INDICATORS, LABOUR FORCE, EMPOYMENT, UNEMPLOYMENT AND POVERTY
6.4.1 There are various types of economic and socio – economic activities in Bulawayo. Within
the respective service providers such as commercial and industrial specialization has increased. For example, within the retailing sector there has been an expansion from simple general dealers to supermarkets and chain stores. The banking sector is a notable feature within the financial landscape. Manufacturing has slowly crept in and the hospitality industry has become visible in the form of lodges and guest houses while heavy industry has declined. However the informal sector has rapidly established itself in the city due to a failure of the formal sector to absorb potential employees. However, there are many implications of the above scenarios. First, there is a strong potential for further economic development as supportive services exist. The presence of many small entreprises, especially in the retail sector risks overtrading. In addition the establishment of retail giants who enjoy economies of scale and back up capital, poses a further threat to the survival of smaller businesses especially those which are indigenous owned. Finally the informal sector has become a vibrant economic activity and has provided an avenue for self reliance, employment creation, poverty eradication and may serve as a potential tax base.

Review and Preparation of Bulawayo Master Plan (2019 – 2034) Report of Study
------------------------------------------------------------------------------------------------------------------------------
89
6.4.2 Bulawayo is strategically located in the region to attract investment through strategic campaigns for the establishment of industries which include beverages, livestock, vegetables, clothing and textiles, shoe manufacturing, solar energy technology. The existing irrigation schemes in the hinterland are assisting in the supply of vegetable produce to the wholesale markets.
6.5 CURRENT ECONOMIC ACTIVITIES AND EMPLOYMENT PATTERNS
6.5.1 Most of the cash income of the residents is derived from employment, pensions, rent,
the informal sector and remittances from the diaspora. This is applicable to both male and female headed households. Although remittances constitute an important source of income for the residents, work related sources and investments are important means of social security. Money from farming and fishing is a main source of income for Zimbabweans (29%) while every 4th Zimbabwean (25%) relies on money from others (household members or remittances) and only 18% receive a regular salary.3 As a result in an effort to improve the economic framework work related strategies should be given priority in future planning efforts.
6.6 EMPLOYMENT
6.6.1 Employment is the state of having paid work. It signifies the state of anyone who is
doing what, under the circumstances, he most wants to do. The employment rate is one
of the economic indicators that economists examine to help understand the state of the
economy.
6.6.2 Tables 16 and Figure 7 present statistics on employment and unemployment in
Bulawayo and the country from 2002 and 2017. These statistics relate to the
economically active population 15 to 64 years. The statistics from Zimstat have been
collated as per their standard guidelines where work is not defined in terms of quality
and this subsequently affects what is perceived as unemployment. The table shows high
rates of employment in Bulawayo between 2012 and 2017 being 74.1% in 2002
declining slightly in 2012 at 72.6% with an increase to 78.7% in 2017. The employment
rate been successively lower than Harare and the country in general where Bulawayo
had 78.7 % employment in 2017 while Harare and Zimbabwe had 83.6% and 93.4%
respectively.

Review and Preparation of Bulawayo Master Plan (2019 – 2034) Report of Study
------------------------------------------------------------------------------------------------------------------------------
90
Table 16: Employment and Unemployment as a percentage of the Total Economically Active
Census Year
Total Economically Active Unemployed Employed
Unemployment Rate (%)
Employment Rate (%)
Bulawayo
2002 282787 71524 211263 25,29 74,1
2012 261188 71491 189697 27,37 72,63
2017 288659 61618 227041 21,3 78,7
Harare
2002 831698 150664 681034 18,12 81,88
2012 898925 153218 745707 17 82,96
2017 757688 127145 630543 16,4 83,6
Zimbabwe
2002 4839511 560288 4279223 11,58 88,42
2012 5120540 153218 4967322 11,1 88,9
2017 5611809 371244 5240565 6,6 93,4
Source: ZIMSTATS 2002, 2012 & ICDS 2017
6.7 UNEMPLOYMENT
6.7.1 Zimstats defines unemployment a “situation where the supply of labour exceeds the
demand”. It further describes the unemployed as those who had done no work and
were looking for work and were available for work. The International Labour
Organisation defines unemployment as those who are: out of work, want a job, have
actively sought work in the previous four weeks and are available to start work within
the next fortnight; or out of work and have accepted a job that they are waiting to start
in the next fortnight.
6.7.2 The unemployment rate is number of unemployed people actively looking for
employment as a percentage of the labour force (15 to 64 years old). It can be
alternatively defined as a situation where those in the labour force are available and
actively looking for employment, jobs or work but cannot find jobs. The standard
definition of unemployment that it requires that a person is simultaneously without
work, is currently available for work, and actively seeking work
6.7.3 A further analysis of employment and unemployment of the economically active age
group, is made based on the 2012 Census (ICDS 2017 information not available by age
group). It shows that regardless of the fact that there was a high rate of employment
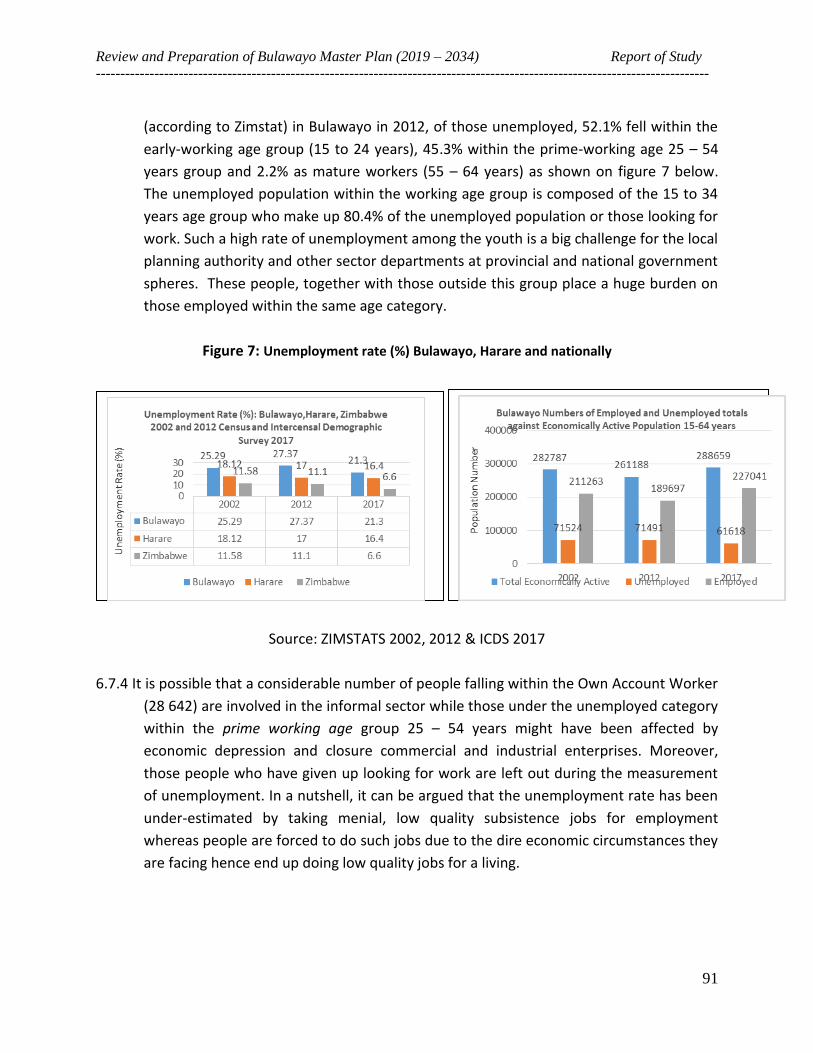
Review and Preparation of Bulawayo Master Plan (2019 – 2034) Report of Study
------------------------------------------------------------------------------------------------------------------------------
91
(according to Zimstat) in Bulawayo in 2012, of those unemployed, 52.1% fell within the
early-working age group (15 to 24 years), 45.3% within the prime-working age 25 – 54
years group and 2.2% as mature workers (55 – 64 years) as shown on figure 7 below.
The unemployed population within the working age group is composed of the 15 to 34
years age group who make up 80.4% of the unemployed population or those looking for
work. Such a high rate of unemployment among the youth is a big challenge for the local
planning authority and other sector departments at provincial and national government
spheres. These people, together with those outside this group place a huge burden on
those employed within the same age category.
Figure 7: Unemployment rate (%) Bulawayo, Harare and nationally
Source: ZIMSTATS 2002, 2012 & ICDS 2017
6.7.4 It is possible that a considerable number of people falling within the Own Account Worker
(28 642) are involved in the informal sector while those under the unemployed category
within the prime working age group 25 – 54 years might have been affected by
economic depression and closure commercial and industrial enterprises. Moreover,
those people who have given up looking for work are left out during the measurement
of unemployment. In a nutshell, it can be argued that the unemployment rate has been
under-estimated by taking menial, low quality subsistence jobs for employment
whereas people are forced to do such jobs due to the dire economic circumstances they
are facing hence end up doing low quality jobs for a living.

Review and Preparation of Bulawayo Master Plan (2019 – 2034) Report of Study
------------------------------------------------------------------------------------------------------------------------------
92
Figure 8: Unemployment Rate, Bulawayo, Harare & Zimbabwe
Source: Census 2002, 2012 & ICDS 2017
6.7.5 Putting these figures differently, Zimstats indicates that Bulawayo had a fairly low rate of
unemployment with about a quarter of the people (27.4%) within the economically
active population were unemployed. The unemployment rate further fell to 21.3% in
2017. The prevailing view on unemployment in the country including Bulawayo is that it
has been trending at high levels contrary to the views from Zimstats. What is consistent
on the subject of employment and unemployment in Bulawayo from the 2002 to 2012
censuses and 2017 ICDS is that consistently, Bulawayo had the lowest rate of
employment but rated conversely highest on unemployment compared to Harare and
the country in general as shown on figures 7and 8.
6.7.6 Zimstats has over the years projected statistics on employment and unemployment as
high for the former and low for the latter. This has generated intense debate as citizens
and analysts “see” evidence of low employment and high unemployment in Bulawayo
through closed industries and related commercial enterprises. The loss of Bulawayo’s
status as an industrial economic hub gives credence to the notion that the closure of
industries gave rise to unemployment.
6.7.7 The notion that there is a high rate of employment is not only misleading but is
dangerous and is not be of assistance in drawing attention to the dire state of the local

Review and Preparation of Bulawayo Master Plan (2019 – 2034) Report of Study
------------------------------------------------------------------------------------------------------------------------------
93
economy. It has a tendency diverting the attention decision-makers, politicians, planners
at the local authority, sector departments, the private sector and the communities at
large towards away from formulating adequate plans and development initiatives to
rescue the city from further collapse. However, the statistics on employment and
unemployment are glaringly tangent to the evident problem of unemployment in the
city. The problem with inaccurate statistics is that they adversely affect planning at local
level and allocation of resources from the national fiscus throughout the plan period.
6.7.8 As at 2012, the city had 261 188 economically active people of which 189 697 were employed and 71 491 were unemployed. Of the total employed persons 58% were males and 42% were females. This emphasises the fact that more males were economically active than females in the city. Table 17 below shows the gender occupational stratification of men and women
Table 17: Current Occupation by Gender – 2012
Occupation Male Female Total Percentage Dominant Gender
Gvt and Snr Officials 196 152 348 0.2 Male
Directors/Mgrs & Co Secretaries
3 315 1 650 4 965 2.6 Male
Natural Science 77 30 107 0.1 Male
Business & Finance 8 145 6 579 14 724 7.8 Male
Engineers & Technicians 3 801 321 4 122 2.2 Male
Life Science Professionals 1 386 2 655 4 041 2.1 Female
Education 3 885 7 577 11 462 6.0 Female
Law and Security 9 668 2 112 11 780 6.2 Male
Information 132 128 260 0.1 Male
Social Science 203 248 451 0.2 Female
Artists 1 621 722 2 343 1.2 Male
Religion 808 218 1 026 0.5 Male
Machine Operators 2 180 197 2 377 1.3 Male
Administration 1 061 1 055 2 116 1.1 Male
Clerks & Secretaries 4 007 5 077 9 048 4.8 Female
Transport 10 987 383 11 370 6.0 Male
Services 22 256 37 653 59 909 31.6 Female
Agriculture 1 742 1 044 2 786 1.5 Male
Mining & Construction 10 748 332 11 080 5.8 Male
Mechanics 6 871 193 7 064 3.7 Male
Manufacturing 7 303 4 120 11 423 6.0 Male
Others 2 641 495 3 136 1.7 Male
Not Stated 7 675 6 048 13 723 7.2 Male

Review and Preparation of Bulawayo Master Plan (2019 – 2034) Report of Study
------------------------------------------------------------------------------------------------------------------------------
94
Total 110 708 78 989 189 697 100
Source: Zimstats 2012
6.8 REMITTANCES
6.8.1 Zimbabwe has experienced massive out migration from year 2 000 to 2008 due to
economic problems faced in the country. The people who emigrated are now living in the “diaspora” and send money back home. Remittances have become an important source of income for people in the urban and rural areas. Table 18 below shows the total amount of remittances to Zimbabwe from about amounted to US$ 319.0 million per year. Households residing in urban areas receive the largest share of remittances from abroad amounting to US$ 252.9 million which constitutes 79.3% of the total remittances while rural areas receive US$ 66.2 million which constitutes 20.7% of the total remittances.
Table 16: Average and Total Annual Remittances from Abroad received by Households by Province, Rural and Urban Areas
Province Average Total %
Harare 3 269 115 661 594 36.3
Bulawayo 2 376 73 202 975 23.0
Manicaland 1 256 13 452 512 4.2
Mashonaland Central 2 686 11 785 908 3.7
Mashonaland East 1 590 11 203 656 3.5
Mashonaland West 1 955 16 183 956 5.1
Matabeleland North 1 158 8 612 518 2.7
Matabeleland South 2 004 15 581 812 4.9
Midlands 1 996 26 981 866 8.5
Masvingo 1 729 26 355 009 8.3
2 269 319 021 814 100.0
Source: Poverty Income Consumption and Expenditure Survey 2011/12
6.9 TYPE OF ECONOMIC ACTIVITIES
6.9.1 The economic profile of Bulawayo is skewed and is dominated by wholesaling or
retailing and the public sector which constitutes of public administration, education, health and social work, community and the NGO sector. Most of the activities are classified as non basic service activities which do not generate growth. As a result the productive sector such as manufacturing, mining and construction need to be expanded. From the table above gender inequalities are apparent in the way employment figures are distributed between man and women. For example women dominate the service sectors in the education sector, secretarial services while men take up the more lucrative primary activities such as management positions in public administration, directorship, law and security as well as mining and construction. Although these

Review and Preparation of Bulawayo Master Plan (2019 – 2034) Report of Study
------------------------------------------------------------------------------------------------------------------------------
95
patterns reflect socio – cultural divisions of labour based on stereotypes, they do translate into serious inequalities in incomes between men and women. In an effort to achieve equitable development, women and girls need to be encouraged to take up training courses and skills that will enable them to participate on an equal footing as their male counterparts.
6.10 ECONOMIC ACTIVITY
6.10.1 There were 261 188 economically active people in the city as at 2012. The majority of people who are economically active are paid employees. Table 19 below summarise the disadvantaged position in which women find themselves economically. This translates to their ability to have access to goods and services which impinges on their quality of life. In summary, men dominate in the employment sector while women do so in unpaid family worker and looking for employment/unemployed. Activity and labour force focused on the population age at least 15 years and these constituted 66 percent of the total population. Out of these, around 60 percent were in the labour force. The proportion of those in the labour force who were unemployed was about 28 percent. Almost 1 percent of children age 10-14 years were economically active. The proportions of those not in the labour force who were students was 39 percent, homemakers 42 percent, and retired/sick/too old 14 percent. Out of those who were employed, the highest proportions (32 percent) were engaged in services related occupations, followed by Business and Finance (8 percent).
Table 19: Economic Activity by Gender – 2012
Sex Paid Employee
Employer Own Account worker
Unpaid family worker
Looking for work/unemployed
Total
Male 79 539 1 461 28 642 1 066 35 101 145 809
Female 48 143 633 28 519 1 694 36 390 115 379
Total 127 682 2 094 57 161 2 760 71 491 261 188
Source: Zimstat 2012 6.10.2 The leading non economic activities are those of student and unpaid family worker
respectively. Paid employee is dominated by males which may be attributed to their comparative qualification advantage into the labour market. However, this is interesting as according to the 2012 Housing and population census women constitute the majority of people who have the highest level of qualifications from secondary school and above.
6.10.3 The majority of people in the unpaid family category are females. The implication is that
they are engaged in invisible activities in the domestic, reproductive and productive spheres that are normally underrated socio-culturally despite their contribution to household and national development.

Review and Preparation of Bulawayo Master Plan (2019 – 2034) Report of Study
------------------------------------------------------------------------------------------------------------------------------
96
6.11 THE INFORMAL SECTOR
6.11.1 It is now part of a common discourse in Zimbabwe in general and in Bulawayo in
particular that formal employment has been replaced by a high degree of informality.
Bulawayo streets in the Central Business District, Regional Centres, Community Centres,
neighbourhood centres convenience shops, are teeming with informal
merchandising/trading in food, clothing, airtime, artefacts, etc. This is informal work and
is better pronounced as such and should not be clouded as employment without
qualifying or classifying it explicitly as informal employment. The classification of
informal work as part of work the mainstream is a highly contested matter and one is of
the view that informal work is more meaningful as work if it plays a complementary role
to formal work towards the developmental path of the city. Malte Luebker (2008) notes
that labour statisticians in Zimbabwe likely have a different understanding from an
ordinary Zimbabwean, who may be engaged in some form of work consider themselves
unemployed as they do not have a proper job. In carrying out its work, Zimstats’
mandate is not to differentiate between the perceptions of good and bad jobs, and
treats all those who work as employed.
6.11.2 Some of the facts to back up the argument that in fact the city experienced a high
unemployment rate contrary to Zimstat statistics are the following:
▪ It is a fact that the country has witnessed an economic depression and
economic collapse since 2002 to date;
▪ Bulawayo has not been immune from economic depression and
economic collapse since 2002 a case in point being the closure of several
industrial and commercial enterprises at the main economic zones in the
city;
▪ Industries have relocated to other parts of the country and to
neighbouring countries and workers have lost jobs;
▪ The upsurge in informal trading is an indicator of loss or unavailability of
jobs in the formal sector hence;
▪ Some graduates from high school and tertiary institutions are
unemployed and at best are doing menial work;
6.11.3 The fact that more than 80 000 people are unemployed does not mean that such people are idle and undertaking no form of economic activity. Bulawayo has seen a proliferation of informal sector activities since the introduction of the Economic Structural Adjustment Programme (ESAP) and the numbers of people in this sector is

Review and Preparation of Bulawayo Master Plan (2019 – 2034) Report of Study
------------------------------------------------------------------------------------------------------------------------------
97
increasing at all times. Until such time that the formal economy gains momentum and begins to create formal employment the number of people who are engaged in this sector will continue to grow as people make efforts to survive.
6.11.4 The number of people involved in the informal sector has not been systematically
recorded. However, given that welfare payments are either non existent or very low and most of the people who are gainfully employed have low salaries as they earn less than $ 200 per month has resulted in them engaging in some form of informal sector economic activities in order to survive. Table 20 below shows the number of people employed in the informal sector by Province.
Table 20: Number of people employed in the Informal Sector by Sex and Province
Province Male Female Total
Harare 114 731 93 919 208 649
Bulawayo 35 195 43 301 78 496
Manicaland 297 873 394 773 692 646
Mashonaland Central 209 373 218 286 427 659
Mashonaland East 160 923 199 925 360 849
Mashonaland West 208 598 213 769 422 367
Matabeleland North 100 580 127 944 228 525
Matabeleland South 117 487 145 979 263 466
Midlands 253 785 301 719 555 504
Masvingo 198 149 302 038 500 187
Total 1 696 695 2 041 653 3 738 348
Source: Poverty Income Consumption and Expenditure Survey 2011/12 Report
From the table above, there are more females 54.6% than males 45.4% who are employed in the informal sector. The same pattern is observed across provinces except for Harare where there are 55% males compared to 45% females who are employed in the informal sector. Masvingo has the highest number of females employed in the informal sector compared to other provinces.
6.11.5 The Informal sector has become a major economic activity in the city. The activities encompass legal and illegal trading activities. The major informal sector activities are characterised by inter-alia vending, sale of clothes, home industry, informal money changing and transport services. The location of informal sector activities is largely influenced by the nature of the activity. For example trading requires locations near to where people congregate in large numbers so as to provide optimum opportunities to generate income while manufacturing requires more space which is secure. Service industries are found almost everywhere from a residential house to a pavement in the city centre.
Review and Preparation of Bulawayo Master Plan (2019 – 2034) Report of Study
------------------------------------------------------------------------------------------------------------------------------
98
6.11.6 The growth in haphazard street selling has resulted in the city centre finding suitable locations for informal sector traders. Bays have been designated along some streets especially 5th Avenue, Lobengula pedestrian mall and near Highlanders club house where informal traders may sell their wares from at a small fee. Provision has also been made for informal sector traders especially those who sell 2nd hand clothes to sell near the revenue hall during weekends and public holidays. In addition to street trading a number of sites have also been designated for flea market areas, most of which are privately owned.
6.12 POVERTY AND POVERTY ALLEVIATION PROGRAMMES
6.12.1 As in other parts of the country and cities, poverty levels in Bulawayo are considered high in Bulawayo when it is realized that the unemployment rate is 28. Out of a total labour force of 261 188 more than 25% of the economically active is unemployed. This means that this percentage of the labour force is without any steady or regular source of income which in itself is a sign of poverty. With 28% of the labour force unemployed, the population living below the Poverty Datum Line (PDL) is equally high. The unemployed, the elderly and in most cases female headed are the most vulnerable to poverty. The effects of poverty are wide ranging from tendency towards crime, sickness and poor quality of life to alcoholism. Destitution is one of the major consequences of poverty. From a United Nations, (UN) (2009) perspective:
Poverty is the inability of having choices and opportunities, a violation of human dignity. It means lack of basic capacity to participate effectively in society. It means not having enough to feed and clothe a family, not having a school or clinic to go to,
not having the land on which to grow one's food or a job to earn one's living, not having access to credit. It means insecurity, powerlessness and exclusion of
individuals, households and communities. It means susceptibility to violence, and it often implies living in marginal or fragile environments, without access to clean
water or sanitation. (UN, 2009).
6.12.2 Table 21 below shows that the majority of Bulawayo households (83.1%) survive on less
than $500 dollars a month. This result shows that the majority of Bulawayo citizens live in extreme poverty despite their ability to afford to buy enough food to keep the household going (77% of the respondents could buy enough food for the month). Approximately 20% of the respondents were lingering close to starvation as shown by an income that was below $150/month which was dangerously close to the FPL of Bulawayo of $149.08. FGD participants reiterated the primary data findings explaining that poverty was rife especially within the high density suburbs and particularly amongst the elderly and widowed. The high poverty levels were known and they rooted them in the non performing economy and de-industrialisation of Bulawayo.

Review and Preparation of Bulawayo Master Plan (2019 – 2034) Report of Study
------------------------------------------------------------------------------------------------------------------------------
99
Table: 21: Income levels in Bulawayo
Combined monthly income % of population Cumulative%
>$500/month 16.9% 16.9%
$400<$500/month 26.9% 43.8%
$300<$400/month 13.5% 57.3%
$150<$300/month 20.4% 77.7%
<$150 20.3% 100%
Valid N (listwise) 455
Source: Job Jika & Associates
6.12.3 The study went further to explain the distribution of poverty in Bulawayo according to
the wards of the city. For this information, information from the Zimbabwe poverty atlas of 2015 was sought. Figures 9 & 10 show the distributions of poverty and non-poor households and poverty in general according to the wards of Bulawayo.
Figure 9: Distribution of poor and non-poor households in Bulawayo by ward
Source: Zimbabwe poverty atlas (2015)

Review and Preparation of Bulawayo Master Plan (2019 – 2034) Report of Study
------------------------------------------------------------------------------------------------------------------------------
100
Figure 10: Poverty prevalence in Bulawayo by ward
Source: Zimbabwe poverty atlas (2015)
6.12.4 Figures 9 & 10 show that poor households and poverty are most prevalent in wards 13,
28, 17, 19 and 07. These wards are predominantly high-density areas with either high levels of new settlements, the presence of long-standing settlements or areas in the periphery of the city.
6.12.5 Demand for social protection has increased sharply over the last decade due to the
general socio-economic challenges in the economy. Households have been exposed to recurring emergencies necessitated by the effects of climatic change (floods and droughts), economic under – performance, increase in orphanage and other social hardships due to the effects of HIV and AIDS scourge. In an effort to address these challenges the Zimbabwe Interim Poverty Reduction Strategy Paper (I – PRSP) 2016 – 2018 was formulated which is an indication of the high priority that Government places on poverty alleviation. The Poverty Reduction Strategies are clustered under seven pillars which anchor the I – PRSP. Currently in an effort to address poverty issues, Government has in place a number of social protection and safety net schemes which benefit various sections of the society which include the elderly, orphans, destitutes, children and drought affected. In Bulawayo the following poverty alleviation programmes are being provided:
i. Supplementary feeding programme meant for primary school children and other vulnerable groups; ii. Monthly food rations for destitutes iii. Old age pension scheme iv. Drought relief program

Review and Preparation of Bulawayo Master Plan (2019 – 2034) Report of Study
------------------------------------------------------------------------------------------------------------------------------
101
v. Harmonized social cash transfer payments vi. Basic Education Assistance Module vii. Health assistance
6.5.6 In addition to the above Government’s initiatives and programmes, it is a challenge for
the Master Plan to identify long term and sustainable strategies for poverty alleviation in Bulawayo during the time frame of the plan.
6.13 ECONOMIC VIABILITY ASSESSMENT OF THE REGION
6.13.1 Sub Regional Growth patterns & Investment Prospects and Constraints 6.13.1.1 There has been a change in the settlement pattern since the attainment of
independence with a growing concentration of population and the establishment of some growth points, attainment of town status by other settlements and growth of already established urban centres. The concentration clusters include Esigodini, Kezi, Lupane, Plumtree, Victoria Falls, Beitbridge, Gwanda and Gweru catchment areas.
6.13.1.2 Bulawayo is the major settlement in the South Western region and it has enjoyed
growth over the years because of its role as the second largest urban settlement. This has accorded it a wide range of commercial, educational, health and industrial development that offer better employment opportunities. Added to these is its declaration as a special economic zone, its strategic locational advantage and endowment of natural resources.
Accessibility: national, regional and international 6.13.2.1 Investors consider accessibility to markets and raw material for production before
setting up business. The strategic location of Bulawayo provides a basis for investment and growth in terms of access to local, regional as well international markets and services. Settlements such as Bulawayo which are located along major transport nodes are attractive to people and investors. The city is nodal as it is linked to all the major towns and cities by road from Plumtree to Mutare, Beitbridge to Victoria falls and to Harare. Other links connect Bulawayo to other major centres such as Nkayi, Kezi, Tsholotsho etc. The established communications have strengthened the centres regional and national relationships with Beitbridge, Gwanda, Plumtree, Lupane, Victoria Falls and other major national urban centres and the neighbouring countries such as Zambia, Botswana, Republic of South Africa and potential economic giants such as Angola and the Democratic Republic of Congo.
6.13.2.2 A railway link runs parallel to most of the major roads and provides a link to South
Africa, Botswana and Zambia. The construction of the Bulawayo – Beitbridge line has improved movement between Zimbabwe and South Africa which is a major trading

Review and Preparation of Bulawayo Master Plan (2019 – 2034) Report of Study
------------------------------------------------------------------------------------------------------------------------------
102
partner. The main potential of the rail network is its use of freight cargo for heavy industrial raw material and finished products. The city has an international airport but currently there are limited flights which locally link up with Victoria Falls and Harare and regionally with South Africa. As a result the airport is currently underutilized.
Service and Utilities
6.13.3.1 Services and utilities are important to any potential investor. Good physical
infrastructure such as roads and electricity exist in the city. The problem faced by the city is limited funding for maintenance of the road network and other infrastructural services. Another important input is water. The Local Authority has adequate, reliable and clean water supplies and efforts are underway to connect and develop other sources to augment supplies to meet the ever growing demands of the city. The City is responsible for its water supplies.
6.13.3.2 Reliable power supplies are essential to sustain industrial and commercial activities.
Zimbabwe Electricity Transmission and Distribution Company (ZETDC) is responsible for the supply of electricity but this is also being complemented by a thermal power station in the city. Power Supply from ZETDC and ZPC is adequate to meet the needs of the city.
6.13.3.3 The liberalization of the telecommunication sector has facilitated the entry by other
players. Though the fixed line networks are being undertaken by Tel one, three private providers namely Net One, Buddie and Telecel have been licenced to operate throughout the country. This has also resulted in an increase in internet cafes. The only challenge is that like all utility services, telecommunication charges are not competitive. However, this is expected to change in future as more players come into the scene due to privatization.
Land and land based resources
6.13.4.1 There is need to improve the servicing of land for commercial, industrial and
residential purposes. A conducive investment climate/environment is important to promote foreign and local investors through the provision of serviced commercial and industrial stands at an affordable price, affordable utilities such as power, water, telecommunication as well as good social services such as health, education, recreation. Servicing of industrial and commercial plots has been on going but at a very low rate compared to housing but there has been some challenges as demand has continued to outstrip supply due to a shortage of funding. Land acquisition and servicing is falling behind.
6.13.4.2 The long waiting lists and turn around time for allocation of stands makes it difficult to
plan for business since land acquisition is uncertain. In addition, land speculation exists in the peri urban areas of Bulawayo.

Review and Preparation of Bulawayo Master Plan (2019 – 2034) Report of Study
------------------------------------------------------------------------------------------------------------------------------
103
6.13.4.3 The important of the informal sector for employment creation and poverty alleviation is appreciated. The operators are accommodated at Lobengula mall, bus rank and along 5th avenue. The majority of informal sector operators will be accommodated at the proposed Egodini Mall as stalls for the operators will be set up.
6.13.4.4 Tourism is a sector with a lot of potential in the city and the urban periphery. Apart of
scenic based tourism the sector could diversify the tourism product to ecological, and cultural tourism. Old Bulawayo is a national heritage which is accorded special protection. Other sites which are of cultural or historical value may be identified for the benefit of the city.
Capital
6.13.5.1 Most Government departments are experiencing problems in securing funding for
capital projects. Centralisation of funds in Harare has resulted in delays or even worse, failure to implement some projects. The lack of funds has also been a challenge in the servicing of commercial and industrial stands. Lack of finance to assist small businesses and highly subsidized loans to provide equity capital to citizens and joint ventures between citizens and foreign investors is a challenge being experienced in Bulawayo and nationally.
Unemployment and Employment creation 6.13.6.1 The labour force in Bulawayo is increasing more rapidly than the number of formal and
informal sector jobs created or available. The bulk of the unemployed are school leavers and some drop outs (out of school youth). The Youth constitute a large percentage of the population and is hard hit by unemployment problems. In addition the transition rate to institutions of higher learning is small resulting in a serious problem of unemployment affecting the out of school youths without any employable skills. There is need to encourage young people to engage in productive and employment response activities through education with production efforts. The main objective of the new educational curriculum is to address some of the existing challenges as there is more focus on potentials of students – academic and practical orientation. The main focus is transition from an agro based economy to an industrial economy since agriculture is unreliable and difficult to sustain. There is need to design programs and projects that will take account of increasing unemployment.
6.13.6.2 A major comparative advantage of Bulawayo which has boosted its economic viability
has been the construction of NUST and other tertiary institutions such as the Catholic University and operation of Lupane State University and Solusi University from Bulawayo. These in addition to existing tertiary institutions such as the Bulawayo Polytechnic, Hillside teachers and United College have meant an exponential growth in

Review and Preparation of Bulawayo Master Plan (2019 – 2034) Report of Study
------------------------------------------------------------------------------------------------------------------------------
104
Bulawayo’s population. Employment opportunities have increased and businesses with benefit from the population.
6.13.7 IMPLICATIONS OF THE POPULATION CHARACTERISTICS AND ECONOMIC INDICATORS
FOR DEVELOPMENT IN THE STUDY AREA 6.13.7.1 From the presentations and analysis in the preceding sections of the chapter it is clear
that the Study Area has a very young population in terms of composition. The implication that goes with this kind of situation is that the focus of the plan should be amongst others, to meet the requirements for the provision of health, recreational and educational facilities as well as the creation of employment opportunities in the Study area. Another characteristic of the population which has implications on unemployment and poverty levels is the proportion of the population which is economically inactive. Of the total labour force, 28% is in unemployment. With such a high unemployment rate, devising of strategies for employment creation in the city should be accorded a high priority in the plan.
6.13.7.2 Though the population of Bulawayo has been on a low growth rate in the past two
decades, the rate of physical and economic developments have not matched this growth in population. The challenge here will be, how to accelerate physical developments in an orderly fashion as well as the provision of adequate infrastructure services to act as pull factors in order to stimulate economic growth through the attraction of investment. With will the potential at Bulawayo’s disposal this could be realized.
6.13.7.3 The poverty rates and levels as measured by the unemployment rate and destitution
also have implications on economic growth and development generally. With such high rates of unemployment, it means the dependency on family members and government is high which in turn means low productivity in their economies. All the above have the effect of slowing the rate of economic growth and development of the city if not properly addressed.

Review and Preparation of Bulawayo Master Plan (2019 – 2034) Report of Study
------------------------------------------------------------------------------------------------------------------------------
105
CHAPTER 7 HOUSING
7.1 INTRODUCTION
7.1.1 The housing market extends beyond the existing boundaries of Bulawayo in this study. However, the market area for housing in this chapter is limited to the Municipal area. Information on the total number of dwelling units was collected through primary and secondary sources but this was also complimented by socio-economic surveys and housing occupancy surveys which were undertaken with the assistance of assistance of research assistants.
7.1.2 This chapter presents housing as an integral part of the overall economic and social
structure of Zimbabwe and Bulawayo in particular. The Government of Zimbabwe accords the housing sector a high priority in recognition of the fact that adequate shelter is a basic human need. Housing is considered a productive sector which contributes directly to the socio economic development of the society. The development and delivery of housing in Bulawayo are a combined effort of both the public and private sector.
7.2 NATIONAL HOUSING POLICY
7.2.1 The National Housing Policy of 2012 provides the guiding principles, objectives and strategies for housing delivery in Zimbabwe. Basically, the housing policy sets out in clear terms, government’s long term goal of ensuring that everyone has access to decent shelter. It further seeks to facilitate the construction of new urban housing for all income levels. The National Housing Policy appeals to all stakeholders and interest groups in the housing sector by clearly outlining the role of each actor and formulation of relevant policies and strategies. The policy coordinates housing sector activities in an effort to address the needs and interests of various stakeholders for maximum performance. It deliberately promotes pro poor housing development strategies that are anchored on the participatory approach and maximum mobilization of beneficiaries’ own resources.
7.2.2 The Housing Policy is based on the following principles:
i. Reinforcement of Government’s role as a facilitator in the housing delivery
process through the formulation of enabling policies and strategies and the
adoption of appropriate technology. Government will however, when necessary,
be obliged to intervene and provide safety nets for the vulnerable groups in
society;

Review and Preparation of Bulawayo Master Plan (2019 – 2034) Report of Study
------------------------------------------------------------------------------------------------------------------------------
106
ii. Defining the roles of each actor and interest group in the housing sector and
formulating relevant enabling policies and strategies;
iii. The building of an extensive network of housing providers such as building
societies, pensions and provident funds, private land developers and employers
and
iv. Promotion of pro-poor housing development strategies that are anchored on the
participatory approach and maximum mobilization of beneficiaries’ own resources.
7.2.3 The revised National Housing Policy among other things recommends:
i) The establishment of a reliable and sustainable housing finance system for effective
housing delivery;
ii) Encouraging private sector participation in housing development ensuring that this
is regulated to reduce risks to investors and home seekers;
iii) Facilitating development by providing off-site infrastructure. Inadequate offsite
infrastructure is seen as the major impediment to housing development, to the
extent that most local authorities are not able to establish new settlements as
this would irreversibly strain existing bulk infrastructure and
iv) Supporting government efforts to expedite land acquisition, compensation and
transparent administration for land earmarked for urban use.
7.3 INSTITUTIONAL FRAMEWORK FOR HOUSING DELIVERY 7.3.1 The institutional framework for housing delivery in Zimbabwe constitutes of structures
and institutions which have been created to focus on various aspects of housing development categories and the housing sector in general in all parts of the country. These include:
7.3.2 The Ministry of Local Government, Public Works and National Housing (MLGPW & NH)
– This Ministry is the lead sector agency in terms of sector policy formulation, implementation, monitoring and review. The mandate of the Ministry is carried out through the following Departments:
i. Department of Housing – The Department is responsible for the formulation of the
housing policy as well as the implementation of specific housing programs and strategies. It provides overall leadership, planning and policy directions on housing schemes in the country. It also performs estate management functions in respect of

Review and Preparation of Bulawayo Master Plan (2019 – 2034) Report of Study
------------------------------------------------------------------------------------------------------------------------------
107
government pool housing and also provides funding for provincial and district housing schemes for public servants.
ii. Department of Physical Planning – The department is responsible for national spatial planning. As such, it is the custodian of settlement development standards.
7.3.3 The Ministry of Finance and Economic Development – The Ministry allocates public
sector resource provision for housing and regulates activities of financial institutions involved in housing. The Ministry’s fiscal policy formulation, implementation, monitoring and review functions and the broader macroeconomic oversight are critical to development and management of housing.
7.3.4 Ministry of Environment, Wildlife and Tourism - The Ministry oversees environmental stewardship through, among others Environmental Impact Assessments (EIAs). The Ministry’s oversight in terms of environmental stewardship is by ensuring that EIAs and EMPs are prepared and reviewed for residential layouts prior to housing developments being undertaken.
7.3.5 Ministry of Health and Child Care – The Ministry administers the Public Health Act
among other pieces of legislation which have a bearing on human settlement standards and administration.
7.3.6 The Ministry of Justice – The Ministry is the custodian of the deeds registry functions
including administration of the property conveyance system in the country. These are critical functions in terms of protecting property rights and security of tenure, which are critical for housing sector investors both foreign and local.
7.3.7 Ministry of Lands and Rural Resettlement – Ministry responsible for lands, which is the
Government’s principal land acquisition authority. It hosts the Office of the Surveyor General and is responsible for carrying out cadastral surveys of detailed layouts on state land. It also manages key land information systems and administers rural state land.
7.3.8 In addition to sector Ministries, there are also key financial and non-financial sectors
that Government deploys to facilitate sector work. Examples of financial institutions include the Infrastructure Development Bank of Zimbabwe (IDBZ) and the National Housing Fund (NHF).
7.4 BULAWAYO CITY COUNCIL
The Local authority participates in all key steps of housing development and management as direct providers of housing, providers of key services, regulators of the activities of private developers and as partners of state, private and civil society actors. The city council’s role could be through the provision of serviced land, allocation of
Review and Preparation of Bulawayo Master Plan (2019 – 2034) Report of Study
------------------------------------------------------------------------------------------------------------------------------
108
virgin land to private developers to service and allocate to those on the waiting lists or entering into partnership with private developers. The Local Authority performs estate management functions in respect of local authority pool housing.
7.4.1 The main functions of Bulawayo City Council in housing provision include:
• Land use planning,
• Land allocation and administration,
• On and offsite servicing,
• Plan approval for superstructures
• Construction supervision,
• Certification of completed developments,
• Technical advise to community groups 7.5 NATIONAL AND INTERNATIONAL DEVELOPMENT ORGANIZATIONS
7.5.1 Zimbabwe has a number of active non-state actors involved in the housing sector. Some of the most active ones are:
• Dialogue on Shelter for the Homeless People in Zimbabwe Trust (Dialogue),
• The Zimbabwe Homeless People’s Federation (ZHPF),
• The Zimbabwe National Association of Housing Cooperatives (ZINAHCO),
• Housing People of Zimbabwe (HPZ),
• Civic Forum on Housing,
• Non-ZINAHCO and non-ZHPF community-based organizations (CBOs) involved with housing cooperatives and other social groups, and
• ZIMHABITAT, which is a platform for stakeholder interaction on housing matters in Zimbabwe established to foster participatory advancement of
the national Habitat agenda. 7.5.2 In addition, there are some international development organizations which have had a
history of supporting housing Development programs in Zimbabwe. The main organizations in this category include:
• United Nations organizations led by UN Habitat,
• Bilateral agencies like SIDA, CIDA and USAID,
• Multilateral agencies like the World Bank (WB) and the African Development Bank (ADB), and
• International non-UN NGOs and Foundations e.g. the Bill and Melinda Gates Foundation.

Review and Preparation of Bulawayo Master Plan (2019 – 2034) Report of Study
------------------------------------------------------------------------------------------------------------------------------
109
7.6 PRIVATE SECTOR
Private sector developers play an important role in housing delivery especially in urban areas. These have been mainly Zimbabwean land development companies. To date the following private developers have played a large role in the provision of housing in the city:
• Pension Funds and Building Societies such as Beverly-CBZ Building Society, Zimbabwe National Building Society-FBC Building Society, Founders-Intermarket-ZB Building Society, Infrastructure Development Bank of Zimbabwe (IDBZ) and Central African Building Society (CABS).
• Finance Houses such as Old Mutual, ZIMRE and Home Link
• Land development companies such as, APG Glendenning, Hawkflight, Mehluli Khumalo Land Developers, Aggregate properties, GG construction, Sypho Land developers, Nkiwane Land Developers, Hlalo Land Developers, Hopeville – Sondelani Land Developers and JRG have been instrumental in the provision of land and housing development.
ii) Private companies involved in company-housing schemes for their employees.
Mining companies have been in the lead in terms of developing and managing sizeable estates.
iii) Land owners in urban, peri-urban and rural areas.
7.7 GOVERNMENT MINISTRIES AND DEPARTMENTS
The Zimbabwe Defence Force (ZDF), Zimbabwe Prisons and Correctional Services (ZPCS), Zimbabwe Republic Police (ZRP) and the Ministry of Primary and Secondary Education (MoPSE) and well as the Ministry of Higher and Tertiary Education (MoHTE) provide housing for some of their employees. In principle, all institutions should provide housing for their employees. Generally, housing development is mainly being undertaken by individuals in both urban and rural areas.
7.8 PRIVATE SECTOR INVOLVEMENT IN HOUSING DELIVERY 7.8.1 The demand for new residential accommodation in the city is likely to be met by the
private sector. The private sector is taken to consist of private companies, building societies, banks, donor agencies and individual developers. The increased participation of the private sector is in line with the provision of the National Housing Policy as well as a withdrawal by other major players such as the Ministry of Local Government Public Works and National Housing and the Local Authority who are no longer actively involved due to the tight monetary conditions prevailing in the country.

Review and Preparation of Bulawayo Master Plan (2019 – 2034) Report of Study
------------------------------------------------------------------------------------------------------------------------------
110
7.8.2 In Bulawayo the involvement of the private sector in housing development as well as land servicing as part of the public private partnership (PPP) has been increasing since year 2000. Servicing of residential stands and the development of housing units has been undertaken in the high density residential areas through schemes such as the Glenkara Housing scheme in Nkulumane and Emganwini and other schemes in Pumula South, Pelandaba West and Cowdray Park. Other housing schemes in the medium and low density residential areas has been through servicing of residential stands in Mahatshula East, Parklands, Mhlangeni and Highmount, Dlamini Township, Mqhabuko Heights, Buena Vista, Burnside and Selbourne Park as well as the provision of town houses. However, the major challenge being experienced with regards to serving of housing schemes by the private sector is lack of finance to ensure that servicing is in line with the development conditions of the subdivision permit. Table 22 below shows private sector involvement in housing development in the city.
Table 22: Private Sector Housing Development in the City
Name of Contractor
Location Number of Stands Year of Allocation
BOPSE Pumula South 381 2002
HABEK Pumula South 253 2002
NSSA Pumula South 700 2006
CABS Pumula South 3 98 2006
PMTP Pumula South 3 98 2006
CABS Nkulumane 1 750 2006
Glenkara Homes Pelandaba 1 000 (Phase 1 – 510, Phase 2 – 490)
2009
ZIGEU Cowdray Park 550 2002
Alpha Construction Cowdray Park 536 2002
Hawkflight Cowdray Park 3 275 2002
GG Hardware Cowdray park 3 116 2004
Ministry of Local Government
Cowdray Park 500 2004
Monologue Cowdray Park 3 126 2004
Standard Products Cowdray Park 377 2005
ZIMTA Cowdray Park 100 2005
Zimbabwe Homeless People’s Federation
Cowdray Park 100 2006
Hlalani Kuhle Cowdray Park 7 000 2005
BCC Cowdray Park 500 2004
PMT Cowdray Park 3 1 000 2002
Aggregate Properties
Mahatshula 200 2004/2008

Review and Preparation of Bulawayo Master Plan (2019 – 2034) Report of Study
------------------------------------------------------------------------------------------------------------------------------
111
JAROOTS Mahatshula 200 2008
Glass and Allied Products
Selbourne Park 76 2006
ZIMRE Properties Parklands 135 2008
Hawkflight Pelandaba West 185 2004
Homelink Parklands 137
Rent a Roof Cowdray Park 2 000 2014
Source: BCC & Consultants Surveys
7.8.3 In Zimbabwe, the private individual is the greatest provider of residential housing. When the economy was buoyant some private individuals developed housing for the prevailing market situation. The houses were elaborately designed and built attracting high rentals. Due to a down turn in economic growth, affordability has become a major challenge and rentals have taken a nose dive and in some instances houses are repossessed by financial institutions because of the inability to service the mortgage. As a result, at the moment housing is not a lucrative sector for investment due to affordability challenges.
7.9 HOUSING SECTOR PLAN AND HOUSING DEVELOPMENT STRATEGY
7.9.1 Despite having a Housing Policy at national governmental level, the city does not have
its own Housing Policy and a Housing Development Strategy. The latter two are critical
towards achieving a structured approach in housing planning, financing, housing
development and delivery. This is critical in view of the diversified housing delivery
sector with several role-players in housing delivery and towards ensuring a guided
approach to housing provision and ensuring that all fundamental requisites are adhered
to through an enabling, facilitative environment.
7.10 RESIDENTIAL SPATIAL STRUCTURE
7.10.1 The city, being a colonial city and now in post-colonial era still displays the hallmarks of
a colonial, spatially segregated residential structure with a clearly discernible polarisation between the western high density (predominantly black low income) and the eastern lower density (formerly white and now mixed race middle to higher income) areas. The trend that has been perpetuated by successive planning efforts has been to reinforce the colonial spatial structure. It is only through dynamism in planning that spatial development growth trends can be directed differently and towards achieving the principles of spatial equity and integration.

Review and Preparation of Bulawayo Master Plan (2019 – 2034) Report of Study
------------------------------------------------------------------------------------------------------------------------------
112
7.11 EXISTING HOUSING STOCK
7.11.1 The 2012 population and housing census shows that Bulawayo had a total of 165 345
dwelling units and 167 092 households and a population of 655 675 which translates to an average household size of 3.9 persons per household. In 2002, total of 165 123 dwelling units were recorded, showing that there has been a 0.13% increase in the number of dwelling units over a 10 year period assuming that each household has one housing unit. The housing stock in Bulawayo is characterised by the following three types of dwelling units;
• Traditional Dwelling Units– these comprise of buildings which are made of pole and dagga/bricks with thatched roofs found in the old style family settlement.
• Modern houses – these are standard houses which are reflective of higher Income ownership. They are usually characterised by services such as water supply and electricity. They are constructed with cement blocks and in most cases have corrugates or asbestos roofing sheets or tiles and are of varying sizes and often more than one room. These types of houses are usually constructed by people who have the means.
• Institutional Housing – this constitutes of staff housing units which house both central and local government housing officials. These housing units are usually of
good standard with brick walls and iron or tile roof with infrastructure service provision. The housing units are where possible located adjacent to the institutions they serve such as local authority facilities, schools, police station and prison among others.
7.11.2 As at October 2018 there were approximately 135 110 dwelling units in the city. High
density housing accounted for about 80% of the total housing stock in Bulawayo. There has been a few developments of low and medium density residential areas during the expired plan period. In the city centre there has been very little development of residential accommodation since the 1970s. In fact there has been a decline in residential accommodation in the city as most of the residential flats in the city have been undergoing a change of use from residential to office blocks, guest houses and commercial undertakings.
7.12 URBAN RENEWAL
7.12.1 Since the early 1960s Bulawayo City Council has made tremendous efforts towards
urban renewal. A major clearance was undertaken at West Gate, a former low income
European suburb which belonged to National Railways. The primary school which served
the neighbourhood was converted to a training centre, now West Gate vocational and
training college. In addition, efforts at rationalising developments were undertaken in
the early 1980s for purposes of upgrading facilities such as toilets, roads and additional

Review and Preparation of Bulawayo Master Plan (2019 – 2034) Report of Study
------------------------------------------------------------------------------------------------------------------------------
113
rooms in Makokoba. The rationalisation process is still on going in Mabutweni and
Iminyela today with more focus on the provision of toilet facilities. To date more than
300 houses have been provided with individual sanitation facilities. The Bulawayo City
Council has also made some proposals to decommission Sidojiwe hostels from
residential to industrial to cater for service industrial units as well as upgrading
Burombo and Vundu hostels.
7.13 MODELS OF HOUSING DELIVERY AND ALTERNATIVE BUILDING TECHNOLOGIES
7.13.1 During the plan implementation period the city has over the years delivered housing
through models which mainly through the public private partnership model. These
constituted joint ventures with the private sector. The models ranged from Turnkey
Housing project where the Local Authority would identify the land, design the layout,
allocate to the developer for servicing and construction of complete houses. The other
model entailed the Local Authority entering into a joint venture with a private
contractor to service land on their behalf and the Local Authority allocating stands to
beneficiaries on the waiting list. The other model which was adopted entailed the Local
Authority identifying virgin land, designing a layout and allocating to a developer to
service and allocate to people on the waiting list. It is important to note that the most
common model of housing delivery during the plan period was servicing and eventually
allocation to people on the waiting list.
7.14 ALTERNATIVE BUILDING TECHNOLOGIES
7.14.1 The housing environment, like the general building sector has undergone radical change
through the adoption of alternative building technologies which also incorporate green
building techniques. The city has not fully adapted these technologies which come with
huge savings in terms of financial costs and environmental benefits.
7.15 DWELLING CONSTRUCTION
7.15.1 The supply of residential houses is clearly lagging behind housing demand and need as is
the case in all urban centres in Zimbabwe. The number of completed housing units
constructed in the city has been declining over the years. The current low levels of
residential development may be attributed to a number of factors such as tight
monetary conditions prevailing on the market, lack of funding on the part of public
agencies, lack of serviced land, high interest rates and poverty on the part of potential
householders. Poverty on the part of potential householders has been augmented by

Review and Preparation of Bulawayo Master Plan (2019 – 2034) Report of Study
------------------------------------------------------------------------------------------------------------------------------
114
the unavailability of mortgage finance as well as high interest rates from banks and
building societies. The rate of dwelling construction in Bulawayo from 2 000 to 2018 is
shown in figure 11 below.
Figure 11: Number of dwellings constructed in Bulawayo since year 2000 to 2018
Source: Bulawayo City Council
7.15.2 The rate of house construction is very low. In an effort to establish housing needs in the
city a comparison is made by comparing the number of housing units with the number
of separate households. However, this does not provide a means of knowing what kind
of housing is needed but gives an indication of the overall numbers.
Table 23: Housing needs in Bulawayo as at October 2018
Estimated
Population
Estimated Number
of Households
Estimated number of
Dwelling Units
Existing Housing Backlog
as at 2018
750 000 184 000 135 110 48 890
Source: ZimStats
7.15.3 The table above shows that on average about 1.5 households share every dwelling unit.
In order to provide accommodation for every household in the city, the local authority
will have to build over 50% of the existing housing stock. However, not every household
can afford a house or desires a separate dwelling as some prefer to rent.
7.15.4 According to the 2012 housing and population census, the households found within
Bulawayo acquire housing units through several ways as presented in table 24 below.

Review and Preparation of Bulawayo Master Plan (2019 – 2034) Report of Study
------------------------------------------------------------------------------------------------------------------------------
115
The purchased (owner occupied) constituted the dominant mode of acquiring
residential accommodation within the city and accounts for 39 percent of the total
number of housing units. Some 38.5% of households rent private houses from various
individuals and companies. The information shows that Bulawayo’s owner-occupied
housing stood at 39.7 percent in 2017 having grown from 37.5 percent in 2002 and 39
percent in 2012. It is however, noticeable that lodging is also rising in the city while
tenancy is going down. A situation where lodging is almost equal to owner-occupied
housing poses a huge challenge for the city in terms of provision of housing to its
citizens. Tenants constitute the 3rd highest category of housing provision in the city.
About 5.8% of the acquired housing units by means of rental remittances to the
government, local authority or job-related provisions by private companies and other
stakeholders. The least category of respondents did not indicate how they acquired
housing in the city.
Table 24: Acquisition Methods of Housing Units in Bulawayo (2002 & 2012)
Housing Type Method of Acquisition
(2002)
Method of Acquisition
(2012)
Percentage (2002)
Percentage (2012)
Purchased (Owner occupied) 65 471 64 485 39.65 39
Tenant 10 881 15 212 6.59 9.2
Tied Accommodation (Institutional)
10 007 9 590 6.06 5.8
Lodger 67 156 63 658 40.67 38.5
Other 11 608 7 606 7.03 4.6
Missing 0 4 795 0 2.9
Total 165 123 165 345 100 100.0
Source: ZIMSTATS Housing and Population Census 2002 & 2012

Review and Preparation of Bulawayo Master Plan (2019 – 2034) Report of Study
------------------------------------------------------------------------------------------------------------------------------
116
Figure 12: Households by tenure status in 2002, 2012 and 2017.
Source: Zim Stats
7.15.5 Household surveys which were undertaken in May 2018 also confirmed that the majority of people in the city are staying in their houses followed by tenants. This is shown in figure 13 below.
Figure 13: Tenure Status in the City
Source: Job Jika & Associates

Review and Preparation of Bulawayo Master Plan (2019 – 2034) Report of Study
------------------------------------------------------------------------------------------------------------------------------
117
7.16 HOUSING CHARACTERISTICS AND CONDITIONS 7.16.1 The 2012 Housing and Population census recorded seven (7) different types of housing
units in Bulawayo as reflected in Table 25 below. The housing market in Bulawayo is dominated by detached accommodation as about 60% of the 165 345 households live in such accommodation. Other prevalent types of dwelling units in Bulawayo are semi detached and flats/town houses which constitute about 22 percent, flats/town houses 11 percent. Semi detached Flats are located in the high and medium density residential areas while most sites for town house development are located in the high income low density suburbs of Khumalo, Parklands, Selborne Park and Barham Green. Shacks constitute 0.3% of the total number of housing units while the least category type of housing unit in the city falls within other types of housing units.
Table: 25 Types of Dwelling Units in Bulawayo 2002 & 2012
Type of Dwelling Unit
Number of Dwelling Units
(2002
Number of Dwelling Units
(2012)
Percentage (%) 2002
Percentage (%) 2012
Traditional 710 992 0.43 0.6
Mixed 793 662 0.48 0.4
Detached 99 322 102 845 60.15 62.2
Semi – detached 42 288 37 707 25.61 22.2
Flat/townhouse 19 518 18 684 11.82 11.3
Shack 826 496 0.5 0.3
Other 1668 331 1.01 0.2
Missing 0 4 630 0 2.8
Total 165 123 165 345 100 100.0
Source: ZIMSTATS Housing and Population Census 2002 & 2012
7.16.2 The low percentage of traditional housing shows the transition by Bulawayo residents from the traditional way of building to a more modernized way of building structures. Most of the houses in Bulawayo have been constructed using modern building material, are self-built and functional.
7.16.3 Residential stands in Bulawayo are characterised by large plots, large stands, medium
and small stands. Large plots constituting more than 1 ha and large stands are found mostly in the low density residential areas while smaller standard stands are found mostly in the high density residential areas. The large plots are those that were allocated in the “plot” area and were mainly for the farming community who were

Review and Preparation of Bulawayo Master Plan (2019 – 2034) Report of Study
------------------------------------------------------------------------------------------------------------------------------
118
engaged in various urban agricultural practices. Most of the areas where there were large plots have been subdivided into 1 hectare plots for residential development. The majority of the stands are in the high density residential areas being allocated by the Local Authority and private developers and average stand sizes are between 200m2 and 300m2. The reduced stand sizes were meant to achieve cost efficiency in the provision of infrastructure and to deliver more residential stands in the city.
7.16.4 The type of building material used for residential development is important for
permanency, durability and quality of housing conditions as well the physical structure. According to the consultants’ surveys, most of the housing units in the city exhibit better conditions in terms of building materials used and sanitary conditions than the traditional and mixed housing types. However, difficulty of servicing the newly established residential areas is presenting a challenge in terms of sanitary conditions in these areas. Using ZIMSTATS housing and population studies of 2012, it can be noted that 1.5 and 0.3% of the population used blair and pit latrines respectively.
7.16.5 From table 26 below it is evident that Bulawayo is supplied with potable water as the
majority of households have piped water indoors (70.1%) and piped water outside (29.1%) their households stand limits. Some 0.2% of the households use water from communal taps while the other 0.2% use water from boreholes/wells. Households who use water from unknown water sources constitute 0.3% of the total households. The least category of households (0.3 %) in the city use water from communal taps and boreholes/wells. The table below further shows that the majority of households (92.7%) are using flush toilets, 3% use unknown water sources, 1.5% are use blair toilets and 1.3% do not have any form of toilet facility.
7.16.6 The non-availability of toilet facilities by some residents is a major cause for concern as
they are likely to be causing open air defacation which is an environmental concern as well as a health risk to neighbourhoods where people do not have toilet facilities. 1.2% of the residents especially in the oldest residential neighbourhoods and other institutional facilities e.g. prison are still using communal toilet facilities. The least category of residents are using pit latrines. The least category of residents are using pit latrines. The blair and pit latrines are mainly found in the new residential areas such as Cowdray Park and Mbundane which have not been provided with conventional sewer. While housing is a basic need, it must come with other basic needs such as water, environmentally sustainable sanitation systems and modern sources of energy.
Table 26: Households access to Services in Bulawayo 2012
SOURCE OF WATER SUPPLY ACCESS TO TOILET FACILITIES
Source No of H/holds (2002)
No of H/holds (2012)
% 2002
% 2012
Type No of H/Holds (2002)
No of H/holds 2012
% (2002)
% (2012)
Piped water indoors
89 612 106 299 54.27 70.1 Flush 158 255 153 275 95.84 92.7

Review and Preparation of Bulawayo Master Plan (2019 – 2034) Report of Study
------------------------------------------------------------------------------------------------------------------------------
119
Piped water outdoors
71 713 47 547 43.43 29.1 Blair 1 222 2 480 0.74 1.5
Communal tape 2939 4 491 1.78 0.2 Pit 1 172 496 0.71 0.3
Well/Borehole protected
528 895 0.32 0.2 Communal 3 385 1 984 2.05 1.2
Well unprotected 248 172 0.15 None 1 073 2 150 0.65 1.3
River/Stream/Dam 17 9 0.01 - Unknown 0 4 960 0 3
Other 66 722 0.04
Unknown 0 5 210 0 0.3
Total 165 122 165 345 100 100 165 124 165 345 100 100
Source: Zim Stats 2012 7.16.7 Households surveys also indicated that the majority of households have piped water
inside, followed by piped water outside. However, there is an increase in the number of people accessing water from a communal tape. This may be attributed to developments in areas such as Cowdray Park where a large number of people are using such water sources. Figure 14 below, shows the results from the household surveys.
7.16.8 Household surveys also indicated that the majority of households use conventional
sewer, followed by sceptic tanks though dominant in the low density residential areas. There has been an increase in the number of blair and environ loo toilets especially in the newly established residential neighbourhoods which are not fully serviced. Figure 15 below shows results from the household surveys.
Figure 14: Main sources of water in the city

Review and Preparation of Bulawayo Master Plan (2019 – 2034) Report of Study
------------------------------------------------------------------------------------------------------------------------------
120
Source: Job Jika & Associates
Figure 15: Main types of toilet facilities in the City
Source: Job Jika & Associates
7.16.8 Table 27 below depicts the sources of fuel/energy for cooking in Bulawayo. The major
source of cooking in Bulawayo is electricity as 89.8% of the households are using electricity, while 6.1% use wood for cooking. Other sources of energy for lighting are paraffin (6.1%) and gas (0.4%). However, it should be noted that there has been an increase in the use of gas for cooking by households which has been attributed to the severe power cuts experienced in the past. In addition gas is also cheaper relative to electricity. As discussed in the environmental chapter, the use of wood as a means of cooking is a cause for concern as it has implications in terms of indiscriminate felling of trees, thus disturbing the ecological balance of the natural environment as unsustainable use of wood as a natural resource.
Table 27: Sources of cooking used by households
Source of
Energy
Number of
Households
(2002
Number of
Households
(2012)
Percentage (%)
2002
Percentage (%)
2012
Wood 6 555 26 620 3.97 6.1
Paraffin 4 243 1 488 2.57 0.9
Electricity 153 465 148 479 92.94 89.8

Review and Preparation of Bulawayo Master Plan (2019 – 2034) Report of Study
------------------------------------------------------------------------------------------------------------------------------
121
Gas 660 661 0.4 0.4
Coal 165 0 0.1 -
Other 0 0 0.02 -
Missing 0 4 464 0 2.7
Not Known 0 0 0.01 0
Total 165 123 165 345 100 100
Source: ZIMSTATS 2002 & 2012
7.16.9 The major sources of lighting in the city is electricity. However, some residents in the city who are residing in neighbourhoods which have not been electrified are using various forms of energy for lighting such as solar, paraffin, candles and gas as a source of lighting. However, the use of solar seems to be gaining prominence in the city especially in those parts of the city which are not electrified.
7.17 QUALITY AND STANDARDS OF RESIDENTIAL NEIGHBOURHOODS 7.17.1 The quality and standards of neighbourhoods in Bulawayo can be explained and
analysed as composing of well-defined high (in the western areas) medium such as Mahatshula, Montrose and Barham green and low density housing such as Selborne Park, Hillside, High Mount and Burnside. However, the quality of residential units in the western areas has greatly improved. This is mainly because people have redeveloped some of the houses which they were initially allocated by the Municipality. In addition some of the residents are built and are building nice houses in the high density areas which may be compared to those in the medium and some high density residential areas. However, there are generally challenges being experienced by most of the residents in the maintenance of houses in the various neighbourhoods.
7.17.2 The houses in the various neighbourhoods are accessible in terms of road linkages.
Infrastructural services and facilities are as per Urban Design standards but the challenge at the moment is actual provision of requisite services in areas such as Cowdray Park which are not fully serviced; there is lack of tarred roads, storm water drainage system as well as some social and physical infrastructure. This challenge is being experienced in some of the neighbourhoods where the Local Authority and some private developers have taken the lead in the provision of residential stands.
7.17.3 The older residential neighbourhoods are also experiencing a challenge in terms of maintenance of infrastructure such as roads as the life span of most of the roads has been exceeded such that pot holes are a common feature and in some instances the tarred road has been completely worn out. The designed open spaces are no longer being developed or maintained and most of them have been turned into dump sites

Review and Preparation of Bulawayo Master Plan (2019 – 2034) Report of Study
------------------------------------------------------------------------------------------------------------------------------
122
while in some instances there have been changes of land use to other land use and residential developments have been undertaken on such sites. In some instances where some infrastructure had been provided in some of the open spaces this has been vandalised. The residential environment has been provided with a variety of land use zonings which serve them with a high degree of compatibility and interdependence.
7.18 HOUSING BACKLOG 7.18.1 There is a demand for new housing to cater for the increasing population. The demand
for additional new housing is usually though imperfectly expressed through the housing
waiting list. As at May 2018 the Bulawayo housing waiting list was at 115 000. This is an
increase of about 454% from the 1998 figure which was 25 356.
7.18.2 This increase in the number of people on the waiting list may be attributed to a failure of the current strategies to provide residential stands or housing in the city. Despite the existence of a housing waiting list, current allocation of residential stands is dependent on one registering to be on the waiting list as one’s ability to pay for stands in the various housing schemes which are being offered by the City Council or private developers. Results from the household surveys revealed that the majority of the respondents indicated that housing strategies which were adopted after independence where a Local Authority would service an area prior to development or where the Local Authority would enter into partnership with a private developer should be adopted in the provision of housing. The least category of respondents indicated rental housing as a solution to the provision of housing in the city. The results are shown in figure 16 below.
Figure 16: Suggested modes of housing delivery in the city

Review and Preparation of Bulawayo Master Plan (2019 – 2034) Report of Study
------------------------------------------------------------------------------------------------------------------------------
123
Source: Job Jika & Associates
7.18.3 Most of the housing schemes which have been implemented by the municipality or the private sector during the course of implementing the operative Master Plan, such as Cowdray Park, Magwegwe North, Pumula South, Pelandaba West, High Mount, Mahatshula North, Mahatshula East and Emhlangeni have not adequately catered for high income earners. This may be attributed to a large market for high density housing as the majority of the people on the waiting list are in that category. There is need for monetary policies to be reviewed, interest rates reduced so that local authorities and individuals may borrow money to service and people to build if ever low income earners are to own houses.
7.19 HOUSING LAND SUPPLY
7.19.1 Currently there are approximately 25 150 residential stands, either under construction
or planned for development principally in Cowdray Park, Pumula South, Rangemore, Magwegwe North, Remainder of Emganwini Phases 1 - IV, Emhlangeni, Highmount, Killarney East, Norwood Tracks Phase 1 and 2 In addition there is approximately 46.22 hectares which has been set aside for future residential development especially detached housing, town houses and residential flats. Land available for development has been reserved by the Local Authority but this may be allocated to some private sector players for servicing and allocation to people on the waiting list.
7.20 THE SQUATTER/INFORMAL HOUSING SITUATION IN BULAWAYO 7.20.1 Bulawayo does not have a serious informal settlement problem. Surveys undertaken
have revealed that squatting exists at Cabatsha, Trenance, Ngozi Mine and Killarney. The City has a minimum squatter population estimated at 3 000 people and most of them are local citizens while others have migrated from other areas in the country. The emergence of squatters in the city may be attributed to a breakdown of extended family ties, the prevailing economic situation, rural to urban migration and housing shortages. The City Council has programmes to clear all areas occupied illegally and relocating them on the edge of the city in the Mazwi/Hyde park areas.

Review and Preparation of Bulawayo Master Plan (2019 – 2034) Report of Study
------------------------------------------------------------------------------------------------------------------------------
124
CHAPTER 8
EDUCATIONAL FACILITIES 8.1 INTRODUCTION
8.1.1 The development of the city hinges on and is intertwined with the level of education of
its residents. It is therefore essential that this master plan puts in place measures and interventions to strengthen the education sector in the city in the short, medium to long term.
8.1.2 The study identifies the present and future educational facility needs of the city. It
analyses the spatial distribution of facilities taking into account the hierarchical ordering of educational facilities. This plan explores the capacity of existing institutions, current and projected student enrolments, adequacy of school facilities and infrastructure within the context of attaining the goal having an educated citizenry for the progressive city development into the future. The study also analyses the future needs of the educational sector in the city and makes recommendations as part of the city’s development vision. In the end, it is envisaged that the study will lay the basis for a capital investment program for education in the city into the future.
8.2 THE ZIMBABWEAN CONSTITUTION & EDUCATION ACT 8.2.1 The constitution of Zimbabwe and the Education Act and the Education Act Chapter
25:04 are the guiding frameworks regarding in the provision of education in Zimbabwe. According to the Constitution of Zimbabwe Amendment (No. 20) Act 2013 every citizen and permanent resident of Zimbabwe has a right to (a) basic state funded education, including adult basic education and further education which the state, through reasonable legislative and other measures must make progressively available and accessible. To this end, the above aim at ensuring that the Government puts in place an education and training strategy that recognises people as a major national resource and capable of giving them an educational system necessary for national development. The Constitution and Education Act recognises education as a fundamental human right. The constitutional provision and the Education Act are hinged on the following principles:
i. Good access to education for all and equity in the provision of education;
ii. Effective preparation of students for life in the future and the needs of the economy; iii. Development of training that is responsive and relevant to the needs of the economy;

Review and Preparation of Bulawayo Master Plan (2019 – 2034) Report of Study
------------------------------------------------------------------------------------------------------------------------------
125
iv. Improvement of the quality of the education system; v. Enhancement of the performance and status of the teaching profession; vi. Effective management of the education system;
8.2.2 The present educational system encompasses pre - primary education, primary
education, secondary education, vocational and technical training, tertiary education, out of school education (non - formal) and special education. Pre – primary and secondary education is divided into 7 + 4 + 2 tier structure system and forms basic education programme. This relates to 7 years of primary education, 4 years of Ordinary Level education and 2 years of Advanced Level education.
8.2.3 Primary and Ordinary education constitutes of a 11 year basic programme with a long
term aim of developing productive citizens who are highly skilled and self - reliant. Advanced level education forms a post basic education programme for preparing learners for tertiary education and the world of work. The Education Act, envisages that the training output will be highly skilled and productive workforce.
8.3 EXISTING EDUCATIONAL FACILITIES
8.3.1 Early Childhood Development Centres (ECDCs)
8.3.2 There exists a total of one hundred (100) registered and operational Early Childhood
Development Centres (ECDs) within Bulawayo City Council’s area of jurisdiction as at May 2018. However, in addition to these 100 registered ECDs all the primary schools within the City were offering ECD education at the time of the survey. Table 28 below shows the existing situation with regards to ECD facilities their location as well as other characteristics of ECD facilities within the City. Of all the operational facilities only twenty five (25) are owned by Bulawayo City Council but these have been leased to private operators, two (2) are owned by Non - Governmental Organisations (NGOs), nine (9) are owned by churches and seventy four (74) are privately owned.
8.3.3 The early childhood development (ECD) centres in the city are operating from primary
schools, designated pre-school sites, church premises/halls and from residential units. However, there are some ECDs which are operating within the city from residential houses (special consent has not been approved) and hence these have not been registered.
8.3.4 Increased demand for Early Childhood Development Centres is a function of the growth
and development of Bulawayo as well as introduction of early childhood learning as a prerequisite for enrolment to primary education. As more people take up residency in the city and are employed parents and guardians they are obliged to send their infants

Review and Preparation of Bulawayo Master Plan (2019 – 2034) Report of Study
------------------------------------------------------------------------------------------------------------------------------
126
to ECDs. Another explanation for an increase in pre-school education is the increasing scarcity and costs of house maids to look after infants while parents and guardians are at work. The above scenarios have contributed to the demand in two ways. First parents and guardians now utilise pre-primary education facilities more than ever before and the unaffordability of house maids has meant that parents have no option but to take children to ECD centres while they are at work.
8.3.5 The age cohort for early childhood development which aims at physical, mental and
psychological and development of the child ranges as follows:
i) 0-3 years old children (ECD A) ii) 3-4 years old children (ECD B) iii) 4-6 years old children (pre-primary)
8.3.6 As can be seen from table 26 below, all the ECD centres have a total enrolment of 4 328
which constitutes an average of 43 for each school. There is an opportunity for enrollment to be increased in the institutions. However, as with averages this figure may be misleading as some schools have large enrollments and may already be at the threshold of over-enrolment while others are small. For example Senzangakhona is the largest institution with an enrolment of 217 while Supreme has the lowest enrolment with 4 children. Facilities provision as per standards is such that there should be at least a pre-school to serve a population of 10 000. Using the 2012 population census for Bulawayo and assuming that 15% of the population is in the age cohort 0 – 6, 98 000 children are supposed to be attending early childhood schools.
8.3.7 However, the total enrolment of 4 328 children make up 0.67% of the current
population of Bulawayo which is estimated at 653 337. The low enrolment may be attributed to high fees being charged in the institutions making them unaffordable to some parents and guardians.
Table: 28: Early Childhood Development Centres in Bulawayo
Name of Early Childhood Development Centre
Location &
Stand Size
Enrolment Number of Teachers
Teacher: Pupil Ratio
Number of Classrooms
Ownership/
Ward Responsible
Male Female Total Authority
Arkel Nursery
Barham Green 1Acre 28 17 45 3 1 to 15 3 Private Ward 6
Children`s House
CBD 1Acre 25 26 51 3 1 to 17 6 Private
Ward 1
Busy Bee CBD
1Acre 15 19 34 2 1 to 17 3 Private Ward 1

Review and Preparation of Bulawayo Master Plan (2019 – 2034) Report of Study
------------------------------------------------------------------------------------------------------------------------------
127
Apple Valley CBD
1Acre 33 31 64 4 1 to 16 6 Private Ward 1
Famona Nursery
Famona 1Acre 10 12 22 2 1 to 11 2 Private
Ward
Scribbles Nursery
Surburbs 1Acre 21 17 38 3 1 to 13 4 Private
Ward 5
Children`s Dream House
Southworld 1Acre 11 11 22 2 1 to 11 3 Private
Ward 6
S.T.Ks Nursery Southworld
1Acre 16 15 31 2 1 to 16 2 Private Ward 6
Snowy Nursery
Bellevue 1Acre 19 19 38 3 1 to 13 2 Private
Ward 6
Breakthrough Bellevue
1Acre 15 26 41 3 1 to 14 4 Private Ward 6
Balfour I & II Bellevue
1Acre 12 21 33 4 1 to 8 2 Private Ward 6
Oxford Hillside
1Acre 9 12 21 3 1 to 7 2 Private Ward 5
Mickey Minnie’s
Trade Fair 1Acre 33 35 68 6 1 to 11 4 Private
Ward 5
Hillside Nursery
Hillside 1Acre 33 10 43 3 1 to 14 2 Private
Ward 5
Step By Step Hillside
1Acre 2 0 2 5 1 to 2 2 Private Ward 5
Scallywags Malindela
1Acre 9 12 21 2 1 to 11 1 Private Ward 4
Be Artee Toddlers
Hillside 1Acre 7 7 14 2 1 to 7 1 Private
Ward 5
Engedi Hilcrest
1Acre 15 12 27 2 1 to 14 1 Private Ward 5
St Clares Morningside
1Acre 10 13 23 2 1 to 12 1 Private Ward 5
Wide Awake CBD
1Acre 32 23 55 4 1 to 14 4 Private Ward 1
First Step Nguboyenja
1Acre 23 10 33 1 1 to 31 1 NGO - Jairos Jiri
Ward 8

Review and Preparation of Bulawayo Master Plan (2019 – 2034) Report of Study
------------------------------------------------------------------------------------------------------------------------------
128
Mlizane Nguboyenja Ward 8
1Acre 13 16 29 2 1 to 15 2 BCC
Nguboyenja Nguboyenja Ward 8
1Acre 22 26 48 3 1 to 16 2 BCC
St Gabriel’s CBD
1Acre 31 24 55 3 1 to 18 3 Anglican Church Ward 1
Queen Elizabeth
CBD 1Acre 37 21 58 5 1 to 12 4 SDA Church
Ward 1
BKMS Nursery Bellevue Ward 6
1Acre 12 23 35 4 1 to 9 2 Private
Nicolas Famona Ward 5
1Acre 9 13 22 3 1 to 7 2 Private
Lancaster Pre-School
Hillcrest Ward 5
1Acre 45 65 110 6 1 to 18 5 Baptist Church
Bugs Bunny CBD
1Acre 26 15 41 3 1 to 14 2 Private Ward 1
Greystone Surburbs Ward 5
1Acre 17 18 35 4 1 to 9 3 Private
The Play Way Hillside Ward 5
1Acre 18 20 38 4 1 to 10 2 Private
Church of Nazarene
Hillside Ward 5
1Acre 19 23 42 5 1 to 8 3 Private
Adolf Schmit Parklands Ward 3
1Acre 15 24 39 4 1 to 10 2 Roman Catholic Sisters
Wendy House Woodlands Ward 4
1Acre 20 21 41 5 1 to 8 4 Private
Come and Play
Hillside Ward 5
1Acre 22 12 34 2 1 to 17 2 Private
Kiddies Cottage
Ilanda 1Acre 28 26 54 5 1 to 11 4 Private
Ward 4
Peter Pan CBD
1Acre 13 17 30 3 1 to 10 2 Private Ward 1
Toddlers University
CBD 1Acre 33 28 61 8 1 to 8 4 Private
Ward 1
Cinderella Surburbs Ward 5
1Acre 7 8 15 3 1 to 5 3 Private
Christ The King
Hillside Ward 5
1Acre 30 29 59 4 1 to 15 3 Private
Newton Pre-Prep
CBD 1Acre 35 27 62 8 1 to 8 3 Private
Ward 1

Review and Preparation of Bulawayo Master Plan (2019 – 2034) Report of Study
------------------------------------------------------------------------------------------------------------------------------
129
Royal Academy
CBD 1Acre 14 12 26 2 1 to 13 2 Private
Ward 1
Eagle Academy
Hillcrest Ward 5
1Acre 9 12 21 2 1 to 11 2 Private
Little Friends Hillside Ward 5
1Acre 13 8 21 2 1 to 11 2 Private
Little Hearts Hillcrest Ward 5
1Acre 22 34 56 5 1 to 11 3 Private
Mommy`s Day Care
Hillside Ward 5
1Acre 11 13 24 3 1 to 8 3 Private
Twinkle Nursery
Famona Ward 5
1Acre 6 22 28 2 1 to 14 3 Private
Senzangakhona
Mganwini Ward 26
6,2145 Ha
107 110 217 5 1 to 43 2 BCC
Manondwane
Nketa 7 Ward 25
1 Ha 13 24 37 1 1 to 37 2 BCC Childhood Day Care
Sususu Day Care
Nketa 7 Ward 25
2200m2
17 7 24 2 1 to 12 3 BCC
E& CP Day Care
Nketa 7 Ward 25
3354m2
11 8 19 1 1 to 19 1 BCC
Toddlers Centre
Emganwini Ward 26
2000m2
7 6 13 1 1 to 13 1 Private
Supre Child Centre
Emganwini Ward 26
334m2
1 3 4 2 1 to 2 2 Private
Blue Bell
Mahatshula North
600m2
14 17 31 2 1 to 16 6 Private Ward 3
Precious Moments
Killarney Ward 3
1 Acre
13 17 30 3 1 to 10 6 Private
Princess Margaret
Nketa 8 Ward 24
1 000m2
31 35 66 2 1 to 33 2 Private
Nketa Baptist Nketa 8 Ward 24
1 000m2
6 15 21 1 1 to 21 1 Baptist Church
Nketa 6 Pre-School
Nketa 6 Ward 24
1 200m2
30 24 54 3 1 to 18 2 BCC
Golden Educare
Nketa 6 Ward 24
1 200m
9 14 23 2 1 to 12 2 Private

Review and Preparation of Bulawayo Master Plan (2019 – 2034) Report of Study
------------------------------------------------------------------------------------------------------------------------------
130
2
Gwabalanda Gwabalanda Ward 16
6 432m2
18 12 30 2 1 to 15 2 BCC
A&J Gwabalanda Ward 16
3 038m2
20 25 45 2 1 to 23 2 Private
Pumula South
Pumula South
5 000m2
2 2 BCC Ward 27
Pumula Old Pumula Old Ward 19
2 747m2
41 34 75 2 1 to 38 2 BCC
Happy Faces Gwabalanda Ward 16
615m2
18 18 36 2 1 to 18 1 Private
Old Luveve Old Luveve Ward 15
10 000m2
30 35 65 3 1 to 22 2 BCC
Ukuhluma New Luveve Ward 15
615.5m2
17 12 29 2 1 to 15 2 Ukuhluma Housing Co-Op
Magwegwe West
Magwegwe West
6 432m2
29 29 58 2 1 to 29 2 BCC Ward 18
Fairlands
Pumula South
375m2
10 25 35 3 1 to 12 2 Private Ward 27
Old Luveve Old Luveve Ward 15
10 000m2
30` 35 65 2 1 to 33 2 BCC
Ukuhluma New Luveve. Ward 15
615.5m2
17 12 29 2 1 to 15 2 BCC
Magwegwe West
Magwegwe West
6 432m2
29 29 58 2 1 to 29 1 Private Ward 18
Pelandaba Pelandaba Ward 8
2.5 Ha
25 39 64 2 1 to 32 2 BCC
Ekukhanyeni Luveve 4 Ward 15
2 Acres
24 18 42 2 1 to 21 2 Private
St Pius Njube 4420
m2 44 23 67 2 1 to 34 2
Arch diocese of Bulawayo
Ward 12

Review and Preparation of Bulawayo Master Plan (2019 – 2034) Report of Study
------------------------------------------------------------------------------------------------------------------------------
131
Helping Hand Njube
22 26 48 2 1 to 21 2 Private Ward 9
Little Angel Mpopoma Ward 9
1 000m2
24 37 51 2 1 to 30 2 Private Nazaren
Siboniso ECD Centre
Mpopoma Ward 9
1 015m2
21 21 42 2 1 to 21 1 BCC
Mabutweni Pre school
Mabutweni Ward 13
300m2
14 10 24 2 1 to 12 2 BCC
Kids University
Mpopoma Ward 9
1,5 Ha
38 49 87 4 1 to 22 3 Scouts
St Peter and Paul
Mpopoma Ward 9
2 Ha 14 8 22 2 1 to 11 2 Roman Catholic
Zamani Pre-School
Mpopoma Ward 9
2 Acres
21 21 42 2 1 to 21 2 BCC
Nazarene Old Magwegwe Ward 18
1 152m2
8 8 16 2 1 to 8 2 Nazareth Church
Magwegwe preschool
Old Magwegwe Ward 18
127,03m2
17 19 36 2 1 to 18 2 BCC
Kinderose Infant
Cowdray Park
5 220 m2
19 24 43 4 1 to 11 3 Private Ward 28
Love and Kindness
Saucertown Ward 2
655m2
17 7 24 2 1 to 12 2 Private
St Margaret Northend Ward 2
700m2
14 8 22 3 1 to 7 2 Private
Tshaka 1 Makokoba Ward 8
560m2
43 39 82 5 1 to 16 2 BCC
Vukuzenzele Makokoba Ward 8
480 m2
29 34 63 3 1 to 21 2 BCC
Makokoba Makokoba Ward 8
420 m2
15 18 33 2 1 to 17 2 BCC
My Little Pony and Friends
Saurcestown Ward 2
750 m2
24 19 43 2 1 to 22 2 Private
Progressive Emakhandeni Ward 11
5 078 m2
5 6 11 2 1 to 6 2 Private

Review and Preparation of Bulawayo Master Plan (2019 – 2034) Report of Study
------------------------------------------------------------------------------------------------------------------------------
132
Canrose
Cowdray Park
1 080 m2
23 26 49 2 1 to 25 2 Private Ward 28
Entumbane Entumbane Ward 10
950 m2
30 31 61 3 1 to 20 2 BCC
Barbourfields Barbourfields Ward 8
850 m2
40 43 83 3 1 to 28 2 BCC
Emakhandeni Emakhandeni Ward 11
900 m2
29 51 2 1 to 30 2 BCC
22
Joyful
Bulawayo CBD
650 m2
15 12 27 2 1 to 14
3 Private Ward 1
Mzilikazi Baptist
Mzilikazi Ward 8
1 050 m2
26 23 49 3 1 to 16 3 Private
St Padre-Pio Entumbane Ward 10
1 080 m2
32 35 67 2 1 to 34 2 Roman Catholic Church
S.O.S Northend Ward 2
1050 m2
67 71 138 6 1 to 23 6 S.O.S Children's villages
Welcome Bulawayo CBD
800 m2
47 20 67 4 1 to 17 3 Private Ward 1
Total 2133 2175 4328 288 1 to 15 246 All
Source: BCC & Field Surveys – May 2017 8.3.8 There is a total of 4 328 children enrolled at the ECD facilities which with a total staff
compliment of 288 teachers make an average teacher to pupil ratio of 1 to 15 a reasonable ratio at face value considering that this is an average with the ratio high at some centres where the teacher to pupil ratio exceeds 1 to 30. Some of the teachers are untrained. Planning bears the responsibility to ensure that the spatial distribution of the facilities is rationally equitable alongside other planning provisions such as the special consent procedure. Early childhood development centres established without planning permission are a cause for concern as they do not only breach the education policy but impact negatively on the children at such institutions. However, household surveys which were undertaken indicated that the majority of the respondents indicated that ECD facilities within neighbourhoods are not adequate. The shortage of facilties in some neighbourhoods results in parents taking children to other facilities outside the neighbourhood especially in the city centre. The results are shown in figure 17 below.

Review and Preparation of Bulawayo Master Plan (2019 – 2034) Report of Study
------------------------------------------------------------------------------------------------------------------------------
133
Figure 17: Adequacy of ECD facilities in the City
Source: Job Jika & Associates
8.3.9 The Ministry of Primary and Secondary Education through the Department of ECD
oversees the planning, co-ordination and development of policies and strategies for pre-primary education. However, the City Council has a direct role in the supervision of pre-Schools. They check for compliance with the City’s By-Laws and various departments and sections are involved namely:
8.3.10 The Housing and Community Services Department works through the following sections:
i) Education section–co-ordination of ECD Curriculum and regulates enrolment
(site visitations and register inspection).
ii) Architectural Section –Design, production of architectural plans and project
management for buildings built by Council only.
iii) Building Inspectorate Section-Supervises the building process of private
buildings, ensuring compliance with building by-laws, plan submissions,
processing and site inspections at each stage of the building, ensuring that
proper procedures are followed during construction and issuing certificates
upon completion in order to ensure that the structure is suitable and safe for
the activities to be carried out.
iv) Estates Section- involved in the allocation, administration and renewal of leases
as well as maintenance of the asset register.
8.3.11 Engineering Services Department:
i) Involved in spatial planning and land use designation, allocation and checks for
compliance with relevant by-laws (that the institution is established on the
appropriate area with no disruptions to other infrastructure like sewer lines and
water supply pipes etc.)

Review and Preparation of Bulawayo Master Plan (2019 – 2034) Report of Study
------------------------------------------------------------------------------------------------------------------------------
134
ii) Availing site plans;
iii) Provision/ supply of clean water;
iv) Sewer connections to the municipal network or authorized onsite sanitation
facilities;
v) Servicing of land and road network
8.3.12 Health Services Department i) Ensuring environmental health compliance with health standards and ensuring the
cleanliness of the facility and its surroundings in line with the required health
standards
ii) Ensuring that the enrolment accommodates and does not exceed the required
number of children according to the space available
iii) Equipment and toys are not hazardous to children
iv) Administering and checking if all the children are immunised and up to date with the
stipulated immunisation programmes to ensure that no child without immunisation
card is enrolled at the facility.
8.3.13 These line function departments are carrying out their mandates satisfactorily. 8.3.14 The city has a good distribution of facilities and this has ensured that the whole city is
well served. However, despite a provision of ECD facilities within the residential neighbourhoods, some parents have enrolled their children in ECD facilities at the City Centre so that they may drop them on their way to work and collect them when they knock off. It should be noted that not all parents are able to send their children to ECD centres especially the private ones as they are more expensive. As a result, the ECD centres at primary schools have more enrolment while other ECD going age children do not attend ECD schools and are left at home with guardians.
8.3.15 Some of the challenges which were indicated by people who are operating ECD centres
in Bulawayo include shortage of space for outdoor equipment, failure and delays by parents to pay school fees, shortage of out-door equipment, low enrolment as parents take their children to ECDs in formal schools for ease of getting grade one places. There is a shortage of qualified teachers, leaners work books, ICT resources which are expensive, shortage of class rooms, shortage of furniture and low participation by parents in school related activities.
8.3.16 It is important that it be ensured that there be a proper alignment of the various tiers of
education within the education sector so that the education system in the city (country) is able to function in a coherent and integrated manner from the foundation phase (early childhood learning stage to the higher echelons of the system for seamless transition and progression from one tier to the next. The municipality can play a

Review and Preparation of Bulawayo Master Plan (2019 – 2034) Report of Study
------------------------------------------------------------------------------------------------------------------------------
135
meaningful role in influencing decision-making and policy formulation within the education sector as a prime role-player at the local government sphere.
8.4 PRIMARY SCHOOLS 8.4.1 A total of eighty (80) primary schools presently exist within Bulawayo. Four (4) primary
schools are owned by Non-Governmental Organisations, Three (3) are privately owned, eleven (11) are owned by churches, twenty four (24) are owned by the Local Authority and thirty (38) are owned by the Government. Like ECDs, primary schools are basically neighbourhood institutions and hence they are evenly distributed throughout Bulawayo a scenario which has been improved by the presence of private primary schools. Since year 2 000 five (5) primary schools, one (1) private, one (1) church and three (3) owned by the City of Bulawayo have been constructed to date. This represents 4% increase in primary school provision in the planning area since the last master plan. Table 29 below presents the existing scenario and details of primary schools in Bulawayo.
Table 29: Existing Primary Schools in Bulawayo
Name of School
Established Location
Stand/ Plot Size
Number of Ownership
Classrooms
Teachers Pupils Classroom to Pupil Ratio
Teacher-Pupil Ratio
Staff Houses
Barham Green 1953 Barham Green
15 25 871 1 to 58 1 to 35 Government
Coghlan 1911 CBD 35 294 34 46 1 824 1 to 54 1 to 40 2 flat lets
Government
Dominican Convent
1895 Lobengula St.
21 25 447 1 to 21 1 to 18 0 Dominican Sisters
Fairview 1943 Parklands 19 23 477 1 to 25 1 to 21 1 West Zimbabwe Conference
Greenfield 1916 Southhold 33 34 1 217 1 to 37 1 to 36 2 Government
Henry Low 1955 Greenhill 24 37 1 378 1 to 57 1 to 37 1 Government
Hillside 1951 Malindela 29 33 1 285 1 to 44 1 to 40 1 Government
John Slaven 1975 Malindela 14 17 116 1 to 8 1 to 7 1 Government
King George VI 1957 Kumalo 20 acres 9 19 116 1 to 13 1 to 6 0 King George Centre
Kumalo 1952 Kumalo 27 35 1563 1 to 58 1 to 45 0 Government
Losikeyi 1954 Nguboyenja
26 30 1091 1 to 42 1 to 36 1 Government
Milton Junior 1910 CBD 33 33 1169 1 to 35 1 to 35 0 Government
Moray 1957 Famona 6 Ha 22 36 1278 1 to 58 1 to 36 2 Government
Robert Tredgold 1933 Batch St. 5306 m2 33 40 1519 1 to 46 1 to 38 0 Government
Simanyane 1983 Newton West
16 Acres 6 7 60 1 to 10 1 to 9 0 Zimcare Trust
Sir Humphrey Gibbs
1963 Kumalo 10 9 83 1 to 8 1 to 9 0 Zimcare Trust

Review and Preparation of Bulawayo Master Plan (2019 – 2034) Report of Study
------------------------------------------------------------------------------------------------------------------------------
136
St Francis 1982 Ingutsheni Hospital
10 000 m2
6 9 75 1 to 13 1 to 8 0 Government
St Thomas 1956 Kumalo 7 16 210 1 to 30 1 to 13 0 Catholic
Tennyson 1959 Ilanda 5 acres 21 23 904 1 to 43 1 to 39 0 Government
ZRP Ross Camp 1940 6th Av. Ext. 18 23 707 1 to 39 1 to 31 0 Government
Amazon 2009 Mahatshula North
3 Ha 7 14 215 1 to 31 1 to 15 0 Private
Cement 1986 PPC 5,4 Ha 13 15 336 1 to 26 1 to 22 11 Private
Centenary 1998 Killarney 51480 m2 9 15 294 1 to 33 1 to 20 0 Private
Emganwini 2 Pr. 2014 Emganwini 1250 m2 4 19 627 1 to 157 1 to 33 0 Government
Hope Fountain 1870 Hope Fountain
1100 m2 20 22 692 1 to 35 1 to 31 6 UCCSA
Imbizo Garrison 1957 Imbizo Garrison
5,4 Ha 13 17 580 1 to 45 1 to 34 0 Government
Induna 1959 Llewellin Barracks
36 000 m2 18 18 602 1 to 33 1 to 33 2 Government
Lochview 1948 Lochview 21,71 Acres
8 18 604 1 to 76 1 to 34 0 Government
Mahatshula 1996 Mahatshula South
5, 5 Ha 28 38 1197 1 to 43 1 to 32 0 BCC
Manondwane 1990 Nketa 7 4142 Ha 21 49 1279 1 to 61 1 to 26 0 BCC
Maranatha Pr. 2014 Nketa 7 12 11 297 1 to 25 1 to 27 South Zimbabwe Conference
Masiyephambili Pr.
1991 Selbourne Park
7 Hectares
19 22 371 1 to 20 1 to 17
NGO -Masiyephambili School Trust
Mganwini Pr. 1989 Nketa 8 6,2145 Ha 27 52 2020 1 to 75 1 to 39 1 BCC
Mgiqika 1994 Kensington 6,4000 Ha 26 55 1904 1 to 73 1 to 35 0 BCC
Mguza SDA 1948 Lochview 2 Hectares
19 39 1391 1 to 73 1 to 36 1 SDA
Amaswazi 1981 Pumula North
45 900 m2 21 33 1006 1 to 48 1 to 30 1 Government
Babambeni 1980 Pumula North
24 750 m2 20 30 1086 1 to 54 1 to 36 1 Government
Dumezweni 1998 Pumula South
28 000 m2 26 55 2031 1 to 78 1 to 40 1 BCC
Fusi 1980 Gwabalanda
34 200 m2 22 41 1431 1 to 65 1 to 36 1 Government
Godlwayo 1981 Old Pumula 40 470 m2 23 41 1431 1 to 62 1 to 36 1 Government
Hyde Park 1929 Methodist Village
29 000 m2 12 12 559 1 to 47 1 to 47 5 Methodist Church
Inzwananzi 1980 Gwabalanda
29 000 m2 21 30 870 1 to 41 1 to 29 1 Government
J.W. Mthimkhulu 1990 Magwegwe West
400 000 m2
19 29 976 1 to 51 1 to 34 1 BCC
Khami Prison 1969 Khami Prison Complex
500 m2 12 24 708 1 to 59 1 to 30 9 Government
Luveve 1935 Old Luveve. 20 000 m2 11 20 555 1 to 50 1 to 28 1 Government
Mafakela 1962 Luveve 25000 m2 23 24 658 1 to 29 1 to 27 1 Government

Review and Preparation of Bulawayo Master Plan (2019 – 2034) Report of Study
------------------------------------------------------------------------------------------------------------------------------
137
Malindela 1988 Pumula South
35898 m2 26 38 1236 1 to 48 1 to 33 1 BCC
Matshayisikhova 1956 Sidojiwe 36051 m2 17 28 934 1 to 55 1 to 33 1 Government
Mazwi 1929 Magwegwe 37236 m2 20 31 1014 1 to 51 1 to 33 1 Government
Ngwalongwalo 2002 Pumula South
50 000 m2 14 41 1520 1 to 109 1 to 37 1 BCC
Mbizo 1954 New Luveve
49 950 m2 16 23 685 1 to 43 1 to 30 1 Government
Percy Ibboston 1960 Percy Ibboston
28000 m2 6 6 401 1 to 67 1 to 67 0 Government
Rangemore 1957 Upper Rangemore
13540 m2 13 13 905 1 to 70 1 to 70 1 Government
Robert Sinyoka 1924 Hyde Park, 30000 m2 18 18 630 1 to 35 1 to 35 0 Presbyterian Church
St. Bernards 1954 Pumula 31800 m2 25 25 1153 1 to 46 1 to 46 0 Roman Catholic Church
St Peters 1953 Mazwi Village
1 113,42 m2 12 12 508 1 to 42 1 to 42 2 BCC
Thembiso 1978 Luveve 28 000 m2 13 13 475 1 to 37 1 to 37 0 Presbyterian church
Queen Elizabeth 11
1993 Nkulumane 12
60 855 m2
21 34 1240 1 to 59 1 to 36 1 BCC
Induba 1957 Iminyela 4,94 Ha 26 38 1369 1 to 53 1 to 36 12 GVT
Intunta 1979 Sizinda, 21 27 955 1 to 45 1 to 35 GVT
Lobengula West
3263 ha 21 42 1432 1 to 68 1 to 34 0 BCC
Nyamande 1974 Old Lobengula
2,8296ha 23 39 1262 1 to 55 1 to 32 1 GOVT
Sigombe 1992 Nkulumane 4,105ha 25 33 1249 1 to 50 1 to 38 0 BCC
Mahlabezulu 1968 Tshabalala 1 ha 23 46 1469 1 to 64 1 to 32 2 GOVT
Mpumelelo 1961 Mpopoma 40502m2 26 39 1450 1 to 56 1 to 37 2 GOVT
Mtshane 1987 Nkulumane 4.135ha 21 38 1464 1 to 70 1 to 39 0 BCC
Mgombane 1996 Nkulumane 6,973hA 21 31 979 1 to 47 1 to 32 0 BCC
Gampu 1954
Matshobane 35650m2 24 35 1075
1 to 45 1 to 31 2 GVT
Mpopoma 1 to 45 1 to 31
Nkulumane 1958 Mpopoma 5,74ha 29 37 1165 1 to 40 1 to 31 2 GVT
Insukamini 1957 Mpopoma 5ha 24 43 1311 1 to 55 1 to 30 2 GVT
Pelandaba 1964 Lobengula 2,4ha 15 21 786 1 to 52 1 to 37 0 SDA Church
Ntshamathhe 1991 Old Magwegwe
40 000m2 21 31 1016 1 to 48 1 to 33 0 BCC
Aisbley 1961 21 Aisleby Farm
8 8 25 1 to 3 1 to 3 0 BCC
Josiah Chinamano
1997 Emakhandeni
21 30 971 1 to 46 1 to 32 0 BCC
Mahlathini 1997 Cowdray Park
6,2345 Ha 27 65 2382 1 to 88 1 to 37 1 BCC
Mkhithika Thebe 2002 Cowdray Park
27 52 2288 1 to 85 1 to 44 0 BCC
Mtshingwe 1987 Emakhandeni
21 26 930 1 to 44 1 to 36 1 BCC
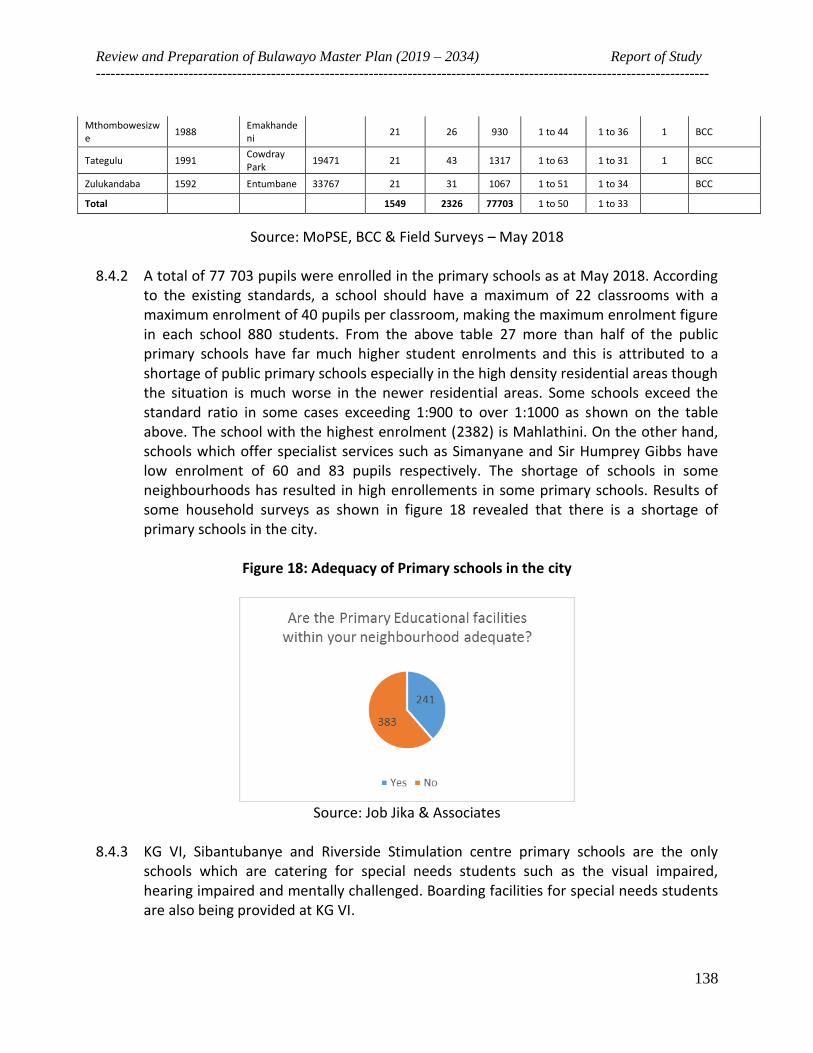
Review and Preparation of Bulawayo Master Plan (2019 – 2034) Report of Study
------------------------------------------------------------------------------------------------------------------------------
138
Mthombowesizwe
1988 Emakhandeni
21 26 930 1 to 44 1 to 36 1 BCC
Tategulu 1991 Cowdray Park
19471 21 43 1317 1 to 63 1 to 31 1 BCC
Zulukandaba 1592 Entumbane 33767 21 31 1067 1 to 51 1 to 34 BCC
Total 1549 2326 77703 1 to 50 1 to 33
Source: MoPSE, BCC & Field Surveys – May 2018 8.4.2 A total of 77 703 pupils were enrolled in the primary schools as at May 2018. According
to the existing standards, a school should have a maximum of 22 classrooms with a maximum enrolment of 40 pupils per classroom, making the maximum enrolment figure in each school 880 students. From the above table 27 more than half of the public primary schools have far much higher student enrolments and this is attributed to a shortage of public primary schools especially in the high density residential areas though the situation is much worse in the newer residential areas. Some schools exceed the standard ratio in some cases exceeding 1:900 to over 1:1000 as shown on the table above. The school with the highest enrolment (2382) is Mahlathini. On the other hand, schools which offer specialist services such as Simanyane and Sir Humprey Gibbs have low enrolment of 60 and 83 pupils respectively. The shortage of schools in some neighbourhoods has resulted in high enrollements in some primary schools. Results of some household surveys as shown in figure 18 revealed that there is a shortage of primary schools in the city.
Figure 18: Adequacy of Primary schools in the city
Source: Job Jika & Associates
8.4.3 KG VI, Sibantubanye and Riverside Stimulation centre primary schools are the only
schools which are catering for special needs students such as the visual impaired, hearing impaired and mentally challenged. Boarding facilities for special needs students are also being provided at KG VI.
Review and Preparation of Bulawayo Master Plan (2019 – 2034) Report of Study
------------------------------------------------------------------------------------------------------------------------------
139
8.4.4 There is a shortage of classrooms in most of the public schools in Bulawayo. The average classroom to pupil ratio for all the primary schools is 1:50. However in reality the classroom to pupil ratios of the primary schools is not the same. Public schools namely Mahlathini (1:88), Mkhithika Thebe (1:85) and Mganwini (1:75) which is way above the standard 1:40. Private schools generally have low classroom to pupil ratios. For example Dominican Convent has a ratio of 1:18 with Masiyephambili having a ratio of 1:17. The shortage of classrooms in all public schools has resulted in hot sitting in most schools.
8.4.5 The shortage of teachers in public primary schools in Zimbabwe is a problem created
and attributable to Government’s freeze in the hiring of teachers in an effort to reduce the wage bill. There are several qualified teachers who are not employed and in an effort to ensure full staff compliments the School Development Committees (SDCs) have employed “temporary” teachers to address the problem.
8.4.6 As far as stand sizes for the primary schools are concerned, this has become an issues
especially in the public schools which were constructed a long time ago. All the public school stands have become small to meet the needs for additional infrastructure, sports fields and other facilities as stipulated in the new curriculum. Support facilities such as libraries and resource centres are still lacking especially in public schools. Furthermore there are no computers and science equipped laboratories which are increasingly becoming essential in today’s learning environment. Another issues of concern among all the schools is the shortage of teacher’s accommodation in all the primary schools.
8.5 SECONDARY SCHOOLS 8.5.1 There are forty two (42) secondary school in Bulawayo. There are six (6) private
secondary schools, fix (5) are being managed by churches, one (1) by the city council and 30 are owned by the government. There has been a 29% increase in the provision of secondary schools since the preparation of the previous master plan in 2000. The provision has been undertaken by Government five (5) schools, private, three (3) schools, churches, three (3) schools and the City of Bulawayo, one (1) school. Of all registered secondary schools thirty five (35) are offering secondary education up to Advanced Level. The existence of many high schools in the city is a positive development for the country as the students can be absorbed in the various universities in the country. Table 30 below shows information about the secondary school situation in Bulawayo.

Review and Preparation of Bulawayo Master Plan (2019 – 2034) Report of Study
------------------------------------------------------------------------------------------------------------------------------
140
Table 30: Secondary/High Schools in Bulawayo
Name of School High/Sec School
Established Location Number of Ownership
Classrooms Teachers Pupils Staff Houses
B.A.H.S High 1980 Suburbs 28 34 631 0 SDA Church
Dominican Convent
High 1894 Lobengula St. 24 22 450 0 Dominican Sisters
Eveline High 1910 33 57 1112 5 Government
Founders High 1952 Barham Green 37 73 1623 2 Government
Gifford High 1927 Old Matopos road Famona
23 47 980 1 Government
Girls College High 1983 Suburbs 21 61 487 0 Board of Governors
Hamilton High 1959 Famona 29 40 972 1 Government
Milton High High 1927 Suburbs 47 48 824 5 Government
Montrose High 1971 Morningside 18 39 787 0 Government
Townsend High 1950 Ilanda 30 48 1051 17 Government
Christian Brothers College
High School
1954 Matshemhlope
55 57 530 8 Board of Govenors
Eastview High School
2011 Mahatshula North
22 14 192 4 Private
Elite High School
2013 Mahatshula North
10 5 105 0 Private
Emsizini Sec 2007 Kensington 4 8 184 3 United Methodist

Review and Preparation of Bulawayo Master Plan (2019 – 2034) Report of Study
------------------------------------------------------------------------------------------------------------------------------
141
Emganwini High School
2006 Emganwini 10 35 871 0 Government
Induna High School
1984 Induna Barracks
10 33 530 8 Government
Maranatha High School
2001 Nketa 7 30 49 1200 0 South Zim. Conferences
Masiyephambili College
High School
1999 Montrose 16 19 196 0 Board of Trustees
Nketa High School
1988 Nketa 8 26 74 1568 1 Government
Nkulumane Sec 2010 Nkulumane 12 8 33 675 0 Government
Petra High 1993 Matshemhlophe
32 41 391 0 Petra Trust
Amhlophe High 1984 Pumula East 20 63 1131 1 Government
Green Gables High 2010 Dunstill Farm , Bulawayo
10 8 267 0 AFM
Inyanda High 1984 Gwabalanda 16 63 1142 1 Government
Masotsha High 1986 Magwegwe North
12 42 691 1 Government
Premier High 2005 Pumula South 28 27 588 0 Private
Pumula High 1983 Pumula North 19 76 1593 1 Government
Pumula South Sec 2016 Pumula South 6 19 568 0 Government
St. Bernards High 1965 Pumula 22 35 852 0 Roman Catholic
Sizalendaba Sec 2013 Mazwi village 4 8 186 0 B.C.C
Khami Prison sec 2011 Khami Prison Complex
4 6 140 Government

Review and Preparation of Bulawayo Master Plan (2019 – 2034) Report of Study
------------------------------------------------------------------------------------------------------------------------------
142
Magwegwe High 1982 Magwegwe 37 70 1752 1 GVT
Sikhulile High 1988 Lobengula West
18 82 2148 0 GVT
Njube High 1973 Njube 20 70 1741 GVT
Sizane High 1963 Pelandaba 23 53 1426 1 African Methodist
Msiteli High 1972 Mpopoma 31 58 1497 2 GVT
Nkulumane High 1984 Nkulumane 20 73 1900 1 GOVT
Lobengula High 1986 Lobengula Extension
10 49 1117 1 Govt
lhlathi High 1970 Tshabalala 18 80 1461 0 Govt
Mandwandwe High 1998 Nkulumane 14 25 1401 0 Govt
Total 1744 36 960
Source: MoPSE, BCC & Field Survey, May 201

Review and Preparation of Bulawayo Master Plan (2019 – 2034) Report of Study
------------------------------------------------------------------------------------------------------------------------------
143
8.5.2 The secondary schools in the city have a wide variety of academic support facilities, such as a libraries, science laboratories and computer laboratories. Some of the courses which are being offered at the schools include ICT, construction, bakery, fashion and fabrics, agriculture and home economics in line with the new curriculum. The majority of the secondary schools in the city do not offer boarding facilities and hence students from the residential neighbourhoods and other parts of the city are enrolled at these secondary schools. The majority of the secondary schools do not provide teachers with accommodation within the school premises. As a result, teachers have to secure alternative accommodation in the city.
8.6 POPULATION OF SCHOOL-GOING AGE IN BULAWAYO 8.6.1 Table 29 shows that 46 percent of Bulawayo’s population in 2012 was made up of the
prime school-going population 0 to 19 years. This population is on the increase based on the intercensal population survey of 2017. It would essential understanding the relationship of this population structure in relation to the required number of educational facilities, enrolment and school attendance or non-attendance.
8.6.2 Using the 2012 Census statistics through interpolation, there were about 49 524 infants
requiring pre-primary education between 3 and 5 years old excluding those below 3 years. There is however a high rate of attendance of school between the ages 3 and 5 years in the city as further explained below and based on the intercensal population survey of 2017. It estimated that there were about 104 270 children of primary school-going age and between the ages 6 to 12 years while there were approximately 54 875 children of secondary school-going age (O-Level between ages 13 and 16 years). Those requiring A-level education between 17 and 18 years would have been about 27071 people. These estimates may provide an idea of the number of educational facilities required in the city. For example, about 118 primary schools would have been required in the city as opposed to the 80 existing schools.
8.6.3 While efforts are made by planners during the design of layouts to ensure a provision of
sites for primary schools in the neigbourhoods so that pupils attend schools nearest to their locality the development of these sites has lagged behind. Primary schools in Bulawayo are not enough to cater for the whole town. The non-development of schools in the new residential neighbourhoods explains why pupils travel long distances to other wards or the city centre to attend school.

Review and Preparation of Bulawayo Master Plan (2019 – 2034) Report of Study
------------------------------------------------------------------------------------------------------------------------------
144
Table 31: Population of School-going Age in Bulawayo, Census 2012
Age Group
Male Number
Female Number Total % Male % Female Total %
20 to 24 31803 41436 73239 4,87 6,34 11,21
15 to 19 33923 44282 78205 5,19 6,78 11,97
10 to 14 32940 36570 69510 5,04 5,6 10,64
5 to 9 32980 34699 67679 5,05 5,31 10,36
0 to 4 42267 42909 85176 6,47 6,57 13,04
Total 173913 199896 373809 26,62 30,6 57,22
Source: ZIMSTATS
8.7 SCHOOL ATTENDANCE
8.7.1 The study commences by looking at the school attendance rate in the city by specifically
focusing on those who never attended school as shown on Table 29. Zimstat recognizes the school-going age as ranging from 3 years to 24 years although it is a fact that some infants under 3 years old attend pre-school mainly for child care while the parents are at work. Most of the children (92 percent) aged 3 years 56.5 percent aged 4 years and 15.5 percent aged 5 years did not attend pre-school in Bulawayo in 2017. Most children start attending school at 6 years old. It is of great concern that 2 percent of children aged 7 and 8 years did not attend school, an age where all children of this age should be in Grade 1 and 2 under normal circumstances. Another worrying statistic is that 3.8 percent of those aged 9 years (who should be in Grade 3) did not attend school in 2017. It is also noted that 3 percent of children who were supposed to be in Form 3 never attended school.
8.7.2 A similar picture emerges across the country albeit in a varied way. With 9.1 percent of
children of school-going age who never attended school, Bulawayo came second best to Matabeleland South with the lowest percentage (8.5 percent) of children who did not attend school in 2017. The scenario depicted on Table 32 should be of great concern to the city as education in axle around which development revolves hence all children must be prepared primary school through enrolment at pre-school and that all children of primary school-going age should be in primary school.
Table 32: Percentage Total Population Age 3 – 24 yrs who never Attended School by
Province
School/ Grade
Age
Manicaland
Mashonaland Central
Mashonaland East
Mashonaland West
Matabeleland North
Matabeleland South
Midlands
Masvingo
Harare
Bulawayo
Total
Preschool 3 91.0 93.8 96.0 98.0 98.9 96.4 92.4 91.1 91.2 91.9 93.7
Preschool 4 67.9 71.0 61.6 77.2 58.4 62.2 63.4 56.7 62.7 56.5 64.6

Review and Preparation of Bulawayo Master Plan (2019 – 2034) Report of Study
------------------------------------------------------------------------------------------------------------------------------
145
Preschool 5 22.7 32.9 28.6 28.9 13.2 22.5 24.0 19.7 25.1 15.5 24.6
Grade 1 6 6.1 11.5 6.4 13.1 8.9 8.7 10.0 3.3 6.4 7.4 8.1
Grade 2 7 4.7 5.3 4.0 4.7 1.2 1.0 3.1 1.8 6.5 2.0 3.8
Grade 3 8 1.8 1.0 1.3 7.3 4.9 1.4 1.0 1.1 1.0 2.0 2.1
Grade 4 9 0.6 4.1 0.0 1.6 0.0 0.0 1.7 0.9 1.0 3.8 1.2
Grade 5 10 0.6 4.7 0.0 2.4 0.0 2.4 0.0 0.8 1.6 0.0 1.3
Grade 6 11 1.1 1.3 0.0 0.0 0.0 0.0 0.6 0.0 0.0 0.0 0.4
Grade 7 12 1.6 2.4 0.0 0.8 4.0 0.0 0.7 1.0 1.0 0.0 1.1
Form 1 13 0.8 1.0 2.4 1.5 2.5 1.4 1.6 1.4 1.9 0.0 1.5
Form 2 14 0.6 2.6 0.0 0.6 0.0 0.0 0.6 0.8 0.0 0.0 0.6
Form 3 15 0.7 1.1 1.2 3.4 0.0 1.5 1.9 1.9 0.0 3.0 1.5
Form 4 16 2.4 0.8 0.0 2.1 3.0 1.8 0.6 1.5 1.8 0.0 1.4
Lower Sixth/Tertiary
17 1.1 3.5 0.5 4.4 1.7 0.0 0.0 1.5 0.9 0.0 1.5
Upper Sixth/Tertiary
18 2.4 1.2 1.2 2.7 0.0 0.0 0.0 0.4 0.6 0.0 1.0
Tertiary 19 0.0 0.0 1.1 1.5 1.8 0.0 1.0 3.6 0.7 1.8 1.1
Tertiary 20 3.3 3.2 0.0 0.0 0.0 0.0 1.9 2.7 0.8 0.0 1.3
Tertiary 21 0.0 1.2 3.2 2.3 0.0 0.0 1.2 0.0 0.8 0.0 1.0
Tertiary 22 2.0 0.0 0.0 3.2 0.0 1.8 2.3 1.5 2.4 1.9 1.7
Tertiary 23 0.0 1.1 3.1 1.5 6.4 0.0 0.0 1.4 0.8 0.0 1.2
Tertiary 24 1.4 3.4 0.0 2.6 0.0 0.0 0.0 0.0 0.0 2.1 1.0
Total 12.1 14.2 12.7 14.4 10.6 8.5 11.6 10.5 11.8 9.1 11.9
Source: Zimbabwe ICDS 2017
8.8 PRIVATE COLLEGES 8.8.1 In addition to the secondary and high schools in the city there are seventeen (17)
private colleges which have been established in the city to compliment, Government, Churches and the City Council in the provision of secondary education. Table 33 below shows information on private schools in the city. The majority of the colleges are located in the high density residential areas having been granted special consent while those within the CBD and are operating from commercial buildings or residential flats also through special consent. However, there are some colleges which are operating from the high density residential areas, colleges such as Herentials and Foundation which have main branches in the city centre and other branches in the residential neighbourhoods of Nkulumane 12 and Pumula South. The private colleges are offering academic education from Form 1 to 6 as well as some professional courses.
Table 33: Private Colleges in the City
Name of Institution
Location Enrolment Number of teachers
Number of Classrooms M F T
Herentals Group CBD 152 133 285 10 9

Review and Preparation of Bulawayo Master Plan (2019 – 2034) Report of Study
------------------------------------------------------------------------------------------------------------------------------
146
Trust Academy CBD 67 73 140 11 9
Denmark Training Services
CBD 40 126 186 11 11
Foundation College
CBD 93 91 184 19 14
New Horizon Institute
CBD 14 35 49 6 15
Faith Christian College
CBD 76 84 160 10 12
Herentals CBD 169 195 364 11 11
Maryrose Emganwini 71 83 154 4 4
Agape Nketa 7 81 95 176 13 9
Tropical Vineyard Nketa 8 60 81 141 9 6
New Vision Nkulumane 10
85 65 100 6 6
Epic Pumula South
23
18
41
4 4
Luveve Luveve 30
34
64
5 4
Sky of good Hope Pumula South
63
85
148
6 4
Enkanyisweni Njube 61 73 134 8 8
Foundation Nkulumane complex
41 40 81 12 10
Herentals Nkulumane 12
41 40 81 6 6
Total
Source: MOPSE
8.8.2 At the time of preparing the Report of Study some of the challenges which were being experienced by the private colleges included, high rentals, lack of grounds for sporting activities, shortage of text books, shortage of furniture, shortage of classrooms, shortage of laboratory equipment and chemicals and no payment of fees by the students.
8.9 VOCATIONAL TRAINING 8.9.1 The Bulawayo City Council has a vocational training section which was established in
1961, when the unemployment rate of school leavers was high. The then City Council introduced a system whereby school leavers could gather at different points called

Review and Preparation of Bulawayo Master Plan (2019 – 2034) Report of Study
------------------------------------------------------------------------------------------------------------------------------
147
placement centres in the western townships for recreational purposes. The activity removes youths from the streets, curbing delinquent behaviour and builds a responsible citizen, hence building a positive image of Bulawayo and indeed the Zimbabwean community. The activity promotes growth of small and medium entrepreneurs as well as contributing to the Zimbabwe agenda for sustainable socio- economic transformation (ZIMASSET).
8.9.2 The Bulawayo City Council’s objective in the youth vocational training programme is to
equip the youth with vocational and technical skills which enable them to get formal employment or self-help projects. The various types of projects being undertaken during vocational training is shown in table 34 below:
Table 34: Vocational Training centres and skills offered at the centres
Discipline Name of centre Surbub Duration
Agriculture Khami Pumula South 3 years
Art Mzilikazi Mzilikazi 2 years
Building Bongani Njube 3 years
Carpentry Luveve Luveve 3years
Plumbing Pumula Old Pumula 3 years
Painting Mzilikazi school of art Mzilikazi 3years
Motor mechanics Tshaka workshop Makokoba 3 years
Welding Inyathi youth centre Mpopoma 3 years
Source: Bulawayo City Council & Consultants Surveys
8.9.3 The graduates from vocational training are absorbed in the co-operatives section of the city as well as in the small and medium enterprises and a few in the employment industries. In the past five years the number of graduates from the various vocational training disciplines are shown in the table below.
Table 35: Number of graduates at the various vocational training centre
2012 -2017
Year Number of graduates
2012 78
2013 73
2014 68
2015 73
2016 74
2017 103
Total 469
Source: Bulawayo City Council

Review and Preparation of Bulawayo Master Plan (2019 – 2034) Report of Study
------------------------------------------------------------------------------------------------------------------------------
148
8.9.4 Whilst the vocational training section is making a positive contribution in terms of human capital there were some challenges which are being experienced in ensuring the smooth running of the section. These include:
• Transport - one vehicle services all the three sections (vocational training, co - operative development and home industries) and is in a state of disrepair spending half the time at the repair workshop.
• Staffing - retired staff still has not been replaced in the vocational centres.
• Lack of computers and internet services within most of the centres
• Memorandums of Understanding between council and NGOs or other funding partners / individuals take too long to be processed; hence we lose out on prospective stakeholder involvement / finance.
• Low recruitment especially the boy child in some disciplines.
• Lack of modern and industrial machinery and equipment.
• Current liquidity challenges facing the country have hit hard service delivery.
8.10 TERTIARY AND VOCATIONAL EDUCATIONAL FACILITIES
8.10.1 There are 5 tertiary and Vocational educational facilities namely National University
of Science and Technology (NUST), Lupane State University (LSU), Zimbabwe Open University (ZOU), Zimbabwe School of Mines (ZSM), Hillside Teachers College (HTC), United College of Education (UCE), Bulawayo Polytechnic and Westgate Industrial Training College (WITC)
8.10.2 National University of Science & Technology
8.10.2.1 The National University of Science and Technology (NUST) was established in 1991
through an Act of Parliament. The institution has been developed on a 160 hectares plot which was donated by the City of Bulawayo for its construction and the provision of a capital budget by the government for the first phase of its construction. It is the second largest public research university in Zimbabwe.
8.10.2.2 The main campus is located at the Corner Cecil Avenue and Gwanda Road, and other
physical locations in Bulawayo and other parts of the country are as shown in the table
below:
Table 36: Location of NUST Campuses in the Country
Name of Unit Location Nature of Business
NUST Harare Office ZIMDEF House, Off Mother Patrick Avenue, Rotten Row Harare
Offices and Teaching space
Institute of Development Studies
Number 38 Duncan Road, Suburbs, Bulawayo
Offices and Teaching space

Review and Preparation of Bulawayo Master Plan (2019 – 2034) Report of Study
------------------------------------------------------------------------------------------------------------------------------
149
Centre for Continuing Education, Publishing Studies Department
55 Jason Moyo Bulawayo
Offices and Teaching space
Faculty of Medicine Mpilo Hospital near Barbourfields and Mzilikazi Suburbs, Bulawayo
Offices and Teaching Space
University Library Number 114 Fort Street, Bulawayo
Library
Source: Nust & Consultant Surveys
8.10.2.3 On 8 April 1991, NUST opened for the first time with 270 students in three (3) faculties and 13 departments namely the faculty of Commerce with 5 departments, faculty of Applied Science with 5 departments and the faculty of Industrial Technology with three departments. The number of faculties has since increased to seven (7) as shown in the table below. The number of academic staff at Inception was 28.
Table 37: Faculties and Departments at the inception of NUST (1991)
Name of Faculty Departments
Commerce • Accounting
• Banking
• Business Management
• Finance
• Insurance and Risk Management
Applied Science
• Applied Biology and Biochemistry
• Applied Chemistry
• Applied Mathematics
• Applied Physics
• Computer Science
Industrial Technology • Civil and Water Engineering
• Electronic Engineering
• Industrial Engineering
Source: Nust & Consultant Surveys
8.10.2.4 Over the years the number of Faculties and Departments has increased and as of 2018, the University has seven (7) Faculties and thirty nine (39) Departments respectively respectively as shown in the table below:
Table 38: Faculties and Departments as at 2018
Name of Faculty Departments
Applied Science • Applied Biology and Biochemistry
• Applied Chemistry
• Applied Mathematics

Review and Preparation of Bulawayo Master Plan (2019 – 2034) Report of Study
------------------------------------------------------------------------------------------------------------------------------
150
• Applied Physics
• Computer Science
• Environmental Science and Health
• Forest Resources and Wildlife Management
• Operations Research and Statistics
• Sports Science and Coaching
Commerce • Accounting
• Banking and Investment Management
• Business Management
• Finance
• Insurance and Risk Management
• Marketing
Communication and Information Science • Journalism and Media Studies
• Library and Information Science
• Publishing
• Records and Archives Management
Medicine • Anatomy and Physiology
• Pharmacology and Biochemistry
• Pathology
• Social Behavioural Sciences
• Nursing and Midwifery Sciences
• Community Medicine
• Surgery and Anaesthetics
• Obstetrics and Gynaecology
• Paediatrics
• Medicine
• Psychiatry
Industrial Technology • Civil and Water Engineering
• Electronic Engineering
• Industrial Engineering
• Fibre and Polymer Materials Engineering
• Industrial and Manufacturing Engineering
• Chemical Engineering
Science and Technology Education • Science and Technology Education
• Applied Art and design
• Technical and Engineering Education
Source: Nust & Consultant Surveys

Review and Preparation of Bulawayo Master Plan (2019 – 2034) Report of Study
------------------------------------------------------------------------------------------------------------------------------
151
8.10.2.5 There are plans to introduce the Faculty of Environmental Science currently
surrogated to the Faculty of Applied Science as well as the Faculty of Culture and
Heritage Studies in line with Ministry of Higher and tertiary Education Science and
Technology’s expectation.
8.10.2.6 Due to an increase in the number of faculties and departments student enrollment has increased annually over the past six years except for year 2014/15. To date there are approximately 9 710 students as shown in the table below.
Table 39: Student enrolment over the past six (6) years; 2012 – 2018
Academic Year Student Enrollment
2012/2013 7 042
2013/2014 8 650
2014/2015 7 957
2015/2016 8 937
2016/2017 9 342
2017/2018 9 710
Total Student Enrollment to Date 51 638
Source: NUST
8.10.2.7 As a University NUST attracts students some international students. However, overall, there has been a decline in the number of foreign students enrolled at NUST. The table below shows enrolment of international students over the past six years.
Table 40: Enrolment Statistics of international students: 2012 – 2018.
Academic Year Student Enrollment
2012/2013 18
2013/2014 39
2014/2015 32
2015/2016 55
2016/2017 7
2017/2018 9
Total number of international students to date 160
Source: NUST 8.10.2.8 Physical infrastructural developments which have been provided at NUST and in
the city centre in an effort to provide a conducive learning and living environment for students and lecturers. These consist of the following:

Review and Preparation of Bulawayo Master Plan (2019 – 2034) Report of Study
------------------------------------------------------------------------------------------------------------------------------
152
Table 41: Physical Infrastructure at NUST
Type of Physical Infrastructure Number
Administration Block 1
Commerce Block 1
Chemical Engineering Block 1
Chemistry Block 1
Multipurpose Hall 1
Lecture Rooms 53
Gym Hall 1
Laboratories 34
Kitchen 3
Dining Hall 3
Library 5
Workshops 5
Clinic 1
Student Hostels
Main Campus 114 rooms
Rose Flats 14 flats
Faculty of Medicine (Mpilo)
Staff Residence
Wello Court 19 Flats
Gleb Flats 8 Flats
No. 55 Jason Moyo 19 Flats
Source: NUST
8.10.2.9 Whilst efforts have been undertaken to implement the University Master Plan, there has been very little funding being allocated to facilitate construction of other essential infrastructure at the University. To date there are some incomplete or outstanding developments such as the Faculty of Communication and Information, Faculty of the Built Environment, Faculty of Environmental Science, Faculty of Industrial Technology, Faculty of Applied Science, Amphitheatre, Central Library, Campus Services centre, Staff Houses, Student Union, Student Residences, Technopark, Sports Complex, Central Stores and the Solar Plant.
8.10.2.10 In addition, in line with developments and market demands some new land use have
been proposed for incorporation into the University Master Plan for implementation in future. These include prefabricated Lecture Halls, the DNA Test Centre, Incinerator, shopping mall and a filing station and a University garden.

Review and Preparation of Bulawayo Master Plan (2019 – 2034) Report of Study
------------------------------------------------------------------------------------------------------------------------------
153
8.11 Lupane State University
Lupane State University was established through an act of the Zimbabwe parliament in 2004 and opened its doors to 14 pioneer students in the faculty of Agricultural Sciences in August 2005.
8.12 Catholic University
8.12.1 The Catholic University is a self funding institution which was established in 1998. The
Bulawayo campus was opened in 2014. At inception the University had 2 Faculties (Faculty of Commerce: with 1 department - Business Management and IT and Faculty of Humanities: with 2 departments - Arts & Theology). Currently we have 3 Faculties (not 7) i.e. Commerce (with 3 Departments - Business Management; IT; Accounting); Humanities & Social Sciences (with 3 departments; Arts, Development Studies; Theology) and Education (with 1 department -Education).
8.12.2 There are plans to introduce additional degree programs such as Bachelor of
Education in IT, Bachelor of Banking and Finance, Bachelor of Economics and Bachelor of Law. In addition to the undergraduate degree programs on offer short courses in project management monitoring & evaluation, applied research methodology, church administration, migration and international relations, geographic information systems and remote sensing, computer applications and packages, business administration, NGO management, chaplaincy, disaster management, peace building studies and Global MBA in impact entrepreneurship.
8.12.3 The first graduates from the Catholic University were in 2016 (13) and in 2017 there
were 50. To date 73 students have graduated from the Catholic University. Enrolment at the University is currently at 704 and all the students are undertaking undergraduate degree programs and they are all Zimbabweans. Yearly enrollment at the University is 150 students per year on average.
8.12.4 At Inception the University had a staff compliment of 5 Academic staff and 3
administrative staff which has since increased to 36 academic staff and 20 administrative staff and they are all Zimbabweans.
8.12.5 Infrastructural developments at the campus consists of 1 staff residence, 3 student
hostels with a capacity to accommodate 108 students, a chapel, 10 lecture rooms, dining room, a laboratory, a library and cafeteria.

Review and Preparation of Bulawayo Master Plan (2019 – 2034) Report of Study
------------------------------------------------------------------------------------------------------------------------------
154
8.13 The Zimbabwe School of Mines
7.13.1 The Zimbabwe School of Mines is a unique, dynamic and vibrant mining training
Institution that was formed by a Presidential Charter in 1994 although its existence
dates back to 1926 where it was operating from Gifford High School.
8.13.2 In 1934 the School of Mines was moved from Gifford High School to be under the Bulawayo Technical School. In 1994 The Zimbabwe School of Mines moved to the current premises in Killarney after obtaining its own Presidential Charter to run as a separate entity which serves all counties in the SADC region.
8.13.3 To-date there is no other infrastructure in Bulawayo or anywhere else. However, there are plans which are at an advanced stage to have centers in the following towns/cities:
❖ Mutare – Gemology center. ❖ Msipani (Zvishavane) – Small Scale & Artisanal miners center/ Platinum research center. ❖ Bulawayo (along Harare road) – Mine Rescue Center.
8.13.4 At inception in 1994 there was 1 (one) department, i.e. Mining but Currently the number of departments has since increased to 6 (six) departments as follows:
❖ Mining Geology. ❖ Mine Surveying. ❖ Mining. ❖ Mineral Processing and Extractive Metallurgy.
❖ Metallurgical Assaying.
❖ Mine Ventilation and Environmental Engineering.
8.13.5 The School has also developed short courses which vary from time to time. Plans are
underway to develop more departments, e.g. the diamond, cutting and polishing course, coal bed methane course. In addition the school plans to introduce the post graduate degrees, e.g. B Tech level.
8.13.6 The institution mainly offers full time study to students at the following levels;
National Certificate, National Diploma and Higher National Diploma in mining related courses/disciplines. Certificates are also issued for all short courses. However, there has been an introduction of a one year block release course in some of the disciplines.
8.13.7 At inception in 1926 the mining school then Bulawayo Technical School had s staff compliment of 5 lecturers and 39 students. Enrolment at the institution has been on
the increase as shown in the table below:

Review and Preparation of Bulawayo Master Plan (2019 – 2034) Report of Study
------------------------------------------------------------------------------------------------------------------------------
155
Table 42: Student enrolment over the past six (6) years; 2012 – 2018
Discipline (NC - HND)
Mining Geology
Mining Mine Surveying
Mineral Processing &
Extractive Metallurgy
Met.
assaying
Mine ventilation & environ.
Engineering
Totals
2012 99 84 90 84 38 0 395
2013 152 155 142 137 52 0 638
2014 152 150 140 157 52 34 685
2015 142 143 113 150 60 27 635
2016 180 185 146 185 52 49 797
2017 210 213 133 207 43 42 848
2018 215 263 111 223 41 58 911
TOTALS 1 150 1 193 875 1 143 338 210 4 909
Source: School of Mines & Field Surveys 8.13.8 As an institution which had focus to train students from around the SADC and beyond,
the mining schools has is still playing its role. However, overall, there has been a decline in the number of foreign students enrolled at the Zimbabwe School of Mines. The table below shows enrolment of international students over the past six years.
Table 43: Enrolment Statistics of foreign students for the past six (6) years: 2012 – 2018.
Country 2012 2013 2014 2015 2016 2017 2018 Totals
Angola 1 1 2
Botswana 2 2 2 2 2 1 11
Equatorial Guinea 12 10 10 9 41
Gambia 1 1
Namibia 56 59 44 31 9 5 1 205
South Africa 1 1 2
Totals 58 61 47 46 21 17 12 262
Source: Zimbabwe School of Mines & Field Surveys
8.13.9 The School of Mines is making a large contribution towards the production of skilled manpower. The number of graduates who have been produced at the school to serve the mining industry to date is shown in the table below.
Table 44: Graduation Statistics over the past 5 years
YEAR TOTAL GRADUATES (ND & HND)
2014 155
2015 152
2016 172
2017 185
2018 260

Review and Preparation of Bulawayo Master Plan (2019 – 2034) Report of Study
------------------------------------------------------------------------------------------------------------------------------
156
Total 1 839
Source: Zimbabwe School of Mines 8.13.10 The School of Mines has a staff compliment of sixty-eight (68) staff members. All the
members of staff are Zimbabweans.
Table 45: Staff Compliment at the School of Mines
Division / Section Staff Compliment
Senior Management 5
Management (H.O.D’s) 6
Senior Lecturers 3
Lecturers 9
Section Heads 11
Technicians 8
Clerks, Support Staff, Security, General Hand. 26
Total 68
Source: Zimbabwe School of Mines
8.13.11 In terms of physical and social infrastructural development the Zimbabwe School of Mines infrastructure has the following infrastructure;
Table 46: Social and Physical Infrastructure at the Zimbabwe School of Mines
Existing Social/Physical Structure Number
Conveyor belt (Main gate) 1
Guard Room 1
Staff quarters / residence 6
Guest House 1
Hostel – accommodates 86 students 1
Dining Hall and kitchen 1
Administration block 1
Wooden cubicles (library, stores, assets and human capital offices) 2
Football pitch 1
Lecture rooms (5 blocks) 8
Laboratories (Mining, Chemistry, Geology, Survey, ICT, Metallurgy, Assay) 7
Academic block (lecturing staff offices) 1
Auditorium 1
Fire Assay Storeroom 1
Works department station 1
Electrical meter storeroom 1
Recreational facility room 1
Building material storeroom 1
Source: Zimbabwe School of Mines

Review and Preparation of Bulawayo Master Plan (2019 – 2034) Report of Study
------------------------------------------------------------------------------------------------------------------------------
157
8.13.12 There are some outstanding developments as per the Zimbabwe School of Mines Master Plan. These include;
➢ Clinic construction.
➢ Library and Registry block.
➢ 2 x Hostels.
➢ Ceremonial hall.
8.13.13 The main challenge being experienced by the Zimbabwe school of Mines is funding
for developmental projects under the current challenging economic environment and dwindling foreign enrolment due to varied reasons befalling Zimbabwe. The School is in dire need of land for student accommodation and sporting facilities around the Killarney areas to compliment growth of the School over the years.
8.14 Hillside Teachers College
8.14.1 Hillside Teachers college is a secondary school training college which was established in
1956. The teachers college offers training in various specialist subjects to secondary school teachers. At inception the College had 2 departments but these have since increased to ten (10) namely Art Craft and Design ,Theory of Education, English, Geography, Physical Education, Mathematics, Science, Music, Professional Studies and History.
8.14.2 At Inception the college had an initial enrolment of 120 per annum but this has since
increased over the years. The current enrolment is 1 500. The College offers Diploma as well as degrees on a block release. Over the past five (5) years the college has offered 3 779 diplomas and twenty two (22) degrees as shown below.
Table 47: Number of Graduates at Hillside Teachers College over the past 6 years
Year Number of Graduates
2012 1017
2013 576
2014 576
2015 511
2016 588
2017 511
Total 3 779
Source: Hill side Teachers College
8.14.3 In terms of Social/Physical infrastructural developments at Hillside Teachers college the following has been developed.

Review and Preparation of Bulawayo Master Plan (2019 – 2034) Report of Study
------------------------------------------------------------------------------------------------------------------------------
158
Table 48: Social and Physical Infrastructure at Hillside Teachers College
Existing Social/Physical Structure Number
Student hostels – accommodates 699 students 6
Guard Room 1
Staff quarters / residence 4
Dining Hall and kitchen 1
Administration block 1
Sports area and gym 1
Lecture rooms 11
Laboratories 13
Source: Hillside Teachers College 8.14.4 The college has plans to construct the following projects in future; classroom blocks
with 10 rooms each, science laboratory with a capacity of 100 students, lecture theatre accommodating 500 students, extension of the administration office to accommodate 10 offices, 30 lecture’s offices, extension of the library, chapel with a capacity of 100, college bookshop, 20 units of staff accommodation as well as 7 flatlets, sports pavilion with ancillary facilities such as ablution blocks with showers, change rooms, first aid room, kitchen as well as a lounge/cafeteria, 2 student hostels with a capacity of 100 each, construction of an incinerator, agricultural too shed and store room with change rooms and ablution facilities and an asset tool shed.
8.15 United College of Education
8.15.1 United College of Education (UCE) is a primary school training college which was
established in 1968. The teachers college offers training to primary school teachers. At inception the college had three (3) departments namely music, infants and general but these have since been increased to seven (7) to include Education, Early Childhood Development, Sciences and Practical Subjects, Humanities and Languages. In addition, UCE plans to separate special needs education from the department of Education so that it becomes a stand alone department and offer special needs education course on block release as opposed to the current full time program which is offered for sixteen months.
8.15.2 At Inception the college had an initial enrollment of 113 students per annum but this
has since increased over the years. The current enrollment is 739 constituting of 732 for ECD and general education and 7 special needs. The College offers Diploma a 3 year diploma program. Over the past five (5) years the college has offered 639 diplomas to the graduates as shown in the table below.

Review and Preparation of Bulawayo Master Plan (2019 – 2034) Report of Study
------------------------------------------------------------------------------------------------------------------------------
159
Table 49: Number of Graduates over the past five years
Year Number of Graduates
2013 246
2014 364
2015 455
2016 459
2017 639
Total 2 163
Source: United College of Education
8.15.3 In terms of Social/Physical infrastructural developments at the United college of Education the following has been developed.
Table 50: Existing Social and Physical Infrastructure at the United College of Education
Existing Social/Physical Structure Number
Student hostels – accommodates 600 students 6
Guard Room 1
Staff quarters / residence 6
Hall 1
Dining Hall and kitchen 1
Administration block 1
Sports area and gym 1
Lecture Theatre 1
Laboratories 3
Library 1
Church 1
Source: United College of Education 8.15.4 The college has plans to construct the following projects in future; early childhood
development centre, sports pavilion, staff houses, new administration block, lecture rooms, multi purpose hall, student hostels. Computer science laboratories, a block of flats, EMT room and Tartan track.
8.16 Bulawayo Polytechnic
8.16.1 The Bulawayo Polytechnic was established in 1927 and is the second largest Polytechnic
in Zimbabwe. It has two (2) campuses, the main campus is located at the corner of 12th Avenue and Park road in Suburbs while the city campus is situated between 11th and 12th avenue along George Silundika in the city centre. The institution prides itself in being a provider of highly empowered human capital through scientific, Technical, Vocational Education and Training for sustainable socio economic development. The institution offers various programs both full time and on a part time basis.

Review and Preparation of Bulawayo Master Plan (2019 – 2034) Report of Study
------------------------------------------------------------------------------------------------------------------------------
160
8.16.2 There are three (3) Departments namely the Department of Applied Art and Design, Department of Automotive Engineering and the Department of Adult and Continuing education and five (5) Divisions at the Bulawayo Polytechnic. The Divisions are the Division of Applied Science and Technology, Division of Commerce, Division of Civil and Construction Engineering, Division of Electrical Engineering and the Division of Mechanical Engineering. There are some courses on offer under Parallel Programme especially the City & Guilds Courses. Training at Bulawayo Polytech is offered at the following levels: Bachelor of Technology Degree Programmes, Higher National Diploma, National Diploma and National Certificate.
8.16.3 In terms of Social/Physical infrastructural developments at the Bulawayo Polytech the
following have been developed.
Table 51: Existing physical Infrastructure at the Bulawayo Polytech
Existing Social/Physical Structure Number
Student hostels – accommodates 556 students 12
Guard Room 1
Staff quarters / residence
Dining Hall and kitchen 1
Administration block 1
Sports area 1
Halls 3
Library 1
Lecture rooms 152
Laboratories 13
Source: Bulawayo Polytechnic 8.16.4 The college has plans to rehabilitate and construct the following projects in future; multi
purpose hall, sports facilities, solar water heating plant, incinerator as well as upgrade the water and plumbing systems.
8.17 School of Hospitality and Tourism
8.17.1 The school of Hospitality and Tourism was established in 1963 as a Division of the
Bulawayo Polytechnic. At inception the department had a student enrolment of 12 and 1 lecturer though its maximum capacity was 40 students. A complex for the school was constructed in 1993 within the Polytechnic premises. The school has established a satellite campus in Harare at the Management Training Bureau old site. The school offers conventional training in Tourism and Hospitality Management, Food and Beverage Management, Professional Cookery and Bakery studies. The various courses are being offered up to Higher National level though informal sector support is being offered to those who do not possess the requisite qualifications. Training at the hotel

Review and Preparation of Bulawayo Master Plan (2019 – 2034) Report of Study
------------------------------------------------------------------------------------------------------------------------------
161
school is being offered on a full time, part time basis and block release to suite the needs of the market.
8.17.2 In 1997 – 98 the school was earmarked for commercialization in line with government
policy to ensure revenue generation from operations and to be able to retain the funds in the school. In an effort to enhance student training, the school established Hotel St Patrick’s in 2011 as a business unit of the school. Enrolment at the Bulawayo campus is about 700 students and 40 lecturers while the Harare satellite campus has an enrolment of about 100.
8.18 Westgate Industrial Training College
8.18.1 Westgate Industrial Training College (WITC) was established in 1983 by the Ministry of
Manpower Planning and Development. The institution was set up to address the needs of industry viz a viz training skilled employees from unclassified to class one.
8.18.2 At inception there was only one (1) department, Automotive engineering but now there
are three (3) departments automotive, electrical and mechanical engineering. There are four (4) main trades which are being offered at WITC on a three (3) month full time basis namely automotive engineering, electrical engineering, mechanical engineering and the fabrication section. There are plans to introduce civil and construction department. At inception WITC had an enrolment of 24 but at the time of the survey WITC had a total enrollment of 800. These courses are offered at National certificate level. The staff compliment at the institutions as at August 2018 is 57 consisting of 21 lecturers, 13 administration staff, 6 kitchen staff, 7 security guards, 6 grounds man and 4 working at the stores.
8.18.3 In addition to the above courses being offered on a full time basis there are short term
which are being offered in the above trades for a duration of twelve (12) Saturdays. 8.18.4 Infrastructural developments at WITC constitute of 2 hostel for males and females each
with an occupancy capacity of 40 students, 3 staff residencies, a machine shop, kitchen, dining hall and a guard room. There exists the electrical engineering block, conference room, computer laboratory and classroom, automotive engineering and fabrication section, administration block and the classroom block. Outstanding projects as per college master plan include 1 student hostel, civil and construction engineering workshop, library and an administration block.
8.18.5 There major challenges being experienced be WITC are financial challenges to facilitate
the development of some projects such as a hostel, civil and construction engineering workshop, library and administration block. In addition the college does not have any playfields for students.

Review and Preparation of Bulawayo Master Plan (2019 – 2034) Report of Study
------------------------------------------------------------------------------------------------------------------------------
162
CHAPTER 9 9.0 PRIMARY HEALTH CARE HEALTH FACILITIES 9.1 INTRODUCTION
9.1.1 The United Nations’ (UN) agency on health, the World Health Organisation (WHO)
observes that “better health is central to human happiness and well-being. It also makes
an important contribution to economic progress, as healthy populations live longer, are
more productive, and save more”. An unhealthy population has huge adverse
implications for city development. Another important consideration in development
planning is the correlation between health and development which is that health
impacts on development and similarly, development impacts on health. Urban planning
has an obligation to ensure that better health is provided for citizens and should impact
positively for the development of the city and country and that oppositely, development
planning has an impact on the achievement of health goals. Put simply, health promotes
development and development promotes health. Whereas Baron (2009) notes that
good spatial planning helps improve the liveability of areas, this study looks at other
built environment disciplines and their relationships with the health sector.
9.2 THE LEGISLATIVE FRAMEWORK
9.2.1 The Zimbabwean Constitution 9.2.1.1 The Constitution of Zimbabwe explicitly provides for the right to health care in Section
76, sub-section 1 to 4 that:
(1) every citizen and permanent resident of Zimbabwe has the right to have access to
basic health-care services, including reproductive health;
(2) every person living with a chronic illness has the right to have access to basic
healthcare services for the illness;
(3) no person may be refused emergency medical treatment in any health-care
institution, and
(4) the State must take reasonable legislative and other measures, within the limits of
the resources available to it, to achieve the progressive realization of the rights set
out in this section
9.2.1.2 The Constitution further provides, in Section 77 that every person has a right to safe,
clean and potable water, and sufficient food (Food Security, Quality and Safety). These
rights are directly related to peoples’ health as it not possible to divorce the living

Review and Preparation of Bulawayo Master Plan (2019 – 2034) Report of Study
------------------------------------------------------------------------------------------------------------------------------
163
conditions of people from their health risks and status. This national health strategy is
indeed subordinate to these constitutional provisions and the State has the
responsibility to create a conducive environment in which it is possible for all people in
Zimbabwe to access basic health services whenever they need them.
9.3 PRIMARY HEALTH CARE
9.3.1 Primary Health Care service in Bulawayo are being provided to the public through
Government and Local authorities institutions playing a dominant role. However, the
majority of the health facilities especially clinics are managed by the City Council. Health
services provision is complemented by the private sector, NGOs and traditional medical
care.
9.3.2 Interwoven into this health care nexus is the international community and the United
Nations’ specialized agency on health; the World Health Organization and its associated
UN agencies. There is a wide range of multi-sectoral and interdisciplinary responsibilities
which have an impact on city planning and healthcare service delivery. This chapter
endeavours to explore the links and roles of relevant stakeholders and how they impact
on the delivery of primary health care in the city of Bulawayo.
9.3.3 The hierarchy, type of facility and administrative arrangements are within the public
health care system are shown on Figure 19. At the apex of the facility hierarchy is the
central hospital, below it is the provincial hospital, district hospital and the rural health
centre and clinic. This also serves as a referral hierarchy of health care from the primary
level up to the quaternary level of care. The public health care system hinges on the
public sector as the main health care provider for the majority of the population in the
city.

Review and Preparation of Bulawayo Master Plan (2019 – 2034) Report of Study
------------------------------------------------------------------------------------------------------------------------------
164
Figure 19: Health Care System in Bulawayo
Source: Job Jika and Associates
9.4 MINISTRY OF HEALTH AND CHILD CARE
9.4.1 The Ministry of Health and Child Care is charged with the responsibility is to set out
policies and provide a legal enabling environment for the operation of the various
actors. Its mandate is to promote a healthy citizenry and a quality of life of the people.
9.4.2 Among other functions of the Ministry are;
• the identification and analysis of the priority health challenges and needs;
• formulating health policy and setting national standards and guidelines;
• improvement of the national health information system;
• monitor implementation of national health plans, compliance to national policies
and guidelines;
• mobilise and allocate resources and institute expenditure;
• mobilise and allocate resources;
• monitor disease trends, quality of care and population health status;
• monitor adherence to pharmaceuticals policies, medicines and drugs quality,
availability and distribution of medicines and drugs;
• health planning and strategy development;
INSTITUTION LEVEL OF CARE
LEVEL OF ADMINISTRATION
Quantinary
Tertiary
Secondary
Primary
National
Village/Ward
District
Provincial
Go
vern
me
nt,
Pri
vate
Se
cto
r,, N
GO
s, T
rad
itio
nal
Med
ical
Pra
ctit
ion
ers,
Inte
rna
tio
nal
Co
mm
un
ity,
Un
ite
d N
atio
ns
Age
nci
es
Pri
vate
Se
cto
r, N
GO
s, T
rad
itio
nal
Med
ical
Pra
ctit
ion
ers,
Inte
rna
tio
nal
Co
mm
un
ity,
Un
ite
d N
atio
ns
Age
nci
es
Other Service Providers
MINISTRY OF HEALTH AND CHILD CARE Funders

Review and Preparation of Bulawayo Master Plan (2019 – 2034) Report of Study
------------------------------------------------------------------------------------------------------------------------------
165
• coordinate the training and development of health managers;
• create a conducive regulatory environment for both public and private providers;
• administer the enabling acts of Parliament in implementation of health care
services;
• national health related research;
• ensure inter agency co-ordination in the context of health delivery; and
• liaise with international health organisations and donor agencies
9.5 BULAWAYO CITY COUNCIL
9.5.1 Bulawayo City Council performs its health service delivery mandate through the
Department of Health Services’ personal health and environmental directorates. It
operates clinics and conducts community-based health services.
9.5.2 The Department of Health Services personal health directorate performs the following
functions:
i) Outpatient care
ii) Maternity care
iii) Child and adolescent health care
iv) Prevention of parent to child transmission of HIV
v) Co-ordination of community participation for health initiatives.
9.5.3 The environmental health directorate offers the following services:
i) Health inspections
ii) Cleaning services
iii) Pest control
iv) Cemetery and crematorium management
9.5.4 Private Health Care
The private sector plays a significant role in primary health care service provision. There
are private hospitals, private clinics and surgeries.
9.5.5 Traditional Medical Care
Regulated through the Zimbabwe National Traditional Healers Association (ZINATHA), traditional medicines and drugs has risen to prominence in health care service delivery in the city. This service is rendered predominantly to the black African population as an ingrained aspect of African culture.

Review and Preparation of Bulawayo Master Plan (2019 – 2034) Report of Study
------------------------------------------------------------------------------------------------------------------------------
166
9.5.6 United Nations Universal Health Development Goals
9.5.6.1 The United Nations plays a critical and supportive role in promoting good health
globally. It works through a network comprising the World Health Organisation at the
fore and supported by other UN agencies. These include the General Assembly and
the Economic and Social Council, Joint United Nations Programme on HIV/AIDS
(UNAIDS); United Nations Population Fund (UNFPA) in support of reproductive,
adolescent and maternal health; and the United Nations Children’s Fund (UNICEF). The
United Nations has set targets in the form of goals to be achieved at specific times and
most prominently, the 2015 Millennium Development Goals and the 2030 Agenda for
Sustainable Development Goals.
9.5.7 2015 Millennium Development Goals
9.5.7.1 The United Nations set eight Millennium Development Goals (MDGs) – of which the
health-related goals seek to eradicate extreme poverty and hunger; reduce child
mortality; improve maternal health and to combat HIV/AIDS, malaria and other diseases
by 2015. An evaluation is made to establish the extent to which these goals were met or
what plans are in place towards the attainment of these goals in Bulawayo.
9.5.8 2030 Agenda for Sustainable Development Goals
8.5.8.1 The United Nations has now adopted the 2030 Agenda for Sustainable Development
Goals (SDGs). The relevant goal in the health sector is Sustainable Development Goal 3
(SDG 3) which is to ensure healthy lives and promote the well-being for all at all ages.
The following are the sub-goals or goals within this goal:
i) By 2030, reduce the global maternal mortality ratio to less than 70 per 100 000 live births;
ii) By 2030, end preventable deaths of new-borns and children under 5 years of age, with all countries aiming to reduce neonatal mortality to at least as low as 12 per 1000 live births and under-5 mortality to at least as low as 25 per 1000 live births;
iii) By 2030, end the epidemics of AIDS, tuberculosis, malaria and neglected tropical diseases and combat hepatitis, water-borne diseases and other communicable diseases;
iv) By 2030, reduce by one third premature mortality from non-communicable diseases through prevention and treatment and promote mental health and well-being;
v) Strengthen the prevention and treatment of substance abuse, including narcotic drug abuse and harmful use of alcohol;
vi) By 2020, halve the number of global deaths and injuries from road traffic accidents;

Review and Preparation of Bulawayo Master Plan (2019 – 2034) Report of Study
------------------------------------------------------------------------------------------------------------------------------
167
vii) By 2030, ensure universal access to sexual and reproductive health-care services, including for family planning, information and education, and the integration of reproductive health into national strategies and programmes;
viii) Achieve universal health coverage, including financial risk protection, access to quality essential health-care services and access to safe, effective, quality and affordable essential medicines and drugss and vaccines for all;
ix) By 2030, substantially reduce the number of deaths and illnesses from hazardous chemicals and air, water and soil pollution and contamination.
9.6 HEALTH ASSESSMENTS APPROACHES
9.6.1 The different role-players and their functions, mandates, goals and targets are outlined
with a view to assessing their performance in fulfilling their mandates or achieving the
set targets. As such, analysis is made on the underlying reasons for non-accomplishment
thereof and recommendations to overcome impediments identified.
9.6.2 The study includes four major assessments approaches based on health and land use
data, including:
i) Community Health Assessment: highlights major health trends in morbidity (the
incidence of disease or being unhealthy within a population) and mortality (the number
deaths or death rate in the population and the underlying reasons.
ii) Health Systems Trends Assessment: looking at the changes in community health over
time in the city
iii) Capacity of Resources and Gap Assessment: in terms of the utilisation and availability of
resources in the health care system (including hospitals, clinics, specialised facilities
emergency medical services, in the city;
iv) Spatial Planning and Land Use Assessment: the assignment of land uses to health
facilities in terms of demand versus supply and the spatial dynamics in medical facilities
and of course the future state of the city’s medical scape.
9.7 SPATIAL DISTRIBUTION OF HEALTH FACILITIES
9.7.1 This section below deals with the spatial distribution of health facilities within the city in
an effort to appraise spatial equity or inequality within the context of spatial planning
and land use management.
9.7.2 Hospitals
9.7.2.1 The colonial spatial structure (lower population density in east and higher population
density in the west) is still evident in Bulawayo’s spatial structure. Most higher order
health facilities are located in the eastern part of the city with a limited inclination
towards the western part of the city on the western edge of Bulawayo Central Business

Review and Preparation of Bulawayo Master Plan (2019 – 2034) Report of Study
------------------------------------------------------------------------------------------------------------------------------
168
District (CBD). At the apex of the primary health care delivery hierarchy in Bulawayo
there is the United Bulawayo Central Hospitals, Ekusileni, Premier hospital and all Saints
children’s hospital located in the eastern periphery of the CBD, Ingutsheni Central
Hospital is located to the south of the CBD. Mpilo Central Hospital and Thorngrove
Hospital are located on the western edge of the CBD. A summary of the major health
facilities in the city is shown on Table 51 below.
Table 52: Major Health Facilities in the City
Name of Health
Facility
Year of
Establishment
No of
beds
Staff
Establishment
Existing Staff Compliment
Catchment
Area
All Saints
Children’s
Hospital
2016 30 26 22 Bulawayo
Metropolitan
Province
Mpilo Central
Hospital
1954 1 866 1 620 1 519 Bulawayo
Metropolitan
Province
Matabeleland
North and
South
Provinces and
Midlands
Provinces.
United Bulawayo
Hospitals
1937 650 1 384 1 243 Bulawayo
Metropolitan
Province,
Matabeleland
North and
South
Provinces,
Masvingo and
Midlands
Provinces
Engutsheni
mental Hospital
1908 708 136 132 National
referral
hospital
Mater- Dei 1953 169 235 235 Bulawayo
Metropolitan

Review and Preparation of Bulawayo Master Plan (2019 – 2034) Report of Study
------------------------------------------------------------------------------------------------------------------------------
169
Province.
Premier Hospital 2006 42 53 53 Bulawayo
Metropolitan
Province,
Matabeleland
North and
South
Provinces.
Corporate 24 2016 30 - 100 Bulawayo
Metropolitan
Province,
Matabeleland
North and
South
Provinces,
Masvingo and
Midlands
Provinces.
Ekusileni 2004 Not yet
Operational
Thorngrove 1941 200 65 15 Bulawayo
Metropolitan
Province,
Matabeleland
North and
South
Provinces.
Source: Job Jika & Associates
9.7.3 Mpilo Central Hospital
9.7.3.1 Mpilo Central Hospital was established in 1954 and is a 1250 bed referral hospital which
not only services Bulawayo, but acts as a major referral centre for Matabeleland North,
greater Bulawayo and Midlands Provinces. The hospital is located off the Old Falls Road
in the high density suburb of Mzilikazi. It offers a wide variety of services including
dental, oncology, surgery, orthopaedics, obstetrics and gynaecology, ophthalmology,
diagnostic (radiology and laboratory), medicine, renal dialysis. Mpilo runs a multi

Review and Preparation of Bulawayo Master Plan (2019 – 2034) Report of Study
------------------------------------------------------------------------------------------------------------------------------
170
disciplinary nurses training school for students undertaking courses in Radiology,
Midwifery and General Nursing.
9.7.3.2 The hospital is experiencing challenges which are mainly a result of the extended
economic depression which has affected not only the physical infrastructure but also
technical installations and equipment. The country has not kept pace with global
development and technological advances in various sectors and the medical field has
not been spared. There is high staff turnover in health personnel and specialists owing
to the economic challenges facing the country and subsequently, Mpilo hospital faces
understaffing problems.
9.7.4 United Bulawayo Hospitals
9.7.4.1 The United Bulawayo Hospitals (UBH) is located next to Woodlands suburb along the old
Esigodini Road. The hospital acts at the provincial and referral centre for Matabeleland
South and the Midlands Province. There are seven (7) hospitals which comprise the UBH
with various specialities. It was established in 1937, the Bulawayo United Hospitals is
one of three referral hospitals servicing Bulawayo, Matabeleland North and South
Provinces and Midlands Provinces. The hospital is a conglomerate of the following
hospitals:
i) Main Bulawayo Central Hospital;
ii) Lady Rodwell Maternity Hospital;
iii) Richard Morris Hospital and
iv) Robbie Gibson Hospital
9.7.4.2 It is a 650 bed hospital offering ophthalmology, surgery, medicine, obstetrics,
gynaecology and school of nursing. The hospital has not been immune from the
economic downward spiral that has adversely hit medical institutions and the
subsequent deterioration in medical services in the in the city and its service area.
9.7.4.3 The major challenges facing the hospital include inadequate funding by government; old
and obsolete capital equipment; lack modern state of the art machines and general
medical supplies. The institution has a shortage of specialist staff e.g. neurosurgeons,
paediatricians, anaesthetists and a pathologist as well as other staff members in the
medical field.
9.7.5 Ingutsheni Central Hospital
9.7.5.1 Ingutsheni Central Hospital is the largest and oldest national Psychiatric referral centre
in the country. The hospital can accommodate 700 patients with mental health
challenges. The number of patients at the institution is increasing with no proportionate
improvement in the creation of an enabling environment for the institution to cater for
the needs of the mentally challenged patients. Compounding the increase in the

Review and Preparation of Bulawayo Master Plan (2019 – 2034) Report of Study
------------------------------------------------------------------------------------------------------------------------------
171
number of patients at the institution is the phenomenon of Ingutsheni becoming a
permanent home for some patients. Some mental patients find it difficult to adjust or be
accommodated outside specialised care hence there a is need for proactive steps to be
taken to either expand the institution, prevent over-population, provide more
institutions of this nature, etc.
9.7.5.2 Some of the challenges faced by Ingutsheni Mental Hospital include
i) Inadequate funding - Health care at the institution is free and is dependent on
allocation from the national fiscus. Treasury disbursements to the institution are
erratic and inadequate. Inadequate budgetary provision affects the operations
and capital infrastructure development at the institution;
ii) Understaffing - The ideal nurse to patient ratio is 1:1 while the existing ratio is
1:3. This is not ideal in an institution housing people with mental challenges and
who require a lot of nursing attention.
iii) Shortage of drugs – This is critical in giving the providing care to patients as
provision of drugs is essential to patients some of whom sedatives are requisite
in calming them down.
iv) Understaffing - The ideal nurse to patient ratio is 1:1 while the existing ratio is
1:3. This is not ideal in an institution housing people with mental challenges and
who require a lot of nursing attention. Generally, Zimbabwe has only 14
psychiatrists to cater for the 1.3 million mental patients.
v) Shortage of drugs – This is critical in providing care to mentally challenged
patients as provision of drugs is essential to some patients who rely on sedatives
to calm them down.
9.7.6 Public Institutional Primary Health Care
9.7.6.1 The Zimbabwe Defence Forces, the Zimbabwe Republic Police and Zimbabwe Prisons
and Correctional Services namely; Lookout Masuku Barracks, Khami Maximum Prison
Complex, Bulawayo Prison and Ross Camp have health facilities within their institutions.
Some of these facilities are not compliant with the standards set by the Health
Professions Council notably: Khami Maximum Prison Clinic and Bulawayo Prison Clinic.
Non-compliance with minimum standards for operation of clinics be they public or
private poses a threat to primary health care. The situation becomes dire when
standards are compromised in institutions dealing with in-mates such as prisons which
are oftentimes characterised by congested living conditions and exposure to infections.
9.7.6.2 The problems experienced at public health institutions in the city are similar. The
facilities are experiencing funding challenges, understaffing shortage of medicines and
drugs. This has adversely affected the quality of primary health care service delivery in
the city.

Review and Preparation of Bulawayo Master Plan (2019 – 2034) Report of Study
------------------------------------------------------------------------------------------------------------------------------
172
9.7.7 Private Healthcare Services
9.7.7.1 The private sector, surgeries, private institutions, parastatals, non-governmental organisations and traditional medical care play an important role in the provision of primary health care in the city. The private hospitals in Bulawayo are located in the eastern part of the city and Bulawayo CBD namely, Mater Dei Hospital located in Malindela, Premier Service Medical Investments (PSMI) Hospital in Hillside and Corporate 24 is located in the CBD and the yet to be operationalised Ekusileni Medical Centre is also located in Hillside. Ekusileni Medical Centre is set to operate in 2019. These facilities are within easy reach of each other in the eastern part of the city. Other institutions or companies such as the National University of Science & Technology (NUST), National Railways of Zimbabwe (NRZ), Hillside Teachers College, United College of Education, Ceshhar and Schweppes. Private Clinics and surgeries are located throughout the city though mostly are mainly concentrated in the CBD.
9.7.8 Mater Dei Hospital
9.7.8.1 Mater Dei Hospital is situated in Malindela and is administered by a Roman Catholic Board. This private hospital is part of primary health care delivery in Bulawayo which was established from a 50 bed hospital in 1953 to a 169 bed hospital in 2018. The hospital has undergone major upgrades over the years building an Intensive Care Unit (ICU), a paediatric ward and an Accident and Emergency and Operating Theatre Suite. The hospital offers a wide range of health care services including ordinary dental and ophthalmic surgery, laboratory services, physiotherapy, radiology and renal-haemodialysis facilities. The nurse to patient ratio of 1:1 in the ICU and 1:5 in the wards.
9.7.8.2 Like most health institutions in the country some of the challenges being experienced at
the hospital include; inadequate funding as it is dependent on donor funding, obsolete and old equipment, shortage of medicines and drugs as a result of the economic depression and shortage of foreign currency.
9.7.9 Premier Service Medical Investments (PSMI) Hospital
9.7.9.1 Premier Hospital was established in 2006 and located in Hillside suburb. This hospital is part of the major primary health care delivery in Bulawayo. It is a 42 bed hospital as per design. The hospital offers a wide range of health care services except for pharmacy services and radiology which are still to be established. The nurse to patient ratio at the hospital is 1:7.
9.7.9.2 Like most health institutions in the country the challenges being experienced at the
hospital are high cost of drugs and a shortage of foreign currency

Review and Preparation of Bulawayo Master Plan (2019 – 2034) Report of Study
------------------------------------------------------------------------------------------------------------------------------
173
9.7.10 Ekusileni Medical Centre
9.7.10.1This is a private hospital which was the brain child of the late Vice President Dr J. M.N.
Nkomo and has been lying idle for 17 years. Concerted efforts are underway to
operationalise the facility in 2019. The facility is expected to be a multi-disciplinary
specialised hospital encompassing a maternity wing, theatres, Intensive Care, dental,
high dependency and neo-natal units, etc. The hospital will use modern state of the art
equipment after the earlier deployment of obsolete equipment was stopped by
government.
9.7.11 Corporate 24
9.7.11.1Corporate 24 is situated in the City Centre. The hospital was established in 2016 and has become part of the major primary health care delivery in Bulawayo. The hospital was established after renovations were undertaken on a commercial building in the city to establish the 30 bed facility. Services being offered at the hospital include an Intensive Care Unit (ICU), laboratory, a maternity ward, paediatric ward and an Accident and Emergency and Operating Theatre Suite. The hospital does not have full time doctors, but they work closely with some private practitioners (specialists) who are called to attend to cases. The hospital is awaiting for registration certificate to operationalize the radiology and pharmacy departments.
9.7.8.2 Like most health institutions in the country some of the challenges being experienced at
the hospital include; high staff turnover and a shortage of drugs as a result of the economic depression and shortage of foreign currency.
9.7.12 All Saints Children’s Hospital
9.7.12.1All Saints children’s Hospital is a 24 hour pediatric health facility which is located in Hillside suburb. The private hospital is part of primary health care delivery in Bulawayo which was established became operational in September 2016. All saints is 30 bed hospital (25 coats and 5 for teenagers). The hospital was established as a result of a change of land use which resulted in the establishment of an administration block, private rooms, shared wards, staff tea room, staff changing rooms, visitors toilets, milk kitchen, scullery, pantry and suckion equipment for oxygen. The hospital also works closely with strategic partners in the provision of services such as X – ray (Mater dei) and laboratory (Lancet).
9.7.12.2 There are plans to develop a surgical wing (surgical wing) include a casuality, admit for
observation and x ray facility 9.7.12.3 Like most health institutions in the country some of the challenges being experienced
at the hospital include; shortage of medicines and drugs as a result of the economic depression and shortage of foreign currency.

Review and Preparation of Bulawayo Master Plan (2019 – 2034) Report of Study
------------------------------------------------------------------------------------------------------------------------------
174
9.7.13 Private Clinics and Surgeries
9.7.13.1There are 57 private clinics which are registered with the Health Professions Council.
These are largely concentrated in the Central Business District of Bulawayo where 40 of
these facilities are located in the CBD, 12 are located in the western high density
suburbs while 5 are located in low density areas. These range from private surgeries,
maternity facilities, paediatric, specialist physician practices, and orthotetics and
gynaecology.
9.7.13.2It is encouraging to note that the private sector is extending its primary health care
service to the high density areas. Some private health facilities have been established
through the special consent of council while some have been proactively designated
through spatial planning. Their affinity for the CBD may be due to the lure of
accessibility of the city centre to most parts of the city.
9.7.13.3Challenges being experienced by private institutions and surgeries are similar and all
have had an adverse effect on the effective and efficient delivery of primary health care
in the city. These range from human resource gaps, obsolete infrastructure, shortage of
drugs and medicine and lack of funding to equip and run health facilities effectively and
efficiently.
9.7.13.4These challenges were an impediment towards a significantly high impact drive in the
attainment of the 2015 Millennium Development Goals, a situation largely attributable
to the poor state of the economy for than a decade. There is a danger that should the
socio-economic situation in the country not improve or deteriorate, the 2030 health
sector Sustainable Development Goal 3 (SDG 3) which is to ensure healthy lives and
promote the well-being for all at all ages would be unachievable.
9.7.13.5The fact that health facilities have continued to perform some of their functions albeit
over nearly two decades of progressive decay in infrastructure implies the resilience of
the health infrastructure. However, a situation where adequate and requisite resources
(human and financial) are not provided as required and where hospital infrastructure is
not developed into state-of-the-art modern infrastructure is undesirable in attaining a
developmental state of the City of Bulawayo in the short to long term.
9.7.14 Proposed Private Hospitals
9.7.14.1The Bulawayo City Council has approved the development of three private hospitals in
the city. Except for lower order facilities, there is no private hospital institution in the
western high density areas of the city. However, Shandrilla Investments got approval to
build a 100 bed hospital along Intemba Road in Pumula South while Veronicare plans to
build an 80 bed hospital along Huggins Road in Luveve. These private health facilities
would improve access to private health care in the western part of the city. The

Review and Preparation of Bulawayo Master Plan (2019 – 2034) Report of Study
------------------------------------------------------------------------------------------------------------------------------
175
establishment of health facilities is better guided and informed by comprehensive
spatial planning in order to ensure rational spatial distribution, accessibility and viability
of these medical institutions.
9.7.14.2There are no higher order health care facilities located in the western part of the city
where the majority of the population of Bulawayo resides. Save for Mpilo Central
Hospital and Thorngrove Hospital closer to the CBD, there is therefore a gap in the
provision higher order primary health care facilities in the high density residential area
in the western part of the city. While these central hospitals are currently accessible to
most of the population in the city, further outward growth of the city will render them
inaccessible in future. Increased volume of traffic, higher transportation costs, poor
transport infrastructure and a poor public and private transportation service are some
of the factors that may militate against good interface between higher order health
services and the majority of the residents. The current distribution of higher order
facilities whose distribution is skewed in favour of the edge of the Central Business
District needs attention as it does not only perpetuate spatial inequality in terms of
distribution, but compromises geographic access to facilities.
9.7.15 Bulawayo City Council Health Services
Bulawayo City Council’s Health Services Department offers primary health care and
outreach services. There are twenty (20) clinics that are distributed mostly to the
western side of the city as (16) of the twenty (20) municipal clinics are located in the
high density suburbs while four clinics are located in other parts of the city. Pelandaba,
Emakhandeni and Nkulumane clinics also offer dental services. Mzilikazi, Tshabalala
offer day service for maternity patients while Nkulumane, Pelandaba, Luveve and
Northend clinics offer a 24 hour service. Thorngrove Hospital is located in Thorngrove
residential area and mainly caters for infectious diseases such as Tubercoulousis. Khami
clinic has an outpatient geni urinary training centre which caters for patients as far
afield as Midlands, Matabalelenad South and Matabeleland North. The council has an
outreach programme to supplement inadequate service delivery to areas such as St
Peters, Aisebly Farm, Nketa and Cowdray Park on a monthly basis. Table 52 shows the
municipal clinics and respective populations served.
Table 53: Municipal Clinics and Population Served
Clinic Population Served
1 Magwegwe 55157
2 Nkulumane 54892
3 Nketa 47671
4 Cowdray Park 46946
5 Northern Suburbs 44437
6 Mzilikazi 43652
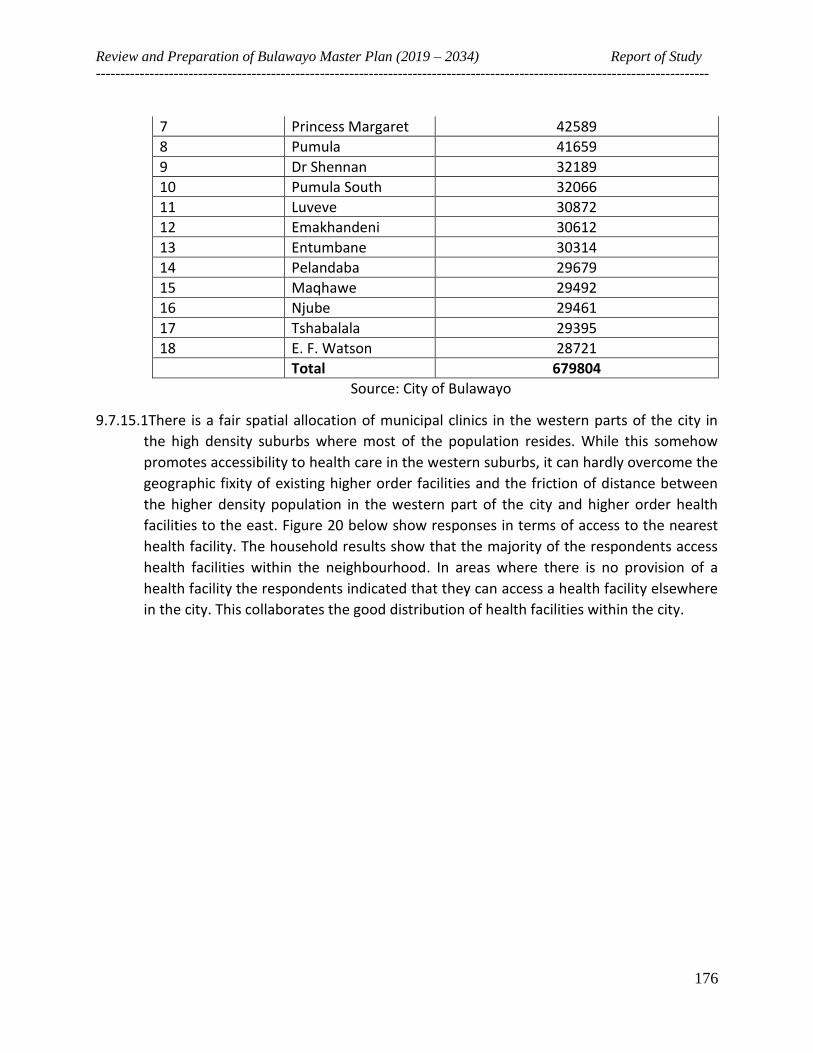
Review and Preparation of Bulawayo Master Plan (2019 – 2034) Report of Study
------------------------------------------------------------------------------------------------------------------------------
176
7 Princess Margaret 42589
8 Pumula 41659
9 Dr Shennan 32189
10 Pumula South 32066
11 Luveve 30872
12 Emakhandeni 30612
13 Entumbane 30314
14 Pelandaba 29679
15 Maqhawe 29492
16 Njube 29461
17 Tshabalala 29395
18 E. F. Watson 28721
Total 679804
Source: City of Bulawayo
9.7.15.1There is a fair spatial allocation of municipal clinics in the western parts of the city in
the high density suburbs where most of the population resides. While this somehow
promotes accessibility to health care in the western suburbs, it can hardly overcome the
geographic fixity of existing higher order facilities and the friction of distance between
the higher density population in the western part of the city and higher order health
facilities to the east. Figure 20 below show responses in terms of access to the nearest
health facility. The household results show that the majority of the respondents access
health facilities within the neighbourhood. In areas where there is no provision of a
health facility the respondents indicated that they can access a health facility elsewhere
in the city. This collaborates the good distribution of health facilities within the city.

Review and Preparation of Bulawayo Master Plan (2019 – 2034) Report of Study
------------------------------------------------------------------------------------------------------------------------------
177
Figure 20: Provision of Health facilities in the City
Source: Job Jika & Associates
9.7.16 As shown in figure 21 below the majority of the respondents indicated that they access
health facilities within their neighbourhoods. However, in areas where there is no
provision of health facilities within the neighbourhood, respondents indicated that they
access health facilities elsewhere. This may be attributed to the fact that while generally
all services are offered in the council clinic, there are some clinics which offer specific
types of services e.g. maternity and dental services are not being offered in all the
health facilities.

Review and Preparation of Bulawayo Master Plan (2019 – 2034) Report of Study
------------------------------------------------------------------------------------------------------------------------------
178
Figure 21: Access to the nearest health facility
Source: Job Jika & Associates
9.8 STAFFING SITUATION AT THE CITY OF BULAWAYO HEALTH SECTOR
9.8.1 A summary of the staffing situation in the city is shown on Table 53 the detailed staffing situation is annexed to this document. The city is functioning at about 60 percent of the required staff complement at its health institutions. This takes a huge toll on the delivery of health services in the city.
Table 54: Staffing Situation at the City of Bulawayo Health Sector
Institution Staff Complement Existing Staff Staff Shortage
Health Services Department
Department of Health Services 38 23 15
Environmental Health Services 37 19 18
Clinics
Khami Rd 25 17 8
Mzilikazi 22 15 7
Njube 22 11 11
Phelandaba 48 39 9
Pumula 23 12 11
Tshabalala 22 12 10
E.F. Watson 20 13 7
Magwegwe 23 14 9
Laveve 46 32 14

Review and Preparation of Bulawayo Master Plan (2019 – 2034) Report of Study
------------------------------------------------------------------------------------------------------------------------------
179
Nkulumane 51 38 13
Emakhandeni 24 16 18
Nothern Suburbs 44 22 22
Thongrove Hospital 68 31 37
Entumbane 22 14 8
Nketa 23 19 4
Princess Margaret Rose 15 12 3
Dr Shennan 11 7 4
Maqhawe 22 12 10
Pumula South 22 14 8
Cowdray Park 12 12 0
Khami Rd Pharmacy 5 0 0
TOTAL 645 404 246
Source: City of Bulawayo
9.9 TRADITIONAL HEALERS
8.9.1 Traditional healers are also operating in the city. They are operating from residential units especially in the high density residential areas. However, most of the traditional medicines in the city are sold at the main market “Mkambo” in Makokoba. 9.10 COMMUNITY HEALTH ASSESSMENT
9.10.1 Morbidity 9.10.1.1 An analysis of the incidence of disease (morbidity) and mortality (death rate in the
population) are critical aspects of the master planning exercise considering that apart from better health being central to a human’s well-being, good health, free from disease, is an essential ingredient to the development of the city and the nation. Healthy populations live longer, are more productive, and save more while an unhealthy population inhibits development as development is people-driven.
9.10.1.2 Disease prevalence in Bulawayo in terms of the order of prevalence is as follows:
a) HIV/AIDS related diseases
b) Tuberculosis
c) Hypertension
d) Diabetes
e) ARI
f) Skin Conditions

Review and Preparation of Bulawayo Master Plan (2019 – 2034) Report of Study
------------------------------------------------------------------------------------------------------------------------------
180
9.10.1.3 It is of great concern that HIV/AIDS and Tuberculosis are topping the disease hierachy especially considering that they are infectious diseases. The health sector in the city including the municipality, national government and other role-players have a huge responsibility in putting in place measures to reduce the prevalence of infectious diseases.
9.10.2 HIV Prevalence
9.10.2.1 The first AIDS death in Bulawayo was recorded in 1989. The incidence of HIV in Bulawayo stood at 6% between 1992 and 1994. The prevalence of HIV in the city
continued to rise. According to the Demographic and Health Survey data (see Table 54
and Figures 22 (a) and (b) from 2005 to 2015, the prevalence of HIV among the 15 to 49 Age group increased from 16.8% in 2005 to 19.1 in 2010 after which it began to decline to 14.3% in 2015.
9.10.2.2 A closer look at HIV prevalence within this age group (15 to 24 years) shows that they
made 7.1% (42% or about half) of the 1.8% of the 15 to 49 HIV positive age group in 2015. The cohort’s contribution to HIV prevalence declined to a third of the 15 to 49 years age group surveyed sample in 2010. It is of concern that by 2015, that while HIV prevalence within the 15 to 49 years age group declined between 2010 and 2015, HIV prevalence showed a slight increase from 5.9% to 6.1 percent within the 15 to 24 year age group again making about half of the HIV positive population within the 15 to 49 years age group as shown on Figure 22.
Table 55: HIV Prevalence by Age and Sex: 15-49, 15-24 and 0-14 Age Groups
Age Group
Bulawayo Harare Zimbabwe
2005-2006 2010-2011 2015 2015 2015
Total Females Males Total Females Males Total Females Males Total Females Males Total Females Males 15 -49 16,8 19,6 12,8 19,1 21,1 16,5 14,3 15,1 13,3 13,8 16,5 10,5 13,8 16,7 10,5 15 -24 7,1 10,6 2,7 5,9 8,8 2,1 6,1 8,2 3,3 4,8 6 3,4 6,7 2,9 0 -14 1,1 0,6 1,7 1,9 2,4 1,2 1,8 2 1,7
Source: Zimbabwe, Demographic and Health Survey 2005, 2010 & 2015
9.10.2.3 This segment of the population is critical in that it influences the fertility rate and
contributes to the rate of HIV infection and population growth. It includes young women and men (15 to 24 years) at their early stages of sexual activity with a propensity to contribute to new HIV infections. They are also the backbone of the economy through the supply of labour and are key in the social and economic well-being of families including family system stability.

Review and Preparation of Bulawayo Master Plan (2019 – 2034) Report of Study
------------------------------------------------------------------------------------------------------------------------------
181
Figure: 22 (a) and (b): HIV Prevalence in Females and Males among the 15-49 and 15-24 Age Groups
(a) (b)
Source: Zimbabwe Demographic and Health Survey
9.10.2.4 An analysis of HIV prevalence by gender as depicted on Figure 23 shows that females
with the 15 to 49 age group have had a higher HIV prevalence than males although
there is a downward trend in HIV prevalence for both sexes since 2005. The
Prevention of Mother-to-Child Transmission (PMTCT) of HIV, Anti Retroviral Therapy
Voluntary Counselling and Testing (VCT) are some programmes being implemented
towards a reduction in the prevalence of HIV. The municipality indicates that there is
an 18% HIV prevalence in the city.
Figure 23: Comparison of HIV Prevalence between Females and Males, 15-49 year age group
Source: Zimbabwe Demographic and Health Survey

Review and Preparation of Bulawayo Master Plan (2019 – 2034) Report of Study
------------------------------------------------------------------------------------------------------------------------------
182
9.10.2.5 The antinal programmes which are targeted specifically at the HIV/AIDS pandemic include Prevention of Mother -to-Child Transmission (PMCT); Early Infant Diagnosis (EID) among infants; Highly Active Antiretroviral Therapy (HAART); TB/HIV care and Voluntary Medical Male Circumcision. These programmes are aimed at managing HIV/AIDS.
9.10.2.6 The health research community globally has made progress in reducing HIV/AIDS
related deaths through the use of ARVs but it has not been able to reduce the rate of infection. However, the city’s Department of Health Services reports that is now a decline in the number of new HIV cases and HIV/AIDS related deaths.
9.11 MENTAL HEALTH PREVALENCE IN ZIMBABWE
9.11.1 The country is experiencing an increase in mental health cases. The increase is attributed to economic hardships facing the country including health-related causes. According to the World Health Organisation there were approximately 1.3 million people with mental health problems out of a population 13 572 560 in 2017 as shown in figure 24. This is equivalent to 10 percent of the population. This is an alarming statistic which when put differently suggests that 1 in 10 people have mental problems. The country has been beset by economic hardships since the turn of the millennium. The increase in mental health problems may be related to the high rate of unemployment, poverty, financial troubles and associated problems faced by households. While there are gestures for economic revival by government, it will take time for mental health to improve as it may take long for economic prosperity to be restored.
Figure 24: Mental Health in Zimbabwe
Source: World Health Organisation

Review and Preparation of Bulawayo Master Plan (2019 – 2034) Report of Study
------------------------------------------------------------------------------------------------------------------------------
183
9.11.2 An increase in mental health problems puts mental health institutions under strain, destabilises households and undermines social well-being with the result that the fabric of society becomes weak more especially when there are weak institutional and family support systems.
9.12 ENVIRONMENTAL HEALTH
9.12.1 Organisational Framework 9.12.1.1 The legal and policy environment for environmental health in the city is undertaken under the auspices of the Ministry of Health and Child Care and the Bulawayo City
Council. The City has a well-established Environmental Health department and hence coverage of the services that promote environmental health is comprehensive.
9.12.1.2 The mission for Environmental Public Health Department is: To prevent ill-health
among the population of Zimbabwe through community education and regulatory mechanism, to promote a healthy living and working environment, and to safeguard community health and quality of life 9.12.1.3 The department of Environmental Health provides the following services provided:
i. Premises inspections - inspect schools, hospitals, mines, factories, trading premises and other public institutions to ensure that standards of hygiene are maintained and that public health regulations are complied with.
ii. Food Quality Monitoring - food for sale to the public including food arriving from other countries to be sold in Zimbabwe is inspected to ascertain its quality. Food samples are also collected and submitted to the laboratory for analysis in order to determine its quality, suitability for consumption and compliance with the law.
iii. Water Quality Monitoring - inspections are conducted on drinking water sources and water samples are collected for analysis using field techniques and laboratory techniques.
iv. Water and Sanitation Promotion - provide technical know-how on the construction and maintenance of the Blair Ventilated Pit Latrine and the upgraded shallow wells through participatory hygiene education and technical know-how.
v. Disease Prevention and Control - investigating cases of infectious diseases and tracing contacts of these diseases.
vi. Port Health Activities - inspect public premises at the ports of entry to ensure that public health nuisances are prevented or dealt with appropriately.
vii. Public Health Legislation - enforce the provisions of all the Public Health Laws. They also review the laws regularly to bring them in line with prevailing situations.

Review and Preparation of Bulawayo Master Plan (2019 – 2034) Report of Study
------------------------------------------------------------------------------------------------------------------------------
184
viii. Health and Hygiene Promotion - the unit provides education on disease prevention, nutrition, food hygiene and safety, personal and general hygiene, and on waste disposal.
9.13 BULAWAYO CITY COUNCIL ENVIRONMENTAL HEALTH SERVICES
The City Council’s Environmental health services department provides the following services:
9.13.1 Health Inspectorate
• That is food hygiene and food safety – maintain and Update a register of food premises and trade premises, inspect and swabbing of food premises and food sampling. Conduct one visit per month, swab as necessary, random sampling of food, 5 per week.
• Licensing and registration – scrutinize and comment on all food premises plans, inspection of trade premises, health institutions, crèches, pre-schools, residential premises, enforce by laws.
• Water quality control – select consumer sampling points in relation to who standards, that is 201 samples per month. Collect water samples and send for
analysis. • And control of environmental pollution – set out emissions standards for pollutants. Air quality sampling and smoke observation. Approval and inspection of stationery fuel burning appliances and sources.
9.13.2 Cleansing Services
• Effective solid waste management – refuse removal and disposal; review number of tasks carried out per day, removal schedule for domestic and industrial areas, e.g. weekly domestic, daily, or 3 x per week shopping areas. Ensure sanitary disposal of waste, adequate cover and compaction daily, prepare new tipping cells as the old ones fill up and provide for leachate control.
• Reduce littering and illegal dumping – provide refuse receptacles and provide skip bins in areas generating high volumes of refuse, e.g. markets, shopping areas. Run anti-litter campaigns coupled with markets, shopping areas. Monitor contractors cleaning streets, shopping areas and sanitary lanes daily.
• Dog patrols and licensing – conduct dog patrols and issue dog notices. Educate on need to vaccinate and licence dogs.
• And public conveniences – maintain in a clean and good state of repair, provide cleaning materials, and repair faulty closets. Cleaned twice daily and when necessary usage areas, for example bus stops.

Review and Preparation of Bulawayo Master Plan (2019 – 2034) Report of Study
------------------------------------------------------------------------------------------------------------------------------
185
9.13.3 Pest Control
• Mosquitoes – larviciding of water bodies, stream bank clearing, spraying rural buses.
• Rodents – baiting along the rodent control belt, clearing vacant stands and catching rodents for species identification.
9.13.4 Cemeteries and Crematorium
• Cemetery maintenance and grave digging contracted out. • Department’s role – monitor output (sufficient graves) monitor the quality
(comply with standards), monitor grass cutting and bush clearing and provide for cremations.
9.14 LEGISLATIVE FRAMEWORK
9.14.1 Urban Councils Act, Chapter 29:15 provides for the maintenance of health and
cleanliness and good order of all houses and buildings within a local government area and for the maintenance in good order of proper sanitary accommodation and for maintaining cleanliness and sanitation generally;
9.14.2 The Environmental Management Act 20:27 makes provision for among others the
following environmental rights and principles of environmental management amongst others:
i) A clean environment that is not harmful to health; and to protect the environment for the benefit of present and future generations ii) Prevention of pollution and environmental degradation; and iii)Taking note that all elements of the environment are linked and inter-related, therefore environmental management must be integrated and the best practicable environmental option pursued; iv) Environmental management must place people and their needs at the forefront of its concern; v) Environmental education, environmental awareness and the sharing of knowledge and experience must be promoted in order to increase the capacity of communities to address environmental issues; vi) Development must be socially, environmentally and economically sustainable; vii) Any person who causes pollution or environmental degradation shall meet the cost of remedying such pollution or environmental degradation and any resultant adverse health effects, as well as the cost of preventing, controlling or minimizing further pollution;
viii) Taking measures necessary to identify materials and processes that are dangerous to human health and the environment;

Review and Preparation of Bulawayo Master Plan (2019 – 2034) Report of Study
------------------------------------------------------------------------------------------------------------------------------
186
ix) No person shall discharge or dispose of any wastes, whether generated within or outside Zimbabwe, in such a manner as to cause pollution to the environment or ill health to any person. 9.15 WASTE HIERARCHY
9.15.1 Waste management in Bulawayo is analysed among other parameters, the waste
hierarchy as depicted on Figure 25 which ranks and prioritises options in terms of their importance in managing waste for the benefit of the environment. The waste hierarchical approach starts by prioritising waste prevention, preparing it for re-use, recycling recovery and disposal at the landfill site as the last option. These processes are evident in the city and mostly occur in a structured and coordinated manner which if applied robustly may have greater benefits various role-players and the environment.
Figure 25: Waste Hierarchy
Source: Job Jika & Associates
9.16 WASTE GENERATION
9.16.1 The primary sources of waste in the city are residences, commercial enterprises,
industries, public and private institutions e.g. schools, hospitals, streets, construction
sites and other public spaces etc. Waste collection is undertaken by the municipality
although there are other waste collectors who collect waste from places such as
industries for recycling. Waste collection by the private sector is not a highly profitable
service hence it is not attractive to private sector players. The main types of waste are
paper, plastic, glass, garden refuse, metal and rubber.

Review and Preparation of Bulawayo Master Plan (2019 – 2034) Report of Study
------------------------------------------------------------------------------------------------------------------------------
187
9.17 REFUSE COLLECTION
9.17.1 The Municipality does not have a robust waste management infrastructure and
equipment due to the financial challenges facing the municipality but efforts are being
made to improve waste collection. Waste collection in parts of the city especially the
high density suburbs has been erratic with some areas going for days with waste not
having been collected. However, the city is continually trying to find innovative ways
and means of improving service delivery to its residents. In June 2015 the use of
community refuse removal project (CRRP) in collecting refuse was piloted at Emganwini,
a high density suburb that is furthest from the landfill and has progressively been rolled
out to all high density suburbs in the city and has improved refuse collection services. In
this program, owners of trucks with a capacity of 3 tonnes to 7 tonnes were engaged
and they provide their own crews to collect refuse from door steps.
9.17.2 The city uses a hybrid collection system where the City Council collects refuse from door
steps in Ward 1 to Ward 8 and transports it to the landfill site. In Ward 9-28 Council has
implemented a Community Refuse Removal program where community trucks collect
refuse from door steps to a temporary collection point where they offload onto Council
refuse trucks which then transport the waste to the Landfill site.
9.17.3 Residents are required to place their refuse in plastic papers or bags that are then
collected onto the community trucks. The clear gains that have been brought about by
the community refuse removal project as follows amongst others:
a) Frequency of collection - The community refuse removal project has improved
collection of refuse from fortnightly to weekly without additional refuse compactors
being purchased. Clearance of sweepings had improved as bagged sweepings are
being collected by community truckers.
b) Distance - The distance being travelled by Council trucks using the Community Refuse
Removal Project (CRRP) has significantly reduced. For example, during collection days
in Nkulumane, Council trucks used to travel 506 km a week but when using the CRRP
Council trucks now travel 155 km. The community refuse removal vehicles thus
presents savings in mileage which in turn reduces vehicle maintenance costs.
c) Fuel, Repairs and Maintenance Costs - House to house refuse collection is
accompanied by a lot of start and stop operations which results in high wear and tear
of the vehicles as well as high diesel consumption. For example, compactors are
double axel vehicles and because of the narrow streets in the high density areas they
are prone to more than average tyre wear and damage. The use of community

Review and Preparation of Bulawayo Master Plan (2019 – 2034) Report of Study
------------------------------------------------------------------------------------------------------------------------------
188
vehicles has helped reduce repair and maintenance costs associated with house to
house collection since the compactors are only collecting from the designated
collection points and are now travelling lesser distances.
d) Labour - To provide a weekly refuse collection service in the high density areas
Council needed 60 employees (12 haulage Overseers and 48 Loaders) yet the same
service is now being provided by 6-8 Council employees. Employees that were
covering the high density areas have been used to improve refuse collection in
eastern areas, shopping centres, institutions and sweepings.
e) Loads of Refuse Collected - It has been observed that since the inception of the CRRP,
the number of households that bring out their refuse for collection has significantly
improved. This in turn has resulted in a reduction by 60-75% in illegal dumping. When
the service was fortnightly a large number of residents would dump their refuse in
the event that the Council truck did not come but this is no longer the case as Council
has managed to stick to its published refuse collection schedule. Using the traditional
model of refuse collection, the schedule was frequently disrupted by vehicle
shortages and breakdowns.
f) The city no longer provides residents with bins due to economic challenges.
9.17.4 The Local Authority is experiencing a problem in terms of essential transport and
equipment needed to ensure efficient refuse removal. The existing situation is shown in
the table below;
Table 56: Available equipment for refuse removal
Type of Equipment Number In use Required Number Backlog
Trucks 52 20 104 84
Refuse Compactors 18 (reliable are only 14) 14 22 4
Skip haulier 0 0 1 1
3 tonne 1 1 2 1
Landfill compactor 1 (currently unreliable) 1 1 0
Bulldozer 1(Frequent breakdowns are being experienced)
1
Front end loader 1 1 1 0
Tipper Trucks 2 2 2 0
Source: City of Bulawayo
9.17.5 The Municipality’s Department of Health has a clear mandate on responsibilities and services to be rendered to the community to satisfactory levels of service delivery standards. However, the department faces the same financial and staffing challenges

Review and Preparation of Bulawayo Master Plan (2019 – 2034) Report of Study
------------------------------------------------------------------------------------------------------------------------------
189
which the municipality faces in service delivery. While the level of service standards are understandable, it is inadequate that domestic waste management (residential) industrial waste management is undertaken once a month. The norm is once a week or as per arrangement with clients as required. Table 56 below shows existing service levels by the Municipality.
Table 57: Service Levels by the Municipality
Service Level/Product Service Level Standard Ideal Service Standard
Licensing and registration of business premises (processing of application)
48 hours (2 days)
48hours
Examination of building plans
72 hours (3 days) 48hrs
Water and food quality monitoring
Routine Routine
Public health complaints 48 hours / on demand 48 hours
Provision of graves and bookings
Routine / provision of graves on demand On demand
Cremation services On demand On demand
Mosquito and rodent control Routine Routine
Domestic waste management (residential)
Once a month One a week
Commercial waste management central business district, hotels, hospitals and shopping centres
Daily
Daily
Industrial waste management
Generator’s responsibility to transport industrial waste. Disposal: on demand
Generator’s responsibility to transport industrial waste. Disposal: on demand
Clearing illegal dumps Depending on availability of resources
Within 48hours of being reported or identified
Cleaning of public conveniences
Daily Daily
Street sweeping Daily Daily
Collection of dead animals On demand On demand
Dog patrols Routine Routine
Source: City of Bulawayo
Review and Preparation of Bulawayo Master Plan (2019 – 2034) Report of Study
------------------------------------------------------------------------------------------------------------------------------
190
9.18 SOLID WASTE MANAGEMENT
9.18.1 The Municipality undertakes solid waste management through refuse removal and disposal of domestic and industrial waste. It ensures sanitary disposal of waste, adequate cover and compaction daily, prepares new tipping cells as the old ones fill up and provide for leachate control. The municipality has a mandate to reduce littering and illegal dumping: provide refuse receptacles and provide skip bins in areas generating high volumes of refuse, e.g. markets, shopping areas. It also is mandated with running anti-litter campaigns at markets and shopping areas, monitor contractors cleaning streets, shopping areas and sanitary lanes daily.
9.18.2 Commercial waste and putrescible waste is collected daily in the CBD and institutions, weekly in the industrial areas while collection of bulk waste and industrial waste is the responsibility of the generator. The city does not have drop-off facilities and waste separation at source programme, strategies which have proved highly essential in waste management.
9.18.3 There are recycling and waste buy-back centres which owned by private companies.
9.18.4 Environmental Health Practitioners and Cleansing Supervisors monitor the disposal of medical waste and specifically, the incineration process.
9.18.5 Industrial waste is co-disposed with domestic waste if it is certified to be stabilized. Non-stabilized/hazardous waste is subjected to chemical and physical analysis where an appropriate disposal method is suggested.
9.18.6 While the city has environmental/waste education and awareness programmes, it acknowledges that there is a need to improve on this very important environmental care strategy.
9.19 THE LANDFILL SITE
9.19.1 Solid waste in Bulawayo is dumped at the Richmond Landfill site close to Cowdray Park
and the proposed Umvimila industrial site. The site is located at the north western part of the city and is not easily accessible to areas from the south western to the eastern part of the city. Accessibility to the facility is becoming more difficult as the city grows outwards in different directions. The site was established in 1994 with an estimated life span of 20 years. The outstanding life span of the landfill at the moment is 7 – 10 years. Infrastructural developments at the landfill consists of offices and a weighbridge. There is no monitoring borehole and no gas venting is being done at the moment. This has implications in terms of monitoring pollution levels as well as routine analysis of bacteriological samples from the site.

Review and Preparation of Bulawayo Master Plan (2019 – 2034) Report of Study
------------------------------------------------------------------------------------------------------------------------------
191
9.19.2 Estimated daily waste at the landfill is 180 tonnes domestic/commercial waste and 20 tonnes industrial waste. This may not be an underestimate or overestimate as the weighbridge has not been functional but from these figures, the impression is that Bulawayo is a high net generator of waste. This is attributed to domestic waste which is generated by a rapidly increasing population and also industrial waste. Special note should also be taken of the waste to wealth (recycling) potential especially cans and plastics which is a multi – million dollar industry in South Africa. The conversion will not only create more jobs but will provide cheap raw material for some consumer products. Waste items therefore have important implications for planning not only because of the concern for environmental repair but also because of the multiplier effects on the economy. However, despite efforts by the Environmental Health Department of Council to institute some order in terms of refuse disposal, illegal dumping sites still exist in the city especially on the road reserves and open spaces.
9.19.3 The Richmond landfill site has become an economic resource to informal waste
recyclers. Informal waste recyclers are an important component of the waste management process and it is important that measures are put in place for them to carry on with their business in a controlled manner and in line with legislation and compliance with by laws.
9.19.4 The emergence of the informal settlement around the waste disposal is a concern in
particular in so far as the provisions of various legislation are taken into account. The settlement contravenes provisions of various pieces of legislation, viz, Town and Country Planning ACT, Public Health Act, Environmental Management Act not leaving out municipal by laws.
9.19.5 Former dump sites exist in the city and most of them are just open spaces which are
being used by the community for urban agriculture while a couple have been reclaimed and developed for use as recreational play areas by the Parks section of the Municipality.
9.19.6 There is need for future disposal sites to be identified during the plan period given the
high rate of waste generation currently being experienced in the city. 9.20 PEST CONTROL
9.20.1 Pest control is an important environmental health activity being undertaken by the
department. Under this activity the city offers services such as spraying of open water bodies, rodent baiting, stream bank clearing controlling pests and vermin in council installations. Pest control is being undertaken for a nominal fee of $17 per four (4) rooms. The services are meant to cover the entire city but as shown in Table 57, the coverage is severely limited.

Review and Preparation of Bulawayo Master Plan (2019 – 2034) Report of Study
------------------------------------------------------------------------------------------------------------------------------
192
Table 58: Coverage of spraying and Baiting in the City – 2017
Month Number of Houses Sprayed
January 8
February 11
March 19
April 0
May 2
June 2
July 0
August 0
September 6
October 19
November 6
December 20
Total 93
Source: City of Bulawayo 9.21 ABBATOIRS
9.21.1 There are four (4) abbatoirs in the city. 2 of these abbatoirs were established after year
2000 and they are both chicken abattoirs and hence there has been no increase in animal slaughter abattoirs in the city despite an increase in population and meat requirements of the rapidly increasing population of the city. Table 58 shows the number of animals slaughtered in the city in 2017. In terms of location, the abbatoirs are well located and they are easily accessible.
Table 59: Animals slaughtered at Abattoirs – 2017
Month Cattle Goats Sheep Pigs
January 1232 395 120 0
February 1066 369 147 0
March 1825 475 232 0
April 1418 456 225 0
May 2172 496 219 0
June 2115 284 218 0
July 4287 527 267 0
August 1916 230 57 0
September 1995 156 123 0
October 1629 274 109 0
November 1699 203 113 0
December 1780 384 171 0
Total 21 666 4 249 1 996 0
Source: City of Bulawayo
Review and Preparation of Bulawayo Master Plan (2019 – 2034) Report of Study
------------------------------------------------------------------------------------------------------------------------------
193
9.21.2 Routine inspections of food and dairy products are carried out by officials from the Environmental Health Department. Prompt action is taken on these procedures especially if there are complaints from consumers. However, the city is experiencing manpower challenges to meet the manpower requirements for a proper and efficient environmental health care services.

Review and Preparation of Bulawayo Master Plan (2019 – 2034) Report of Study
------------------------------------------------------------------------------------------------------------------------------
194
CHAPTER 10
SOCIAL AND COMMUNITY FACILITIES 10.1 GOVERNMENT OFFICES – CENTRAL AND LOCAL GOVERNMENT 10.1.1 There are various agencies of both Local and Central Government which are charged
with the administration and co-ordination of development activities within the Bulawayo Planning Area. Most of the central government offices are located at Mhlahlandlela Government complex and Tredgold within the city centre while other government offices are located within other parts of the city centre and periphery e.g. Social Welfare, Immigration, ZIMRA, Public Works and National Housing and Veterinary services. The provincial offices for Matabeleland North are located at Mhlahlandlela while the provincial health offices for Matabeleland South are located at old memorial building. Local Government offices are located at the tower block though other offices especially housing offices are located within the various neighbourhoods. The offices for Umguza Rural District Council, which administers areas outside the Municipal boundary are also located within the city centre.
10.1.2 Central government departments in Bulawayo play an important role in terms of service
delivery as well as the coordination and implementation of various development projects. The Central Government Departments in Bulawayo include:
i. Ministry of Local Government Public Works and National Housing
ii. Agritex – Provincial and District iii. ZIMRA
iv. Ministry of Primary and Secondary Education v. Department of Survey and Mapping vi. Ministry of Mines vi. Department of Animal Health vii. Ministry of Public Service Labour and Social Welfare viii. Department of Wildlife and National Parks ix. Ministry of Health x. Prisons and correctional services xi. Zimbabwe Republic Police xii. Magistrate Courts xiii. ZINWA xiv. Tel One xv. Zim Post xvi. ZETDC xvii. National Railways of Zimbabwe

Review and Preparation of Bulawayo Master Plan (2019 – 2034) Report of Study
------------------------------------------------------------------------------------------------------------------------------
195
10.1.3 Local Government offices in Bulawayo are;
i. Bulawayo City Council offices and departments which are located at the Tower Block and Stores unit. The Local Authority is headed by the Town Clerk, who is assisted by various heads of Departments. These consist of the Director of Engineering Services, Director of Housing and Community Services, Director of Finance, Director of Health Services and the Chamber Secretary. The various council departments include;
- Council Administration - Human Resources and Administration
- Finance (Accounts and Revenue) - Stores - Survey - Town Planning - Transport -Environmental Health - Primary health - Primary Education - Roads - Water and Waste water - Integrated Communications Technology (ICT) - Architecture and Buildings - Valuation
ii. Umguza Rural District Council main offices are located within Bulawayo at Umguza RDC offices and is headed by the Chief Executive Officer. The CEO is assisted by various heads of departments. The various council departments include;
- Council Administration - Human Resources and Administration - Finance - Engineering
10.2 COMMUNITY FACILITIES & YOUTH CENTRES
10.2.1 There are twenty (20) community halls which are located in the various residential
neighbourhood. The facilities are being managed by the Local Authority though some
that have been deemed redundant have been leased out. The community centres are
located in the high density residential areas as shown in the table below;

Review and Preparation of Bulawayo Master Plan (2019 – 2034) Report of Study
------------------------------------------------------------------------------------------------------------------------------
196
Table 60: Community Halls in the Bulawayo
Name of community halls Location (Township)
Macdonald Mzilikazi
Luveve beit hall Old Luveve
Pumula Old Pumula
Mpopoma Mpopoma
Entumbane Entumbane
Matshobana Matshobana
Stanley Makokoba
Emakhandeni Emakhandeni
Njube Njube
Mabutweni Mabutweni
Iminyela Iminyela
Lobengula New Lobengula
Pelandaba Pelandaba
Magwegwe Old Magwegwe
Pumula South Pumula South
Pumula North Pumula North
Sizinda Sizinda
Tshabalala Tshabalala
Nketa Nketa 8
Nkulumane Nkulumane Sekusile
Source: BCC & Consultant Surveys
10.2.2 Activities which may be undertaken at the community centres should have been approved by officials from the Housing and Community Services department. The activities for which community halls may be hired include; weddings, political meetings, community meetings, church meetings, musical events, arts exhibitions and performances, burial meetings, social parties and school events such as competitions amongst others. There are also some non – hired activities which are permitted at the community halls such as; rehearsals by artists, councillors’ meetings, vulnerable groups meetings. support group meetings, budget consultation meetings, national events, council programmes and recreational activities.
10.2.3 The facilities to a large extent still meeting the basic community needs as planned as
they are providing a conducive environment for residents to meet and interact.
However, there is need to upgrade and equip them with a view to modernize them to
meet changing consumer tastes.
10.2.4 The challenges being faced regarding the community halls is that the facilities are now old and lack modern facilities and equipment which has greatly affected their

Review and Preparation of Bulawayo Master Plan (2019 – 2034) Report of Study
------------------------------------------------------------------------------------------------------------------------------
197
patronage. This has resulted in the LA loosing some traditional clients to other players in the market who have better facilities.
10.3 YOUTH CENTRES
10.3.1 There are sixteen (16) Youth Centres which are located in the various residential neighbourhood. Fourteen (14) Youth centres are being managed by the City of Bulawayo while two (2) namely Youth Arena and Youth Venture Camp have been leased out. The Youth Centres are located in the high density residential areas as shown in the table below;
Table 61: Youth Centres in the City
Name of Youth Centre Location
Inyathi Mpopoma, Cleary Drive, Near Mpopoma Housing Office, Thikili Shopping Centre
Vulindlela Mpopoma, Block 14, Ngwenya Road, Next to Salvation Army Church
Mthwakazi Nguboyenja, Station Rd, Ext to Lozikeyi Primary School
Mzilikazi Mzilikazi, Near S& P Square, Next to Mzilikazi Housing Office, Queens Road
Pumelela Pelandaba( No 6) Adjacent to Pelandaba Hall, Sizani Road
Sizinda Sizinda, Sizinda Community Centre, Mthwalo Road
Thabiso Makokoba, 1st And Batch Street, Opposite Methodist Training Centre And Salvation Army Church
Impande Njube F Square, Opposite Njube High School, J.C Taylor Rd
Indlovu Tshabalala, Vulindlela Rd, Near Basic Shopping Complex Opposite Masuku Primary School
Isilwane Pumula Old, B Square. Opposite Police Camp
Isiziba Njube O Square, Sibula Rd, Opposite Kwezi Park
Lobengula New Lobengula, Uzwathi Rd, Opposite Brethren Christ Church
Luveve Luveve Old, Huggins Rd, Opposite Luveve Stadium
Magwegwe Magwegwe Old, Ntshamathe Rd/ Mqolo Road, Opposite Magwegwe Reservoir
Youth Arena Mabutweni (No 2), Near White City Stadium, Hyde Park Road
Youth Venture Camp Pumula South
Source: Bulawayo City Council & Consultants Surveys
10.3.2 The various activities being undertaken at the various Youth Centres include the following; Physical development; These activities include all ball games i.e. Soccer, Netball, Volley ball, Basketball, Table tennis, Weightlifting, Drum majorettes, Cricket, Boxing, Martial Arts commonly classified as recreational activities.

Review and Preparation of Bulawayo Master Plan (2019 – 2034) Report of Study
------------------------------------------------------------------------------------------------------------------------------
198
Mental and intellectual development; The activities include: Debates, Chess, drama, drum majorettes, quiz, playing cards, drafts and ludo, risk, monopoly, snake and ladders, livelihoods and life skill straining for example computer literacy (IT). Moral development; The activities include: Peer education, reproductive and sexual orientation, HIV and AIDS, STIs, Counselling, dissemination of information. Social development; The activities include: Dance, art, music, poetry, drama, talent shows, modelling shows community dialogues, community engagement, social equity, philanthropy, public relations promote and enhance community youth participation.
10.3.3 The Youth Centres to a large extent are meeting the needs of youths within the community. This is in view of the needs for facilities to keep the youths occupied. Various artists and drama groups in the city developed skills from these youth centres. However there is room to improve and upgrade these centres to meet the current trends in youth development.
10.3.4 Whilst the youth centres are making a positive contribution to the youths and the community, there are some challenges which are being experienced at these facilities. These include the following amongst others;
• There is need for grading sporting for fields for all recreation centres.
• Lack of computers and internet services within most of the centres.
• Lack of modern equipment for instance gym equipment, Public Address system and musical instruments that service various youth needs.
10.4 ZIMBABWE INTERNATIONAL EXHIBITION CENTRE
10.4.1 The Zimbabwe International Exhibition Centre was established in 1960. It occupies a large expanse of land measuring over 17 hectares and is located near the city centre in the southern portion of the city on plot 160745600. Apart from open air exhibition area which is open for business all year round the Zimbabwe International Exhibition Centre hosts major trade exhibitions in the country such as the Zimbabwe International trade Fair and Mine entra as well as other activities such as private events conferences and seminars, exhibitions and functions, musical events and fashion shows. The exhibition centre provides about 58 000m2 exhibition space, six (6) fully equipped and serviced multi purpose utility halls of 20 000m2 area, over hundred (100) separate pavilions, parking space, outdoor grass arena for outdoor sporting activities and restaurants. The Individual Pavilions have different shapes and sizes for individual exhibitors. The structures are designed to meet the needs of the different exhibitors and their various wares.
10.4.2 Unlike the individual pavilions section which is already built up, the open air exhibition
area is allocated to individuals and companies/organisations who erect temporary structures for exhibiting their wares during trade fair and other events. The structures

Review and Preparation of Bulawayo Master Plan (2019 – 2034) Report of Study
------------------------------------------------------------------------------------------------------------------------------
199
mainly constitutes of canopies, stands, marquees and kiosks. The ZITF grounds are landscaped and efforts are made to upgrade the facility at all times.
10.4.3 The Zimbabwe International Trade Fair (ZITF) grounds is designed to be a complex of
mixed uses. There are some offices for some companies which operate from there on a permanent basis. There is a portion were various agricultural activities e.g. auctions are undertaken.
10.4.4 In an effort to consolidate its tenure status, the Zimbabwe International Trade Fair
company which manages the complex is works closely with Government, Commerce and Industry. Plans are on hand to upgrade and extend the establishment – there is space to accommodate the proposed expansion. The development of offices as well as granting of permission for other social events to be undertaken from the ZITF grounds promotes security as well as optimal utilization of space and facilities.
10.5 DIPLOMATIC MISSION 10.5.1 The South African Embassy has established an agency for its diplomatic mission in
Bulawayo. It was established in an effort to assist people in the Southern part of the country who intend to apply for various documents such as student VISAs, work permits etc. The commission’s agent is located along Samuel Parirenyatwa street and is easily accessible.
10.6 ZIMBABWE REPUBLIC POLICE 10.6.1 There are 22 developed police stations as well as other police posts in the city. Since 2
000 ZRP Bulawayo province has only managed to construct ZRP Magwegwe and Mabutweni with the assistance of the community. However, there are other departments within the police which are located within the police stations. The headquarters for Bulawayo Province police is located at Ross Camp. Looking at the country’s standards of one police station for 5 000 people the police stations in the city are inadequate. In addition, the stand sizes for most police stations has implications on the facilities which are supposed to be provided at a police station.
10.6.2 There are 4 253 police officers within Bulawayo province making the ratio of one police
officer to 10 000 people, a ratio which is very high when looking at the various efforts which are underway in an effort to combat crime. Table 61 below shows the crime statistics in Bulawayo from 2015 to December 2017. Theft is the most common form of crime followed by other forms of crime.

Review and Preparation of Bulawayo Master Plan (2019 – 2034) Report of Study
------------------------------------------------------------------------------------------------------------------------------
200
Table 62: Crime Statistics for Bulawayo 2015 - 2017
Nature of Offence January – December 2015
January – December 2016
January – December 2017
Murder 34 22 41
Plan Robbery 1 382 997 956
A/Robbery (F/A) 17 27 22
Rape (Adult) 131 128 108
Rape (Juvenile) 156 142 122
U/Entry & Theft 3 140 2 479 2 472
Stocktheft 219 263 221
Theft 4 889 4 640 5 763
Assault 2 377 2 329 2 580
Theft of Motor Vehicle 62 33 60
Theft from Motor Vehicle
684 1 026 1 105
DD Act 103 82 111
Exch. Control 0 1 16
Fraud 848 798 644
Infanticide 9 2 8
Customs 0 4 2
Gold & P. Stone 37 29 18
Immigration 25 9 8
Tax Evasion 50 22 4
Corruption 7 3 0
Parks & Wildlife 18 13 6
MDP 634 736 732
Smuggling 16 23 25
Public Violence 4 4 2
Others 3 467 2 683 2 979
TOTAL 18 309 16 495 18 005
Source: Zimbabwe Republic Police, Bulawayo Province
10.6.3 The ZRP is experiencing some challenges in their operations namely a shortage of offices, there are only 202 offices against a staff compliment of 4 253 and there is a shortage of basic furniture, stationary and computers. There is also a shortage of holding cells and accommodation, as only 1 900 police officers are accommodated in institutional accommodation. The operations are hindered by lack of transport as well as an efficient communication system.
10.6.4 The ZRP has already been allocated stands in the various parts of the city and plans to
construct more police stations in the city but is being hindered by lack of funds. The sites allocated sites are as follows:

Review and Preparation of Bulawayo Master Plan (2019 – 2034) Report of Study
------------------------------------------------------------------------------------------------------------------------------
201
Table 63: Sites allocated for ZRP developments
Proposal Location Size of Plot (Ha) Date Offered
ZRP Bulawayo Central (Charge Office & Administration Offices)
Corner Masotsha Ndlovu & Batch Street
4.4 1993
ZRP Cowdray Park 3864 Cowdrey Park 0.3146 1996
ZRP Emganwini (Charge Office, Administration Offices & Residential Camp)
T.B.A 17.62 2004
ZRP Magwegwe (Charge Office, Administration Office & Residential Camp
5933 Magwegwe 4.3 2005
ZRP Khumalo Next to Elangeni Training Centre
T.B.A 2014
Source: Zimbabwe Republic Police
10.7 ZIMBABWE PRISONS AND CORRECTIONAL SERVICES 10.7.1 There are five (5) prison and correctional services facilities within the jurisdiction of
Bulawayo namely Khami Maximum, Mlondolozi, Khami Medium, Khami Remand and Bulawayo Prison. The table below show the existing situation at the facilities.
Table 64: Prison Facilities within the Planning Area
Name of Facility
Location Stand Size Number of Prison Cells
Number of Prison Officers
Number of Housing Units
Khami Maximum
Bulawayo Metropolitan
Approx 3 Ha 128 268 Shares with Mlondolozi
Khami Remand
Bulawayo Metropolitan
Approx 1 Ha 223 203 Shares with Mlondolozi
Khami Medium
Bulawayo Metropolitan
-------------- 32 communal 12 single
180 Shares with Mlondolozi
Mlondolozi Bulawayo Metropolitan
Approx 1 ½ 71 167 374
Bulawayo Town Centre ----------------- 21 179 26

Review and Preparation of Bulawayo Master Plan (2019 – 2034) Report of Study
------------------------------------------------------------------------------------------------------------------------------
202
Prison communal 2 single
Source: ZPCS & Consultants Surveys
10.7.2 Other facilities which have been developed at the correctional facilities include offices, gardens sports and recreational facilities at the facilities in Khami and a car wash at the town centre prison.
10.7.3 The main challenges being experienced at the Prison and correctional facilities relate to
accommodation. For example the houses at Mlondolozi are occupied by staff from 10 stations namely Khami maximum prison, Khami remand prison, Mlondolozi prison, Khami medium prison, Khami prison workshop, Bulawayo Metropilitan Province, Matabeleland North Province, Public works department, Khami secondary and Khami primary school staff. In addition due to a shortage of accommodation some of the officers are sharing houses. The other challenges being experienced include shortage of offices, shortage of manpower (officers), shortage of transport and failure to fully utilise the farm/gardens to ensure full produce food from the various agricultural activities being undertaken at the prison facilities.
10.8 ZIMBABWE NATIONAL ARMY 10.8.1 The Zimbabwe National Army has two (2) major establishments. Mzilikazi barracks
which is located within the Municipal Boundary near Paddonhurst suburb along the Harare road and Imbizo barracks which is located outside the boundaries of Bulawayo City Council.
10.9 ZIMBABWE POSTAL SERVCES 10.9.1 There are fifteen (15) post offices in Bulawayo which have been established to provide an efficient postal service delivery system in the city. Eleven (11) post offices are located in the residential neighbourhoods, three (3) in the city centre and one (1) is located in the industrial area. The Central sorting centre is also located in the city centre. There are no post offices which were constructed in the city during the operational period of the 2000 – 2015 Master Plan. Detailed information on the post offices in Bulawayo is shown in the table below.
Table 65: Post Offices in Bulawayo
Name of Post Office
Location Stand Size (m2)
Total No of Counters
Number of Counters utilized for Zim Post Services
No of Private Boxes
Nkulumane Nkulumane 2288 3 2 200

Review and Preparation of Bulawayo Master Plan (2019 – 2034) Report of Study
------------------------------------------------------------------------------------------------------------------------------
203
Northend Northend 1604,8 2 1 100
Bulawayo Main Post Office
City Centre 8th Ave
2601,76 23 7 5 950
Luveve Luveve 1500 3 2 100
Magwegwe Magwegwe 1200 3 1 50
Pumula Pumula 1200 3 2 100
Mzilikazi Mzilikazi 800 2 1 50
Queenspark Queenspark 1850 2 1 200
Morningside Morningside 961 3 2 300
Hillside Hillside 2099,52 4 2 399
Belmont Belmont 1500 4 2 600
Raylton Raylton 932,5 4 1 250
Entumbane Entumbane 2466,38 5 1 200
Mpopoma Mpopoma 1176 3 1 200
Famona 15th Ave and George Silundika
276,52 4 1 1100
Total 68 27 9 799
Source: Zim Post & Consultants Surveys
10.9.2 The post office’s main business is distribution of mail. However there has been a slight change of focus as post offices are now providing insurance services and have become an agency for a number of organisations such as ZINARA, CVR, NSSA, Government pension and offers banking services for POSB. In addition the financial sector it has become an agency for banks such as FBC, Steward, CABS and offers international money transfer services. As for cell phone network providers the post office is offering eco cash, airtime and related products for Econet, airtime and tele cash for telecel as well as net one money transfer services. As shown in the table above only twenty seven (27) out of sixty eight (68) counters which constitutes about 40% are being used for Zimpost services. The post office has a total of 9 799 private poxes but only 8% of the boxes are taken up. The economic downturn resulted in many companies surrendering their boxes.
10.10 COMMUNITY INFORMATION CENTRE
10.10.1 Community Information Centres have been established within most of the ZIM Post buildings. This is in line with a Government initiative which is aimed at ensuring that disadvantaged members of the community who cannot afford to buy computers are able to access internet services, print, scan, photocopy and fax.

Review and Preparation of Bulawayo Master Plan (2019 – 2034) Report of Study
------------------------------------------------------------------------------------------------------------------------------
204
10.10.2 The ZIM Post buildings were information centres have been established have been subdivided to establish a training room and information centre. Some offices such as Nkulumane are capable of accommodating up to twenty (20) trainees a time. At the community information centre, basic computer literacy programmes are being offered to members of the public so that people can use computers as well as search on the internet.
10.10.3 A special postal courier service is being rendered by Courier Connect, a subsidiary of
ZIM post. The unit competes with the private courier companies in the business of delivering customers mail both within and outside the country at the shortest possible time for an economic fee.
10.10.4 While Zim post is making efforts to ensure that service delivery improves there are
challenges being experienced in the delivery of mail. Some of the houses in new surburbs such as Cowdray Park, Mbundane and Mganwini have no house numbers making life difficult for the postmen. Some mail is addressed to vacant stands which have no mail repositories.
10. 11 OTHER SOCIAL AND COMMUNITY FACILITIES 10.11.1 Jairos Jiri Association
10.11.2 Jairos Jiri Association (JJA) is a registered Non-Governmental Organisation and is the
largest service provider to people with disabilities for people with Disabilities. It was founded in 1950 with the official opening of a new training centre in Nguboyenja which was made possible as a result of a donation of land and buildings by Bulawayo City Council.
10.11.3Bulawayo Vocational Training Centre is the foundation and the oldest of all Association’s
establishments. The centre treat, assist and rehabilitate men, women, boys and girls with disabilities by equipping them with various skills. Bulawayo Vocational Training centre is registered under the Ministry of Higher Education and Technology and offers training in Clothing Technology, Computer Programming, Electronics, Refrigeration, Welding, Business Studies, Wood Technology, Basketry, Leather Craft, and Secretarial Studies. The work of JJA is diversified and is tailor made to meet the needs of people with disabilities (men, women, boys and girls). The courses offered empower trainees with skills for both formal and informal employment in various economic sectors. The institution has given hope for the disabled in the country, where they could learn and train to be respected and be independent members of the society. Occupational therapy, Independent living, outreach and Follow up Integration programmes are carried out by the centre with the support from the Community Rehabilitation Programme.

Review and Preparation of Bulawayo Master Plan (2019 – 2034) Report of Study
------------------------------------------------------------------------------------------------------------------------------
205
10.11.4 Bulawayo Vocational training Centre has over the years produced many respectable citizens, some of whom are graduates of our local universities. Students also have access to regular rehabilitation services within the institution and participate in various sports and recreational activities. Students at the centre are taken once a week for physical exercise by the physiotherapist.
10.12 OLD AGE HOMES
10.12.1 There are eleven (11) old age homes in Bulawayo namely; Edith Duly, Garden park,
Queen Mary, Ralsten, Savyon, Barbra Burell, Rhodes Jubilee, Coronation cottages, Bartley block, Ekuphumuleni and Entembeni. The majority of the old age homes are situated within the Coronation cottage complex on fife street extension.
10.12.2 Garden Park Trust
10.12.2.1 Garden Park Trust is a retirement home situated in Woodlands and is registered with the Social Welfare Department. The home was established in October 1972 as a social welfare home for the aged after a donation by the City of Bulawayo of the 12 acre piece of land. It is administered by a board of three trustees and a committee comprising of five residents. The staff compliment at Garden Park as at July 2018 was thirty one (31) comprising of the management team namely; the complex manager, an administrator, security supervisor, maintenance supervisor, clinic sister, cashier and part time book keeper. There are some security gate keepers, maintenance team as well as gardeners.
10.12.2.2 Garden Park Trust offers various types of accommodation as shown in the table
below:
Table 66: Existing situation at Garden park Trust
Type of Accommodation
Facilities Number of types of housing units
Fees per month
Garden Park House Full board and lodging 18 $ 550.00 full board
Rented Bed Sit Flats Small garden, a verandah, lounge/bedroom combined, bathroom and kitchen
55 $98.00
Rented one bed Flats Small garden, a verandah, lounge/dining room, kitchen and bathroom with separate toilet
11 $129.00
Rented One Bedroom Cottages
Free standing with - Small garden, a
21 $185.00

Review and Preparation of Bulawayo Master Plan (2019 – 2034) Report of Study
------------------------------------------------------------------------------------------------------------------------------
206
verandah, lounge/dining room, kitchen and bathroom with separate toilet
Two Bedroom cottages
Free standing 35 These are on Right of Abode or otherwise known as Life Rights. The cost of a right of abode is between $ 50 000-00 and $ 55
000.00
Two Bedroom Terrace 19 These are on Right of Abode or otherwise known as Life Rights. The cost of a right of abode is between $ 50 000-00 and $ 55
000.00
Source: Consultant Field Survey July 2018
10.12.2.3 Other infrastructural developments at garden park consist of an administration block kitchen and dining room, lounge, library, laundry, matron’s rooms and a chapel.
10.12.2.4 To date there are two hundred (200) people who are residing at Garden Park and there is a waiting list of 277 people. This shows that there is a demand for such facilities in the city. 10.12.3 Edith Duly
10.12.3.1 Edith Duly is Bulawayo’s only registered private nursing home, situated within the
Coronation cottage complex and is registered with the Social Welfare Department. The home was established in 1959. Admittance to the home is extended to all ages where the need for assisted living has been established. In addition to general geriatric care, the nursing home is able to care for special needs such as stroke and accident victims, diabetics with complications, epileptic sufferers, Alzheimer’s and Dementia. A short stay at Edith Duly can be arranged.
10.12.3.2 At the time of the survey Edith Duly had a staff compliment of 36 comprising of
administrative staff, senior registered nurses, rehabilitation technician/occupational therapist, nurse aids, kitchen staff, cleaners and gardeners.

Review and Preparation of Bulawayo Master Plan (2019 – 2034) Report of Study
------------------------------------------------------------------------------------------------------------------------------
207
10.12.3.3 Accommodation options within the home rage from 4 to 5 bed wards, private rooms with en suite bathrooms and private with communal facilities. There are also a limited number of units suitable for elderly couples. The facility offers a full board facility, no independent living. This is shown in the table below:
Table 67: Existing situation at Edith Duly
Type of Accommodation
Facilities Number of types of housing units
Fees per month
Wards – can accommodate 5 beds
Full board and lodging 8 $
Independent Rooms (private)
Full board and lodging 16 $
Source: Consultants Survey
10.12.3.4 The facility has a potential occupancy of 55 people but at the time of the survey the occupancy was 22. The average annual occupancy is 20 and this is mainly attributed to affordability.
10.12.3.4 Infrastructural developments at Edith Duly consists of offices, wards, independent
rooms, dining room and lounge. There are well maintained gardens where residents can sit and enjoy bird life.
10.12.4 Coronation Cottages
10.12.4.1 Coronation cottages was established in 1957 on a piece of land which was donated by
the city of Bulawayo and is registered with the Social Welfare Department. Admittance to the home is extended to all ages where the need for assisted living has been established.
10.12.4.2 As at August 2018 Coronation cottages had a staff compliment of 11 comprising of
administrative staff, senior registered nurse and gardeners. The registered nurse monitors the health condition of elderly though she works closely with EMRAS and various health facilities
10.12.4.3 The establishment has 203 housing units comprising of 163 flat lets which are
earmarked for single persons and 40 cottages which are suitable for married couples. The facility does not offer full time boarding facilities as meals are provided at verity hall by a private caterer though the facility is located within the coronation cottages premises. The meals on offer are breakfast and lunch and these are offered 4 times a week. The verity hall is multi purpose and various activities for the benefit of the elderly such as church services, exercises, crafts and various celebrations such as mother’s and father’s day are being undertaken from the facility. Corronation cottages does not pay for using the facility. Coronation cottages has a waiting list especially for their cottages.

Review and Preparation of Bulawayo Master Plan (2019 – 2034) Report of Study
------------------------------------------------------------------------------------------------------------------------------
208
At the time of the survey not all the cottages were fully occupied due to renovations which were underway. In addition at least 3 flat lets and one cottage are left vacant at any time to accommodate visitors for the residents at a minimal cost of $ 10 per night. This is shown in the table below:
Table 68: Existing situation at coronation cottages
Type of Accommodation
Facilities Number of types of housing units
Fees per month
Flat lets Self catering and lodging
163 $ 115.00
Cottages Self catering and lodging
40 $ 150.00
Source: Consultants Survey
10.12.4.6 The facility has a potential occupancy of 243 people but at the time of the survey the occupancy was about 230. The average annual occupancy is at least 235 and this is mainly attributed to affordability.
10.12.4.7 Infrastructural developments at Edith Duly consists of offices, wards, independent
rooms, dining room, lounge. There are well maintained gardens where residents can sit and enjoy bird life.
10.12.5 Rhodes Jubilee Cottages
10.12.5.1 Rhodes Jubilee Cottages formerly known as the cottage home for aged coloured
community was established in 1953. The old age home is registered with the Social Welfare Department. Admittance to the home is extended to the aged who can take care of themselves.
10.12.5.2 The establishment has 30 various types of housing units comprising of 10 single
quarters in Block B with a common bathroom and toilet, 10 single rooms with a kitchen, veranda, bathroom, common shower and toilet, 6 single rooms with own bathroom, toilet and kitchen and 4 married quarters. Rhodes Jubilee offers full time boarding facilities to the 10 single quarters in block B. The rest of the residents are catering for themselves.
10.12.5.3 There is no waiting list at Rhodes Jubilee, allocation is based on availability at the time
of the enquiry. At the time of the survey all the housing units were occupied. Information on the existing housing units is shown in the table below:

Review and Preparation of Bulawayo Master Plan (2019 – 2034) Report of Study
------------------------------------------------------------------------------------------------------------------------------
209
Table 69: Existing situation at Rhodes Jubilee
Type of Accommodation
Facilities Number of types of housing units
Fees per month
Single Rooms Kitchen, dining, common toilet and bathroom - Full boarding
10 $ 200.00
Single Rooms Lounge cum bedroom, kitchen, veranda, common toilet and shower - Self catering
10 $ 100.00
Single Rooms Lounge cum bedroom, kitchen, veranda, private toilet and shower - Self catering
6 $ 120.00
Married Quarters Lounge, bedroom, kitchen, veranda, private toilet and shower - Self catering
4 $ 200.00
Source: Consultants Surveys
10.12.5.4 The facility has a potential occupancy of 34 people and at the time of the survey it was fully occupied. At the time of the survey, Rhodes Jubilee had a staff compliment of 6 comprising of administrative staff, 3 gardeners and 2 cooks. There is no health personnel at the Rhodes Jubilee but the matron works closely with EMRAS ambulance services and various health facilities in case there residents who need medical attention.
10.12.5.5 Infrastructural developments at Rhodes Jubilee consists of offices, residential units,
dining room, kitchen and a lounge. There are well maintained gardens where residents can sit and relax as well as enjoy bird life.
10.12.6 Barbra Burrell
10.12.6.1 Barbara established in 1974 to provide accommodation, recreation and rehabilitation
for the elderly blind people. The institution was established on a piece of land which was donated by the city of Bulawayo and is registered with the Social Welfare Department. Admittance to the home is mainly for the elderly blind but in the event that there are no demand by the elderly blind, elderly people are accommodated for assisted living.
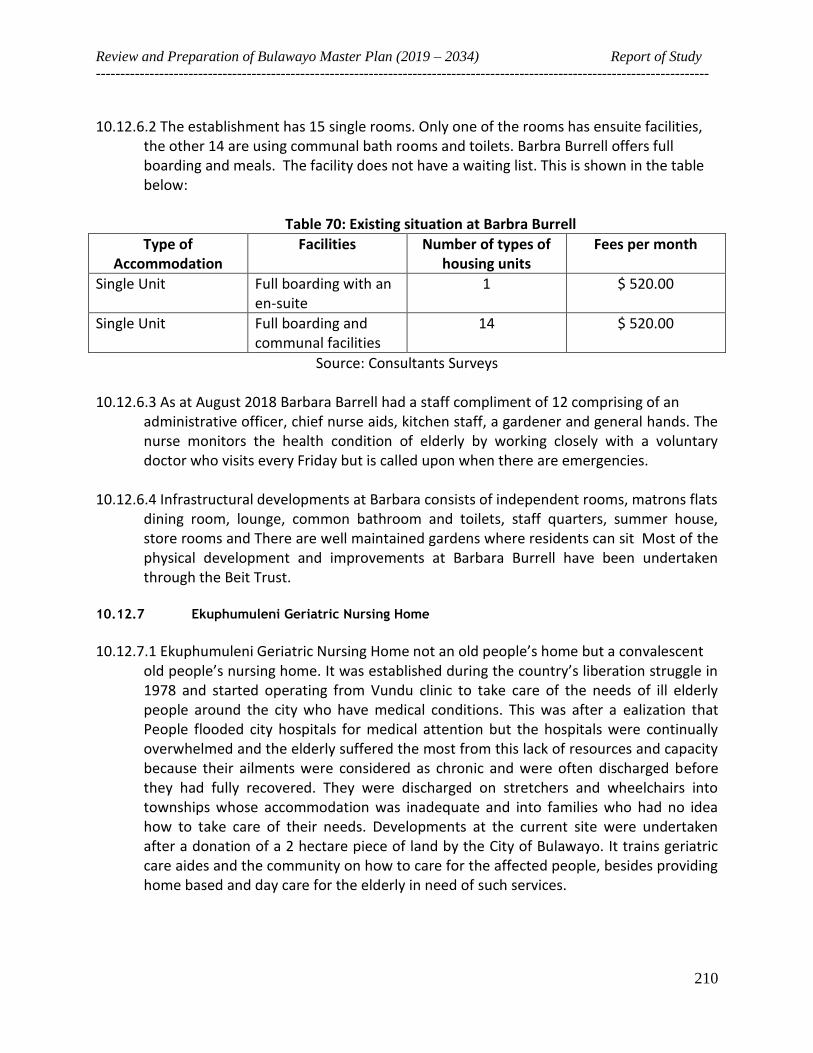
Review and Preparation of Bulawayo Master Plan (2019 – 2034) Report of Study
------------------------------------------------------------------------------------------------------------------------------
210
10.12.6.2 The establishment has 15 single rooms. Only one of the rooms has ensuite facilities, the other 14 are using communal bath rooms and toilets. Barbra Burrell offers full boarding and meals. The facility does not have a waiting list. This is shown in the table below:
Table 70: Existing situation at Barbra Burrell
Type of Accommodation
Facilities Number of types of housing units
Fees per month
Single Unit Full boarding with an en-suite
1 $ 520.00
Single Unit Full boarding and communal facilities
14 $ 520.00
Source: Consultants Surveys
10.12.6.3 As at August 2018 Barbara Barrell had a staff compliment of 12 comprising of an administrative officer, chief nurse aids, kitchen staff, a gardener and general hands. The nurse monitors the health condition of elderly by working closely with a voluntary doctor who visits every Friday but is called upon when there are emergencies.
10.12.6.4 Infrastructural developments at Barbara consists of independent rooms, matrons flats
dining room, lounge, common bathroom and toilets, staff quarters, summer house, store rooms and There are well maintained gardens where residents can sit Most of the physical development and improvements at Barbara Burrell have been undertaken through the Beit Trust.
10.12.7 Ekuphumuleni Geriatric Nursing Home
10.12.7.1 Ekuphumuleni Geriatric Nursing Home not an old people’s home but a convalescent
old people’s nursing home. It was established during the country’s liberation struggle in 1978 and started operating from Vundu clinic to take care of the needs of ill elderly people around the city who have medical conditions. This was after a ealization that People flooded city hospitals for medical attention but the hospitals were continually overwhelmed and the elderly suffered the most from this lack of resources and capacity because their ailments were considered as chronic and were often discharged before they had fully recovered. They were discharged on stretchers and wheelchairs into townships whose accommodation was inadequate and into families who had no idea how to take care of their needs. Developments at the current site were undertaken after a donation of a 2 hectare piece of land by the City of Bulawayo. It trains geriatric care aides and the community on how to care for the affected people, besides providing home based and day care for the elderly in need of such services.

Review and Preparation of Bulawayo Master Plan (2019 – 2034) Report of Study
------------------------------------------------------------------------------------------------------------------------------
211
10.12.7.2 Ekuphumuleni has 13 rooms which can accommodate 3 beds each as well 12 rooms which can accommodate 2 beds each. Communal bath rooms and toilets are being used at the facility. Full boarding facilities and meals and a 24 hour upkeep is being offered for three (3) months to the inmates prior to a review to ensure that one can function independently within a home environment. The maximum intake at Ekuphumuleni Geriatric Nursing Home is 62 but 45 are admitted at the home. The facility does not have a waiting. Table 71: Existing situation at Ekuphumuleni Geriatric Nursing Home
Type of Accommodation
Facilities Number of types of housing units
Fees per month
Rooms with 3 beds Full boarding & communal facilities
13 $ 100.00
Rooms with 2 beds Full boarding & communal facilities
12 $ 100.00
Source: Consultants Surveys
Note: In addition to the $ 100.00 monthly payment the relatives/next of kin are expected to bring groceries and other toiletries. 10.12.7.3 Ekuphumuleni staff compliment is 45 permanent staff constituting of an
administrator, a matron, sister in charge, bookkeeper, a driver, 21 nurse aids, kitchen staff, a gardener and general hands. In addition to the full staff compliment, institutions such as Zimbabwe Red Cross, Jubilee, St John Ambulance and other agencies which train nurse aids bring 24 student nurse every for practical lessons for 2 months.
10.12.7.4 Infrastructural developments consist of accommodation rooms, wards, lounge, kitchen, laundry flats dining room, lounge, common bathroom and toilets. There are some income generating activities such as poultry and vegetable gardening which are meant to sustain Ekuphumuleni.
10.12.8 Railstein Home
10.12.8.1 Railstein home was established in 1936 to provide accommodation, recreation and
rehabilitation for the elderly. The home accommodates the elderly who can take care of themselves. The institution was established on a piece of land which was designated for use as old age homes by the city of Bulawayo. The facility is registered with the Social Welfare Department.
10.12.8.2 Railstein offers full boarding facilities and meals to the residents. The establishment has 32 single rooms with communal bath rooms and toilets. This is shown in the table
below:

Review and Preparation of Bulawayo Master Plan (2019 – 2034) Report of Study
------------------------------------------------------------------------------------------------------------------------------
212
Table 72: Existing situation at Railstein Home
Type of Accommodation
Facilities Number of types of housing units
Fees per month
Private rooms Full boarding and communal facilities
32 $ 200.00
Source: Consultants Surveys
10.12.8.3 As at August 2018, Railsten Home had a staff compliment of 7 comprising of an administrative officer/matron, nurse aid, 2 kitchen staff, a gardener, laundry staff and a security guard. The nurse monitors the health condition of elderly and works closely with a doctor who attends to patient’s everyday between Mondays and Friday from Queen Mary House.
10.12.8.4 Infrastructural developments at Railsten consists of the matron’s house, residential
rooms, administration office, dining room, kitchen, laundry, library and toilets, staff quarters. There are well maintained gardens where residents can sit and relax. Most of the improvements and refurbishments at Railstein have been undertaken through the Beit Trust.
10.12.9 Savyon Lodge
10.12.9.1 Savyon lodge is a private facility which was established as a retirement home for the
Jewish but now accommodates other denominations. The home was established in 1966 on a piece of land which was allocated by the City Council and is registered with the Department of Social Welfare.
10.12.9.2 Savyon lodge offers full boarding facilities and meals to the residents. The
establishment has 16 single rooms and 15 double rooms which are all en - suites. Savyon Lodge has a capacity to accommodate 46 people but at the time of the survey there were only 4 people. Information on the facility is shown in the table below:
Table 73: Existing situation at Savyon Lodge
Type of Accommodation
Facilities Number of types of housing units
Fees per month
Private single rooms Full boarding with en - suites
16 $ 850.00
Double Rooms Full boarding with ensuites
15 $ 1 135.00 for single $ 1 500.00 for double
Source: Consultants Surveys
10.12.9.3 As at August 2018, Savyon Lodge had a staff compliment of 6 full time staff comprising of a cook, 2 matrons, gardener, cleaner and kitchen hand. There is a part time nurse monitors the health condition of elderly and works closely with the health

Review and Preparation of Bulawayo Master Plan (2019 – 2034) Report of Study
------------------------------------------------------------------------------------------------------------------------------
213
facilities. However, residents can employ a nurse aid to assist them if they see it fit to do so.
10.12.9.4 Infrastructural developments at Savyon Lodge consist of residential rooms,
administration office, dining room/lounge, kitchen, laundry and a library. There is well maintained garden where residents can sit and relax.
10.12.9.5 Trained nurses and care givers provide care and support to the elderly at Savyon lodge nursing home 10.12.10 Queen Mary House
10.12.10.1 Queen Mary is a private retirement home which was established in 1929. The home
was established on a piece of land which was allocated by the City Council for the development of old people’s homes and is registered with the Department of Social Welfare.
10.12.10.2 Queen Mary offers full boarding facilities and meals to the residents. The
institution has 32 private rooms, of which 10 are self contained and the other 22 use communal facilities. The retirement home has a capacity to accommodate 35 people. Information on the facility is shown in the table below:
Table 74: Existing situation at Queen Mary House
Type of Accommodation
Facilities Number of types of housing units
Fees per month
Flat let Full boarding with en - suite
1 $ 565 single $ 1 000 - double
Private single rooms Full boarding with en - suites
5 $ 565.00
Private single rooms Full boarding with shared facilities
4 $ 565.00
Private single rooms Full boarding with communal facilities
22 $ 445.00
Source: Consultants Surveys
10.12.10.3 As at August 2018, Queen Mary had a staff compliment of 11 full time staff comprising of 2 chefs, 2 kitchen assistants, 2 matrons, 2 gardeners/cleaners and 3 maids. There is no health personnel at Queen Mary to monitors the health condition of elderly hence the task lies with the matrons who work closely with the health facilities and the doctor. A volunteer doctor is available from Monday to Friday to look after staff and the residents.

Review and Preparation of Bulawayo Master Plan (2019 – 2034) Report of Study
------------------------------------------------------------------------------------------------------------------------------
214
10.12.10.4 Infrastructural developments at Queen Mary consist of staff accommodation for the matrons and 5 others members of staff, residential rooms, administration office, dining room, lounge, kitchen, laundry and a library. There is well maintained garden where residents can sit and relax.
10.12.11 Entembeni Old Age Home
10.12.11.1 Entembeni old age home was established in 1967 by a group of men who were part
of the management team for Bulawayo City Council. These men formed a trust and bought land from Bulawayo City Council. They had discovered that most people who were destitute were aliens mainly from Malawi, Zambia and Mozambique who had come to Zimbabwe in the 194os to look for work. Currently the institution is being run by a voluntary Board of Trustees. Entembeni has a capacity to accommodate 150 people but at the time of the survey there were only 38 people.
10.12.11.2 Infrastructural developments at the above old age homes mainly consists of administration blocks and hostels. Unlike Garden Park Trust which has a waiting list, the above homes are hardly full or filled up.
10.12.11.3 The staff compliment at Entembeni consists of a matron, 5 Nurse aids and two
general hands.
10.12.12 Bartley Memorial Block
10.12.12.1 Bartley Memorial Block (BMB) constitutes part of the Government run United Bulawayo Hospital group. It was established in 1943 as a geriatric facility and is currently caring for 9 elderly who are residing at the facility. However, BMB no longer admits any new old people (no longer operates as an old people’s home) but accommodates an overflow from Grey ward and Richard Morris. A management committee and volunteers are catering for the welfare of the old people at BMB. 10.12.12.2 There members of nursing staff who are taking care of the overflow from Richard
Morris and Grey ward is taking care of general welfare and health needs of the old people. However, toiletries, laundry and ironing services for the geriatrics is being provided by the committee.
10.12.12.3 There accommodation are mostly private rooms and only one is being shared by 3
people and they all have communal facilities. BMB offers full boarding facilities, there is no independent living. This is shown in the table below.

Review and Preparation of Bulawayo Master Plan (2019 – 2034) Report of Study
------------------------------------------------------------------------------------------------------------------------------
215
Table 75: Existing situation at Bartley Memorial Block
Type of Accommodation
Facilities Number of rooms
Fees
Private Rooms Full boarding and lodging 5 None
Shared Room Full boarding and lodging 1 None
Source: Consultants Surveys
10.12.12.4 BMB has the potential to increase the number of people but there are plans to utilise the facility as a private ward for orthopedic patients and hence there are no new admissions for geriatrics. 10.12.12.5 Infrastructural developments at BMB consists of offices, private rooms, dining,
lounge, kitchen and spacious verandas where the geriatrics can relax.
10.13 CHILD CARE FACILITIES 10.13.1 There are ten (10) child care facilities which are registered with the Department of Social Welfare in the city as shown below.
Table 76: Registered Child Care facilities
Home Date registered
Location Registered capacity
Enrolment
John Smile 1960s Barham Green 72 39
Percy Ibbotson Probation Hostel
1967 Luveve 5 66 17
Luveve Training School For Girls
1960s Luveve 5 48 18
Isaiah’s Umuzi Wotando 2007 Suburbs 20 14
Emthunzini Wethemba 1992 Mzilikazi 20 24
Queen Elizabeth 1968 S.Parerenyatwa st/8th Avenue
30 33
SOS 1977 Northend 180 96
Mustard Seed 2017 Reigate 35 39
Thembiso 1989 Luveve 5 54 35
Sandra Jones 2009 Malindela 10 12
Source: Consultant Field Surveys
10.13.2 Infrastructural facilities at the child care facilities mainly consists of dormitories, administrative blocks and family units. The facilities are not being fully utilised as the registered capacity vs enrollment is low.

Review and Preparation of Bulawayo Master Plan (2019 – 2034) Report of Study
------------------------------------------------------------------------------------------------------------------------------
216
10.13.3 The child care facilities are experiencing some challenges such as; financial constraints for day to day operations, transport constraints for some institutions particularly Government ones (John Smile, Percy, Luveve) and payment of salaries especially private facilities.
10.13.4 In view of the lack of full utilization the Government is of the view that there is no need for such facilities those already in place are enough. The government is advocating for community or foster care and adoption than institutionalisation.
10.13.5 The staff compliments of the various child care facilities are as shown in the table below;
Table 77: Staff compliment at the child care facilities
Name of Facility Establishment Existing
John Smale
Superintendent 1 1
Social Welfare Officers 0 0
General Hands 2 1
Supervisors 7 7
Cooks 2 0
Matron 0 0
Accounting assistant 1 1
Total 13 10
Percy Ibbotson
Superintendent 1 1
Matron 0 0
Social welfare officers 0 0
Supervisors 7 7
Cooks 2 2
General Hand 1 1
Accounting assistant 1 0
Total 12 11
Luveve Training School for Girls
Superintendent 1 1
Matron 0 0
Social Welfare officers 0 0
Cooks 2 0
General hand 2 1
Supervisors 6 4
Accounting Assistant 1 0
Total 12 6
Isaiah’s Umuzi Wothando

Review and Preparation of Bulawayo Master Plan (2019 – 2034) Report of Study
------------------------------------------------------------------------------------------------------------------------------
217
Administrator 1 1
Social welfare Officers 0 0
Nurse aids 0 0
General hand 1 1
Total 2 2
Emthunzini Wethemba
Administrator 1 1
Social Welfare Officers(SWOs) 0 0
Nurse Aids 0 0
General Hand 1 1
Total 2 2
Queen Elizabeth
Matron 1 1
SWOs 0 0
Nurse Aids 0 0
Secretary 1 1
Cooks 2 2
Finance Officer 1 1
General Hand 2 1
Caregivers 9 9
Total 16 15
SOS
Coordinator 1 1
SWOs 1 1
Nurse Aids 0 0
General Hand 1 1
Total 3 3
Mustard Seed Home
Administrator 1 1
SWOs 0 0
Nurse Aids 0 0
General Hand 2 2
Total 3 3
Thembiso
Superintendent 1 1
SWOs 0 0
Nurse Aids 0 0
General Hand 1 1
Total 2 2
Sandra Jones
Matron 1 1

Review and Preparation of Bulawayo Master Plan (2019 – 2034) Report of Study
------------------------------------------------------------------------------------------------------------------------------
218
SWOs 0 0
Nurse aids 0 0
General Hand 0 0
Caregivers 3 3
Total 4 4
Source: Dept of Social Welfare & Consultant Field Surveys – June 2018
10.13.6 As shown in the table above, no facility has a full staff compliment to ensure the smooth running of the child care facilities. Critical staff such as Social welfare officers, cooks, nurse aids and general hands is not available is some of the facilities. 10.14 FIRE STATIONS
10.14.1 There are four (4) Fire Stations in the City namely Famona, North-end, Nketa and Nkulumane fire station.
Table 78: Existing fire Stations in the City
Name of Fire Station
Year of Construction
Location
Staff Compliment
Establishment Existing
Famona 1950 Famona 117 39
Nketa 1955 Mpopoma 39 15
North End 1972 North End 39 15
Nkulumane 1998 Nkulumane 39 15
Control Room Call Centre 9 5
Fire Prevention Famona 2 1
Ambulance Services
All Stations 114 59
Total 356 149
Note: All the fire stations have 3 shifts and hence the high numbers as per establishments
Source: BCC
10.14.2 As shown in the table above there have been no new Fire stations constructed or developed after year 2 000, hence the need to establish at least two more stations to maintain or improve the response time by the fire department of ten minutes within the city.
10.14.3 In terms of service provision by the fire brigade, the city is divided into four zones called turn-out areas or station grounds to ensure a standard response time of ten minutes within each zone with back-up coming from another zone depending on the magnitude of an emergency. However, due to the rapid expansion of the city, the response time

Review and Preparation of Bulawayo Master Plan (2019 – 2034) Report of Study
------------------------------------------------------------------------------------------------------------------------------
219
has tended to increase above ten minutes to such suburbs as Waterford, Mahatshula and Cowdray Park and Woodville.
10.14.4 Infrastructural developments at each fire station constitutes of administration offices, staff quarters, kitchens, TV rooms, recreation rooms, lecture rooms, under carriage vehicle inspection pits, training drill yard, fire appliances and (vehicles) parking bays. Only Famona has additional infrastructure such a vehicle workshop for our fleet, partially equipped gym for our staff and equipment maintenance stores for internal servicing of various fire fighting equipment.
10.14.5 The current challenges being experienced by the fire brigade department include
manpower shortages, shortage of spare parts for vehicles and other equipment, poor road networks which affects the response times and proximity of suburbs (in respect of expanding city and the boundary) to the nearest fire station, such that our response time to furthest suburbs is about twenty minutes.
10.14.6 There are plans to establish new substations at Cowdray Park and Waterford.
10.15 CEMETERIES AND CREMATORIA
10.15.1 There are ten (10) cemeteries within the city. Only (1) operation cemetery is located in the high density area of Luveve, the others are located in the middle income residential area. Eight are being managed by the city council and the other two Nkulumane Heroes Acre and Umvutcha are privately managed. Some of the cemeteries which are being managed by the city have been decommissioned and hence are no longer fully operational except for reserved burial spaces except for the Green Span cemetery which has been fully decommissioned.
Table 79: Existing cemeteries in Bulawayo
Name of Cemetery
Size of the Cemetery
Operational Date
Estimated Life Span
Current Status Comments
Athlone Av.
16 ha In the late 1890s
decommissioned Closed in year 2000
Only a few grave sites for people who bought in advance still exist
Luveve Old 60 ha 03/03/1940
decommissioned Burial space left is for pioneers
Hyde Park 22 ha 17/02/1958 decommissioned Decommissioned Dwindling

Review and Preparation of Bulawayo Master Plan (2019 – 2034) Report of Study
------------------------------------------------------------------------------------------------------------------------------
220
in 2009 burial space. Only left for Muslims
Luveve Cemetery Extension
16 ha Nov 2009 15 yrs Commissioned in Nov 2009
Burials taking place are mainly for residents from western suburbs.
West Park 21 ha 02/11/1999 Ending in 2018 Still operational Little space available should take us up to June 2018
Marvel 17.2 ha Yet to be commissioned
Development taking place.
Pumula South
54.8982 ha
Yet to be commissioned
Yet to be commissioned
Athlone West
4.06 ha Yet to be commissioned
5 yrs Yet to be commissioned
Green Span 3 ha 9/10/1928 Over Decommissioned
Lady Stanley Av
Dec 1958 2 yrs Still operational. Cemetery within West park cemetery. Caters for burial of prominent citizens
Cremations 1940s Decommissioned in 2016.
Awaiting delivery of the new cremator
Umvutcha Park
2017 Operational Capacity is 50 000 graves
Source: BCC & Field Surveys
10.15.2 In addition to the cemeteries the city is operating a wood fired cremator that is a joint venture between Hindoo Society and the city council. The larger cremator was decommissioned in 2016, awaiting delivery of a new cremator.

Review and Preparation of Bulawayo Master Plan (2019 – 2034) Report of Study
------------------------------------------------------------------------------------------------------------------------------
221
10.15.3 Whilst there has been some reservations for burial space as some cemeteries are yet to be commission there are some challenges being experienced in the operation of cemeteries. These include; general maintenance of the cemeteries, fencing of the cemeteries, encountering rocky areas in some parts of the cemetery which reduces burial space and water logging being experienced in some of the cemeteries during the rainy season.
10.16 LIBRARIES
10.16.1 There are nine (9) libraries which are being managed by the City of Bulawayo through the Bulawayo Municipal Library Service (BMLS). The BMLS is a Sub-Section of the Education Section and is headed by a Senior Librarian, assisted by nine Branch Librarians to manage the whole library service. The table below shows the existing situation regarding libraries in the city.
Table 80: Libraries being managed by the City of Bulawayo
Name Stand. No /Physical Location
Mzilikazi 44054 Mzilikazi
Luveve 3170 Old Luveve
Magwegwe 1063 New Magwegwe
Mpopoma 47002 Mpopoma,
Njube 52008 Njube
Nketa 3809 Nketa 7
Nkulumane 8342 Nkulumane 12
Pumula 10324 Pumula North
Tshabalala 63065 Tshabalala
Source: Bulawayo City Council & Field Surveys
10.16.2 There is no mobile library service being offered by the BMLS at the moment.
10.16.3 The libraries are a portal of all types of information within the community of Bulawayo and this includes education, recreational and research. At the moment the BMLS is meeting the needs of their clients as shown by number of people who utilise this service. All the nine libraries were purpose built libraries that meet the modern library design and also provide reading and study spaces. In an effort to meet the needs of children the libraries have established childrens’ corners at all junior libraries (wings) where infant reading materials, games and toys are found.

Review and Preparation of Bulawayo Master Plan (2019 – 2034) Report of Study
------------------------------------------------------------------------------------------------------------------------------
222
10.16.4 While the libraries are providing an essential service to the community by promoting a reading culture they have not delivered to their expectation. For example due to harsh economic climate in the country, the library as a sub-section has not been able to expand as expected. The LA strategy was such that it planned to build at least one library after every five years as new suburbs were being built. The whole idea was that no library user should travel more than 5km to access the nearest library to their residential areas. However, the LA has not managed to do so as presently there is a backlog of eight (8) libraries.
10.16.5 In addition, all the nine (9) libraries are now lagging behind in terms of information
communication technology. Internet for the public and staff is needed in the libraries. Currently only three (3) out of nine (9) libraries are online. Office and desk work need to be digitalised in order to cut some cost and improve service delivery efficiency. For example the installation of Koha, a library management software, would improve library operations significantly.
10.16.6 The staff establishment needs to be improved to offer good library service. Currently
there are fifteen (15) vacant positions.
10.16.7 Funds are also needed annually to buy books relevant to local needs and to support local education syllabi. Current the library relies on donated books from Book Aid International which do not necessary meet our clientele’ needs. Funds are also needed for general expenses, for example, buying materials for book processing. 10.16.8 In addition to the public libraries which are being managed by the city of Bulawayo there are 2 other public libraries namely; Bulawayo Public Library and the National Free Library.
Table 81: Other Public Libraries in the City
Name of Library Location
Bulawayo Public Library City Centre, between Fort Street and eighth Avenue
National Free Library Along 12th Avenue Extension next to Bulawayo Polytech
Source: Job Jika & Associates
10.16.8.1 Bulawayo Public Library 10.16.8.1.2 Bulawayo Public Library was the 1st public library to be stablished in the country. It
was established in 1896 to provide services to citizens in the city centre and those suburbs which had no libraries in their neighborhoods. The library is being managed through a management committee and the library is a subscription library funded through subscriptions, grants and donations.

Review and Preparation of Bulawayo Master Plan (2019 – 2034) Report of Study
------------------------------------------------------------------------------------------------------------------------------
223
10.16.8.1.3 The library has 5 main section namely the main Lending section, children section, textbook and study section, binding section and computer section (internet cafe) and each with a capacity to accommodate 100 people. In addition, the library is offering braille services to the blind. They receive information services and rehabilitation and this library is improving their lives.
10.16.8.1.4 While the library is providing a service to the Bulawayo community, the major clients are children and high school going students at an average of 50 a day. Library
patronage is high during school holidays and towards exams as students will be utilizing the space for studying for their final examinations.
10.16.8.1.5 At Inception the library had a staff compliment of ten (10) which has since increased to 22. This staff compliment constitutes of administrative as well as librarians. 10.16.8.1.6 The challenges being experienced by the library are mainly financial. As a self funding and non profit organisation lack of funding is affecting the library services especially when it intends to introduce new services or improve infrastructure. 10.16.8.1.7 In addition to the main public library the Bulawayo Public Library is running four (4) public library branches within the city namely Ascot Public Library, Cowdray Park Library, Historic Reference Centre (HRC) and the book (mobile) bus library. 10.16.8.2 Ascot Public Library 10.16.8.2.1 Ascot Public Library was established in 1981. The facility was meant to cater for members of the public who reside in the eastern suburbs as the city council has only developed public libraries in the western suburbs. The library is being managed through a management committee of the main public library and is being funded through subscriptions, grants and donations. 10.16.8.2.2 The library provides lending services as well as internet services at a cost. 10.16.8.2.3 While the library is providing a service to the Bulawayo community in the eastern
suburbs, its major clients are children and high school going students and some senior citizens. Library patronage is high during school holidays and towards exams as students will be utilizing the facility to prepare for their final examinations. The Library is not open on Wednesdays.
10.16.8.2.4 The library had a staff compliment of one officer. 10.16.8.3 Cowdray Park Public Library 10.16.8.3.1 Cowdray Park Public Library was established in 1995. The library does not

Review and Preparation of Bulawayo Master Plan (2019 – 2034) Report of Study
------------------------------------------------------------------------------------------------------------------------------
224
constitute of any physical infrastructure but it is an old bus which was beyond repair which had a breakdown at Mahlathini primary school which was modified for
use as a library. The facility was meant to cater for members of the public who reside in Cowdray Park as there is no provision of library services in the neighbourhood. The library is being managed through a management committee of the main public library and is being funded through subscriptions, grants and donations.
10.16.8.3.2 Despite that the library is located within a school it is providing lending services to all members of the public within the neighbourhood. While the library is providing a
service to the Bulawayo community in the eastern suburbs, its major clients are children and high school going students and some citizens. Library patronage is high during school holidays and towards exams as students will be utilizing the facility to prepare for their final examinations.
10.16.8.3.3 The library had a staff compliment of one officer.
10.16.8.4 Historic Reference Collection 10.16.8.4.1 The Historic Reference Collection (HRC) was officially opened in 1981 and is operating from the City Council building – under the clock. It is the repository centre for various publications on Zimbabwe. The facility is meant to keep various publication which are also available at national archives as well as the Harare legal repository centre. The library is being managed through a management committee of the main public library and is being funded through subscriptions, grants and donations. 10.16.8.4.2 The library provides lending services as well as internet services at a cost. 10.16.8.4.3 The historic reference collection is meant to provide members of the public in the whole city with various publications on the history and development of Zimbabwe. While the library is providing a service to the whole Bulawayo community, its major clients are university students, researchers and some senior citizens. Library patronage is high when university students are writing their dissertations and thesis but on the overall researchers throughout the year patronise the HRC. 10.16.8.4.4 The library had a staff compliment of one officer. 10.16.8.5 Book (mobile) bus library 10.16.8.5.1 This is an outreach program of the mobile library which reaches out and instills a reading culture to primary school going children at schools which do not have libraries.

Review and Preparation of Bulawayo Master Plan (2019 – 2034) Report of Study
------------------------------------------------------------------------------------------------------------------------------
225
10.17 National Free Library
10.17.1 The National Free library was established in 1945 but its origins go back to the grant made in 1939 to the government of then Southern Rhodesia by the Carnegie Corporation of New York. 10.17.2 The Ministry of Primary and Secondary Education is the responsible authority. The
library used to be run by a Board but was taken over by the Government through an ACT called the National Library and Documentation Service of 1985.
10.17.3 At Inception the library had four (4) sections namely: local lending; postal lending;
accessions and interlibrary loans but now there are basically 2 active sections namely the local lending and accessions. Postal lending and interlibrary loans were overtaken by events.
10.17.4 The library has a sitting capacity of 60 and the garden can accommodate 40 readers
making a maximum of 100 users at a time. The libraries major clients are high school students, lecturers, students from tertiary institutions. (Anyone who has completed 4years of secondary education can join the library) Average of 10 people use the library on quiet days and on busy days 40 or more. The library is particularly busy for major national and international examinations. It is usually quiet in December.
10.17.5 At inception the library had a staff compliment of thirty two (32) but now the library has a total staff compliment of six (6), 2 General Hands, 2 Library Assistants and 2 Senior Librarians. The post of a Deputy Director has been vacant since 2004, Principal Librarians since 1997 and Senior librarians since early 2000. 10.17.6 The library is not fully meeting the needs of the community due dependence on
donations and donors do not meet a specific need but they give what they have. Books and other materials were last purchased in the late 1990s. However, with purchases the library is able to meet specific needs. 30 074 people have used the library in the past 5 years and the library is experiencing a decline in usage due to an old collection and failure to embrace emerging technologies. Funding has been the biggest challenge. The economic situation prevailing in the country has contributed immensely to the decline in patronage. The major challenges being experienced by the library include; underfunding, slow pace by government in adopting and adapting to the emerging technologies, outdated and torn books and failure to improve the existing structures
10.17.7 In future the library is looking at ICT, more offices and training rooms. The library has
potential to be expanded upwards to accommodate more office space and a virtual library.
Review and Preparation of Bulawayo Master Plan (2019 – 2034) Report of Study
------------------------------------------------------------------------------------------------------------------------------
226
10.18 PLACES OF WORSHIP 10.18.1 There are 726 registered churches within the city and they are unevenly distributed
through out the city. The majority of the churches are located in the city centre and high density residential area. The most prominent and big churches in the city include, UCCSA, Zion Christian Church, Seventh Day Adventist, Roman Catholic, Evangelical Lutheran Church in Zimbabwe, Methodist Church of Zimbabwe, United Methodist Church in Zimbabwe, AFM, Guta ra Mwari and Pentecostal Churches. Of all the registered churches 620 are operating from designated stands while some are operating from residential premises, schools, premises within the city centre and from some industrial stands in the various industrial areas. This goes to show that there is a shortage of civic and community stands in Bulawayo.
10.18.2 Some of the challenges being experienced in the operation of churches include; ethnical differences leading to splits and new church formations resulting in an increase in the church waiting list register and financial constraints resulting in the failure to develop the church stands as well as payment of monthly rates. 10.19 SPORTS AND RECREATION 10. 19.1 Bulawayo has a good share of sporting facilities and the most popular being football,
rugby, hockey and cricket. The activities are well distributed across the city with elitist sports being concentrated in the low density residential areas and the high density area beginning to enjoy exposure to these sports due to development programmes initiated by central government and the respective associations.
10.19.1.1 Stadiums and Sports centres
10.19.1.2 There are five major stadiums in Bulawayo. Three of these stadiums are Municipal
owned, one is state owned and the other is privately owned. There have been no major
developments undertaken except for improvements and upgrading of Luveve Stadium,
White City stadium, Barbourfields Stadium and Bulawayo Municipal Pool during the
AUSC Region 5 Youth games in 2014. Sporting grounds were also revamped at Mzilikazi,
Indlovu and Inyathi youth centres. These stadiums are multi purpose and may also be
hired out for various occasions. In addition, there are various smaller privately owned
sports centres which are open to paid up members who have the full priviledge of
utilizing the facilities. Facilities at the clubs include tennis, squash, badmington,
basketball courts, football, rugby, cricket, hockey grounds and swimming pools. Some of
the major sports clubs in the city include Queens Sports Club, Bulawayo Athletic Club,
Bulawayo Sports Club, Old Miltonians, Busters, Zimbabwe saints, Highlanders, Railstars
and Amazulu.

Review and Preparation of Bulawayo Master Plan (2019 – 2034) Report of Study
------------------------------------------------------------------------------------------------------------------------------
227
10.19.1.3 Swimming Pools
10.19.1.4 There are six (6) swimming pools in the city. Three (3) of the swimming pools are
located in the high density areas of Luveve, Mpopoma and Barbourfields. The Other 3
are located in Barham Green, North End and the city centre. Information on the existing
swimming pools and their status is shown in the table below.
Table 82: Swimming pools in the city
Name of Swimming Pool Location Operation Status
Leased Out or being managed by BCC
Princes Margaret CBD Operational managed by BCC
Barbourfields Barbourfields Not Operational Leased Out
Barham Green Barham Green Operational Managed by BCC
North End North End Not Operational Managed by BCC
Luveve Luveve Not Operational Managed by BCC
Mpopoma Mpopoma Not Operational Managed by BCC
Source: City of Bulawayo
10.19.1.5 Only one (1) swimming pool is being leased out as part of the Public Private Partnership (PPP) as well as to improve service provision. As noted above the majority of swimming pools are not operating due to high costs of operation and maintenance and the perennial water and power challenges have also affected the operations of the swimming pools. There have been development of swimming pools in the newer residential areas even after year 2000 and the LA does not have plans to develop any swimming pools in the new residential areas.
10.19.1.6 Basketball 10.19.1.7 The major basketball courts in Bulawayo are located in North end and the central area. These facilities are used both for social and professional matches. Other basketball courts may be found within private properties or educational institutions.
10.19.1.8 Tennis/Badminton Courts
10.19.1.9 There are three (3) main tennis courts in Bulawayo, BAC, White City and Emakhandeni. BAC is located within Suburbs, White City in Mabutweni and Emakhandeni Tennis Club within the same suburb. BAC mainly serves the northern and western residential areas, whereas White City serves the western areas. In addition to the above courts some sports clubs and institutions also have tennis facilities.

Review and Preparation of Bulawayo Master Plan (2019 – 2034) Report of Study
------------------------------------------------------------------------------------------------------------------------------
228
10.19.1.10 Golf Courses
10.19.1.11 There are four (4) golf courses in Bulawayo. The golf courses are privately operated and are utilised by club members. These are located in the low density residential areas.
10.19.1.12 Water Recreation
10.19.1.13 Water recreation takes place outside the Municipal boundary on Umguza, Ncema, Umzingwane and Cunningham dams.
10.19.1.14 Entertainment and Cultural Facilities
10.19.1.15 The rate of growth and development of entertainment and social facilities in Bulawayo has been generally low during plan period. Cinema facilities exist at the Bulawayo centre in the central business district. Their locations means that they are generally accessible to a wider audience from the city and its hinterland. There also exists theCentral Park Ampitheatre which is located at the centenary park and the Music Academy which is located near the Trade Fair. In addition, Amakhosi Township Squareis located on the city centre periphery in Makokoba, offers theatre, music and othercultural events. Black Umfolosi has a cultural centre within the residential area of Entumbane.
10.20. PARKS AND OPEN SPACES
10.20.1The preservation of open spaces throughout the city is important to provide the soft
scape in the city. However, there have been some concerns regarding some open spaces
when it was realized that enforcing authorities were involved in changing uses of areas
designated as open through re-zoning for other urban land use activities. The
development has contributed to the potential danger of ecological imbalance resulting
from the insufficiency of open spaces.
10.20.2 There are two caravan parks in Bulawayo which are both Municipal owned the Hilltop
site along Gwanda road and the central caravan site which is close to the Bulawayo
Polytechnic. The central caravan park is properly designed, landscaped and well laid out.
There are water fountains, internal foot paths, benches and flower beds, trees and
shrubs also offers a play area, chalet area, tent area and biker area.
10.20.3 There are several open spaces all over the city in the various neighbourhoods in
conformity with the urban design guidelines. Some of the open spaces have not been
developed to make them active resulting in their being considered abandoned or merely

Review and Preparation of Bulawayo Master Plan (2019 – 2034) Report of Study
------------------------------------------------------------------------------------------------------------------------------
229
undeveloped plots. The open spaces need some attention from the City Council. As a
result of lack of maintenance the propensity to convert them into other land uses is a
function of their being left unattendant. If they are properly developed as open spaces,
the residents will not consider them as undeveloped vacant plots which they can utilise.
10.20.4 In addition to parks and open spaces there are several play grounds especially within
schools but also in the various residential neighbourhoods throughout the city. In the
recent years community grounds have been established at Emganwini, Nketa, Cowdray
Park and Pumula East. Most of these open spaces are used for sporting activities even
though informally as is the case with open spaces outside the educational institutions.
Soccer is the most visible sporting activity in the later category of open spaces.
10.20.5 One crucial important open space which occupies a prominent place in the city is the
Mazwi game reserve. Located on an expansive plot about 10km from the city centre
along the Victoria Falls road, the site used to be a prime attraction for tourists and
residents in the city. There is a rich variety of wildlife for which the country is well know
for.
10.21 PUBLIC CONVENIENCES
10.21.1 Public conveniences in Bulawayo are provided by the City Council. These are mostly
integrated in places where there are high volume public areas e.g. city centre, bus
terminuses and cemeteries. There are 97 public conveniences which have been
constructed to serve the entire city. These are distributed as shown in the table below.
Table 83: Status of public toilets in the city LOCATION NUMBER OF
W/CS CISTERNS CONDITION OF TOILET OPERATOR
Male Female
Northend 3 3 3 cisterns not working Council
Queens Rd/M. Ndlovu Ave 2 5 1 pan broken 2 cisterns missing
Council
Queens Park East 1 1 All not flushing Closed
Upper H/Side Dam (Brown) 4 6 All not flushing Leased
Upper H/Side Dam (White) 2 2 Functioning well Leased
Lower H/Side Dam 3 3 All working Leased
8th Ave/R. Mugabe Way 12 11 One block Leased Council/Leased
Chigumira S/centre 1 2 3 cisterns not working Council
T M Hyper 2 5 Working Under TM
P.S. Mpofu 1 2 3 cisterns not working Closed
Woza Woza S/Centre 1 2 3 cisterns not working Closed

Review and Preparation of Bulawayo Master Plan (2019 – 2034) Report of Study
------------------------------------------------------------------------------------------------------------------------------
230
Mugadza S/Centre 1 2 3 cisterns not working Closed
Apollo S/Centre 1 2 3 cisterns not working Council
Mawunga 1 2 3 cisterns not working Closed
Eastgate Complex 3 5 1 cisterns not working Closed
Westgate 3 5 8 cisterns not working Closed
Dliwayo S/Centre 1 2 3 cisterns not working Closed
Rusike S/Centre 1 2 3cisterns not working Council
Yonah S/Centre 1 2 3 cisterns not working Council
Nhliziyo S/Centre 1 2 3 cisterns not working Council
Hlalo S/Centre 1 2 3 cisterns not working Council
Basch Street/6th Ave 4 4 Leased
B.G. Shopping Centre 2 4 6 cisterns not working Council
Manwele Market 4 3 All not working Council
Mashumba 5 2 5 cisterns not working Council
Efusini 2 2 Refurbished by WVZ Council
Makokoba Market 8 7 Refurbished by WVZ Council
Black & White 2 2 4 cisterns not working Council
J.B T/Grove 3 2 5 cisterns not working Council
Mzilikazi S/Centre 2 2 4 cisterns not working Closed
Library (Mzilikazi) 3 2 5 cisterns not working Closed
Nkulumane (Sekusile) 2 3 5 cisterns not working Leased
Nkulumane (Munyoro) 2 3 Refurbished Council
Nkulumane (Phekiwe) 2 3 5 cisterns not working Closed
Nkulumane 10 3 5 8 cisterns not working Closed
Nketa 6 2 3 5 cisterns not working Council
Nketa 6 S/Centre 2 3 5 cisterns not working Council
Nketa 9 S/Centre 2 3 5 cisterns not working Council
Lenard S/Centre 2 2 cisterns not working Closed
Tshabalala Bus Terminus 2 2 cisterns not working Council
Tshabalala One Way 1 1 2 cisterns not working Council
Tshabalala Post Office 1 1 Vandalised cistern, taps
Council
Vulindlela Trading Co. 1 2 3 cisterns not working Closed
Tshabalala Nketa Drive 2 3 Vandalised zinc roof, cistern, taps
Closed
Sizinda P/Toilet 3 4 Vandalised Closed
Magwegwe West 1 2 3 cisterns not working 3 taps missing
Council
Pumula East 1 2 Refurbished by WVZ Council
Pumula /North 1 2 Working Council
Kelvin 3 5 Working Council

Review and Preparation of Bulawayo Master Plan (2019 – 2034) Report of Study
------------------------------------------------------------------------------------------------------------------------------
231
Maplanka 1 2 Working Council
J Themba 1 2 Working Council
Masina 1 2 3 cisterns not working Council
Banda Square 1 2 3 cisterns not working Council
Mpopoma Total 1 2 Refurbished by WVZ Council
Njube S/Centre 3 5 5 cisterns not working Council
New Lobengula Terminus
1 2 3 cisterns not working No taps on hand basins
Closed
Magwegwe North Terminus
1 2 No taps on hand basins Council
Magwegwe North Market 1 2 2 cisterns not working No taps on hand basins
Council
Magwegwe West Terminus 1 2 3 cisterns not working Council
Mpopoma Barnabas 1 1 All flushing Council
Kelvin North 3 5 8 Cisterns not working Council
Tikili S/Centre 1 2 3 cisterns not working Council
Njube ‘D’ Square 1 1 2 cisterns not working No taps on hand basin
Council
Iminyela 1 2 Under renovation by Council for Disabled
Mabutweni 3 5 Not functional Closed
Lobengula at Sikulile 1 2 Not working Closed
Khami Road (near Cleansing)
4 2 6 cisterns not working Closed
Near Getrude Hostel Makokoba
Closed Closed
5th Ave/Fife Street Functional Council
Cowdray Park 2 3 functional Council
2nd Ave/Lobengula St 3 3 Leased Leased
Pelandaba 1 2 working Council
1st Ave/S. Parirenyatwa 1 2 Leased Leased
Luveve Success (Sporweni) Newly Built Council
Revenue Hall (Underground)
9 9 working Closd
Renkini (1st Block) 10 14 5 w.c not functional Council

Review and Preparation of Bulawayo Master Plan (2019 – 2034) Report of Study
------------------------------------------------------------------------------------------------------------------------------
232
Renkini (2nd Block) 10 3 not functional Council
Renkini (3rd Block) 10 10 Closed due to plumbing challenges
Council
Nkulumane Complex 6 5 Functional Council
Lobengula St/Mall (Zupco Terminus) Block 2
6 18 10 w.c not functional To be demolished under Terra Cotta
Lobengula Mall (Zupco Terminus ) Block 1
6 - 6 doors missing 6 cisterns not working
As above
Thorngrove Industrial 3 2
5 cisterns not working Closed
Bristol Rd/ J Chinamano Supercanners
1 2 3 cisterns not working Closed
Khami Rd/Magazine Rd near Cleansing Section
Closed Closed
White City 1 2 Not functional Council
Mpopoma Nketa Park (1st Block)
Not functional Council
Mpopoma Nketa Park (2nd Block)
Not functional Council
Congo Park 1
2 3 cisterns not working Closed
Falls Rd/M. Ndlovu 1 1 Leased Closed
8th Ave/R Mugabe Way 12 11 Leased Council
Basch Street/ 6th Ave 4 4 Leased Leased out
3rd Ave/Lobengula St Leased Leased
Nguboyenja 6 3 Returned Council
Mpilo Public Toilet 2 3 Leased Leased
8th Ave/Basch Street 8 8 Leased Leased
New Magwegwe Leased Leased
Skittle Inn Leased Leased
Source: Bulawayo City Council
10.21.2 However, of all these facilities only 62 are fully operational and of these 12 have been

Review and Preparation of Bulawayo Master Plan (2019 – 2034) Report of Study
------------------------------------------------------------------------------------------------------------------------------
233
leased out. During the operational period of the Master Plan (2000 – 2015) public
conveniences have been developed in two areas namely Cowdray park terminus and
Nkulumane long distance bus terminus. Some of the facilities have since been closed
due to manpower shortages while others have been vandalized as they are no longer
serving the purpose for which they were established especially those which were
provided at the bus terminuses, as the bus terminuses are no longer being
operationalized. The major challenges being experienced in operationalizing the public
conveniences especially those which are being operated by the Municipality is
vandalism. Due to inadequate facilities and maintenance problems being experienced in
terms of public conveniences this constitutes a potential health hazard in the city.
However, the city council has plans to establish more public conveniences in new
suburbs and other areas which are now high volume public areas.
10.22 NATIONAL MUSEUM
10.22.1 The Bulawayo Museum, later named the Natural History Museum of Zimbabwe is
Zimbabwe’s largest museum. It is located in the Centenary Park in Bulawayo long
Leopold Takawira. The National Museum was built in 1962 and in 1982 when all the
natural science collections were moved to it and it was renamed Natural History
Museum of Zimbabwe.
10.22.2 The Museum has the world’s renowed collection of exhibits from various which relate
to Entomology (insects), Geology, Herpetology (reptiles and amphibians), Ichthyology
(fishes), Mammology, Ornithology (birds), and Palaeontology (prehistoric life forms).
The Museum has a considerable number of artefacts from Zimbabwe’s colonial era.
There is a large collection of gemstones showcasing the country’s wealth in terms of
natural resources. At the centre of the museum is a collection of live snakes such as
black mambas and cobras. The impressive circular building has nine (9) public display
galleries, a lecture hall with a sitting capacity of 120, a cafeteria and eight research
departments with substantial study collections and ongoing research in the various
disciplines indicated above. Educational opportunities to students and the general
public are offered through guided tours, periodic talks and conservation clubs.

Review and Preparation of Bulawayo Master Plan (2019 – 2034) Report of Study
------------------------------------------------------------------------------------------------------------------------------
234
CHAPTER 11 INFRASTRUCTURE AND UTILITIES
11.0 INTRODUCTION 11.0.1 This chapter covers water supply and waste water including all infrastructure from raw
water sources, storage, pump stations rising and gravity supply mains, water treatment, clear water storage reservoirs, bulk distribution mains, reticulation, reservoir/zone metering erf connections and consumer metering. In terms of wastewater this includes all infrastructure from sewer outfalls, pump stations, rising mains, reticulation and waste water treatment facilities. The chapter also covers roads, traffic and transportation in the city, electricity and telecommunication systems.
11.1 WATER SOURCES, SUPPLIES AND DEMAND
11.1.1 It is estimated that the water reticulation network is 2 381km. The engineering services
department is responsible for the planning, design and administration of water infrastructure for the city. The general planning of water was found to be of good competency and well planned as confirmed by previous master plan studies. However, the infrastructure in some cases has its design life come to an end whilst in some cases rehabilitation and upgrade efforts have been made. Inadequate resources for operations and maintenance have also contributed to non-fulfillment of some initiatives and recommendations by previous studies.
11.1.2 Extensive studies have been carried out including the Bosch Stemele Water and
Wastewater master plan of 2012. The contents of the report cover master planning with interventions at three levels, immediate, short term (5years) and medium term up to 20 years. The report covered:
• Water Demand Management
• Water and wastewater master plan study
11.1.3 The recommendations made in the report have been reviewed in line with the proposed Master Plan as there is a deliberate effort to implement recommendations.
Water Sources
11.1.4 The main sources of water for Bulawayo is a group of five supply dams to the south
eastern side of the city located on the system of rivers forming the Limpopo River catchment system. Khami dam located on the north western end of the city is currently out of commission due to high pollution levels. The city also gets supplies from 77

Review and Preparation of Bulawayo Master Plan (2019 – 2034) Report of Study
------------------------------------------------------------------------------------------------------------------------------
235
boreholes located at the Nyamandlovu aquifer located approximately 70km north west of the city which supply approximately 10% of the city’s water consumption. Despite being installed in 1992 the boreholes were not fully operational until 2012 and are giving a yield of 2 Mℓ/day and a maximum of 4 Mℓ/day. The management of the Nyamandlovu Aquifer is a shared responsibility between Zimbabwe National Water Authority (ZINWA) and the City of Bulawayo. The boreholes pump into a common supply pipeline which feeds into Rochester Reservoir. The responsibility for the borehole supply system by ZINWA terminates at the Rochester Reservoir. The City of Bulawayo is responsible for the supply system from the outlet of Rochester reservoir.
Table 84: Main water sources for Bulawayo
Source Capacity m³ Yield mℓ/day
Umzingwane Dam 42 million 35,3
Inyankuni Dam 74 million 20.8
Upper and Lower Ncema Dams 63 million 42.5
Insiza Dam 173 million 33.7
TOTAL 352 million 132.3
Source: Bulawayo City Council & Consultants Surveys 11.1.5 The Mtshabezi pipeline was commissioned in 2016 to augment supplies to the city and
has an average yield of 16 Mℓ/day. This pipeline augments water supply from Mzingwane. In addition, there is an additional supply of 17.9 Mℓ/day from Insiza Dam, which is the Iargest of the existing supply dams and increases the safe yield from 4% to 10%. Historically, Insiza Dam has been a reliable source of raw water supply to Bulawayo, even during severe drought conditions when the other supply dams have not been able to provide the safe yields.
11.1.6 With the exception of Insiza dam which is 20.5% Government owned, all the dams,
conveyance systems and purification works which are used to supply the city are owned by the City of Bulawayo. The Nyamandlovu Acquifer well field is government owned but the storage and conveyance system is council owned. The City Council is also responsible for the maintenance and operation of all the water supply facilities.
11.1.7 There is a proposal to augment supply to Bulawayo through the Zambezi/Gwayi-
Shangani Dam in the medium term (5-10years). This proposal remains active with an anticipated design capacity of 168.5 Mℓ/day for the initial 1200mm diameter pipeline, and 146.9 Mℓ/day for the second stage 1100mm diameter pipeline. It remains a critical project to ensure water supply security. It is envisaged that the supply will have a receiving raw water reservoir and treatment works at Cowdray Park.
11.1.8 The future water supply as depicted in the 2012 Water & Waste Water Master Plan,
shows that fully implementation has not yet been undertaken. This long term plan will

Review and Preparation of Bulawayo Master Plan (2019 – 2034) Report of Study
------------------------------------------------------------------------------------------------------------------------------
236
see an increase in water demand of up to 204.1 Mℓ/day by year 2032. The summarized scenario is:
• 50% of the bulk water supply will be provided from the existing water sources with a yield of 132.3 Mℓ/day, including the Mtshabezi pipeline which is now in place
• 50% of the bulk water requirement would be provided from the Zambezi and Gwayi- Shangani Dam. This proposal would cater for water demand of the Magwegwe reservoir, Cowdray park and proposed future northern reservoir
• 9 Mℓ/day from the Nyamandlovu aquifer 11.1.9 Based on the current water resource planning for Bulawayo, it was envisaged that
approximately 20% of the domestic sewage in Bulawayo needs to be re-cycled for potable re-use. This is work in progress, although the water at this stage is intended for non-potable use. The industries and Zimbabwe Electricity Supply Authority are part of this program.
11.2 BULK WATER TREATMENT AND STORAGE
11.2.1 Water is treated and pumped to reservoirs within the city through pressurized
reticulation mains.
a) Ncema water treatment works
11.2.2 Ncema treatment works located 60km to the south eastern part of the city receives raw water from the existing supply dams. These works were constructed in 1939 with a capacity of 80 Mℓ/day. Ncema treatment works receives water by gravity from Lower Ncema and Umzingwane Dams. There is a provision to receive water from Insiza and Inyankuni dam if required. The Ncema water treatment plant consists of the following infrastructure:
• A balancing reservoir and chemical dosing at the head of the works. The
chemical is mixed in solution in 2 x 23m³ tanks and dosed by gravity feeder,
vertical shaft mixers are used for mixing.
• Four clariflocculators, a square type Dorr Clarifier and 2 No. Kinmont horizontal
sedimentation tanks
• 3 main banks of rapid gravity sand filters. There are in total 21x rapid gravity
sand filters. Backwash is through a combination of air and water scour.
▪ Bank 1 (North) – 8 filters ▪ Bank 2 (East) – 6 ‘Bateman’ type filters ▪ Bank 3 (West) – 6 ‘Candy’ type filters ▪ Old ‘Bateman’ type filter

Review and Preparation of Bulawayo Master Plan (2019 – 2034) Report of Study
------------------------------------------------------------------------------------------------------------------------------
237
11.2.3 The raw water is conveyed to storage reservoirs, with approximately one third of the raw water being treated at Ncema. The water is then pumped to Fernhill and Tuli Reservoirs. The remaining two thirds is pumped, via Fernhill Reservoir and pump station, to the Criterion Water Treatment Works where it is treated and distributed. Treated water is stored in 2 clear water reservoirs. The 2012 Water & Waste Water Master plan, recommended a decommission of the Ncema treatment works in 2022. This in turn would mean that raw water will be pumped to Fernhill raw water reservoirs, then pumped and treated at Criterion water works. It is envisaged that the Ncema to Fernhill and Criterion raw water pumping mains, pump station and reservoirs should be refurbished by 2022.
b) Criterion water works
11.2.4 These works were constructed in 1973 with an average capacity of 180 Mℓ/day, consisting of two 90 Mℓ/day modules. The criterion water works consists of the following infrastructure:
• 1,400 Mℓ open raw water storage reservoir/dam
• Chemical dosing plant (i.e. aluminium sulphate for coagulation, polyelectrolyte as a flocculation aid and lime for PH correction)
• 8 Alum solution tanks
• 2 polyelectrolyte solution tanks
• 2 x 4 No. Degremont Pulsator Clarifiers
• 2 x 8 No. rapid gravity sand filters
• Disinfection through chlorination
• 90 Mℓ clear water reservoir
• Sludge ponds
11.2.5 Fernhill Reservoir receives pumped raw water from Ncema Water Treatment Works via a booster pump station at Fernhill Reservoir up to the open raw water storage reservoir at Criterion. Water gravitates from the reservoir into the treatment works through a 900mm diameter concrete pipe. The Fernhill pipeline also has a valve system to divert raw water directly into the storage reservoir outlet pipework, thereby by-passing the raw water storage reservoir if required. Flow into the works is measured by an orifice plate type ‘Kent’ flow meter and the flow is manually adjusted with the use of a valve.
11.2.6 In the long term it is envisaged that recycled water from Khami Dam will be used for
industries to augment water demand. The recycled raw water source will not exceed 20% of the total 20 year water demand requirements. The existing treatment works with a capacity of 180 Mℓ/d is capable of treating the required demands for the next 5 years. A further 10 Mℓ/d augmentation will be required to meet the 10-20 year demand. In addition, a bulk water supply pipeline will be required from Criterion Water Treatment Works to the Tuli Reservoir. Water demands up to 2022 will require water from both the Ncema and Criterion Water Treatment Works.

Review and Preparation of Bulawayo Master Plan (2019 – 2034) Report of Study
------------------------------------------------------------------------------------------------------------------------------
238
11.3 BULK WATER SUPPLY MAINS
Bulk Pipeline from Insiza Dam to Ncema WTW Raw Water Reservoir
11.3.1 The pipeline was constructed around 1980. Water gravitates from the outlet of Insiza
Dam to the raw water reservoir at Ncema treatment works. This line is a 900mm diameter AC pipe, class 6, 12 and 24, its length is approximately 28km. Due to the age of the pipeline, it leaks frequently and has had failures in some sections in recent years. The local authority has been managing the situation through maintenance. Air valves which were previously giving challenges have since been replaced. There are existing recommendations to replace problematic sections of the line with a 800mm diameter steel or GRP pipeline which will convey the approximate 44 Mℓ/day based on the safe yield of the dam. In addition, there has been some recommendations to duplicate the pipeline link from Insiza Dam to Ncema with a second 600mm diameter pipeline, in order to provide an additional capacity of 17.9 Mℓ/day. Based on 2012 studies by Bosch Stemele it was recommended that consideration be given to increasing the duplicate proposed pipeline to 900mm diameter in order to meet the full capacity requirement for this link. This will allow the old existing AC pipeline to be de-commissioned at some stage in the future (medium to long term), when it reaches the end of its life span. Insiza dam remains key to water security in the city. The City is in the process of sourcing funds for the duplication of the line.
Bulk Pipeline from Umzingwane Dam to Ncema water treatment works
11.3.2 Umzingwane to Ncema pipeline was constructed around 1950. Ncema water treatment
works receives water from Umzingwane through an 840mm diameter steel pipe by gravity if the dam levels are sufficiently high or through a booster pump if otherwise. The bulk pipeline is 9km in length. The line is in a fair condition although the city attends to leaks and failures through planned and general maintenance. There is need for a detailed condition survey of the pipeline. The results will guide the Local Authority in terms of whether a complete replacement is required given the age of the pipe. Based on the safe yield of the dam approximately 46 Mℓ/day can be achieved.
Bulk Pipeline from Inyankuni Dam to Ncema WTW Raw Water Reservoir
11.3.3 Water gravitates from the outlet of Inyankuni Dam to the raw water Reservoir at Ncema
WTW through an existing 600 mm diameter AC (Class 24) bulk pipeline, approximately 15 km in length. The pipeline was constructed in the 1950’s and is in a fair condition. Over the years a few leaks or failures on the pipeline have been detected but these are being managed and repaired. In general the line is in good working condition. Recommendations based on 2012 studies are to replace sections with a new 700mm diameter steel or GRP pipeline. Based on dam yield, approximately 27 Mℓ/day, flow can be achieved.

Review and Preparation of Bulawayo Master Plan (2019 – 2034) Report of Study
------------------------------------------------------------------------------------------------------------------------------
239
Bulk Pipeline from Ncema Dam to Ncema WTW 11.3.4 Water gravitates from Lower Ncema into Ncema treatment works. Lower Ncema
receives flow from Upper Ncema. Based on the yield of the dam approximately 55 Mℓ/day of flow can be achieved.
Bulk Pipelines from Ncema Raw Water Reservoir to Criterion Raw Water Reservoir
11.3.5 Ncema- Fernhill line was constructed in 1968 and is commonly known as “KSB” main,
which is 840mm diameter steel pipe and is VJ coupled. The line is generally in a fair condition. There are two pump stations on the line both with KSB pumps.
11.3.6 Fernhill- Criterion line is a 750/825mm diameter steel pipe, which was constructed in
1995 and commonly known to as the “Sulzer” main. The pipeline is in a generally fair condition. The two pump stations are equipped with Sulzer pumps. General conditions of serviceability could not be ascertained.
11.3.7 The bulk pipeline consists of dual steel raw water high pressure pumping mains of
approximate total length of 37.7 km. There are two pumping lifts:
• Ncema to Fernhill (20 km)
• Fernhill to Criterion (17.7 km).
Bulk Pipeline from Ncema WTW to Tuli Clear Water Reservoir (Sulzer Old) 11.3.8 The pipeline was constructed around the mid 1950’s, and is in a fair condition, with
localised corrosion at VJ coupled joints along the pipeline. The pipe line has an approximate length of 37.7km which is a 760mm diameter steel clear water high pressure pumping main. There are two pumping lifts.
• Ncema to Fernhill (20 km)
• Fernhill to Criterion (17.7 km)
11.3.9 The 760mm diameter steel pipeline has VJ coupled joints, with a bitumen coating and lining. This pipeline is commonly referred to as the “Old Sulzer “main, with Sulzer pumps at both booster pump stations. Localised corrosion is occuring at air valve and scour tees along the pipeline. The pipeline is beyond its estimated 50 year design life-span, and would require refurbishment or replacement. This pipeline is to be permanently decommissioned in the long term as soon as the future supply from the Zambezi and Gwayi-Shangani Dam in the north is implemented. There are peri-urban consumers along the line who may have to be catered for after decommissioning of the line. Estimated population is 200 people.

Review and Preparation of Bulawayo Master Plan (2019 – 2034) Report of Study
------------------------------------------------------------------------------------------------------------------------------
240
Bulk Pipeline from Nyamandlovu Boreholes to Rochester and Hyde Park (Magwegwe) Reservoir
11.3.10 Nyamandlovu boreholes pump to the Rochester Reservoirs with several steel or AC
pumping mains. There is a bulk pumping main from Rochester Reservoir to the Cowdray Park booster pump station, and thereafter up to the Hyde Park (Magwegwe) Reservoir. Sections of the pipeline comprises 600mm diameter steel with VJ coupled joints, and is in a fair condition. The 760mm diameter AC pipe (Class 24) is also in a fair condition. The pipeline was installed around 1995 and no replacement or upgrading is required, apart from general maintenance of valves and chambers, which is work in progress.
11.4 RESERVOIR STORAGE CAPACITY AND REQUIREMENTS
11.4.1 According to studies by Bosch Stemele in 2012, the existing reservoir capacities are
adequate to meet current requirements. Additional storage capacity will need to be provided at the following sites to meet the projected future demands:
• Additional 14 Mℓ at the Criterion clear water reservoir site
• Additional 7 Mℓ at the 6J Reservoir site
• Proposed New 40 Mℓ Rangemore Reservoir
• Proposed New 28 Mℓ Northern Reservoir
11.5 WATER DEMAND
11.5.1 The estimated population according to City of Bulawayo based on the Non-Revenue
water presentation 2018, is approximately 763 670 for the municipal area while the master plan report of 2012 by Bosch Stemele, estimated one million people. The latter was based more on property counts and estimated occupancy. For purposes of water demand projections an estimate of one million people is adopted based on a 2% growth rate as shown in the table below.
Table 85: Present and Future Annual Average Daily Water Demands for growth with medium
level demand scenario
Reservoir Supply Zone Total Average Demand (2012) with 36% losses (Mℓ/day)
Total Average Demand Present (2017) with 25% Losses (Mℓ/day)
Total Average Demand Year 20 (2032) @ 2% growth with 15% losses (Mℓ/day)
6J 32.609 28.488 35.274
Criterion 39.650 32.842 40.665
Hillside 24.513 21.741 26.920
Magwegwe 28.455 22.574 27.951
RR 16.423 14.091 27.951
Tuli 14.949 11.865 14.691

Review and Preparation of Bulawayo Master Plan (2019 – 2034) Report of Study
------------------------------------------------------------------------------------------------------------------------------
241
Future Res Range more
0.000 22.013 27.257
Future Res Northern 0.000 11.228 13.903
Total 156.599 164.842 204.108
Source: Bosch Stemele, Water and Waste Water Master Plan Report, 2012
11.5.2 The figures above were determined from a measurement of the system input volume using the ultrasonic flow meters in 2011. According to Bulawayo City Council Engineering Services the water demand is 123Mℓ/day with indications of losses up to 41.6%. The indications are there has not been any dramatic increase in demand since the last master plan study of 2012.
• The City Council estimate of the number of occupied properties is 134 381 households and total number of surveyed stands being 167 503. Bosch Stemele assessment approximated it to 107 547 with a projected increase to 214 498 sites by 2032 and 321 499 by year 2052.
• For the purposes of guiding the Master plan, table 1 above, representing middle road growth and medium level demand scenario appears to be a realistic projection for future planning in terms of water demand.
11.6 SEWER RETICULATION AND TREATMENT
Bulk Sewerage Treatment
11.6.1 Bulawayo is serviced by nine (9) waste water treatment plants namely:
• Aisleby 1
• Aisleby 2
• Aisleby 3
• Cowdray park
• Luveve
• Magwegwe
• SAST
• Thorngrove
• Waterford
11.6.2 In general Bulawayo drains from South to North into the Umguza river catchment area
with the exception of the South – West corner and part of the Western side that drains
into the Khami River catchment. This has led to the development of two prime waste
water facilities namely Aisleby and SAST. The main sewer catchment areas in the city are
shown on Map 11.

Review and Preparation of Bulawayo Master Plan (2019 – 2034) Report of Study
------------------------------------------------------------------------------------------------------------------------------
242
Northern Catchment 11.6.3 The Northern Catchment consists of Aisleby Treatment Works located next to Upper
Umguza Dams. Two of the units at Aisleby are conventional trickling filter work with final effluent being discharged to Aisleby and Good hope farms where it is used for irrigation. Digested sludge is also discharged to the farms where it is ploughed into the farm land. The third unit is a biological nutrient removal plant producing effluent quantity good enough for direct discharge into the Umguza river. Aisleby treats most of the effluent generated within the CBD as well as domestic waste from the Northern and Eastern areas. Aisleby Wastewater Treatment Works
11.6.4 There are 3 separate wastewater treatment works serving the overall Aisleby catchment
area with a capacity of 30, 9 Mℓ/day. The catchment area is quite significant covering from southern, across the city to the norther boundary. The works also cover Mahatshula and Killarney which flows by gravity to Aisbley 3. The plant mechanisms are as follows:
• Aisleby 1: A biological filter (trickling filter) plant
• Aisleby 2: A biological filter (trickling filter) plant
• Aisleby 3: A biological nutrient removal activated sludge plant – 10 Mℓ/d
11.6.5 Aisleby 1 and 2 are situated on the same site. The two works are similar in layout and structure and have the following components:
• Intake Works
▪ Hand rake screens
▪ Manual grit channels
▪ Degritting structure
• Primary sedimentation tanks
• Pump station (sludge and recycle)
• Biological filters
• Humus tank
• Digesters
• Sludge Drying beds
11.6.6 Aisleby 1 & 2 WWTW condition had deteriorated due to the lack of maintenance and operations funding for several years. However the waste water works have been refurbished in recent years.

Review and Preparation of Bulawayo Master Plan (2019 – 2034) Report of Study
------------------------------------------------------------------------------------------------------------------------------
243
Southern Catchment 11.6.7 Southern Areas Treatment Works are located upstream of Khami Dam. This is a
Biological Nutrient Removal Plant whose final effluent is discharged into the Khami river. The southern areas treatment works treats domestic sewage from the western high density areas.
SAST 1 and 2 (Southern Areas Sewage Treatment)
11.6.8 There are two wastewater treatment works adjacent to each other which comprise of
SAST 1 and 2. SAST 1 was an extension of the aeration sludge plant (capacity 6, 0 Mℓ/d) which was later converted to a nutrient removal plant. SAST 2 (capacity 15, 0 Mℓ/d) is a full nutrient removal plant. The plants were completed in 2002, however they were never fully commissioned. At the same time SAST 1 was taken off line. The SAST 2 is being run as an extended aeration plant because of an in-completed digested sludge system. However the works will be complete through AFDB funding.
11.6.9 The two SAST treatment works comprise of the following components:
• Intake Works 11.6.10 The inlet works is common to both plants and comprises of:
▪ A mechanically raked bar screen with manual bypass
▪ A manual fine raked screen
▪ A flow measuring flume and flow meter
▪ Division chamber to split flows
▪ Mechanical grit removal system for both SAST 1 and 2 plants
11.6.11 SAST 2 WWTW comprises of the following: ▪ 2 Primary sedimentation tanks
▪ Primary sludge pump station
▪ Primary sludge gravity thickness
▪ Balancing tank with vertical shaft mixers
▪ 2 No Archimedean screw pumps
▪ NRB reactor with surface aeration and vertical shaft mixers.
▪ Waste activated sludge recycle pumps
▪ DAF (dissolved air flotation) unit for sludge thickening including pumps and
compressor.
▪ Thickened WA Sludge pump station
▪ Anaerobic digesters
▪ Heat exchanges and associated pumps

Review and Preparation of Bulawayo Master Plan (2019 – 2034) Report of Study
------------------------------------------------------------------------------------------------------------------------------
244
▪ 2 No secondary clarifiers
▪ WAS aerobic pond with floating aerators
▪ Sludge drying beds
11.6.12 The ponds and sludge drying beds serve both plants. The SAST 2 wastewater treatment works is in a fair condition and could be raised to serviceability level.
11.6.13 All sewage entering the SAST 1 and 2 sewage treatment works is gravitated from the
SAST catchment area, which includes Pumula in the west up to Nketa and Emganwini in the south. In future SAST 1 and 2 will also receive sewage from the proposed new developments in the Upper and Lower Rangemore areas located at the south western boundary of Bulawayo.
Magwegwe Wastewater Treatment Works
11.6.14 The Magwegwe waste water treatment works falls into an upper part of the upper part
of the Khami catchment on the western side of Bulawayo. The treatment works receive sewer inflow from Magwegwe high density residential area. The plant uses stabilization pond system. Magwegwe is a facultative pond works with effluent being used to irrigate a gumtree plantation. The design capacity of the works is approximately 4 0 Mℓ/day. The works consists of the following:
▪ Intake works (hand raked screen with 2 grit channels)
▪ Three anaerobic ponds
▪ Seven secondary ponds (flocculation and maturation)
Luveve Waste Water Treatment 11.6.15 The plant was built in the 1970s in the form of a conventional trickling filter plant
whose final effluent provides a reclaimed effluent facility for the irrigation of recreational facilities in Luveve suburb. It has a capacity of 3, 5 Mℓ/day. This plant also has a water reclaiming facility. The catchment covered is quite a small area which is significantly developed, consisting of mainly residential areas. The works comprises of the following structures:
▪ Intake Works
✓ Manual rake screen
✓ Mechanical screen
✓ Grit channels
✓ Raw sewage pump station
▪ Four primary sedimentation tanks. All raw sewage is pumped into the
primary sedimentation tanks.
▪ Two Primary Trickling Filters
Review and Preparation of Bulawayo Master Plan (2019 – 2034) Report of Study
------------------------------------------------------------------------------------------------------------------------------
245
▪ One Humus Tank
▪ Three Secondary Trickling Filters
▪ One Secondary Humus Tank/Clarifier
▪ One Digester
▪ Three steel sand filters for reclaimed water
▪ Pump stations
✓ Raw sewage
✓ Secondary treatment
✓ Sludge
✓ Reclaimed waste
▪ Twenty two Sludge Drying Beds
Thorngrove Wastewater Treatment Works 11.6.16 Thorngrove constitutes trickling filter type of works located just downstream of
Bulawayo’s major industrial waste discharges and 2km west of the City Centre. The treatment works treats both industrial and residential sewer inflows from central Bulawayo. The residential areas covered are Mpopoma, Donnington, Mzilikazi, Sizinda, whilst industrial inflow comes from oil refinery, abattoir and dairy operations. The plant is a conventional biological filtration system with over 50 years of existence. The capacity of the plant is suspected to be in range of 8 Mℓ/day, the exact quantity is unknown. At the time of the 2012 master plan studies the condition of the plant was poor however in recent years work has been done and the state has improved to a fair condition. The treatment works have a water reclamation system to distribute second class (non-potable) water which can used to irrigate parks and open spaces around central Bulawayo. Infrastructure development at the treatment works constitute of:
1. Intake Works
✓ Inlet channels for removal of grit
✓ A mechanical rake screen
✓ A mechanical grit removal detractor with pump and screw
conveyor for removal of grit
✓ Partial flume for measurement
2. Primary Sedimentation Tanks
✓ Distribution Chamber
✓ 8 No primary settlers with mechanical scrapers (15m diameter)
3. Recycle Pump station
✓ Four pumps for recycle of primary filter effluent and pumping to
secondary bio-filters
4. Biological (Trickling Filters)

Review and Preparation of Bulawayo Master Plan (2019 – 2034) Report of Study
------------------------------------------------------------------------------------------------------------------------------
246
✓ Primary Filters 8 No bio-filters (42m diameter)
5. Secondary Bio-filters
✓ 2 No. bio-filters (42m diameter)
6. Humus Tanks
✓ 2 No. humus tanks from primary trickling filters and 2 No. humus
tanks from the secondary trickling filters.
7. Sludge Recycle and Discharge Pump station
✓ 2 No. sludge recycle pumps for humus tank recycle
✓ 2 No. sludge pumps used to pump sludge to the maturation hands
✓ Only 2 of the 4 pumps are working
8. Maturation Pond
9. Holding Tank and Pump station
Cowdray Park Wastewater Treatment Works 11.6.17 The treatment works which has a capacity of approximately 3,869 Mℓ/day, receives
effluent from Cowdray Park high density residential areas. The works consist of a stabilization pond system with the following components:
✓ Inlet works (hand raked screen with 2 sand/grit channels with a flume)
✓ Anaerobic ponds
✓ Secondary ponds
11.6.18 The final effluent is discharged to open fields or pumped for irrigation. Generally the Ponds are in a fair condition, though they require periodic or routine maintenance of ponds i.e. clearing of reeds etc.
Waterford Wastewater Treatment Works
11.6.19 The Waterford plant collects flows from Waterford and Douglas dale areas. It also
receives sewage from the proposed future developments, some of which are on - going in the area east of the treatment works.
11.6.20 The wastewater treatment works was recently refurbishment and upgrading. The inflow volume of sewage is not known. The design capacity was estimated at 0.15
Mℓ/day.
11.6.21 The works comprises of the following: ✓ Intake works
✓ Primary sedimentation tank
✓ 1 small and 1 larger bio-filter
✓ Humus tank

Review and Preparation of Bulawayo Master Plan (2019 – 2034) Report of Study
------------------------------------------------------------------------------------------------------------------------------
247
11.7 PRESENT AND FUTURE PROJECTIONS OF THE TREATMENT WORKS
11.7.1 The present day capacity and the future capacity requirements for each of the WWTW,
based on the medium growth and medium level average demand scenario, are summarised in the table below:
Table 86: Capacity projections for the WWTW
WWTW Projected Estimate Capacity 2017
(Mℓ/day)
Future Required Capacity Year
2022 (Mℓ/day)
Future Required Capacity Year
2027 (Mℓ/day)
Future Required Capacity Year
2032 (Mℓ/day)
Aisleby 1 & 2 32.125 33.563 35.066 36.637
Aisleby 3 9.076 10.701 12.618 14.878
Cowdray Park
3.869 4.619 5.515 6.585
Luveve 3.888 4.011 4.139 4.270
Magwegwe 3.703 4.077 4.488 4.941
Sast 21.173 24.558 28.483 33.035
Thorngrove 11.925 12.027 12.129 12.233
Waterford 0.170 0.212 0.265 0.330
Source: Bosch Stemele, Water and Waste Water Master Plan Report, 2012 11.7.2 Based on the recommendations of the scenario “middle road growth and medium level
average demand”, SAST, Thorngrove and Waterford waste water treatment plants will continue to treat sewage from their respective catchment areas.
11.7.3 Whilst additional capacity of 0.18 Mℓ/day will be required at the Waterford WWTW in
the medium to long term in order to accommodate the future demand requirements for its catchment area.
11.8 ROADS, TRAFFIC AND TRANSPORTATION
Road Network
11.8.1 There are two major regional corridor roads which pass through Bulawayo measuring a
total 29.68km namely:
• R9: South to North route from Beitbridge to Victoria falls.
• R2: West to east route from Plumtree through to Mutare.
11.8.2 The two roads have not been upgraded although R2 was rehabilitated. R9 facilitates the movement of goods from the north through Zimbabwe into South Africa.
11.8.3 Other major road links within the Study area consist of the following:

Review and Preparation of Bulawayo Master Plan (2019 – 2034) Report of Study
------------------------------------------------------------------------------------------------------------------------------
248
i) Bulawayo – Khami ii) Bulawayo – Nkayi iv) Bulawayo – Harare v) Bulawayo – Kezi 11.8.4 These roads are all tarred and carry considerable volumes of vehicular traffic. As a result
of the above road links and intersections and given the fact that the major regional roads pass through Bulawayo, the city is strategically located at the centre of the road and railway networks of the SADC region and is therefore an important interconnecting City for all forms of overland transport. Map 12 shows the road network in the city. This situation facilitates the movement of goods and people to and from virtually all parts of the country.
11.8.5 With regards to the existing road network in the existing built up areas of Bulawayo, the
is such that there is a fairly discernable hierarchy of roads in terms of local primary, secondary collector roads and access roads.
11.9 CLASSIFICATION OF NETWORK
11.9.1 City of Bulawayo, in 2016-17 carried out a road condition survey. The outputs from the
exercise included, Road Network register, Road Inventory, Road classification, Traffic count analysis, Road rehabilitation and maintenance strategy. The results of the exercise have been used as a basis for review of status quo. The City total network according to class and type is shown in the tables below.
Table 87: City of Bulawayo total network
Type Length, km
Sealed 1 509
Gravel & Sealed 75.5
Gravel 566
Earth 91.3
Blank 147
Total 2 388
Source: National Road Condition Survey 2016-2017
Table 88: Network breakdown according to category
Class Urban Arterial
Urban CBD Urban Local
Urban Collectors
Urban Distributor
TOTAL
Km 65 14 1507 211 2 2388
Source: National Road Condition Survey 2016-2017

Review and Preparation of Bulawayo Master Plan (2019 – 2034) Report of Study
------------------------------------------------------------------------------------------------------------------------------
249
State of the Network 11.9.2 The condition of the entire road network can be assessed using the riding quality of the
pavements. Using this parameter, 26.3% of the entire road network is in good state, 34.3% is in a fair state, 24.6% is poor and 14.8% is unaccounted for. See figure 26 below.
Figure 26: Riding Quality of the City of Bulawayo Road network
Source: National Road Condition Survey
Condition of Roads 11.9.3 Except for the major primary and secondary roads the road conditions in Bulawayo can
generally be described as poor. The major primary and secondary roads are in a very good road condition. They have proper road signs, bus/taxi stops, zebra crossings and street lights which unfortunately do not work at all times. Most of the tarred (access) roads in the residential areas are in a very bad condition, the tarmac is virtually scrapped. Some of these roads need a complete rehabilitation. On the other hand the gravel roads in most of the new residential areas are generally in a bad condition. They are always in a state of disrepair, largely due to lack of regular maintenance as a result of lack of equipment and lack of funds. The situation is made worse by the absence of storm water drainage, resulting in pot holes and ponding. The gravel roads become terribly bad during the rainy season.

Review and Preparation of Bulawayo Master Plan (2019 – 2034) Report of Study
------------------------------------------------------------------------------------------------------------------------------
250
Sealed Roads 11.9.4 Sealed roads cover approximately 1585km and comprise of Gravel & Sealed and Sealed.
For the entire City network only 6.3% of all sealed roads are in a very good state, 12.5% of all sealed roads are in a good state, 12.7% are in a Fair state, 21.5% are in a poor state and 47% are in a very poor state. Most of the poor roads are access roads.
Table 88: Condition of sealed roads in the city
CONDITION PERCENTAGE
Very Good state 6.3%
Good state 12.5%
Fair state 12.7%
Poor state 21.5%
Very Poor state 47%
Source: Road Condition Survey Report 2016 - 2017
The table below gives the condition of the sealed roads in % based on the current state of road features and defects assessed during the 2016-2017 Road Condition Survey.
Table 89: Condition of sealed roads Road Defects Classification None (Good %) Moderate (Fair
%) Extensive (Poor %) Unaccounted %
Potholes 14.7 18.4 20.7 46.2
Cracks 34 7.2 23.1 35.7
Ravelling 22.5 14.7 32.2 30.6
Rutting 16.1 1.1 2.5 80.3
Road Markings 2.8 3.1 22.1 71.9
Surface patches 11.5 24.9 8.6 45
Source: Road Condition Survey Report 2016 - 2017 11.9.5 For the CBD area 41% roads are in a poor state and the rest, i.e. 59% are in a very poor
state. The major collector roads that have been resealed in recent years include; Masiyephambili drive, Nketa drive, Cecil drive, Luveve road, Khami road, Old Khami road, Plumtree road and Harare road. Whilst this has improved inter-suburban traffic flow a lot, there is still need to improve road condition to main institutional and commercial centres.
a) Gravel roads
11.9.6 The total length of Gravel roads is 456.86km. Only 6.3% of the gravel roads are in a very good to fair condition. Most of the gravel roads in Bulawayo are in a poor to very poor state; that is about 93.7% of all gravel roads. These are mostly in the high-density

Review and Preparation of Bulawayo Master Plan (2019 – 2034) Report of Study
------------------------------------------------------------------------------------------------------------------------------
251
suburbs high density suburbs as well as low density residential areas especially residential neigbourhoods which were developed by private developers after the late 1990s. Some of the areas are inaccessible. The wearing course thickness and cross section had worn off and most of the roads need complete rehabilitation.
Table 90: Condition of Gravel roads in the city
CONDITION PERCENTAGE
Very Good state
Good state 6.3%
Fair state
Poor state
Very Poor state 93.7%
Source: Road Condition Survey Report
b) Earth Roads Table 91: Condition of earth roads in the city
CONDITION PERCENTAGE
Very Good state 5.2%
Good state 22.1%
Fair state 12.2%
Poor state 37.9%
Very Poor state 22.7%
Source: Road condition survey Report
11.9.7 The total length of earth roads is 91.3km. There is need to consider improving the conditions of these roads to gravel roads and possibly single seal. Based on cumulative maintenance statistics, the City has made considerable effort to improve the condition of these roads, with 77.283km in repairs at the end of 2017.
11.9.8 With regards to the adequacy of the road network to facilitate circulation within the
city, it is generally adequate for the present levels of demand. There are few impends of any significance to traffic flow and a good level of cross – linking. What may be needed is a complete rationalization and upgrading of some internal roads especially in the older residential areas to come up with well-defined road hierarchies. This will ensure that minimum road standards are met in order to provide proper access to all plots and also provide servitudes for line infrastructure where possible. It is necessary to ensure that adequate provision is made on the road networks to handle the anticipated future growth of traffic volumes.

Review and Preparation of Bulawayo Master Plan (2019 – 2034) Report of Study
------------------------------------------------------------------------------------------------------------------------------
252
11.10 STORMWATER DRAINAGE
11.10.1 Within the City of Bulawayo flows are made up of the various catchments that
ultimately channels the stormwater to major rivers surrounding the city. Local flows are channeled via the street collector systems, where they exist, into the main storm water drains which then discharge into the main carrier. These flows are functions of the land use in the area, the amount of development and the type of vegetation. Within the CBD, the majority of the drains are subsurface drains and open channels (trapezoidal and v drains) are employed within the city suburbs.
11.10.2 Below is the current status quo of drainage network within the city.
Table 92: Drainage Conditions in the city
Drainage Condition Poor Fair Good (Blank) Grand Total
Earth 60 2 29 91
Gravel 145 120 78 223 566
Gravel & Sealed 18 21 13 23 75
Sealed 309 432 256 513 1 510
(Blank) 7 7 4 129 147
Grand Total 539 583 351 916 2 389
Source: Road condition survey Report
11.10.3 The drainage within the Central Business Unit comprises partly of sub-surface and surface lined drains. Of these 23.3% are in Good state, 7.75 % Fair, 1.6% in poor state and the 67.4% is unaccounted for, some of the sub surface drains could not be accessed during the assessment. Attached in Appendix is an excel file of the current condition of the drains within the suburbs of the city.
Challenges 11.10.4 Despite challenges of inadequate resources Council is committed to ensuring adequacy
of the storm water drainage infrastructure. Vandalism of infrastructure is a big challenge in the City. Major challenges in drainage works maintenance include illegal dumping in streams and drains. This leads to choking and blockage of drains and culverts. Trenching on the road servitude by Telecoms industry players and illegal cultivation on stream banks is another major cause of siltation of drains as well as illegal cultivation. Scouring is also a major problem for the unlined drains especially within the Higher Density suburbs. Within the new developments blocking of the drains by rubble from the construction of the houses is a problem.

Review and Preparation of Bulawayo Master Plan (2019 – 2034) Report of Study
------------------------------------------------------------------------------------------------------------------------------
253
Maintenance Strategy 11.10.5 The council is undertaking stormwater drainage maintenance programs and the
maintenance of storm water drains involves different activities that include canals, streams and drain cleaning, unblocking of silted culverts, lining of trapezoidal drains, construction of culverts and cutting or slashing of grass. The works are done in house and through community groups selected from each ward. The expenditure was at $350 732 against a total budget of $633 740 for the year 2017. By the end of the year 2017 a total of 134.278km of drainage was cleared by both the council and the community groups within city suburbs and the CBD.
Road signage
11.10.6 Road signs in Zimbabwe have previously been aligned to Vienna Convention on road signs and signals concerning the use of shape and colour to indicate function. Recently function. Recently, the Government of Zimbabwe agreed to harmonize traffic signs with those in other SADC countries. The SADC-RTSM became native legislation in Zimbabwe in 2016, the progress of implementation is this in the City of Bulawayo has been commendable and responsive.
11.11 ELECTRICITY/POWER SUPPLIES
11.11.1 Within cities power is distributed from 330/132kV substations to 132/33KV substations located closer to the respective nodes from which it radiates into the hinter lands through 33kV lines. The distribution system within the City consists of 88kV and 33kV distribution networks which supply a number of primary substations where voltage is stepped down to 11kV for local distribution. The 11KV network supplies indoor and outdoor pole or ground mounted substations most of which supply low voltage reticulation to individual consumers.
Bulk Supply points
11.11.2 There are two bulk supply substations at Insukamini and Marvel. These receive power from the 330kV National grid and step it down to the 88kV with some secondary transformation to 33Kv. The capacity of Insukamini is 180MVA while the Marvel substation has a capacity of 425MVA. These two bulk supply substations are interconnected via the 88kV system to provide electricity to the city.
Sub Stations
11.11.3 The Bulawayo power load is supplied through substations listed in Table 93. The table shows the capacity and loading of the various substations. The power infrastructure is

Review and Preparation of Bulawayo Master Plan (2019 – 2034) Report of Study
------------------------------------------------------------------------------------------------------------------------------
254
shown on Map 12. These substations supply electricity to clients within the Bulawayo Metropolitan Province. At the present moment the substations have the capacity to meet the requirements for the city which is increasing all at times due to new customers and new developments as well as other new loads.
Table 93: Substations serving the city, installed capacities and loading
Name of Sub Station Installed Capacity Substation Loading (MVA)
Marvel 330/88Kv 1 x 175 ˖ 2 x 60 102
Cement 88/11kV 2 x 10 9.95
Criterion 88/11kV 1 x 20 ± 1 x 15 10.19
Criterin 11/33kV 1 x 10 6.206
Donnington 88/11kV 2 x 30 17.56
Engutsheni 88/11kV 1 x 50 15.23
Belmont 88/11Kv 1 x 30 16.04
London Road 88/11Kv 2 x 15 6.8
Emganwini 88/11kV 2 x 20 15.23
Valleyfields 88/11kV 2 x 20 21.44
Pumula 88/11 kV 1 x 50 20.3
Hyde Park 88/11kV 1x 20 + 1 x 15 11.88
Mpopoma 88/11kV 1 x 20 + 1 x 10
Forrestvale 88/11kV 3 x 20 23.89
Glenville 88/11kV 1 x 15 + 1 x 10 14.51
Queens Park 88/11kV 2 x 15 13.8
Insukamini 330/88kV 2 x 175 92
Marvel 88/33kV 1 x 50 + 2 x 40 31
Khumalo 33/11kV 2 x 10 9.03
Ilanda 33/11kV 2 x 10 8.63
Matopos 33/11kV 1 x 10 8.73
Electricity House 33/11 kV 2 x 15 14.31
Fife Street 2 x 7.5 10.25
Steeldale 33/11kV 3 X 15 8.02
Source: ZESA & Job Jika & Associates
88kV System
11.11.4 The 88kV network system consists mainly of overhead lines with some underground cables. These substation are fully inter-connected via the 88kV system so that every substation has an alternative feed. Every substation has an alternative source of power supply in an effort to provide a secure syste. There is Cowdray Park substation currently under construction the capacity of which will be 40MVA; supplied by two 88/11kV

Review and Preparation of Bulawayo Master Plan (2019 – 2034) Report of Study
------------------------------------------------------------------------------------------------------------------------------
255
transformers each with 20 MVA capacity. The 88/11Kv substations supply residential, commercial and industrial loads.
33kV System
11.11.5 Other residential, commercial and industrial loads are supplied from 33/11KV substations. The 33kV network supplies the city centre, Steeldale Industrial area and the suburbs of Famona, Hillside, Khumalo, Suburbs, Ilanda and Killarney. It has supply points at Marvel Bulk Substation and at the Bulawayo Power Station. Every substation has an alternative source of power supply in an effort to provide a secure system. Construction of Aerodrome 33/11kV substation with an installed capacity of 30MVA comprised of two 15MVA transformers is nearly complete.
11Kv System
11.11.6 The 11kV distribution system is supplied from 88kV and 33kV substations. 11/0.4kV transformers is either ground or pole mounted substations supply the central business district, low density and high density residential areas including commercial and industrial areas by means of either overhead lines or underground cables. The overhead 11kV system is largely inter – connected to provide security of supply by way of alternative feeds.
11.11.7 Substations fed from the underground system are mainly indoor with transformer capacity ranging from 300kVA up to 2000kVA.
Medium and Low Voltage
11.11.8 The low voltage reticulation system consists mainly of overhead lines with some underground cable particularly in the low density residential area. In the high density residential areas substation capacity is based on 2.5kVA per consumer after diversity. The distribution network is based on the basis of 5kVA per consumer after diversity to allow for load growth resulting in the greater use of electricity as a substitute to more traditional fuels such as gas and wood.
The Thermal Power Station
11.11.9 The Thermal power station was commissioned between 1947 and 1957 as an undertaking by the City of Bulawayo. It became part of the Zimbabwe Electricity Supply Authority in 1987 after the amalgamation of all the Local Authority Electricity undertakings. As a result of the need to unbundle business units the plant has joined Zimbabwe Power Company. The thermal power plant is connected to the national grid through 11kV and 33kV systems.

Review and Preparation of Bulawayo Master Plan (2019 – 2034) Report of Study
------------------------------------------------------------------------------------------------------------------------------
256
11.11.10 The power station initially had a design capacity of 120MW which had dropped down to 30 MW before the refurbishment exercise commenced in 1997/98. The 30
megabites was not consistent, there were frequent breakdowns a refurbishment exercise gave the ageing plant a new lease of life as the station capacity has since increased to 90MW.
11.11.11 The existing supply of electricity is expected to meet the power needs of the city
during the plan period. Street Lighting
11.11.12 The city centre, primary, secondary and access roads in the middle and low density areas are provided with street lighting. To date a total of 8 823 street lights have been installed in the city - 1 251 in the CBD, 4 149 in the low density suburbs and 323 along major streets. In the high density residential areas there are no street lights but 382 tower lights which have a wider coverage. However, street lighting is not working most of the time due to vandalism. The new residential areas especially those which have been undertaken by some private developers do not have bituminised roads barely have any street lights or tower lights.
11.12 TELECOMMUNICATIONS 11.12.1 Telecommunication infrastructure in Bulawayo is the responsibility of both TelOne
and other players. As the National ICT infrastructure implementing agency for GoZ, TelOne is mandated to:
• Build a national telecommunications backbone infrastructure to provide for Zimbabwe’s internal and external communication needs.
• Build backhaul links to hook up with regional and international broadband networks to cater for the country’s broadband requirements.
• Provide ICT services to all market segments in Zimbabwe
11.12.2 Tel One is responsible for planning and design of fixed line communication telecommunication infrastructure wherever demand for such infrastructure exists. As a result its network extends from time to time to meet the city’s telecommunication needs. The company currently offers voice, internet, data-communication and Digital video on Demand services. Bulawayo is served through 13 nodes located in the Metropolitan district. The company also has a city wide optical fibre network for connecting enterprise customers in the commercial, industrial and residential districts of the city on demand

Review and Preparation of Bulawayo Master Plan (2019 – 2034) Report of Study
------------------------------------------------------------------------------------------------------------------------------
257
11.12.3 There is a backlog of demand for additional lines amounting to 1103 voice and 593 broadband lines which all are residential demand and no business backlog. This waiting list expresses the recorded demand. The backlog is mostly in the more recently developed residential areas including parts of Cowdray Park, Emganwini, Mbundane, Umvimilla etc
11.12.3 TelOne services are provided from nodes that each serve a given geographical area. There has been a steady growth in ICT services from enterprise clients and a shift in
demand from voice to internet and data services as shown in the table below. The trend has been caused by a combination of shifts in usage patterns and the macro-economic environment.
Table 94: Telephone connection 2014 - 2018
Land Use Telephone connections 2014
Telephone connections 2015
Telephone connections in 2016
Telephone connections in 2017
Telephone connections in 2018
Voice 56264 56529 46509 46086 47191
Broadband 9103 13335 13903 14981 17109
Source: Tel One 11.12.4 Telecommunication in the city has improved since the introduction of digital systems in
the mid-80s (1987). The improvements realised were largely relating to the quality of service, Value Added Services (VAS) and expanded coverage. Whilst the organisation is making efforts to improve telecommunication some of the challenges being experienced in the provision of services include:
• Vandalism of our network and damage to our infrastructure by other service providers as they deploy their own infrastructure.
• Forex challenges.
• Revenue collection challenges. Electronic mail via telephone lines
11.12.5 Technological Advancement has introduced other services e.g. electronic mail. This service has been regulated for other players such as Zol, power tel etc. However, Tel one is controlling a major stake in the provision of internet services. Mobile Telephone Network
11.12.6 Due to deregulation, the provision of telecommunication services has allowed other private service providers into the sector. There are three major mobile telephone service providers operating in Bulawayo namely Tel One’s Net One, Econet and Telecel which are privately owned.

Review and Preparation of Bulawayo Master Plan (2019 – 2034) Report of Study
------------------------------------------------------------------------------------------------------------------------------
258
11.12.7 Base stations are being used by these three cell phone companies within and outside the Municipal boundary. Each base station has a catchment radius. The stations receive transmission from the main exchange via each companies exchange in Harare. There will be need for more land in future residential and industrial developments within the Master Plan period to cater for the demand as there has been a significant increase in the demand for mobile telephone services.
11.13 TRAFFIC AND TRANSPORTATION
11.13.1 The major movement of traffic within the city is centred on all major roads such as
Plumtree road, Khami road, 12th Avenue extension, 13th Avenue extension, Luveve road,
Leopold Takawira, J.M.N. Nkomo extension, Victoria Falls road, Robert Mugabe Way,
Harare Road, Burnside Road, Cecil Avenue, Matopos road. In addition when schools are
open there is a lot of traffic on most of the roads leading to the schools. Traffic
generated within the residential neighbourhoods accounts for the majority of the traffic.
This is a major factor in determining the requirements of development of the road
transportation network.
11.13.2 It is to be expected that the most heavily used routes during peak hours are those
connecting residential, commercial, industrial and schools. As a result the concentration
of vehicular movement is leading from all directions to the city centre.
11.13.3 The traffic flows in the morning and afternoon peak hour are very similar and indicate
that they are caused by traffic movement between residence and place of work.
11.13.4 All roads show a substantial increase in traffic over the traffic accounts undertaken in
2000. This is a result of increased vehicle ownership especially asthe availability of 2nd
hand Japanese vehicles which are more affordable, and the development of new
residential areas in areas such as Emganwini, Mbundane, Pumula South and Cowdray
Park. Developments within the urban periphery in areas such as Reigate and Hopeville
also contribute to an increase in traffic flow through and within the city. As vehicular
ownership increases, the number of vehicles expected to use the road network also
increases.
Remedial Measures
11.13.5 The most intensive traffic congestion during peak hours is along sixth Avenue and
Herbert Chitepo Street, Leopold Takawira and Herbert Chitepo, Sixth Avenue Extension
and Lobengula Street, Leopold Takawira and Fort Street, 10th Avenue and Fort Street as
well as Herbert Chitepo at 11 at TM Hyper. All these places experience high pedestrian

Review and Preparation of Bulawayo Master Plan (2019 – 2034) Report of Study
------------------------------------------------------------------------------------------------------------------------------
259
and traffic (combi) conflicts which is attributed to combis picking up passengers from
undesignated points. A thorough roads analysis and traffic planning analysis identify
alternative ways to ease the present traffic congestion.
Travel Modes
11.13.6 There are numerous modes of travel in operation within Bulawayo though kombis,
private cars, pirate taxis account for most of the trips. There are high volumes of cyclists
and pedestrians from the high density residential area to the city centre and industrial
areas. In the city centre pedestrian activity accounts for a large portion of the
movement of people in the city. This means that a traffic system must also cater for this
modes of traffic. There are problems of traffic flow associated with large pedestrian
movements which has been compounded by informal sector activities being undertaken
within pavements. There is need to examine options for mitigating such problems and
this requires special attention and calls for a separate study to resolve the problem of
pedestrian traffic in the city centre.
Vehicle Ownership
11.13.7 The latest statistics of Central Vehicle Registry (CVR) indicates that there were 11 074
registered vehicles in Bulawayo as at November 2018. The registration of vehicles has
been computerized and hence the information is assumed to be accurate. The latest
figure of 11 074 relates to vehicles owned by individuals and private companies. Table
94 below gives a breakdown of the number and types of vehicles registered in Bulawayo
between 2013 1nd 2018. In addition the Government of Zimbabwe and its agencies own
several vehicles stationed in Bulawayo.
Table 95: Number of registered vehicles in Bulawayo as at November 2018
BODY TYPE 201
3 2014 2015 2016 2017 2018
4*4 0 0 0 2 0 0
Ambulance 0 0 0 6 0 5
Amphibian 0 0 0 1 0 0
Artic Horse 1 0 0 5 1 3
Bakkie 0 0 1 1 2 3
Bitumen Distributor 0 0 0 0 0 1
Boat Trailer 0 0 3 6 10 8
Bottlers 0 0 2 1 0 0

Review and Preparation of Bulawayo Master Plan (2019 – 2034) Report of Study
------------------------------------------------------------------------------------------------------------------------------
260
Bowser 0 0 0 3 0 0
Box (Stakeside/Highsides) 0 1 16 49 15 10
Box Trailer 0 0 0 29 111 76
Box Truck 0 0 4 15 3 2
Box Van 1 1 10 15 9 9
Bread Van 0 0 0 10 0 0
Breakdown 0 0 0 0 1 0
Bulk Grain 0 0 1 0 0 0
Bulk Side 0 0 0 0 0 1
Bull Maize 0 1 0 0 0 0
Bus 0 5 13 44 39 38
Caravan 0 0 3 9 3 3
Cattle/Livestock Transporter 0 0 0 0 0 1
Club Cab 0 0 0 1 0 0
Coach 1 0 0 2 0 2
Compactor 0 0 0 6 1 1
Convertible (Drop Head/Open) 0 0 1 2 1 1
Coupe 0 0 1 1 3 1
Crane 0 0 0 3 0 1
Crane Truck 0 0 0 1 0 1
Curtain Sider 0 0 2 1 1 1
Curtainsided Truck 0 1 0 7 2 0
Curtainsider 0 1 0 6 0 1
Curtainsider Trailer 1 0 0 1 1 2
Double Cab 4 12 86 275 187 245
Drop Sides 2 2 16 52 43 49
Dropside Trailer 0 0 2 1 6 20
Dump Digger 0 0 1 1 0 0
Dump Truck 0 0 0 3 0 0
E/Cab 0 0 0 0 2 0
Equiptype 1000 0 0 0 0 1 0
Estate Car 2 0 7 26 7 8
Ext Cab 0 0 0 0 1 0
Extended Cab 0 0 1 1 4 2
Extra Cab 0 0 2 9 6 7
Flat Deck 0 1 4 18 42 37
Flat Lorry 0 0 0 1 1 1
Flatbed 0 0 3 3 2 1
Flatbed Trailer 0 0 0 1 24 57
Fork Truck/Fork Lift 0 0 0 1 0 1
Fridge Truck 0 0 0 3 1 0

Review and Preparation of Bulawayo Master Plan (2019 – 2034) Report of Study
------------------------------------------------------------------------------------------------------------------------------
261
Fuel Tanker 0 0 2 0 0 0
Grader 0 0 0 3 0 0
Hardtop 0 0 0 1 0 2
Hatch Back 24 73 332 870 258 275
Hatchback 1 4 64 482 1685 2806
High Sides 0 0 0 0 0 1
Ho Crew Cab 0 0 1 0 0 1
Horse 1 2 6 28 22 24
Horse Box 0 2 7 13 9 11
Insulated Van 3 0 1 1 0 1
International 0 0 0 0 2 0
Jeep 0 0 0 1 0 1
King Cab 0 0 2 1 1 1
Kombi 0 0 2 6 3 7
Laguage Trailer 0 0 1 1 0 0
Light Trailer 0 0 0 6 1 0
Limousine 0 1 0 0 0 1
Loader 0 0 0 0 3 0
Lorry 0 0 1 3 2 3
Mechanical Horse 0 0 0 0 1 2
Mechanical Horse (5th Wheel) 0 1 15 26 39 38
Microbus/Minibus 11 24 175 365 301 430
Miller 0 0 1 1 0 1
Mini Bus 4 8 6 86 465 439
Mobile Crane 0 0 0 0 0 1
Motor Bike 1 0 0 15 17 51
Motor Cycle 1 8 34 58 40 16
Mpv 0 0 0 1 0 0
Omnibus 1 3 8 28 29 30
Open Deck 0 0 1 0 0 1
Panel Van 7 24 181 342 86 93
Panel Van (Van) 1 1 22 52 20 23
Panelvan 0 0 0 5 1 0
Pick-Up 2 1 8 138 37 33
Pick Up 0 3 3 46 275 305
Pickup(Vannet/Delivery/Tricar) 5 16 253 448 347 370
Platform Trailer 0 0 0 2 0 1
Ranger 0 0 1 0 1 0
Reefer 0 0 0 0 1 4
Refrigerated Trailer 0 0 0 0 1 1
Refrigerated Truck 0 0 0 1 1 0

Review and Preparation of Bulawayo Master Plan (2019 – 2034) Report of Study
------------------------------------------------------------------------------------------------------------------------------
262
Refuse Collector 0 0 0 0 2 0
Rigid Truck 1 0 3 26 107 176
Road Tractor 0 0 0 3 45 101
S/Cab 0 0 0 2 0 0
Safari Car 0 0 1 0 0 0
Saloon 1 1 6 23 7 8
Satation Wagon 0 0 3 20 1 1
Scooter 0 1 0 1 0 1
Sedan 18 60 521 1341 1583 2138
Semi Trailer 0 0 0 3 0 0
Side Tipper 0 0 0 0 3 5
Single Cab 3 2 11 77 48 63
Sleeper Cab 0 0 0 1 0 0
Smart Cab 0 0 3 8 1 3
Special Purpose Veh 0 0 0 1 6 5
Sports 0 0 0 2 0 1
Station Wagon 0 5 5 126 864 1195
Stationwagon (Ranchwagon) 28 60 395 952 278 314
Steel 0 0 1 0 0 0
Super Cab 0 0 0 3 0 3
Suv 0 1 14 107 155 269
Tanker 0 0 1 4 6 5
Tanker - Water Telescopic 0 0 0 2 0 1
Tanker Trailer 0 0 0 0 5 6
Tipper 1 1 10 14 16 19
Tractor 0 0 10 11 8 5
Tractor Horse 7 2 3 4 3 4
Trailed Tanker 0 0 0 1 0 0
Trailer 6 7 51 159 77 90
Truck 5 23 142 430 455 501
Twin Cab 0 0 0 7 4 0
Twin Cab 0 0 0 5 146 235
Utility 0 0 1 0 0 0
Van 2 2 14 75 228 352
Wagon 0 1 1 4 0 1
Waterbowser 0 0 0 1 0 0
Wrecker 0 0 0 1 0 0
- 0 0 0 0 1 0
Total 146 362 2 502 7 066 8 227 11 074
Source: Central Vehicle Registry

Review and Preparation of Bulawayo Master Plan (2019 – 2034) Report of Study
------------------------------------------------------------------------------------------------------------------------------
263
11.13.8 The historical traffic data in the table above shows that the traffic growth within the period 2013-2018 was marginal for heavy vehicles. On the other hand there is an increase in light motor vehicles. Observations in recent years have seen increase in light vehicle traffic in all the busy links. An average percentage increase in total volume of 6% is expected by year 2034. A traffic growth rate of 2.65% up to 2020, as indicated in the 2000-2015 Master Plan seems to have been a fair projection, for planning purposes, providing a realistic demand scenario. A strategy for sustaining the carrying capacity of the City’s road networks premised on a growth rate of up to 3- 4%, in line with other urban growth rates in the country. The city is accommodating this growth in traffic at the moment and in view of the wide road and ring road design we hope that the city will cope even in future.
11.14 PUBLIC TRANSPORT
11.14.1 There are four main types of public transport in use in the city. There are buses, mini
bus, combis, metered taxi and pirate taxis. Buses are mainly used by schools to ferry
pupils, government to carry civil servants and companies to carry their employees. The
mini buses, combis and pirate taxis constitute the most prominent forms of public
transport linking the city centre and the residential area. Metered taxis are mainly for
transportation mainly within the city and residential areas though they can operate
within a 40km radius while mini buses and combis mainly provide inter - city passenger
service. The metered taxis have designated parking areas and these are relatively
expensive for the majority of the population and mainly service the casual visitor or
tourist sector, although these are also used by employers to ferry workers at night.
11.14.2 Long distance buses generally terminate at the main bus at Renkini, Entumbane and Nkulumane where travelers going further are transferred to the combi system which then acts as a next order distributor. The main bus stations are the busiest public transport terminuses (or rank) in Bulawayo. The bus terminuses facilitate the transfer of passengers between bus, mini bus, tax in the city. As for combi ranks in the city include the main Basch street (Egodini) mini bus/combi tax rank which is due for development as well as other mini bus terminuses, TM Hyper, 3rd avenue & Lobengula, 3rd Avenue & J.M.N. Nkomo, City Hall, Samuel Parirenyatwa and Harare road. There are some designated drop and pick up points for combis and taxis along the major roads in the city.
11.14.3 The most extensive public transport system is being provided by the mini bus or combi
operators. This can be seen by the large number of travellers using the mode of
transport. The average occupancy of each combi during peak hours is eighteen (18)
which is high. In an effort to improve the public transport system Bulawayo City Council
facilitated the establishment of three (3) companies namely Tshova Mubaiwa Transport
Co-operative (TMC), Bulawayo United Passenger Transport Association (BUPTA),

Review and Preparation of Bulawayo Master Plan (2019 – 2034) Report of Study
------------------------------------------------------------------------------------------------------------------------------
264
Bulawayo City Transit (BCT) company. These three companies dominate the public
transport industry but there are other kombi operators who are not members of any of
these companies. However, it seems most routes are being serviced by BUPTA. The
public transport system services various routes in the city as shown on Map 13.
However, there seems to be an overlap on some routes by some of the operators
especially in Pumula, Luveve and Cowdray Park. The expectation is that in future these
companies would eventually introduce 25 seater or buses on the more popular routes
to cut down on the number of vehicles in use. This may improve traffic flows and
probably commuter safety. Some attempts at introducing larger buses in the early 2000s
have failed as they were slow, had many bus stops and the fill in time was too long to
allow all the passengers to reach their destinations in targeted time. The bus/combi stop
facility and drop off points have being formalized. However, despite the provision of
facilities in an effort to improve safety, the number of public service vehicles which are
still pulling off the road into road shoulders to drop and pick passengers is still high. This
is presenting a challenge in terms of damaging road shoulders and edges of surfaced
roads as well as compromising passenger’s safety.
11.14.4 The envisaged main public transport station (Egodini) is located between streets Lobengula to the east, Basch Street to the west, 6th avenue to the north and 8th avenue on the southern end. Development of the transport station is currently underway and it is expected to provide a consolidated form of public transport within the CBD. Currently public transporters are loading from several locations in the CBD. It is envisaged that this development will eventually bring sanity to the inner city. Some of the anticipated developments at Egodini are:
• 30 000m² intermodal transport hub which includes both covered and uncovered
sections
• 12 Regional & cross border bus and 70 minibus taxi loading and offloading
handling facility.
• Offsite minibus taxi holding facility with maximum capacity of 300 minibus taxis
• 410 visitor parking bays
• Pedestrian routes along Lobengula Street between 6th and 8th avenues
11.14.5 Projections are that the envisaged transport hub should service the town adequately up to the end of the period under review.
11.15 SPEED LIMITS
11.15.1 The speed limits in force in the city currently falls into two categories. There is a general
speed limit of 60km/hour on all the roads within the city except for some major roads
within the city where the speed limit is 80km/hr. The presence of traffic lights and

Review and Preparation of Bulawayo Master Plan (2019 – 2034) Report of Study
------------------------------------------------------------------------------------------------------------------------------
265
junctions within the city’s road network plays a role in reducing average traffic speed.
The traffic light changeovers along the major roads is also playing a large role in terms of
reducing speed as the signals are synchronized. However, the problem of speed in the
city is directly related to law enforcement. Speed zoning which is a traffic management
measure and the timing of traffic light changes is important in managing the overall flow
of traffic in the city. Traffic tends to move naturally in pulses and an ideal traffic
management system should foresee these pulses to facilitate the timing of traffic
changeovers to pass through them. These predictions can only be effective if the speed
limits on the roads are being adhered to. Speed enforcement has much to do with the
smooth flow of traffic as well as ensuring public safety.
Car Parking
11.15.2 There is adequate car parking space within the city except within certain areas within
the city especially at church sites, government offices and some commercial areas.
However, there are few areas where this is a major concern. Parking problem are often
experienced at Mhlahlandlela Government Complex as well as within the core Central
Business District. However, the parking problems are at certain times.
11.15.3 Office and commercial developments such as the Tower Block, Fidelity Life Centre and
at the Bulawayo Centre have provided underground parking but this does not constitute
general public parking.
Railway Crossings
11.15.4 There are several road/rail level crossings in the city – on Mpopoma Drive, 13th Avenue
Extension, Basch street, Khami road, Emganwini off Plumtree road, Cowdray park road.
Most of the road/rail crossings are along 13th Avenue extension. The road/rail crossings
mainly exist in the industrial areas were designed as railway spurs to serve some of the
major industrial areas while others constitute crossing from destinations such as
Plumtree and Victoria Falls. The road/rail crossing do not constitute a major traffic
management problem at the moment as there are no accidents which have been
recorded from the rail crossings.
Accident Statistics
11.15.5 A total number of 231 have been recorded along the major roads in the city centre and along roads linking the city with other major settlements since January 2018 by the Zimbabwe Republic Police traffic division. The following table shows roads in the city
with a high number of accidents

Review and Preparation of Bulawayo Master Plan (2019 – 2034) Report of Study
------------------------------------------------------------------------------------------------------------------------------
266
Table 96: Accident statistics along major roads, January – August 2018
Name of Road
Type of Accident
Total Veh -
veh
Veh –
ped
Veh -
cyclist
Veh -
obj
Veh –
animal
Veh –
M/bike
Sole
party
Ped -
cyclist
J. M. N. Nkomo 25 21 02 00 02 00 00 00 00
R.G Mugabe 24 18 04 02 00 00 00 00 00
Fife Street 22 16 02 00 04 00 00 00 00
Fort Street 25 22 01 00 01 00 01 00 00
L. Takawira 13 11 01 00 01 00 00 00 00
H. Chitepo 20 15 03 01 01 00 00 00 00
Masiyephambili
Drive
15 13 01 00 00 00 00 01 00
Luveve Road 11 08 02 00 00 00 00 01 00
J. Moyo 20 16 02 00 01 00 00 01 00
Nketa Drive 11 10 00 00 01 00 00 00 00
Harare Road 08 06 01 00 01 00 00 00 00
Gwanda Road 09 07 01 00 01 00 00 00 00
Plumtree Road 15 12 00 02 00 00 00 01 00
Khami Road 13 08 00 00 03 01 00 01 00
Source: Zimbabwe Republic Police traffic division
11.15.6 From the above table it is interesting to note that roads in the city centre which have
high incidences of accidents are traffic light controlled. Five roads which are
experiencing a high number of accidents are in the city centre and these are J.M.N
Nkomo street, Fort street, R.G. Mugabe way, Fife street and Herbert Chitepo. The major
reasons which may be attributed to high incidences of accidents high volumes of traffic
on those roads, failure to obey road signs and rules, following too close and speeding.
The intersections which are experiencing a high number of accidents are shown in the
table below:

Review and Preparation of Bulawayo Master Plan (2019 – 2034) Report of Study
------------------------------------------------------------------------------------------------------------------------------
267
Table 97: Accident statistics along major intersections
Name of
Intersection
TYPE OF ACCIDENT
TOTAL Veh -
veh
Veh -
ped
Veh -
cyclist
Veh -
object
Veh -
animal
Veh –
M/bike
Sole
party
Ped -
cyclist
J. Nkomo/10th Ave 09 08 01 00 00 00 00 00 00
H. Chitepo/10th Ave 13 09 04 00 00 00 00 00 00
H. Chitepo/6th Ave 07 06 01 00 00 00 00 00 00
Fort Street/11th Ave 08 08 00 00 00 00 00 00 00
Fort Street/13th Ave 06 06 00 00 00 00 00 00 00
Khami Road/Nketa
Drive
07 06 00 00 00 00 00 01 00
J. Moyo/12th Ave 08 06 01 00 01 00 00 00 00
Nketa Drive/Hyde
Park
08 07 00 00 01 00 00 00 00
Khami Road/
Masiyephambili
09 08 01 00 00 00 00 00 00
Fort St/10th Ave 08 08 00 00 00 00 00 00 00
Source: Zimbabwe Republic Police Road Traffic Division
11.15.7 As shown in the table above a total of 83 road accidents occurred along major
intersections. Most of the accidents involve vehicle to vehicle and they constitute 88%
of all the road accidents in the city centre. Other accidents along intersection involve
vehicle – pedestrian, vehicle – object and sole party. The major causes of accidents
along major roads and intersection in the city from January 2016 to 31August 2018 are
shown in the table below:

Review and Preparation of Bulawayo Master Plan (2019 – 2034) Report of Study
------------------------------------------------------------------------------------------------------------------------------
268
Table 98: Major causes of road accidents in the City
Cause of Accident 2016 2017 2018 (January – August)
Speeding 549 501 421
Vehicle Defects 117 60 54
Animals 125 141 115
Following too Close 913 854 476
Fatigue 20 28 10
Overtaking Error 378 448 434
Negligent pedestrian 55 44 30
Poor Road Condition 08 00 00
Failure to give way to “controlled” 371 357 267
Failure to Give way to
“uncontrolled”
275 324 206
Turning in front of oncoming traffic 313 315 299
Reversing error 818 870 479
Parking error 177 267 133
Negligent Cyclist 34 25 14
Inattention or misjudgement 304 472 696
Others 1 073 796 426
Total 5 217 5 502 4 060
Source: Zimbabwe Republic Police, Traffic Division
11.15.8 The major causes of accidents in the city is following too close followed by reversing
error while the least causes of road accidents is a result of a negligent cyclist. There are
more accidents on Fridays and Saturdays compared to other workdays. During the week
most accidents occur during peak hours between 7 – 8am as well as afternoon hours
between 4 to 6 pm.

Review and Preparation of Bulawayo Master Plan (2019 – 2034) Report of Study
------------------------------------------------------------------------------------------------------------------------------
269
11.15.9 Black spots in the city are Nguboyenj flyover along Luveve road, 12 – 15km peg along
the Bulawayo – Harare road, Nketa drive/Hyde park road, Masiyephambili road/B.
Burombo road, Masiyephambili road/Luveve road, Khami road/Masiyephambili road
and Bulawayo – Khamiroad.
Enforcement of Traffic Rules and Regulations
11.15.10 Traffic law in the city is governed by national legislation, namely the Road Traffic Act and is enforced by the Zimbabwe Republic Police. BCC has no powers in the
enforcement of road traffic laws and regulations except the introduction of by laws. However, these by – laws may not override or conflict with any written law in force in Zimbabwe. However, in an effort to enforce traffic rules and regulations in the city has introduced parking and clamping by laws.
Railway Traffic
11.15.11 The National Railways of Zimbabwe (NRZ) is a railway parastatal of Zimbabwe which
was established during the time of British colonial rule and was called Rhodesia Railways
until 1980. Segments of the railway line were conceived as part of the Cairo railway line.
In the colonial era, Rhodesia Railways was the state railway operator in both Southern
Rhodesia (now Zimbabwe) and Northern Rhodesia (now Zambia).
11.15.12 The route length of the railway system in Zimbabwe has a track length of 4 313 km and route distance of 2 565 kilometres of which 817km are branch lines. Some 313 km of the route length, from Dabuka to Harare, is electrified. This line has been vandalized and is no longer in operation. In addition, there is 385 km of track operated by the Bulawayo Beitbridge Railway concession. Of the total route length, 110 kilometres constitute the main line between Ramatlabama in the south and Bulawayo and 439 kilometres to the west in Victoria Falls, 331 km to the east in Beitbridge and 439 km to the north in Harare. The branch lines are serving some major establishments especially mining companies such as Hwange Colliery Company Limited, Makomo resources,
Natural Stone, Quarrying enterprises, Ilford services and Dorowa mines. NRZ owns a fleet of 47 diesel locomotives constituting of (22 mainline and 25 shunt), 7 350 wagons (3 340 operational and 3 810 parked) and 309 passenger coaches (206 parked).
. 11.15.13 Today NRZ forms a crucial link in the railway systems of the Southern Africa region. It
is worth noting that NRZ’s geographic position makes it strategic on the North South Corridor, thus it is the transit corridor for traffics to/from the landlocked countries in the north (Zambia, DRC etc.) to /from the ports in South Africa and Mozambique.

Review and Preparation of Bulawayo Master Plan (2019 – 2034) Report of Study
------------------------------------------------------------------------------------------------------------------------------
270
Along with Bulawayo Beitbridge Railway (BBR)4 the National Railways of Zimbabwe provides a connection to South Africa Namibia and Swaziland and an unbroken rail line to the Democratic Republic of Congo (Zaire), Angola, Mozambique, Tanzania and Malawi. Bulawayo lies on the main railway line and it serves as a rail trans-shipment
centre. Local traffic being serviced by the NRZ consists of coal, chrome ore, coke, ferro chrome, cement, sugar cane and granite. Transit traffic to neighbouring countries mainly consists of diesel, wheat, containers, maize, 270ertilizer, salt and coal.
11.15.14 The Bulawayo railway station is still busy though the level of activity has significantly
dropped when compared to the pre-multi-currency era. Among the factors militating against performance is road competition from a macro level and poor coaches condition coupled with poor time keeping by the trains. NRZ is still servicing Harare and Victoria Falls routes with passenger trains as shown below:
Table 99: National Railways of Zimbabwe Passenger service provision from Bulawayo
Route Frequency Time of Travel
Harare-Bulawayo Bulawayo-Harare
Sunday, Tuesday, Friday Monday, Thursday, Saturday
Night Night
Bulawayo-Victoria Falls Victoria Falls-Bulawayo
Daily except Monday, Wednesday Daily except Tuesday, Thursday
Night Night
Source: National Railways of Zimbabwe
11.15.15 There is potential of additional freight and passenger service to meet the increasing demands. The parastatal has a great role to play in the city’s and the country’s drive toward industrialization and modernization. Statistics in Table 5 reveal the freight tonnage handled by NRZ between 2013 and 2017. On the overall there is a decline in the freight tonnage handled by NRZ which may be attributed to the inherent competition between rail and road haulage. The planning of both modes of transport has to be coordinated and synchronized to avoid unnecessary and wasteful competition. There is also a tremendous decline in the volume of passenger traffic handled by the NRZ within the same period. This is easily explained by the introduction of better services and luxury coaches.
4 BBR was formed in 1997 it is in partnership with NRZ in managing a concession which includes a Built-Operate-Transfer agreement to construct 150km of new track and upgrade 172km existing track. NRZ and BBR are not competitors but are complementary players in rail business handling.

Review and Preparation of Bulawayo Master Plan (2019 – 2034) Report of Study
------------------------------------------------------------------------------------------------------------------------------
271
Table 100: Freight tonnage handled between 2013 & 2017
Freight (000t) 2013 2014 2015 2016 2017
Local 2734 2756 2428 1971 2401
Import 709 736 640 831 538
Export 0 0 0 0 0
Transit 326 361 257 125 208
Total 3769 3853 3325 2927 3147
Passenger(000) 1037 499 602 210 334
Source: NRZ & Consultants
11.15.16 Some of the challenges being experienced by the NRZ in an effort to achieve its objectives include; lack of recapitalization funding resulting in slow recovery by industry, fewer reliable resources (locomotives and wagons), low business availability owing to depressed economy, high track length under speed restriction (cautions) affecting turnaround of resources, vandalized and obsolete infrastructure and stiff competition from the road.
11.15.17 The NRZ is currently conducting feasibility studies for commercial developments on
the vacant pockets of the Railway Reserve. There are also plans to expand Mpopoma marshalling yard and upgrading Bulawayo station. There are also recapitilisation negotiations to the tune of US$400 million between NRZ and Transnet/DIDG consortium are ongoing. The objective of the project is therefore to enable NRZ to restore operational capacity and capability to profitably support economic activity through public transportation of goods and passengers.
Joshua Mqhabuko International Airport
11.15.18 The airport is located about 21km from the city centre. The airport was established in
1958 but was upgraded in 2001 to replace the old Bulawayo international airport on the
same premises. The airport was officially opened in 2013 when all the works were
complete. The site for the airport is about 700 hectares and is all fenced. The
improvements which were being undertaken during the upgrading process were
undertaken within the same premises. The upgrading process increased the building
three times and improved through put from 500 000 to 1.5 million passengers per
annum. During the upgrading process the major works which were undertaken were
mainly civils such as increasing the terminal building, improving power reticulation by
developing 8 sub stations, construction of a 2km drainage, access roads, increasing car
parking facilities from 250 to 500 and the construction of sewer ponds. There were no
improvements to the runway at the time of upgrading the airport.

Review and Preparation of Bulawayo Master Plan (2019 – 2034) Report of Study
------------------------------------------------------------------------------------------------------------------------------
272
11.15.19 The airport has two (2) runways. The main runway is 2 588m x 45m and can
accommodate major aircraft such as the B 767 200 series which has the capacity to
carry 250 passengers as well as a smaller runaway which is 1 347m x 30m. The smaller
runaway handles smaller aircraft with capacity to carry a maximum of about 37
passengers.
11.15.20 Whilst the airport is looking forward to being an aerocity with some commercial
developments, warehousing and hotel developments to improve activity at airport in
future it restricts the use of land within its vicinity in line with the Civil Aviation
Authority zone map. As a result any proposed developments should be done in close
liaison with the Civil Aviation Authority. 3 zones (red, yellow and green) have to be
strictly adhered to in terms of developments within the 5km radius. The red zone is
strictly related to airport related uses. The yellow zone is for temporary industrial while
the green is for controlled housing development. The development should be single
storey and stand sizes should be a minimum of 1 000m2.

Review and Preparation of Bulawayo Master Plan (2019 – 2034) Report of Study
------------------------------------------------------------------------------------------------------------------------------
273
CHAPTER 12
ENVIRONMENTAL AUDITS OF KEY PHYSICAL DEVELOPMENTS AND STATE OF THE ENVIRONMENT
12.1 AIM AND OBJECTIVES 12.1.1 This chapter presents an appraisal of the condition of Bulawayo’s environment. Prior to
the enactment of the Environmental Impact Assessment (EIA) Act 20: 27 of 2002, some of the major developments were carried out without the benefit of an EIA. This meant that possible environmental impacts of such developments were not taken into consideration and consequently no mitigation measures were put in place. The aim of conducting environmental audits of key existing developments in Bulawayo is therefore to identify impacts on the environment by such developments which were not considered or predicted at the time when the developments were undertaken. Importantly, the environmental management and protection programmes that are in place will also be evaluated during the audits.
12.1.2 The specific objectives of Environmental Audits (EA) of existing key developments within the Municipal boundary are: i) To identify the environmental components which have been affected by such
existing key developments, land use and environmental practices and other human activities
ii) To assess the environmental effects and consequences of the above; and iii) To recommend impact mitigation measures at the development proposal stage
of the project 12.2 ENVIRONMENTAL SETTINGS OF KEY EXISTING DEVELOPMENTS 12.2.1 There are some key developments in Bulawayo which have been identified as being set
in an environmentally sensitive and fragile area. Such developments and the activities being undertaken on them have impacts on the fragile environments on which they exist. Such developments are on the flood plains which places them at risk in the form of collapse potentials of the soils on which these structures have been built; vulnerability to erosion of foundations, flooding and consequent destruction of property. Developments in this category are mainly infill layouts e.g. in Ilanda.
12.2.2 Other activities in Bulawayo whose activities in one way or the other impact on the
environment are the power station. This has implications in terms of pollution to

Review and Preparation of Bulawayo Master Plan (2019 – 2034) Report of Study
------------------------------------------------------------------------------------------------------------------------------
274
property and people in the city centre within the immediate vicinity of the power station are affected by activities at the power station. Old Nick Mine and mining special grants/small scale mining, fuel storage tanks, the railway station and various industrial activities and commercial activities such as the district commercial centre are some of the major developments which were undertaken without the benefit of EIAs.
12.2.3 In terms of environmental settings most of the major developments mentioned in the
preceding paragraphs are industrial in nature they and were located away from residential land use zones. Other developments or activities observed to have impacts on the environment in Bulawayo include the Bus Rank, Fuel Filling Stations, Vehicle maintenance workshops and Garages, pit latrines, sewerage ponds, the landfill as well as excavations for sand and gravel. Details of the environmental practices and impacts arising from some of the activities are presented in section 13.3.
12.3 ENVIRONMENTAL ELEMENTS IMPACTED BY EXISTNG KEY DEVELOPMENTS AND
ENVIRONMENTAL PRACTICES 12.3.1 The environmental elements which may be negatively impacted by the various activities
of some key developments and other environmental practices and ambient air quality, water, soil, the general landscape and general public environmental health. Impacts on these environmental elements emanate from the practices in the areas of waste management (solid and liquid), construction activities; sand and gravel excavations, handling of used engine oils and fuel products. The main recipients of the negative impacts from these environmental practices in the various sectors are the natural and physical environment as well as the river systems. Humans are also at large risk due largely to pollution of the surface and underground water, the atmosphere as well as the types and manner of waste disposal in the city including the landfill.
Water Pollution 12.3.2 The 2012 population census report indicated that 96 percent of the enumerated
population had access to safe water, some households still obtain their water from community stand pipes or natural sources which are more vulnerable to contamination. Bulawayo’s water supply are exposed to pollution from cyanide tainted water due to mining activities in the catchment area.
12.3.3 The city does not seem to have a serious environmental problem in terms of water
treatment and sewerage there seems to be overloading on the existing treatment works. This is due to that most of the wastewater facilities are currently operating at design capacity, the low flow levels being experienced tend to encourage an increase in acids resulting in sewer collapse. In some areas constant sewer blockages and spill off has been experienced posing an environmental health hazard.

Review and Preparation of Bulawayo Master Plan (2019 – 2034) Report of Study
------------------------------------------------------------------------------------------------------------------------------
275
12.3.4 Sewerage disposal methods are a major source of water pollution (both surface and underground water) in the city. This has to do with the large number of households who now use pit latrines. Due to the high permeability of the soils, decomposed compound with high nitrate contents may percolate through to the underground water resources, thus resulting in water contamination.
Sewage Pollution
12.3.5 Furthermore, effluent from the sewerage treatment works discharge directly into the
rivers while some industrial establishments have often being found to be discharging some waste into the river system. The river systems which bifurcate the built-up environment and city periphery and which eventually form part of a larger river system are recipient to sewage discharge from burst sewers in the built environment to discharge of effluent from the sewage ponds. The municipality faces challenges in maintaining sewerage infrastructure largely due to the dire economic challenges facing the country. Cases in point are the discharge of raw sewage into Matshemhlophe river, Umguza river, Khami river, etc. Public health is at risk through domestic use of polluted water and also through fishing and swimming in polluted waters. The recreational use of Umguza River is adversely impacted and severely hampered by the high levels of pollution which have not been attended to for many years.
Industrial Pollution
12.3.6 Another source of surface and groundwater pollution is the city are the filling stations
and motor repair garages/workshops. There are high possibilities of petrol, diesel and engine oil leakages and spillages at these establishments finding its way into the river system through incidental run – offs. Some industrial establishments also discharge waste into the streams and rivers that empty drain into Umguza river contributing to pollution and disruption of the ecology.
12.3.7 This audit notes that although the industrial sector in the city is currently depressed, and as earlier indicated there are still industrial pollutants in the city. The study is mindful of the fact that during the prime of Bulawayo’s status as the industrial hub in the country, industrial effluent was rampant and with adverse environmental impacts. The conduits of such pollution still exist and preventative measures to minimize pollution are not adequate such that at the time the city regains its industrial hub status, the environment would be more vulnerable to harm.
Review and Preparation of Bulawayo Master Plan (2019 – 2034) Report of Study
------------------------------------------------------------------------------------------------------------------------------
276
Solid Waste
12.3.8 The Ngozi informal settlement around the Richmond landfill site is a concern in particular in so far as the provisions of various legislation are taken into account. The settlement contravenes provisions of various pieces of legislation, viz, Town and Country Planning ACT, Public Health Act, Environmental Management Act not leaving out municipal by laws. There could be some underground seepage and the situation is compounded by the non – provision of a monitoring borehole. In addition, the juxtaposition of a settlement (be it informal or planned) is a travesty of the principles of public and environmental healthcare.
12.3.9 Despite efforts by the Environmental Health Department of Council to institute some order in terms of refuse disposal, illegal dumping sites still exist in the city especially on the road reserves and open spaces. This poses a threat to good environmental care. The efficiency of the municipal waste collection system has deteriorated over the past decade and this has adversely affected the environment as waste generators end up disposing of waste at undesignated sites.
12.3.10 The environmental audit also revealed that another source of water pollution is human
excrement in the bush. The 2012 population and housing census revealed that 1.3% of the population use the bush to relieve themselves. This may have increased as there have been more residential developments since then and which are not fully serviced. These are washed into the river system during heavy rains. New Unserviced neighbourhoods
12.3.11 The city has seen the sprouting of new neighbourhoods some of which do not have
service infrastructure and are dependent either on on-site sanitation systems or the use “bush toilets”. Some of these settlements are not provided with refuse removal services and there is an incidence of littering and pollution of the environment.
Air Pollution
12.3.12 Air quality as an environmental element is impacted by land use and the various environmental practices within the Municipal area and is concentrated within the heavy industrial areas and also within the high density areas. Sources of air pollution emanate from:
i) The industrial zones of Bulawayo are not specifically polluted but there are some
activities being undertaken which cause excessive pollution. The cement factory along Harare road is a major polluter as noted from its impacts on the vegetation and surrounding built environment. Brick yards in the same location at Willsgrove also create excessive dust and smoke pollution.

Review and Preparation of Bulawayo Master Plan (2019 – 2034) Report of Study
------------------------------------------------------------------------------------------------------------------------------
277
ii) Coal dust and smoke emanating from the power station into the atmosphere. Though impact may appear to be localized to the area itis affecting people and property in the city centre. However, the areas within the immediate vicinity are the most affected by coal dusts and smoke emissions. Decaying solid waste dumped at random within open spaces and road reserves as well as burning of solid waste in pits dug within residential properties.
iii) Foul odours emanating from ventilated improved pit latrines. iv) Smoke emissions from various industrial establishments. v) Emissions from vehicles especially haulage trucks. This is in the form of carbon
monoxide pollution which is which are harmful to the body when inhailed over a long period of time continuously. The release of smoke emissions into the atmosphere over a long period of time leads to a depletion of the ozone layer.
vi) Burning of wood fuel for cooking purposes in the high density areas emits smoke and particles into the atmosphere.
vii) Dust is also an important cause of reduced air quality in the city. The main periods of dust pollution are during the dry season especially in the months of July to October when windy weather is more prevalent.
12.3.13 In general, Bulawayo does not experience dangerous and health affecting levels
of air pollution. This is partly due to the advantage of the city’s topography and climate. Being located in a high veld without entrapping hills and mountains, polluted air can quickly escape to the upper levels of the atmosphere. High levels of sunshine also burn off the polluted air. This is noticeable especially during the winter months when some temperature inversion exists for the first few hours of the morning leading to a pall of smoke filed air hanging over the western suburbs and central area.
Noise Pollution 12.3.13 Noise pollution in Bulawayo is generally not too high except for certain areas
along the main roads and railway lines. In addition, land use incompatibilities or improper land uses has been the main cause of an increased number of residential areas being susceptible to high levels of noise pollution.
Landscape and Soil Degradation
12.3.14 The general landscape is being defaced as a result of mining activities, dumping
of construction rubble and the excavation of burrow pits for sand and other construction aggregates. Some of the burrow pits have been turned into refuse dumping areas. The burrow pits apart from posing a danger to human lives degrade the physical environment, making it aesthetically unpleasant. In addition, burrow pits make such areas sterile in the sense that they become

Review and Preparation of Bulawayo Master Plan (2019 – 2034) Report of Study
------------------------------------------------------------------------------------------------------------------------------
278
difficult and expensive to develop on considering the costs of reclamation and rehabilitation.
12.3.15 The are some considerable areas of land within the Municipal boundaries and
some parts of the peri – urban which are experiencing challenges of continuous cutting down of trees for fuelwood and cultivation without regard for preventing soil erosion consequently leading to the siltation of rivers.
12.3.16 Tree cutting is a major problem in all parts of the study area. There is a major
demand for wood fuel that most mature trees in the areas abutting the high density suburbs have been removed. This also has an impact upon the fauna, the larger numbers of which if not trapped and snared have little to no habitat within which to survive.
12.3.17 Illegal dumping is a growing problem in and around the city. For example certain
areas in the city especially where there is a large number of undeveloped stands or land not yet planned in the low density areas, Mahatshula, Hyde Park and Cowdray are becoming eyesores as households and contractors dump solid waste and assorted rubbish (pampers) and construction rubble. This in turn leads to a health hazard. The social problem of person litter disposal by the public is rooted in a lack of civic pride and responsibility and needs to be addressed at an early age by parents and through schools.
12.4 ENVIRONMENTAL STATUS AND CONCLUSION
12.4.1 From the presentations in the preceding sections, the environmental status of
Bulawayo can be summarised as follows:
i) There are a number of areas within the city which currently show signs and characteristics of high environmental degradation. These include: un-reclaimed quarry sites, polluted watercourses such as the Matshemhlophe spruit, polluted dams such as Khami; land fill sites; squatter settlement sites and areas in close proximity to the cement industrial area.
The location of major physical developments on environmentally sensitive areas (rivers and streams) and activities on such developments, impact negatively on the fragile environments and also place such developments at risk;
ii) Poor handling of petroleum products also impact on the above environmental
elements, particularly surface water, underground water and soil; iii) Poor sanitation practices and waste management (solid and liquid) impact on
various environmental elements such as surface and underground water, soils and air;
Review and Preparation of Bulawayo Master Plan (2019 – 2034) Report of Study
------------------------------------------------------------------------------------------------------------------------------
279
iv) Human activities are affecting the general landscape especially mining for gravel and sand aggregates;
v) The unsustainable utilization of natural resources for example the rampant felling of trees for use as fuel wood has resulted in serious damages to woodland composition and structure as exotic tree now constitute the dominant tree species in the city. The cutting down of trees has some environmental implications in the form of soil erosion.
12.4.2 Finally this chapter has focused on assessing the impacts of key existing
developments and environmental practices on the environment. During this process some environment elements which are impacted upon and how they are impacted has been outlined. These would constitute a basis of mitigation measures to be presented at the development proposals stage.