Human Splicing Finder: an online bioinformatics tool to predict splicing signals
Upload
independentCategory
view
0download
0
Molecular Cell, Vol. 16, 929–941, December 22, 2004, Copyright ©2004 by Cell Press
Revealing Global Regulatory Featuresof Mammalian Alternative SplicingUsing a Quantitative Microarray Platform
only contains a few known examples of AS, the potentialcomplexity of mRNA isoforms generated by AS in mam-mals and other metazoan organisms is vast. It is there-fore widely assumed that AS is a key step in the genera-tion of proteomic diversity in more complex organisms
Qun Pan,1,5 Ofer Shai,2,5 Christine Misquitta,1
Wen Zhang,1,3 Arneet L. Saltzman,1,3
Naveed Mohammad,1 Tomas Babak,1,3 Henry Siu,1,3
Timothy R. Hughes,1,3,4 Quaid D. Morris,1,2
Brendan J. Frey,2 and Benjamin J. Blencowe1,3,4,*(Black, 2000; Graveley, 2001; Modrek and Lee, 2002).1Banting and Best Department of Medical Research
Alternative splicing is known to play numerous critical2 Department of Electrical and Computer Engineeringroles in regulatory pathways in metazoans, including3 Department of Molecular and Medical Geneticsthose controlling cell growth, cell death, differentiation4 Program in Proteomics and Bioinformaticsand development, and its misregulation has been impli-C.H. Best Institutecated in many life-threatening human diseases (Blen-University of Torontocowe, 2000; Caceres and Kornblihtt, 2002; Cartegni et112 College Streetal., 2002; Faustino and Cooper, 2003; Smith and Valcar-Toronto, Ontario M5G 1L6cel, 2000). A major goal of the postgenomic era is toCanadaidentify physiologically- and disease-relevant AS eventsto determine where and when these occur, what theirspecific roles are, and how they are regulated. In con-Summarytrast to the considerable advances made in recent yearsin the understanding of global regulatory properties ofWe describe the application of a microarray platform,transcription, very little is understood as to how ASwhich combines information from exon body andevents are globally regulated and coordinated undersplice-junction probes, to perform a quantitative anal-different conditions. These fundamental questions re-ysis of tissue-specific alternative splicing (AS) forquire advances in the development of high-throughputthousands of exons in mammalian cells. Through thistechnologies for monitoring alternative splicing. To date,system, we have analyzed global features of AS inmost efforts in this direction have focused on computa-major mouse tissues. The results provide numeroustional analyses of AS using complementary DNA (cDNA)inferences for the functions of tissue-specific AS, in-and expressed sequence tag (EST) data, and efforts tosights into how the evolutionary history of exons canharness microarray technology for analyzing AS haveimpact on their inclusion levels, and also informationbegun.on how global regulatory properties of AS define tissue
Computational approaches with cDNA and EST datatype. Like global transcription profiles, global AS pro-have allowed inferences to be made regarding the loca-files reflect tissue identity. Interestingly, we find thattion, frequency, and conservation of AS events in differ-transcription and AS act independently on differentent organisms (Brett et al., 2002; Modrek and Lee, 2003;sets of genes in order to define tissue-specific expres-Nurtdinov et al., 2003; Pan et al., 2005; Sorek et al., 2004;sion profiles. These results demonstrate the utility ofThanaraj et al., 2003; Xu et al., 2002). A limitation ofour quantitative microarray platform and data for re-these approaches is that AS can be detected only invealing important global regulatory features of AS.transcripts for which there is sufficient sequence cover-age. Moreover, the available sequences often are repre-Introductionsented for only a limited number of cell and tissue types,which, in the case of human and mouse ESTs, are fre-
The splicing of precursor mRNA (pre-mRNA) to mRNAquently derived from tumor or cell-line sources. Conse-
is a critical step in the expression of the majority ofquently, it is not possible to obtain substantial informa-
mammalian genes. Four small nuclear ribonucleoprotein tion on cell or tissue-type specific inclusion levels ofparticles (snRNPs) and numerous non-snRNP factors alternative exons by using sequence-based computa-associate with pre-mRNA to form a spliceosome, which tional approaches.catalyzes the excision of intervening intron sequences Recently, a number of groups have begun to exploreand joining of the exon sequences (Burge et al., 1999; the use of different experimental approaches for theGraveley, 2000; Kramer, 1996; Will and Luhrmann, 1997). high-throughput detection and monitoring of RNA pro-A typical human and mouse gene contains eight to ten cessing events (Lee and Roy, 2004). Spotted-oligonucle-exons, which can be joined in different arrangements otide microarrays employing probes designed to detectby alternative splicing (AS) (Black, 2003; Smith and Val- unprocessed and processed RNA have been used tocarcel, 2000). Recent computational studies have esti- monitor pre-mRNA splicing in yeast (Clark et al., 2002)mated that one- to two-thirds of human and mouse and the processing of noncoding RNAs in yeast andgenes contain at least one alternative exon (Brett et al., mammals (Peng et al., 2003; Babak et al., 2004). A fiber2002; Croft et al., 2000; Kan et al., 2001; Lander et al., optic-based array method (Yeakley et al., 2002), a poly-2001; Mironov et al., 1999; Modrek and Lee, 2003; Oka- merase colony assay (Zhu et al., 2003), and more con-zaki et al., 2002). In contrast to budding yeast, which ventional microarray-based approaches utilizing spot-
ted cDNA fragments or oligonucleotides (Hu et al., 2001;Johnson et al., 2003; Wang et al., 2003) have been used*Correspondence: [email protected]
5 These authors contributed equally to this work. for monitoring AS in mammalian cells. The most exten-

Molecular Cell930
sive use of the latter approach was the application of represented by 2647 distinct genes, with 413 of thegenes containing two or more AS events. In addition,“exon-junction” microarrays for the discovery of exon54 of the AS events represented on the microarray areskipping events in human tissues and cell lines (Johnsonduplicates and were monitored by sets of probes that inet al., 2003). These authors used custom microarrayssome cases are complementary to different sequencescontaining oligonucleotide probes complementary towithin the same exons. These served as reproducibilitymapped exon-exon junction sequences in RefSeq genescontrols (see below). The 2647 AS genes representedfor the main purpose of discovering new AS events inon the microarray are associated with 1118 distinct Genehuman transcripts. Despite the progress describedOntology Biological Process (GO-BP) categories amongabove, a system has not yet been described that permitsa total set of 2362 GO-BP categories assigned to 10,361the large-scale quantitative profiling of alternative splic-Mouse Gene Informatics (MGI) markers (refer to Experi-ing in mammalian cell and tissue sources. This is primar-mental Procedures; see below). This indicates that theily due to limitations stemming from the design of exist-AS genes represented on the microarray are associateding microarrays and the lack of suitable algorithms forwith a diverse range of biological functions in mamma-data analysis.lian cells.In this paper, we describe a microarray platform that
permits the simultaneous quantification of the levels ofQuantitative Microarray Profiling of Alternativethousands of alternative exons in mammalian cell andSplicing in Mouse Tissuestissues sources. We have applied this system to theIn order to assess the performance of our microarrayanalysis of the regulation of 3126 sequence-verified ASsystem and to reveal global properties of alternativeevents in diverse mouse tissues. The resulting data havesplicing in mammalian tissues, we hybridized random-generated hundreds of new inferences for functionalprimed Cy3/Cy5-labeled cDNA prepared from poly-A�roles of tissue-specific AS, insights into how the evolu-mRNA isolated from the following ten adult mouse tis-tionary origins of alternative exons relate to their inclu-sues: brain, heart, intestine, kidney, liver, lung, muscle,sion levels in normal tissues, and information on globalsalivary, spleen, and testis. The poly-A� RNA was iso-features of AS that underlie tissue-type specificity. Thislated from tissue samples pooled from several animalsstudy therefore demonstrates the utility of a quantitative(CD1 strain) in order to collect sufficient quantities andmicroarray platform for generating fundamental new in-to reduce detection of possible animal-to-animal vari-sights into the global regulation of alternative splicingability. Fluor-reversals were performed for each hybrid-in mammals.ization to control for signal reproducibility and labelincorporation biases. A multistep data-processing pro-Resultscedure was employed to normalize probe signals be-tween the separately hybridized arrays and to removeA Custom Microarray for Quantitative Profilingspatial-bias artifacts (refer to Experimental Procedures).of AS in Mammalian Cells
Because each microarray probe has unique hybridiza-In order to perform large-scale quantitative analyses oftion characteristics and the probe signals can dependfunctionally diverse AS events in mammalian tissues, weon various parameters including transcript abundance,
developed a custom microarray to represent sequence-tissue source, and noise, a direct analysis of the normal-
validated AS events mined from mouse cDNA and ESTized probe signals (i.e., taking ratios) was not sufficient
sequence databases (refer to Experimental Proce- for producing accurate measurements of alternativedures). To minimize representation of possible splicing splicing levels (data not shown). We therefore developederrors or relatively low-abundance transcripts, we se- a new data analysis tool, referred to as the generativelected “cassette-type” AS events with the highest num- model for the alternative splicing array platform (Gen-bers of supporting cDNA and EST sequences from dif- ASAP), to automatically generate the percent alternativelyferent cell and tissue sources. To enhance the sensitivity spliced exon exclusion (%ASex) values from the micro-of detection and quantification of inclusion/exclusion array data. This new tool, which employs machine learn-levels of alternative exons, each AS event was measured ing and a Bayesian network, takes into account probeby using six different oligonucleotide probes: one body noise, outlier processes, abundance of transcript, andprobe for each exon sequence, designated as “C1, A unanticipated correlations between probe values. In ad-and C2” probes (C, constitutive; A, alternative), and one dition to outputting %ASex values for each AS event,junction probe for each of the three splice-junction se- GenASAP outputs a number indicating the confidencequences generated by AS, designated as “C1-A, A-C2 level of the %ASex value. These values were used toand C1-C2” probes (Figure 1A). In addition, a control rank the 31,260 %ASex values (from profiling the tenprobe specific to each intron sequence (located be- mouse tissues) in order from highest (1) to lowesttween C1 and A) was included to permit detection of (31,260) confidence. In the presentation of the resultsunspliced pre-mRNA and/or contaminating genomic below, GenASAP %ASex values across the ten tissuesDNA in the hybridizations. are assigned a tissue-specific rank (AS tissue rank; from
From an initial starting set of 4892 AS events in our 1 to 31,260) and also a single cumulative rank (AS rank;database, 3126 AS events were selected for monitoring from 1 to 3126). The AS rank thus represents the rankon a single ink-jet printed microarray, manufactured by for the same AS event across the ten tissues. AdditionalAgilent Technologies (Figure 1B). The vast majority of information on the GenASAP algorithm is given in thethe AS events correspond to cassette-type alternative Experimental Procedures, and a detailed description ofexons, and additional events may correspond to mutu- its derivation is described in a Technical Report (avail-
able at http://www.psi.utoronto.ca/�ofer/AS-supp.pdf).ally exclusive alternative exons. The 3126 AS events are
Global Regulation of Alternative Splicing931
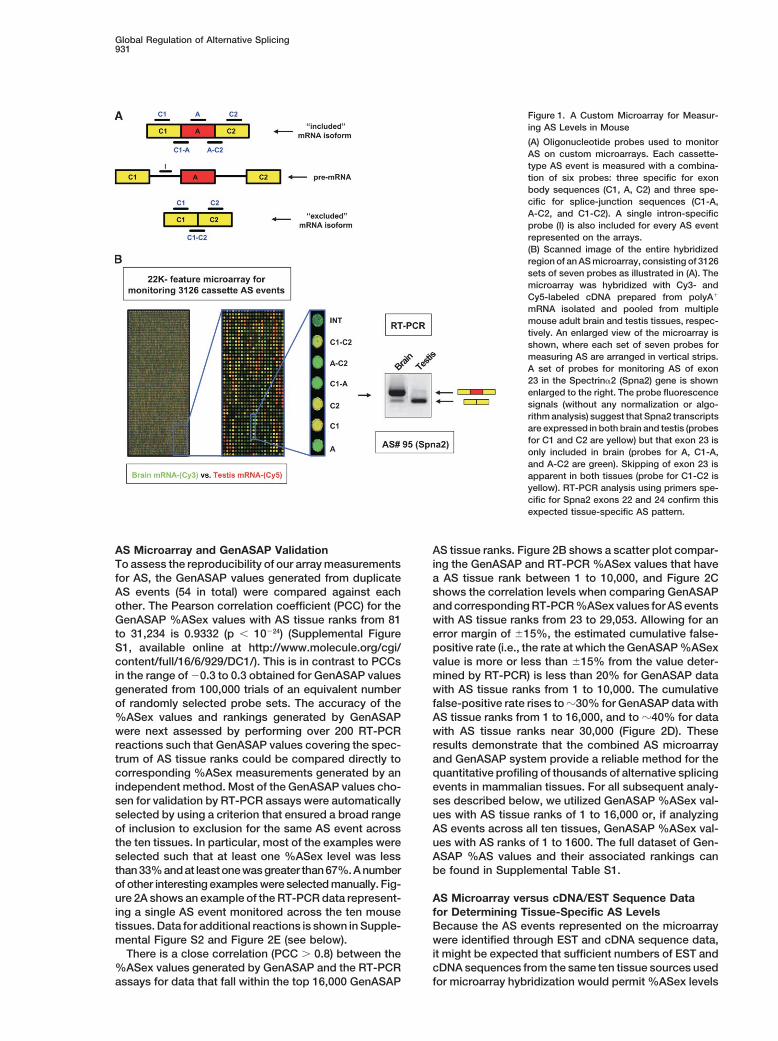
Figure 1. A Custom Microarray for Measur-ing AS Levels in Mouse
(A) Oligonucleotide probes used to monitorAS on custom microarrays. Each cassette-type AS event is measured with a combina-tion of six probes: three specific for exonbody sequences (C1, A, C2) and three spe-cific for splice-junction sequences (C1-A,A-C2, and C1-C2). A single intron-specificprobe (I) is also included for every AS eventrepresented on the arrays.(B) Scanned image of the entire hybridizedregion of an AS microarray, consisting of 3126sets of seven probes as illustrated in (A). Themicroarray was hybridized with Cy3- andCy5-labeled cDNA prepared from polyA�
mRNA isolated and pooled from multiplemouse adult brain and testis tissues, respec-tively. An enlarged view of the microarray isshown, where each set of seven probes formeasuring AS are arranged in vertical strips.A set of probes for monitoring AS of exon23 in the Spectrin�2 (Spna2) gene is shownenlarged to the right. The probe fluorescencesignals (without any normalization or algo-rithm analysis) suggest that Spna2 transcriptsare expressed in both brain and testis (probesfor C1 and C2 are yellow) but that exon 23 isonly included in brain (probes for A, C1-A,and A-C2 are green). Skipping of exon 23 isapparent in both tissues (probe for C1-C2 isyellow). RT-PCR analysis using primers spe-cific for Spna2 exons 22 and 24 confirm thisexpected tissue-specific AS pattern.
AS Microarray and GenASAP Validation AS tissue ranks. Figure 2B shows a scatter plot compar-ing the GenASAP and RT-PCR %ASex values that haveTo assess the reproducibility of our array measurements
for AS, the GenASAP values generated from duplicate a AS tissue rank between 1 to 10,000, and Figure 2Cshows the correlation levels when comparing GenASAPAS events (54 in total) were compared against each
other. The Pearson correlation coefficient (PCC) for the and corresponding RT-PCR %ASex values for AS eventswith AS tissue ranks from 23 to 29,053. Allowing for anGenASAP %ASex values with AS tissue ranks from 81
to 31,234 is 0.9332 (p � 10�24) (Supplemental Figure error margin of �15%, the estimated cumulative false-positive rate (i.e., the rate at which the GenASAP %ASexS1, available online at http://www.molecule.org/cgi/
content/full/16/6/929/DC1/). This is in contrast to PCCs value is more or less than �15% from the value deter-mined by RT-PCR) is less than 20% for GenASAP datain the range of �0.3 to 0.3 obtained for GenASAP values
generated from 100,000 trials of an equivalent number with AS tissue ranks from 1 to 10,000. The cumulativefalse-positive rate rises to �30% for GenASAP data withof randomly selected probe sets. The accuracy of the
%ASex values and rankings generated by GenASAP AS tissue ranks from 1 to 16,000, and to �40% for datawith AS tissue ranks near 30,000 (Figure 2D). Thesewere next assessed by performing over 200 RT-PCR
reactions such that GenASAP values covering the spec- results demonstrate that the combined AS microarrayand GenASAP system provide a reliable method for thetrum of AS tissue ranks could be compared directly to
corresponding %ASex measurements generated by an quantitative profiling of thousands of alternative splicingevents in mammalian tissues. For all subsequent analy-independent method. Most of the GenASAP values cho-
sen for validation by RT-PCR assays were automatically ses described below, we utilized GenASAP %ASex val-ues with AS tissue ranks of 1 to 16,000 or, if analyzingselected by using a criterion that ensured a broad range
of inclusion to exclusion for the same AS event across AS events across all ten tissues, GenASAP %ASex val-ues with AS ranks of 1 to 1600. The full dataset of Gen-the ten tissues. In particular, most of the examples were
selected such that at least one %ASex level was less ASAP %AS values and their associated rankings canbe found in Supplemental Table S1.than 33% and at least one was greater than 67%. A number
of other interesting examples were selected manually. Fig-ure 2A shows an example of the RT-PCR data represent- AS Microarray versus cDNA/EST Sequence Data
for Determining Tissue-Specific AS Levelsing a single AS event monitored across the ten mousetissues. Data for additional reactions is shown in Supple- Because the AS events represented on the microarray
were identified through EST and cDNA sequence data,mental Figure S2 and Figure 2E (see below).There is a close correlation (PCC � 0.8) between the it might be expected that sufficient numbers of EST and
cDNA sequences from the same ten tissue sources used%ASex values generated by GenASAP and the RT-PCRassays for data that fall within the top 16,000 GenASAP for microarray hybridization would permit %ASex levels
Molecular Cell932
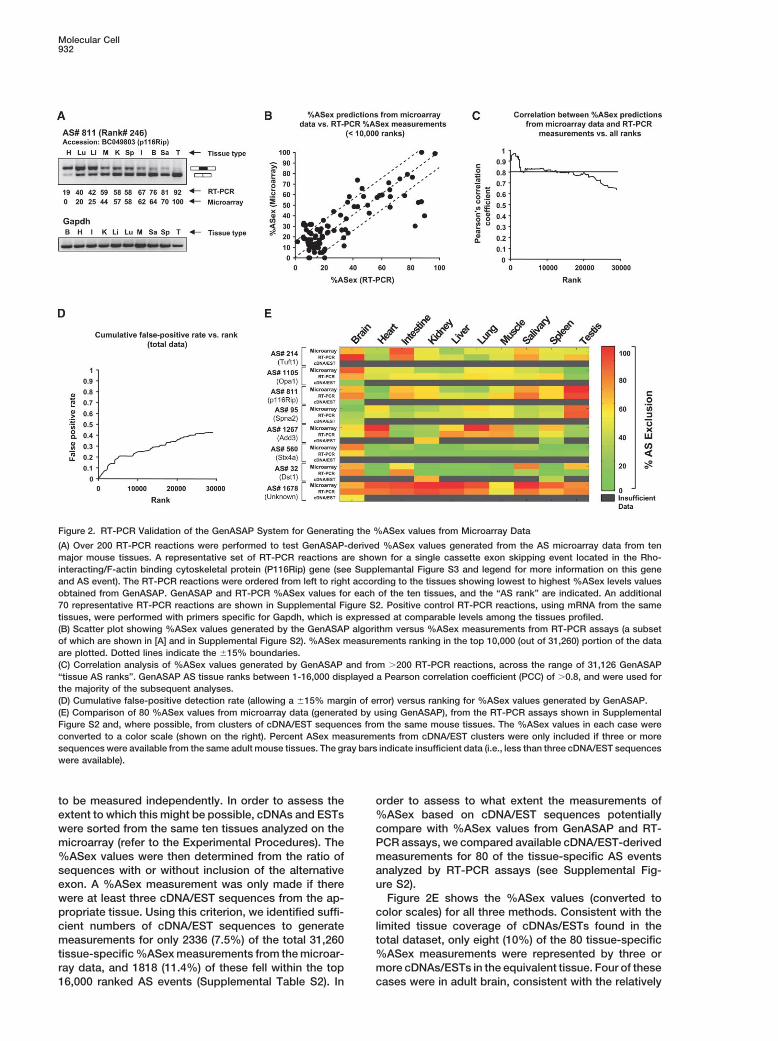
Figure 2. RT-PCR Validation of the GenASAP System for Generating the %ASex values from Microarray Data
(A) Over 200 RT-PCR reactions were performed to test GenASAP-derived %ASex values generated from the AS microarray data from tenmajor mouse tissues. A representative set of RT-PCR reactions are shown for a single cassette exon skipping event located in the Rho-interacting/F-actin binding cytoskeletal protein (P116Rip) gene (see Supplemantal Figure S3 and legend for more information on this geneand AS event). The RT-PCR reactions were ordered from left to right according to the tissues showing lowest to highest %ASex levels valuesobtained from GenASAP. GenASAP and RT-PCR %ASex values for each of the ten tissues, and the “AS rank” are indicated. An additional70 representative RT-PCR reactions are shown in Supplemental Figure S2. Positive control RT-PCR reactions, using mRNA from the sametissues, were performed with primers specific for Gapdh, which is expressed at comparable levels among the tissues profiled.(B) Scatter plot showing %ASex values generated by the GenASAP algorithm versus %ASex measurements from RT-PCR assays (a subsetof which are shown in [A] and in Supplemental Figure S2). %ASex measurements ranking in the top 10,000 (out of 31,260) portion of the dataare plotted. Dotted lines indicate the �15% boundaries.(C) Correlation analysis of %ASex values generated by GenASAP and from �200 RT-PCR reactions, across the range of 31,126 GenASAP“tissue AS ranks”. GenASAP AS tissue ranks between 1-16,000 displayed a Pearson correlation coefficient (PCC) of �0.8, and were used forthe majority of the subsequent analyses.(D) Cumulative false-positive detection rate (allowing a �15% margin of error) versus ranking for %ASex values generated by GenASAP.(E) Comparison of 80 %ASex values from microarray data (generated by using GenASAP), from the RT-PCR assays shown in SupplementalFigure S2 and, where possible, from clusters of cDNA/EST sequences from the same mouse tissues. The %ASex values in each case wereconverted to a color scale (shown on the right). Percent ASex measurements from cDNA/EST clusters were only included if three or moresequences were available from the same adult mouse tissues. The gray bars indicate insufficient data (i.e., less than three cDNA/EST sequenceswere available).
to be measured independently. In order to assess the order to assess to what extent the measurements of%ASex based on cDNA/EST sequences potentiallyextent to which this might be possible, cDNAs and ESTs
were sorted from the same ten tissues analyzed on the compare with %ASex values from GenASAP and RT-PCR assays, we compared available cDNA/EST-derivedmicroarray (refer to the Experimental Procedures). The
%ASex values were then determined from the ratio of measurements for 80 of the tissue-specific AS eventsanalyzed by RT-PCR assays (see Supplemental Fig-sequences with or without inclusion of the alternative
exon. A %ASex measurement was only made if there ure S2).Figure 2E shows the %ASex values (converted towere at least three cDNA/EST sequences from the ap-
propriate tissue. Using this criterion, we identified suffi- color scales) for all three methods. Consistent with thelimited tissue coverage of cDNAs/ESTs found in thecient numbers of cDNA/EST sequences to generate
measurements for only 2336 (7.5%) of the total 31,260 total dataset, only eight (10%) of the 80 tissue-specific%ASex measurements were represented by three ortissue-specific %ASex measurements from the microar-
ray data, and 1818 (11.4%) of these fell within the top more cDNAs/ESTs in the equivalent tissue. Four of thesecases were in adult brain, consistent with the relatively16,000 ranked AS events (Supplemental Table S2). In

Global Regulation of Alternative Splicing933
Figure 3. Evolutionary Features of Exons Impacting on Global AS Levels in Mouse Tissues and Implications for Protein Structure and Function
(A) Alternative exons represented on the microarray were classified as: conserved AS (detected in mouse and human transcript sequences),genome-specific AS (detected at the transcript and genomic level in mouse but not human), or mouse-specific AS of conserved exons events(a mouse AS event is detected as a constitutive splicing event in human), based on a scoring scheme comparing relative cDNA/EST coverageof the ortholog exons between mouse and human (refer to main text and Experimental Procedures for more information). High-confidencecases have a �100% probability of being correctly identified as species-specific AS of conserved exons events based on the scoring system,as validated by RT-PCR reactions analyzing these events in human and mouse (data not shown; Pan et al., 2005).(B) The percentage of the total AS events monitored on the microarray, which, based on the GenASAP %ASex data, display inclusion levelswithin the ranges indicated.(C) The percentage of alternative exons at different inclusion levels that have the potential to alter (i.e., upon skipping modify, disrupt, orcreate) conserved protein domains.(D) The percentage of the total AS events monitored on the microarray that correspond to each of the different classes of AS exon shown in (A).(E) The percentage of alternative exons at different inclusion levels which correspond to the types of alternative exons shown in (A).
high number of cDNAs/ESTs from this tissue source. sues. We also determined the extent to which AS ofthese exons in different tissues results in alterations toHowever, with the exception of the cDNA/EST measure-
ments for AS#32 and AS#95 in spleen and brain, respec- conserved protein domain coding sequences. In thisanalysis, we separated AS events into three classes: (1)tively, which agree fairly well with microarray and RT-
PCR data, the other six %ASex levels measured using genome-specific AS events (i.e., the alternative exon isdetected in genome and cDNA/EST sequences in mousecDNAs/ESTs did not correspond closely to either the
GenASAP or the RT-PCR %ASex values, which do corre- but not in human), (2) conserved AS events (i.e., thesame AS event is detected in cDNA/EST sequences inlate well with each other. Based on these observations,
it is apparent that the vast majority of our microarray both human and mouse), and (3) mouse-specific AS ofconserved exons events (i.e., cDNA/EST sequence datameasurements for tissue-specific %ASex levels cannot
be derived independently from the analysis of cDNA and indicates that a conserved exon undergoes AS in mouseand constitutive splicing in human) (see Figure 3A). WeEST sequences. Moreover, the fact that the AS events
represented on our microarray represent diverse cellular identified high-confidence cases in the final categoryusing a scoring system based on relative cDNA/ESTfunctions (as determined by GO-BP labels; refer to Ex-
perimental Procedures) indicates that our method for coverage of human and mouse ortholog exons (Pan etal., 2005; refer to the Experimental Procedures). In thisselection of AS events for microarray profiling generally
is not biased toward the detection of AS events in spe- parallel study, 100% RT-PCR-verification was observedfor the high-confidence cases identified using the scor-cific tissues or in specific gene functional categories.
These features, together with accuracy of the GenASAP ing system.The majority (53.6%) of the cassette AS exons moni-data, permit the global regulation of AS to be investi-
gated. tored using the AS microarray are highly (�67%) in-cluded across the ten mouse tissues, whereas fewer(36.6%) are included at intermediate (33%–67%) levelsEvolutionary Features of Alternative Exons Influence
Their Inclusion Levels in Adult Tissues and even fewer (9.8%) are included at low (�33%) levels(Figure 3B). Similar results were observed in each indi-Using the microarray platform described above, we de-
termined how the origin of cassette alternative exons vidual tissue (data not shown). Thus, at steady state,the majority of cassette AS exons do not undergo pro-impacts on their average inclusion levels in mouse tis-

Molecular Cell934
Figure 4. Independent Roles for AS and Transcription in the Generation of Tissue-Specific Gene Expression Profiles
(A) The level of similarity between AS and transcription profiles for every pairwise combination of the ten tissues analyzed in this study werecompared. AS profiles were obtained from GenASAP values for each tissue (top 1600 AS ranks), and transcription profiles were measuredusing the average values from the C1 and C2 probes for the same set of genes (see Figure 1A). Each tissue is assigned a color and shape,as indicated, and each point with a different combination of colored shapes represents the two tissues being compared. The resulting scatterplot shows the level of similarity between the AS profiles on the x axis and the level of similarity between the transcription profiles on the y
Global Regulation of Alternative Splicing935
nounced skipping in major mouse tissues. Surprisingly class, it is possible that this class of AS event plays asignificant role in defining mouse-specific character-however, there is a parallel increase between the steady-
state inclusion levels of alternative exons and the fre- istics.quency at which they alter (i.e., modify, delete, or create)conserved structural and functional domains in proteins Alternative Splicing and Transcription Primarily
Regulate Independent Sets of Genes to Generate(Figure 3C; see discussion below).We observe significant differences in the frequency at Tissue Specificity
We find that AS profiles in mouse tissues, like transcrip-which the different classes of alternative exon describedabove are included at high, intermediate, and low levels tion profiles, reflect tissue type. Previous global analy-
ses of human and mouse mRNA abundance levels using(Figures 3D and 3E). The majority (�70%) of alternativeexons included at low steady-state levels are repre- microarrays have revealed that more closely related tis-
sues (i.e., sharing common physiologies) in general havesented by “genome-specific AS events,” whereas fewer(�24%) of these AS exons are represented by “con- more closely correlated transcription profiles than less
related tissues (Miki et al., 2001; Su et al., 2004; Zhangserved AS events,” and even fewer (3.2%) are repre-sented by “mouse-specific AS of conserved exons et al., 2004). This is also apparent in our data, where
transcription profiles (measured using the C1 and C2events.” Alternative exons included at intermediate,steady-state levels across tissues are represented to probes; refer to Experimental Procedures) for the top
1600 ranking GenASAP genes are correlated to a greatersimilar extents by these three classes of AS events. Incontrast, �70% of highly included exons are repre- extent for pairs of tissues with more closely related
physiologies (i.e., kidney � liver and heart � skeletalsented by AS events that involve conserved exons, themajority of which correspond to mouse-specific AS of muscle) than less related tissues. To directly compare
how overall AS and transcription profiles compare be-conserved exons events, of which at least 20% of thetotal are in the high-confidence category (Figure 3E). tween tissues, we coplotted the similarity levels be-
tween tissue %ASex profiles (from GenASAP data) andThese results confirm experimentally a conclusionbased on the computational analyses of cDNA/EST data the similarity levels between transcription profiles for
every pairwise combination of the tissues analyzed withfrom mixed normal and tumor/cell line sources (Modrekand Lee, 2003), that genome-specific AS exons are gen- the AS microarray. Figure 4A shows the resulting pair-
wise comparison plot, where every tissue combinationerally weakly included, and further demonstrate that thisproperty applies in normal adult tissues. Our results is color coded as indicated. Notably, it is apparent that
pairs of tissues with more closely correlated transcrip-extend the observations in this previous study by dem-onstrating experimentally that there are significant dif- tion profiles also have more closely related AS profiles
(seen as the overall grouping of points along the diago-ferences in the inclusion levels of conserved exons de-pending on whether they correspond to conserved AS nal line in the plot in Figure 4A). Thus, overall, in a manner
similar to transcription profiles, AS profiles reflect tis-events or mouse-specific AS events. Moreover, we ob-serve that cassette alternative exons that are highly in- sue identity.
However, an important question relating to the globalcluded at steady-state levels, which primarily corre-spond to the species-specific AS of conserved exons regulation of gene expression is whether transcription
and AS are coordinated to control specific sets of com-class, tend to target conserved protein domains morefrequently than alternative exons included at low, steady- mon genes to achieve tissue specificity, or whether
these steps in gene expression primarily act indepen-state levels. Thus, in the majority of cases, AS eventsin adult tissues would not be expected to affect the dently on separate sets of genes. To address this ques-
tion, we ordered the genes by clustering them accordingmajor fraction of transcripts and may therefore play apredominant role in the fine-tuning of structural and to their AS profiles and then compared both the AS
profiles and the transcriptional profiles using the samefunctional activities associated with conserved proteindomains. Nevertheless, because AS events that involve ordering. As shown in Figure 4B, groupings of coregu-
lated AS profiles are not preserved in transcription pro-highly included exons appear more often to target con-served domains in proteins, they may be responsible files. Because the genes used in this analysis represent
%ASex values with correlation coefficients �0.8 be-for relatively frequent modulation of tissue-specific ac-tivities associated with these domains. In addition, be- tween microarray and RT-PCR data, this result is not
due to noise but due to differences between gene-spe-cause many of the highly included alternative exonsbelong to the mouse-specific AS of conserved exons cific AS and transcription profiles. We repeated this pro-
axis, for each pair of tissues. Transcription profile similarity is measured using the Pearson correlation coefficient (PCC). AS profile similarityis measured as 1� normalized Euclidean distance, reflecting consistency of overall AS levels. Pairs of tissues that have the most similar ASand transcription profiles between pairs of tissues are located at the upper-right portion of the plot (e.g., liver � kidney and heart �
skeletal muscle).(B and C) Hierarchical agglomerative clustering, followed by optimal leaf ordering (Bar-Joseph et al., 2001), was used to cluster genes (withinthe top 1600 GenASAP AS ranks). Only the 745 genes showing a change in %ASex of greater or less than 50% between any pair of tissueswere included in the clustering analysis. In the left panel in (B), GenASAP %ASex values were clustered based on the PCC of binarized profiles(thresholded at 50%) of different AS events (rows) and tissues (columns) monitored on the microarray. Transcription levels are shown in theadjacent panel for the same genes, maintaining the same order in the vertical axis as shown in the left panel. In the left panel of (C), geneswere clustered according to PCCs of the transformed transcription profiles. The right panel shows %ASex levels for the same genes, maintainingthe same order in the vertical axis as shown in the left panel.

Molecular Cell936
Table 1. Analysis of Overlap between Genes that Define Tissue-Specific AS and Transcription Profiles
Number of Unique Genes Number of Unique Genes(and GO-BP Categories) (and GO-BP Categories) Number of Overlapping Genes
Tissue Pair Compared in AS Profile in Transcription Profile (and GO-BP Categories)
Liver � Kidney 89 (206) 89 (227) 11 (50)Heart � Muscle 82 (230) 82 (169) 18 (90)Lung � Salivary 86 (225) 86 (223) 14 (64)Testis � Spleen 87 (222) 87 (237) 13 (81)
Sets of 100 genes, from the four tissue pairs that display the most closely correlated AS and transcription profiles shown in Figure 4A, wereselected and analyzed to determine the extent of their overlap. Available GO-BP annotations for these gene sets were also analyzed todetermine the extent of their overlap. The numbers of unique and overlapping genes and GO-BPs are shown.
cedure, clustering genes according to their transcription would be expected based on the overlap between ran-domly selected sets of genes (data not shown). Thisprofiles, and found that groupings of coregulated tran-
scription profiles generally are not preserved in AS pro- observation indicates that cassette exon AS and tran-scription also primarily act independently on differentfiles (Figure 4C). In both pairs of clustergrams, tissues
are arranged in the same order along the horizontal axis, functional processes to generate tissue-specific expres-sion patterns.according to their overall profile similarities. It is evident
from comparing these clustergrams that there is very In conclusion, these results provide quantitative evi-dence that regulated transcription and AS of cassettelittle, if any, correspondence between the clustering pat-
terns obtained for AS and transcription levels. Thus, alternative exons operate primarily as independent pro-cesses on genes to establish adult tissue-specific genegenes that cluster according to correlated AS levels do
not display parallel clusters, indicating that the same expression patterns.genes are significantly coregulated at the transcriptionlevel, and the converse situation is also true. Inferring the Functions of Tissue-Specific
Alternative SplicingWe next asked to what extent genes that define tissue-specific profile similarities at the levels of AS and tran- Besides affording new insights into global aspects of
AS regulation, our microarray data also provides a usefulscription overlap. To address this question, we selectedsets of 100 genes in the data that most strongly define resource for generating experimentally testable hypoth-
eses on the functional roles of tissue-specific AS intissue-specific profiles at both the transcription and ASlevels (refer to Experimental Procedures). In this case, genes of interest. In particular, functional inferences can
be readily generated if information is available on thethe gene sets were selected from the tissue pairs thatdisplay the most closely correlated AS and transcription structure and/or function of the protein (or RNA) se-
quence overlapping the AS event monitored on the mi-profiles (which include liver � kidney, heart � skeletalmuscle, lung � salivary gland, and spleen � testis), croarray. To this end, we have provided a comprehen-
sive database of conserved protein domains that areas indicated by their clustering in the upper-right-mostquadrant of the scatter-plot in Figure 4A. The gene sets modified by tissue-specific AS, as detected in the ten
mouse tissues surveyed in this study (see Supplementalfor each tissue pair were next analyzed to determinethe extent of their overlap. As shown in Table 1, there Table S3). Representative examples of inferences gen-
erated from the data are shown in Supplemental Figureis a very similar extent of gene overlap for each pairof tissues. The overlap ranges from 11 genes between S3 (see legend for more information) and are discussed
below. We have also clustered the microarray data toliver � kidney to 18 genes between heart � skeletalmuscle, and the average overlap for the four tissue pairs identify examples of coordinated AS events that are
specific to individual tissues or pairs of related tissues.is 14 genes. This corresponds closely to the mean over-lap of 12.2 genes obtained from a hypergeometric distri- An example cluster containing brain-specific exon skip-
ping events is shown in Figure 5, and selected examplesbution, which represents the overlap obtained from in-dependent selections of genes from the same dataset. from this cluster that allow interesting functional infer-
ences are also discussed below. Thus, from profilingThis result is consistent with the clustergram analysisin Figures 4B and 4C and suggests that AS and tran- the inclusion levels of thousands of cassette-type alter-
native exons in major mouse tissues, we have been ablescription primarily operate as independent processeson different sets of genes in order to establish tissue- to discern new features of global gene regulation, as
well as to generate a database that can be mined byspecific expression profiles.By using the available GO-BP annotations associated researchers who wish to explore the structural and func-
tional consequences of tissue-specific changes in alter-with the genes in our dataset, we also asked whetherthe sets of 100 genes that most define the tissue-specific native splicing, in genes of interest.AS and transcription profiles in Figure 4A are repre-sented by functional categories that overlap more or Discussionless than would be expected based on random sam-pling. The numbers of different GO-BP labels associated In this report, we describe a custom microarray and
associated data analysis tool that permits the reliablewith the genes are similar between the tissue pairs, andthe overlap is also comparable (Table 1). The overlap quantification of thousands of alternative exon inclusion
levels in mammalian cells and tissues. By using thisof GO-BP annotations is not significantly different than
Global Regulation of Alternative Splicing937
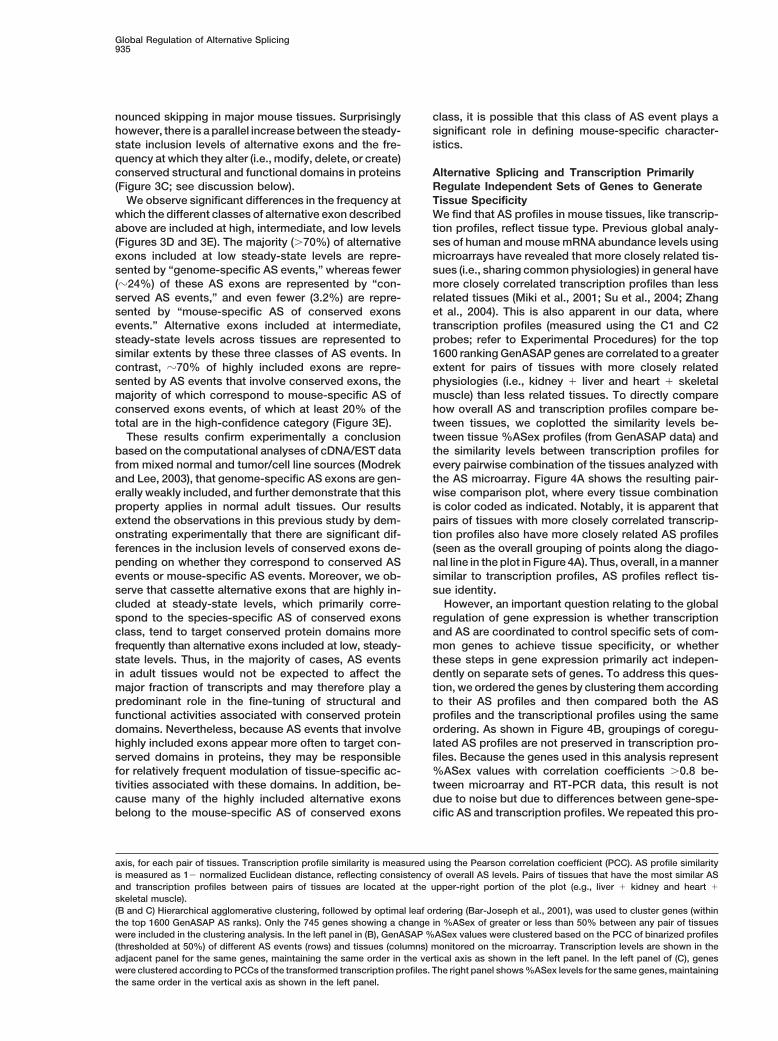
Figure 5. Identification of Brain-Specific AS Events from Microarray Data
A cluster of brain-specific exon skipping events is shown. The names and associated GO-BP annotations for representative genes within thiscluster are indicated. Tissue abbreviations are the same as those in Figure 2. Selected AS events in the brain AS cluster were confirmed byRT-PCR assays to have increased exon skipping, specifically in brain tissue (see list in Figure; Supplemental Figure S2; data not shown).Functional implications of a subset of the RT-PCR-verified brain-specific skipping events discovered in the cluster are described in theDiscussion section. %ASex levels are indicated using the same color scale as shown in Figure 4B.
microarray system, we have elucidated global regulatory tions of RefSeq genes in order to discover new ASevents in human transcripts (Johnson et al., 2003). Thisfeatures of alternative splicing (AS) and have identified
thousands of tissue-specific AS events in functionally system was capable of monitoring exon skipping as a“yes/no event”, with a false-positive detection rate ofdiverse genes. The results shed light on evolutionary
features of alternative exons that determine their inclu- �50%, and comparisons of multiple adjacent splicejunction signals between tissues were required to detectsion levels in major mammalian tissues, information on
how AS operates in conjunction with transcription to a skipping event.The microarray system described in the present study,generate overall adult tissue-specific gene expression
profiles, as well as many new inferences for the func- which also employs the ink-jet printing technology de-veloped at Rosetta Inpharmatics, differs from the previ-tional roles of tissue-specific AS. These results thus
demonstrate the application of a microarray system for ous approaches in several important ways and offersseveral advantages. First, our microarray specificallyaddressing important questions in the postgenomic era,
namely, the location, extent, and functional conse- monitors the inclusion levels of sequence-verified ASevents, such that a higher density of AS events can bequences of tissue-specific AS events.monitored simultaneously on a single array. Becausethe microarray-monitored AS events were selected fromA Microarray System for the Quantification
of AS Levels in Mammals transcripts expressed in a wide range of cell and tissuetypes and are associated with functionally diverseSeveral microarray-based methods have been reported
previously for the monitoring and discovery of RNA pro- genes, the resulting data is unlikely to be significantlybiased toward the detection of AS events in specificcessing events (see also Introduction). Fu and col-
leagues described a fiber optic microarray system for tissues or in specific functional classes of genes (e.g.,see Figure 2E). Second, the use of sets of Tm-matchedmonitoring several AS events in different human cell
lines (Yeakley et al., 2002). Ares and colleagues used probes to both exon body and splice-junction se-quences, representing both skipped and includedspotted oligonucleotide microarrays, employing exon
and junction-specific probes, to monitor globally the mRNA isoforms (see Figure 1), significantly improvesthe detection specificity and permits the quantificationconstitutive splicing of yeast introns in different mutant
backgrounds (Clark et al., 2002). Hughes and colleagues of AS levels. This approach also circumvents the re-quirement for detection of additional flanking exons/extended this approach to monitoring the processing
of yeast noncoding RNAs (Peng et al., 2003). Changes splice-junction signals to monitor exon skipping events.Third, the development of a method for data analysis,in AS, primarily in the 3 UTR regions of rat transcripts
have been retroactively inferred from data generated GenASAP, based on unsupervised learning and Bayes-ian inference, was successfully applied to modeling offrom an Affymetrix microarray designed for profiling
transcription (Hu et al., 2001). Various researchers have the microarray data and permitted the prediction of ASlevels with considerable accuracy. Based on validationdemonstrated the use of “exon tiling” arrays to measure
exon signals across human genes, although, to date, experiments using semiquantitative RT-PCR assays, ourmouse AS microarray and GenASAP system generatedthis approach has not yielded significant information on
AS (Shoemaker et al., 2001; Kapranov et al., 2002; Rinn et approximately 16,000 values for exon exclusion levelsacross ten major mouse tissues, that are expected toal., 2003). Recently, researchers at Rosetta Inpharmatics
used custom “ink-jet”-printed microarrays (Hughes et agree well with actual %ASex levels. The generation ofquantitative information on AS using our new microarrayal., 2001) containing probes targeted to exon-exon junc-

Molecular Cell938
system permitted the discovery of new global properties conserved domains in proteins are relatively frequentlytargeted by alternative cassette exons that do not un-of AS.dergo pronounced differential inclusion levels in adultmammalian tissues.Global Features of AS Levels in Mammalian Tissues
and Consequences for the Regulation of ProteinIndependent Roles for AS and TranscriptionStructure and Functionin the Generation of Tissue-SpecificA surprising feature of the majority of cassette-type ASGene Expression Profilesexons surveyed in major mouse tissues is that they areOur data reveal that overall, AS and transcription profilesin general highly (�67%) included at steady state levels.both reflect tissue identity (Figure 4). This finding is con-However, by separating the cassette alternative exonssistent with a conclusion from the study of Johnson etrepresented on the microarray according to those thatal. (2002), who found that exon skipping events inferredare conserved (in human) and those that are mousefrom junction probe microarray data were more similar inspecific, we observed significant differences in the be-physiologically-related tissues, than in distantly relatedhavior of each class. In this case, by using a recentlytissues. However, the global transcription and AS pro-devised scoring system based on comparisons of cDNAfiles from the same dataset were not directly comparedand EST coverage of ortholog exons between humanin this previous study. Because we have focused ourand mouse (see Experimental Procedures; Pan et al.,study on determining the inclusion levels of alternative2005), we have classified species-specific AS eventsexons in differentiated adult tissues, we asked to whatinto two types: (1) genome-specific AS, which corre-extent steady-state AS profiles that most define tissuespond to alternative exons that are detected at the tran-identity occur in genes that are also regulated to definescript and genomic level in mouse only, and (2), species-tissue identity at the transcription level. We find that thespecific AS of conserved exons, which correspond tooverlap between the genes that are regulated at theexons that undergo AS in mouse, but constitutive splic-levels of AS and transcription to define tissue type fol-ing in human (refer to Figure 3A).lows a hypergeometric distribution, which representsConsistent with the results of Lee and colleagues (Mo-the overlap obtained from independent selections ofdrek and Lee, 2003), based on computational analysessets of genes from the same dataset. Similar resultsof collections of mRNA and EST sequences combinedwere obtained when surveying GO-BP categories corre-from normal and tumor/cell-line derived sources, we findsponding to the gene sets that define tissue-specificthat genome-specific AS events are generally weaklytranscription and AS profiles, which also did not show(�33%) included. In contrast, we find that the species-a significant difference in overlap compared to whatspecific AS of conserved exons class (Figure 3A), whichwould be expected based on independent sampling ofwere not analyzed in the Modrek and Lee study, areGO-BP-annotated genes from the larger gene set. Thus,generally highly included and that conserved AS events,despite the fact that AS and transcription act in parallelwhich are those detected in both mouse and humanto define tissue-specific profiles (Figure 4A), regulationtranscript sequences, on average display intermediateof AS of cassette exons and regulation of transcription(33%–67%) inclusion levels across mouse tissues. Thus,appear to act on separate genes and processes to con-the microarray data generated in the present study con-tribute tissue specificity in adult mammalian organs (Fig-firm and extend previous findings, based on computa-ures 4B and 4C, and Table 1). It is therefore interestingtional analyses, relating the evolutionary history of exonsto consider that AS may provide an additional layer ofto their inclusion levels. It is important to emphasize incontrol, primarily on independent sets of genes, to refinethis case that the present study represents the use oftissue-specific expression patterns established at thean experimental system to address these questions, andlevel of transcription.that it provides global information on inclusion levels of
By using the system we have described in this report,different classes of cassette alternative exons in “normal”it will be of interest to determine to what extent transcrip-mammalian tissues.tion and AS might be coordinated in other types of reg-Although the majority of cassette AS events do notulatory situations, for example, involving transientundergo pronounced changes in inclusion levels be-changes in cell physiology in response to specific signal-tween the adult tissues that we have surveyed, we ob-ing events, and involving other types of AS events, in-serve that alternative exons that are on average highlycluding alternative 5 and 3 splice site selection. Theincluded are more likely to target structurally and func-microarray system we have described in the presenttionally conserved regions in proteins. This suggestsstudy provides the opportunity to address these andthat a predominant role for the regulation of tissue-spe-other important questions concerning the global regula-cific AS in adult tissues is to fine-tune the activitiestion of AS.of proteins associated with these domains. Moreover,
since this type of tissue-specific regulation often in-volves conserved exons that undergo mouse-specific Functional Inferences
Our microarray data has also provided a wealth of newAS, it is possible that many species-specific characteris-tics could arise from relatively subtle but frequent information on the potential roles of tissue-specific AS
in mammals, which can be used as a resource by investi-changes in AS involving conserved exons, as well asgenome-specific exons. These findings, which are sup- gators who wish to investigate experimentally the regu-
lation of genes of interest. To this end, we have createdported by a parallel computational analysis of cDNA andEST sequences (Pan et al., 2005), represent experimen- a database that can be used to retrieve information on
the tissue-specific levels of AS of exons of query genes,tal confirmation that regions in transcripts encoding
Global Regulation of Alternative Splicing939
and skipped isoform sequences against the human mRNA/EST se-and the conserved protein domain sequences that over-quences (ftp://ftp.ncbi.nih.gov/repository/UniGene/), by using an elap or are proximal to each AS event represented on thevalue cut-off of 1e-3 (refer to Supplemental for additional details).microarray. By using this information, we have alreadyAS Gene Annotation and Detection of Protein
noted numerous cases of AS events that target different Domains Altered by ASproteins associated with the cytoskeleton (e.g., see Sup- Retrieval and analysis of GO-BP categories and MGI markers asso-plemental Figure S3 and legend), and can therefore infer ciated with the AS genes profiled on the microarray is described in
the Supplemental Data. GO annotations are provided in Supplemen-from these observations that regulated AS likely per-tal Table S4. Skipped and included mRNA isoform sequences wereforms important roles in establishing differences in cy-translated into all possible reading frames by using the EMBOSStoskeletal architecture that contribute to defining tissuegetorf application (Rice et al., 2000) and searched against the Con-
characteristics. served Domain Database (Marchler-Bauer et al., 2003) by using anBy clustering tissue-specific AS events, we have iden- e value cut-off of 0.001. Domain “alteration” was scored when a
tified many examples of widely expressed genes that domain was detected in one splice isoform but not the other. A fulllist of annotated domains altered by the 3126 AS events monitoredcontain alternative exons uniquely skipped in specificon the microarray is shown in Table S3.adult tissues. For example, in the brain AS cluster shown
in Figure 5 are examples of widely expressed genesthat contain alternative exons displaying pronounced Custom Microarray Design
Oligonucleotide Probe Designskipping only in brain. One of these AS events corre-Exon and flanking intron sequences were repeat masked throughsponds to exon 3 in Madh2 (also known as Smad2),RepeatMasker (http://ftp.genome.washington.edu/RM/RepeatMasker.which is a transcription factor that transduces signalinghtml). A program was developed to automatically select optimal
pathways by transforming growth factor (TGF)-, and oligonucleotide probe sequences with the following criteria: (1) exonthus regulates multiple important cellular processes, in- body and intron probes have a matching Tm of 66�C � 2�C, andcluding cell proliferation, apoptosis, and differentiation junction probes are positioned over a splice junction such that the
Tm on either side of the junction is equal, and the overall Tm is 66�C �(ten Dijke and Hill, 2004). Skipping of exon 3 results in2�C; (2) each probe sequence has a similar AT/GC base compositionthe creation of an intact MH1 (DNA binding) domainand simple repeats, especially GGG and CCC are avoided; (3) se-and is a key event in promoting activity and alteredquences with self-annealing potential are avoided; (4) sequencesspecificity of Madh2 for gene targets (Yagi et al., 1999).with four or more consecutive internal base pairings are avoided;
To our knowledge, an increased level of skipping of and (5) probe sequences have the maximal differential between theexon 3 in brain tissue has not been reported, allowing target sequence and second-best match from BLAST searches ofus to speculate that the activity and target specificity mouse sequence databases are prioritized. Probe sets represented
on the microarray were prioritized according to a ranking schemeof Madh2 may be very different in brain compared tobased on the design parameters listed above. No more than 12 T’sother tissues. Among the other genes in the brain ASwere added to the 3-end of each probe sequence; the total lengthcluster are Dickkopf-3 (Dkk3), which has been impli-of the probe sequence cannot be more than 60 nt. Microarrays were
cated in brain development (Diep et al., 2004), and the manufactured by Agilent Technologies.N-terminal-asparagine-amidase (Ntan1), which func-tions in regulated protein turnover by the N-terminal rule
Microarray Hybridization, Scanning, Data Extraction,pathway. Interestingly, mice deficient for Ntan1 haveand Normalization
altered activity, social behavior, and spatial memory Labeling and Hybridizationability (Balogh et al., 2000, 2001; Grigoryev et al., 1996; cDNA labeling and microarray hybridization was performed essen-Kwon et al., 2000). Thus, it is possible to infer that tially as described by Zhang et al. (2004). All hybridizations were
performed in duplicate with fluor reversal, and microarrays werethese newly identified brain-specific exon skippingscanned with a 4000A microarray scanner (Axon Instruments, Unionevents contribute to controlling the neural-specific ac-City, California).tivities of these widely expressed genes. Such informa-Image Processing and Normalizationtion generated by our microarray data will facilitate new TIFF images were quantitated with GenePix 3.0 (Axon Instruments).
experimentation directed at defining how important tis- Individual channels were spatially denoised (i.e., overall correlationssue-specific activities of proteins are established and between spot intensity and position on the slide removed) by usingcontrolled in mammals. spatial trend removal (STR) with 10% outliers (Shai, Morris, and
Frey, in preparation). We applied variance stabilizing normalizationExperimental Procedures (VSN) by using 25% of the genes to normalize all single channels
to each other. Finally, we manually identified and removed data fromComputational Identification and Analysis of AS Events residual artifacts apparent on microarray images and measurementsfrom cDNA and EST Databases that showed high inconsistency between dye-swaps.AS Identification and FilteringAS events were identified by clustering cDNA and EST sequences
RT-PCR Assaysto contigs of exons extracted from alignments of transcript andPrimer pairs were designed to have a matching Tm (59�C) and weregenomic sequences using Sim4 (Florea et al., 1998). Details of data-targeted to constant exon sequences flanking each alternative exon.bases and filtering criteria used are provided in the SupplementalRT-PCR assays were performed with the OneStep RT-PCR Kit (Qia-Data.gen). Reactions were performed in 25 �l volumes containing 1.0 ngSorting of ESTs According to Tissue SourcespolyA� mRNA, 7.5 units porcine RNAguard (Amersham), and 600Cell and tissue source information, where available, was retrievedpM each of the forward and reverse primers. After 30 rounds offrom the GenBank flat file for cDNA sequences and from the ESTamplification, the reaction products were separated on 2% agaroseLibrary Browser for EST sequences by using expression searchesgels stained with ethidium bromide. Several representative AS geneswith manually compiled key words for 54 different cell/tissue sourcewere assayed over a dilution range of input mRNA in order to assesscategories (Pan et al., 2005).the linearity of the amplifications. The ratios of exclusion to inclusionIdentification of Conserved and Mouse-Specificwere generally maintained over the titration ranges. Inverted blackAlternative Exonsand white images of the gels were recorded with a Syngene gelTo determine whether the mouse AS events were conserved in
human, we Blasted “probe” sequences corresponding to included documentation system and GeneSnap software.

Molecular Cell940
AS Microarray Data Analysis and understanding nonsense: exonic mutations that affect splicing.Nat. Rev. Genet. 3, 285–298.Algorithm Development
Details of the GenASAP algorithm used to analyze the AS microarray Clark, T.A., Sugnet, C.W., and Ares, M., Jr. (2002). Genomewidedata are provided in a technical report (www.psi.utoronto.ca/�ofer/ analysis of mRNA processing in yeast using splicing-specific mi-AS-supp.pdf) and in the Supplemental Data. croarrays. Science 296, 907–910.Comparison of Gene Sets Defining Tissue-Specific
Croft, L., Schandorff, S., Clark, F., Burrage, K., Arctander, P., andAS and Transcription ProfilesMattick, J.S. (2000). ISIS, the intron information system, reveals theThe top 1600 ranked AS events were filtered to remove events forhigh frequency of alternative splicing in the human genome. Nat.which no GO-BP annotation was available, and only one AS eventGenet. 24, 340–341.per gene was analyzed. 820 AS events remained, representing 769Diep, D.B., Hoen, N., Backman, M., Machon, O., and Krauss, S.GO-BP annotations, after up-propagation. Using a “greedy” algo-(2004). Characterization of the Wnt antagonists and their responserithm, the top 100 AS events were selected whose profiles mostto conditionally activated Wnt signalling in the developing mouseclosely reflect tissue similarity between (1) kidney and liver, (2) heartforebrain. Brain Res. Dev. Brain Res. 153, 261–270.and muscle, (3) lung and salivary, and (4) testis and spleen, while
at the same time distinguishing these tissue-pair profiles from the Faustino, N.A., and Cooper, T.A. (2003). Pre-mRNA splicing andrest of the tissues. (Further details of the greedy approach are given human disease. Genes Dev. 17, 419–437.in Supplemental Data.)
Florea, L., Hartzell, G., Zhang, Z., Rubin, G.M., and Miller, W. (1998).A computer program for aligning a cDNA sequence with a genomic
Acknowledgments DNA sequence. Genome Res. 8, 967–974.
Graveley, B.R. (2000). Sorting out the complexity of SR protein func-Correspondence relating to GenASAP can be addressed to B.J.F.
tions. RNA 6, 1197–1211.and Q.D.M. We thank Richard Aronovitz, John Calarco, Richard
Graveley, B.R. (2001). Alternative splicing: increasing diversity in theCollins, Jim Friesen, Christos Ouzounis, and Susan McCracken forproteomic world. Trends Genet. 17, 100–107.helpful discussions and comments on the manuscript. We also thank
Ursula Skalska and Sanie Mnaimneh for their excellent assistance. Grigoryev, S., Stewart, A.E., Kwon, Y.T., Arfin, S.M., Bradshaw, R.A.,This work was funded by the Canadian Institutes of Health Research Jenkins, N.A., Copeland, N.G., and Varshavsky, A. (1996). A mouseProof-of-Principle and Operating grants (to B.J.B. and T.R.H), On- amidase specific for N-terminal asparagine. The gene, the enzyme,tario Premier’s Research Excellence Awards (to B.J.F. and B.J.B), and their function in the N-end rule pathway. J. Biol. Chem. 271,a National Cancer Institute of Canada operating grant (to B.J.B), 28521–28532.and Canadian Foundation for Innovation infrastructure grants (to Hu, G.K., Madore, S.J., Moldover, B., Jatkoe, T., Balaban, D.,T.R.H., B.J.F. and B.J.B.). We also thank Jim Friesen for his generous Thomas, J., and Wang, Y. (2001). Predicting splice variant from DNAsupport during the course of this work. chip expression data. Genome Res. 11, 1237–1245.
Hughes, T.R., Mao, M., Jones, A.R., Burchard, J., Marton, M.J.,Received: August 9, 2004 Shannon, K.W., Lefkowitz, S.M., Ziman, M., Schelter, J.M., Meyer,Revised: November 18, 2004 M.R., et al. (2001). Expression profiling using microarrays fabricatedAccepted: December 8, 2004 by an ink-jet oligonucleotide synthesizer. Nat. Biotechnol. 19,Published: December 21, 2004 342–347.
Johnson, J.M., Castle, J., Garrett-Engele, P., Kan, Z., Loerch, P.M.,References
Armour, C.D., Santos, R., Schadt, E.E., Stoughton, R., and Shoe-maker, D.D. (2003). Genome-wide survey of human alternative pre-
Babak, T., Zhang, W., Morris, Q., Blencowe, B.J., and Hughes, T.R. mRNA splicing with exon junction microarrays. Science 302, 2141–(2004). Probing miRNAs with microarrays: tissue specificity and 2144.functional inference. RNA 10, 1813–1819.
Kan, Z., Rouchka, E.C., Gish, W.R., and States, D.J. (2001). GeneBalogh, S.A., McDowell, C.S., Tae Kwon, Y., and Denenberg, V.H. structure prediction and alternative splicing analysis using. Genome(2001). Facilitated stimulus-response associative learning and long- Res. 11, 889–900.term memory in mice lacking the NTAN1 amidase of the N-end rule
Kapranov, P., Cawley, S.E., Drenkow, J., Bekiranov, S., Strausberg,pathway. Brain Res. 892, 336–343.R.L., Fodor, S.P., and Gingeras, T.R. (2002). Large-scale transcrip-
Balogh, S.A., Kwon, Y.T., and Denenberg, V.H. (2000). Varying in-tional activity in chromosomes 21 and 22. Science 296, 916–919.
tertrial interval reveals temporally defined memory deficits and en-Kramer, A. (1996). The structure and function of proteins involvedhancements in NTAN1-deficient mice. Learn. Mem. 7, 279–286.in mammalian pre-mRNA splicing. Annu. Rev. Biochem. 65, 367–409.
Bar-Joseph, Z., Gifford, D.K., and Jaakkola, T.S. (2001). Fast optimalKwon, Y.T., Balogh, S.A., Davydov, I.V., Kashina, A.S., Yoon, J.K.,leaf ordering for hierarchical clustering. Bioinformatics Suppl. 17,Xie, Y., Gaur, A., Hyde, L., Denenberg, V.H., and Varshavsky, A.S22–S29.(2000). Altered activity, social behavior, and spatial memory in mice
Black, D.L. (2000). Protein diversity from alternative splicing: a chal-lacking the NTAN1p amidase and the asparagine branch of the
lenge for bioinformatics and post-genome biology. Cell 103,N-end rule pathway. Mol. Cell. Biol. 20, 4135–4148.
367–370.Lander, E.S., Linton, L.M., Birren, B., Nusbaum, C., Zody, M.C.,
Black, D.L. (2003). Mechanisms of alternative pre-messenger RNABaldwin, J., Devon, K., Dewar, K., Doyle, M., FitzHugh, W., et al.
splicing. Annu. Rev. Biochem. 72, 291–336.(2001). Initial sequencing and analysis of the human genome. Nature
Blencowe, B.J. (2000). Exonic splicing enhancers: mechanism of 409, 860–921.action, diversity and role in human genetic diseases. Trends Bio-
Lee, C., and Roy, M. (2004). Analysis of alternative splicing withchem. Sci. 25, 106–110.microarrays: successes and challenges. Genome Biol. 5, 231.
Brett, D., Pospisil, H., Valcarcel, J., Reich, J., and Bork, P. (2002).Marchler-Bauer, A., Anderson, J.B., DeWeese-Scott, C., Fedorova,Alternative splicing and genome complexity. Nat. Genet. 30, 29–30.N.D., Geer, L.Y., He, S., Hurwitz, D.I., Jackson, J.D., Jacobs, A.R.,
Burge, C., Tuschl, T., and Sharp, P.A. (1999). Splicing of Precursors Lanczycki, C.J., et al. (2003). CDD: a curated Entrez database ofto mRNAs by the Spliceosomes, Second Edition (Cold Spring Har- conserved domain alignments. Nucleic Acids Res. 31, 383–387.bor, New York: Cold Spring Harbor Laboratory Press).
Miki, R., Kadota, K., Bono, H., Mizuno, Y., Tomaru, Y., Carninci, P.,Caceres, J.F., and Kornblihtt, A.R. (2002). Alternative splicing: multi- Itoh, M., Shibata, K., Kawai, J., Konno, H., et al. (2001). Delineatingple control mechanisms and involvement in human disease. Trends developmental and metabolic pathways in vivo by expression profil-Genet. 18, 186–193. ing using the RIKEN set of 18,816 full-length enriched mouse cDNA
arrays. Proc. Natl. Acad. Sci. USA 98, 2199–2204.Cartegni, L., Chew, S.L., and Krainer, A.R. (2002). Listening to silence

Global Regulation of Alternative Splicing941
Mironov, A.A., Fickett, J.W., and Gelfand, M.S. (1999). Frequent Accession Numbersalternative splicing of human genes. Genome Res. 9, 1288–1293.
All microarray data have been deposited at GEO under accessionModrek, B., and Lee, C. (2002). A genomic view of alternative splic-number GSE2054.ing. Nat. Genet. 30, 13–19.
Modrek, B., and Lee, C.J. (2003). Alternative splicing in the human,mouse and rat genomes is associated with an increased frequencyof exon creation and/or loss. Nat. Genet. 34, 177–180.
Nurtdinov, R.N., Artamonova, I.I., Mironov, A.A., and Gelfand, M.S.(2003). Low conservation of alternative splicing patterns in the hu-man and mouse genomes. Hum. Mol. Genet. 12, 1313–1320.
Okazaki, Y., Furuno, M., Kasukawa, T., Adachi, J., Bono, H., Kondo,S., Nikaido, I., Osato, N., Saito, R., Suzuki, H., et al. (2002). Analysisof the mouse transcriptome based on functional annotation of60,770 full-length cDNAs. Nature 420, 563–573.
Pan, Q., Bakowski, M.A., Morris, Q., Zhang, W., Frey, B.J., Hughes,T.R., and Blencowe, B.J. (2005). Alternative splicing of conservedexons is frequently species-specific in human and mouse. TrendsGenet., in press.
Peng, W.T., Robinson, M.D., Mnaimneh, S., Krogan, N.J., Cagney,G., Morris, Q., Davierwala, A.P., Grigull, J., Yang, X., Zhang, W., etal. (2003). A panoramic view of yeast noncoding RNA processing.Cell 113, 919–933.
Rice, P., Longden, I., and Bleasby, A. (2000). EMBOSS: the Europeanmolecular biology open software suite. Trends Genet. 16, 276–277.
Rinn, J.L., Euskirchen, G., Bertone, P., Martone, R., Luscombe, N.M.,Hartman, S., Harrison, P.M., Nelson, F.K., Miller, P., Gerstein, M., etal. (2003). The transcriptional activity of human Chromosome 22.Genes Dev. 17, 529–540.
Shoemaker, D.D., Schadt, E.E., Armour, C.D., He, Y.D., Garrett-Engele, P., McDonagh, P.D., Loerch, P.M., Leonardson, A., Lum,P.Y., Cavet, G., et al. (2001). Experimental annotation of the humangenome using microarray technology. Nature 409, 922–927.
Smith, C.W., and Valcarcel, J. (2000). Alternative pre-mRNA splicing:the logic of combinatorial control. Trends Biochem. Sci. 25, 381–388.
Sorek, R., Shamir, R., and Ast, G. (2004). How prevalent is functionalalternative splicing in the human genome? Trends Genet. 20, 68–71.
Su, A.I., Wiltshire, T., Batalov, S., Lapp, H., Ching, K.A., Block, D.,Zhang, J., Soden, R., Hayakawa, M., Kreiman, G., et al. (2004). Agene atlas of the mouse and human protein-encoding tran-scriptomes. Proc. Natl. Acad. Sci. USA 101, 6062–6067.
ten Dijke, P., and Hill, C.S. (2004). New insights into TGF-beta-Smadsignalling. Trends Biochem. Sci. 29, 265–273.
Thanaraj, T.A., Clark, F., and Muilu, J. (2003). Conservation of humanalternative splice events in mouse. Nucleic Acids Res. 31, 2544–2552.
Wang, H., Hubbell, E., Hu, J.S., Mei, G., Cline, M., Lu, G., Clark, T.,Siani-Rose, M.A., Ares, M., Kulp, D.C., and Haussler, D. (2003). Genestructure-based splice variant deconvolution using a microarrayplatform. Bioinformatics Suppl. 19, i315–i322.
Will, C.L., and Luhrmann, R. (1997). Protein functions in pre-mRNAsplicing. Curr. Opin. Cell Biol. 9, 320–328.
Xu, Q., Modrek, B., and Lee, C. (2002). Genome-wide detection oftissue-specific alternative splicing in the human. Nucleic Acids Res.30, 3754–3766.
Yagi, K., Goto, D., Hamamoto, T., Takenoshita, S., Kato, M., andMiyazono, K. (1999). Alternatively spliced variant of Smad2 lackingexon 3. Comparison with wild-type Smad2 and Smad3. J. Biol.Chem. 274, 703–709.
Yeakley, J.M., Fan, J.B., Doucet, D., Luo, L., Wickham, E., Ye, Z.,Chee, M.S., and Fu, X.D. (2002). Profiling alternative splicing onfiber-optic arrays. Nat. Biotechnol. 20, 353–358.
Zhang, W., Morris, Q., Chang, R., Shai, O., Bakowski, M., Mitsakakis,N., Mohammad, N., Robinson, M., Eftekharpour, E., Grigull, J., et al.(2004). The functional landscape of mouse gene expression. J. Biol.3, 21.
Zhu, J., Shendure, J., Mitra, R.D., and Church, G.M. (2003). Singlemolecule profiling of alternative pre-mRNA splicing. Science 301,836–838.
Copyright © 2022 FDOKUMEN