Returns to public sector plant breeding in the presence of spill-ins and private goods: the case of...
18
AGRICULTURAL ECONOMICS Agricultural Economics 41 (2010) 425–442 Returns to public sector plant breeding in the presence of spill-ins and private goods: the case of bean research in Michigan Mywish K. Maredia a,∗ , Richard Bernsten b , Catherine Ragasa c a Department of Agricultural, Food and Resource Economics, 321 Agriculture Hall, Michigan State University, East Lansing, MI 48824, USA b Department of Agricultural, Food and Resource Economics, 211E Agriculture Hall, Michigan State University, East Lansing, MI 48824, USA c International Food Policy Research Institute, 2033 K Street NW, Washington, DC 20006, USA Received 18 December 2008; received in revised form 15 January 2010; accepted 15 January 2010 Abstract This article illustrates a methodology for assessing economic returns to a publicly funded breeding program in the presence of private sector investments, and spill-ins from other contemporary public institutions and past research efforts. The approach consists of determining yield gains from bean improvement research; applying these yield gain estimates to measure benefits attributable to different institutional players and time periods; and then assessing the benefit-cost ratios of investments in a bean improvement program since 1980 by Michigan State University (MSU). The results indicate that investments in MSU’s bean breeding program have yielded benefits to costs ratio in the range of 0.7 to 2.2, depending on the attribution rule used to estimate the benefits. The estimated benefit/cost ratios reported in this study are lower-bound estimates, as they do not account for potential benefits from area planted to MSU varieties outside of Michigan (spillover effects), which was 1.5 times greater than the area planted to MSU-bred varieties within Michigan in the period 1998–2002. The implications of the increasingly privatized bean seed markets for the role of public sector research in bean improvement research are discussed. JEL classifications: O22, O30, Q16 Keywords: Economic benefits; Rates of return; Bean research; Improved varieties; Michigan; Public sector investment; Plant breeding research; Spillover effects; Private sector research 1. Introduction The returns-to-research literature is replete with studies that measure benefits of public goods that result from public sector investments in agricultural research (see Alston, Marra, et al., 2000, and Evenson, 2001, for an inventory of rates of return studies). A majority of these studies estimate rates of return to public sector research investment when it is the only player in the research sector. However, for many agricultural com- modities several institutional players (public, private, regional, and international) contribute to productivity growth. In this sce- ∗ Corresponding author. Tel.: (517) 353 6602; fax: (517) 432 1073. E-mail address: [email protected] (M.K. Maredia). Data Appendix Available Online A data appendix to replicate main results is available in the online version of this article. Please note: Wiley-Blackwell, Inc. is not responsible for the content or functionality of any supporting information supplied by the author. Any queries (other than missing material) should be directed to the corresponding author for the article. nario, it becomes challenging to estimate benefits to only one public sector institution. Yet, failure to include research invest- ments by other public and private sector players or properly attributing the benefits to different institutional players in the R&D sector has possibly overestimated the social rates of re- turn (Alston and Pardey, 2001; Fuglie et al., 1996; Pardey et al., 2006). Seeds of bean (Phaseolus vulgaris) varieties planted by Michigan farmers are a classic example of a matured R&D industry where farmers have access to seeds that are devel- oped by both the public and private sectors—in state and out of state. One way of dealing with the overestimation problem is to measure joint benefits and returns to investments by multi- ple institutional players. Several rates of return studies listed in Alston, Chan-Kang, et al. (2000) and Evenson (2001) do pre- cisely this. However, rates of return estimates are often intended to be used to justify past investments for a specific time period by a public sector institution and to garner continued support for such investments. Therefore, estimating rates of return to joint investments by all the institutional players may not serve c 2010 International Association of Agricultural Economists DOI: 10.1111/j.1574-0862.2010.00455.x
-
Upload
independent -
Category
Documents
-
view
3 -
download
0
Transcript of Returns to public sector plant breeding in the presence of spill-ins and private goods: the case of...

AGRICULTURALECONOMICS
Agricultural Economics 41 (2010) 425–442
Returns to public sector plant breeding in the presence of spill-ins and privategoods: the case of bean research in Michigan
Mywish K. Marediaa,∗, Richard Bernstenb, Catherine Ragasac
aDepartment of Agricultural, Food and Resource Economics, 321 Agriculture Hall, Michigan State University, East Lansing, MI 48824, USAbDepartment of Agricultural, Food and Resource Economics, 211E Agriculture Hall, Michigan State University, East Lansing, MI 48824, USA
cInternational Food Policy Research Institute, 2033 K Street NW, Washington, DC 20006, USA
Received 18 December 2008; received in revised form 15 January 2010; accepted 15 January 2010
Abstract
This article illustrates a methodology for assessing economic returns to a publicly funded breeding program in the presence of private sectorinvestments, and spill-ins from other contemporary public institutions and past research efforts. The approach consists of determining yield gainsfrom bean improvement research; applying these yield gain estimates to measure benefits attributable to different institutional players and timeperiods; and then assessing the benefit-cost ratios of investments in a bean improvement program since 1980 by Michigan State University (MSU).The results indicate that investments in MSU’s bean breeding program have yielded benefits to costs ratio in the range of 0.7 to 2.2, depending onthe attribution rule used to estimate the benefits. The estimated benefit/cost ratios reported in this study are lower-bound estimates, as they do notaccount for potential benefits from area planted to MSU varieties outside of Michigan (spillover effects), which was 1.5 times greater than the areaplanted to MSU-bred varieties within Michigan in the period 1998–2002. The implications of the increasingly privatized bean seed markets for therole of public sector research in bean improvement research are discussed.
JEL classifications: O22, O30, Q16
Keywords: Economic benefits; Rates of return; Bean research; Improved varieties; Michigan; Public sector investment; Plant breeding research; Spillover effects;Private sector research
1. Introduction
The returns-to-research literature is replete with studies thatmeasure benefits of public goods that result from public sectorinvestments in agricultural research (see Alston, Marra, et al.,2000, and Evenson, 2001, for an inventory of rates of returnstudies). A majority of these studies estimate rates of returnto public sector research investment when it is the only playerin the research sector. However, for many agricultural com-modities several institutional players (public, private, regional,and international) contribute to productivity growth. In this sce-
∗Corresponding author. Tel.: (517) 353 6602; fax: (517) 432 1073.E-mail address: [email protected] (M.K. Maredia).
Data Appendix Available Online
A data appendix to replicate main results is available in the online version ofthis article. Please note: Wiley-Blackwell, Inc. is not responsible for the contentor functionality of any supporting information supplied by the author. Anyqueries (other than missing material) should be directed to the correspondingauthor for the article.
nario, it becomes challenging to estimate benefits to only onepublic sector institution. Yet, failure to include research invest-ments by other public and private sector players or properlyattributing the benefits to different institutional players in theR&D sector has possibly overestimated the social rates of re-turn (Alston and Pardey, 2001; Fuglie et al., 1996; Pardey et al.,2006).
Seeds of bean (Phaseolus vulgaris) varieties planted byMichigan farmers are a classic example of a matured R&Dindustry where farmers have access to seeds that are devel-oped by both the public and private sectors—in state and out ofstate. One way of dealing with the overestimation problem isto measure joint benefits and returns to investments by multi-ple institutional players. Several rates of return studies listed inAlston, Chan-Kang, et al. (2000) and Evenson (2001) do pre-cisely this. However, rates of return estimates are often intendedto be used to justify past investments for a specific time periodby a public sector institution and to garner continued supportfor such investments. Therefore, estimating rates of return tojoint investments by all the institutional players may not serve
c© 2010 International Association of Agricultural Economists DOI: 10.1111/j.1574-0862.2010.00455.x
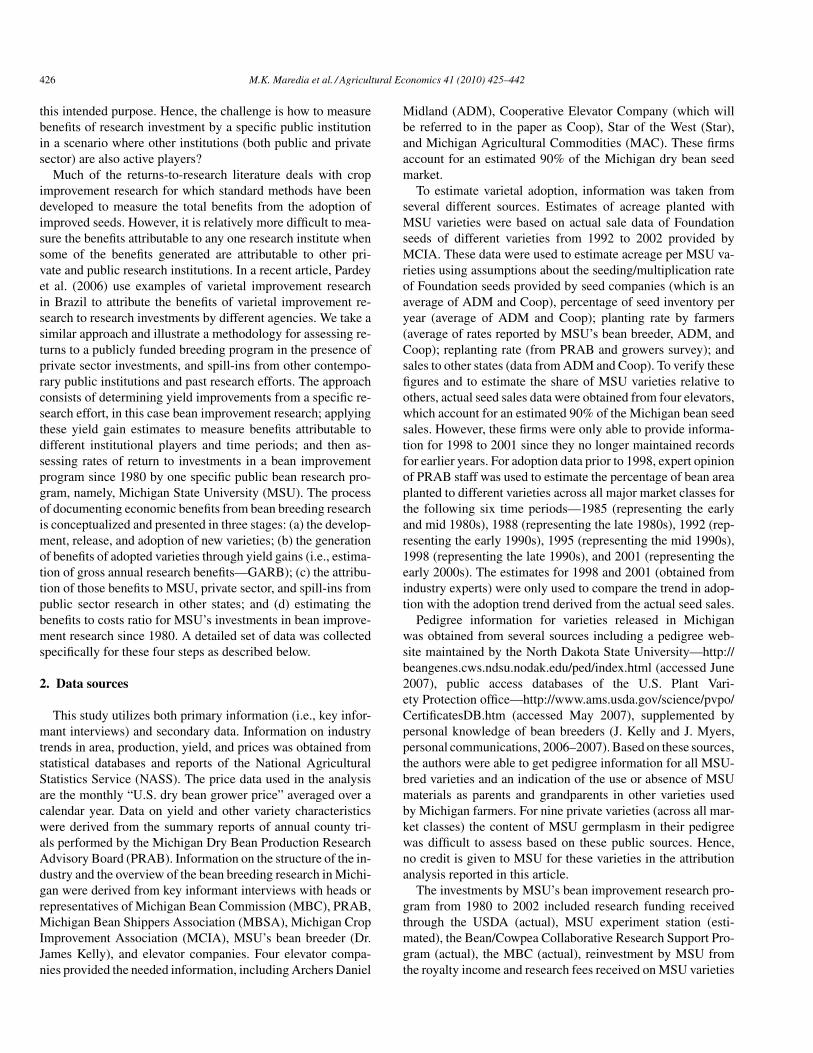
426 M.K. Maredia et al. / Agricultural Economics 41 (2010) 425–442
this intended purpose. Hence, the challenge is how to measurebenefits of research investment by a specific public institutionin a scenario where other institutions (both public and privatesector) are also active players?
Much of the returns-to-research literature deals with cropimprovement research for which standard methods have beendeveloped to measure the total benefits from the adoption ofimproved seeds. However, it is relatively more difficult to mea-sure the benefits attributable to any one research institute whensome of the benefits generated are attributable to other pri-vate and public research institutions. In a recent article, Pardeyet al. (2006) use examples of varietal improvement researchin Brazil to attribute the benefits of varietal improvement re-search to research investments by different agencies. We take asimilar approach and illustrate a methodology for assessing re-turns to a publicly funded breeding program in the presence ofprivate sector investments, and spill-ins from other contempo-rary public institutions and past research efforts. The approachconsists of determining yield improvements from a specific re-search effort, in this case bean improvement research; applyingthese yield gain estimates to measure benefits attributable todifferent institutional players and time periods; and then as-sessing rates of return to investments in a bean improvementprogram since 1980 by one specific public bean research pro-gram, namely, Michigan State University (MSU). The processof documenting economic benefits from bean breeding researchis conceptualized and presented in three stages: (a) the develop-ment, release, and adoption of new varieties; (b) the generationof benefits of adopted varieties through yield gains (i.e., estima-tion of gross annual research benefits—GARB); (c) the attribu-tion of those benefits to MSU, private sector, and spill-ins frompublic sector research in other states; and (d) estimating thebenefits to costs ratio for MSU’s investments in bean improve-ment research since 1980. A detailed set of data was collectedspecifically for these four steps as described below.
2. Data sources
This study utilizes both primary information (i.e., key infor-mant interviews) and secondary data. Information on industrytrends in area, production, yield, and prices was obtained fromstatistical databases and reports of the National AgriculturalStatistics Service (NASS). The price data used in the analysisare the monthly “U.S. dry bean grower price” averaged over acalendar year. Data on yield and other variety characteristicswere derived from the summary reports of annual county tri-als performed by the Michigan Dry Bean Production ResearchAdvisory Board (PRAB). Information on the structure of the in-dustry and the overview of the bean breeding research in Michi-gan were derived from key informant interviews with heads orrepresentatives of Michigan Bean Commission (MBC), PRAB,Michigan Bean Shippers Association (MBSA), Michigan CropImprovement Association (MCIA), MSU’s bean breeder (Dr.James Kelly), and elevator companies. Four elevator compa-nies provided the needed information, including Archers Daniel
Midland (ADM), Cooperative Elevator Company (which willbe referred to in the paper as Coop), Star of the West (Star),and Michigan Agricultural Commodities (MAC). These firmsaccount for an estimated 90% of the Michigan dry bean seedmarket.
To estimate varietal adoption, information was taken fromseveral different sources. Estimates of acreage planted withMSU varieties were based on actual sale data of Foundationseeds of different varieties from 1992 to 2002 provided byMCIA. These data were used to estimate acreage per MSU va-rieties using assumptions about the seeding/multiplication rateof Foundation seeds provided by seed companies (which is anaverage of ADM and Coop), percentage of seed inventory peryear (average of ADM and Coop); planting rate by farmers(average of rates reported by MSU’s bean breeder, ADM, andCoop); replanting rate (from PRAB and growers survey); andsales to other states (data from ADM and Coop). To verify thesefigures and to estimate the share of MSU varieties relative toothers, actual seed sales data were obtained from four elevators,which account for an estimated 90% of the Michigan bean seedsales. However, these firms were only able to provide informa-tion for 1998 to 2001 since they no longer maintained recordsfor earlier years. For adoption data prior to 1998, expert opinionof PRAB staff was used to estimate the percentage of bean areaplanted to different varieties across all major market classes forthe following six time periods—1985 (representing the earlyand mid 1980s), 1988 (representing the late 1980s), 1992 (rep-resenting the early 1990s), 1995 (representing the mid 1990s),1998 (representing the late 1990s), and 2001 (representing theearly 2000s). The estimates for 1998 and 2001 (obtained fromindustry experts) were only used to compare the trend in adop-tion with the adoption trend derived from the actual seed sales.
Pedigree information for varieties released in Michiganwas obtained from several sources including a pedigree web-site maintained by the North Dakota State University—http://beangenes.cws.ndsu.nodak.edu/ped/index.html (accessed June2007), public access databases of the U.S. Plant Vari-ety Protection office—http://www.ams.usda.gov/science/pvpo/CertificatesDB.htm (accessed May 2007), supplemented bypersonal knowledge of bean breeders (J. Kelly and J. Myers,personal communications, 2006–2007). Based on these sources,the authors were able to get pedigree information for all MSU-bred varieties and an indication of the use or absence of MSUmaterials as parents and grandparents in other varieties usedby Michigan farmers. For nine private varieties (across all mar-ket classes) the content of MSU germplasm in their pedigreewas difficult to assess based on these public sources. Hence,no credit is given to MSU for these varieties in the attributionanalysis reported in this article.
The investments by MSU’s bean improvement research pro-gram from 1980 to 2002 included research funding receivedthrough the USDA (actual), MSU experiment station (esti-mated), the Bean/Cowpea Collaborative Research Support Pro-gram (actual), the MBC (actual), reinvestment by MSU fromthe royalty income and research fees received on MSU varieties

M.K. Maredia et al. / Agricultural Economics 41 (2010) 425–442 427
Navy
BlackPinto
Red Kidney (Both)
CranberrySmall Red
Great NorthernOther
0%
10%
20%
30%
40%
50%
60%
70%
80%
90%
100%
1980 1982 1984 1986 1988 1990 1992 1994 1996 1998 2000 2002 2004 2006
% o
f to
tal b
ean
are
a h
arve
sted
in M
ich
igan
Fig. 1. Trend in area harvested under different market classes as a percentage of total bean area harvested in Michigan, 1980–2007.
sold (actual), and 50% of the salary and fringes for a technicianand 25% of the salary and fringes of the bean breeder at MSU(estimated).1 Due to lack of data prior to 1980, research invest-ments for 1977–1979 were assumed to be at the same level as1980 in nominal dollars.
3. Development, release, and adoption of beanvarieties in Michigan
Michigan, the second largest dry-bean-producing state in theUnited States following North Dakota, accounts for 12% ofthe total U.S. production (about 5 million cwt harvested from265,000 acres in 2002). It is an important player in the U.S.dry bean industry and is the leading producer of black beans,cranberry beans, small red beans, and light red kidney (LRK)beans. Production of dry beans in Michigan is concentrated inthe Saginaw Valley and the Bay Thumb area in central andeast central Michigan. Since only around 4% of the total beanacreage is irrigated, the bean production frequently suffers fromcrop failures due to dry weather conditions. The total bean areaharvested in Michigan has fallen from more than 500,000 acresin late 1970s–early 1980s to around 220,000 acres in recentyears. Along with the absolute decline in the total bean areaharvested, the relative share of different market classes in thetotal area harvested in Michigan has also changed over thepast two decades as the percentage area under navy beans hasdeclined dramatically and area planted to black beans and otherniche market classes increased over this time period (Fig. 1).
1 The bean breeder at MSU is a faculty member in the Department of Crop andSoil Sciences with other responsibilities that include: basic research, teaching,and outreach. The other 75% of the salary and fringes not included in the costestimate reflects these other responsibilities of the bean breeder.
The seed industry in Michigan is composed of breeders/developers, multipliers, and sellers of seeds to the growers.Bean breeders or developers of varieties for commercial use bygrowers come from both private and public sectors. The pub-lic institution that caters to the seed needs of Michigan beangrowers is the Michigan State University’s Crop and Soil Sci-ence Department. Varieties developed by public universities inother states, which perform well in Michigan, are also grownby Michigan farmers. Leading private companies that developvarieties grown by Michigan farmers are Seminis (formerlyAsgrow Seed Company), Syngenta Group (formerly RogersBros. Company), and Gen-tec Seeds Limited. These companiesare located in other states, specifically Idaho, with branchesin key states all over the country. ADM has its own breedingprogram, but a relatively young one, and it deals only with cran-berry, light red kidney, and lima beans. Cooperative ElevatorCompany also started a breeding program in 1995, with ties toother companies. It concentrates on the following bean marketclasses—black, navy, small red, and Alubia.
Private varieties are usually developed for multistate releaseand are crossed and tested in several states. On the otherhand, varieties developed by MSU’s bean breeding programare mainly targeted for Michigan growers. However, it is stillpossible for MSU-bred varieties to “spill over” to other statesin the United States and Canada. In fact, as data in this articleshow, in 2002 the total area planted to MSU varieties outsideMichigan is almost three times greater than the total area plantedin Michigan.
MSU’s bean breeding program caters to the needs of Michi-gan growers across nine bean market classes—navy, black,pinto, great northern, cranberry, LRK, dark red kidney (DRK),white kidney, and small red (a recent focus). Although increas-ing yield is a major breeding objective, and almost 60% of theprogram efforts are devoted to crossing and testing for higher

428 M.K. Maredia et al. / Agricultural Economics 41 (2010) 425–442
yielding varieties across multiple locations, MSU’s breedingprogram also targets other traits such as upright architecture,early maturity, disease resistance, stress tolerance, and canningquality. Drought tolerance is indirectly included by natural fieldselection under local rainfed conditions, and yield consistencyis included as a breeding objective by testing potential varietiesin multiple locations across the state and selecting consistentperforming varieties.
The bean seed industry in Michigan is considered matureand dynamic, as evident by the fact that farmers have accessto a continuous stream of new bean varieties from multiple
Table 1Bean varieties included in multiple regression analysis and the estimates ofaverage yield advantage
Market Varietya Origin Yearclass released
Black T-39 Univ. of California-Davis
1975
Midnight Cornell University 1980Black Magic MSU 1982Domino MSU 1982Black Hawk (B 83302) MSU 1989Black Jack Gentec 1989Onyx (ROG 925) Syngenta 1997Jaguar (B95556) MSU 1999
Cranberry Taylor MIB 1964MI Improved Vine Cran) MSU 1966Cran-75 (or Vine Cran-75) Gentec 1985CRAN-028 MSU 1986SVM Cran (or SVM Taylor) ASI 1986Etna Seminis/Asgrow 1990Cran 09 Gentec 1990Hooter Seminis/Asgrow 1999ROG 912 Syngenta 2000
DRK Charlevoix MSU 1960Montcalm MSU 1977California Univ. of California-
Davis1990
Camelot (RB83351) Syngenta 1990Guardian (RD83353) Syngenta 1990Drake Seminis/Asgrow 1994Isles (K86012) MSU 1994Red Hawk (K90101) MSU 1997
GN Alpine (G 89003) MSU 1992Moonbean (ASGB303) Seminis/Asgrow 1996Matterhorn (G 93414) MSU 1997
LRK Sacramento Sacramento ValleyMilling
1973
Isabella (70688) MSU 1982Linden Univ. of California-
Davis1983
Horizon (B212) Seminis/Asgrow 1990Cal Early LRK Univ. of California-
Davis1990
Foxfire Syngenta 1991Chinook (K86506) MSU 1992Chinook 2000 (K94601) MSU 1998Chardonnay (ASG 8340) Seminis/Asgrow 1999Red Kranner Cornell University 2001
Continued
Table 1Continued
Market Varietya Origin Yearclass released
Navy Seafarer MSU 1968Fleetwood Agriculture Canada 1977Bunsi MSU/CIAT 1982Midland Seminis/Asgrow/
WGT1982
C-20 MSU/Campbell 1983Crestwood Gentec 1986Albion (B166) Seminis/Asgrow 1987Mayflower MSU 1987Avanti Seminis/Asgrow 1990Schooner (RB 83045) Syngenta 1990Vista (GTS 0286) Gentec 1990ROG 331 Syngenta 1991Voyager (ROG 303) Syngenta 1993Navigator (ROG 345) Syngenta 1995Mackinac MSU 1996
Pinto Olathe Colorado StateUniversity
1979
Pindak USDA/NorthDakota StateUniversity
1981
Othello USDA-WA 1986Sierra (P 86299) MSU 1989Aztec (P 89430) MSU 1992Focus Seminis/Asgrow 1994Vision Seminis/Asgrow 1995Buster Seminis/Asgrow 1998
aMSU varieties are identified in bold letters.
sources across all major market classes (Table 1). From 1980 to2002, MSU’s bean breeding program released a total of 29 drybean varieties or approximately four new varieties (across allmarket classes) every three years. In addition, there is a largenumber of new competing varieties coming from other sourcesevery year (Table 1). For navy beans, for instance, a total of 16varieties released since 1980 and actually grown by Michiganfarmers, were developed by private companies and universitiesfrom other states. This gives a total of 25 varieties for navybeans, which means that on the average, five new varietiesbecame available every four years. For black beans, a total ofeight varieties have been released by private seed companiesand other universities since 1980, which gives a total of 14varieties for black beans or almost four new varieties every fiveyears.
While the record of varietal development and release is im-pressive, considering the 6–8-year variety development time-frame, the true test of the performance of a breeding programis farmers’ adoption of the varieties developed by a program.Due to “genotype by environment” interactions and the uniqueeconomic, social, and marketing circumstances faced by grow-ers, no one variety excels in all environment/circumstances atall times. Thus, in any given year growers in Michigan plant anumber of different varieties in a given market class, dependingon several factors: (a) prior experience with a given variety andits performance; (b) suitability of the variety to the growers’

M.K. Maredia et al. / Agricultural Economics 41 (2010) 425–442 429
farm production and marketing practices; (c) seed availability;and (d) marketability after harvest. Depending on the occur-rence of these factors, a variety released by a program maybecome: (a) a commercially successful variety that is plantedon a large proportion of the area for a number of years, (b) apartially successful variety that is adopted on a sizable area orfor a special niche, or (c) an unsuccessful variety that is nevercommercially adopted.
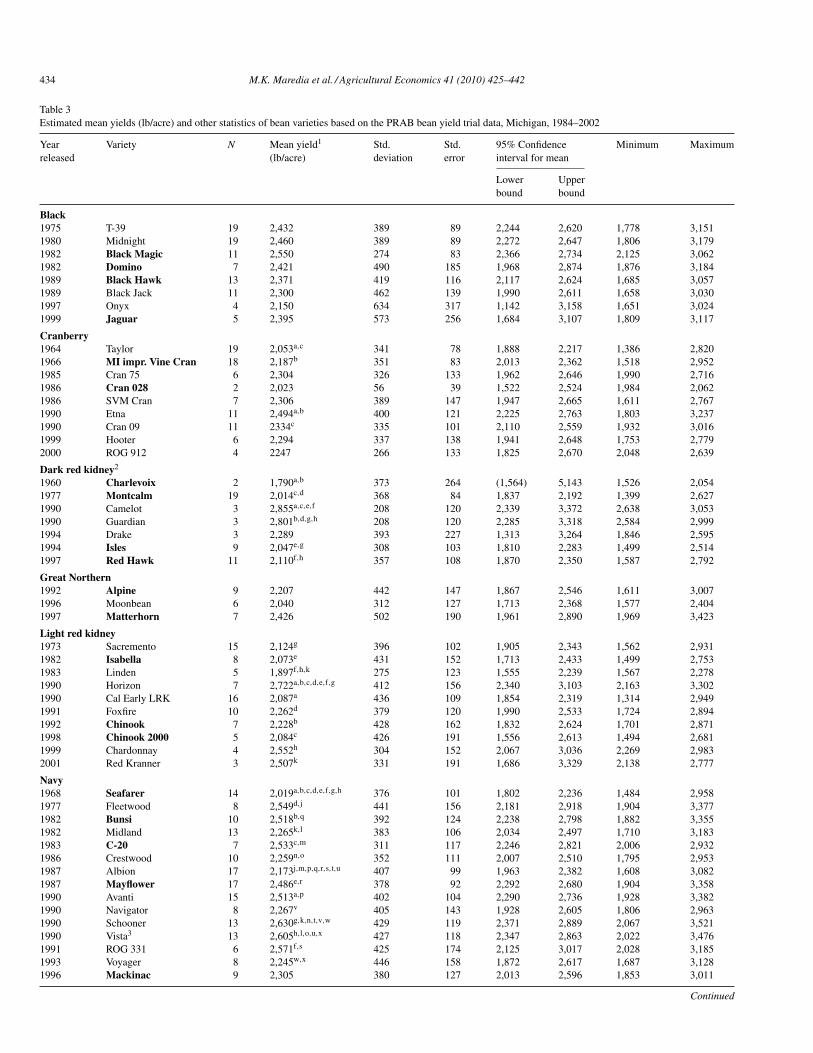
Table 2 lists all the bean varieties (across seven major mar-ket classes) that have been commercially successful or partiallysuccessful (defined as those varieties whose share in seed saleswas more than 2% for at least two years between 1985 to 2002)in Michigan. It also provides market share information for eachof these varieties, based on estimates of industry experts for1985, 1988, 1992, and 1995 and actual seed sales data for1998–2002. Assuming a research lag of six years, the varietiesreleased after 1986 are considered as outputs of post-1980 re-search investments in bean breeding, which is the focused timeframe of this assessment.
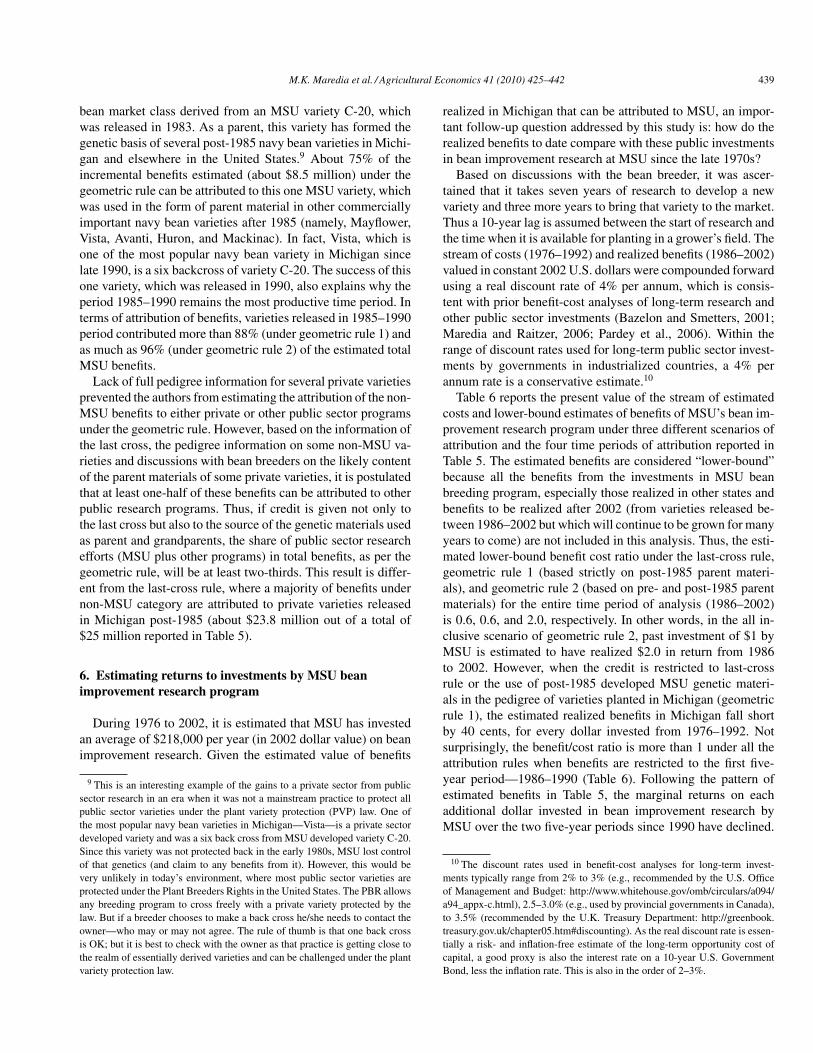
Overall, the weighted average market share of MSU varietiesacross all market classes for the time period 1985–2002 is 27%,but with a clear downward trend from 51% in 1985 to 15%in 2002 (Fig. 2). The declining overall adoption rate of MSUvarieties is mainly due to the negative trend in navy and blackbeans. For navy, the total area planted to MSU varieties declinedfrom more than 50% in the 1980s to around 5% in 2000–2002(Table 2). The introduction of the bean variety Vista in the1990s has reduced the market shares of many other varieties.For black beans, the area planted to MSU varieties decreasedfrom around 30% in late 1980s–early 1990s to about 12% inearly 2000. In other market classes, the share of MSU varietieseither remained steady (e.g., cranberry, DRK, and great northernbeans), increased over time (e.g., LRK beans) or remained small(pinto beans).
Based on the assumption that the market share data presentedin Table 2 are good proxies for the adoption rate of each va-riety, and using the year of release information, the weightedaverage age of varieties planted in Michigan in the early 2000swas estimated to be 20 years for black beans, 18 for cranberrybeans, 14 for pinto beans, 11 for navy beans, 10 for DRK beansand LRK beans, and 4 for great northern beans. The averageage of bean varieties planted in Michigan is surprisingly high insome market classes, despite an active and matured bean seedR&D sector. However, no other estimates of bean seed varietalage in other states or countries are available to make a com-parative assessment. The higher weighted age in black beansand cranberry beans indicates that farmers in Michigan are stillgrowing older varieties and have not replaced these with newerones (e.g., T-39—the oldest variety, was still the most widelyadopted black beans variety in Michigan in 2002). The loweraverage age of great northern bean varieties reflects the fact thatthis is a niche market class that has recently become popular inMichigan and that breeders have responded by developing newvarieties that have been adopted by farmers.
The varieties developed by MSU are not only sold andadopted in Michigan but also in other states. With the bean
acreage shrinking in Michigan, even a public sector beanbreeding program needed to explore other production areasfor markets—assuming that acreage was expanding elsewhere.Seed sales data collected from various sources indicate that thevolume of seeds of MSU varieties (released post-1985) soldduring 1998–2002 in other states is 1.5 times larger than the to-tal volume sold in Michigan. The trend in volume of seeds soldin other states has been steadily increasing over the five yearsfor which seed sales data are available. The ratio of volume ofseeds sold out-state versus in-state has increased from 0.21 in1998 to 2.75 (almost three times) in 2002 (Fig. 3). Thus, thelevel of spillover effects of the MSU breeding program to otherstates is high. The bulk of these sales come from Red Hawkbeans (24,573 cwt); Mayflower beans (18,161); Beluga (8,426cwt); Matterhorn beans (4,824 cwt); and Chinook 2000 beans(3,275 cwt). According to elevator staff, seeds of MSU varietiesare sold mainly in Minnesota, North Dakota, New York, andOntario.
4. Economic benefits of bean improvement research
The information presented in the previous section on vari-eties released and estimates of their adoption provide evidenceof the necessary conditions for crop breeding research to pro-duce benefits. An additional necessary condition is that thesevarieties must embody tangible benefits to farmers and to soci-ety in the form of increased yields, improved quality, reducedcosts, or other gains. In this study, the GARB to Michigan fromvarietal improvement are approximated as the value of addi-tional output attributed to new varieties, that is, GARB = PQK,where P is the average bean grower price, Q is the quantity ofbean production, and K is the supply shift parameter (expressedas a proportion of P) attributed to the adoption of new varieties.
This method of approximating GARB was first used byGriliches (1958) in his study of hybrid corn and has since beenused by several studies to assess economic benefits of crop im-provement research (Morris and Heisey, 2003; Pardey et al.,2006). This measure of GARB provides a close approxima-tion of total benefits under the most common assumptions usedin measures of research benefits. These include: (a) a linearand parallel supply curve shift due to research, (b) no conse-quences of increased supply in Michigan on world market pricefor beans, and (c) no quantity effects of improved varieties inMichigan on bean yields in other states and countries. Althoughthese are reasonable assumptions in the case of bean research inMichigan, this measure of GARB is not without shortcomings,as discussed by Alston et al. (1998). For example, if the natureof the research-induced supply shift is indeed pivotal ratherthan parallel, the measure of GARB = PQK will overstate thebenefits. However, since information is not available on the na-ture of the supply shift associated with new bean varieties inMichigan, some assumptions are inevitable. Another limitationof this approach is that it does not measure the distributionof benefits between producers and consumers either within oroutside Michigan. This is not a serious shortcoming, since the

430 M.K. Maredia et al. / Agricultural Economics 41 (2010) 425–442
Table 2Market share of bean varieties adopted in Michigan by market class, 1985–2002
Year released Varietya 1985 1988 1992 1995 1998 1999 2000 2001 2002
Black1975 T-39 65.0% 60.0% 60.0% 60.0% 36.4% 55.9% 51.4% 59.2% 50.2%1980 Midnight 20.0% 10.0% 10.0% 10.0% 26.7% 10.6% 14.2% 7.1% 15.4%1982 Black Magic 10.0% 5.0% 5.0% 5.0% 0.04% 1.5%1982 Domino 5.0% 10.0% 10.0% 5.0% 2.4% 10.2% 5.9% 6.7% 8.1%1989 Black Hawk 15.0% 15.0% 5.0% 18.1% 3.8% 3.1% 0.2% 0.1%1989 Black Jack 20.0% 10.7% 14.1% 19.1% 17.4% 13.3%1997 Onyx 2.6% 5.6% 2.8% 8.1%1999 Jaguar 0.5% 6.1% 3.0%
Other varieties 0.6% 2.9% 0.2% 0.5% 0.1%Share of MSU varieties 15% 30% 30% 10% 25.5% 14% 9.5% 13% 11.2%
Cranberry1964 Taylor 80.0% 73.0% 73.0% 65.0% 15.5% 10.6% 21.3% 12.2% 19.6%1966 MI impr. Vine Cran 15.0% 10.0% 10.0% 15.0% 7.0% 13.8% 4.4% 18.7% 14.5%1985 Cran 75 7.0% 7.0%1986 Cran 028 5.0%1986 SVM Cran 10.0% 10.0% 20.0% 68.0% 23.4% 31.8% 40.5% 21.7%1990 Etna 4.5% 9.6% 18.3% 15.1% 15.0%1990 Cran 09 5.0% 38.6% 19.2% 4.1%1999 Hooter 0.05% 4.3% 27.8%2000 Rog 912 4.1% 4.9% 5.1% 1.4%Share of MSU varieties 20% 10% 10% 15% 7% 13.8% 4.4% 18.7% 14.5%
Dark red kidney1960 Charlevoix 10.0% 2.0%1977 Montcalm 90.0% 95.0% 95.0% 85.0% 87.5% 75.4% 31.6% 24.7% 29.4%1990 California 1.0% 2.0% 6.4% 1.0% 5.1% 2.6%1990 Camelot 1.0% 1.0%1990 Guardian 1.0% 1.0%1994 Isles 10.0% 6.0% 6.0% 4.3%1994 Drake 5.0% 7.4% 3.5% 3.4% 2.1%1997 Red Hawk 10.2% 55.4% 69.3% 68.5%Share of MSU varieties 100% 97% 95% 95% 93.5% 81.4% 91.3% 94% 97.9%
Great Northern1992 Alpine 95.0% 20.0% 10.0%1996 Moonbean 80.0% 77.0% 17.0% 2.0%1997 Matterhorn 13.0% 82.0% 98.0% 100.0%
Other varieties 5.0% 1.0%Share of MSU varieties 95% 20% 23% 82% 98% 100%
Light red kidney1973 Sacremento 80.0% 75.0% 65.0% 20.0% 11.5% 11.4%1982 Isabella 10.0% 20.0% 15.0%1983 Linden 5.0% 2.0%1990 Horizon 5.0% 5.0%1990 Cal Early LRK 5.0% 65.0% 43.0% 61.8% 70.1% 34.6% 61.6%1991 Foxfire 5.0% 2.3% 17.5% 5.0% 7.9% 1.4%1992 Chinook 5.0% 5.0% 43.2% 19.8% 9.1% 22.4% 16.2%1998 Chinook 2000 0.9% 4.0% 21.7% 20.9%1999 Chardonnay2001 Red Kranner 0.3% 13.4%
Other varieties 5.0% 3.0% 5.0%Share of MSU varieties 10% 20% 15% 5% 43.2% 19.8% 13.1% 44.1% 37.1%
Navy1968 Seafarer 25.0% 10.0% 5.0% 2.0% 0.5% 0.1% 0.1% 0.4% 0.1%1977 Fleetwood 25.0% 2.0% 0.1% 0.2%1982 Bunsi 10.0% 5.0% 2.0%1982 Midland 10.0% 40.0% 25.0% 2.0% 0.8% 1.9% 1.5% 1.2% 0.4%1983 C-20 20.0% 10.0% 0.4%1986 Crestwood 3.0% 2.0% 5.0% 5.7% 5.5% 6.7% 4.5%1987 Mayflower 10.0% 15.0% 10.0% 10.9% 8.0% 4.0% 3.4% 3.0%
Continued

M.K. Maredia et al. / Agricultural Economics 41 (2010) 425–442 431
Table 2Continued
Year released Varietya 1985 1988 1992 1995 1998 1999 2000 2001 2002
1987 Albion 20.0% 15.0% 2.0% 3.0% 4.4% 2.8% 4.4% 2.7%1990 Avanti 15.0% 5.0% 10.8% 7.8% 5.7% 8.3% 9.4%1990 Navigator 0.9% 0.4% 8.6% 7.4% 1.9%1990 Schooner 0.5% 15.0% 20.0% 7.5% 12.2% 12.4% 11.4% 13.2%1990 Vista 5.0% 55.0% 56.3% 53.6% 52.0% 51.8% 50.2%1991 ROG 331 1.2% 3.8% 2.9% 4.7%1993 Voyager 2.0% 0.6% 1.7% 1.0% 0.6% 5.3%1996 Mackinac 1.3% 1.4% 1.7% 0.6% 0.9%
Other varieties 10.0% 2.5% 2.2% 1.6% 0.6% 1.1% 3.5%Share of MSU varieties 45% 35% 22% 12% 13.1% 9.5% 5.8% 4.4% 4%
Pinto1979 Olathe 60.0% 10.0% 5.0% 2.0%1981 Pindak 40.0% 10.0% 5.0% 2.0%1986 Othello 75.0% 65.0% 71.0% 85.5% 92.7% 98.3% 79.2% 79.7%1989 Sierra 5.0% 20.0% 5.0%1992 Aztec 5.0% 20.0% 0.1% 1.9% 0.4%1994 Focus 14.3% 10.4%1995 Vision 1.0% 0.0% 6.0% 2.9%1998 Buster 0.4% 14.9% 5.6%
Other varieties 4.4% 1.2% 1.0%Share of MSU varieties 0% 5% 25% 25% 0.1% 1.9% 0% 0% 0.4%
aMSU varieties are identified in bold letters.Source: 1985–1995: Data based on estimates of industry experts; 1998–2002: Estimates based on seed sales data provided by seed companies.
0%
20%
40%
60%
80%
100%
1985 1988 1992 1995 1998 2002
MSU varieties
Private sector varieties
Other public sector varieties
Fig. 2. Market share of bean varieties planted in Michigan from MSU, other public sector programs, and private companies (last-cross rule), 1985–2002.
interest of this assessment is to measure total benefits of beanimprovement research to Michigan, rather than the distributionof benefits among different groups.
The supply-shift parameter, K, is the most critical variable inthe measure of total benefits. It is defined as the proportionalgain in yield associated with the adoption of improved vari-eties. Ideally, the assessment of economic benefits of varietiesreleased by a research program requires estimating the yieldgains (or cost advantage) of these varieties on each and everyfarm on which they are grown. However, in practice, data and in-formation are not available to derive such site-specific estimatesof yield/cost advantage of adopted varieties. A more practical
approach, which is consistent with the goal of the analysis andavailable data, is to estimate a yield gain index attributable tothe release and adoption of newer varieties over time, based ona “with-and-without” research scenario.
Taking a similar approach as used by Pardey et al. (2006),yield gain indexes are first derived for two scenarios—an actualscenario based on yield gains resulting from the “actual” adop-tion rates of varieties in a given year (this is the “with” cropimprovement research scenario) and a counterfactual scenariobased on yield gains holding the adoption area weights constantto a base year (i.e., “without” changes in varieties). These twoscenarios are then combined to obtain the proportional gain

432 M.K. Maredia et al. / Agricultural Economics 41 (2010) 425–442
Total Sold in Michigan
Total Sold in Other States
0
5000
10000
15000
20000
25000
30000
35000
1998 1999 2000 2001 2002Year
See
d sa
les
(cw
t.)
Fig. 3. MSU varieties (released post-1985) sold in Michigan and other states: All market classes (1998–2002).
in yields (by market class) attributable to bean improvementresearch (K), as reflected in the mix toward new, higher-yieldingvarieties
Kmt = (Y a
mt − Y cmt
)/Y a
mt . (1)
The Y amt is an “actual” area-weighted index of experimental
yield in Michigan for market class m in year t (reflecting theyield gains as a result of adoption of new varieties over time),and Y c
mt is “counterfactual” base year area-weighted index ofexperimental yield for market class m in year t (reflecting nochanges in varietal adoption over time). The method used toderive these two yield indexes is described below.
4.1. Estimating potential genetic yield gains
Yield data from varietal yield trials (experimental yields)conducted on growers’ fields by the Michigan Dry Bean PRABfrom 1984 to 2002 are used to estimate the rate of geneticgains in yields of the commercially successful varieties listed inTable 1. These trials are conducted across multiple locations inbean-growing regions of Michigan under consistent manage-ment practices and with input levels (e.g., fertilizer, pesticides,labor) that are used by a typical bean grower in Michigan. Foreach market class, these trials include commercial varieties andadvanced lines contributed by both public and private breedingprograms in Michigan, as well as other states and Canada.
A number of methods are available for measuring yield gainsdue to the introduction of new varieties (Byerlee and Moya,1993; Godden, 1988). Since the trial data were incomplete (i.e.,not all these varieties were in the trials in all the years), thefollowing method was used to first estimate an adjusted yield ofeach variety in the data set (Gonzalez, 1992). The method con-sists of estimating, for each market class, the yields of variety i
in year t, in location j, using least squares:
Yijt = a + �btDt + �ciDi + �djDj + ut , (2a)
where, Dt are the dummy variables for years, Di are the dummyvariables for varieties included in the data set, Dj is the dummyvariables for locations included in the data set, ut are the errorterms, and a, b, c, and d are estimated coefficients.
This is an ideal model to estimate when there is consistencyin the locations where trials are conducted each year and the setof varieties tested in a given year is the same across locations.Such an ideal scenario was absent from the PRAB trial data setthat included 11 locations across 18 years (1984–2002). Not allthe trials were conducted in the same location each year andnot all the 11 locations were included in each yield trial. Thus,model 2a was modified as follows:
Yit = a + �btDt + �ciDi + ut , (2b)
where, Yit is the yield of variety i (average across all locations)in year t. Although this suppresses the potential genotype byenvironment interaction in yield estimation, this approach (av-eraging yields of variety i across all locations) is consistent withthe results reported each year by MSU and made public to thebean growers.
The predicted yield Yit based on the estimation of model 2b,is the adjusted mean of variety i taking into account an estimateof the year effect. This method gives the most accurate estimatesof the yield effect by adjusting yield upward or downward tocompensate for the fact that a given variety may not have beentested in high- or low-yielding years.2
2 To prevent the dummy trap, the oldest variety in a given market classwas dropped from the regression model. Thus, the estimated coefficients forincluded varieties are the yield gains or losses in relation to the oldest variety.

M.K. Maredia et al. / Agricultural Economics 41 (2010) 425–442 433
A simplified multiple regression analysis was applied usingthe predicted yields from Model 2b to estimate a vintage modelof the form
ln(Yit ) = a + �btDt + gVi + ut , (3)
where ln (Yit ) is the natural log of Yit (predicted values fromModel 2) and Vi is the year in which variety i was released(the vintage variable). This logarithmic specification gives therelative yield increase [100 dln (Yit)/dVi) = 100 g] measured asthe percent per year yield gain.
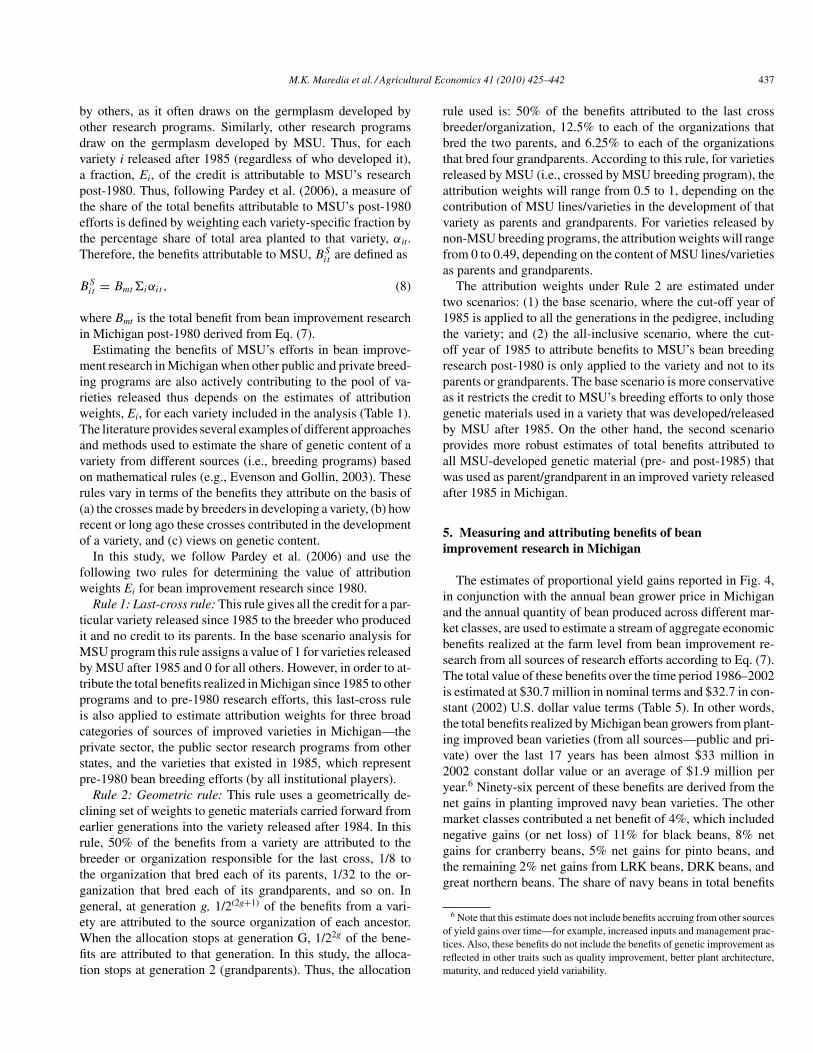
The model in Eq. (3) was estimated for each market class,using the yield trial data from 1984 to 2002. Results of the vin-tage model are reported in Table 4. Since the number of dummyvariables Dt for each year of trial is 18 (in the case of all marketclass, except great northern bean), only the F-ratio is reportedfor including Dt as a group of variables to test the hypothesisthat D1 = D2 = · · · = Dn = 0. As evident from Table 3, inall model estimations, this F-ratio is highly significant, indicat-ing considerable year-to-year variation in average yields acrossmarket classes.
The results of the regression analysis reported in Table 4indicate that the rate of yield gain due to the release of newervarieties (i.e., genetic improvement) varies from −0.2% peryear for black beans to 0.7% per year for navy beans.3 Thisaverage yield gain also includes the effects of yield declines inolder varieties, due to the loss of disease resistance (if any) orother genetic degradation.
The estimated yield gains are significantly different fromzero at the 1 or 5% test level for all market classes except greatnorthern bean. The positive yield gains in the range of 0.3 to0.7% per year for most market classes suggest that investmentsin bean breeding research (by all the programs—private, pub-lic, in-state, and out-of-state) have together been successful indeveloping newer varieties over time, which, on average, yieldhigher than earlier varieties released in Michigan.
The variety release information in Table 1 and results of thevintage model analysis indicate that for navy beans, the gain inyield potential from varieties released from 1968 to 1996 aver-aged 0.7% per year (or 14 lbs/acre/year); followed by cranberrybeans (1964 to 1999, 0.4% per year, or 8 lbs/acre/year), DRKbeans (1960 to 1997, 0.3% per year or 5 lbs/acre/year), LRKbeans (1973 to 2001, 0.6% per year or 13 lbs/acre/year), andpinto beans (1979 to 1998, 0.5% per year or 11 lbs/acre/year)—all significantly different from zero (Table 4). The only marketclass experiencing a negative yield gain (or yield losses) due tothe release of newer varieties was black beans (1975 to 1999,
3 The estimated average industry bean yield growth rate (across all marketclasses) is 1.18%/year in Michigan over the last three decades (1966–1970to 1996–2000). The estimated yield gains using the vintage model are lowerthan the observed industry yield growth rates across all market classes. Thisis expected since the yield gains estimated in Table 4 are average gains due togenetic improvement and does not include other sources of yield growth (e.g.,inputs, agronomic practices, and improved management).
0.2% per year or 5 lbs/acre/year). This is because the oldest va-riety in the data set—T-39 (released in 1975) is still the highestyielding variety.
Many economists have used these estimates of average yieldgains (percentage gain per year) as a measure of K in estimatingthe GARB (Byerlee and Traxler, 1995; Maredia and Byerlee,2000). This is an appropriate measure when dealing with astream of new varieties, all emanating from a single source ofinstitutional research investments (e.g., a regional or nationalpublic breeding program). However, when farmers have accessto new varieties from multiple institutional sources (public,private, national, regional, or international), as in the case ofMichigan bean industry, or when dealing with estimating theeconomic benefits of research investments for a specific timeperiod, as is the objective of this study, this estimate (aver-age percentage yield gains per year) does not reflect the truecounterfactual. Thus, we use a modified approach to estimatethe yield gains. First, we estimate the yield gains attributed tonew varieties under a “with” and “without” research scenar-ios to calculate the total benefits of crop improvement researchin Michigan. Then, we partition these benefits by three insti-tutional sources—MSU bean breeding program, private sectorand public research programs in other states. The time periodover which the research investments are being assessed is 1980onward (with new bean varieties released from these invest-ments after 1985). However, since in any given year, farmersplant varieties from diverse sources as well as diverse time peri-ods (old and new), the total benefits realized in Michigan since1985 are also partitioned between those that can be attributedto pre-1980 and post-1980 research efforts.
4.2. Estimating yield gain indexes—“with” and “without”research scenario
For the research programs to generate economic benefits, thepositive yield gains evident in the yield trial data over the pastfew decades need to be reflected in farmers’ fields through adop-tion and replacement of older with newer varieties. In terms ofestimating the economic benefits of breeding research, one mustbe cognizant of the fact that the actual yield gains (or losses)due to genetic improvement realized on-farm over time may beless than the observed potential average yield gains (or losses)reported in Table 4. This is because individual farmers, as wellas farmers in aggregate, usually plant a mosaic of varietiesreflecting different ecological niches, diversification to spreadrisks, as well as normal differences in adoption lags amongfarmers. To reflect the existence of these factors, which canpotentially reduce the yield gains realized on farmers’ fields,average weighted mean yields, ya
mt for t = 1985–2002 werecalculated for each market class m as described in Eq. (4)
yamt = �i(Yitαit ), (4)
where Yit is either the observed yields of variety i in trial year t(Yit) or the predicted yields from Eq. (2) (Yit ) for years in which
434 M.K. Maredia et al. / Agricultural Economics 41 (2010) 425–442
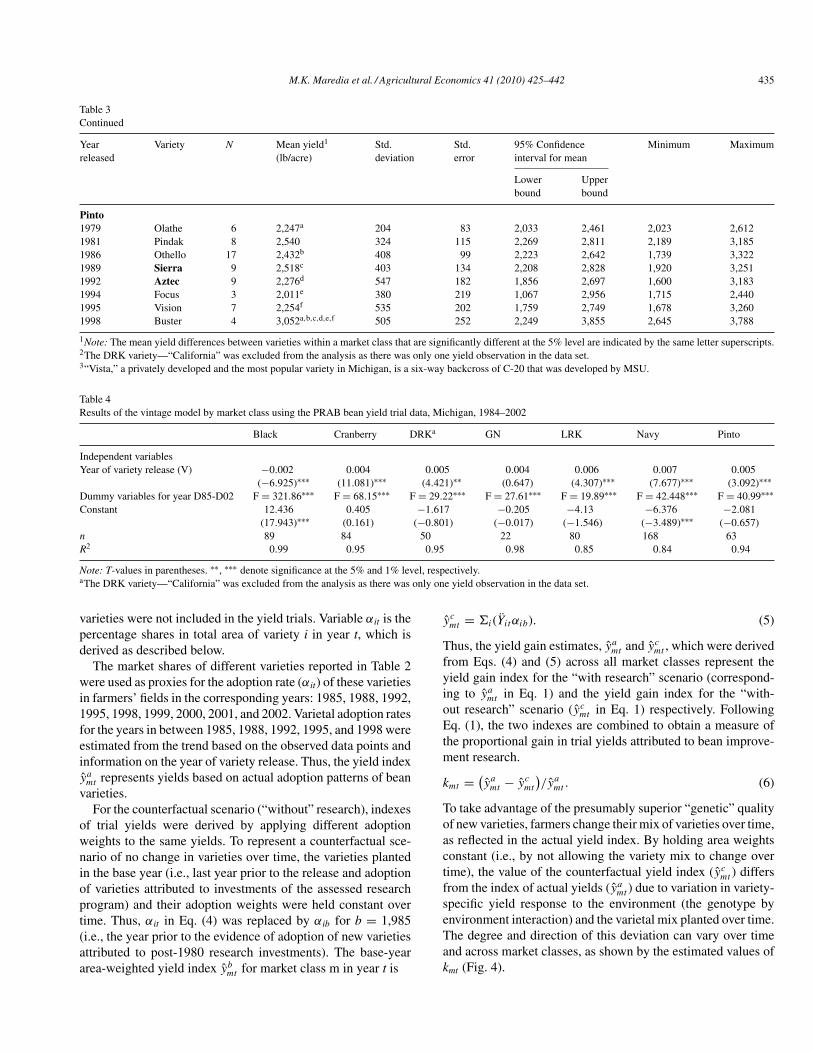
Table 3Estimated mean yields (lb/acre) and other statistics of bean varieties based on the PRAB bean yield trial data, Michigan, 1984–2002
Year Variety N Mean yield1 Std. Std. 95% Confidence Minimum Maximumreleased (lb/acre) deviation error interval for mean
Lower Upperbound bound
Black1975 T-39 19 2,432 389 89 2,244 2,620 1,778 3,1511980 Midnight 19 2,460 389 89 2,272 2,647 1,806 3,1791982 Black Magic 11 2,550 274 83 2,366 2,734 2,125 3,0621982 Domino 7 2,421 490 185 1,968 2,874 1,876 3,1841989 Black Hawk 13 2,371 419 116 2,117 2,624 1,685 3,0571989 Black Jack 11 2,300 462 139 1,990 2,611 1,658 3,0301997 Onyx 4 2,150 634 317 1,142 3,158 1,651 3,0241999 Jaguar 5 2,395 573 256 1,684 3,107 1,809 3,117
Cranberry1964 Taylor 19 2,053a,c 341 78 1,888 2,217 1,386 2,8201966 MI impr. Vine Cran 18 2,187b 351 83 2,013 2,362 1,518 2,9521985 Cran 75 6 2,304 326 133 1,962 2,646 1,990 2,7161986 Cran 028 2 2,023 56 39 1,522 2,524 1,984 2,0621986 SVM Cran 7 2,306 389 147 1,947 2,665 1,611 2,7671990 Etna 11 2,494a,b 400 121 2,225 2,763 1,803 3,2371990 Cran 09 11 2334c 335 101 2,110 2,559 1,932 3,0161999 Hooter 6 2,294 337 138 1,941 2,648 1,753 2,7792000 ROG 912 4 2247 266 133 1,825 2,670 2,048 2,639
Dark red kidney2
1960 Charlevoix 2 1,790a,b 373 264 (1,564) 5,143 1,526 2,0541977 Montcalm 19 2,014c,d 368 84 1,837 2,192 1,399 2,6271990 Camelot 3 2,855a,c,e,f 208 120 2,339 3,372 2,638 3,0531990 Guardian 3 2,801b,d,g,h 208 120 2,285 3,318 2,584 2,9991994 Drake 3 2,289 393 227 1,313 3,264 1,846 2,5951994 Isles 9 2,047e,g 308 103 1,810 2,283 1,499 2,5141997 Red Hawk 11 2,110f,h 357 108 1,870 2,350 1,587 2,792
Great Northern1992 Alpine 9 2,207 442 147 1,867 2,546 1,611 3,0071996 Moonbean 6 2,040 312 127 1,713 2,368 1,577 2,4041997 Matterhorn 7 2,426 502 190 1,961 2,890 1,969 3,423
Light red kidney1973 Sacremento 15 2,124g 396 102 1,905 2,343 1,562 2,9311982 Isabella 8 2,073e 431 152 1,713 2,433 1,499 2,7531983 Linden 5 1,897f,h,k 275 123 1,555 2,239 1,567 2,2781990 Horizon 7 2,722a,b,c,d,e,f,g 412 156 2,340 3,103 2,163 3,3021990 Cal Early LRK 16 2,087a 436 109 1,854 2,319 1,314 2,9491991 Foxfire 10 2,262d 379 120 1,990 2,533 1,724 2,8941992 Chinook 7 2,228b 428 162 1,832 2,624 1,701 2,8711998 Chinook 2000 5 2,084c 426 191 1,556 2,613 1,494 2,6811999 Chardonnay 4 2,552h 304 152 2,067 3,036 2,269 2,9832001 Red Kranner 3 2,507k 331 191 1,686 3,329 2,138 2,777
Navy1968 Seafarer 14 2,019a,b,c,d,e,f,g,h 376 101 1,802 2,236 1,484 2,9581977 Fleetwood 8 2,549d,j 441 156 2,181 2,918 1,904 3,3771982 Bunsi 10 2,518b,q 392 124 2,238 2,798 1,882 3,3551982 Midland 13 2,265k,l 383 106 2,034 2,497 1,710 3,1831983 C-20 7 2,533c,m 311 117 2,246 2,821 2,006 2,9321986 Crestwood 10 2,259n,o 352 111 2,007 2,510 1,795 2,9531987 Albion 17 2,173j,m,p,q,r,s,t,u 407 99 1,963 2,382 1,608 3,0821987 Mayflower 17 2,486e,r 378 92 2,292 2,680 1,904 3,3581990 Avanti 15 2,513a,p 402 104 2,290 2,736 1,928 3,3821990 Navigator 8 2,267v 405 143 1,928 2,605 1,806 2,9631990 Schooner 13 2,630g,k,n,t,v,w 429 119 2,371 2,889 2,067 3,5211990 Vista3 13 2,605h,l,o,u,x 427 118 2,347 2,863 2,022 3,4761991 ROG 331 6 2,571f,s 425 174 2,125 3,017 2,028 3,1851993 Voyager 8 2,245w,x 446 158 1,872 2,617 1,687 3,1281996 Mackinac 9 2,305 380 127 2,013 2,596 1,853 3,011
Continued
M.K. Maredia et al. / Agricultural Economics 41 (2010) 425–442 435
Table 3Continued
Year Variety N Mean yield1 Std. Std. 95% Confidence Minimum Maximumreleased (lb/acre) deviation error interval for mean
Lower Upperbound bound
Pinto1979 Olathe 6 2,247a 204 83 2,033 2,461 2,023 2,6121981 Pindak 8 2,540 324 115 2,269 2,811 2,189 3,1851986 Othello 17 2,432b 408 99 2,223 2,642 1,739 3,3221989 Sierra 9 2,518c 403 134 2,208 2,828 1,920 3,2511992 Aztec 9 2,276d 547 182 1,856 2,697 1,600 3,1831994 Focus 3 2,011e 380 219 1,067 2,956 1,715 2,4401995 Vision 7 2,254f 535 202 1,759 2,749 1,678 3,2601998 Buster 4 3,052a,b,c,d,e,f 505 252 2,249 3,855 2,645 3,788
1Note: The mean yield differences between varieties within a market class that are significantly different at the 5% level are indicated by the same letter superscripts.2The DRK variety—“California” was excluded from the analysis as there was only one yield observation in the data set.3“Vista,” a privately developed and the most popular variety in Michigan, is a six-way backcross of C-20 that was developed by MSU.
Table 4Results of the vintage model by market class using the PRAB bean yield trial data, Michigan, 1984–2002
Black Cranberry DRKa GN LRK Navy Pinto
Independent variablesYear of variety release (V) −0.002 0.004 0.005 0.004 0.006 0.007 0.005
(−6.925)∗∗∗ (11.081)∗∗∗ (4.421)∗∗ (0.647) (4.307)∗∗∗ (7.677)∗∗∗ (3.092)∗∗∗Dummy variables for year D85-D02 F = 321.86∗∗∗ F = 68.15∗∗∗ F = 29.22∗∗∗ F = 27.61∗∗∗ F = 19.89∗∗∗ F = 42.448∗∗∗ F = 40.99∗∗∗Constant 12.436 0.405 −1.617 −0.205 −4.13 −6.376 −2.081
(17.943)∗∗∗ (0.161) (−0.801) (−0.017) (−1.546) (−3.489)∗∗∗ (−0.657)n 89 84 50 22 80 168 63R2 0.99 0.95 0.95 0.98 0.85 0.84 0.94
Note: T-values in parentheses. ∗∗, ∗∗∗ denote significance at the 5% and 1% level, respectively.aThe DRK variety—“California” was excluded from the analysis as there was only one yield observation in the data set.
varieties were not included in the yield trials. Variable αit is thepercentage shares in total area of variety i in year t, which isderived as described below.
The market shares of different varieties reported in Table 2were used as proxies for the adoption rate (αit) of these varietiesin farmers’ fields in the corresponding years: 1985, 1988, 1992,1995, 1998, 1999, 2000, 2001, and 2002. Varietal adoption ratesfor the years in between 1985, 1988, 1992, 1995, and 1998 wereestimated from the trend based on the observed data points andinformation on the year of variety release. Thus, the yield indexya
mt represents yields based on actual adoption patterns of beanvarieties.
For the counterfactual scenario (“without” research), indexesof trial yields were derived by applying different adoptionweights to the same yields. To represent a counterfactual sce-nario of no change in varieties over time, the varieties plantedin the base year (i.e., last year prior to the release and adoptionof varieties attributed to investments of the assessed researchprogram) and their adoption weights were held constant overtime. Thus, αit in Eq. (4) was replaced by αib for b = 1,985(i.e., the year prior to the evidence of adoption of new varietiesattributed to post-1980 research investments). The base-yeararea-weighted yield index yb
mt for market class m in year t is
ycmt = �i(Yitαib). (5)
Thus, the yield gain estimates, yamt and yc
mt , which were derivedfrom Eqs. (4) and (5) across all market classes represent theyield gain index for the “with research” scenario (correspond-ing to ya
mt in Eq. 1) and the yield gain index for the “with-out research” scenario (yc
mt in Eq. 1) respectively. FollowingEq. (1), the two indexes are combined to obtain a measure ofthe proportional gain in trial yields attributed to bean improve-ment research.
kmt = (ya
mt − ycmt
)/ya
mt . (6)
To take advantage of the presumably superior “genetic” qualityof new varieties, farmers change their mix of varieties over time,as reflected in the actual yield index. By holding area weightsconstant (i.e., by not allowing the variety mix to change overtime), the value of the counterfactual yield index (yc
mt ) differsfrom the index of actual yields (ya
mt ) due to variation in variety-specific yield response to the environment (the genotype byenvironment interaction) and the varietal mix planted over time.The degree and direction of this deviation can vary over timeand across market classes, as shown by the estimated values ofkmt (Fig. 4).

436 M.K. Maredia et al. / Agricultural Economics 41 (2010) 425–442
(0.20)
(0.15)
(0.10)
(0.05)
-
0.05
0.10
0.15
0.20
0.25
1985 1986 1987 1988 1989 1990 1991 1992 1993 1994 1995 1996 1997 1998 1999 2000 2001 2002
Pro
po
rtio
na
l yie
ld g
ain
sBlack
Navy
DRK
LRK
Pinto
Cranberry
Fig. 4. Estimated proportional yield gains (losses) due to bean improvement research by market class, 1985–2002.
The estimated values of kmt, which was derived from Eq. (6)for each market class, were used to measure the proportionalgains (and loss) in production, holding inputs constant, dueto varietal improvement post-1980. These estimated values aremultiplied by the actual value of production for a given marketclass to derive an estimate of the value of production foregone,if the new varieties (released after 1985) were not adopted.In other words, the total benefits from varietal improvementpost-1980 for market class m in year t can be expressed as
Bmt = kmtPtQmt . (7)
Note that the value of kmt is expected to be positive in mostyears. However, for some market classes and for some years,the index of “actual” yields was observed to be less than the“counterfactual” yield index, giving an estimated proportionalyield gain less than zero (Fig. 4). This is especially the case withblack and LRK bean market classes. This implies that farmers inMichigan would have been better off planting older than newervarieties in those years. Indeed, the high varietal age observedfor the black bean market class and the negative yield gainsreported in Table 4 confirm the relatively higher yields of oldervarieties, especially T-39. The popularity of T-39 stems from itssteady or consistent performance that is one of the key criteriafor growers producing black beans. The other major point infavor of T-39 is that it is promoted by one of the elevators whohas built an export business around selling this specific varietyto Mexico where it is especially preferred because of its sizeand shape. One of the reasons why none of the MSU blackbean varieties has gained much adoption until 2002 is that theMSU breeding program has specifically focused on improvingplant architecture, disease resistance, and canning quality—allof which came at some cost to yield. However, despite higheryields, farmers in Michigan have slowly replaced T-39 withother newer varieties, which means that gradually new marketsthat value attributes of those newer varieties are being developed
in black bean market class.4 However, since yield is the onlyindicator of benefits of new varieties used in this study and tobe conservative and consistent, the negative values of the yieldgain index in any given year are included in the total benefitcalculations across all market classes. Therefore, the estimatedbenefits due to genetic improvement are net of potential yieldlosses due to adoption of newer varieties in some years andmarket classes.5
4.3. Attribution of benefits to MSU’s bean breeding program
One of the main objectives of this study is to assess thebenefits generated by MSU’s bean improvement research ef-forts post-1980 (and reflected in varieties released after 1985).As expected, MSU’s bean improvement research (or any otherprogram’s research efforts) is not independent of research done
4 The trend toward adopting varieties other than T-39 may be increasing morein recent years due to changing preferences of growers (who are now demandingvarieties with plant architecture that allows them to direct harvest), canners(who need quality), and seed producers (who want to produce seed locally toreduce costs rather than the traditional practice of producing seeds in westernstates such as Idaho). All these changes imply that traits on which MSU beanbreeding program has focused for quite some time (i.e., architecture, canningquality, and disease resistance) are becoming economic traits in black beans inMichigan. A recently registered new MSU variety “Zorro” holds promise inthis respect (Kelly et al., 2009).
5 To ensure that the results of this study are robust and not affected negativelyby this approach, the analysis was done both by including and excluding theblack beans market class, which had negative values for most of the years. Thevalue of total benefits estimated increased by about $3 million in total—mostof it in the class of varieties released pre-1986. There was no significant changein the value of benefits accrued to MSU breeding program for the time frameof benefit estimation—1986–2002—when the negative values were excluded.Thus, the results and conclusions of this study remained unchanged whetherthe negative values were included or excluded. To err on the side of beingconservative, we have maintained the approach of including negative values inthe estimates of total benefits.
M.K. Maredia et al. / Agricultural Economics 41 (2010) 425–442 437
by others, as it often draws on the germplasm developed byother research programs. Similarly, other research programsdraw on the germplasm developed by MSU. Thus, for eachvariety i released after 1985 (regardless of who developed it),a fraction, Ei, of the credit is attributable to MSU’s researchpost-1980. Thus, following Pardey et al. (2006), a measure ofthe share of the total benefits attributable to MSU’s post-1980efforts is defined by weighting each variety-specific fraction bythe percentage share of total area planted to that variety, αit.Therefore, the benefits attributable to MSU, BS
it are defined as
BSit = Bmt�iαit , (8)
where Bmt is the total benefit from bean improvement researchin Michigan post-1980 derived from Eq. (7).
Estimating the benefits of MSU’s efforts in bean improve-ment research in Michigan when other public and private breed-ing programs are also actively contributing to the pool of va-rieties released thus depends on the estimates of attributionweights, Ei, for each variety included in the analysis (Table 1).The literature provides several examples of different approachesand methods used to estimate the share of genetic content of avariety from different sources (i.e., breeding programs) basedon mathematical rules (e.g., Evenson and Gollin, 2003). Theserules vary in terms of the benefits they attribute on the basis of(a) the crosses made by breeders in developing a variety, (b) howrecent or long ago these crosses contributed in the developmentof a variety, and (c) views on genetic content.
In this study, we follow Pardey et al. (2006) and use thefollowing two rules for determining the value of attributionweights Ei for bean improvement research since 1980.
Rule 1: Last-cross rule: This rule gives all the credit for a par-ticular variety released since 1985 to the breeder who producedit and no credit to its parents. In the base scenario analysis forMSU program this rule assigns a value of 1 for varieties releasedby MSU after 1985 and 0 for all others. However, in order to at-tribute the total benefits realized in Michigan since 1985 to otherprograms and to pre-1980 research efforts, this last-cross ruleis also applied to estimate attribution weights for three broadcategories of sources of improved varieties in Michigan—theprivate sector, the public sector research programs from otherstates, and the varieties that existed in 1985, which representpre-1980 bean breeding efforts (by all institutional players).
Rule 2: Geometric rule: This rule uses a geometrically de-clining set of weights to genetic materials carried forward fromearlier generations into the variety released after 1984. In thisrule, 50% of the benefits from a variety are attributed to thebreeder or organization responsible for the last cross, 1/8 tothe organization that bred each of its parents, 1/32 to the or-ganization that bred each of its grandparents, and so on. Ingeneral, at generation g, 1/2(2g+1) of the benefits from a vari-ety are attributed to the source organization of each ancestor.When the allocation stops at generation G, 1/22g of the bene-fits are attributed to that generation. In this study, the alloca-tion stops at generation 2 (grandparents). Thus, the allocation
rule used is: 50% of the benefits attributed to the last crossbreeder/organization, 12.5% to each of the organizations thatbred the two parents, and 6.25% to each of the organizationsthat bred four grandparents. According to this rule, for varietiesreleased by MSU (i.e., crossed by MSU breeding program), theattribution weights will range from 0.5 to 1, depending on thecontribution of MSU lines/varieties in the development of thatvariety as parents and grandparents. For varieties released bynon-MSU breeding programs, the attribution weights will rangefrom 0 to 0.49, depending on the content of MSU lines/varietiesas parents and grandparents.
The attribution weights under Rule 2 are estimated undertwo scenarios: (1) the base scenario, where the cut-off year of1985 is applied to all the generations in the pedigree, includingthe variety; and (2) the all-inclusive scenario, where the cut-off year of 1985 to attribute benefits to MSU’s bean breedingresearch post-1980 is only applied to the variety and not to itsparents or grandparents. The base scenario is more conservativeas it restricts the credit to MSU’s breeding efforts to only thosegenetic materials used in a variety that was developed/releasedby MSU after 1985. On the other hand, the second scenarioprovides more robust estimates of total benefits attributed toall MSU-developed genetic material (pre- and post-1985) thatwas used as parent/grandparent in an improved variety releasedafter 1985 in Michigan.
5. Measuring and attributing benefits of beanimprovement research in Michigan
The estimates of proportional yield gains reported in Fig. 4,in conjunction with the annual bean grower price in Michiganand the annual quantity of bean produced across different mar-ket classes, are used to estimate a stream of aggregate economicbenefits realized at the farm level from bean improvement re-search from all sources of research efforts according to Eq. (7).The total value of these benefits over the time period 1986–2002is estimated at $30.7 million in nominal terms and $32.7 in con-stant (2002) U.S. dollar value terms (Table 5). In other words,the total benefits realized by Michigan bean growers from plant-ing improved bean varieties (from all sources—public and pri-vate) over the last 17 years has been almost $33 million in2002 constant dollar value or an average of $1.9 million peryear.6 Ninety-six percent of these benefits are derived from thenet gains in planting improved navy bean varieties. The othermarket classes contributed a net benefit of 4%, which includednegative gains (or net loss) of 11% for black beans, 8% netgains for cranberry beans, 5% net gains for pinto beans, andthe remaining 2% net gains from LRK beans, DRK beans, andgreat northern beans. The share of navy beans in total benefits
6 Note that this estimate does not include benefits accruing from other sourcesof yield gains over time—for example, increased inputs and management prac-tices. Also, these benefits do not include the benefits of genetic improvement asreflected in other traits such as quality improvement, better plant architecture,maturity, and reduced yield variability.

438 M.K. Maredia et al. / Agricultural Economics 41 (2010) 425–442
Table 5Estimated benefits from bean improvement research in Michigan and theirattribution to different institutional sources and time period (in million 2002U.S. dollars)
Attribution to specific Institutional attribution Totaltime period ofvarietal release MSU Private + Othera
Other (unidentified)public
Last cross rule: all credit to last cross (million 2002 US $)Pre-1986b $3.62 (11%) $1.34 $3.621986–90 $2.93 Not est. $26.571991–95 $0.12 Not est. $0.871996–02 $0.34 Not est. $0.31All (1986–02) $3.39 $25.05 $1.34 $32.71
(11%) (77%) (4%) (100%)
Geometric rule 1: credit only to post-1985 MSU developed germplasm in thepedigreec (million 2002 US $)Pre-1986b $6.46 (11%) $1.34 $3.621986–90 2.58 Not est. $26.571991–95 0.16 Not est. $0.871996–02 0.25 Not est. $0.31All (1986–02) $2.93 $24.8 $1.34 $32.71
(9%) (76%) (4%) (100%)
Geometric rule 2: credit to all (pre-1986 and post-1985) MSU developedgermplasm in the pedigreed (million 2002 US $)Pre-1986b $3.62 (11%) $1.34 $3.621986–90 10.74 Not est. $26.571991–95 0.12 Not est. $0.871996–02 0.32 Not est. $0.31All (1986–02) $11.18 $16.57 $1.34 $32.71
(34%) (51%) (4%) (100%)
Source: Authors’ calculations.aBenefits of about $1.34 million are not attributed specifically to any of theinstitutional sources as they appear as “other varieties” in the market share datacollected by the authors.bThese include MSU, other public and private sector varieties released before1986 but still planted in Michigan from 1986 to 2002. Fifty percent of the valueof these benefits is attributed to pre-1986 MSU released varieties.cThis category includes varieties released after 1985 that contain in their pedi-grees MSU lines/varieties released only after 1985 (the conservative scenario).dThis category includes varieties released after 1985 that contain in their pedi-grees MSU lines/varieties released before and after 1985.
is proportionately higher than its average share in total areaplanted in Michigan over the period 1986–2002 (60%). This ismainly due to the negative gains in black bean market class,which was the second biggest market class in Michigan duringthe period of analysis (average area planted to black beans in1986–2002 was 20% of total area).7
How much of these total benefits realized by Michigan farm-ers can be attributed to: (a) MSU’s bean improvement researchprogram; and (b) research efforts over different time frames,are key questions addressed by this study. Using the two attri-bution rules described above and the two subscenarios underRule 2, the total benefits from bean improvement research areattributed to MSU and non-MSU bean research programs and
7 In the last five years, black beans have become the largest market class inMichigan.
four different time periods (pre-1985, 1986–1990, 1991–1995,and 1996–2002) as indicated in Table 5.
Out of a total $32.71 million benefits realized in Michigan,about $1.34 million (4%) are associated with “other varieties”that had no identifiable institutional source (Table 5). Also, morethan $3.6 million of the benefits realized during 1986–2002 arefrom varieties that were released prior to 1985 (Table 5). Thisrepresents a sizable portion of total benefits (11%) and confirmsthe durability and long time frame often conceptualized forreaping the benefits of crop varietal technology, especially ofself-pollinated crops like beans. Further partitioning of thesebenefits reveals that about 50% of the benefits from pre-1985varieties are attributed to MSU. However, since the focus ofthis study is to assess the impact of bean research post-1980, anexact breakdown of this estimate by MSU versus non-MSU isnot attempted in this article.
Based on the last-cross rule, 11% and 77% of the total bene-fits realized from 1986 to 2002 (a value of $32.75 million) areattributed to post-1980 bean improvement efforts by MSU andnon-MSU (private companies and other public sector) researchprograms, respectively. Of the total $3.39 million benefits at-tributed to MSU per the last cross rule, a majority ($2.93 millionor 86%) are associated with varieties released in the earlier timeperiod 1986–1990. Varieties released by MSU in 1991–1995and 1996–2002 have contributed $0.12 (4%) and $0.34 (10%)million, respectively to the total realized benefits up to 2002($3.39 million).
As a proportion of total benefits realized in a given marketclass, MSU’s contribution has been the greatest in small nichemarket classes in Michigan, namely kidney beans (more than40% of benefits in this market class are attributed to MSU vari-eties) and great northern bean (100% of benefits are attributedto MSU varieties).8 As expected, the private sector has beenmore active in other larger market classes in Michigan such asnavy and black beans, where MSU’s contribution to net benefitsis only about 10% for navy beans and 4% for black beans.
When the benefits are attributed to different institutions perthe geometric rule 1 (that gives credit only to post-1985 devel-oped germplasm in the pedigree), the share of MSU in totalbenefits (9%) and attribution of these benefits to different timeperiods changes only slightly from the last cross rule benefits(Table 5). However, if credit is given to MSU for all the ge-netic materials (pre- and post-1985) used in the pedigree ofa variety released after 1985, the attributed benefits to MSUincreases to $11.18 million or 34% of total benefits realizedbetween 1986 and 2002. Again, most of these benefits ($10.74million or 96%) are attributed to varieties released between1986 and 1990 (Table 5). The high estimates for benefits underthis second scenario of the geometric rule is basically due toa few commercially successful varieties (post-1985) in navy
8 The small size of these market classes is reflected in the combined averageshare of these three market classes (LRK, DRK, and great northern) in totalarea planed to beans in Michigan, which was less than 10% over the period ofanalysis.
M.K. Maredia et al. / Agricultural Economics 41 (2010) 425–442 439
bean market class derived from an MSU variety C-20, whichwas released in 1983. As a parent, this variety has formed thegenetic basis of several post-1985 navy bean varieties in Michi-gan and elsewhere in the United States.9 About 75% of theincremental benefits estimated (about $8.5 million) under thegeometric rule can be attributed to this one MSU variety, whichwas used in the form of parent material in other commerciallyimportant navy bean varieties after 1985 (namely, Mayflower,Vista, Avanti, Huron, and Mackinac). In fact, Vista, which isone of the most popular navy bean variety in Michigan sincelate 1990, is a six backcross of variety C-20. The success of thisone variety, which was released in 1990, also explains why theperiod 1985–1990 remains the most productive time period. Interms of attribution of benefits, varieties released in 1985–1990period contributed more than 88% (under geometric rule 1) andas much as 96% (under geometric rule 2) of the estimated totalMSU benefits.
Lack of full pedigree information for several private varietiesprevented the authors from estimating the attribution of the non-MSU benefits to either private or other public sector programsunder the geometric rule. However, based on the information ofthe last cross, the pedigree information on some non-MSU va-rieties and discussions with bean breeders on the likely contentof the parent materials of some private varieties, it is postulatedthat at least one-half of these benefits can be attributed to otherpublic research programs. Thus, if credit is given not only tothe last cross but also to the source of the genetic materials usedas parent and grandparents, the share of public sector researchefforts (MSU plus other programs) in total benefits, as per thegeometric rule, will be at least two-thirds. This result is differ-ent from the last-cross rule, where a majority of benefits undernon-MSU category are attributed to private varieties releasedin Michigan post-1985 (about $23.8 million out of a total of$25 million reported in Table 5).
6. Estimating returns to investments by MSU beanimprovement research program
During 1976 to 2002, it is estimated that MSU has investedan average of $218,000 per year (in 2002 dollar value) on beanimprovement research. Given the estimated value of benefits
9 This is an interesting example of the gains to a private sector from publicsector research in an era when it was not a mainstream practice to protect allpublic sector varieties under the plant variety protection (PVP) law. One ofthe most popular navy bean varieties in Michigan—Vista—is a private sectordeveloped variety and was a six back cross from MSU developed variety C-20.Since this variety was not protected back in the early 1980s, MSU lost controlof that genetics (and claim to any benefits from it). However, this would bevery unlikely in today’s environment, where most public sector varieties areprotected under the Plant Breeders Rights in the United States. The PBR allowsany breeding program to cross freely with a private variety protected by thelaw. But if a breeder chooses to make a back cross he/she needs to contact theowner—who may or may not agree. The rule of thumb is that one back crossis OK; but it is best to check with the owner as that practice is getting close tothe realm of essentially derived varieties and can be challenged under the plantvariety protection law.
realized in Michigan that can be attributed to MSU, an impor-tant follow-up question addressed by this study is: how do therealized benefits to date compare with these public investmentsin bean improvement research at MSU since the late 1970s?
Based on discussions with the bean breeder, it was ascer-tained that it takes seven years of research to develop a newvariety and three more years to bring that variety to the market.Thus a 10-year lag is assumed between the start of research andthe time when it is available for planting in a grower’s field. Thestream of costs (1976–1992) and realized benefits (1986–2002)valued in constant 2002 U.S. dollars were compounded forwardusing a real discount rate of 4% per annum, which is consis-tent with prior benefit-cost analyses of long-term research andother public sector investments (Bazelon and Smetters, 2001;Maredia and Raitzer, 2006; Pardey et al., 2006). Within therange of discount rates used for long-term public sector invest-ments by governments in industrialized countries, a 4% perannum rate is a conservative estimate.10
Table 6 reports the present value of the stream of estimatedcosts and lower-bound estimates of benefits of MSU’s bean im-provement research program under three different scenarios ofattribution and the four time periods of attribution reported inTable 5. The estimated benefits are considered “lower-bound”because all the benefits from the investments in MSU beanbreeding program, especially those realized in other states andbenefits to be realized after 2002 (from varieties released be-tween 1986–2002 but which will continue to be grown for manyyears to come) are not included in this analysis. Thus, the esti-mated lower-bound benefit cost ratio under the last-cross rule,geometric rule 1 (based strictly on post-1985 parent materi-als), and geometric rule 2 (based on pre- and post-1985 parentmaterials) for the entire time period of analysis (1986–2002)is 0.6, 0.6, and 2.0, respectively. In other words, in the all in-clusive scenario of geometric rule 2, past investment of $1 byMSU is estimated to have realized $2.0 in return from 1986to 2002. However, when the credit is restricted to last-crossrule or the use of post-1985 developed MSU genetic materi-als in the pedigree of varieties planted in Michigan (geometricrule 1), the estimated realized benefits in Michigan fall shortby 40 cents, for every dollar invested from 1976–1992. Notsurprisingly, the benefit/cost ratio is more than 1 under all theattribution rules when benefits are restricted to the first five-year period—1986–1990 (Table 6). Following the pattern ofestimated benefits in Table 5, the marginal returns on eachadditional dollar invested in bean improvement research byMSU over the two five-year periods since 1990 have declined.
10 The discount rates used in benefit-cost analyses for long-term invest-ments typically range from 2% to 3% (e.g., recommended by the U.S. Officeof Management and Budget: http://www.whitehouse.gov/omb/circulars/a094/a94_appx-c.html), 2.5–3.0% (e.g., used by provincial governments in Canada),to 3.5% (recommended by the U.K. Treasury Department: http://greenbook.treasury.gov.uk/chapter05.htm#discounting). As the real discount rate is essen-tially a risk- and inflation-free estimate of the long-term opportunity cost ofcapital, a good proxy is also the interest rate on a 10-year U.S. GovernmentBond, less the inflation rate. This is also in the order of 2–3%.

440 M.K. Maredia et al. / Agricultural Economics 41 (2010) 425–442
Table 6Comparison of costs and benefits of MSU’s bean improvement research underdifferent scenarios of attribution
Benefits attribution to specifictime period of varietal release
1986–90 1991–95 1996–02 1986–02
Present value of costsassociated with a givenbenefit estimation timeframe(million 2002 U.S. dollars)a
2.98 2.68 2.86 6.89
Present value of realized benefits under different scenarios of attribution—realized up to 2002 (million 2002 U.S. dollars)
Last-cross rule 3.9 0.14 0.36 4.4Geometric rule 1 (only
post-1985)3.4 0.12 0.27 3.8
Geometric rule 2 (pre-1986and post-1985)
13.6 0.14 0.34 14.1
Benefit-cost ratios (lower-bound estimates):Last-cross rule 1.3 0.05 0.12 0.6Geometric rule 1 (only
post-1985)1.1 0.04 0.09 0.6
Geometric rule 2 (pre-1986and post-1985)
4.6 0.05 0.12 2.0
Source: Authors’ calculations.aA 10-year lag (comprising seven years for research and three years for seedmultiplication) is assumed between the program costs and the start of thebenefit stream. In other words, the estimated costs begin 10 years before thestart of the benefit stream and end three years before the end of benefit period.Thus for 1986–1990, the breeding program costs correspond to 1977–1982; for1991–1995, they correspond to 1981–1987; for 1996–2002 they correspond to1986–1992; and for 1986–2002, they correspond to 1977–1992.
However, it should be noted that for these two time periods thetimeframe for estimated benefits is relatively shorter (11 and6 years, respectively) than for the first time period (16 years).The declining marginal benefits over time can be partially at-tributed to the declining area under beans in Michigan and thedeclining real price of beans—both of which have negativelyaffected the size of the bean industry in Michigan over the past16–20 years.
Note also that the benefit-cost ratios reported in Table 6 arenot absolute values of indicators of returns to MSU’s invest-ments from 1980 to 1996. As a public research program, theoutputs of MSU’s bean breeding program are available to allthe farmers (in- and out-of-state) and research programs (pub-lic, private, domestic, and international). In this study, we havemade no attempt to include all of the potential outputs and ben-efits of MSU’s investments (that may be reflected in traits otherthan crop yield), nor measured the benefits accrued to farmersand researchers outside Michigan (i.e., spillovers to other statesand countries). As indicated earlier, the seed sales data over theperiod 1988–2002 suggests that the volume of seeds of MSUvarieties sold in other states was 1.5 times larger than the totalvolume sold in Michigan, implying that the potential benefitsthat should be attributed to MSU is much larger than those re-ported in Table 5. However, on the cost side, it is not possibleto attribute only a portion of the total cost to the estimated ben-efits realized in Michigan. We had only one option—that is to
compare the estimated benefits to the total costs. Hence, thebenefits attributed to MSU, as reported in Table 5, represent anunderestimate of potential benefits (close to the lower-boundestimates rather than total benefits) from all the investments inbean improvement research at MSU. Similarly, the benefit-costratios in Table 6 represent conservative lower-bound estimates,since costs are total, but benefits are partial. Relaxing just oneof the assumptions underlying these conservative estimates byassuming that MSU varieties released between 1985 and 2002will continue to be planted in Michigan and will continue togenerate benefits for the next 20 years, raises the benefit-costratios to more than 1 under all three scenarios of attribution forall the time periods, except 1991–1995.
7. Summary and concluding comments
The challenges associated with estimating benefits at-tributable to one research institute (i.e., MSU) for a specifictime period (1980–2002) when the total benefits generated areattributable to other contemporary and past private and publicsector investments are quite different from the scenario com-monly found in the literature on rates of returns to agriculturalresearch investments (i.e., a dominant public sector institutionsupplying most of the new genetically improved varieties ofseed crops). The data presented in this article on the marketshare of bean varieties planted in Michigan point to an in-creasing share of private sector and spill-in varieties from otherpublic sector programs (primarily from other states) in the beanimprovement industry. Moreover, the average weighted age ofbean varieties planted in Michigan in 2002 for some majormarket classes ranged from 20 years for black beans, 18 forcranberry beans, 14 for pinto beans, and 11 for navy beans, in-dicating the presence of much older varieties. Failure to accountfor these different sources and time period of varietal improve-ment could overestimate the benefits attributed to a specificplant breeding program in a specific time period. The purposeof this study was to illustrate a methodology to document thebenefits of a public sector plant breeding program for invest-ments made in a specific time period (i.e., 1980–2002) underthe following scenario: (1) an increasingly privatized world;(2) presence of spill-in benefits from other public sector pro-grams, and (3) presence of varieties that were developed frominvestments prior to 1980.
The results indicate that in the most conservative scenario,the net benefits realized to date far exceeds the total invest-ment in MSU’s bean breeding program when credit is givento all MSU developed germplasm in the pedigree of varietiesplanted by Michigan growers from 1986 to 2002. However, ifcredit is restricted to who released the variety (the last crossrule), then the realized gains fall short by $0.3 on every $1 in-vested by MSU bean breeding program from 1980–1996. How-ever, the estimated benefit/cost ratios reported in this study arelower-bound estimates as they do not account for potentialbenefits from additional acres planted to MSU varieties out-side Michigan, potential benefits beyond 2002, and potential
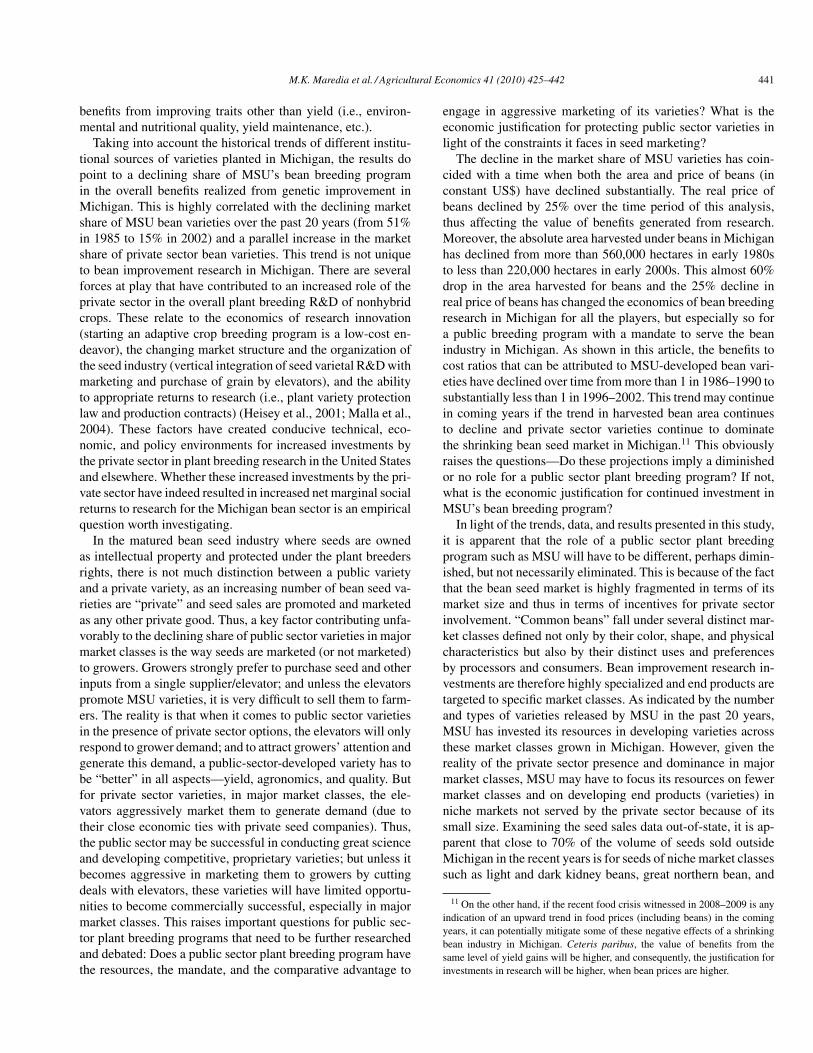
M.K. Maredia et al. / Agricultural Economics 41 (2010) 425–442 441
benefits from improving traits other than yield (i.e., environ-mental and nutritional quality, yield maintenance, etc.).
Taking into account the historical trends of different institu-tional sources of varieties planted in Michigan, the results dopoint to a declining share of MSU’s bean breeding programin the overall benefits realized from genetic improvement inMichigan. This is highly correlated with the declining marketshare of MSU bean varieties over the past 20 years (from 51%in 1985 to 15% in 2002) and a parallel increase in the marketshare of private sector bean varieties. This trend is not uniqueto bean improvement research in Michigan. There are severalforces at play that have contributed to an increased role of theprivate sector in the overall plant breeding R&D of nonhybridcrops. These relate to the economics of research innovation(starting an adaptive crop breeding program is a low-cost en-deavor), the changing market structure and the organization ofthe seed industry (vertical integration of seed varietal R&D withmarketing and purchase of grain by elevators), and the abilityto appropriate returns to research (i.e., plant variety protectionlaw and production contracts) (Heisey et al., 2001; Malla et al.,2004). These factors have created conducive technical, eco-nomic, and policy environments for increased investments bythe private sector in plant breeding research in the United Statesand elsewhere. Whether these increased investments by the pri-vate sector have indeed resulted in increased net marginal socialreturns to research for the Michigan bean sector is an empiricalquestion worth investigating.
In the matured bean seed industry where seeds are ownedas intellectual property and protected under the plant breedersrights, there is not much distinction between a public varietyand a private variety, as an increasing number of bean seed va-rieties are “private” and seed sales are promoted and marketedas any other private good. Thus, a key factor contributing unfa-vorably to the declining share of public sector varieties in majormarket classes is the way seeds are marketed (or not marketed)to growers. Growers strongly prefer to purchase seed and otherinputs from a single supplier/elevator; and unless the elevatorspromote MSU varieties, it is very difficult to sell them to farm-ers. The reality is that when it comes to public sector varietiesin the presence of private sector options, the elevators will onlyrespond to grower demand; and to attract growers’ attention andgenerate this demand, a public-sector-developed variety has tobe “better” in all aspects—yield, agronomics, and quality. Butfor private sector varieties, in major market classes, the ele-vators aggressively market them to generate demand (due totheir close economic ties with private seed companies). Thus,the public sector may be successful in conducting great scienceand developing competitive, proprietary varieties; but unless itbecomes aggressive in marketing them to growers by cuttingdeals with elevators, these varieties will have limited opportu-nities to become commercially successful, especially in majormarket classes. This raises important questions for public sec-tor plant breeding programs that need to be further researchedand debated: Does a public sector plant breeding program havethe resources, the mandate, and the comparative advantage to
engage in aggressive marketing of its varieties? What is theeconomic justification for protecting public sector varieties inlight of the constraints it faces in seed marketing?
The decline in the market share of MSU varieties has coin-cided with a time when both the area and price of beans (inconstant US$) have declined substantially. The real price ofbeans declined by 25% over the time period of this analysis,thus affecting the value of benefits generated from research.Moreover, the absolute area harvested under beans in Michiganhas declined from more than 560,000 hectares in early 1980sto less than 220,000 hectares in early 2000s. This almost 60%drop in the area harvested for beans and the 25% decline inreal price of beans has changed the economics of bean breedingresearch in Michigan for all the players, but especially so fora public breeding program with a mandate to serve the beanindustry in Michigan. As shown in this article, the benefits tocost ratios that can be attributed to MSU-developed bean vari-eties have declined over time from more than 1 in 1986–1990 tosubstantially less than 1 in 1996–2002. This trend may continuein coming years if the trend in harvested bean area continuesto decline and private sector varieties continue to dominatethe shrinking bean seed market in Michigan.11 This obviouslyraises the questions—Do these projections imply a diminishedor no role for a public sector plant breeding program? If not,what is the economic justification for continued investment inMSU’s bean breeding program?
In light of the trends, data, and results presented in this study,it is apparent that the role of a public sector plant breedingprogram such as MSU will have to be different, perhaps dimin-ished, but not necessarily eliminated. This is because of the factthat the bean seed market is highly fragmented in terms of itsmarket size and thus in terms of incentives for private sectorinvolvement. “Common beans” fall under several distinct mar-ket classes defined not only by their color, shape, and physicalcharacteristics but also by their distinct uses and preferencesby processors and consumers. Bean improvement research in-vestments are therefore highly specialized and end products aretargeted to specific market classes. As indicated by the numberand types of varieties released by MSU in the past 20 years,MSU has invested its resources in developing varieties acrossthese market classes grown in Michigan. However, given thereality of the private sector presence and dominance in majormarket classes, MSU may have to focus its resources on fewermarket classes and on developing end products (varieties) inniche markets not served by the private sector because of itssmall size. Examining the seed sales data out-of-state, it is ap-parent that close to 70% of the volume of seeds sold outsideMichigan in the recent years is for seeds of niche market classessuch as light and dark kidney beans, great northern bean, and
11 On the other hand, if the recent food crisis witnessed in 2008–2009 is anyindication of an upward trend in food prices (including beans) in the comingyears, it can potentially mitigate some of these negative effects of a shrinkingbean industry in Michigan. Ceteris paribus, the value of benefits from thesame level of yield gains will be higher, and consequently, the justification forinvestments in research will be higher, when bean prices are higher.

442 M.K. Maredia et al. / Agricultural Economics 41 (2010) 425–442
white kidney bean. Thus a shift in the focus away from majormarket classes to smaller niche markets makes “public good”sense for MSU from both the state and national perspective. Butit also implies that public sector investments will potentiallygenerate even smaller economic benefits as calculated by thisstudy (since the area planted to MSU varieties in Michigan willbe smaller). To keep the cost-benefit ratio above one in this po-tential future scenario, the resources invested in plant breedingactivities (i.e., activities focused on developing the end productsfor farmer release) will have to shrink and the efficiency of thebreeding program has to increase simultaneously.
Unlike a private seed company, a university-based plantbreeding program is an integral part of a much broader beanresearch program that generates many other benefits that arenot captured by the estimated economic returns presented inthis study. These include the benefits generated by a university-based research program in training future plant breeders, con-ducting fundamental research in methodology development,maintaining/conserving germplasm, and doing basic researchin generating varieties that incorporate certain public goodcharacteristics such as disease resistance (through maintenancebreeding), environmental suitability, nutritional characteristics,etc. These are the types of activities in which private breed-ing programs will not invest at a socially optimal level asthere is not always an economic value associated with the out-puts of this type of research. In the absence of MSU beanresearch program, important contributions made by the pro-gram, which are not reflected in the value of estimated benefits,in maintaining the yield, nutritional, environmental, and indus-trial quality may be lost. This potential counterfactual (whatwould happen in the absence of public sector research) pro-vides continued economic justification for public investmentsin plant breeding and genetics research. However, these poten-tial benefits are not captured by the myriad rates of returnsstudies (including this one) found in the literature that arebased on the cost-benefit framework where benefits are esti-mated as the measurable incremental value of the end prod-ucts adopted by the farmers (i.e., improved varieties). There is,therefore, a need to develop new methods and approaches tocapture these other benefits generated by an integrated publicsector research, training, and capacity building program in cropimprovement.
Acknowledgment
Financial support from the Bean/Cowpea Collaborative Re-search Support Program (CRSP) under the USAID grant num-ber GDG-G-00-02-00012-00 is acknowledged and greatly ap-preciated. The authors thank Gregory Varner and James Kellyfor their valuable support and anonymous reviewers for theirhelpful comments. The opinions expressed herein are those ofthe authors and do not necessarily reflect the views of the U.S.Agency for International Development or the Bean/CowpeaCRSP.
References
Alston, J.M., Pardey, P.G., 2001. Attribution and other problems in assessingthe returns to agricultural R&D. Agric. Econ. 25, 141–52.
Alston, J.M., Marra, M.C., Pardey, P.G. Wyatt, T.J., 2000. Research returnsredux: A meta-analysis of the returns to agricultural R&D. Aust. J. Agric.Res. Econ. 44(2), 185–215.
Alston, J.M., Chan-Kang, C., Marra, M.C., Pardey, P.G., Wyatt, T.J., 2000. AMeta-Analysis of Rates of Return to Agricultural R&D, Ex Pede Herculem?IFPRI Research Report 113, International Food Policy Research Institute,Washington, DC.
Alston, J.M., Norton, G.W., Pardey, P.G., 1998. Science Under Scarcity: Princi-ples and Practice for Agricultural Research Evaluation and Priority Setting.CAB International, Wallingford, UK.
Bazelon C., Smetters, K., 2001. Discounting in the long-term. Loyola LA LawRev. 35, 277–291.
Byerlee, D., Moya, P.F., 1993. Impacts of International Wheat Breed-ing Research in the Developing World, 1966-1990. CIMMYT, Mexico,DF.
Byerlee, D., Traxler, G., 1995. National and international wheat improvementresearch in the post-green revolution period: Evolution and impacts. Am. J.Agric. Econ. 77, 268–278.
Evenson, R.E., 2001. Economic impacts of agricultural research andextension. In: Gardner, B.L., Rausser, G.C. (Eds). Handbook ofAgricultural Economics, Volume 1A, Elsevier, Amsterdam, TheNetherlands, pp. 573–628.
Evenson, R.E., Gollin, D. (Eds), 2003. Crop Variety Improvement and its Effecton Productivity: The Impact of International Agricultural Research. CABInternational, Wallingford, UK.
Fuglie, K., Ballenger, N., Day, K., Klotz, C., Ollinger, M., Reilly, J., Vasavada,U., Yee, J., Fisher, J., Payson, S., 1996. Agricultural research and develop-ment: Public and private investments under alternative markets and institu-tions. USDA-ERS-NRED Agricultural Economic Report 735. U.S. Depart-ment of Agriculture, Washington, DC.
Godden, D., 1988. Technical change embodies in new varieties of Englishwinter wheat and spring barley. Research and Development in Agriculture5(2), 117–122.
Gonzalez, C.A., 1992. Methods of Estimating Rate of Yield Gains for PlantBreeding Programs. Economics Miscellaneous Paper No. 92-1. CIMMYT,El Batan, Mexico.
Griliches, Z., 1958. Research costs and social returns: Hybrid corn and relatedinnovations. J. Pol. Econ. 66, 419–431.
Heisey, P.W., Srinivasan, C.S., Thirtle, C., 2001. Public Sector Plant Breed-ing in a Privatizing World. Agriculture Information Bulletin No. 772.Resource Economics Division, Economic Research Service, U.S. Depart-ment of Agriculture, Washington, DC. Available at http://www.ers.usda.gov/publications/aib772/aib772.pdf.
Kelly, J.D., Varner, G., O’Boyle, P., Long, B., 2009. Registration of Zorro blackbean. J. Plant Reg. 3(3), 226–230.
Malla, S., Gray, R., Phillips, P., 2004. Gains to research in the presence ofintellectual property rights and research subsidies. Rev. Agric. Econ. 26(1),63–81.
Maredia, M.K., Byerlee, D., 2000. Efficiency of research investments in thepresence of international spillovers: A case study of wheat research. Agric.Econ. 22(2000), 1–16.
Maredia, M.K., Raitzer, D.A. 2006. CGIAR and NARS Partner Research inSub-Saharan Africa: Evidence of Impact to Date. CGIAR Science CouncilSecretariat, Rome, Italy.
Morris, M.L., Heisey, P.W., 2003. Estimating the benefits of plant breedingresearch: Methodological issues and practical challenges. Agric. Econ. 29,241–252.
Pardey, P.G., Alston, J.M., Chan-Kang, C., Magalhaes, E.C., Vosti, S.A., 2006.International and institutional R&D spillovers: Attribution of benefits amongsources for Brazil’s new crop varieties. Am. J. Agric. Econ. 88(1), 104–123.