Responses of polar mesospheric cloud brightness to stratospheric gravity waves at the South Pole and...
12
Responses of polar mesospheric cloud brightness to stratospheric gravity waves at the South Pole and Rothera, Antarctica Xinzhao Chu a, , Chihoko Yamashita a , Patrick J. Espy b , Graeme J. Nott c , Eric J. Jensen d , Han-Li Liu e , Wentao Huang a , Jeffrey P. Thayer a a Cooperative Institute for Research in Environmental Sciences and Department of Aerospace Engineering Sciences, University of Colorado at Boulder, USA b Department of Physics, Norwegian University of Science and Technology, Trondheim, Norway c Department of Physics and Atmospheric Science, Dalhousie University, Halifax, Canada d NASA Ames Research Center, Moffett Field, CA, USA e National Center for Atmospheric Research, Boulder, CO, USA article info Article history: Accepted 7 October 2008 Available online 17 October 2008 Keywords: Polar mesospheric clouds Gravity waves Lidar Antarctica Stratosphere abstract We present the first observational proof that polar mesospheric cloud (PMC) brightness responds to stratospheric gravity waves (GWs) differently at different latitudes by analyzing the Fe Boltzmann lidar data collected from the South Pole and Rothera (67.51S, 68.01W), Antarctica. Stratospheric GW strength is characterized by the root-mean-square (RMS) relative density perturbation in the 30–45 km region and PMC brightness is represented by the total backscatter coefficient (TBC) in austral summer from November to February. The linear correlation coefficient (LCC) between GW strength and PMC brightness is found to be +0.09 with a 42% confidence level at the South Pole and 0.49 with a 98% confidence level at Rothera. If a PMC case potentially affected by a space shuttle exhaust plume is removed from the Rothera dataset, the negative correlation coefficient and confidence level increase to 0.61 and 99%, respectively. The Rothera negative correlation increases when shorter-period waves are included while no change is observed in the South Pole correlation. Therefore, observations show statistically that Rothera PMC brightness is negatively correlated with the stratospheric GW strength but no significant correlation exists at the South Pole. A positive correlation of +0.74 with a confidence level of 99.98% is found within a distinct subset of the South Pole data but the rest of the dataset exhibits a random distribution, possibly indicating different populations of ice particles at the South Pole. Our data show that these two locations have similar GW strength and spectrum in the 30–45 km region during summer. The different responses of PMC brightness to GW perturbations are likely caused by the latitudinal differences in background temperatures in the ice crystal growth region between the PMC altitude and the mesopause. At Rothera, where temperatures in this region are relatively warm and supersaturations are not as large, GW-induced temperature perturbations can drive subsaturation in the warm phase. Thus, GWs can destroy growing ice crystals or limit their growth, leading to negative correlation at Rothera. Because the South Pole temperatures in the mesopause region are much colder, GW-perturbed temperature may never be above the frost point and have less of an impact on crystal growth and PMC brightness. The observed phenomena and proposed mechanisms above need to be understood and verified through future modeling of GW effects on PMC microphysics and ray modeling of GW propagation over the South Pole and Rothera. & 2008 Elsevier Ltd. All rights reserved. 1. Introduction Due to the water ice nature of polar mesospheric clouds (PMCs) (Hervig et al., 2001), PMCs are expected to be very sensitive to the changes in mesospheric water vapor and temperature (Thomas, 1991). The increased concentration of CH 4 , which oxidizes to form water vapor in the mesopause region (Thomas et al., 1989), and CO 2 , which possibly cools the middle and upper atmosphere (Portman et al., 1995), could lead to the increase of PMC brightness and occurrence frequency (Thomas, 1996; Thomas and Olivero, 2001). Thus, PMCs provide a potential indicator of global climate change, which has fueled the intensive study of PMCs in recent years. While earlier trend studies concentrated on PMC occurrence frequency (Gadsden, 1998; DeLand et al., 2003), recent studies turn the attention to PMC brightness (DeLand et al., 2007). Two major considerations are behind this change. First, unlike the occurrence frequency that is heavily affected by sampling issues, PMC brightness is a ARTICLE IN PRESS Contents lists available at ScienceDirect journal homepage: www.elsevier.com/locate/jastp Journal of Atmospheric and Solar-Terrestrial Physics 1364-6826/$ - see front matter & 2008 Elsevier Ltd. All rights reserved. doi:10.1016/j.jastp.2008.10.002 Corresponding author. Tel.: +1303 492 3280; fax: +1303 492 1149. E-mail address: [email protected] (X. Chu). Journal of Atmospheric and Solar-Terrestrial Physics 71 (2009) 434–445
-
Upload
independent -
Category
Documents
-
view
1 -
download
0
Transcript of Responses of polar mesospheric cloud brightness to stratospheric gravity waves at the South Pole and...

ARTICLE IN PRESS
Journal of Atmospheric and Solar-Terrestrial Physics 71 (2009) 434–445
Contents lists available at ScienceDirect
Journal ofAtmospheric and Solar-Terrestrial Physics
1364-68
doi:10.1
� Corr
E-m
journal homepage: www.elsevier.com/locate/jastp
Responses of polar mesospheric cloud brightness to stratosphericgravity waves at the South Pole and Rothera, Antarctica
Xinzhao Chu a,�, Chihoko Yamashita a, Patrick J. Espy b, Graeme J. Nott c,Eric J. Jensen d, Han-Li Liu e, Wentao Huang a, Jeffrey P. Thayer a
a Cooperative Institute for Research in Environmental Sciences and Department of Aerospace Engineering Sciences, University of Colorado at Boulder, USAb Department of Physics, Norwegian University of Science and Technology, Trondheim, Norwayc Department of Physics and Atmospheric Science, Dalhousie University, Halifax, Canadad NASA Ames Research Center, Moffett Field, CA, USAe National Center for Atmospheric Research, Boulder, CO, USA
a r t i c l e i n f o
Article history:
Accepted 7 October 2008We present the first observational proof that polar mesospheric cloud (PMC) brightness responds to
stratospheric gravity waves (GWs) differently at different latitudes by analyzing the Fe Boltzmann lidar
Available online 17 October 2008Keywords:
Polar mesospheric clouds
Gravity waves
Lidar
Antarctica
Stratosphere
26/$ - see front matter & 2008 Elsevier Ltd. A
016/j.jastp.2008.10.002
esponding author. Tel.: +1303 492 3280; fax:
ail address: [email protected] (X. Ch
a b s t r a c t
data collected from the South Pole and Rothera (67.51S, 68.01W), Antarctica. Stratospheric GW strength
is characterized by the root-mean-square (RMS) relative density perturbation in the 30–45 km region
and PMC brightness is represented by the total backscatter coefficient (TBC) in austral summer from
November to February. The linear correlation coefficient (LCC) between GW strength and PMC
brightness is found to be +0.09 with a 42% confidence level at the South Pole and �0.49 with a 98%
confidence level at Rothera. If a PMC case potentially affected by a space shuttle exhaust plume is
removed from the Rothera dataset, the negative correlation coefficient and confidence level increase to
�0.61 and 99%, respectively. The Rothera negative correlation increases when shorter-period waves are
included while no change is observed in the South Pole correlation. Therefore, observations show
statistically that Rothera PMC brightness is negatively correlated with the stratospheric GW strength
but no significant correlation exists at the South Pole. A positive correlation of +0.74 with a confidence
level of 99.98% is found within a distinct subset of the South Pole data but the rest of the dataset
exhibits a random distribution, possibly indicating different populations of ice particles at the South
Pole. Our data show that these two locations have similar GW strength and spectrum in the 30–45 km
region during summer. The different responses of PMC brightness to GW perturbations are likely caused
by the latitudinal differences in background temperatures in the ice crystal growth region between the
PMC altitude and the mesopause. At Rothera, where temperatures in this region are relatively warm and
supersaturations are not as large, GW-induced temperature perturbations can drive subsaturation in the
warm phase. Thus, GWs can destroy growing ice crystals or limit their growth, leading to negative
correlation at Rothera. Because the South Pole temperatures in the mesopause region are much colder,
GW-perturbed temperature may never be above the frost point and have less of an impact on crystal
growth and PMC brightness. The observed phenomena and proposed mechanisms above need to be
understood and verified through future modeling of GW effects on PMC microphysics and ray modeling
of GW propagation over the South Pole and Rothera.
& 2008 Elsevier Ltd. All rights reserved.
1. Introduction
Due to the water ice nature of polar mesospheric clouds(PMCs) (Hervig et al., 2001), PMCs are expected to be verysensitive to the changes in mesospheric water vapor andtemperature (Thomas, 1991). The increased concentration ofCH4, which oxidizes to form water vapor in the mesopause region
ll rights reserved.
+1303 4921149.
u).
(Thomas et al., 1989), and CO2, which possibly cools the middleand upper atmosphere (Portman et al., 1995), could lead to theincrease of PMC brightness and occurrence frequency (Thomas,1996; Thomas and Olivero, 2001). Thus, PMCs provide a potentialindicator of global climate change, which has fueled the intensivestudy of PMCs in recent years. While earlier trend studiesconcentrated on PMC occurrence frequency (Gadsden, 1998;DeLand et al., 2003), recent studies turn the attention to PMCbrightness (DeLand et al., 2007). Two major considerationsare behind this change. First, unlike the occurrence frequencythat is heavily affected by sampling issues, PMC brightness is a
ARTICLE IN PRESS
X. Chu et al. / Journal of Atmospheric and Solar-Terrestrial Physics 71 (2009) 434–445 435
better-defined physical quantity readily measured by satellitesand lidars. Second, occurrence frequency might reach saturation,especially at high latitudes where it is nearly 100% in midsummer.Conversely, PMC brightness could continue growing with largernumber density and/or larger PMC ice particles. Therefore, PMCbrightness is more suitable for long-term trend monitoring.However, PMC brightness is strongly influenced by tides (vonZahn et al., 1998; Chu et al., 2001b, 2003, 2006; Fiedler et al.,2005), planetary waves (Merkel et al., 2003), and gravity waves(GWs) (Hecht et al., 1997; Gerrard et al., 1998, 2004a, b). To derivereliable long-term trends and to understand the meaning of thesetrends, it is important to understand and quantify PMC brightnessresponse to various dynamic factors in addition to the basic watervapor, temperature, and nucleation parameters. This will help tovalidate and improve coupled PMC microphysical, chemical, anddynamical models so that long-term trends can be assessed basedon these models and historic data sets.
The focus of this paper is the PMC brightness response toatmospheric GWs. The visual displays of PMCs, i.e., ground-viewed noctilucent clouds (NLCs), often exhibit GW signatureslike bands, streaks, billows, and whirls (e.g., Witt, 1962; Gadsdenand Schroder, 1989). When such wave-like NLC structures movethrough the lidar field of view, they are observed as variations ofPMC brightness with time. It has been suggested that GWs causePMC brightness to vary through wave-induced undulation ofcloud layers and wave-induced convergence and divergence ofcloud particle concentration (Jensen and Thomas, 1994), throughwave breaking (Fritts et al., 1993), or through wave-inducedtemperature perturbations in the PMC vicinity (Turco et al., 1982;Jensen and Thomas, 1994; Rapp et al., 2002). Observations fromSondrestrom, Greenland (67.01N, 50.91W) showed evidence of thepassage of acoustic GWs in the mesopause region causing PMCsublimation (Hecht et al., 1997). Gerrard et al. (1998, 2004a, b)analyzed the Rayleigh lidar data from Sondrestrom and found thatthe strength of stratospheric GWs (30–45 km) was negativelycorrelated with the PMC brightness. Furthermore, Thayer et al.(2003) employed a PMC microphysical model and found that theintroduction of short period waves (2–3 h) replicated the cloudcharacteristics observed by the Rayleigh lidar at Sondrestrom.
None of the above investigations of GW and PMC correlationswere conducted at very high latitude (i.e., not close to the pole).Whether this negative GW–PMC correlation is true for alllatitudes becomes a valid question considering the latitudinaldifferences in background temperatures. Will GWs affect PMCmicrophysics in different ways under different backgroundconditions? To answer these questions, we examine the extensivedata collected by an iron Boltzmann lidar at Rothera (67.51S,68.01W) and the South Pole (901S) and derive the correlationbetween stratospheric GWs (30–45 km) and PMC using astatistical approach similar to Gerrard et al. (1998, 2004a). AsRothera is located at the edge of Antarctica and the South Pole atthe center of the Antarctic plateau, the lidar datasets provide aunique opportunity to test a hypothesis that a negative correlationexists at the Antarctic edge but no correlation exists at the SouthPole. Furthermore, by applying different temporal filters to selectdifferent period waves, we examine how this GW–PMC correla-tion varies with GW spectrum. We then investigate why the PMCbrightness responds to GWs differently at different latitudes.
2. Methodology
2.1. Instrument
The instrument used to collect the observational data was theUniversity of Illinois Fe Boltzmann/Rayleigh/Mie lidar. This is a
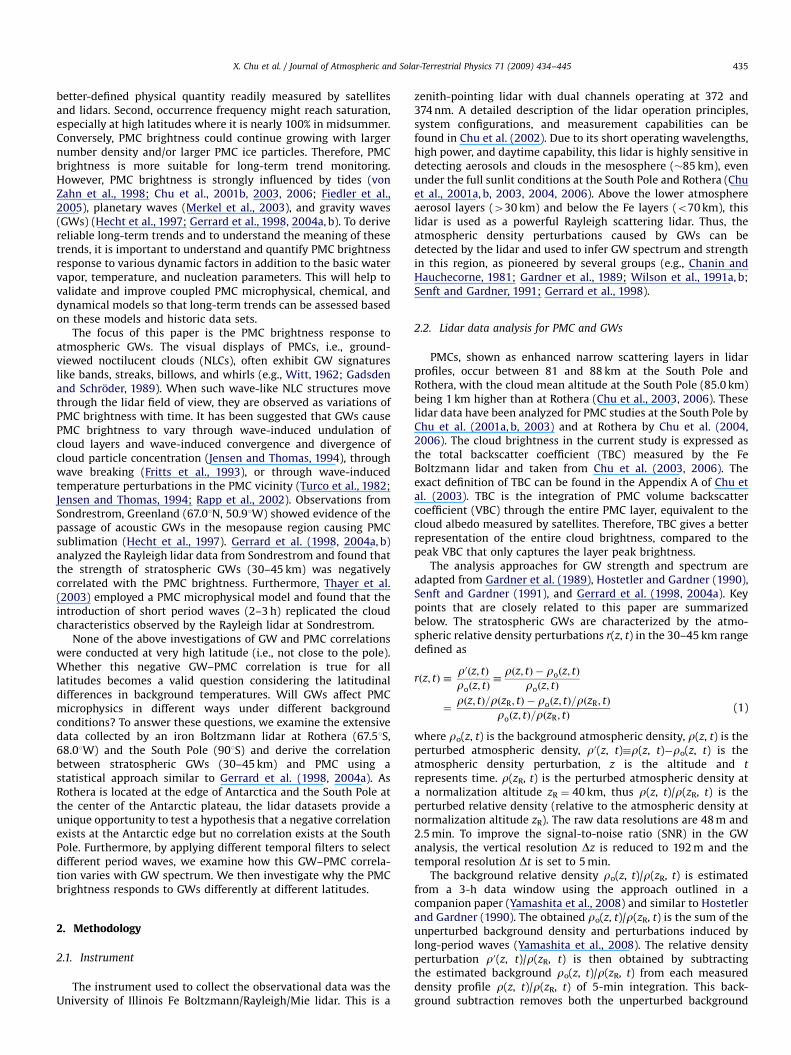
zenith-pointing lidar with dual channels operating at 372 and374 nm. A detailed description of the lidar operation principles,system configurations, and measurement capabilities can befound in Chu et al. (2002). Due to its short operating wavelengths,high power, and daytime capability, this lidar is highly sensitive indetecting aerosols and clouds in the mesosphere (�85 km), evenunder the full sunlit conditions at the South Pole and Rothera (Chuet al., 2001a, b, 2003, 2004, 2006). Above the lower atmosphereaerosol layers (430 km) and below the Fe layers (o70 km), thislidar is used as a powerful Rayleigh scattering lidar. Thus, theatmospheric density perturbations caused by GWs can bedetected by the lidar and used to infer GW spectrum and strengthin this region, as pioneered by several groups (e.g., Chanin andHauchecorne, 1981; Gardner et al., 1989; Wilson et al., 1991a, b;Senft and Gardner, 1991; Gerrard et al., 1998).
2.2. Lidar data analysis for PMC and GWs
PMCs, shown as enhanced narrow scattering layers in lidarprofiles, occur between 81 and 88 km at the South Pole andRothera, with the cloud mean altitude at the South Pole (85.0 km)being 1 km higher than at Rothera (Chu et al., 2003, 2006). Theselidar data have been analyzed for PMC studies at the South Pole byChu et al. (2001a, b, 2003) and at Rothera by Chu et al. (2004,2006). The cloud brightness in the current study is expressed asthe total backscatter coefficient (TBC) measured by the FeBoltzmann lidar and taken from Chu et al. (2003, 2006). Theexact definition of TBC can be found in the Appendix A of Chu etal. (2003). TBC is the integration of PMC volume backscattercoefficient (VBC) through the entire PMC layer, equivalent to thecloud albedo measured by satellites. Therefore, TBC gives a betterrepresentation of the entire cloud brightness, compared to thepeak VBC that only captures the layer peak brightness.
The analysis approaches for GW strength and spectrum areadapted from Gardner et al. (1989), Hostetler and Gardner (1990),Senft and Gardner (1991), and Gerrard et al. (1998, 2004a). Keypoints that are closely related to this paper are summarizedbelow. The stratospheric GWs are characterized by the atmo-spheric relative density perturbations r(z, t) in the 30–45 km rangedefined as
rðz; tÞ �r0ðz; tÞroðz; tÞ
�rðz; tÞ � roðz; tÞ
roðz; tÞ
¼rðz; tÞ=rðzR; tÞ � roðz; tÞ=rðzR; tÞ
roðz; tÞ=rðzR; tÞ(1)
where ro(z, t) is the background atmospheric density, r(z, t) is theperturbed atmospheric density, r0(z, t)�r(z, t)�ro(z, t) is theatmospheric density perturbation, z is the altitude and t
represents time. r(zR, t) is the perturbed atmospheric density ata normalization altitude zR ¼ 40 km, thus r(z, t)/r(zR, t) is theperturbed relative density (relative to the atmospheric density atnormalization altitude zR). The raw data resolutions are 48 m and2.5 min. To improve the signal-to-noise ratio (SNR) in the GWanalysis, the vertical resolution Dz is reduced to 192 m and thetemporal resolution Dt is set to 5 min.
The background relative density ro(z, t)/r(zR, t) is estimatedfrom a 3-h data window using the approach outlined in acompanion paper (Yamashita et al., 2008) and similar to Hostetlerand Gardner (1990). The obtained ro(z, t)/r(zR, t) is the sum of theunperturbed background density and perturbations induced bylong-period waves (Yamashita et al., 2008). The relative densityperturbation r0(z, t)/r(zR, t) is then obtained by subtractingthe estimated background ro(z, t)/r(zR, t) from each measureddensity profile r(z, t)/r(zR, t) of 5-min integration. This back-ground subtraction removes both the unperturbed background

ARTICLE IN PRESS
X. Chu et al. / Journal of Atmospheric and Solar-Terrestrial Physics 71 (2009) 434–445436
and long-period waves (such as tides and stationary waves),leaving short-period waves (periods less than 6 h—double thewindow length) in r0(z, t)/r(zR, t). To reduce the noise level(mainly with very short periods), the obtained relative densityperturbation r(z, t) is low-pass filtered with a vertical cutoffwavelength lC of 2 km and a temporal cutoff period TC of 60 min.Such filter and background windows allow us to calculate GWswith vertical wavelengths of 2–30 km and periods of 60–360 min.The resulted two-dimensional (2-D) relative density perturbationsare for every 5 min through the entire dataset. Two examples ofsequence plots are shown in Fig. 1 for the South Pole and Rothera,respectively.
The GW strength is then characterized by the root-mean-square (RMS) relative density perturbation. To do so, the mean-square (MS) relative density perturbation is calculated:
hr2i ¼1
TL
Z T
0
Z L
0r2ðz; tÞdz dt �
1
TL
Z T
0
Z L
0rðz; tÞdz dt
� �2
(2)
where T and L are the 2-D window sizes (T ¼ 3 h and L ¼ 15 km).The positive bias introduced by photon noise in the MS relativedensity perturbation must be subtracted to obtain the pure MSperturbation, i.e., the non-biased GW strength. Senft and Gardner(1991) gave a bias estimation equation for nighttime observationswhere the background noise can be neglected. We further developthe equation to account for the noise caused by the daytime solarbackground:
Dr� �2
LPF¼
4DtDz
TClC
1
TL
Z T
0
Z L
0
½DNTðz; tÞ�2
½NTðz; tÞ � NBðtÞ�2
(
þ½DNTðzR ; tÞ�
2
½NTðzR ; tÞ � NBðtÞ�2
)dz dt (3)
where NT(z, t) is the total photon count for each bin, NBðtÞ
is the estimated background photon count, and ½DNTðz; tÞ�rms ¼ffiffiffiffiffiffiffiffiffiffiffiffiffiffiffiNTðz; tÞ
pis the photon noise associated with NT(z, t). The
RMS relative density perturbation, i.e., the GW strength, iscomputed as
ðrÞrms ¼
ffiffiffiffiffiffiffiffiffiffiffiffiffiffiffiffihr2iPure
q¼
ffiffiffiffiffiffiffiffiffiffiffiffiffiffiffiffiffiffiffiffiffiffiffiffiffiffiffiffiffiffihr2i � ½Dr�2LPF
q. (4)
0 2 4 630
35
40
45
Alti
tude
(km
)
20 December 1999
0 2 4 630
35
40
45
Alti
tude
(km
)
Relative Density P
19 December 200
7 UT
28.5 UT
Fig. 1. Sequence plots of the 2-D filtered relative density perturbations obtained for 20
density profile represents an integration of 5-min data and is shifted by 1% to the righ
GW spectrum analysis is performed on the 2-D relative densityperturbations. A 2-D FFT is applied to derive the 2-D powerspectral density (PSD). The vertical wavelength lz and correspond-ing period T of the dominant wave with the highest PSD areestimated from the PSD profile. The GW vertical phase speed cz isthen calculated as cz ¼ lz/T.
2.3. Criteria for GW data analysis
Four criteria are used for data quality control and GWidentification. First, by checking the Rayleigh and backgroundlevels, any profiles taken under lidar beam alignment and cloudyconditions are removed. Second, due to the use of a 3-h windowfor background estimate, any data sets with a period less than 3 hare excluded from the GW data analysis. Third, the RMSuncertainty of /r2SPure in the 3-h window must be smaller than50% of /r2SPure. This RMS uncertainty f is adapted from Senft andGardner (1991):
f ¼ lCTC½Dr�2LPF=TLhr2iPure
h i1=2. (5)
Fourth, hourly data must show GW downward phase progressionin order to be qualified in the GW database. Only data that pass allfour criteria are used for this study.
3. Observations
Amundsen–Scott South Pole Station (901S) is located at theAntarctic plateau. The lidar observations at the South Pole weremade by the University of Illinois under the support of theNational Science Foundation from December 1999 to October2001. Rothera (67.51S, 68.01W) is located on Adelaide Island nearthe Antarctic Peninsula. The lidar observations at Rothera were acollaborative effort between the British Antarctic Survey and theUniversity of Illinois from December 2002 to March 2005. PMCswere observed by the lidar from November to February duringtwo austral summers (1999–2000 and 2000–2001) at the SouthPole (Chu et al., 2003) and during three austral summers atRothera (2002–2003, 2003–2004, and 2004–2005) (Chu et al.,
@ South Pole
erturbation (%)
3 @ Rothera
10 UT
31.5 UT
December 1999 at the South Pole and 19 December 2003 at Rothera. Each relative
t progressively.

ARTICLE IN PRESS
X. Chu et al. / Journal of Atmospheric and Solar-Terrestrial Physics 71 (2009) 434–445 437
2006). In order to study the GW–PMC correlation we analyze thelidar density data in the PMC season from November to Februaryto derive stratospheric GW strength and spectrum in the altituderange of 30–45 km. This range is chosen for comparison withearlier studies by Gerrard et al. (1998, 2004a, b) at Sondrestrom,Greenland (67.01N, 50.91W). It is also in consideration of the SNRthus the reliability of the lidar data.
Statistics of examination and occurrence hours (and datasets)for PMC and GW are summarized in Table 1. The total hours ofdata that passed the first two criteria and used for examining GWsare �399 h at the South Pole and �354 h at Rothera. The largedifference between the PMC and GW examination hours ispartially due to the fact that many datasets shorter than 3 h areexcluded from GW examination. Furthermore, many hours of datawith relatively low Rayleigh signals or questionable overlappingbetween the lidar beam and the receiver field of view are alsoexcluded from the GW analysis to ensure the data quality. GWs areobserved in �306 h at the South Pole and �318 h at Rothera, i.e.,these data pass the last two criteria and show clear GWsignatures. About 93 and 36 h of data are disqualified at theSouth Pole and Rothera by the third criterion because the MSperturbations in these hours are not significantly larger than theuncertainty caused by photon noise. Histograms of the distribu-tion of GW examination and occurrence hours versus UT areplotted in Fig. 2. Lidar observations cover the full diurnal cyclewith relatively homogeneous distribution at the South Pole butinhomogeneous distribution at Rothera. Due to the high solar
Table 1Summary of lidar observations of PMC and stratospheric GW at the South Pole and
Rothera, Antarctica
South Pole Rothera
PMC examination hours/datasets 650 h/78 sets 459 h/46 sets
PMC occurrence hours/datasets 437 h/67 sets 128/32 sets
GW examination hours/datasets 399 h/54 sets 354 h/47 sets
GW occurrence hours/datasets 306 h/51 sets 318 h/47 sets
Simultaneous GW and PMC
observation hours/datasets
222 h/37 sets 210 h/23 sets
0 6 12 18 240
10
20
30
GW
Exa
min
atio
n (h
)
South Pole
0 6 12 18 240
10
20
30
Universal Time (h)
GW
Occ
urre
nce
(h)
Fig. 2. Histograms of gravity wave examination and occurrence hours in the sum
background around noon hours at Rothera, the GW occurrencehours are biased towards local midnight (4.5 UT). There are 37 and23 datasets with both PMC and GW occurrence at the South Poleand Rothera, respectively. Only these simultaneous datasets areused in the following derivation of correlation coefficientsbetween GW strength and PMC brightness.
3.1. Correlations between GW strength and PMC brightness at
different latitudes
Similar to the approach taken by Gerrard et al. (1998, 2004a),the correlation between GW strength and PMC brightness ischaracterized by a linear correlation coefficient (LCC) between theTBC of PMCs and the RMS relative density perturbation (RMSperturbation for short) of GWs. The LCC is defined as (Press et al.,1986):
LCC ¼
Piðri � rÞðbi � bÞffiffiffiffiffiffiffiffiffiffiffiffiffiffiffiffiffiffiffiffiffiffiffiP
iðri � rÞ2q ffiffiffiffiffiffiffiffiffiffiffiffiffiffiffiffiffiffiffiffiffiffiffiffiffiP
iðbi � bÞ2q (6)
where ri and bi are the mean GW RMS perturbation and meanPMC TBC for each dataset i, and r and b are the means of ri and bi
used in the LCC calculation, respectively. Dataset-mean values ofTBC bi and RMS perturbation ri are used, instead of hourly or 3-hmean values. This is because the stratospheric GWs in the range of30–45 km take about 10–20 h to propagate to the PMC region forvertical group velocity �2–3 km/h. The hourly PMCs may nothave a one-to-one correlation with hourly stratospheric wavesbut the overall dataset means could provide a clue whether thesetwo are correlated (Gerrard et al., 1998). To take the datasetmeans, the TBC for the hours with waves but without clouds areset to zero.
Plotted in Figs. 3(a) and (b) are the PMC brightness versus GWstrength for the South Pole and Rothera, respectively. Each datapoint in the figures represents a dataset-mean PMC TBC and GWRMS perturbation. The error bars on each point are the standarddeviations of PMC TBC and the uncertainty of GW RMS perturba-tion within each dataset. The cutoff period and wavelength of thelow-pass filters used for these figures are 60 min and 2 km.Without considering the standard deviations, the LCC derived
0 6 12 18 240
10
20
30
GW
Exa
min
atio
n (h
)
Rothera
0 6 12 18 240
10
20
30
Universal Time (h)
GW
Occ
urre
nce
(h)
mer from November to February at the South Pole and Rothera, Antarctica.

ARTICLE IN PRESS
0.2 0.4 0.6−0.5
0
0.5
1
1.5
2
2.5
3
3.5
PM
C T
otal
Bac
ksca
tter C
oeffi
cien
t
RMS Perturbation (%)0 0.2 0.4 0.6 0.8
0
2
4
6
8
10
12
14
PM
C T
otal
Bac
ksca
tter C
oeffi
cien
t
RMS Perturbation (%)
LCC = 0.09 (42%) LCC = −0.49 (98%)
Fig. 3. PMC brightness (total backscatter coefficient) versus GW strength (RMS relative density perturbations in the 30–45 km range) at the South Pole (a) and Rothera (b).
The gravity wave data were processed using a low-pass filter with a 60-min cutoff period. Each data point represents a dataset-mean PMC TBC and GW RMS perturbation.
Error bars represent the uncertainty of GW RMS perturbation and standard deviation of PMC TBC. Circled data point represents 25 January 2003.
X. Chu et al. / Journal of Atmospheric and Solar-Terrestrial Physics 71 (2009) 434–445438
directly from the 37 and 23 data points in Figs. 3(a) and (b) are0.09 with a 42% confidence level for the South Pole and �0.49with a 98% confidence level for Rothera. Using a Monte Carlomethod similar to Gerrard et al. (2004a) to run the computation ofLCC within the half standard deviation of each point for 100,000times, the obtained mean LCC in the Monte Carlo method is0.0970.05 with a confidence level of 39% for the South Pole and�0.4370.07 with a confidence level of 95% for Rothera. Ourresults show that the PMC brightness and GW strength areuncorrelated at the South Pole, which can be seen from twoaspects. First, the LCC is very close to zero, indicating nosignificant correlation. Second, a confidence level of 42%or 39% means that the probability of using two random data setsto obtain the same LCC is 58% or 61%, so the two datasets {ri} and{bi} are unlikely to be correlated. The negative correlation atRothera given by the LCC is statistically significant as theconfidence level is above 95%, i.e., the probability of getting acorrelation as large as the observed value by random chance isless than 5%. Therefore, our lidar observations show that thestratospheric GW strength is negatively correlated with the PMCbrightness at Rothera but no significant correlation exists at theSouth Pole.
The dataset-mean GW RMS perturbations in Fig. 3(b) forRothera distribute from 0.1% to 0.6% with most of the data pointsbelow 0.4%. The points with lower PMC brightness tend to be atlarger GW RMS perturbation and the points with higher PMCbrightness tend to distribute at smaller GW RMS perturbation,except one point whose TBC is high around 1.7�10�6 sr�1 but itscorresponding RMS perturbation is also quite high around 0.45%.This exceptional point is 25 January 2003 when the Columbiashuttle exhaust reached Rothera station, potentially enhancing thePMC occurrence and brightness as discovered by Stevens et al.(2005). Excluding this point from the LCC calculation, we obtain aRothera LCC of �0.61 with a confidence level of 99%. Thus, thenegative correlation becomes even stronger at Rothera. Thedistribution of the dataset-mean GW RMS perturbations inFig. 3(a) for the South Pole is from 0.05% to 0.70%, slightly largerthan the Rothera distribution range. The dataset-mean PMC TBCat the South Pole is 4–5 times brighter than that at Rothera. Thereis no clear trend in the entire distribution for the South Pole.While the right side points show random distribution, a positivecorrelation is apparent among the left-side data points in Fig. 3(a).
If the correlation is derived using only the data on the left side, theLCC goes to +0.74 with a confidence level of 99.98%. This subsetdata cover both seasons (1999–2000 and 2000–2001) anddistribute in all 3 months (December, January, and February). Nospecific year or month or time of day dominates this positivecorrelation. For the rest of the data on the right side that form anear-circle shape, they are also from different seasons andmonths. The overall effect of all data points shows no significantcorrelation but this subset exercise indicates a possibility ofdifferent populations of ice particles having different responses toGW perturbations at the South Pole.
3.2. Correlations for different GW spectra
The results in Section 3.1 are obtained with a low-pass filtercutoff period of 60 min and a background window of 3-h. Thus,the periods of the GWs detected in the 30–45 km range from 60 to360 min. Decreasing the low-pass filter cutoff period to 30 minwill allow more waves with shorter periods to be included in theRMS perturbation. The shorter-period waves have larger verticalphase speed if similar vertical wavelength can be assumed fordifferent wave spectra. If one further assumes that the verticalgroup velocity is equal to the observed vertical phase speed but isof the opposite direction, the shorter-period waves will be lesslikely to encounter critical levels than the longer-period waves.Thus shorter-period waves have a greater chance of reaching thePMC region, and if the Rothera negative correlation is true, weexpect a stronger negative correlation when shorter-period wavesare included. As for the South Pole, we expect no significantchanges in the correlation when the cutoff period is varied.
We perform the GW spectrum tests in the 30–45 km as follows.The temporal low-pass filter cutoff period is varied from 60-minto 30- and 90-min, respectively while the spatial low-pass filtercutoff wavelength (2 km) is kept the same as before. The rest ofthe steps are the same as in the case of 60-min cutoff. In all caseswe allow the third criterion to remove data points whoseuncertainty is larger than 50% of the RMS perturbation itself.This criterion is applied because both waves and noise can changewith the cutoff period. In fact, the mean signal-to-noise ratiodecreases in the 30-min cutoff case when compared to the 60-mincase. Fortunately, Eq. (3) correctly estimates the bias caused by

ARTICLE IN PRESS
X. Chu et al. / Journal of Atmospheric and Solar-Terrestrial Physics 71 (2009) 434–445 439
the solar background so the RMS relative density perturbationsderived from Eq. (4) for the 30-min cutoff case are still reliableenough for the correlation study. The obtained LCCs for 30-, 60-,and 90-min cutoff are summarized in Tables 2 and 3 for the SouthPole and Rothera, along with the corresponding confidence levels.For Rothera, the LCCs derived from the 23 data points withoutconsidering the standard deviations are �0.54, �0.49, and �0.46with confidence levels of 99%, 98%, and 97% for the three caseswith cutoff periods of 30-, 60-, and 90-min, respectively. RunningMonte Carlo tests within half of the standard deviations for100,000 times, the obtained mean LCCs are �0.4970.07,�0.4370.07, and �0.4070.09 with 97%, 95%, and 92% confidencelevels for 30-, 60-, and 90-min cases. Thus, our tests indicate thatthe negative correlation increases with a shorter cutoff period.Fig. 4 shows the PMC brightness versus GW strength for the casesof 30- and 90-min cutoff periods. Comparing Fig. 4 with Fig. 3, it isclear that the average RMS relative density perturbation in theshorter-period cutoff case is larger than the longer-period casebecause more GWs are included in the shorter-period case. Theincrease trends of both the correlation and the GW RMSperturbation are consistent with our expectation, implying thetrue negative correlation between GW strength and PMC bright-ness at Rothera. For the South Pole, some data points are removedby the third criterion for the 90-min cutoff period case. This maybe understood as while the larger window reduces noise, shorter-period waves are removed more, leading to insignificant RMSperturbation. Fig. 4 shows that the average RMS perturbation
Table 2South Pole linear correlation coefficients between PMC brightness and GW
strength in the 30–45 km
South Pole (30–45 km)
GW period (min) 30a–360 60–360 90–360
GW wavelength (km) 2–30 2–30 2–30
Number of data points 39 37 35
Direct data-point method
LCC 0.09 0.09 0.11
Confidence level (%) 40 42 49
Monte Carlo method (100,000 times run)
LCC7std. 0.0870.05 0.0970.05 0.1170.05
Confidence level (%) 38 39 45
a 30, 60, and 90 min are the different cutoff periods of the low-pass filters used
in GW data analysis.
Table 3Rothera linear correlation coefficients between PMC brightness and GW strength
in the 30–45 km
Rothera (30–45 km)
GW period (min) 30a–360 60–360 90–360
GW wavelength (km) 2–30 2–30 2–30
Number of data points 23 23 23
Direct data-point method
LCC �0.54 �0.49 �0.46
Confidence level (%) 99 98 97
Monte Carlo method (100,000 times run)
LCC7std. �0.4970.07 �0.4370.07 �0.4070.09
Confidence level(%) 97 95 92
a 30, 60, and 90 min are the different cutoff periods of the low-pass filters used
in GW data analysis.
increases with the shorter cutoff period while the LCCs remain atnear-zero values in all three cases. This is consistent withour expectation, indicating no significant correlation at theSouth Pole.
4. Discussion
Comparing our results with previous studies by Gerrard et al.(2004a) at Sondrestrom in the northern hemisphere, the Rotheracorrelation coefficients are very similar to or slightly larger thanthose at Sondrestrom. Gerrard et al. (2004a) used the peak VBC torepresent the PMC brightness and found the LCC between PMCpeak VBC and GW RMS relative density perturbation to be �0.44with a confidence level of 95% from the data points and �0.35with a confidence level of 95% from the Monte Carlo method. Whydoes the negative correlation exist at Rothera and Sondrestrombut no significant correlation exists at the South Pole? In thefollowing we investigate the problem from three aspects: (1) thestratospheric GW strength and spectrum in 30–45 km (wavesource for PMC region), (2) whether these waves can reach thePMC region (wave propagation and breaking), and (3) how GWsreaching the PMC region affect PMC brightness under differentbackground conditions (PMC microphysics).
4.1. Stratospheric GW strength and spectrum in the 30–45 km
altitude range
The first question to ask is whether the stratospheric GWs inthe 30–45 km are much weaker at the South Pole than at the twoother locations. Weaker waves in 30–45 km could lead to weakerwaves at PMC region, resulting in no significant influence onPMCs. The means and standard deviations of the dataset-meanRMS perturbation in Figs. 3(a) and (b) are 0.3970.14% and0.3570.11% for the South Pole and Rothera, respectively. Thisindicates that the GW strengths on PMC days are comparable inthe 30–45 km range at these two locations. To further examine theGW strength we plot in Fig. 5 the histograms of GW RMS relativedensity perturbation for Rothera and the South Pole: the total datain summer from November to February on the left column; thevalues on the days with PMC occurrence (middle column); andthe days without PMC occurrence (right column). Each count inFig. 5 represents the RMS perturbation in a 3-h window. On PMCdays Rothera exhibits a preference of small RMS perturbationswhile the South Pole has a relatively homogeneous distribution.For no PMC days the RMS perturbations are spread out at theSouth Pole from 0.1% to 0.9% while more tightly clustered atRothera. As summarized in Table 4, the mean GW strengths arecomparable within the standard deviations between Rothera andthe South Pole. The observed GW strength and its distributions atRothera are very similar to the results at Sondrestrom (Gerrardet al., 2004a). Thus, the GW strengths in 30–45 km are comparableamong all three locations during the summer. This result is quitesurprising at first, as Rothera should have much strongerorography GW sources than the South Pole. As analyzed in acompanion paper (Yamashita et al., 2008), the similar strength inthe stratosphere between Rothera and the South Pole occurs onlyin summer. During winter months, the Rothera GW potentialenergy densities are �4 times larger than those at the South Pole.The disparity between seasons is most likely due to differentcritical level filtering effects at the two locations between seasons.Yamashita et al. (2008) suggest that in summer the critical levelsbetween the troposphere and the stratosphere filter out mostorography-generated GWs, resulting in similar GW strengthsbetween the two sites. The critical level filtering at Rothera isminimum in winter, allowing most orography GWs to reach the

ARTICLE IN PRESS
0 0.2 0.4 0.6 0.8 10
5
10
14
PM
C T
otal
Bac
ksca
tter C
oeffi
cien
t
South Pole
0.2 0.4 0.6 0.8
0
1
2
3
Rothera
PM
C T
otal
Bac
ksca
tter C
oeffi
cien
t
0 0.2 0.4 0.6 0.8 10
5
10
14
RMS Perturbation (%)0.2 0.4 0.6 0.8
0
1
2
3
RMS Perturbation (%)
30−min Cutoff
90−min Cutoff
30−min Cutoff
90−min Cutoff
Fig. 4. PMC total backscatter coefficient versus GW RMS relative density perturbations in the 30–45 km range at the South Pole (a, b) and Rothera (c, d) for 30-min cutoff
period (a, c) and for 90-min cutoff period (b, d). Each data point represents a dataset-mean PMC TBC and GW RMS perturbation. Error bars represent the uncertainty of GW
RMS perturbation and standard deviation of PMC TBC.
0 0.5 10
10
20
30
Num
ber o
f Occ
urre
nce
Rothera: Total
RMS perturbation (%)0 0.5 1
0
10
20
30PMC day
RMS perturbation (%)0 0.5 1
0
10
20
30No PMC day
RMS perturbation (%)
0 0.5 10
10
20
30
Num
ber o
f Occ
urre
nce
South Pole: Total
0 0.5 10
10
20
30PMC day
0 0.5 10
10
20
30No PMC day
Fig. 5. Comparison of summer gravity wave strengths at the South Pole (upper panels) and Rothera (lower panels): total summer data (a, d), on days with PMC occurrence
(b, e), and on days without PMC (c, f). Data were analyzed using a low-pass filter with a 60-min cutoff period and a 2-km cutoff wavelength. Each data point represents a 3-h
data.
X. Chu et al. / Journal of Atmospheric and Solar-Terrestrial Physics 71 (2009) 434–445440
30–45 km range. Polar vortex and stratospheric jet streams mayalso contribute to the winter enhancement of GW strength atRothera (Yamashita et al., 2008).
The next question to ask is whether the South Pole hasdifferent GW spectra than Rothera. GWs with different spectramay have different chances to approach the critical levels in

ARTICLE IN PRESS
Table 4Statistics of stratospheric GW strength in summer at the South Pole and Rothera
South Pole Rothera
Total PMC day No PMC day Total PMC day No PMC day
Observation (h) 306 222 84 318 210 108
Observation (dataset) 51 37 14 47 23 24
RMSa (%) (mean7std)b 0.4270.18 0.3870.17 0.5170.19 0.3770.15 0.3470.15 0.4170.15
a RMS means the RMS relative density perturbation in the 30–45 km.b The mean and std are the mean and standard deviation of 3-h data points.
2 6 10 14 18 220
20
40
60
80
Vertical Wavelength (km)
Num
ber o
f Occ
urre
nce
0 1 2 3 40
10
20
30
40
50
Vertical Phase Speed (m/s)100 200 300
0
10
20
30
40
Period (min)
2 6 10 14 18 220
20
40
60
80
Vertical Wavelength (km)
Num
ber o
f Occ
urre
nce
0 1 2 3 40
10
20
30
40
50
Vertical Phase Speed (m/s)100 200 300
0
10
20
30
40
Period (min)
Fig. 6. Comparison of stratospheric gravity wave spectra in the 30–45 km altitude region between the South Pole (top) and Rothera (bottom): vertical wavelength (a, d),
vertical phase speed (b, e), and period (c, f). Data were analyzed using a low-pass filter with a 60-min cutoff period and a 2-km cutoff wavelength. Each data point
represents a 3-h data.
X. Chu et al. / Journal of Atmospheric and Solar-Terrestrial Physics 71 (2009) 434–445 441
between the stratosphere and the mesosphere. Different spectraof GWs may also have different effects on PMC microphysics.Illustrated in Fig. 6 are the histograms of summer GW verticalwavelengths, vertical phase speeds, and periods obtained forRothera and the South Pole in the 30–45 km. Each countrepresents a 3-h value. The distributions of vertical wavelengthsand periods at Rothera are similar to those at the South Pole butslightly biased to longer wavelengths and periods. Both locationshave similar distributions of vertical phase speeds. Summarized inTable 5 are the mean characteristics of summer GWs in the30–45 km at the South Pole and Rothera. Within standarddeviations the South Pole and Rothera have comparable GWspectra. The mean vertical phase speeds of 0.7770.65 and0.8070.72 m/s for the South Pole and Rothera are also similar toSondrestrom results of 0.56–0.83 m/s (2–3 km/h). By definitionthe vertical group velocity of GWs is equal to the intrinsic verticalphase speed but with an opposite sign. The ground-based lidarsobserve the ground-relative phase speed, not the intrinsic phasespeed. When assuming the observed and intrinsic frequencies aresimilar, the observed vertical phase speed can be regarded as thevertical group velocity of the waves. Such assumption is reason-
able if the background wind is smaller than the wave horizontalphase speed. Due to the lack of background wind and horizontalwavenumber information, our results stated above are under suchassumption. The similar GW strength and spectrum in the30–45 km cannot account for the different correlations at Rotheraand the South Pole.
4.2. Wave propagation from the stratosphere to the
mesopause region
The third question to ask is whether the stratospheric wavescan reach the PMC regions. This question involves two issues—
whether the waves are filtered out during propagation by thecritical levels between the stratosphere and the PMC region andwhether the waves break before reaching PMC altitudes. Our lidardata cannot provide information on either of these issues.NASA/UARS Reference Atmosphere Project provides a baselinestandard zonal wind model (Swinbank and Ortland, 2003). Itshows the mesospheric jet offset from the South Pole in summerwith considerably stronger zonal wind at the latitude of Rothera

ARTICLE IN PRESS
Table 5Statistics of stratospheric GW spectrum in summer at the South Pole and Rothera
South Pole Rothera
Vertical
wavelength (km)
Period (min) Vertical phase
speed (m/s)
Vertical
wavelength (km)
Period (min) Vertical phase
speed (m/s)
Mean7stda 5.274.8 115742 0.7770.65 5.774.4 128740 0.8070.72
Range—min–max 2.0–19.7 67–341 0.17–3.37 2.0–21.8 67–269 0.19–3.58
a The mean and std are the mean and standard deviation of 3-h data points.
X. Chu et al. / Journal of Atmospheric and Solar-Terrestrial Physics 71 (2009) 434–445442
than at the South Pole. As a result, vertically propagating GWsover Rothera would encounter a wide range of wind velocitiescompared with the weak stratospheric and mesospheric windsover the pole. Sondrestrom in the northern hemisphere hassimilar westward wind patterns as Rothera in summer. Therefore,the South Pole is unlikely to have stronger critical level filteringeffects from the stratosphere to the mesopause than Rothera andSondrestrom if we assume the wave propagation directionalityrelative to background wind being similar among three stations.
The wave directional information is very important indetermining whether the stratospheric waves can affect overlyingPMCs (Gerrard et al., 2004b). The critical level is reached onlywhen the wave vector is the same as the background wind. If GWsat the South Pole were filtered out before reaching the PMCregion, there would be no correlation between PMCs and GWs.Although possible, it is unlikely the case from a statistical point ofview. If waves propagate horizontally away from the observationsite, they may not affect overlying PMCs. With a ray tracing modelGerrard et al. (2004b) showed that the waves observed at �40 kmwere part of the same wave field affecting PMCs �80 km atSondrestrom. They also showed that the wave breaking effect onPMCs discussed by Fritts et al. (1993) and Gerrard et al. (2004a)was largely absent for many waves simulated in their model. Lackof horizontal wave propagation information for the South Poleand Rothera prevents us from drawing any conclusions on thewave propagation issue. We do not know whether Rothera and theSouth Pole have the same amplitudes of GWs at the mesopausealtitudes. We would like to measure and better model them infuture studies.
4.3. GW influences on PMC microphysics
We now turn our attention to the issue of how the GWs thatreach the PMC region influence PMC under different backgroundconditions. Jensen and Thomas (1994) pointed out that the GWeffects on PMCs are twofold: the dynamical effects due to wave-induced wind perturbations, and the microphysical effects due towave-induced temperature perturbations. The wave-inducedwind perturbations can cause the undulation of PMC layers andcause the convergence and divergence of the number density ofPMC particles. These mechanisms could be responsible for thewave structures in NLC observed from the ground with very lowelevation angles (see Figs. 1 and 2 of Jensen and Thomas, 1994).However, excluding changes in cloud microphysical propertiescaused by wave dynamics, the dynamical effects should not alterthe lidar-measured PMC TBC for two reasons. First, the lidar beamwas pointed vertically and TBC is the integration of the entire PMClayers. Thus, the altitude shift of PMC layers will not affect theobtained TBC. Second, our statistical study takes the dataset-meanTBC so the periodic convergence and divergence effects of particlenumber density will be averaged out. Therefore, if the lidarobserves any correlation between PMC and GW, it has to comefrom the microphysical effects driven by the wave-induced
temperature perturbations. Rapp et al. (2002) included GWs in2-D simulations of PMC formation using wave parametersdetermined from lidar measurements. They showed that thewave-driven wind and temperature perturbations could modulateice crystal sizes and PMC optical properties. They concluded thatGWs with periods longer than 6.5 h tend to amplify PMCbrightness, whereas shorter waves tend to destroy the clouds.Thayer et al. (2003) concluded based on observations that GWswith periods of 2–3 h reduce PMC brightness.
Before analyzing how GWs influence PMC microphysics, wewant to point out the obvious differences among the threesites—PMCs at the South Pole are much brighter and morefrequent than the clouds at Rothera and Sondrestrom. Chu et al.(2003, 2006) reported the means of hourly PMC TBC being5.43�10�6 sr�1 for the South Pole and 2.34�10�6 sr�1 forRothera. The mean of hourly PMC TBC at Sondrestrom, afterconverted to 374 nm as used by the Fe Boltzmann lidar, is2.4672.30�10�6 sr�1, comparable to the PMC brightness atRothera (Chu et al., 2006). Chu et al. (2003) reported anoccurrence frequency of 67.4% over the entire PMC season, andPMCs occur nearly 100% of the time in the middle of the season atthe South Pole. Rothera and Sondrestrom only have around 20%occurrence frequency (Chu et al., 2006; Thayer and Pan, 2006).The differences in PMC brightness and occurrence frequency are areflection of the differences in the background atmosphericconditions. Temperature and water vapor are the two key factorsin determining the formation, development, and sublimation ofPMC ice particles. TIME-GCM simulation shows that the SouthPole summer temperatures at mesopause altitude (�87 km) areabout 10–15 K colder than those at Rothera latitude (Xu et al.,2007) while SABER measurements (version 1.06) show that theDecember mesopause at 67.51S is about 5 K warmer than themesopause at 851S (Xu et al., 2007). The version 1.07 of SABERdata exhibits that the mesopause temperature difference between801S and 67.51S is increased to 12–15 K, very similar to the TIME-GCM simulations, although there are discrepancies in the absolutetemperatures between SABER and TIME-GCM (Jiyao Xu, State KeyLaboratory of Space Weather, Chinese Academy of Sciences,private communication, 2008). Thus, it is clear that the SouthPole summer mesopause region is much colder than that ofRothera and Sondrestrom. Assuming the same water vapor mixingratio (reliable measurements of the global distribution of watervapor mixing ratio in MLT region are not available), the South Polehas much larger supersaturations with respect to ice than Rotheraand Sondrestrom. Thus, more and/or larger ice particles can format the South Pole, leading to brighter clouds.
As an air parcel rises and falls under the influence of aGW, the corresponding expansion and compression will induceadiabatic cooling and warming, leading to an oscillation of the airparcel temperature. In the typical summertime conditions at PMCaltitudes, water vapor saturation with respect to ice occurs around150 K. If the parcel temperature oscillates around a mean slightlylower than 150 K, the PMC ice particles inside the air parcel willexperience temperatures above 150 K (subsaturation) for part of

ARTICLE IN PRESS
X. Chu et al. / Journal of Atmospheric and Solar-Terrestrial Physics 71 (2009) 434–445 443
the oscillation period and below 150 K (supersaturation) for therest of the period. Due to the exponential dependence of theequilibrium water vapor pressure (i.e., the saturation vaporpressure) on temperature, the sublimation of the ice particles inthe subsaturated period is much faster than the growth by watervapor deposition on the ice surfaces in the supersaturated period.Thus, the effect of the waves is to reduce particle size and decreasePMC brightness. This mechanism can explain the negativeinfluences of short-period GWs on mature PMCs. Here the shortperiod is relative to the PMC growth timescale: when the PMCgrowth timescale is much longer than the wave period, thegrowth in the cold phase of the wave is very minor compared tothe sublimation in the warm phase. Besides destroying maturePMC ice particles, GWs can also prevent new PMC formation.Jensen and Thomas (1994) found from their model test that themesopause region temperatures had to be 5 K colder for PMC toform when GWs present. However, regardless of shifts in themesospheric temperature profile, maximum PMC brightness willoccur at the height where the saturation ratio is unity andice crystals reach their maximum size. Hence, the influence ofGWs on mature PMCs will likely be similar at Rothera and theSouth Pole.
The negative GW–PMC correlations observed at Rothera andSondrestrom may be a result of relatively warm temperatures(and correspondingly low supersaturations) in the altitude regionbetween the PMC altitude and the mesopause where ice crystalsgrow and sediment. If the supersaturations are small, then GWtemperature perturbations can drive subsaturation in the warmphase of the wave, which could either reduce the size of icecrystals present or completely sublimate them. Ultimately, thePMC resulting from the sedimenting ice crystals will havediminished brightness even if the ice crystals survive to make acloud. In contrast, at the South Pole where it is much colder in theregion between the PMCs and the mesopause, supersaturationsare generally large, ice crystals will continue growing even withGW temperature perturbations, and the impact of GW on PMCbrightness will be relatively weaker than at Rothera. Thishypothesis is consistent with the much higher PMC occurrencefrequency at the South Pole than at Rothera. A schematic is shownin Fig. 7 to illustrate the above idea.
Latitude
Tem
pera
ture
South Pole
Frost Point
Fig. 7. A schematic to illustrate the idea of how the background temperatures in
the ice crystal growth-sedimentation region between the PMC altitude and the
mesopause influence PMC responses to gravity waves at different latitudes: A
snapshot of the gravity wave perturbed temperatures versus latitudes. The thicker
solid-line is the background temperature in this region, the periodic oscillation
represents the GW-induced temperature perturbation, and the dotted line
indicates the frost point temperature (�150 K) for typical summertime conditions
in mesopause region.
It is also likely that gravity-wave-induced temperature pertur-bations will increase the number density of ice crystals nucleatedin the mesopause region. Regardless of whether meteor smokeparticles or proton-hydrate ions are the dominant ice nuclei, thenumber of ice crystals nucleated increases rapidly with decreasingtemperature (Rapp and Thomas, 2006). Since wave-driventemperature perturbations decrease the minimum temperatures,they will cause sporadic nucleation of larger ice concentrationsthan would occur without the waves. However, the backscattercoefficient is proportional to the fifth or sixth power of radius.Thus, for a given ice mass in the clouds, increasing the number ofice crystals (and correspondingly decreasing their size) shoulddecrease the cloud brightness. It should be noted here that we areexamining the correlation between GW and PMC brightnessdirectly overhead. Ice nucleation events and the resulting PMCsare often separated by large times and distances (Berger and vonZahn, 2007). Hence, even if GWs have a strong influence on icenucleation processes, one might not expect to see a correlation inthe zenith lidar data.
Even if the atmosphere is highly supersaturated over theSouth Pole such that GWs do not drive sublimation in the icecrystal growth-sedimentation altitude region, the wave-driventemperature perturbations will still modulate the ice crystalgrowth rates. Given the nonlinearity of the Clausius–Clapeyronvapor pressure temperature dependence, the temperature fluc-tuations will tend to decrease the mean particle size. However, theincreased growth rates in the cold phase of the waves anddecreased growth rates in the warm phase could also increase thewidth of the ice crystal size distribution. Given the extremelystrong dependence of PMC brightness on particle size discussedabove, it is possible that a wave-driven extension of the tail of thesize distribution on the large end has a more important effect onmean PMC brightness than the decrease in mean particle size.Although this mechanism is purely speculative and microphysicalmodeling will be required to test the hypothesis, it might providean explanation for the population of the data points at the SouthPole suggesting a positive correlation between GW strength andPMC brightness.
5. Conclusions
Fe Boltzmann lidar data collected from the South Pole andRothera (67.51S), Antarctica are used to study the PMC brightnessresponse to stratospheric GW perturbations in the 30–45 km. ThePMC brightness is represented by the TBC of PMC layers and theGW strength is expressed through the RMS relative densityperturbation in the 30–45 km range. A LCC is derived between thePMC TBC and the GW RMS perturbation to characterize theGW–PMC correlation. With the 60-min cutoff period and 2-kmcutoff wavelength low-pass filter, a negative LCC of –0.49 with a98% confidence level is found between GW strength and the PMCbrightness at Rothera, while the LCC at the South Pole is 0.09 withan 42% confidence level. The negative correlation coefficient atRothera increases to �0.54 (99%) with the 30-min cutoff periodand decreases to�0.46 (97%) with a 90-min cutoff. The South Polecorrelation coefficient remains near zero through all cases.Therefore, the lidar observations show that the PMC brightnessis negatively correlated with the stratospheric GW strength in the30–45 km at Rothera while there is no significant correlation atthe South Pole. The negative correlation at Rothera is statisticallysignificant as the confidence level is above 95% and it is alsosimilar to or slightly larger than the correlation observed atSondrestrom (67.01N), Greenland.
Our lidar observations show that GW strength and spectrum inthe 30–45 km are comparable among the South Pole, Rothera, and

ARTICLE IN PRESS
X. Chu et al. / Journal of Atmospheric and Solar-Terrestrial Physics 71 (2009) 434–445444
Sondrestrom in summer. For the GWs that reach the PMC region,the dynamical effects, i.e., the wave-induced wind perturbations,cannot alter the lidar-measured TBC (i.e., PMC brightness) so theyare not responsible for the observed correlation. The lidarobserved GW–PMC correlation is most likely a result of themicrophysical effects driven by the wave-induced temperatureperturbations. The different PMC brightness responses to GWs arelikely caused by the different background temperatures in the icecrystal growth-sedimentation region between the PMC altitude(�84–85 km) and the mesopause (�88 km). As the Rotheratemperatures in this region are typically not far below the frostpoint, the GW-induced temperature perturbations can drivesubsaturation in the warm phase, destroying or limiting thegrowth of sedimenting ice crystals, and diminishing cloudbrightness. This mechanism can explain the negative responseat Rothera. However, the South Pole mesopause temperature ismuch colder and well below the frost point in the mesopauseregion. GW-perturbed temperatures may never be above the frostpoint. Thus, GWs may have a relatively weaker impact on PMCbrightness at the South Pole than at Rothera. It is also possiblethat GWs are filtered out before reaching PMC region thus leadingto no correlation between PMCs and GWs at the South Pole. Also,if waves propagate horizontally away from the observation site,they may not affect the overlying PMCs. Lack of background windand wave propagation directional information prevents us fromdrawing any conclusions on the wave propagation issue. Thisshould be addressed by future studies.
This study provides the first observational proof that PMCbrightness responds to stratospheric GWs differently at differentlatitudes. This is very likely due to the latitudinal differences inbackground temperatures. At very high latitudes (�801) when themesopause temperature is far below the frost point, GWs mayhave very little influence on PMC brightness, similar to what weobserved at the South Pole. Consequently, no GW signatureswould be seen on PMC brightness. This may explain thephenomena observed by AIM/CIPS that wave signatures are notseen on PMC images at high latitudes but are very evident at NLClatitudes (Chandran et al., 2008). The proposed mechanismsabove, including GW influence on ice particle nucleation, need tobe verified through future modeling of gravity-wave effects onPMC. Furthermore, the different populations of ice particles at theSouth Pole indicated by the lidar observations await theoreticalexplanations and future modeling.
Acknowledgements
We sincerely acknowledge David J. Maxfield, Jan C. Diettrich,and the staff of the British Antarctic Survey and the RotheraResearch Station for their support through the entire campaign atRothera. We also acknowledge two winter-over scientists, AshrafEl Dakrouri and John Bird, and the staff of Amundsen-Scott SouthPole Station for their help and support in collecting data at theSouth Pole. We appreciate the valuable discussion with Gary E.Thomas and Hans G. Mayr. We sincerely acknowledge Jiyao Xu forproviding us the temperature comparison results with SABERversion 1.07 data. We are very grateful to Chester S. Gardner,George C. Papen, Robert Kerr and Robert Robinson for theirinspiration and support. The Rothera lidar project was supportedby the UK Natural Environmental Research Council and by theUnited States National Science Foundation (NSF) Grant ATM-0602334. X.C., C.Y., and W.H. were partially supported by NSFCAREER Grant ATM-0645584, NSF CEDAR Grant ATM-0632501,and NSF CRRL Grant ATM-0545353. C.Y. sincerely acknowledgesthe generous support of NCAR Newkirk Graduate Fellowship.H.L.L.’s effort is in part supported by the Office of Naval Research
(N00014-07-C0209). National Center for Atmospheric Research issponsored by the National Science Foundation.
References
Berger, U., von Zahn, U., 2007. Three-dimensional modeling of the trajectories ofvisible noctilucent cloud particles: an indication of particle nucleation wellbelow the mesopause. Journal of Geophysical Research 112, D16204.
Chandran, A., Rusch, D.W., Palo, S.E., Thomas, G.E., Taylor, M.J., 2008. Gravity waveobservations in the summertime polar mesosphere from the Cloud Imagingand Particle Size (CIPS) experiment on the AIM spacecraft. Journal ofAtmospheric and Solar-Terrestrial Physics, this issue.
Chanin, M.-L., Hauchecorne, A., 1981. Lidar observations of gravity and tidal wavesin the stratosphere and mesosphere. Journal of Geophysical Research 86,9715–9721.
Chu, X., Gardner, C.S., Papen, G., 2001a. Lidar observations of polar mesosphericclouds at South Pole: seasonal variations. Geophysical Research Letters 28,1203–1206.
Chu, X., Gardner, C.S., Papen, G., 2001b. Lidar observations of polar mesosphericclouds at South Pole: diurnal variations. Geophysical Research Letters 28,1937–1940.
Chu, X., Pan, W., Papen, G., Gardner, C.S., Gelbwachs, J., 2002. Fe Boltzmantemperature lidar: design, error analysis, and initial results at the North andSouth Pole. Applied Optics 41, 4400–4410.
Chu, X., Gardner, C.S., Roble, R.G., 2003. Lidar studies of inter annual, seasonal anddiurnal variations of polar mesospheric clouds at the South Pole. Journal ofGeophysical Research 108 (D8), 8447.
Chu, X., Nott, G.J., Espy, P.J., Gardner, C.S., Diettrich, J.C., Clilverd, M.A., Jarvis, M.J.,2004. Lidar observations of polar mesospheric clouds at Rothera, Antarctica(67.51S, 68.01W). Geophysical Research Letters 31, L02114.
Chu, X., Espy, P.J., Nott, G.J., Diettrich, J.C., Gardner, C.S., 2006. Polar mesosphericclouds observed by an iron Boltzmann lidar at Rothera (67.51S, 68.01W),Antarctica from 2002–2005: properties and implications. Journal of Geophy-sical Research 111, D20213.
DeLand, M.T., Shettle, E.P., Thomas, G.E., Olivero, J.J., 2003. Solar backscatteredultraviolet (SBUV) observations of polar mesospheric clouds (PMCs) over twosolar cycles. Journal of Geophysical Research 108 (D8), 8445.
DeLand, M.T., Shettle, E.P., Thomas, G.E., Olivero, J.J., 2007. Latitude-dependentlong-term variations in polar mesospheric clouds from SBUV version 3 PMCdata. Journal of Geophysical Research 112, D10315.
Fiedler, J., Baumgarten, G., von Cossart, G., 2005. Mean diurnal variations ofnoctilucent clouds during 7 years of lidar observations at ALOMAR. AnnalesGeophysicae 23, 1175–1181.
Fritts, D.C., Isler, J.R., Thomas, G.E., 1993. Wave breaking signatures in noctilucentclouds. Geophysical Research Letters 20, 2039–2042.
Gadsden, M., 1998. The north-west Europe data on noctilucent clouds: a survey.Journal of Atmospheric and Solar-Terrestrial Physics 60, 1163–1174.
Gadsden, M., Schroder, W., 1989. Noctilucent Clouds. Springer, New York.Gardner, C.S., Miller, M.S., Liu, C.H., 1989. Rayleigh lidar observations of gravity
wave activity in the upper stratosphere at Urbana, Illinois. Journal of theAtmospheric Sciences 46, 1838–1854.
Gerrard, A.J., Kane, T.J., Thayer, J.P., 1998. Noctilucent clouds and wave dynamics:observations at Sondrestrom, Greenland. Geophysical Research Letters 25,2817–2820.
Gerrard, A.J., Kane, T.J., Thayer, J.P., Eckermann, S.D., 2004a. Concerning theupper stratospheric gravity wave and mesospheric cloud relationship overSondrestrom, Greenland. Journal of Atmospheric and Solar-Terrestrial Physics66, 229–240.
Gerrard, A.J., Kane, T.J., Eckermann, S.D., Thayer, J.P., 2004b. Gravity waves andmesospheric clouds in the summer middle atmosphere: a comparison of lidarmeasurements and ray modeling of gravity waves over Sondrestrom, Green-land. Journal of Geophysical Research 109 (D10), D10103.
Hecht, J.H., Thayer, J.P., Gutierrez, D.J., McKenzie, D.L., 1997. Multi-instrumentzenith observations of noctilucent clouds over Greenland on July 30/31, 1995.Journal of Geophysical Research 102 (D2), 1959–1970.
Hervig, M., Thompson, R.E., McHugh, M., Gordley, L.L., Russell III, J.M., Summers,M.E., 2001. First confirmation that water ice is the primary component of polarmesospheric clouds. Geophysical Research Letters 28, 971–974.
Hostetler, C.A., Gardner, C.S., 1990. Rayleigh lidar signal processing techniques forstudies of stratospheric temperature structure and dynamics, EOSL paper 90-003, University of Illinois at Urbana-Champaign.
Jensen, E.J., Thomas, G.E., 1994. Numerical simulations of the effects ofgravity waves on noctilucent clouds. Journal of Geophysical Research 99,3421–3430.
Merkel, A.W., Thomas, G.E., Palo, S.E., Bailey, S.M., 2003. Observations of the 5-dayplanetary wave in PMC measurements from the student nitric oxide explorersatellite. Geophysical Research Letters 30 (4), 1196.
Portman, R.W., Thomas, G.E., Solomon, S., Garcia, R.R., 1995. The importance ofdynamical feedbacks on doubled CO2-induced changed in the thermalstructure of the mesosphere. Geophysical Research Letters 22, 1733–1736.
Press, W.H., Flannery, B.P., Teukolsky, S.A., Vetterling, W.T., 1986. NumericalRecipes: The Art of Scientific Computing. Cambridge University Press,New York.

ARTICLE IN PRESS
X. Chu et al. / Journal of Atmospheric and Solar-Terrestrial Physics 71 (2009) 434–445 445
Rapp, M., Thomas, G.E., 2006. Modeling the microphysics of mesospheric iceparticles: assessment of current capabilities and basic sensitivities. Journal ofAtmospheric and Solar-Terrestrial Physics 68, 71–744.
Rapp, M., Lubken, F.-J., Mullemann, A., 2002. Small-scale temperature variations inthe vicinity of NLC: experimental and model results. Journal of GeophysicalResearch 107 (D19), 4392.
Senft, D.C., Gardner, C.S., 1991. Seasonal variability of gravity wave activity andspectra in the mesosphere region at Urbana. Journal of Geophysical Research96, 17229–17264.
Stevens, M.H., Meier, R.R., Chu, X., DeLand, M.T., Plane, J.M.C., 2005. Antarcticmesospheric clouds formed from space shuttle exhaust. Geophysical ResearchLetters 32, L13810.
Swinbank, R., Ortland, D.A., 2003. Compilation of wind data for the upperatmosphere research satellite (UARS) reference atmosphere project. Journal ofGeophysical Research 108 (D19), 4615.
Thayer, J.P., Pan, W., 2006. Lidar observations of sodium density depletions in thepresence of polar mesospheric clouds. Journal of Atmospheric and Solar-Terrestrial Physics 68, 85–92.
Thayer, J.P., Rapp, M., Gerrard, A.J., Gudmundsson, E., Kane, T.J., 2003. Gravitywave influences on Arctic mesospheric clouds as determined by a Rayleighlidar at Sondrestrom, Greenland. Journal of Geophysical Research 108 (D8),8449.
Thomas, G.E., 1991. Mesospheric clouds and the physics of the mesopause region.Reviews of Geophysics 29, 553–575.
Thomas, G.E., 1996. Global change in the mesosphere–lower thermosphere region:has it already arrived? Journal of Atmospheric and Solar-Terrestrial Physics 58,1629–1656.
Thomas, G.E., Olivero, J.J., 2001. Noctilucent clouds as possible indicators of globalchange in the mesosphere. Advances in Space Research 28, 937–946.
Thomas, G.E., Olivero, J.J., Jensen, E.J., Schroeder, W., Toon, O.B., 1989. Relationbetween increasing methane and the presence of ice clouds at the mesopause.Nature 338, 490–492.
Turco, R.P., Toon, O.B., Whitten, R.C., Keesee, R.G., Hollenback, D., 1982. Noctilucentclouds: simulation studies of their genesis, properties, and global influences.Planetary and Space Science 30, 1147–1181.
von Zahn, U., von Cossart, G., Fiedler, J., Rees, D., 1998. Tidal variations ofnoctilucent clouds measured at 691N latitude by ground based lidar.Geophysical Research Letters 25, 1289–1292.
Wilson, R., Chanin, M.L., Hauchecorne, A., 1991a. Gravity waves in the middleatmosphere observed by Rayleigh lidar 1. Case studies. Journal of GeophysicalResearch 96, 5153–5167.
Wilson, R., Chanin, M.L., Hauchecorne, A., 1991b. Gravity waves in the middleatmosphere observed by Rayleigh lidar 2. Climatology. Journal of GeophysicalResearch 96, 5169–5183.
Witt, G., 1962. Height, structure and displacements of noctilucent clouds. Tellus 14 (1), 1.Xu, J., Liu, H.-L., Yuan, W., Smith, A.K., Roble, R.G., Mertens, C.J., Russell III, J.M.,
Mlynczak, M.G., 2007. Mesopause structure from Thermosphere, Ionosphere,Mesosphere, Energetics, and Dynamics (TIMED)/Sounding of the AtmosphereUsing Broadband Emission Radiometry (SABER) observations. Journal ofGeophysical Research 112, D09102.
Yamashita, C., Chu, X., Liu, H.-L., Espy, P.J., Nott, G.J., Huang, W., 2008. Stratosphericgravity wave characteristics and seasonal variations observed by lidar at theSouth Pole and Rothera, Antarctica. Journal of Geophysical Research, submittedfor publication.