Resilient Control and Intrusion Detection ... - eScholarship.org
Atmospheric Environment 34 (2000) 1355}1365
Stratospheric ozone intrusion episodes recorded at Mt. Cimoneduring the VOTALP project: case studies
P. Bonasoni!,*, F. Evangelisti!, U. Bonafe!, F. Ravegnani!, F. Calzolari!, A. Stohl",L. Tositti#, O. Tubertini#, T. Colombo$
!Istituto per lo Studio dei Fenomeni Fisici e Chimici della Alta e Bassa Atmosfera, Consiglio Nazionale delle Ricerche,Via Gobetti 101, I-40129, Bologna, Italy
"Lehrstuhl fur Bioklimatologie und Immissionsforschung, Ludwig-Maximilians-Universita( t Munchen, Am Hochanger 13,D-85354 Freising- Weihenstephan, Germany
#Laboratorio di Radiochimica Ambientale, Dipartimento di Chimica, Universita% di Bologna, Via Selmi2, I-40126, Bologna, Italy$Centro Aeronautico di Montagna, Servizio Meteorologico Aeronautica Militare, Via delle Ville 100, 41029 Sestola (Mo), Italy
Received 25 January 1999; received in revised form 10 May 1999; accepted 28 May 1999
Abstract
Continuous measurements of ozone concentrations performed at baseline stations on high mountain summits allowstratosphere}troposphere exchange events to be monitored and their variability over small scales to be studied. In thispaper we present two characteristic episodes related to lower stratosphere/upper troposphere vertical transportregistered at Mt. Cimone during the VOTALP project and we highlight the use of carbon monoxide (CO) and carbondioxide (CO
2) as non-conventional tracers of lower stratospheric air masses. In this way, stratosphere}troposphere
exchange events transporting high ozone concentration into the troposphere have been identi"ed by an accurate analysisof the CO and CO
2behaviour. Moreover, three-dimensional ensemble trajectories, satellite maps (water vapour and total
ozone), ground-based ozone measurements and ozone-soundings have been analysed together with conventional tracersas 7Be and relative humidity as well as the normalised fraction f (7Be, 210Pb) in order to fully characterise the examinedevents. ( 2000 Elsevier Science Ltd. All rights reserved.
Keywords: Surface ozone; Carbon dioxide; Carbon monoxide; Tropopause folding; Cut-o! low; Stratospheric tracers
1. Introduction
An increase in surface ozone at all altitudes betweensea level and the free troposphere has been measuredduring the last decades in Europe. In particular, ozoneconcentrations have increased by almost a factor of twobetween the 1950s and the 1990s as reported by Low etal. (1990) and Staehelin et al. (1994). This rise is asso-ciated with increasing emissions of ozone precursors,which lead to photochemical ozone production in theboundary layer and in the free troposphere. Althoughonly 0.1% of ozone produced in the stratosphere leaksinto the troposphere (Crutzen, 1995), the contribution of
*Corresponding author.
vertical transport between the lower stratosphere and thetroposphere cannot be entirely neglected (Follows andAustin, 1992). Consequently, the stratosphere}tropo-sphere exchange (STE) is a signi"cant process for thebudget of ozone in the free troposphere. Nevertheless,STE is worth being investigated for a better knowledge ofbehaviour of the other trace gases that show di!erentconcentrations in the stratosphere and troposphere.
Observations at mountain top baseline stations, e.g. inthe Alps or the Apennines, allow STE events to be betterstudied than by measurements in the #atlands. The STEshort-time-scale variability can be studied by continuousmeasurements of surface ozone and other related atmo-spheric compounds, together with a systematic monitor-ing of stratospheric tracers. This approach, supported byclimatological model studies (Stohl et al., 1999), allows
1352-2310/00/$ - see front matter ( 2000 Elsevier Science Ltd. All rights reserved.PII: S 1 3 5 2 - 2 3 1 0 ( 9 9 ) 0 0 2 8 0 - 0
the contribution of stratospheric ozone that directly orindirectly reaches the lower troposphere to be revealed.This is one of the topics of the EC project `VerticalOzone Transports in the Alpsa (VOTALP), combiningmodels of various complexities with baseline mea-surements undertaken at selected mountain peaks:Jungfraujoch, Sonnblick, Zugspitze and Mt. Cimone. Incontrast to the other stations situated in the Alps, Mt.Cimone (MTC) lies in the Northern Apennines. It isinvolved in continuous baseline measurements of ozone,carbon monoxide, carbon dioxide (by the Italian AirForce Meteorological Service), radioactive cosmogenicand natural compounds. At this station, during theVOTALP project, we identi"ed 26 events of high ozonelevels associated with lower stratosphere/upper tropo-sphere vertical transports within a period of 2 years. Thisvalue agrees with those reported by Reiter (1991) (1}2days per month) and Elbern et al. (1997) (195 cases overa 10 year period) at the Zugspitze summit (2962 m a.s.l.)in the Northern Alps. Some of the episodes recorded atMTC have been revealed as tropopause foldings andcut-o! lows, which are the most important STE pro-cesses, normally described through conventional me-teorological (relative humidity), chemical (ozone),radiochemical (7Be) and dynamical (potential vorticity)tracers. Less frequently the study of STE is based on theanalysis of non-conventional tracers, as carbon monox-ide and carbon dioxide, which can help to identifystratospheric intrusion events when some conventionaltracers present ambiguous behaviour. Evidence for STErelated to intense deformation of the tropopause (Ancel-let et al., 1994) during cut-o! low or tropopause foldingevents can also be obtained from satellite total ozonemaps (TOMS, TOVS, SBUV-2, GOME), where a localozone maximum can be observed, separated from thesurroundings by very steep gradients in total ozone,typically 100 DU/500 km (WMO, 1985). Ground-basedDobson, Brewer and UV}Vis spectrometer measure-ments and ozone-soundings provide further informationabout the total ozone amount and its vertical pro"leduring stratospheric ozone intrusion episodes.
In this paper we discuss two episodes of elevated sur-face ozone concentrations observed at Mt. Cimonein 1996, which were attributed to cut-o! low andtropopause folding. In the "rst episode (cut-o! low),characterised by unusual high relative humidity values,the analysis was accomplished by using the behaviour ofthe non-conventional tracer CO, as well as water vapourmap, ozone pro"les, total ozone maps and Dobsonmeasurements. Dynamical and thermodynamical tracers,probably as a consequence of their low temporal resolu-tion, have not yet supported this episode which, on thecontrary, was unambiguously detected by the CO andO
3chemical tracers. In the tropopause folding episode,
well identi"ed by conventional tracers (O3, RH, 7Be) we
realised that CO2
concentrations were useful to charac-
terise an air mass coming from the stratosphere. In fact,during the warm season the registered steady concentra-tion of this non-conventional tracer, higher than its nor-mal tropospheric value, is typical of an air mass, whichoriginated in the lower stratosphere where sources orsinks of carbon dioxide are not present.
2. Experimental
Mt. Cimone (44312@ N, 10342@ E) is the highest peak ofthe Northern Apennines (2165 m a.s.l.) that divide thenorth of Italy, including the Po Valley, from central Italyand the Mediterranean basin. Besides having a 3603 freehorizon, MTC has an elevation such that the measure-ment station lies above the planetary boundary layerduring most of the year. Moreover, MTC can be a!ectedby intense cyclogenetic activity often originating in thenear Gulf of Genoa area (Buzzi et al., 1984; Davies andSchuepbach, 1994). The site is considered the most repre-sentative WMO-GAW weather station in Italy (WMO,1994) and recently the ozone monitoring program activelycontributes to the new World Data Centre for SurfaceOzone (WDCSO3). Details of the site description werereported in a previous paper (Bonasoni et al., 1997).
The MTC laboratory operates automatically, the mea-sured parameters being averaged on a 1-min basisand transmitted daily to the FISBAT-CNR Institute inBologna. The intake line of sample air is 2 m above theroof and 10 m above the ground and consists of a glasstube through which the sampled air is passed at a con-stant #ow rate. Those parts of the system that are outsidethe building are heated to prevent ice formation duringthe cold season. Inside the building the analysers drawtheir sample air via a manifold pipe "tted to a glass tube.An overvoltage and lightning protection system is usedto prevent damage to the instrumentation and to ensurethe continuity of the measurements.
Surface ozone concentration measurements are carriedout by using two UV-photometric analysers (Dasibi 1108W/GEN and Dasibi 1003) operating simultaneously,which are calibrated six times a year by an ozone calib-rator (Dasibi 1108 PC). Zero and span checks are auto-matically performed every 24 h, while the accuracy andprecision are $2 ppb. The CO analyser is made up of anassembled gas chromatographic system coupled to a re-duction gas detector and is automated through a com-puter controlling the whole system by means of twointerfaces. Its accuracy and precision is approximately$2 ppb. The air intake is 1 m above the roof and 10m above the ground. CO data have a bi-hourly frequencyfollowing previous practice (Corazza and Tesi, 1995),while details of the CO experimental set-up are reportedin Bonasoni et al. (1997). The CO
2measurement system
has been operating continuously since March 1979(Colombo et al., 1994) and the accuracy and precision are
1356 P. Bonasoni et al. / Atmospheric Environment 34 (2000) 1355}1365
$0.1 ppm. The air sample intake is 15 m above theground and carbon dioxide values are determined ina dry air by a NDIR-analyser, calibrated every 6 h andcontrolled by a computer in which the data are storedevery 10 min.
7Be and 210Pb are determined at 477.6 and 46.7 keV,respectively, by direct c-spectrometry of aerosol samples,collected by a PM-10 High Volume Sampler (ThermoEnvironmental Instruments Inc. } Flow rate"1.13 m3 min~1) on glass "bre "lters, using a n-type intrin-sic Hyper Pure Ge detector (relative e$ciency"38%;full-width at half-maximum"2.03 at 1332 keV). Spectraare processed with a speci"c software package (Silgamma} EMCA II). The time resolution of each sample is 48 hand the sampled volume amounts to approximately 3250m3. The samples are conditioned at a constant temper-ature (203C) and relative humidity (30%) in order todetermine the aerosol mass loading.
3. Ozone and vertical exchange
The MTC surface ozone concentrations usually ex-hibit a minimum in the winter, a principal maximum inthe summer and a secondary maximum in the spring asoften observed at background monitoring sites (Beek-mann et al., 1994; Scheel et al., 1997). During most part ofthe year no evident diurnal variation in surface ozone ispresent at MTC, except during the warm season whena reverse diurnal variation of ozone occurs. This reversediurnal variation, as reported from other baseline moun-tain stations (Oltmans, 1981; Aneja et al., 1991), is charac-terised by ozone values around midday being lower thannighttime values (Colombo et al., 1992) and are as-sociated with a mountain wind regime (anabatic windduring the day, katabatic wind during the night). Thestatistical analysis of ozone hourly mean values performedon the 1996}1997 summer data shows that the di!erencebetween the night and day values is about 5 ppbv.
Stratospheric ozone intrusion events at Mt. Cimonehave been identi"ed both by meteorological analyses,measurements of chemical (O
3, CO and CO
2), meteo-
rological (relative humidity) and cosmogenic (7Be)parameters and by studying Three Dimensional BackTrajectory (3DBT) and potential vorticity. In particular,high concentrations of 7Be are indicative for stratos-pheric intrusions. For instance, Reiter et al. (1983) sug-gested a threshold value of 8 mBq/m3, above which an airmass probably has stratospheric characteristics. It is im-portant to note that the e!ective lifetime of the 7Be in thetroposphere is determined by the physical lifetime of thecarrier aerosol versus its radioactive lifetime. This hasthe implication that wet scavenging can a!ect the roleof 7Be as a stratospheric tracer under certain weatherconditions. For this reason, in an attempt to obtainclearer information about the stratospheric origin of the
air mass, we considered the normalised fraction f (7Be,210Pb)"(7Be)/(7Be# n210Pb), where n is approximatedby the ratio of the standard deviation of (7Be) to thestandard deviation of (210Pb) in the sample set, as sugges-ted by Graustein and Turekian (1996). This expression,based on the use of independent radionuclides with thesame fate in the atmosphere, represents the relative vari-ation of cosmogenic 7Be to crustal 210Pb. Thus, thenormalised fraction f (7Be, 210Pb) is not a!ected by wetscavenging, assuming that both 7Be and 210Pb are scav-enged at a similar rate. High values of f (7Be, 210Pb), inthe 0}1 range, are associated with upper atmosphere airmasses, low values with boundary layer air masses(Graustein and Turekian, 1996).
Cosmogenic 7Be (t0.5
"53.3 d) is produced through-out the atmosphere by spallation reactions of cosmic rayswith maximum production rate in the stratosphere atabout 15}18 km (Lal and Peters, 1967). From this levelits equilibrium concentration decreases steadily towardsearth's surface. 210Pb (t
0.5"22.3 yr) is a relatively long-
lived descendant of the noble gas 222Rn (t0.5
"3.8 d)emitted by all the crustal materials. Therefore, 7Be isconsidered the most representative aerosol radioactivestratospheric tracer and 210Pb is an excellent boundarylayer aerosol tracer (Koch et al., 1996). Since 1996, 1127Be and 210Pb measurements have been carried out atMt. Cimone. Among these, 28 values of 7Be exceeded thethreshold value of 8 mBq m~3: the maximum 7Be valueof 23.6 mBq m~3, 210Pb"0.3 mBq m~3, f (7Be, 210Pb)"0.98 were recorded on 8 July 1997.
The intrusion events recorded at a mountain peak asMt. Cimone are sometimes di$cult to detect, because airmasses of stratospheric origin can reach the measure-ment site after experiencing dilution, dispersion or re-moval processes, which could have modi"ed their phys-ical}chemical characteristics while travelling through thetroposphere. In these cases ozone concentrations mayexhibit signi"cant variations. With the aim of identifyingwhether high ozone levels recorded indicate a high-alti-tude origin of the air mass, correlation analyses of MTCozone concentrations with stratospheric and boundarylayer tracers were carried out (Bonasoni et al., 1998).
4. Vertical transport: case studies
4.1. 12 March 1996
During 11}12 March 1996, a cut-o! low eventdeveloped over central Europe. The meteorologicalsituation was characterised by a Russian}Siberian anti-cyclone located northeast of Scandinavia, developing on11 March and strengthening on 12 March, that favouredthe development of a blocking system with a low-pres-sure area over central Europe, northeast of Italy. The
P. Bonasoni et al. / Atmospheric Environment 34 (2000) 1355}1365 1357
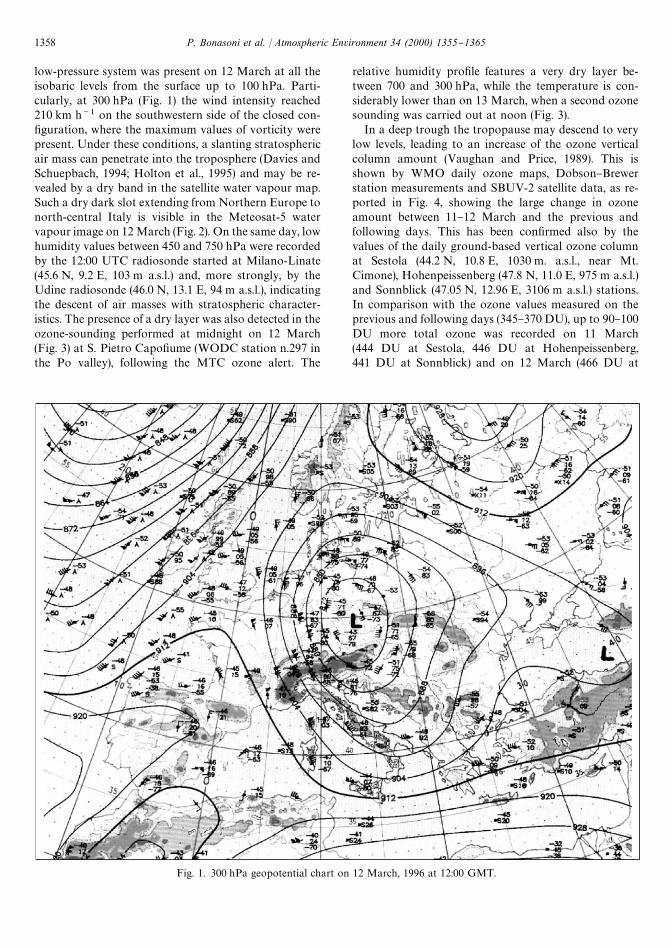
Fig. 1. 300 hPa geopotential chart on 12 March, 1996 at 12:00 GMT.
low-pressure system was present on 12 March at all theisobaric levels from the surface up to 100 hPa. Parti-cularly, at 300 hPa (Fig. 1) the wind intensity reached210 km h~1 on the southwestern side of the closed con-"guration, where the maximum values of vorticity werepresent. Under these conditions, a slanting stratosphericair mass can penetrate into the troposphere (Davies andSchuepbach, 1994; Holton et al., 1995) and may be re-vealed by a dry band in the satellite water vapour map.Such a dry dark slot extending from Northern Europe tonorth-central Italy is visible in the Meteosat-5 watervapour image on 12 March (Fig. 2). On the same day, lowhumidity values between 450 and 750 hPa were recordedby the 12:00 UTC radiosonde started at Milano-Linate(45.6 N, 9.2 E, 103 m a.s.l.) and, more strongly, by theUdine radiosonde (46.0 N, 13.1 E, 94 m a.s.l.), indicatingthe descent of air masses with stratospheric character-istics. The presence of a dry layer was also detected in theozone-sounding performed at midnight on 12 March(Fig. 3) at S. Pietro Capo"ume (WODC station n.297 inthe Po valley), following the MTC ozone alert. The
relative humidity pro"le features a very dry layer be-tween 700 and 300 hPa, while the temperature is con-siderably lower than on 13 March, when a second ozonesounding was carried out at noon (Fig. 3).
In a deep trough the tropopause may descend to verylow levels, leading to an increase of the ozone verticalcolumn amount (Vaughan and Price, 1989). This isshown by WMO daily ozone maps, Dobson}Brewerstation measurements and SBUV-2 satellite data, as re-ported in Fig. 4, showing the large change in ozoneamount between 11}12 March and the previous andfollowing days. This has been con"rmed also by thevalues of the daily ground-based vertical ozone columnat Sestola (44.2 N, 10.8 E, 1030 m. a.s.l., near Mt.Cimone), Hohenpeissenberg (47.8 N, 11.0 E, 975 m a.s.l.)and Sonnblick (47.05 N, 12.96 E, 3106 m a.s.l.) stations.In comparison with the ozone values measured on theprevious and following days (345}370 DU), up to 90}100DU more total ozone was recorded on 11 March(444 DU at Sestola, 446 DU at Hohenpeissenberg,441 DU at Sonnblick) and on 12 March (466 DU at
1358 P. Bonasoni et al. / Atmospheric Environment 34 (2000) 1355}1365
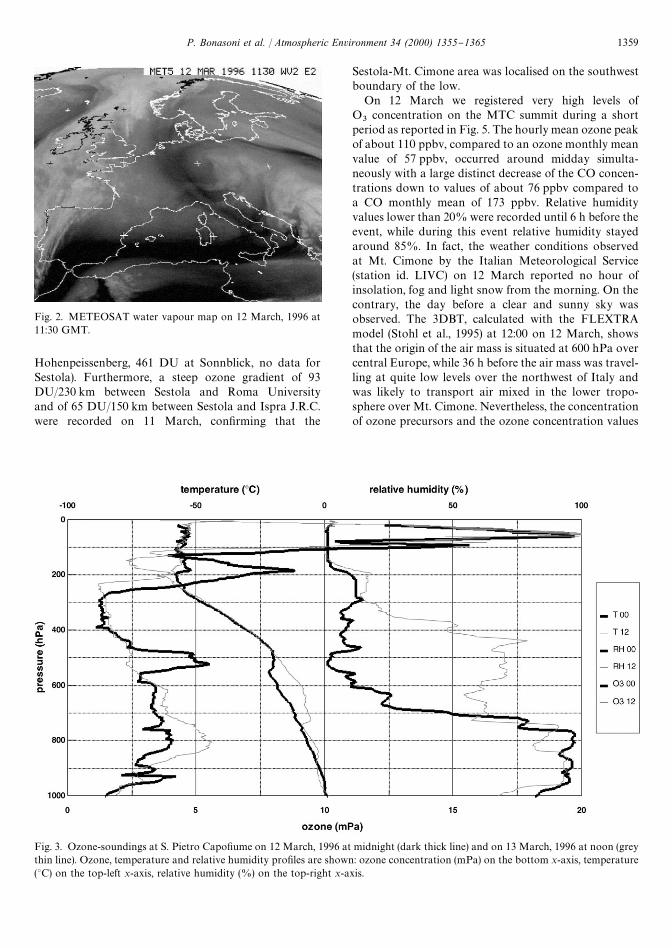
Fig. 3. Ozone-soundings at S. Pietro Capo"ume on 12 March, 1996 at midnight (dark thick line) and on 13 March, 1996 at noon (greythin line). Ozone, temperature and relative humidity pro"les are shown: ozone concentration (mPa) on the bottom x-axis, temperature(3C) on the top-left x-axis, relative humidity (%) on the top-right x-axis.
Fig. 2. METEOSAT water vapour map on 12 March, 1996 at11:30 GMT.
Hohenpeissenberg, 461 DU at Sonnblick, no data forSestola). Furthermore, a steep ozone gradient of 93DU/230 km between Sestola and Roma Universityand of 65 DU/150 km between Sestola and Ispra J.R.C.were recorded on 11 March, con"rming that the
Sestola-Mt. Cimone area was localised on the southwestboundary of the low.
On 12 March we registered very high levels ofO
3concentration on the MTC summit during a short
period as reported in Fig. 5. The hourly mean ozone peakof about 110 ppbv, compared to an ozone monthly meanvalue of 57 ppbv, occurred around midday simulta-neously with a large distinct decrease of the CO concen-trations down to values of about 76 ppbv compared toa CO monthly mean of 173 ppbv. Relative humidityvalues lower than 20% were recorded until 6 h before theevent, while during this event relative humidity stayedaround 85%. In fact, the weather conditions observedat Mt. Cimone by the Italian Meteorological Service(station id. LIVC) on 12 March reported no hour ofinsolation, fog and light snow from the morning. On thecontrary, the day before a clear and sunny sky wasobserved. The 3DBT, calculated with the FLEXTRAmodel (Stohl et al., 1995) at 12:00 on 12 March, showsthat the origin of the air mass is situated at 600 hPa overcentral Europe, while 36 h before the air mass was travel-ling at quite low levels over the northwest of Italy andwas likely to transport air mixed in the lower tropo-sphere over Mt. Cimone. Nevertheless, the concentrationof ozone precursors and the ozone concentration values
P. Bonasoni et al. / Atmospheric Environment 34 (2000) 1355}1365 1359
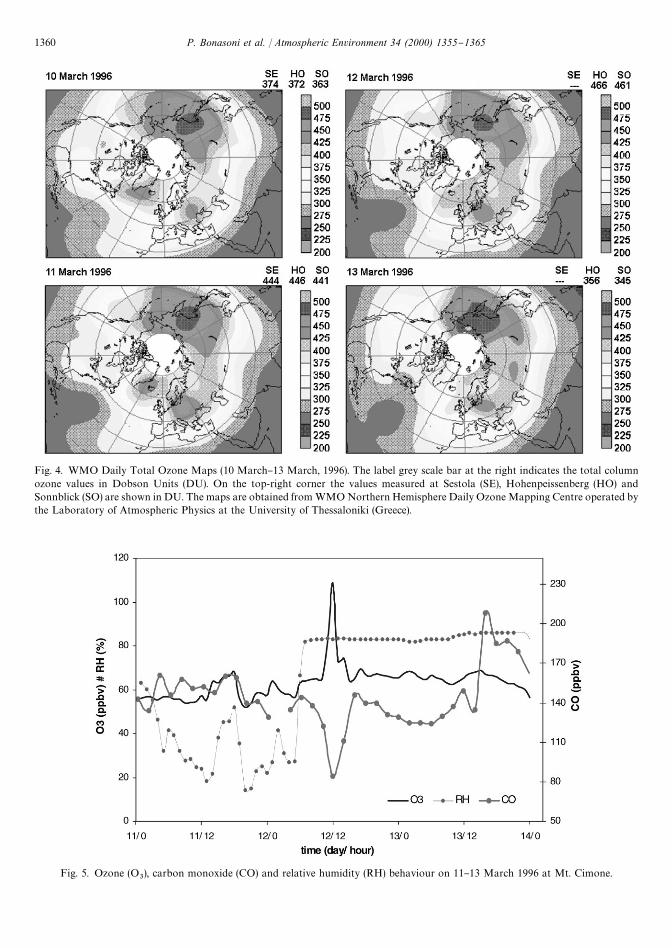
Fig. 4. WMO Daily Total Ozone Maps (10 March}13 March, 1996). The label grey scale bar at the right indicates the total columnozone values in Dobson Units (DU). On the top-right corner the values measured at Sestola (SE), Hohenpeissenberg (HO) andSonnblick (SO) are shown in DU. The maps are obtained from WMO Northern Hemisphere Daily Ozone Mapping Centre operated bythe Laboratory of Atmospheric Physics at the University of Thessaloniki (Greece).
Fig. 5. Ozone (O3), carbon monoxide (CO) and relative humidity (RH) behaviour on 11}13 March 1996 at Mt. Cimone.
1360 P. Bonasoni et al. / Atmospheric Environment 34 (2000) 1355}1365
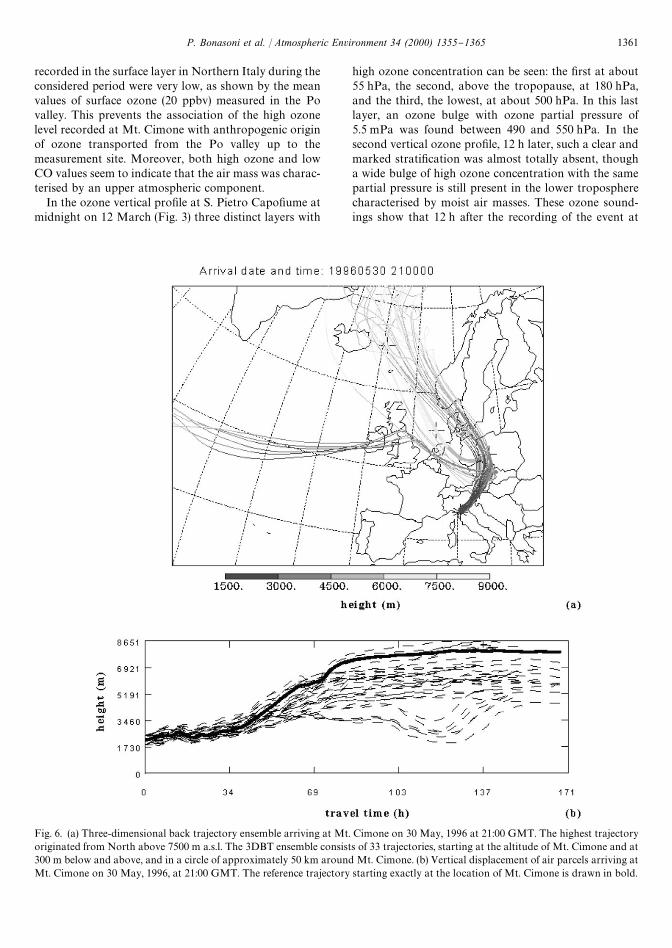
Fig. 6. (a) Three-dimensional back trajectory ensemble arriving at Mt. Cimone on 30 May, 1996 at 21:00 GMT. The highest trajectoryoriginated from North above 7500 m a.s.l. The 3DBT ensemble consists of 33 trajectories, starting at the altitude of Mt. Cimone and at300 m below and above, and in a circle of approximately 50 km around Mt. Cimone. (b) Vertical displacement of air parcels arriving atMt. Cimone on 30 May, 1996, at 21:00 GMT. The reference trajectory starting exactly at the location of Mt. Cimone is drawn in bold.
recorded in the surface layer in Northern Italy during theconsidered period were very low, as shown by the meanvalues of surface ozone (20 ppbv) measured in the Povalley. This prevents the association of the high ozonelevel recorded at Mt. Cimone with anthropogenic originof ozone transported from the Po valley up to themeasurement site. Moreover, both high ozone and lowCO values seem to indicate that the air mass was charac-terised by an upper atmospheric component.
In the ozone vertical pro"le at S. Pietro Capo"ume atmidnight on 12 March (Fig. 3) three distinct layers with
high ozone concentration can be seen: the "rst at about55 hPa, the second, above the tropopause, at 180 hPa,and the third, the lowest, at about 500 hPa. In this lastlayer, an ozone bulge with ozone partial pressure of5.5 mPa was found between 490 and 550 hPa. In thesecond vertical ozone pro"le, 12 h later, such a clear andmarked strati"cation was almost totally absent, thougha wide bulge of high ozone concentration with the samepartial pressure is still present in the lower tropospherecharacterised by moist air masses. These ozone sound-ings show that 12 h after the recording of the event at
P. Bonasoni et al. / Atmospheric Environment 34 (2000) 1355}1365 1361
Mt. Cimone, the air masses in the free troposphere stillhad characteristics typical of the lower stratosphere,con"rming that dry air masses with high ozone con-centrations slanted down from high layers and reachedrelatively low altitudes.
From the data analysis we can state that a modi"ca-tion of the tropopause over the Northern Apenninesoccurred on 11 March, when the ozone total columnincreased by 70 DU compared to the day before atSestola, and stratospheric air reached the mid-tropo-sphere. The following day (12 March) this air, instead ofdescending directly to the ground, penetrated towardslower altitudes and reached the MTC summit after mix-ing with lower tropospheric moist air. In spite of thismoisture condition, the distinct ozone concentrationspike and low CO recorded values are a clear indicationthat a vertical transport of stratospheric air massesoccurred at the mountain site.
4.2. 30}31 May 1996
The episode of tropopause folding, which occurred inCentral Europe at the end of May 1996 has been thor-oughly studied within the VOTALP project and is dis-cussed in detail by Stohl et al. (1999). Our presentationof this episode provides a further contribution to thisdiscussion. In fact, not only the behaviour of conven-tional stratospheric tracers (O
3, 7Be and RH) will be
considered, but also in particular the atmospheric CO2
response will be introduced as a tracer of upper tropo-spheric/lower stratospheric origin of the air masses. CO
2is usually monitored because of its greenhouse e!ectupon the earth's climate. However, in the analysis of thisevent we present CO
2as an interesting tracer of atmo-
spheric vertical exchange, owing to the di!erencesbetween the stratospheric and tropospheric CO
2concen-
trations at northern mid latitudes (Strahan et al., 1998;Huntrieser et al., 1998).
The tropopause folding event detected at the end ofMay 1996 extended from Scandinavia over the Balkanregion to Crete and reached a minimum height of about600 hPa. The anticyclonic subsidence in the western partof the folding transported ozone-rich air downwards,which intruded into the middle troposphere, spreadingover the Alps and the Northern Apennines. The airmasses which reached Mt. Cimone on 30 May and 31had crossed the tropopause folding area over centralEurope on 29 May and passed over the north-east ofItaly at an altitude of about 3000 m, as con"rmed by thethree-dimensional back trajectory ensemble analysis(Fig. 6a and b).
At Mt. Cimone, during the morning of 30 May, theCO
2concentration, instead of showing a decrease due to
the onset of photosynthetic activity of the vegetationwhen a mountain breeze regime is present, typical for thistime of day during this season, shows an anomalous
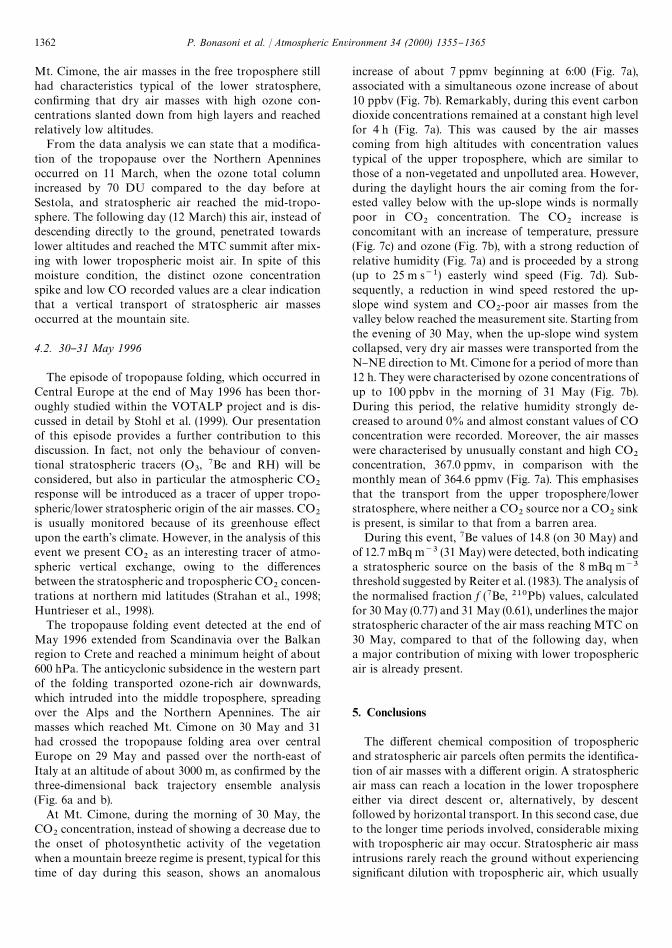
increase of about 7 ppmv beginning at 6:00 (Fig. 7a),associated with a simultaneous ozone increase of about10 ppbv (Fig. 7b). Remarkably, during this event carbondioxide concentrations remained at a constant high levelfor 4 h (Fig. 7a). This was caused by the air massescoming from high altitudes with concentration valuestypical of the upper troposphere, which are similar tothose of a non-vegetated and unpolluted area. However,during the daylight hours the air coming from the for-ested valley below with the up-slope winds is normallypoor in CO
2concentration. The CO
2increase is
concomitant with an increase of temperature, pressure(Fig. 7c) and ozone (Fig. 7b), with a strong reduction ofrelative humidity (Fig. 7a) and is proceeded by a strong(up to 25 m s~1) easterly wind speed (Fig. 7d). Sub-sequently, a reduction in wind speed restored the up-slope wind system and CO
2-poor air masses from the
valley below reached the measurement site. Starting fromthe evening of 30 May, when the up-slope wind systemcollapsed, very dry air masses were transported from theN}NE direction to Mt. Cimone for a period of more than12 h. They were characterised by ozone concentrations ofup to 100 ppbv in the morning of 31 May (Fig. 7b).During this period, the relative humidity strongly de-creased to around 0% and almost constant values of COconcentration were recorded. Moreover, the air masseswere characterised by unusually constant and high CO
2concentration, 367.0 ppmv, in comparison with themonthly mean of 364.6 ppmv (Fig. 7a). This emphasisesthat the transport from the upper troposphere/lowerstratosphere, where neither a CO
2source nor a CO
2sink
is present, is similar to that from a barren area.During this event, 7Be values of 14.8 (on 30 May) and
of 12.7 mBq m~3 (31 May) were detected, both indicatinga stratospheric source on the basis of the 8 mBq m~3
threshold suggested by Reiter et al. (1983). The analysis ofthe normalised fraction f (7Be, 210Pb) values, calculatedfor 30 May (0.77) and 31 May (0.61), underlines the majorstratospheric character of the air mass reaching MTC on30 May, compared to that of the following day, whena major contribution of mixing with lower troposphericair is already present.
5. Conclusions
The di!erent chemical composition of troposphericand stratospheric air parcels often permits the identi"ca-tion of air masses with a di!erent origin. A stratosphericair mass can reach a location in the lower troposphereeither via direct descent or, alternatively, by descentfollowed by horizontal transport. In this second case, dueto the longer time periods involved, considerable mixingwith tropospheric air may occur. Stratospheric air massintrusions rarely reach the ground without experiencingsigni"cant dilution with tropospheric air, which usually
1362 P. Bonasoni et al. / Atmospheric Environment 34 (2000) 1355}1365
Fig. 7. Mt. Cimone measurements from 30 May to 1 June, 1996: a } Carbon dioxide (CO2) and relative humidity (RH); b } Ozone (O
3)
and carbon monoxide (CO), c } Pressure (P) and temperature (T), d }Wind direction (WD) and wind speed (WI). Time is expressed onthe x-axis as day/hour.
P. Bonasoni et al. / Atmospheric Environment 34 (2000) 1355}1365 1363

prevents the stratospheric air mass to be detected withcon"dence. Thus, only continuous measurements of me-teorological, chemical and radiochemical stratosphericcompounds performed at high mountain peak stationspermit to suitably study stratosphere}troposphere ex-change events.
The stratospheric chemical compounds considered astracers of air mass intrusion are characterised by highstratospheric}tropospheric gradient in their concentra-tion or composition. In this way, ozone, 7Be and relativehumidity are considered conventional tracers of strato-spheric intrusions. However, in some cases, when theorigin of the stratospheric air mass is not clearly tracedby these conventional parameters, this approach may beinadequate to identify and study vertical transport of airmasses from upper levels. In these cases carbon dioxideand carbon monoxide non-conventional tracers can pro-vide an important contribution to reveal the origin of theair mass. In fact, as the CO concentration decreases withaltitude, the very low values registered during the "rstepisode presented in this paper clearly indicated theorigin of a stratospheric air mass, which reached Mt.Cimone. During the second episodes the CO
2seasonal
concentration and its typical daily tropospheric variationwere modi"ed by an air mass with high concentrationand steady behaviour of CO
2characteristic of a strato-
spheric origin. These stratospheric intrusion processesdepend on the degree of dilution of the air mass and itslower troposphere mixing. In order to highlight the stra-tospheric character of this air mass the normalised fractionf (7Be, 210PB) has also been taken into consideration.
In this paper we have presented two episodes ofstratospheric intrusions that occurred at Mt. Cimoneduring the VOTALP project and revealed using CO andCO
2as non-conventional tracers together with conven-
tional tracers (O3, RH, 7Be), water vapour satellite maps
and three-dimensional backward trajectory analysis.Ozone satellite observations and ground-based ozonevertical column measurements have been also usefultools to emphasise the localised ozone maximum trappedin the intense deformation of the tropopause duringstratospheric intrusion events.
Acknowledgements
Authors thank WMO Northern Hemisphere DailyOzone Mapping Centre operated by the Laboratory ofAtmospheric Physics at the University of Thessaloniki(Greece) for the ozone maps; ECMWF for the meteoro-logical synoptic map, Atmospheric Environment Service}World Ozone Data Centre and all those who operatedthe Dobson}Brewer WMO ozone stations mentioned inthis paper. Authors are also grateful to two anonymousreviewers for constructive comments and useful sugges-tions on this manuscript.
This study was part of VOTALP, funded by the Euro-pean Commission under Framework Programme IV,Environment and Climate, Contract No. ENV4-CT95-0025, and by the government of Switzerland.
References
Ancellet, G., Beekmann, M., Papayannis, A., 1994. Impact ofa cuto! low development on downward transport of ozonein the troposphere. Journal of Geophysical Research 93 (D2),3451}3468.
Aneja, V.P., Businger, S., Zheng, Li, Claiborn, C.S., Murthy, A.,1991. Ozone climatology at high elevations in the southernAppalachians. Journal of Geophysical Research 96(D1),1007}1021.
Beekmann, M., Ancellet, G., Mancier, C., 1994. Tropo-spheric ozone monitoring at the Observatoire de HauteProvence. In: Borrell, P.M., Borrel, P., Cvitas, T., Seiler,W. (Eds.), Proceedings of EUROTRAC Symposium.pp. 367}372.
Bonasoni, P., Calzolari, F., Colombo, T., Corazza, E., San-taguida, R., Tesi, G., 1997. Continuous CO and H2 mea-surements at Mt. Cimone (Italy): preliminary results.Atmospheric Environment 31, 959}967.
Bonasoni, P., Tositti, L., Evangelisti F., Sthol, A., Bonafe, U.,Calzolari, F., Colombo, T., Kromp-Kolb, H., Tubertini, O.,1998. In#uence of horizontal and vertical transport of airmasses on the background ozone concentration atMt.Cimone station. 25th International Conference on AlpineMeteorology, Torino 14}19 September. Booklet of Proceed-ings, pp. 240}245.
Buzzi, A., Giovannelli, G., Nanni, T., Tagliazucca, M., 1984.Study of high ozone concentrations in the troposphere asso-ciated with lee cyclogenesis during ALPEX. BeitraK ge zurPhysik der AtmosphaK re 57, 380}392.
Colombo, T., Cundari, V., Bonasoni, P., Cervino, M., Evan-gelisti, F., Georgiadis, T., Giovanelli, G., 1992. Episodes ofvertical and horizontal ozone transport monitored at Italy'sMt. Cimone Observatory. Proceedings of QuadriennialOzone Symposium Charlottesville, VA, USA, NASA Con-ference Publication 3266.
Colombo, T., Santaguida, R., 1994. Atmospheric CO2
recordfrom in situ measurement at Mt.Cimone. In: Boden, T.A.,Kaiser, D.P., Sepanski, R.J., Stoss, F.W. (Eds.), Trends '93:A Compendium of Data on Global Change.ORNL/CDIAC-65. Carbon Dioxide Information AnalysisCenter. Oak Ridge National Laboratory, Oak Ridge, TE,USA, pp. 169}172.
Corazza, E., Tesi, G., 1995. Tropospheric hydrogen and carbonmonoxide in Antarctica and in Greenland. Science of theTotal Environment 160/161, 803}809.
Crutzen, P.J., 1995. Ozone in the troposphere. Composition,Chemistry and Climate of the Atmosphere. In: Singh, H.B.(Ed.), Van Nostrand Reinhold, New York, pp. 349}393.
Davies, T.D., Schuepbach, E., 1994. Episodes of high ozoneconcentrations at the earth's surface resulting from trans-port down from the upper troposphere/lower stratosphere:a review and case studies. Atmospheric Environment 28,53}68.
1364 P. Bonasoni et al. / Atmospheric Environment 34 (2000) 1355}1365
Elbern, H., Kowol, R., Sladkovic, R., Ebel, A., 1997. Deepstratospheric intrusions: a statistical assessment withmodel guided analyses. Atmospheric Environment 31,3207}3226.
Follows, M.J., Austin, J.F., 1992. A zonal average model of thestratospheric contributions to the tropospheric ozonebudget. Journal of Geophysical Research 97 (D16),18047}18060.
Graustein, W.C., Turekian, K.K., 1996. 7Be and 210Pb indicatean upper troposphere source for elevated ozone in the sum-mertime subtropical free troposphere of the eastern NorthAtlantic. Geophysical Research Letters 23 (5), 539}542.
Holton, J.R., Haynes, P.H., McIntyre, M.E., Douglass, A.R.,Rood, R.B., P"ster, L., 1995. Stratosphere}troposphere ex-change. Reviews of Geophysics 33, 403}439.
Huntrieser, H., Schlager, H., Feigl, Holler, H., 1998. Transportand production of NO
xin electri"ed thunderstorms: survey
of previous studies and new observatios at midlatitudes.Journal of Geophysical Research 103, 28247}28264.
Koch, D.M., Jacob, D.J., Graustein, W.C., 1996. Vertical trans-port of tropospheric aerosol as indicated by 7Be and 210Pbin a chemical tracer model. Journal of Geophysical Research101 (D13), 18651}18666.
Lal, D., Peters, B., 1967. Cosmic rays produced radioactivity onthe earth. Encyclopaedia of Physics. Springer, New York.
Low, P.S., Davies, T.D., Kelly, P.M., Farmer, G., 1990. Trends insurface ozone at Hohenpeissenberg and Arkona. Journal ofGeophysical Research 95 (D13), 22441}22453.
Oltmans, S.J., 1981. Surface ozone measurements in clean air.Journal of Geophysical Research 86 (C2), 1174}1180.
Reiter, R., 1991. On the mean daily and seasonal variations ofthe vertical ozone pro"les in the lower troposphere. Atmo-spheric Environment 25A, 1751}1757.
Reiter, R., Munzert, K., Kanter, H.J., Poetzl, K., 1983. Cosmo-genic radionuclides and ozone at a mountain station at
3.0 km a.s.l. Archive Meteriology Geophysik and Bio-clamatologic 32B, 131}160.
Scheel, H.E., Ancellet, G., Areskoung, H. Beck, J. et al., 1997.Spatial and temporal variability of tropospheric ozone overEurope. In: Hystein Hov (Ed)., Tropospheric Ozone Re-search } Transport and Chemical Transformation of Pollu-tants in the Troposphere, Vol. 6. pp. 49}56. EUROTRAC.(Chapter 2).
Staehelin, J., Thudium, J., Buehler, R., Volz-Thomas, A., Graber,W., 1994. Trends in surface ozone concentrations at Arosa(Switzerland). Atmospheric Environment 28, 75}87.
Stohl, A., Wotawa, G., Seibert, P., Kromp-Kolb, H., 1995. Inter-polation errors in wind "elds as a function of spatial andtemporal resolution and their impact on di!erent types ofkinematic trajectories. Journal of Applied Meteorology 34,2149}2165.
Stohl, A., Spichtinger-Rakowsky, N., Bonasoni, P., Feldman, H.,Memmesheimer, M., Scheel, H.E., Trickl, T., HuK bener, S.,Ringer, W., Mandl, M., 1999. The in#uence of stratosphericintrusions on alpine ozone concentrations. Atmospheric En-vironment 34, 1323}1354.
Strahan, S.E., Douglass, A.R., Nielsen, J.E., Boering, K.A., 1998.The CO
2seasonal cycle as a tracer of transport. Journal of
Geophysical Research 103(D12), pp 13729}13741.Vaughan, G., Price, J.D., 1989. Ozone transport into the tropo-
sphere in a cut-o! low event. In: Bojkov, R.D., Fabian, P.,Ozone in the Atmosphere. Deepak Pub., Hampton (USA),pp. 415}418.
World Meteorological Organization, 1985. Atmospheric Ozone1985: assessment of our understanding of the processes con-trolling its present distribution and change } Report N.16} Vol. 1. Strat-Trop Exchange, 151}240.
World Meteorological Organization } Global AtmosphericWatch, 1994. Report on the measurements of atmosphericturbidity in BAPMoN. Report N 94, 1}73.
P. Bonasoni et al. / Atmospheric Environment 34 (2000) 1355}1365 1365
Copyright © 2022 FDOKUMEN