Oxidized carbon nanofiber/polymer composites prepared by chaotic mixing
RC
Ma
b
c
d
a
ARRA
KTNCROFT
1
hoptafoaoHlc
vT
1d
Chemical Engineering Journal 156 (2010) 278–285
Contents lists available at ScienceDirect
Chemical Engineering Journal
journa l homepage: www.e lsev ier .com/ locate /ce j
esponse surface optimization of photocatalytic process for degradation ofongo Red using H-titanate nanofiber catalyst
eng Nan Chonga,b, H.Y. Zhuc, Bo Jina,b,d,∗
School of Chemical Engineering, The University of Adelaide, Adelaide, SA 5005, AustraliaSchool of Earth and Environmental Sciences, The University of Adelaide, Adelaide, SA 5005, AustraliaSchool of Physical and Chemical Sciences, Queensland University of Technology, Brisbane, QLD 4001, AustraliaAustralian Water Quality Centre, Bolivar, SA Water Corporation, SA 5110, Australia
r t i c l e i n f o
rticle history:eceived 18 May 2009eceived in revised form 6 October 2009ccepted 6 October 2009
eywords:iO2
anofibersongo Redesponse surface analysisptimization
a b s t r a c t
In this study, a new generation H-titanate nanofiber catalyst (TNC) with long fibril morphology and surfacecovered anatase titanium dioxide (TiO2) crystals of 10–20 nm was used as the photocatalyst for improvedphotoactivity, mass transfer resistance and downstream separation. The combined Taguchi method andresponse surface analysis (RSA) were employed to evaluate the effects of key operational factors of TNCloading, pH, aeration rate and initial Congo Red (CR) concentration on the performances of TNC in anannular slurry photoreactor (ASP). The average CR photocatalytic degradation rate (mg dm−3 min−1) wasestimated and applied as the response outputs of the L9 (3)4 Taguchi orthogonal array. Results fromthe RSA interpretations revealed that pH, initial CR concentration and aeration rate were the significantfactors, while TNC loading appears to be the least significant factor. On contrary, positive interactionsof TNC loading were observed when being coupled with pH and aeration rate. Other interactions of
actor interactionaguchi method
the operation factors were also determined using statistical analysis. A natural logarithmic modifiedregression equation was developed from multiple regression analysis for response surface modelling.This model predicted that the average photocatalytic degradation rate of CR was 0.1576 mg dm3 min−1
under the optimal conditions. A subsequent verification experiment showed a photocatalytic degradationrate of 0.1563 ± 0.0282 mg dm−3 min−1, which is in good agreement with the model predicted value. This
f theocess
proved the applicability ophotocatalytic reactor pr
. Introduction
Development of advanced water treatment technologies withigh efficacy, low cost, and “zero” waste outputs are at the forefrontf R&D fields owing to the increasingly stringent environmentalressure [1–3]. Among the currently available water abatementechnologies, heterogeneous titanium dioxide (TiO2) photocat-lytic treatment processes have emerged as a promising candidateor sustainable removal of recalcitrant organic pollutants with-ut generation of any secondary pollution [3–7]. This is solelyttributed to the reactive oxygen species generated on the surface
f the TiO2 particles [8]. These oxidative species (i.e. OH•, O2•−,2O2) can subsequently degrade the organic pollutants, eventually
eading to a complete mineralization with innocuous of water andarbon dioxide molecules as the final by-products [1–7].
∗ Corresponding author at: School of Earth and Environmental Sciences, The Uni-ersity of Adelaide, North Terrace Campus, Adelaide, SA 5005, Australia.el.: +61 8 8303 7056; fax: +61 8 8303 6222.
E-mail address: [email protected] (B. Jin).
385-8947/$ – see front matter © 2009 Elsevier B.V. All rights reserved.oi:10.1016/j.cej.2009.10.017
developed model as a reliable design and modelling tool for scaling up the.
© 2009 Elsevier B.V. All rights reserved.
However, there are a few technical challenges which make thisTiO2 technology unviable as an industrial treatment process. Oneof the more prominent issues is the difficulty and high cost fordownstream process to separate the TiO2 particles after the watertreatment process [9,10]. The TiO2 particles exhibit excellent quan-tum properties (i.e. efficient charge separation, opaqueness andlight refractive index) when the particles size lies in the nanometerrange [11]. Increasing the particle size of TiO2 will leads to seriousdeterioration in photoactivity, although such shift in particle size(towards bulk characteristics) promises ease of recovery. This haslead to numerous efforts to immobilize the nano-size TiO2 particlesonto larger inert substrates where the quantum properties can beconserved and effectively utilized [1,10,12,13]. In previous study, anew nanofiber TiO2 photocatalyst was developed in which anatasecrystals of 10–20 nm was successfully deposited on titanate fib-ril of 40–100 nm thickness and length up to 30 �m long [14,15].
This photocatalyst was easily dispersed in the photoreactor systemand can be readily separated and reused owing to the long fibrilmorphology [14–16].When nanofiber catalyst is integrated with a photocatalyticreactor, a multivariable system is created and may lead to a setback

ineering Journal 156 (2010) 278–285 279
tttviSrbnyomnat(secwfmpdhDtp
tClstwwerrlritp
2
2
AgtRtmdici
hp383
tional light could be placed within the central quartz core. In thisstudy, an UV light of 11 W (Davis Ultraviolet, Australia) was fit-ted annularly within the quartz thimble to prevent direct contactwith the reaction fluid, while allowing optimal UV transmission forsurface activation of the suspended TNC fibrils. Sampling during
M.N. Chong et al. / Chemical Eng
owards process optimization and modelling. The conventionalechnique for optimization is bounded by the one-factor-at-a-ime approach, while first principle model derivation with processalidation has been a common practice associated with many stud-es on optimization and modelling of a photocatalytic process.uch techniques are fragile and time-consuming as they requireapid experimentations to validate and correlate the interactionsetween the operational factors involved [3,7,9,13,16]. Recently aumber of statistical design of experiments (DOE) and data anal-sis techniques have been employed in various fields of processptimization [17–20]. These methods involve the use of statisticalodels to effectively design the experiments so as to reduce the
umber of experiments required while improving the results withnumber of analysing techniques. Among the statistical methods,
he Taguchi DOE method combined with response surface analysisRSA) is recognised as a simple and reliable tool for a multivariableystem [21–24]. The Taguchi DOE pre-determines the number ofxperiments required to cover the factors involved, while the RSAan effectively analyse the effects of several independent variablesithout any knowledge on the relationship between the objectives
unction and variables. The robustness of RSA includes buildingodels, evaluating the effects of several factors and optimizing the
rocess operating conditions to achieve desirable outcomes. Whileevelopment and application of photocatalysts for water treatmentave been intensively reported in the literature, use of combinedOE and RSA methodologies for optimization, identification of fac-
ors interaction and modelling of a photocatalytic system has beenaid little attention.
This study was to apply the Taguchi DOE and RSA for iden-ifying the optimum operation conditions for the degradation ofongo Red (CR). A recently developed H-titanate nanofiber cata-
yst (TNC) and a laboratory scale annular slurry photoreactor (ASP)ystem were employed in the study. Four key ASP operational fac-ors of TNC loading, pH, aeration rate and initial CR concentrationill be studied and the interaction between each chosen factorsill be identified. A Taguchi DOE of L9 (3)4 array with 9 standard
xperiments will be used and the estimated average photocatalyticeaction rate from the batch kinetics data will be assigned as theesponse outputs for RSA interpretation. Finally, a statistical corre-ation that defines the chosen factors will be build by multiple linearegression technique for optimizing the photocatalytic process anddentifying the factor interaction. A subsequent experiment valida-ion was performed to test the accuracy of the model to predict thehotocatalytic reaction rate.
. Materials and methods
.1. Materials
Congo Red (C32H22N6Na2O6S2, Colour Index 22120, Labchemjax Finechem, Australia), a secondary diazo was used as a surro-ate indicator to simulate the industrial wastewater and to evaluatehe photo-effectiveness of the TNC used in the APS system. Congoed is a recalcitrant azo dye that is commonly found in indus-rial wastewater and thus considered suitable as an effectiveness
easure, in terms of its chemical structure, molecular weight andiazo bonds. It has been involved in several photocatalysis stud-
es including those using TiO2 and hence is appropriate in makingomparisons in this study. The chemical structure of the Congo Reds as shown in Fig. 1.
The H-titanate nanofibers were previously synthesized through a
ydrothermal reaction between concentrated NaOH and TiO2 and aost-synthesis ion exchange with HCl solution [14,15]. Specifically,g of anatase particles (∼325 meshes from Aldrich) was mixed with0 mL of 10 M NaOH. The resultant suspensions were sonicated for0 min and transferred into a PTFE container for autoclaving. TheFig. 1. Chemical structure of Congo Red (a secondary diazo dye).
autoclave was maintained at hydrothermal temperature of 180 ◦Cfor 48 h. The precipitate (sodium titanate nanofibers) was recov-ered, washed with distilled water (to remove excess NaOH) andfinally exchanged with H+ (using a 0.1 M HCl solution) to pro-duce hydrogen TNC. These products were repeatedly washed withdistilled water until pH ∼ 7 was reached. The hydrogen titanateproduct was dried at 80 ◦C for 12 h and then calcined at 700 ◦C for3 h to yield anatase nanofibers. The TEM image of the single TNCfibril is shown in Fig. 2.
2.2. Annular photocatalytic reactor system
A stainless steel-lined ASP was developed previously and usedin this study [16]. The ASP was operated as a three-phase bubblecolumn reactor, where the solid TNC were dispersed in the targetedwater with the aid of compressed air. The lower end of the ASP wasfabricated with a detachable conical bottom for free of reactiondead zone, making it easy for cleaning and maintenance. A 45 �mair sparger was fitted to the detachable conical bottom to providehomogeneous bubble distribution for agitation, mixing and suffi-cient dissolved oxygen for the photocatalytic reaction. The lightconfiguration in the ASP was distinctively designed where addi-
Fig. 2. The TEM image of a single TNC fibril.
280 M.N. Chong et al. / Chemical Engineeri
Fbpa
tem(te
2
mirCttvaltwpesscsottGabCser
2
di
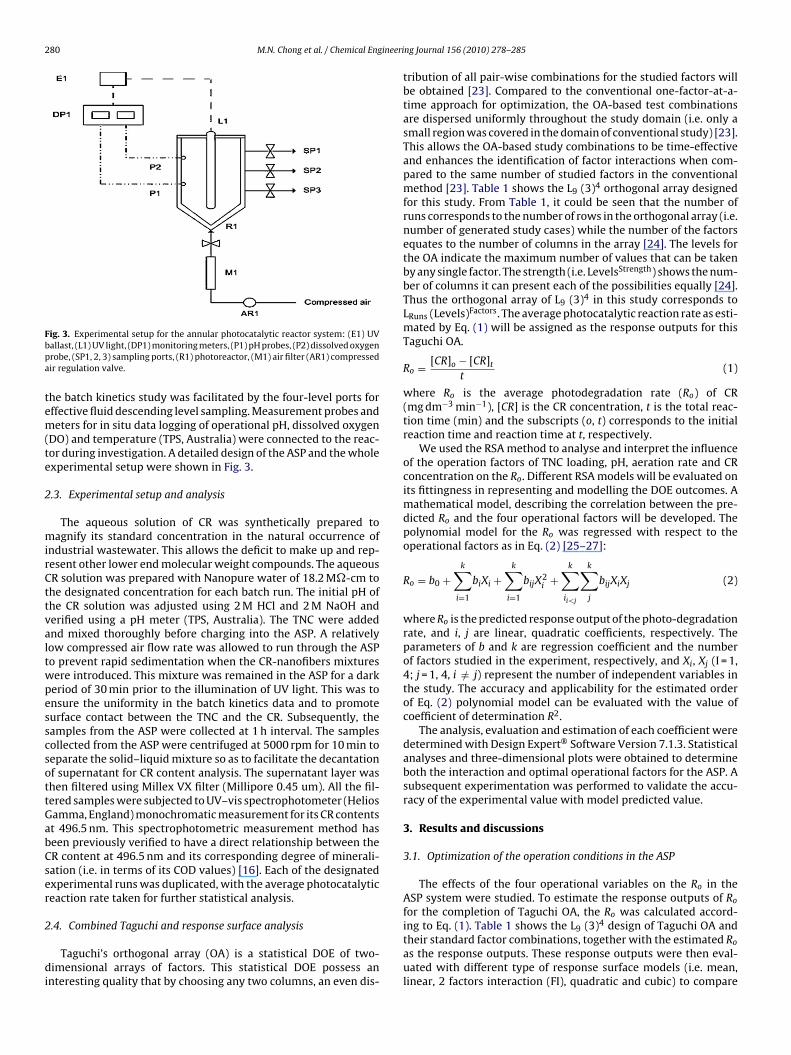
ig. 3. Experimental setup for the annular photocatalytic reactor system: (E1) UVallast, (L1) UV light, (DP1) monitoring meters, (P1) pH probes, (P2) dissolved oxygenrobe, (SP1, 2, 3) sampling ports, (R1) photoreactor, (M1) air filter (AR1) compressedir regulation valve.
he batch kinetics study was facilitated by the four-level ports forffective fluid descending level sampling. Measurement probes andeters for in situ data logging of operational pH, dissolved oxygen
DO) and temperature (TPS, Australia) were connected to the reac-or during investigation. A detailed design of the ASP and the wholexperimental setup were shown in Fig. 3.
.3. Experimental setup and analysis
The aqueous solution of CR was synthetically prepared toagnify its standard concentration in the natural occurrence of
ndustrial wastewater. This allows the deficit to make up and rep-esent other lower end molecular weight compounds. The aqueousR solution was prepared with Nanopure water of 18.2 M�-cm tohe designated concentration for each batch run. The initial pH ofhe CR solution was adjusted using 2 M HCl and 2 M NaOH anderified using a pH meter (TPS, Australia). The TNC were addednd mixed thoroughly before charging into the ASP. A relativelyow compressed air flow rate was allowed to run through the ASPo prevent rapid sedimentation when the CR-nanofibers mixturesere introduced. This mixture was remained in the ASP for a darkeriod of 30 min prior to the illumination of UV light. This was tonsure the uniformity in the batch kinetics data and to promoteurface contact between the TNC and the CR. Subsequently, theamples from the ASP were collected at 1 h interval. The samplesollected from the ASP were centrifuged at 5000 rpm for 10 min toeparate the solid–liquid mixture so as to facilitate the decantationf supernatant for CR content analysis. The supernatant layer washen filtered using Millex VX filter (Millipore 0.45 um). All the fil-ered samples were subjected to UV–vis spectrophotometer (Heliosamma, England) monochromatic measurement for its CR contentst 496.5 nm. This spectrophotometric measurement method haseen previously verified to have a direct relationship between theR content at 496.5 nm and its corresponding degree of minerali-ation (i.e. in terms of its COD values) [16]. Each of the designatedxperimental runs was duplicated, with the average photocatalyticeaction rate taken for further statistical analysis.
.4. Combined Taguchi and response surface analysis
Taguchi’s orthogonal array (OA) is a statistical DOE of two-imensional arrays of factors. This statistical DOE possess an
nteresting quality that by choosing any two columns, an even dis-
ng Journal 156 (2010) 278–285
tribution of all pair-wise combinations for the studied factors willbe obtained [23]. Compared to the conventional one-factor-at-a-time approach for optimization, the OA-based test combinationsare dispersed uniformly throughout the study domain (i.e. only asmall region was covered in the domain of conventional study) [23].This allows the OA-based study combinations to be time-effectiveand enhances the identification of factor interactions when com-pared to the same number of studied factors in the conventionalmethod [23]. Table 1 shows the L9 (3)4 orthogonal array designedfor this study. From Table 1, it could be seen that the number ofruns corresponds to the number of rows in the orthogonal array (i.e.number of generated study cases) while the number of the factorsequates to the number of columns in the array [24]. The levels forthe OA indicate the maximum number of values that can be takenby any single factor. The strength (i.e. LevelsStrength) shows the num-ber of columns it can present each of the possibilities equally [24].Thus the orthogonal array of L9 (3)4 in this study corresponds toLRuns (Levels)Factors. The average photocatalytic reaction rate as esti-mated by Eq. (1) will be assigned as the response outputs for thisTaguchi OA.
Ro = [CR]o − [CR]t
t(1)
where Ro is the average photodegradation rate (Ro) of CR(mg dm−3 min−1), [CR] is the CR concentration, t is the total reac-tion time (min) and the subscripts (o, t) corresponds to the initialreaction time and reaction time at t, respectively.
We used the RSA method to analyse and interpret the influenceof the operation factors of TNC loading, pH, aeration rate and CRconcentration on the Ro. Different RSA models will be evaluated onits fittingness in representing and modelling the DOE outcomes. Amathematical model, describing the correlation between the pre-dicted Ro and the four operational factors will be developed. Thepolynomial model for the Ro was regressed with respect to theoperational factors as in Eq. (2) [25–27]:
Ro = b0 +k∑
i=1
biXi +k∑
i=1
bijX2i +
k∑
ii<j
k∑
j
bijXiXj (2)
where Ro is the predicted response output of the photo-degradationrate, and i, j are linear, quadratic coefficients, respectively. Theparameters of b and k are regression coefficient and the numberof factors studied in the experiment, respectively, and Xi, Xj (I = 1,4; j = 1, 4, i /= j) represent the number of independent variables inthe study. The accuracy and applicability for the estimated orderof Eq. (2) polynomial model can be evaluated with the value ofcoefficient of determination R2.
The analysis, evaluation and estimation of each coefficient weredetermined with Design Expert® Software Version 7.1.3. Statisticalanalyses and three-dimensional plots were obtained to determineboth the interaction and optimal operational factors for the ASP. Asubsequent experimentation was performed to validate the accu-racy of the experimental value with model predicted value.
3. Results and discussions
3.1. Optimization of the operation conditions in the ASP
The effects of the four operational variables on the Ro in theASP system were studied. To estimate the response outputs of Ro
for the completion of Taguchi OA, the Ro was calculated accord-
ing to Eq. (1). Table 1 shows the L9 (3)4 design of Taguchi OA andtheir standard factor combinations, together with the estimated Roas the response outputs. These response outputs were then eval-uated with different type of response surface models (i.e. mean,linear, 2 factors interaction (FI), quadratic and cubic) to compare
M.N. Chong et al. / Chemical Engineering Journal 156 (2010) 278–285 281
Table 1Taguchi OA L9 (3)4 design for combinatorial optimization for the degradation of CR using H-titanate nanofibers photocatalysts.
Standard run TNC loading(g dm−3) (X1)
pH (X2) Aeration rate(dm3 min−1) (X3)
Initial CR concentration(mg dm−3) (X4)
Response outputs(mg dm−3 min−1)
1 2.00 3.00 2.50 20.00 0.04702 2.00 6.00 5.00 40.00 0.09573 2.00 9.00 7.50 60.00 0.15294 4.00 3.00 5.00 60.00 0.11745 4.00 6.00 7.50 20.00 0.0545
tinpfim
�
wti
urbl9fbomtrsott
Fs
6 4.00 9.00 2.507 6.00 3.00 7.508 6.00 6.00 2.509 6.00 9.00 5.00
he appropriateness of each model. From the iteration procedures,t was found that the 2 factors interaction (FI) models with sig-ificant power transformation could adequately fit all the designoints. Other order models exhibited a significant degree of lack oft term, and thus inapplicable in this case. Most power transfor-ation function can be described by a standard equation of:
= fn(�˛) (3)
here fn is the functionalised model used, � is the standard devia-ion, � is the mean, ˛ is the power, and � is (1 − ˛) in all cases. Thenitial value of � in the standard equation will be � = 1.
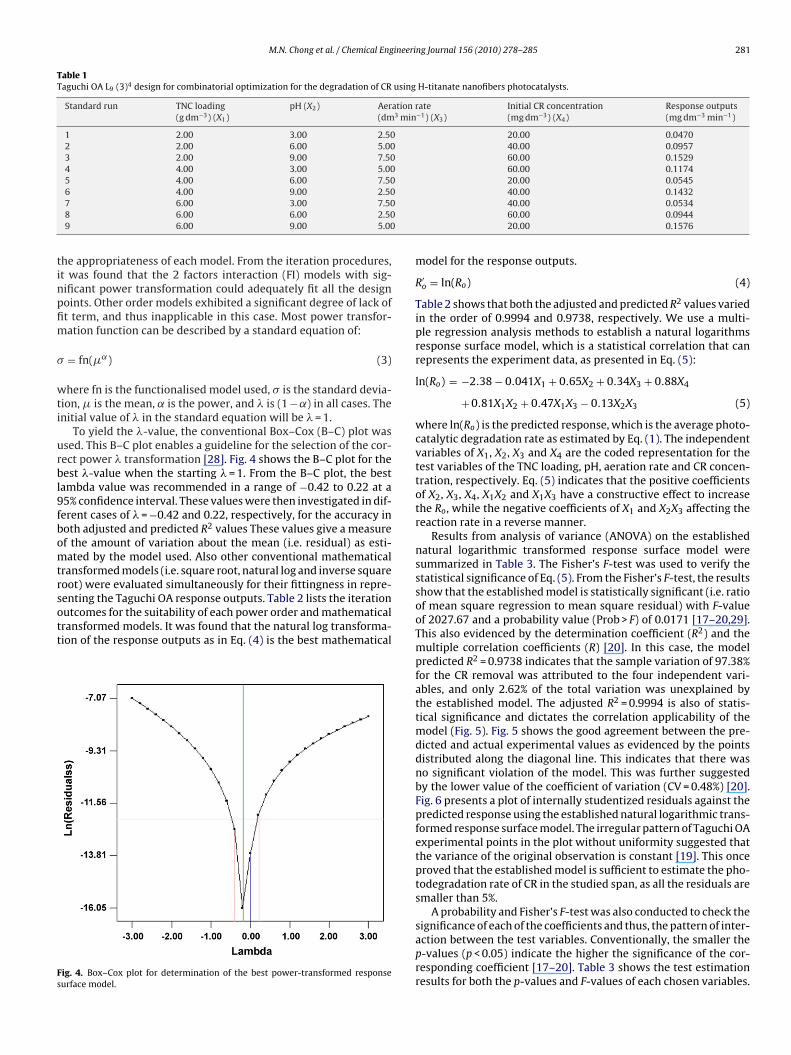
To yield the �-value, the conventional Box–Cox (B–C) plot wassed. This B–C plot enables a guideline for the selection of the cor-ect power � transformation [28]. Fig. 4 shows the B–C plot for theest �-value when the starting � = 1. From the B–C plot, the best
ambda value was recommended in a range of −0.42 to 0.22 at a5% confidence interval. These values were then investigated in dif-erent cases of � = −0.42 and 0.22, respectively, for the accuracy inoth adjusted and predicted R2 values These values give a measuref the amount of variation about the mean (i.e. residual) as esti-ated by the model used. Also other conventional mathematical
ransformed models (i.e. square root, natural log and inverse squareoot) were evaluated simultaneously for their fittingness in repre-
enting the Taguchi OA response outputs. Table 2 lists the iterationutcomes for the suitability of each power order and mathematicalransformed models. It was found that the natural log transforma-ion of the response outputs as in Eq. (4) is the best mathematicalig. 4. Box–Cox plot for determination of the best power-transformed responseurface model.
40.00 0.143240.00 0.053460.00 0.094420.00 0.1576
model for the response outputs.
R′o = ln(Ro) (4)
Table 2 shows that both the adjusted and predicted R2 values variedin the order of 0.9994 and 0.9738, respectively. We use a multi-ple regression analysis methods to establish a natural logarithmsresponse surface model, which is a statistical correlation that canrepresents the experiment data, as presented in Eq. (5):
ln(Ro) = −2.38 − 0.041X1 + 0.65X2 + 0.34X3 + 0.88X4
+ 0.81X1X2 + 0.47X1X3 − 0.13X2X3 (5)
where ln(Ro) is the predicted response, which is the average photo-catalytic degradation rate as estimated by Eq. (1). The independentvariables of X1, X2, X3 and X4 are the coded representation for thetest variables of the TNC loading, pH, aeration rate and CR concen-tration, respectively. Eq. (5) indicates that the positive coefficientsof X2, X3, X4, X1X2 and X1X3 have a constructive effect to increasethe Ro, while the negative coefficients of X1 and X2X3 affecting thereaction rate in a reverse manner.
Results from analysis of variance (ANOVA) on the establishednatural logarithmic transformed response surface model weresummarized in Table 3. The Fisher’s F-test was used to verify thestatistical significance of Eq. (5). From the Fisher’s F-test, the resultsshow that the established model is statistically significant (i.e. ratioof mean square regression to mean square residual) with F-valueof 2027.67 and a probability value (Prob > F) of 0.0171 [17–20,29].This also evidenced by the determination coefficient (R2) and themultiple correlation coefficients (R) [20]. In this case, the modelpredicted R2 = 0.9738 indicates that the sample variation of 97.38%for the CR removal was attributed to the four independent vari-ables, and only 2.62% of the total variation was unexplained bythe established model. The adjusted R2 = 0.9994 is also of statis-tical significance and dictates the correlation applicability of themodel (Fig. 5). Fig. 5 shows the good agreement between the pre-dicted and actual experimental values as evidenced by the pointsdistributed along the diagonal line. This indicates that there wasno significant violation of the model. This was further suggestedby the lower value of the coefficient of variation (CV = 0.48%) [20].Fig. 6 presents a plot of internally studentized residuals against thepredicted response using the established natural logarithmic trans-formed response surface model. The irregular pattern of Taguchi OAexperimental points in the plot without uniformity suggested thatthe variance of the original observation is constant [19]. This onceproved that the established model is sufficient to estimate the pho-todegradation rate of CR in the studied span, as all the residuals aresmaller than 5%.
A probability and Fisher’s F-test was also conducted to check the
significance of each of the coefficients and thus, the pattern of inter-action between the test variables. Conventionally, the smaller thep-values (p < 0.05) indicate the higher the significance of the cor-responding coefficient [17–20]. Table 3 shows the test estimationresults for both the p-values and F-values of each chosen variables.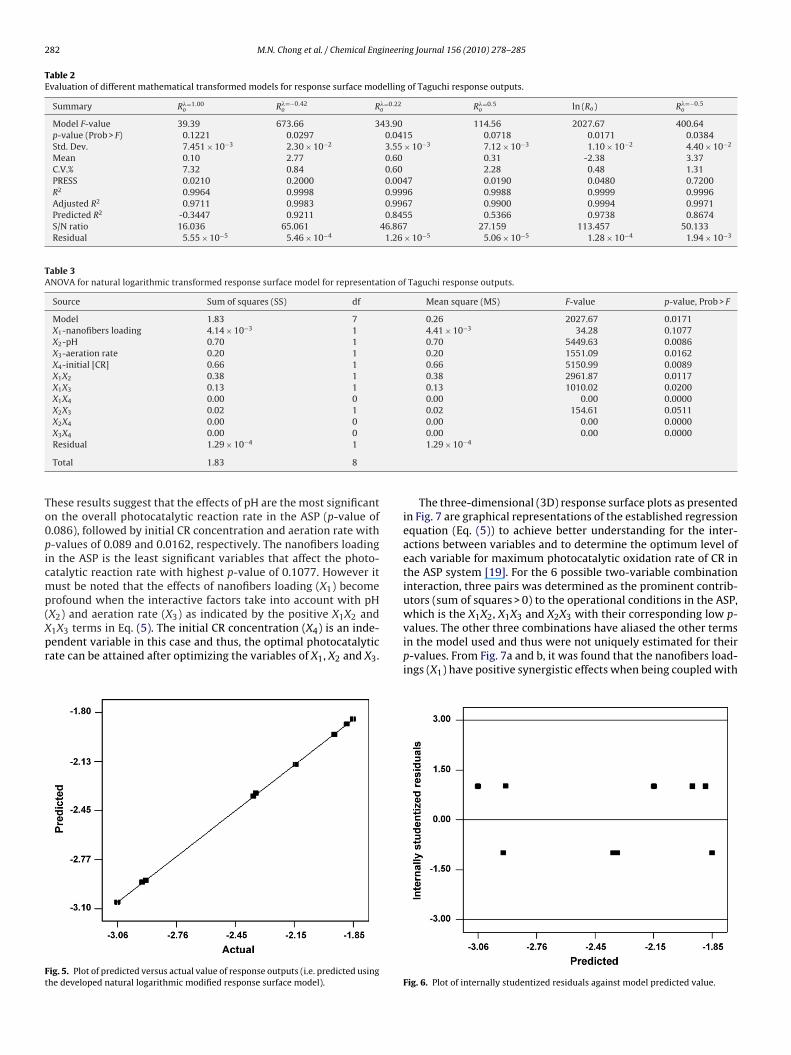
282 M.N. Chong et al. / Chemical Engineering Journal 156 (2010) 278–285
Table 2Evaluation of different mathematical transformed models for response surface modelling of Taguchi response outputs.
Summary R�=1.00o R�=−0.42
o R�=0.22o R�=0.5
o ln (Ro) R�=−0.5o
Model F-value 39.39 673.66 343.90 114.56 2027.67 400.64p-value (Prob > F) 0.1221 0.0297 0.0415 0.0718 0.0171 0.0384Std. Dev. 7.451 × 10⁻³ 2.30 × 10⁻² 3.55 × 10⁻³ 7.12 × 10⁻³ 1.10 × 10⁻² 4.40 × 10⁻²
Mean 0.10 2.77 0.60 0.31 -2.38 3.37C.V.% 7.32 0.84 0.60 2.28 0.48 1.31PRESS 0.0210 0.2000 0.0047 0.0190 0.0480 0.7200R2 0.9964 0.9998 0.9996 0.9988 0.9999 0.9996Adjusted R2 0.9711 0.9983 0.9967 0.9900 0.9994 0.9971Predicted R2 -0.3447 0.9211 0.8455 0.5366 0.9738 0.8674S/N ratio 16.036 65.061 46.867 27.159 113.457 50.133Residual 5.55 × 10⁻⁵ 5.46 × 10⁻⁴ 1.26 × 10⁻⁵ 5.06 × 10⁻⁵ 1.28 × 10⁻⁴ 1.94 × 10⁻³
Table 3ANOVA for natural logarithmic transformed response surface model for representation of Taguchi response outputs.
Source Sum of squares (SS) df Mean square (MS) F-value p-value, Prob > F
Model 1.83 7 0.26 2027.67 0.0171X1-nanofibers loading 4.14 × 10⁻³ 1 4.41 × 10⁻³ 34.28 0.1077X2-pH 0.70 1 0.70 5449.63 0.0086X3-aeration rate 0.20 1 0.20 1551.09 0.0162X4-initial [CR] 0.66 1 0.66 5150.99 0.0089X1X2 0.38 1 0.38 2961.87 0.0117X1X3 0.13 1 0.13 1010.02 0.0200X1X4 0.00 0 0.00 0.00 0.0000X2X3 0.02 1 0.02 154.61 0.0511X2X4 0.00 0 0.00 0.00 0.0000
To0picmp(Xpr
Ft
X3X4 0.00 0Residual 1.29 × 10⁻⁴ 1
Total 1.83 8
hese results suggest that the effects of pH are the most significantn the overall photocatalytic reaction rate in the ASP (p-value of.086), followed by initial CR concentration and aeration rate with-values of 0.089 and 0.0162, respectively. The nanofibers loadingn the ASP is the least significant variables that affect the photo-atalytic reaction rate with highest p-value of 0.1077. However itust be noted that the effects of nanofibers loading (X1) become
rofound when the interactive factors take into account with pH
X2) and aeration rate (X3) as indicated by the positive X1X2 and1X3 terms in Eq. (5). The initial CR concentration (X4) is an inde-endent variable in this case and thus, the optimal photocatalyticate can be attained after optimizing the variables of X1, X2 and X3.ig. 5. Plot of predicted versus actual value of response outputs (i.e. predicted usinghe developed natural logarithmic modified response surface model).
0.00 0.00 0.00001.29 × 10−4
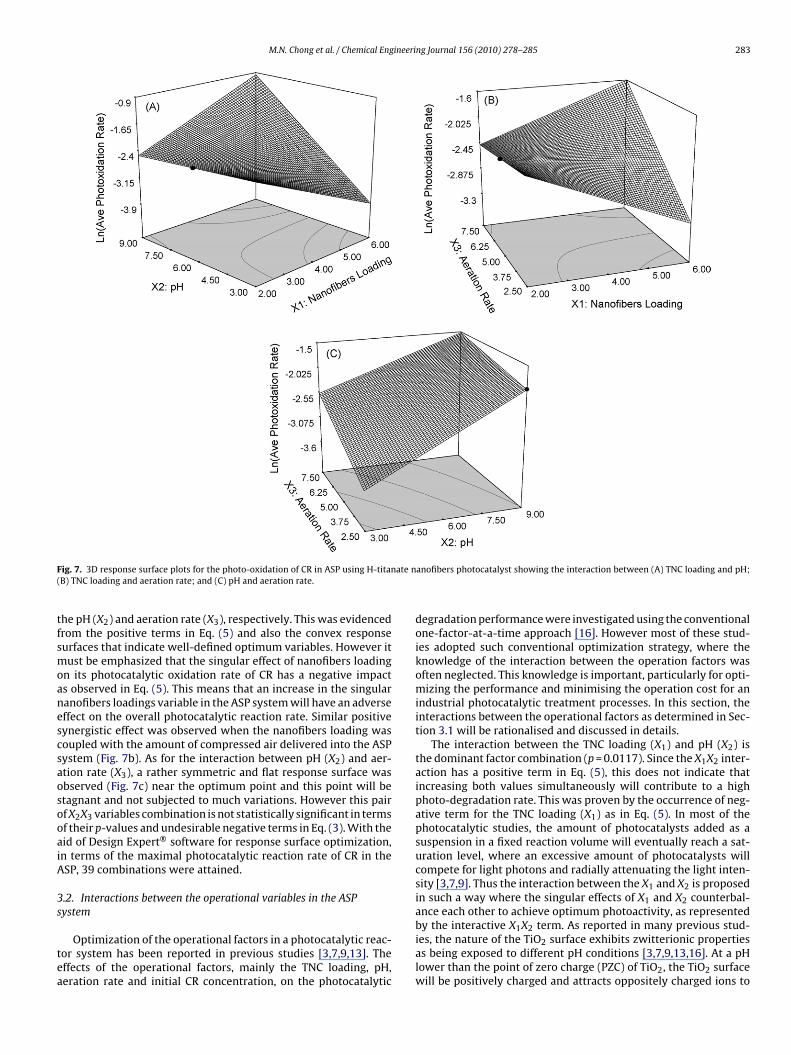
The three-dimensional (3D) response surface plots as presentedin Fig. 7 are graphical representations of the established regressionequation (Eq. (5)) to achieve better understanding for the inter-actions between variables and to determine the optimum level ofeach variable for maximum photocatalytic oxidation rate of CR inthe ASP system [19]. For the 6 possible two-variable combinationinteraction, three pairs was determined as the prominent contrib-utors (sum of squares > 0) to the operational conditions in the ASP,which is the X1X2, X1X3 and X2X3 with their corresponding low p-
values. The other three combinations have aliased the other termsin the model used and thus were not uniquely estimated for theirp-values. From Fig. 7a and b, it was found that the nanofibers load-ings (X1) have positive synergistic effects when being coupled withFig. 6. Plot of internally studentized residuals against model predicted value.
M.N. Chong et al. / Chemical Engineering Journal 156 (2010) 278–285 283
F ate n(
tfsmoanescsaosooaiA
3s
tea
ig. 7. 3D response surface plots for the photo-oxidation of CR in ASP using H-titanB) TNC loading and aeration rate; and (C) pH and aeration rate.
he pH (X2) and aeration rate (X3), respectively. This was evidencedrom the positive terms in Eq. (5) and also the convex responseurfaces that indicate well-defined optimum variables. However itust be emphasized that the singular effect of nanofibers loading
n its photocatalytic oxidation rate of CR has a negative impacts observed in Eq. (5). This means that an increase in the singularanofibers loadings variable in the ASP system will have an adverseffect on the overall photocatalytic reaction rate. Similar positiveynergistic effect was observed when the nanofibers loading wasoupled with the amount of compressed air delivered into the ASPystem (Fig. 7b). As for the interaction between pH (X2) and aer-tion rate (X3), a rather symmetric and flat response surface wasbserved (Fig. 7c) near the optimum point and this point will betagnant and not subjected to much variations. However this pairf X2X3 variables combination is not statistically significant in termsf their p-values and undesirable negative terms in Eq. (3). With theid of Design Expert® software for response surface optimization,n terms of the maximal photocatalytic reaction rate of CR in theSP, 39 combinations were attained.
.2. Interactions between the operational variables in the ASPystem
Optimization of the operational factors in a photocatalytic reac-or system has been reported in previous studies [3,7,9,13]. Theffects of the operational factors, mainly the TNC loading, pH,eration rate and initial CR concentration, on the photocatalytic
anofibers photocatalyst showing the interaction between (A) TNC loading and pH;
degradation performance were investigated using the conventionalone-factor-at-a-time approach [16]. However most of these stud-ies adopted such conventional optimization strategy, where theknowledge of the interaction between the operation factors wasoften neglected. This knowledge is important, particularly for opti-mizing the performance and minimising the operation cost for anindustrial photocatalytic treatment processes. In this section, theinteractions between the operational factors as determined in Sec-tion 3.1 will be rationalised and discussed in details.
The interaction between the TNC loading (X1) and pH (X2) isthe dominant factor combination (p = 0.0117). Since the X1X2 inter-action has a positive term in Eq. (5), this does not indicate thatincreasing both values simultaneously will contribute to a highphoto-degradation rate. This was proven by the occurrence of neg-ative term for the TNC loading (X1) as in Eq. (5). In most of thephotocatalytic studies, the amount of photocatalysts added as asuspension in a fixed reaction volume will eventually reach a sat-uration level, where an excessive amount of photocatalysts willcompete for light photons and radially attenuating the light inten-sity [3,7,9]. Thus the interaction between the X1 and X2 is proposedin such a way where the singular effects of X1 and X2 counterbal-ance each other to achieve optimum photoactivity, as represented
by the interactive X1X2 term. As reported in many previous stud-ies, the nature of the TiO2 surface exhibits zwitterionic propertiesas being exposed to different pH conditions [3,7,9,13,16]. At a pHlower than the point of zero charge (PZC) of TiO2, the TiO2 surfacewill be positively charged and attracts oppositely charged ions to
2 ineeri
ts(ua(anh
tA(tchiptrsatotl
afiecduItna(abwbpb(tTpawar
3
dcv0iowtt
84 M.N. Chong et al. / Chemical Eng
he vicinity of its surface for photocatalytic reaction [7,9]. Since dis-olved CR is an anionic molecules, it is anticipated that at pH < PZCTiO2) and ascending nanofibers concentration beyond the ASP sat-ration level, the maximum photocatalytic reaction rate will bettained. From Fig. 7a, other possibility is that at pH > PZC (TiO2)i.e. with increasing electrostatic repulsion between the nanofibersnd CR), these electrostatic effect can be compensated by higheranofibers loading to increase the possibility of surface contact andence, counterbalance the photocatalytic reaction rate [30].
Similar counterbalance interactive term was also observed inhe nanofibers loading (X1) with aeration rate (X3) used in theSP system (Fig. 7b), owing to the adversity of X1 variable in Eq.
5). The interactive combination of low nanofibers loading (upo saturation level) with high aeration rate (above 5 dm3 min−1)an yield an optimal reaction rate owing to a higher degree ofomogeneous dispersion and mixing. At higher nanofibers load-
ng with lower aeration rate (2.5 dm3 min−1), an irregular mixingattern and rapid sedimentation of the nanofibers that blockedhe bubble sparger plate was observed at the end of each batchun. Chin et al. [9] observed that at an ascending aeration rate, theize of the bubble formed will also increase and further createsshielding effect (bubble clouds) against the efficient distribu-
ion of light photons in the reactor. This will further weightn the effective attenuation of light photons within the reac-or when the nanofibers loading was well above the saturationevel.
As for the interactive term between the effects of pH (X2) and theeration rate (X3) in Eq. (5), the interaction outcomes were differentrom the previously discussed X1X2 and X1X3 terms (Fig. 7c). Thiss owing to the critical nature of this X2X3 term in the regressionquation (Eq. (5)) that will eventually lowered the overall photo-atalytic reaction rate. Although it was known that such term wasetrimental, the optimum level for this variable pair should be wellnderstood in order to minimise its unfavourable effect. Fernande-
banez et al. [31] discussed that to reduce the aggregation betweenhe TiO2 particles used; the operating pH should be well maintainedear the PZC (TiO2). This is to reduce the possible surface inter-ction between the polar molecules at pH distant from the PZCTiO2), which will reduce the specific surface area due to particlesggregation. In addition, low aeration rate (2.5 dm3 min−1) shoulde avoided from coupling with pH distant from PZC (TiO2), as thisill further promotes the formation of large TiO2 clumps during the
atch reaction. From the previous study, it was observed that bestossible combination between these variables of X2 and X3, shoulde attained at pH ∼ PZC (TiO2) and high aeration rate in the ASP5 dm3 min−1 and above). This will minimise the possible aggrega-ion of TiO2 nanofibers with rapid bubbling to disintegrate the largeiO2 clumps formation and further promotes homogeneous dis-ersion of nanofibers for maximum photo-efficiency. Chin et al. [9]lso observed and reported similar findings at high aeration rates,here the bubbling produced greater shear rates to prevent TiO2
gglomeration that leads to higher surface area for photocatalyticeaction.
.3. Verification of the established model
As reported in Section 3.1, a maximum photocatalytic degra-ation rate in the ASP system can be achieved with the optimalombinations via 39 different permutations of the operationariables. The optimum photocatalytic degradation rate was.1576 mg dm−3 min−1 at a particular combination; nanofiber load-
ng of 6 g dm−3, pH 9, aeration rate of 5 dm3 min−1 and 20 mg dm−3
f the initial CR concentration. All the optimal values were locatedithin the experimental span and varied around the centre points
o a limited extent. Subsequently, a verification experiment onhe chosen variable combination in achieving the reaction rate
ng Journal 156 (2010) 278–285
of 0.1576 mg dm−3 min−1 was carried out in the ASP system.The average photocatalytic degradation rate was found to be0.1563 ± 0.0282 mg dm−3 min−1. This showed that the establishedregression model for the current experimental span was highlyrobust in predicting the experimental outcomes. Further efforts canbe dedicated, when expanding the current model to incorporatedifferent water quality by introducing a fractional corrective fac-tor. This can be realised by taking the current model prediction asthe base case.
4. Conclusion
This study showed the development and application of sta-tistical design of experiments and response surface analysis fordetermining the optimal operation variables for optimizing thephotocatalytic degradation process using H-titanate nanofiber cat-alyst. The results generated from the statistical analysis and modelevaluation revealed that the DOE and RSA methods can be effec-tively adopted to optimize operation variables and to determinetheir interactions in the ASP system, which demonstrated an over-all advantage over the conventional one-factor-at-a-time method.In combination with the Taguchi DOE, a time-effective statisticalapproach was developed in solving the multivariables associatedwith the TiO2 photocatalytic water treatment system. In addition,the developed regression model could be effectively used as a mod-elling and design tool for scaling up the ASP system to a commercialscale process. This was considered as an innovative and robustapproach for system modelling over the conventional first principlederivation model that requires rapid parameters validation. Subse-quent work should be expanded to build a more realistic model byincorporating different water qualities, by taking the current resultas the base case.
Nomenclature
ANOVA analysis of varianceASP annular slurry photoreactorAve averageb regression coefficientB–C Box–CoxCOD chemical oxygen demandCR Congo redCV coefficient of variationdf degree of freedomDO dissolved oxygenDOE design of experimentFI factor interactionfn functionHCl hydrochloric acidH2O2 hydrogen peroxideLn natural logarithmicL9(3)4 Taguchi orthogonal arrayM molar (mol L−1)MS mean squareNaOH sodium hydroxideO2
•− superoxide radicalOA orthogonal arrayOH• hydroxyl radicalPTFE polytetrafluoroethylene
PZC point of zero chargeRo average photodegradation rate (mg dm−3 min−1)R′o natural log-transformed rate outputR2 correlation coefficientR&D research and development
ineeri
rRSSStTTTUX
Sotijk
G��˛�
A
Yw(Co
R
[
[
[
[
[
[
[
[
[
[
[
[
[
[
[
[
[
[
[
[
M.N. Chong et al. / Chemical Eng
pm revolution per minuteSA response surface analysis/N signal-to-noise ratioS sum of squarestd. Dev. standard deviation
total reaction time (min)EM transmission electron microscopyiO2 titanium dioxideNC H-titanate nanofiber catalystV ultraviolet
independent variable
ubscriptsinitial reaction time, t = 0reaction time, tlinear coefficientquadratic coefficientnumber of factors
reek symbolsstandard deviationmeanpower1 − power
cknowledgement
The authors would like to thank their Honour students Ruofeiee and Zhongde Lim for their technical assistances. This workas funded by the Australian Research Council Linkage Grant
LP0562153) and the Australian Water Quality Centre, SA Waterorporation through the Water Environmental Biotechnology Lab-ratory (WEBL) at the University of Adelaide.
eferences
[1] S. Mozia, M. Tomaszewska, A.W. Morawski, Photodegradation of azo dye AcidRed 18 in a quartz labyrinth flow reactor with immobilized TiO2 bed, DyesPigments 75 (2007) 60–66.
[2] L. Rizzo, J. Koch, M.A. Anderson, Removal of methylene blue in a photocatalyticreactor using polymethylmethacrylate supported TiO2 nanofilm, Desalination211 (2007) 1–9.
[3] I.J. Ochuma, R.P. Fishwick, J. Wood, J.M. Winterbottom, Optimisation of degra-dation conditions of 1,8-diazabicyclo[5.4.0]undec-7-ene in water and reactionkinetics analysis using a cocurrent downflow contactor photocatalytic reactor,Appl. Catal. B: Environ. 73 (2007) 259–268.
[4] K. Pirkanniemi, M. Sillanpaa, Heterogeneous water phase catalysis as an envi-ronmental application: a review, Chemosphere 48 (2002) 1047–1060.
[5] D. Bahnemann, Photocatalytic water treatment: solar energy applications, Sol.Energy 77 (2004) 445–459.
[6] U.I. Gaya, A.H. Abdullah, Heterogeneous photocatalytic degradation of organiccontaminants over titanium dioxide: a review of fundamentals, progress andproblems, J. Photochem. Photobiol. C: Photochem. Rev. 9 (2008) 1–12.
[7] A.P. Toor, A. Verma, C.K. Jotshi, P.K. Bajpai, V. Singh, Photocatalytic degradationof Direct Yellow 12 dye using UV/TiO2 in a shallow pond slurry reactor, DyesPigments 68 (2006) 53–60.
[
[
ng Journal 156 (2010) 278–285 285
[8] A. Fujishima, K.K. Honda, Photolysis-decomposition of water at surface of anirradiated semiconduction, Nature 238 (1972) 37.
[9] S.S. Chin, T.M. Lim, K. Chiang, A.G. Fane, Factors affecting the performance of alow-pressure submerged membrane photocatalytic reactor, Chem. Eng. J. 130(2007) 53–63.
10] M.N. Chong, V. Vimonses, S. Lei, B. Jin, C. Saint, C. Chow, Synthesis and charac-terisation of novel titania impregnated kaolinite nano-photocatalyst, Micropor.Mesopor. Mater. 117 (2009) 233–242.
11] J.S. Jang, W. Li, S.H. Oh, J.S. Lee, Fabrication of CdS/TiO2 nano-bulk compos-ite photocatalysts for hydrogen production from aqueous H2S solution undervisible light, Chem. Phys. Lett. 425 (2006) 278–282.
12] R.L. Pozzo, J.L. Giombi, M.A. Baltanas, A.E. Cassano, The performance in a flu-idized bed reactor of photocatalysts immobilized onto inert supports, Catal.Today 62 (2000) 175–187.
13] A. Bhargava, M.F. Kabir, E. Vaisman, C.H. Langford, A. Kantzas, Novel techniqueto characterize the hydrodynamics and analyze the performance of a fluidized-bed photocatalytic reactor for wastewater treatment, Ind. Eng. Chem. Res. 43(2004) 980–989.
14] H. Zhu, X. Gao, Y. Lan, D. Song, Y. Xi, J. Zhao, Hydrogen titanate nanofiberscovered with anatase nanocrystals: a delicate structure achieved by the wetchemistry reaction of the titanate nanofibers, J. Am. Chem. Soc. Commun. 126(2004) 8380–8381.
15] H.Y. Zhu, Y. Lan, X.P. Gao, S.P. Ringer, Z.F. Zheng, D.Y. Song, J.C. Zhao, Phasetransition between nanostructures of titanate and titanium dioxides via simplewet-chemical reactions, J. Am. Chem. Soc. 127 (2005) 6730–6736.
16] M.N. Chong, B. Jin, H.Y. Zhu, C. Chow, C. Saint, Application of H-titanatenanofibers for degradation of Congo Red in an annular slurry photoreactor,Chem. Eng. J. 150 (2009) 49–54.
17] L. Levin, C. Herrmann, V.L. Papinutti, Optimization of lignocellulolytic enzymeproduction by the white-rot fungus Trametes trogii in solid-state fermentationusing response surface methodology, Biochem. Eng. J 39 (2008) 207–214.
18] X. Chen, W. Du, D. Liu, Response surface optimization of biocatalytic biodieselproduction with acid oil, Biochem. Eng. J. 40 (2008) 423–429.
19] L. Yu, T. Lei, X. Ren, X. Pei, Y. Feng, Response surface optimization of l-(+)-lacticacid production using corn steep liquor as an alternative nitrogen source byLactobacillus rhamnosus CGMCC 1466, Biochem. Eng. J 39 (2008) 496–502.
20] Q. Wang, H. Ma, W. Xu, L. Gong, W. Zhang, D. Zou, Ethanol production fromkitchen garbage using response surface methodology, Biochem. Eng. J. 39(2008) 604–610.
21] W. Charteris, Taguchi’s system of experimental design and data analysis: a qual-ity engineering technology for the food industry, J. Soc. Dairy Technol. 45 (1992)33–49.
22] K.D. Kim, S.H. Kim, H.T. Kim, Applying the Taguchi method to the optimiza-tion for the synthesis of TiO2 nanoparticles by hydrolysis of TEOT in micelles,Colloids Surf. A: Physicochem. Eng. Aspects 254 (2005) 99–105.
23] G. Taguchi, System of Experimental Design Volumes 1 and 2, UNIPUB KraussInternational, New York, 1987.
24] Z. Li, O.P. Malik, An orthogonal test approach based control parameter opti-mizationand its application to a hydro-turbine governor, IEEE Trans. EnergyConver. 12 (1997) 388–393.
25] R.D. Cook, Residuals and Influence in Regression, Chapman and Hall, New York,1982.
26] E. Sayan, M. Bayramoglu, Statistical modeling of sulfuric acid leaching of TiO2
from red mud, Hydrometallurgy 57 (2000) 181–186.27] A.F. Caliman, C. Cojocaru, A. Antoniadis, I. Poulios, Optimized photocatalytic
degradation of Alcian Blue 8 GX in the presence of TiO2 suspensions, J. Hazard.Mater. 144 (2007) 265–273.
28] G.E.P. Box, D.R. Cox, An analysis of transformation (with discussion), J. R. Stat.Soc. B26 (1964) 211–252.
29] Y.S. Song, D.Y. Lee, B.Y. Kim, Effect of glass frit addition on corrosion resistanceof Ti/TiO2/IrO2–RuO2 films, Mater. Lett. 58 (2004) 817–823.
30] R.A. Burns, J.C. Crittenden, D.W. Hand, V.H. Selzer, L.L. Sutter, S.R. Salman, Effectof inorganic ions in heterogeneous photocatalysis of TCE, J. Environ. Eng. 125(1999) 77–85.
31] P. Fernande-Ibanez, J. Blanco, S. Malato, F.J. Nieves, Application of the colloidalstability of TiO2 particles for recovery and reuse in solar photocatalysis, WaterRes. 37 (2003) 3180–3188.
Copyright © 2022 FDOKUMEN