Juniper Secure Analytics Managing Vulnerability Assessment ...
Upload
independentCategory
view
0download
0
Remote Sens. 2013, 5, 5330-5345; doi:10.3390/rs5105330
Remote Sensing ISSN 2072-4292
www.mdpi.com/journal/remotesensing
Article
Response of Spectral Reflectances and Vegetation Indices on Varying Juniper Cone Densities
Dailiang Peng 1,*, Zhangyan Jiang 2, Alfredo R. Huete 3, Guillermo E. Ponce-Campos 4,5,
Uyen Nguyen 2 and Jeffrey C. Luvall 6
1 Key Laboratory of Digital Earth Science, Institute of Remote Sensing and Digital Earth,
Chinese Academy of Sciences, Beijing 100094, China 2 Department of Soil, Water, and Environmental Science, University of Arizona, Tucson, AZ 85721,
USA; E-Mails: [email protected] (Z.J.); [email protected] (U.N.) 3 Plant Functional Biology and Climate Change Cluster (C3), University of Technology, Sydney,
NSW 2007, Australia; E-Mail: [email protected] 4 USDA ARS Southwest Watershed Research, Tucson, AZ 85719, USA;
E-Mail: [email protected] 5 Soil, Water and Environmental Sciences, University of Arizona, Tucson, AZ 85721, USA 6 Marshall Space Flight Center, NASA, Huntsville, AL 35805, USA; E-Mail: [email protected]
* Author to whom correspondence should be addressed; E-Mail: [email protected];
Tel.: +86-10-8217-8181; Fax: +86-10-8217-8177.
Received: 24 August 2013; in revised form: 29 September 2013 / Accepted: 8 October 2013 /
Published: 22 October 2013
Abstract: Juniper trees are widely distributed throughout the world and are common
sources of allergies when microscopic pollen grains are transported by wind and inhaled. In
this study, we investigated the spectral influences of pollen-discharging male juniper cones
within a juniper canopy. This was done through a controlled outdoor experiment involving
ASD FieldSpec Pro Spectroradiometer measurements over juniper canopies of varying
cone densities. Broadband and narrowband spectral reflectance and vegetation index (VI)
patterns were evaluated as to their sensitivity and their ability to discriminate the presence
of cones. The overall aim of this research was to assess remotely sensed phenological
capabilities to detect pollen-bearing juniper trees for public health applications. A general
decrease in reflectance values with increasing juniper cone density was found, particularly
in the Green (545–565 nm) and NIR (750–1,350 nm) regions. In contrast, reflectances in
the shortwave-infrared (SWIR, 2,000 nm to 2,350 nm) region decreased from no cone
presence to intermediate amounts (90 g/m2) and then increased from intermediate levels to
OPEN ACCESS

Remote Sens. 2013, 5 5331
the highest cone densities (200 g/m2). Reflectance patterns in the Red (620–700 nm) were
more complex due to shifting contrast patterns in absorptance between cones and juniper
foliage, where juniper foliage is more absorbing than cones only within the intense
narrowband region of maximum chlorophyll absorption near 680 nm. Overall, narrowband
reflectances were more sensitive to cone density changes than the equivalent MODIS
broadbands. In all VIs analyzed, there were significant relationships with cone density
levels, particularly with the narrowband versions and the two-band vegetation index
(TBVI) based on Green and Red bands, a promising outcome for the use of phenocams in
juniper phenology trait studies. These results indicate that spectral indices are sensitive to
certain juniper phenologic traits that can potentially be used for juniper cone detection in
support of public health applications.
Keywords: juniper; hyperspectral; vegetation index; cones; ASD; phenology
1. Introduction
Junipers are woody coniferous plants belonging to the genus Juniperus of the cypress family
Cupressaceae [1]. Since the late 1800s, juniper populations have been expanding rapidly, for example,
in eastern Oregon, juniper canopy cover has increased by 80% from 1939 to 1988 [2–4]. Now, juniper
tree species are widely distributed throughout the northern hemisphere, from the Arctic to tropical
Africa and the mountains of Central America. In North America, juniper is found in western Alaska,
throughout Canada, and northern parts of the USA, extending from the northern latitudinal limit of
trees south to the mountains of California, Arizona and New Mexico [5,6].
Juniper woodlands are managed for a variety of purposes, including watershed health, fuelwood,
pine nuts, Christmas trees, and wildlife habitat [6]. However, juniper trees are common sources of
allergies when microscopic pollen grains are transported by the wind and inhaled, and pollen can travel
long distances under certain weather conditions. These pollen allergens have strong cross-reactivity
among allergic individuals and are major public health concerns in many parts of North America [7].
Thus, there is great interest in linking juniper canopy traits with pollen discharge occurrence for public
health studies.
Some studies have observed the presence of flower petals to directly alter canopy-scale reflectances
in certain wavelengths, resulting in lower values of the Normalized Difference Vegetation Index
(NDVI), due to increases in reflected Red band reflectance from the flower petals and the masking of
green foliage by the flower petals [8–11]. Using the AVHRR imagery from the NOAA-10 satellite,
Peters et al. noted that the dense yellow flower mass from a short grass prairie reduced NDVI values
by decreasing absorption at the Red wavelengths [10]. Shen et al. observed clear decreases in NDVI
and Enhanced Vegetation Index (EVI) values from the Moderate Resolution Imaging Spectroradiometer
(MODIS) due to the presence of yellow flowers in alpine meadows, and suggested that these effects be
further studied through satellite-based phenology monitoring of vegetation that exhibit profuse seasonal
blooms [12]. However, few studies have focused on the detection of pollen and pollen-discharging cones
using remote sensing.

Remote Sens. 2013, 5 5332
In this study, the presence of male juniper cones (the carrier or source of pollen) in juniper canopies was
investigated with field-based spectroradiometers to explore the relationship between juniper cone density
and remotely-sensed, narrowband and broadband spectral reflectances and vegetation indices (VIs).
2. Methods
2.1. Acquisition of Juniper Canopy Spectra
A set of fresh juniper (Juniperus monosperma) branch samples containing dense juniper cones were
harvested from the Santa Catalina Mountains, near Tucson, Arizona (32.542°N, 110.710°W), and
positioned over a black painted supporting frame with dimensions of 0.5 × 0.55 m (Figure 1a). In
addition, we collected three soil backgrounds representing a bright (sandy) to dark (loam) brightness
range. Juniper canopy spectral reflectance signatures were measured with an ASD FieldSpec Pro
spectroradiometer that sampled every 1 nm, at 10 nm nominal spectral resolution, over a wavelength
range from 350 to 2,500 nm, and a field of view (FOV) 18 degrees. In a controlled experimental setup,
the ASD probe was mounted on a black bracket and fixed at a height of 1.5 m above the juniper
canopy full of cones.
Figure 1. Juniper canopy (a) full of cones and (b) with no cones.
(a) (b)
Juniper spectral reflectance measurements for variable cone densities were made under clear and
sunny sky conditions between 13:00 and 15:30 local time. Each set of measurements consisted of one
juniper cone density level with 10 replicate readings, and reference panel reading. The interval time for
each measurement sequence was approximately 3–5 min. The 10 juniper canopies with three soil
background replicates were averaged and followed by measurements over a white reference Spectralon
panel for computation of reflectances.
After the complete set of measurements, we removed a portion of the cones from the juniper
branches and repeated the juniper canopy spectra measurements with the new cone density level.
Remote Sens. 2013, 5 5333
The juniper branches were gradually thinned of juniper cones until there were no visible cones
remaining (see Figure 1b). For each sequence, the fresh weight of the removed juniper cones was
determined. In this manner, measurements over 10 cone density levels were obtained. We weighed the
cones with an analytical balance, and divided by the area of the bracket, resulting in the following
measured cone density levels (rounded to nearest 10 g/m2), 200, 190, 180, 170, 150, 140, 120, 90, 50,
and 0, respectively.
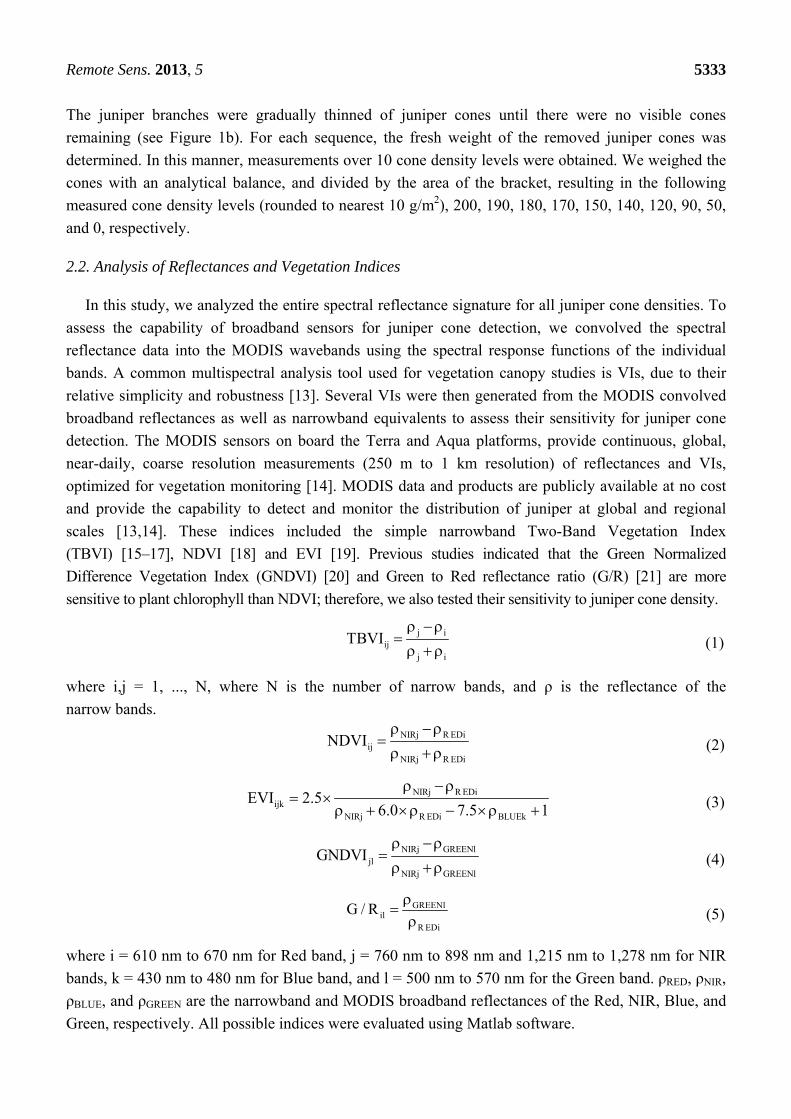
2.2. Analysis of Reflectances and Vegetation Indices
In this study, we analyzed the entire spectral reflectance signature for all juniper cone densities. To
assess the capability of broadband sensors for juniper cone detection, we convolved the spectral
reflectance data into the MODIS wavebands using the spectral response functions of the individual
bands. A common multispectral analysis tool used for vegetation canopy studies is VIs, due to their
relative simplicity and robustness [13]. Several VIs were then generated from the MODIS convolved
broadband reflectances as well as narrowband equivalents to assess their sensitivity for juniper cone
detection. The MODIS sensors on board the Terra and Aqua platforms, provide continuous, global,
near-daily, coarse resolution measurements (250 m to 1 km resolution) of reflectances and VIs,
optimized for vegetation monitoring [14]. MODIS data and products are publicly available at no cost
and provide the capability to detect and monitor the distribution of juniper at global and regional
scales [13,14]. These indices included the simple narrowband Two-Band Vegetation Index
(TBVI) [15–17], NDVI [18] and EVI [19]. Previous studies indicated that the Green Normalized
Difference Vegetation Index (GNDVI) [20] and Green to Red reflectance ratio (G/R) [21] are more
sensitive to plant chlorophyll than NDVI; therefore, we also tested their sensitivity to juniper cone density.
(1)
where i,j = 1, ..., N, where N is the number of narrow bands, and ρ is the reflectance of the
narrow bands.
NIRj R EDiij
NIRj R EDi
NDVI
(2)
NIRj R EDiijk
NIRj R EDi BLUEk
EVI 2.56.0 7.5 1
(3)
NIRj GREENljl
NIRj GREENl
GNDVI
(4)
GREENlil
R EDi
G / R
(5)
where i = 610 nm to 670 nm for Red band, j = 760 nm to 898 nm and 1,215 nm to 1,278 nm for NIR
bands, k = 430 nm to 480 nm for Blue band, and l = 500 nm to 570 nm for the Green band. ρRED, ρNIR,
ρBLUE, and ρGREEN are the narrowband and MODIS broadband reflectances of the Red, NIR, Blue, and
Green, respectively. All possible indices were evaluated using Matlab software.
j iij
j i
TBVI

Remote Sens. 2013, 5 5334
2.3. Variation Analysis of Juniper Canopy Spectra and Vegetation Indices
To depict spectral signature and VI differences across the juniper cone densities of this study, we
used the percent relative change, as:
cones no cones
no cones
X XRe lative change(%)= 100%
X
(6)
where Xcones, Xno cones, are the reflectances (or VIs) of the juniper canopy with and without the
cones, respectively.
The coefficient of determination (R2), slope (S), and coefficient of variation (CV) were used to
select the most sensitive bands (or VIs) to changes in juniper cone density. R2, S, and CV are defined
as follows: R2 is the square of the correlation coefficient between reflectance (or VIs) and the cone
densities. S, or named gradient, was calculated by the change in the reflectance (or VIs) divided by the
corresponding change in the cone densities, where the relationship between measured reflectances (or
VIs) and the cone densities was linear, and no transformation for S calculation was required. Higher
values of R2 and S indicate a more significant change of reflectance (or VIs) with cone densities. CV
was defined as the ratio of the standard deviation of reflectance (or VIs) to their mean value, which
showed the extent of variability in relation to mean of the reflectance (or VIs) caused by juniper cone
changes. We calculated R2, S and CV using the MATLAB software.
3. Results and Discussion
3.1. Juniper Canopy Spectral Signatures with Varying Cone Densities
In general, the juniper canopy reflectance signatures appear representative of typical green
vegetation spectra, with high reflectances in the NIR region due to leaf-level mesophyll scattering, low
reflectance in the Red region (around 670 nm) attributed to chlorophyll absorption, and a weaker
“Green spectra” reflectance peak at around 550 nm (Figure 2) [12]. A general overall decrease in
reflectance values with increasing juniper cone density was found, particularly in the Green
(545–565 nm) and NIR (750–1,350 nm) regions. In contrast, reflectances in the shortwave-infrared
(SWIR, 2,000 nm to 2,350 nm) region decreased from no cone presence to intermediate amounts
(90 g/m2) and then increased from intermediate levels to the highest cone densities (200 g/m2)
(Figure 2). SWIR reflectances in the 1,450–1,750 nm spectral region changed the least but generally
decreased slightly with cone presence. Reflectance patterns in the Red (620–700 nm) were more
complex and exhibited a critical value at approximately 655 nm in which the relatively flat reflectance
profile from the highest cone density intersected the Red reflectance profile from the juniper canopy
with no cones (Figure 2). This highlights the delicate contrast patterns in absorptance between cones
and juniper foliage, where juniper foliage is more absorbing than cones only within the intense
narrowband region of maximum chlorophyll absorption near 680 nm.

Remote Sens. 2013, 5 5335
Figure 2. Juniper canopy spectral reflectance curves for variable cone densities (0, 50, 90,
140, 180, 200 g/m2). Only six of the cone density levels are shown in order to more clearly
depict the reflectance signature shifts.
(a)
(b) (c)
The percentage relative spectral reflectance changes, from the zero cone density case to the various
cone density levels (Equation (6)), are shown in Figure 3. The most pronounced relative reflectance
changes occurred in the visible spectral region and SWIR region beyond 2,000 nm (Figure 3). Visible
reflectance changes were highly spectrally-dependent and most intense with the highest level of cones
and varied from nearly −30%, in the Blue, Green, and NIR, to +17% in the Red region, relative to the
juniper canopy without cones. The SWIR region beyond 2,000 nm resulted in nearly equivalent
differences, ranging from −25% to +15%. The remaining spectral region, from ~1,000 nm to 2,000 nm,
varied the least with relative changes between −10% and +5%. Only small portions of the SWIR
region, at 1,450–1,540 nm, 2,000–2,100 nm, and 2,270–2,350 nm, showed positive reflectance
changes, which occurred only for the higher juniper cone densities (Figure 3).
The first derivative of the juniper spectral signatures was derived to assess the contrast between the
visible and NIR regions to evaluate changes to the “Red edge”, or Red to NIR slopes, for the various
cone densities (Figure 4). This showed quite clearly the strong reduction in the strength and amplitude
of the Red edge with increasing cone presence and density. Furthermore, there were no spectral
wavelength shifts of the Red edge peak, indicating that variations in cone density had no effect on the
health or the stress condition of the green canopy foliage [22,23]. This was an expected and useful
outcome since the juniper canopy itself was constant and not subjected to different stress treatments.

Remote Sens. 2013, 5 5336
There was also a smaller reduction in the Green edge peak, at 520 nm, indicating reductions in Green
in contrast with the presence of cones (Figure 4).
Figure 3. Juniper canopy reflectance changes for various juniper cone densities (50, 90,
140, 180, 200 g/m2) relative to juniper with no cones. MODIS bandwidths and location are
shown along the “x” axis.
Figure 4. First derivative reflectance spectra across the visible and Near Infrared (NIR)
region for the juniper canopy with varying cone density levels.
3.2. Comparisons of Narrow- and Broadband Sensitivity to Cone Density Variations
We compared narrow- and broadband reflectances to determine if fine-temporal resolution, but
broadband sensor platforms (e.g., MODIS) is able to spectrally detect the reflectance patterns observed
in our dataset. The R2 of linear regression between spectral reflectances for all wavelengths and cone
densities were shown in Figure 5. The Visible spectral region showed significant correlation
(P > 0.001) with cone density variations, as well as the NIR (about 700 nm–1,350 nm), and SWIR

Remote Sens. 2013, 5 5337
(about 1,550 nm–1,770 nm) spectral regions. Broadband results were compared with narrowband
equivalents through selection of the most sensitive narrowband based on maximum values of R2, S,
and CV (Table 1). The most sensitive narrowband in the Red spectral range was 610 nm for all three
measures of sensitivity; both 480 nm and 458 nm were the most sensitive in the Blue; 538 nm, 555 nm,
and 546 nm were the most sensitive bands in Green; 760 nm and 768 nm was the most sensitive bands
in NIR range; and 1,662 and 2,001 nm were the most sensitive bands in SWIR range.
Figure 5. The coefficient of determination (R2) of linear regression between spectral
reflectances and cone densities.
Table 1. Narrowband positions resulting in the best measures of cone density, based on
maximum values of R2, slope (S), and coefficient of variation (CV), along with
corresponding MODIS broadband for different spectral ranges.
Band Ranges R2 S CV
Blue (430–480 nm) 0.81 *** (458 nm) 7.1 × 10⁻⁴ (480 nm) 0.10 (480 nm)
MODIS Band 3 0.80 *** 6.6 × 10⁻⁴ 0.09
Green (500–570 nm) 0.88*** (538 nm) 2.1 × 10⁻³ (555 nm) 0.13 (546 nm)
MODIS Band 4 0.87 *** 2.0 × 10⁻³ 0.12
Red (610–670 nm) 0.55** (610 nm) 8.7 × 10⁻⁴ (610 nm) 0.09 (610 nm)
MODIS Band 1 0.03 0.7 × 10⁻⁴ 0.06
NIR (760–898 nm) 0.91*** (768 nm) 9.4 × 10⁻³ (760 nm) 0.12 (760 nm)
MODIS Band 2 0.88 *** 8.5 × 10⁻³ 0.09
NIR (1215–1278 nm) 0.85*** (1,260 nm) 3.6 × 10⁻³ (1,262 nm) 0.05 (1,262 nm)
MODIS Band 5 0.84 3.4 × 10⁻³ 0.04
SWIR (1597–1661 nm) 0.91*** (1,661 nm) 1.8 × 10⁻³ (2,001 nm) 0.13 (2,001 nm)
MODIS Band 6 0.86 *** 1.1 × 10⁻³ 0.03
SWIR (2000–2174 nm) 0.28(2,005 nm) 1.7 × 10⁻³ (2,000 nm) 0.13 (2,001 nm)
MODIS Band 7 0.01 0.4 × 10⁻³ 0.09
Note: ** Significant at the p < 0.01 level, *** Significant at the p < 0.001 level.
The percent relative changes of MODIS-convolved broadband and corresponding narrowband
(based on the best-fit R2 values) reflectance data are shown in Figure 6 for all juniper cone densities.

Remote Sens. 2013, 5 5338
The reflectances in MODIS Bands 3–6 and corresponding narrowbands (458 nm, 538 nm, 1,260 nm,
and 1,661 nm) both decreased with cone density with nearly indistinguishable patterns, although the
1,661 nm narrowband was slightly more sensitive than MODIS band 6 (Figure 6). The narrowband
reflectances, 610 nm, 768 nm, and 2005 nm, showed more sensitivity to cone density variations than
the equivalent MODIS Bands 1, 2, and 7, respectively. The greatest decrease in reflectances was
observed from low to intermediate cone density levels (from 0 to ~100 g/m2, in all bands except for
MODIS Band 5 and Band 6, which showed only slight decreases. At juniper cone densities higher than
100 g/m2, the decreasing trend in reflectances reversed to positive trends in MODIS Band 1 (Red) and
Band 7 (SWIR2), and at the highest cone density level (200 g/m2), these two bands showed no relative
change from the 0 g/m2 cone juniper measurement. Reflectances also decreased (~15%) and then
increased (~20%) for the corresponding narrow bands of 610 nm and 2,005 nm. On the other hand, the
remaining MODIS bands continued their reflectance declines with increasing juniper cone densities for
all levels analyzed in this study, while MODIS Band 3 became stable beyond 90 g/m2 (Figure 6).
Figure 6. Relative changes in juniper canopy reflectance for different levels of
juniper cone densities in MODIS Bands 1–7 and corresponding narrowband with the
best-fit R2 values.
Sensitivity to cone density variations between the narrowband and MODIS broadband reflectance
as well as for narrow- and broadband VIs, was assessed through statistical measures, R2, S, CV
(Tables 1 and 2). Small difference between narrow- and broadbands were observed for the Blue and
Green bands, while for the Red band, the values of R2, S, and CVs at 610 nm were significantly higher
than the equivalent MODIS broadband, which showed no significant correlation with juniper cone
density changes despite a significant correlation (p < 0.01) shown for the 610 nm narrowband. The
overall comparisons showed that spectral sensitivity was greater in the narrowbands relative to the
MODIS broadbands.
It was found that the narrowband versions of NDVI (670 nm, 760 nm), GNDVI (538 nm,
1,215 nm), and G/R (570 nm, 670 nm) were most sensitive to cone density variations among all VIs

Remote Sens. 2013, 5 5339
derived from different band combinations, although the narrowband EVI (432 nm, 670 nm, and
768 nm) differed little from the broadband EVI, with R2 of 0.98 and 0.97, respectively (see Table 2).
Table 2. Narrowband positions resulting in the maximum values of R2, S, and CV, along
with corresponding MODIS broadband for different vegetation indices. Narrowband TBVI
was made with the region of MODIS Bands 4 and 1.
Vegetation Index R2 S CV
Narrowband TBVI 0.97 ***
(502 nm, 670 nm)
2.5 × 10⁻²
(538 nm, 670 nm)
0.99
(547 nm, 638 nm)
MODIS TBVI 0.94 ***
(MODIS Band 4 and 1)
1.9 × 10⁻²
(MODIS Band 7 and 4)
0.79
(MODIS Band 7 and 4)
Narrowband EVI 0.98 ***
(432 nm, 670 nm, 768 nm)
1.8 × 10⁻²
(480 nm, 670 nm, 760 nm)
0.14
(480 nm, 670 nm, 760 nm)
MODIS EVI 0.97 *** 1.2 × 10⁻² 0.09
Narrowband NDVI 0.89 *** (670 nm, 760 nm) 1.2 × 10⁻²
(670 nm, 760 nm)
0.05
(670 nm, 760 nm)
MODIS NDVI 0.76*** 0.6 × 10⁻² 0.03
Narrowband
GNDVI
0.86 ***
(538 nm, 1,215 nm)
6.7 × 10⁻³
(552 nm, 1215 nm)
0.04
(554 nm, 1,215 nm)
MODIS GNDVI 0.76 *** 2.0 × 10⁻³ 0.01
Narrowband G/R 0.98 ***
(570 nm, 670 nm)
6.3 × 10⁻²
(555 nm, 670 nm)
0.15
(546 nm, 670 nm)
MODIS G/R 0.96 *** 4.0 × 10⁻² 0.11
Note: *** Significant at the p < 0.001 level.
Figure 7. 2D correlation plots illustrating the coefficient of determination (R2) of linear
regression between all possible Two-Band Vegetation Index (TBVI) and cone densities. The
black square frame is the region of Green and Red corresponding to MODIS Bands 4 and 1.

Remote Sens. 2013, 5 5340
The coefficient of determination (R2) of linear regression between all possible TBVI and cone
densities was depicted in Figure 7. The best narrowband TBVI (692 nm, 648 nm) yielded two Red
bands, which would normally be considered redundant, however, from Figure 2 it was observed that
there are two distinct Red spectral regions in which juniper foliage and cones reverse their contrasts.
This narrowband TBVI (692 nm, 648 nm) was the most sensitive index to cone density variations than
any other VI analyzed in this study, with an R2 of 0.99. When the same TBVI analyses was made with
the MODIS bands, the best two broadbands were Bands 4 and 1 (Green, Red), as there was only 1 Red
band available (Table 2). If we use the S and CV statistical criteria of sensitivity, then MODIS
broadband TBVI calculated by MODIS Bands 7 and 4 was more sensitive to cone density variations
which exceeded the narrowband TBVI (692 nm, 648 nm).
3.3. Relationship between Vegetation Indices and Juniper Cone Densities
In Figure 8a, the relationship of narrowband and broadband VIs with juniper cone density is shown
for TBVI, NDVI, EVI, GNDVI, and G/R (Equations (1–5)). All indices, except narrow- and
broadband GNDVI, exhibited negative relationships with cone density, with the G/R and EVI showing
the strongest negative relationship, with R2 values of ~0.97 for the G/R and EVI from narrowband and
broadband (P < 0.001). NDVI showed a relative weaker relationship (R2 = 0.89 and 0.76 for
narrowband and broadband NDVI, P < 0.001) compared with other indices, partly due to saturation of
the NDVI signal caused by the dense juniper canopy, as shown in Figure 1. The regression relationship
between juniper cone density and GNDVI, on the other hand, was slightly positive with a stronger
coefficient of determination for narrowband compared with broadband GNDVI (R2 = 0.86 and 0.76,
respectively, P < 0.001) (Figure 8a).
Figure 8. (a) Vegetation index and (b) Vegetation Index relative changeover different
juniper cone densities, including MODIS broadband and narrow bands with the best-fit R2
values in Table 2.
(a)

Remote Sens. 2013, 5 5341
Figure 8. Cont.
(b)
The percent VI relative changes induced by juniper cones are depicted in Figure 8b. TBVI
(502 nm, 670 nm), narrowband GNDVI (538 nm, 1,215 nm) and broadband MODIS GNDVI increased
strongly, with the narrowband TBVI showing the largest variation of ~200%. The TBVI calculated
from MODIS Bands 4 and 1 decreased ~100% with cone density. The other indices decreased as a
result of juniper cone presence. The NDVI and GNDVI derived from MODIS broadbands showed less
sensitivity to juniper cones decreasing by 8% and increasing by 2%, respectively. Narrowband EVI
and G/R decreased by ~30% as a result of cone presence on the juniper canopy. The reflectance in the
Green band decreased with higher cone densities, resulting in increasing GNDVI values. Based on the
CV in Table 2 and the relative change in Figure 8b, all VIs derived from narrowbands had larger
variation than those derived from MODIS broadbands, which can also be found in Figure 8b.
3.4. Future Studies
Although the analysis conducted in this study was based on in-situ hyperspectral data, our results
provided important insights into the challenges of monitoring juniper cone presence and phenology at
larger scales from satellite and airborne derived data, where spatial, temporal and spectral resolutions
must be optimized and atmosphere correction available. Prior studies have considered the effects of
plant flowers on VIs (such as NDVI and EVI) for monitoring vegetation status during the flowering
season [12]. However, there have been no previous studies on the influence of cone presence and density.
This study suggests that it is potentially promising to employ satellite/airborne remote sensing
spectral-based techniques to monitor juniper phenology stages associated with pre-budding, budding
stage, and cone development. In particular spectral indices involving the Green and Red bands,
especially the G/R ratio and TBVI, provide high sensitivity to cone presence and density. The MODIS

Remote Sens. 2013, 5 5342
broadband Green-Red spectral indices were less sensitive than the narrowband versions, but
nevertheless remained highly sensitive and useful for juniper phenology studies. Furthermore,
narrowband and broadband sensitivities of the very useful Green band were equivalent and strongly
sensitive at low and intermediate levels of cone density, which is very promising for early detection of
cone development.
Although Juniper is an evergreen [24] species, further studies are needed to ensure there are no
significant leaf-level phenological spectral changes prior to, and post cone appearance. However, other
environmental factors (e.g., drought) may influence canopy reflectances, but these can be analyzed
through comparisons to the juniper plants without cones. A Red edge band and first derivative analyses
of hyperspectral data would distinguish between canopy spectral changes due to leaf stress from those
due to cone presence, however, current sensor systems used in phenology studies (e.g., Landsat and
MODIS) do not have sufficient spectral fidelity to do this. EO-1 Hyperion and future hyperspectral
missions would be highly useful in this regard.
At landscape scale, Juniper woodlands are largely open canopies with fractional covers that
typically range from 25% to 60% [25–27]. The cone spectral signal will be correspondingly diluted in
moderate to coarse resolution satellite imagery, and there will be soil background and vegetation
heterogeneity considerations. When the juniper tree coverage is low, the juniper cone signal will
become much weaker than that of green part of the vegetation canopy, and there will be large
uncertainties in retrievals of cone density. However, an important public health application is the
detection of juniper cone presence and development, rather than accurate cone density estimates.
Demonstrating the feasibility of predicting the strength of the pollen discharge period by estimating
Juniper cone density levels would be valuable to the public health user community.
Further studies are also needed to explore other juniper cone species, the influence of soil
background over varying juniper tree covers, as well as the influence of leaf phenology and
environmental stress. The results presented here demonstrate the utility of visible color bands for
juniper cone detection and thus we anticipate that simple camera based systems, such as phenocams,
that can monitor daily spectral changes in Red, Green, and Blue channels will be quite valuable in
juniper cone detection for early warning public health applications. Integrating satellite/airborne
remote sensing techniques, phenocams, and field spectroradiometric measures of canopy and leaf
spectra would provide valuable insights to resolve these issues.
4. Conclusions
In this study, in-situ juniper canopy reflectance spectra with 10 cone density levels were measured
with a field-based ASD spectroradiometer over black, loam, and sandy soils. The reflectance values of
the juniper canopy generally decreased at spectrally variable extents with the presence of juniper
cones, especially in the Blue, Green, and Near Infrared (NIR) bands, while the Red and portions of the
Shortwave Infrared (SWIR) showed mixed responses. The decreases of the reflectances in MODIS
Blue, Green, NIR, SWIR bands (Bands 3–6) and corresponding narrowbands (458 nm, 538 nm,
1,260 nm, and 1,661 nm) were similar, although the narrowband versions were slightly more sensitive.
However, the Red, NIR, and SWIR narrowband reflectances of 610 nm, 768 nm, and 2,005 nm were
more sensitive to cone density variations than equivalent MODIS Bands 1, 2, and 7, respectively. The
Remote Sens. 2013, 5 5343
largest decrease in reflectances was observed over the lower cone density levels, between 50 and
90 g/m2, in all bands except for MODIS Band 5 (1,230–1,250 nm) and Band 6 (1,628–1,652 nm). The
reflectances in MODIS Band 1 (620–670 nm) and Band 7 (2,105–2,155 nm) at the highest cone
density level (200 g/m2) showed nearly identical reflectances with the 0 g/m2 cone juniper
measurement, While for their corresponding narrow bands of 610 nm and 2,005 nm, where
reflectances decreased ~15% and increased ~20%, respectively.
The Normalized Difference Vegetation Index (NDVI) and Enhanced Vegetation Index (EVI)
displayed decreasing values with increasing cone densities. The Green Normalized Difference
Vegetation Index (GNDVI) showed slightly increasing values with cone density levels, indicating an
increasing contrast between these two bands with increasing cone density. In all VIs tested in this
study, we found significant relationships with cone density levels, however, there were large
differences in VI sensitivity to cones, with TBVI (502 nm, 670 nm) showing the strongest sensitivity,
followed by moderate sensitivity with G/R and EVI, and weak sensitivity with the NDVI and GNDVI.
The narrowband versions of VIs were generally more sensitive to cone density variations than the
MODIS broadbands. These results demonstrate that certain VIs are useful in juniper phenology studies
can be potentially exploited for detection of Juniper cone development prior to pollen discharge period.
Acknowledgments
This study was funded by the National Natural Science Foundation of China No. 41201354, NASA
Applications in Public Health grant (J. Luvall, P.I.), National Basic Research Program of China
No. 2009CB723902, National High-tech R&D Program of China No: 2012AA12A301, and Hundred
Talent Program of the Chinese Academy of Sciences of Wenjiang Huang No: Y24001101A.
We also thank Bing Zhang from Key Laboratory of Digital Earth Science, Institute of Remote Sensing
and Digital Earth, Chinese Academy of Sciences, for his help with several constructive comments.
Conflicts of Interest
The authors declare no conflict of interest.
References
1. Brenzel, K.N. Sunset Western Garden Book; Oxmoor House: Birmingham, AL, USA, 1995;
pp. 606–607.
2. Steven, L.P.; Tamzen, K.S. Development of GIS-based models to predict plant community
structure in relation to western juniper establishment. For. Ecol. Manage. 2008, 256, 981–989.
3. Gedney, D.R.; Azuma, D.L.; Bolsinger, C.L.; McKay, N. Western Juniper in Eastern Oregon.
General Technical Report PNW-GTR-464; United States Department of Agriculture: Twin Cities,
MN, USA, 1999.
4. Miller, R.F.; Bates, J.D.; Svejcar, T.J.; Pierson, F.B.; Eddleman, L.E. Biology, Ecology, And
Management of Western Juniper; Technical Bulletins 152; Agricultural Experiment Station,
Oregon State University: Corvallis, OR, USA, 2005.

Remote Sens. 2013, 5 5344
5. Jose´ Carlos, M.R. Diversity of maritime juniper woodlands. For. Ecol. Manage. 2004, 192,
267–276.
6. Alice, C.M. Use of pinyon-juniper woodlands by bats in New Mexico. For. Ecol. Manage. 2005,
204, 209–220.
7. Johnsona, R.M.; Barnesa, C.; Dhar, M.; Portnoy, J. Increase in midwestern airborne juniper pollen
over 13 years. J. Allergy Clin. Immun. 2010, 125, 25.
8. Behrens, T.; Muller, J.; Diepenbrock, W. Utilization of canopy reflectance to predict properties of
oilseed rape (Brassica napus L.) and barley (Hordeumvalgare L.) during ontogenesis. Eur. J.
Agoron. 2006, 25, 345–355.
9. Ge, S.; Everitt, J.; Carruthers, R.; Gong, P.; Anderson, G. Hyperspectral characteristics of canopy
components and structure for phonological assessment of an invasive weed. Environ. Monit.
Assess. 2006, 120, 109–126.
10. Peters, A.J.; Reed, B.C.; Eve, M.D.; Mcdaniel, K.C. Remote sensing of broom snakeweed
(Gutierreziasarothrae) with NOAA-10 spectral image processing. Weed Technol. 1992, 6,
1015–1020.
11. Verma, K.S.; Saxena, R.K.; Hajare, T.N.; Kharche, V.K.; Kumari, P.A. Spectral response of gram
varieties under variable soil conditions. Int. J. Remote Sens. 2002, 23, 313–324.
12. Shen, M.; Chen, J.; Zhu, X.; Tang, Y. Yellow flowers can decrease NDVI and EVI values:
Evidence from a field experiment in an alping meadow. Can. J. Remote Sens. 2009, 35, 99–106.
13. Peng, D.; Huete, A.R.; Huang, J.; Wang, F.; Sun, H. Detection and estimation of mixed paddy rice
cropping patterns with MODIS data. Int. J. Appl. Earth Obs. Geoinf. 2011, 13, 13–23.
14. Huete, A.R.; Didan, K.; Miura, T.; Rodriguez, E.P.; Gao, X.; Ferreira, L.G. Overview of the
radiometric and biophysical performance of the MODIS vegetation indices. Remote Sens.
Environ. 2002, 83, 195–213.
15. Thenkabail, P.S.; Smith, R.B.; De-Pauw, E. Evaluation of narrowband and broadband vegetation
indices for determining optimal hyperspectral wavebands for agricultural crop characterization.
Photogramm. Eng. Rem. Sens. 2002, 68, 607–621.
16. Thenkabail, P.S.; Smith, R.B.; De-Pauw, E. Hyperspectral vegetation indices for determining
agricultural crop characteristics. Remote Sens. Environ. 2000, 71, 158–182.
17. Thenkabail, P.S.; Mariotto, I.; Gumma, M.K.; Middleton, E.M.; Landis, D.R.; Huemmrich, K.F.
Selection of hyperspectralnarrowbands (HNBs) and composition of hyperspectraltwoband
vegetation indices (HVIs) for biophysical characterization and discrimination of crop types using
field reflectance and Hyperion/EO-1 data. IEEE J. Sel. Top. Appl. Earth Obs. Remote Sens. 2013,
6, 427–439.
18. Rouse, W.; Haas, R.H.; Schell, J.A.; Deering, D.W. Monitoring Vegetation Systems in the Great
Plains with ERTS; NASA SP-351; NASA: Washington, DC, USA, 1974.
19. Jiang, Z.Y.; Huete, A.R.; Didan, K.; Miura, T. Development of a two-band enhanced vegetation
index without a blue band. Remote Sens. Environ. 2008, 112, 3833–3845.
20. Gitelson, A.A.; Kaufman, Y.J.; Merzlyak, M.N. Use of a green channel in remote sensing of
global vegetation from EOS-MODIS. Remote Sens. Environ. 1996, 58, 289–298.
21. Hunt, E.R., Jr.; Williams, A.E.P. Detection of flowering leafy spurge with satellite multispectral
imagery. Rangel. Ecol. Manage. 2006, 59, 494–499.

Remote Sens. 2013, 5 5345
22. Stone, C.; Chisholm, L.; Coops, N. Spectral reflectance characteristics of eucalypt
foliagedamaged by insects. Aust. J. Bot. 2001, 49, 687–698
23. Carter, G.A.; Knapp, A.K. Leaf optical properties in higher plants: Linking spectral characteristics
to stress and chlorophyllconcentration. Am. J. Bot. 2001, 88, 677–684.
24. Skopec, M.M.; Dearing, M.D. Differential expression and activity of catechol-O-methyl
transferase (COMT) in a generalist (Neotomaalbigula) and juniper specialist (Neotomastephensi)
woodrat. Comp. Biochem. Physiol. C 2011, 154, 383–390.
25. Landon, D.B.; Peter, V.W.; Harrington, W.; Estelle, L. Predicting and quantifying pollen
production in Juniperus Ashei forests. Phytologia 2012, 94, 417–438.
26. Huang, C.Y.; Asner, G.P.; Martin, R.E.; Barger, N.N.; Neff, J.C. Multiscale analysis of tree cover
and aboveground carbon stocks in pinyon-juniper woodlands. Ecol. Appl. 2009, 19, 668–681.
27. William, H.R.; Craig, D.A.; John, D.B.; William, L.B.; Brandon, T.B.; Peter, M.B.; Karen, S.E.;
Lisa, M.F.; David, W.H.; Brian, F.J.; et al. Historical and modern disturbance regimes, stand
structures, and landscape dynamics in piñon-juniper vegetation of the Western United States.
Rangel. Ecol. Manage. 2009, 62, 203–222.
© 2013 by the authors; licensee MDPI, Basel, Switzerland. This article is an open access article
distributed under the terms and conditions of the Creative Commons Attribution license
(http://creativecommons.org/licenses/by/3.0/).
Copyright © 2022 FDOKUMEN