Respiration Effect on Wavelet-Based ECG T-Wave End Delineation Strategies
11
1818 IEEE TRANSACTIONS ON BIOMEDICAL ENGINEERING, VOL. 59, NO. 7, JULY 2012 Respiration Effect on Wavelet-Based ECG T-Wave End Delineation Strategies Maikel Noriega, Juan Pablo Mart´ ınez, Pablo Laguna, Senior Member, IEEE, Raquel Bail ´ on, and Rute Almeida* Abstract—The main purpose of this paper is to study the influ- ence of the mechanical effect of respiration over the T-wave end delineation. We compared the performance of an automatic delin- eation system based on the wavelet transform (WT), considering single lead (SL), global delineation locations obtained from SL an- notations (SLR), and multilead (ML) approaches. The linear rela- tion between the variations on T-wave end locations obtained with each of the methods and the mechanical effect of respiration was quantified using spectral coherence and ARARX modeling both in simulated signals and in real data. We also explored the evolution of the vectorcardiographic spatial loop using the projection on the main direction of the WT in the region close to the T-wave end (T e ) and its relation with respiration. The dispersion of the additional T-wave end location error due to respiration was reduced by 15% using SLR with respect to SL, while ML allows for a reduction of around 40%. The percentage of that error correlated with respira- tion was in average 99% using SL while 82% and 72% using SLR and ML, respectively. Thus, results suggest that ML is the most adequate strategy for T-wave delineation, allowing the reduction of the instability of T-wave end location caused by respiration. Index Terms—Electrocardiogram delineation, respiration, T-wave. I. INTRODUCTION T HE electrocardiogram (ECG) is a noninvasive and pain- less procedure and an essential diagnostic tool for many Manuscript received November 16, 2011; revised April 9, 2011; accepted May 2, 2011. Date of publication May 27, 2011; date of current version June 20, 2012. This work was supported in part by the MCyT and FEDER un- der Project TEC2010-21703-C03-02, by Grupo Consolidado Communications Technology Group (GTC) from DGA T:30 and in part by the grants from the Banco Santander Central Hispano and University of Zaragoza. Centro de Inves- tigaci´ on Biom´ edica en Red en Bioingenier´ ıa, Biomateriales y Nanomedicina is an initiative supported in part by the VI National R&D&i Plan 2008–2011, Iniciativa Ingenio 2010, Consolider Program, CIBER Actions and in part by the Instituto de Salud Carlos III with assistance from the European Regional Development Fund. Centro de Matem´ atica da Universidade do Porto (CMUP) is supported by Fundac ¸˜ ao para a Ciˆ encia e a Tecnologia (FCT), Portugal, through POCI2010/POCTI/POSI programmes, with national and European Community Structural Funds. Asterisk indicates corresponding author. M. Noriega is with the Communications and Electronical Department of Ori- ente University, Santiago de Cuba 90400, Cuba, and also with Communications Technology Group, Arag´ on Institute of Engineering Research, IIS Arag ´ on, Uni- versity of Zaragoza, Zarogaza 50001-50018, Spain and Centro de Investigaci´ on Biom´ edica en Red en Bioingenier´ ıa, Biomateriales y Nanomedicina, Zaragoza 50001-50018, Spain (e-mail: [email protected]). J. P. Mart´ ınez, P. Laguna, and R. Bail´ on are with the Communications Technology Group, I3A, IIS Arag´ on, UZ, and also with Centro de Investi- gaci´ on Biom´ edica en Red en Bioingenier´ ıa, Biomateriales y Nanomedicina, Zaragoza 50001-50018, Spain (e-mail: [email protected]; [email protected]; [email protected]). *R. Almeida is with the Centro de Investigaci´ on Biom´ edica en Red en Bioingenier´ ıa, Biomateriales y Nanomedicina, Zaragoza 50001-50018, Spain, with the Communications Technology Group, I3A, IIS Arag´ on, UZ, Zaragoza 50001-50018, Spain and also with the CMUP, 4169-007 Porto, Portugal (e-mail: [email protected], [email protected]). Digital Object Identifier 10.1109/TBME.2011.2157824 Fig. 1. Principal waves of a beat and RR and QT intervals. The R peak mark locates the beat and the marks of the onset of the QRS (Q o ) and of the T-wave end (T e ) correspond, respectively, to the onset and end of the ventricular activity (depolarization and repolarization process). cardiac and noncardiac conditions. Each heart beat is produced by an electric wavefront that crosses the different cardiac struc- tures; the activation/inactivation of those is reflected in different ECG waves (P, Q, R, S, T) which can be used to infer both wave durations and beat-to-beat variations (see Fig. 1). The time intervals defined by the waves’ onsets, peaks, and ends are clinically relevant [1], [2], as it is the case of the RR interval (measured between consecutive R-waves) used as standard for cycle duration and to calculate heart rate (HR). In particular, the T-wave end (T e ) timing corresponds to the end of the ventricular activity and its correct location is re- quired by many strategies used for ventricular repolarization (VR) analysis. Both the QT, measured from the onset of the QRS complex (Q o ) to the T e , and the RT, measured from the R peak to the T e , intervals have been used as indeces of the VR time [3], [4]. Abnormal QT values, as well as prolongation of the time interval from the T-wave peak to the T e , have been as- sociated with ventricular pro-arrhythmicity and sudden cardiac death [2]. Moreover the study of possible effects over the QT is mandatory to guaranty the cardiac safety of any drug, prior to its commercialization [5]–[7]. The dispersion of the VR, measured as beat-to-beat variations and by the normalized QT variability index (QTVI = log ratio between the QT and HR variabili- ties, each normalized by its square mean) have been repeatedly reported as risk stratifiers and associated with life-threatening arrhythmia and sudden death [8]–[10]. Therefore, the correct location of the T e provides a fundamental feature to derive clin- ically useful information. The stability of the automatic mark, avoiding spurious beat-to-beat variability resulting from non cardiac sources, is of extreme importance. Locating accurately the T e can be particularly difficult in the case of smooth T-waves with low SNR. Nevertheless, there is a lack of gold standard for T e location and developing a consensus definition remains a challenge [6], [7]. By using several electrodes it is possible to access simultane- ous electrocardiographic leads, providing a spatial perspective 0018-9294/$31.00 © 2012 IEEE
-
Upload
independent -
Category
Documents
-
view
1 -
download
0
Transcript of Respiration Effect on Wavelet-Based ECG T-Wave End Delineation Strategies
1818 IEEE TRANSACTIONS ON BIOMEDICAL ENGINEERING, VOL. 59, NO. 7, JULY 2012
Respiration Effect on Wavelet-Based ECG T-WaveEnd Delineation Strategies
Maikel Noriega, Juan Pablo Martınez, Pablo Laguna, Senior Member, IEEE, Raquel Bailon, and Rute Almeida*
Abstract—The main purpose of this paper is to study the influ-ence of the mechanical effect of respiration over the T-wave enddelineation. We compared the performance of an automatic delin-eation system based on the wavelet transform (WT), consideringsingle lead (SL), global delineation locations obtained from SL an-notations (SLR), and multilead (ML) approaches. The linear rela-tion between the variations on T-wave end locations obtained witheach of the methods and the mechanical effect of respiration wasquantified using spectral coherence and ARARX modeling both insimulated signals and in real data. We also explored the evolutionof the vectorcardiographic spatial loop using the projection on themain direction of the WT in the region close to the T-wave end (Te)and its relation with respiration. The dispersion of the additionalT-wave end location error due to respiration was reduced by 15%using SLR with respect to SL, while ML allows for a reduction ofaround 40%. The percentage of that error correlated with respira-tion was in average 99% using SL while 82% and 72% using SLRand ML, respectively. Thus, results suggest that ML is the mostadequate strategy for T-wave delineation, allowing the reductionof the instability of T-wave end location caused by respiration.
Index Terms—Electrocardiogram delineation, respiration,T-wave.
I. INTRODUCTION
THE electrocardiogram (ECG) is a noninvasive and pain-less procedure and an essential diagnostic tool for many
Manuscript received November 16, 2011; revised April 9, 2011; acceptedMay 2, 2011. Date of publication May 27, 2011; date of current version June20, 2012. This work was supported in part by the MCyT and FEDER un-der Project TEC2010-21703-C03-02, by Grupo Consolidado CommunicationsTechnology Group (GTC) from DGA T:30 and in part by the grants from theBanco Santander Central Hispano and University of Zaragoza. Centro de Inves-tigacion Biomedica en Red en Bioingenierıa, Biomateriales y Nanomedicinais an initiative supported in part by the VI National R&D&i Plan 2008–2011,Iniciativa Ingenio 2010, Consolider Program, CIBER Actions and in part bythe Instituto de Salud Carlos III with assistance from the European RegionalDevelopment Fund. Centro de Matematica da Universidade do Porto (CMUP) issupported by Fundacao para a Ciencia e a Tecnologia (FCT), Portugal, throughPOCI2010/POCTI/POSI programmes, with national and European CommunityStructural Funds. Asterisk indicates corresponding author.
M. Noriega is with the Communications and Electronical Department of Ori-ente University, Santiago de Cuba 90400, Cuba, and also with CommunicationsTechnology Group, Aragon Institute of Engineering Research, IIS Aragon, Uni-versity of Zaragoza, Zarogaza 50001-50018, Spain and Centro de InvestigacionBiomedica en Red en Bioingenierıa, Biomateriales y Nanomedicina, Zaragoza50001-50018, Spain (e-mail: [email protected]).
J. P. Martınez, P. Laguna, and R. Bailon are with the CommunicationsTechnology Group, I3A, IIS Aragon, UZ, and also with Centro de Investi-gacion Biomedica en Red en Bioingenierıa, Biomateriales y Nanomedicina,Zaragoza 50001-50018, Spain (e-mail: [email protected]; [email protected];[email protected]).
*R. Almeida is with the Centro de Investigacion Biomedica en Red enBioingenierıa, Biomateriales y Nanomedicina, Zaragoza 50001-50018, Spain,with the Communications Technology Group, I3A, IIS Aragon, UZ, Zaragoza50001-50018, Spain and also with the CMUP, 4169-007 Porto, Portugal (e-mail:[email protected], [email protected]).
Digital Object Identifier 10.1109/TBME.2011.2157824
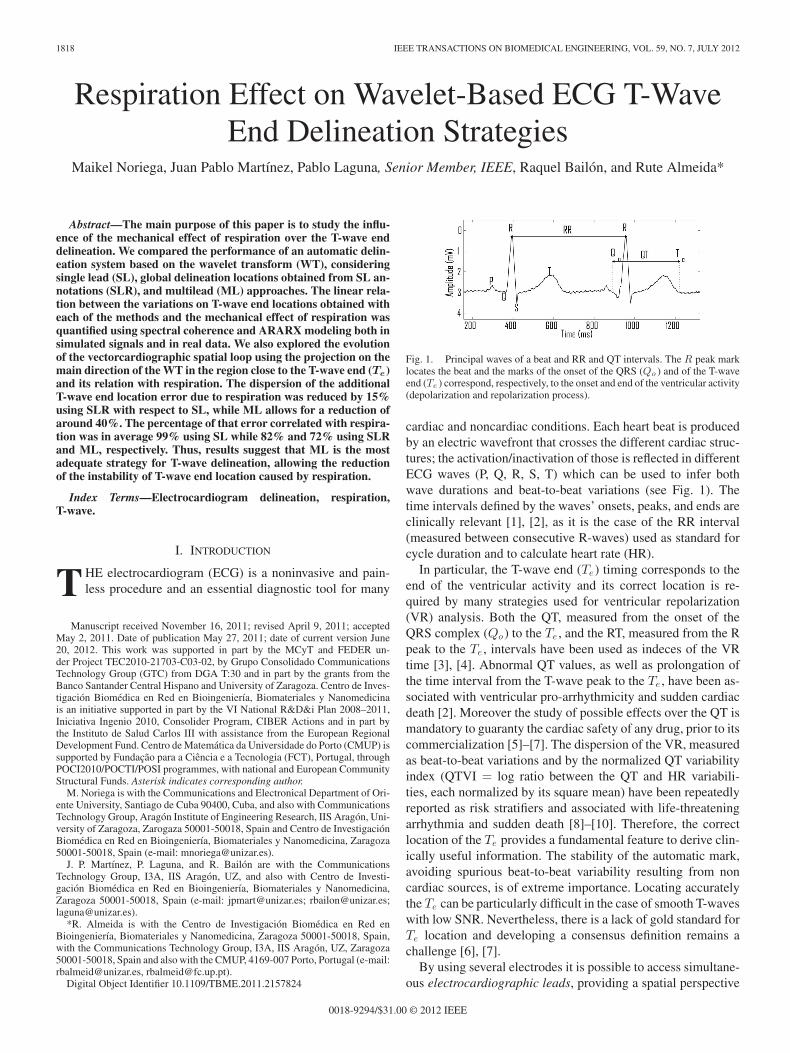
Fig. 1. Principal waves of a beat and RR and QT intervals. The R peak marklocates the beat and the marks of the onset of the QRS (Qo ) and of the T-waveend (Te ) correspond, respectively, to the onset and end of the ventricular activity(depolarization and repolarization process).
cardiac and noncardiac conditions. Each heart beat is producedby an electric wavefront that crosses the different cardiac struc-tures; the activation/inactivation of those is reflected in differentECG waves (P, Q, R, S, T) which can be used to infer bothwave durations and beat-to-beat variations (see Fig. 1). Thetime intervals defined by the waves’ onsets, peaks, and ends areclinically relevant [1], [2], as it is the case of the RR interval(measured between consecutive R-waves) used as standard forcycle duration and to calculate heart rate (HR).
In particular, the T-wave end (Te ) timing corresponds to theend of the ventricular activity and its correct location is re-quired by many strategies used for ventricular repolarization(VR) analysis. Both the QT, measured from the onset of theQRS complex (Qo ) to the Te , and the RT, measured from the Rpeak to the Te , intervals have been used as indeces of the VRtime [3], [4]. Abnormal QT values, as well as prolongation ofthe time interval from the T-wave peak to the Te , have been as-sociated with ventricular pro-arrhythmicity and sudden cardiacdeath [2]. Moreover the study of possible effects over the QT ismandatory to guaranty the cardiac safety of any drug, prior to itscommercialization [5]–[7]. The dispersion of the VR, measuredas beat-to-beat variations and by the normalized QT variabilityindex (QTVI = log ratio between the QT and HR variabili-ties, each normalized by its square mean) have been repeatedlyreported as risk stratifiers and associated with life-threateningarrhythmia and sudden death [8]–[10]. Therefore, the correctlocation of the Te provides a fundamental feature to derive clin-ically useful information. The stability of the automatic mark,avoiding spurious beat-to-beat variability resulting from noncardiac sources, is of extreme importance. Locating accuratelythe Te can be particularly difficult in the case of smooth T-waveswith low SNR. Nevertheless, there is a lack of gold standard forTe location and developing a consensus definition remains achallenge [6], [7].
By using several electrodes it is possible to access simultane-ous electrocardiographic leads, providing a spatial perspective
0018-9294/$31.00 © 2012 IEEE

NORIEGA et al.: RESPIRATION EFFECT ON WAVELET-BASED ECG T-WAVE END DELINEATION STRATEGIES 1819
Fig. 2. Example of morphology changes of the ECG signal caused by respi-ration. On the right there is a zoom of the area inside the rectangle.
of the heart’s electrical activity [1], [11]. The cardiac dipolemodel approximates the electrical activity from the heart bya time-variant electrical dipole called electric heart vector(EHV) [11]. According to this model, each lead can be in-terpreted as the projection of the EHV over the vector thatdefines the lead direction. The EHV’s canonical representationis given by the vectorcardiogram (VCG) defined by 3 orthog-onal leads [x(n), y(n), z(n)], usually acquired as the correctedFrank leads. The exact timing in which the VR is over cannot besystematically determined by a particular ECG lead. The cor-respondent projection of the T-wave loop in the VCG dependson the loop orientation with respect to the given lead, as influ-enced by the cardiac electrical axis, which can vary due to chestmovements (respiration) and other physiological processes [12].
Respiration influences the ECG in various ways. During therespiratory cycle, chest movements, and changes in the thoraximpedance distribution due to filling and emptying of the lungscause a rotation of the electrical axis of the heart which has aneffect over beat morphology [13], [14] (see Fig. 2). This effectis referred to as the mechanical effect of respiration on theECG. Nevertheless, respiration modulates HR, and therefor RTand QT intervals, such that it increases during inspiration anddecreases during expiration. This is denoted to as the autonomiceffect, as it is mainly due to the control of the autonomic nervoussystem (ANS) [15], in spite of evidence that it may also have amechanical origin.
The effect of respiration on ECG morphology, as result of thechanges on the VCG loop orientation with respect to the pro-jection axis, is likely to cause errors or instabilities in automaticdelineation. In [16] Sornmo proposed a method to align the VCGloops before performing morphologic beat-to-beat variability inorder to cope with the spurious effects. In [17], we found thata multilead (ML) delineation strategy that estimates the VCGloop main direction and uses the projection over it to locate theTe , allows us to increase the stability of the QT interval mea-surement, with respect to using single-lead (SL) delineation orpostprocessing rules after SL delineation (SLR) in real multi-lead ECG signals. We hypothesize that this is a consequence ofa lower influence of the mechanical effect of respiration overML-based automatic locations by the adjustment of the projec-tion axis, compensating the changes over the loop orientation.To validate this hypothesis, in this paper we performed a simu-
lation study in which the respiratory effect over the delineationof Te is assessed. We also investigate in real signals whether themechanical influence of respiratory activity on the ECG is re-flected on the several delineation strategies and how it influencesover the stability of the obtained marks. Our main goal is toprovide evidences that, among T-wave end delineation strate-gies, the ML achieves the maximum reduction of the mechani-cally driven spurious variability of the delineation error by com-pensating the respiratory mechanical effect over the ECG, andto extract useful information on this process to further improvethe delineation in the future. In doing so we will establish thatthis should be the preferred strategy for QT variability analysis,and the basis for further improvements in delineators.
II. MATERIALS AND METHODS
There are several published methodologies for automaticECG delineation. Particularly in this paper we discuss the mul-tiscale wavelet transform (WT)-based delineator previously de-scribed and validated in [18] and [19]. Notation can be found inAppendix.
A. Automatic Delineation
1) SL and SLR for Multilead Signals: For each lead, a setof differentiated signals, smoothed at different scales, is ob-tained by means of the discrete WT, using a quadratic splineas prototype wavelet [18]. First, detection and classification ofwaveforms are performed by searching for the maxima andminima at different scales. Then, the ECG boundaries [20] arelocated using a threshold approach across scales. This allows usto obtain a set of annotations for each available lead [18]. ThisSL approach has the limitation that the electrical cardiac activityis a global phenomena and therefore it is desirable to consideran approach in which all ECG leads are taken into account toproduce global marks.
One strategy for dealing with multilead signals is the inclusionof postprocessing rules (SLR) after the SL-based delineation.This consists in obtaining a global mark constructed or chosenfrom the marks given by each lead. A simple rule is to choosethe median (more robust with respect to outliers compared witharithmetic mean) of the SL marks as the peak of the wave. Themark for a wave’s onset (end) should be the earliest (latest) one,with some outliers protection [21]. These rules perform properlyas long as they have a large set of leads available (for instanceon a record acquired according to the standard 12-lead system)but are hardly adequate for a record with just 2 or 3 leads (e.g.,Frank leads on a VCG record).
2) ML Delineation: Although the SLR strategy finally givesone single mark per boundary or peak, it does not use allavailable spatial information. The ML delineation departs fromthe SL but considers simultaneously the orthogonal leads ofthe VCG [19]. Denoting by ws,m (n) the WT of a signals(n) ∈ {x(n), y(n), z(n)} in the scale m, for a VCG loop givenby [x(n), y(n), z(n)]T , the correspondent spatial WT loop is de-fined as
wm (n) = [wx,m (n) , wy,m (n), wz,m (n)]T . (1)
1820 IEEE TRANSACTIONS ON BIOMEDICAL ENGINEERING, VOL. 59, NO. 7, JULY 2012
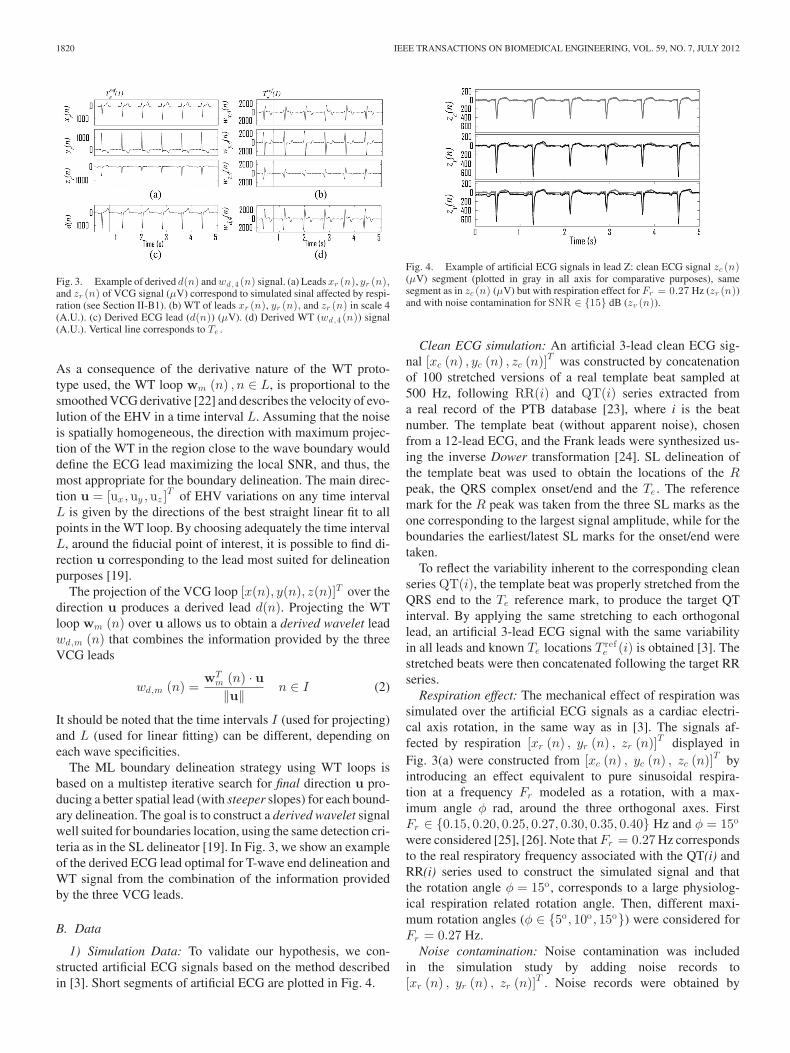
Fig. 3. Example of derived d(n) and wd,4 (n) signal. (a) Leads xr (n), yr (n),and zr (n) of VCG signal (μV) correspond to simulated sinal affected by respi-ration (see Section II-B1). (b) WT of leads xr (n), yr (n), and zr (n) in scale 4(A.U.). (c) Derived ECG lead (d(n)) (μV). (d) Derived WT (wd,4 (n)) signal(A.U.). Vertical line corresponds to Te .
As a consequence of the derivative nature of the WT proto-type used, the WT loop wm (n) , n ∈ L, is proportional to thesmoothed VCG derivative [22] and describes the velocity of evo-lution of the EHV in a time interval L. Assuming that the noiseis spatially homogeneous, the direction with maximum projec-tion of the WT in the region close to the wave boundary woulddefine the ECG lead maximizing the local SNR, and thus, themost appropriate for the boundary delineation. The main direc-tion u = [ux ,uy ,uz ]
T of EHV variations on any time intervalL is given by the directions of the best straight linear fit to allpoints in the WT loop. By choosing adequately the time intervalL, around the fiducial point of interest, it is possible to find di-rection u corresponding to the lead most suited for delineationpurposes [19].
The projection of the VCG loop [x(n), y(n), z(n)]T over thedirection u produces a derived lead d(n). Projecting the WTloop wm (n) over u allows us to obtain a derived wavelet leadwd,m (n) that combines the information provided by the threeVCG leads
wd,m (n) =wT
m (n) · u‖u‖ n ∈ I (2)
It should be noted that the time intervals I (used for projecting)and L (used for linear fitting) can be different, depending oneach wave specificities.
The ML boundary delineation strategy using WT loops isbased on a multistep iterative search for final direction u pro-ducing a better spatial lead (with steeper slopes) for each bound-ary delineation. The goal is to construct a derived wavelet signalwell suited for boundaries location, using the same detection cri-teria as in the SL delineator [19]. In Fig. 3, we show an exampleof the derived ECG lead optimal for T-wave end delineation andWT signal from the combination of the information providedby the three VCG leads.
B. Data
1) Simulation Data: To validate our hypothesis, we con-structed artificial ECG signals based on the method describedin [3]. Short segments of artificial ECG are plotted in Fig. 4.
Fig. 4. Example of artificial ECG signals in lead Z: clean ECG signal zc (n)(μV) segment (plotted in gray in all axis for comparative purposes), samesegment as in zc (n) (μV) but with respiration effect for Fr = 0.27 Hz (zr (n))and with noise contamination for SNR ∈ {15} dB (zv (n)).
Clean ECG simulation: An artificial 3-lead clean ECG sig-nal [xc (n) , yc (n) , zc (n)]T was constructed by concatenationof 100 stretched versions of a real template beat sampled at500 Hz, following RR(i) and QT(i) series extracted froma real record of the PTB database [23], where i is the beatnumber. The template beat (without apparent noise), chosenfrom a 12-lead ECG, and the Frank leads were synthesized us-ing the inverse Dower transformation [24]. SL delineation ofthe template beat was used to obtain the locations of the Rpeak, the QRS complex onset/end and the Te . The referencemark for the R peak was taken from the three SL marks as theone corresponding to the largest signal amplitude, while for theboundaries the earliest/latest SL marks for the onset/end weretaken.
To reflect the variability inherent to the corresponding cleanseries QT(i), the template beat was properly stretched from theQRS end to the Te reference mark, to produce the target QTinterval. By applying the same stretching to each orthogonallead, an artificial 3-lead ECG signal with the same variabilityin all leads and known Te locations T ref
e (i) is obtained [3]. Thestretched beats were then concatenated following the target RRseries.
Respiration effect: The mechanical effect of respiration wassimulated over the artificial ECG signals as a cardiac electri-cal axis rotation, in the same way as in [3]. The signals af-fected by respiration [xr (n) , yr (n) , zr (n)]T displayed inFig. 3(a) were constructed from [xc (n) , yc (n) , zc (n)]T byintroducing an effect equivalent to pure sinusoidal respira-tion at a frequency Fr modeled as a rotation, with a max-imum angle φ rad, around the three orthogonal axes. FirstFr ∈ {0.15, 0.20, 0.25, 0.27, 0.30, 0.35, 0.40} Hz and φ = 15o
were considered [25], [26]. Note that Fr = 0.27 Hz correspondsto the real respiratory frequency associated with the QT(i) andRR(i) series used to construct the simulated signal and thatthe rotation angle φ = 15o , corresponds to a large physiolog-ical respiration related rotation angle. Then, different maxi-mum rotation angles (φ ∈ {5o , 10o , 15o}) were considered forFr = 0.27 Hz.
Noise contamination: Noise contamination was includedin the simulation study by adding noise records to[xr (n) , yr (n) , zr (n)]T . Noise records were obtained by
NORIEGA et al.: RESPIRATION EFFECT ON WAVELET-BASED ECG T-WAVE END DELINEATION STRATEGIES 1821
subtracting an exponentially updated average beat from a realstress testing ECG and rejecting afterward the residual QRSpeaks [27]. Then the inverse Dower transformation is ap-plied to obtain the 3-lead noise signal [vx(n), vy (n), vz (n)]T .The three noise leads were rescaled by a constant a to get aSNR ∈ {30, 25, 20, 15, 10} dB:
a =(
Pxr+ Pyr
+ Pzr
Pvx+ Pvy
+ Pvz
· 10−S N R
1 0
) 12
(3)
were Ps denotes the power of signal s(n). The noise wasadded to the ECG signal with respiratory effect correspond-ing to Fr = 0.27 Hz and φ = 15o , obtaining the noisy signal[xv (n), yv (n), zv (n)]T .
2) Real Data: To extend the study to real signals we an-alyzed two databases: the PTB database and a database ofECG signals from healthy subjects recorded at University ofZaragoza, Zaragoza, Spain, which we call control database(CDB).
PTB database [23]: We use the 60 control recordings includedin these databases, each one containing the 12-standard and 3-Frank lead ECG, sampled at 1000 Hz.
CDB database: This database contains the standard 12-leadECG and a respiration signal (r(n)) of 40 subjects (age 32 ±9 years, 26 male/14 female), recorded during 5 min of supineresting and all were here considered. The MP 150 (BIOPAC Sys-tems) was used to acquire simultaneously the ECG (ECG100Camplifier and disposable Ag–AgCl electrodes) at a samplingfrequency of 1000 Hz, and the respiration signal (RSP100C anda strain gauge transducer) at a sampling frequency of 125 Hz.
The ECG signals were delineated using the SLR and MLdelineation strategies. The ML strategy in PTB database wasapplied over Frank leads while in CDB over the three leads ob-tained with inverse Dower’s transformation. SLR delineationwas applied over the 12 standard leads in both databases;RTM
e (i) interval was measured from the R peak obtained withSLR to Te(i) for each delineation system M ∈ {SLR,ML}. Themechanical effect of respiration was estimated from the ECGsignal in the two databases using the algorithm proposed in [26].In this method, the ECG-derived respiratory (EDR) signal is es-timated from the VCG as the series of rotation angles aroundeach orthogonal lead (ϕx(i), ϕy (i) and ϕz (i)), estimated be-tween successive QRS–VCG loops and a reference QRS–VCGloop by least-squares minimization.
C. Performance Indexes
1) Simulation Data: The clean (c), respiration affected (r),and noise contaminated (v) simulated ECG signals, were delin-eated with SL (over lead X), SLR, and ML to obtain the marksTM ,s
e (i), M ∈ {SL,SLR,ML} and s ∈ {c, r, v}. For SLR de-lineation the Dower’s transformation was applied to obtain the12 standard leads [24].
The delineation error was calculated as the difference betweenthe marks found over the ECG and the reference marks used inthe simulation:
esM(i) = TM ,s
e (i) − T refe (i). (4)
Fig. 5. Model of ξ(i) and r(i) interactions.
Expression (4) can be rewrite as
esM(i) = (TM ,s
e (i) − TM ,ce (i)) + (TM ,c
e (i) − T refe (i))
= EsM(i) + ec
M(i) (5)
where ecM(i) is the delineation error in the clean signal, and
EsM(i) is the additional error due to respiration or noise. In
this paper, we will focus on the study of the relation of thisadditional error Es
M(i) with the mechanical effect of respiration.The linear relation between the respiratory signal (r(n)) andseries of er
M(i), evM(i), Er
M(i) or EvM(i) was measured using both
a nonparametric (spectral coherence) and a parametric method(ARARX modeling).
The spectral coherence was calculated after resampling at5 Hz the respective series obtaining Es
M(n), s ∈ {r, v} and ther(n). To evaluate the relation between r(n) and the final direc-tion u, for both cases in which respiratory mechanical effectwas introduced, the angles of u with respect to the plane de-fined by each pair of orthogonal leads were obtained, � r
ρ(i) and� v
ρ(i); ρ ∈ {(x, y), (y, z), (x, z)}, corresponding respectively tothe angles with respect to the frontal, sagittal, and transversalplanes of the human body. Additionally, the spectral coherencesbetween r(n) and the resampled angles, � r
ρ(n) and � vρ(n), were
also obtained. The average value of the spectral coherence wascomputed in a band centered on Fr and with a bandwidth of0.04 Hz and denoted as Cr,Es
Mfor the differences Es
M(n) andCr, � s
ρfor the angles.
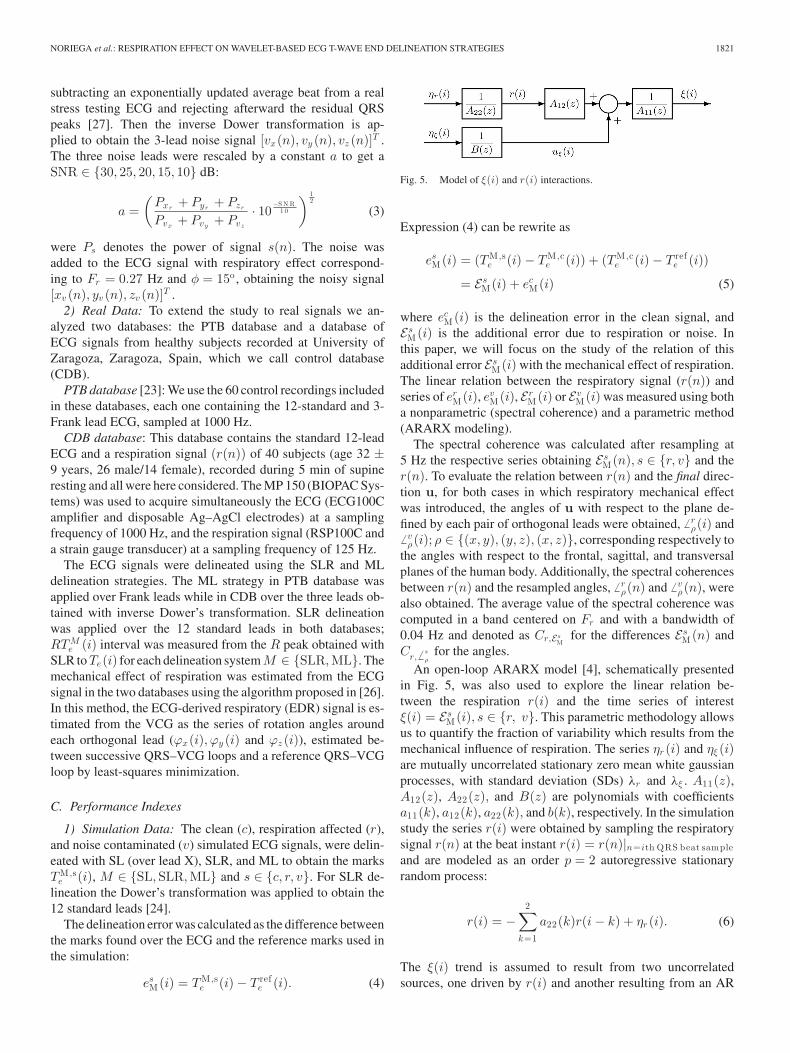
An open-loop ARARX model [4], schematically presentedin Fig. 5, was also used to explore the linear relation be-tween the respiration r(i) and the time series of interestξ(i) = Es
M(i), s ∈ {r, v}. This parametric methodology allowsus to quantify the fraction of variability which results from themechanical influence of respiration. The series ηr (i) and ηξ (i)are mutually uncorrelated stationary zero mean white gaussianprocesses, with standard deviation (SDs) λr and λξ . A11(z),A12(z), A22(z), and B(z) are polynomials with coefficientsa11(k), a12(k), a22(k), and b(k), respectively. In the simulationstudy the series r(i) were obtained by sampling the respiratorysignal r(n) at the beat instant r(i) = r(n)|n=ith QRS beat sampleand are modeled as an order p = 2 autoregressive stationaryrandom process:
r(i) = −2∑
k=1
a22(k)r(i − k) + ηr (i). (6)
The ξ(i) trend is assumed to result from two uncorrelatedsources, one driven by r(i) and another resulting from an AR

1822 IEEE TRANSACTIONS ON BIOMEDICAL ENGINEERING, VOL. 59, NO. 7, JULY 2012
process with a white noise input ηξ (i). That is
ξ(i) =q∑
k=0
a12(k)r(i − k) + uξ (i) −q∑
k=1
a11(k)ξ(i − k)
uξ (i) = −q∑
k=1
b(k)uξ (i − k) + ηξ (i) (7)
where values q = 2, 3, 4, 5, 6. For simplicity, the same order qwas assumed for all ARARX model polynomials.
ARARX model parameters were iteratively obtained us-ing the generalized least-squares (GLS) method [28]. The or-der q is taken as the one minimizing the multivariate AIClog (det (Σ)) + 2 ∗ (p + 3q + 1)/N , where det (Σ) stands forthe determinant of the covariance matrix of the residuals [ηr (i)and ηξ (i)] and N is the number of intervals (beats) in the seg-ment. Note that as p = 2 is fixed and the ηr (i) variance havebeen already determined in the previous step, only the q orderremains to be chosen and this is not a multivariate minimizationin strict sense.
The assumption of uncorrelated sources allows us to computethe power spectral density (PSD) functions of each ξ(i) as thesum of two partial spectra: Sξ (F ) = Sξ |r (F ) + Sξ |ξ (F ):
Sξ |r (F ) = TRλ2r
∣∣∣∣ A12(z)A11(z)A22(z)
∣∣∣∣2
z=ej 2 π F T R
Sξ |ξ (F ) = TRλ2ξ
∣∣∣∣ 1A11(z)B(z)
∣∣∣∣2
z=ej 2 π F T R
(8)
where TR stands for the mean of the RR(i) in the analyzedsegment.
The power for each PSD in the frequency band of interestHF (0.15–0.4 Hz), corresponding to the respiration frequencyband (Pξ |r , Pξ |ξ ) is calculated by decomposing these spectraand summing the contributions of the poles in the band:
Rξ |r =Pξ |r
Pξ |r + Pξ |ξ× 100 (9)
represents the relative fraction of ξ(i) variability driven by r(i).2) Real Data: The delineation error in real ECG signals
cannot be calculated, as there is no reference Te mark. Instead,the differences between the automatic Te locations obtainedusing the two strategies were calculated:
ΔTe(i) = T SLRe (i) − TML
e (i) (10)
For the ML strategy we also obtained the angles of the finaldirection u with respect to the frontal, sagittal and transversalplanes of the human body, defined by each pair of orthogonalleads ( � ρ ; ρ ∈ {(y, z), (x, z), (x, y)}, respectively). The linearrelation between ϕl(i), l ∈ {x, y, z} and ΔTe(i), RTM
e (i) or� ρ(i) was measured using both the nonparametric and para-metric approaches as described for the simulated data cases.Thus, the spectral coherences Cr,d ; d ∈ {ΔTe,RTM
e , � ρ} wereobtained by computing the mean value in a band centered on therespiratory frequency, estimated from ϕl(i), with a bandwidthof 0.04 Hz. Also, the ARARX model was applied to obtain therelative fraction of ξ(i) = ΔTe(i), RTM
e (i), � ρ(i) variabilities
TABLE IMEAN ± SD OF Er
M (i) AND ecM FOR DIFFERENT Fr AND φ
linearly explained by the respiration r(i), according to (8). r(i)is taken either as ϕl(i) or as the resampled respiratory signalr(n), when it is available as in the CDB.
III. RESULTS
A. Simulation Study
The mean ± SD of ErM(i) for different values of Fr and φ are
presented in Table I. Last row shows mean ± SD for the delin-eation errors ec
M(i) over the clean simulated data. In Fig. 6(a) and(b) are presented the distributions of the errors ec
M(i) and esM(i),
and of the differences ErM(i), considering simulated respiration
with different values of Fr and φ. In general, ML delineationoutperforms SL and SLR (lower error bias and dispersion). Asexpected, both bias and variability of the errors increased withthe inclusion of respiration, but ML delineation is less affectedthan SL or SLR. The performance decreases most for the highermaximum rotation angle φ = 15o , with similar results for theseveral Fr values considered. The additional error due to respi-ration Er
M(i) for the maximum φ represents roughly the fifth partof the total error using SL and more than half of the total errorusing ML. Moreover, the dispersion of the Er
M(i) is comparableor higher than the error dispersion itself. Note also that usingML the dispersion of Er
M(i) becomes lower than using SL orSLR, for all combinations. In particular for φ = 5o the Er
ML(i)are almost equal to 0.
Fig. 7 shows the delineation errors esM(i) and the corre-
spondent simulated r(i) and ErM(i) found using each delin-
eation strategy over the clean simulated signal and consideringFr = 0.27Hz and φ = 15o . The increased variability of ec
SLR(i)compared with ec
SL(i) is caused by the protection rules of SLRwhich changes the lead chosen by the rules. The resemblancebetween r(i) and er
SL(i) and ErSL(i) is remarkable, with a clear
periodic component corresponding to Fr . This component canalso be seen in Er
SLR(i), but is less evident. Similar results wereobtained for other values of Fr and φ. In Fig. 8(b) the resultsof both nonparametric (Cr,Er
M) and parametric (Rr
ξ |r ) method-ologies to measure the linear relation between r(n) and Er
M(i)are presented. Note that both the average coherence values andthe relative fraction of the HF variability of Es
M(i) explained byr(i) obtained with SL are higher than those obtained with MLand SLR for all Fr considered. This indicates that the additional
NORIEGA et al.: RESPIRATION EFFECT ON WAVELET-BASED ECG T-WAVE END DELINEATION STRATEGIES 1823
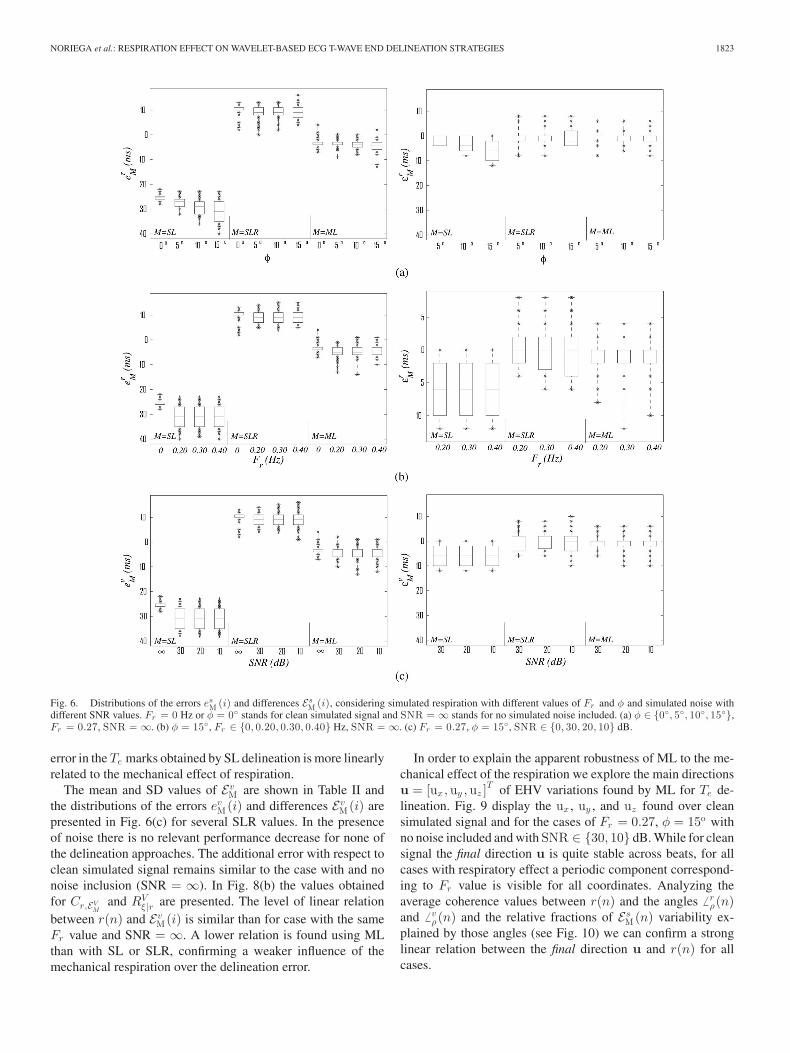
Fig. 6. Distributions of the errors esM (i) and differences Es
M (i), considering simulated respiration with different values of Fr and φ and simulated noise withdifferent SNR values. Fr = 0 Hz or φ = 0◦ stands for clean simulated signal and SNR = ∞ stands for no simulated noise included. (a) φ ∈ {0◦, 5◦, 10◦, 15◦},Fr = 0.27, SNR = ∞. (b) φ = 15◦, Fr ∈ {0, 0.20, 0.30, 0.40} Hz, SNR = ∞. (c) Fr = 0.27, φ = 15◦, SNR ∈ {0, 30, 20, 10} dB.
error in the Te marks obtained by SL delineation is more linearlyrelated to the mechanical effect of respiration.
The mean and SD values of EvM are shown in Table II and
the distributions of the errors evM(i) and differences Ev
M(i) arepresented in Fig. 6(c) for several SLR values. In the presenceof noise there is no relevant performance decrease for none ofthe delineation approaches. The additional error with respect toclean simulated signal remains similar to the case with and nonoise inclusion (SNR = ∞). In Fig. 8(b) the values obtainedfor Cr,EV
Mand RV
ξ |r are presented. The level of linear relationbetween r(n) and Ev
M(i) is similar than for case with the sameFr value and SNR = ∞. A lower relation is found using MLthan with SL or SLR, confirming a weaker influence of themechanical respiration over the delineation error.
In order to explain the apparent robustness of ML to the me-chanical effect of the respiration we explore the main directionsu = [ux ,uy ,uz ]
T of EHV variations found by ML for Te de-lineation. Fig. 9 display the ux , uy , and uz found over cleansimulated signal and for the cases of Fr = 0.27, φ = 15o withno noise included and with SNR ∈ {30, 10} dB. While for cleansignal the final direction u is quite stable across beats, for allcases with respiratory effect a periodic component correspond-ing to Fr value is visible for all coordinates. Analyzing theaverage coherence values between r(n) and the angles � r
ρ(n)and � v
ρ(n) and the relative fractions of EsM(n) variability ex-
plained by those angles (see Fig. 10) we can confirm a stronglinear relation between the final direction u and r(n) for allcases.

1824 IEEE TRANSACTIONS ON BIOMEDICAL ENGINEERING, VOL. 59, NO. 7, JULY 2012
Fig. 7. Delineation errors and additional error (ms) due to respiration foundin the simulation study using several delineation approaches.
Fig. 8. Average coherence values and relative fractions of the total delineationerror or additional error including the respiration. SNR = ∞ stands for nosimulated noise included. (a) Linear relation between r(n) and er
M (i) or evM (i).
(b) Linear relation between r(n) and ErM (i) or Ev
M (i).
B. Real ECG Study
The linear relation between the estimated ϕx(i) and RTMe (i)
or ΔTe(i) found in the PTB database are shown in Fig. 11as the average coherence values Cr,d (nonparametric method)and fraction of variability Rξ |r explained by ϕx(i) (paramet-ric method). It can be observed that a strong relation between
TABLE IIMEAN ± SD OF Ev
M (i) FOR EACH STUDIED SNR VALUE
Fig. 9. Main directions u = [ux , uy , uz ]T of EHV variations found by MLfor Te delineation over: (a) clean simulated signal, (b) simulated signal includingrespiratory effect, with (c) noise for SNR = 30 dB and (d) noise for SNR =10 dB.
Fig. 10. Linear relation between r(n) and � sρ (n): average coherence values
and relative fractions of explained variability. (a) r(n) and � rρ (n).
ΔTe(i) and ϕx(i) is found by both methods. Also, RT SLRe (i)
seems more related with the ϕx(i) than RTMLe (i). The differ-
ence was found to be significatively higher using a unilateralsign test (p < 0.001) both for Cr,d and Rξ |r . The results ob-tained with ϕy (i) and ϕz (i) are analogous.
For CDB database recordings, both the linear relation be-tween the (recorded or estimated by rotation angles) respirationwith RTM
e (i) or ΔTe(i) are shown in the Fig. 12. Again, a strongrelation between ΔTe(i) and ϕx(i) or r(n) can be observed.The values found by both the methods for the linear relationbetween RT SLR
e (i) and ϕx(i) compared with RTMLe (i) are sig-
nificatively higher, with all p-values < 0.05 for the unilateralsign. The results obtained with ϕz (i) are analogous, while forϕy (i) non significant differences were found.
The linear relation between the final direction u angles andϕx(i) found over PTB database recordings are shown in Fig. 13

NORIEGA et al.: RESPIRATION EFFECT ON WAVELET-BASED ECG T-WAVE END DELINEATION STRATEGIES 1825
Fig. 11. Results in the PTB database: average coherence values Cr,d distribu-tion of ϕx (i) with ΔTe (i), RT SLR
e (i), and RT M Le (i) series and distribution
of relative fraction of ΔTe (i), RT SLRe (i), and RT M L
e (i) variability explainedby ϕx (i). p-values unilateral sign test are also indicated.
Fig. 12. Results in the CDB: average coherence values Cr,d distribution ofrespiration with ΔTe (i), RT SLR
e (i) and RT M Le (i) series and distribution of
relative fraction of ΔTe (i), RT SLRe (i) and RT M L
e (i) variability explained byrespiration, both with respect to recorded and estimated (inside the rectangle)respiration. p-values unilateral sign test are also indicated.
Fig. 13. Values in the PTB database (a) average coherence values distributionof ϕx (i) with the final direction u angle series with respect to the (x, y), (x, z),and (y, z) planes. (b) Distribution of relative fraction of � r
ρ variability explainedby ϕx (i).
while in Fig. 14 the results over CDB recordings are shown,considering both ϕx(i) and recorded respiration. High values aretypically found, specially with respect to recorded respiration.
IV. DISCUSSION
The delineation approaches used in this paper were previouslyvalidated and their performance level has been established else-where [18], [19]. In clean simulated data we found a delineation
Fig. 14. Values in the CDB (a) average coherence values distribution ofrecorded and estimated (inside the rectangle) respiration with the final directionu angle series respect to (x, y), (x, z), and (y, z) planes. (b) Distribution ofrelative fraction of � r
ρ variability explained by respiration.
error for T-wave end with a very low SD for all methods (lowerthan 2 ms, corresponding to one sample, for SL and ML), buta remarkable bias was found (Table I, last row). The bias usingSLR methods is explained by the rule used, favoring the latermarks among the 12 leads, and by a reference mark based inthree leads only. The huge SL bias is explained by the fact thatit was based in the X-lead while the T-wave end in the templateis taken as the latest SL-based mark, which happen to be theY-lead mark. We recall that T ref
e (i) are fully determined by theRR and QT series used in the simulation and by the referencemarks in the template beat. If SL based is on lead Z, instead oflead X, equivalent results are obtained (−25.5 ± 1.2), while iflead Y is considered a much lower bias is found (0.86 ± 1.1).
The known mechanical effect of respiration which causesECG morphologic changes morphological is expected to havesome influence over the results of automatic delineation, as ithas over other indexes [16]. Including mechanical respirationeffect, both bias and SD of delineation errors increase and usingSL approach one can see a quite remarkable relation betweenthe respiratory signal and both the delineation error and the ad-ditional error due to respiration. The additional delineation errorcaused by the respiration not only contributes for the global de-lineation error, but it also presents a high dispersion. Thus, therespiratory mechanical influence can contribute for the spuriousvariability of the T-end mark location. Nevertheless, this addi-tional error is lower using ML delineation, as result of a correctadjustment of the projected leads, with equivalent results foundfor different respiratory frequencies and noise levels.
The respiration effect was simulated using a sinusoidal sig-nal, which does take into account inspiration/expiration asym-metries. While a more realistic nonsymmetric sigmoidal signalcould be used instead, we believe that the rotation resulting fromthe respiration would not influence differently T-end delineationduring inspiration and expiration. The respiratory frequenciesconsidered were limited to the classical range located in thehigh-frequency band as defined by [25], and similar effects canbe expected in the presence of lower respiratory frequencies.
In real data, it was observed that the RT interval typicallypresents a strong linear relation with respiration (estimated orrecorded). This dependency has two possible sources: 1) the me-chanical effect of respiration on the ECG waveforms, and 2) the
1826 IEEE TRANSACTIONS ON BIOMEDICAL ENGINEERING, VOL. 59, NO. 7, JULY 2012
well-known physiological dependency of RT interval from RRinterval and, consequently, from respiration through HR. Thatrelation is higher when compared with recorded respiration,which can result from the fact that the EDR signal, estimatedas the rotation angles in the cardiac electrical axis, even thoughrepresenting a good estimation of periodicity of the respiratorysignal, is not linearly related with the air volume in the lungs,in contrast to the respiratory signal recorded by the pressuretransducer. The RT interval measure based on SLR Te locationwas also found to be significantly more related to respiration(estimated or recorded) than using ML. The only case of non-significance is using the EDR signal estimated from the rotationsaround lead y(n). Reviewing the EDR signals we found out asignal quite different from the equivalent ones extracted fromother leads. Possibly the extraction of the respiration is givingmuch error on that particular lead as result of the noise. It canbe deduced that the high relation of the ΔTe(i) with respirationis mainly due to the respiratory influence on SLR marks.
Both in simulated and real data a strong relation betweenrespiratory signals and the angles of the final direction u wasfound, confirming our hypothesis that ML is adapting the searchfor the best lead to mark Te to the respiration-induced changes inthe EHV, canceling out the ECG morphologic variations. Bothresults over simulated and real data allowed us to concludethat the ML allows us to locate Te more robustly, avoidingthe undesirable effect of the mechanically driven respiration-induced variations.
CONCLUSION
The results obtained in this study confirm the importance ofmultilead delineation. From comparison between the multileadstrategies in both simulated and real signals, a lower influence ofthe mechanical effect of the respiration on the Te mark locationwas observed with ML delineation. The differences between theTe measures obtained with both ML and SLR are dominated bythe mechanical influence of respiration on the SLR mark. Inaddition, we found out that the selected direction of projectionu in the ML system follows the changes of the cardiac electricalaxis caused by respiration, compensating their effect on the Te
mark. Thus, the increased stability in the Te mark in the ML sys-tem with respect to SLR can be explained by a reduction of thevariability associated with the mechanical effect of respirationon the delineation. These results lead us to state that for for QTvariability analysis, in cardiac risk stratification or drug safetystudies, it is highly advisable to use ML delineation strategies.
APPENDIX
ACRONYMS AND NOTATION
ANS Autonomic nervous system.EDR ECG-derived respiratory signal.EHV Electric heart vector.ML Multilead delineation system.SL Single-lead delineation system.SLR Postprocessing rules after the SL-based delin-
eation.
VCG Vectorcardiogram.WT Wavelet transform.Cr,Es
MAverage value in a respiratory frequency centeredwindow of the spectral coherence of respiratorysignal with Es
M(n).Cr, � s
ρAverage value in a respiratory frequency centeredwindow of the spectral coherence between therespiratory signal and the � s
ρ(i).es
M(i) Delineation error for the ith beat by auto-matic delineation using M ∈ {SL,SLR,ML}approach over the clean ECG (s ∈ {c}), ECGwith respiration affected (s ∈ {r}), and ECGwith noise contamination (s ∈ {v}).
RTMe Time interval measured from the R peak obtained
with SLR to Te obtained with each delineationapproach M ∈ {SLR,ML}.
Rsξ |r Relative fraction of Es
M(i) HF variability ex-plained by the respiration, where s ∈ {r, v}stands for ECG with respiration simulated effectand with noise contamination, respectively.
r(n) Respiratory signal.Te T wave end.T ref
e (i) Reference Te location for the ith beatu Main direction of EHV variations.TM ,s
e (i) Te mark for the ith beat obtained by auto-matic delineation using M ∈ {SL,SLR,ML}approach over the clean ECG (s ∈ {c}), ECGwith respiration simulated effect (s ∈ {r}), orECG with noise contamination (s ∈ {v})
ws,m (n) WT of a signal s(n) in the scale m.wm (n) WT loop in the scale m.Es
M(i) Additional error for the ith beat due to res-piration or noise (s ∈ {r, v}) with respect tothe automatic location over the clean signalTM ,c
e (i).� s
ρ(i) Angles of u for the ith beat with respect to theplane defined by each pair of orthogonal leadsρ ∈ {(x, y), (y, z), (x, z)}, s ∈ {r, v} � s
ρ(n).ΔTe(i) Differences between the automatic Te location
on beat i obtained using ML and SLR delineationapproaches.
ϕx(i), ϕy (i) Series of rotation angles around each orthogonallead estimated with the EDR algorithm.and ϕz (i)
REFERENCES
[1] L. Sornmo and P. Laguna, Bioelectrical Signal Processing in Cardiac andNeurological Applications, New York: Elsevier, 2005.
[2] M. Malik and A. J. Camm, Dynamic Electrocardiography. Oxford:Blackwell, 2004.
[3] R. Almeida, J. P. Martınez, A. P. Rocha, S. Olmos, and P. Laguna, “Im-proved QT variability quantification by multilead automatic delineation,”in Computers in Cardiology 2005, vol. 32. Washington, DC: IEEEComputer Society Press, pp. 503–506, 2005.
[4] A. Porta, G. Baselli, E. Caiani, A. Malliani, F. Lombardi, and S. Cerutti,“Quantifying electrocardiogram RT-RR variability interactions,” Med.Biol. Eng. Comput., vol. 36, pp. 27–34, 1998.
[5] J. P. Couderc and C. M. lopes, “Short and long QT syndromes: Does QTlength really matter?” J. Electrocardiol., vol. 43, no. 5, pp. 396–399,2010.
NORIEGA et al.: RESPIRATION EFFECT ON WAVELET-BASED ECG T-WAVE END DELINEATION STRATEGIES 1827
[6] D. J. Whellan, C. L. Green, J. P. Piccini, and M. W. Krucoff, “QT as asafety biomarker in drug development,” Clin. Pharmacol. Therapeut.,vol. 36, no. 1, pp. 101–104, 2009.
[7] J. P. Piccini, D. J. Whellan, B. R. Berridge, J. K. Finkle, S. D. Pettit,N. Stockbridge, J. P. Valentin, H. M. Vargas, and M. W. Krucoff, “Currentchallenges in the evaluation of cardiac safety during drug development:Translational medicine meets the critical path initiative,” Amer. Heart J.,vol. 158, no. 3, pp. 317–326, 2009.
[8] E. Pueyo, J. P. Martınez, and P. Laguna, “Cardiac repolarisation analysisusing the surface ECG,” Philos. Trans. R. Soc.—A, vol. 367, pp. 213–233,2009.
[9] C. P. Dobson, M. T. La Rovere, C. Olsen, M. Berardinangeli, M. Veniani,P. Midi, L. Tavazzi, M. Haigney, and on behalf of the GISSI-HF Investiga-tors, “24-Hour QT variability in heart failure,” J. Electrocardiol., vol. 42,no. 6, pp. 500–504, 2009.
[10] M. Hinterseer, B. M. Beckmann, M. B. Thomsen, A. Pfeufer, M. Ulbrich,M. F. Sinner, S. Perz, H. E. Wichmann, C. Lengyel, R. Schimpf, S. K.Maier, A. Varro, M. A. Vos, G. Steinbeck, and S. Kaab, “Usefulness ofshort-term variability of QT intervals as a predictor for electrical remodel-ing and proarrhythmia in patients with nonischemic heart failure,” Amer.J. Cardiol., vol. 106, no. 2, pp. 216–220, 2010.
[11] J. Malmivuo and R. Plonsey, Bioelectromagnetism—Principles and Appli-cations of Bioelectric and Biomagnetic Fields. London: Oxford Univ.Press, 1995.
[12] M. Malik, “Beat-to-beat QT variability and cardiac autonomic regulation,”Amer. J. Physiol. Heart Circ. Physiol., vol. 295, no. 3, pp. H923–H925,Sep. 2008.
[13] J. Flaherty, S. D. Blumenschen, A. W. Alexander, R. D. Gentzler, T. M.Gallie, J. P Boineau, and M. S. Spach, “Influence of respiration on record-ing cardiac potentials,” Amer. J. Cardiol., vol. 20, pp. 21–28, 1967.
[14] M. Astrom, H. C. Santos, L. Sornmo, P. Laguna, and B. Wohlfart, “Vec-torcardiographic loop alignment and the measurement of morphologicbeat-to-beat variability in noisy signals,” IEEE Trans. Biomed. Eng.,vol. 47, no. 4, pp. 497–506, Apr. 2000.
[15] F. Yasuma and J. Hayano, “Respiratory sinus arrhythmia. Why does theheartbeat synchronize with respiratory rhythm?,” Chest, vol. 125, pp. 683–690, 2004.
[16] L. Sornmo, “Vectorcardiographic loop alignment and morphologic beat-to-beat variability,” IEEE Trans. Biomed. Eng., vol. 45, no. 2, pp. 1401–1413, Dec. 1998.
[17] M. Noriega, R. Almeida, J. P. Martınez, and P. Laguna, “Medida Mul-tiderivacional de QT en el ECG de 12 derivaciones del sistema EASI,”presented at the 27th Congreso Anual de la Sociedad Espanola de Inge-nierıa Biomedica, Cadiz, Espana, Nov. 18–20, 2009.
[18] J. P. Martınez, R. Almeida, S. Olmos, A. P. Rocha, and P. Laguna “Wavelet-based ECG delineator: Evaluation on standard databases,” IEEE Trans.Biomed. Eng., vol 51, no. 4, pp 570–581, Apr. 2004.
[19] R. Almeida, J. P. Martınez, A. P. Rocha, and P. Laguna, “Multilead ECGdelineation using spatially projected leads from wavelet transform loops,”IEEE Trans. Biomed. Eng., vol. 56, no. 8, pp. 1996–2005, Aug. 2009.
[20] The CSE Working Party, “Recommendations for measurement standardsin quantitative electrocardiography,” Eur. Heart J., vol. 6, pp. 815–825,1985.
[21] P. Laguna, R. Jane, and P. Camina, “Automatic detection of wave bound-aries in multilead ECG signals: Validation with the CSE database,” Com-put. Biomed. Res., vol. 27, no. 1, pp. 45–60, Feb. 1994.
[22] S. Mallat and S. Zhong, “Characterization of signals from multiscaleedge,” IEEE Trans. Pattern Anal. Mach. Intell., vol. 14, no. 7, pp. 710–732, Jul. 1992.
[23] I. Christov, I. Otsinsky, I. Simova, R. Prokopova, E. Trendafilova, andS. Naydenov, “Dataset of manually measured QT intervals in the electro-cardiogram,” Biomed. Eng. Online vol. 31, no. 5, pp. 5–31, 2006.
[24] G. E. Dower, “The ECGD: A derivation of the ECG from VCG leads,” J.Electrocardiol., vol. 17, no. 2, pp. 189–191, 1984.
[25] Task Force of The ESC/ASPE, 1996, “Heart rate variability: Standards ofmeasurement, physiological interpretation, and clinical use,” Eur. HeartJ., vol. 17, pp. 354–381, 1996.
[26] R. Bailon, L. Sornmo, and P. Laguna, “A robust method for ECG-basedestimation of the respiratory frequency during stress testing,” IEEE Trans.Biomed. Eng., vol. 53, no. 7, pp. 1273–1285, Jul. 2006.
[27] R. Bailon, J. Mateo, S. Olmos, P. Serrano, J. Garcıa, A. del Rıo, I. Ferreira,and P. Laguna, “Coronary artery disease diagnosis based on exercise elec-trocardiogram indexes from repolarisation, depolarisation and heart ratevariability,” Med. Biol. Eng. Comput., vol. 41, pp. 561–571, 2003.
[28] T. Soderstrom, “Convergence properties of the generalised least squaresidentification method,” Automatica, vol. 10, pp. 617–626, 1974.
Maikel Noriega received the M.S. degree in telecom-munications and electronic engineering from the Uni-versity of Oriente, Santiago de Cuba, Cuba, and theMaster’s degree in biomedical engineering from theUniversity of Zaragoza, Zaragoza, Spain, in 2004 and2010, respectively, where he is currently working to-ward the Ph.D. degree in the field of biomedical signalprocessing.
He is currently an Assistant Professor of Commu-nications Theory in the Department of Telecommuni-cations Engineering, University of Oriente, Santiago
de Cuba, Cuba. Since 2008, he has been a Researcher at the Aragon Insti-tute of Engineering Research, Zaragoza. His current research interests includebiomedical signal processing, especially focused on the wavelet-based methodsfor automatic delineation of the ECG.
Juan Pablo Martınez was born in Zaragoza, Spain,in 1976. He received the M.S. degree in telecommu-nication engineering and the Ph.D. degree in biomed-ical engineering from the University of Zaragoza(UZ), Zaragoza, in 1999 and 2005, respectively.
Since 2000, he has been an Assistant Profes-sor at the Aragon Institute of Engineering Research,UZ, where he has been an Associate Professor since2007. He is also with the Centro de InvestigacionBiomedica en Red en Bioingenieria, Biomaterialesy Nanomedicina, Zaragoza. His current research in-
terests include biomedical signal processing, with main interest in signals ofcardiovascular origin.
Pablo Laguna (M’92–SM’06) was born in Jaca(Huesca), Spain, in 1962. He received the M.S. de-gree in physics and the Ph.D. degree in physic sciencefrom the Science Faculty, University of Zaragoza,Zaragoza, Spain, in 1985 and 1990, respectively. ThePh.D. thesis was developed at the Biomedical En-gineering Division of the Institute of Cybernetics(U.P.C.-C.S.I.C.) under the direction of P. Caminal.
He is currently a Full Professor of Signal Pro-cessing and Communications in the Department ofElectrical Engineering, Engineering School, where
he has being vice-dean for international relation (1999–2002), and a researcherat the Aragon Institute for Engineering Research (I3A), both at University ofZaragoza, Spain, where he has being responsible of the Biomedical Engineer-ing division of the I3A (2000–2011) and of the Biomedical Engineering Master(2003–2010). His professional research interests are in Signal Processing, inparticular applied to Biomedical applications. He has co-authored more than80 research papers on this topic, over 200 international conference papers,and has advise 10 Ph.D. Thesis. He has lead a broad number of projects onbiomedical signal interpretation specially in the cardiovascular domain, mostof them with international collaborations at clinical and engineering sites. He ishaving some international scientific responsibilities, as serving at the board ofComputing in Cardiology conference, editor of the Digital Signal ProcessingJournal (Eurasip), and of the Journal of Electrocardiology, organizer of differ-ent scientific conferences, etc. He is also member, and currently director, of theSpanish Center for Biomedical Engineering, Biomaterial and Nano-medicineResearch CIBER-BBN, and responsible of the Ph.D. program in BiomedicalEngineering at Zaragoza University. He is, together with L. Sornmo, the authorof the Bioelectrical Signal Processing in Cardiac and Neurological Applica-tions (Amsterdam: Elsevier, 2005). His professional research interests includesignal processing, in particular applied to biomedical applications.

1828 IEEE TRANSACTIONS ON BIOMEDICAL ENGINEERING, VOL. 59, NO. 7, JULY 2012
Raquel Bailon was born in Zaragoza, Spain, in 1978.She received the M.Sc. degree in telecommunica-tion engineering and the Ph.D. degree in biomedicalengineering from the University of Zaragoza (UZ),Zaragoza, in 2001 and 2006, respectively.
She was an Assistant Professor with the De-partment of Electronic Engineering and Communi-cations, UZ, from 2003 to 2010, where she is anAssociate Professor since 2010. She is also a Re-searcher with the Aragon Institute for EngineeringResearch, Zaragoza, and also with the Biomedical
Research Networking Center in bioengineering, biomaterials and nanomedicine,Zaragoza. Her current research interests include the biomedical signal process-ing field, specially in the analysis of the dynamics and interactions of cardio-vascular signals.
Rute Almeida was born in Porto, Portugal in 1979.She received a 4 years degree in mathematics appliedto technology in 2000 and the European Doctor De-gree (Ph.D. in applied mathematics) in 2007 fromFaculty of Sciences, University of Porto (FCUP),Oporto, Portugal.
She was with the Autonomic Function Study Cen-ter from Hospital S. Joao from March to October2001, working in methods for automatic delineationof the ECG. She was supported by an individual grantfrom the Foundation for Science and Technology
(Portugal) and the European Social Fund, from October 2001 to September2005. Since 2005, she is a member of the Centro de Matematica da Universi-dade do Porto (CMUP), Porto, Portugal.
From June 2007 to June 2012, she was a researcher at the Spanish center forBiomedical Engineering, Biomaterial and Nano-medicine Research CIBER-BBN (Centro de Investigacion Biomedica en Red en Bioingenierıa, Bioma-teriales y Nanomedicina ), under protocol with the University of Zaragoza(UNIZAR), Zaragoza, Spain. She was also with the Aragon Institute for En-gineering Research (I3A) at UNIZAR. Since July 2012, she is a postdoctoralresearcher at CMUP, Porto, Portugal.