Research on experimental measurement of acoustic resistance and major accuracy influencing factors...
9
Journal of Mechanical Science and Technology 28 (4) (2014) 1219~1227 www.springerlink.com/content/1738-494x DOI 10.1007/s12206-014-0302-1 Research on experimental measurement of acoustic resistance and major accuracy influencing factors analysis † Wang Xiaoqing 1 , Xiang Yang 1,* , Guo Zhiyong 2 , Xia Xuebao 1 , Shi Yuxiao 1 , Xue Peng 1 and Wu Shaowei 1 1 School of Energy and Power Engineering, Wuhan University of Technology, Wuhan, 430063, China 2 CCCC Tianjin Port & Waterway Prospection & Design Research Institute CO.,LTD., Tianjin, 300461, China (Manuscript Received July 5, 2013; Revised December 28, 2013; Accepted February 6, 2014) ---------------------------------------------------------------------------------------------------------------------------------------------------------------------------------------------------------------------------------------------------------------------------------------------- Abstract An experimental method of measuring acoustic surface radiation resistance is developed. The principle of the method is based on ob- taining source velocity and field pressure generated by the source. To measure surface radiation resistance, measuring probe was devel- oped and measuring system was set up. Then, major factors that affect measurement accuracy is discussed and great improvements are got. After that, experiments of measuring baffled circular piston were conducted to analyze its applicable frequency range. To verify actual application effect, experiments of measuring the tube and cylinder heads of a diesel engine were performed. The results show that this measuring system can obtain resistance values in the frequency range from 460 to 1900 Hz with high precision. The measuring sys- tem has features of simple operation, convenient use, and high accuracy. Therefore, it can be used to determine surface resistance matrix of various structures. Keywords: Acoustic resistance; Resistance matrix; Lumped parameter model; Acoustic radiation ---------------------------------------------------------------------------------------------------------------------------------------------------------------------------------------------------------------------------------------------------------------------------------------------- 1. Introduction The essential method in noise control area is quiet structure designing achieved by acoustic optimization design which take into account of vibration and noise characteristic in de- signing stage of product development. Thus, to assess the effect of optimization method and compare advantages and disadvantages of different designing methods, an objective function is needed, and sound power radiated from the surface of the structure is just in case. Though the sound powder radiated from structures can be calculated by numerical integration or by means of finite and boundary element methods, these methods are usually time consuming, especially those with complex surface geometries [1, 2]. In lumped parameter model [3], the sound power radiated from the surface of structure can be written in volume velocity and resistance matrix. Thus, the noise of the structure can be lower by optimization of the resistance matrix. In other words, resistance matrix can be used to evaluate the noise level ra- diated from structures. The resistance matrix can be solved with acoustic finite element method and acoustic boundary method, which are suite to structure with simple boundary conditions. However, the experimental method will not be affected by surface boun- dary condition and it can measure structure with complex surface shape. By measuring several typical acoustic struc- tures, Koopmann [1, 4, 5] made the conclusion that the expe- rimental method can give a precise value of the resistance in a certain frequencies. Then, Arenas [6] do some research work on the experimental method. However, the measured value they measured has big error with analytical values. Thus, based on previous research [7-9], this paper is to design a measuring probe, find out its major affecting factors and then use the probe in practical application. 2. Principle of resistance measurement In lumped parameter model [1], the acoustic power output of a vibrating of structure can be written in the resistance ma- trix with the volume velocities of the surface elements. Each of the surface elements was assumed to be vibrating as a pis- ton. The equation of the power output was determined as: , T av * 1 W = U U 2 R (1) where, 1 T N U U U is the volume velocities of the sur- * Corresponding author. Tel.: +86 27 50853170, Fax.: +86 27 86581997 E-mail address: [email protected] † Recommended by Associate Editor Cheolung Cheong © KSME & Springer 2014
Transcript of Research on experimental measurement of acoustic resistance and major accuracy influencing factors...
Journal of Mechanical Science and Technology 28 (4) (2014) 1219~1227
www.springerlink.com/content/1738-494x
DOI 10.1007/s12206-014-0302-1
Research on experimental measurement of acoustic resistance and major accuracy
influencing factors analysis†
Wang Xiaoqing1, Xiang Yang1,* , Guo Zhiyong2, Xia Xuebao1, Shi Yuxiao1, Xue Peng1 and Wu Shaowei1
1School of Energy and Power Engineering, Wuhan University of Technology, Wuhan, 430063, China 2CCCC Tianjin Port & Waterway Prospection & Design Research Institute CO.,LTD., Tianjin, 300461, China
(Manuscript Received July 5, 2013; Revised December 28, 2013; Accepted February 6, 2014)
----------------------------------------------------------------------------------------------------------------------------------------------------------------------------------------------------------------------------------------------------------------------------------------------
Abstract
An experimental method of measuring acoustic surface radiation resistance is developed. The principle of the method is based on ob-
taining source velocity and field pressure generated by the source. To measure surface radiation resistance, measuring probe was devel-
oped and measuring system was set up. Then, major factors that affect measurement accuracy is discussed and great improvements are
got. After that, experiments of measuring baffled circular piston were conducted to analyze its applicable frequency range. To verify
actual application effect, experiments of measuring the tube and cylinder heads of a diesel engine were performed. The results show that
this measuring system can obtain resistance values in the frequency range from 460 to 1900 Hz with high precision. The measuring sys-
tem has features of simple operation, convenient use, and high accuracy. Therefore, it can be used to determine surface resistance matrix
of various structures.
Keywords: Acoustic resistance; Resistance matrix; Lumped parameter model; Acoustic radiation
----------------------------------------------------------------------------------------------------------------------------------------------------------------------------------------------------------------------------------------------------------------------------------------------
1. Introduction
The essential method in noise control area is quiet structure
designing achieved by acoustic optimization design which
take into account of vibration and noise characteristic in de-
signing stage of product development. Thus, to assess the
effect of optimization method and compare advantages and
disadvantages of different designing methods, an objective
function is needed, and sound power radiated from the surface
of the structure is just in case.
Though the sound powder radiated from structures can be
calculated by numerical integration or by means of finite and
boundary element methods, these methods are usually time
consuming, especially those with complex surface geometries
[1, 2].
In lumped parameter model [3], the sound power radiated
from the surface of structure can be written in volume velocity
and resistance matrix. Thus, the noise of the structure can be
lower by optimization of the resistance matrix. In other words,
resistance matrix can be used to evaluate the noise level ra-
diated from structures.
The resistance matrix can be solved with acoustic finite
element method and acoustic boundary method, which are
suite to structure with simple boundary conditions. However,
the experimental method will not be affected by surface boun-
dary condition and it can measure structure with complex
surface shape. By measuring several typical acoustic struc-
tures, Koopmann [1, 4, 5] made the conclusion that the expe-
rimental method can give a precise value of the resistance in a
certain frequencies. Then, Arenas [6] do some research work
on the experimental method. However, the measured value
they measured has big error with analytical values. Thus,
based on previous research [7-9], this paper is to design a
measuring probe, find out its major affecting factors and then
use the probe in practical application.
2. Principle of resistance measurement
In lumped parameter model [1], the acoustic power output
of a vibrating of structure can be written in the resistance ma-
trix with the volume velocities of the surface elements. Each
of the surface elements was assumed to be vibrating as a pis-
ton. The equation of the power output was determined as:
,
T
a v
*1W = U U
2R (1)
where, 1 T
NU U U is the volume velocities of the sur-
*Corresponding author. Tel.: +86 27 50853170, Fax.: +86 27 86581997
E-mail address: [email protected] † Recommended by Associate Editor Cheolung Cheong
© KSME & Springer 2014
1220 Wang X. et al. / Journal of Mechanical Science and Technology 28 (4) (2014) 1219~1227
face elements,
11 1
1
N
N NN
R R
R
R R
is the acoustic surface
radiation resistance matrix.
The resistance matrix could be determined by numerical
method, however, due to its huge amount of preparation work
and time-consuming calculation, experimental method has
some advantage in determining the values of the resistance
matrix. The single term of resistance matrix is defined as:
, Re
m
a mn
n
p r
u r
R (2)
where mp r
is the sound pressure of an arbitrarily point m
on the structure surface, and nu r
is the volume velocity of
an arbitrarily point n on the structure surface. It is called
self-resistance when m= n and cross-resistance when m n≠ .
Thus, a small source with known volume velocity is needed to
measure radiation resistance, and it must meet two conditions
to simulate a point simple source. First, the size of the source
should be small enough, so that its influence on the shape can
be ignored when it is installed on the structure surface. Second,
it must be able to radiate a sound pressure that strong enough
to be measured in a certain frequency range, so that every
point on the structure can be measured. These two require-
ments are conflicting, because a source with smaller size
means it will has lower power output at low frequency.
In the research, due to flat diaphragm and moving like pis-
ton motion [10], a flat panel loudspeaker is used to simulate a
point simple source, and it was enclosed to guarantee its work-
ing as a point simple source, otherwise, it is more likely work-
ing as a point double source and its radiation output ability
will be very weak.
According to the acoustic theory, the sound pressure inside
the small volume cavity is determined by the harmonic oscil-
lation velocity of the cavity wall and it is defined as:
2
0 0 ˆjρ c
p uωV
(3)
where 0 is the density of the medium,
0c is sound velocity
in the medium, is the circular frequency ( 2 f ),V is the
cavity volume, and u is the harmonic oscillation velocity of
the cavity wall.
The volume velocity of the chamber wall can be calculated
from formula Eq. (3) if ignoring the influence of standing
wave in the cavity and given the condition that the volume of
the cavity is known and the response of the microphone mea-
suring sound pressure have no phase error. In fact, however, it
is difficult to measure the volume of the cavity accurately due
to the irregular shape of the loudspeaker. Besides, the phase
error of microphone response cannot be ignored [11]. There-
fore, it’s necessary to calibrate the probe before experiment.
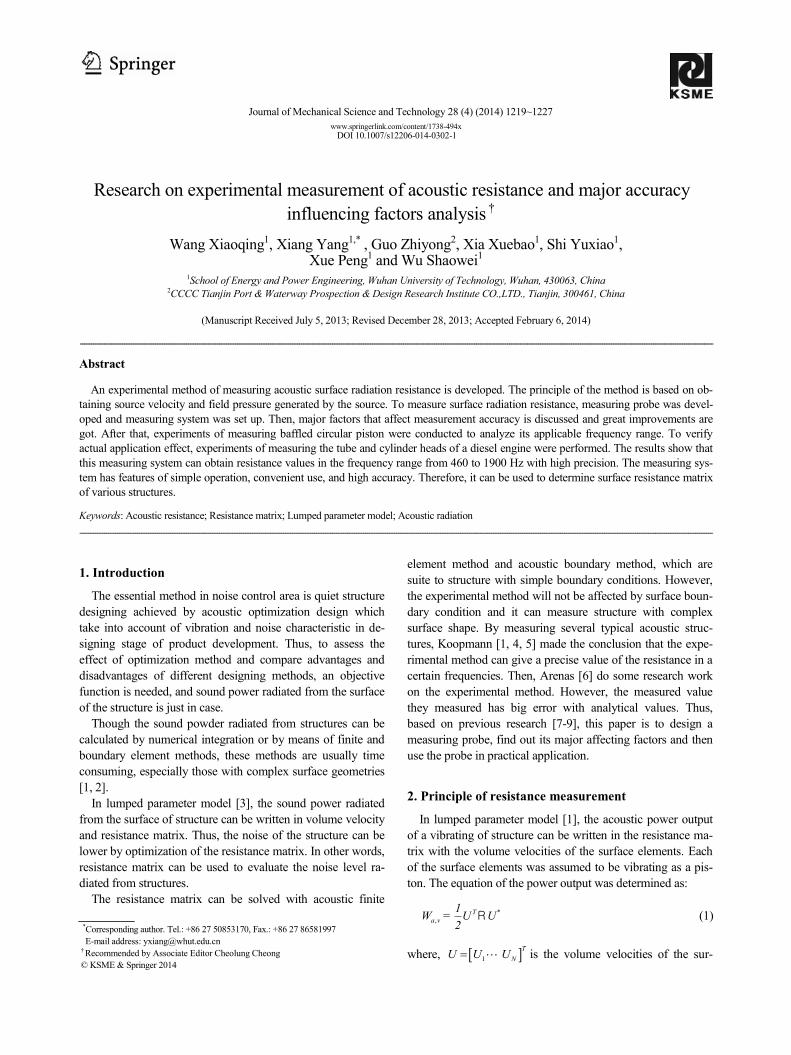
The calibration is conducted with a cavity (called calibra-
tion cavity) whose volume is known fixed on the source cavity
and the microphone fixed on the top of the calibration is used
to measure the sound pressure in it. Schematic diagram of the
calibration is shown in Fig. 1(a). Since the air compression in
the source cavity is corresponding with the air expansion in
the calibration cavity, which means ˆ ˆs cu u . So the transfer
function cF , referred as sound pressure ratio between the two
cavities, is determined by:
2 2
0 0 0 0ˆ ˆ ˆ
=ˆ
/c c sc
s c s
p jρ c u jρ c u
p ωV ωF
V
s
c
V
V (4)
where cV and
sV is the volume of the calibration cavity and
source cavity, respectively. Thus,sV can be calculated by mea-
suring the sound pressure of the two cavities. So the formula
Eq. (3) can be written as:
2
0 0
ˆ ˆ .cs c
Vu j p F
c
(5)
The volume velocity of the arbitrary point k on the sur-
face of the structure can be calculated with
2
0 0
ˆ ˆ .ck s k c
Vu r j p r F
c
(6)
When the sound pressure of the point i on the surface of the
structure is measured, then the acoustic radiation resistance
between two arbitrary points can be calculated with
210 0
, .k i
a ik c
k c s k
p r p rρ cR F
u r jωV p r
R R (7)
Then the formula can be further simplified as:
2 21 10 0 0 0
, Im Imi
a ik c m c
c s k c
p rρ c ρ cR F F F
ωV p r ωV
(8)
where m i s kF p r p r
. As complex number, cF and
mF
can be expressed as:
1 0j ψ ψ jψ
c c cF A e A e
(9)
1 0j j
m m mF A e A e
(10)
where 1 0ψ ψ ψ and 1 0 . 1
cF and 0ψ are the
phase angle of the microphones in calibration cavity and
source cavity during calibration measurement. 1 and 0 are
the phase angle of the microphones at field point and source
cavity during experimental measurement. Thus, formula Eq.
(8) can be written with
Wang X. et al. / Journal of Mechanical Science and Technology 28 (4) (2014) 1219~1227 1221
2 2
-0 0 0 0, Im Im
jj ψm m
a ik j
c
ψ
c c c
ρ c A e ρ c Ae
ωV A e ωV A
R (11)
Then, it can be simplified as:
2 2
0 0 0 0, sin - sinm m
c
k
c
a i
c c
ρ c A A ρ cψ θ
ωV A A ωV R (12)
where -θ ψ .
Thus, the acoustic radiation resistance can be calculated
with formula Eq. (12) by first amend the phase error of the
microphones with 1
cF calculated by the calibration mea-
surement, then by measure the sound pressure of arbitrary
points on the surface of the structure and the pressure inside of
the source cavity with the designed probe.
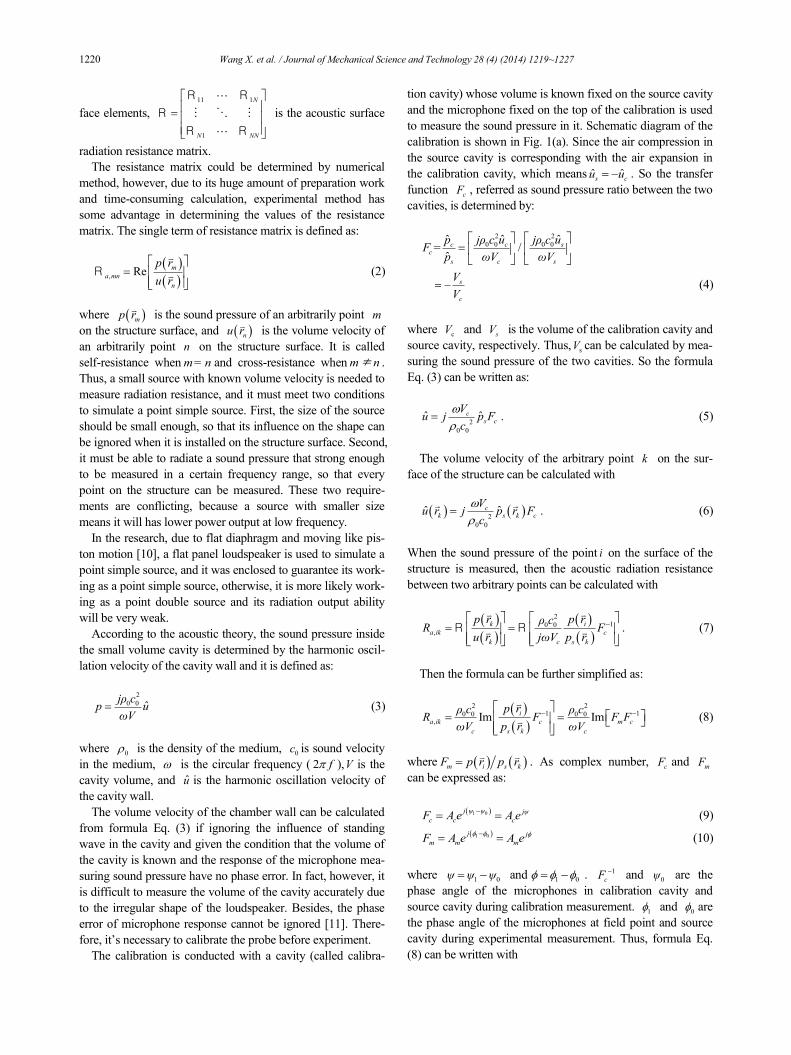
3. Measuring system
A schematic of the probe designed is shown in Fig. 1 and
the measuring system is shown in Fig. 2, which including the
designed experimental device, NI 9263 Analog voltage output
module, NI 9234 dynamic signal acquisition modules, NI
cDAQ-9172 chassis, and the computer for data acquisition
and post-processing. The loudspeakers are flat panel type with
rated power output of 2 W and diameter of 57 mm and 50 mm.
The size of omnidirectional electret microphones, named
DGO9767CD, is 9.7 mm6.7 mm with sensitivity of -24B, -
30 dB, -32 dB. Data acquisition program which was pro-
gramed with LabVIEW can gather data automatically after the
setup of initial parameters. The data post-processing program
is programmed with MATLAB.
In each of the experiments, the input volume of loudspeaker
was kept constant; the loudspeaker was driven with sinusoidal
signal and the frequency range from 20 to 4000 Hz with fre-
quency increment of 20 Hz. The sampling rate is 25.6 KHz
and the sampling number is 40000. The acoustic radiation
resistance can be calculated with the actual experimental data
andcF calculated by the calibration measurement.
4. Major influencing factors
Besides the rated power and diameter of the loudspeaker,
the air tightness of the source cavity, the sensitivity of the
microphone and the matching of the source and field micro-
phones are also important factors that influencing the measur-
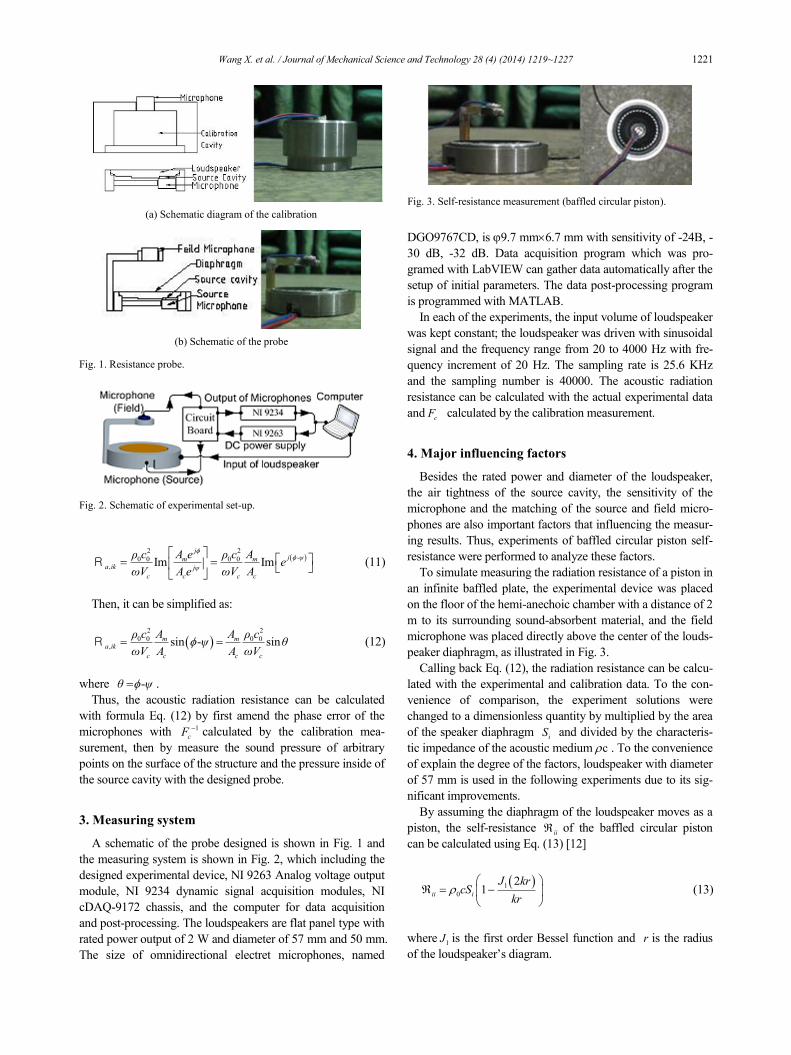
ing results. Thus, experiments of baffled circular piston self-
resistance were performed to analyze these factors.
To simulate measuring the radiation resistance of a piston in
an infinite baffled plate, the experimental device was placed
on the floor of the hemi-anechoic chamber with a distance of 2
m to its surrounding sound-absorbent material, and the field
microphone was placed directly above the center of the louds-
peaker diaphragm, as illustrated in Fig. 3.
Calling back Eq. (12), the radiation resistance can be calcu-
lated with the experimental and calibration data. To the con-
venience of comparison, the experiment solutions were
changed to a dimensionless quantity by multiplied by the area
of the speaker diaphragm iS and divided by the characteris-
tic impedance of the acoustic medium c . To the convenience
of explain the degree of the factors, loudspeaker with diameter
of 57 mm is used in the following experiments due to its sig-
nificant improvements.
By assuming the diaphragm of the loudspeaker moves as a
piston, the self-resistance ii of the baffled circular piston
can be calculated using Eq. (13) [12]
1
0
21iii
J krcS
kr
(13)
where 1J is the first order Bessel function and r is the radius
of the loudspeaker’s diagram.
(a) Schematic diagram of the calibration
(b) Schematic of the probe
Fig. 1. Resistance probe.
Fig. 2. Schematic of experimental set-up.
Fig. 3. Self-resistance measurement (baffled circular piston).
1222 Wang X. et al. / Journal of Mechanical Science and Technology 28 (4) (2014) 1219~1227
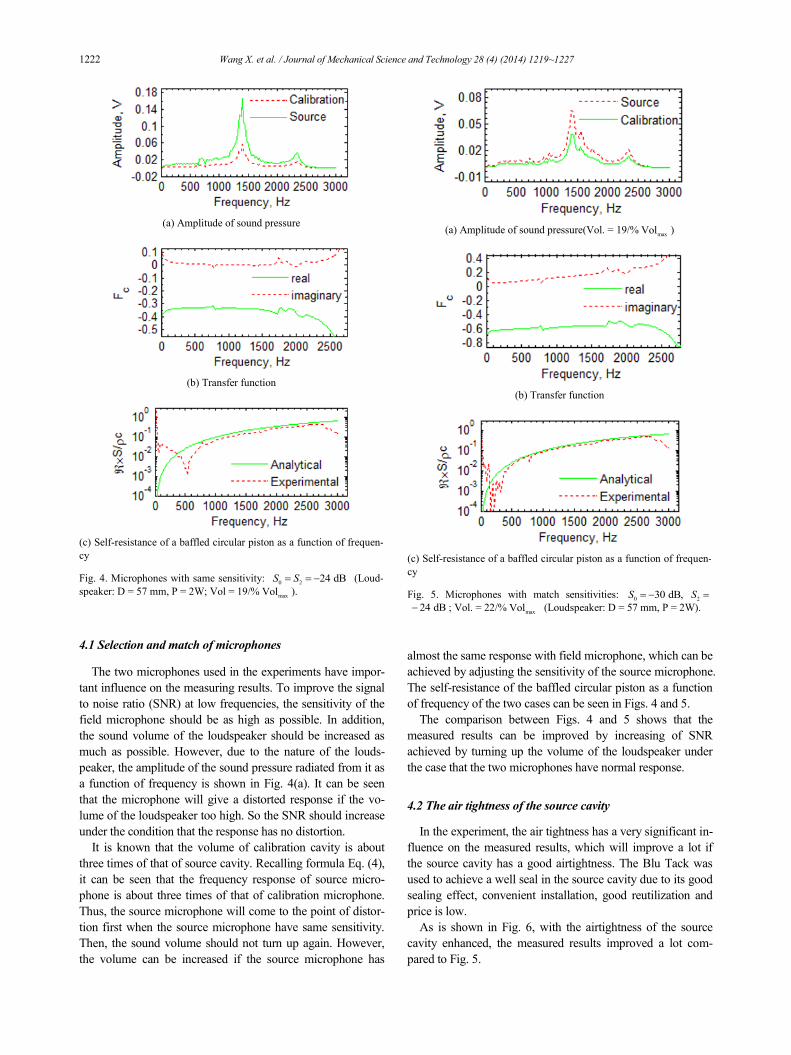
4.1 Selection and match of microphones
The two microphones used in the experiments have impor-
tant influence on the measuring results. To improve the signal
to noise ratio (SNR) at low frequencies, the sensitivity of the
field microphone should be as high as possible. In addition,
the sound volume of the loudspeaker should be increased as
much as possible. However, due to the nature of the louds-
peaker, the amplitude of the sound pressure radiated from it as
a function of frequency is shown in Fig. 4(a). It can be seen
that the microphone will give a distorted response if the vo-
lume of the loudspeaker too high. So the SNR should increase
under the condition that the response has no distortion.
It is known that the volume of calibration cavity is about
three times of that of source cavity. Recalling formula Eq. (4),
it can be seen that the frequency response of source micro-
phone is about three times of that of calibration microphone.
Thus, the source microphone will come to the point of distor-
tion first when the source microphone have same sensitivity.
Then, the sound volume should not turn up again. However,
the volume can be increased if the source microphone has
almost the same response with field microphone, which can be
achieved by adjusting the sensitivity of the source microphone.
The self-resistance of the baffled circular piston as a function
of frequency of the two cases can be seen in Figs. 4 and 5.
The comparison between Figs. 4 and 5 shows that the
measured results can be improved by increasing of SNR
achieved by turning up the volume of the loudspeaker under
the case that the two microphones have normal response.
4.2 The air tightness of the source cavity
In the experiment, the air tightness has a very significant in-
fluence on the measured results, which will improve a lot if
the source cavity has a good airtightness. The Blu Tack was
used to achieve a well seal in the source cavity due to its good
sealing effect, convenient installation, good reutilization and
price is low.
As is shown in Fig. 6, with the airtightness of the source
cavity enhanced, the measured results improved a lot com-
pared to Fig. 5.
(a) Amplitude of sound pressure
(b) Transfer function
(c) Self-resistance of a baffled circular piston as a function of frequen-
cy
Fig. 4. Microphones with same sensitivity: 0 2
24 dBS S (Loud-
speaker: D = 57 mm, P = 2W; Vol = 19/%max
Vol ).
(a) Amplitude of sound pressure(Vol. = 19/%max
Vol )
(b) Transfer function
(c) Self-resistance of a baffled circular piston as a function of frequen-
cy
Fig. 5. Microphones with match sensitivities: 0
30 dB,S 2
S
24 dB ; Vol. = 22/%max
Vol (Loudspeaker: D = 57 mm, P = 2W).
Wang X. et al. / Journal of Mechanical Science and Technology 28 (4) (2014) 1219~1227 1223
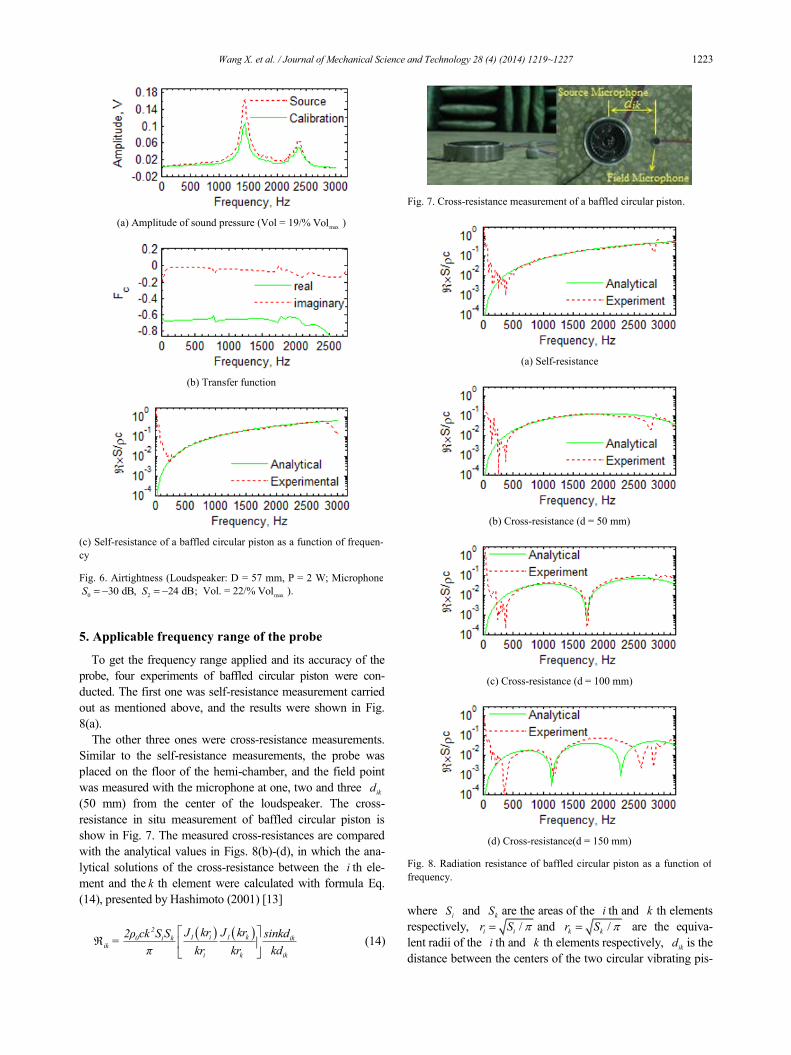
5. Applicable frequency range of the probe
To get the frequency range applied and its accuracy of the
probe, four experiments of baffled circular piston were con-
ducted. The first one was self-resistance measurement carried
out as mentioned above, and the results were shown in Fig.
8(a).
The other three ones were cross-resistance measurements.
Similar to the self-resistance measurements, the probe was
placed on the floor of the hemi-chamber, and the field point
was measured with the microphone at one, two and three ikd
(50 mm) from the center of the loudspeaker. The cross-
resistance in situ measurement of baffled circular piston is
show in Fig. 7. The measured cross-resistances are compared
with the analytical values in Figs. 8(b)-(d), in which the ana-
lytical solutions of the cross-resistance between the i th ele-
ment and the k th element were calculated with formula Eq.
(14), presented by Hashimoto (2001) [13]
21 i 1 k0 i k ik
ik
i k ik
J kr J kr2ρ ck S S sinkd=
π kr kr kd
(14)
where iS and kS are the areas of the i th and k th elements
respectively, /i ir S and /k kr S are the equiva-
lent radii of the i th and k th elements respectively, ikd is the
distance between the centers of the two circular vibrating pis-
(a) Amplitude of sound pressure (Vol = 19/%max
Vol )
(b) Transfer function
(c) Self-resistance of a baffled circular piston as a function of frequen-
cy
Fig. 6. Airtightness (Loudspeaker: D = 57 mm, P = 2 W; Microphone
030 dB,S
224 dB;S Vol. = 22/%
maxVol ).
Fig. 7. Cross-resistance measurement of a baffled circular piston.
(a) Self-resistance
(b) Cross-resistance (d = 50 mm)
(c) Cross-resistance (d = 100 mm)
(d) Cross-resistance(d = 150 mm)
Fig. 8. Radiation resistance of baffled circular piston as a function of
frequency.
1224 Wang X. et al. / Journal of Mechanical Science and Technology 28 (4) (2014) 1219~1227
ton elements.
The results shows that the probe can get resistance values
with higher precision in frequency between 460~1900 Hz, but
there are errors in low and high frequencies results from rea-
sons listed below:
(1) At frequencies below 460 Hz, The errors of the meas-
ured results is caused by lower SNR, which results from the
lower power radiated from the diaphragm of the loudspeaker.
(2) The radiation resistance measurement is limited by the
noise floor of this hemi-anechoic chamber, which is at approx-
imately 2/ 1 10S c R , so it can be seen that the experi-
mental results will not show good agreement with analytical
values below 0.01.
(3) At frequencies above 2000 Hz, the measuring probe
should not be viewed as a point simple source, because the
wavelength is shorter and the ratio of it to the size of the probe
is not big enough, and thus the probe is not correspondence
with the condition of the lumped parameter model. Besides,
the performance of the loudspeaker is also decreased.
6. Measuring examples
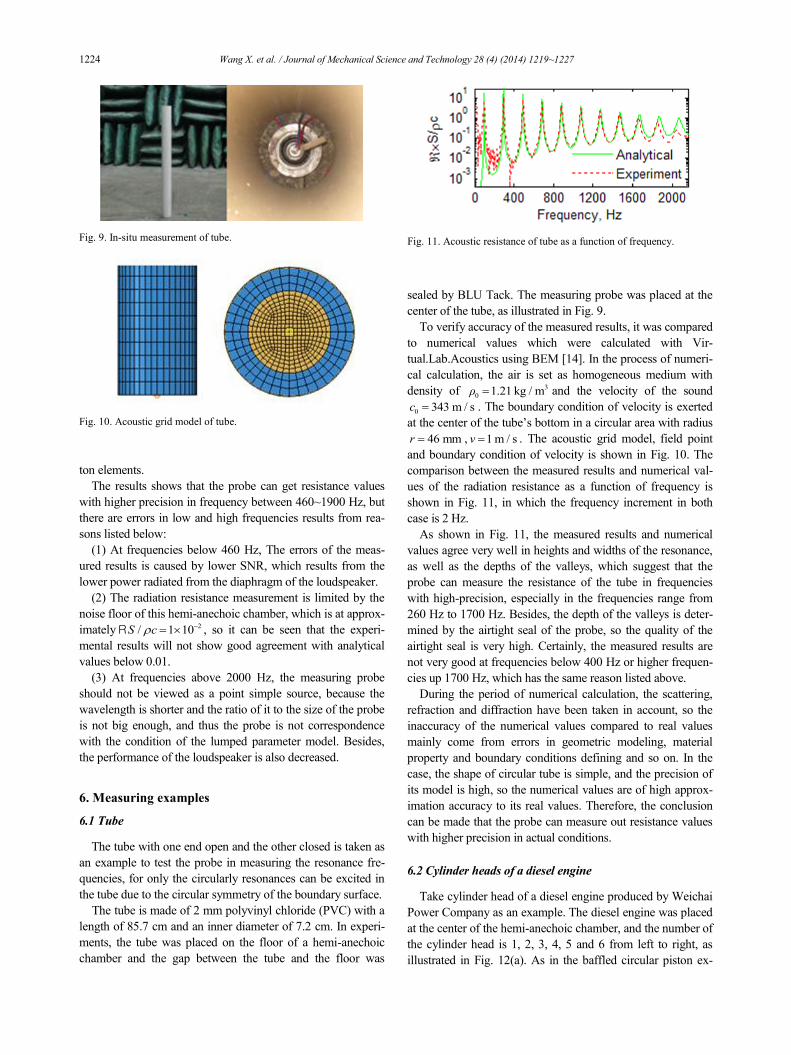
6.1 Tube
The tube with one end open and the other closed is taken as
an example to test the probe in measuring the resonance fre-
quencies, for only the circularly resonances can be excited in
the tube due to the circular symmetry of the boundary surface.
The tube is made of 2 mm polyvinyl chloride (PVC) with a
length of 85.7 cm and an inner diameter of 7.2 cm. In experi-
ments, the tube was placed on the floor of a hemi-anechoic
chamber and the gap between the tube and the floor was
sealed by BLU Tack. The measuring probe was placed at the
center of the tube, as illustrated in Fig. 9.
To verify accuracy of the measured results, it was compared
to numerical values which were calculated with Vir-
tual.Lab.Acoustics using BEM [14]. In the process of numeri-
cal calculation, the air is set as homogeneous medium with
density of 3
0 1.21 kg / mρ and the velocity of the sound
0 343 m / sc . The boundary condition of velocity is exerted
at the center of the tube’s bottom in a circular area with radius
46 mmr , 1 m / sv . The acoustic grid model, field point
and boundary condition of velocity is shown in Fig. 10. The
comparison between the measured results and numerical val-
ues of the radiation resistance as a function of frequency is
shown in Fig. 11, in which the frequency increment in both
case is 2 Hz.
As shown in Fig. 11, the measured results and numerical
values agree very well in heights and widths of the resonance,
as well as the depths of the valleys, which suggest that the
probe can measure the resistance of the tube in frequencies
with high-precision, especially in the frequencies range from
260 Hz to 1700 Hz. Besides, the depth of the valleys is deter-
mined by the airtight seal of the probe, so the quality of the
airtight seal is very high. Certainly, the measured results are
not very good at frequencies below 400 Hz or higher frequen-
cies up 1700 Hz, which has the same reason listed above.
During the period of numerical calculation, the scattering,
refraction and diffraction have been taken in account, so the
inaccuracy of the numerical values compared to real values
mainly come from errors in geometric modeling, material
property and boundary conditions defining and so on. In the
case, the shape of circular tube is simple, and the precision of
its model is high, so the numerical values are of high approx-
imation accuracy to its real values. Therefore, the conclusion
can be made that the probe can measure out resistance values
with higher precision in actual conditions.
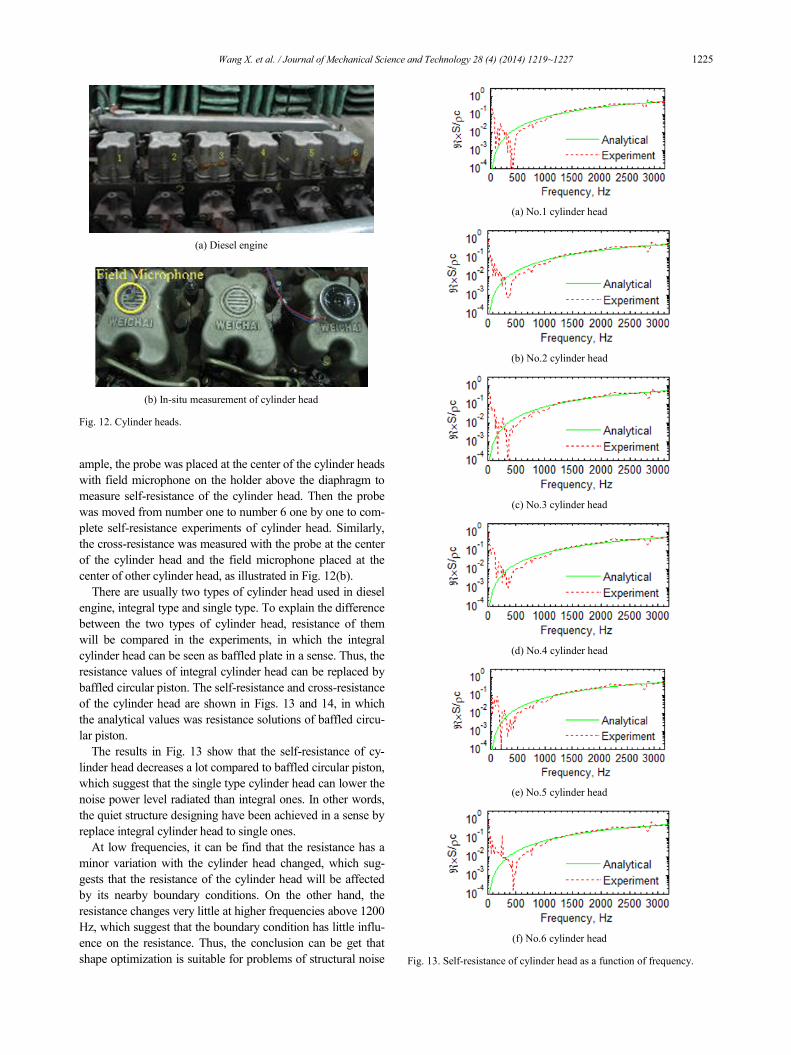
6.2 Cylinder heads of a diesel engine
Take cylinder head of a diesel engine produced by Weichai
Power Company as an example. The diesel engine was placed
at the center of the hemi-anechoic chamber, and the number of
the cylinder head is 1, 2, 3, 4, 5 and 6 from left to right, as
illustrated in Fig. 12(a). As in the baffled circular piston ex-
Fig. 9. In-situ measurement of tube.
Fig. 10. Acoustic grid model of tube.
Fig. 11. Acoustic resistance of tube as a function of frequency.
Wang X. et al. / Journal of Mechanical Science and Technology 28 (4) (2014) 1219~1227 1225
ample, the probe was placed at the center of the cylinder heads
with field microphone on the holder above the diaphragm to
measure self-resistance of the cylinder head. Then the probe
was moved from number one to number 6 one by one to com-
plete self-resistance experiments of cylinder head. Similarly,
the cross-resistance was measured with the probe at the center
of the cylinder head and the field microphone placed at the
center of other cylinder head, as illustrated in Fig. 12(b).
There are usually two types of cylinder head used in diesel
engine, integral type and single type. To explain the difference
between the two types of cylinder head, resistance of them
will be compared in the experiments, in which the integral
cylinder head can be seen as baffled plate in a sense. Thus, the
resistance values of integral cylinder head can be replaced by
baffled circular piston. The self-resistance and cross-resistance
of the cylinder head are shown in Figs. 13 and 14, in which
the analytical values was resistance solutions of baffled circu-
lar piston.
The results in Fig. 13 show that the self-resistance of cy-
linder head decreases a lot compared to baffled circular piston,
which suggest that the single type cylinder head can lower the
noise power level radiated than integral ones. In other words,
the quiet structure designing have been achieved in a sense by
replace integral cylinder head to single ones.
At low frequencies, it can be find that the resistance has a
minor variation with the cylinder head changed, which sug-
gests that the resistance of the cylinder head will be affected
by its nearby boundary conditions. On the other hand, the
resistance changes very little at higher frequencies above 1200
Hz, which suggest that the boundary condition has little influ-
ence on the resistance. Thus, the conclusion can be get that
shape optimization is suitable for problems of structural noise
(a) No.1 cylinder head
(b) No.2 cylinder head
(c) No.3 cylinder head
(d) No.4 cylinder head
(e) No.5 cylinder head
(f) No.6 cylinder head
Fig. 13. Self-resistance of cylinder head as a function of frequency.
(a) Diesel engine
(b) In-situ measurement of cylinder head
Fig. 12. Cylinder heads.
1226 Wang X. et al. / Journal of Mechanical Science and Technology 28 (4) (2014) 1219~1227
control at low frequencies.
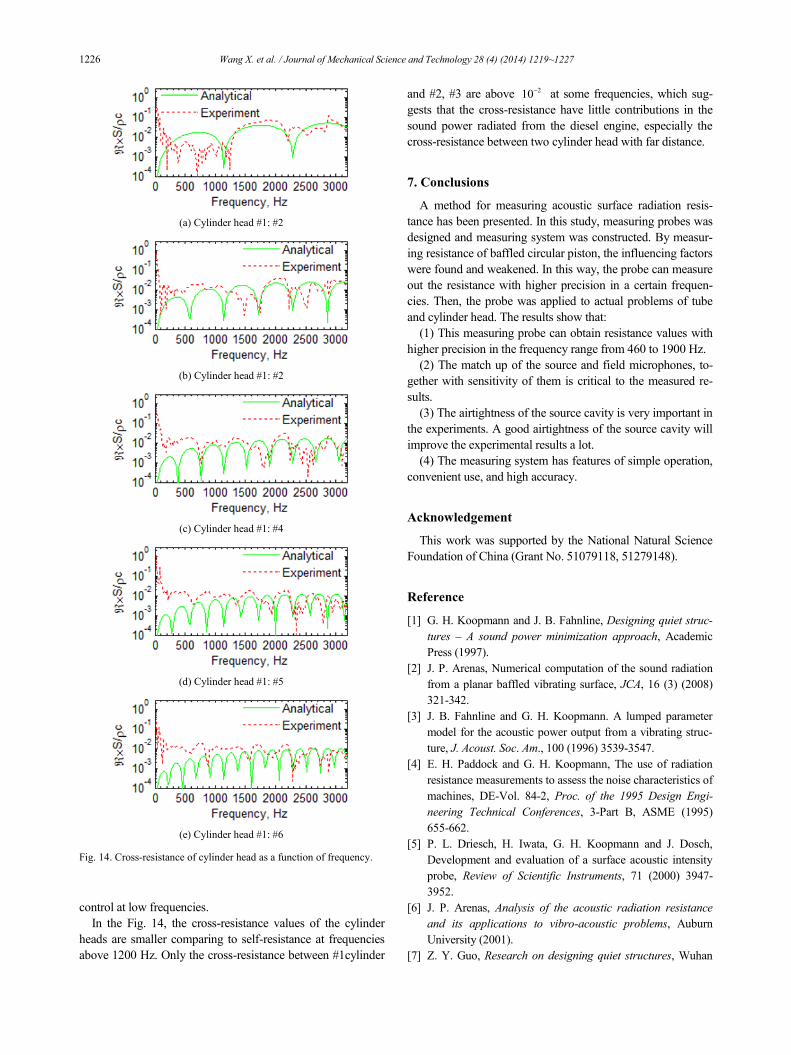
In the Fig. 14, the cross-resistance values of the cylinder
heads are smaller comparing to self-resistance at frequencies
above 1200 Hz. Only the cross-resistance between #1cylinder
and #2, #3 are above 210 at some frequencies, which sug-
gests that the cross-resistance have little contributions in the
sound power radiated from the diesel engine, especially the
cross-resistance between two cylinder head with far distance.
7. Conclusions
A method for measuring acoustic surface radiation resis-
tance has been presented. In this study, measuring probes was
designed and measuring system was constructed. By measur-
ing resistance of baffled circular piston, the influencing factors
were found and weakened. In this way, the probe can measure
out the resistance with higher precision in a certain frequen-
cies. Then, the probe was applied to actual problems of tube
and cylinder head. The results show that:
(1) This measuring probe can obtain resistance values with
higher precision in the frequency range from 460 to 1900 Hz.
(2) The match up of the source and field microphones, to-
gether with sensitivity of them is critical to the measured re-
sults.
(3) The airtightness of the source cavity is very important in
the experiments. A good airtightness of the source cavity will
improve the experimental results a lot.
(4) The measuring system has features of simple operation,
convenient use, and high accuracy.
Acknowledgement
This work was supported by the National Natural Science
Foundation of China (Grant No. 51079118, 51279148).
Reference
[1] G. H. Koopmann and J. B. Fahnline, Designing quiet struc-
tures – A sound power minimization approach, Academic
Press (1997).
[2] J. P. Arenas, Numerical computation of the sound radiation
from a planar baffled vibrating surface, JCA, 16 (3) (2008)
321-342.
[3] J. B. Fahnline and G. H. Koopmann. A lumped parameter
model for the acoustic power output from a vibrating struc-
ture, J. Acoust. Soc. Am., 100 (1996) 3539-3547.
[4] E. H. Paddock and G. H. Koopmann, The use of radiation
resistance measurements to assess the noise characteristics of
machines, DE-Vol. 84-2, Proc. of the 1995 Design Engi-
neering Technical Conferences, 3-Part B, ASME (1995)
655-662.
[5] P. L. Driesch, H. Iwata, G. H. Koopmann and J. Dosch,
Development and evaluation of a surface acoustic intensity
probe, Review of Scientific Instruments, 71 (2000) 3947-
3952.
[6] J. P. Arenas, Analysis of the acoustic radiation resistance
and its applications to vibro-acoustic problems, Auburn
University (2001).
[7] Z. Y. Guo, Research on designing quiet structures, Wuhan
(a) Cylinder head #1: #2
(b) Cylinder head #1: #2
(c) Cylinder head #1: #4
(d) Cylinder head #1: #5
(e) Cylinder head #1: #6
Fig. 14. Cross-resistance of cylinder head as a function of frequency.
Wang X. et al. / Journal of Mechanical Science and Technology 28 (4) (2014) 1219~1227 1227
University of Technology (2009).
[8] Y. Xiang, Z. Y. Guo and X. Q. Wang. Research on the mea-
surement principle design and calibration of the resistance
probe, Journal of Wuhan University of Technology: Trans-
portation Science & Engineering, 36 (5) (2012) 899-902.
[9] Y. Xiang, Z. Y. Guo and X. Q. Wang. Research on design of
the resistance probe and experiments using the probe, Jour-
nal of Wuhan University of Technology: Transportation
Science & Engineering, 36 (6) (2012) 1140-1142.
[10] D. Zhang, Research of flat panel loudspeaker, Nanjing:
Southeast University (2007).
[11] K. A. Chen and X. Y. Zeng, Acoustic measurement Beijing,
China Machine Press (2010).
[12] G. H. Du, Z. M. Zhu and X. F. Gong, Fundamentals of
acoustics, Nanjing: Nanjing University Press (2001).
[13] N. Hashimoto, Measurement of sound radiation efficiency
by the discrete calculation method, Applied Acoustics, 62
(2001) 429-446.
[14] Z. G. Li and F. L. Zhang, Acoustical simulated calculation
of advanced application examples in Virtual.Lab.Acoustics,
Beijing: National defense Industry Press (2010).
Wang Xiaoqing received his B.S. and
M.S. degrees in Marine Engineering
from Chongqing Jiaotong University
and Wuhan University of Technology,
China, in 2010 and 2013. He is currently
a doctoral student in The University of
Alabama. His research interest include
vibration and noise control, and electron
beam additive fabrication.
Xiang Yang, Ph.D., is currently a Pro-
fessor at the School of Energy and Pow-
er Engineering, Wuhan University of
Technology. Prof. Xiang’s research
interests include vibration and noise
control, optimal design, condition moni-
toring and fault diagnosis technology,
and signal processing technology.