Research Article A SAFETY STOCK MODEL BASED ON ...
13
841 Sigma J Eng & Nat Sci 37 (3), 2019, 841-853 Research Article A SAFETY STOCK MODEL BASED ON ORDER CHANGE-TO-DELIVERY RESPONSE TIME: A CASE STUDY FOR AUTOMOTIVE INDUSTRY Murat ÇOLAK* 1 , Tuğçen HATİPOĞLU 2 , Gülşen AYDIN KESKİN 3 , Alpaslan FIĞLALI 4 1 Kocaeli University, Department of Industrial Engineering, KOCAELİ; ORCID: 0000-0001-8226-6067 2 Kocaeli University, Department of Industrial Engineering, KOCAELİ; ORCID: 0000-0001-5760-3652 3 Kocaeli University, Department of Industrial Engineering, KOCAELİ; ORCID: 0000-0001-6639-1882 4 Kocaeli University, Department of Industrial Engineering, KOCAELİ; ORCID: 0000-0002-8364-3313 Received: 12.03.2019 Revised: 13.06.2019 Accepted: 07.08.2019 ABSTRACT The concept of competition has changed from ‘competition among companies’ to ‘competition among supply chains’ recently. Therefore, it is necessary to determine safety stock levels through scientific methods by considering customer service level for all companies of a supply chain. In the literature, the mean demand is used to calculate safety stock levels for a specified customer service level. In this study, a rule-based safety stock methodology, considering the order quantity changes immediately before the delivery date of the customer, has been proposed as different from literature. This methodology based on ABC-XYZ analysis provides to classify products according to monetary value and order changes and to propose a safety stock level for each product group in ABC-XYZ analysis. The main motivation is to provide an optimal combination of customer service and stock levels. The proposed methodology has been applied to a company operating in the automotive sector with 1203 products. The safety stock levels were determined according to previous year data and policies on the basis of different behaviors of customers and also the sales. Keywords: ABC-XYZ analysis, customer service level, response time, safety stock, supply chain management. 1. INTRODUCTION Supply chain management can be defined as the systematic and strategic coordination of traditional work practices and tactics to improve the long-term performance of companies on both a single chain and the entire supply chain. Operational decisions such as production planning, scheduling, inventory management, and determination of safety stock levels are among the components that have a direct impact on supply chain performance [1]. Communication is a critical concept for success of supply chain management. Communication among supply chain components such as suppliers, manufacturers, distributors, retailers and customers directly effects supply chain performance. At this point, flexible supplier-manufacturer relationship is a key concept in order to cope with changing market conditions. Flexibility enables to respond rapid demand changes [2]. * Corresponding Author: e-mail: [email protected], tel: (262) 303 33 17 Sigma Journal of Engineering and Natural Sciences Sigma Mühendislik ve Fen Bilimleri Dergisi
-
Upload
khangminh22 -
Category
Documents
-
view
1 -
download
0
Transcript of Research Article A SAFETY STOCK MODEL BASED ON ...

841
Sigma J Eng & Nat Sci 37 (3), 2019, 841-853
Research Article
A SAFETY STOCK MODEL BASED ON ORDER CHANGE-TO-DELIVERY
RESPONSE TIME: A CASE STUDY FOR AUTOMOTIVE INDUSTRY
Murat ÇOLAK*1, Tuğçen HATİPOĞLU
2, Gülşen AYDIN KESKİN
3,
Alpaslan FIĞLALI4
1Kocaeli University, Department of Industrial Engineering, KOCAELİ; ORCID: 0000-0001-8226-6067 2Kocaeli University, Department of Industrial Engineering, KOCAELİ; ORCID: 0000-0001-5760-3652 3Kocaeli University, Department of Industrial Engineering, KOCAELİ; ORCID: 0000-0001-6639-1882 4Kocaeli University, Department of Industrial Engineering, KOCAELİ; ORCID: 0000-0002-8364-3313
Received: 12.03.2019 Revised: 13.06.2019 Accepted: 07.08.2019
ABSTRACT
The concept of competition has changed from ‘competition among companies’ to ‘competition among supply
chains’ recently. Therefore, it is necessary to determine safety stock levels through scientific methods by
considering customer service level for all companies of a supply chain. In the literature, the mean demand is used to calculate safety stock levels for a specified customer service level. In this study, a rule-based safety
stock methodology, considering the order quantity changes immediately before the delivery date of the
customer, has been proposed as different from literature. This methodology based on ABC-XYZ analysis provides to classify products according to monetary value and order changes and to propose a safety stock
level for each product group in ABC-XYZ analysis. The main motivation is to provide an optimal
combination of customer service and stock levels. The proposed methodology has been applied to a company operating in the automotive sector with 1203 products. The safety stock levels were determined according to
previous year data and policies on the basis of different behaviors of customers and also the sales.
Keywords: ABC-XYZ analysis, customer service level, response time, safety stock, supply chain management.
1. INTRODUCTION
Supply chain management can be defined as the systematic and strategic coordination of
traditional work practices and tactics to improve the long-term performance of companies on both
a single chain and the entire supply chain. Operational decisions such as production planning,
scheduling, inventory management, and determination of safety stock levels are among the
components that have a direct impact on supply chain performance [1]. Communication is a
critical concept for success of supply chain management. Communication among supply chain
components such as suppliers, manufacturers, distributors, retailers and customers directly effects
supply chain performance. At this point, flexible supplier-manufacturer relationship is a key
concept in order to cope with changing market conditions. Flexibility enables to respond rapid
demand changes [2].
* Corresponding Author: e-mail: [email protected], tel: (262) 303 33 17
Sigma Journal of Engineering and Natural Sciences
Sigma Mühendislik ve Fen Bilimleri Dergisi
842
Production lead-time is a significant concept for inventory management in a manufacturing
company. It is necessary to provide shorter lead times not only to meet customer requirements but
also to reduce inventory costs [3]. Fu rthermore, a successful inventory management policy
depends on two factors as reliability and consistency [1]. In this context, determining inventory
levels for each product group is directly related to critical performance indicators of a company
such as service level, response time, delivery time, and supply chain effectiveness. In terms of
reliability and efficiency of the supply chain, the literature focused on stock level control. Many
researchers work in theory and practice in different inventory management subjects such as
determining safety stock levels, safety stock placement and minimizing inventory costs [4-6].
In the literature, the rate of responding customer needs at the right time and right amount is
defined as customer service level. The company may prefer to keep its inventory levels at the
maximum level for product groups in order to increase the customer service level. However, this
will result with an increase in inventory costs. Uncertainties regarding stock control in the supply
chain structure include customer demand volatility, supplier’s deficiency and market conditions.
Efficient inventory management keeps inventory level at optimal by preventing both stoppage of
production due to stock shortage and high inventory costs due to excess inventory [7]. Safety
stock level in the supply chain with uncertain environment requirements is twofold: reducing the
amount of stock causes a decrease in the customer service level while increasing the amount of
stock will cause to increase in operating and inventory costs. The storage space and volume
constraints of the stocks are confronted as another problem.
The main motivation of this study is increasing customer service level as well as decreasing
both inventory and operating costs. The purpose of the study is to determine the safety stock
levels that maintains the customer service level. While these levels were determining, all the
scenarios specific to the product groups of the company were evaluated previously encountered
by the company in which the study was conducted. A rule-based safety stock methodology has
been developed on the basis of the coefficient of variation, taking into account the variations
experienced in customer demands on product basis. The customers with higher coefficient of
variation are classified in Z group while the lower variation ones are in X group according to
XYZ analysis. In order not to sacrifice from the customer service level, different scenarios are
assessed for preventing a backorder in group A products determined by the ABC analysis. The
total holding cost of each scenario and the tradeoffs associated with the backorder amounts have
been considered within a multi-criteria context. In other words, the novelty of the study is to
determine different specific stock policies for the different product groups of the company,
according to the coefficient of variation. Another contribution of the study to the literature is the
modeling of customer behaviors while determining safety stock levels in the proposed system.
The level of consciousness is increased in which the customers behave more decisively and
reliably.
The rest of the paper has been organized as follows. A comprehensive literature review has
been presented for studies related to safety stock and customer service level in Section 2. The
proposed methodology and the case study have been given in Section 3. Finally, the study has
been concluded with results and suggestions in Section 4.
2. LITERATURE REVIEW
The most important factors that complicate the supply chain structure are demand
fluctuations, keeping customer service level at desired level, stock shortage, capacity increases,
inefficiencies in transportation system and production scheduling mistakes. One of the policies
that companies prefer to take over from these causes is to keep excess stock. In this case,
increasing inventory quantities also increase inventory holding and operating costs [8]. There are
many studies that have been proposed to overcome these problems in the literature. Some of these
studies are summarized below.
M. Çolak, T. Hatipoğlu, G. Aydın Keskin, A. Fığlalı / Sigma J Eng & Nat Sci 37 (3), 841-853, 2019

843
Singh et al. [4] aimed to deter mine lot size and reorder points according to risk adjusted
discount rates by using a capital asset pricing approach for inventory management of a company.
Desmet et al. [9] aimed to optimise safety stocks in a two-echelon assembly system through
several approximation models. Zhou and Viswanathan [10] compared the results of bootstrapping
and parametric methods for safety stock determination of spare parts which have intermittent
demand. They showed that parametric method has provided better results than bootstrapping
method with real industry data. Li et al. [11] examined the effects of lead time and service level
constraints on inventory management. They revealed centralized and decentralized models which
include these constraints and proposed solution approaches in order to obtain optimum solutions.
Jodlbauer and Reitner [12] presented a stochastic production model examining the effect of cycle
time, safety stock, processing time, setup time and demand on service level and costs (holding,
setup and backorder). Besides, they developed algorithms in order to obtain maximum service
level and minimum cost points. Osman and Demirli [5] handled safety stock placement problem
including multiple sourced stockpoints which have variable demand and lead time. They aimed to
determine fill rate and safety stock level for each stockpoint by using decentralized safety stock
placement model and centralized consolidation model in order to increase customer service level
and minimize safety stock placement cost. Jeong and Leon [13] studied on coordination of a
supply chain with safety stocks under complete and partial information. They obtained optimal
solution under complete information and suggested Alternating Direction Method and Diagonal
Quadratic Approximation Method for supply chain coordination under partial information. Beutel
and Minner [14] presented two approaches which use regression models and linear programming
in order to determine safety stock under variable demand. They compared the results of these
methods so as to determine inventory levels better. Li and Jiang [15] handled safety stock
placement problem as a project scheduling problem and proposed integrated constraint
programming – genetic algorithm approach in order to increase solution performance.
Chakraborty and Giri [16] developed a model for an unreliable production environment named
due to process deterioration, maintanance, machine breakdown and buffer stock. They proposed
an algorithm in order to determine safety stock level and production run time for this model. Van
Donselaar and Broekmeulen [17] presented an approximation in order to determine safety stocks
in a lost sales inventory system under periodic review, positive lead-time and target fill rate. The
average and standart deviation of approximation error were calculated for this approximation and
the result is considered as very well. Inderfurth and Vogelgesang [18] aimed to determine safety
stock levels for a manufacturer in order to handle uncertainties rooted from stochastic demand
and different yield randomness. They proposed some approaches for determining static and
dynamic safety stocks and examined effectiveness of these approaches via simulation study.
Moncayo-Martinez and Zhang [19] formulated supply chain configuration and safety stock
placement problem as MAX-MIN ant system which aims to minimize total supply chain cost and
lead time concurrently. They presented a bi-objective model and Ant Colony Optimization-based
more effective approach. Braglia et al. [20] proposed an analytical approach to the single vendor–
single buyer problem under Vendor Managed Inventory with consignment agreement.
Tempelmeier and Bantel [21] introduced a methodology in order to investigate the relationship
between the inventory system performance and a subsequent transportation process. Safety stock
inventory in a two-stage serial line supply chain was optimised in the study of Hua and Willems
[6]. Paul and Rahman [22] have developed a fuzzy-based model to overcome sudden supply
delays, taking into account demand volatility and safety stock. Woerner et al. [23] aimed to
reduce total cost of inventory by providing both budget constraints and service level. They have
proposed an algorithm that jointly calculates the optimal capacity allocation and base-stock levels.
Saad et al. [24] calculated safety stocks over ERP by taking service levels into consideration.
Korponai et al. [25] focused on the relations between the stock level and the risk of shortages. Li
and Fu [26] formulated a two-stage optimization model. In the second stage, the worst case
demand distribution is characterized by being treated as an input to the inventory levels, while in
A Safety Stock Model Based on Order Change-to- … / Sigma J Eng & Nat Sci 37 (3), 841-853, 2019

844
the first stage optimum stock levels are determined by using the results of the second stage. Lu et
al. [27] suggested five allocation policies based on schedule, cost, demand, schedule-cost and
schedule-demand in order to support inventory management process. They applied a simulation
optimization method based on genetic algorithm for solving inventory model and determining
optimal inventory levels for related policy. Darom et al. [28] presented a recovery model for a
two-stage supply chain so as to minimize supply disruption by taking into consideration safety
stock and carbon emission. As a result of the study, they determined that safety stock level is
affected from holding cost for a range of short disruption periods. Kumar and Aouam [29] aimed
to optimize strategic safety stock placement and tactical lot sizing problems concurrently by
minimizing system-wide production and inventory costs. They utilized an extended dynamic
programming algorithm to solve this integrated problem. Trapero et al. [30] proposed an optimal
combination of empirical techniques in order to increase safety stock estimation performance.
They demonstrated the effectiveness of this approach via simulation and real data experiments.
Puga et al. [31] suggested a supply chain design model combining facility location, safety stock
placement and delivery strategy decisions so as to improve supply chain design. They determined
safety stock placement decisions by means of guaranteed-service approach. Trapero et al. [32]
analyzed effects of deviations from i.i.d. (independently and identically distributed) assumption
and suggested empirical techniques based on kernel density estimation and Generalised
AutoRegressive Conditional Heteroscedastic (GARCH) (1,1) models for determining safety stock
levels. They showed the importance of normality deviation and the suitability of kernel density
estimation for shorter lead times as a result of this study.
The main sources of uncertainty in the supply chain are twofold: the variability in customer
demand on the shipping side (outbound side) and the supply period and order amount on the
supply side (inbound side). Methods widely used in the literature to determine the safety stocks
take into account distribution measures obtained from statistics on variability in customer
demand. However, today, particularly in sectors with very intense competition, due to the special
importance attributed to the customer, the extreme flactuation on demands of the customer are
also responded. Safety stock quantities are calculated for predetermined customer service levels
using the mean and standard deviation values of the past order quantities. Especially when
demand is met directly from the stock, it is possible to obtain a high level of customer service for
such dynamic inventory items with very high inventory costs. Inventory costs naturally decrease
when the order does not have to be met directly from the inventory and a certain production
period is available. However, in the latter case, when the customer makes a change in the order
quantity very close to the due date, the company may not be able to respond due to limited
production capacity. In this case, if the safety stock calculation is made considering the
production response time, safety stock amount and the cost will be reduced considerably. In this
study, unlike other methods in the literature; a model is proposed which takes into account the
quantity changes very close to the customer's delivery date on the basis of the demand is not
necessarily met directly from stock and a specific production period is available. The proposed
model uses the statistical analysis which define the client's past behavior profile. Using the
proposed model structure, it would be possible to respond order quantity changes in a very short
period of time in the delivery while maintaining high customer service level and minimizing
inventory quantity and cost.
3. METHODOLOGY AND CASE STUDY
The main purpose of this study is to be able to determine safety stock levels against positive
order quantity changes that may occur in a certain response time (between order to delivery
including production time) before due date. Our second aim is to identify products with high
coefficient of variation and to make recommendations for the regulation of customers' ordering
policies for these products. Thus, the companies will be able to act proactively with the customer's
M. Çolak, T. Hatipoğlu, G. Aydın Keskin, A. Fığlalı / Sigma J Eng & Nat Sci 37 (3), 841-853, 2019
845
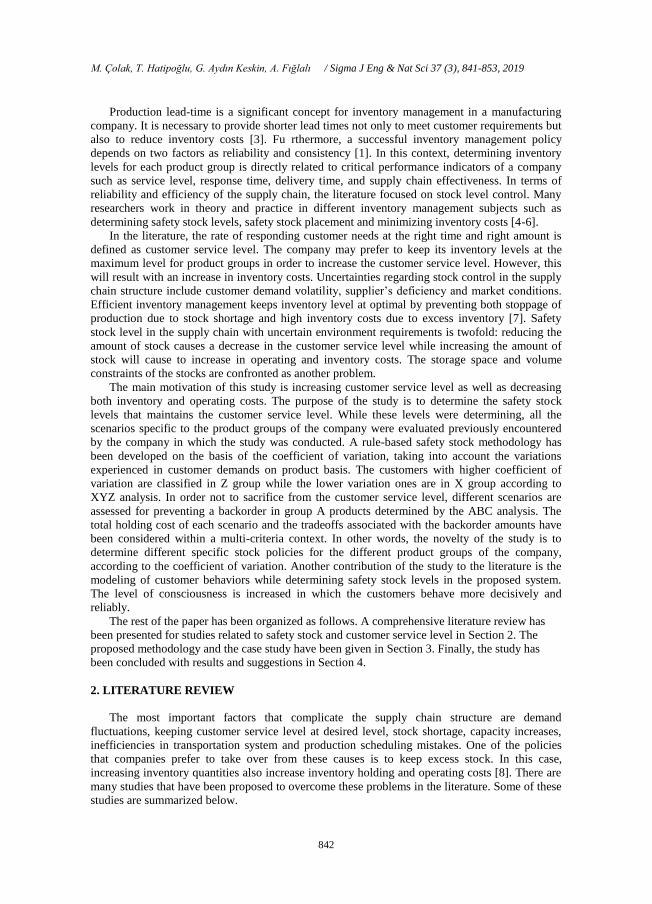
awareness of the general tendency of behavior, as well as lead customers who behave different
from specified in the annual contract. The applied methodology to achieve these goals is
described in Figure 1.
Step 1: Performing ABC analysis according to annual sales
revenue of products
Step 2: Determining order response time according to
product conditions of the company
Step 3.1: Calculating means of order increases
for each product (X-bar)
Step 3.2: Calculating standard deviations of
order increases for each product (σ)
Step 3.3: Calculating coefficient of variation
values for each product (σ / X-bar)
Step 3.4: Classifying products according to
their coefficient of variation values
Step 4: Combining results of ABC and XYZ analyses
Step 5.1: Constituting different scenarios for
safety stock level (X-bar+kσ) (k=0.5, 1, 1.5, 2)
Step 5.2: Calculating backorder rates for
different scenarios
Step 5.3: Calculating additional stock costs for
different scenarios
Step 5.4: Determining appropriate comparison
scenarios for each in-group products
Step 5.5: Calculating tradeoff coefficients
depending on compared scenarios
Step 5.6: Making appropriate safety stock
decision for each product in the group
Step
3: X
YZ
Analy
sisS
tep 5
: In-g
roup an
alyses fo
r com
bin
ed g
roups
(AZ
2, A
Z1, A
Y, A
X, B
Z2 etc.)
Figure 1. The steps of the proposed methodology
A Safety Stock Model Based on Order Change-to- … / Sigma J Eng & Nat Sci 37 (3), 841-853, 2019

846
The proposed methodology has been applied for a manufacturing company operating in
automotive sector. The company is operating in different locations around the world with 264
customers and 1203 different product types. Arrival time at customer orders varies between 1
month and 18 months and the order quantities can be updated until the delivery time. Since the
order updates tend to increase as the delivery time approaches, the company will have difficulty
to respond due to the production capacity constraint. The company is able to respond to order
variability by two weeks before the delivery. But the company can not take action against later
order updates. If customers do not change orders in the last two weeks, the customer service level,
which can reach 99%, is on average 80% due to the demanding approach of the customers.
In order to differentiate safety stock policies in product base, variations in customer orders
and product values should be taken into consideration. In the literature, ABC analysis for the
value-based classification of products and XYZ analysis for the analysis of customer variability
are accepted as suitable methods. The company in which the case study is carried out operates in
the automotive supplier industry. There are 1203 stock keeping units (SKU) in the product range
of company. In order to classify these products according to their annual sales revenue, ABC
analysis has been applied. The results of ABC analysis has been presented in Table 1.
Table 1. The results of ABC analysis
Class SKU Monetary value (Thousand Euro) Rate (%)
A 214 97,498 82
B 290 17,325 15
C 699 3,844 3
Total 1203 118,667 100
When a positive change in customer orders occurs, the company can respond to this increase
within 2 weeks. Hence, changes made within two weeks prior to the delivery date have been
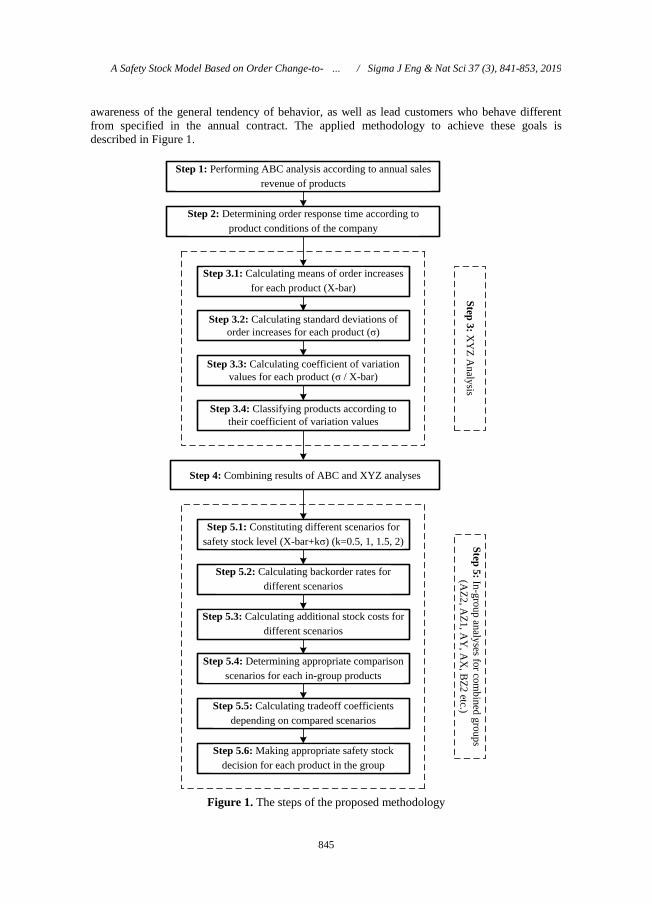
identified as the basic reference point in this study. XYZ analysis has been applied to distinguish
this variability based on products. In order to make a more detailed analysis, Z group was
evaluated by dividing into two subgroups as Z1 and Z2. The classification in the XYZ analysis has
been realized according to coefficient of variation values. After checking the normality of the
quantity of positive order changes using 0.05 value as the critical significance level, the
coefficient of variation has been determined by using the annual means and standard deviations of
positive quantity changes for each product. It is determined that the coefficient of variation is
within the range of [0.0, 3.0]. The summary results of the XYZ analysis have been presented in
Table 2.
The Z1 and Z2 product groups, which are defined as having a high coefficient of variation, are
products whose order quantities are mostly increased by the customer within two weeks prior to
the delivery date. On the other hand, X group products have low coefficient of variation. Due to
this distinction, different inventory policies should be applied for inventory items in different
groups in XYZ analysis. Since the same assumption is extended to the product groups in the ABC
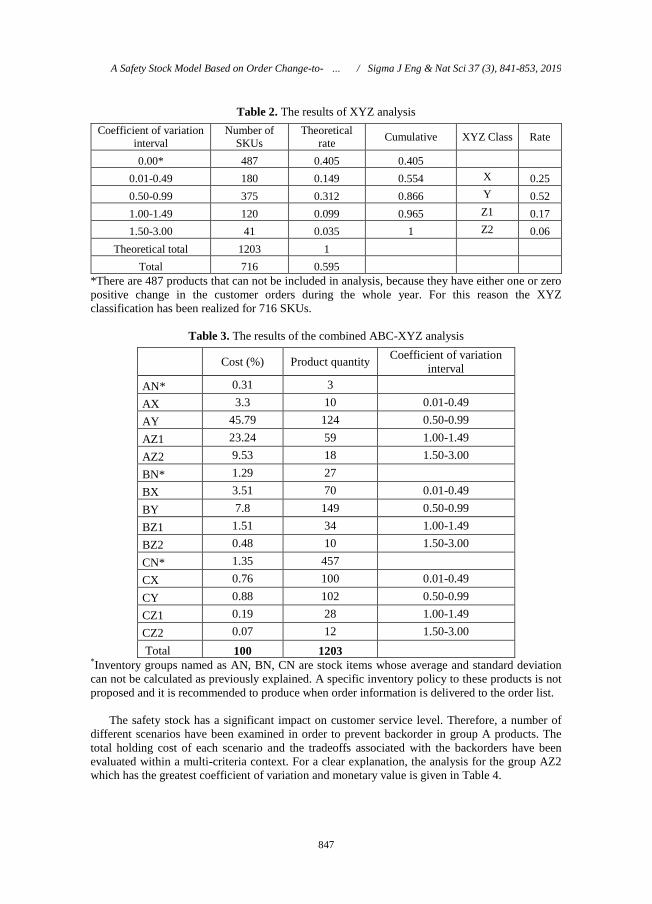
analysis, it is appropriate to use the results of the ABC-XYZ analysis which means the
combination of these two analyses in order to make detailed decisions. The summarized data of
the combined analysis are given in Table 3.
M. Çolak, T. Hatipoğlu, G. Aydın Keskin, A. Fığlalı / Sigma J Eng & Nat Sci 37 (3), 841-853, 2019
847
Table 2. The results of XYZ analysis
Coefficient of variation
interval
Number of
SKUs
Theoretical
rate Cumulative XYZ Class Rate
0.00* 487 0.405 0.405 0.01-0.49 180 0.149 0.554 X 0.25
0.50-0.99 375 0.312 0.866 Y 0.52
1.00-1.49 120 0.099 0.965 Z1 0.17
1.50-3.00 41 0.035 1 Z2 0.06
Theoretical total 1203 1
Total 716 0.595
*There are 487 products that can not be included in analysis, because they have either one or zero
positive change in the customer orders during the whole year. For this reason the XYZ
classification has been realized for 716 SKUs.
Table 3. The results of the combined ABC-XYZ analysis
Cost (%) Product quantity Coefficient of variation
interval
AN* 0.31 3
AX 3.3 10 0.01-0.49
AY 45.79 124 0.50-0.99
AZ1 23.24 59 1.00-1.49
AZ2 9.53 18 1.50-3.00
BN* 1.29 27
BX 3.51 70 0.01-0.49
BY 7.8 149 0.50-0.99
BZ1 1.51 34 1.00-1.49
BZ2 0.48 10 1.50-3.00
CN* 1.35 457
CX 0.76 100 0.01-0.49
CY 0.88 102 0.50-0.99
CZ1 0.19 28 1.00-1.49
CZ2 0.07 12 1.50-3.00
Total 100 1203 *Inventory groups named as AN, BN, CN are stock items whose average and standard deviation
can not be calculated as previously explained. A specific inventory policy to these products is not
proposed and it is recommended to produce when order information is delivered to the order list.
The safety stock has a significant impact on customer service level. Therefore, a number of
different scenarios have been examined in order to prevent backorder in group A products. The
total holding cost of each scenario and the tradeoffs associated with the backorders have been
evaluated within a multi-criteria context. For a clear explanation, the analysis for the group AZ2
which has the greatest coefficient of variation and monetary value is given in Table 4.
A Safety Stock Model Based on Order Change-to- … / Sigma J Eng & Nat Sci 37 (3), 841-853, 2019

848
Table 4. Analysis table for the products of AZ2 group
M. Çolak, T. Hatipoğlu, G. Aydın Keskin, A. Fığlalı / Sigma J Eng & Nat Sci 37 (3), 841-853, 2019

849
The explanations of the variables in columns of Table 4 are given as follows:
In column 1, the company product code,
In column 2, standard deviations of the increased customer order quantities in the two weeks prior
to the delivery date,
In column 3, the mean of the increased customer order quantities in the two weeks prior to the
delivery date,
In column 4, the coefficient of variation (mean / standard deviation),
In column 5, 6, 7 and 8, the values calculated in the case of having stocks equal to 0.5-1-1.5 and 2
standard deviations respectively, in order to observe the effects of different scenarios,
In column 9, 10, 11 and 12, the number of annual backorders depending on the scenarios given in
previous columns,
In column 13, the number of positive order quantity change in the last two weeks before delivery
date in customer orders,
In column 14, 15, 16 and 17, backorder rates of different scenarios with stocks equal to 0.5-1-1.5
and 2 standard deviations, respectively,
In column 18, the difference between the backorder rates of 1.5 and 2 standard deviation values
(Because AZ2 group includes inventory items with high coefficient of variation and both the
annual return of the group is high and the variance of the Z2 group customer order quantities in
the last two weeks is high, the standard deviation values are preferred higher. Thus, the customer
service level has been increased),
In column 19 and 20, annual sales quantities and unit prices, respectively,
In column 21, annual additional cost if two standard deviation safety stocks are provided instead
of 1.5 standard deviations,
In column 22, this value represents the rate of additional cost to the number of stock levels that
correspond to 2 standard deviations instead of 1.5 standard deviations in the annual stock,
In column 23, tradeoff coefficient (In the case of a safety stock holding 2 standard deviations
instead of 1.5 standard deviations, for instance; for the C00159 stock code product, the rate of
4.55% backorder profit is equal to 1148.7 Euros obtained by proportioning the stock holding
additional cost for the values corresponding to the same standard deviations to the value of
0.0040, which is the portion in the profit),
In column 24, decisions regarding final safety stock quantities related to products are included.
An overall list of mentioned decisions is given in Table 5 as a set of rules for different stock
classes.
A Safety Stock Model Based on Order Change-to- … / Sigma J Eng & Nat Sci 37 (3), 841-853, 2019

850
Table 5. Rules used to determine safety stock policies for all product groups
M. Çolak, T. Hatipoğlu, G. Aydın Keskin, A. Fığlalı / Sigma J Eng & Nat Sci 37 (3), 841-853, 2019

851
In the ideal situation where customers can plan well and there are not major changes in the
market, it is expected that all inventory items will be placed into AX, BX and CX groups except
some specific cases such as customer emergencies and natural disasters according to monetary
values. However, as seen in Table 3 due to many uncertainties on the part of the customer it
appears that the number of materials in the Y and Z groups is highly above the expected values
related with exceptional cases. This indicates that order planning systems of the customers are not
working conveniently. In order to develop an effective inventory policy, a consensus should be
reached within a certain upper limit of the increase in customer order quantities within the last
two weeks.
When customers' recent order changes tend to increase, excessive safety stock cost and the
risk of backorders occur. On the contrary, if the recent changes tend to decrease, unnecessary
holding cost occurs. If the order change process is applied in stricter rules, safety stocks with
lower standard deviations can be holded and the company will provide significant cost
advantages.
4. CONCLUSIONS AND DISCUSSION
Safety stocks are held to avoid interruption of production and shipment flows that may arise
from uncertainty over the supply chain. It is also known that safety stocks are a significant cost
item in addition to contribution to reducing uncertainty and increasing customer service levels.
Therefore, it is necessary to determine the most appropriate safety stock levels by performing
benefit-cost analysis. When the literature is examined, it is generally considered that the supply
period and the supply amounts of safety stock levels are calculated on the supply side (inbound
logistics); on the shipment side (outbound logistics) it is seen that statistical analysis of the data
belonging to the customer orders is considered. As a result of this analysis, safety stock levels are
calculated depending on the desired customer service level. When the outbound logistics is
considered, safety stocks can respond to changes in customer demands over time with a certain
statistical reliability rate. However the safety stock does not take into account recent revisions of
the quantity to the order delivery of the customer. For this reason, mean and standard deviation
values obtained from the previous order quantities analyzed are higher than the average and
standard deviation values of the company’s response to the order change, so that the safety stock
values calculated according to the literature are higher. In this study, a safety stock determination
methodology is proposed based on mean and standard deviations of quantitative changes made
during the response period, and customer service level for companies that are able to respond
quickly to the revisions of the order quantities, under appropriate production capacity. The
proposed methodology integrates ABC analysis and XYZ analysis and enables to classify
products corresponding to a automotive company according to their monetary values and order
variations. While ABC analysis has been applied to classify products by using monetary values of
them, the products have been grouped via XYZ analysis according to their order variations. The
products of company have been classified as AZ2, AZ1, …, CY, CX through an ABC-XYZ
analysis integrating ABC and XYZ analyses and safety stock decisions have been made for each
product group. In the product-based decision making phase, costs of different safety stock levels
calculated for various standard deviation levels and backorder rates in this case are analyzed and
appropriate safety stock policies are determined. It is possible to say that this is a comprehensive
safety stock analysis because of product-based analyses and it can be generalized to other
companies which have similar demand characteristic with this company. The suggested safety
stock methodology provides to increase customer service level and to decrease inventory costs.
As a future study, it can be said that customer behavior analysis can be made based on products.
The results can be achieved in the context of customer relationship management so that
relationships with customers can be maintained in a particular discipline.
A Safety Stock Model Based on Order Change-to- … / Sigma J Eng & Nat Sci 37 (3), 841-853, 2019

852
REFERENCES
[1] Wild T. (2017). Best Practice in Inventory Management, 3rd ed., Routledge, Taylor and
Francis Group, London and New York.
[2] Jayant A., Wadhwa S., Gupta P., Garg S. K. (2012). Simulation Modelling of Outbound
Logistics of Supply Chain: A Case Study of Telecom Company, International Journal of
Industrial Engineering: Theory, Applications and Practice 19(2), 90-100.
[3] Finke G. R., Singh M., Schönsleben P. (2012). Production Lead Time Variability
Simulation Insights from a Case study, International Journal of Industrial Engineering:
Theory, Applications and Practice 19(5), 213-220.
[4] Singh S., McAllister C. D., Rinks D., Jiang X. (2010). Implication of risk adjusted
discount rates on cycle stock and safety stock in a multi-period inventory model,
International Journal of Production Economics 123, 187-195.
[5] Osman H., Demirli K. (2012). Integrated safety stock optimization for multiple sourced
stockpoints facing variable demand and lead time, International Journal of Production
Economics 135, 299-307.
[6] Hua N. G., Willems S. P. (2016). Analytical insights into two-stage serial line supply
chain safety stock, International Journal of Production Economics 181(A), 107-112.
[7] Bose D. C. (2006). Inventory Management, PHI Learning Pvt. Ltd., New Delhi.
[8] Cannella S., Ashayeri J., Miranda P. A., Bruccoleri M. (2014). Current economic
downturn and supply chain: the significance of demand and inventory smoothing,
International Journal of Computer Integrated Manufacturing 27(3), 201-212.
[9] Desmet B., Aghezzaf EH., Vanmaele H. (2010). Safety stock optimisation in two-echelon
assembly systems: normal approximation models, International Journal of Production
Research 48(19), 5767-5781.
[10] Zhou C., Viswanathan S. (2011). Comparison of a new bootstrapping method with
parametric approaches for safety stock determination in service parts inventory systems,
International Journal of Production Economics 133, 481-48.
[11] Li Y., Xu X., Ye F. (2011). Supply chain coordination model with controllable lead time
and service level constraint, Computers & Industrial Engineering 61, 858-864.
[12] Jodlbauer H., Reitner S. (2012). Optimizing service-level and relevant cost for a
stochastic multi-item cyclic production system, International Journal of Production
Economics 136, 306-317.
[13] Jeong IJ., Leon V. J. (2012). A serial supply chain of newsvendor problem with safety
stocks under complete and partial information sharing, International Journal of
Production Economics 135, 412-419.
[14] Beutel AL., Minner S. (2012). Safety stock planning under causal demand forecasting,
International Journal of Production Economics 140, 637-645.
[15] Li H., Jiang D. (2012). New model and heuristics for safety stock placement in general
acyclic supply chain networks, Computers & Operations Research 39, 1333-1344.
[16] Chakraborty T., Giri B. C. (2012). Joint determination of optimal safety stocks and
production policy for an imperfect production system, Applied Mathematical Modelling
36, 712-722.
[17] Van Donselaar K. H., Broekmeulen R.A.C.M. (2013). Determination of safety stocks in a
lost sales inventory system with periodic review, positive lead-time, lot-sizing and a target
fill rate, International Journal of Production Economics 143, 440-448.
[18] Inderfurth K., Vogelgesang S. (2013). Concepts for safety stock determination under
stochastic demand and different types of random production yield, European Journal of
Operational Research 224, 293-301.
M. Çolak, T. Hatipoğlu, G. Aydın Keskin, A. Fığlalı / Sigma J Eng & Nat Sci 37 (3), 841-853, 2019
853
[19] Moncayo-Martinez L.A., Zhang D. Z. (2013). Optimising safety stock placement and lead
time in an assembly supply chain using bi-objective MAX–MIN ant system, International
Journal of Production Economics 145, 18-28.
[20] Braglia M., Castellano D., Frosolini M. (2014). Safety stock management in single
vendor–single buyer problem under VMI with consignment stock agreement,
International Journal of Production Economics 154, 16-31.
[21] Tempelmeier H. Bantel O. (2015). Integrated optimization of safety stock and
transportation capacity, European Journal of Operational Research 247, 101-112.
[22] Paul S. K., Rahman S. (2017). A quantitative and simulation model for managing sudden
supply delay with fuzzy demand and safety stock, International Journal of Production
Research 56(13), 4377-4395.
[23] Woerner S., Laumanns M., Wagner S. M. (2017). Joint optimisation of capacity and
safety stock allocation, International Journal of Production Research 56(13), 4612-4628.
[24] Saad S. M., Perez C. D. M., Alvarado V. E. V. (2017). Development of a mechanism to
facilitate the safety stock planning configuration in ERP, Production & Manufacturing
Research 5(1), 42-56.
[25] Korponai J., Toth A. B., Illes B. (2017). Effect of the Safety Stock on the Probability of
Occurrence of the Stock Shortage, Procedia Engineering 182, 335-341.
[26] Li Z., Fu Q. (2017). Robust inventory management with stock-out substitution,
International Journal of Production Economics 193, 813-826.
[27] Lu H., Wang H., Xie Y., Wang, X. (2018). Study on construction material allocation
policies: A simulation optimization method, Automation in Construction 90, 201-212.
[28] Darom N. A., Hishamuddin H., Ramli R., Nopiah, Z. M. (2018). An inventory model of
supply chain disruption recovery with safety stock and carbon emission consideration,
Journal of Cleaner Production 197, 1011-1021.
[29] Kumar K., Aouam T. (2018). Integrated lot sizing and safety stock placement in a
network of production facilities, International Journal of Production Economics 195, 74-
95.
[30] Trapero J. R., Cardos M. and Kourentzes N. (2019). Quantile forecast optimal
combination to enhance safety stock estimation, International Journal of Forecasting 35,
239-250.
[31] Puga M. S., Minner S., Tancrez JS. (2019). Two-stage supply chain design with safety
stock placement decisions, International Journal of Production Economics 209, 183-193.
[32] Trapero J. R., Cardos M., Kourentzes N. (2019). Empirical safety stock estimation based
on kernel and GARCH models, OMEGA 84, 199-211.
A Safety Stock Model Based on Order Change-to- … / Sigma J Eng & Nat Sci 37 (3), 841-853, 2019