Rice Molecular Breeding Laboratories in the Genomics Era: Current Status and Future Considerations
Upload
khangminh22Category
view
2download
0
H. ten Have
Research and breeding for mechanical culture of rice in Surinam
1967 Centre for Agricultural Publications and Documentation
Wageningen

The author was awarded the degree of Doctor of Agricultural Sciences, State Agricultural University, Wageningen, the Netherlands, on a thesis with the same title and contents.
© Centre for Agricultural Publications and Documentation, Wageningen 1967.
No part of this book may be reproduced and/or published in any form, by print, photoprint, microfilm or by any other means, without written permission from the publisher.

Acknowledgments
I wish to express my sincere gratitude to the Board of Directors of the Foundation
for the Development of Mechanized Agriculture in Surinam for providing me with
all facilities needed in preparing this book. Many thanks are also due to some of the
staff of Pudoc for helping me with the final version of the manuscript.
The line drawings were made by Mr. BOEKELMAN. Most of the photographs in this
book were taken by Mr. ZWAAN, Mr. VAN DER HORST and Mr. MEINEMA, to whom I
am very much indebted. Finally I would like to thank all persons who helped me to
obtain the data and to present the results.
The author
Contents
APOLOGIA 7
1 INTRODUCTION 9
1.1 The development of rice cultivation in Surinam 9 1.2 The establishments engaged in the research 13
1.2.1 The Prince Bernhard Polder 13 1.2.2 The Wageningen Project 14 1.2.3 The Agricultural Experiment Station 15
1.3 The Agricultural Research Department of the S.M.L. 15 1.3.1 Introduction 15 1.3.2 Buildings, equipment and experimental fields 16 1.3.3 Personnel 17 1.3.4 The cost of research and breeding 17
1.4 Soil, climate, varieties and methods of cultivation 18
Part I Cultural practices 23
2 SURFACE AND UNDERGROUND DRAINAGE 25
2.1 The importance of level fields and good drainage 25 2.2 Levelling 25 2.3 Drainage 27
3 TILLAGE AND SEEDBED PREPARATION 31
3.1 Introduction 31 3.2 Dry tillage 31
3.2.1 Purpose 31 3.2.2 Variables in tillage 32 3.2.3 Implements 35 3.2.4 Operations after the harvest of a main crop 36 3.2.5 Operations after the harvest of an off-season crop 38
3.3 Wet tillage 39 3.3.1 General remarks 39 3.3.2 Adverse effects of puddling 39 3.3.3 Implements 40 3.3.4 The practice of wet tillage 45
3.4 Seedbed preparation 46 3.4.1 The seedbed 46 3.4.2 Preparation following dry cultivation 46 3.4.3 Preparation in wet weather 48
3.5 The application of flood fallowing 52 3.5.1 Introduction 52 3.5.2 Flood fallowing during an off-season 52 3.5.3 Flood fallowing during a main season 53
3.6 Summary 54
4 SOWING 55
4.1 Introduction 55 4.2 Important factors in sowing 55
4.2.1 Quality of the seed 55 4.2.2 Quality of the water 56 4.2.3 Properties of the seedbed 57 4.2.4 Weather conditions 57
4.3 Sowing practices 60 4.3.1 Broadcasting in water 60 4.3.2 Broadcasting on mud 61 4.3.3 Final remarks 62
5 THE OPTIMUM SEED RATE 63
5.1 Introduction 63 5.2 The optimum seed rate in field trials 63
5.2.1 Material and methods 63 5.2.2 Discussion of the results 64
5.3 The optimum seed rate for commercial fields 71 5.3.1 Results of experiments 71 5.3.2 Assessing the amount of seed required per hectare 72
5.4 Effect of seed and nitrogen rates on some plant characteristics 73 5.4.1 Material and methods 73 5.4.2 Effective tillering 74 5.4.3 Panicle weight 76 5.4.4 Panicle length 78 5.4.5 Spikelets per panicle 79 5.4.6 Thousand-grain weight 80 5.4.7 Plant height 81 5.4.8 Straw yield 82 5.4.9 Grain-to-straw ratio 83 5.4.10 Optimum number of productive panicles per square metre 84
5.5 Summary 86
6 WATERMANAGEMENT 88
6.1 Introduction 88 6.2 Water management during the early weeks after sowing 88 6.3 Water level in relation to the growth of weeds 90 6.4 Influence of depth of submergence on some characteristics of the crop 91 6.5 Effects of water replacement and drainage periods 92
6.5.1 Water replacement 92 6.5.2 Drainage periods 93
6.6 Draining the fields before harvest 96 6.7 Summary 97
7 WEED CONTROL 99
7.1 Introduction 99 7.2 Weed control by cultural methods, crop management and varietal choice 99 7.3 The control of aquatic weeds 101 7.4 Chemical control of grasses 102 7.5 Chemical control of Cyperaceae and broad-leaved weeds 106 7.6 The control of volunteer and red rice 110 7.7 Summary 112
8 FERTILIZERS 114
8.1 Introduction 114 8.2 Material and methods 114 8.3 Withdrawal of nutrients from the soil 115 8.4 Application of nitrogen 116
8.4.1 Sources of nitrogen 116 8.4.2 Basic dressing or top dressing 118 8.4.3 Broadcasting fertilizers in a drained field or in water 118 8.4.4 Duration of the drainage period 120 8.4.5 Optimum times for top dressing 121 8.4.6 Effect of nitrogen on grain yield of different varieties 123 8.4.7 Spraying with urea 128 8.4.8 Effect of nitrogen on some characteristics of SML varieties 132 8.4.9 Differences between indica types and SML varieties in nitrogen
response 136 8.5 Application of other elements 139
8.5.1 Application of phosphate 139 8.5.2 Application of potash and lime 142
8.6 Summary 145
9 CONTROL OF DISEASES AND PESTS 148
9.1 Control of diseases 148 9.1.1 Physiological diseases 148
9.1.2 Fungus diseases 150 9.1.3 Virus diseases 154
9.2 Control of pests 154 9.2.1 General introduction 154 9.2.2 Insect pests 156 9.2.3 Other pests 160
9.3 Summary 162
10 THE CROPPING SYSTEM 164
10.1 Introduction 164 10.2 Date-of-sowing experiments 165
10.2.1 Material and methods 165 10.2.2 Discussion of the results 166
10.3 Rotation trials 173 10.3.1 Material and methods 173 10.3.2 Yield results 174 10.3.3 Chemical soil analysis 178
10.4 The cropping systems at Wageningen and in the Prince Bernhard Polder 181 10.4.1 Analysis of yields of commercial fields 182 10.4.2 Discussion of some cropping systems 187 10.4.3 Final remarks 192
10.5 Summary 193
Part II Quality of the grain and improvement of the crop by breeding 195
11 EFFECT OF HARVESTING DATE ON SOME CHARACTERISTICS OF THE GRAIN 197
11.1 Material and methods 197 11.2 Moisture content 198 11.3 Recovery of white rice 201 11.4 Amount of breakage 203
11.4.1 General discussion 203 11.4.2 Results of experiments 207 11.4.3 Final considerations on causes of breakage 213
11.5 Amount of cracked grain 214 11.5.1 Review of literature 214 11.5.2 Results of experiments 216
11.6 Relation between cracking in paddy and breakage in milled rice 219 11.6.1 Remarks on amount of cracked grain 219 11.6.2 Remarks on amount of breakage 222 11.6.3 Experimental results 224
11.7 Optimum date of harvesting 227 11.8 Summary 230
RESEARCH INTO SOME QUALITY CHARACTERISTICS OF THE GRAIN 232
12.1 Introduction 232 12.2 Grain dimensions and 1000-grain weight 232 12.3 Dormancy periods of different varieties 234
12.3.1 Introduction 234 12.3.2 Experimental results 236
12.4 Physicochemical characteristics of rice 239 12.4.1 Introduction 239 12.4.2 Analysis figures from Beaumont and Detmold 240 12.4.3 Water-uptake capacity of rice in cooking 243
12.5 Quality analyses of the grain harvested in the Wageningen Polder during 1956 to 1963 245
12.6 Summary 249
BREEDING 251
13.1 Introduction 251 13.2 Breeding objectives 252
13.2.1 Mechanical culture 253 13.2.2 Culture by smallholders in Nickerie 261
13.3 Basic stock 262 13.3.1 Stock in 1951 262 13.3.2 Later imports 263
13.4 Crossing technique and raising F, plants 264 13.4.1 Emasculation and pollination 264 13.4.2 Percentageseed setting 267 13.4.3 Raising Fx plants 268
13.5 Selection in later generations 268 13.5.1 General review up to 1963 268 13.5.2 Discussion of selection systems 270 13.5.3 Selection in hybrid populations 274 13.5.4 Selection in lines 276 13.5.5 Use of backcrosses 283 13.5.6 Artificial mutations 285
13.6 Varietal testing 289 13.7 Maintenance of varieties and production of seed rice 289 13.8 Summary 292
REFERENCES 294
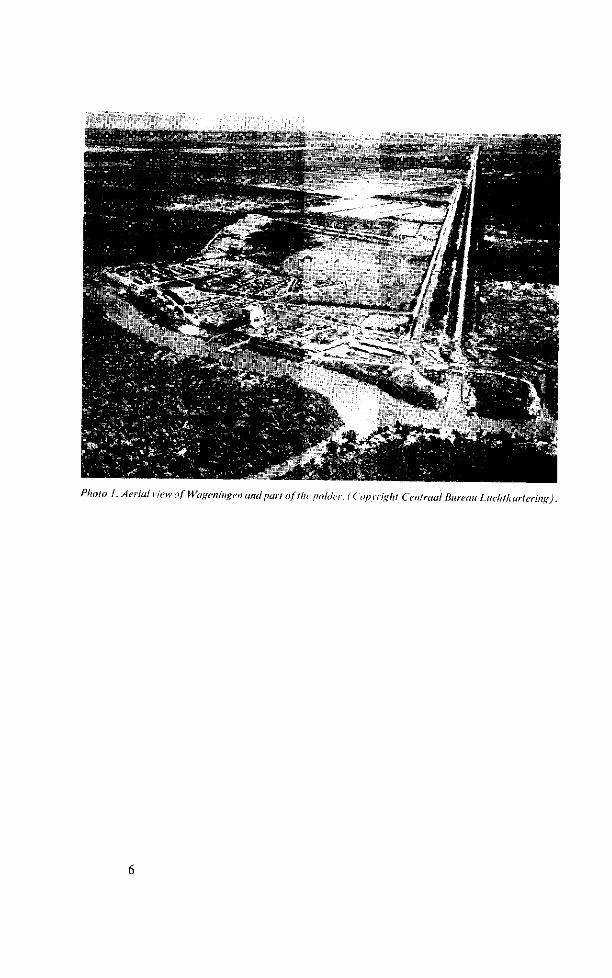
Photo 1. Aerial view of Wageningen and part of the polder. (Copyright Centraal Bureau Luehtkartering).
Apologia
The circumstances which led to the setting up of the Wageningen Project, and the methods of land reclamation and the mechanization of rice production, have been amply discussed in DE WIT'S thesis (1960). Except for certain parts that book devotes less attention to cultural practices. These subjects fell outside the main scope of that work while the methods of rice cultivation were still not sufficiently crystallized. At that time the Wageningen Project was still grappling with various problems inherent in the large scale of operations and with a method of reclamation that has since proved to be not the best owing to a still limited knowledge of soil conditions.
When the present writer left his post with the Agricultural Research Department in December 1963, the Board of the Foundation for the Development of Mechanized Agriculture in Surinam (abbreviated S.M.L.) considered that the time had come to record the results of investigations into cultural methods and grain quality, as well as the results of breeding work. Since this record was intended also as a doctoral thesis, a compromise was needed on various points of the subject matter and of the presentation of the outcome of the studies and experience gained.
The bulk of the contents of the present book concern the author's own work, while for other subjects the situation around 1965 has been described. Matters clearly outside the author's own scope, such as reclamation, mechanization and soil research, and those in which research is still in its infancy, such as water requirement and salinity, have been left out of discussion. Although the writer has endeavoured to give this book an independent character, the more interested reader is advised also to peruse DE WIT'S thesis.
In view of the task of the Agricultural Research Department of the S.M.L. and the situation with which it was faced, it is understandable that research and breeding were an first of a practical nature and that not until later were certain aspects tackled more fundamentally. Research on tillage lay outside the direct sphere of activity of this E'epartment; during the first few years it was concerned mainly with the testing of various implements, while afterwards attention was paid more to the soil itself. Within the scope of activities of S.M.L. and the Prince Bernhard Polder, an attempt has been made to delineate the working programme of the Agricultural Research E>epartment. The author considers it a great privilege to have had the chance of surveying the results.
In order to maintain the continuity and extension of research on rice cultivation in Surinam, despite the frequent changes of staff, it is important that the chief results and practical experience should be laid down in this book. For the benefit of other rice-
cultivating areas some aspects and working methods have been described in greater detail than may be strictly necessary. The writer hopes that this description of experiments and of the cultivation of rice on the heavy clays of the young coastal plain of Surinam may help to solve similar problems in other parts of the world.
56 55
ATLANTIC OCEAN
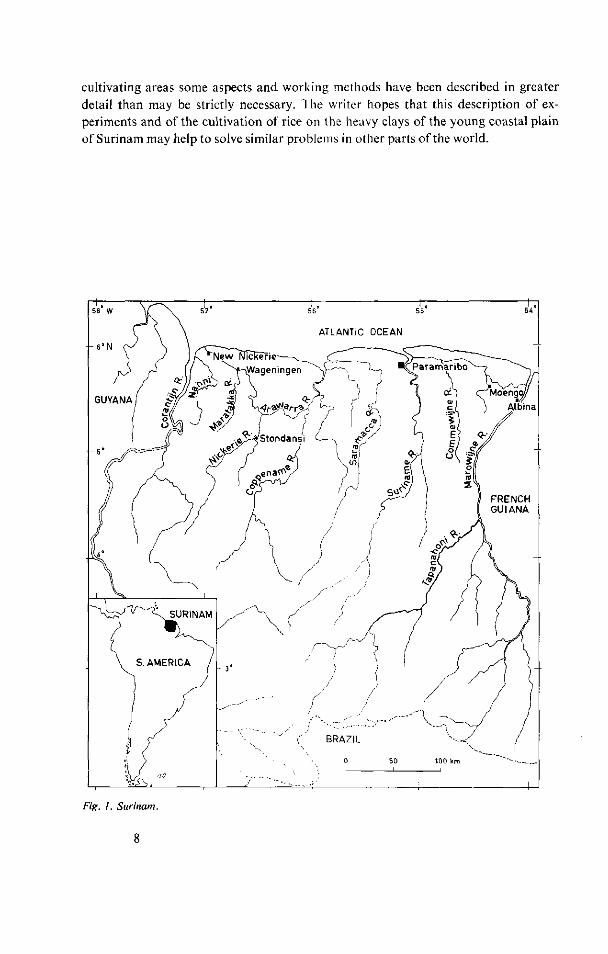
Fig. 1. Surinam.
1 Introduction
1.1 The development of rice cultivation in Surinam
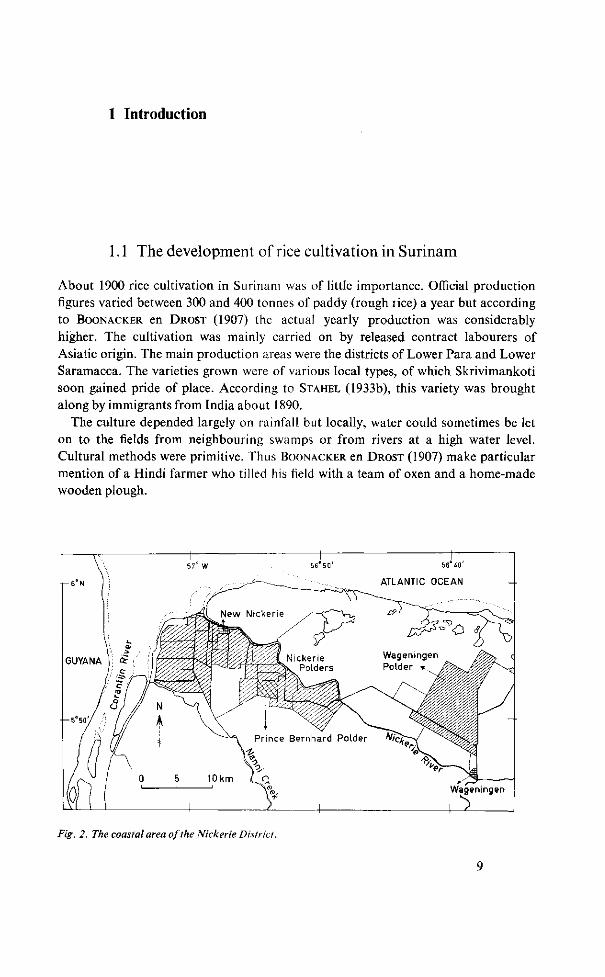
About 1900 rice cultivation in Surinam was of little importance. Official production figures varied between 300 and 400 tonnes of paddy (rough lice) a year but according to BOONACKER en DROST (1907) the actual yearly production was considerably higher. The cultivation was mainly carried on by released contract labourers of Asiatic origin. The main production areas were the districts of Lower Para and Lower Saramacca. The varieties grown were of various local types, of which Skrivimankoti soon gained pride of place. According to STAHEL (1933b), this variety was brought along by immigrants from India about 1890.
The culture depended largely on rainfall but locally, water could sometimes be let on to the fields from neighbouring swamps or from rivers at a high water level. Cultural methods were primitive. Thus BOONACKER en DROST (1907) make particular mention of a Hindi farmer who tilled his field with a team of oxen and a home-made wooden plough.
5S 40
ATLANTIC OCEAN
Fig. 2. The coastal area of the Nicker ie District.
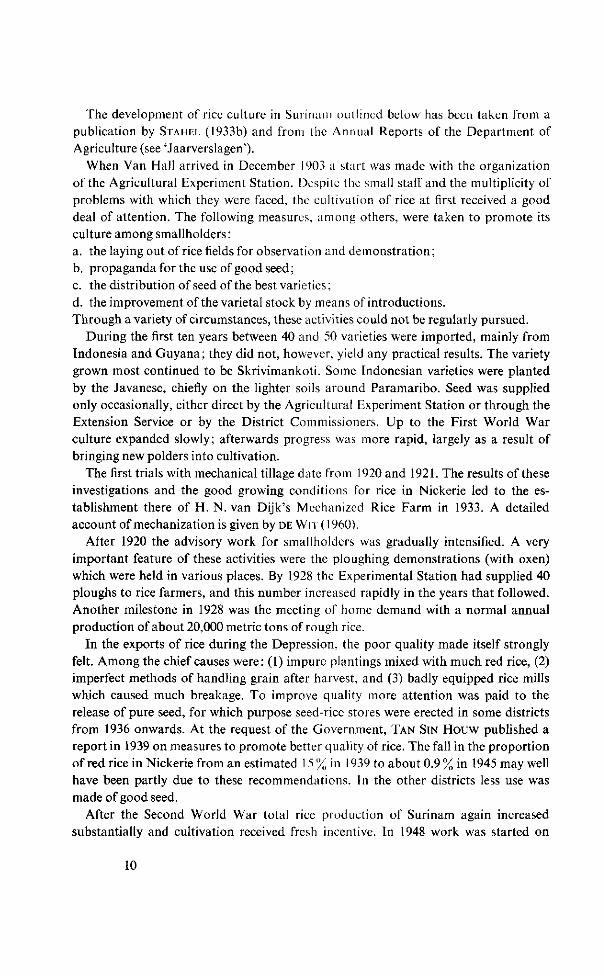
The development of rice culture in Surinam outlined below has been taken from a publication by STAHEL (1933b) and from the Annual Reports of the Department of Agriculture (see 'Jaarverslagen').
When Van Hall arrived in December 1903 a start was made with the organization of the Agricultural Experiment Station. Despite the small staff and the multiplicity of problems with which they were faced, the cultivation of rice at first received a good deal of attention. The following measures, among others, were taken to promote its culture among smallholders : a. the laying out of rice fields for observation and demonstration; b. propaganda for the use of good seed ; c. the distribution of seed of the best varieties ; d. the improvement of the varietal stock by means of introductions. Through a variety of circumstances, these activities could not be regularly pursued.
During the first ten years between 40 and 50 varieties were imported, mainly from Indonesia and Guyana; they did not, however, yield any practical results. The variety grown most continued to be Skrivimankoti. Some Indonesian varieties were planted by the Javanese, chiefly on the lighter soils around Paramaribo. Seed was supplied only occasionally, either direct by the Agricultural Experiment Station or through the Extension Service or by the District Commissioners. Up to the First World War culture expanded slowly; afterwards progress was more rapid, largely as a result of bringing new polders into cultivation.
The first trials with mechanical tillage date from 1920 and 1921. The results of these investigations and the good growing conditions for rice in Nickerie led to the establishment there of H. N. van Dijk's Mechanized Rice Farm in 1933. A detailed account of mechanization is given by DE WIT ( 1960).
After 1920 the advisory work for smallholders was gradually intensified. A very important feature of these activities were the ploughing demonstrations (with oxen) which were held in various places. By 1928 the Experimental Station had supplied 40 ploughs to rice farmers, and this number increased rapidly in the years that followed. Another milestone in 1928 was the meeting of home demand with a normal annual production of about 20,000 metric tons of rough rice.
In the exports of rice during the Depression, the poor quality made itself strongly felt. Among the chief causes were: (1) impure plantings mixed with much red rice, (2) imperfect methods of handling grain after harvest, and (3) badly equipped rice mills which caused much breakage. To improve quality more attention was paid to the release of pure seed, for which purpose seed-rice stores were erected in some districts from 1936 onwards. At the request of the Government, TAN SIN HOUW published a report in 1939 on measures to promote better quality of rice. The fall in the proportion of red rice in Nickerie from an estimated 15% in 1939 to about 0.9% in 1945 may well have been partly due to these recommendations. In the other districts less use was made of good seed.
After the Second World War total rice production of Surinam again increased substantially and cultivation received fresh incentive. In 1948 work was started on
10
Product ion in 1000 metr ic tons
90
70
50
30
10
1950
Surinam
Wageningen and Prince Bernhard polders
1955 1960 1965
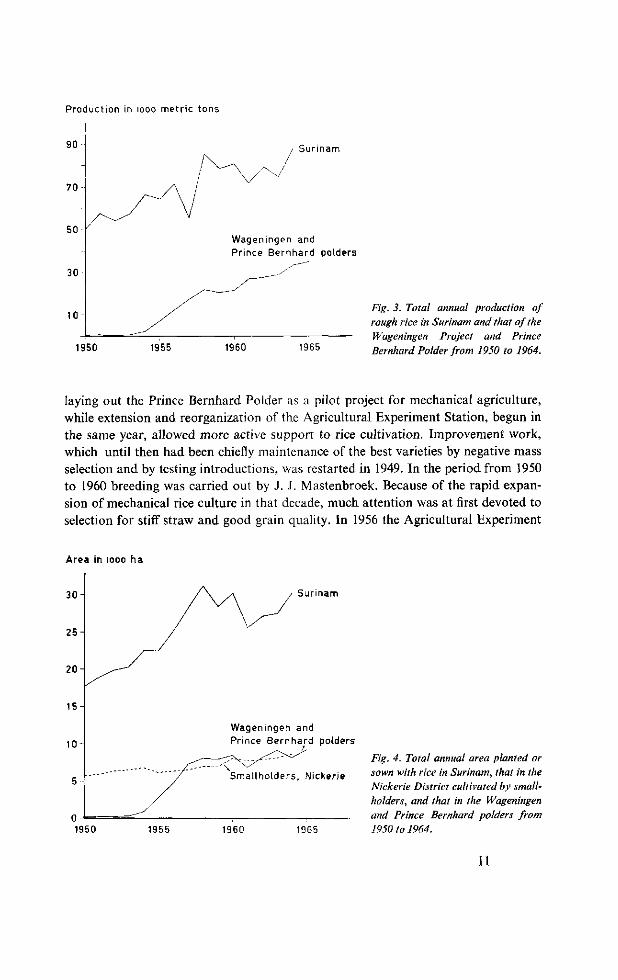
Fig. 3. Total annual production of rough rice in Surinam and that of the Wageningen Project and Prince Bernhard Polder from 1950 to 1964.
laying out the Prince Bernhard Polder as a pilot project for mechanical agriculture, while extension and reorganization of the Agricultural Experiment Station, begun in the same year, allowed more active support to rice cultivation. Improvement work, which until then had been chiefly maintenance of the best varieties by negative mass selection and by testing introductions, was restarted in 1949. In the period from 1950 to 1960 breeding was carried out by J. .1. Mastenbroek. Because of the rapid expansion of mechanical rice culture in that decade, much attention was at first devoted to selection for stiff straw and good grain quality. In 1956 the Agricultural Experiment
Area in looo ha
30
25
20
15
10
Surinam
Wageningen and Prince Bernhard polders
Smal lho lders , Nickerie
1950 1955 1960 1965
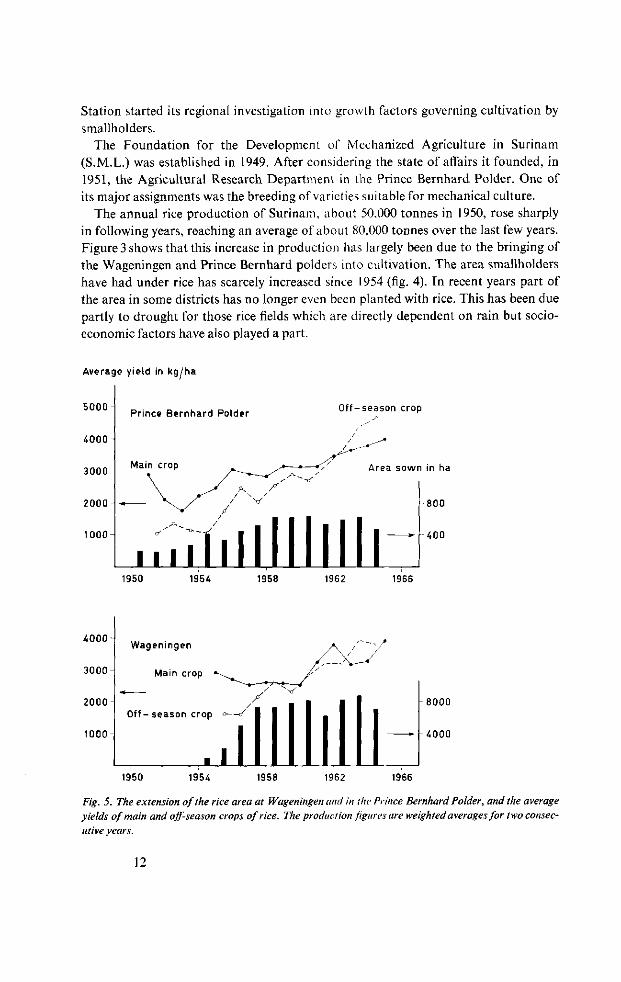
Fig. 4. Total annual area planted or sown with rice in Surinam, that in the Nickerie District cultivated by smallholders, and that in the Wageningen and Prince Bernhard polders from 1950 to 1964.
11
Station started its regional investigation into growth factors governing cultivation by smallholders.
The Foundation for the Development of Mechanized Agriculture in Surinam (S.M.L.) was established in 1949. After considering the state of affairs it founded, in 1951, the Agricultural Research Department in the Prince Bernhard Polder. One of its major assignments was the breeding of varieties suitable for mechanical culture.
The annual rice production of Surinam, about 50,000 tonnes in 1950, rose sharply in following years, reaching an average of about 80,000 tonnes over the last few years. Figure 3 shows that this increase in production has largely been due to the bringing of the Wageningen and Prince Bernhard polders into cultivation. The area smallholders have had under rice has scarcely increased since 1954 (fig. 4). In recent years part of the area in some districts has no longer even been planted with rice. This has been due partly to drought for those rice fields which are directly dependent on rain but socioeconomic factors have also played a part.
Average yield in kg/ha
5000 O f f -season crop
Area sown in ha
800
400
1950 1954 1958 1962 1966
4 0 0 0 -
3 0 0 0 -
2000 -
1000
Wageningen
Main crop «
O f f - season crop
•
/
.1
/ - • - -
/* x v
1 * •
1950 1954 1958 1962
- 8 0 0 0
- 4 0 0 0
1966
Fig. 5. The extension of the rice area at Wageningen and in the Prince Bernhard Polder, and the average yields of main and off-season crops of rice. The production figures are weighted averages for two consecutive years.
12
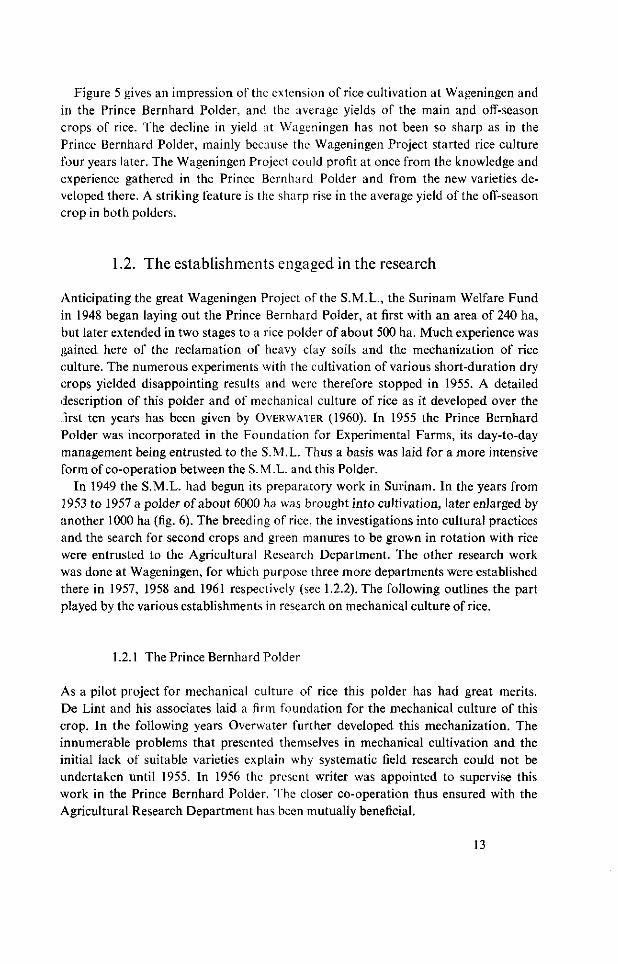
Figure 5 gives an impression of the extension of rice cultivation at Wageningen and in the Prince Bernhard Polder, and the average yields of the main and off-season crops of rice. The decline in yield at Wageningen has not been so sharp as in the Prince Bernhard Polder, mainly because the Wageningen Project started rice culture four years later. The Wageningen Project could profit at once from the knowledge and experience gathered in the Prince Bernhard Polder and from the new varieties developed there. A striking feature is the sharp rise in the average yield of the off-season crop in both polders.
1.2. The establishments engaged in the research
Anticipating the great Wageningen Project of the S.M.L., the Surinam Welfare Fund in 1948 began laying out the Prince Bernhard Polder, at first with an area of 240 ha, but later extended in two stages to a rice polder of about 500 ha. Much experience was gained here of the reclamation of heavy clay soils and the mechanization of rice culture. The numerous experiments with the cultivation of various short-duration dry crops yielded disappointing results and were therefore stopped in 1955. A detailed description of this polder and of mechanical culture of rice as it developed over the first ten years has been given by O VERWATER (1960). In 1955 the Prince Bernhard Polder was incorporated in the Foundation for Experimental Farms, its day-to-day management being entrusted to the S.M.L. Thus a basis was laid for a more intensive form of co-operation between the S.M.L. and this Polder.
In 1949 the S.M.L. had begun its preparatory work in Surinam. In the years from 1953 to 1957 a polder of about 6000 ha was brought into cultivation, later enlarged by another 1000 ha (fig. 6). The breeding of rice, the investigations into cultural practices and the search for second crops and green manures to be grown in rotation with rice were entrusted to the Agricultural Research Department. The other research work was done at Wageningen, for which purpose three more departments were established there in 1957, 1958 and 1961 respectively (see 1.2.2). The following outlines the part played by the various establishments in research on mechanical culture of rice.
1.2.1 The Prince Bernhard Polder
As a pilot project for mechanical culture of rice this polder has had great merits. De Lint and his associates laid a firm foundation for the mechanical culture of this crop. In the following years Overwater further developed this mechanization. The innumerable problems that presented themselves in mechanical cultivation and the initial lack of suitable varieties explain why systematic field research could not be undertaken until 1955. In 1956 the present writer was appointed to supervise this work in the Prince Bernhard Polder. The closer co-operation thus ensured with the Agricultural Research Department has been mutually beneficial.
13
Paranuß0
Polder for me r ice farms
V
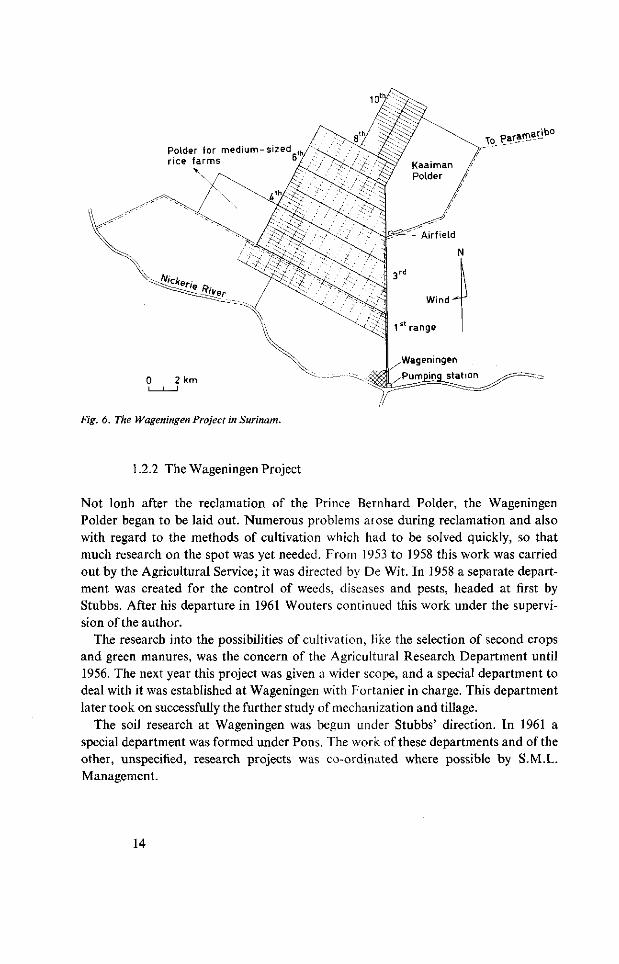
Fig. 6. The Wageningen Project in Surinam.
1.2.2 The Wageningen Project
Not lonh after the reclamation of the Prince Bernhard Polder, the Wageningen Polder began to be laid out. Numerous problems arose during reclamation and also with regard to the methods of cultivation which had to be solved quickly, so that much research on the spot was yet needed. From 1953 to 1958 this work was carried out by the Agricultural Service; it was directed by De Wit. In 1958 a separate department was created for the control of weeds, diseases and pests, headed at first by Stubbs. After his departure in 1961 Wouters continued this work under the supervision of the author.
The research into the possibilities of cultivation, like the selection of second crops and green manures, was the concern of the Agricultural Research Department until 1956. The next year this project was given a wider scope, and a special department to deal with it was established at Wageningen with Fortanier in charge. This department later took on successfully the further study of mechanization and tillage.
The soil research at Wageningen was begun under Stubbs' direction. In 1961 a special department was formed under Pons. The work of these departments and of the other, unspecified, research projects was co-ordinated where possible by S.M.L. Management.
14
1.2.3 The Agricultural Experiment Station
In the development of mechanized culture of rice the Agricultural Experiment Station at Paramaribo was rather indirectly involved. S.M.L. employed a limited staff of research workers and over the yaers they frequently had to ask the Agricultural Experiment Station to find solutions to particular problems. The pedological recommendations, the chemical analyses of soil and water, the investigations into means of controlling various pests, and the rice improvement work have been important for mechanical rice cultivation. It was at this Station that Mastenbroek developed the Dima variety which for about six years held a prominent place among the varieties sown at Wageningen and in the Prince Bernhard Polder.
1.3. The Agricultural Research Department of the S.M.L.
1.3.1 Introduction
When the Agricultural Research Department started its operations in 1951, its task was extensive. Little was known about mechanical cultivation of rice in Surinam. Admittedly, mechanical culture had long been practised in the Southern States of North America, but circumstances there differed so much from those in Surinam that the cultural practices developed there could not be directly applied to Surinam. The local varieties were not suitable for combine harvesting, so that it was found necessary
i M, - si '*'-jfK'M&. " «. !~ •»••
A, i * • - ' . * * - * . '•iiTT'J",s»>""'««Hl * * * I B * r * i< «t. •
:«-r5
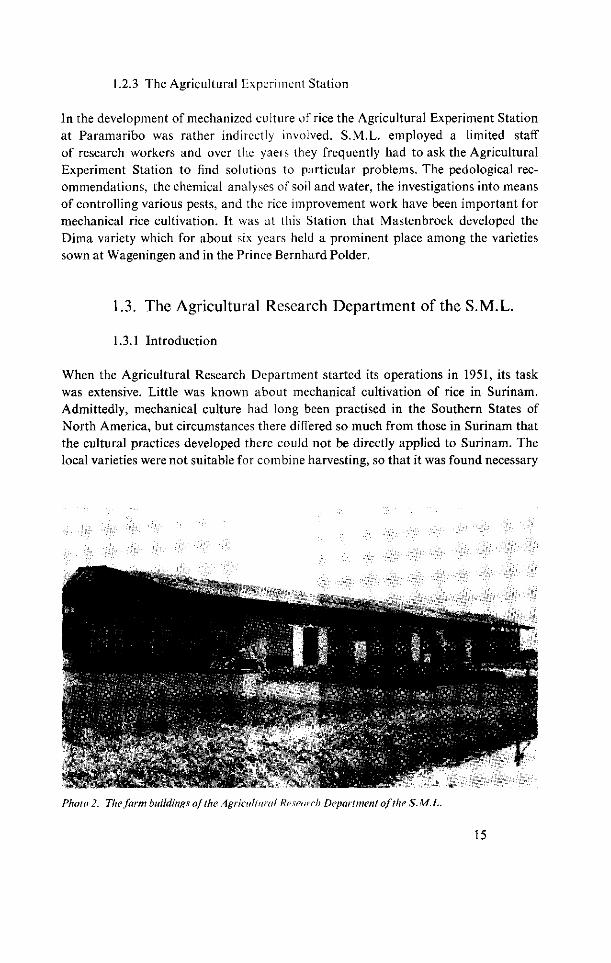
'\x "x&s*^ Photo 2. The farm buildings of the Agricultural Research Department of the S.M.L.
15
to import strong-strawed varieties and to start breeding new types better suited to the local conditions.
Three periods can be distinguished in the Department's work. During the first period (1951-1956) the work was directed towards the development of suitable rice varieties and methods of culture and selection of short-duration dry crops and green manures. On a limited scale studies were made of the best methods of culturing and tending rice. This latter work chiefly took place in the Prince Bernhard Polder.
During the second period (1956-1959) the breeding work was greatly extended, while much systematic field research was carried out in co-operation with the Prince Bernhard Polder. The work on second crops and green manures, except for that on Crotalaria quinquefolia L., was discontinued. In this period some aspects of the research programme were completed and these provisional results were published in De Surinaamse Landbouw.
During the third period (1960-1963) breeding activities were undertaken on a large scale with attention partly to the needs also of the smallholders. Work on grain quality forged ahead in those years. With the help of the Agricultural Service and the other research departments of the S.M.L., the major problems regarding the growth and culture of rice reached satisfactory conclusions. Chapters 2 to 13 draw together these results.
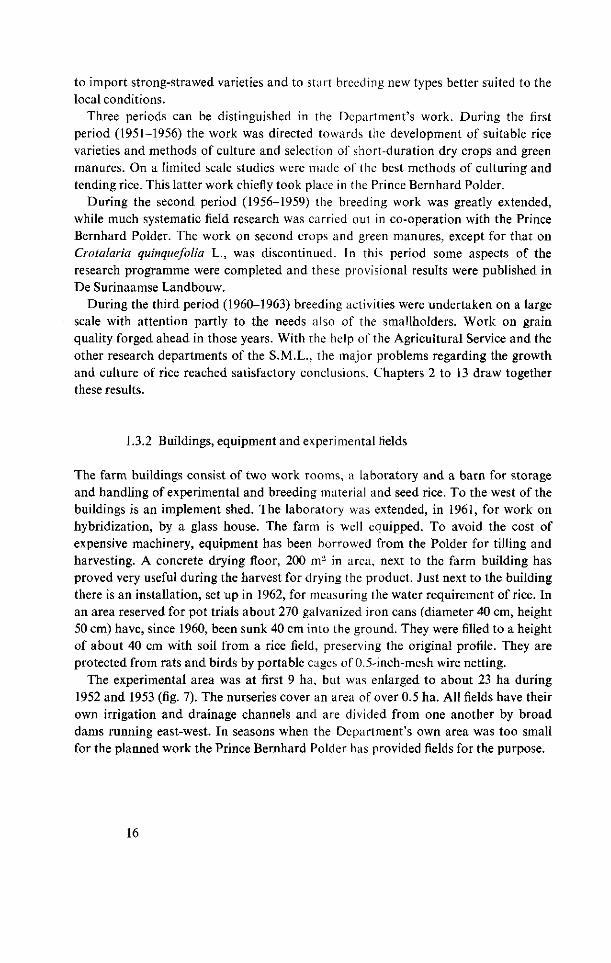
1.3.2 Buildings, equipment and experimental fields
The farm buildings consist of two work rooms, a laboratory and a barn for storage and handling of experimental and breeding material and seed rice. To the west of the buildings is an implement shed. The laboratory was extended, in 1961, for work on hybridization, by a glass house. The farm is well equipped. To avoid the cost of expensive machinery, equipment has been borrowed from the Polder for tilling and harvesting. A concrete drying floor, 200 m2 in area, next to the farm building has proved very useful during the harvest for drying the product. Just next to the building there is an installation, set up in 1962, for measuring the water requirement of rice. In an area reserved for pot trials about 270 galvanized iron cans (diameter 40 cm, height 50 cm) have, since 1960, been sunk 40 cm into the ground. They were filled to a height of about 40 cm with soil from a rice field, preserving the original profile. They are protected from rats and birds by portable cages of 0.5-inch-mesh wire netting.
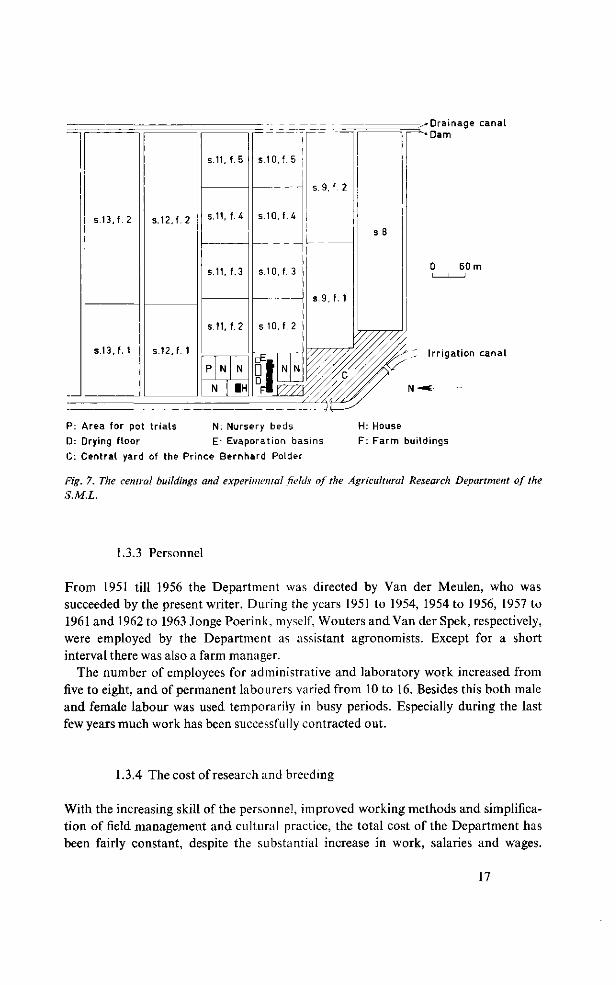
The experimental area was at first 9 ha, but was enlarged to about 23 ha during 1952 and 1953 (fig. 7). The nurseries cover an area of over 0.5 ha. All fields have their own irrigation and drainage channels and are divided from one another by broad dams running east-west. In seasons when the Department's own area was too small for the planned work the Prince Bernhard Polder has provided fields for the purpose.
16
Drainage canal "•Darn
0 60 m i i i
Irrigation canal
P: Area for pot trials N: Nursery beds
D: Drying floor E: Evaporation basins
C: Central yard of the Prince Bernhard Polder
H: House
F: Farm buildings
Fig. 7. The central buildings and experimental fields of the Agricultural Research Department of the
S.M.L.
1.3.3 Personnel
From 1951 till 1956 the Department was directed by Van der Meulen, who was succeeded by the present writer. During the years 1951 to 1954, 1954 to 1956, 1957 to 1961 and 1962 to 1963 Jonge Poerink, myself, Wouters and Van der Spek, respectively, were employed by the Department as assistant agronomists. Except for a short interval there was also a farm manager.
The number of employees for administrative and laboratory work increased from five to eight, and of permanent labourers varied from 10 to 16. Besides this both male and female labour was used temporarily in busy periods. Especially during the last few years much work has been successfully contracted out.
1.3.4 The cost of research and breeding
With the increasing skill of the personnel, improved working methods and simplification of field management and cultural practice, the total cost of the Department has been fairly constant, despite the substantial increase in work, salaries and wages.
17
From 1951 to 1963 the working expenses, including depreciations, totalled about Sf* 70,000 a year. It is not possible to split up this amount into cost of research and cost of breeding, because the two activities were too closely interwoven. The cost of salaries, wages and social provisions amounted to approximately 70% of the total, which demonstrates the labour-intensive character of this enterprise.
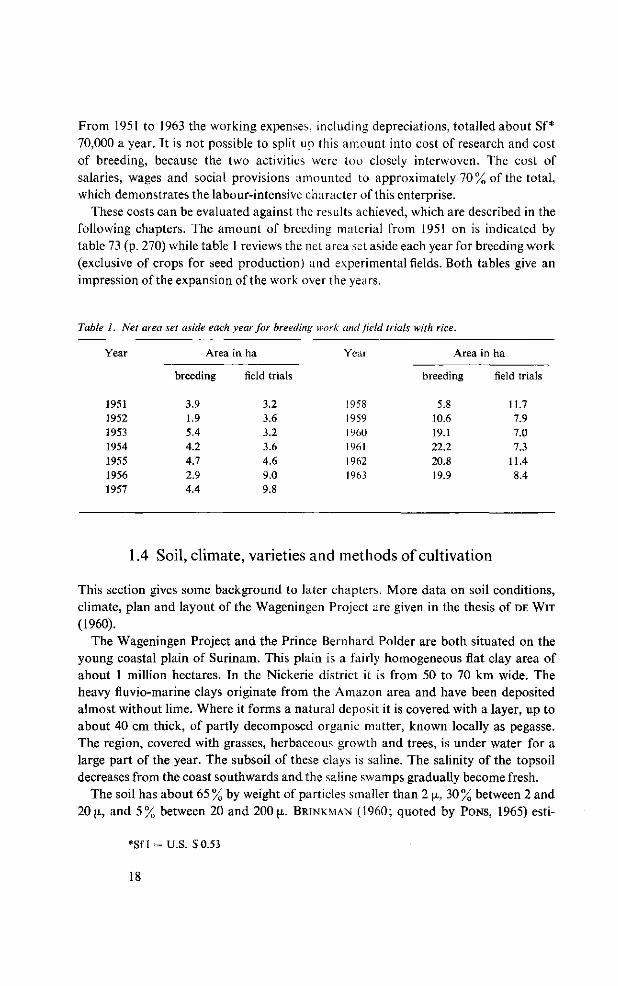
These costs can be evaluated against the results achieved, which are described in the following chapters. The amount of breeding material from 1951 on is indicated by table 73 (p. 270) while table 1 reviews the net area set aside each year for breeding work (exclusive of crops for seed production) and experimental fields. Both tables give an impression of the expansion of the work over the years.
Table I. Net area set aside each year for breeding work and field trials with rice.
Year
1951 1952 1953 1954 1955 1956 1957
Area
breeding
3.9 1.9 5.4 4.2 4.7 2.9 4.4
in ha
field trials
3.2 3.6 3.2 3.6 4.6 9.0 9.8
Year
1958 1959 I960 1961 1962 1963
Area
breeding
5.8 10.6 19.1 22.2 20.8 19.9
in ha
field trials
11.7 7.9 7.0 7.3
11.4 8.4
1.4 Soil, climate, varieties and methods of cultivation
This section gives some background to later chapters. More data on soil conditions, climate, plan and layout of the Wageningen Project are given in the thesis of DE WIT (1960).
The Wageningen Project and the Prince Bernhard Polder are both situated on the young coastal plain of Surinam. This plain is a fairly homogeneous fiat clay area of about 1 million hectares. In the Nickerie district it is from 50 to 70 km wide. The heavy fluvio-marine clays originate from the Amazon area and have been deposited almost without lime. Where it forms a natural deposit it is covered with a layer, up to about 40 cm thick, of partly decomposed organic matter, known locally as pegasse. The region, covered with grasses, herbaceous growth and trees, is under water for a large part of the year. The subsoil of these clays is saline. The salinity of the topsoil decreases from the coast southwards and the saline swamps gradually become fresh.
The soil has about 65 % by weight of particles smaller than 2 \i, 30 % between 2 and 20 [L, and 5% between 20 and 200 \i. BRINKMAN (1960; quoted by PONS, 1965) esti-
*Sfl = U.S. $0.53
18
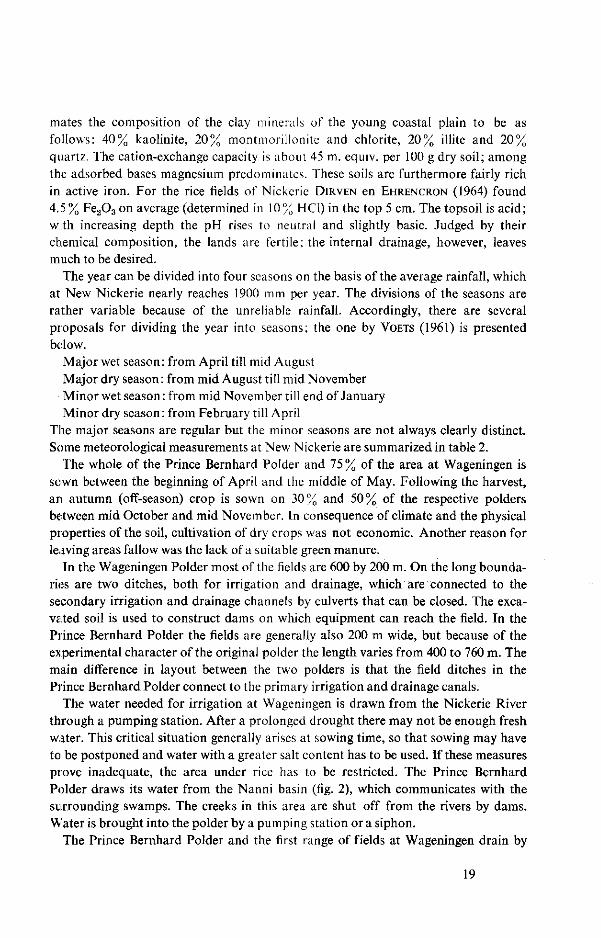
mates the composition of the clay minerals of the young coastal plain to be as follows: 40% kaolinite, 20% montmorillonite and chlorite, 20% illite and 20% quartz. The cation-exchange capacity is about 45 m. equiv. per 100 g dry soil; among the adsorbed bases magnesium predominates. These soils are furthermore fairly rich in active iron. For the rice fields of Nickerie DIRVEN en EHRENCRON (1964) found 4.5 % Fe203 on average (determined in 10% HCl) in the top 5 cm. The topsoil is acid; with increasing depth the pH rises to neutral and slightly basic. Judged by their chemical composition, the lands are fertile; the internal drainage, however, leaves much to be desired.
The year can be divided into four seasons on the basis of the average rainfall, which at New Nickerie nearly reaches 1900 mm per year. The divisions of the seasons are rather variable because of the unreliable rainfall. Accordingly, there are several proposals for dividing the year into seasons; the one by VOETS (1961) is presented below.
Major wet season: from April till mid August Major dry season : from mid August till mid November Minor wet season: from mid November till end of January Minor dry season: from February till April
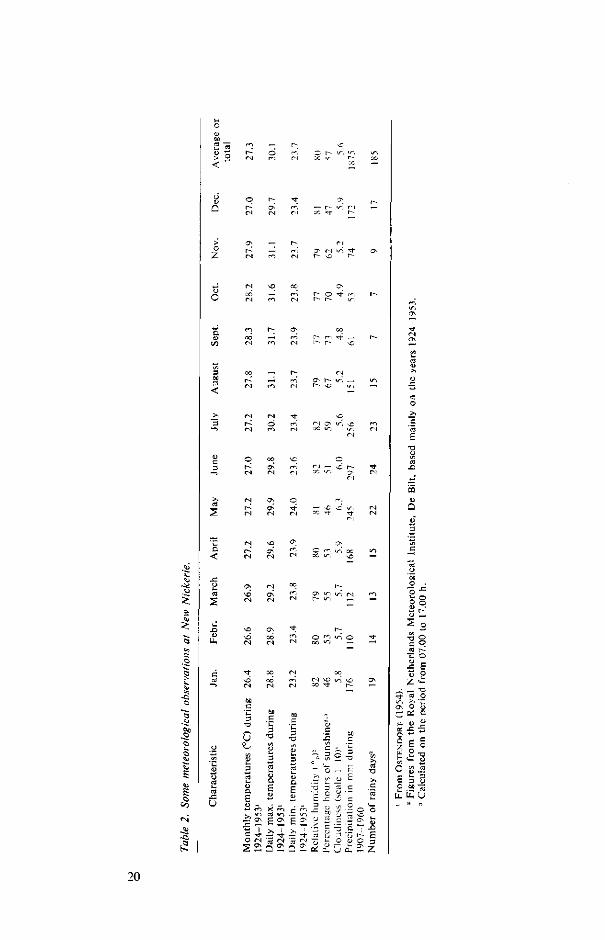
The major seasons are regular but the minor seasons are not always clearly distinct. Some meteorological measurements at New Nickerie are summarized in table 2.
The whole of the Prince Bernhard Polder and 75 % of the area at Wageningen is sown between the beginning of April and the middle of May. Following the harvest, an autumn (off-season) crop is sown on 30% and 50% of the respective polders between mid October and mid November. In consequence of climate and the physical properties of the soil, cultivation of dry crops was not economic. Another reason for leaving areas fallow was the lack of a suitable green manure.
In the Wageningen Polder most of the fields are 600 by 200 m. On the long boundaries are two ditches, both for irrigation and drainage, which are connected to the secondary irrigation and drainage channels by culverts that can be closed. The excavated soil is used to construct dams on which equipment can reach the field. In the Prince Bernhard Polder the fields are generally also 200 m wide, but because of the experimental character of the original polder the length varies from 400 to 760 m. The main difference in layout between the two polders is that the field ditches in the Prince Bernhard Polder connect to the primary irrigation and drainage canals.
The water needed for irrigation at Wageningen is drawn from the Nickerie River through a pumping station. After a prolonged drought there may not be enough fresh water. This critical situation generally arises at sowing time, so that sowing may have to be postponed and water with a greater salt content has to be used. If these measures prove inadequate, the area under rice has to be restricted. The Prince Bernhard Polder draws its water from the Nanni basin (fig. 2), which communicates with the surrounding swamps. The creeks in this area are shut off from the rivers by dams. Water is brought into the polder by a pumping station or a siphon.
The Prince Bernhard Polder and the first range of fields at Wageningen drain by
19
m —.
r- —
O <—, — r- <r, r-l —
r~- O "=*" rn
r- •—' ^ r - ir, —.
M q ir, e
CO
û
O O
<u —
S o
c p ~£ o W r-
S g z <-
• _ -a
~ 3 S = o —-, « 3
'S & B <D
c o
ON
t - i
a B
>< B >> "S
r* i
ON
"7
CC
p. Ë OJ
c
E _ 'M
_ -3" r j
~ £ £ 3
— O
'% o
O a:
3
O
CO
T= D
CJ
__ O
6
.= 3
_o
C
£
,_ O
r3
ü <L>
Di a
z C O
£ <- 2 I O S «
E 3 3 2 -S"« u. u, u
2 û ï c î i £ u £ î z
20

gravity into the Nickerie River. The other area of Wageningen is drained through a pumping station and sluice into the same river (fig. 6).
In both polders the culture of rice has, as far as possible, been mechanized; a clear description was given by JANNASH (1965). In the early years of the Prince Bernhard Polder combine-harvesting was beset by difficulties, because no varieties with stiff straw were available. This obstacle was surmounted with American types. After 1954, these varieties were rapidly replaced by Dima and a few SML varieties. Since 1961 only SML varieties have been in use in mechanical farming. The newly developed types generally have a high yield, stiff straw, long, slender grains, a favourable response to nitrogen and a low photoperiodic sensitivity. The average duration of growth (from sowing to harvest) is 144 days in the main season and about one week less in the off-season.
21

Part I Cultural practices
2 Surface and underground drainage
2.1 The importance of level fields and good drainage
For successful rice culture the use of even fields is a first requisite. The advantages of such fields relate on the one hand to water consumption and optimum water level during the growth of the crop, while on the other hand they are closely relevant to the possibilities of drainage during a fallow period. This is why the level position of the fields affects every part of the cultivation method. Many of the favourable effects of the use of flat fields have already been discussed by DE WIT (1960) and TEN HAVE
(1959b). They will not be repeated here because they will come up for discussion again in the following chapters. These effects result in a lower cost of production, higher yields and better grain quality.
For drainage the evenness of fields deserves special attention. The rice areas of the young coastal plain of Surinam have very low permeability, so that excess water needs to be drained off mainly along the surface, or has to evaporate. This very low permeability is detrimental to rice by promoting reduction processes and the accumulation of toxins which may affect the rice crop (see 9.1.1). During the period when the fields lie fallow it is very important that the soil should dry and weather as much as possible to be brought into the best physical and chemical condition (chapter 3). For this regeneration of rice soils the flatness of the fields is important enough by itself, but even more so in relation to drainage devices, such as ditches, furrows and moles, which can be used to best advantage only after levelling the fields.
Mechanical rice culture in Surinam is faced with some other factors as well, on account of which such great value must be attached to drainage for drying out and structural improvement of the soil. Among such may be mentioned: (1) the frequent cultivation of rice, (2) the fairly long growth period of the varieties, (3) the variable and rainy weather conditions, (4) the lack of suitable green manures and of second crops, and (5) the sensitivity of the varieties to adverse physical and chemical soil conditions. The factors (1) to (4) may not allow sufficiënt recovery of the soil and so cause poor growth of the next rice crop. The poor internal drainage of these heavy clay soils is a key problem in the mechanical culture of rice in Surinam.
2.2 Levelling
All fields need levelling because of natural differences in height as well as of differ-
25
ences caused by the work of reclamation. These differences may amount to as much as 30 to 50 cm per field. Later on unevennesses may also result from the tillage and harvesting under difficult circumstances. To eliminate variations in height over short distances landplanes are employed, while to remove them over larger tracts scrapers are in use.
Levelling operations can best be carried out in stages. During the first few years after reclamation landplanes only should be used, because the settling of the soil may differ within a field with differences in maturation1 and organic matter content of the soil. This is why a single levelling operation with scrapers is not sufficient at this stage.
Slight irregularities in the fields of the Wageningen Polder are levelled by two types of landplanes, the Marvin Junior 94 and the Marvin Standard 86, 12 and 18 m long respectively. In the Prince Bernhard Polder they use a John Deere Lindeman LS 400 landshaper with a wheel base of 12.5 m. The levelling effect of the landplanes depends on their length. The operations are often carried out indifferent directions. The average capacity of these implements varies from 0.8 to 1 ha/hr. They compact the topsoil so that one or more harrowings are needed to make it sufficiently loose again. During the last few years these levelling implements have been less in use because culture and harvesting cause fewer irregularities and ruts than a few years ago, and because the
1 The more progressive part of the initial soil formation or ripening is referred to as maturation; see PONS and ZONNEVELD, 1965.
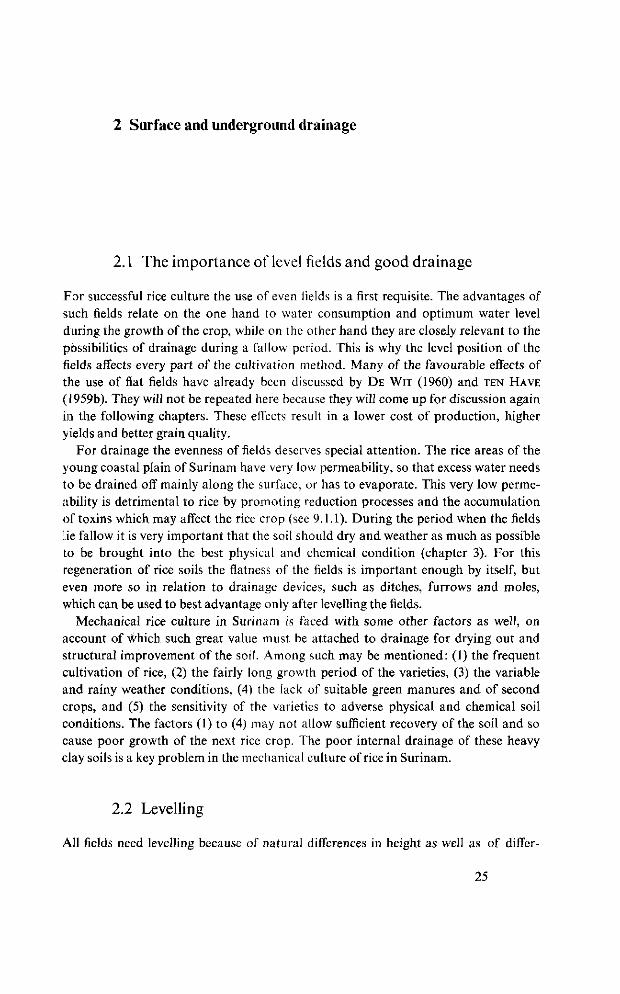
Photo 3. Levelling with a landplane.
26
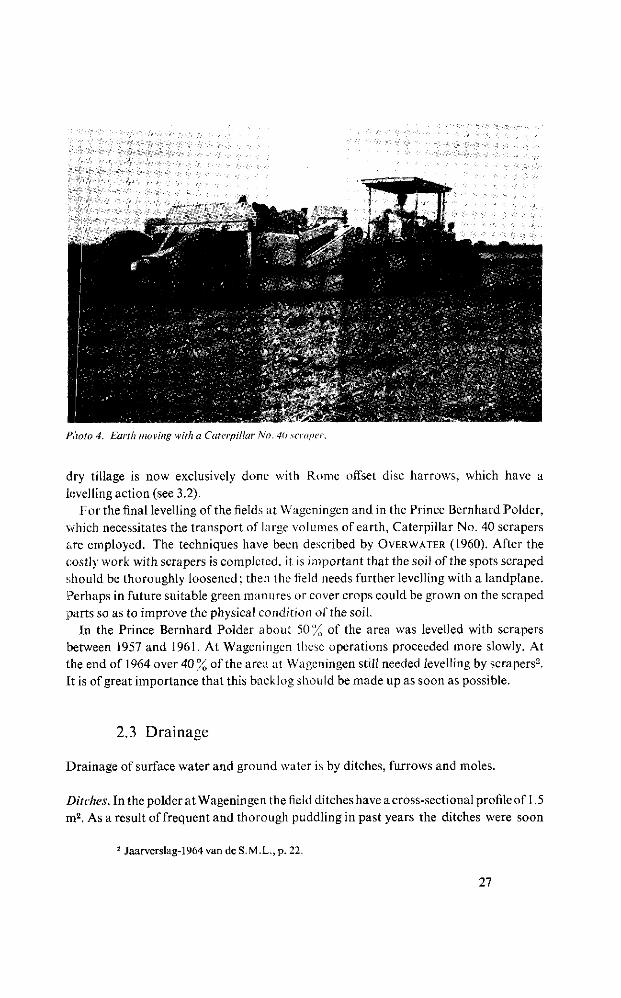
Paolo 4. Earth moving with a Caterpillar No. 40 scraper.
dry tillage is now exclusively done with Rome offset disc harrows, which have a levelling action (see 3.2).
For the final levelling of the fields at Wageningen and in the Prince Bernhard Polder, which necessitates the transport of large volumes of earth, Caterpillar No. 40 scrapers are employed. The techniques have been described by OVERWATER (1960). After the costly work with scrapers is completed, it is important that the soil of the spots scraped should be thoroughly loosened; then the field needs further levelling with a landplane. Perhaps in future suitable green manures or cover crops could be grown on the scraped parts so as to improve the physical condition of the soil.
In the Prince Bernhard Polder about 50% of the area was levelled with scrapers between 1957 and 1961. At Wageningen these operations proceeded more slowly. At the end of 1964 over 40% of the area at Wageningen still needed levelling by scrapers2. It is of great importance that this backlog should be made up as soon as possible.
2.3 Drainage
Drainage of surface water and ground water is by ditches, furrows and moles.
Ditches. In the polder at Wageningen the field ditches have a cross-sectional profile of 1.5 m2. As a result of frequent and thorough puddling in past years the ditches were soon
• Jaarverslag-1964 vandeS.M.L., p. 22.
27
partly or almost completely filled with silt. This led to a critical situation between 1959 and. 1961 when the deepening of the ditches lagged considerably behind silting up. Lack of manpower and the high cost restricted the use of manual labour for maintenance work; mechanical methods had to be found. A 0.5-cubic-yard dragline, specially converted for the purpose, was at first promising, but broke down frequently and was expensive to repair. Its capacity was too small, according to JANNASH (1965) between 900 and 1200 m per 8-hr working day.
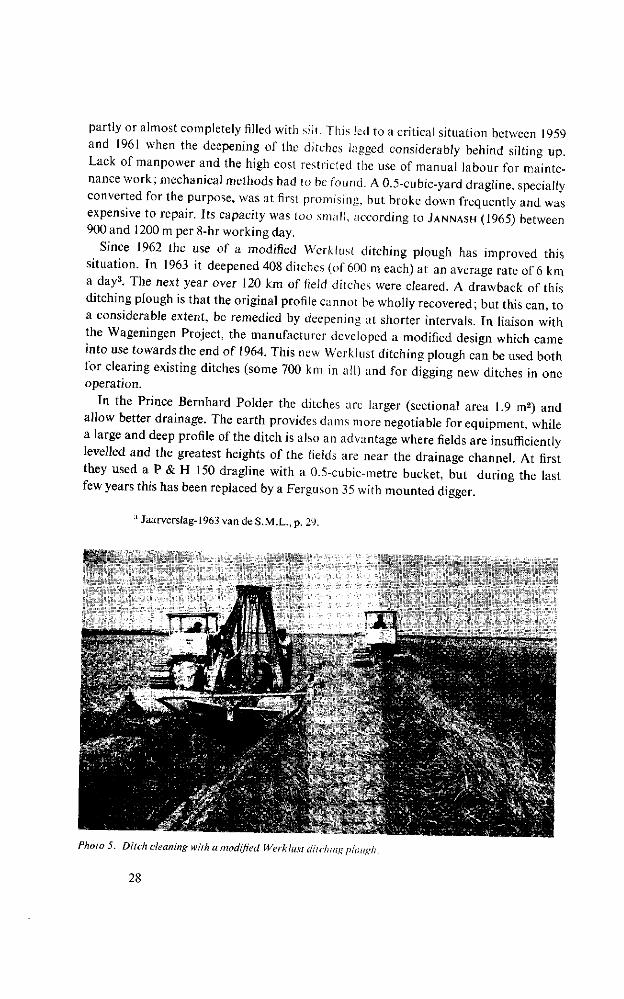
Since 1962 the use of a modified Werklust ditching plough has improved this situation. In 1963 it deepened 408 ditches (of 600 m each) at an average rate of 6 km a day3. The next year over 120 km of field ditches were cleared. A drawback of this ditching plough is that the original profile cannot be wholly recovered; but this can, to a considerable extent, be remedied by deepening at shorter intervals. In liaison with the Wageningen Project, the manufacturer developed a modified design which came into use towards the end of 1964. This new Werklust ditching plough can be used both for clearing existing ditches (some 700 km in all) and for digging new ditches in one operation.
In the Prince Bernhard Polder the ditches arc larger (sectional area 1.9 m«) and allow better drainage. The earth provides dams more negotiable for equipment, while a large and deep profile of the ditch is also an advantage where fields are insufficiently levelled and the greatest heights of the fields are near the drainage channel. At first they used a P & H 150 dragline with a 0.5-cubic-metre bucket, but during the last few years this has been replaced by a Ferguson 35 with mounted digger.
3 Jaarverslag-1963 van de S.M.L., p. 29.
ijCsfcr
M w w ^ ^ ^ ^
•J
»"HAS.'*"-
wirf-. ^ - * - : ï * » -•" :* \ '.. ï **&
-- v**i**iv5-*-<- * V • • -
&
Photo 5. Ditch cleaning with a modified Werklust ditching plough.
28
Furrows. Time and circumstances permitting, a portion of the fallow land is furrowed before the rainy season with a Ransomes Solotrac plough. This is a heavy, single-furrow, one-way plough which will dig furrows approximately 25 cm deep and 30 cm wide. Formerly these furrows were often dug in S-loops along the field; the connections to the ditches were dug by hand. Nowadays they are mostly made to run from the field ditch to about 10 m away from the middle of the field. The distance between them is generally 20 m. Especially on low spots drainage furrows must be accurately placed.
First to be considered for such furrowing are those fields which after harvest did not undergo dry tillage and which show deep ruts caused by mechanical cultivation and harvesting of the crop. In uneven and tilled fields furrowing seems to be of limited value. This drainage system can only work properly if the furrows are kept open, the field is sufficiently level and the position of the furrows is chosen carefully.
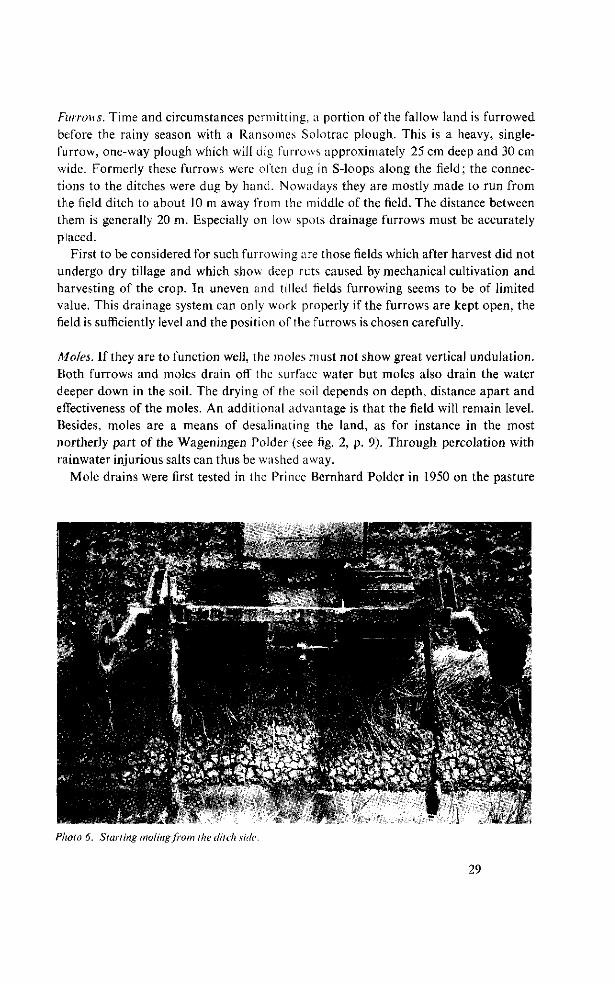
Moles. If they are to function well, the moles must not show great vertical undulation. Both furrows and moles drain off the surface water but moles also drain the water deeper down in the soil. The drying of the soil depends on depth, distance apart and effectiveness of the moles. An additional advantage is that the field will remain level. Besides, moles are a means of desalinating the land, as for instance in the most northerly part of the Wageningen Polder (see fig. 2, p. 9). Through percolation with rainwater injurious salts can thus be washed away.
Mole drains were first tested in the Prince Bernhard Polder in 1950 on the pasture
a * * . v Photo 6. Starling moling from the ditch side.
, : Â ! • V-: .1 r*. •' I' -•'•il' * ••'"Ajr^-11 •
29
land. In later years the system was used to improve the chances of second crops. The outlets of the moles into the ditches were provided with small plastic pipes to prevent clogging. Different reports give the impression that the results achieved were, generally, fairly favourable: surface drainage and drying out of the soil were better. When research on second crops ended, the experiments in mole drainage also came to an end.
In 1962 Pons resumed work on moling, this time in the Wageningen Polder, to improve the soil for rice culture and to make possible the growth of second crops. The moles are preferably cut through untitled well-dried soil from the ditch side towards the middle of the field, about 45 cm deep and 2 m apart. These operations should be carried out early enough for the walls of the slits to dry and crack before the rains. Provisional results look hopeful ; it is still too early for definite conclusions.
VAN AMSON en HASSELBACH (1966), from 1963 to 1965, tried moling old rice land to improve the growth of some secondary crops. On this clay, with very poor physical properties, the results were not promising. Despite intensive moling and complete water control by pumping, the water table remained very high during the rainy season. On more permeable soils better results may be expected.
30
3 Tillage and seedbed preparation
3.1 Introduction
The operations used to bring the soil into adequate condition for rice are based upon practical experience and the results of exploratory trials with various implements under diverse conditions. The experience acquired resulted in a number of dry and wet tillage practices with a limited range of implements for working and preparing the land under widely different circumstances. Some of these practices do not produce an ideal seedbed.
The account here is based on experience in the Prince Bernhard Polder and at the Wageningen Project (OVERWATER, I960; DE WIT, 1960; FORTANIER, 1962), on research and advisory work by VAN BEERS (1961, 1962) and PONS (1963, 1964), and on the author's experimental results. Over the years few reliable figures have been obtained from the many commercial-scale field trials on tillage. This was due, firstly, to inadequate experimental designs and secondly, to several influences which disturbed and obscured differences due to treatment. Such factors as abnormal seasons, alterations in the sowing schedule, and lack of time, machinery and implements dislocated the experimental programme. Various difficulties have been overcome, however, so that tillage operations can now be better tested in practice than in former years.
In the following sections stress is laid on the agricultural aspects of land preparation, whilst questions of engineering and farm economics are left out of consideration. The vagaries of the weather prevent hard and fast schedules for tillage and seedbed preparation. Fundamental research into the physical properties of the soil is still needed to provide a more scientific basis for various parts of the tillage.
3.2 Dry tillage
3.2.1 Purpose
From the moment the field is inundated and worked in a wet state the soil particles disintegrate and soil reduction begins. The very low permeability of the Wageningen clay soils promotes reduction and an accumulation of toxic substances to which the varieties grown are only partly resistant. The intensity of the wet tillage and the initial state of the soil determine the degree of soil compaction and the fall in permeability and stability of the aggregates. After harvest, therefore, thorough drying is essential if
31
soil structure is to be built up (see KOKNIGS, 1963; WARKENTIN, 1962) and to the improvement of the chemical condition of the soil by means of oxidation (see PON-NAMPERUMA, 1965). Experience has also shown that dry tillage and thorough drying of the soil are of great importance to the rice crop. Primarily, then, the intention of tillage is recovery and improvement of the physical and chemical properties of the soil, not merely the topsoil but also the subsoil.
For some time after the harvest the demands which the next rice crop makes on the soil are the same as those needed to regenerate the soil condition; but as sowing approaches, some discrepancy will appear. This is because the cost of seedbed preparation, too, is part of the tillage cost and thus of the total production cost of the crop, the aim pursued being, after all, an economic one (see also KUIPERS, 1963).
The weed vegetation may be a considerable help in improving the physical soil condition; yet it must be turned under early enough to prevent the worst weeds from setting seed. This should be done in such a way as not to induce any strong reduction processes in the soil.
As was already stated in 2.1, many factors hinder a proper drying up of the soil as well as the formation of a good structure. On account of the low permeability of the soil and the vagaries of the weather every operation, therefore, should be carried out with care. The weather factor gains in significance as less time is available for tillage.
3.2.2 Variables in tillage
In this section some variable factors will be discussed in relation to the soil, whereas the next section will deal with the implements.
Timing the first tillage. When the field is drained during ripening of the crop (about three weeks before harvest), the soil starts to dry. A healthy and robust crop will then withdraw far more water from the soil than does a poorly growing or diseased crop. Any remaining surface water and the water in the soil can at first disappear mainly through evaporation. The soil will then begin to crack and considerably enlarge the evaporation surface. Investigations by ADAMS and HANKS (1964) and by JOHNSTON
and HILL (1944) have shown the great influence which shrinkage cracks have on the loss of soil water. Thus the soil can dry down to fairly great depths, improving the permeability, consistency and the aeration of the subsoil. Yet although this maturation of the subsoil is very important to rice, the soil cannot be left idle after the harvest; one reason is that internal drying of the soil lumps would be inadequate (see also 3.2.4).
Ploughing too early causes kneading of the soil into plastic lumps which may become very hard on the outside through further drying and will aerate badly inside and be difficult to break up by subsequent harrowing. Unless the hard and coarse clods are broken by alternate wetting and drying, under-water tillage does not give a good seedbed but tough clods and silt. If it rains much soon after the land has been ploughed before it has dried adequately, its condition is likewise worsened. The soil
32
turned over by the plough is of unstable structure and swells easily again after ab
sorbing water. It probably absorbs more if the soil has dried out less (see KOENIGS,
1963). However, ploughing always enhances water storage of the cultivated layer (see
KUIPERS and VAN OUWERKERK, 1963). Unless there are any appreciable cracks below
the bottom of the ploughed layer, any rainwater collecting in the topsoil can hardly
disperse except by evaporation. Even if the soil is tilled under optimum conditions
there is still an increase in water storage, but the disadvantages in this case are less
because part of the rainwater can disappear through cracks to the subsoil.
If the first tillage is delayed, the soil may have become so hard that no reasonable
working depth (10 to 12 cm) can be obtained any more. The limits of moisture content
for good tillage are rather narrow but have not yet been measured. The right timing of
the first cultivation should be judged on experience. Work is more often started too
early than too late through lack of time.
Working depth. A working depth of 12 to 15 cm, possible with Rome offset disc
harrows, is shallow. A deep cultivation between 18 and 25 cm can usually be achieved
with disc or mouldboard ploughs. Shallow working promotes a very dry topsoil and
allows the subsoil to go on cracking and drying, unless the immediate tilth is too fine,
[f the land is cultivated more deeply, a thicker topsoil is secured but it cannot be as
thoroughly dried, while upward movement and evaporation from the subsoil would
generally be less. With tillage, whether shallow or deep, the water-storage capacity
increases, but with shallow tillage the rainwater is stored in the thin topsoil layer and
can sink more easily through cracks into the subsoil. A shallow operation is also
preferred to mitigate the chances of reduction after ploughing in weeds and plant
residues.
With shallow tillage the optimum moisture content of the soil is sooner attained, so
that work can be started earlier (gain of time). It is considerably cheaper than deep
tillage. After mouldboard or disc ploughing, one or two harrowings are usually
needed to reduce the size of the bigger lumps. These (shallow) workings do not,
however, appreciably lessen the dangerous effects of heavy rainfall, because much
water can still accumulate at the bottom of the cultivated layer and can, with much
difficulty, escape from there by capillary rise and evaporation. The almost impervious
subsoil is one of the main reasons why shallow tillage is preferred. If the land is
ploughed while too wet the detrimental effects are much greater with deep than with
shallow tillage.
I t is when the soil is flooded and prepared for sowing that the difficulties arising
from deep tillage become most clearly apparent. The thick cultivated layer will then
be filled with water and generally be so soft that tractors and implements sink deep
into the soil and work it too thoroughly (see 3.3.2). It has repeatedly been found that
deeply ploughed fields can scarcely be prepared for sowing, give much trouble in
mechanically sowing and tending the crop and support machinery with difficulty even
at harvest time. These detrimental effects loom larger if the time between ploughing
and seedbed preparation is shorter and the rainfall in that interval is heavier. For this
33
reason alone tillage shortly before sowing should never be deep. The question of shallow or deep tillage has for many years exercised the minds of
those engaged in Surinam mechanical cultivation of rice. In the Prince Bernhard Polder several commercial-scale field experiments have shown no conclusive differences in yield, so that shallow tillage is still preferred because of the smaller risks incurred. At the Wageningen Project some different implements were used and extensive commercial field trials were conducted there in the autumns of 1960 and 1963 to find the best working depth. For deep tillage McCormick No. 98 disc ploughs were used (in a few cases a mouldboard plough), while the shallow operations were with Rome offset disc harrows. In 1963 similar experiments were carried out in the Prince Bernhard Polder, where for the deep cultivation a Ferguson three-furrow mould-board plough was put into service. Despite the fact that in the year following this operation in each polder a prolonged drought ensued (from 1 December to 30 April in those years the average rainfall at Wageningen amounted to 32 and 26%, respectively, of the long-term average at New Nickerie), great difficulties were encountered on the deep-tilled plots in preparing the seedbed as well as in the mechanical culture and harvesting of the crop. No important differences in yield were noticed.
Turning or mixing action. The question whether the implements should perform a turning or a mixing action is specially relevant to the way of incorporating organic matter (rice stubble, straw, volunteer rice and weeds). Mouldboard ploughs turn most material under whereas the Rome offset disc harrows mix debris with the soil; disc ploughs are intermediate.
Turning under has some appeal for plant hygiene, while the seedbed, too, should preferably be free from vegetable matter on the surface. Yet this practice of turning in retards decomposition and promotes reduction. Where the plant remains occur as a layer at the bottom of the ploughed layer, the drying process of the subsoil may thereby be more retarded than if this matter had been mixed with the soil. Given the factors soil, climate and cultural methods (see 1.4 and 2.1), a mixing operation seems preferable.
Coarse or fine structure. Big clods will dry out less easily than small ones, but on the other hand they allow drying of the soil to a greater depth. In laboratory experiments HOLMES et al. (1960) found that a layer consisting of very small aggregates (diameter 2.5 mm) lost considerably less water by evaporation than if it had been made up of larger aggregates (diameter 25 or 50 mm). The differences in evaporation widened as wind velocity increased.
With a coarse operation the chance of weeds cropping up is smaller, which is important when a field is soon to be ready for sowing. On the other hand, a weed vegetation may help withdraw water from the soil, while the rooting, too, will benefit the condition of the soil. After heavy rain it may be expected that, with a finer structure, part of the water will flow off superficially, whereas with a coarser structure of the topsoil the water will only be lost downwards or upwards. This loss of water down to
34
the subsoil and up into the atmosphere, will, in the absence of vegetation, undoubtedly be greater with a coarse tilth. These opposing effects make it hard to be categorical on the optimum clod size, dependent as it is on the time available for the tillage.
3.2.3 Implements
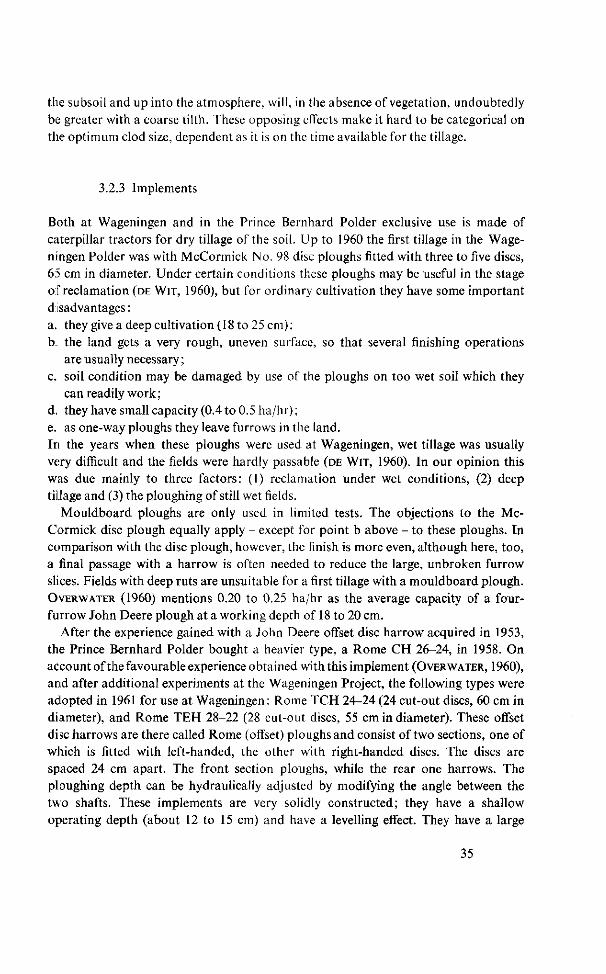
Both at Wageningen and in the Prince Bernhard Polder exclusive use is made of caterpillar tractors for dry tillage of the soil. Up to 1960 the first tillage in the Wageningen Polder was with McCormick No. 98 disc ploughs fitted with three to five discs, 65 cm in diameter. Under certain conditions these ploughs may be useful in the stage of reclamation (DE WIT, 1960), but for ordinary cultivation they have some important d isadvantages : a. they give a deep cultivation (18 to 25 cm); b. the land gets a very rough, uneven surface, so that several finishing operations
are usually necessary ; c. soil condition may be damaged by use of the ploughs on too wet soil which they
can readily work; d. they have small capacity (0.4 to 0.5 ha/hr); e. as one-way ploughs they leave furrows in the land. In the years when these ploughs were used at Wageningen, wet tillage was usually very difficult and the fields were hardly passable (DE WIT, 1960). In our opinion this was due mainly to three factors: (1) reclamation under wet conditions, (2) deep tillage and (3) the ploughing of still wet fields.
Mouldboard ploughs are only used in limited tests. The objections to the McCormick disc plough equally apply - except for point b above - to these ploughs. In comparison with the disc plough, however, the finish is more even, although here, too, a final passage with a harrow is often needed to reduce the large, unbroken furrow slices. Fields with deep ruts are unsuitable for a first tillage with a mouldboard plough. OVERWATER (1960) mentions 0.20 to 0.25 ha/hr as the average capacity of a four-furrow John Deere plough at a working depth of 18 to 20 cm.
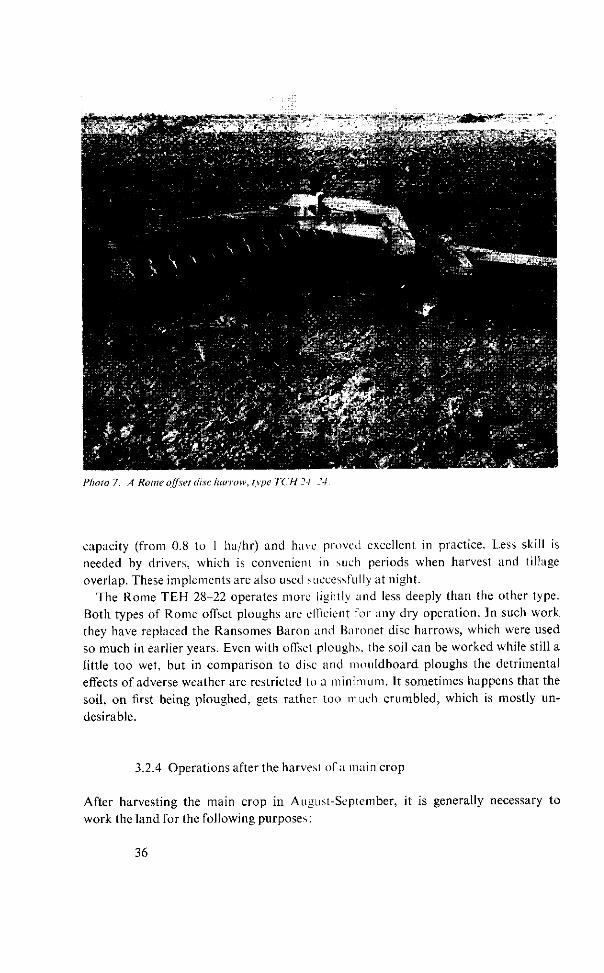
After the experience gained with a John Deere offset disc harrow acquired in 1953, the Prince Bernhard Polder bought a heavier type, a Rome CH 26-24, in 1958. On account of the favourable experience obtained with this implement (OVERWATER, 1960), and after additional experiments at the Wageningen Project, the following types were adopted in 1961 for use at Wageningen : Rome TCH 24-24 (24 cut-out discs, 60 cm in diameter), and Rome TEH 28-22 (28 cut-out discs, 55 cm in diameter). These offset disc harrows are there called Rome (offset) ploughs and consist of two sections, one of which is fitted with left-handed, the other with right-handed discs. The discs are spaced 24 cm apart. The front section ploughs, while the rear one harrows. The ploughing depth can be hydraulically adjusted by modifying the angle between the two shafts. These implements are very solidly constructed; they have a shallow operating depth (about 12 to 15 cm) and have a levelling effect. They have a large
35
••F* k i%&~ï3fy!Bè'. * t > • '*;' &***£•
Photo 7. A Rome off sel disc harrow, type TC H 24 24.
capacity (from 0.8 to 1 ha/hr) and have proved excellent in practice. Less skill is needed by drivers, which is convenient in such periods when harvest and tillage overlap. These implements are also used successfully at night.
The Rome TEH 28-22 operates more lightly and less deeply than the other type. Both types of Rome offset ploughs are efficient for any dry operation. In such work they have replaced the Ransomes Baron and Baronet disc harrows, which were used so much in earlier years. Even with offset ploughs, the soil can be worked while still a little too wet, but in comparison to disc and mouldboard ploughs the detrimental effects of adverse weather are restricted to a minimum. It sometimes happens that the soil, on first being ploughed, gets rather too much crumbled, which is mostly undesirable.
3.2.4 Operations after the harvest of a main crop
After harvesting the main crop in August-September, it is generally necessary to work the land for the following purposes :
36
a. To improve structure and the thorough drying of the soil. Large lumps should also dry out thoroughly internally.
b. To obliterate any ruts in the field. e. As a measure of plant protection to prevent the build-up of diseases and pests on
new shoots from the rice stubble, on volunteer rice and on weeds. d. To combat weeds. If no tillage takes place, a dense vegetation may form out of
dropseed rice and weed seeds (among which may be the notorious Saramacca grass: Jschaemum rugosum SALISB.). These plants, while alive, do indeed withdraw much water from the soil, but when older or dead they can hinder a maximum drying of the field. In practice it has been found that such a layer of plant debris is difficult to burn so that it has to be ploughed under despite the consequences (see 3.3).
e. To ensure an effective distribution of work and to meet risks. Postponing dry tillage involves the risk that these operations cannot be carried out under favourable conditions ; in the worst case the land must be prepared for sowing entirely by puddling (see further 3.3).
f. To prevent salination in the northernmost area of the Wageningen polder (VAN BEERS, 1961).
Before first tillage the loose straw and the rice stubble are burnt as completely as possible to promote drying out and to facilitate further working of the soil. This measure is also recommended for plant hygiene. When sowing follows shortly afterwards, the presence of large quantities of buried straw may encourage reduction and temporarily restrict availability of nitrogen; an optimum seedbed cannot be obtained. The advantages of burning more than offset the loss of organic matter, as these soils are fairly rich in organic matter (about 5%). The nuisance of large quantities of plant debris, which remain to be worked under if the weather prevents burning, underlines the advantage.
As will be shown in 5.4.9 and 8.4.8, from a harvest of 4000 kg grain about 6000 kg straw and stubble remains in the field. This standing stubble (height about 50 cm) and the loose straw can badly hinder drying out (see also ARMY et ai, 1961). The burning of this material is therefore well worth the care and cost expended on it. At the Wageningen Project the rice stubble is first flattened by driving a Marden T-5 triplex weedcutter over it. For this operation the land must be fairly dry, lest it be too heavily compacted and the straw be partly pressed into the soil. If the operation is not practical the straw is just set on fire.
Of recent time there has, in the Prince Bernhard Polder, been some successful experiments on the mowing of stubble with a rotary mower drawn by a wheeled tractor. This operation has been put into general practice for fields which are sown again shortly after harvest; the average working capacity is about 1 ha/hr. The straw remains loose on the short stubble, reducing the risk of incomplete combustion.
At Wageningen the first tillage is frequently across the ruts. The time of any second working, at right angles to the first, depends on the success of the first, the time available and the plans for the field, i.e. dry fallow, rice or flood fallow.
37
For a dry fallow a single operation in autumn (October-December) will often do, because the Rome offset ploughs perform a crumbling and levelling action. Next, under the influence of alternate wet and dry spells, the clods can weather and the topsoil becomes more compact. If the surface is uneven or there are noxious weeds, a second tillage may be desirable. As a general rule, too much crumbling of the topsoil must be avoided so that the subsoil can dry up and crack further. The subsequent tillage in January to March is a preliminary to the seedbed preparation, which is done under water. All fields are worked at the start of the dry season with the Rome offset plough, provided the soil is dry enough, in order that the wet operation is as light as possible and to limit the amount of vegetable matter to be turned in. The operation may be repeated, if necessary, to keep the field free from weeds.
If the field is to be sown with rice between mid October and mid November, the operations cannot always be carried out under the best conditions because of lack of time and irregular heavy rain in the dry season. Because of the risks, the work must be carefully supervised. It may be best in such cases to use the light Rome plough first and, if the soil remains dry, to try and deepen the cultivated layer later. The successive operations are apt to follow each other too quickly and the state of the soil during and after the last rice crop must therefore be such, that after the harvest it will dry as evenly and rapidly as possible. Although dry tillage is often not optimum for the next crop, a superficial wet operation will usually suffice for preparing the seedbed.
The fields for flood fallow generally undergo one dry operation with a Rome offset plough and are subsequently treated as described in 3.5.
3.2.5 Operations after the harvest of an off-season crop
The operations carried out after harvest in February-March are much the same as those applied after gathering a main crop. For the fields to be sown again with rice the straw should be well burnt and the soil dry tilled, lest at a later stage a seedbed has to be prepared solely by wet tillage (see 3.3). As the chances of heavy rainfall are much greater in this period than after a main harvest, the soil is often tilled before it is dry enough. From the foregoing discussion it should be clear that the light Rome plough is the right implement for an operation of this nature.
Also for fallows during the major wet period (the main season) a dry working is most desirable, otherwise too much volunteer and red rice, new shoots from standing stubble, and too many weeds would develop, which may become a source for infection of diseases and pests. Such vegetation hinders a rapid drying of the soil at the start of the major dry season, being largely dead at that time.
38
3.3 Wet tillage
3.3.1 General remarks
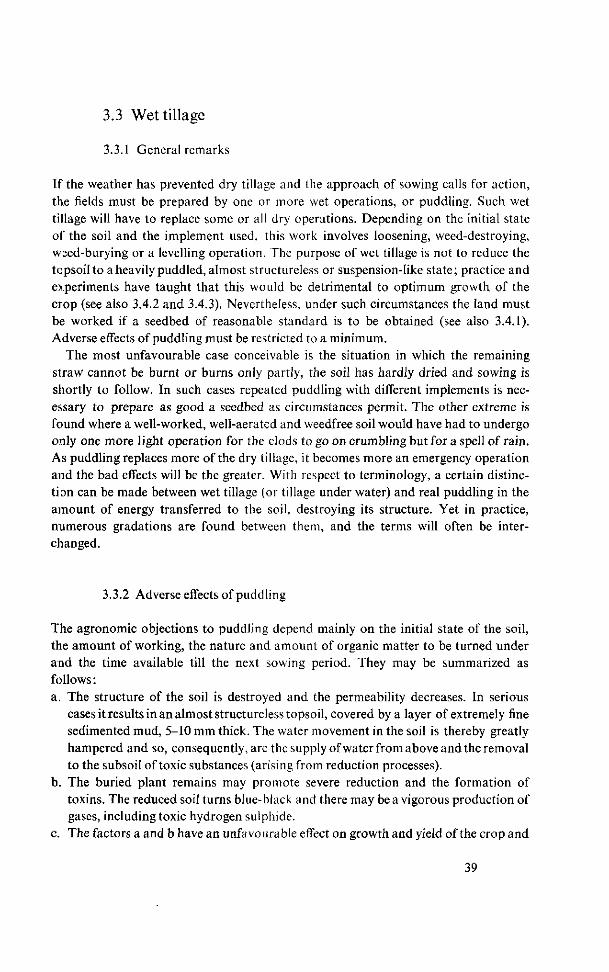
If the weather has prevented dry tillage and the approach of sowing calls for action, the fields must be prepared by one or more wet operations, or puddling. Such wet tillage will have to replace some or all dry operations. Depending on the initial state of the soil and the implement used, this work involves loosening, weed-destroying, wsed-burying or a levelling operation. The purpose of wet tillage is not to reduce the topsoil to a heavily puddled, almost structureless or suspension-like state; practice and experiments have taught that this would be detrimental to optimum growth of the crop (see also 3.4.2 and 3.4.3). Nevertheless, under such circumstances the land must be worked if a seedbed of reasonable standard is to be obtained (see also 3.4.1). Adverse effects of puddling must be restricted to a minimum.
The most unfavourable case conceivable is the situation in which the remaining straw cannot be burnt or burns only partly, the soil has hardly dried and sowing is shortly to follow. In such cases repeated puddling with different implements is necessary to prepare as good a seedbed as circumstances permit. The other extreme is found where a well-worked, well-aerated and weedfree soil would have had to undergo only one more light operation for the clods to go on crumbling but for a spell of rain. As puddling replaces more of the dry tillage, it becomes more an emergency operation and the bad effects will be the greater. With respect to terminology, a certain distinction can be made between wet tillage (or tillage under water) and real puddling in the amount of energy transferred to the soil, destroying its structure. Yet in practice, numerous gradations are found between them, and the terms will often be interchanged.
3.3.2 Adverse effects of puddling
The agronomic objections to puddling depend mainly on the initial state of the soil, the amount of working, the nature and amount of organic matter to be turned under and the time available till the next sowing period. They may be summarized as follows : a. The structure of the soil is destroyed and the permeability decreases. In serious
cases it results in an almost structureless topsoil, covered by a layer of extremely fine sedimented mud, 5-10 mm thick. The water movement in the soil is thereby greatly hampered and so, consequently, are the supply of water from above and the removal to the subsoil of toxic substances (arising from reduction processes).
b. The buried plant remains may promote severe reduction and the formation of toxins. The reduced soil turns blue-black and there may be a vigorous production of gases, including toxic hydrogen sulphide.
c. The factors a and b have an unfavourable effect on growth and yield of the crop and
39
heighten the susceptibility of the plant to fungus diseases (see 9.1.1). Great losses of yield accompany a marked decline in the quality of the grain (see 11.4.2 and 11.4.3). To such poorly thriving plants the notorious weed grass, Ischaemum rugosum SAUSB.,
may be even more injurious. d. By being puddled the soil can absorb and retain more water (KOENIGS, 1963;
WARKENTIN, 1962). This water has afterwards to be withdrawn again to restore the structure of the topsoil.
e. The field ditches get silted up. To a lesser extent this applies to the secondary drainage channels as well.
f. The soil becomes soft. Ruts made before sowing are detrimental to an even stand and good water control; those too which are made later prevent the soil from drying quickly and evenly.
g. After thorough puddling a good and regular density of crop is less easy to obtain because in pockets the seed may be killed under fine mud. Draining the field for a longer period after sowing encourages the establishment of rice seedlings, but also of weeds.
h. Practical experience has shown that repeated and thorough puddling favours the development of the weed, Sphenoclea zeylanica GAERTN.
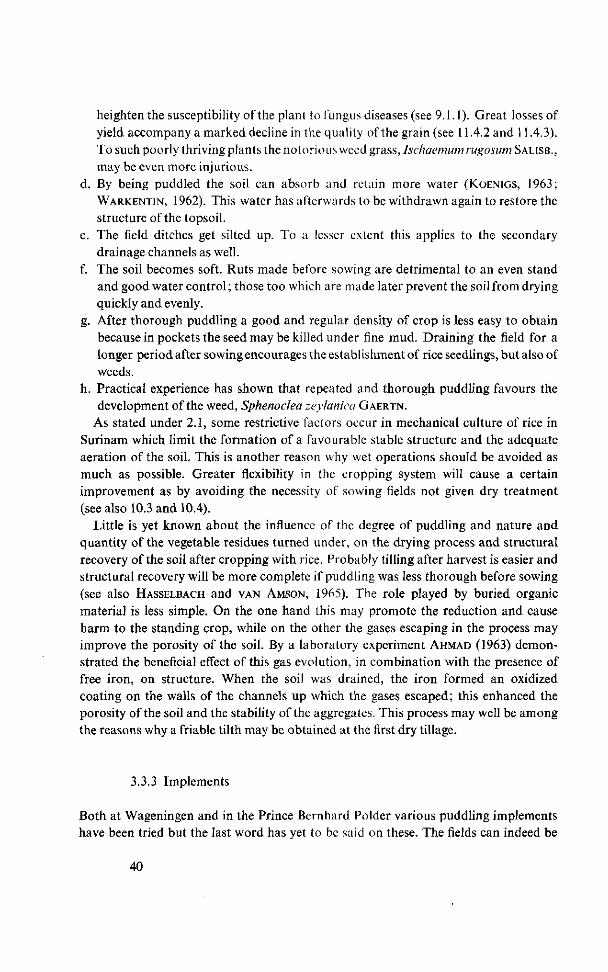
As stated under 2.1, some restrictive factors occur in mechanical culture of rice in Surinam which limit the formation of a favourable stable structure and the adequate aeration of the soil. This is another reason why wet operations should be avoided as much as possible. Greater flexibility in the cropping system will cause a certain improvement as by avoiding the necessity of sowing fields not given dry treatment (see also 10.3 and 10.4).
Little is yet known about the influence of the degree of puddling and nature and quantity of the vegetable residues turned under, on the drying process and structural recovery of the soil after cropping with rice. Probably tilling after harvest is easier and structural recovery will be more complete if puddling was less thorough before sowing (see also HASSELBACH and VAN AMSON, 1965). The role played by buried organic material is less simple. On the one hand this may promote the reduction and cause harm to the standing crop, while on the other the gases escaping in the process may improve the porosity of the soil. By a laboratory experiment AHMAD (1963) demonstrated the beneficial effect of this gas evolution, in combination with the presence of free iron, on structure. When the soil was drained, the iron formed an oxidized coating on the walls of the channels up which the gases escaped; this enhanced the porosity of the soil and the stability of the aggregates. This process may well be among the reasons why a friable tilth may be obtained at the first dry tillage.
3.3.3 Implements
Both at Wageningen and in the Prince Bernhard Polder various puddling implements have been tried but the last word has yet to be said on these. The fields can indeed be
40
prepared under widely diverging conditions, but often with too great a deterioration of the soil structure. Puddling implements are too few for choice in relation to the demands of rice on the soil. Changes in the practice of dry tillage will also make different demands on the puddling tools. Further research is needed to enable the wet tillage, as most commonly practised, to be carried out with less deleterious effects than now.
The implements used for puddling at the Wageningen Project and in the Prince Bernhard Polder may be classed into four groups according to their design and action : a. closed rollers with steel knives or iron strips attached to the circumference, parallel
to the axis; b. open rollers with steel knives or iron strips ; c. disc harrows ; d. boards or beams.
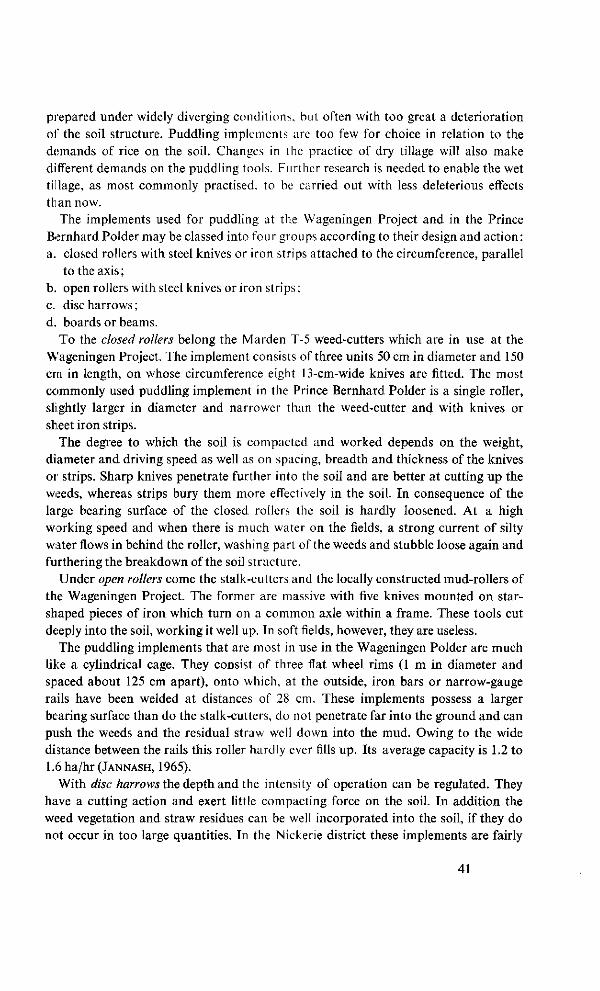
To the closed rollers belong the Marden T-5 weed-cutters which are in use at the Wageningen Project. The implement consists of three units 50 cm in diameter and 150 crn in length, on whose circumference eight 13-cm-wide knives are fitted. The most commonly used puddling implement in the Prince Bernhard Polder is a single roller, slightly larger in diameter and narrower than the weed-cutter and with knives or sheet iron strips.
The degree to which the soil is compacted and worked depends on the weight, diameter and driving speed as well as on spacing, breadth and thickness of the knives or strips. Sharp knives penetrate further into the soil and are better at cutting up the weeds, whereas strips bury them more effectively in the soil. In consequence of the large bearing surface of the closed rollers the soil is hardly loosened. At a high working speed and when there is much water on the fields, a strong current of silty water flows in behind the roller, washing part of the weeds and stubble loose again and furthering the breakdown of the soil structure.
Under open rollers come the stalk-cutters and the locally constructed mud-rollers of the Wageningen Project. The former are massive with five knives mounted on star-shaped pieces of iron which turn on a common axle within a frame. These tools cut deeply into the soil, working it well up. In soft fields, however, they are useless.
The puddling implements that are most in use in the Wageningen Polder are much like a cylindrical cage. They consist of three flat wheel rims (1 m in diameter and spaced about 125 cm apart), onto which, at the outside, iron bars or narrow-gauge rails have been welded at distances of 28 cm. These implements possess a larger bearing surface than do the stalk-cutters, do not penetrate far into the ground and can push the weeds and the residual straw well down into the mud. Owing to the wide distance between the rails this roller hardly ever fills up. Its average capacity is 1.2 to 1.6ha/hr(JANNASH, 1965).
With disc harrows the depth and the intensity of operation can be regulated. They have a cutting action and exert little compacting force on the soil. In addition the weed vegetation and straw residues can be well incorporated into the soil, if they do not occur in too large quantities. In the Nickerie district these implements are fairly
41
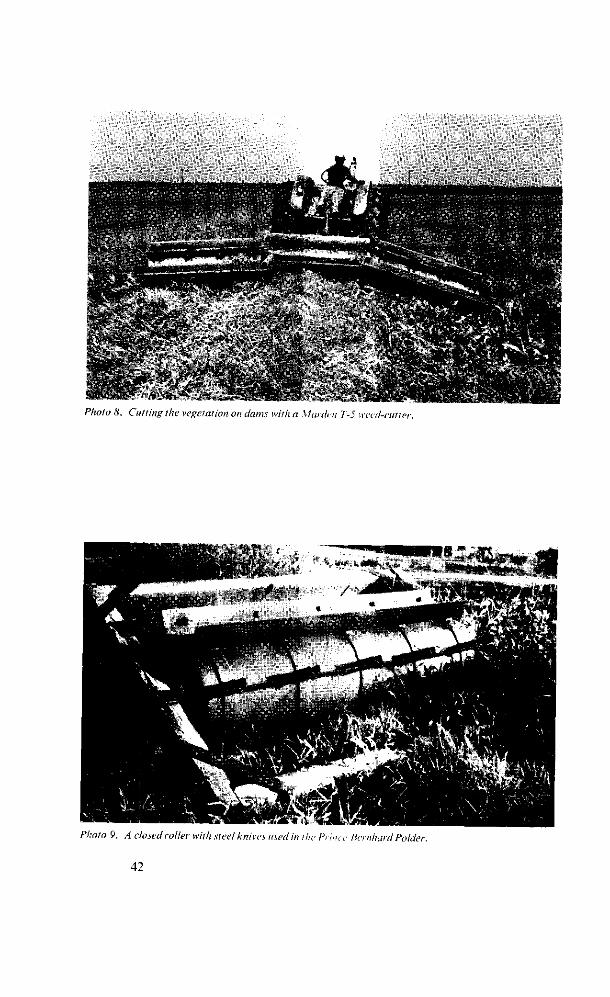
* ' » S. Cutting the vegetation on dams with a Marden 1-5 weed-cutter.
Photo 9. A closed roller with steel knives used in the Prince Bernhard Pokier.
42
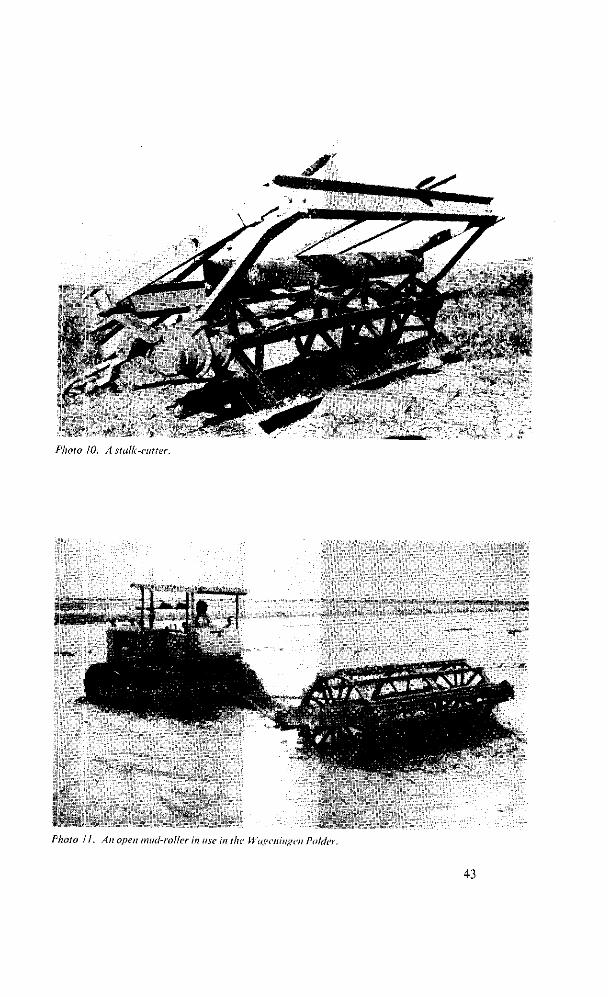
Photo 10. A stalk-cutter.
Photo il. Au open mtiil-roller in use in the \\'UKCIUII!>CII I' •....::.
43
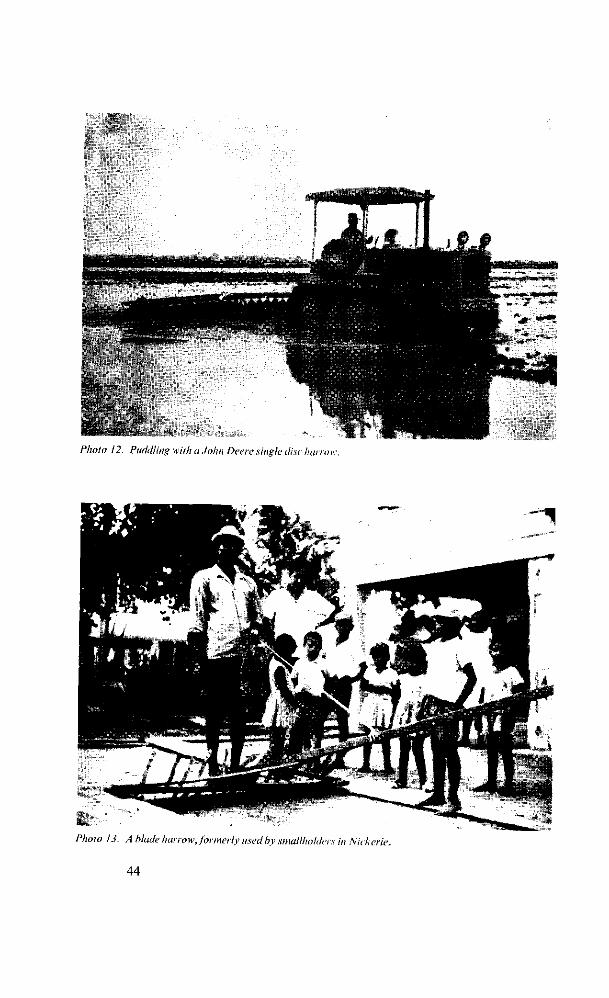
Photo 12. Puddling with a John Deere single disc harrow.
Photo 13. A blade harrow, formerly used by smallholders in Nickerie.
44
'iMWU^ üiiiii. * ^ * $ ^ ^ * ''-^Z^PK v ' ° * -
«SSè".*,
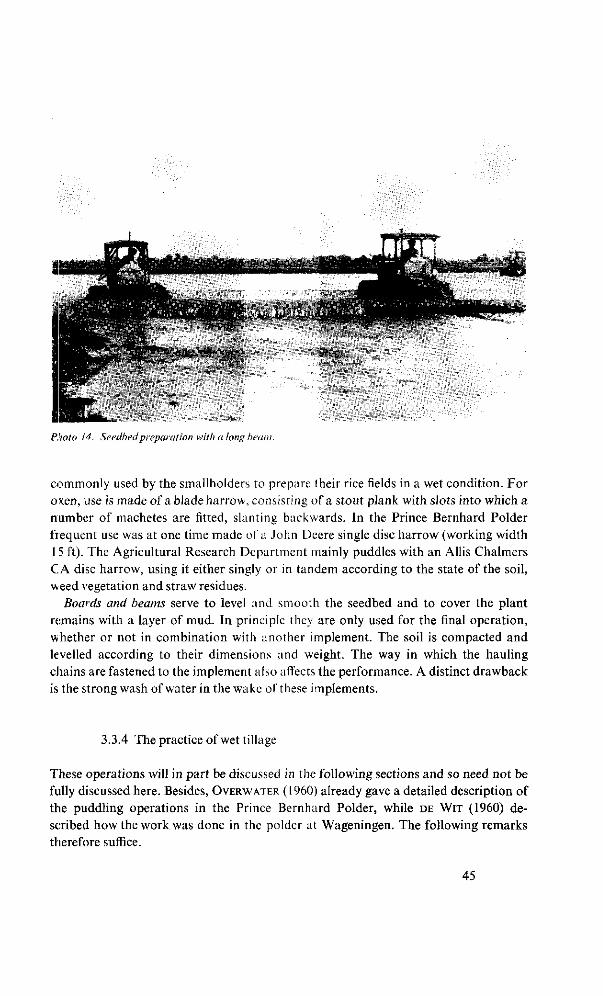
Photo 14. Seedbed preparation with a long beam.
commonly used by the smallholders to prepare their rice fields in a wet condition. For oxen, use is made of a blade harrow, consisting of a stout plank with slots into which a number of machetes are fitted, slanting backwards. In the Prince Bernhard Polder frequent use was at one time made of a John Deere single disc harrow (working width 15 ft). The Agricultural Research Department mainly puddles with an Allis Chalmers CA disc harrow, using it either singly or in tandem according to the state of the soil, weed vegetation and straw residues.
Boards and beams serve to level and smooth the seedbed and to cover the plant remains with a layer of mud. In principle they are only used for the final operation, whether or not in combination with another implement. The soil is compacted and levelled according to their dimensions and weight. The way in which the hauling chains are fastened to the implement also affects the performance. A distinct drawback is the strong wash of water in the wake of these implements.
3.3.4 The practice of wet tillage
These operations will in part be discussed in the following sections and so need not be fully discussed here. Besides, OVERWATER (1960) already gave a detailed description of the puddling operations in the Prince Bernhard Polder, while DE WIT (1960) described how the work was done in the polder at Wageningen. The following remarks therefore suffice.
45
The water level in the field should be as low as possible, short of letting the implement or the crawler tracks get clogged with earth and plant residues, i.e. the field is irrigated hardly enough to cover the clods. In this way less strong currents will arise in the water, the work will yield better results and the missing of strips can be avoided. The working depth should on no account be greater than of the previous dry operation, if any. An untilled or compact soil should be adequately loosened, lest a poorly growing crop should result. For this operation a cutting and somewhat inversive action is preferred.
To lessen a fall in permeability of the soil and to hinder reduction processes, the use of implements having a kneading or dragging action should be restricted as much as possible. The choice of the implement is dependent also on the negotiability of the field, the mass of plant debris to be turned under and the time available till sowing.
3.4 Seedbed preparation
3.4.1 The seedbed
In most cases the seed is broadcast onto a puddled field from which the water has been drained. Sometimes the field is irrigated for a couple of days to make the clods fall apart, after which sowing takes place on a waterlogged soil. On a limited scale, sowing is done in water covering soil which may or may not have been puddled (see chapter 4). In all these cases the seedbed should, at the moment of sowing, possess the following characteristics : (1) a loose topsoil of small clods (up to a few centimetres in diameter) and containing little silt, (2) freedom from weeds, (3) absence of plant residues at the surface and (4) a flat surface. Only if the weather conditions have been favourable and the soil has been able to dry and weather sufficiently, can a seedbed with these qualities be achieved. In less favourable circumstances some compromise must be accepted. Yet it is fortunate that in many cases the method of sowing can be adjusted to the condition of the seedbed.
3.4.2 Preparation following dry cultivation
Owing to coarse and hard clods in the topsoil it is not always possible to obtain a finely crumbled seedbed by dry tillage. As a finishing operation light puddling is therefore often necessary. In those cases where such an operation was omitted and the sowing followed immediately in water or on a waterlogged soil (to be flooded in a few days), this yielded the following practical disadvantages : a. The stand of the crop will be uneven and more thinly set, owing mainly to a
disintegration of the clods which cover part of the seed with a layer of soil particles. K The establishment of the seedlings will proceed irregularly, because the seed lies at
unequal depths.
46
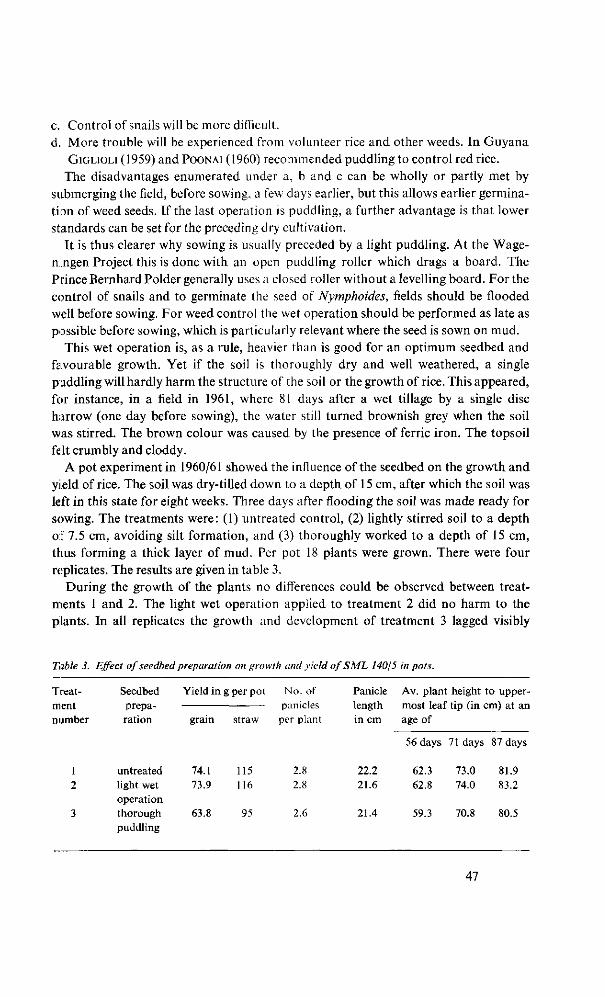
c. Control of snails will be more difficult. d. More trouble will be experienced from volunteer rice and other weeds. In Guyana
GIGLIOLI (1959) and POONAI (1960) recommended puddling to control red rice. The disadvantages enumerated under a, b and c can be wholly or partly met by
submerging the field, before sowing, a few days earlier, but this allows earlier germination of weed seeds. If the last operation is puddling, a further advantage is that lower standards can be set for the preceding dry cultivation.
It is thus clearer why sowing is usually preceded by a light puddling. At the Wage-mngen Project this is done with an open puddling roller which drags a board. The Prince Bernhard Polder generally uses a closed roller without a levelling board. For the control of snails and to germinate the seed of Nymphoides, fields should be flooded well before sowing. For weed control the wet operation should be performed as late as possible before sowing, which is particularly relevant where the seed is sown on mud.
This wet operation is, as a rule, heavier than is good for an optimum seedbed and favourable growth. Yet if the soil is thoroughly dry and well weathered, a single puddling will hardly harm the structure of the soil or the growth of rice. This appeared, for instance, in a field in 1961, where 81 days after a wet tillage by a single disc harrow (one day before sowing), the water still turned brownish grey when the soil was stirred. The brown colour was caused by the presence of ferric iron. The topsoil felt crumbly and cloddy.
A pot experiment in 1960/61 showed the influence of the seedbed on the growth and yield of rice. The soil was dry-tilled down to a depth of 15 cm, after which the soil was left in this state for eight weeks. Three days after flooding the soil was made ready for sowing. The treatments were: (1) untreated control, (2) lightly stirred soil to a depth of 7.5 cm, avoiding silt formation, and (3) thoroughly worked to a depth of 15 cm, thus forming a thick layer of mud. Per pot 18 plants were grown. There were four replicates. The results are given in table 3.
During the growth of the plants no differences could be observed between treatments 1 and 2. The light wet operation applied to treatment 2 did no harm to the plants. In all replicates the growth and development of treatment 3 lagged visibly
Table 3. Effect of seedbed preparation on growth and yield of S ML 140/5 in pots.
Treatment number
1 2
3
Seedbed preparation
untreated light wet operation thorough puddling
Yield in
grain
74.1 73.9
63.8
g per pot
straw
115 116
95
No. of panicles per plant
2.8 2.8
2.6
Panicle length in cm
22.2 21.6
21.4
Av. plant height most leaf tip (in i age of
56 days 71 days
62.3 73.0 62.8 74.0
59.3 70.8
to upper-:m) at an
87 days
81.9 83.2
80.5
47
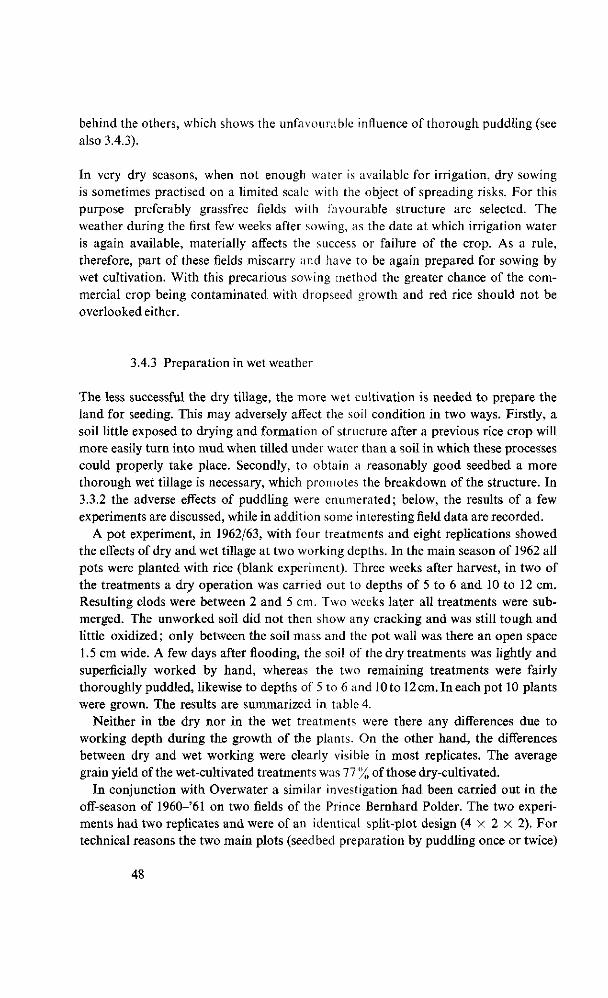
behind the others, which shows the unfavourable influence of thorough puddling (see also 3.4.3).
In very dry seasons, when not enough water is available for irrigation, dry sowing is sometimes practised on a limited scale with the object of spreading risks. For this purpose preferably grassfree fields with favourable structure are selected. The weather during the first few weeks after sowing, as the date at which irrigation water is again available, materially affects the success or failure of the crop. As a rule, therefore, part of these fields miscarry and have to be again prepared for sowing by wet cultivation. With this precarious sowing method the greater chance of the commercial crop being contaminated with dropseed growth and red rice should not be overlooked either.
3.4.3 Preparation in wet weather
The less successful the dry tillage, the more wet cultivation is needed to prepare the land for seeding. This may adversely affect the soil condition in two ways. Firstly, a soil little exposed to drying and formation of structure after a previous rice crop will more easily turn into mud when tilled under water than a soil in which these processes could properly take place. Secondly, to obtain a reasonably good seedbed a more thorough wet tillage is necessary, which promotes the breakdown of the structure. In 3.3.2 the adverse effects of puddling were enumerated; below, the results of a few experiments are discussed, while in addition some interesting field data are recorded.
A pot experiment, in 1962/63, with four treatments and eight replications showed the effects of dry and wet tillage at two working depths. In the main season of 1962 all pots were planted with rice (blank experiment). Three weeks after harvest, in two of the treatments a dry operation was carried out to depths of 5 to 6 and 10 to 12 cm. Resulting clods were between 2 and 5 cm. Two weeks later all treatments were submerged. The unworked soil did not then show any cracking and was still tough and little oxidized; only between the soil mass and the pot wall was there an open space 1.5 cm wide. A few days after flooding, the soil of the dry treatments was lightly and superficially worked by hand, whereas the two remaining treatments were fairly thoroughly puddled, likewise to depths of 5 to 6 and 10 to 12 cm. In each pot 10 plants were grown. The results are summarized in table 4.
Neither in the dry nor in the wet treatments were there any differences due to working depth during the growth of the plants. On the other hand, the differences between dry and wet working were clearly visible in most replicates. The average grain yield of the wet-cultivated treatments was 77 % of those dry-cultivated.
In conjunction with Overwater a similar investigation had been carried out in the off-season of 1960—'61 on two fields of the Prince Bernhard Polder. The two experiments had two replicates and were of an identical split-plot design (4 x 2 X 2). For technical reasons the two main plots (seedbed preparation by puddling once or twice)
48
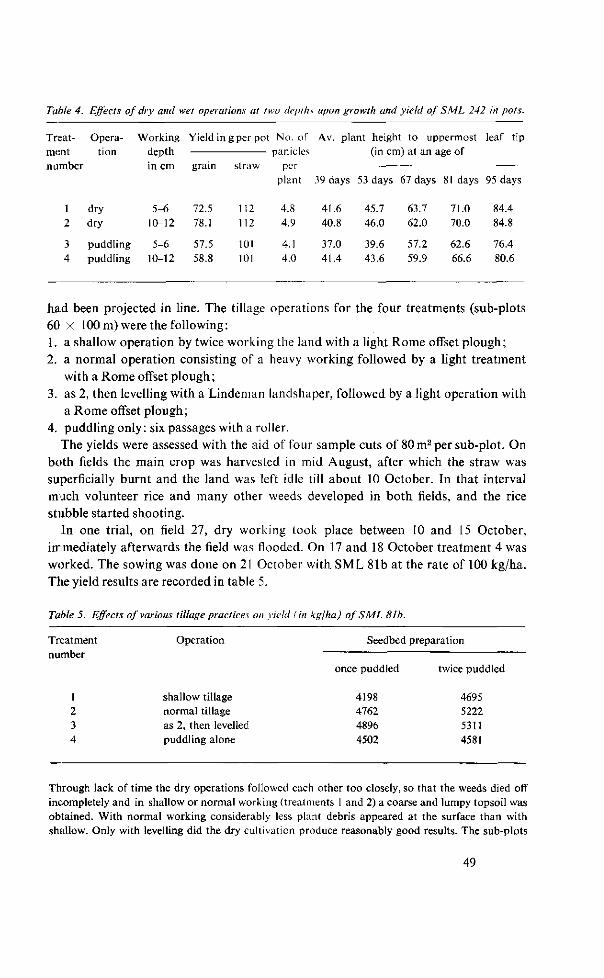
Table 4. Effects of dry and wel operations at two depths upon growth and yield of S ML 242 in pots.
Treat- Opera-rnont tion number
1 dry 2 dry
3 puddling 4 puddling
Working depth
5-6 10-12
5-6 10-12
Yield in
72.5 78.1
57.5 58.8
g per pot
straw
112 112
101 101
No. of panicles
per plant
4.8 4.9
4.1 4.0
Av. plant height to uppermost (in cm) at an i
39 days 53 days
41.6 45.7 40.8 46.0
37.0 39.6 41.4 43.6
67 days
63.7 62.0
57.2 59.9
age of
81 days
71.0 70.0
62.6 66.6
leaf tip
95 days
84.4 84.8
76.4 80.6
had been projected in line. The tillage operations for the four treatments (sub-plots 60 x 100 m) were the following: 1. a shallow operation by twice working the land with a light Rome offset plough; 2. a normal operation consisting of a heavy working followed by a light treatment
with a Rome offset plough; 3. as 2, then levelling with a Lindeman landshaper, followed by a light operation with
a Rome offset plough; 4. puddling only: six passages with a roller.
The yields were assessed with the aid of four sample cuts of 80 m2 per sub-plot. On both fields the main crop was harvested in mid August, after which the straw was superficially burnt and the land was left idle till about 10 October. In that interval much volunteer rice and many other weeds developed in both fields, and the rice stubble started shooting.
In one trial, on field 27, dry working took place between 10 and 15 October, immediately afterwards the field was flooded. On 17 and 18 October treatment 4 was worked. The sowing was done on 21 October with SML 81b at the rate of 100 kg/ha. The yield results are recorded in table 5.
Table 5. Effects of various tillage practices on yield (in kg/ha) of SML 81b.
Treatment
number
1 2 3 4
Operation
shallow tillage normal tillage as 2, then levelled puddling alone
Seedbed preparation
once puddled
4198 4762 4896 4502
twice puddled
4695 5222 5311 4581
Through lack of time the dry operations followed each other too closely, so that the weeds died off incompletely and in shallow or normal working (treatments 1 and 2) a coarse and lumpy topsoil was obtained. With normal working considerably less plant debris appeared at the surface than with shallow. Only with levelling did the dry cultivation produce reasonably good results. The sub-plots
49
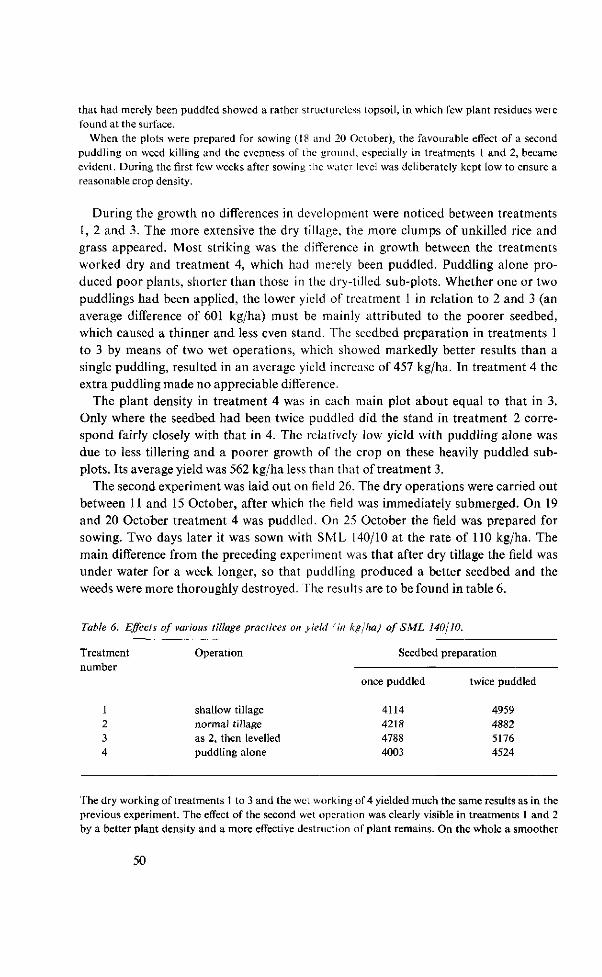
that had merely been puddled showed a rather structureless topsoil, in which few plant residues were found at the surface.
When the plots were prepared for sowing (18 and 20 October), the favourable effect of a second puddling on weed killing and the evenness of the ground, especially in treatments 1 and 2, became evident. During the first few weeks after sowing the water level was deliberately kept low to. ensure a reasonable crop density.
During the growth no differences in development were noticed between treatments 1, 2 and 3. The more extensive the dry tillage, the more clumps of unkilled rice and grass appeared. Most striking was the difference in growth between the treatments worked dry and treatment 4, which had merely been puddled. Puddling alone produced poor plants, shorter than those in the dry-tilled sub-plots. Whether one or two puddlings had been applied, the lower yield of treatment 1 in relation to 2 and 3 (an average difference of 601 kg/ha) must be mainly attributed to the poorer seedbed, which caused a thinner and less even stand. The seedbed preparation in treatments 1 to 3 by means of two wet operations, which showed markedly better results than a single puddling, resulted in an average yield increase of 457 kg/ha. In treatment 4 the extra puddling made no appreciable difference.
The plant density in treatment 4 was in each main plot about equal to that in 3. Only where the seedbed had been twice puddled did the stand in treatment 2 correspond fairly closely with that in 4. The relatively low yield with puddling alone was due to less tillering and a poorer growth of the crop on these heavily puddled subplots. Its average yield was 562 kg/ha less than that of treatment 3.
The second experiment was laid out on field 26. The dry operations were carried out between 11 and 15 October, after which the field was immediately submerged. On 19 and 20 October treatment 4 was puddled. On 25 October the field was prepared for sowing. Two days later it was sown with SML 140/10 at the rate of 110 kg/ha. The main difference from the preceding experiment was that after dry tillage the field was under water for a week longer, so that puddling produced a better seedbed and the weeds were more thoroughly destroyed. The results are to be found in table 6.
Table 6. Effects of various tillage practices on yield (in kg/ha) of SML 140/10.
Treatment number
1 2 3 4
Operation
shallow tillage normal tillage as 2, then levelled puddling alone
Seedbed preparation
once puddled
4114 4218 4788 4003
twice puddled
4959 4882 5176 4524
The dry working of treatments 1 to 3 and the wet working of 4 yielded much the same results as in the previous experiment. The effect of the second wet operation was clearly visible in treatments 1 and 2 by a better plant density and a more effective destruction of plant remains. On the whole a smoother
50
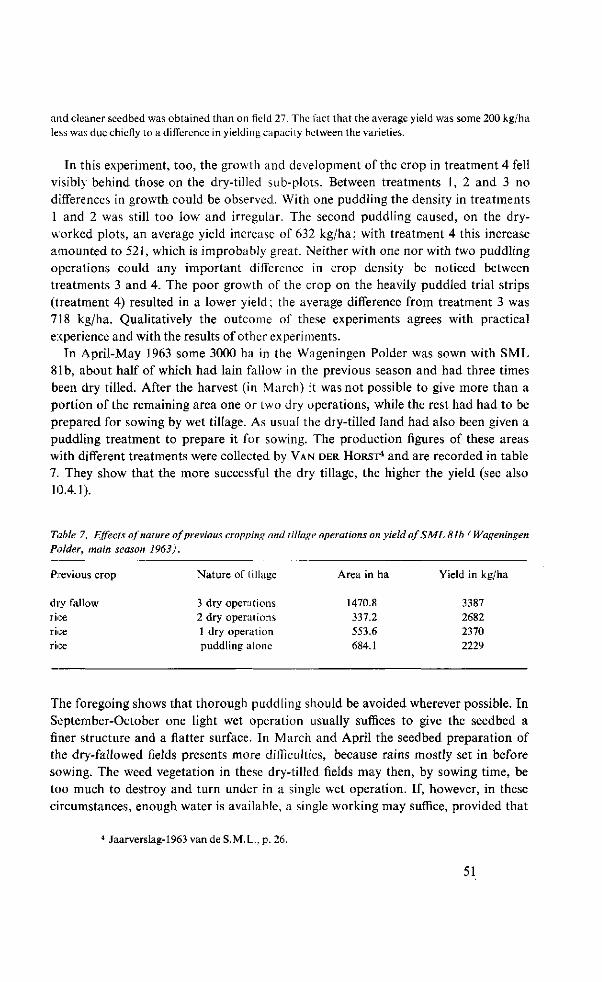
and cleaner seedbed was obtained than on field 27. The fact that the average yield was some 200 kg/ha less was due chiefly to a difference in yielding capacity between the varieties.
In this experiment, too, the growth and development of the crop in treatment 4 fell visibly behind those on the dry-tilled sub-plots. Between treatments 1, 2 and 3 no differences in growth could be observed. With one puddling the density in treatments 1 and 2 was still too low and irregular. The second puddling caused, on the dry-worked plots, an average yield increase of 632 kg/ha; with treatment 4 this increase amounted to 521, which is improbably great. Neither with one nor with two puddling operations could any important difference in crop density be noticed between treatments 3 and 4. The poor growth of the crop on the heavily puddled trial strips (treatment 4) resulted in a lower yield; the average difference from treatment 3 was 718 kg/ha. Qualitatively the outcome of these experiments agrees with practical experience and with the results of other experiments.
In April-May 1963 some 3000 ha in the Wageningen Polder was sown with SML 81b, about half of which had lain fallow in the previous season and had three times been dry tilled. After the harvest (in March) it was not possible to give more than a portion of the remaining area one or two dry operations, while the rest had had to be prepared for sowing by wet tillage. As usual the dry-tilled land had also been given a puddling treatment to prepare it for sowing. The production figures of these areas with different treatments were collected by VAN DER HORST4 and are recorded in table 7. They show that the more successful the dry tillage, the higher the yield (see also 10.4.1).
Table 7. Effects of nature of previous cropping and tillage operations on yield of SML 81b ( Wageningen Polder, main season 1963).
Previous crop
dry fallow rice rice rice
Nature of tillage
3 dry operations 2 dry operations 1 dry operation puddling alone
Area in ha
1470.8 337.2 553.6 684.1
Yield in kg/ha
3387 2682 2370 2229
The foregoing shows that thorough puddling should be avoided wherever possible. In September-October one light wet operation usually suffices to give the seedbed a finer structure and a flatter surface. In March and April the seedbed preparation of the dry-fallowed fields presents more difficulties, because rains mostly set in before sowing. The weed vegetation in these dry-tilled fields may then, by sowing time, be too much to destroy and turn under in a single wet operation. If, however, in these circumstances, enough water is available, a single working may suffice, provided that
4 Jaarverslag-1963 van de S.M.L., p. 26.
51
it is early and followed with a deep submersion of the field until sowing. If the minor seasons are dry and the major rainy season commences late, similar
difficulties may present themselves because lack of irrigation water prevents sowing until the rains have for some time set in. It will not be possible then to prepare the seedbed early and conserve it by covering the field with a deep layer of water. Under such conditions it is thought desirable to flatten the vegetation at a convenient time by driving over it, in part destroying it and pushing it below ground, and then to flood the field deep enough to check further growth of weeds. The ensuing final wet operation will then produce less harmful effects.
The experience at Wageningen and in the Prince Bernhard Polder is that after a very long intensely dry period, the crop can give high yields despite the thorough wet tillage which had to be applied to secure a weedfree seedbed. This result is largely ascribed to the favourable effects of such weather on the structure, permeability and the oxygen status of the soil, which render it less susceptible to the destructive effects of puddling.
3.5 The application of flood fallowing
3.5.1 Introduction
In the early years the rice in the Prince Bernhard Polder was usually sown dry and not flooded for about six weeks. Side by side with this, experiments were made with wet cultivation to enable a seedbed to be prepared also under adverse weather conditions. Here the seed was usually sown on mud, and flooded a few weeks later. In those years weeds (mainly grasses) became an increasingly grave problem because sowing in water still presented numerous difficulties, and preparation methods in wet weather were not yet satisfactory.
In the search for suitable implements and methods of obtaining a good weedfree seedbed under wet conditions it was found that this could be promoted by deep flooding for some time. This principle later resulted in a so-called flood fallowing, which implies that the soil is superficially worked under water and that next a deep layer of water is retained on the field until sowing. Thus, with the help of much water a good seedbed can be simply prepared and the crop will generally give higher yields than fields treated in the usual way. In later years many variations have been made on this method. Flood fallowing, however, has found little practical application because of an all-round improvement in cultural methods and the high demands on water supply.
3.5.2 Flood fallowing during an off-season
The practice of flood fallowing in the Prince Bernhard Polder is as follows. After the
52
main crop has been gathered, the land is worked dry; when the minor rainy season begins (November-December), the fields arc Hooded with a little water to promote the germination of rice and weed seeds (especially Nymphoides). A few weeks later the soil is roughly worked with a disc harrow (preferably without a drag) to loosen it, and partly destroy and bury the weeds. While the field is deep under water, the vegetation dies off and the seedbed acquires a more smooth and even surface and keeps free trom weeds. The subsequent sowing is preferably done in water.
The advantages of flood fallowing, enumerated by OVERWATER (1960), are a better distribution of work and better weed control, while it may also save expenses on tillage and care of the crop. In many cases substantially higher yields were obtained than with a dry fallow (about 500 kg/ha or more).
Little is yet known about the causes of better growth of the crop. The increase achieved is largely attributed to a better nitrogen supply. Among the causes suggested are nitrogen fixation by algae and less immobilization by buried plant residues. Besides, the seedbed feels loose and crumbly and probably has better permeability than a soil that could dry less thoroughly and had to be prepared by puddling. The early incorporation of weeds and rice stubble would probably ensure that the crop suffers little damage from reduction processes in the soil. This hypothesis is partly borne out by the experience that if weeds grow after a shortage of water and the field has to be prepared anew by one or more puddlings, the result will generally be a poor-growing and low-yielding crop (see also 10.3).
In Guyana a modified form of flood fallowing is used in sugar-cane cultivation (EIVANS, 1962). The better structure of the soil after drying is ascribed by EVANS to the effect of buried organic matter and to the presence of much free iron (see also AHMAD,
1963). Even if there is enough water, the management will often meet with practical and
financial obstacles to such water control, and the extra expense and loss of yield when flood fallowing fails, are obvious reasons why this method has been so rarely used during an off-season. Besides, the layout of the fields in the Wageningen Polder is heirdly suited to it (see 1.4).
3.5.3 Flood fallowing during a main season
At the Wageningen Project, generally, 75 % of the cultivated area is sown with a main crop. Normally, the remaining fields cannot usually be given any dry tillage, so that weed infestation is heavy, which is detrimental in many respects (see 3.2.5). Partly because these fields are marked with deep ruts of the combine harvester, the soil has poor drainage and is generally waterlogged in the major wet season. In such fields the flood fallowing practice deserves every attention. After the chances of dry cultivation are gone these fields ought to be flooded while there is enough water available.
The desirability of first flattening the vegetation is not known. Often the structure that had already formed will be partly lost again through such an operation; yet it is
53
questionable whether the complete killing of weeds can be ensured merely by a deep layer of water. Before the commencement of the major dry season the water should be drained off so that normal dry tillage can soon begin.
3.6 Summary
Considering the circumstances in which mechanical rice culture is practised in Surinam, the dry tillage should primarily be aimed at the recovery and improvement of the physical and chemical properties of the topsoil and the subsoil. As a result of hard and coarse clods it is not usually possible to form a good seedbed by dry tillage but by submerging and tilling under water.
The factors that promote or hinder drying and the build-up of soil structure, as well as the ways of promoting the desired processes, have been considered at great length. In dry tilling a shallow (some 12 to 15 cm) and mixing action is generally preferred as given by Rome offset disc harrows, which have proved most satisfactory in practice. If the fields are to be resown soon after harvest, dry tillage is fairly often undertaken under sub-optimum conditions because otherwise seedbed preparation had to be carried out by more thorough puddling.
Wet tillage or puddling is not merely applied as a final touch to the seedbed; it is also used where unfavourable weather prevents further dry operations. This practice may be detrimental to soil and crop, depending on the original state of the soil and the thoroughness of the puddling. Wet tillage can usually only be justified if it serves as a supplement to the dry working. As an emergency measure it often has to take over a larger or smaller portion of the dry tillage. It cannot, unfortunately, be dispensed with. The adverse effects through puddling must be restricted to a minimum. The implements now in use are not entirely satisfactory.
A sufficient supply of water for irrigation may considerably help in avoiding heavy puddling. In rainy weather the fields can then be prepared early, after which the seedbed is preserved under a deep layer of water. On the other hand, a provisional wet treatment may first be applied, after which an adequate depth of water checks further growth of the weeds and helps to kill the vegetation. When the field is eventually prepared for sowing, lighter or fewer operations will suffice. For fields which lie fallow in the major rainy season and on which are many weeds and much straw, the practice of flood fallowing is recommended.
54
4 Sowing
4.1 Introduction
In the mechanical cultivation of rice in Surinam the only method of sowing practised on a large scale is that of broadcasting the seed into water or onto a muddy surface. The crucial questions here are, firstly, how to create conditions that are favourable to germination and growth of rice and, secondly, how to prevent the growth of weeds. This implies that throughout the first few weeks, in sowing as well as in water management, a suitable compromise has to be found. During this period numerous circumstances may arise which have an adverse effect on the growth of the seedlings. To a considerable extent these circumstances determine the eventual plant density from a certain quantity of seed. Good water control and flat fields are prerequisites to minimize the detrimental effects.
Since a good even stand of the crop is required for a high yield, and because mistakes made during sowing and the following few weeks can hardly ever be corrected later, sowing practices and techniques and the management of water will be discussed at some length. These methods are adapted to the local conditions of soil, climate, varieties and cultural practice; changes in these may affect the most suitable method of seeding.
4.2 Important factors in sowing
4.2.1 Quality of the seed
Especially where conditions are unfavourable to germination and early growth, it is essential that use should be made of seed having a high hectolitre weight, viability and germination. Seed over eight months old is rarely used. Disinfection is with Panogen (2 ml per kg) as a fungicide. For fields where damage by Helodytes beetles is feared, the seed is simultaneously treated with an equal amount of 30% Dieldrin oil. Only if the Wageningen farms are supplied with seed that is still dormant does the Seed Farm refrain from applying Panogen as experience has taught that in this case the disinfectant is harmful to germination.
Seed to be sown in water or on mud is first germinated. The advantages of this practice have been pointed out by DE WIT (1960). Bags of seed (about 52 kg net) are soaked for 24 hours in an irrigation canal and thereby increase by some 30% in
55
weight (TAKAHASHI, 1960; MIKKELSEN and SINAII, 1961). It is then stored under a tarpaulin for 24 to 48 hours, varying according to the speed of germination and the method of sowing, and rewetted, if necessary, to prevent it from desiccation and from germinating too slowly. Prolonged germination may result in injury to the germs in sowing, thereby preventing a regular distribution. The use of pregerminated seed provides an effective check that the seed rice has good viability.
4.2.2 Quality of the water
For quick germination and successful seedling growth sufficiency of fresh and clear irrigation water is very important. The large water consumption and the slight flow of the Nickerie River in drought often cause a high silt content in the irrigation stream in the Wageningen Polder during the sowing period and some weeks after, because drainage water is pumped directly back into the irrigation canal. This turbid water reduces the transmission of sunlight and covers the submerged leaves of the seedlings with a film of mud, which adversely affects assimilation. In pot experiments (TEN HAVE, 1959b) it was found that in muddy water a far lower emergence was obtained than if clear water was used. These differences in emergence increased as the germinated seed was sown in a greater depth of water. Heavy showers will avert the harmful effects of muddy water.
If there is not enough irrigation water or if it has a rather high salt content (200 to 700 mg CI per litre), as much of the sowing is done in water as possible. High standards are required of the seedbed and of water management to avert the need of temporarily draining the field shortly afterwards. Relatively little is known as yet of the tolerance of the young crop to the salt content of soil and irrigation water. In early years the maximum salt content permitted in the irrigation water was 300 mg CI per litre, but afterwards this was raised successively to 500 and 700 mg CI per litre. Except in the most northerly fields in the Wageningen Polder, this temporary measure (during and after sowing) has had no adverse influence on grain yield.
It is very difficult to set a practical limit to the salt content in the water. In practice the fields, once sown, have to remain under water, and it is not known when fresh water will again be available. After a lock in the Arawarra River (fig. 1) is constructed, the fresh water supply to the Wageningen Project will improve gieatly. The final answer should be the building of a dam up the Nickerie River (the so-called Stondansi project).
In the Prince Bernhard Polder, too, a shortage of irrigation water occurs in years of drought. After the rains set in the water becomes a deep brown through dissolved or suspended organic substances which it contains. The use of this water during sowing is attended by risks from its low oxygen content, opacity and low pH. In 1958 a large proportion of the crop in this polder failed where the germinating rice had been flooded with this dark-brown water from the swamps. Yet it is not likely that this water was the only cause of the failure; it should rather be put down to a combination
56
of factors, such as a silty seedbed with much buried and partly decomposed organic matter and inadequate water control. Lack of oxygen and lack of light may have been important factors responsible for the death of the young plants. With regard to the oxygen content of the water CHAPMAN and PETERSON (1962) state that at temperatures between 25° and 35°C a minimum level of 4 p.p.m. by weight is required for good seedling establishment. At lower temperatures a smaller oxygen content suffices.
4.2.3 Properties of the seedbed
Although the germination of rice seed does not make a high demand on the oxygen supply of the environment (TAYLOR, 1942; VLAMIS and DAVIS, 1943), only a poor emergence is obtained where the seed is covered with both soil (or mud) and water (JONES, 1933a; DORE and THEVAN, 1959). On a silty seedbed part of the soaked or germinated seed generally comes to rest under a thin layer of mud, so that a thinner stand results. A further unfavourable influence on the establishment of the seedlings is exerted by entirely or partly buried, partly decomposed organic material. This may be through lack of oxygen (see PATRICK and STURGIS, 1955), but probably toxins play a part as well. Through the decomposition of the plant remains the standing water sometimes becomes less clear, and in dry and hot weather scum will often form on its surface, so that the leaves of the seedlings cannot emerge from the water and eventually die.
It is a general experience that much straw residue on the seedbed encourages the growth of algae. If a layer of water is retained on the field, these algae may cause a thin crop because the seedlings get wholly enveloped and cannot erect themselves above the water level. In combination with silty water algae can have particularly serious consequences.
On low-lying parts of the field it is difficult to obtain a good density. The seedbed is often poorer, while snails and Helodytes beetles also cause more damage there and along the ditch sides. Extra seed does not always bring the desired result because adverse factors to germination and early growth are there enhanced.
4.2.4 Weather conditions
Generally, an overcast sky and some rain is desirable for good seedling establishment. If the seed is broadcast on mud, a severe drought may dry out the seed and shrivel up the young shoots and roots. ISHIKAWA (1963) and COYAUD (1950) state that newly germinated rice seeds are reasonably resistant to temporary desiccation, but that the damage increases as germination advances. In dry weather seed should be broadcast on a thoroughly wet field or be germinated for a shorter time to reduce the damage from drought. In practice the ultimate damage is usually less than one might expect, because it occurs mainly in higher parts where plant density is usually greatest and
57
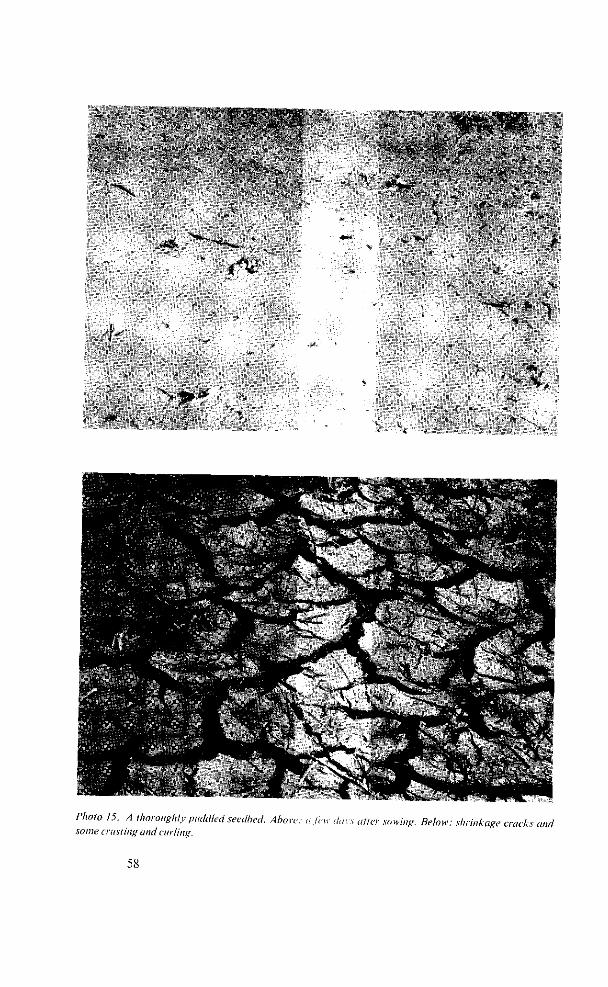
ife V
' 1 * V*
* ' " / 5 - A t'«»-°"gl<ly P'iddled seedbed. Above: a lew days after sowing. Below: shrinkage cracks and some crusting and curling.
58
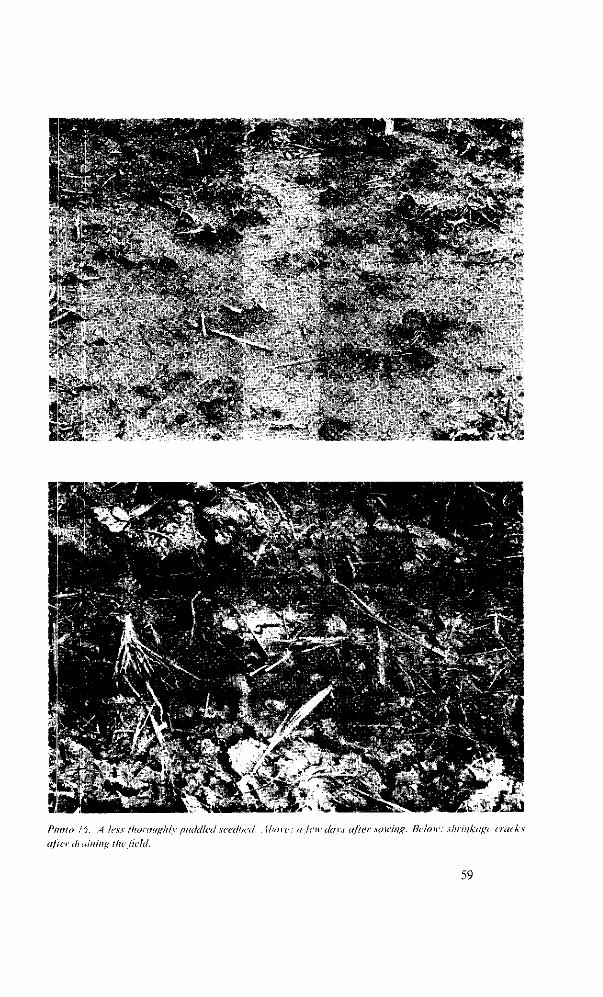
t , H .
«Cï 3 i
— • 4 r BÜI laMQu*.
» ». 1
Photo ,">. A less thoroughly puddled seedbed. Above: o Jew days after sowing. Below: shrinkage cracks after draining the field.
59
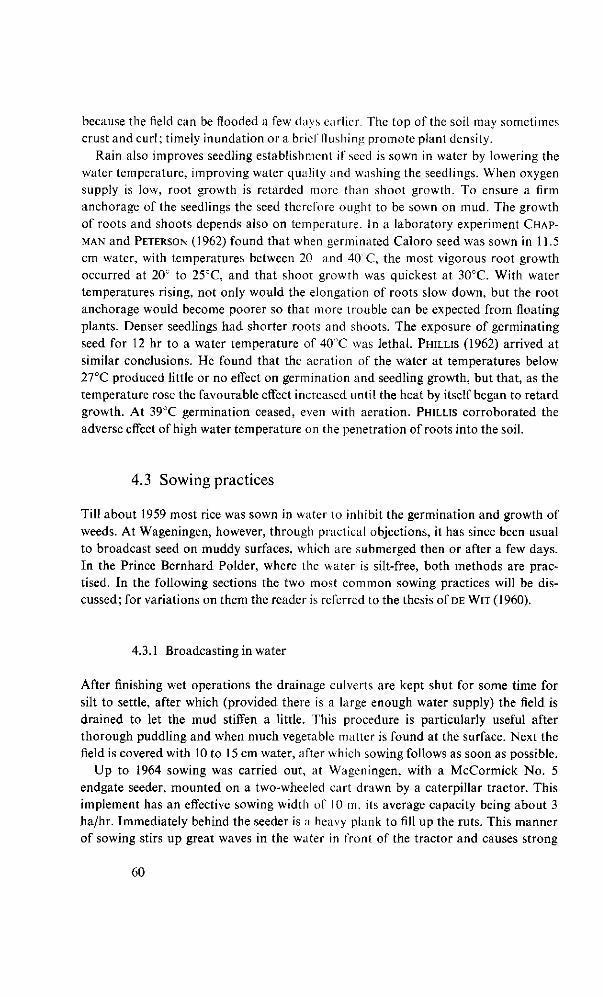
because the field can be flooded a few days earlier. The top of the soil may sometimes crust and curl; timely inundation or a brief Hushing promote plant density.
Rain also improves seedling establishment if seed is sown in water by lowering the water temperature, improving water quality and washing the seedlings. When oxygen supply is low, root growth is retarded more than shoot growth. To ensure a firm anchorage of the seedlings the seed therefore ought to be sown on mud. The growth of roots and shoots depends also on temperature. In a laboratory experiment CHAP
MAN and PETERSON (1962) found that when germinated Caloro seed was sown in 11.5 cm water, with temperatures between 20 and 40 C, the most vigorous root growth occurred at 20° to 25CC, and that shoot growth was quickest at 30°C. With water temperatures rising, not only would the elongation of roots slow down, but the root anchorage would become poorer so that more trouble can be expected from floating plants. Denser seedlings had shorter roots and shoots. The exposure of germinating seed for 12 hr to a water temperature of 40 C was lethal. PHILLIS (1962) arrived at similar conclusions. He found that the aeration of the water at temperatures below 27°C produced little or no effect on germination and seedling growth, but that, as the temperature rose the favourable effect increased until the heat by itself began to retard growth. At 39°C germination ceased, even with aeration. PHILLIS corroborated the adverse effect of high water temperature on the penetration of roots into the soil.
4.3 Sowing practices
Till about 1959 most rice was sown in water to inhibit the germination and growth of weeds. At Wageningen, however, through practical objections, it has since been usual to broadcast seed on muddy surfaces, which are submerged then or after a few days. In the Prince Bernhard Polder, where the water is silt-free, both methods are practised. In the following sections the two most common sowing practices will be discussed; for variations on them the reader is referred to the thesis of DE WIT (1960).
4.3.1 Broadcasting in water
After finishing wet operations the drainage culverts are kept shut for some time for silt to settle, after which (provided there is a large enough water supply) the field is drained to let the mud stiffen a little. This procedure is particularly useful after thorough puddling and when much vegetable matter is found at the surface. Next the field is covered with 10 to 15 cm water, after which sowing follows as soon as possible.
Up to 1964 sowing was carried out, at Wageningen, with a McCormick No. 5 endgate seeder, mounted on a two-wheeled cart drawn by a caterpillar tractor. This implement has an effective sowing width of 10 m, its average capacity being about 3 ha/hr. Immediately behind the seeder is a heavy plank to fill up the ruts. This manner of sowing stirs up great waves in the water in front of the tractor and causes strong
60
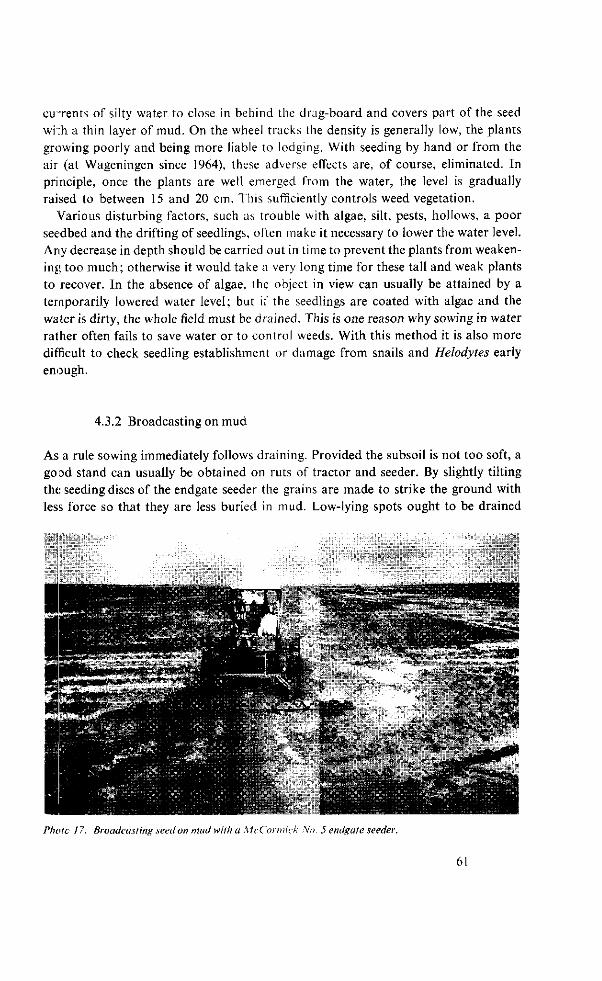
cirrents of silty water to close in behind the drag-board and covers part of the seed whh a thin layer of mud. On the wheel tracks the density is generally low, the plants growing poorly and being more liable to lodging. With seeding by hand or from the air (at Wageningen since 1964), these adverse effects are, of course, eliminated. In principle, once the plants are well emerged from the water, the level is gradually raised to between 15 and 20 cm. This sufficiently controls weed vegetation.
Various disturbing factors, such as trouble with algae, silt, pests, hollows, a poor seedbed and the drifting of seedlings, often make it necessary to lower the water level. Any decrease in depth should be carried out in time to prevent the plants from weakening too much; otherwise it would take a very long time for these tall and weak plants to recover. In the absence of algae, the object in view can usually be attained by a temporarily lowered water level; but if the seedlings are coated with algae and the water is dirty, the whole field must be drained. This is one reason why sowing in water rather often fails to save water or to control weeds. With this method it is also more difficult to check seedling establishment or damage from snails and Helodytes early enough.
4.3.2 Broadcasting on mud
As a rule sowing immediately follows draining. Provided the subsoil is not too soft, a good stand can usually be obtained on ruts of tractor and seeder. By slightly tilting the seeding discs of the endgate seeder the grains are made to strike the ground with less force so that they are less buried in mud. Low-lying spots ought to be drained
•:;1•Afjrtrh••':^-;' r • AT- *...*-.'=" "Aifcie M• ' ï^< ! i , ,
- ^ • * a - J — • * * - - — * '— —
f«*-^jl"***F!
ji'4P
• t . r « ' - > •
"V" "* "V *"f:*
Photo 17. Broadcasting seed on mud with a McConnick No. 5 endgate seeder
m
before seeding, for in dry and sunny weather pools become so hot that no seedlings emerge.
While the field is still drained it is easy lo check establishment. Sometimes birds eat seed, while even caterpillars may destroy the seedlings a few days after sowing. Prompt action (chemical control or submersion) is imperative for caterpillars. The fields are submerged usually four to eight days after seeding unless conditions are considered too unfavourable, when flooding may take place a few days later and the level may be gradually raised. Whatever the method, farm managers need much caution, skill and experience to obviate the many difficulties and to achieve a good density of crop with few weeds.
4.3.3 Final remarks
Optimum seeding times in connection with tillage, harvest, cropping system, duration of growth and climate are clearly described by DE WIT (1960). For the main crop at Wageningen (about 5300 ha) sowing lasts about 7 weeks from the beginning of April till mid May. A shorter period (desirable for the control of pests and diseases) is technically possible for tillage and cultural practices, but would cause difficulties in harvesting. The pace of harvesting operations would then fall behind that at which the crop matured, which would entail loss of quality, higher harvesting costs and loss of yield (chapter 11). For the same reason a 4i-week period, extending from 15 October till 15 November, is reserved for the off-season crop (chapter 10).
The order in which the different varieties are sown depends on their characteristics, such as duration of growth and resistance to lodging and adverse soil conditions. Varieties with the longest growth duration are preferably sown last. This is particularly important for a main crop because late sowing causes slightly earlier flowering (see 10.2.2), ripening is a little more quickly in the major dry season, and the physical soil condition of the last sown area is generally worst, which likewise makes for a somewhat shorter period of growth.
Enough seed should be reserved for supplementary sowing of ditch sides and low spots. The distribution of seed over the field should be such that a good plant density may be expected throughout. In case the seedling establishment should nevertheless turn out below the expectation, seed may still be successfully supplemented during the first week after sowing. For supplementary sowing seed should be longer preger-minated and should be of varieties with a quick initial growth and a somewhat shorter growth duration. This will not there raise great objections in grain quality.
The additional sowing should be done with care lest the whole field may afterwards have to be worked and sown all over again. According to the original state of the soil, such renewed puddling operations will affect the germination and growth of the second sowing and the negotiability of the field. Reseeding must be considered very carefully to avoid disappointments and loss of time, especially if the field is again cropped with rice in the next season.
62
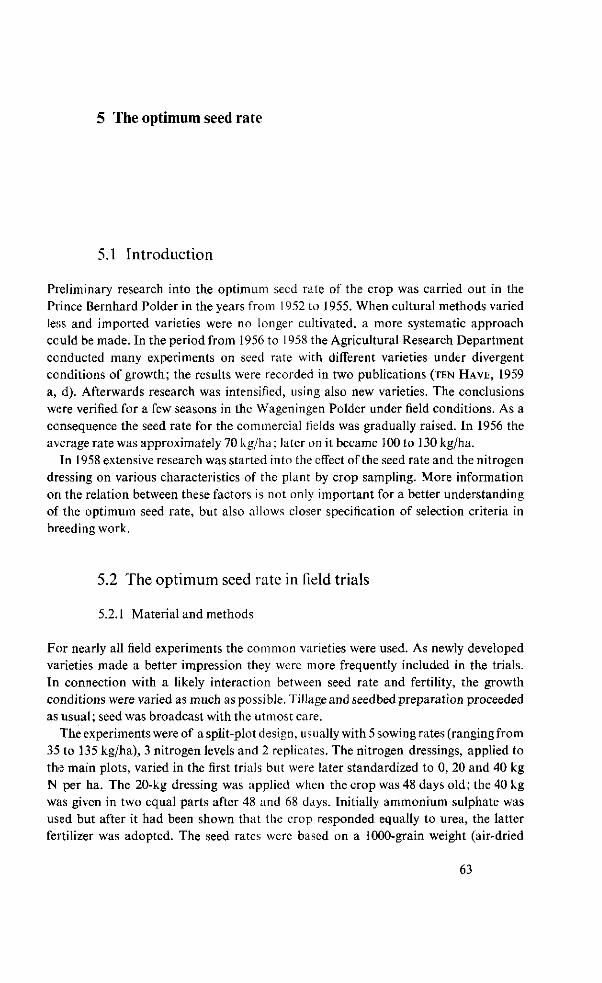
5 The optimum seed rate
5.1 Introduction
Preliminary research into the optimum seed rate of the crop was carried out in the Prince Bernhard Polder in the years from 1952 to 1955. When cultural methods varied less and imported varieties were no longer cultivated, a more systematic approach cculd be made. In the period from 1956 to 1958 the Agricultural Research Department conducted many experiments on seed rate with different varieties under divergent conditions of growth; the results were recorded in two publications (TEN HAVE, 1959 a, d). Afterwards research was intensified, using also new varieties. The conclusions were verified for a few seasons in the Wageningen Polder under field conditions. As a consequence the seed rate for the commercial fields was gradually raised. In 1956 the average rate was approximately 70 kg/ha ; later on it became 100 to 130 kg/ha.
In 1958 extensive research was started into the effect of the seed rate and the nitrogen dressing on various characteristics of the plant by crop sampling. More information on the relation between these factors is not only important for a better understanding of the optimum seed rate, but also allows closer specification of selection criteria in breeding work.
5.2 The optimum seed rate in field trials
5.2.1 Material and methods
For nearly all field experiments the common varieties were used. As newly developed varieties made a better impression they were more frequently included in the trials. In connection with a likely interaction between seed rate and fertility, the growth conditions were varied as much as possible. Tillage and seedbed preparation proceeded as usual; seed was broadcast with the utmost care.
The experiments were of a split-plot design, usually with 5 sowing rates (ranging from 35 to 135 kg/ha), 3 nitrogen levels and 2 replicates. The nitrogen dressings, applied to the main plots, varied in the first trials but were later standardized to 0, 20 and 40 kg N per ha. The 20-kg dressing was applied when the crop was 48 days old; the 40 kg was given in two equal parts after 48 and 68 days. Initially ammonium sulphate was used but after it had been shown that the crop responded equally to urea, the latter fertilizer was adopted. The seed rates were based on a 1000-grain weight (air-dried
63
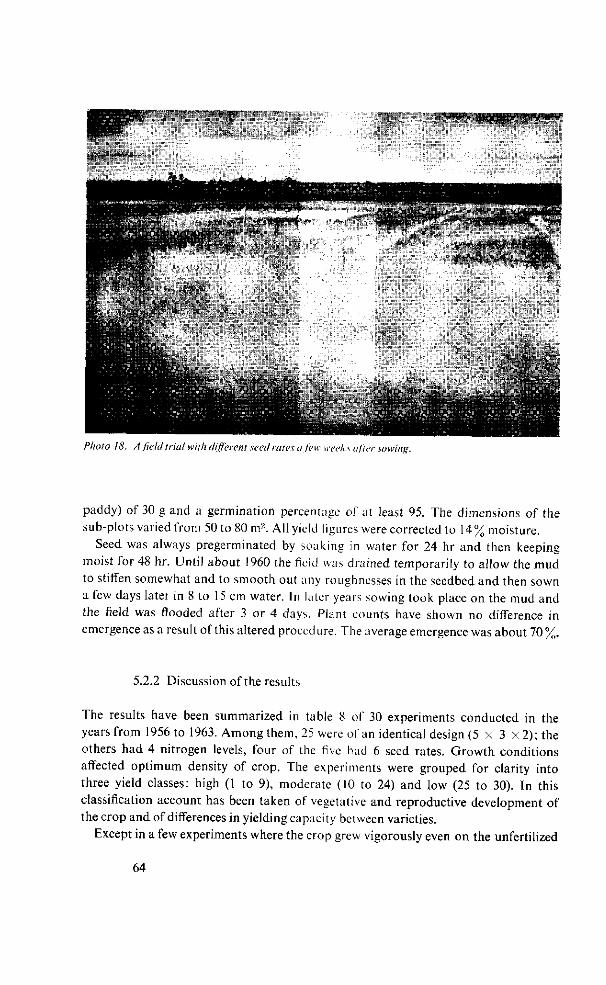
L 1 »:•.•*!
v&ïàtejj
P/io/o 18. A field trial with different seed rates a few week v after sowing.
paddy) of 30 g and a germination percentage of at least 95. The dimensions of the sub-plots varied from 50 to 80 m2. All yield figures were corrected to 14 % moisture.
Seed, was always pregerminated by soaking in water for 24 hr and then keeping moist for 48 hr. Until about 1960 the field was drained temporarily to allow the mud to stiffen somewhat and to smooth out any roughnesses in the seedbed and then sown a few days latei in 8 to 15 cm water. In later years sowing took place on the mud and the field was flooded after 3 or 4 days. Plant counts have shown no difference in emergence as a result of this altered procedure. The average emergence was about 70%.
5.2.2 Discussion of the results
The results have been summarized in table 8 of 30 experiments conducted in the years from 1956 to 1963. Among them, 25 were of an identical design (5 X 3 x2); the others had 4 nitrogen levels, four of the five had 6 seed rates. Growth conditions affected optimum density of crop. The experiments were grouped for clarity into three yield classes: high (1 to 9), moderate (10 to 24) and low (25 to 30). In this classification account has been taken of vegetative and reproductive development of the crop and of differences in yielding capacity between varieties.
Except in a few experiments where the crop grew vigorously even on the unfertilized
64
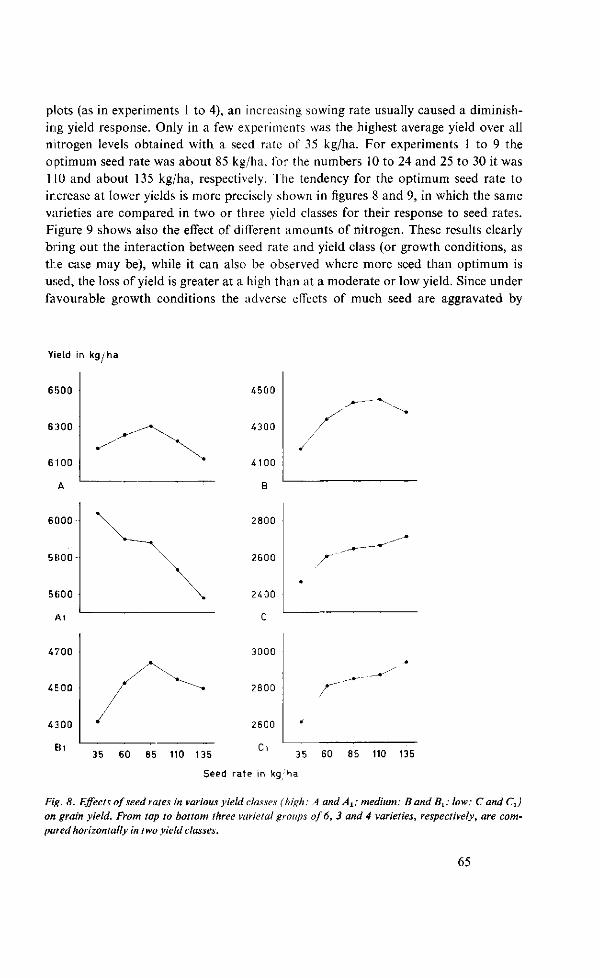
plots (as in experiments 1 to 4), an increasing sowing rate usually caused a diminishing yield response. Only in a few experiments was the highest average yield over all nitrogen levels obtained with a seed rate of 35 kg/ha. For experiments 1 to 9 the optimum seed rate was about 85 kg/ha, for the numbers 10 to 24 and 25 to 30 it was 110 and about 135 kg/ha, respectively. The tendency for the optimum seed rate to increase at lower yields is more precisely shown in figures 8 and 9, in which the same varieties are compared in two or three yield classes for their response to seed rates. Figure 9 shows also the effect of different amounts of nitrogen. These results clearly bring out the interaction between seed rate and yield class (or growth conditions, as the case may be), while it can also be observed where more seed than optimum is used, the loss of yield is greater at a high than at a moderate or low yield. Since under favourable growth conditions the adverse effects of much seed are aggravated by
Yield in kg /ha
6!5O0
6 : ÎOO
6100
A
6000
5(100
5fi00
A i
4700
4E00
4300
Eh
4500
4300
4100
B
2800
2600
2400
C
3000
2800
2600
Ci
A'
35 60 85 110 135 " " 35 60 85 110 135
Seed rate in kg ha
Fig. 8. Effects of seed rates in various yield classes (high: A and Ax; medium: B and B±; low: C and Cr) on grain yield. From top to bottom three varietal groups of 6, 3 and 4 varieties, respectively, are corn-par ed horizontally in two yield classes.
65
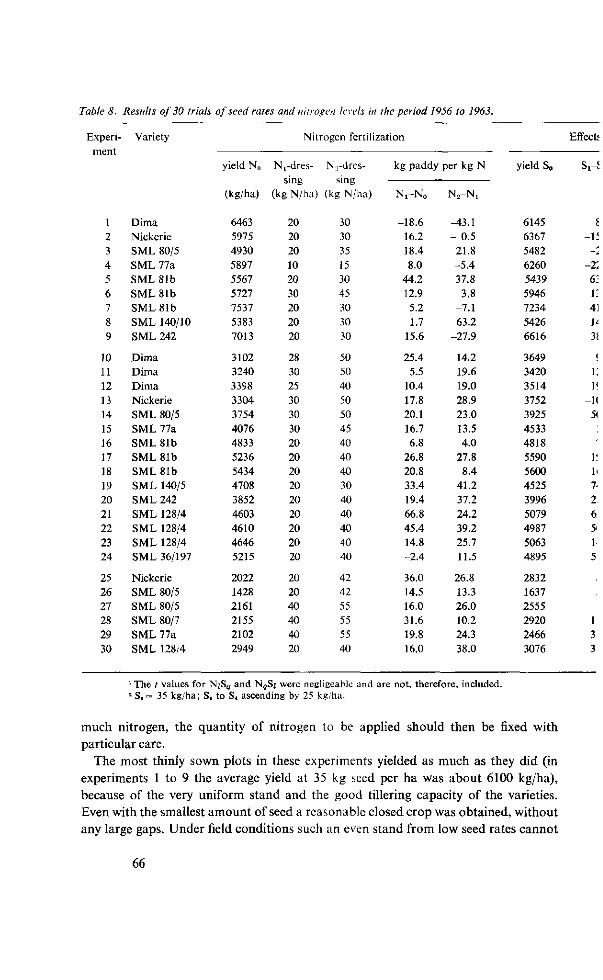
Table 8. Results of 30 trials of seed rates and nitrogen levels in the period 1956 to 1963.
Experiment
1 2 3 4 5 6 7 8 9
10 11 12 13 14 15 16 17 18 19 20 21 22 23 24
25 26 27 28 29 30
Variety
Dima Nickerie SML 80/5 SML 77a SML 81b SML 81b SML 81b SML 140/10 SML 242
Dima Dima Dima Nickerie SML 80/5 SML 77a SML 81b SML 81b SML 81b SML 140/5 SML 242 SML 128/4 SML 128/4 SML 128/4 SML 36/197
Nickerie SML 80/5 SML 80/5 SML 80/7 SML 77a SML 128/4
yield N0
(kg/ha)
6463 5975 4930 5897 5567 5727 7537 5383 7013
3102 3240 3398 3304 3754 4076 4833 5236 5434 4708 3852 4603 4610 4646 5215
2022 1428 2161 2155 2102 2949
Nitrogen fertilization
^ - d r e s
sing (kg N/ha)
20 20 20 10 20 30 20 20 20
28 30 25 30 30 30 20 20 20 20 20 20 20 20 20
20 20 40 40 40 20
Nj-dres-
sing (kg N/ha)
30 30 35 15 30 45 30 30 30
50 50 40 50 50 45 40 40 40 30 40 40 40 40 40
42 42 55 55 55 40
kg paddy
Ni-N»
-18.6 16.2 18.4 8.0
44.2 12.9 5.2 1.7
15.6
25.4 5.5
10.4 17.8 20.1 16.7 6.8
26.8 20.8 33.4 19.4 66.8 45.4 14.8 -2.4
36.0 14.5 16.0 31.6 19.8 16.0
per kg N
Ns-Ni
-43.1 - 0.5 21.8 -5.4 37.8 3.8
-7.1 63.2
-27.9
14.2 19.6 19.0 28.9 23.0 13.5 4.0
27.8 8.4
41.2 37.2 24.2 39.2 25.7 11.5
26.8 13.3 26.0 10.2 24.3 38.0
yield S0
6145 6367 5482 6260 5439 5946 7234 5426 6616
3649 3420 3514 3752 3925 4533 4818 5590 5600 4525 3996 5079 4987 5063 4895
2832 1637 2555 2920 2466 3076
Effects
Si - !
t -If
—z
-2 ; 61 i: 41 U 3)
e
i: 1!
-K 51
1! li
7. 2. 6 5' 1 5
1 3 3
1 The t values for N;Sg and N4Sj were négligeable and are not, therefore, included. 2 S, = 35 kg/ha; St to Si ascending by 25 kg/ha.
much nitrogen, the quantity of nitrogen to be applied should then be fixed with particular care.
The most thinly sown plots in these experiments yielded as much as they did (in experiments 1 to 9 the average yield at 35 kg seed per ha was about 6100 kg/ha), because of the very uniform stand and the good tillering capacity of the varieties. Even with the smallest amount of seed a reasonable closed crop was obtained, without any large gaps. Under field conditions such an even stand from low seed rates cannot
66
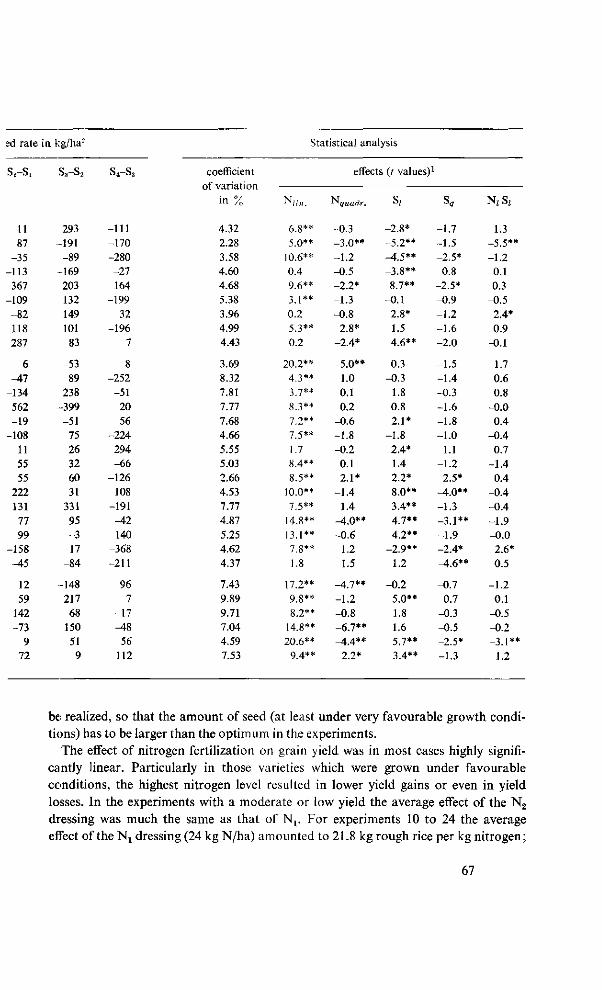
ed rate
S2-SI
-11 87
-35 -113 367
-109 -82 118 287
6 -Al
-134 562 -19
-108 11 55 55
222 131 77 99
-158 -45
12 59
142 -73
9 72
in kg/ha2
s3-s2
-293 -191 -89
-169 203 132 149 101 83
-53 89
238 -399 -51
75 26 32 60 31
331 95 -3 17
-84
-148 217 68
150 51 9
S4-S3
-111 -170 -280 -27 164
-199 32
-196 7
8 -252 -51
20 56
-224 294 -66
-126 108
-191 -42 140
-368 -211
96 7
-17 ^ 8 56
112
coefficient of variation
in %
4.32 2.28 3.58 4.60 4.68 5.38 3.96 4.99 4.43
3.69 8.32 7.81 7.77 7.68 4.66 5.55 5.03 2.66 4.53 7.77 4.87 5.25 4.62 4.37
7.43 9.89 9.71 7.04 4.59 7.53
Statistical analysis
N„„.
-6.8** 5.0**
10.6** 0.4 9.6** -3 1 * *
0.2 5.3** 0.2
20.2** 4.3** ^ 7**
8.3** •7 2 * *
7 5**
1.7 8.4** 8.5**
10.0** j 5**
14.8** 13.1** 7.8** 1.8
17.2** Q Q * *
8.2** 14.8** 20.6**
q A **
effect!
^quadr.
-0.3 -3.0** -1.2 -0.5 -2.2* -1.3 -0.8
2.8* -2.4*
-5.0** 1.0 0.1 0.2
-0.6 -1.8 -0.2 0.1
- 2 . 1* -1.4
1.4 ^1.0** -0.6
1.2 1.5
,-17**
-1.2 -0.8 -6.7** _4,4**
2.2*
; (/ values)
Si
-2.8* -5.2** -4.5** -3.8** 8.7**
-0.1 2.8* 1.5 4.6**
0.3 -0.3
1.8 0.8 2.1*
-1.8 2.4* 1.4 2.2* 8.0** 3.4** 4.7** 4.2**
_2 o** 1.2
-0.2 5.0** 1.8 1.6 5 7**
3.4**
L
s9
-1.7 -1.5 -2.5* 0.8
-2.5* -0.9 -1.2 -1.6 -2.0
-1.5 -1.4 -0.3 -1.6 -1.8 -1.0
1.1 -1.2 -2.5*
^ o * * -1.3 -3 .1** -1.9 -2.4* ^t.6**
-0.7 0.7
-0.3 -0.5 -2.5* -1.3
N ( Sj
-1.3 -5.5** -1.2 0.1 0.3
-0.5 2.4* 0.9
-0.1
1.7 0.6 0.8
-0.0 0.4
-0.4 0.7
-1.4 -0.4 -0.4 -0.4 -1.9 -0.0 2.6* 0.5
-1.2 0.1
-0.5 -0.2 -3 .1**
1.2
be: realized, so that the amount of seed (at least under very favourable growth conditions) has to be larger than the optimum in the experiments.
The effect of nitrogen fertilization on grain yield was in most cases highly significantly linear. Particularly in those varieties which were grown under favourable conditions, the highest nitrogen level resulted in lower yield gains or even in yield losses. In the experiments with a moderate or low yield the average effect of the N2
dressing was much the same as that of N,. For experiments 10 to 24 the average effect of the Nx dressing (24 kg N/ha) amounted to 21.8 kg rough rice per kg nitrogen;
67
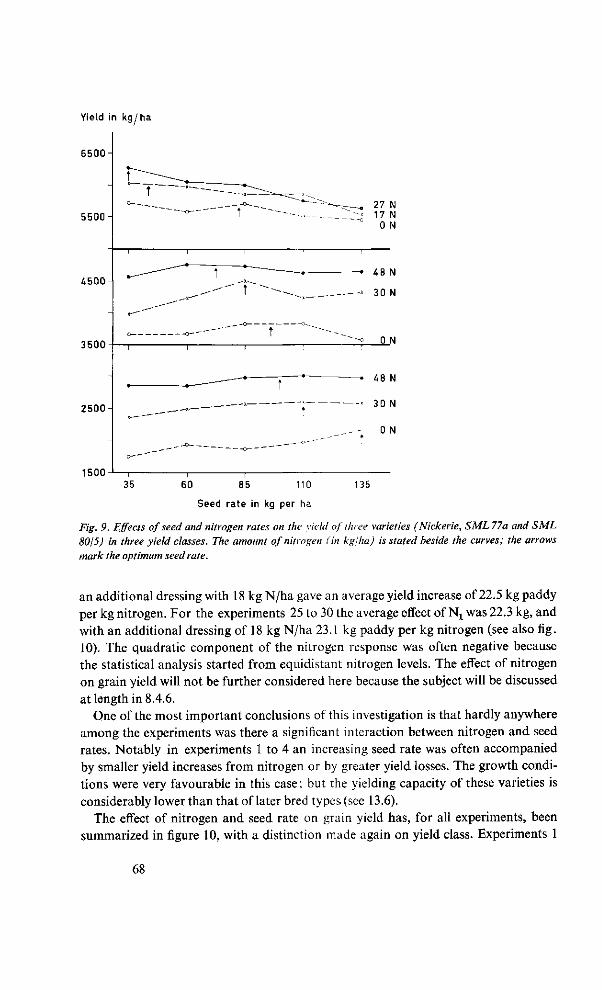
Yield in kg / ha
6500
5500
4500
3500
2 5 0 0 -
1500
27 N 17 N
0 N
48 N
30 N
0 N
35 60 85 110
Seed rate in kg per ha
135
Fig. 9. Effects of seed and nitrogen rates on the yield of three varieties (Nickerie, SML 77a and SML 80/5) in three yield classes. The amount of nitrogen (in kg/ha) is stated beside the curves; the arrows mark the optimum seed rate.
an additional dressing with 18 kg N/ha gave an average yield increase of 22.5 kg paddy per kg nitrogen. For the experiments 25 to 30 the average effect of Nx was 22.3 kg, and with an additional dressing of 18 kg N/ha 23.1 kg paddy per kg nitrogen (see also fig. 10). The quadratic component of the nitrogen response was often negative because the statistical analysis started from equidistant nitrogen levels. The effect of nitrogen on grain yield will not be further considered here because the subject will be discussed at length in 8.4.6.
One of the most important conclusions of this investigation is that hardly anywhere among the experiments was there a significant interaction between nitrogen and seed rates. Notably in experiments 1 to 4 an increasing seed rate was often accompanied by smaller yield increases from nitrogen or by greater yield losses. The growth conditions were very favourable in this case: but the yielding capacity of these varieties is considerably lower than that of later bred types (see 13.6).
The effect of nitrogen and seed rate on grain yield has, for all experiments, been summarized in figure 10, with a distinction made again on yield class. Experiments 1
68
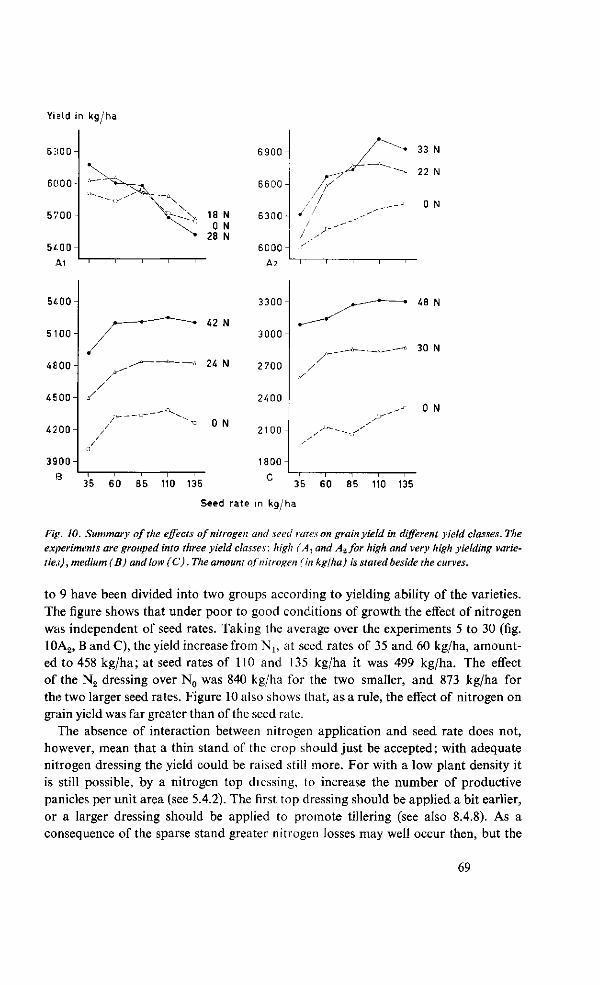
Yield i
6 : i 00 -
6000
5 7 0 0 -
5400
Ai
5400
5100
4800
4500
4200
3900-
13
n kg/ha
6 9 0 0 -
6 6 0 0 -
6 3 0 0 -
6 0 0 0 -
/T /7
/ ^ y
.-""
33 N
22 N
0 N
/ /
A / / / / fl
u- ^ ' ^ ^ ~ r i
42 N
0 N
35 60 85 110 135
A2
3 3 0 0 -
3000
2700
2400
2 1 0 0 -
1800-
C
48 N
30 N
0 N
- 1 - i 1 1 1 —
35 60 85 110 135
Seed rate in kg/ha
Fig. 10. Summary of the effects of nitrogen and seed rates on grainyield in different yield classes. The experiments are grouped into three yield classes: high (Ax and A2for high and very high yielding varieties), medium (B) and low (C). The amount of nitrogen (in kglha) is stated beside the curves.
to 9 have been divided into two groups according to yielding ability of the varieties. The figure shows that under poor to good conditions of growth the effect of nitrogen was independent of seed rates. Taking the average over the experiments 5 to 30 (fig. 10A2, B and C), the yield increase from Nx, at seed rates of 35 and 60 kg/ha, amounted to 458 kg/ha; at seed rates of 110 and 135 kg/ha it was 499 kg/ha. The effect of the N2 dressing over N0 was 840 kg/ha for the two smaller, and 873 kg/ha for the two larger seed rates. Figure 10 also shows that, as a rule, the effect of nitrogen on grain yield was far greater than of the seed rate.
The absence of interaction between nitrogen application and seed rate does not, however, mean that a thin stand of the crop should just be accepted; with adequate nitrogen dressing the yield could be raised still more. For with a low plant density it is still possible, by a nitrogen top dressing, to increase the number of productive panicles per unit area (see 5.4.2). The first top dressing should be applied a bit earlier, or a larger dressing should be applied to promote tillering (see also 8.4.8). As a consequence of the sparse stand greater nitrogen losses may well occur then, but the
69
efficiency of nitrogen fertilization is so great with these varieties that such losses are not an objection. Larger nitrogen dressings can be applied at an early stage here without taking any great risks, since the chances of lodging will chiefly occur where nitrogen is applied late or the crop is dense.
The higher the plant density, the sooner and the more clearly are symptoms of nitrogen deficiency, so that a positive interaction between seed rate and nitrogen application might in fact be expected in consequence of a better utilization of the nitrogen when applied to more densely sown fields. That this was not clear may be due to an inadequate design of the experiments. Besides, lodging may cause a negative interaction.
The optimum seed rate bears an essential and close relation to the balance between assimilation and respiration. YAMADA (1963) records that photosynthesis of rice plants at first rises rectilinearly with total leaf area, but then levels off. This decrease in photosynthetic rate per unit leaf-area is attributed to a lower light intensity, resulting from the increasing mutual shading of the leaves. Yet respiration rises proportionally with increasing leaf area, so that the net increase in dry matter has an optimum. A greater leaf area than the optimum exerts an unfavourable effect on dry matter production. The light requirement of rice plants will therefore increase with age and with closer spacing (TAKEDA and MARUTA, 1955).
Between the leaf area index (the total leaf area per unit ground area) and the light-transmission ratio (the light intensity at ground level expressed as a percentage of that at the top of the plants) a negative logarithmic relation has been found (see TANAKA et al., 1964). The leaf area index depends on plant habit and increases with nitrogen or closer spacing. In leafy varieties with broad and drooping foliage an unfavourable balance is therefore apt to occur between photosynthesis and respiration. Such varieties usually have a low grain-to-straw ratio, so that nitrogen often yields only slightly more grain and may even yield less. This situation is aggravated by narrow spacing or poor light (TANAKA et al., 1964; TANAKA, 1965b).
Varieties which respond favourably to nitrogen in grain yield are generally shorter, of compact tillering habit with erect tillers and stiff, upright leaves, and usually with a favourable grain-to-straw ratio. It will be clear that such varieties are better suited to higher seed rates or more nitrogen than are the first group. For an ample discussion on photosynthesis, respiration and nitrogen response in rice see MURATA (1965) and TANAKA et al. (1966). In conclusion, the variety (plant type, tillering capacity), the fertility of the soil, the seed rate and the nitrogen dressing should all be directed towards a maximum utilization of available sunlight.
Among the SML varieties tested no major differences were found in their reaction to seed rate. This is understandable if one considers that these varieties much resemble each other in habit and that selection had always been made for stiff straw and favourable response to nitrogen (see 13.2). Also in regard to nitrogen fertilizing these varieties, except Paradijs, react in much the same way (see 8.4.6). Both Paradijs and Dima may start rather rapidly developing too strong a vegetative growth, so that
70
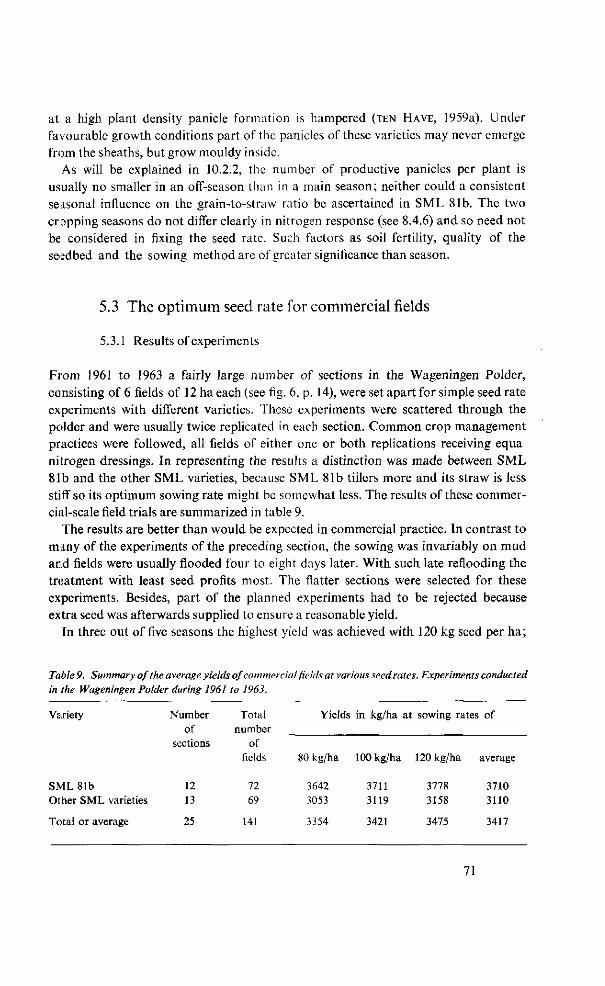
at a high plant density panicle formation is hampered (TEN HAVE, 1959a). Under favourable growth conditions part of the panicles of these varieties may never emerge from the sheaths, but grow mouldy inside.
As will be explained in 10.2.2, the number of productive panicles per plant is usually no smaller in an off-season than in a main season; neither could a consistent seasonal influence on the grain-to-straw ratio be ascertained in SML 81b. The two cropping seasons do not differ clearly in nitrogen response (see 8.4.6) and so need not be considered in fixing the seed rate. Such factors as soil fertility, quality of the seedbed and the sowing method are of greater significance than season.
5.3 The optimum seed rate for commercial fields
5.3.1 Results of experiments
From 1961 to 1963 a fairly large number of sections in the Wageningen Polder, consisting of 6 fields of 12 ha each (see fig. 6, p. 14), were set apart for simple seed rate experiments with different varieties. These experiments were scattered through the polder and were usually twice replicated in each section. Common crop management practices were followed, all fields of either one or both replications receiving equa nitrogen dressings. In representing the results a distinction was made between SML 81b and the other SML varieties, because SML 81b tillers more and its straw is less stiff so its optimum sowing rate might be somewhat less. The results of these commercial-scale field trials are summarized in table 9.
The results are better than would be expected in commercial practice. In contrast to many of the experiments of the preceding section, the sowing was invariably on mud and fields were usually flooded four to eight days later. With such late reflooding the treatment with least seed profits most. The flatter sections were selected for these experiments. Besides, part of the planned experiments had to be rejected because extra seed was afterwards supplied to ensure a reasonable yield.
In three out of five seasons the highest yield was achieved with 120 kg seed per ha;
Table 9. Summary of the average yields of commercial fields at various seed rates. Experiments conducted
in the Wageningen Polder during 1961 to 1963.
Variety
SML 81b Other SML varieties
Total or average
Number of
sections
12 13
25
Total number
of fields
72 69
141
Yields
80 kg/ha
3642 3053
3354
in kg/ha at sowing rates
100 kg/ha
3711 3119
3421
120 kg/ha
3778 3158
3475
1 of
average
3710 3110
3417
71
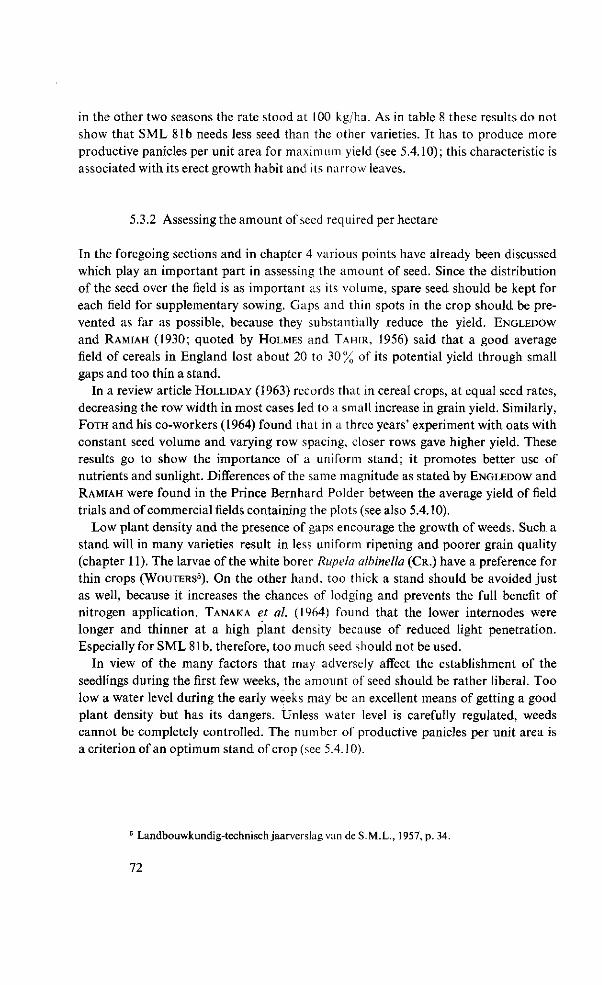
in the other two seasons the rate stood at 100 kg/ha. As in table 8 these results do not show that SML 81b needs less seed than the other varieties. It has to produce more productive panicles per unit area for maximum yield (see 5.4.10); this characteristic is associated with its erect growth habit and its narrow leaves.
5.3.2 Assessing the amount of seed required per hectare
In the foregoing sections and in chapter 4 various points have already been discussed which play an important part in assessing the amount of seed. Since the distribution of the seed over the field is as important as its volume, spare seed should be kept for each field for supplementary sowing. Gaps and thin spots in the crop should be prevented as far as possible, because they substantially reduce the yield. ENGLEDOW
and RAMIAH (1930; quoted by HOLMES and TAHIR, 1956) said that a good average field of cereals in England lost about 20 to 30 % of its potential yield through small gaps and too thin a stand.
In a review article HOLLIDAY (1963) records that in cereal crops, at equal seed rates, decreasing the row width in most cases led to a small increase in grain yield. Similarly, FOTH and his co-workers (1964) found that in a three years' experiment with oats with constant seed volume and varying row spacing, closer rows gave higher yield. These results go to show the importance of a uniform stand; it promotes better use of nutrients and sunlight. Differences of the same magnitude as stated by ENGLEDOW and RAMIAH were found in the Prince Bernhard Polder between the average yield of field trials and of commercial fields containing the plots (see also 5.4.10).
Low plant density and the presence of gaps encourage the growth of weeds. Such a stand will in many varieties result in less uniform ripening and poorer grain quality (chapter 11). The larvae of the white borer Rupela albinella (CR.) have a preference for thin crops (WOUTERS5). On the other hand, too thick a stand should be avoided just as well, because it increases the chances of lodging and prevents the full benefit of nitrogen application. TANAKA et al. (1964) found that the lower internodes were longer and thinner at a high plant density because of reduced light penetration. Especially for SML 81b, therefore, too much seed should not be used.
In view of the many factors that may adversely affect the establishment of the seedlings during the first few weeks, the amount of seed should be rather liberal. Too low a water level during the early weeks may be an excellent means of getting a good plant density but has its dangers. Unless water level is carefully regulated, weeds cannot be completely controlled. The number of productive panicles per unit area is a criterion of an optimum stand of crop (see 5.4.10).
5 Landbouwkundig-technisch jaarverslag van de S.M.L., 1957, p. 34.
72
5.4 Effect of seed and nitrogen rates on some plant characteristics
In the previous sections grain yield was regarded as the chief criterion of optimum seed rate. Since grain yield depends on a number of yield components, the effects on them of seed rate and nitrogen application were studied. This work was confined to plant properties of practical importance because circumstances did not permit deeper study.
5.4.1 Material and methods
Samples were taken in some of the field trials with seed rates and nitrogen levels, whose grain yields have already been given in table 8. The crop was sampled with 50 X 50 cm frames of 4-mm-thick welding wire. When the plants were about four weeks old, the frames were carefully placed in the sub-plots where the plant density was typical for the plot. Preliminary investigations, like subsequent random tests, proved that about 70% emergence of the seed could be expected. The position of the frames was not fixed until the number of plants enclosed differed by not more than 3 to 5 from the number expected.
The design was identical with that of the field experiments, consisting of 5 seed rates and 3 nitrogen levels. The usual practice was to sample the best replicate in each field trial with at least 30 frames (often the number was twice as large). In all, 1065 frames were placed in 20 field trials and the following numbers of plants were counted at the seed rates stated :
Seed in Average number of Average number of kg/ha plants per sample plants per m2
35 18.6 74 60 33.5 134 85 48.2 193
110 63.0 252 135 78.2 313
The frames remained on the ground throughout growth and the plants were treated like the rest of the sub-plot. Just before the harvest of the field all plants within a frame were cut close to the ground, sheaved and dried. The principal data collected were: weight of grain and straw, number of productive panicles per plant (effective tillering), plant height and length and weight of panicle. Any panicle with at least a few filled grains was classed as productive. Panicle weight was defined as cleaned paddy per panicle. All weights relate to air-dried material. The experiment numbers in some of the tables refer to field experiments in table 8.
73
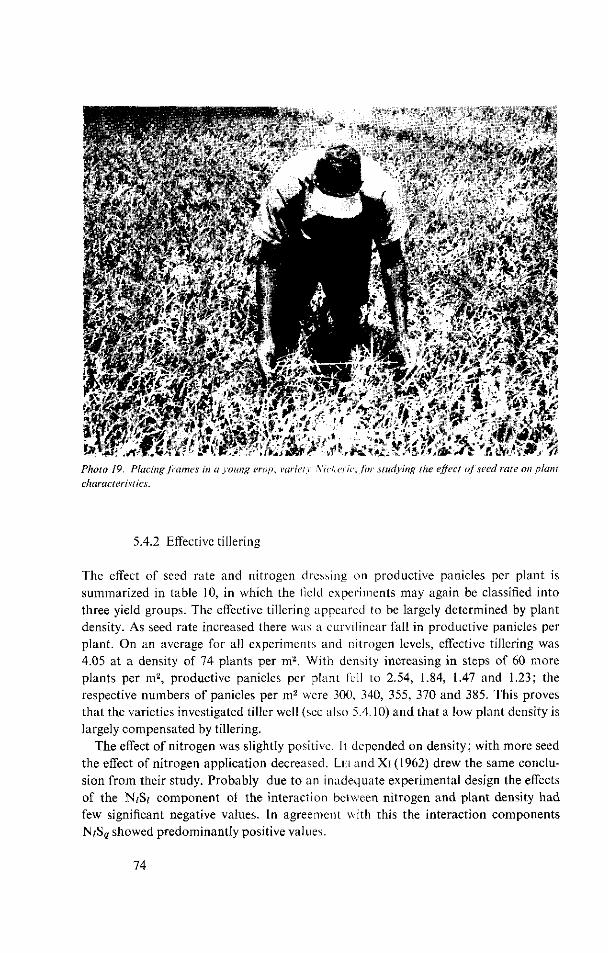
5.4.2 Effective tillering
The effect of seed rate and nitrogen dressing on productive panicles per plant is summarized in table 10, in which the field experiments may again be classified into three yield groups. The effective tillering appeared to be largely determined by plant density. As seed rate increased there was a curvilinear fall in productive panicles per plant. On an average for all experiments and nitrogen levels, effective tillering was 4.05 at a density of 74 plants per m2. With density increasing in steps of 60 more plants per m2, productive panicles per plant fell to 2.54, 1.84, 1.47 and 1.23; the respective numbers of panicles per m2 were 300. 340, 355, 370 and 385. This proves that the varieties investigated tiller well (see also 5.4.10) and that a low plant density is largely compensated by tillering.
The effect of nitrogen was slightly positive. It depended on density; with more seed the effect of nitrogen application decreased. Li;i and Xi (1962) drew the same conclusion from their study. Probably due to an inadequate experimental design the effects of the N;S; component of the interaction between nitrogen and plant density had few significant negative values. In agreement with this the interaction components NjSe showed predominantly positive values.
74
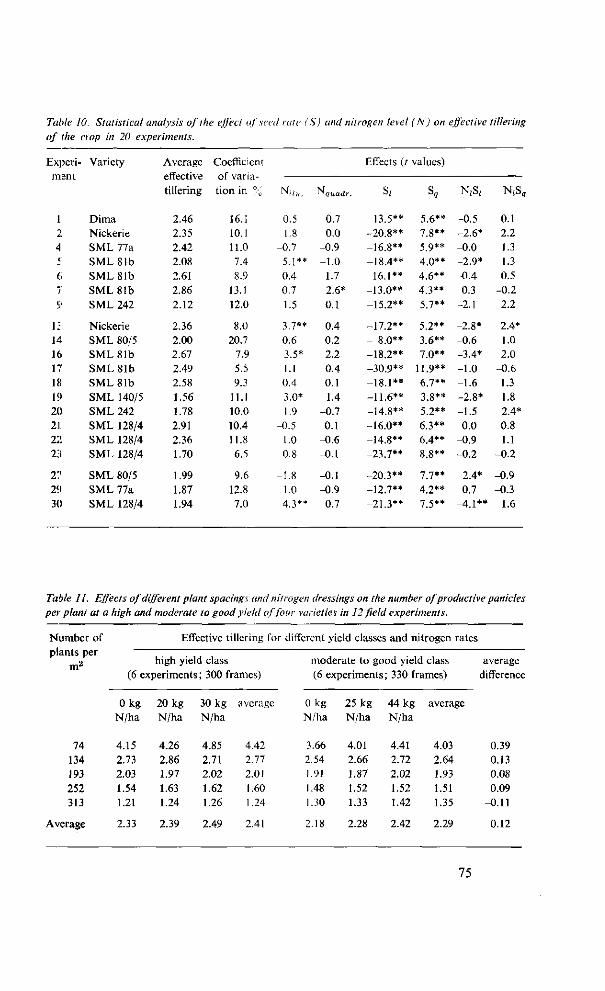
Table 10. Statistical analysis of the effect of seed rate ( S) and nitrogen level (N) on effective tillering of the crop in 20 experiments.
Experiment
1 2,
4 <;
6 7 9
13 14 16 17 18 19 20 21 22 23
27 29 30
Variety
Dima Nickerie SML 77a S M L 8 l b SML 81b SML 81b SML 242
Nickerie SML 80/5 SML 81b SML 81b SML 81b SML 140/5 SML 242 SML 128/4 SML 128/4 SML 128/4
SML 80/5 SML 77a SML 128/4
Average effective tillering
2.46 2.35 2.42 2.08 2.61 2.86 2.12
2.36 2.00 2.67 2.49 2.58 1.56 1.78 2.91 2.36 1.70
1.99 1.87 1.94
Coefficient of variation in %
16.1 10.1 11.0 7.4 8.9
13.1 12.0
8.0 20.7
7.9 5.5 9.3
11.1 10.0 10.4 11.8 6.5
9.6 12.8 7.0
N„-„.
0.5 1.8
-0.7 5 1 **
-0.4 0.7 1.5
3.7** 0.6 3.5* 1.1 0.4 3.0* 1.9
-0.5 1.0 0.8
-1.8 1.0 4.3**
^(luadr.
-0.7 0.0
-0.9 -1.0 -1.7
2.6* 0.1
0.4 0.2 2.2 0.4 0.1 1.4
-0.7 0.1
-0.6 -0.1
-0.1 -0.9 0.7
Effects (7 values)
s* -13.5** -20.8** -16.8** -18.4** -16.1** -13.0** -15.2**
-17.2** - 8.0** -18.2** -30.9** -18.1** -11.6** -14.8** -16.0** -14.8** -23.7**
-20.3** -12.7** -21.3**
s„ 5.6** 7.8** 5 Q**
4 o** 4.6** 4.3** 5.7**
5.2** 3.6** 7.0**
1 j 9**
6.7** 3.8** 5.2** 6.3** 6.4** 8.8**
y 7**
4.2** 7.5**
N Ä
-0.5 -2.6* -0.0 -2.9* -0.4 0.3
-2.1
-2.8* -0.6 -3.4* -1.0 -1.6 -2.8* -1.5 0.0
-0.9 -0.2
2.4* 0.7
_4 |**
H S ,
0.1 2.2 1.3 1.3 0.5
-0.2 2.2
2.4* 1.0 2.0
-0.6 1.3 1.8 2.4* 0.8 1.1
-0.2
-0.9 -0.3
1.6
Table It. Effects of different plant spacings and nitrogen dressings on the number of productive panicles per plant at a high and moderate to good yield of four varieties in 12 field experiments.
Number of
plants per
74 134 193 252 313
Average
Effective ti
high yield class (6 experiments
0 kg N/ha
4.15 2.73 2.03 1.54 1.21
2.33
20 kg N/ha
4.26 2.86 1.97 1.63 1.24
2.39
illering for
;; 300 frames)
30 kg N/ha
4.85 2.71 2.02 1.62 1.26
2.49
average
4.42 2.77 2.01 1.60 1.24
2.41
different yield classes and nitrogen rates
moderate to good yield class (6 experiments
0 kg N/ha
3.66 2.54 1.91 1.48 1.30
2.18
25 kg N/ha
4.01 2.66 1.87 1.52 1.33
2.28
; 330 frames)
44 kg N/ha
4.41 2.72 2.02 1.52 1.42
2.42
average
4.03 2.64 1.93 1.51 1.35
2.29
average difference
0.39 0.13 0.08 0.09
-0.11
0.12
75
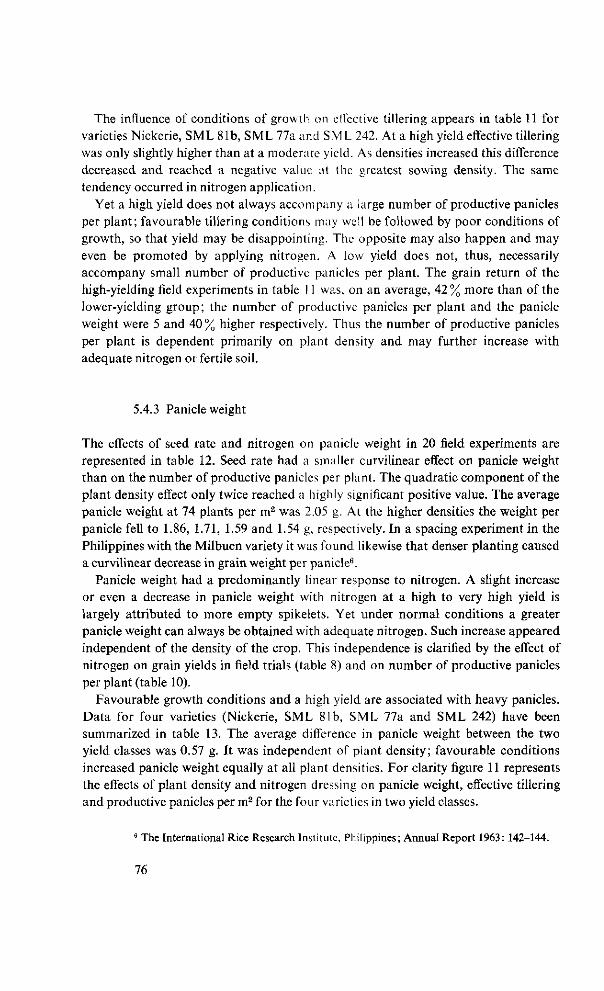
The influence of conditions of growth on effective tillering appears in table 11 for varieties Nickerie, SML 81b, SML 77a and SM L 242. At a high yield effective tillering was only slightly higher than at a moderate yield. As densities increased this difference decreased and reached a negative value at the greatest sowing density. The same tendency occurred in nitrogen application.
Yet a high yield does not always accompany a large number of productive panicles per plant; favourable tillering conditions may well be followed by poor conditions of growth, so that yield may be disappointing. The opposite may also happen and may even be promoted by applying nitrogen. A low yield does not, thus, necessarily accompany small number of productive panicles per plant. The grain return of the high-yielding field experiments in table 11 was, on an average, 42% more than of the lower-yielding group; the number of productive panicles per plant and the panicle weight were 5 and 40% higher respectively. Thus the number of productive panicles per plant is dependent primarily on plant density and may further increase with adequate nitrogen oi fertile soil.
5.4.3 Panicle weight
The effects of seed rate and nitrogen on panicle weight in 20 field experiments are represented in table 12. Seed rate had a smaller curvilinear effect on panicle weight than on the number of productive panicles per plant. The quadratic component of the plant density effect only twice reached a highly significant positive value. The average panicle weight at 74 plants per m2 was 2.05 g. At the higher densities the weight per panicle fell to 1.86, 1.71, 1.59 and 1.54 g, respectively. In a spacing experiment in the Philippines with the Milbuen variety it was found likewise that denser planting caused a curvilinear decrease in grain weight per panicle6.
Panicle weight had a predominantly linear response to nitrogen. A slight increase or even a decrease in panicle weight with nitrogen at a high to very high yield is largely attributed to more empty spikelets. Yet under normal conditions a greater panicle weight can always be obtained with adequate nitrogen. Such increase appeared independent of the density of the crop. This independence is clarified by the effect of nitrogen on grain yields in field trials (table 8) and on number of productive panicles per plant (table 10).
Favourable growth conditions and a high yield are associated with heavy panicles. Data for four varieties (Nickerie, SML 81b, SML 77a and SML 242) have been summarized in table 13. The average difference in panicle weight between the two yield classes was 0.57 g. It was independent of plant density; favourable conditions increased panicle weight equally at all plant densities. For clarity figure 11 represents the effects of plant density and nitrogen dressing on panicle weight, effective tillering and productive panicles per m2 for the four varieties in two yield classes.
6 The International Rice Research Institute, Philippines; Annual Report 1963: 142-144.
76
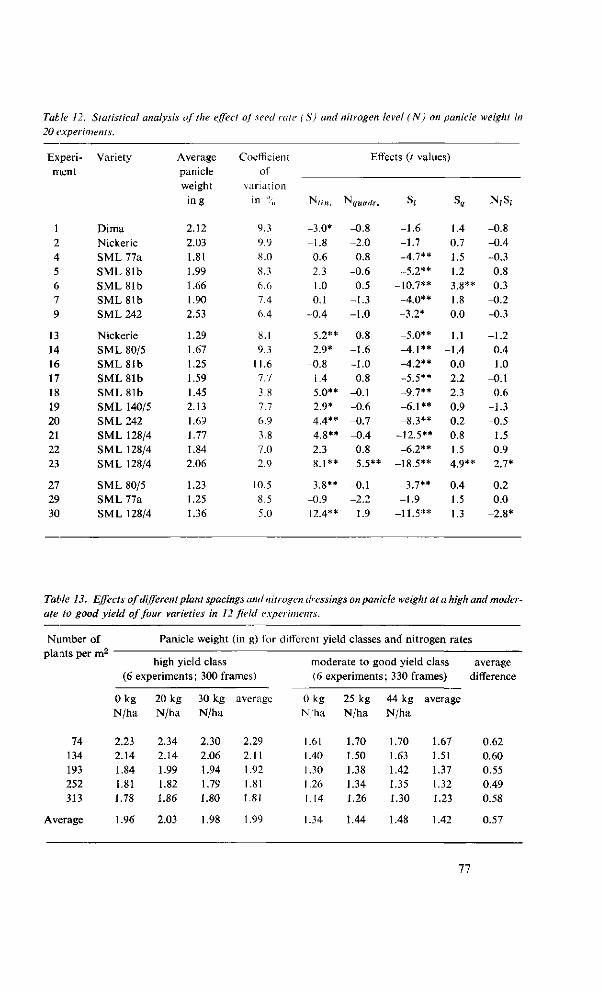
Table 12. Statistical analysis of the effect of seed rate ( S) and nitrogen level (N) on panicle weight in
20 experiments.
Experiment
1 2 4 5 6 7 9
13 14 16 17 18 19 20 21 22 23
27 29 30
Variety
Dima Nickerie SML 77a SML81b SML 81b SML 81b SML 242
Nickerie SML 80/5 SML 81b SML 81b SML 81b SML 140/5 SML 242 SML 128/4 SML 128/4 SML 128/4
SML 80/5 SML 77a SML 128/4
Average panicle weight
ing
2.12 2.03 1.81 1.99 1.66 1.90 2.53
1.29 1.67 1.25 1.59 1.45 2.13 1.69 1.77 1.84 2.06
1.23 1.25 1.36
Coefficient of
variation in "••„
9.3 9.9 8.0 8.3 6.6 7.4 6.4
8.1 9.3
11.6 7.7 3.8 7.7 6.9 3.8 7.0 2.9
10.5 8.5 5.0
N/,;„.
-3.0* -1.8 0.6 2.3 1.0 0.1
-0.4
5.2** 2.9*
-0.8 1.4 5.0** 2.9* 44**
4.8** 2.3 8.1**
3.8** -0.9 12.4**
Effects (t values)
' v/warfr.
-0.8 -2.0 0.8
-0.6 0.5
-1.3 -1.0
0.8 -1.6 -1.0 0.8
-0.1 -0.6 -0.7 -0.4 0.8 5.5**
-0.1 -2.2
1.9
s(
-1.6 -1.7 -4.7** -5.2**
-10.7** -4.0** -3.2*
-5.0** —4.1** -4.2** -5.5** _Q 7 * *
-6 .1** -8.3**
-12.5** -6.2**
-18.5**
—3 7**
-1.9 -11.5**
S,
1.4 0.7 1.5 1.2 3.8** 1.8 0.0
1.1 -1.4 0.0 2.2 2.3 0.9 0.2 0.8 1.5 4 ü**
0.4 1.5 1.3
N,S,
-0.8 -0.4 -0.3 0.8 0.3
-0.2 -0.3
-1.2 0.4 1.0
-0.1 0.6
-1.3 -0.5
1.5 0.9 2.7*
0.2 0.0
-2.8*
Table 13. Effects of different plant spacings and nitrogen dressings on panicle weight at a high and moderate to good yield of four varieties in 12 field experiments.
Number of
plants per mz
74 134 193 252 313
Panicle weight (in g) for
high yield class (6 experiments
0 kg 20 kg N/ha
2.23 2.14 1.84 1.81 1.78
N/ha
2.34 2.14 1.99 1.82 1.86
; 300 frames)
30 kg average N/ha
2.30 2.06 1.94 1.79 1.80
2.29 2.11 1.92 1.81 1.81
different yield classes and nitrogen rates
moderate to good yield class (6 experiments
0 kg N/ha
1.61 1.40 1.30 1.26 1.14
25 kg N/ha
1.70 1.50 1.38 1.34 1.26
;; 330 frames)
44 kg N/ha
1.70 1.63 1.42 1.35 1.30
average
1.67 1.51 1.37 1.32 1.23
average difference
0.62 0.60 0.55 0.49 0.58
Average 1.96 2.03 1.98 1.99 1.34 1.44 1.48 1.42 0.57
77
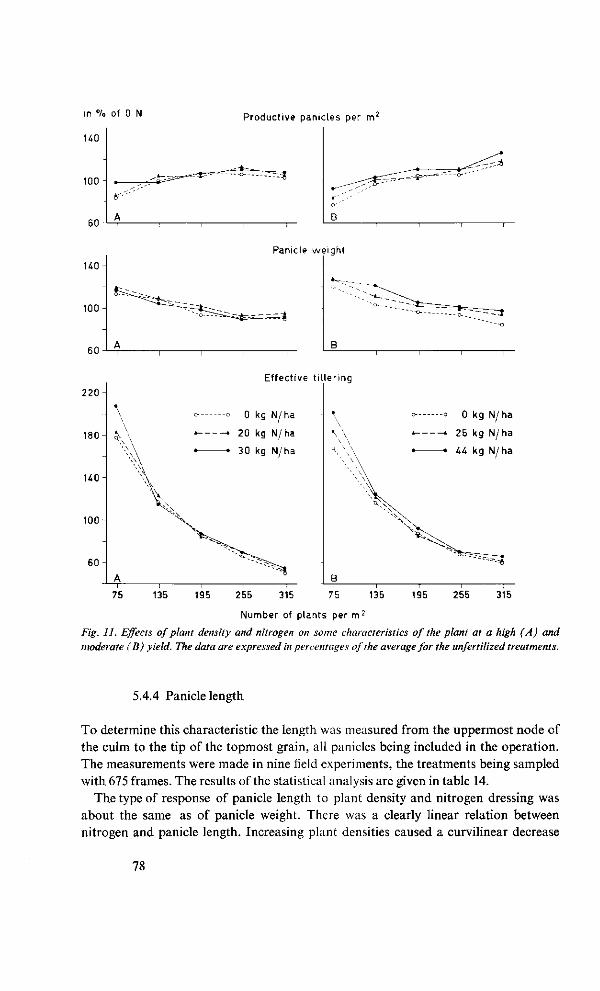
In °/o of 0 N
140
Productive panicles per m2
100
60
U0
100
60
220
180-
140
100
60
A
t"
B
" < -"°~"~
^ ~ ^ * -^l-jt,—~-—a-
Panicle weight
B i i
o-, ~~ "~ ~ J
~-o
Effective t i l le r ing
0 kg N/ha
20 kg N/ha
30 kg N/ha
\
\ H x
-B
\ \\
•Q>
'
0
-*
0
26
44
^ "
kg
kg
kg
S B
N/ha
N/ha
N/ha
^^
75 135 195 255 315 75 135 195 255 315
Number of plants per m2
Fig. 11. Effects of plant density and nitrogen on some characteristics of the plant at a high (A) and
moderate ( B) yield. The data are expressed in percentages of the average for the unfertilized treatments.
5.4.4 Panicle length
To determine this characteristic the length was measured from the uppermost node of the culm to the tip of the topmost grain, all panicles being included in the operation. The measurements were made in nine field experiments, the treatments being sampled with 675 frames. The results of the statistical analysis are given in table 14.
The type of response of panicle length to plant density and nitrogen dressing was about the same as of panicle weight. There was a clearly linear relation between nitrogen and panicle length. Increasing plant densities caused a curvilinear decrease
78
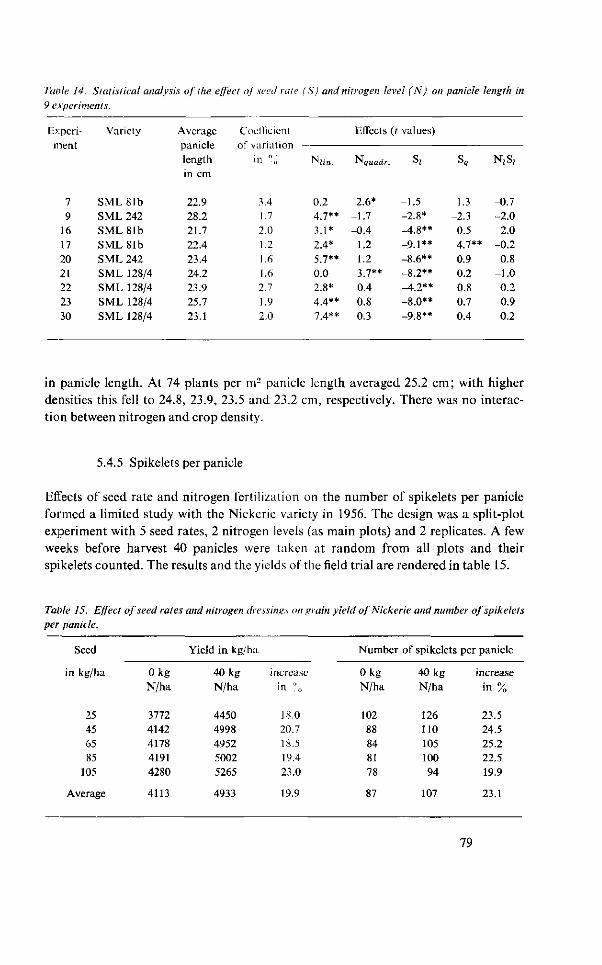
Table 14. Statistical analysis of the effect of seed rate ( S) and nitrogen level (N) on panicle length in
9 experiments.
Experiment
7 9
16 17 20 21 22 23 30
Variety
SML81b SML 242 SML81b SML 81b SML 242 SML 128/4 SML 128/4 SML 128/4 SML 128/4
Average panicle length
in cm
22.9 28.2 21.7 22.4 23.4 24.2 23.9 25.7 23.1
Coellieient of variation
in "„
3.4 1.7 2.0 1.2 1.6 1.6 2.7 1.9 2.0
NKre.
0.2 4.7** 3.1* 2.4* 5 7**
0.0 2.8* 4.4** 7.4**
Effects (t values)
^quadr.
2.6* -1.7 -0.4
1.2 1.2 2 j * *
0.4 0.8 0.3
Sj
-1.5 -2.8* -4.8** _9 i **
-8.6** -8.2** -4.2** -8.0** _Q 8 * *
sa
1.3 -2.3 0.5 4.7** 0.9 0.2 0.8 0.7 0.4
N(S,
-0.7 -2.0 2.0
-0.2 0.8
-1.0 0.2 0.9 0.2
in panicle length. At 74 plants per m2 panicle length averaged 25.2 cm; with higher densities this fell to 24.8, 23.9, 23.5 and 23.2 cm, respectively. There was no interaction between nitrogen and crop density.
5.4.5 Spikelets per panicle
Effects of seed rate and nitrogen fertilization on the number of spikelets per panicle formed a limited study with the Nickerie variety in 1956. The design was a split-plot experiment with 5 seed rates, 2 nitrogen levels (as main plots) and 2 replicates. A few weeks before harvest 40 panicles were taken at random from all plots and their spikelets counted. The results and the yields of the field trial are rendered in table 15.
Table 15. Effect of seed rates and nitrogen dressings on grain yield of Nickerie and number of spikelets per panicle.
Seed
in kg/ha
25 45 65 85
105
Average
0 kg N/ha
3772 4142 4178 4191 4280
4113
Yield in kg/ha
40 kg N/ha
4450 4998 4952 5002 5265
4933
increase
in °„
18.0 20.7 18.5 19.4 23.0
19.9
Number of spikelets
0 kg N/ha
102 88 84 81 78
87
40 kg N/ha
126 110 105 100 94
107
per panicle
increase
in %
23.5 24.5 25.2 22.5 19.9
23.1
79
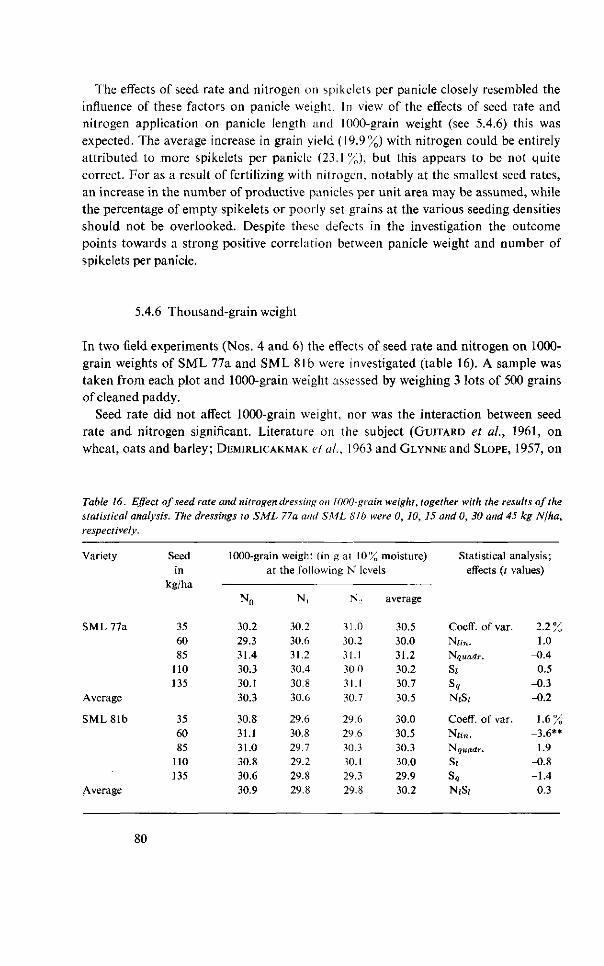
The effects of seed rate and nitrogen on spikclets per panicle closely resembled the influence of these factors on panicle weight. In view of the effects of seed rate and nitrogen application on panicle length and 1000-grain weight (see 5.4.6) this was expected. The average increase in grain yield (19.9%) with nitrogen could be entirely attributed, to more spikelets per panicle (23.1 %), but this appears to be not quite correct. For as a result of fertilizing with nitrogen, notably at the smallest seed rates, an increase in the number of productive panicles per unit area may be assumed, while the percentage of empty spikelets or poorly set grains at the various seeding densities should not be overlooked. Despite these defects in the investigation the outcome points towards a strong positive correlation between panicle weight and number of spikelets per panicle.
5.4.6 Thousand-grain weight
In two field experiments (Nos. 4 and 6) the effects of seed rate and nitrogen on 1000-grain weights of SML 77a and SML 81b were investigated (table 16). A sample was taken from each plot and 1000-grain weight assessed by weighing 3 lots of 500 grains of cleaned paddy.
Seed rate did not affect 1000-grain weight, nor was the interaction between seed rate and nitrogen significant. Literature on the subject (GUITARD et al., 1961, on wheat, oats and barley; DEMIRLICAKMAK et al., 1963 and GLYNNE and SLOPE, 1957, on
Table 16. Effect of seed rate and nitrogen dressing on 1000-grain weight, together with the results of the statistical analysis. The dressings to SML 77a and SML 8lb were 0, 10, 15 and 0, 30 and 45 kg N/ha, respectively.
Variety
SML 77a
Average
SML 81b
Average
Seed in
kg/ha
35 60 85
110 135
35 60 85
110 135
1000-grain weight (in
N 0
30.2 29.3 31.4 30.3 30.1 30.3
30.8 31.1 31.0 30.8 30.6 30.9
g at 10% moisture) at the following N levels
N,
30.2 30.6 31.2 30.4 30.8 30.6
29.6 30.8 29.7 29.2 29.8 29.8
N-,
31.0 30.2 31.1 30.0 31.1 30.7
29.6 29.6 30.3 30.1 29.3 29.8
average
30.5 30.0 31.2 30.2 30.7 30.5
30.0 30.5 30.3 30.0 29.9 30.2
Statistical analysis; effects (t values)
Coeff. of var. N Î ; „ .
Nquadr.
Si
s« N &
Coeff. of var.
Nu,!. N quadr. Si
Sq
N &
2.2% 1.0
-0.4 0.5
-0.3 -0.2
1.6% -3.6**
1.9 -0.8 -1.4 0.3
80
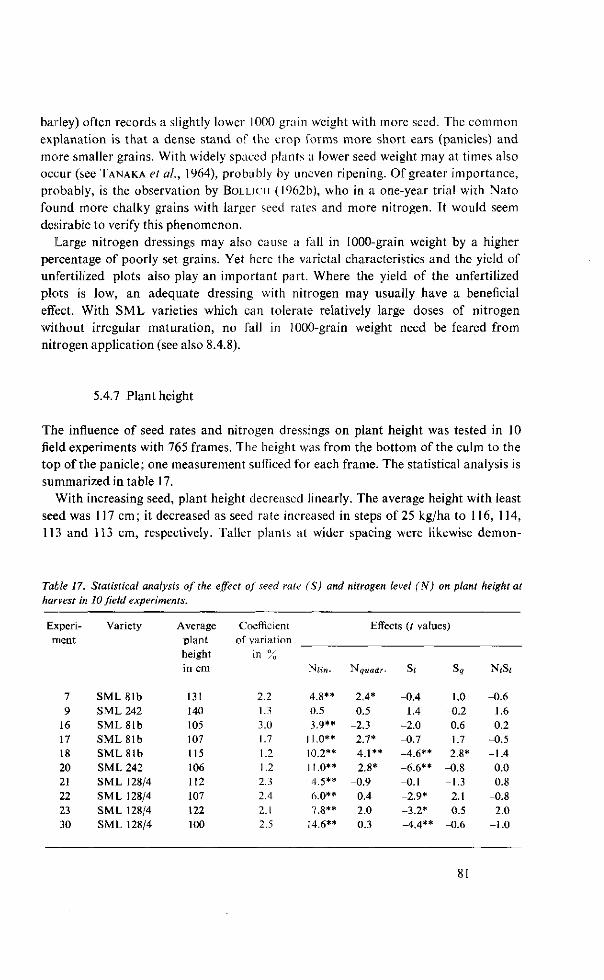
barley) often records a slightly lower 1000-grain weight with more seed. The common explanation is that a dense stand of the crop forms more short ears (panicles) and more smaller grains. With widely spaced plants a lower seed weight may at times also occur (see TANAKA et ai, 1964), probably by uneven ripening. Of greater importance, probably, is the observation by BOLLICH (1962b), who in a one-year trial with Nato found more chalky grains with larger seed rates and more nitrogen. It would seem desirable to verify this phenomenon.
Large nitrogen dressings may also cause a fall in 1000-grain weight by a higher percentage of poorly set grains. Yet here the varietal characteristics and the yield of unfertilized plots also play an important part. Where the yield of the unfertilized plots is low, an adequate dressing with nitrogen may usually have a beneficial effect. With SML varieties which can tolerate relatively large doses of nitrogen without irregular maturation, no fall in 1000-grain weight need be feared from nitrogen application (see also 8.4.8).
5.4.7 Plant height
The influence of seed rates and nitrogen dressings on plant height was tested in 10 field experiments with 765 frames. The height was from the bottom of the culm to the top of the panicle; one measurement sufficed for each frame. The statistical analysis is summarized in table 17.
With increasing seed, plant height decreased linearly. The average height with least seed was 117 cm; it decreased as seed rate increased in steps of 25 kg/ha to 116, 114, 113 and 113 cm, respectively. Taller plants at wider spacing were likewise demon-
Table 17. Statistical analysis of the effect of seed rate (S) and nitrogen level (N) on plant height at harvest in 10 field experiments.
Experiment
7 9
16 17 18 20 21 22 23 30
Variety
SML 81b SML 242 SML 81b SML 81b SML 81b SML 242 SML 128/4 SML 128/4 SML 128/4 SML 128/4
Average plant height in cm
131 140 105 107 115 106 112 107 122 100
Coefficient of variation
in %
2.2 1.3 3.0 1.7 1.2 1.2 2.3 2.4 2.1 2.5
Nij«.
4.8** 0.5 3 9**
11.0** 10.2**
no** 4.5** 6.0** 7 g**
14.6**
Effects (7 values)
Nquadr.
2.4* 0.5
-2.3 2.7* 4.1** 2.8*
-0.9 0.4 2.0 0.3
Si
-0.4 1.4
-2.0 -0.7 -4.6** -6.6** -0.1 -2.9* -3.2* -4.4**
s«
1.0 -0.2 0.6 1.7 2.8*
-0.8 -1.3 2.1 0.5
-0.6
N Ä
-0.6 1.6 0.2
-0.5 -1.4
0.0 0.8
-0.8 2.0
-1.0
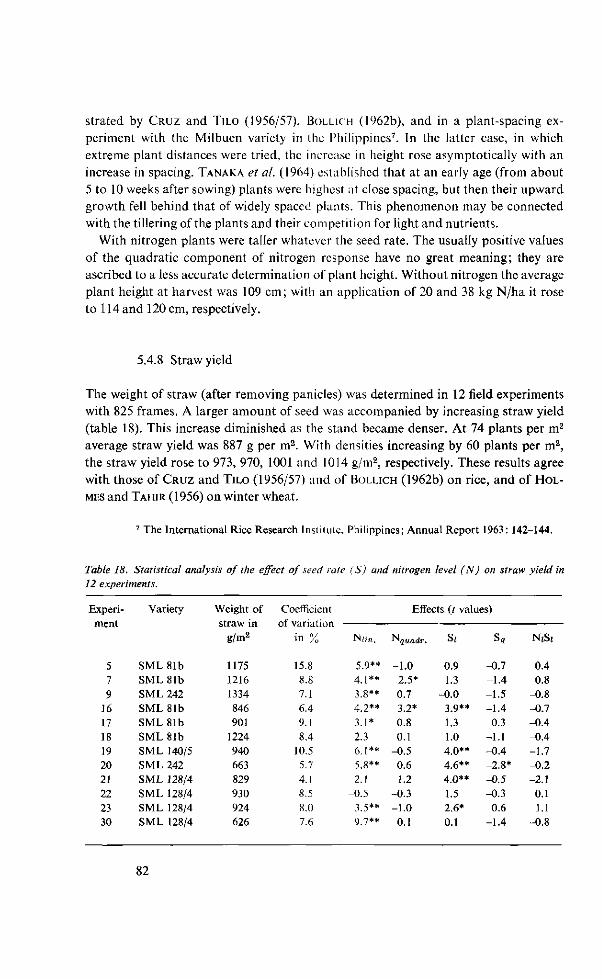
strated by C R U Z and TILO (1956/57), BOLLICH (1962b), and in a plant-spacing ex
periment with the Milbuen variety in the Philippines7. In the latter case, in which
extreme plant distances were tried, the increase in height rose asymptotically with an
increase in spacing. TANAKA et al. (1964) established that at an early age (from about
5 to 10 weeks after sowing) plants were highest at close spacing, but then their upward
growth fell behind that of widely spaced plants. This phenomenon may be connected
with the tillering of the plants and their competition for light and nutrients.
With nitrogen plants were taller whatever the seed rate. The usually positive values
of the quadratic component of nitrogen response have no great meaning; they are
ascribed to a less accurate determination of plant height. Without nitrogen the average
plant height at harvest was 109 cm; with an application of 20 and 38 kg N/ha it rose
to 114 and 120 cm, respectively.
5.4.8 Straw yield
The weight of straw (after removing panicles) was determined in 12 field experiments
with 825 frames. A larger amount of seed was accompanied by increasing straw yield
(table 18). This increase diminished as the stand became denser. At 74 plants per m2
average straw yield was 887 g per m2. With densities increasing by 60 plants per m2,
the straw yield rose to 973, 970, 1001 and 1014 g/m2, respectively. These results agree
with those of C R U Z and TILO (1956/57) and of BOLLICH (1962b) on rice, and of H O L
MES and TAHIR (1956) on winter wheat.
7 The International Rice Research Institute, Philippines; Annual Report 1963: 142-144.
Table 18. Statistical analysis of the effect of seed rate (S) and nitrogen level (N) on straw yield in 12 experiments.
Experiment
5 7
9 16
17 18
19 20 21
22
23 30
Variety
SML 81b
SML 81b SML 242
SML 81b SML 81b
SML 81b SML 140/5 SML 242
SML 128/4
SML 128/4 SML 128/4 SML 128/4
Weight of straw in
g/m2
1175 1216
1334
846 901
1224 940 663
829
930
924 626
Coefficient
of variation
in %
15.8 8.8 7.1
6.4 9.1
8.4 10.5 5.7 4.1
8.5 8.0
7.6
NH« .
5.9** 4.1** 3.8**
4.2**
3.1* 2.3 6.1** 5.8**
2.1
-0.5 -} 5**
9.7**
Effects (t values)
Nquadr.
-1.0
2.5* 0.7 3.2*
0.8
0.1 -0.5 0.6
1.2 -0.3 -1.0 0.1
Si
0.9
1.3 -0.0
3 9**
1.3
1.0 4.0** 4.6**
4.0**
1.5 2.6*
0.1
s9
-0.7 -1.4
-1.5
-1.4 0.3
-1.1 -0.4 -2.8*
-0.5 -0.3
0.6 -1.4
NjSi
0.4
0.8 -0.8
-0.7 -0.4
-0.4 -1.7 -0.2
-2.1
0.1
1.1 -0.8
82
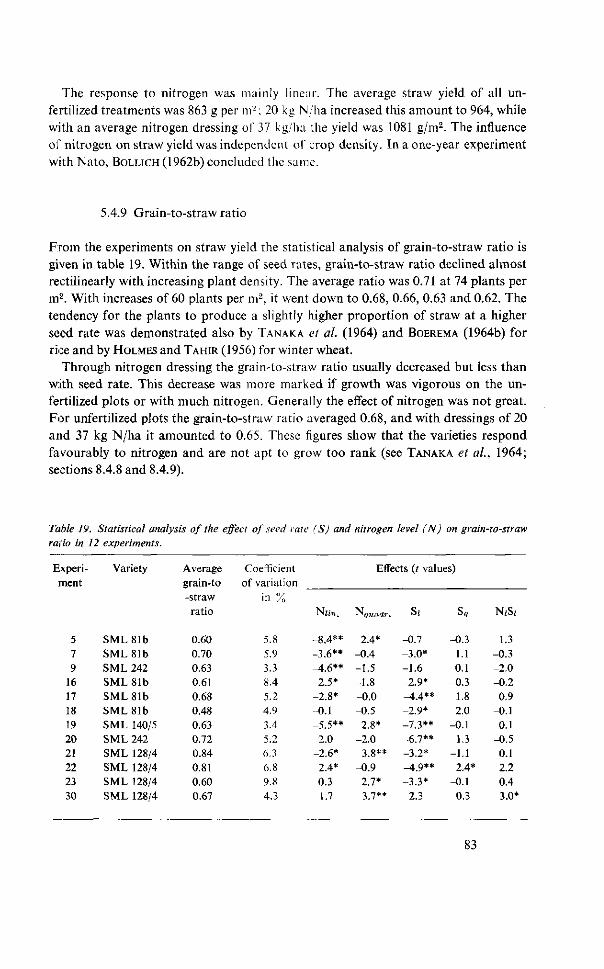
The response to nitrogen was mainly linear. The average straw yield of all unfertilized treatments was 863 g per m2; 20 kg N/ha increased this amount to 964, while with an average nitrogen dressing of 37 kg/ha the yield was 1081 g/m2. The influence of nitrogen on straw yield was independent of crop density. In a one-year experiment with Nato, BOLLICH (1962b) concluded the same.
5.4.9 Grain-to-straw ratio
From the experiments on straw yield the statistical analysis of grain-to-straw ratio is given in table 19. Within the range of seed rates, grain-to-straw ratio declined almost rectilinearly with increasing plant density. The average ratio was 0.71 at 74 plants per m2. With increases of 60 plants per m2, it went down to 0.68, 0.66, 0.63 and 0.62. The tendency for the plants to produce a slightly higher proportion of straw at a higher seed rate was demonstrated also by TANAKA et al. (1964) and BOEREMA (1964b) for rice and by HOLMES and TAHIR (1956) for winter wheat.
Through nitrogen dressing the grain-to-straw ratio usually decreased but less than with seed rate. This decrease was more marked if growth was vigorous on the unfertilized plots or with much nitrogen. Generally the effect of nitrogen was not great. For unfertilized plots the grain-to-straw ratio averaged 0.68, and with dressings of 20 and 37 kg N/ha it amounted to 0.65. These figures show that the varieties respond favourably to nitrogen and are not apt to grow too rank (see TANAKA et al, 1964; sections 8.4.8 and 8.4.9).
Table 19. Statistical analysis of the effect of seed rate (S) and nitrogen level (N) on grain-to-straw ratio in 12 experiments.
Experiment
5 7 9
16 17 18 19 20 21 22 23 30
Variety
SML81b SML81b SML 242 SML81b SML 81b SML 81b SML 140/5 SML 242 SML 128/4 SML 128/4 SML 128/4 SML 128/4
Average grain-to -straw ratio
0.60 0.70 0.63 0.61 0.68 0.48 0.63 0.72 0.84 0.81 0.60 0.67
Coefficient of variation
in %
5.8 5.9 3.3 8.4 5.2 4.9 3.4 5.2 6.3 6.8 9.8 4.3
Nj(n .
-8.4** -3.6** -4.6** -2.5* -2.8* -0.1 -5.5** 2.0
-2.6* 2.4* 0.3 1.7
Effects (t values)
^Quadr.
2.4* -0.4 -1.5 -1.8 -0.0 -0.5
2.8* -2.0
3.8** -0.9 2.7* 3.7**
S;
-0.7 -3.0* -1.6 -2.9* -AA** -2.9* -7.3** -6.7** -3.2* _4 9**
-3 .3* -2.3
s«
-0.3 1.1 0.1
-0.3 1.8 2.0
-0.1 1.3
-1.1 2.4*
-0.1 0.3
N,S*
1.3 -0.3 -2.0 -0.2 0.9
-0.1 0.1
-0.5 0.1 2.2 0.4
-3.0*
83
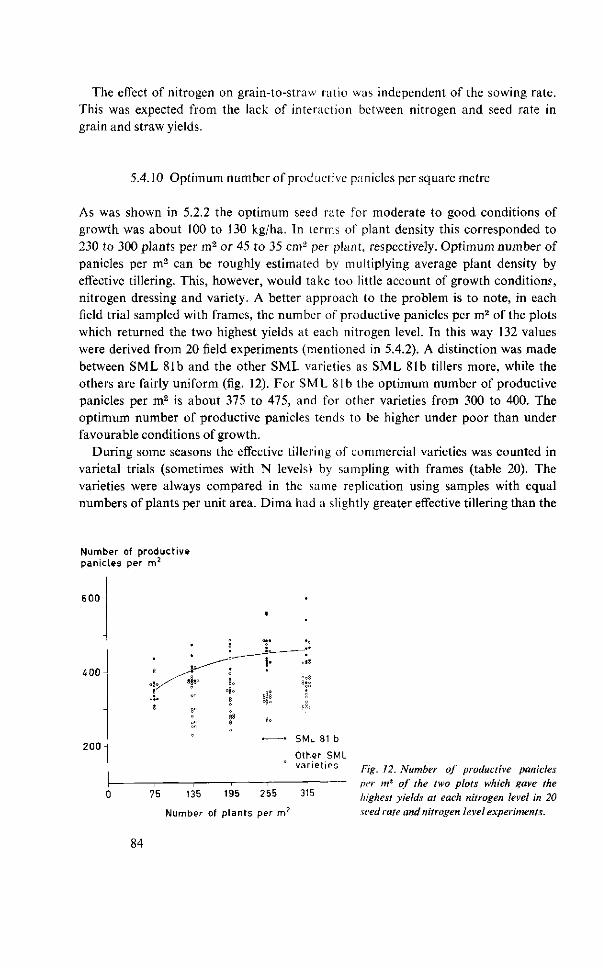
The effect of nitrogen on grain-to-struw ratio was independent of the sowing rate. This was expected from the lack of interaction between nitrogen and seed rate in grain and straw yields.
5.4.10 Optimum number of productive panicles per square metre
As was shown in 5.2.2 the optimum seed rate for moderate to good conditions of growth was about 100 to 130 kg/ha. In terms of plant density this corresponded to 230 to 300 plants per m2 or 45 to 35 cm2 per plant, respectively. Optimum number of panicles per m2 can be roughly estimated by multiplying average plant density by effective tillering. This, however, would take too little account of growth conditions, nitrogen dressing and variety. A better approach to the problem is to note, in each field trial sampled with frames, the number of productive panicles per m2 of the plots which returned the two highest yields at each nitrogen level. In this way 132 values were derived from 20 field experiments (mentioned in 5.4.2). A distinction was made between SML 81b and the other SML varieties as SML 81b tillers more, while the others are fairly uniform (fig. 12). For SML 81b the optimum number of productive panicles per m2 is about 375 to 475, and for other varieties from 300 to 400. The optimum number of productive panicles tends to be higher under poor than under favourable conditions of growth.
During some seasons the effective tillering of commercial varieties was counted in varietal trials (sometimes with N levels) by sampling with frames (table 20). The varieties were always compared in the same replication using samples with equal numbers of plants per unit area. Dima had a slightly greater effective tillering than the
Number of productive panicles per m2
6 0 0 -
-
4 0 0 -
2 0 0 -
8
8
J 8 ^ ^ »§8°
8°
•_
i °8-8
88 8
1
~~"b~
8§8
8o
•
= 1 !
fl.Q
i C M1 D I k • J M L O 1 D
Other SML variet ies Fig. 12. Number of productive panicles
per m'1 of the two plots which gave the 7 5 ' 3 5 1 9 5 2 5 5 3 1 5 highest yields at each nitrogen level in 20
Number of plants per m2 seed rate and nitrogen level experiments.
84
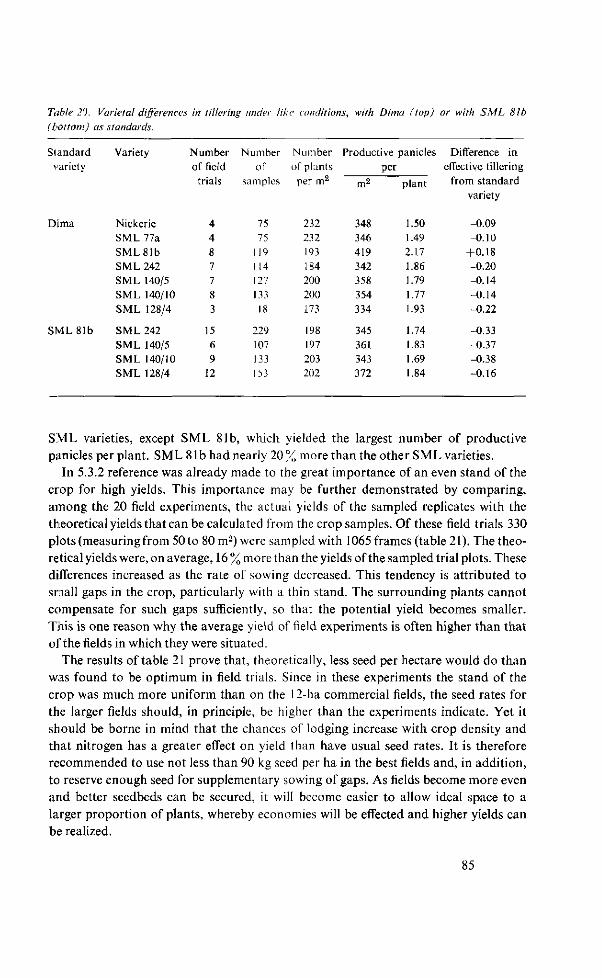
Table 20. Varietal differences in lillering under like conditions, with Dima f top) or with SML 81b (bottom) as standards.
Standard Variety
variety
Number Number Number Productive panicles Difference in of field of of plants per effective tillering
from standard variety
-0.09 -0.10 -0.18 -0.20 0.14
-0.14 -0.22
-0.33 -0.37 -0.38 -0.16
Dima
SML 81b
Nickerie SML 77a SML81b SML 242 SML 140/5 SML 140/10 SML 128/4
SML 242 SML 140/5 SML 140/10 SML 128/4
trials
4 4 8 7 7 8 3
15 6 9
12
samples
75 75
119 114 127 133 18
229 107 133 153
per m2
232 232 193 184 200 200 173
198 197 203 202
m2
348 346 419 342 358 354 334
345 361 343 372
plant
1.50 1.49 2.17 1.86 1.79 1.77 1.93
1.74 1.83 1.69 1.84
SML varieties, except SML 81b, which yielded the largest number of productive panicles per plant. SML 8lb had nearly 20% more than the other SML varieties.
In 5.3.2 reference was already made to the great importance of an even stand of the crop for high yields. This importance may be further demonstrated by comparing, among the 20 field experiments, the actual yields of the sampled replicates with the theoretical yields that can be calculated from the crop samples. Of these field trials 330 plots (measuring from 50 to 80 m2) were sampled with 1065 frames (table 21). The theoretical yields were, on average, 16 % more than the yields of the sampled trial plots. These differences increased as the rate of sowing decreased. This tendency is attributed to small gaps in the crop, particularly with a thin stand. The surrounding plants cannot compensate for such gaps sufficiently, so that the potential yield becomes smaller. This is one reason why the average yield of field experiments is often higher than that of the fields in which they were situated.
The results of table 21 prove that, theoretically, less seed per hectare would do than was found to be optimum in field trials. Since in these experiments the stand of the crop was much more uniform than on the 12-ha commercial fields, the seed rates for the larger fields should, in principle, be higher than the experiments indicate. Yet it should be borne in mind that the chances of lodging increase with crop density and that nitrogen has a greater effect on yield than have usual seed rates. It is therefore recommended to use not less than 90 kg seed per ha in the best fields and, in addition, to reserve enough seed for supplementary sowing of gaps. As fields become more even and better seedbeds can be secured, it will become easier to allow ideal space to a larger proportion of plants, whereby economies will be effected and higher yields can be realized.
85
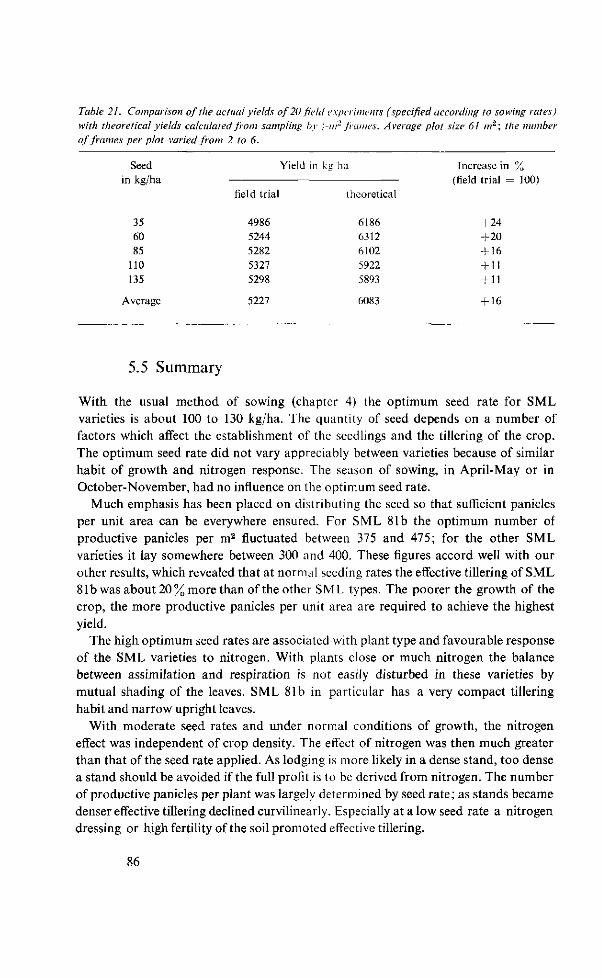
Table 21. Comparison of the actual yields of 20 field experiments (specified according to sowing rates) with theoretical yields calculated from sampling by 1-nr frames. Average plot size 61 m2; the number of frames per plot varied from 2 to 6.
Seed in kg/ha
35 60 85
110 135
Average
field trial
4986 5244 5282 5327 5298
5227
Yield in kg ha
theoretical
6186 6312 6102 5922 5893
6083
Increase in % (field trial = 100)
+24 +20 + 16
+ 11 + 11
+ 16
5.5 Summary
With the usual method of sowing (chapter 4) the optimum seed rate for SML varieties is about 100 to 130 kg/ha. The quantity of seed depends on a number of factors which affect the establishment of the seedlings and the tillering of the crop. The optimum seed rate did not vary appreciably between varieties because of similar habit of growth and nitrogen response. The season of sowing, in April-May or in October-November, had no influence on the optimum seed rate.
Much emphasis has been placed on distributing the seed so that sufficient panicles per unit area can be everywhere ensured. For SML 81b the optimum number of productive panicles per m2 fluctuated between 375 and 475; for the other SML varieties it lay somewhere between 300 and 400. These figures accord well with our other results, which revealed that at normal seeding rates the effective tillering of SML 81b was about 20 % more than of the other SML types. The poorer the growth of the crop, the more productive panicles per unit area are required to achieve the highest yield.
The high optimum seed rates are associated with plant type and favourable response of the SML varieties to nitrogen. With plants close or much nitrogen the balance between assimilation and respiration is not easily disturbed in these varieties by mutual shading of the leaves. SML 81b in particular has a very compact tillering habit and narrow upright leaves.
With moderate seed rates and under normal conditions of growth, the nitrogen effect was independent of crop density. The effect of nitrogen was then much greater than that of the seed rate applied. As lodging is more likely in a dense stand, too dense a stand should be avoided if the full profit is to be derived from nitrogen. The number of productive panicles per plant was largely determined by seed rate; as stands became denser effective tillering declined curvilinearly. Especially at a low seed rate a nitrogen dressing or high fertility of the soil promoted effective tillering.
86
Between panicle length and weight per panicle a marked positive correlation was found. The effect of seed rate on panicle weight was smaller than on the number of productive panicles per plant; both were negatively curvilinear. Larger applications of nitrogen were mostly associated with a linear rise in panicle weight and panicle length, an effect which was found to be independent of seed rate.
Increased amounts of seed caused an almost rectilinear fall in grain-to-straw ratio. The effect of nitrogen on this ratio was small; notably in case of vigorous growth or large applications of nitrogen this effect was negative. No interaction was found beween nitrogen fertilization and seeding rate; the average value of this ratio was 2:3.
87
6 Watermanagement
6.1 Introduction
Good water control and water management are essential to successful, intensive mechanical cultivation. In water management we are, on the one hand, concerned with the optimum water level during the various growth stages of the crop, while in some cases, on the other hand, one or more drainage periods can be interposed to improve the soil condition and the yield of rice. In the research for the optimum water management many experiments have been carried out in various countries, but they were not always in harmony. This must, in particular, be attributed to the differences to be found in properties of the soil, varieties, water, cultural practices pursued and weather conditions.
Investigations by JONES (1933b) and MATSUSHIMA (1962) have shown that no good growth and yield can be achieved unless during the growth period the soil is under water. Apparently, a wet soil was insufficient for optimum growth and yield. According to YAMADA (1965), Fukagi and many other investigators obtained almost always similar results. MATSUSHIMA (1962) further concluded that where the soil was under water, the grain yield decreased as the water level rose; but if the surface of the soil was exposed to the air, the yield would decrease with falling water-table. From chemical analyses of soil and plants he inferred that poor growth and yield of the 0-cm-treatment must be set down to denitrification. NOJIMA (1963) states that rice yields, in general, decrease with decreasing soil-moisture contents. In this connection it may also be noted that the availability of some elements (P, Si and Fe) to the crop increases under submerged and reduced conditions (e.g., YAMADA, 1965; PONNAM-
PERUMA, 1965). Keeping the field under water is also necessary from the viewpoint of weed control.
The moment, at which the weed factor is no longer of concern, is mainly determined by the method of cultivation and the age and habit of the plant. These factors have likewise to be considered in timing drainage periods. To facilitate harvesting the field should be drained well in advance, without letting the crop get short of water.
6.2 Water management during the early weeks after sowing
In chapter 4 reference was made to the importance of good water management during the first few weeks after sowing, not only to promote the establishment of the
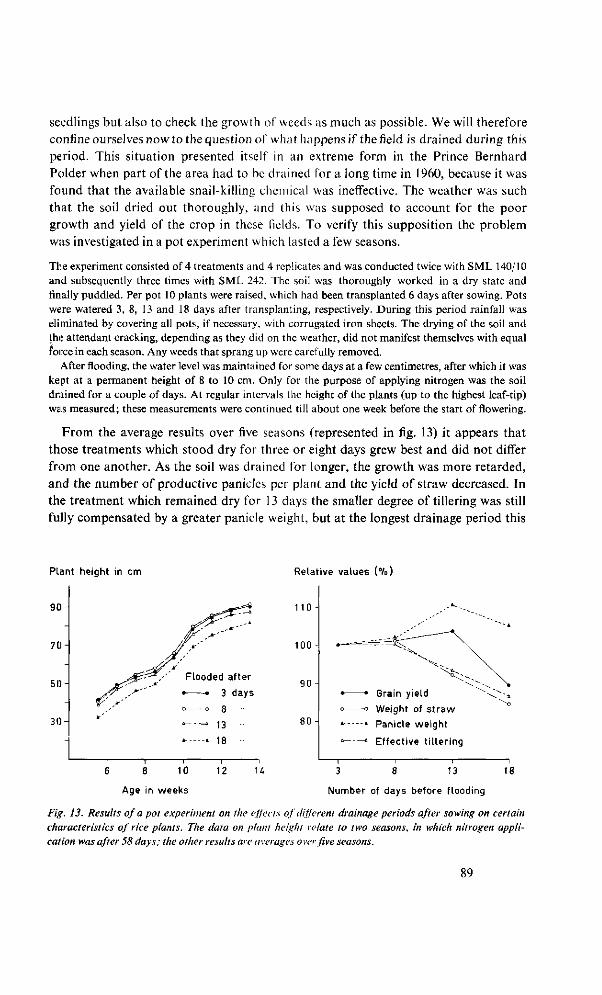
seedlings but also to check the growth of weeds as much as possible. We will therefore confine ourselves now to the question of what happens if the field is drained during this period. This situation presented itself in an extreme form in the Prince Bernhard Polder when part of the area had to be drained for a long time in 1960, because it was found that the available snail-killing chemical was ineffective. The weather was such that the soil dried out thoroughly, and this was supposed to account for the poor growth and yield of the crop in these fields. To verify this supposition the problem was investigated in a pot experiment which lasted a few seasons.
The experiment consisted of 4 treatments and 4 replicates and was conducted twice with SML 140/10 and subsequently three times with SML 242. The soil was thoroughly worked in a dry state and finally puddled. Per pot 10 plants were raised, which had been transplanted 6 days after sowing. Pots were watered 3, 8, 13 and 18 days after transplanting, respectively. During this period rainfall was eliminated by covering all pots, if necessary, with corrugated iron sheets. The drying of the soil and the attendant cracking, depending as they did on the weather, did not manifest themselves with equal force in each season. Any weeds that sprang up were carefully removed.
After flooding, the water level was maintained for some days at a few centimetres, after which it was kept at a permanent height of 8 to 10 cm. Only for the purpose of applying nitrogen was the soil drained for a couple of days. At regular intervals the height of the plants (up to the highest leaf-tip) wa.s measured; these measurements were continued till about one week before the start of flowering.
From the average results over five seasons (represented in fig. 13) it appears that those treatments which stood dry for three or eight days grew best and did not differ from one another. As the soil was drained for longer, the growth was more retarded, and the number of productive panicles per plant and the yield of straw decreased. In the treatment which remained dry for 13 days the smaller degree of tillering was still fully compensated by a greater panicle weight, but at the longest drainage period this
Plant height in cm
90
Relative values (°/o)
70
50
30 13
18
110
100
90
80
Grain yield
Weight of s t raw
Panicle weight
Effective t i l le r ing
6 8 10
Age in weeks
12 U 3 8 13
Number of days before flooding
18
Fig. 13. Results of a pot experiment on the effects of different drainage periods after sowing on certain characteristics of rice plants. The data on plant height relate to two seasons, in which nitrogen application was after 58 days; the other results are averages over five seasons.
89
was no longer the case. The difference in yield between the treatment that had been irrigated after 18 days and the control (irrigated after 3 days) was not the same each season, amounting successively to - 14, - 7, i 6, -15 and - 17%. The former treatment moreover started flowering about four days later than the control.
The poor growth and yield of the plants following a prolonged period of drainage has probably to be put down to the fact that the soil became very tough and hard so that root formation was impeded. The short supply of nutrients as a cause of poor growth in the treatments which had been kept dry a long time was considered unlikely. As may be seen from figure 13, the lag in vertical growth of the plants was not made up. These results show that a thorough drying of the soil shortly after sowing adversely affects the growth and yield of the crop. The extent to which a loss of yield will manifest itself depends on the weather during the drainage interval and may well be partly determined by the degree of destruction of soil structure during puddling.
6.3 Water level in relation to the growth of weeds
During the first three weeks after sowing it will have to be chiefly the growth of the young rice plants that decides the depth of water. After this period the water level should, for some weeks, be looked upon primarily from the angle of effective weed control. Experience in the field and numerous experiments have shown that weeds are adequately controlled by a level of 15 to 20 cm water. If necessary, the water level may be temporarily increased but should not then be abruptly lowered again because of the weakened stems of the crop.
Of grassy weeds Fimbristylis miliacea VAHL is easier to control than Ischaemum rugosum SALISB. (Saramacca grass). To suppress the latter weed and Sphenoclea zeylanica GAERTN. a temporary water level of about 20 cm during the early weeks after sowing is required (GEERTSEMA, TEN HAVE; unpublished data). Sphenoclea zeylanica occurs chiefly where the crop grows thinly or in gaps, and it exerts a less unfavourable influence on the growth of rice than does Fimbristylis miliacea. Pankuku (Nym-phoides sp.) is a noxious weed which, particularly at high water levels, can inflict grave damage on the crop by preventing the young plants from rising above water, so that they choke below the surface. The frequent occurrence of Nymphoides renders it necessary to regulate the water level with care, with reference also to the differences in height existing within a field.
After the weed vegetation is under sufficient control (broad-leaved weeds and Cyperaceae are usually controlled chemically when the crop is 5 to 6 weeks old), a water level of about 10 cm will suffice until the first application of nitrogen (at 7 weeks). After that, until the field is drained for harvest, a level of 5 to 10 cm is enough to prevent further trouble from weeds. A low water level benefits the yield of the crop and the stiffness of its straw and is also more economical on water. Yet in some cases a temporary raising of the water level may be desirable, as for the purpose of reducing the damage from rats and brown stalk-bugs (Tibraca limbativentris STÂL).
90
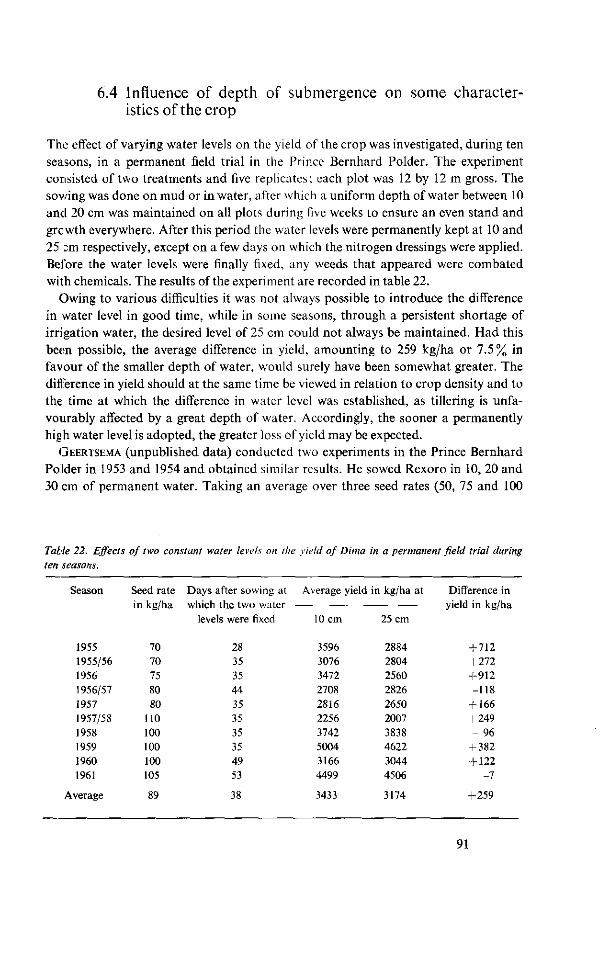
6.4 Influence of depth of submergence on some characteristics of the crop
The effect of varying water levels on the yield of the crop was investigated, during ten seasons, in a permanent field trial in the Prince Bernhard Polder. The experiment consisted of two treatments and five replicates; each plot was 12 by 12 m gross. The sov/ing was done on mud or in water, after which a uniform depth of water between 10 and 20 cm was maintained on all plots during five weeks to ensure an even stand and growth everywhere. After this period the water levels were permanently kept at 10 and 25 cm respectively, except on a few days on which the nitrogen dressings were applied. Before the water levels were finally fixed, any weeds that appeared were combated with chemicals. The results of the experiment are recorded in table 22.
Owing to various difficulties it was not always possible to introduce the difference in water level in good time, while in some seasons, through a persistent shortage of irrigation water, the desired level of 25 cm could not always be maintained. Had this been possible, the average difference in yield, amounting to 259 kg/ha or 7.5% in favour of the smaller depth of water, would surely have been somewhat greater. The difference in yield should at the same time be viewed in relation to crop density and to the time at which the difference in water level was established, as tillering is unfavourably affected by a great depth of water. Accordingly, the sooner a permanently high water level is adopted, the greater loss of yield may be expected.
GEERTSEMA (unpublished data) conducted two experiments in the Prince Bernhard Polder in 1953 and 1954 and obtained similar results. He sowed Rexoro in 10, 20 and 30 cm of permanent water. Taking an average over three seed rates (50, 75 and 100
Table 22. Effects of two constant water levels on the yield of Dima in a permanent field trial during ten seasons.
Season
1955 1955/56 1956 1956/57 1957 1957/58 1958 1959 1960 1961
Average
Seed rate in kg/ha
70 70 75 80 80
110 100 100 100 105
89
Days after sowing at which the two water
levels were
28 35 35 44 35 35 35 35 49 53
38
fixed
Average yield
10 cm
3596 3076 3472 2708 2816 2256 3742 5004 3166 4499
3433
in kg/ha at
25 cm
2884 2804 2560 2826 2650 2007 3838 4622 3044 4506
3174
Difference in yield in kg/ha
+ 712 +272 +912 -118
+ 166 + 249 - 96
+ 382 + 122
-7
+259
91
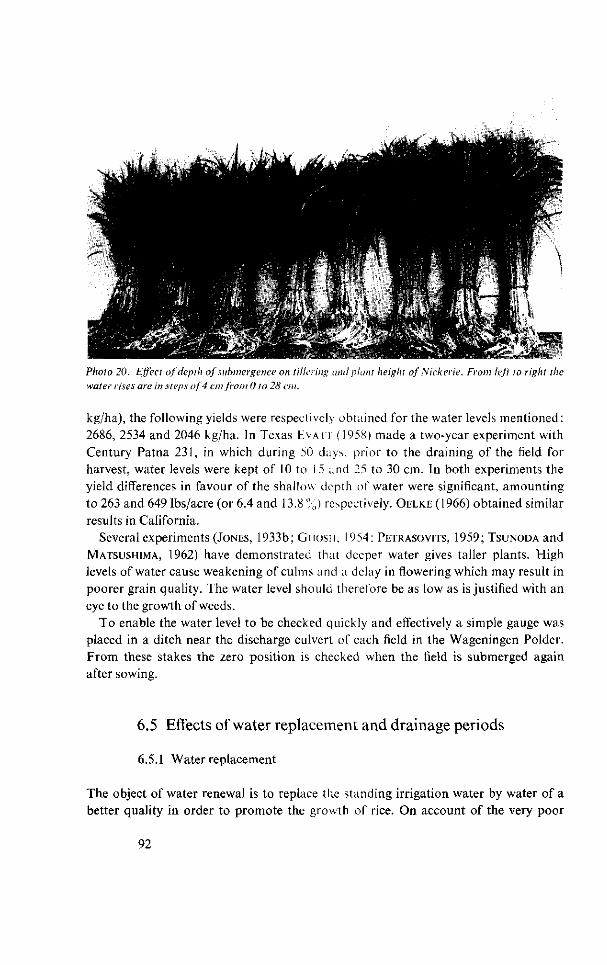
Photo 20. Effect of depth of submergence on tillering and plant height of' Nicker ie. From left to right the water rises are in steps of 4 cm from 0 to 28 cm.
kg/ha), the following yields were respectively obtained for the water levels mentioned: 2686, 2534 and 2046 kg/ha. In Texas EVA IT (1958) made a two-year experiment with Century Patna 231, in which during 50 days, prior to the draining of the field for harvest, water levels were kept of 10 to 15 and 25 to 30 cm. In both experiments the yield differences in favour of the shallow depth of water were significant, amounting to 263 and 649 lbs/acre (or 6.4 and 13.8 %) respectively. OELKE (1966) obtained similar results in California.
Several experiments (JONES, 1933b; GHOSH, 1954; PETRASOVITS, 1959; TSUNODA and M ATSUSHIMA, 1962) have demonstrated that deeper water gives taller plants. High levels of water cause weakening of culms and a delay in flowering which may result in poorer grain quality. The water level should therefore be as low as is justified with an eye to the growth of weeds.
To enable the water level to be checked quickly and effectively a simple gauge was placed in a ditch near the discharge culvert of each field in the Wageningen Polder. From these stakes the zero position is checked when the field is submerged again after sowing.
6.5 Effects of water replacement and drainage periods
6.5.1 Water replacement
The object of water renewal is to replace the standing irrigation water by water of a better quality in order to promote the growth of rice. On account of the very poor
92
permeability of the Wageningen rice fields hardly any beneficial effect on the soil may be expected of this measure as long as the surface remains wet. It is, therefore, the quality of the water which will decide whether or not it m ust be replaced. A renewal of the water may be desirable if it is dirty or turbid or is covered with scum. Such renewal often takes place during the first few weeks after sowing, with the primary aim of improving the chances of establishment. Young plants can be prevented from collapsing and sticking in the mud during this operation by alternately opening and closing an inlet and an outlet culvert diagonally opposite each other in the field. This measure is sometimes resorted to in the northernmost part of the Wageningen Polder, if after a prolonged period of drought a harmful concentration of salt in the topsoil is feared. Similarly the water can be replaced when salty water has been used and sufficient fresh water has again become available for irrigation. Water can be renewed either by letting the water flow through or by draining it off and then irrigating anew.
In rice culture at Wageningen and in the Prince Bernhard Polder a few renewals of water take place as a matter of course during the growth period of the crop because the fields are usually drained three times for 4 to 6 days to control weeds chemically and to apply nitrogen. In any case there is a need of replenishment of losses, possible partly from new irrigation water but also through the rainfall of the wet periods in which the rice is usually grown. Further, the irrigation water is rather expensive and is poor in nutrients. Therefore replacement of the water for its own sake is hardly necessary or economic.
The results of field trials in past years have failed to prove that regular renewal of water is of any practical use. In the Wageningen Polder the treatment with continuously running water, on an average over three seasons, yielded 6% more than did the treatment in which no replacement had been made. Nor were any appreciable differences found between these two treatments in the three-year experiment that was carried out in the Prince Bernhard Polder; in fact, the yield was even 2% less with running than with stagnant water.
6.5.2 Drainage periods
During the growth of the crop periods of drainage are sometimes inserted to improve the properties of the soil and to impart to the plants a greater resistance to physiological diseases (see 9.1.1). This is rather a drastic interference with water management, because the soil will, for some time, be exposed to drying. The practice is pursued in many rice areas.
According to Japanese investigators (e.g., MATSUSHIMA, 1962; YAMADA, 1965) rice can best support the absence of irrigation water during the last stage of tillering till the initiation of panicles, the greatest sensitivity to lack of water occurring from three weeks before flowering till about one week after it. For the currently grown SML varieties this would mean that they would need a sufficient supply of irrigation water again from about 85 days after sowing.
93
Under the conditions prevailing at Wageningen an appropriate drainage period may be expected to yield the following benefits.
a. Through the drying and cracking of the soil, air can enter it and harmful products of reduction be thereby converted into substances less toxic to the plant. Harmful gases, too, can thus escape more easily.
b. The physiological activity of the root system of rice is enhanced. With early draining many new roots will form after irrigation. If, on the other hand, the operation does not take place till about a month or less before flowering, it hardly stimulates rooting; yet even in this case the root system does look healthier after flooding.
c. Withdrawal of water, cracking and aeration improve the structure and the firmness of the soil. If the intermediate draining was late and thorough, these cracks will still be visible in part by the time the field is drained for harvest. They will quicken the pace at which the soil dries out during grain ripening and make harvesting operations easier.
d. According to WOUTERS8 the damage done to the crop by Helodytes larvae (root maggots) can be restricted by draining the field. In the United States (ADAIR and ENGLER, 1955 ; BEACHER and WELLS, 1960) this is one of the reasons why intermediate draining is practised there. Draining the field, however, entails some disadvantages as well, which are partly
connected with the growth stage of the crop and the measure in which the soil dries out. Thus an early period of drainage may markedly encourage the growth of grasses and other weeds. The damage caused by these is partly dependent on the habit and the growth rate of the rice plant. Draining may reduce the availability of some nutrients, notably nitrogen and phosphorus (see YAMADA, 1965) and retard the growth of rice. Nitrogen losses through nitrification and denitrification following draining and reflooding have been established experimentally by MATSUSHIMA (1962), PATRICK
et al. (1964) and others. Draining is therefore sometimes carried out to prevent excessive vegetative growth of rice (DAVIS, 1950; NOJIMA, 1963).
The success of draining depends on many factors, such as the state of the soil, the tolerance of the variety to adverse soil conditions, the prevalent weather and the surface and underground drainage. It can only be applied where the salt content of the soil cannot rise to a harmful concentration. The matter is made even more complex by the fact that draining affects not only the soil, but also directly affects growth of the crop through water supply and availability of nutrients. The optimum duration of a drainage period or the optimum dryness of the soil is therefore difficult to determine. Hence it is easily understood that research made into this matter in different countries has not always yielded consistent results (e.g., JENKINS and JONES, 1944; COYAUD,
1950; JONES, 1952; CHEANEY, 1955; DESAI et al., 1957; MATSUO, 1959; AGLIBUT et al,
1962/63) and that the author's investigations, too, have not unfrequently led to contradictory conclusions.
The first exploratory experiments with one or two periods of drainage were carried
8 Jaarverslag-1963 van de S.M.L., p. 57-58.
94
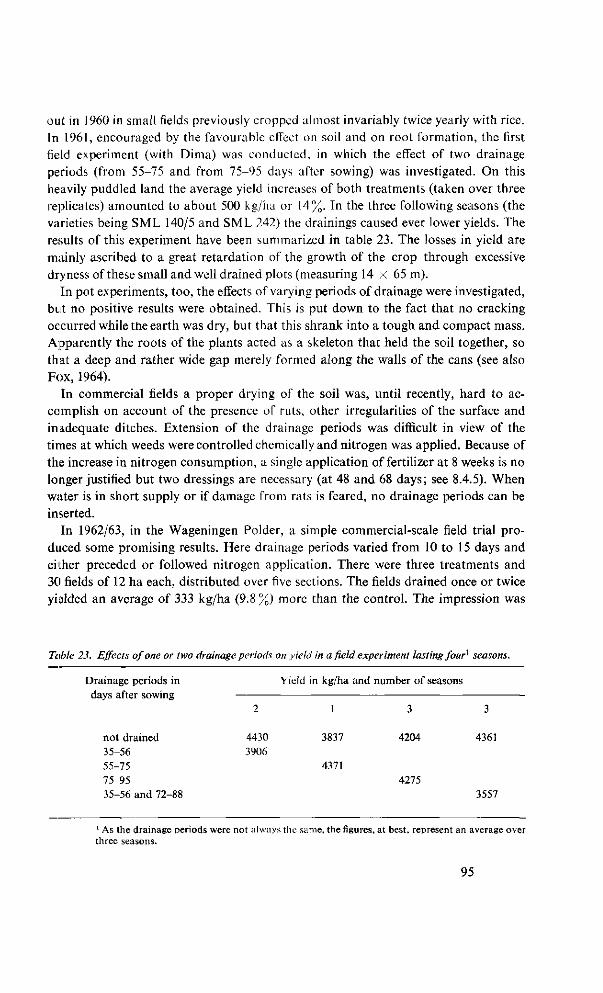
out in 1960 in small fields previously cropped almost invariably twice yearly with rice. In 1961, encouraged by the favourable effect on soil and on root formation, the first field experiment (with Dima) was conducted, in which the effect of two drainage periods (from 55-75 and from 75-95 days after sowing) was investigated. On this heavily puddled land the average yield increases of both treatments (taken over three replicates) amounted to about 500 kg/ha or 14%. In the three following seasons (the varieties being SML 140/5 and SML 242) the drainings caused ever lower yields. The results of this experiment have been summarized in table 23. The losses in yield are mainly ascribed to a great retardation of the growth of the crop through excessive dryness of these small and well drained plots (measuring 14 x 65 m).
In pot experiments, too, the effects of varying periods of drainage were investigated, but no positive results were obtained. This is put down to the fact that no cracking occurred while the earth was dry, but that this shrank into a tough and compact mass. Apparently the roots of the plants acted as a skeleton that held the soil together, so that a deep and rather wide gap merely formed along the walls of the cans (see also Fox, 1964).
In commercial fields a proper drying of the soil was, until recently, hard to accomplish on account of the presence of ruts, other irregularities of the surface and inadequate ditches. Extension of the drainage periods was difficult in view of the times at which weeds were controlled chemically and nitrogen was applied. Because of the increase in nitrogen consumption, a single application of fertilizer at 8 weeks is no longer justified but two dressings are necessary (at 48 and 68 days; see 8.4.5). When water is in short supply or if damage from rats is feared, no drainage periods can be inserted.
In 1962/63, in the Wageningen Polder, a simple commercial-scale field trial produced some promising results. Here drainage periods varied from 10 to 15 days and either preceded or followed nitrogen application. There were three treatments and 30 fields of 12 ha each, distributed over five sections. The fields drained once or twice yielded an average of 333 kg/ha (9.8%) more than the control. The impression was
Table 23. Effects of one or two drainage periods on yield in afield experiment lasting four1 seasons.
Drainage periods in days after sowing
not drained 35-56 55-75 75-95 35-56 and 72-88
2
4430 3906
Yield in kg/ha and number of seasons
1 3
3837 4204
4371 4275
3
4361
3557
1 As the drainage periods were not always the same, the figures, at best, represent an average over three seasons.
95
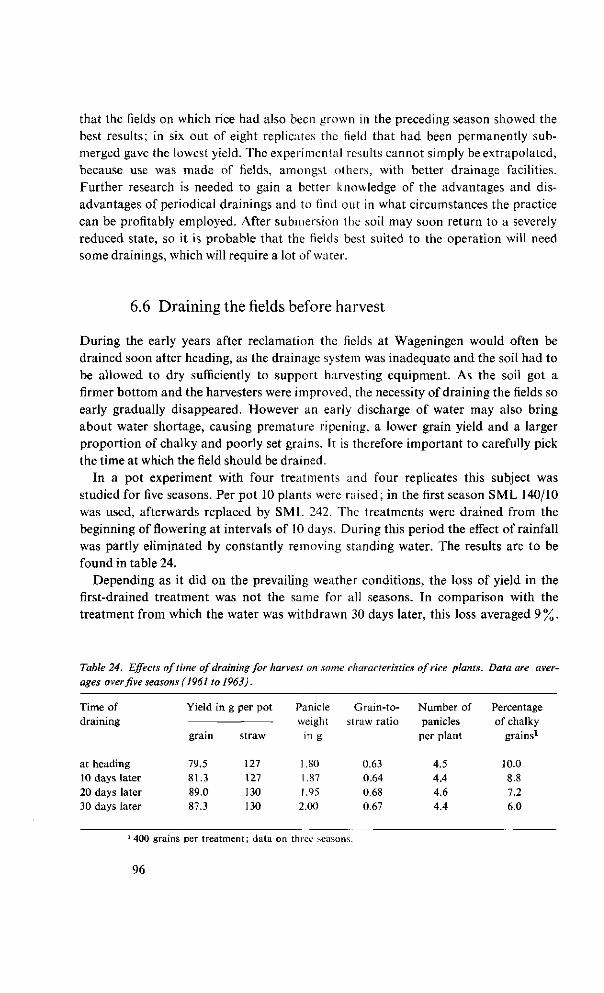
that the fields on which rice had also been grown in the preceding season showed the best results; in six out of eight replicates the field that had been permanently submerged gave the lowest yield. The experimental results cannot simply be extrapolated, because use was made of fields, amongst others, with better drainage facilities. Further research is needed to gain a better knowledge of the advantages and disadvantages of periodical drainings and to find out in what circumstances the practice can be profitably employed. After submersion the soil may soon return to a severely reduced state, so it is probable that the fields best suited to the operation will need some drainings, which will require a lot of water.
6.6 Draining the fields before harvest
During the early years after reclamation the fields at Wageningen would often be drained soon after heading, as the drainage system was inadequate and the soil had to be allowed to dry sufficiently to support harvesting equipment. As the soil got a firmer bottom and the harvesters were improved, the necessity of draining the fields so early gradually disappeared. However an early discharge of water may also bring about water shortage, causing premature ripening, a lower grain yield and a larger proportion of chalky and poorly set grains, ft is therefore important to carefully pick the time at which the field should be drained.
In a pot experiment with four treatments and four replicates this subject was studied for five seasons. Per pot 10 plants were raised; in the first season SML 140/10 was used, afterwards replaced by SML 242. The treatments were drained from the beginning of flowering at intervals of 10 days. During this period the effect of rainfall was partly eliminated by constantly removing standing water. The results are to be found in table 24.
Depending as it did on the prevailing weather conditions, the loss of yield in the first-drained treatment was not the same for all seasons. In comparison with the treatment from which the water was withdrawn 30 days later, this loss averaged 9%.
Table 24. Effects of time of draining for harvest on some characteristics of rice plants. Data are averages over five seasons (1961 to 1963).
Time of draining
at heading 10 days later 20 days later 30 days later
Yield in
grain
79.5 81.3 89.0 87.3
g per pot
straw
127 127 130 130
Panicle weight
in g
1.80 1.87 1.95
2.00
Grain-to-straw ratio
0.63 0.64 0.68 0.67
Number of panicles per plant
4.5 4.4 4.6 4.4
Percentage of chalky
grains1
10.0 8.8 7.2 6.0
1 400 grains per treatment; data on three seasons
96
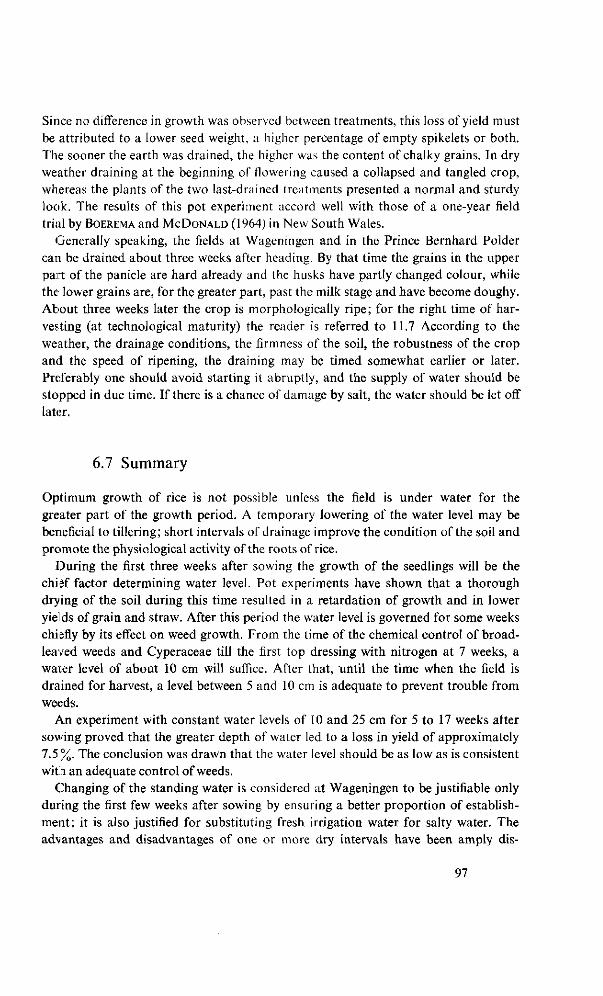
Since no difference in growth was observed between treatments, this loss of yield must be attributed to a lower seed weight, a higher percentage of empty spikelets or both. The sooner the earth was drained, the higher was the content of chalky grains. In dry weather draining at the beginning of flowering caused a collapsed and tangled crop, whereas the plants of the two last-drained treatments presented a normal and sturdy look. The results of this pot experiment accord well with those of a one-year field trial by BOEREMA and MCDONALD (1964) in New South Wales.
Generally speaking, the fields at Wageningen and in the Prince Bernhard Polder can be drained about three weeks after heading. By that time the grains in the upper part of the panicle are hard already and the husks have partly changed colour, while the lower grains are, for the greater part, past the milk stage and have become doughy. About three weeks later the crop is morphologically ripe; for the right time of harvesting (at technological maturity) the reader is referred to 11.7 According to the weather, the drainage conditions, the firmness of the soil, the robustness of the crop and the speed of ripening, the draining may be timed somewhat earlier or later. Preferably one should avoid starting it abruptly, and the supply of water should be stopped in due time. If there is a chance of damage by salt, the water should be let off later.
6.7 Summary
Optimum growth of rice is not possible unless the field is under water for the greater part of the growth period. A temporary lowering of the water level may be beneficial to tillering; short intervals of drainage improve the condition of the soil and promote the physiological activity of the roots of rice.
During the first three weeks after sowing the growth of the seedlings will be the chief factor determining water level. Pot experiments have shown that a thorough drying of the soil during this time resulted in a retardation of growth and in lower yields of grain and straw. After this period the water level is governed for some weeks chiefly by its effect on weed growth. From the time of the chemical control of broad-leaved weeds and Cyperaceae till the first top dressing with nitrogen at 7 weeks, a water level of about 10 cm will suffice. After that, until the time when the field is drained for harvest, a level between 5 and 10 cm is adequate to prevent trouble from weeds.
An experiment with constant water levels of 10 and 25 cm for 5 to 17 weeks after sowing proved that the greater depth of water led to a loss in yield of approximately 7.5%. The conclusion was drawn that the water level should be as low as is consistent with an adequate control of weeds.
Changing of the standing water is considered at Wageningen to be justifiable only during the first few weeks after sowing by ensuring a better proportion of establishment; it is also justified for substituting fresh irrigation water for salty water. The advantages and disadvantages of one or more dry intervals have been amply dis-
97
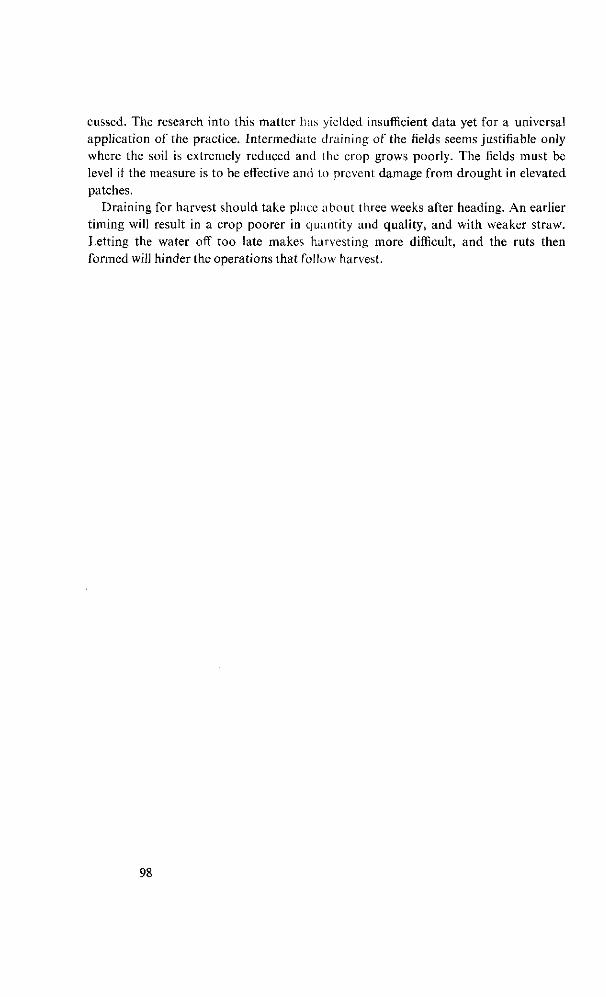
cussed. The research into this matter has yielded insufficient data yet for a universal application of the practice. Intermediate draining of the fields seems justifiable only where the soil is extremely reduced and the crop grows poorly. The fields must be level if the measure is to be effective and to prevent damage from drought in elevated patches.
Draining for harvest should take place about three weeks after heading. An earlier timing will result in a crop poorer in quantity and quality, and with weaker straw. Letting the water off too late makes harvesting more difficult, and the ruts then formed will hinder the operations that follow harvest.
98
7 Weed control
7.1 Introduction
The detrimental effects of weeds on the rice crop generally relate to competition for space, light and nutrients, while some species moreover serve as hosts to harmful insects and fungi. Besides a loss of yield, higher costs of harvesting, drying and processing as well as a lower market value of the product have sometimes to be reckoned with. In fully mechanized cultivation the varieties used are mostly diffeient from those used in the traditional practice of transplanting (as in early growth, tillering habit and grain-to-straw ratio), so that for this reason alone weed control generally constitutes a greater problem in the first than in the second case. Ever since the Prince Bernhard Polder was laid out and the Wageningen Project was started, the control of weeds has formed an important part of the research programme (DiRVENen SMIT, 1953; JONGE
PoERiNK en GEERTSEMA, 1953 ; DIRVEN and JONGE POERINK, 1955; DE WIT, 1960). Later investigations by Stubbs, Wouters and Ten Have have been described in the Annual Reports of the S.M.L.
The following sections will mainly deal with the control methods which have been applied in the past few years. The equipment has been drastically changed since 1964-1965, from when the chemical control has been carried out almost solely by aircraft. Of this latter method, being so recently introduced, no technical particulars are given. For chemical control the chief herbicides are 2,4-D and DPA9 (propanil); in special cases a limited use is made of Na-PCP10 and Bayluscid11. Drawings of the commonest weeds are given by WOUTERS (1965a).
7.2 Weed control by cultural methods, crop management and varietal choice
Preventive weed control during fallow periods has been discussed in chapter 3. Those measures, however, are far from adequate to prevent the growth of weeds among the crop. A good sowing method and proper water management are of paramount importance in weed control. Yet the full benefit of these practices can be derived only if enough irrigation water of good quality is available and the fields are in a level
9 3,4 - dichloropropionanilide 10 Sodium-pentachlorophenolate 11 Ethanolamine salt of 5,2' - dichloro - 4' - nitrosalicylanilide
99
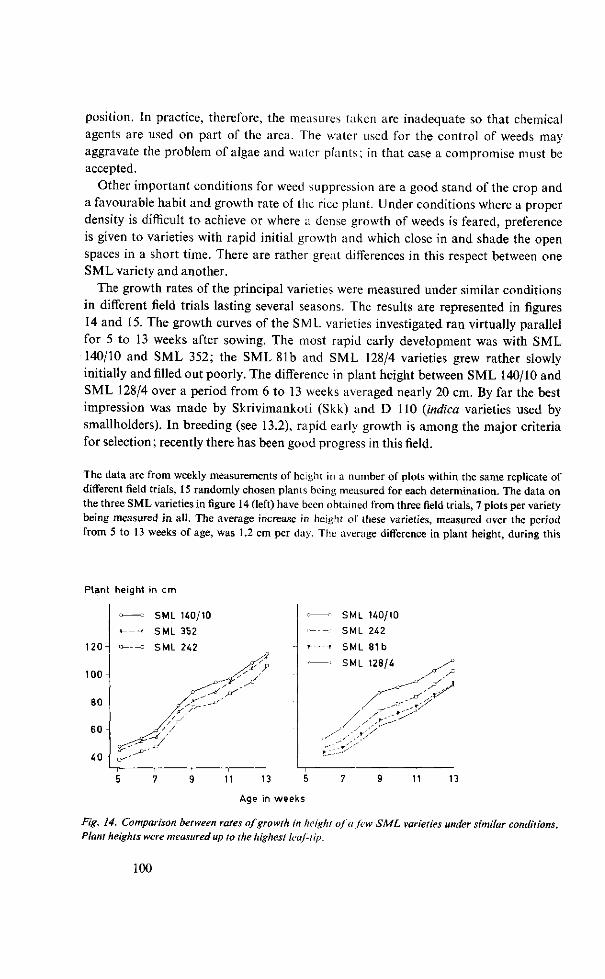
position. In practice, therefore, the measures taken are inadequate so that chemical agents are used on part of the area. The water used for the control of weeds may aggravate the problem of algae and water plants; in that case a compromise must be accepted.
Other important conditions for weed suppression are a good stand of the crop and a favourable habit and growth rate of the rice plant. Under conditions where a proper density is difficult to achieve or where a dense growth of weeds is feared, preference is given to varieties with rapid initial growth and which close in and shade the open spaces in a short time. There are rather great differences in this respect between one SML variety and another.
The growth rates of the principal varieties were measured under similar conditions in different field trials lasting several seasons. The results are represented in figures 14 and 15. The growth curves of the SML varieties investigated ran virtually parallel for 5 to 13 weeks after sowing. The most rapid early development was with SML 140/10 and SML 352; the SML 81b and SML 128/4 varieties grew rather slowly initially and filled out poorly. The difference in plant height between SML 140/10 and SML 128/4 over a period from 6 to 13 weeks averaged nearly 20 cm. By far the best impression was made by Skrivimankoti (Skk) and D 110 (indica varieties used by smallholders). In breeding (see 13.2), rapid early growth is among the major criteria for selection; recently there has been good progress in this field.
The data are from weekly measurements of height in a number of plots within the same replicate of different field trials, 15 randomly chosen plants being measured for each determination. The data on the three SML varieties in figure 14 (left) have been obtained from three field trials, 7 plots per variety being measured in all. The average increase in height of these varieties, measured over the period from 5 to 13 weeks of age, was 1.2 cm per day. The average difference in plant height, during this
Plant height in cm
120 H
100
80
60
40
SML H0/10
SML 352
SML 242
- ^ SML 140/10
---• SML 242
--* SML 81b
— SML 128/4
11 13 5
Age in weeks
13
Fig. 14. Comparison between rates of growth in height of a few SML varieties under similar conditions. Plant heights were measured up to the highest leaf-tip.
100
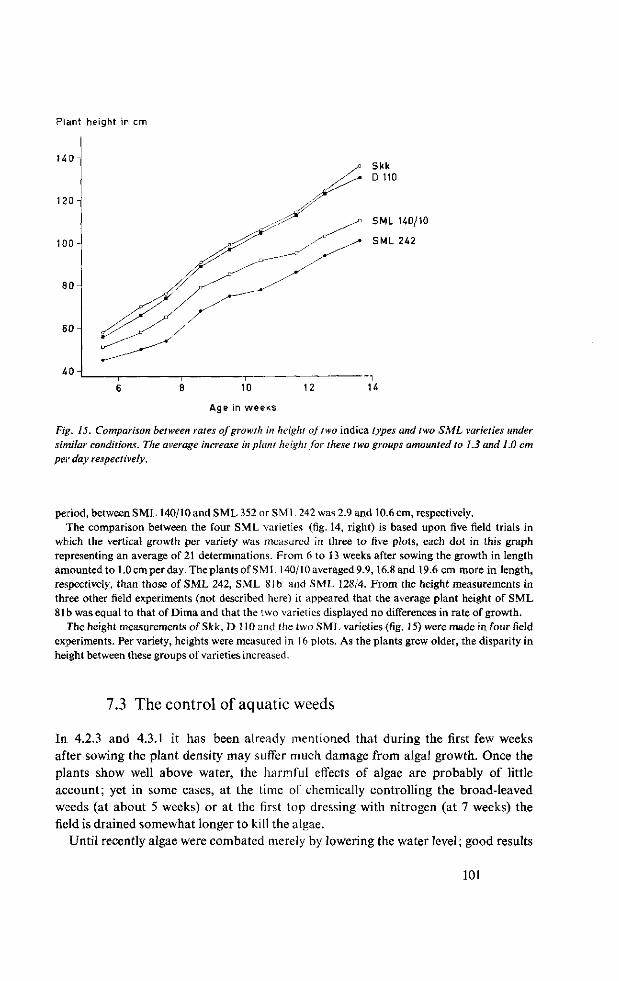
Plant height in cm
1 4 0 -
120
100
80
6 0 -
40
Skk D 110
SML HO/10
SML 242
10
Age in weeks
12 14
Fig. 15. Comparison between rates of growth in height of two indica types and two SML varieties under similar conditions. The average increase in plant height for these two groups amounted to 1.3 and 1.0 cm per day respectively.
period, between SML 140/10 and SML 352 or SML 242 was 2.9 and 10.6 cm, respectively. The comparison between the four SML varieties (fig. 14, right) is based upon five field trials in
which the vertical growth per variety was measured in three to five plots, each dot in this graph representing an average of 21 determinations. From 6 to 13 weeks after sowing the growth in length amounted to 1.0 cm per day. The plants of SML 140/10 averaged 9.9,16.8 and 19.6 cm more in length, respectively, than those of SML 242, SML 81b and SML 128/4. From the height measurements in three other field experiments (not described here) it appeared that the average plant height of SML 81b was equal to that of Dima and that the two varieties displayed no differences in rate of growth.
The height measurements of Skk, D 110 and the two SML varieties (fig. 15) were made in four field experiments. Per variety, heights were measured in 16 plots. As the plants grew older, the disparity in height between these groups of varieties increased.
7.3 The control of aquatic weeds
In 4.2.3 and 4.3.1 it has been already mentioned that during the first few weeks after sowing the plant density may suffer much damage from algal growth. Once the plants show well above water, the harmful effects of algae are probably of little account; yet in some cases, at the time of chemically controlling the broad-leaved weeds (at about 5 weeks) or at the first top dressing with nitrogen (at 7 weeks) the field is drained somewhat longer to kill the algae.
Until recently algae were combated merely by lowering the water level; good results
101
used to be obtained in level fields. Spraying tests with various chemicals were usually disappointing. The control was especially impaired by the circumstance that, at the time when it ought to be carried out, the rice plants are still wholly or partly submerged and are highly vulnerable. WOUTERS (1965b) gained favourable results with an application of Bayluscid 70%. For local treatment he recommends an aqueous solution of rather more than 1 kg of this chemical per ha.
Of the other aquatic weeds Nymphoides humboldtianum (H.B.K..) O.K. and Nym-phaea spp. are the most noxious to rice. Their injurious action can be reduced not only by a temporary lowering of the water level or a period of drainage but also by spraying them with 2,4-D, if the field is sufficiently drained. Experiments by WOUTERS
(1965b) have shown that under certain conditions Na-PCP can also be used; but with this spray the weeds have still to be under water, while the rice should show well above it because of the phytotoxic properties of the chemical. Per hectare an aqueous solution of about 8 kg Na-PCP 85 % (granular) is applied. The liquid is squirted into the water in a thin jet so that it hits as few rice plants as possible.
7.4 Chemical control of grasses
The most noxious grasses to threaten rice cultivated mechanically in Surinam are Ischaemum rugosum SALISB., Echinochloa crus-pavonis (H.B.K.) SCHULT., Echinochloa colonum (L.) LINK, Leptochloa scabra NEES and Luziola spruceana BENTH. Till about 1961 any chemical control of grasses in rice appeared impossible, so that all that could be done was to restrict the damage by appropriate crop management. Under field conditions this was feasible only in part, and there was a feeling of general relief when it became known that by applying DPA (orpropanil) the grass could be killed by spraying it at an early stage. The first tentative trials with Stam F-34 (a trade name for propanil) were carried out in the Prince Bernhard Polder in 1961/62 (see GRUBBEN,
1962). In the following seasons extensive experiments were made with this product (and with Surcopur) by Wouters at Wageningen and by the author in the Prince Bernhard Polder. Thanks also to the results obtained with propanil in other rice areas it was soon possible to use this herbicide on a large scale in the mechanized cultivation of rice in Surinam.
By far the greatest damage is inflicted on rice by Ischaemum rugosum. In weedy crops the grain yield is almost nil, while this grass may also cause serious lodging by laying the crop. Moreover the seeds arc hard to separate from the rice grain. In an off-season crop the effects of Ischaemum rugosum are less severe because then the duration of growth is about three weeks shorter and the grass grows less robustly. The literature and the experiments in Surinam show that the right time of spraying is fairly limited. The optimum lies somewhere between the end of the two-leaf, and the beginning of the four-leaf stage. Depending on the seedbed and the water management, this stage was reached by /. rugosum in 10 to 20 days after the sowing of rice; it then had a height of 6 to 12 cm.
102
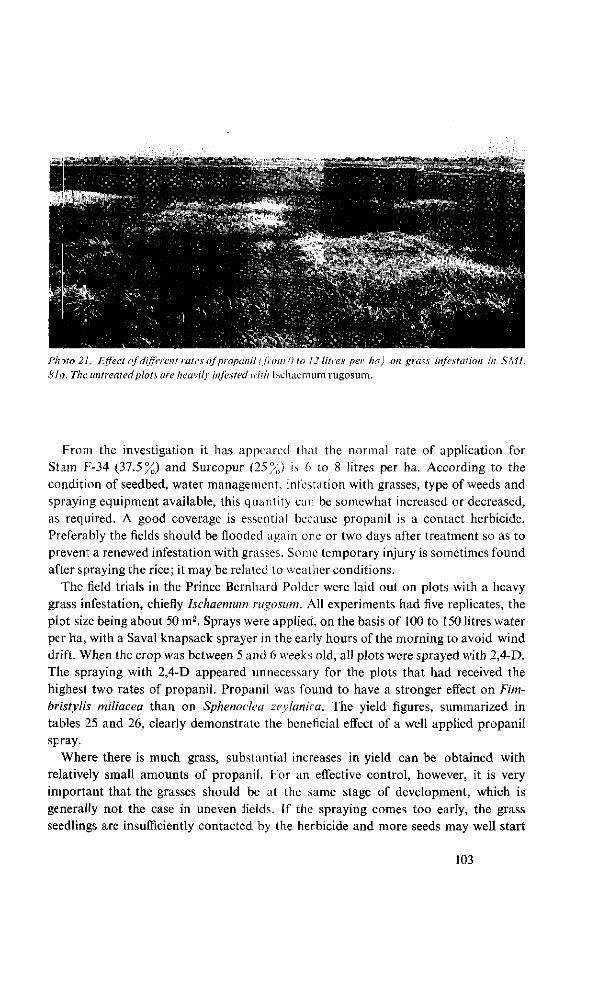
Photo 21. Effect of different rates of propanil (from O to 12 litres per ha) on grass infestation in S ML 81b. The untreated plots are heavily infested with Ischacmum rugosum.
From the investigation it has appeared that the normal rate of application for Stam F-34 (37.5%) and Surcopur (25%) is 6 to 8 litres per ha. According to the condition of seedbed, water management, infestation with grasses, type of weeds and spraying equipment available, this quantity can be somewhat increased or decreased, as required. A good coverage is essential because propanil is a contact herbicide. Preferably the fields should be flooded again one or two days after treatment so as to prevent a renewed infestation with grasses. Some temporary injury is sometimes found after spraying the rice; it may be related to weather conditions.
The field trials in the Prince Bernhard Polder were laid out on plots with a heavy grass infestation, chiefly Ischaemum rugosum. All experiments had five replicates, the plot size being about 50 m2. Sprays were applied, on the basis of 100 to 150 litres water per ha, with a Saval knapsack sprayer in the early hours of the morning to avoid wind drift. When the crop was between 5 and 6 weeks old, all plots were sprayed with 2,4-D. The spraying with 2,4-D appeared unnecessary for the plots that had received the highest two rates of propanil. Propanil was found to have a stronger effect on Fim-bristylis miliacea than on Sphenoclea zeylanica. The yield figures, summarized in tables 25 and 26, clearly demonstrate the beneficial effect of a well applied propanil spray.
Where there is much grass, substantial increases in yield can be obtained with relatively small amounts of propanil. For an effective control, however, it is very important that the grasses should be at the same stage of development, which is generally not the case in uneven fields. If the spraying comes too early, the grass seedlings are insufficiently contacted by the herbicide and more seeds may well start
103
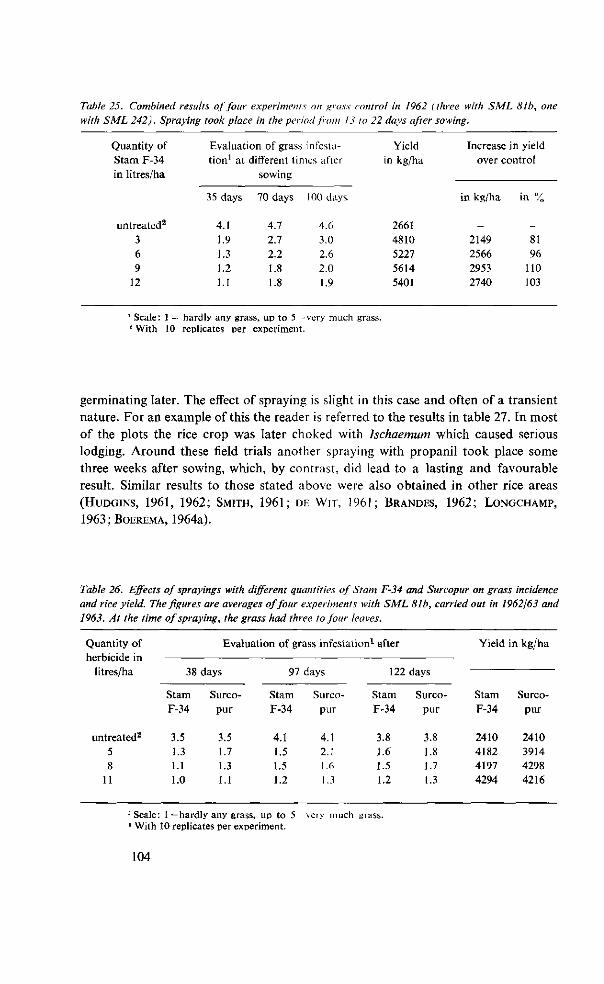
Table 25. Combined results of four experiments on grass control in 1962 (three with SML 81b, one with SML 242). Spraying took place in the period from 13 to 22 days after sowing.
Increase in yield over control
in kg/ha in
Quantity of
Stam F-34 in litres/ha
untreated2
3
6
9 12
Evaluation of grass infesta-tion1 at different times after
35 days
4.1 1.9
1.3
1.2 1.1
sowing
70 days
4.7
2.7 2.2
1.8
1.8
100 days
4.6
3.0 2.6
2.0
1.9
Yield
in kg/ha
2661
4810 5227
5614
5401
2149
2566
2953 2740
81
96 110
103
Scale: 1 = hardly any grass, up to 5 -very much grass. 2 With 10 replicates per experiment.
germinating later. The effect of spraying is slight in this case and often of a transient
nature. For an example of this the reader is referred to the results in table 27. In most
of the plots the rice crop was later choked with Ischaemum which caused serious
lodging. Around these field trials another spraying with propanil took place some
three weeks after sowing, which, by contrast, did lead to a lasting and favourable
result. Similar results to those stated above were also obtained in other rice areas
(HUDGINS, 1961, 1962; SMITH, 1961; DE WIT , 1961; BRANDES, 1962; LONGCHAMP,
1963 ;BOEREMA, 1964a).
Table 26. Effects of sprayings with different quantities of Stain F-34 and Surcopur on grass incidence and rice yield. The figures are averages of four experiments with SML 81b, carried out in 1962163 and 1963. At the time of spraying, the grass had three to four leaves.
Quantity of
herbicide in
litres/ha
untreated2
5
8 11
Evaluation of grass infestation1 after
38 days
Stam
F-34
3.5 1.3
1.1
1.0
Surcopur
3.5 1.7
1.3
1.1
97 days
Stam
F-34
4.1
1.5 1.5 1.2
Surcopur
4.1 2.1
1.6 1.3
122 days
Stam F-34
3.8
1.6 1.5
1.2
Surcopur
3.8 1.8
1.7 1.3
Yield
Stam
F-34
2410 4182 4197
4294
in kg/ha
Surcopur
2410
3914 4298 4216
1 Scale: 1 =hardly any grass, up to 5 very much grass. ! With 10 replicates per experiment.
104
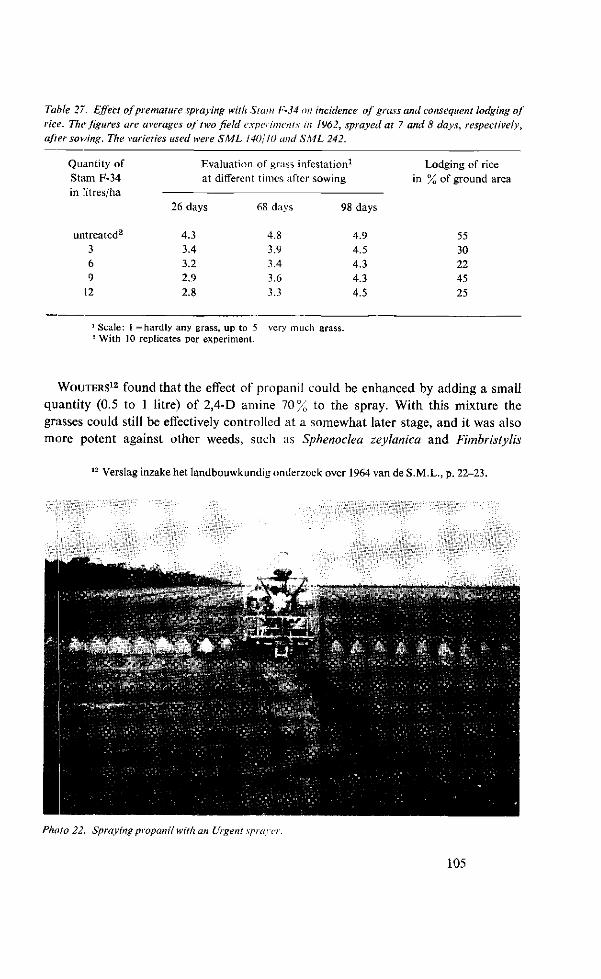
Table 27. Effect of premature spraying with Stain F-34 on incidence of grass and consequent lodging of rice. The figures are averages of two field experiments in 1962, sprayed at 7 and 8 days, respectively, after sowing. The varieties used were SML 140/10 and S ML 242.
Quantity of Stam F-34 in litres/ha
untreated2
3 6 9
12
Evaluation of grass infestati on1
at different times after sowing
26 days
4.3 3.4 3.2 2.9 2.8
68 days
4.8 3.9 3.4 3.6 3.3
98 days
4.9 4.5 4.3 4.3 4.5
Lodging of rice in % of ground area
55 30 22 45 25
1 Scale: 1 = hardly any grass, up to 5 very much grass. 2 With 10 replicates per experiment.
WOUTERS12 found that the effect of propanil could be enhanced by adding a small quantity (0.5 to 1 litre) of 2,4-D amine 70% to the spray. With this mixture the grasses could still be effectively controlled at a somewhat later stage, and it was also more potent against other weeds, such as Sphenoclea zeylanica and Fimbristylis
12 Verslag inzake het landbouwkundig onderzoek over 1964 van de S.M.L., p. 22-23.
•w •'m-
Photo 22. Spraying propanil with an Urgent sprayer.
105
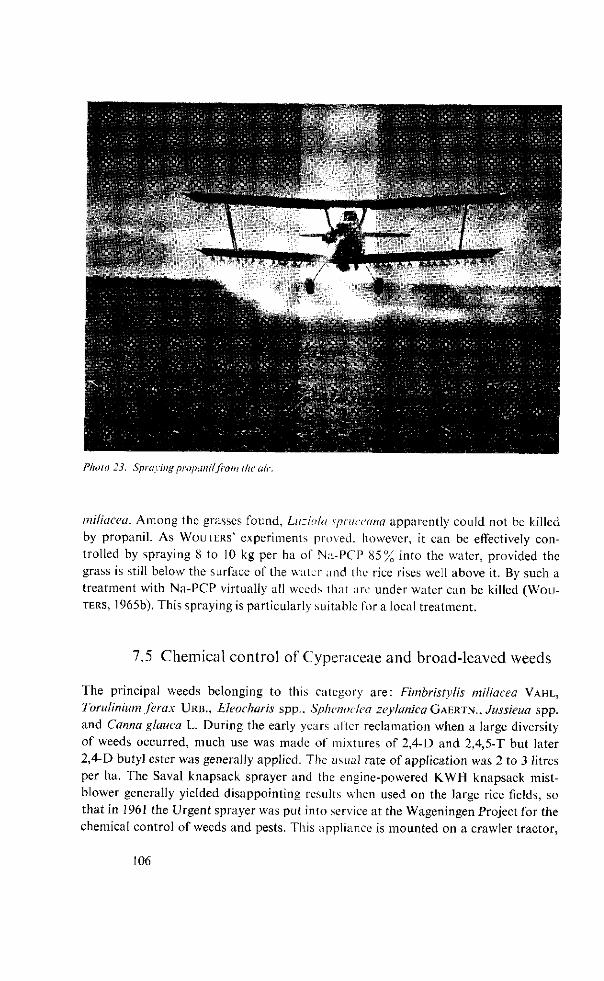
Photo 23. Spraying propanilfrom the air.
miliacea. Among the grasses found, Luziola spruccana apparently could not be killed by propanil. As WOUTERS' experiments proved, however, it can be effectively controlled by spraying 8 to 10 kg per ha of Na-PCP 85% into the water, provided the grass is still below the surface of the water and the rice rises well above it. By such a treatment with Na-PCP virtually all weeds that are under water can be killed (WOU
TERS, 1965b). This spraying is particularly suitable for a local treatment.
7.5 Chemical control of Cyperaccae and broad-leaved weeds
The principal weeds belonging to this category are: Fimbristylis miliacea VAHL,
Torulinium ferax URB., Eleocharis spp., Splwnoclea zeylanica GAERTN., Jussieua spp. and Canna glauca L. During the early years after reclamation when a large diversity of weeds occurred, much use was made of mixtures of 2,4-D and 2,4,5-T but later 2,4-D butyl ester was generally applied. The usual rate of application was 2 to 3 litres per ha. The Saval knapsack sprayer and the engine-powered KWH knapsack mist-blower generally yielded disappointing results when used on the large rice fields, so that in 1961 the Urgent sprayer was put into service at the Wageningen Project for the chemical control of weeds and pests. This appliance is mounted on a crawler tractor,
106
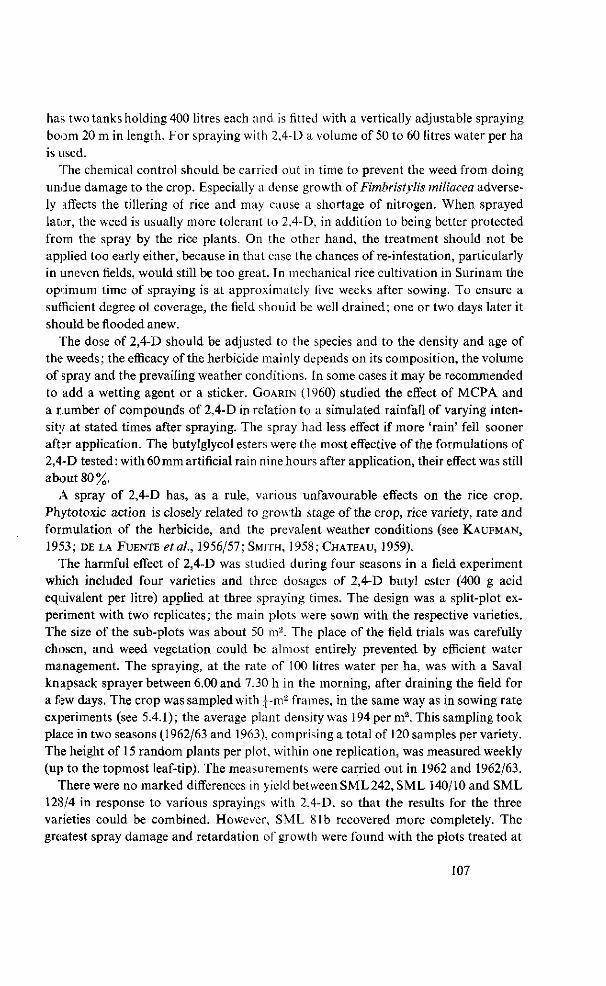
has; two tanks holding 400 litres each and is fitted with a vertically adjustable spraying boom 20 m in length. For spraying with 2,4-D a volume of 50 to 60 litres water per ha is used.
The chemical control should be carried out in time to prevent the weed from doing undue damage to the crop. Especially a dense growth of Fimbristylis miliacea adversely affects the tillering of rice and may cause a shortage of nitrogen. When sprayed later, the weed is usually more tolerant to 2,4-D, in addition to being better protected from the spray by the rice plants. On the other hand, the treatment should not be applied too early either, because in that case the chances of re-infestation, particularly in uneven fields, would still be too great. In mechanical rice cultivation in Surinam the opdmum time of spraying is at approximately five weeks after sowing. To ensure a sufficient degree of coverage, the field should be well drained; one or two days later it should be flooded anew.
The dose of 2,4-D should be adjusted to the species and to the density and age of the weeds; the efficacy of the herbicide mainly depends on its composition, the volume of spray and the prevailing weather conditions. In some cases it may be recommended to add a wetting agent or a sticker. GOARIN (1960) studied the effect of MCPA and a number of compounds of 2,4-D in relation to a simulated rainfall of varying intensity at stated times after spraying. The spray had less effect if more 'rain' fell sooner after application. The butylglycol esters were the most effective of the formulations of 2,4-D tested : with 60 mm artificial rain nine hours after application, their effect was still about 80%.
A spray of 2,4-D has, as a rule, various unfavourable effects on the rice crop. Phytotoxic action is closely related to growth stage of the crop, rice variety, rate and formulation of the herbicide, and the prevalent weather conditions (see KAUFMAN,
1953; DE LA FUENTE et ah, 1956/57; SMITH, 1958; CHATEAU, 1959). The harmful effect of 2,4-D was studied during four seasons in a field experiment
which included four varieties and three dosages of 2,4-D butyl ester (400 g acid equivalent per litre) applied at three spraying times. The design was a split-plot experiment with two replicates; the main plots were sown with the respective varieties. The size of the sub-plots was about 50 m2. The place of the field trials was carefully chosen, and weed vegetation could be almost entirely prevented by efficient water management. The spraying, at the rate of 100 litres water per ha, was with a Saval knapsack sprayer between 6.00 and 7.30 h in the morning, after draining the field for a few days. The crop was sampled with \-rv? frames, in the same way as in sowing rate experiments (see 5.4.1); the average plant density was 194 perm2. This sampling took place in two seasons (1962/63 and 1963), comprising a total of 120 samples per variety. The height of 15 random plants per plot, within one replication, was measured weekly (up to the topmost leaf-tip). The measurements were carried out in 1962 and 1962/63.
There were no marked differences in yield between SML 242, SML 140/10 and SML 128/4 in response to various sprayings with 2,4-D, so that the results for the three varieties could be combined. However, SML 81b recovered more completely. The greatest spray damage and retardation of growth were found with the plots treated at
107
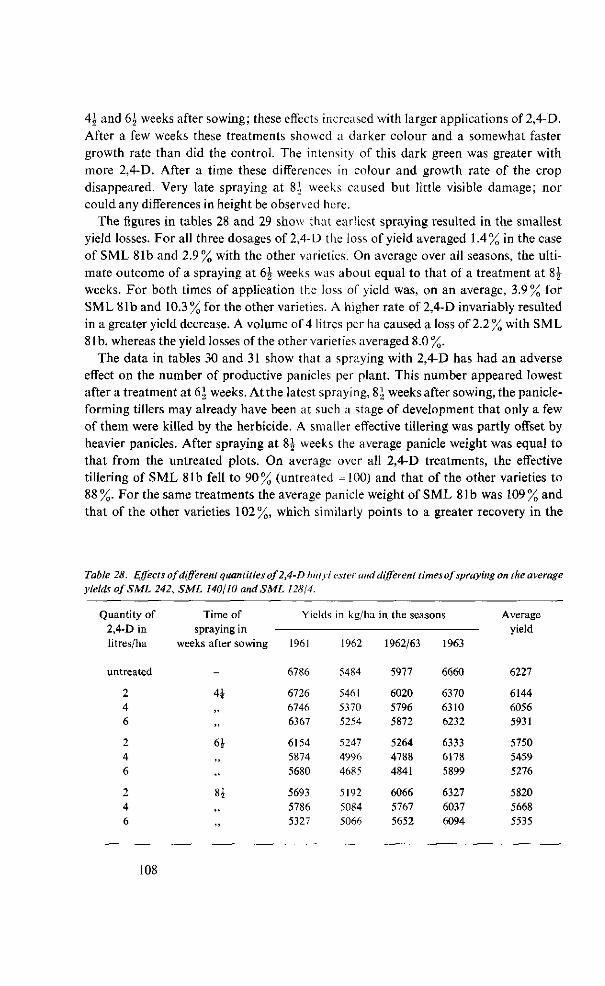
4h and 6-J- weeks after sowing; these effects increased with larger applications of 2,4-D. After a few weeks these treatments showed a darker colour and a somewhat faster growth rate than did the control. The intensity of this dark green was greater with more 2,4-D. After a time these differences in colour and growth rate of the crop disappeared. Very late spraying at 8.1 weeks caused but little visible damage; nor could any differences in height be observed here.
The figures in tables 28 and 29 show that earliest spraying resulted in the smallest yield losses. For all three dosages of 2,4-D the loss of yield averaged 1.4% in the case of SML 81b and 2.9% with the other varieties. On average over all seasons, the ultimate outcome of a spraying at 6\ weeks was about equal to that of a treatment at 8J weeks. For both times of application the loss of yield was, on an average, 3.9% for SML 81b and 10.3 % for the other varieties. A higher rate of 2,4-D invariably resulted in a greater yield decrease. A volume of 4 litres per ha caused a loss of 2.2 % with SML 81b, whereas the yield losses of the other varieties averaged 8.0%.
The data in tables 30 and 31 show that a spraying with 2,4-D has had an adverse effect on the number of productive panicles per plant. This number appeared lowest after a treatment at 6 | weeks. At the latest spraying, 8 | weeks after sowing, the panicle-forming tillers may already have been at such a stage of development that only a few of them were killed by the herbicide. A smaller effective tillering was partly offset by heavier panicles. After spraying at 8 | weeks the average panicle weight was equal to that from the untreated plots. On average over all 2,4-D treatments, the effective tillering of SML 81b fell to 90% (untreated = 100) and that of the other varieties to 88%. For the same treatments the average panicle weight of SML 81b was 109% and that of the other varieties 102%, which similarly points to a greater recovery in the
Table 28. Effects of different quantities of 2,4-D butyl ester and different times of spraying on the average yields of SML 242, SML 140/10 and SML 128/4.
Quantity of
2,4-D in
litres/ha
untreated
2 4 6
2 4 6
2 4 6
Time of
spraying in
weeks after sowing
-
4J ,, ».
61 ,, ..
Bi „
"
Yield!
1961
6786
6726
6746
6367
6154
5874
5680
5693
5786
5327
; in kg/ha in the seasons
1962
5484
5461
5370
5254
5247
4996
4685
5192
5084
5066
1962/63
5977
6020
5796
5872
5264
4788
4841
6066
5767
5652
1963
6660
6370
6310
6232
6333
6178
5899
6327
6037
6094
Average
yield
6227
6144
6056
5931
5750
5459
5276
5820
5668
5535
108
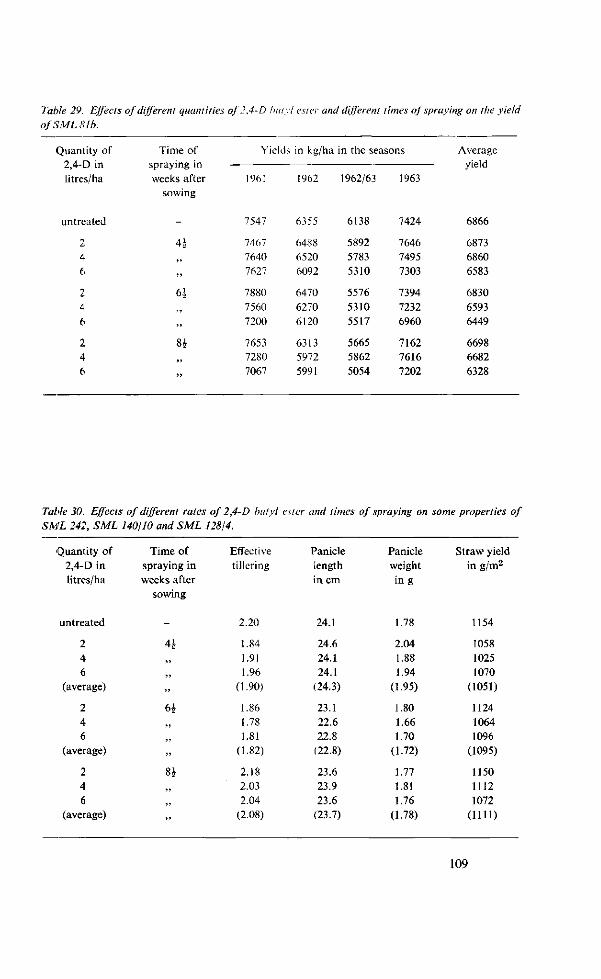
Table 29. Effects of different quantities of 2 A-D hut vi ester and different times of spraying on the yield ofSML 81b.
Quantity of 2,4-D in litres/ha
untreated
A.
4 6
4 6
2 4 6
Time of spraying in weeks after
sowing
-
41
°2
8i
Yields
196!
7547
7467 7640 7627
7880 7560 7200
7653 7280 7067
in kg/ha
1962
6355
6488 6520 6092
6470 6270 6120
6313 5972 5991
in the seasons
1962/63
6138
5892 5783 5310
5576 5310 5517
5665 5862 5054
1963
7424
7646 7495 7303
7394 7232 6960
7162 7616 7202
Average yield
6866
6873 6860 6583
6830 6593 6449
6698 6682 6328
Table 30. Effects of different rates of 2A-D butyl ester and times of spraying on some properties of SML 242, SML 140/10 and SML 128/4.
Quantity of 2,4-D in litres/ha
untreated
2 4 6
(average)
2 4 6
(average)
2 4 6
(average)
Time of spraying in weeks after
sowing
-
41 ,, ,, »
6i ,, ,, »
8i ,, ,,
"
Effective tillering
2.20
1.84 1.91 1.96
(1.90)
1.86 1.78 1.81
(1.82)
2.18 2.03 2.04
(2.08)
Panicle length in cm
24.1
24.6 24.1 24.1
(24.3)
23.1 22.6 22.8
(22.8)
23.6 23.9 23.6
(23.7)
Panicle weight in g
1.78
2.04 1.88 1.94
(1.95)
1.80 1.66 1.70
(1.72)
1.77 1.81 1.76
(1.78)
Straw yield in g/m2
1154
1058 1025 1070
(1051)
1124 1064 1096
(1095)
1150 1112 1072
( U l i )
109
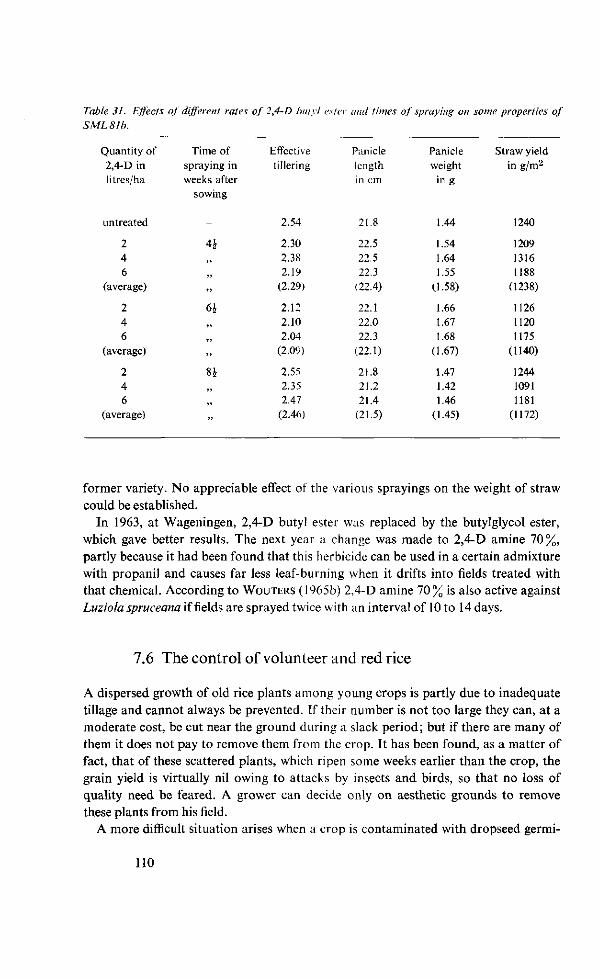
Table 31. Effects of different rates of 2,4-D butyl ester and times of spraying on some properties of S ML 8 lb.
Quantity of 2,4-D in litres/ha
untreated
2 4 6
(average)
2 4 6
(average)
2 4 6
(average)
Time of spraying in weeks after
sowing
-
4J ,, „
..
6 i „ „
..
81 „ ,,
"
Effective tillering
2.54
2.30 2.38 2.19
(2.29)
2.12 2.10 2.04
(2.09)
2.55 2.35 2.47
(2.46)
Panicle length in cm
21.8
22.5 22.5 22.3
(22.4)
22.1 22.0 22.3
(22.1)
21.8 21.2 21.4
(21.5)
Panicle weight
in g
1.44
1.54 1.64 1.55
(1.58)
1.66 1.67 1.68
(1.67)
1.47 1.42 1.46
(1.45)
Straw yield in g/m2
1240
1209 1316 1188
(1238)
1126 1120 1175
(1140)
1244 1091 1181
(1172)
former variety. No appreciable effect of the various sprayings on the weight of straw could be established.
In 1963, at Wageningen, 2,4-D butyl ester was replaced by the butylglycol ester, which gave better results. The next year a change was made to 2,4-D amine 70%, partly because it had been found that this herbicide can be used in a certain admixture with propanil and causes far less leaf-burning when it drifts into fields treated with that chemical. According to WOUTERS (1965b) 2,4-D amine 70% is also active against Luziola spruceana if fields are sprayed twice with an interval of 10 to 14 days.
7.6 The control of volunteer and red rice
A dispersed growth of old rice plants among young crops is partly due to inadequate tillage and cannot always be prevented. If their number is not too large they can, at a moderate cost, be cut near the ground during a slack period; but if there are many of them it does not pay to remove them from the crop. It has been found, as a matter of fact, that of these scattered plants, which ripen some weeks earlier than the crop, the grain yield is virtually nil owing to attacks by insects and birds, so that no loss of quality need be feared. A grower can decide only on aesthetic grounds to remove these plants from his field.
A more difficult situation arises when a crop is contaminated with dropseed germi-
110
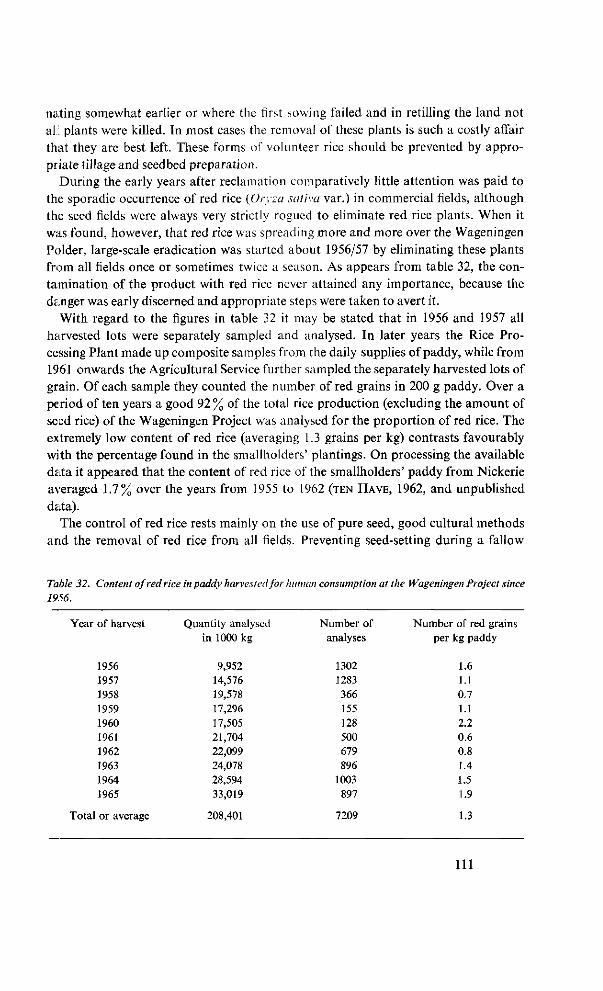
na.ting somewhat earlier or where the first sowing failed and in refilling the land not all plants were killed. In most cases the removal of these plants is such a costly affair that they are best left. These forms of volunteer rice should be prevented by appropriate tillage and seedbed preparation.
During the early years after reclamation comparatively little attention was paid to the sporadic occurrence of red rice (Oryza sativa var.) in commercial fields, although the seed fields were always very strictly rogued to eliminate red rice plants. When it was found, however, that red rice was spreading more and more over the Wageningen Polder, large-scale eradication was started about 1956/57 by eliminating these plants from all fields once or sometimes twice a season. As appears from table 32, the contamination of the product with red rice never attained any importance, because the danger was early discerned and appropriate steps were taken to avert it.
With regard to the figures in table 32 it may be stated that in 1956 and 1957 all harvested lots were separately sampled and analysed. In later years the Rice Processing Plant made up composite samples from the daily supplies of paddy, while from 1961 onwards the Agricultural Service further sampled the separately harvested lots of grain. Of each sample they counted the number of red grains in 200 g paddy. Over a period of ten years a good 92 % of the total rice production (excluding the amount of seed rice) of the Wageningen Project was analysed for the proportion of red rice. The extremely low content of red rice (averaging 1.3 grains per kg) contrasts favourably with the percentage found in the smallholders' plantings. On processing the available data it appeared that the content of red rice of the smallholders' paddy from Nickerie averaged 1.7% over the years from 1955 to 1962 (TEN HAVE, 1962, and unpublished data).
The control of red rice rests mainly on the use of pure seed, good cultural methods and the removal of red rice from all fields. Preventing seed-setting during a fallow
Table 32. Content of red rice in paddy harvested for human consumption at the Wageningen Project since 19.56.
Year of harvest
1956 1957 1958 1959 1960 1961 1962 1963 1964 1965
Total or average
Quantity analysed in 1000 kg
9,952 14,576 19,578 17,296 17,505 21,704 22,099 24,078 28,594 33,019
208,401
Number of analyses
1302 1283 366 155 128 500 679 896
1003 897
7209
Number of red grains per kg paddy
1.6 1.1 0.7 1.1 2.2 0.6 0.8 1.4 1.5 1.9
1.3
111
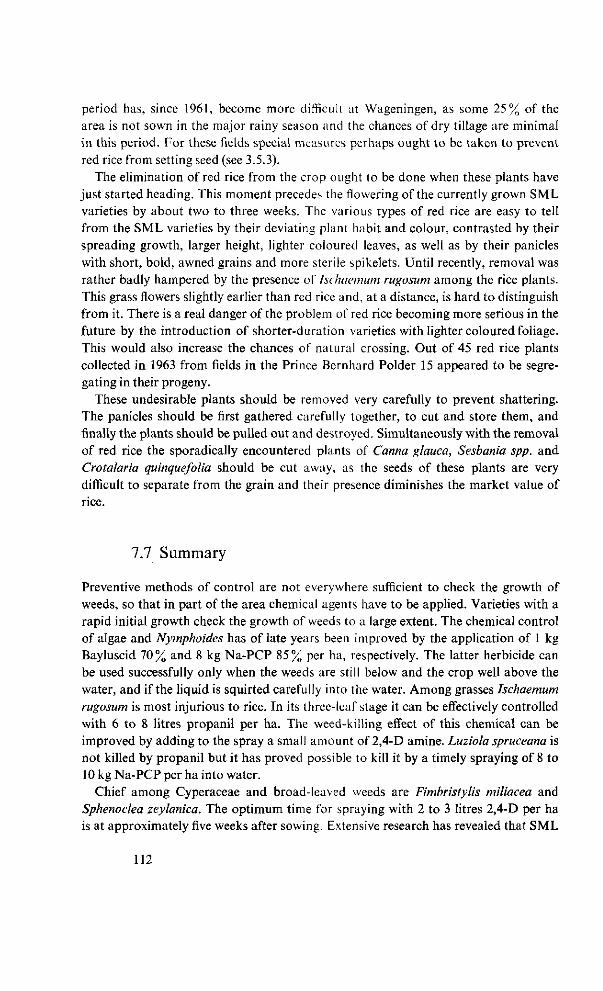
period has, since 1961, become more difficult at Wageningen, as some 25% of the area is not sown in the major rainy season and the chances of dry tillage are minimal in this period. For these fields special measures perhaps ought to be taken to prevent red rice from setting seed (see 3.5.3).
The elimination of red rice from the crop ought to be done when these plants have just started heading. This moment precedes the flowering of the currently grown SML varieties by about two to three weeks. The various types of red rice are easy to tell from the SML varieties by their deviating plant habit and colour, contrasted by their spreading growth, larger height, lighter coloured leaves, as well as by their panicles with short, bold, awned grains and more sterile spikelets. Until recently, removal was rather badly hampered by the presence of Ischaemum rugosum among the rice plants. This grass flowers slightly earlier than red rice and, at a distance, is hard to distinguish from it. There is a real danger of the problem of red rice becoming more serious in the future by the introduction of shorter-duration varieties with lighter coloured foliage. This would also increase the chances of natural crossing. Out of 45 red rice plants collected in 1963 from fields in the Prince Bernhard Polder 15 appeared to be segregating in their progeny.
These undesirable plants should be removed very carefully to prevent shattering. The panicles should be first gathered carefully together, to cut and store them, and finally the plants should be pulled out and destroyed. Simultaneously with the removal of red rice the sporadically encountered plants of Canna glauca, Sesbania spp. and Crotalaria quinquefolia should be cut away, as the seeds of these plants are very difficult to separate from the grain and their presence diminishes the market value of rice.
7.7 Summary
Preventive methods of control are not everywhere sufficient to check the growth of weeds, so that in part of the area chemical agents have to be applied. Varieties with a rapid initial growth check the growth of weeds to a large extent. The chemical control of algae and Nymphoides has of late years been improved by the application of 1 kg Bayluscid 70% and 8 kg Na-PCP 85% per ha, respectively. The latter herbicide can be used successfully only when the weeds are still below and the crop well above the water, and if the liquid is squirted carefully into the water. Among grasses Ischaemum rugosum is most injurious to rice. In its three-leaf stage it can be effectively controlled with 6 to 8 litres propanil per ha. The weed-killing effect of this chemical can be improved by adding to the spray a small amount of 2,4-D amine. Luziola spruceana is not killed by propanil but it has proved possible to kill it by a timely spraying of 8 to 10 kg Na-PCP per ha into water.
Chief among Cyperaceae and broad-leaved weeds are Fimbristylis miliacea and Sphenoclea zeylanica. The optimum time for spraying with 2 to 3 litres 2,4-D per ha is at approximately five weeks after sowing. Extensive research has revealed that SML
112
81b has greater tolerance to 2,4-D butyl ester than the other SML varieties tested, and thai: the crop suffers less permanent injury from a treatment at 4J weeks than if it is sprayed 6 \ weeks after sowing.
The control of red rice is given much attention each season. In addition to a very strict check for the presence of red rice in seed fields, other fields are once or twice cleared of those plants. This eradication is best done when red rice has just started heading or about 2 to 3 weeks before the flowering of commercial varieties. During a period often years 1.3 red grains were, on average, found per kg paddy harvested for human consumption at the Wageningen Project.
113
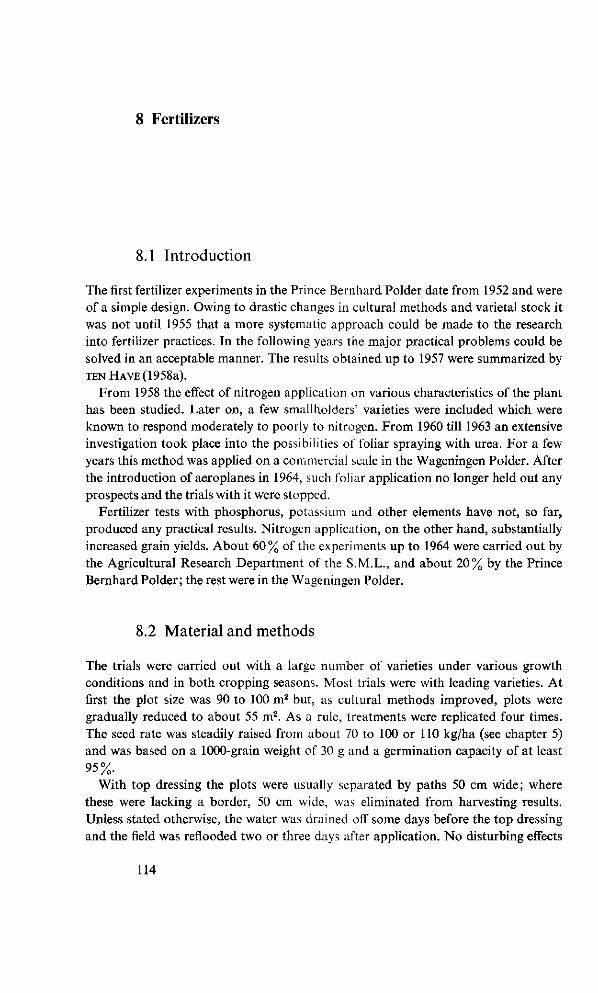
8 Fertilizers
8.1 Introduction
The first fertilizer experiments in the Prince Bernhard Polder date from 1952 and were of a simple design. Owing to drastic changes in cultural methods and varietal stock it was not until 1955 that a more systematic approach could be made to the research into fertilizer practices. In the following years the major practical problems could be solved in an acceptable manner. The results obtained up to 1957 were summarized by TEN HAVE (1958a).
From 1958 the effect of nitrogen application on various characteristics of the plant has been studied. Later on, a few smallholders' varieties were included which were known to respond moderately to poorly to nitrogen. From 1960 till 1963 an extensive investigation took place into the possibilities of foliar spraying with urea. For a few years this method was applied on a commercial scale in the Wageningen Polder. After the introduction of aeroplanes in 1964, such foliar application no longer held out any prospects and the trials with it were stopped.
Fertilizer tests with phosphorus, potassium and other elements have not, so far, produced any practical results. Nitrogen application, on the other hand, substantially increased grain yields. About 60% of the experiments up to 1964 were carried out by the Agricultural Research Department of the S.M.L., and about 20% by the Prince Bernhard Polder; the rest were in the Wageningen Polder.
8.2 Material and methods
The trials were carried out with a large number of varieties under various growth conditions and in both cropping seasons. Most trials were with leading varieties. At first the plot size was 90 to 100 m2 but, as cultural methods improved, plots were gradually reduced to about 55 m2. As a rule, treatments were replicated four times. The seed rate was steadily raised from about 70 to 100 or 110 kg/ha (see chapter 5) and was based on a 1000-grain weight of 30 g and a germination capacity of at least 95%.
With top dressing the plots were usually separated by paths 50 cm wide; where these were lacking a border, 50 cm wide, was eliminated from harvesting results. Unless stated otherwise, the water was drained off some days before the top dressing and the field was reflooded two or three days after application. No disturbing effects
114
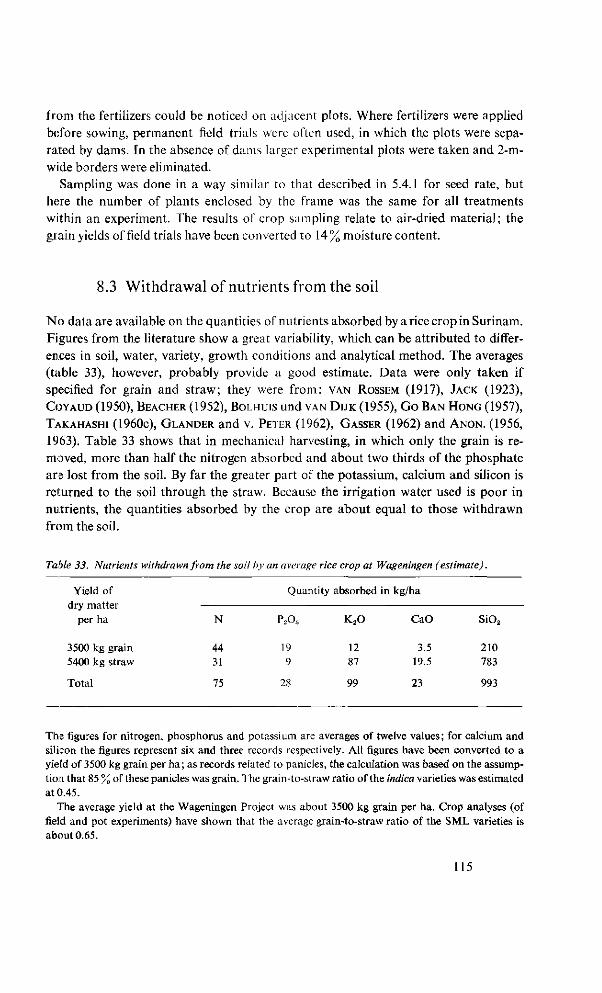
from the fertilizers could be noticed on adjacent plots. Where fertilizers were applied
before sowing, permanent field trials were often used, in which the plots were sepa
rated by dams. In the absence of dams larger experimental plots were taken and 2-m-
wide borders were eliminated.
Sampling was done in a way similar to that described in 5.4.1 for seed rate, but
here the number of plants enclosed by the frame was the same for all treatments
within an experiment. The results of crop sampling relate to air-dried material; the
grain yields of field trials have been converted to 14% moisture content.
8.3 Withdrawal of nutrients from the soil
No data are available on the quantities of nutrients absorbed by a rice crop in Surinam.
Figures from the literature show a great variability, which can be attributed to differ
ences in soil, water, variety, growth conditions and analytical method. The averages
(table 33), however, probably provide a good estimate. Data were only taken if
specified for grain and straw; they were from: VAN ROSSEM (1917), JACK (1923),
COYAUD (1950), BEACHER (1952), BOLHUIS und VAN D I J K (1955), Go BAN HONG (1957),
TAKAHASHI ( 1960C) , GLANDER and v. PETER (1962), GASSER (1962) and ANON. (1956,
1963). Table 33 shows that in mechanical harvesting, in which only the grain is re
moved, more than half the nitrogen absorbed and about two thirds of the phosphate
are lost from the soil. By far the greater part of the potassium, calcium and silicon is
returned to the soil through the straw. Because the irrigation water used is poor in
nutrients, the quantities absorbed by the crop are about equal to those withdrawn
from the soil.
Table 33. Nutrients withdrawn from the soil by an average rice crop at Wageningen (estimate).
Yield of
dry matter
per ha
3500 kg grain 5400 kg straw
Total
N
44 31
75
Quantity absorbed
P2O.
19 9
28
K 2 0
12 87
99
in kg/ha
CaO
3.5 19.5
23
sio2
210 783
993
Ths figures for nitrogen, phosphorus and potassium are averages of twelve values; for calcium and silicon the figures represent six and three records respectively. All figures have been converted to a yield of 3500 kg grain per ha; as records related to panicles, the calculation was based on the assumption that 85 % of these panicles was grain. The grain-to-straw ratio of the indica varieties was estimated at 0.45.
The average yield at the Wageningen Project was about 3500 kg grain per ha. Crop analyses (of field and pot experiments) have shown that the average grain-to-straw ratio of the S ML varieties is about 0.65.
115
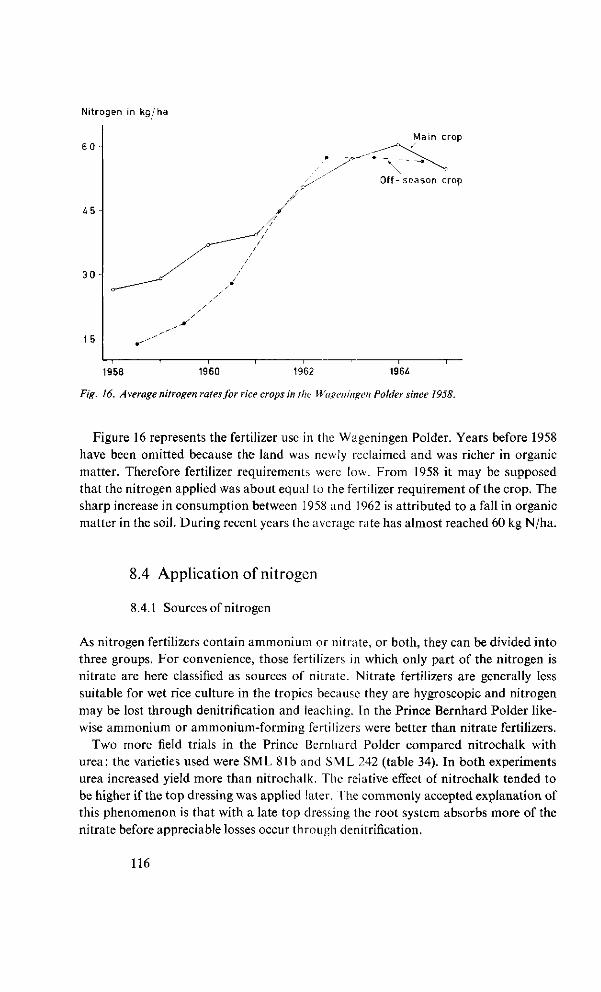
Nitrogen in kg/ha
60 -
45 -
3 0 -
1 5 - •-'''
y y /
y y
/f // y / __—-~° / -—-"" /
/ / / /
/ y
y
p
Main crop
Off- season crop
1958 1960 1962 1964
F;£. /<5. Average nitrogen rates for rice crops in I lie Wapeningen Polder since 1958.
Figure 16 represents the fertilizer use in the Wageningen Polder. Years before 1958 have been omitted because the land was newly reclaimed and was richer in organic matter. Therefore fertilizer requirements were low. From 1958 it may be supposed that the nitrogen applied was about equal to the fertilizer requirement of the crop. The sharp increase in consumption between 1958 and 1962 is attributed to a fall in organic matter in the soil. During recent years the average rate has almost reached 60 kg N/ha.
8.4 Application of nitrogen
8.4.1 Sources of nitrogen
As nitrogen fertilizers contain ammonium or nitrate, or both, they can be divided into three groups. For convenience, those fertilizers in which only part of the nitrogen is nitrate are here classified as sources of nitrate. Nitrate fertilizers are generally less suitable for wet rice culture in the tropics because they are hygroscopic and nitrogen may be lost through denitrification and leaching. In the Prince Bernhard Polder likewise ammonium or ammonium-forming fertilizers were better than nitrate fertilizers.
Two more field trials in the Prince Bernhard Polder compared nitrochalk with urea; the varieties used were SML 81b and SML 242 (table 34). In both experiments urea increased yield more than nitrochalk. The relative effect of nitrochalk tended to be higher if the top dressing was applied later. The commonly accepted explanation of this phenomenon is that with a late top dressing the root system absorbs more of the nitrate before appreciable losses occur through denitrification.
116
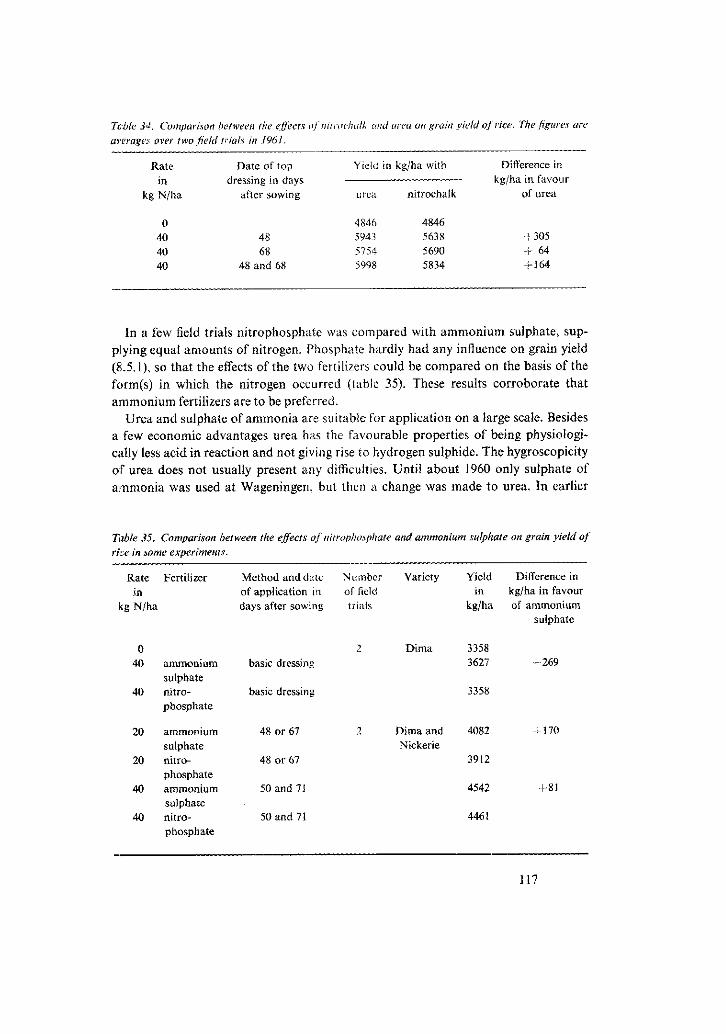
Table 3*. Comparison between the effects of nitroehulk and urea on grain yield office. The figures are
averages over two field trials in 1961.
Rate
kg N/ha
0 40 40 40
Date of top dressing in days
after sowing
48 68
48 and 68
Yield in kg/ha with
urea
4846 5943 5754 5998
nitrochalk
4846 5638 5690 5834
Difference in kg/ha in favour
of urea
+ 305 -(- 64 + 164
In a few field trials nitrophosphate was compared with ammonium sulphate, supplying equal amounts of nitrogen. Phosphate hardly had any influence on grain yield (&.5.1), so that the effects of the two fertilizers could be compared on the basis of the form(s) in which the nitrogen occurred (table 35). These results corroborate that ammonium fertilizers are to be preferred.
Urea and sulphate of ammonia are suitable for application on a large scale. Besides a few economic advantages urea has the favourable properties of being physiologically less acid in reaction and not giving rise to hydrogen sulphide. The hygroscopicity of urea does not usually present any difficulties. Until about 1960 only sulphate of ammonia was used at Wageningen, but then a change was made to urea. In earlier
Table 35. Comparison between the effects of nitrophosphate and ammonium sulphate on grain yield of
rice in some experiments.
Variety
Dima
Rate in
:g N/ha
0 40
40
20
20
40
40
Fertilizer
ammonium sulphate nitrophosphate
ammonium sulphate nitrophosphate ammonium sulphate nitrophosphate
Method and dale of application in days after sowing
basic dressing
basic dressing
48 or 67
48 or 67
50 and 71
50 and 71
N umbci of field trials
2
2
Yield in
kg/ha
3358 3627
Difference in kg/ha in favour of ammonium
sulphate
4 269
Dima and Nickerie
3358
4082
3912
4542
4461
+ 170
-81
117
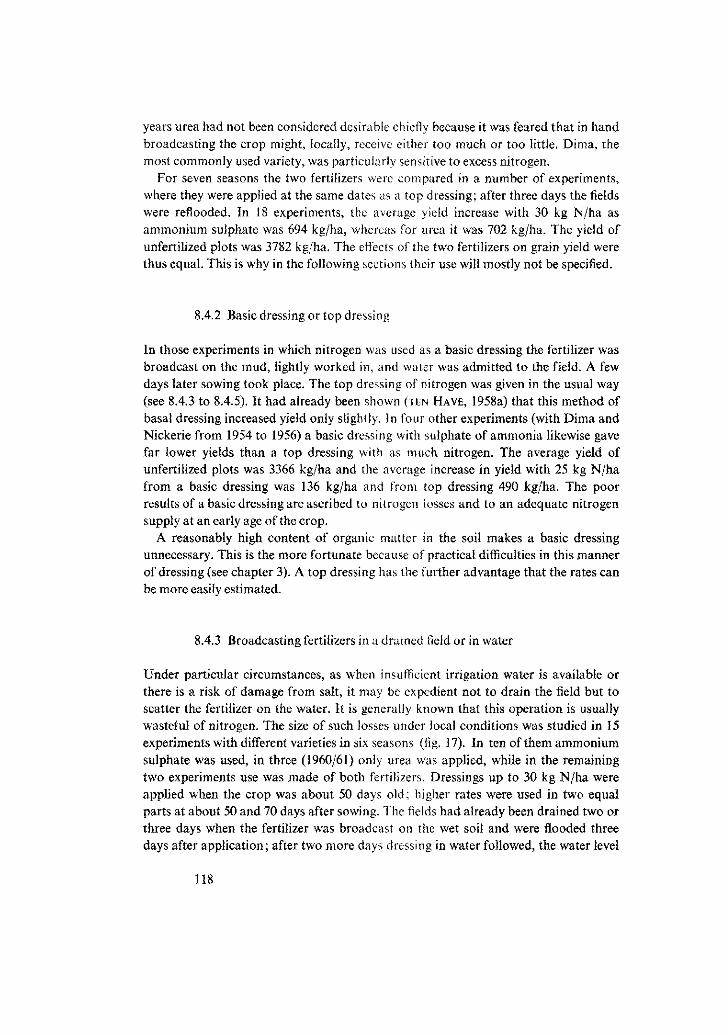
years urea had not been considered desirable chiefly because it was feared that in hand broadcasting the crop might, locally, receive either too much or too little. Dima, the most commonly used variety, was particularly sensitive to excess nitrogen.
For seven seasons the two fertilizers were compared in a number of experiments, where they were applied at the same dates as a top dressing; after three days the fields were reflooded. In 18 experiments, the average yield increase with 30 kg N/ha as ammonium sulphate was 694 kg/ha, whereas for urea it was 702 kg/ha. The yield of unfertilized plots was 3782 kg/ha. The effects of the two fertilizers on grain yield were thus equal. This is why in the following sections their use will mostly not be specified.
8.4.2 Basic dressing or top dressing
In those experiments in which nitrogen was used as a basic dressing the fertilizer was broadcast on the mud, lightly worked in, and water was admitted to the field. A few days later sowing took place. The top dressing of nitrogen was given in the usual way (see 8.4.3 to 8.4.5). It had already been shown (TEN HAVE, 1958a) that this method of basal dressing increased yield only slightly. In four other experiments (with Dima and Nickerie from 1954 to 1956) a basic dressing with sulphate of ammonia likewise gave far lower yields than a top dressing with as much nitrogen. The average yield of unfertilized plots was 3366 kg/ha and the average increase in yield with 25 kg N/ha from a basic dressing was 136 kg/ha and from top dressing 490 kg/ha. The poor results of a basic dressing are ascribed to nitrogen losses and to an adequate nitrogen supply at an early age of the crop.
A reasonably high content of organic matter in the soil makes a basic dressing unnecessary. This is the more fortunate because of practical difficulties in this manner of dressing (see chapter 3). A top dressing has the further advantage that the rates can be more easily estimated.
8.4.3 Broadcasting fertilizers in a drained field or in water
Under particular circumstances, as when insufficient irrigation water is available or there is a risk of damage from salt, it may be expedient not to drain the field but to scatter the fertilizer on the water. It is generally known that this operation is usually wasteful of nitrogen. The size of such losses under local conditions was studied in 15 experiments with different varieties in six seasons (fig. 17). In ten of them ammonium sulphate was used, in three (1960/61) only urea was applied, while in the remaining two experiments use was made of both fertilizers. Dressings up to 30 kg N/ha were applied when the crop was about 50 days old; higher rates were used in two equal parts at about 50 and 70 days after sowing. The fields had already been drained two or three days when the fertilizer was broadcast on the wet soil and were flooded three days after application; after two more days dressing in water followed, the water level
118
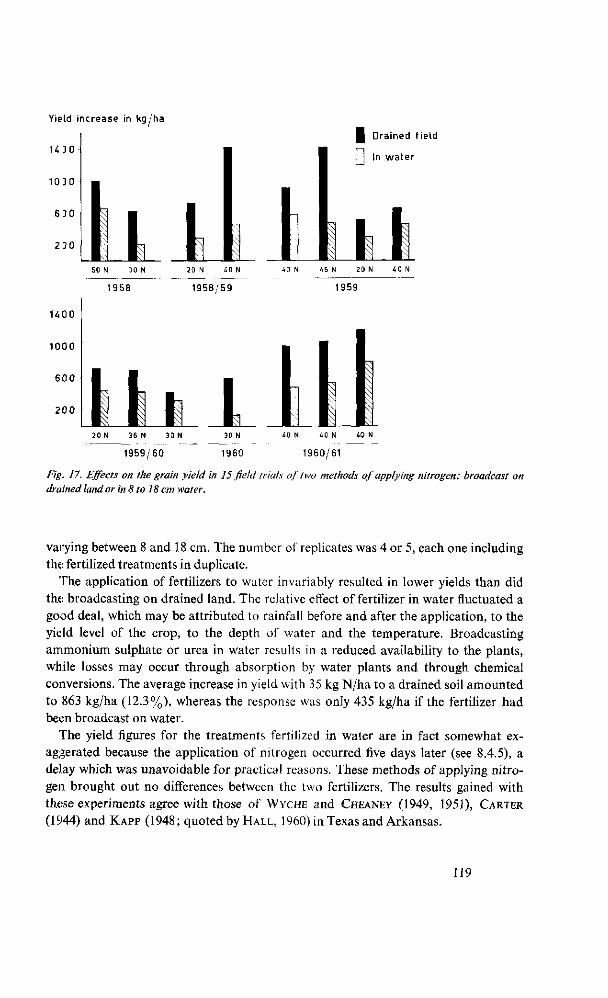
Yield increase in kg/ha
1400
| Drained f ie ld
M In wa ter
1000
20 N 36 N 30 N
1959/60
30 N 40 N 40 N 40 N
1960 1960/61
Fig. 17. Effects on the grain yield in 15 field trials of two methods of applying nitrogen: broadcast on drained land or in 8 to 18 cm water.
varying between 8 and 18 cm. The number of replicates was 4 or 5, each one including the: fertilized treatments in duplicate.
The application of fertilizers to water invariably resulted in lower yields than did the broadcasting on drained land. The relative effect of fertilizer in water fluctuated a good deal, which may be attributed to rainfall before and after the application, to the yield level of the crop, to the depth of water and the temperature. Broadcasting ammonium sulphate or urea in water results in a reduced availability to the plants, while losses may occur through absorption by water plants and through chemical conversions. The average increase in yield with 35 kg N/ha to a drained soil amounted to 863 kg/ha (12.3%), whereas the response was only 435 kg/ha if the fertilizer had been broadcast on water.
The yield figures for the treatments fertilized in water are in fact somewhat exaggerated because the application of nitrogen occurred five days later (see 8.4.5), a delay which was unavoidable for practical reasons. These methods of applying nitrogen brought out no differences between the two fertilizers. The results gained with these experiments agree with those of WYCHE and CHEANEY (1949, 1951), CARTER
(1944) and KAPP (1948; quoted by HALL, 1960) in Texas and Arkansas.
119
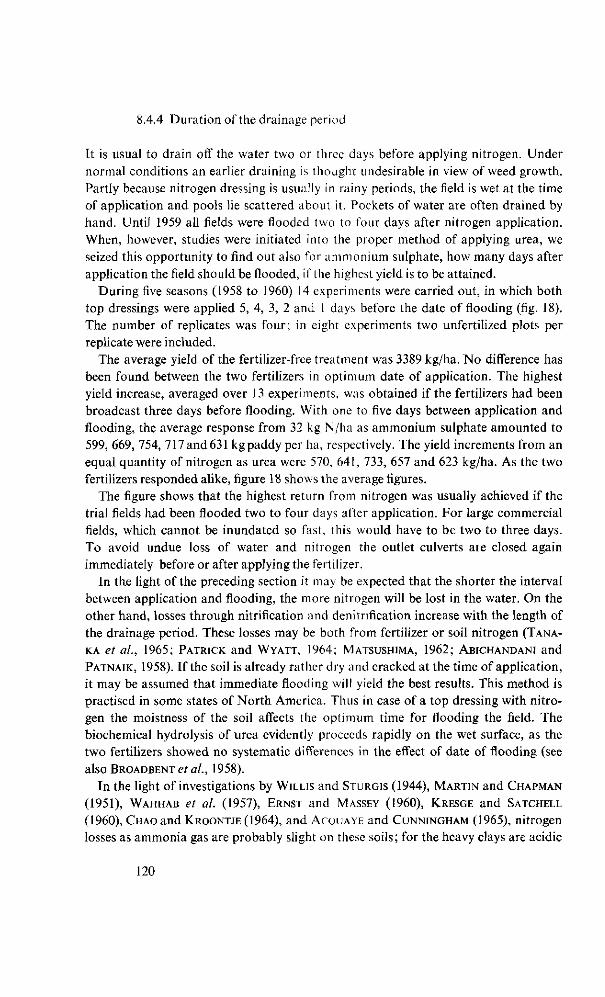
8.4.4 Duration of the drainage period
It is usual to drain off the water two or three days before applying nitrogen. Under
normal conditions an earlier draining is thought undesirable in view of weed growth.
Partly because nitrogen dressing is usually in rainy periods, the field is wet at the time
of application and pools lie scattered about it. Pockets of water are often drained by
hand. Until 1959 all fields were flooded two to four days after nitrogen application.
When, however, studies were initiated into the proper method of applying urea, we
seized this opportunity to find out also for ammonium sulphate, how many days after
application the field should be flooded, if the highest yield is to be attained.
During five seasons (1958 to 1960) 14 experiments were carried out, in which both
top dressings were applied 5, 4, 3, 2 and 1 days before the date of flooding (fig. 18).
The number of replicates was four; in eight experiments two unfertilized plots per
replicate were included.
The average yield of the fertilizer-free treatment was 3389 kg/ha. No difference has
been found between the two fertilizers in optimum date of application. The highest
yield increase, averaged over 13 experiments, was obtained if the fertilizers had been
broadcast three days before flooding. With one to five days between application and
flooding, the average response from 32 kg N/ha as ammonium sulphate amounted to
599, 669, 754, 717and631 kgpaddy per ha, respectively. The yield increments from an
equal quantity of nitrogen as urea were 570, 641, 733, 657 and 623 kg/ha. As the two
fertilizers responded alike, figure 18 shows the average figures.
The figure shows that the highest return from nitrogen was usually achieved if the
trial fields had been flooded two to four days after application. For large commercial
fields, which cannot be inundated so fast, this would have to be two to three days.
To avoid undue loss of water and nitrogen the outlet culverts are closed again
immediately before or after applying the fertilizer.
In the light of the preceding section it may be expected that the shorter the interval
between application and flooding, the more nitrogen will be lost in the water. On the
other hand, losses through nitrification and denitrification increase with the length of
the drainage period. These losses may be both from fertilizer or soil nitrogen (TANA-
KA et al., 1965; PATRICK and WYATT, 1964; MATSUSHIMA, 1962; ABICHANDANI and
PATNAIK, 1958). If the soil is already rather dry and cracked at the time of application,
it may be assumed that immediate flooding will yield the best results. This method is
practised in some states of Nor th America. Thus in case of a top dressing with nitro
gen the moistness of the soil affects the optimum time for flooding the field. The
biochemical hydrolysis of urea evidently proceeds rapidly on the wet surface, as the
two fertilizers showed no systematic differences in the effect of date of flooding (see
also BROADBENT et al., 1958).
In the light of investigations by WILLIS and STURGIS (1944), MARTIN and CHAPMAN
(1951), WAHHAB et al. (1957), ERNST and MASSEY (1960), KRESGE and SATCHELL
(1960), CHAO and KROONTJE (1964), and ACQUAYE and CUNNINGHAM (1965), nitrogen
losses as ammonia gas are probably slight on these soils; for the heavy clays are acidic
120
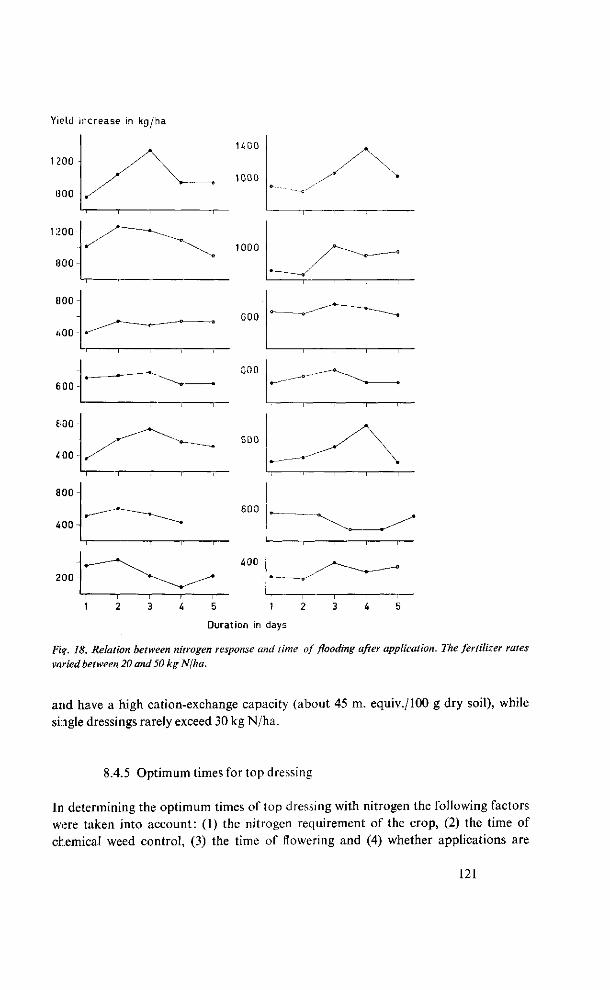
Yield increase in kg/ha
1200
300
1200
»00
8 0 0 -
«00
EiOO
6100
400
800
400
200
1400
1000
1000
600 -
coo
600
600
400
1 2 3 4 5 1 2 3 4 5
Duration in days
Fig. 18. Relation between nitrogen response and time of flooding after application. The fertilizer rates
varied between 20 and 50 kg N/ha.
and have a high cation-exchange capacity (about 45 m. equiv./100 g dry soil), while single dressings rarely exceed 30 kg N/ha.
8.4.5 Optimum times for top dressing
In determining the optimum times of top dressing with nitrogen the following factors were taken into account: (1) the nitrogen requirement of the crop, (2) the time of chemical weed control, (3) the time of flowering and (4) whether applications are
121
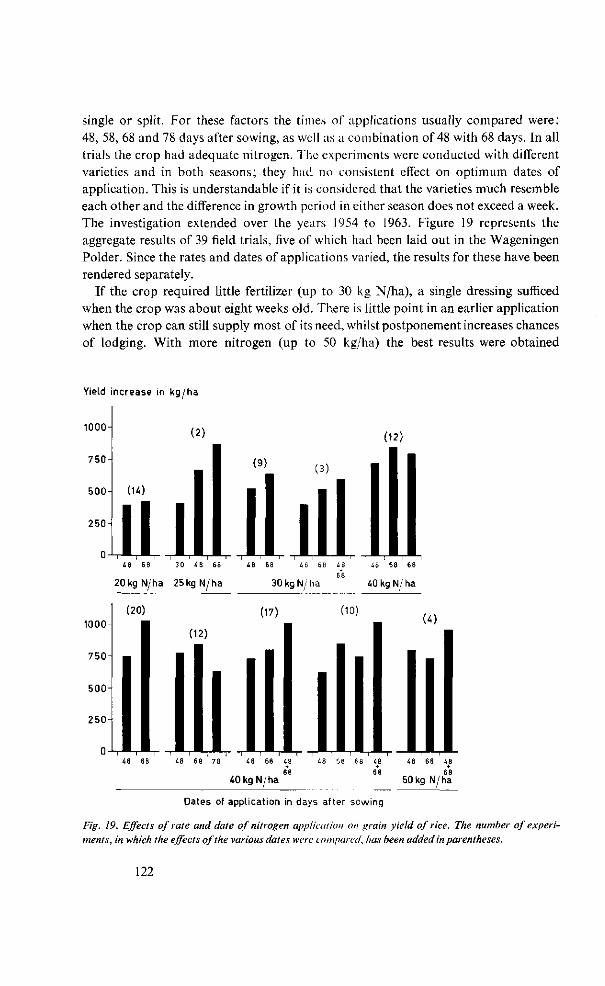
single or split. For these factors the times of applications usually compared were: 48, 58, 68 and 78 days after sowing, as well as a combination of 48 with 68 days. In all trials the crop had adequate nitrogen. The experiments were conducted with different varieties and in both seasons; they had no consistent effect on optimum dates of application. This is understandable if it is considered that the varieties much resemble each other and the difference in growth period in either season does not exceed a week. The investigation extended over the years 1954 to 1963. Figure 19 represents the aggregate results of 39 field trials, five of which had been laid out in the Wageningen Polder. Since the rates and dates of applications varied, the results for these have been rendered separately.
If the crop required little fertilizer (up to 30 kg N/ha), a single dressing sufficed when the crop was about eight weeks old. There is little point in an earlier application when the crop can still supply most of its need, whilst postponement increases chances of lodging. With more nitrogen (up to 50 kg/ha) the best results were obtained
Yield increase in kg/ha
id 68 30 48 68
20kg N/ha 25kg N/ha
68 68
30 kg N/ha 40 kg N/ha
10)
Dates of application in days after sowing
Fig. 19. Effects of rate and date of nitrogen application on grain yield of rice. The number of experiments, in which the effects of the various dates were compared, has been added in parentheses.
122
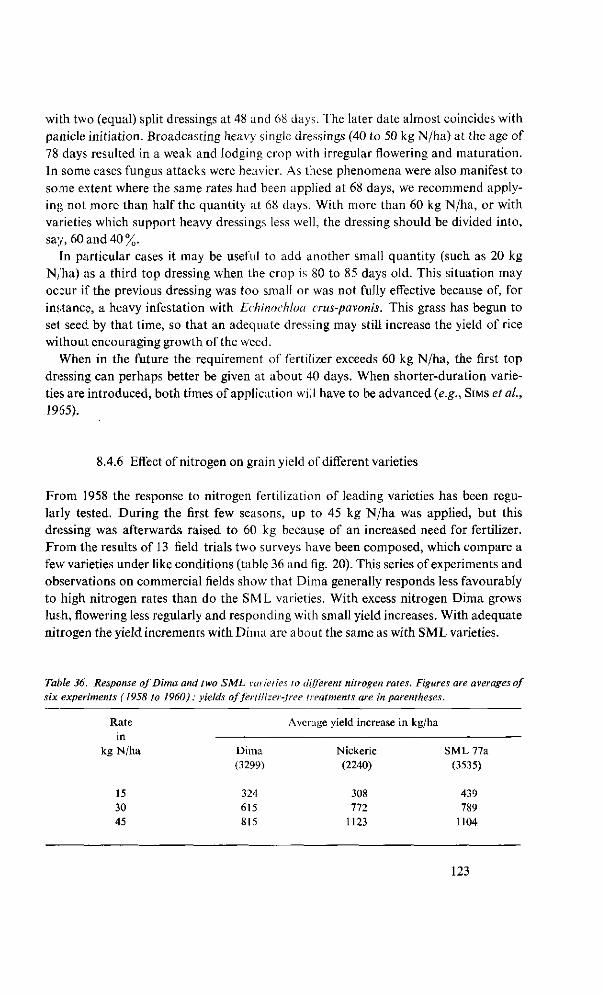
with two (equal) split dressings at 48 and 68 days. The later date almost coincides with panicle initiation. Broadcasting heavy single dressings (40 to 50 kg N/ha) at the age of 78 days resulted in a weak and lodging crop with irregular flowering and maturation. In some cases fungus attacks were heavier. As these phenomena were also manifest to some extent where the same rates had been applied at 68 days, we recommend applying not more than half the quantity at 68 days. With more than 60 kg N/ha, or with varieties which support heavy dressings less well, the dressing should be divided into, say, 60 and 40%.
In particular cases it may be useful to add another small quantity (such as 20 kg N/ha) as a third top dressing when the crop is 80 to 85 days old. This situation may occur if the previous dressing was too small or was not fully effective because of, for instance, a heavy infestation with Echinochloa crus-pavonis. This grass has begun to set seed by that time, so that an adequate dressing may still increase the yield of rice without encouraging growth of the weed.
When in the future the requirement of fertilizer exceeds 60 kg N/ha, the first top dressing can perhaps better be given at about 40 days. When shorter-duration varieties are introduced, both times of application will have to be advanced (e.g., SIMS et al., 1965).
8.4.6 Effect of nitrogen on grain yield of different varieties
From 1958 the response to nitrogen fertilization of leading varieties has been regularly tested. During the first few seasons, up to 45 kg N/ha was applied, but this dressing was afterwards raised to 60 kg because of an increased need for fertilizer. From the results of 13 field trials two surveys have been composed, which compare a few varieties under like conditions (table 36 and fig. 20). This series of experiments and observations on commercial fields show that Dima generally responds less favourably to high nitrogen rates than do the S ML varieties. With excess nitrogen Dima grows lush, flowering less regularly and responding with small yield increases. With adequate nitrogen the yield increments with Dima are about the same as with SML varieties.
Table 36. Response of Dima and two SML varieties to different nitrogen rates. Figures are averages of six experiments (1958 to I960) ; yields of fertilizer-free treatments are in parentheses.
Rate in
kg N/ha
15 30 45
Dima (3299)
324 615 815
Aver; .ige yield increase in
Nickerie (2240)
308 772
1123
kg/ha
SML 77a (3535)
439 789
1104
123
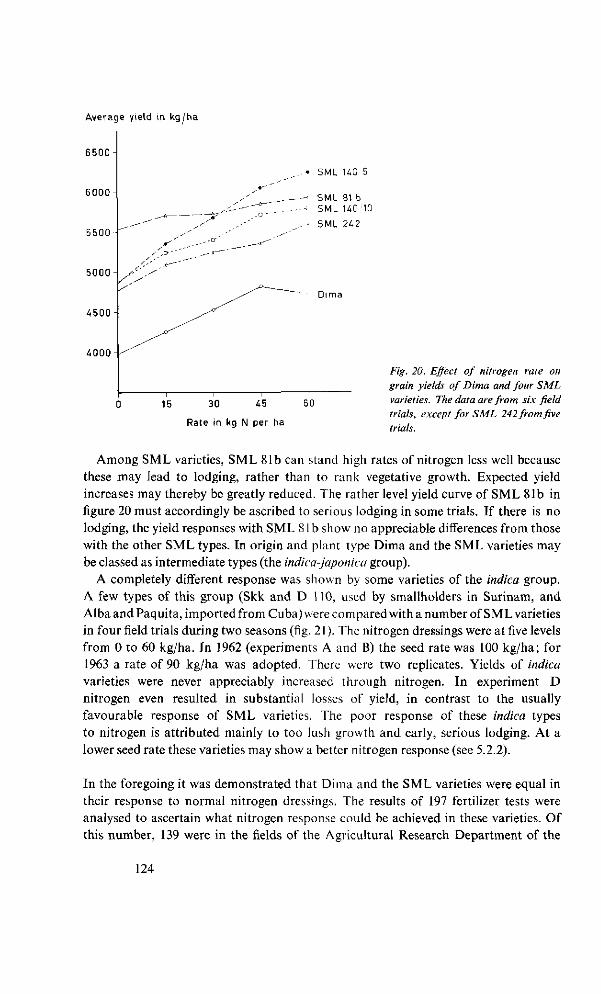
Average yield in kg/ha
6 5 0 0 -
6000
5500
5000
SML 140 5
4500
4000
15 30 45 60
Rate in kg N per ha
Fig. 20. Effect of nitrogen rate on grain yields of Dima and four SML varieties. The data are from six field trials, except for SML 242 from five trials.
Among SML varieties, SML 81b can stand high rates of nitrogen less well because these may lead to lodging, rather than to rank vegetative growth. Expected yield increases may thereby be greatly reduced. The rather level yield curve of SML 81b in figure 20 must accordingly be ascribed to serious lodging in some trials. If there is no lodging, the yield responses with SML 81 b show no appreciable differences from those with the other SML types. In origin and plant type Dima and the SML varieties may be classed as intermediate types (the indica-japonica group).
A completely different response was shown by some varieties of the indica group. A few types of this group (Skk and D 110, used by smallholders in Surinam, and Alba and Paquita, imported from Cuba) were co m pared with a number of S M L varieties in four field trials during two seasons (fig. 21 ). The nitrogen dressings were at five levels from 0 to 60 kg/ha. In 1962 (experiments A and B) the seed rate was 100 kg/ha; for 1963 a rate of 90 kg/ha was adopted. There were two replicates. Yields of indica varieties were never appreciably increased through nitrogen. In experiment D nitrogen even resulted in substantial losses of yield, in contrast to the usually favourable response of SML varieties. The poor response of these indica types to nitrogen is attributed mainly to too lush growth and early, serious lodging. At a lower seed rate these varieties may show a better nitrogen response (see 5.2.2).
In the foregoing it was demonstrated that Dima and the SML varieties were equal in their response to normal nitrogen dressings. The results of 197 fertilizer tests were analysed to ascertain what nitrogen response could be achieved in these varieties. Of this number, 139 were in the fields of the Agricultural Research Department of the
124
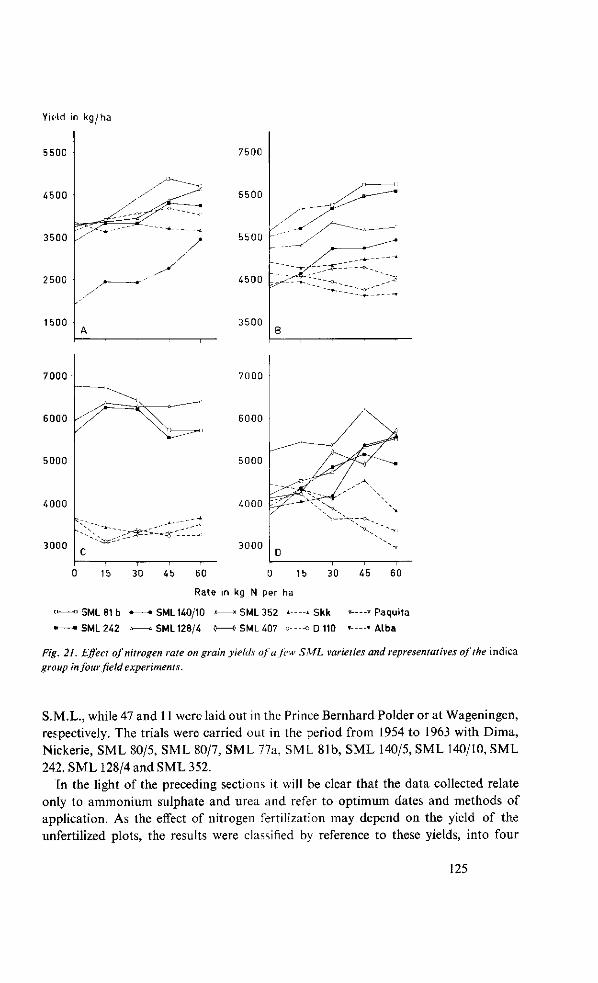
Yield in kg/ha
5500
4500
3500
2500
1500
7500
6500
5500
4500 _ ^
3500
7000
6000
5000
4000
3000
^ > . \ . _ - — - •
s^y \ \ y \ \
C 1 1 I I
7000
6000
5000
4000
3000 D
/ \
' j j ^ / ' A
^ ^ ~ ^ v C ' ^ \
^
0 15 30 45 60 0 15 30 45 60
Rate in kg N per ha
" ° SML 81 b • — • SML 140/10 » * SML 352 ' - - -» Skk -—-•> Paquita
« "SML 242 * «SML 128/4 0 « SML 407 °----° D 110 ' -—»Alba
Fig. 21. Effect of nitrogen rate on grain yields of a few SML varieties and representatives of the indica group in four field experiments.
S.M.L., while 47 and 11 were laid out in the Prince Bernhard Polder or at Wageningen, respectively. The trials were carried out in the period from 1954 to 1963 with Dima, Nickerie, SML 80/5, SML 80/7, SML 77a, SML 81b, SML 140/5, SML 140/10, SML 242, SML 128/4 and SML 352.
In the light of the preceding sections it will be clear that the data collected relate only to ammonium sulphate and urea and refer to optimum dates and methods of application. As the effect of nitrogen fertilization may depend on the yield of the unfertilized plots, the results were classified by reference to these yields, into four
125
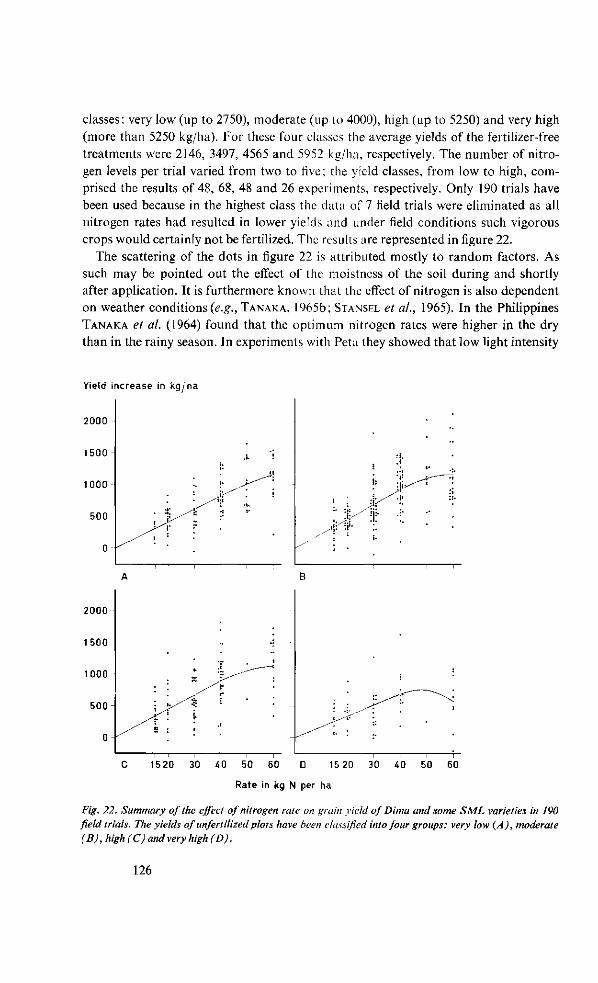
classes: very low (up to 2750), moderate (up lo 4000), high (up to 5250) and very high (more than 5250 kg/ha). For these four classes the average yields of the fertilizer-free treatments were 2146, 3497, 4565 and 5952 kg/ha, respectively. The number of nitrogen levels per trial varied from two to five; the yield classes, from low to high, comprised the results of 48, 68, 48 and 26 experiments, respectively. Only 190 trials have been used because in the highest class the data of 7 field trials were eliminated as all nitrogen rates had resulted in lower yields and under field conditions such vigorous crops would certainly not be fertilized. The results are represented in figure 22.
The scattering of the dots in figure 22 is attributed mostly to random factors. As such may be pointed out the effect of the moistness of the soil during and shortly after application. It is furthermore known that the effect of nitrogen is also dependent on weather conditions (e.g., TANAKA, 1965b; STANSEL et al., 1965). In the Philippines TANAKA et al. (1964) found that the optimum nitrogen rates were higher in the dry than in the rainy season. In experiments with Peta they showed that low light intensity
Yield increase in kg/na
2000
1500
1000
500
0
2000
1500
1000-
5 0 0 -
o-
* *> /^l*
./"•J. :
i r
C 1520 30 40 50 60 D 15 20 30 40 50 60
Rate in kg N per ha
Fig. 22. Summary of the effect of nitrogen rale on grain yield of Dima and some SML varieties in 190 field trials. The yields of unfertilized plots have been classified into four groups: very low {A), moderate (B), high (C) and very high (D).
lib
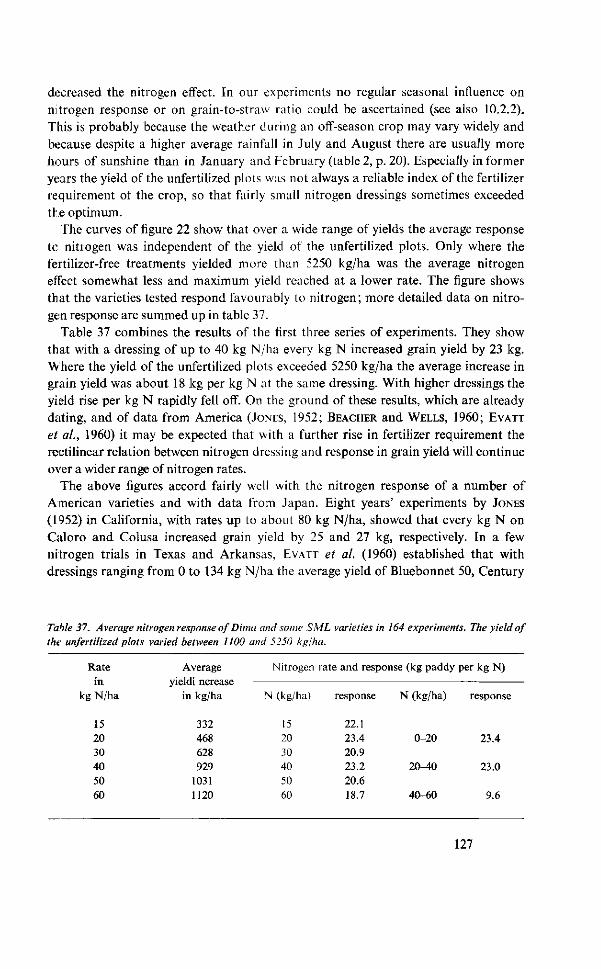
decreased the nitrogen effect. In our experiments no regular seasonal influence on nitrogen response or on grain-to-straw ratio could be ascertained (see also 10.2.2). This is probably because the weather during an off-season crop may vary widely and because despite a higher average rainfall in July and August there are usually more hours of sunshine than in January and February (table 2, p. 20). Especially in former years the yield of the unfertilized plots was not always a reliable index of the fertilizer requirement of the crop, so that fairly small nitrogen dressings sometimes exceeded the optimum.
The curves of figure 22 show that over a wide range of yields the average response tc nitrogen was independent of the yield of the unfertilized plots. Only where the fertilizer-free treatments yielded more than 5250 kg/ha was the average nitrogen effect somewhat less and maximum yield reached at a lower rate. The figure shows that the varieties tested respond favourably to nitrogen; more detailed data on nitrogen response are summed up in table 37.
Table 37 combines the results of the first three series of experiments. They show that with a dressing of up to 40 kg N/ha every kg N increased grain yield by 23 kg. Where the yield of the unfertilized plots exceeded 5250 kg/ha the average increase in grain yield was about 18 kg per kg N at the same dressing. With higher dressings the yield rise per kg N rapidly fell off. On the ground of these results, which are already dating, and of data from America (JONES, 1952; BEACHER and WELLS, 1960; EVATT
et al, 1960) it may be expected that with a further rise in fertilizer requirement the rectilinear relation between nitrogen dressing and response in grain yield will continue over a wider range of nitrogen rates.
The above figures accord fairly well with the nitrogen response of a number of American varieties and with data from Japan. Eight years' experiments by JONES
(1952) in California, with rates up to about 80 kg N/ha, showed that every kg N on Caloro and Colusa increased grain yield by 25 and 27 kg, respectively. In a few nitrogen trials in Texas and Arkansas, EVATT et al. (1960) established that with dressings ranging from 0 to 134 kg N/ha the average yield of Bluebonnet 50, Century
Table 37. Average nitrogen response of Dima and some S ML varieties in 164 experiments. The yield of the unfertilized plots varied between 1100 and 5250 kg/ha.
Rate Average Nitrogen rate and response (kg paddy per kg N) in yieldi ncrease
kg N/ha in kg/ha N (kg/ha) response N (kg/ha) response
15 332 15 22.1 20 468 20 23.4 0-20 23.4 30 628 30 20.9 40 929 40 23.2 20-40 23.0 50 1031 50 20.6 60 1120 60 18.7 40-60 9.6
127
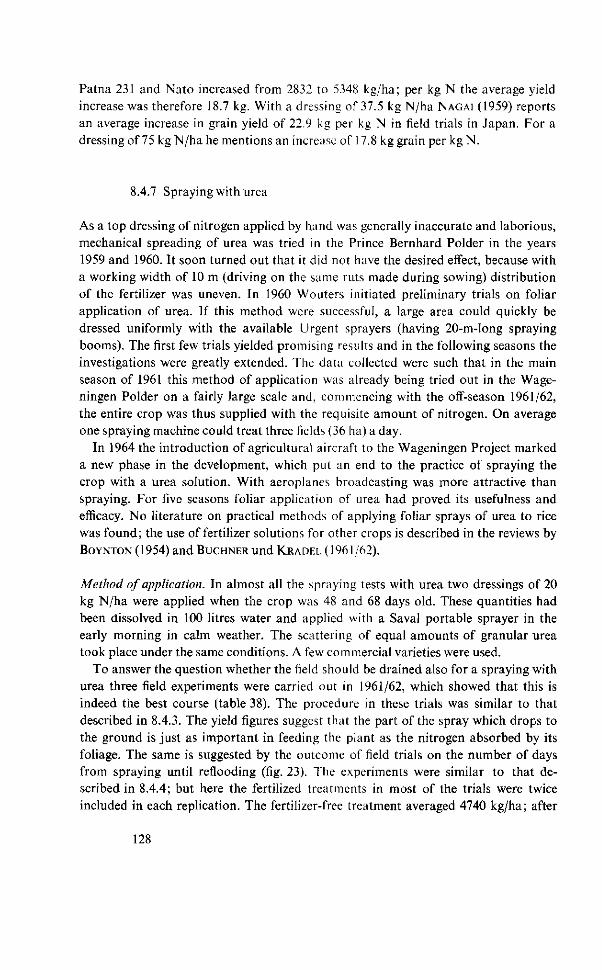
Patna 231 and Nato increased from 2832 to 5348 kg/ha; per kg N the average yield increase was therefore 18.7 kg. With a dressing of 37.5 kg N/ha NAGAI (1959) reports an average increase in grain yield of 22.9 kg per kg N in field trials in Japan. For a dressing of 75 kg N/ha he mentions an increase of 17.8 kg grain per kgN.
8.4.7 Spraying with urea
As a top dressing of nitrogen applied by hand was generally inaccurate and laborious, mechanical spreading of urea was tried in the Prince Bernhard Polder in the years 1959 and 1960. It soon turned out that it did not have the desired effect, because with a working width of 10 m (driving on the same ruts made during sowing) distribution of the fertilizer was uneven. In 1960 Wouters initiated preliminary trials on foliar application of urea. If this method were successful, a large area could quickly be dressed uniformly with the available Urgent sprayers (having 20-m-long spraying booms). The first few trials yielded promising results and in the following seasons the investigations were greatly extended. The data collected were such that in the main season of 1961 this method of application was already being tried out in the Wageningen Polder on a fairly Jarge scale and, commencing with the off-season 1961/62, the entire crop was thus supplied with the requisite amount of nitrogen. On average one spraying machine could treat three fields (36 ha) a day.
In 1964 the introduction of agricultural aircraft to the Wageningen Project marked a new phase in the development, which put an end to the practice of spraying the crop with a urea solution. With aeroplanes broadcasting was more attractive than spraying. For five seasons foliar application of urea had proved its usefulness and efficacy. No literature on practical methods of applying foliar sprays of urea to rice was found; the use of fertilizer solutions for other crops is described in the reviews by BOYNTON ( 1954) and BUCHNER und KRADF.L (1961/62).
Method of application. In almost all the spraying tests with urea two dressings of 20 kg N/ha were applied when the crop was 48 and 68 days old. These quantities had been dissolved in 100 litres water and applied with a Saval portable sprayer in the early morning in calm weather. The scattering of equal amounts of granular urea took place under the same conditions. A few commercial varieties were used.
To answer the question whether the field should be drained also for a spraying with urea three field experiments were carried out in 1961/62, which showed that this is indeed the best course (table 38). The procedure in these trials was similar to that described in 8.4.3. The yield figures suggest that the part of the spray which drops to the ground is just as important in feeding the plant as the nitrogen absorbed by its foliage. The same is suggested by the outcome of field trials on the number of days from spraying until reflooding (fig. 23). The experiments were similar to that described in 8.4.4; but here the fertilized treatments in most of the trials were twice included in each replication. The fertilizer-free treatment averaged 4740 kg/ha; after
128
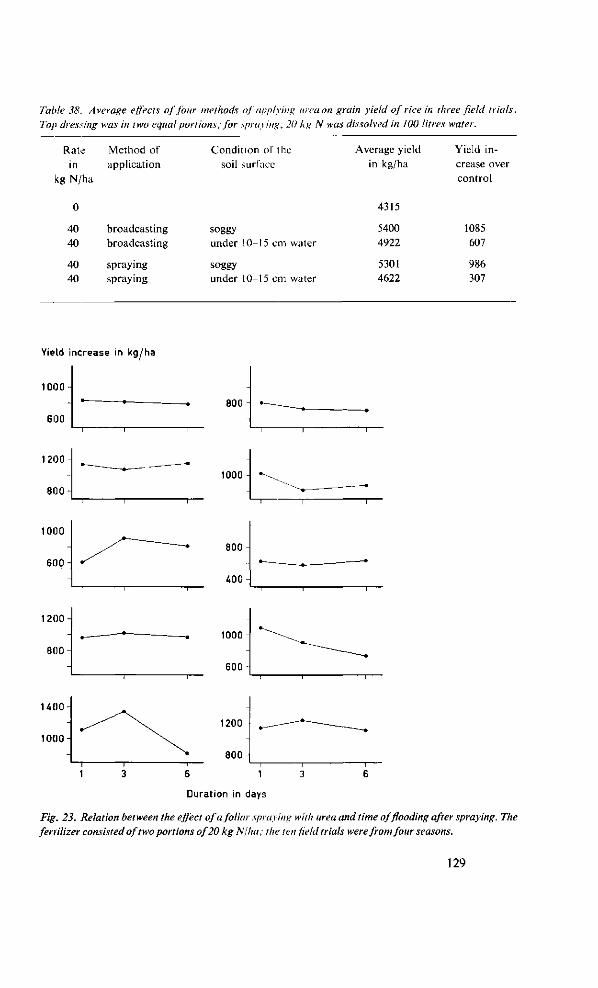
Table 38 A ver age effects of four methods of applying urea on grain yield of rice in three field trials. Top dressing was in two equal portions; for spraying, 20 kg N was dissolved in 100 litres water.
Rate Method of in application
kg N/ha
Condition ol' the soil surface
Average yield in kg/ha
4315
Yield increase over control
40 40
40 40
broadcasting broadcasting
spraying spraying
soggy under 10-15 cm water
soggy under 10-15 cm water
5400 4922
5301 4622
1085 607
986 307
Yield increase in kg/ha
1000
600-
1200
800
"T r
800
1000
1000
600 800
400
1200
800
1000
600 H
1400
1000
1200
800
1
Duration in days
Fig. 23. Relation between the effect of a foliar spraying with urea and time of flooding after spraying. The fertilizer consisted of two portions of 20 kg NI ha; the ten field trials were from four seasons.
129
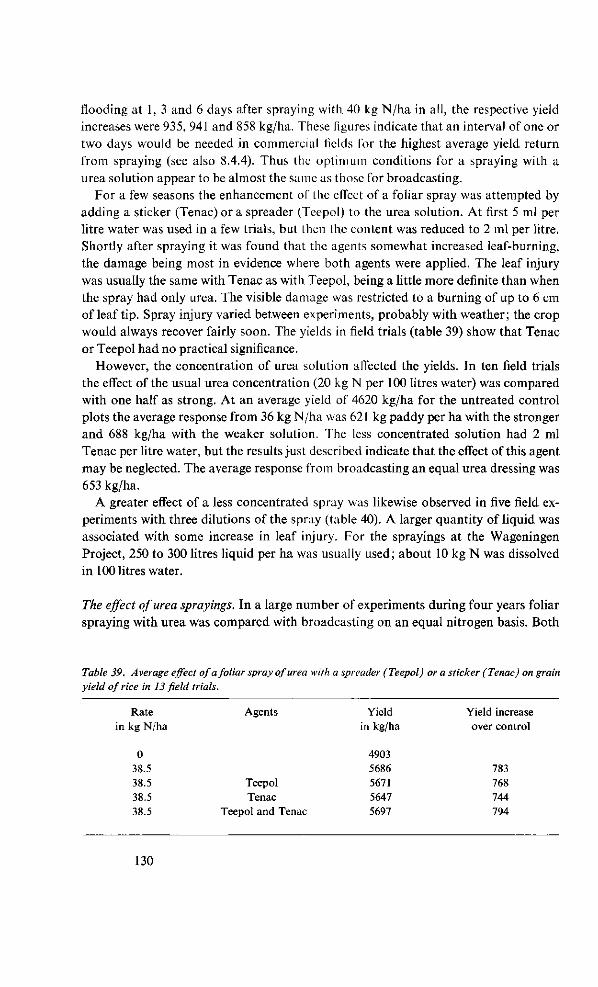
flooding at 1, 3 and 6 days after spraying with 40 kg N/ha in all, the respective yield increases were 935, 941 and 858 kg/ha. These figures indicate that an interval of one or two days would be needed in commercial fields for the highest average yield return from spraying (see also 8.4.4). Thus the optimum conditions for a spraying with a urea solution appear to be almost the same as those for broadcasting.
For a few seasons the enhancement of the effect of a foliar spray was attempted by adding a sticker (Tenac) or a spreader (Teepol) to the urea solution. At first 5 ml per litre water was used in a few trials, but then the content was reduced to 2 ml per litre. Shortly after spraying it was found that the agents somewhat increased leaf-burning, the damage being most in evidence where both agents were applied. The leaf injury was usually the same with Tenac as with Teepol, being a little more definite than when the spray had only urea. The visible damage was restricted to a burning of up to 6 cm of leaf tip. Spray injury varied between experiments, probably with weather; the crop would always recover fairly soon. The yields in field trials (table 39) show that Tenac or Teepol had no practical significance.
However, the concentration of urea solution affected the yields. In ten field trials the effect of the usual urea concentration (20 kg N per 100 litres water) was compared with one half as strong. At an average yield of 4620 kg/ha for the untreated control plots the average response from 36 kg N/ha was 621 kg paddy per ha with the stronger and 688 kg/ha with the weaker solution. The less concentrated solution had 2 nil Tenac per litre water, but the results just described indicate that the effect of this agent may be neglected. The average response from broadcasting an equal urea dressing was 653 kg/ha.
A greater effect of a less concentrated spray was likewise observed in five field experiments with three dilutions of the spray (table 40). A larger quantity of liquid was associated with some increase in leaf injury. For the sprayings at the Wageningen Project, 250 to 300 litres liquid per ha was usually used; about 10 kg N was dissolved in 100 litres water.
The effect of urea sprayings. In a large number of experiments during four years foliar spraying with urea was compared with broadcasting on an equal nitrogen basis. Both
Table 39. Average effect of a foliar spray of urea with a spreader (Teepol) or a sticker (Tenac) on grain yield of rice in 13 field trials.
Rate in kg N/ha
0 38.5 38.5 38.5 38.5
Agents
Teepol Tenac
Teepol and Tenac
Yield in kg/ha
4903 5686 5671 5647 5697
Yield increase over control
783 768 744 794
130
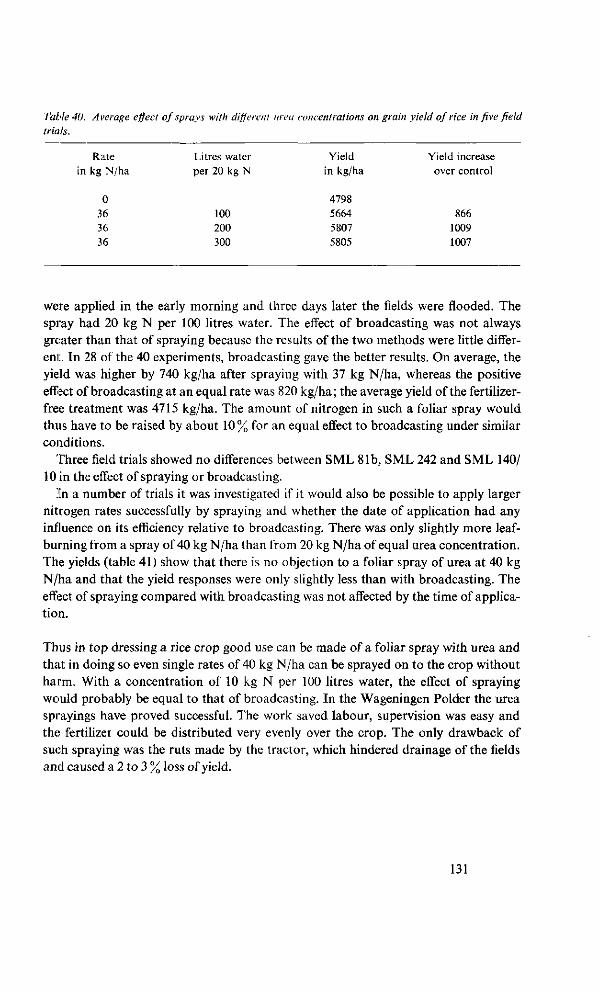
Table 40. A verage effect of sprays with different urea concentrations on grain yield of rice in five field trials.
Rate in kg N/ha
0 36 36 36
Litres water per 20 kg N
100 200 300
Yield in kg/ha
4798 5664 5807 5805
Yield increase over control
866 1009 1007
were applied in the early morning and three days later the fields were flooded. The spray had 20 kg N per 100 litres water. The effect of broadcasting was not always greater than that of spraying because the results of the two methods were little different. In 28 of the 40 experiments, broadcasting gave the better results. On average, the yield was higher by 740 kg/ha after spraying with 37 kg N/ha, whereas the positive effect of broadcasting at an equal rate was 820 kg/ha; the average yield of the fertilizer-free treatment was 4715 kg/ha. The amount of nitrogen in such a foliar spray would thus have to be raised by about 10% for an equal effect to broadcasting under similar conditions.
Three field trials showed no differences between SML 81b, SML 242 and SML 140/ 10 in the effect of spraying or broadcasting.
In a number of trials it was investigated if it would also be possible to apply larger nitrogen rates successfully by spraying and whether the date of application had any influence on its efficiency relative to broadcasting. There was only slightly more leaf-burning from a spray of 40 kg N/ha than from 20 kg N/ha of equal urea concentration. The yields (table 41) show that there is no objection to a foliar spray of urea at 40 kg N/ha and that the yield responses were only slightly less than with broadcasting. The effect of spraying compared with broadcasting was not affected by the time of application.
Thus in top dressing a rice crop good use can be made of a foliar spray with urea and that in doing so even single rates of 40 kg N/ha can be sprayed on to the crop without harm. With a concentration of 10 kg N per 100 litres water, the effect of spraying would probably be equal to that of broadcasting. In the Wageningen Polder the urea sprayings have proved successful. The work saved labour, supervision was easy and the fertilizer could be distributed very evenly over the crop. The only drawback of such spraying was the ruts made by the tractor, which hindered drainage of the fields and caused a 2 to 3 % loss of yield.
131

Table 41. Average effects of broadcasting anil spraying urea (20 kg N per 100 litres water) at different times of application on grain yield of rice in six experiments in three seasons.
Rate in kg N/ha
0
40 40
40 40
40 40
40 40
40 40
Date of application in days after sowing
48 48
58 58
68 68
78 78
48 and 68 48 and 68
Method of application
broadcasting spraying
broadcasting spraying
broadcasting spraying
broadcasting spraying
broadcasting spraying
Yield in kg/ha
4200
4782 4821
5015 4977
5012 4858
4842 4798
5250 5289
Yield increase over control
582 621
815 777
812 658
642 598
1050 1089
8.4.8 Effect of nitrogen on some characteristics of SML varieties
This study was carried out by sampling the crop with frames measuring \m2, as in 5.4.1. In six field trials (with SML 242 and SML 128/4) the effects were compared of five times of application of 40 kg N/ha by broadcasting or spraying. As no regular differences had been found between the two methods (for yields in field trials, see table 41), this factor was left out of account. Per trial it was usual to sample one replicate with four to six frames per plot. In all, 45 L samples were analysed; the average plant density was 204 per m2. Since no differences were observed between the varieties, the figures were combined (table 42). For four characteristics the differences with the unfertilized treatment are represented diagramatically in figure 24.
From the results it is seen that a later application is accompanied by a decline in effective tillering and a slight increase in panicle weight. Except for the top dressing at 78 days, the application resulted in a steep rise in straw yield. The later the dressing the smaller the increase in straw yield and the higher the grain-to-straw ratio. By far the best results were obtained with split dressings of 20 kg N/ha at 48 and 68 days after sowing.
Crop samples were taken to calculate the increase in dry matter production and the grain-to-straw ratio of the increase at each time of application. With applications at 48, 58, 68, 78 and 48 + 68 days after sowing, 39, 38, 46, 72 and 42% of the increase in dry matter was found in the grain. Excluding the date of 78 days out of practical considerations (see 8.4.5), over 40% of the increase in dry matter benefited the grain yield in these experiments. This means that the grain-to-straw ratio of the increase in dry matter was 0.70.
132
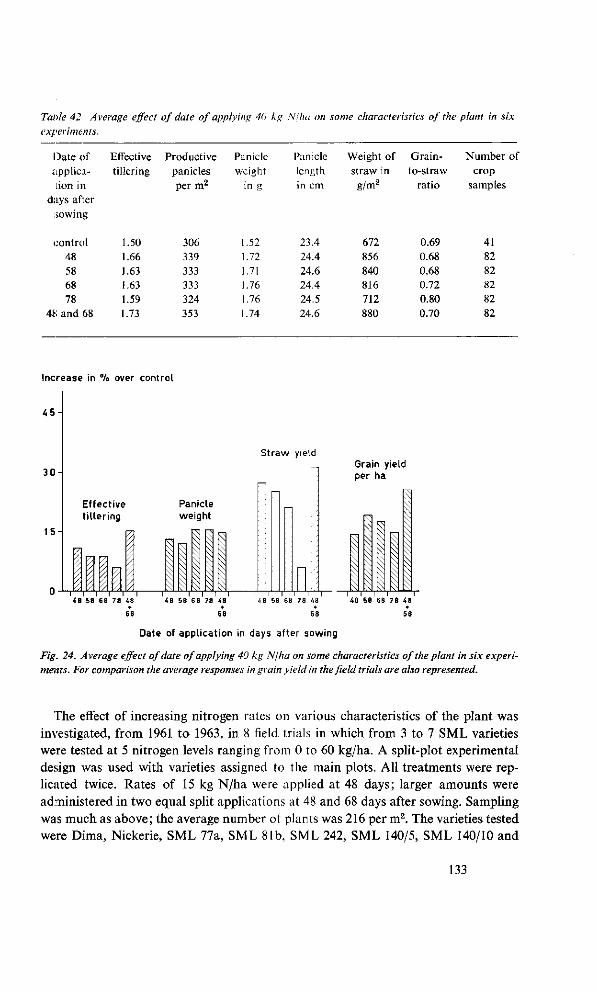
Table 42. Average effect of date of applying 40 kg NI ha on some characteristics of the plant in six experiments.
Date of application in
days after sowing
control 48 58 68 78
48 and 68
Effective tillering
1.50 1.66 ).63 1.63 1.59 1.73
Productive panicles per m2
306 339 333 333 324 353
Panicle weight
in g
1.52 1.72 1.71 1.76 1.76 1.74
Panicle length in cm
23.4 24.4 24.6 24.4 24.5 24.6
Weight of straw in g/m2
672 856 840 816 712 880
Grain-to-straw
ratio
0.69 0.68 0.68 0.72 0.80 0.70
Number of crop
samples
41 82 82 82 82 82
Increase in % over control
45
30
15 -
Straw yield
Effective tillering
Panicle weight
VX
vx K ( l
48 58 68 78 1 I I I I I
48 58 68 78 48
Grain yield per ha
IS
48 58 68 78 48
68
58 63 78 48
68
Date of application in days after sowing
Fig. 24. Average effect of date of applying 40 kg N/ha on some characteristics of the plant in six experiments. For comparison the average responses in grain yield in the field trials are also represented.
The effect of increasing nitrogen rates on various characteristics of the plant was investigated, from 1961 to 1963, in 8 field trials in which from 3 to 7 SML varieties were tested at 5 nitrogen levels ranging from 0 to 60 kg/ha. A split-plot experimental design was used with varieties assigned to the main plots. All treatments were replicated twice. Rates of 15 kg N/ha were applied at 48 days; larger amounts were administered in two equal split applications at 48 and 68 days after sowing. Sampling was much as above; the average number of plants was 216 per m2. The varieties tested were Dima, Nickerie, SML 77a, SML 81b, SML 242, SML 140/5, SML 140/10 and
133
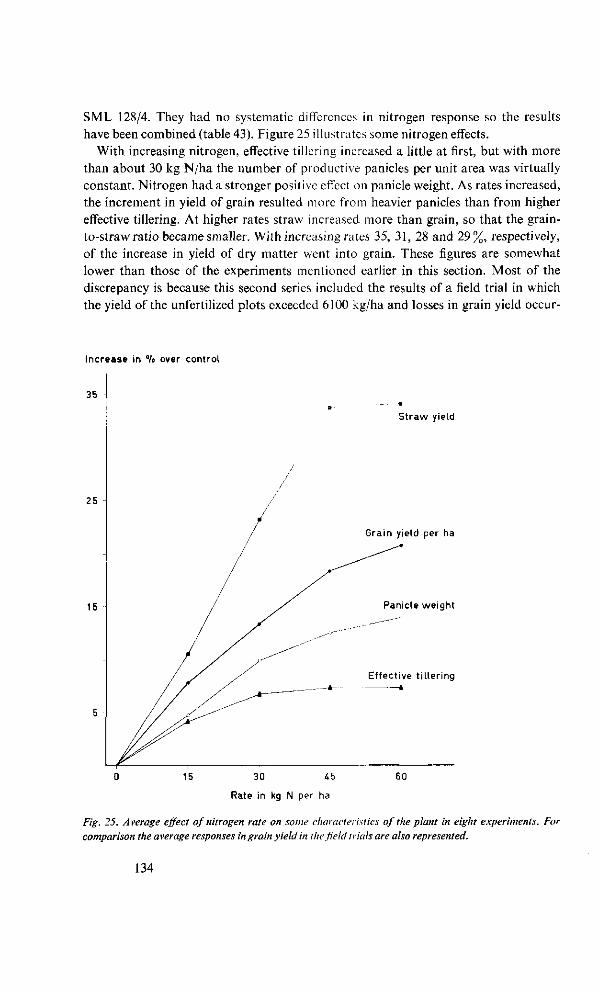
SML 128/4. They had no systematic differences in nitrogen response so the results have been combined (table 43). Figure 25 illustrates some nitrogen effects.
With increasing nitrogen, effective tillering increased a little at first, but with more than about 30 kg N/ha the number of productive panicles per unit area was virtually constant. Nitrogen had a stronger positive effect on panicle weight. As rates increased, the increment in yield of grain resulted more from heavier panicles than from higher effective tillering. At higher rates straw increased more than grain, so that the grain-to-straw ratio became smaller. With increasing rates 35, 31, 28 and 29%, respectively, of the increase in yield of dry matter went into grain. These figures are somewhat lower than those of the experiments mentioned earlier in this section. Most of the discrepancy is because this second series included the results of a field trial in which the yield of the unfertilized plots exceeded 6100 kg/ha and losses in grain yield occur-
Increase in °/o over control
36
St raw yield
25
Grain yield per ha
15 Panicle weight
30 45
Rate in kg N per ha
Fig. 25. Average effect of nitrogen rate on some characteristics of the plant in eight experiments. For comparison the average responses in grain yield in the field trials are also represented.
134
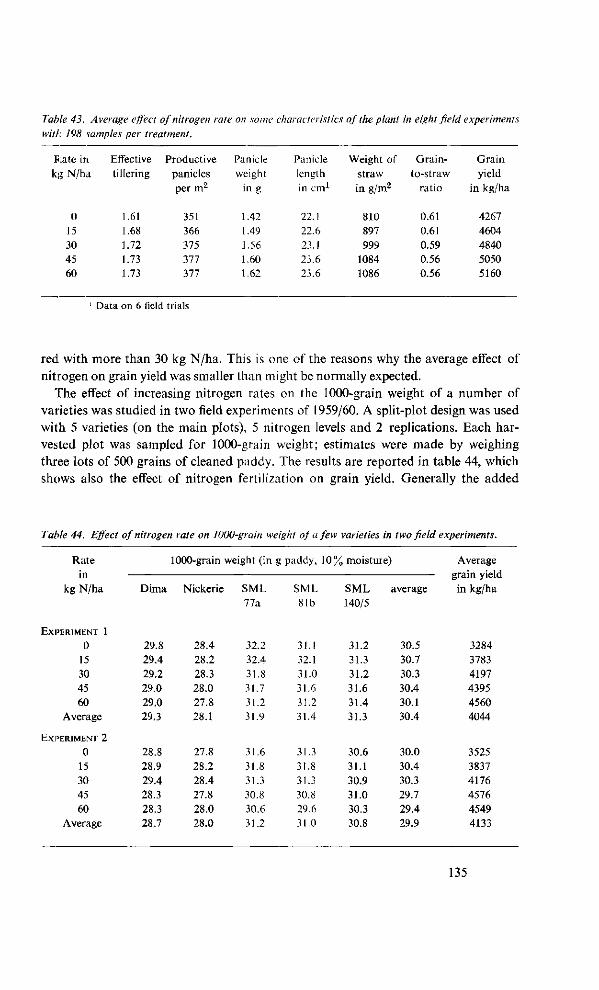
Table 43. Average effect of nitrogen rate on some characteristics of the plant in eight field experiments with. 198 samples per treatment.
Rate in kg N/ha
0 15 30 45 60
Effective tillering
1.61 1.68 1.72 1.73 1.73
Productive panicles per m2
351 366 375 377 377
Panicle weight
in g
1.42 1.49 1.56 1.60 1.62
Panicle length in cm1
22.1 22.6 23.1 23.6 23.6
Weight of straw in g/m2
810 897 999
1084 1086
Grain-to-straw
ratio
0.61 0.61 0.59 0.56 0.56
Grain yield
in kg/ha
4267 4604 4840 5050 5160
Data on 6 field trials
red with more than 30 kg N/ha. This is one of the reasons why the average effect of nitrogen on grain yield was smaller than might be normally expected.
The effect of increasing nitrogen rates on the 1000-grain weight of a number of varieties was studied in two field experiments of 1959/60. A split-plot design was used with 5 varieties (on the main plots), 5 nitrogen levels and 2 replications. Each harvested plot was sampled for 1000-grain weight; estimates were made by weighing three lots of 500 grains of cleaned paddy. The results are reported in table 44, which shows also the effect of nitrogen fertilization on grain yield. Generally the added
Table 44. Effect of nitrogen rate on 1000-grain weight of a few varieties in two field experiments.
Rate •
in kg N/ha
EXPERIMENT 1
0 15 30 45 60
Average
EXPERIMENT 2
0 15 30 45 60
Average
Dima
29.8 29.4 29.2 29.0 29.0 29.3
28.8 28.9 29.4 28.3 28.3 28.7
1000-grain weight (in
Nickerie
28.4 28.2 28.3 28.0 27.8 28.1
27.8 28.2 28.4 27.8 28.0 28.0
SML 77a
32.2 32.4 31.8 31.7 31.2 31.9
31.6 31.8 31.3 30.8 30.6 31.2
g paddy,
SML 81b
31.1 32.1 31.0 31.6 31.2 31.4
31.3 31.8 31.3 30.8 29.6 31.0
10% moistuie)
SML ; 140/5
31.2 31.3 31.2 31.6 31.4 31.3
30.6 31.1 30.9 31.0 30.3 30.8
iverage
30.5 30.7 30.3 30.4 30.1 30.4
30.0 30.4 30.3 29.7 29.4 29.9
Average grain yield in kg/ha
3284 3783 4197 4395 4560 4044
3525 3837 4176 4576 4549 4133
135
nitrogen did not appreciably affect 1000-grain weight. At low nitrogen levels there was a slight tendency towards somewhat heavier grains, whereas at high rates the 1000-grain weight usually decreased a little. In the first experiment 60 kg N/ha gave lower yield responses with Dima and SML 81 b. while it proved also too high for Nickerie and SML 77a in the second trial. These results and those in 5.4.6 indicate that a negative effect on 1000-grain weight need not be feared in fixing the nitrogen rate.
8.4.9 Differences between indica types and SML varieties in nitrogen response
The effect of nitrogen on a few properties of Dima and some SML varieties has been discussed; the nitrogen responses of some of the indica group will now be compared. The grain yields in field trials have been given in 8.4.6. In experiments A to C (fig. 21, p. 125) the crop was sampled with frames; the results are summarized in table 45. Although no consistent differences in nitrogen response have been found among the SML varieties, or within the indica group, the data on SML 140/10 and Alba were not included in this table because these varieties were not used in every experiment. Growth and development indicated that growth conditions in experiments A to C could be characterized as moderate, good and very favourable, respectively. As different fertilizer rates ranging from 0 to 60 kg N/ha were used, a clear picture could be gained of the ways in which these varieties responded to nitrogen.
Table 45 shows that in the SML varieties better conditions of growth were accompanied by a larger number of productive panicles per unit area and that under moderate and good conditions the application of nitrogen still exerted a beneficial effect. Under the very favourable growth conditions of 1963 the effective tillering was not any further increased by nitrogen. The members of the indica group displayed a smaller effective tillering than did the SML varieties. Under moderate to good conditions for growth the number of productive panicles per m2 hardly increased with nitrogen application, and under very favourable conditions the nitrogen effect was negative. The largest number of productive panicles per m2 for the indica varieties was achieved under good growth conditions. Thus it may be assumed that optimum number of productive panicles per unit area is much lower for these than for the SML varieties (see also 5.4.10). With direct seeding the optimum number of productive panicles for these indica types may be 225 to 300 per m2, according to conditions of growth.
With the SML varieties the panicle weight responded markedly to growth conditions and nitrogen dressing. The heaviest panicles were obtained under good conditions; the increase in panicle weight with nitrogen was slightly less than under moderate conditions for growth. The decrease in panicle weight in 1963 after applications of 45 and 60 kg N/ha occurred chiefly with SML 81 b and SML 242, which also sustained heavy losses of grain after these dressings (fig. 21, p. 125). With the indica types the average panicle weight was much the same under moderate as under good growth conditions,
136
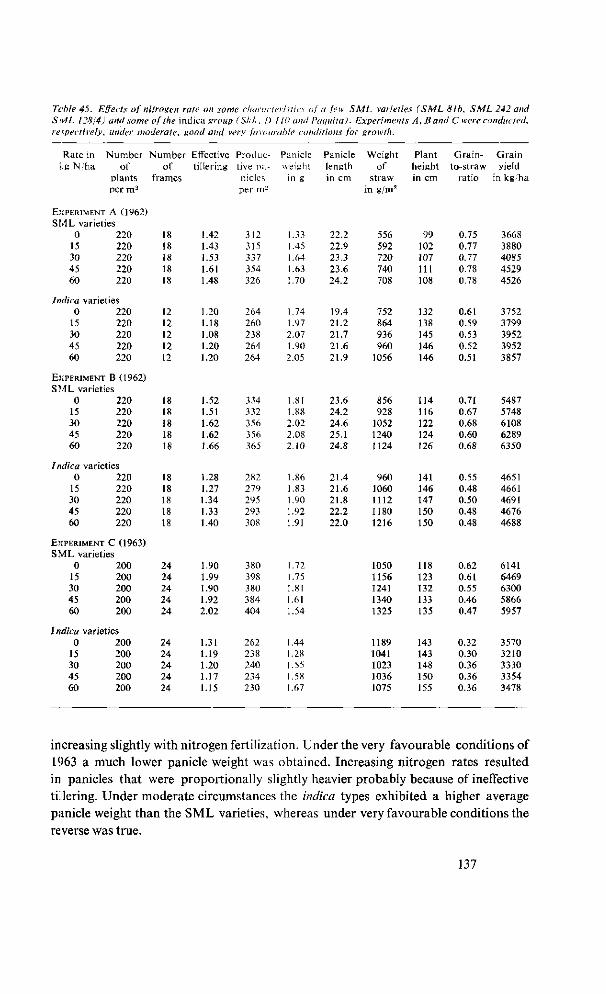
Table 45. Effects of nitrogen rate on some characteristics of a few SML varieties (SAIL 81b, SML 242 and SML US 14) and some of the indica group (Skf. I) ill) and Paquita). Experiments A, Band C were conducted, respectively, under moderate, good and very favourable conditions for growth.
Rate in l : gN/ha
EXPERIMENT
Number of
plants per m2
A (1962) SML varieties
0 15 30 45 60
220 220 220 220 220
Indica varieties 0
15 30 45 60
EXPERIMENT
220 220 220 220 220
B (1962) SML varieties
0 15 30 45 60
220 220 220 220 220
Indica varieties 0
15 30 45 60
EXPERIMENT
220 220 220 220 220
C (1963) SML varieties
0 15 30 45 60
200 200 200 200 200
Indica varieties 0
15 30 45 60
200 200 200 200 200
Number of
frames
18 18 18 18 18
12 12 12 12 12
18 18 18 18 18
18 18 18 18 18
24 24 24 24 24
24 24 24 24 24
Effective tillering
1.42 1.43 1.53 1.61 1.48
1.20 1.18 1.08 1.20 1.20
1.52 1.51 1.62 1.62 1.66
1.28 1.27 1.34 1.33 1.40
1.90 1.99 1.90 1.92 2.02
1.31 1.19 1.20 1.17 1.15
Productive panicles per m-
312 315 337 354 326
264 260 238 264 264
334 332 356 356 365
282 279 295 293 308
380 398 380 384 404
262 238 240 234 230
Panicle weight
in g
1.33 1.45 1.64 1.63 1.70
1.74 1.97 2.07 1.90 2.05
1.81 1.88 2.02 2.08 2.10
1.86 1.83 1.90 1.92 1.91
1.72 1.75 1.81 1.61 1.54
1.44 1.28 1.55 1.58 1.67
Panicle length in cm
22.2 22.9 23.3 23.6 24.2
19.4 21.2 21.7 21.6 21.9
23.6 24.2 24.6 25.1 24.8
21.4 21.6 21.8 22.2 22.0
Weight of
straw in g/m2
556 592 720 740 708
752 864 936 960
1056
856 928
1052 1240 1124
960 1060 1112 1180 1216
1050 1156 1241 1340 1325
1189 1041 1023 1036 1075
Plant height in cm
99 102 107 111 108
132 138 145 146 146
114 116 122 124 126
141 146 147 150 150
118 123 132 133 135
143 143 148 150 155
Grain-to-straw
ratio
0.75 0.77 0.77 0.78 0.78
0.61 0.59 0.53 0.52 0.51
0.71 0.67 0.68 0.60 0.68
0.55 0.48 0.50 0.48 0.48
0.62 0.61 0.55 0.46 0.47
0.32 0.30 0.36 0.36 0.36
Grain yield
in kg/ha
3668 3880 4085 4529 4526
3752 3799 3952 3952 3857
5487 5748 6108 6289 6350
4651 4661 4691 4676 4688
6141 6469 6300 5866 5957
3570 3210 3330 3354 3478
increasing slightly with nitrogen fertilization. Under the very favourable conditions of 1963 a much lower panicle weight was obtained. Increasing nitrogen rates resulted in panicles that were proportionally slightly heavier probably because of ineffective tillering. Under moderate circumstances the indica types exhibited a higher average panicle weight than the SML varieties, whereas under very favourable conditions the reverse was true.
137
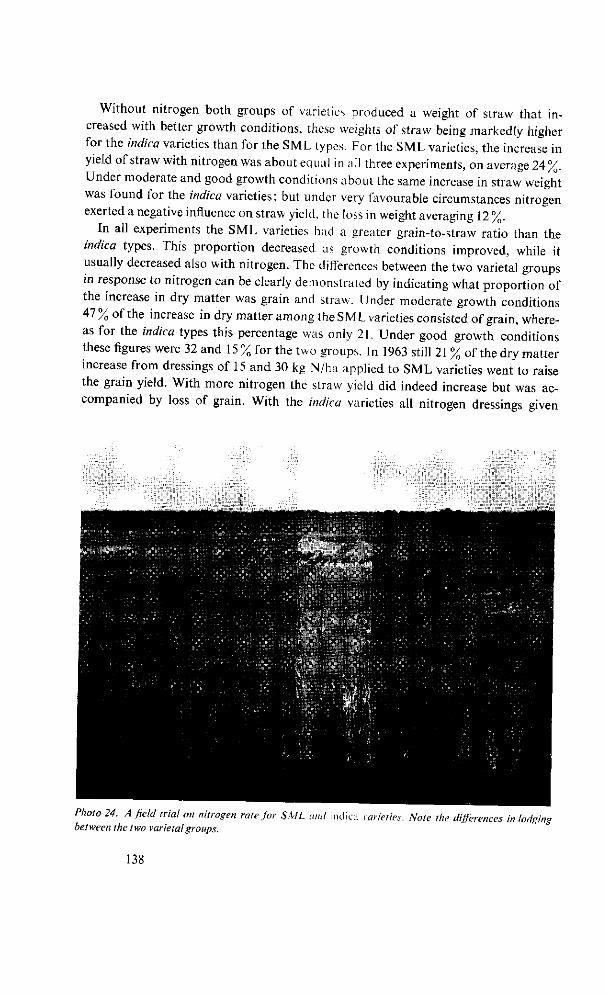
Without nitrogen both groups of varieties produced a weight of straw that increased with better growth conditions, these weights of straw being markedly higher for the indica varieties than for the SML types. For the SML varieties, the increase in yield of straw with nitrogen was about equal in all three experiments, on average 24%. Under moderate and good growth conditions about the same increase in straw weight was found for the indica varieties; but under very favourable circumstances nitrogen exerted a negative influence on straw yield, the loss in weight averaging 12%.
In all experiments the SML varieties had a greater grain-to-straw ratio than the indica types. This proportion decreased as growth conditions improved, while it usually decreased also with nitrogen. The differences between the two varietal groups in response to nitrogen can be clearly demonstrated by indicating what proportion of the increase in dry matter was grain and straw. Under moderate growth conditions 47 % of the increase in dry matter among the SM L varieties consisted of grain, whereas for the indica types this percentage was only 21. Under good growth conditions these figures were 32 and 15 % for the two groups. In 1963 still 21 % of the dry matter increase from dressings of 15 and 30 kg N/ha applied to SML varieties went to raise the grain yield. With more nitrogen the straw yield did indeed increase but was accompanied by loss of grain. With the indica varieties all nitrogen dressings given
Photo 24. A field trial on nitrogen rate for SML and indica varieties. Note the differences in lodging between the two varietal groups.
138
under the favourable growth conditions of 1963 led to losses of both grain and straw. Under moderate growth conditions the average increase in dry matter production
over the four nitrogen levels was the same for both groups, amounting to 2.5 tonnes per ha. Under good circumstances, nitrogen applied to the SML varieties brought about an average increase in dry matter of 3.4 tonnes per ha; the corresponding figure for the indica varieties was 2.1 tonnes. Under the very favourable conditions of 1963 this increase in dry weight among SML varieties still amounted to 2.2 tonnes per ha, whereas in the indica types an average fall by 1.6 tonnes per ha was recorded. These figures support the view that nitrogen application and consequent heavy mutual shading may cause an imbalance between photosynthetic gains and respiration losses, especially in leafy varieties with long, drooping foliage. In varieties that can stand heavy nitrogen dressings better, the habit of the plant is affected less by nitrogen. Besides varietal differences in response to nitrogen of a morphological and physiological nature, attention should be called also to stiffness of straw, because the potential increase in grain yield must be prevented from being partly or wholly lost or, worse, from turning to a loss of yield. For a further discussion of plant type in relation to nitrogen dressing and optimum seed rate see 5.2.2, while section 13.2.1 describes how selection is carried out for types which respond favourably to nitrogen.
8.5 Application of other elements
8.5.1 Application of phosphate
In 1955 a beginning was made with systematic research into the effect of phosphate in seme permanent field experiments. As it became clear over the years that no consistent yield response could be obtained with phosphatic fertilizers, some of these field trials were stopped. During the last few years the investigation has continued only in one permanent field trial in the Prince Bernhard Polder. In several fields of the Wageningen Project and the Prince Bernhard Polder one-year trials were at the same time conducted to verify the results of the permanent experiments. On the whole, phosphate had no effect on grain yield. This is probably because these soils contain a moderate amount of readily available phosphate and that the availability usually increases when the soil is submerged and reduction occurs. Such an increase in availability of phosphate has been observed by many workers (ISLAM and ELAHI,
1954; SHAPIRO, 1958a,b; DATTA and DATTA, 1963; CHAUDHRY and MCLEAN, 1963;
SAVANT and ELLIS, 1964; BROESHART et al., 1965).
A prolonged trial with NPK and NP in the Prince Bernhard Polder studied the effect of phosphate fertilization for nine and eight seasons, respectively. The NPK trial was of a factorial design (33 x 2), while the NP trial was laid out as a Latin square with five treatments, all plots being separated by dams. Until 1961 Dima was used as test variety, after which it was replaced by SML 242. The phosphate fertilizers were broadcast on mud and then lightly worked in. At harvest a third of the height of
139
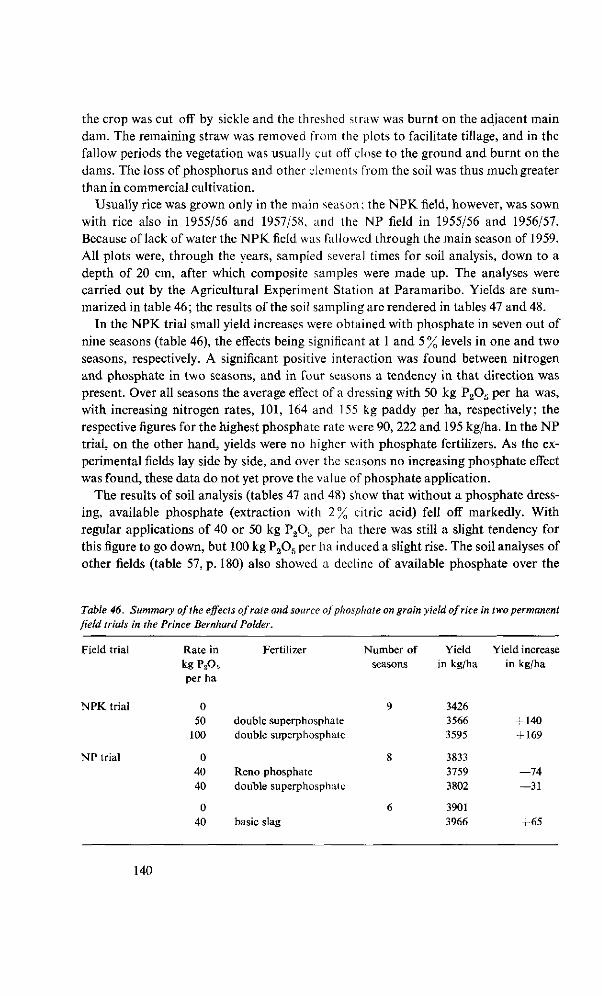
the crop was cut off by sickle and the threshed straw was burnt on the adjacent main dam. The remaining straw was removed from the plots to facilitate tillage, and in the fallow periods the vegetation was usually cut off close to the ground and burnt on the dams. The loss of phosphorus and other elements from the soil was thus much greater than in commercial cultivation.
Usually rice was grown only in the main season ; the NPK field, however, was sown with rice also in 1955/56 and 1957/58, and the NP field in 1955/56 and 1956/57. Because of lack of water the NPK field was fallowed through the main season of 1959. All plots were, through the years, sampled several times for soil analysis, down to a depth of 20 cm, after which composite samples were made up. The analyses were carried out by the Agricultural Experiment Station at Paramaribo. Yields are summarized in table 46; the results of the soil sampling are rendered in tables 47 and 48.
In the NPK trial small yield increases were obtained with phosphate in seven out of nine seasons (table 46), the effects being significant at 1 and 5% levels in one and two seasons, respectively. A significant positive interaction was found between nitrogen and phosphate in two seasons, and in four seasons a tendency in that direction was present. Over all seasons the average effect of a dressing with 50 kg P205 per ha was, with increasing nitrogen rates, 101, 164 and 155 kg paddy per ha, respectively; the respective figures for the highest phosphate rate were 90, 222 and 195 kg/ha. In the NP trial, on the other hand, yields were no higher with phosphate fertilizers. As the experimental fields lay side by side, and over the seasons no increasing phosphate effect was found, these data do not yet prove the value of phosphate application.
The results of soil analysis (tables 47 and 48) show that without a phosphate dressing, available phosphate (extraction with 2% citric acid) fell off markedly. With regular applications of 40 or 50 kg P205 per ha there was still a slight tendency for this figure to go down, but 100 kg P205 per ha induced a slight rise. The soil analyses of other fields (table 57, p. 180) also showed a decline of available phosphate over the
Table 46. Summary of the effects of rate and source of phosphate on grain yield of rice in two permanent field trials in the Prince Bernhard Polder.
Field trial
NPK trial
NP trial
Rate in kg P 2 0 5
per ha
0 50
100
0 40 40
0 40
Fertilizer
double superphosphate double superphosphate
Reno phosphate double superphosphate
basic slag
Number of Yield Yield increase seasons in kg/ha in kg/ha
3426 3566 3595
3833 3759 3802
3901 3966
+ 140 + 169
—74 —31
+65
140
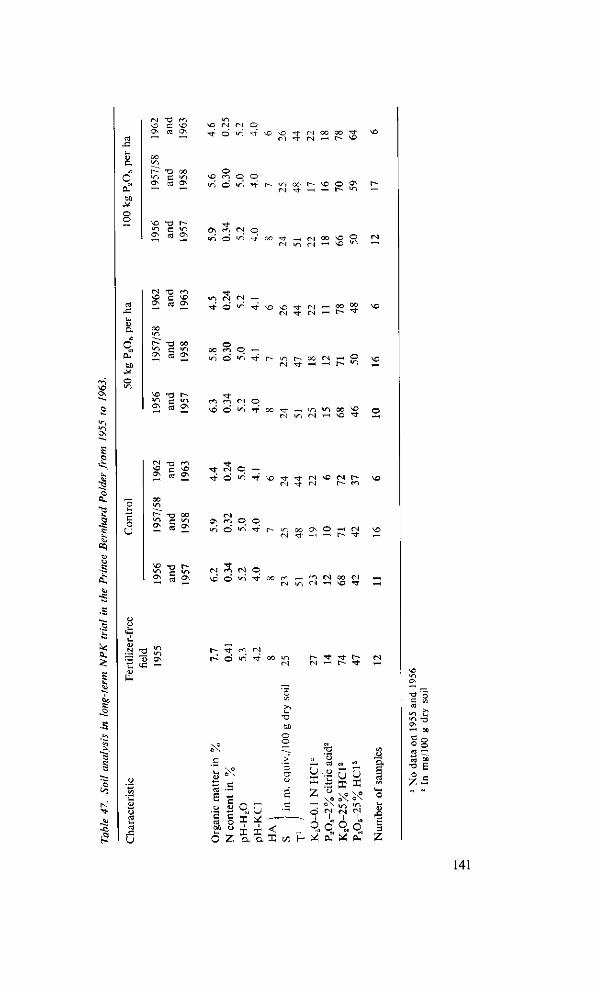
.«
£
I
- o
q O?
O
U
•O oo
ca O
Qv c3 ^
c *o ca o
t - - a 00 OV a os
- o t -
ca o
JE 2 E
NO (N (N O ' t 6 ^ ^t ^ ^ ^ IN 00 OO ^
(N ^ tr~~ ^o
^n o v^ T-t r-- «o oo r- ^o O ^ r -e-i ^ t r-4 —< r - «o —.
ON f*l <N o , - , " , — « n o " ^ - ^ - c > 0 ^- ^ M OO ^O O 2 |
(N io (N H ^ ^ '—,
— ra ^ ^ O «n Tj- ^O ^O T t ^ oo oo ^ H r - • *
q PT M
X O T >
r-v-> o
*C V i
o
•a c ca
~a c ca
oo T l O
r-v~i 0 \
00 •o
o vo
o m ö
^f m Ó
q w-j
<N iri
• *
o • *
r - oo (N 1-H ^t - H ^ r -
•sf —, «n <o co vg o oj in IN H \ o ^ ^
^i ^f \0 i 1
Os r*l O O v-> Ö "^ "^ iO co ^
r s ^ - i O H (N NO 1-« t - -<t T-H
oo m — ^ M oo r j ,—i IN i n M - ^ ^O t ^H
r ö r^ (N
V
^ c
'S c ca o ta u
o X D.
G <
>! -o OO
o o
> er Cu»
P
c
t/5 H
% ö
i
O
T3 '5 ca M «
itri
c H
Cl
HC
l
\ o o \ <="-o N w-i "-> <N <N <N
U i u q O q
.o
s 3
•o c t f l
m "Ti
'o trt
S-H
-o
« 'T
II ia
141
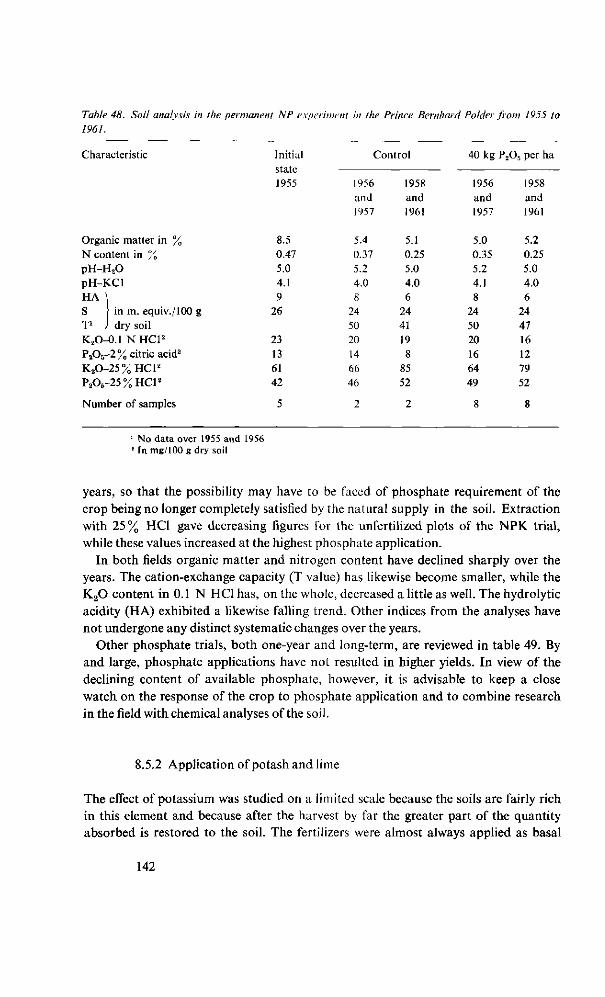
Table 48. Soil analysis in the permanent NP experiment in the Prince Bernhard Polder from 1955 to 1961.
Characteristic
Organic matter in % N content in % pH-H 2 0 pH KCl HA \ S in m. equiv./lOO g T1 J dry soil K2O-0.1 NHC1 2
P 20 5 -2% citric acid2
K 20-25%HC1 2
P 2 0 5 - 2 5 % H 0 2
Number of samples
Initial state 1955
8.5 0.47 5.0 4.1 9
26
23 13 61 42
5
Control
1956 and 1957
5.4 0.37 5.2 4.0 8
24 50 20 14 66 46
2
1958 and 1961
5.1 0.25 5.0 4.0 6
24 41 19 8
85 52
2
40 kg P 20 5 per ha
1956 and 1957
5.0 0.35 5.2 4.1 8
24 50 20 16 64 49
8
1958 and 1961
5.2 0.25 5.0 4.0 6
24 47 16 12 79 52
8
No data over 1955 and 1956 ' In mg/100 g dry soil
years, so that the possibility may have to be faced of phosphate requirement of the crop being no longer completely satisfied by the natural supply in the soil. Extraction with 25% HCl gave decreasing figures for the unfertilized plots of the NPK trial, while these values increased at the highest phosphate application.
In both fields organic matter and nitrogen content have declined sharply over the years. The cation-exchange capacity (T value) has likewise become smaller, while the K 20 content in 0.1 N HCl has, on the whole, decreased a little as well. The hydrolytic acidity (HA) exhibited a likewise falling trend. Other indices from the analyses have not undergone any distinct systematic changes over the years.
Other phosphate trials, both one-year and long-term, are reviewed in table 49. By and large, phosphate applications have not resulted in higher yields. In view of the declining content of available phosphate, however, it is advisable to keep a close watch on the response of the crop to phosphate application and to combine research in the field with chemical analyses of the soil.
8.5.2 Application of potash and lime
The effect of potassium was studied on a limited scale because the soils are fairly rich in this element and because after the harvest by far the greater part of the quantity absorbed is restored to the soil. The fertilizers were almost always applied as basal
142
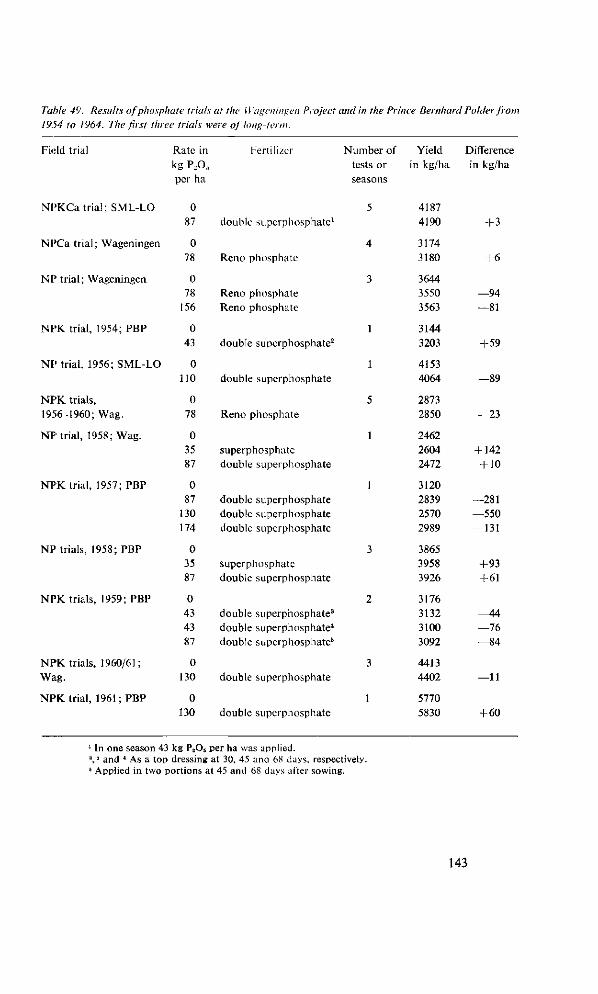
Table 49. Results of phosphate trials at the Wageningen Project and in the Prince Bernhard Polder from 1954 to 1964. The first three trials were of long-term.
Field trial
NPKCa trial; SML-LO
NPCa trial ; Wageningen
NP trial; Wageningen
NPK trial, 1954; PBP
NP trial, 1956; SML-LO
NPK trials, 1956-t960; Wag.
NP trial, 1958; Wag.
NPK trial, 1957; PBP
NP trials, 1958; PBP
NPK trials, 1959; PBP
NPK trials, 1960/61; Wag.
NPK trial, 1961 ; PBP
Rate in
kg P 2 0 5
per ha
0 87
0 78
0 78
156
0 43
0 110
0 78
0 35 87
0 87
130 174
0 35 87
0 43 43 87
0 130
0 130
Fertilizer
double superphosphate1
Reno phosphate
Reno phosphate Reno phosphate
double superphosphate2
double superphosphate
Reno phosphate
superphosphate double superphosphate
double superphosphate double superphosphate double superphosphate
superphosphate double superphosphate
double superphosphate3
double superphosphate4
double superphosphate5
double superphosphate
double superphosphate
Number of tests or seasons
5
4
3
1
1
5
1
1
3
2
3
1
Yield in kg/ha
4187 4190
3174 3180
3644 3550 3563
3144 3203
4153 4064
2873 2850
2462 2604 2472
3120 2839 2570 2989
3865 3958 3926
3176 3132 3100 3092
4413 4402
5770 5830
Difference in kg/ha
+ 3
+6
—94 —81
+ 59
—89
—23
+ 142 + 10
—281 —550 —131
+93 + 61
—44 —76 —84
—11
+ 60
In one season 43 kg P205 per ha was applied. ',3 and * As a top dressing at 30, 45 ana 68 days, respectively. • Applied in two portions at 45 and 68 days after sowing.
143
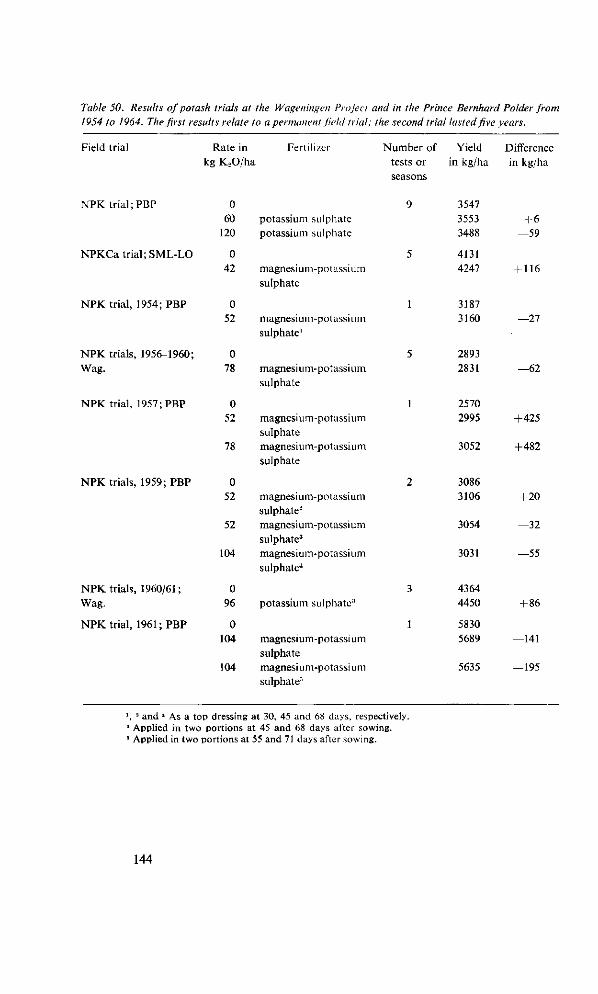
Table 50. Results of potash trials at the Wageningen Project and in the Prince Bernhard Polder from 1954 to 1964. The first results relate to a permanent field trial; the second trial lasted five years.
Field trial
NPK trial;PBP
NPKCa trial; SML-LO
NPK trial, 1954; PBP
NPK trials, 1956-1960; Wag.
NPK trial, 1957; PBP
NPK trials, 1959; PBP
NPK trials, 1960/61; Wag.
NPK trial, 1961 ; PBP
Rate in Fertilizer kg K ,0 /ha
0 60
120
0 42
0 52
0 78
0 52
78
0 52
52
104
0 96
0 104
104
potassium sulphate potassium sulphate
magnesium-potassium sulphate
magnesium-potassium sulphate1
magnesium-potassium sulphate
magnesium-potassium sulphate magnesium-potassium sulphate
magnesium-potassium sulphate2
magnesium-potassium sulphate3
magnesium-potassium sulphate4
potassium sulphate3
magnesium-potassium sulphate magnesium-potassium sulphate5
Number of tests or seasons
9
5
1
5
1
2
3
1
Yield in kg/ha
3547 3553 3488
4131 4247
3187 3160
2893 2831
2570 2995
3052
3086 3106
3054
3031
4364 4450
5830 5689
5635
Difference in kg/ha
+ 6 —59
+ 116
—27
—62
+425
+482
+20
—32
—55
+ 86
—141
—195
', '' and » As a top dressing at 30, 45 and 68 days, respectively. 4 Applied in two portions at 45 and 68 days alter sowing. 5 Applied in two portions at 55 and 71 days after sowing.
144
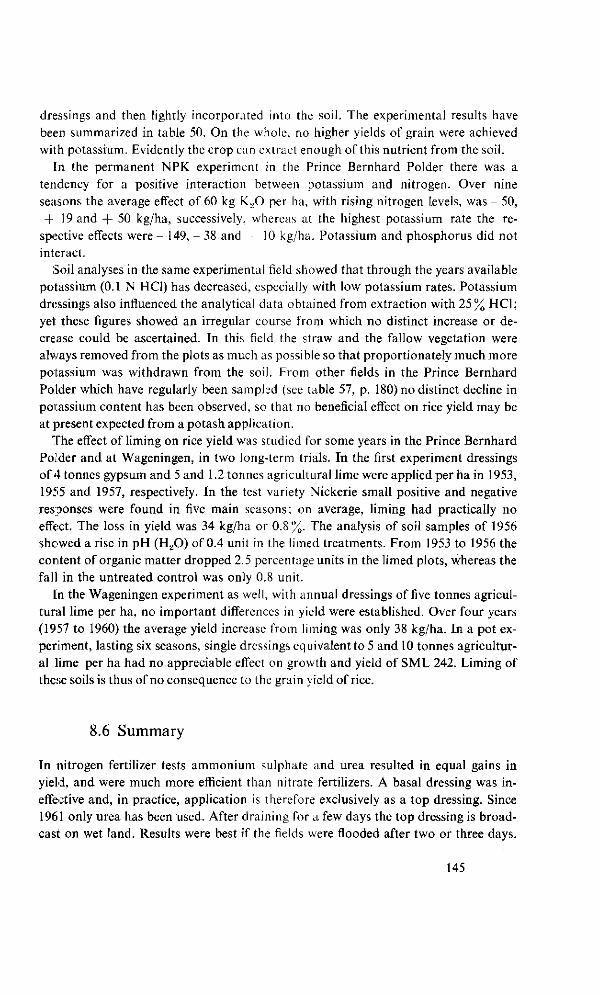
dressings and then lightly incorporated into the soil. The experimental results have been summarized in table 50. On the whole, no higher yields of grain were achieved with potassium. Evidently the crop can extract enough of this nutrient from the soil.
In the permanent NPK experiment in the Prince Bernhard Polder there was a tendency for a positive interaction between potassium and nitrogen. Over nine seasons the average effect of 60 kg K20 per ha, with rising nitrogen levels, was - 50, -f 19 and + 50 kg/ha, successively, whereas at the highest potassium rate the re
spective effects were - 149, - 38 and 10 kg/ha. Potassium and phosphorus did not interact.
Soil analyses in the same experimental field showed that through the years available potassium (0.1 N HCl) has decreased, especially with low potassium rates. Potassium dressings also influenced the analytical data obtained from extraction with 25% H O ; yet these figures showed an irregular course from which no distinct increase or decrease could be ascertained. In this field the straw and the fallow vegetation were always removed from the plots as much as possible so that proportionately much more potassium was withdrawn from the soil. From other fields in the Prince Bernhard Polder which have regularly been sampled (see table 57, p. 180) no distinct decline in potassium content has been observed, so that no beneficial effect on rice yield may be at present expected from a potash application.
The effect of liming on rice yield was studied for some years in the Prince Bernhard PoMer and at Wageningen, in two long-term trials. In the first experiment dressings of 4 tonnes gypsum and 5 and 1.2 tonnes agricultural lime were applied per ha in 1953, 1955 and 1957, respectively. In the test variety Nickerie small positive and negative responses were found in five main seasons; on average, liming had practically no effect. The loss in yield was 34 kg/ha or 0.8%. The analysis of soil samples of 1956 shewed a rise in pH (H20) of 0.4 unit in the limed treatments. From 1953 to 1956 the content of organic matter dropped 2.5 percentage units in the limed plots, whereas the fall in the untreated control was only 0.8 unit.
In the Wageningen experiment as well, with annual dressings of five tonnes agricultural lime per ha, no important differences in yield were established. Over four years (1957 to 1960) the average yield increase from liming was only 38 kg/ha. In a pot experiment, lasting six seasons, single dressings equivalent to 5 and 10 tonnes agricultural lime per ha had no appreciable effect on growth and yield of SML 242. Liming of these soils is thus of no consequence to the grain yield of rice.
8.6 Summary
In nitrogen fertilizer tests ammonium sulphate and urea resulted in equal gains in yield, and were much more efficient than nitrate fertilizers. A basal dressing was ineffective and, in practice, application is therefore exclusively as a top dressing. Since 1961 only urea has been used. After draining for a few days the top dressing is broadcast on wet land. Results were best if the fields were flooded after two or three days.
145
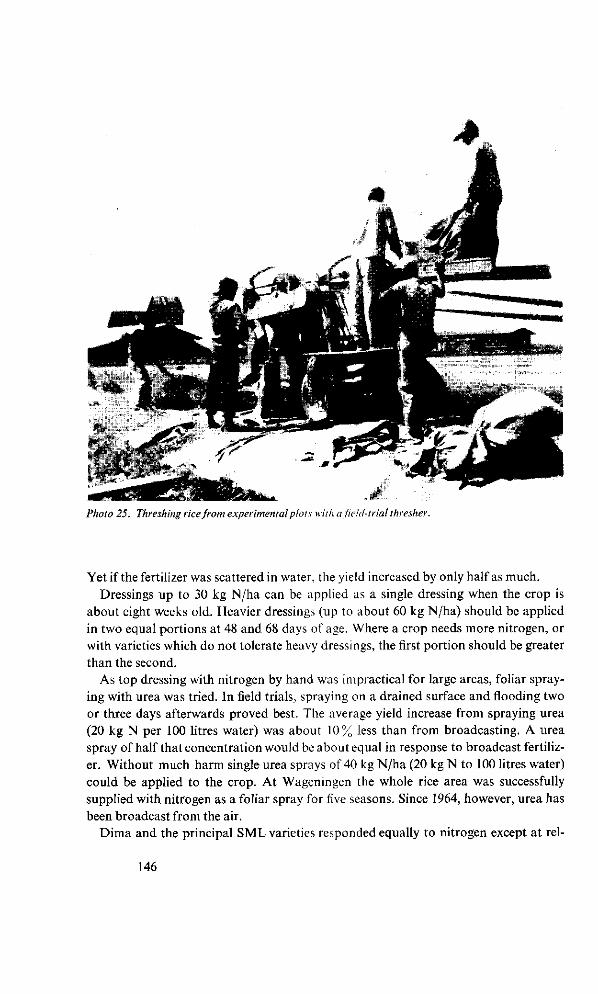
Photo 25. Threshing rice from experimental plots with a field-trial thresher.
Yet if the fertilizer was scattered in water, the yield increased by only half as much. Dressings up to 30 kg N/ha can be applied as a single dressing when the crop is
about eight weeks old. Heavier dressings (up to about 60 kg N/ha) should be applied in two equal portions at 48 and 68 days of age. Where a crop needs more nitrogen, or with varieties which do not tolerate heavy dressings, the first portion should be greater than the second.
As top dressing with nitrogen by hand was impractical for large areas, foliar spraying with urea was tried. In field trials, spraying on a drained surface and flooding two or three days afterwards proved best. The average yield increase from spraying urea (20 kg N per 100 litres water) was about 10% less than from broadcasting. A urea spray of half that concentration would be about equal in response to broadcast fertilizer. Without much harm single urea sprays of 40 kg N/ha (20 kg N to 100 litres water) could be applied to the crop. At Wageningen the whole rice area was successfully supplied with nitrogen as a foliar spray for five seasons. Since 1964, however, urea has been broadcast from the air.
Dima and the principal SML varieties responded equally to nitrogen except at rel-
146
atively high fertilizer rates, when Dima developed too much vegetative growth and SML 81b severely lodged. Analysis of a large number of experiments showed that up to 40 kg N/ha grain yield response was rectilinear; yield rose by an average of 23 kg paddy per kg N. Only where the yields of the unfertilized plots exceeded 5250 kg/ha was response smaller.
A later application of nitrogen was accompanied by a decline in effective tillering and straw weight, and by an increase in panicle weight and grain-to-straw ratio. With increasing nitrogen dressings the effective tillering would at first increase but at rates exceeding 30 kg N/ha the number of productive panicles per unit area remained virtually constant. As nitrogen dressings increased, the larger grain yield resulted increasingly from heavier panicles rather than from a larger number of panicle-bearing tillers.
In comparison with SML varieties the indica types Skk, D 110 and Paquita responded poorly to nitrogen. The responses were analysed with crop samples. Of the increase in dry matter yield of the SML varieties under moderate growth conditions 47 % was grain, whereas for the indica varieties the percentage was only 21; under good growth conditions respective figures were 32 and 15. Under very favourable conditions the average increase in yield of dry matter with the SML varieties from nitrogen was 2.2 tonnes per ha, whereas in the indica types the weight fell by 1.6 tonnes per ha. These differences are ascribed to lodging and mutual shading. In leafy varieties with long, drooping leaves, nitrogen tends more readily to give rise to an unfavourable balance between photosynthesis and respiration than in varieties which tolerate heavy dressings well.
Phosphate did not generally raise grain yields. In the future, however, the phosphate requirement of the crop may no longer be covered by the quantity available in the soil. Potash and lime had no positive effects on grain yield.
147
9 Control of diseases and pests
Investigations into chemical control of pests were mainly carried on at Wageningen. During the years 1953 to 1957 this work was under De Wit; after that Stubbs and Wouters took charge of it. Until 1961 chemical control of diseases was investigated in the Wageningen Polder; afterwards this work was undertaken also by the Agricultural Research Department. The way in which the most important pests were combated up to about 1959 has been fully described by DE WIT (1960). As radical changes took place in the chemicals applied and the methods used in later years, and as new possibilities appeared of controlling diseases, the subject deserves another scrutiny.
9.1 Control of diseases
9.1.1 Physiological diseases
In parts of many of the world's rice areas crops are affected by a physiological disease associated with severe reduction of the soil and attributed to a high concentration of toxins near the roots. These diseases with some common symptoms are known by different names and generally occur on soils with poor internal drainage or no permeability at all. Such substances as hydrogen sulphide, ferrous iron and a few organic acids can disturb or inhibit the absorption of water and nutrients by rice or kill the roots (see TAKAHASHI, 1960a, and BABA et al., 1965). Toxins form by reduction; injurious quantities arise if reduction is promoted and downward movement of water is hindered. Accumulation of toxic quantities of reduction products is known to have sometimes been wholly or partly prevented by applying certain substances to the soil, such as manganese dioxide (YUAN and PONNAMPHRUMA, 1966). PONNAMPERUMA (1960) partly controlled bronzing disease in Ceylon by liming, while iron-containing materials, amongst others, are recommended (BABA et al., 1965) to combat 'akiochi' (autumn decline) in Japan.
Although the precise causes of most of these diseases are still incompletely known, it is commonly held that damage by many of them can be partly or wholly prevented by avoiding a severe reduction of the soil, enhancing its permeability, and by cultivating tolerant varieties. Short descriptions of several such diseases are given by TAKAHASHI (1960a,b)andBABA<?/a/. (1965). Recent studies in the Philippines, however, suggest that some of the so-called physiological diseases are caused by viruses (Ou, 1965; Ou and GOH, 1966).
148
In mechanical cultivation of rice in Surinam a similar disease occurs. The disorder was not noticed until 1957. In the Wageningen Polder reclamation was incomplete until about 1958. Fields were not level; dry tillage, preparation of seedbeds and control of pests were inadequate. In the Prince Bernhard Polder reduction of the soil had comparatively little effect on yield because cultural practices were not yet perfected and because better tillage and drainage meant that the soil was in better condition than in the Wageningen Polder.
A poor growth of the crop, followed by a premature browning and dying-off of the leaves and inexplicably low yields were first observed in a few fields of the Agricultural Research Department. In 1956/57 and 1957 SML 80/5 and SML 80/7 appeared not to be suitable for land cropped with rice in the previous season unless it could be dry-tilled between crops. In such fields Dima performed better. Later it became clear that physical and chemical properties of the soil greatly affected the growth, maturation ami yield of rice.
Optimum soil conditions for the crop are not yet known. Several factors influence the reduction status and the accumulation of toxins in the soil. As such may be mentioned: (1) oxidation level of the topsoil. (2) stability of the aggregates before flooding, (3) content of organic matter, (4) physical properties of the subsoil, (5) nature and quantity of incorporated plant residues. (6) intensity of puddling, (7) quality and temperature of the standing water, and (8) periods of drainage. The most severe condition of the soil is easily described: the topsoil consists of a bluish black, putty-like mass and smells strongly of H2S. Such an environment has a most harmful effect on growth and development of the crop. As so many factors affect the physical and chemical properties of the soil, the physiological disorder is of a complex origin and nature.
Where the disease occurs at an early stage, this is manifested by poor growth followed by a dirty-brown discoloration and death of the older leaves. At flowering the panicles vary in height and few leaves remain green. The dying-off of the leaves may proceed rapidly and force ripening; the crop shrivels up and at harvest looks dirty-brown and rusty. Such a crop has many damaged and dead roots and is usually attacked by parasitic fungi. The low photosynthetic activity of the leaves and the poor root system result in a low grain yield. The harvest is often hard to time because matu-raton proceeds quickly and the same panicle houses green as well as ripe grains. The quality of the product is usually poor; there are many small, chalky or fragile grains. The disease may be mild or serious; varieties and lines differ in susceptibility.
Elsewhere, the vegetative growth of the crop may be adequate, yet, after receiving the second dressing of nitrogen, plants may remain dark green and produce panicles with 90 to 100% sterile spikelets. Because seed-setting hardly takes place, the panicles remain erect. Similar symptoms occur also in North America; the disease is known there as straighthead.
In other cases the growth of the crop proceeds normally till a few weeks before flowering, when the older leaves start dying off rather quickly, while the younger leaves turn brown and gradually die back from the tips. Ripening is accelerated and by
149
harvest time the crop has turned a dirty brown without retaining a single green or light-yellow leaf. The crop is usually attacked by fungi as well. The symptoms of the disease (browning and dying of leaves and forced maturation) may sometimes not appear until after flowering. It can suddenly break out in a serious degree so that at harvest almost all plants are dead with appreciable losses in yield and quality. Where the plants rapidly declined and the leaves died off, the root system often appeared almost dead and black, and the bluish-black soil smelt strongly of H2S.
The disease can thus occur at various times and in various degrees and both an early and a late attack may give rise to considerable losses. On the basis of the yield expected when the disorder appears, the losses in a serious attack are estimated at 500 to 1500 kg/ha. Although this physiological disease is usually accompanied by an attack by parasitic fungi {Helminthosporium and/or Cercospora and/or Piricularia), such attacks often seem to be secondary, so that losses in yield and quality are ascribed chiefly to the bad state of the soil. In this connection it may be noted that in Japan the occurrence of 'akiochi' is almost invariably associated with an infection by Helminthosporium oryzae (BABA and HARADA, 1954). The effect of the disease on the quality of the grain is dealt with in sections 11.4 to 11.6.
The financial losses with this disease stress the need to prevent heavy reduction of the soil and accumulation of toxins. Limitation of losses involves the following operations: (1) improving the surface and underground drainage in fallow periods (chapter 2); (2) improving the oxidation status of the soil or preventing a severe reduction when tilling the land and preparing the seedbed (chapter 3); (3) preventing ruts in the field when sowing and managing the crop; (4) interposing periods of drainage during the growth of the crop (6.5.2); (5) breeding and cultivating tolerant varieties; (6) adopting a cropping system in which the soil is given an adequate opportunity to recover during fallow; and (7) cultivating green manures or cover crops to improve physical properties of the soil. The disease is frequent, severity is unpredictable and remedial measures produce too little effect. Therefore great care and attention must be incessantly devoted to preventive measures.
9.1.2 Fungus diseases
The principal fungi encountered in mechanical culture of rice in Surinam are Helminthosporium oryzae VAN BREDA DE HAAN (or Cochliobolus miyabeanus), Cercospora oryzae MIYAKE and Piricularia oryzae CAV. These pathogens attack the crop at different stages, the progress of the disease being uncertain. Rice crops have often been known to recover partly or wholly from an early infection, but when attacked at a later age their chances of recovery are much smaller. Generally, it may be stated that with the varieties grown till about 1960 (Dima, Nickerie, SML 80/5 and SML 80/7) the infection often revealed itself when the crop was from 60 to 70 days old, whereas in the more recently grown types (SML 81b, SML 242, SML 140/5 and SML 140/10)
150
the leaf spots generally did not show until about 90 days after sowing. Although fairly important differences in resistance to these fungus diseases are
found among the varieties, it is difficult to give an accurate description of the resistance (or susceptibility) of each variety, since it has appeared in practice that such varietal characteristics are not static concepts. Many varieties have been attacked more severely with the passing of years and have been frequently infected with more than one species of fungus. In fact, this was one of the main reasons why varieties such as SML 77a, SML 140/5, SML 140/10 and SML 128/4 were early discarded from the varietal stock. The gradual increase in susceptibility is attributed to a build-up of existing fungus races or to the appearance of new physiologic races.
The nutrition of the plant may also affect the course of infection by fungi. The state of the soil is the chief factor (see 9.1.1) in that adverse conditions greatly suppress the physiological activity of rice plants. Sources of infection are supposed to be dropseed growth and ratoon shoots from rice stubble. Varieties may differ in the extent to which Helminthosporiwn will spread. Grasses and other weeds in the polder may sometimes act as hosts and sources of infection for parasitic fungi on rice. A Helminthosporium infection in Leptochloa scabra has frequently been transmitted with wind to a crop of Dima.
Fungus diseases are indirectly controlled by seed disinfection; for security different varieties are sown. Phyto-sanitary measures are hard to effect because rice is grown in both seasons and the remaining fallow land cannot be kept free from volunteer rice, grasses and other weeds, and even so they would be questionable economically. For reasons partly other than hygiene the remaining straw and the existing weed vegetation are burnt or ploughed in after harvest and crop management is intended to favour growth. Indirect control may receive more attention when more is known about epidemiology.
New perspectives for direct chemical control were opened up in 1961 by DU-TER 20% wettable powder (a fungicide on a triphenyl tin hydroxide base). This product or one of three other fungicides was sprayed on the crop (SML 140/5) at ten days' intervals from 60 to 120 days after sowing (table 51 ). The chemicals, in 100 litres water per ha, were applied early in the morning with a Saval knapsack sprayer, when the weather was calm. The fungicides colloidal sulphur and DU-TER both had a wetting agent (Teepol) and a sticker (Tenac), each 2 ml per litre water. The experimental design was a Latin square with five treatments; the plot size was 44 m2.
When the crop in this experiment was 100 days old (about one week before flowering;), few leaf spots were to be seen, but after 110 days the infection rapidly spread so that at maturity (142 days) the untreated crop was badly affected by fungi, mainly Helminthosporium oryzae and to a lesser extent Piricularia at the panicle base. At the last spraying, at 120 days, distinct differences were visible between treatments. The plots treated with DU-TER remained at first free, but were later mildly infected. The crop on these plots ripened slowly and was ready for harvest some ten days later than the untreated crop. The plots sprayed with sulphur or Quinolate 20 (a copper-oxy-
151
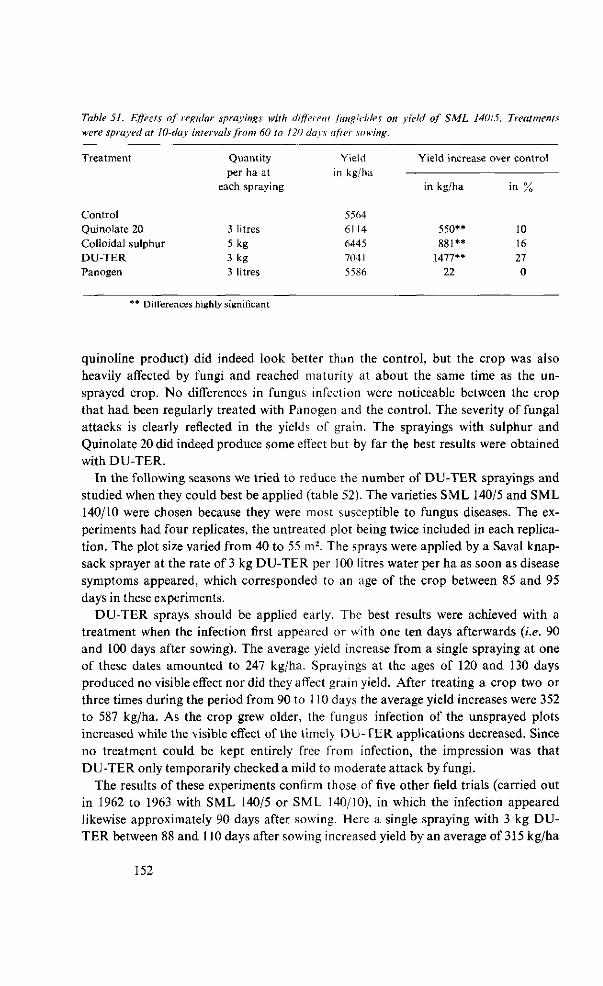
Table 51. Effects of regular sprayings with different fungicides on yield of S ML 140/5. Treatments were sprayed at 10-day intervals from 60 to 120 days after sowing.
Treatment
Control Quinolate 20 Colloidal sulphur DU-TER Panogen
Quantity per ha at
each spraying
3 litres 5 kg 3 kg 3 litres
Yield in kg/ha
5564 6114 6445 7041 5586
Yield increase
in kg/ha
550** 881**
1477** 22
over control
i n %
10 16 27 0
** Differences highly significant
quinoline product) did indeed look better than the control, but the crop was also heavily affected by fungi and reached maturity at about the same time as the un-sprayed crop. No differences in fungus infection were noticeable between the crop that had been regularly treated with Panogen and the control. The severity of fungal attacks is clearly reflected in the yields of grain. The sprayings with sulphur and Quinolate 20 did indeed produce some effect but by far the best results were obtained with DU-TER.
In the following seasons we tried to reduce the number of DU-TER sprayings and studied when they could best be applied (table 52). The varieties SML 140/5 and SML 140/10 were chosen because they were most susceptible to fungus diseases. The experiments had four replicates, the untreated plot being twice included in each replication. The plot size varied from 40 to 55 m2. The sprays were applied by a Saval knapsack sprayer at the rate of 3 kg DU-TER per 100 litres water per ha as soon as disease symptoms appeared, which corresponded to an age of the crop between 85 and 95 days in these experiments.
DU-TER sprays should be applied early. The best results were achieved with a treatment when the infection first appeared or with one ten days afterwards (i.e. 90 and 100 days after sowing). The average yield increase from a single spraying at one of these dates amounted to 247 kg/ha. Sprayings at the ages of 120 and 130 days produced no visible effect nor did they affect grain yield. After treating a crop two or three times during the period from 90 to 110 days the average yield increases were 352 to 587 kg/ha. As the crop grew older, the fungus infection of the unsprayed plots increased while the visible effect of the timely DU-TER applications decreased. Since no treatment could be kept entirely free from infection, the impression was that DU-TER only temporarily checked a mild to moderate attack by fungi.
The results of these experiments confirm those of five other field trials (carried out in 1962 to 1963 with SML 140/5 or SML 140/10), in which the infection appeared likewise approximately 90 days after sowing. Here a single spraying with 3 kg DU-TER between 88 and 110 days after sowing increased yield by an average of 315 kg/ha
152
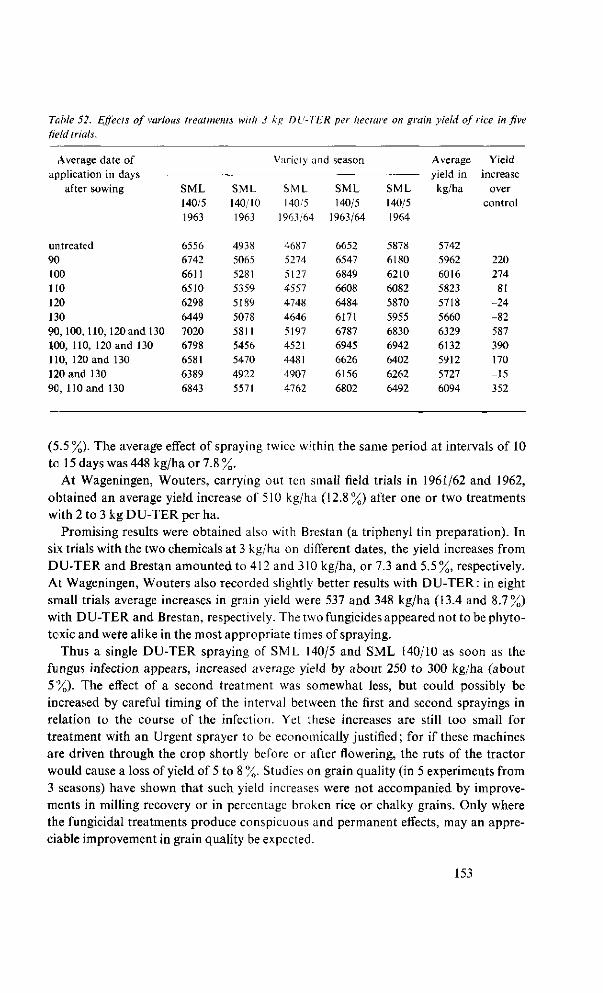
Table 52. Effects of various treatments with 3 kg DU-1 ER per hectare on grain yield of rice in five field trials.
Average date of 'jnY\\if-'ittr\r\ i n ricivc d,Ll LMllwdlUJll 111 \Xd.y S
after sowing
untreated 90 100
no 120 130 90, 100,110, 120 and 130 100, 110, 120 and 130 110, 120 and 130 120 and 130 90, 110 and 130
SML 140/5 1963
6556 6742 6611 6510 6298 6449 7020 6798 6581 6389 6843
SML 140/10 1963
4938 5065 5281 5359 5189 5078 5811 5456 5470 4922 5571
Variety and season
SML 140/5
1963/64
4687 5274 5127 4557 4748 4646 5197 4521 4481 4907 4762
SML 140/5
1963/64
6652 6547 6849 6608 6484 6171 6787 6945 6626 6156 6802
SML 140/5 1964
5878 6180 6210 6082 5870 5955 6830 6942 6402 6262 6492
Average • yield in
kg/ha
5742 5962 6016 5823 5718 5660 6329 6132 5912 5727 6094
Yield increase
over control
220 274 81
-24 -82 587 390 170 -15 352
(5.5%). The average effect of spraying twice within the same period at intervals of 10 to 15 days was 448 kg/ha or 7.8 %.
At Wageningen, Wouters, carrying out ten small field trials in 1961/62 and 1962, obtained an average yield increase of 510 kg/ha (12.8%) after one or two treatments with 2 to 3 kg DU-TER per ha.
Promising results were obtained also with Brestan (a triphenyl tin preparation). In six trials with the two chemicals at 3 kg/ha on different dates, the yield increases from DU-TER and Brestan amounted to 412 and 310 kg/ha, or 7.3 and 5.5%, respectively. At Wageningen, Wouters also recorded slightly better results with DU-TER: in eight small trials average increases in grain yield were 537 and 348 kg/ha (13.4 and 8.7%) with DU-TER and Brestan, respectively. The two fungicides appeared not to be phyto-tcxic and were alike in the most appropriate times of spraying.
Thus a single DU-TER spraying of SML 140/5 and SML 140/10 as soon as the fungus infection appears, increased average yield by about 250 to 300 kg/ha (about 5%). The effect of a second treatment was somewhat less, but could possibly be increased by careful timing of the interval between the first and second sprayings in relation to the course of the infection. Yet these increases are still too small for treatment with an Urgent sprayer to be economically justified; for if these machines are driven through the crop shortly before or after flowering, the ruts of the tractor would cause a loss of yield of 5 to 8 %. Studies on grain quality (in 5 experiments from 3 seasons) have shown that such yield increases were not accompanied by improvements in milling recovery or in percentage broken rice or chalky grains. Only where the fungicidal treatments produce conspicuous and permanent effects, may an appreciable improvement in grain quality be expected.
153
The use of aeroplanes, since 1964, is more promising for chemical control of fungi. It is not yet known whether similar effects are obtainable with other varieties, such as SML 81b and SML 242. Large-scale control needs more basic data. It is of major importance to find out more about the relation between soil condition and attack by parasitic fungi. The chemical control of fungi will be more economic if it can be combined with combat against seed bugs or brown borers.
9.1.3 Virus diseases
The only virus disease on rice in Surinam, observed sporadically since 1958, is 'hoja blanca' or white leaf. It is transmitted by the delphacid Sogata orizicola MUIR. The great damage which this disease inflicted in Cuba and other Latin-American countries led to brisk activity in Surinam for a number of years to be able to cope with it. During successive seasons its incidence in the Prince Bernhard Polder and at Wageningen was watched closely. No appreciable extension of the disease could be noticed. The counts from 1958 till 1963 in the fields of the Agricultural Research Department revealed less than 0.1 % affected plants; and as far as is known, the incidence elsewhere in Surinam was even less.
In breeding, much attention was paid during some years to selection for resistance to this virus disease. The reaction of varieties and promising lines was tested in Venezuela, Guatemala, Colombia and Costa Rica. Results showed that most SML varieties offered reasonable to good resistance. For SML 81b and SML 140/5 this was afterwards confirmed by EFFERSON ( 1964) and VAN DER SPEK (1965). VAN HOOF
(1962) found that approximately 0.4% of Sogata orizicola individuals was able to transmit the virus. For some years it has been possible to control the vector. The virus disease is therefore no longer considered a serious menace to rice in Surinam.
9.2 Control of pests
9.2.1 General introduction
Since rice was first cultivated in the Wageningen Polder attacks by numerous pests have always had to be faced. Control at first presented great difficulties. Intensive research, better equipment and improvements in cultural practice have eventually controlled most of these pests. A good deal more of experimental work is still needed to perfect the control measures. The range of chemicals has changed as better pesticides entered the market and because the choice of product is partly determined by the equipment available. Products with a broad spectrum are in demand as well as selective agents because pest incidence is erratic and also because the pesticides are slow in delivery.
Until 1960 large areas were treated mainly with KWH portable motor-driven mist
154
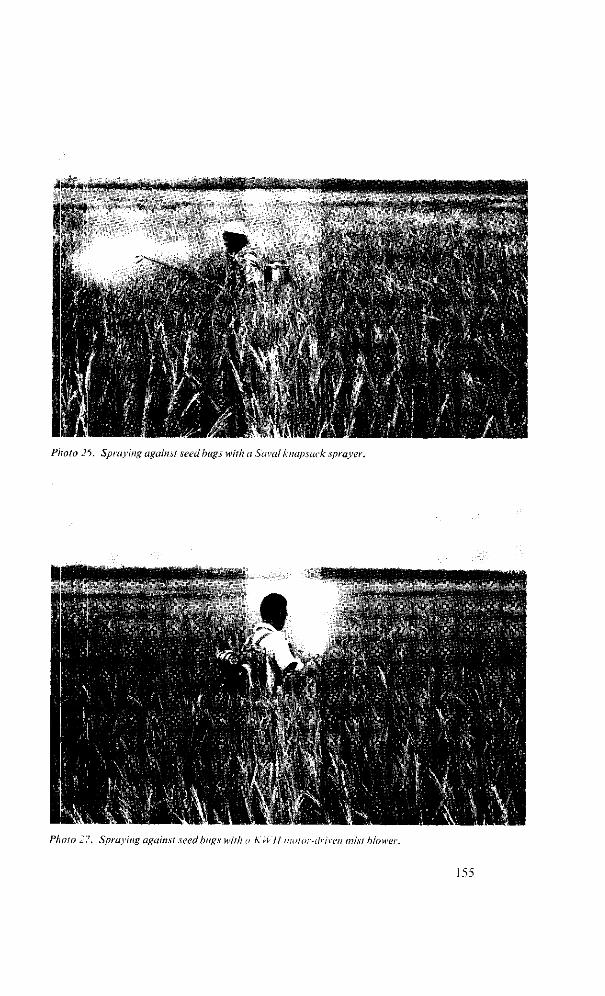
1» •*
Photo <?5. Spraying against seed bugs with a Scival knapsack sprayer.
Photo 27. Spraying against seed bugs with a A 1(7/ motor-driven mist blower.
155
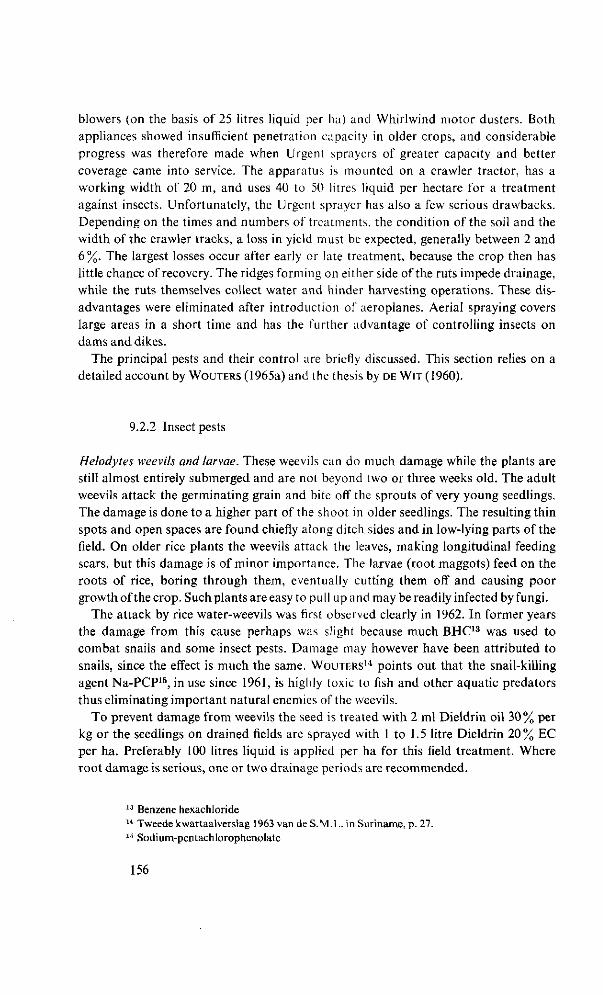
blowers (on the basis of 25 litres liquid per ha) and Whirlwind motor dusters. Both appliances showed insufficient penetration capacity in older crops, and considerable progress was therefore made when Urgent sprayers of greater capacity and better coverage came into service. The apparatus is mounted on a crawler tractor, has a working width of 20 m, and. uses 40 to 50 litres liquid per hectare for a treatment against insects. Unfortunately, the Urgent sprayer has also a few serious drawbacks. Depending on the times and numbers of treatments, the condition of the soil and the width of the crawler tracks, a loss in yield must be expected, generally between 2 and 6%. The largest losses occur after early or late treatment, because the crop then has little chance of recovery. The ridges forming on either side of the ruts impede drainage, while the ruts themselves collect water and hinder harvesting operations. These disadvantages were eliminated after introduction of aeroplanes. Aerial spraying covers large areas in a short time and has the further advantage of controlling insects on dams and dikes.
The principal pests and their control are briefly discussed. This section relies on a detailed account by WOUTERS (1965a) and the thesis by DE WIT (1960).
9.2.2 Insect pests
Helodytes weevils and larvae. These weevils can do much damage while the plants are still almost entirely submerged and are not beyond two or three weeks old. The adult weevils attack the germinating grain and bite off the sprouts of very young seedlings. The damage is done to a higher part of the shoot in older seedlings. The resulting thin spots and open spaces are found chiefly along ditch sides and in low-lying parts of the field. On older rice plants the weevils attack the leaves, making longitudinal feeding scars, but this damage is of minor importance. The larvae (root maggots) feed on the roots of rice, boring through them, eventually cutting them off and causing poor growth of the crop. Such plants are easy to pull up and may be readily infected by fungi.
The attack by rice water-weevils was first observed clearly in 1962. In former years the damage from this cause perhaps was slight because much BHC13 was used to combat snails and some insect pests. Damage may however have been attributed to snails, since the effect is much the same. WOUTERS14 points out that the snail-killing agent Na-PCP15, in use since 1961, is highly toxic to fish and other aquatic predators thus eliminating important natural enemies of the weevils.
To prevent damage from weevils the seed is treated with 2 ml Dieldrin oil 30% per kg or the seedlings on drained fields arc sprayed with 1 to 1.5 litre Dieldrin 20% EC per ha. Preferably 100 litres liquid is applied per ha for this field treatment. Where root damage is serious, one or two drainage periods are recommended.
13 Benzene hexachloride 14 Tweede kwartaalverslag 1963 van de S.M.L. in Suriname, p. 27. 15 Sodium-pentachlorophenolate
156
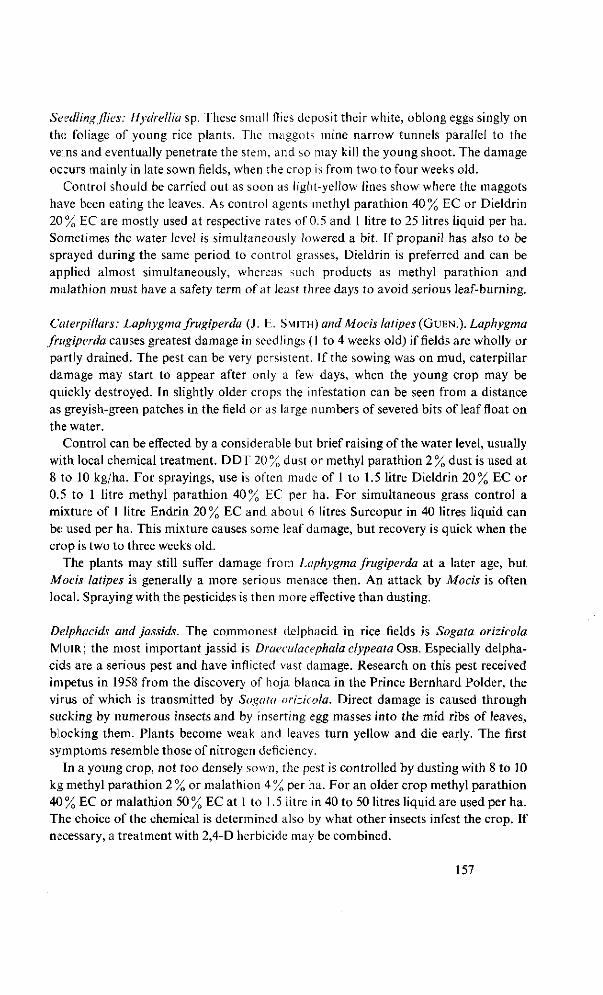
Seedling flies: Hydrellia sp. These small flies deposit their white, oblong eggs singly on the foliage of young rice plants. The maggots mine narrow tunnels parallel to the veins and eventually penetrate the stem, and so may kill the young shoot. The damage oc:urs mainly in late sown fields, when the crop is from two to four weeks old.
Control should be carried out as soon as light-yellow lines show where the maggots have been eating the leaves. As control agents methyl parathion 40% EC or Dieldrin 20% EC are mostly used at respective rates of 0.5 and 1 litre to 25 litres liquid per ha. Sometimes the water level is simultaneously lowered a bit. If propanil has also to be sprayed during the same period to control grasses, Dieldrin is preferred and can be applied almost simultaneously, whereas such products as methyl parathion and malathion must have a safety term of at least three days to avoid serious leaf-burning.
Caterpillars: Laphygma frugiperda (J. E. SMITH) and Mocis latipes (GUEN.). Laphygma frugiperda causes greatest damage in seedlings ( 1 to 4 weeks old) if fields are wholly or partly drained. The pest can be very persistent. If the sowing was on mud, caterpillar damage may start to appear after only a few days, when the young crop may be quickly destroyed. In slightly older crops the infestation can be seen from a distance as greyish-green patches in the field or as large numbers of severed bits of leaf float on the water.
Control can be effected by a considerable but brief raising of the water level, usually with local chemical treatment. DDT 20% dust or methyl parathion 2% dust is used at 8 to 10 kg/ha. For sprayings, use is often made of 1 to 1.5 litre Dieldrin 20% EC or 0.5 to 1 litre methyl parathion 40% EC per ha. For simultaneous grass control a mixture of 1 litre Endrin 20% EC and about 6 litres Surcopur in 40 litres liquid can be used per ha. This mixture causes some leaf damage, but recovery is quick when the crop is two to three weeks old.
The plants may still suffer damage from Laphygma frugiperda at a later age, but Mocis latipes is generally a more serious menace then. An attack by Mocis is often local. Spraying with the pesticides is then more effective than dusting.
Delphacids and jassids. The commonest delphacid in rice fields is Sogata orizicola MUIR; the most important jassid is Draeculacephala clypeata OSB. Especially delphacids are a serious pest and have inflicted vast damage. Research on this pest received impetus in 1958 from the discovery of hoja blanca in the Prince Bernhard Polder, the virus of which is transmitted by Sogata orizicola. Direct damage is caused through sucking by numerous insects and by inserting egg masses into the mid ribs of leaves, blocking them. Plants become weak and leaves turn yellow and die early. The first symptoms resemble those of nitrogen deficiency.
In a young crop, not too densely sown, the pest is controlled by dusting with 8 to 10 kg methyl parathion 2% or malathion 4% per ha. For an older crop methyl parathion 40 % EC or malathion 50 % EC at 1 to 1.5 litre in 40 to 50 litres liquid are used per ha. The choice of the chemical is determined also by what other insects infest the crop. If necessary, a treatment with 2,4-D herbicide may be combined.
157
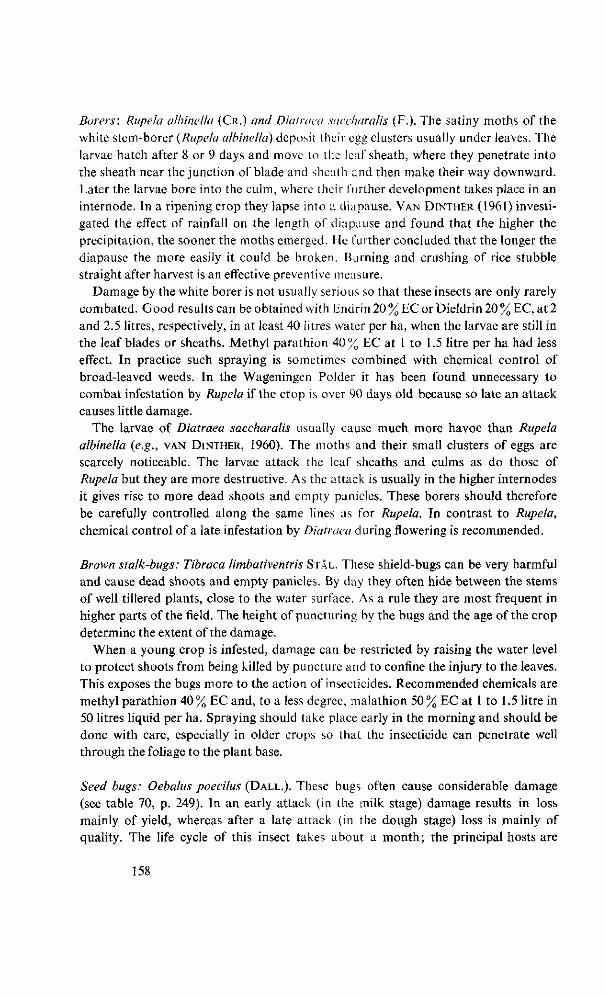
Borers: Rupela albinella (CR.) and Diatraea saccharalis (F.). The satiny moths of the white stem-borer {Rupela albinella) deposit their egg clusters usually under leaves. The larvae hatch after 8 or 9 days and move to the leaf sheath, where they penetrate into the sheath near the junction of blade and sheath and then make their way downward. Later the larvae bore into the culm, where their further development takes place in an internode. In a ripening crop they lapse into a diapause. VAN DINTHER (1961) investigated the effect of rainfall on the length of diapause and found that the higher the precipitation, the sooner the moths emerged. He further concluded that the longer the diapause the more easily it could be broken. Burning and crushing of rice stubble straight after harvest is an effective preventive measure.
Damage by the white borer is not usually serious so that these insects are only rarely combated. Good results can be obtained with Endrin 20 % EC or Dieldrin 20 % EC, at 2 and 2.5 litres, respectively, in at least 40 litres water per ha, when the larvae are still in the leaf blades or sheaths. Methyl parathion 40% EC at 1 to 1.5 litre per ha had less effect. In practice such spraying is sometimes combined with chemical control of broad-leaved weeds. In the Wageningen Polder it has been found unnecessary to combat infestation by Rupela if the crop is over 90 days old because so late an attack causes little damage.
The larvae of Diatraea saccharalis usually cause much more havoc than Rupela albinella {e.g., VAN DINTHER, 1960). The moths and their small clusters of eggs are scarcely noticeable. The larvae attack the leaf sheaths and culms as do those of Rupela but they are more destructive. As the attack is usually in the higher internodes it gives rise to more dead shoots and empty panicles. These borers should therefore be carefully controlled along the same lines as for Rupela. In contrast to Rupela, chemical control of a late infestation by Diatraea during flowering is recommended.
Brown stalk-bugs: Tibraca limbativentris STÂL. These shield-bugs can be very harmful and cause dead shoots and empty panicles. By day they often hide between the stems of well tillered plants, close to the water surface. As a rule they are most frequent in higher parts of the field. The height of puncturing by the bugs and the age of the crop determine the extent of the damage.
When a young crop is infested, damage can be restricted by raising the water level to protect shoots from being killed by puncture and to confine the injury to the leaves. This exposes the bugs more to the action of insecticides. Recommended chemicals are methyl parathion 40% EC and, to a less degree, malathion 50% EC at 1 to 1.5 litre in 50 litres liquid per ha. Spraying should take place early in the morning and should be done with care, especially in older crops so that the insecticide can penetrate well through the foliage to the plant base.
Seed bugs: Oebalus poecilus (DALL.). These bugs often cause considerable damage (see table 70, p. 249). In an early attack (in the milk stage) damage results in loss mainly of yield, whereas after a late attack (in the dough stage) loss is mainly of quality. The life cycle of this insect takes about a month; the principal hosts are
158
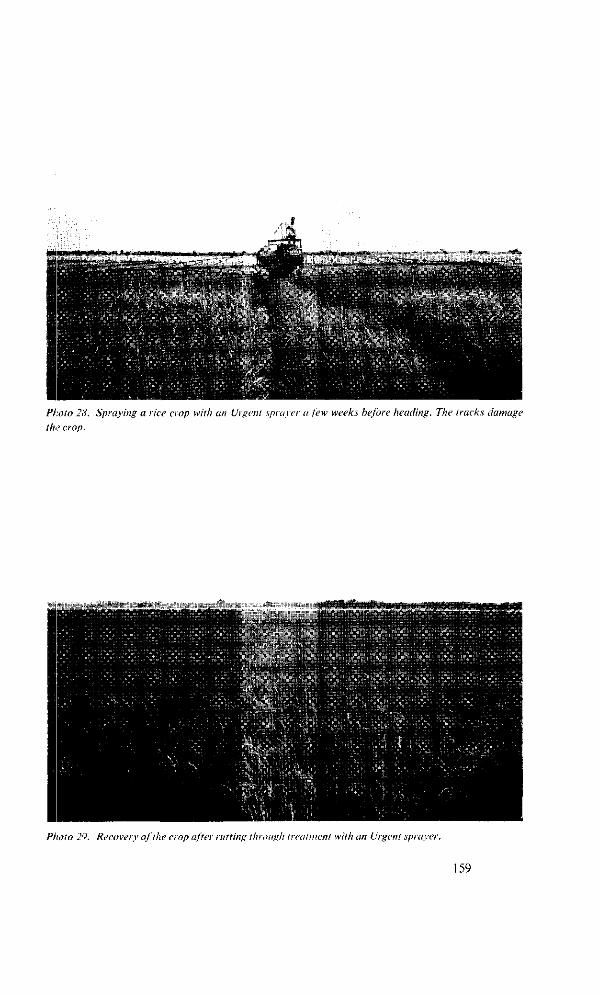
- n*r*-— my > n y ^ .
—fr-J Ç -
'Vijp
Photo 28. Spraying a rice crop with an Urgent sprayer a Jew weeks before heading. The tracks damage
the crop.
*#i%Mj
Photo 2''). Recovery of the crop after rutting through 1 real ment with an Urgent sprayer.
159
Echinoehloa crus-pavonis (H.B.K.) SCHULT, and Hymenachne amplexicaulis ( RUDGE)
NÉES. The former species occurs frequently on fallow land, but in some fields also
among rice. Hymenachne amplexicaulis is chiefly found on dams.
The control of seed bugs should be directed towards preventing the build-up of a
large population on these host plants from where they can migrate to neighbouring
rice fields. This can be done by a timely tillage of the fallow land, by rolling the dams
regularly with a weed-cutter and by controlling sources of infestation with malathion
50% EC or methyl parathion 40% EC at 2 and 1 litres, respectively, in 25 to 50 litres
water per ha. In rice fields malathion 50% EC of Dipterex SP 80 (1.5 kg/ha) is rec
ommended, but a dust of 8 to 10 kg malathion 4 % per ha can also be applied.
Till 1964 chemical control of these bugs was often unsatisfactory. This was because
a large-scale control could not possibly be carried out by hand, the working width of
the motor dusters was usually not sufficient and the use of Urgent sprayers entailed
severe losses of yield. Treatment from the air provided the best solution.
Spider mites: Acarina sp. Damage from spider mites, resulting in a reduced photo-
synthetic capacity of the plant, occurs chiefly during dry and sunny periods. The infes
tation generally spreads from the borders of the field. The crop is usually attacked by
these mites at an advanced age.
Control should be carried out preferably in the early morning, when dew is still on
the leaves. Methyl parathion 40% EC and malathion 50% EC are recommended as
pesticides at 1 and 2 litres per ha, respectively. Sometimes 2 ml wetting agent per litre
water is added to ensure a better effect. Dusting with 10 kg methyl parathion 2 % per
ha also produced good results, if done early in the morning.
9.2.3 Other pests
Snails: Pomacea spp. Among the snails Pomacea dolioides REEVE is by far the most
important; Pomacea glauca L. occurs to a much smaller extent. They are among the
worst pests of mechanical cultivation of rice in Surinam because they graze vast
numbers of young sprouts. The damage arises chiefly during the first three weeks
after sowing while the fields are submerged. Damage can be prevented by draining so
that the snails become less active and may burrow into the soil; but this measure is
usually impractical because the weed problem becomes serious.
The control of snails in past years (by BHC or copper sulphate) has been described
by VAN DINTHER (1956) and DE W I T (1960). A summary including the more recent
research was given by VAN DINTHER and STUBBS (1965). Since 1961 control has been
almost exclusively by Na-PCP 8 5 % ; it proved highly effective under field conditions.
Before it is applied, the fields must have been under water for a couple of days so that
snails in the soil become active and creep to the surface. Shortly before or after the
last puddling an aqueous solution of the chemical at 3 to 4 kg Na-PCP per ha is
sprayed onto water of 10 to 15 cm deep. The field ditches are usually treated separately
160
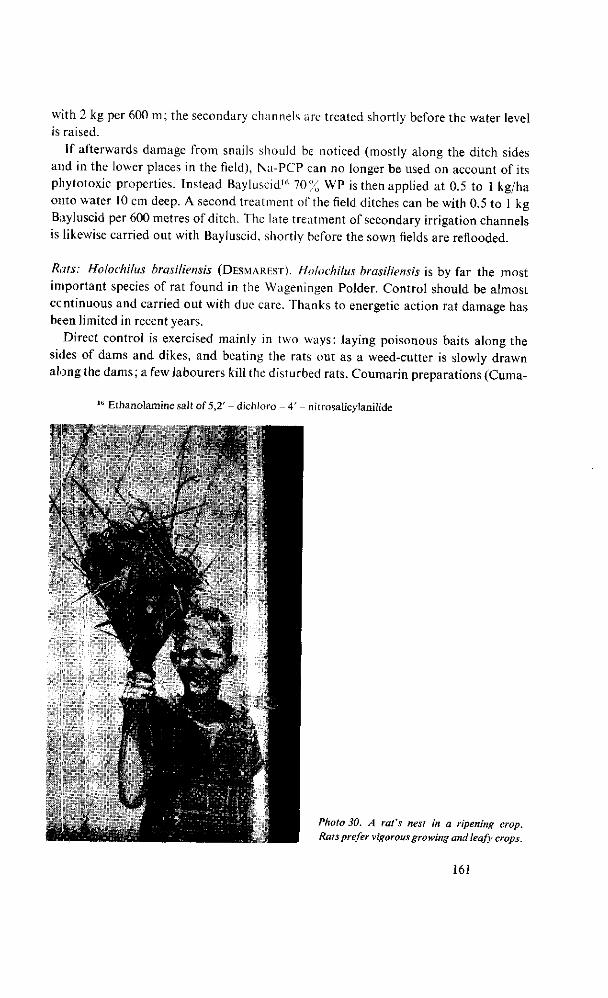
with 2 kg per 600 m ; the secondary channels are treated shortly before the water level is raised.
If afterwards damage from snails should be noticed (mostly along the ditch sides and in the lower places in the field), Na-PCP can no longer be used on account of its phytotoxic properties. Instead Bayluscid16 70% WP is then applied at 0.5 to 1 kg/ha onto water 10 cm deep. A second treatment of the field ditches can be with 0.5 to 1 kg Bayluscid per 600 metres of ditch. The late treatment of secondary irrigation channels is likewise carried out with Bayluscid, shortly before the sown fields are reflooded.
Rats: Holochilus brasiliensis (DESMAREST). Holochilus brasiliensis is by far the most important species of rat found in the Wageningen Polder. Control should be almost continuous and carried out with due care. Thanks to energetic action rat damage has been limited in recent years.
Direct control is exercised mainly in two ways: laying poisonous baits along the sides of dams and dikes, and beating the rats out as a weed-cutter is slowly drawn along the dams; a few labourers kill the disturbed rats. Coumarin preparations (Cuma-
16 Ethanolamine salt of 5 , 2 ' - dichloro - 4 ' - nitrosalicylanilide
Photo 30. A rat's nest in a ripening crop. Rats prefer vigorous growing and leafy crops.
161
kill and Racumin 57) are almost exclusively used for bait; the powder is mixed with
rough rice (1:19). The wooden shelters that had at one time been used were later re
placed by bamboo internodes, but in recent years predominant use has been made of
small plastic bags. The laying of baits (preferably in sheltered places) should be
started as soon as possible after sowing. The operation with weed-cutters has striking
ly proved its effectiveness in the course of the years: during a heavy infestation in 1962,
for example, more than 100,000 rats were killed in two months. This method cannot be
used, however, under very wet conditions.
If young rice still suffers heavy attacks by rats, a mixture of Malariol oil with 2 %
Endrin 20% EC is used, which in an undiluted state, to the amount of 15 to 25 litres
per ha, is sprayed around the threatened spots. On account of the phytotoxic action
of this compound the liquid is squirted into the water in a thin jet. Rats can be kept
out of older crops by treating the border strips of the field with this compound.
Birds: Dendrocygna autumnalis discolor SCLATER ÜW/SALVIN, andPorphyrula martinica
(L.). The Dendrocygna ducks (locally called wisi-wisi) can cause widespread devasta
tion after sowing when they alight in swarms at night on to the flooded fields, trampl
ing the seedlings, pulling them up and destroying them. They show a preference for
places where there is little standing water. Damage can therefore be substantially
reduced by either draining the field completely or putting it under some 20 cm water.
Effective use is made also of carbide guns placed around the threatened fields. Shoot
ing of these ducks is necessary as a further check. When the crop is about three weeks
old the risk of damage is past.
The purple fowl Porphyrula martinica (locally called blauki-panki) is a rather un
gainly flier which, as it alights on a flowering or ripening crop, breaks and bruises
many culms and panicles. These marsh fowls are mostly found in scattered groups
in older crops, where they also build their nests, breaking many stalks and panicles to
serve as a temporary roost. Appreciable losses in yield and quality may thus result.
Effective control has not yet proved possible.
9.3 Summary
Varieties, cultural practices, soil and climate are involved in a physiological disease
attributed to a poor physical condition of the soil and to accumulation of toxic re
duction products near the roots of rice. This disease may appear at different times and
in different degrees, and is often associated with fungal infection. I t can inflict severe
losses in yield and quality. Since the course of this physiological disorder is hard to
predict and there is no effective remedy, control must be preventive.
Direct control of some fungus diseases was promising with 20% DU-TER wettable
powder. A single spraying of SML 140/5 or SML 140/10 as soon as infection ap
peared increased yield by an average of 250 to 300 kg/ha. Yet, partly because such
responses in yield were not accompanied by improvements in grain quality, treatment
162
of' the crop with Urgent spraying machines was not economically justified. With aeroplanes, chemical control is more economic, particularly when combined with insect control. For a large-scale chemical control of fungus diseases, however, much information on the epidemiology of the common pathogens is still lacking.
Ways of combating a vast number of pests have improved considerably. One improvement was Urgent sprayers, which had an action width of 20 m. The disadvantages inherent in this equipment were eliminated in 1964 and 1965 by changing over to aeroplanes. The majority of pests, which have been briefly discussed, could be successfully controlled from the air.
163
10 The cropping system
10.1 Introduction
When the Prince Bernhard Polder was laid out, the intention was to cultivate rice in the major rainy season (main cropping season) and to reserve the off-season for the cultivation of other short-duration crops. The culture of dry crops, however, yielded disappointing results, and more and more attention came to be devoted to the off-season culture of rice. With rice as a second crop poor results were at first obtained; but as years went by the yields increased rapidly (fig. 5, p. 12). During 1950 to 1953 the average yield of an off-season crop in the Prince Bernhard Polder was only 50% of that of a main crop, but in the two following periods of four years this percentage rose to 72 and 97, respectively.
Since 1956 it has been customary in the Prince Bernhard Polder, after cultivating a main crop on 100 % of the area, to sow about a third of this with rice again in October for an off-season or autumn crop. For lack of irrigation water this distribution of the two crops was not always possible each year, but could be more or less realized as an average over some years. During 1957 to 1963 an average of 98.7% of the available land grew a main crop and 32.4% an off-season one. This works out as an average occupation of the area by rice of 131.1 %.
At Wageningen, during the first few years after reclamation, 25% of the area usually had rice in the off-season, after which the percentage was raised to about 35 in 1959 and 1960. Chiefly for economic reasons, the rice crops have been more equally divided between the two seasons ever since 1961, the ratio adopted being 75% of the area with a main crop and 50% with an autumn crop. Over the years 1957 to 1963, 88.9 % of the area was used for a main crop, followed by an off-season crop covering 36.3% of the area under cultivation (125.2% in all).
As a green manure favourable results were gained over a number of years with Crotalaria quinquefolia L. (TEN HAVE, 1959c); but from 1962 on, this crop was seriously infected with a Fusarium wilt so culture was discontinued. A suitable substitute has yet to be found, so that the area not intended for rice was left fallow.
Below follows, first, a discussion of the results of some experiments on date of sowing and of a rotation trial, after which the cropping systems adopted at Wageningen and in the Prince Bernhard Polder will be discussed.
164
10.2 Date-of-sowing experiments
10.2.1 Material and methods
In 1952 Van der Meulen started a study of sowing date on Skrivimankoti and seven American varieties to ascertain the effect of natural day-length on the behaviour of these varieties. Every five weeks seed was sown in pots, after which the seedlings, at the age of 35 days, were transplanted into a field covered with wire netting. At a spacing of 25 cm each way and with one plant per 'hill', 6 x 6 plants were grown of ea;h variety. Border rows were excluded from the data. The day of emergence of the first panicle of a plant was regarded as the flowering date. The experiment lasted eighteen months. Since at that time pests were inadequately controlled and the area was too small to avoid a serious deterioration of the soil, the results (apart from the notes on flowering) were of limited value.
In 1957 and 1958 the author carried out a similar study with Nickerie, in which at intervals of 15 days a plot of 20 m2 was sown at 90 kg/ha on a field covered likewise wi th one-inch wire netting. The day on which about 30 % of the plants had headed was adopted as the flowering date. Neither in this experiment could reliable data on tillering, plant height and grain yield be obtained because the soil was not given sufficient opportunity to recover after harvesting.
In 1961 the work was resumed with Skrivimankoti (Skk) and SML 81b as test varieties. In view of the experience gained with the earlier experiments a different working method was applied which made it possible (thanks also to a better control of pests) to collect more data of higher reliability. The plants were raised in galvanized iron cans (40 cm diameter, 50 cm high) which had been sunk into the ground to a depth of about 40 cm. In February 1961 these cans (64 in all) were filled up to 40 cm with earth from a rice field. To protect the treatments from rats and birds they were screened with large, portable metal cages with half-inch wire netting.
First sowing in this experiment was on 17 April 1961 and every three weeks thereafter seed was germinated in petri dishes, and after five days the seedlings were set out. During the next few weeks a sufficient number were kept in reserve to provide ten plants per pot. Both varieties were twice replicated. When the plants were large enough, the water was kept 8 cm deep throughout growth. Only while nitrogen was applied (at 56 days) was the soil drained for a few days. For each sowing date the final removal of the water was timed according to the length of the growth period of the later maturing variety, about ten days before the panicles of that variety were reaped.
To ensure an approximately equal initial condition of the soil for all sowings, the fallow pots were covered with corrugated sheets at night and during rainy weather. This practice was started on 12 June 1961. During the fallow period the soil was worked a few times down to a depth of 15 cm. On the sowing date pots were flooded; four days later there was some light puddling and the water was drained off.
The date was noted when half the plants had headed. From three weeks onward the
165
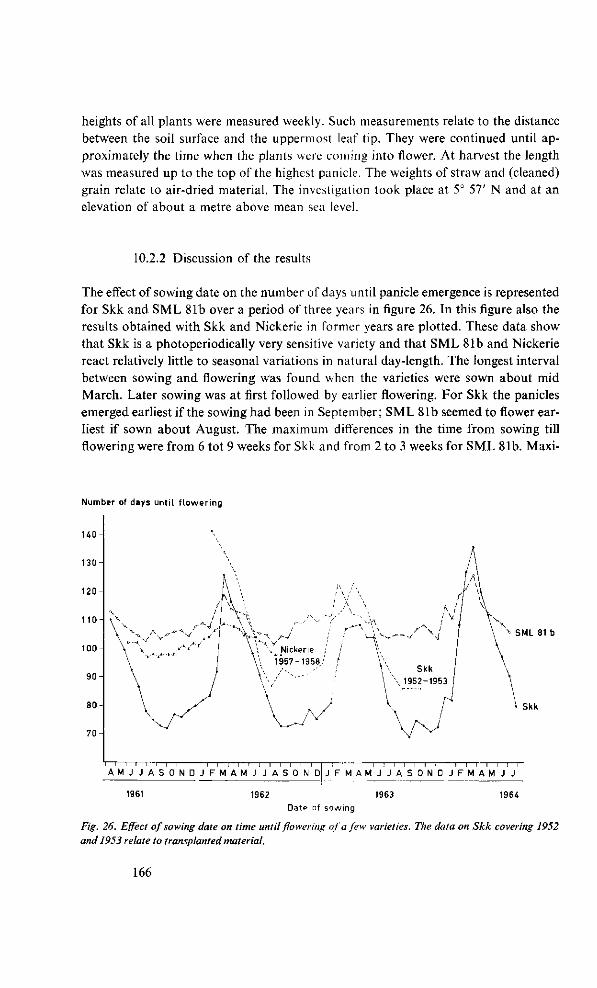
heights of all plants were measured weekly. Such measurements relate to the distance between the soil surface and the uppermost leaf tip. They were continued until approximately the time when the plants were coming into flower. At harvest the length was measured up to the top of the highest panicle. The weights of straw and (cleaned) grain relate to air-dried material. The investigation took place at 5° 57' N and at an elevation of about a metre above mean sea level.
10.2.2 Discussion of the results
The effect of sowing date on the number of days until panicle emergence is represented for Skk and SML 81b over a period of three years in figure 26. In this figure also the results obtained with Skk and Nickerie in former years are plotted. These data show that Skk is a photoperiodically very sensitive variety and that SML 81b and Nickerie react relatively little to seasonal variations in natural day-length. The longest interval between sowing and flowering was found when the varieties were sown about mid March. Later sowing was at first followed by earlier flowering. For Skk the panicles emerged earliest if the sowing had been in September; SML 81b seemed to flower earliest if sown about August. The maximum differences in the time from sowing till flowering were from 6 tot 9 weeks for Skk and from 2 to 3 weeks for SML 81b. Maxi-
Number of days until f lowering
U 0 -
130
1 20
110-
100-
90-
8 0 -
7 0 -
^ SML 81 b
Skk
I I I I I 1 1 1 1 1 1 1 1 1 1 1 1 1 1 1 1 •• ' ' 1 ! 1 1 1 1 ~
A M J J A S O N D J F M A M J J A S O N D J F M A M J J A S O N D —i—i—i—i—i—i—r J F M A M J J
1961 1964 1962 1963 Date of sowing
Fig. 26. Effect of sowing date on time until flowering of a few varieties. The data on Skk covering 1952
and 1953 relate to transplanted material.
166
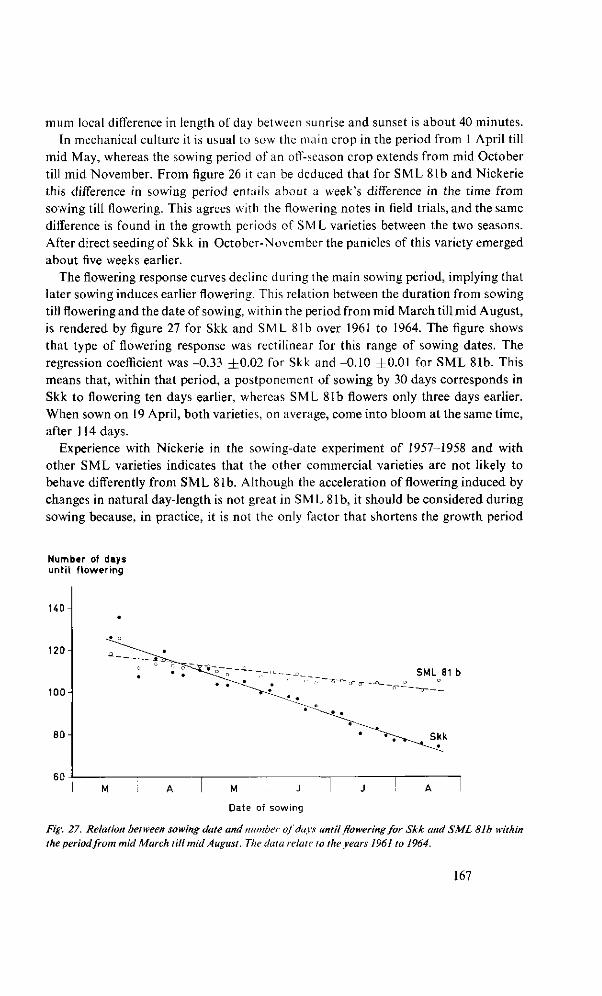
mum local difference in length of day between sunrise and sunset is about 40 minutes. In mechanical culture it is usual to sow the main crop in the period from 1 April till
mid May, whereas the sowing period of an off-season crop extends from mid October till mid November. From figure 26 it can be deduced that for SML 81b and Nickerie this difference in sowing period entails about a week's difference in the time from sowing till flowering. This agrees with the flowering notes in field trials, and the same difference is found in the growth periods of SML varieties between the two seasons. After direct seeding of Skk in October-November the panicles of this variety emerged about five weeks earlier.
The flowering response curves decline during the main sowing period, implying that later sowing induces earlier flowering. This relation between the duration from sowing till flowering and the date of sowing, within the period from mid March till mid August, is rendered by figure 27 for Skk and SML 81b over 1961 to 1964. The figure shows that type of flowering response was rectilinear for this range of sowing dates. The regression coefficient was -0.33 ±0.02 for Skk and -0.10 ±0.01 for SML 81b. This means that, within that period, a postponement of sowing by 30 days corresponds in Skk to flowering ten days earlier, whereas SML 81b flowers only three days earlier. When sown on 19 April, both varieties, on average, come into bloom at the same time, after 114 days.
Experience with Nickerie in the sowing-date experiment of 1957-1958 and with other SML varieties indicates that the other commercial varieties are not likely to behave differently from SML 81b. Although the acceleration of flowering induced by changes in natural day-length is not great in SM L 81b, it should be considered during sowing because, in practice, it is not the only factor that shortens the growth period
Number of days until flowering
UO
120
100
80
60
SML 81 b
Skk
M A I M J I J ! A
Date of sowing
Fig. 27. Relation between sowing date and number of days until flowering for Skk and SML 81b within the period from mid March till mid August. The data relate to the years 1961 to 1964.
167
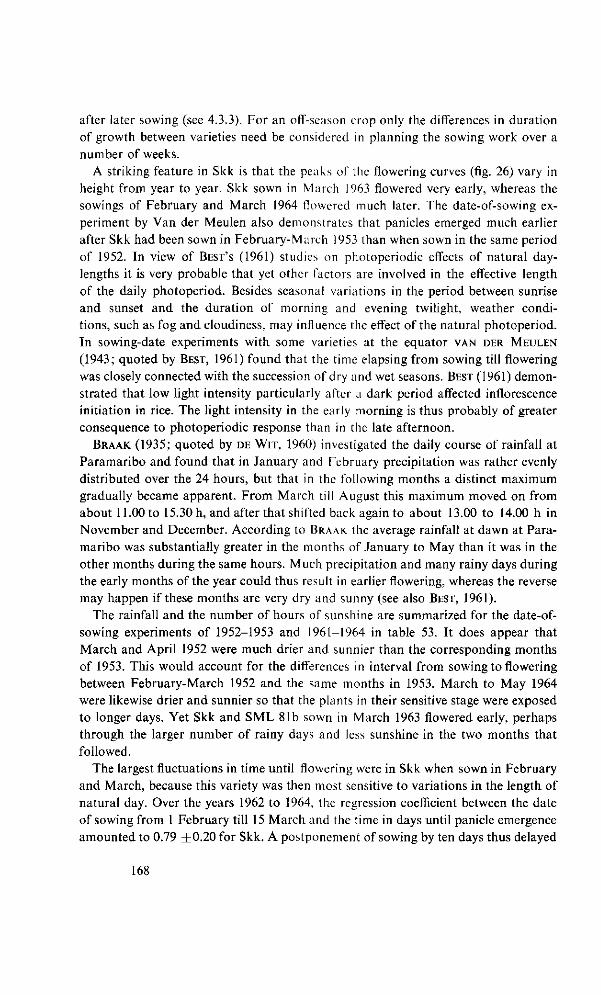
after later sowing (see 4.3.3). For an off-season crop only the differences in duration
of growth between varieties need be considered in planning the sowing work over a
number of weeks.
A striking feature in Skk is that the peaks of the flowering curves (fig. 26) vary in
height from year to year. Skk sown in March 1963 flowered very early, whereas the
sowings of February and March 1964 flowered much later. The date-of-sowing ex
periment by Van der Meulen also demonstrates that panicles emerged much earlier
after Skk had been sown in February-March 1953 than when sown in the same period
of 1952. In view of BEST'S (1961) studies on photoperiodic effects of natural day-
lengths it is very probable that yet other factors are involved in the effective length
of the daily photoperiod. Besides seasonal variations in the period between sunrise
and sunset and the duration of morning and evening twilight, weather condi
tions, such as fog and cloudiness, may influence the effect of the natural photoperiod.
In sowing-date experiments with some varieties at the equator VAN DER MEULEN
(1943; quoted by BEST, 1961) found that the time elapsing from sowing till flowering
was closely connected with the succession of dry and wet seasons. BEST (1961) demon
strated that low light intensity particularly after a dark period affected inflorescence
initiation in rice. The light intensity in the early morning is thus probably of greater
consequence to photoperiodic response than in the late afternoon.
BRAAK (1935; quoted by DE W I T , 1960) investigated the daily course of rainfall at
Paramaribo and found that in January and February precipitation was rather evenly
distributed over the 24 hours, but that in the following months a distinct maximum
gradually became apparent. From March till August this maximum moved on from
about 11.00 to 15.30 h, and after that shifted back again to about 13.00 to 14.00 h in
November and December. According to BRAAK the average rainfall at dawn at Para
maribo was substantially greater in the months of January to May than it was in the
other months during the same hours. Much precipitation and many rainy days during
the early months of the year could thus result in earlier flowering, whereas the reverse
may happen if these months are very dry and sunny (see also BEST, 1961).
The rainfall and the number of hours of sunshine are summarized for the date-of-
sowing experiments of 1952-1953 and 1961-1964 in table 53. It does appear that
March and April 1952 were much drier and sunnier than the corresponding months
of 1953. This would account for the differences in interval from sowing to flowering
between February-March 1952 and the same months in 1953. March to May 1964
were likewise drier and sunnier so that the plants in their sensitive stage were exposed
to longer days. Yet Skk and SML 81b sown in March 1963 flowered early, perhaps
through the larger number of rainy days and less sunshine in the two months that
followed.
The largest fluctuations in time until flowering were in Skk when sown in February
and March, because this variety was then most sensitive to variations in the length of
natural day. Over the years 1962 to 1964, the regression coefficient between the date
of sowing from 1 February till 15 March and the time in days until panicle emergence
amounted to 0.79 ±0 .20 for Skk. A postponement of sowing by ten days thus delayed
168
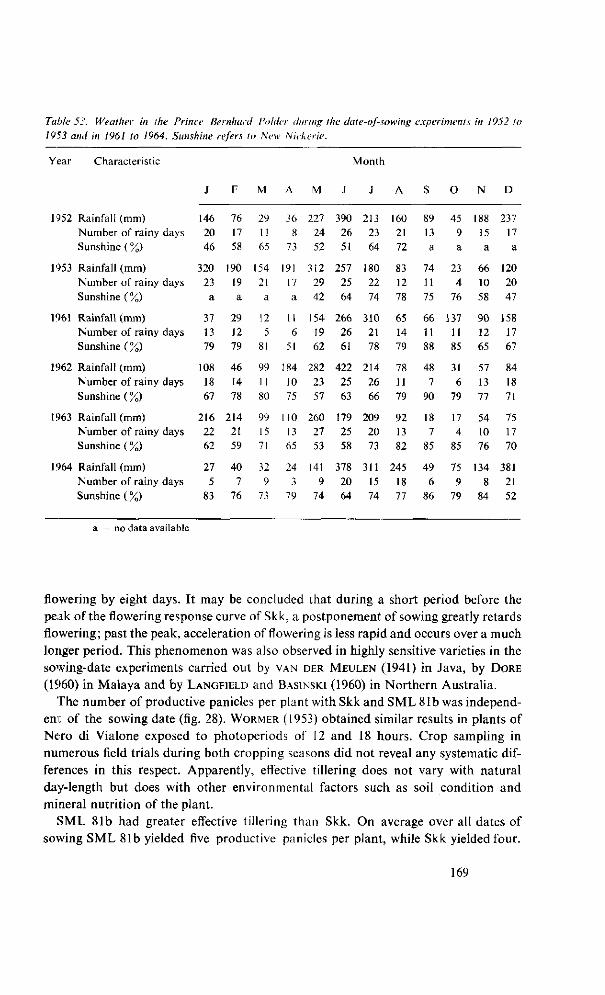
Table 5:'. Weather in the Prince Bernhard Polder during the date-of-sowing experiments in 1952 to
1953 and in 1961 to 1964. Sunshine refers to New Niekerie.
Year Characteristic
1952 Rainfall (mm) Number of rainy days
Sunshine (%)
1953 Rainfall (mm)
Number of rainy days
Sunshine (%)
1961 Rainfall (mm) Number of rainy days
Sunshine (%)
1962 Rainfall (mm)
Number of rainy days
Sunshine (%)
J
146
20 46
320
23
a
37 13 79
108
18 67
F
76
17 58
190
19
a
29 12
79
46
14
78
M
29
11 65
154 21
a
12 5
81
99
11
80
A
36 8
73
191
17
a
11 6
51
184 10
75
M
227
24
52
312
29
42
154
19 62
282
23 57
Month
J
390 26
51
257
25
64
266 26
61
422
25
63
J
213
23 64
180
22
74
310 21
78
214
26
66
A
160 21 72
83 12
78
65 14
79
78 11
79
S
89
13 a
74
11
75
66 11 88
48 7
90
O
45
9 a
23
4 76
137 11
85
31
6
79
N
188 15
a
66
10
58
90 12
65
57
13
77
D
237 17
a
120
20 47
158 17
67
84
18
71
1963 Rainfall (mm) 216 214 99 110 260 179 209 92 18 17 54 75 Number of rainy days 22 21 15 13 27 25 20 13 7 4 10 17 Sunshine (%) 62 59 71 65 53 58 73 82 85 85 76 70
1964 Rainfall (mm) Number of rainy days
Sunshine ( %)
a = no data available
27
5 83
40
7 76
32
9 73
24
3 79
141
9 74
378
20 64
311
15
74
245
18 77
49
6 86
75
9 79
134
8 84
381
21
52
flowering by eight days. It may be concluded that during a short period before the
peak of the flowering response curve of Skk, a postponement of sowing greatly retards
flowering; past the peak, acceleration of flowering is less rapid and occurs over a much
longer period. This phenomenon was also observed in highly sensitive varieties in the
sowing-date experiments carried out by VAN DER MEULEN (1941) in Java, by DORE
(1960) in Malaya and by LANGFIELD and BASINSKI (1960) in Northern Australia.
The number of productive panicles per plant with Skk and SML 81b was independ
ent of the sowing date (fig. 28). WORMER (1953) obtained similar results in plants of
Nero di Vialone exposed to photoperiods of 12 and 18 hours. Crop sampling in
numerous field trials during both cropping seasons did not reveal any systematic dif
ferences in this respect. Apparently, effective tillering does not vary with natural
day-length but does with other environmental factors such as soil condition and
mineral nutrition of the plant.
SML 81b had greater effective tillering than Skk. On average over all dates of
sowing SML 81b yielded five productive panicles per plant, while Skk yielded four.
169
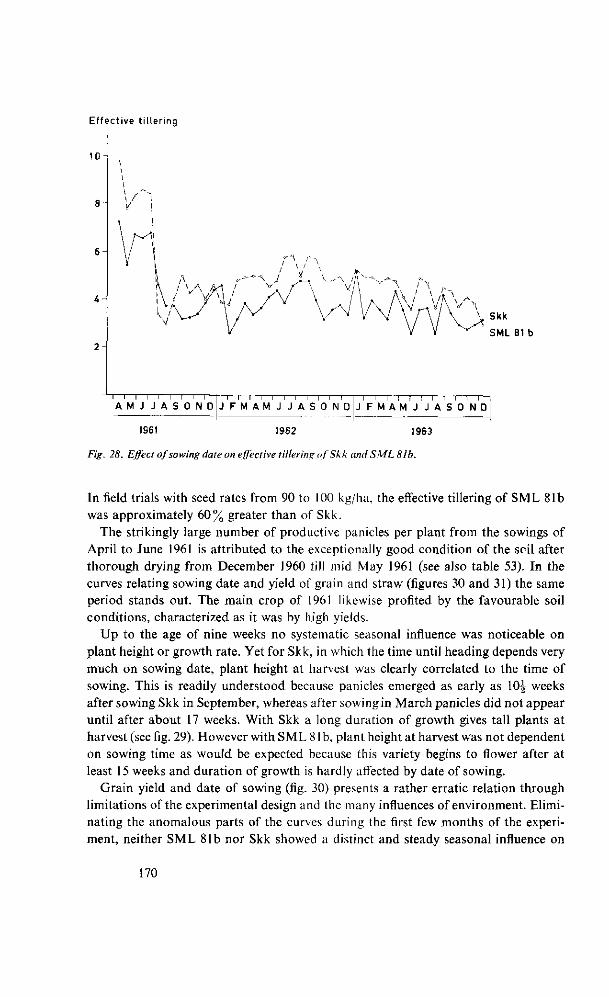
Effect ive t i l ler ing
10
i — i — I — I — i — i — i — i — i —
A M J J A S O N D " ~ I I I — I — 1 — l — I — I — l — I — ! — I — I — : — l — I — i — I — I — i — i — I — I —
J F M A M J J A S O N D J F M A M J J A S O N D
1961 1962 1963
Fig. 28. Effect of sowing date on effective tillering of Skk and SML 81b.
In field trials with seed rates from 90 to 100 kg/ha, the effective tillering of SML 81b was approximately 60% greater than of Skk.
The strikingly large number of productive panicles per plant from the sowings of April to June 1961 is attributed to the exceptionally good condition of the soil after thorough drying from December 1960 till mid May 1961 (see also table 53). In the curves relating sowing date and yield of grain and straw (figures 30 and 31) the same period stands out. The main crop of 1961 likewise profited by the favourable soil conditions, characterized as it was by high yields.
Up to the age of nine weeks no systematic seasonal influence was noticeable on plant height or growth rate. Yet for Skk, in which the time until heading depends very much on sowing date, plant height at harvest was clearly correlated to the time of sowing. This is readily understood because panicles emerged as early as \Q\ weeks after sowing Skk in September, whereas after sowing in March panicles did not appear until after about 17 weeks. With Skk a long duration of growth gives tall plants at harvest (see fig. 29). However with SML 81 b, plant height at harvest was not dependent on sowing time as would be expected because this variety begins to flower after at least 15 weeks and duration of growth is hardly affected by date of sowing.
Grain yield and date of sowing (fig. 30) presents a rather erratic relation through limitations of the experimental design and the many influences of environment. Eliminating the anomalous parts of the curves during the first few months of the experiment, neither SML 81b nor Skk showed a distinct and steady seasonal influence on
170
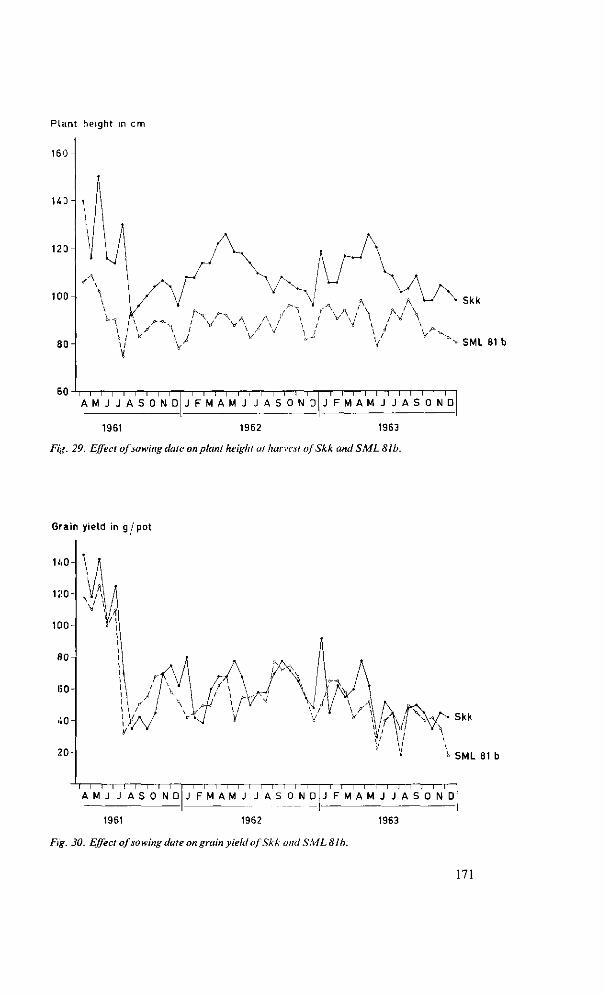
Plant height in cm
160 -
UD
120
100
80
Skk
SML 81 b
6 0 - ' T — i — i — i — i — i — i — i — i — A M J J A S O N D
- 1 — i — i — ! — i — i — i — i — ! — i — r — J F M A M J J A S O N D
— i — i — i — i — i — i — i — i — i — i — r -
J F M A M J J A S O N D
1961 1962 1963
Fig. 29. Effect of sowing date on plant height at harvest of Skk and S ML 8 lb.
Grain yield in g /pot
140-
120-
100-
110
IÎ0
-i0-
20-
Skk
>> S M L 81 b
i — i — i — i — i — i — i — i — i —
A M J J A S O N D J F M A M J J A S O N D ~ i — i — i — I — i — i — i — i — i — i — i — J F M A M J J A S O N D
1961 1962 1963
Fig. 30. Effect of sowing date on grain yield of Skk and S ML 8 lb.
171
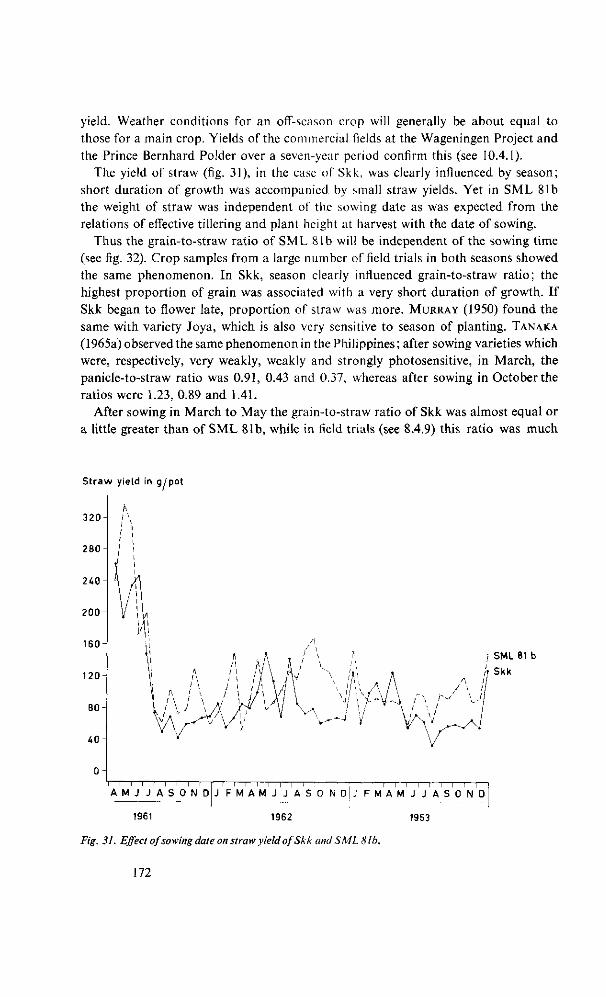
yield. Weather conditions for an off-season crop will generally be about equal to those for a main crop. Yields of the commercial fields at the Wageningen Project and the Prince Bernhard Polder over a seven-year period confirm this (see 10.4.1).
The yield of straw (fig. 31), in the case of Skk, was clearly influenced by season; short duration of growth was accompanied by small straw yields. Yet in SML 81b the weight of straw was independent of the sowing date as was expected from the relations of effective tillering and plant height at harvest with the date of sowing.
Thus the grain-to-straw ratio of SML 81b will be independent of the sowing time (see fig. 32). Crop samples from a large number of field trials in both seasons showed the same phenomenon. In Skk, season clearly influenced grain-to-straw ratio; the highest proportion of grain was associated with a very short duration of growth. If Skk began to flower late, proportion of straw was more. MURRAY (1950) found the same with variety Joya, which is also very sensitive to season of planting. TANAKA
(1965a) observed the same phenomenon in the Philippines; after sowing varieties which were, respectively, very weakly, weakly and strongly photosensitive, in March, the panicle-to-straw ratio was 0.91, 0.43 and 0.37, whereas after sowing in October the ratios were 1.23, 0.89 and 1.41.
After sowing in March to May the grain-to-straw ratio of Skk was almost equal or a little greater than of SML 81b, while in field trials (see 8.4.9) this ratio was much
St raw yield in g /pot
3 2 0 -
280
2 4 0 -
2 0 0 -
160
120
80
4 0 -
— i — i — i — i — i — i — i — i —
A M J J A S O N D i i i i i i l i : ' ;—' ' — i — i — i — i — i — i — i — i — I —
J F M A M J J A S O N D J F M A M J J A S O N D
1961 1962 1963
Fig. 31. Effect of sowingdateonstraw yieldof Skk and SMLSIb.
172
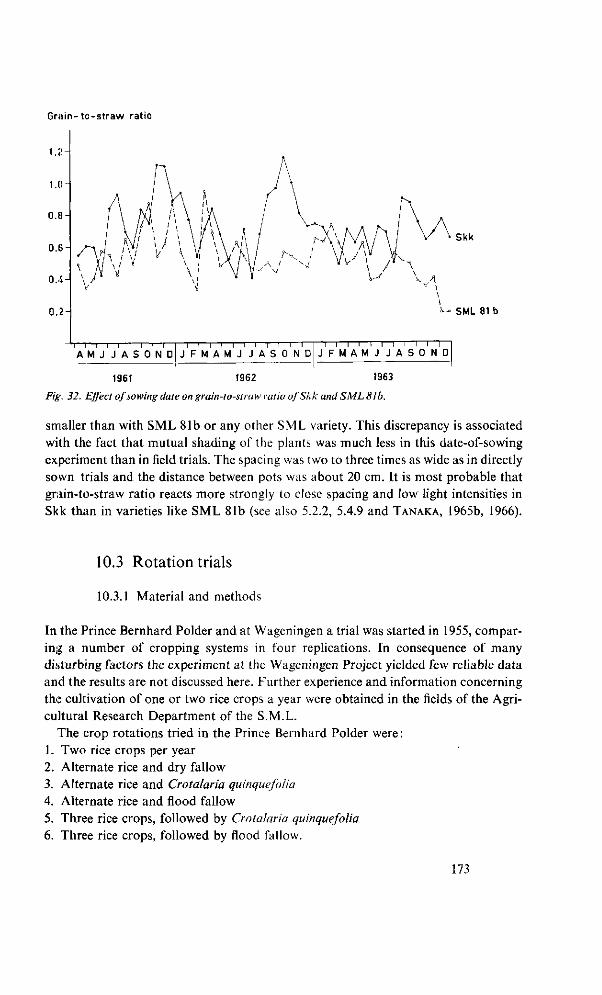
Grain- to-straw ratio
1.;:
1.0-
0.1!
0.6
0.4-
0.:2-
Skk
^- SML 81 b
i — i — i — i — i — i — i — i — i —
A M J J A S O N D —I—I—I—I—I—I—1—I—1—I—!~ J F M A M J J A S O N D
- i — i — l — r J F M A M J J A S O N D
1961 1962 1963
Fig: 32. Effect of sowing date on grain-to-straw ratio of Skk and SML 8 lb.
smaller than with SML 81b or any other SML variety. This discrepancy is associated with the fact that mutual shading of the plants was much less in this date-of-sowing experiment than in field trials. The spacing was two to three times as wide as in directly sown trials and the distance between pots was about 20 cm. It is most probable that grain-to-straw ratio reacts more strongly to close spacing and low light intensities in Skk than in varieties like SML 81b (see also 5.2.2, 5.4.9 and TANAKA, 1965b, 1966).
10.3 Rotation trials
10.3.1 Material and methods
In the Prince Bernhard Polder and at Wageningen a trial was started in 1955, comparing a number of cropping systems in four replications. In consequence of many disturbing factors the experiment at the Wageningen Project yielded few reliable data and the results are not discussed here. Further experience and information concerning the cultivation of one or two rice crops a year were obtained in the fields of the Agricultural Research Department of the S.M.L.
The crop rotations tried in the Prince Bernhard Polder were: 1. Two rice crops per year 2. Alternate rice and dry fallow 3. Alternate rice and Crotalaria quinquefolia 4. Alternate rice and flood fallow 5. Three rice crops, followed by Crotalaria quinquefolia 6. Three rice crops, followed by flood fallow.
173
The plots were 14 x 65 m. Dima was used first; but when part of the sowing failed in 1961 and a renewed preparation of the experimental field seemed unjustified, SML 242 was successfully sown in addition, and this variety was kept ever since. About 75 kg seed per ha was sown in 1955 and 1956, but later 100 kg/ha. The main crop was sown between 16 April and 2 May and autumn crops between 17 October and 11 November. After harvest dry fallows were tilled once or twice and then left till preparation for seeding. Crotalaria quinquefolia was sown in mid November and four months later worked in by dry tillage. The plots earmarked for flood fallow were put under some 5 cm water in mid December and worked from three to four weeks afterwards. Although we intended to keep these fields under deep water until the next sowing, this method failed in most cases through lack of water, so that the soil had afterwards to be tilled and prepared for sowing afresh. To ensure an even and weed-free seedbed all fields, except successful flood fallows, were finally puddled.
Nitrogen was applied to half of each plot. After Crotalaria or flood fallow nitrogen dressings several times lowered grain yields of Dima; as nitrogen rates of the other treatments were not always optimum either, the only results discussed are of the untreated sub-plots. Reaping was by sickle, and the threshed straw was burnt on the dams. More nutrients were therefore removed from the soil than is normal in practice.
10.3.2 Yield results
The yields are summarized in table 54. For the double-cropping system information is available for seven main crops and seven off-season crops; the average yields were 2219 and 2483 kg/ha, respectively. Date-of-sowing results, discussed in the preceding section, suggest that the difference between main and off-seasons in yield is due chiefly to differences in the soil at sowing. The field was drained, on average, for 36 days before sowing the main crop but for 58 days before an off-season crop. During these periods weather was usually less favourable to a proper drying of the soil in the former case than in the latter; the daily precipitation was 2.4 and 1.9 mm, respectively. Dry tillage in September-October would therefore yield better results than in March-April.
Yields have not fallen off in the trial with cultivation of two rice crops a year. The same experience was gained in the fields of the Agricultural Research Department, where rice has sometimes been grown twice per year, from 12 to 14 times consecutively. The great variability of the yield figures is ascribed mainly to differences in the soil condition at sowing, to the weather during the growth and to the incidence of diseases and pests.
Rice alternating with dry fallow (treatment 2) yielded an average of 3904 kg/ha over seven years compared with main crops under a continuous cropping system of only 2219 kg/ha. Thus dry fallow markedly improved the next rice crop, while an off-season crop adversely affected yield of the next main crop. The yield of a main crop after rice (treatment 1) has fluctuated widely from year to year between 30 to 84% of a similar crop after fallow (treatment 2).
174
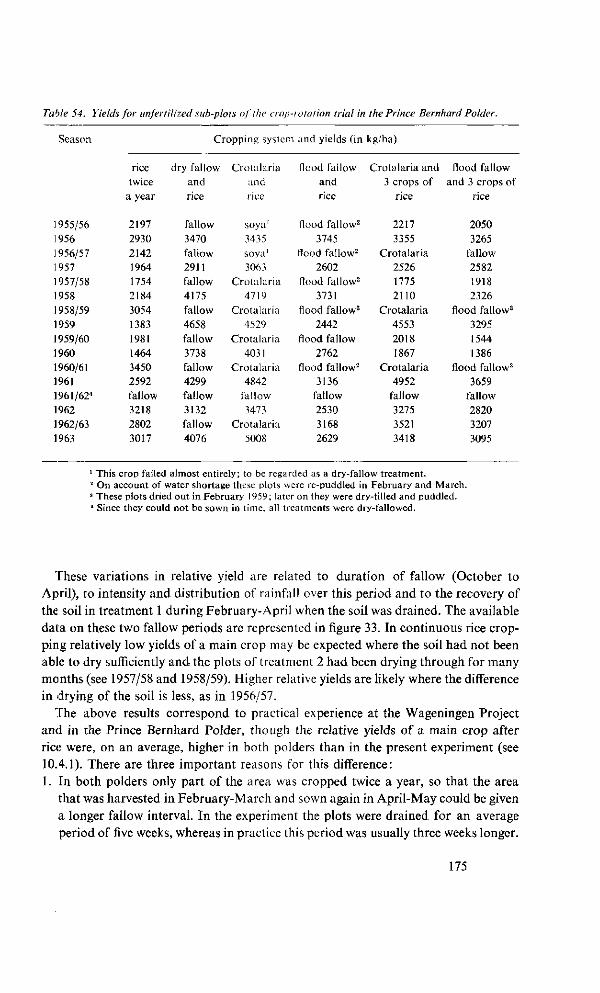
Table 54. Yields for unfertilized sub-plots oj the crop-rotation trial in the Prince Bernhard Polder.
Season Cropping system and yields (in kg/ha)
rice dry fallow Crotalaria twice and and
a year rice rice
flood fallow Crotalaria and flood fallow and 3 crops of and 3 crops of rice rice rice
1955/56 1956 1956/57 1957 1957/58 1958 1958/59 1959 1959/60 1960 1960/61 1961 1961/624
1962 1962/63 1963
2197 2930 2142 1964 1754 2184 3054 1383 1981 1464 3450 2592 fallow 3218 2802 3017
fallow 3470 fallow 2911 fallow 4175 fallow 4658 fallow 3738 fallow 4299 fallow 3132 fallow 4076
soya' 3435 soya' 3063
Crotalaria 4719
Crotalaria 4529
Crotalaria 4031
Crotalaria 4842
fallow 3473
Crotalaria 5008
flood fallow2
3745 Hood fallow2
2602 flood fallow2
3731 flood fallow3
2442 flood fallow
2762 flood fallow2
3136 fallow 2530 3168 2629
2217 3355
Crotalaria 2526 1775 2110
Crotalaria 4553 2018 1867
Crotalaria 4952
fallow 3275 3521 3418
2050 3265
fallow 2582 1918 2326
flood fallow3
3295 1544 1386
flood fallow2
3659 fallow 2820 3207 3095
This crop failed almost entirely; to be regarded as a dry-fallow treatment. ' On account of water shortage these plots were re-puddled in February and March. 1 These plots dried out in February 1959 ; later on they were dry-tilled and puddled. ' Since they could not be sown in time, all treatments were dry-fallowed.
These variations in relative yield are related to duration of fallow (October to April), to intensity and distribution of rainfall over this period and to the recovery of the soil in treatment 1 during February-April when the soil was drained. The available data on these two fallow periods are represented in figure 33. In continuous rice cropping relatively low yields of a main crop may be expected where the soil had not been able to dry sufficiently and the plots of treatment 2 had been drying through for many months (see 1957/58 and 1958/59). Higher relative yields are likely where the difference in drying of the soil is less, as in 1956/57.
The above results correspond to practical experience at the Wageningen Project and in the Prince Bernhard Polder, though the relative yields of a main crop after rice were, on an average, higher in both polders than in the present experiment (see 10.4.1). There are three important reasons for this difference: 1. En both polders only part of the area was cropped twice a year, so that the area
that was harvested in February-March and sown again in April-May could be given a longer fallow interval. In the experiment the plots were drained for an average period of five weeks, whereas in practice this period was usually three weeks longer.
175
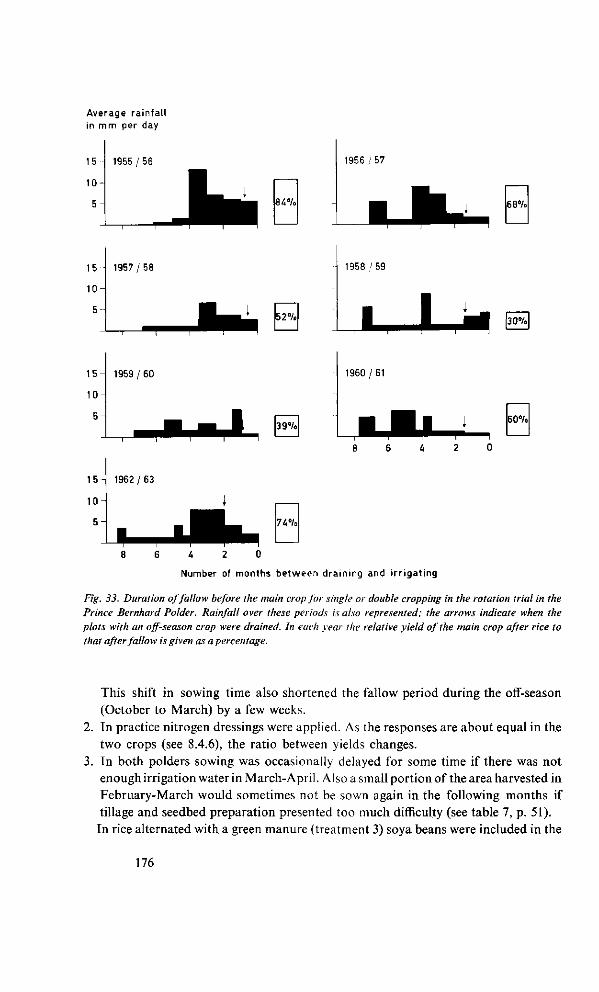
Average ra infal l in mm per day
84%
1956 /57
68°/<
52%
1958 '59
Li_i 30%
39%
1960/61
60%
74%
6 4 2 0
Number of months between draining and i r r igat ing
Fig. 33. Duration of fallow before the main crop for single or double cropping in the rotation trial in the Prince Bernhard Polder. Rainfall over these periods is also represented; the arrows indicate when the plots with an off-season crop were drained. In each year the relative yield of the main crop after rice to that after fallow is given as a percentage.
This shift in sowing time also shortened the fallow period during the off-season (October to March) by a few weeks.
2. In practice nitrogen dressings were applied. As the responses are about equal in the two crops (see 8.4.6), the ratio between yields changes.
3. In both polders sowing was occasionally delayed for some time if there was not enough irrigation water in M arch-A pril. Also a small portion of the area harvested in February-March would sometimes not be sown again in the following months if tillage and seedbed preparation presented too much difficulty (see table 7, p. 51). In rice alternated with a green manure (treatment 3) soya beans were included in the
176
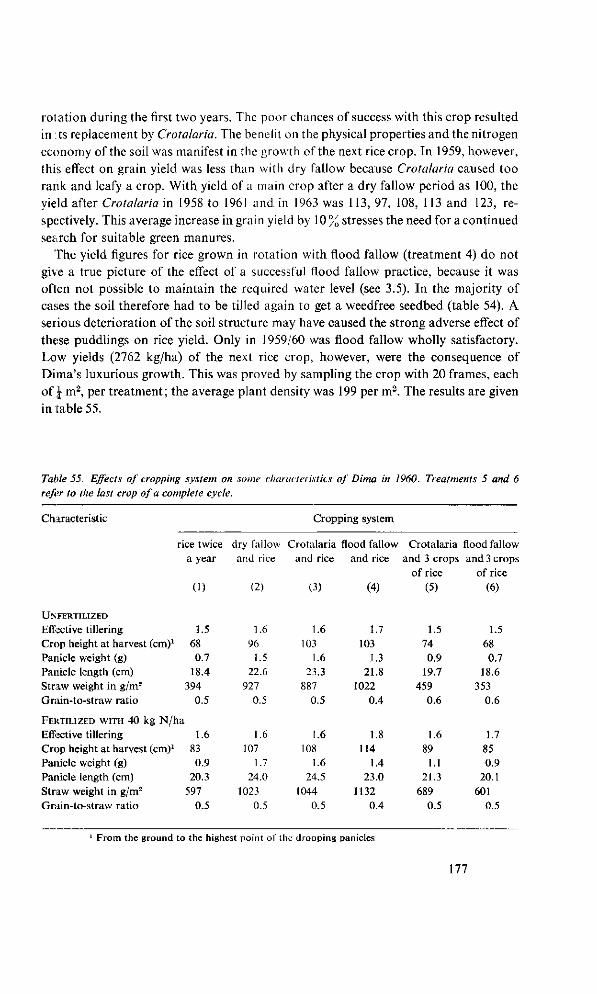
rotation during the first two years. The poor chances of success with this crop resulted in : ts replacement by Crotalaria. The benefit on the physical properties and the nitrogen economy of the soil was manifest in the growth of the next rice crop. In 1959, however, this effect on grain yield was less than with dry fallow because Crotalaria caused too rank and leafy a crop. With yield of a main crop after a dry fallow period as 100, the yield after Crotalaria in 1958 to 1961 and in 1963 was 113, 97, 108, 113 and 123, respectively. This average increase in grain yield by 10% stresses the need for a continued search for suitable green manures.
The yield figures for rice grown in rotation with flood fallow (treatment 4) do not give a true picture of the effect of a successful flood fallow practice, because it was often not possible to maintain the required water level (see 3.5). In the majority of cases the soil therefore had to be tilled again to get a weedfree seedbed (table 54). A serious deterioration of the soil structure may have caused the strong adverse effect of these puddlings on rice yield. Only in 1959/60 was flood fallow wholly satisfactory. Low yields (2762 kg/ha) of the next rice crop, however, were the consequence of Dima's luxurious growth. This was proved by sampling the crop with 20 frames, each of j m2, per treatment; the average plant density was 199 per m2. The results are given in table 55.
Table 55. Effects of cropping system on some characteristics of Dima in 1960. Treatments 5 and 6 refer to the last crop of a complete cycle.
Characteristic Cropping system
rice twice dry fallow Crotalaria flood fallow Crotalaria flood fallow a year and rice and rice and rice and 3 crops and 3 crops
of rice of rice (1) (2) (3) (4) (5) (6)
UNFERTILIZED
Effective tillering Crop height at harvest (cm)1
Panicle weight (g) Panicle length (cm) Straw weight in g/m2
Grain-to-straw ratio
FERTILIZED WITH 40 kg N/ha
Effective tillering Crop height at harvest (cm)1
Panicle weight (g) Panicle length (cm) Straw weight in g/m2
Grain-to-straw ratio
1.5 68 0.7
18.4
394 0.5
1.6 83 0.9
20.3
597 0.5
1.6 96 1.5
22.6
927 0.5
1.6 107
1.7 24.0
1023
0.5
1.6 103
1.6 23.3
887 0.5
1.6 108
1.6 24.5
1044
0.5
1.7 103
1.3 21.8
1022
0.4
1.8 114
1.4 23.0
1132
0.4
1.5 74 0.9
19.7
459 0.6
1.6 89 1.1
21.3
689 0.5
1.5 68 0.7
18.6
353 0.6
1.7 85 0.9
20.1
601 0.5
From the ground to the highest point of the drooping panicles
177
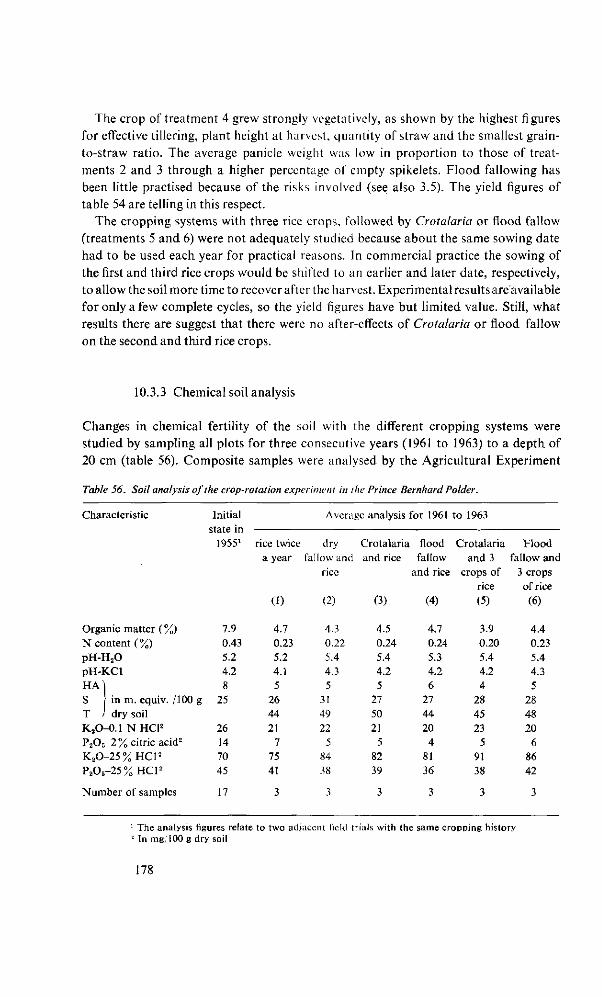
The crop of treatment 4 grew strongly vegetatively, as shown by the highest figures for effective tillering, plant height at harvest, quantity of straw and the smallest grain-to-straw ratio. The average panicle weight was low in proportion to those of treatments 2 and 3 through a higher percentage of empty spikelets. Flood fallowing has been little practised because of the risks involved (see also 3.5). The yield figures of table 54 are telling in this respect.
The cropping systems with three rice crops, followed by Crotalaria or flood fallow (treatments 5 and 6) were not adequately studied because about the same sowing date had to be used each year for practical reasons. In commercial practice the sowing of the first and third rice crops would be shifted to an earlier and later date, respectively, to allow the soil more time to recover after the harvest. Experimental results are available for only a few complete cycles, so the yield figures have but limited value. Still, what results there are suggest that there were no after-effects of Crotalaria or flood fallow on the second and third rice crops.
10.3.3 Chemical soil analysis
Changes in chemical fertility of the soil with the different cropping systems were studied by sampling all plots for three consecutive years (1961 to 1963) to a depth of 20 cm (table 56). Composite samples were analysed by the Agricultural Experiment
Table 56. Soil analysis of the crop-rotation experiment in the Prince Bernhard Polder.
Characteristic Initial state in
19551 rice twice
Average analysis for 1961 to 1963
dry Crotalaria flood Crotalaria Flood a year fallow and and rice fallow and 3 fallow and
rice and rice crops of 3 crops rice of rice
(1) (2) (3) (4) (5) (6)
Organic matter ( %) N content (%) pH-H 2 0 pH-KCl HA) S J in m. equiv. /100 g T 1 dry soil K2O-0.1 N HCl2
P 20 5 -2 % citric acid2
K 2 0 - 2 5 % H C 1 2
P 2 0 5 - 2 5%HC1 2
Number of samples
7.9 0.43 5.2 4.2 8
25
26 14 70 45
17
4.7 0.23 5.2 4.1 5
26 44 21
7 75 41
3
4.3 0.22 5.4 4.3 5
31 49 22
5 84 38
3
4.5 0.24 5.4 4.2 5
27 50 21
5 82 39
3
4.7 0.24 5.3 4.2 6
27 44 20 4
81 36
3
3.9 0.20 5.4 4.2 4
28 45 23
5 91 38
3
4.4 0.23 5.4 4.3 5
28 48 20
6 86 42
3
1 The analysis figures relate to two adjacent field trials with the same cropping history 2 In mg, 100 g dry soil
178
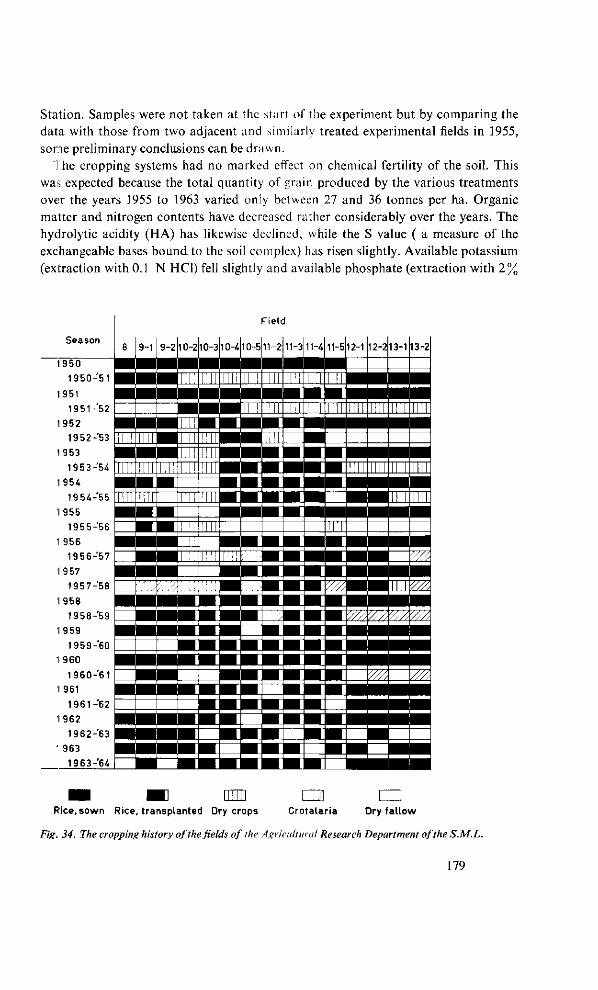
Station. Samples were not taken at the start of the experiment but by comparing the data with those from two adjacent and similarly treated experimental fields in 1955, some preliminary conclusions can be drawn.
The cropping systems had no marked effect on chemical fertility of the soil. This was expected because the total quantity of grain produced by the various treatments over the years 1955 to 1963 varied only between 27 and 36 tonnes per ha. Organic matter and nitrogen contents have decreased rather considerably over the years. The hydrolytic acidity (HA) has likewise declined, while the S value ( a measure of the exchangeable bases bound to the soil complex) has risen slightly. Available potassium (extraction with 0.1 N HCl) fell slightly and available phosphate (extraction with 2%
Season
1950" 1950-51
1951
1951-'52
1952
19 52-53 19 53
1953-54 1954
1954-55
1955
1955-56
1 956
1956-57 19 57
1957-'58 1958
19 58-59 19 59
1959-60 'I960
1960 -61
1961
1961-62
1962
19 62-63
' 963
19 63-64
Field
8 I 3—1 [ 9-2|l0—2I1O—3|l0 Ä|l0-B|ll—2111—3111— 111—5112—1
C3 • Rice, sown Rice, transplanted Dry crops Crotalaria Dry fallow
Fig. 34. The cropping history of the fields of the Agricultural Research Department of the S.M.L.
179
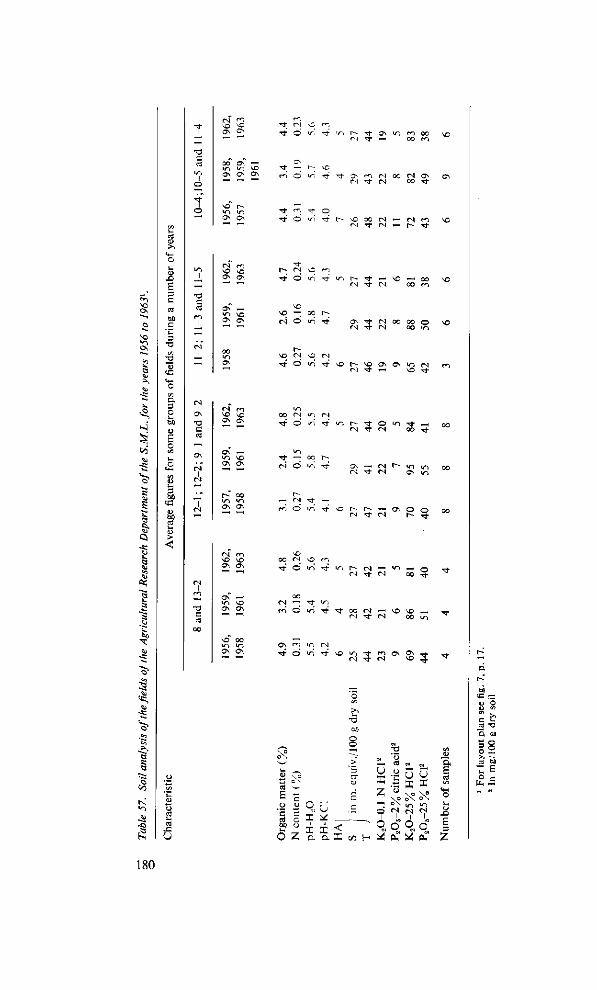
eu
co
'S»
*,
a
to
-o
fi
S
o, 3 O
SO
> <
CS
U
13
O
c!
O N ON
00 0\ -IT) ^ ^O O N O N O N
"o «o O N O N
CM m O N O N
O N - H <n vo ON O N
ra oo CM O N CM CO ^
CM r-i NO vo ON os
ON -H in o OS ON
<N m ON ON
O N —< in ^o O N O N
\0 OO «o in O N O N
J- O <n Tj- r- \D
f- <N \D r*~>
Tf O ^ 't »n r~~ -rt — NO — OO C M -3" CM oo m
CS ö
VD <"M ^O CM rfr Ö in Tt NO ON ON »n CM
T - -H NO -<fr
00 CM tn (N 't Ö ^i ^ IO h
CM* Ö
O V~i tf _ H
CM oo Tt
— M ^ -M O in' Tt
00 M ^ f, ^ Ó in ^
9 O
CM — «"> — O rj- CM 00 Tt
^t oo CM •—' NO \D —i CM ^ CM 00 in
0\ n in (N rt ö <n Tf <o in TJ- . m O N O N _*•
Tf CM NO 5
o z x x < a a X
t/î H
'u s i „
•c o G £ x ffi \o o\ o^ o N in "^ M M N
q o q eu ^ eC
o o
OH
S CS cß
<*-H
O t-H
CU .O
E 3
Z
cd ÖD
- 6 fc »S
180
citric acid) has markedly decreased. In phosphate fertilizer trials (see 8.5.1) the same phenomenon was observed.
The above conclusions accord fairly well with the soil analysis of some fields of the Agricultural Research Department, whose cropping system is represented by figure 34. According to the frequency of growing rice in these fields, they are divided into four groups. As in the crop-rotation experiment, sampling for the soil analysis was to a depth of 20 cm. The withdrawal of nutrients from the soil was here greater because the use of the transplanting method and the shifting of sowing dates gave higher annual yields per ha.
The changes in organic matter and nitrogen contents were rather erratic (table 57), although they did not decline after all. There were no appreciable changes in pH values. The hydrolytic acidity and the cation-exchange capacity declined slightly, while the S value tended to rise. The decrease in available phosphate is striking, whereas available potassium was almost static. No important differences were noticed during the sampling period in figures of the soil analysis through frequency of cropping to rice. In commercial production, where rice has not yet been grown more than four times in three years and where only the grain is removed, a more frequent cultivation of rice should not have important consequences to chemical indices of soil fertility.
10.4 The cropping systems at Wageningen and in the Prince Bernhard Polder
As was already stated (10.1), the whole area of both polders was at first cropped with rice- during the main season and 25 to 30 % of the area in the off-season. In the Prince Bernhard Polder this system is still in use, but at Wageningen a change was made to 75 % in the main season and 50 % in the off-season. This change in cropping ratio was introduced chiefly for reasons of business economics and organization. The remaining area was left fallow in both polders.
The experiments discussed give some insight into the two cropping systems but are insufficient to decide whether a higher occupation with rice is economically attractive and agronomically justified. Analysis of yield data of the commercial fields in both polders give more information on the advantages and disadvantages of different cropping systems. For the first few years systematic differences are overshadowed by numerous fortuitous factors, and the yield figures for the first few years are therefore of little value to the present investigation. Data have been processed from 1957 onwards, omitting the first rice crop after reclamation. For the Wageningen Polder the yields of the ninth and tenth ranges (fig. 6, p. 14) were moreover eliminated because that area had only recently been brought under culture and part of the crop was sometimes damaged by salt, The results relate to cultural practices during that period; improvements in varietal stock, drainage, tillage, culture of green manures and water supply will influence the choice of cropping system.
181
10.4.1 Analysis of yields of commercial fields
One of the first questions in evaluating different cropping systems is whether the number of previous rice crops17 affects the yield of the next crop. Data on this subject were gathered from both polders over a period of seven years. At a cropping ratio of 100 and 25 % for the two seasons, a third successive rice crop is grown on 25 % of the area during the main season ; at a cropping system of 75 and 50%, rice recurs not more than twice in succession on the same field (see lig. 35, p. 188). These schemes have sometimes been disturbed so that rice has been grown during a larger number of consecutive seasons on the same field. The information available on this matter is summarized in table 58, in which the average yield of the areas that have already been cropped once or twice with rice since the previous six-month fallow is put at 100. It appears from the table that yields of the third to fifth crops were not generally below those of the second rice crop following a fallow period. This implies that the influence of such a fallow period does not, as a rule, extend beyond the crop immediately following it. In the crop-rotation experiment (10.3.2) results pointed in the same direction.
The variability of the relative yields in table 58 is partly set down to the circumstance that in one season the weather after a rice harvest is much more favourable to tillage and recovery of the soil than in another (see also chapter 3). In practice, therefore, the number of preceding crops should not be the criterion whether particular fields should again be sown with rice. This decision should depend on tillage and regeneration of the physical properties of the soil after the preceding harvest.
A second question for the evaluation of cropping systems is the adverse effect of an off-season crop on the yield of the next main crop. In the crop-rotation experiment the yield of a main crop after rice averaged about 60 % of that after a seven-month fallow (10.3.2), but in practice at Wageningen and the Prince Bernhard Polder the percentage was higher (table 59). For the first few years varieties were not distinguished because the yields were about equal and the distribution of the varieties over the sown area was rather arbitrary. For the later years the yields of SML 81b are stated separately, because this variety has different properties. Yet its response differed indistinctly so relative yields per season may be averaged. Over seven years it was found that the relative yield of a main crop after rice for the Wageningen Polder was 76% and for the Prince Bernhard Polder 88 % of one preceded by a fallow period of about six months.
This disparity in relative yields between the two polders is attributed in part to the fact that during the early years tilling operations were, on the whole, carried out better in the Prince Bernhard Polder than at the Wageningen Project (see chapter 3). The difference was enhanced by the results of 1963, when the greater part of the area
17 By this is meant the number of times that rice was cultivated since the previous fallow period of half a year.
182
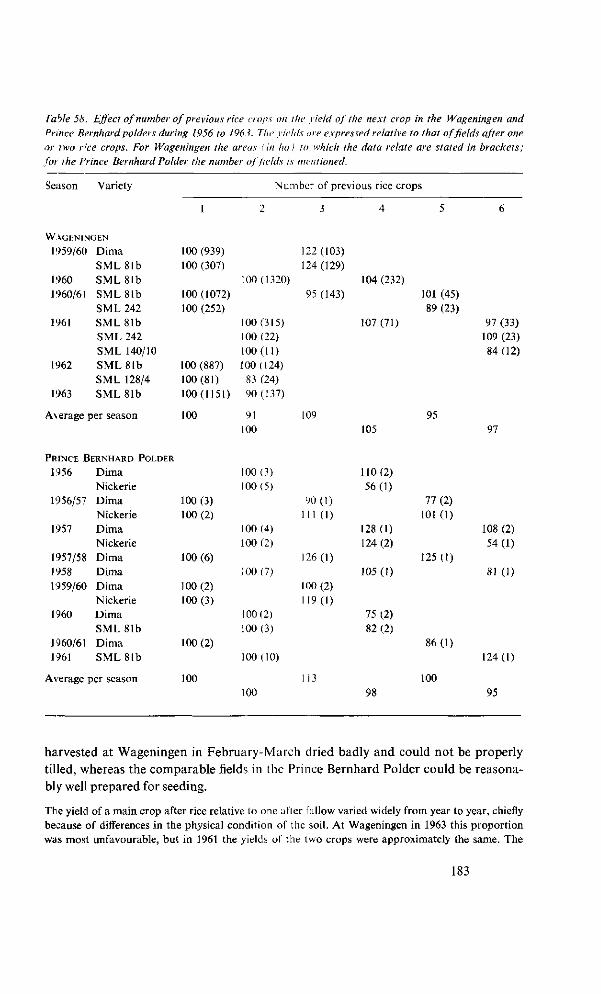
Table 58. Effect of number of previous rice crops on the yield of the next crop in the Wageningen and Prince Bernhard polders during 1956 to 1963. The yields are expressed relative to that of fields after one or two rice crops. For Wageningen the areas (in hul to which the data relate are stated in brackets; for the Prince Bernhard Polder the number of fields is mentioned.
Season Variety Number of previous rice crops
WAGENINGEN
1959/60 Dima 100(939) 122(103) S M L 8 l b 100(307) 124(129)
1960 S M L 8 I b 100(1320) 104(232) 1960/61 S M L 8 l b 100(1072) 95(143) 101(45)
S ML 242 100(252) 89(23) 1961 SML81b 100(315) 107(71) 97(33)
SML242 100(22) 109(23) SML 140/10 100(11) 84(12)
1962 SML 81b 100(887) 100(124) SML 128/4 100(81) 83(24)
1963 SML 81b 100(1151) 90(137)
Average per season 100 91 109 95 100 105 97
P R I N C E B E R N H A R D P O L D E R
1956 Dima 100(3) 110(2) Nickerie 100(5) 56(1)
1956/57 Dima 100(3) 90(1) 77(2) Nickerie 100(2) 111 (1) 101 (1)
1957 Dima 100(4) 128(1) 108(2) Nickerie 100(2) 124(2) 54(1)
1957/58 Dima 100(6) 126(1) 125(1) 1958 Dima 100 (7) 105 (1) 81 (1) 1959/60 Dima 100(2) 100(2)
Nickerie 100(3) 119(1) 1960 Dima 100(2) 75(2)
SML 81b 100(3) 82(2) 1960/61 Dima 100(2) 86(1) 1961 SML 81b 100(10) 124(1)
Average per season 100 113 100 100 98 95
harvested at Wageningen in February-March dried badly and could not be properly tilled, whereas the comparable fields in the Prince Bernhard Polder could be reasonably well prepared for seeding.
The yield of a main crop after rice relative to one after fallow varied widely from year to year, chiefly because of differences in the physical condition of the soil. At Wageningen in 1963 this proportion was most unfavourable, but in 1961 the yields of the two crops were approximately the same. The
183
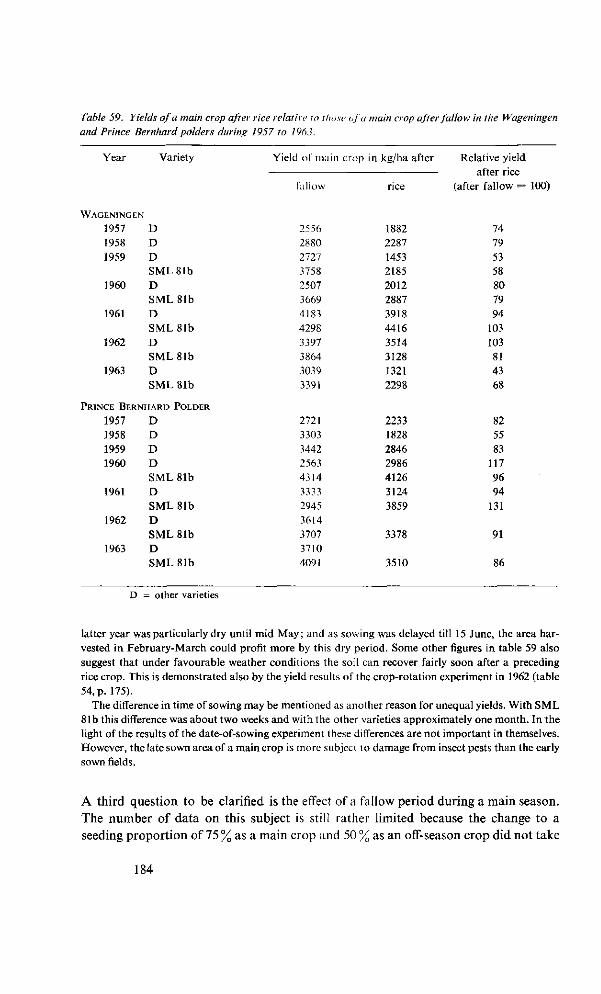
Table 59. Yields of a main crop after rice relative to those of a main crop after fallow in the Wageningen and Prince Bernhard polders during 1957 to 1963.
Year Variety
1957 1958 1959
1960
1961
1962
1963
D D D SML81b D SML 81b D SML 81b D SML 81b D SML 81b
P R I N C E B E R N H A R D P O L D E R
1957 1958 1959 1960
1961
1962
1963
D D D D SML 81b D SML 81b D SML 81b D SML 81b
Yield of main crop in kg/ha after
fallow
2556 2880 2727 3758 2507 3669 4183 4298 3397 3864 3039 3391
2721 3303 3442 2563 4314 3333 2945 3614 3707 3710 4091
rice
1882 2287 1453 2185 2012 2887 3918 4416 3514 3128 1321 2298
2233 1828 2846 2986 4126 3124 3859
3378
3510
Relative yield after rice
(after fallow = 100)
74 79 53 58 80 79 94
103 103 81 43 68
82 55 83
117 96 94
131
91
86
D = other varieties
latter year was particularly dry until mid May; and as sowing was delayed till 15 June, the area harvested in February-March could profit more by this dry period. Some other figures in table 59 also suggest that under favourable weather conditions the soil can recover fairly soon after a preceding rice crop. This is demonstrated also by the yield results of the crop-rotation experiment in 1962 (table 54, p. 175).
The difference in time of sowing may be mentioned as another reason for unequal yields. With SML 81b this difference was about two weeks and with the other varieties approximately one month. In the light of the results of the date-of-sowing experiment these differences are not important in themselves. However, the late sown area of a main crop is more subject to damage from insect pests than the early sown fields.
A third question to be clarified is the effect of a fallow period during a main season. The number of data on this subject is still rather limited because the change to a seeding proportion of 75 % as a main crop and 50 % as an off-season crop did not take
184
place at Wageningen until 1961. In 1961/62, 1962/63 and 1963/64 the relative yield of SML 81b after rice amounted to 93, 99 and 87%, respectively, of the yield after fallow, while the figures for other varieties in the last two seasons were 93 and 103%. Thus, through the cultivation of rice in the main season the yield of the following crop fell, on an average, by 5%. This means that the effect of a fallow period is much more beneficial during October to March than it is in a main season.
It makes comparatively little difference to the cultivation of rice in the off-season whether the land lay fallow during the main season or was cropped with rice, because the period from May till mid August is mostly very wet so that fallow land cannot dry out. Besides, the fallow area cannot derive full benefit from the particularly dry weather in September and October because these fields are sown again in the second part of October.
Under the cropping scheme of 75 + 50% the corresponding rice area is sown in the first half of April and drained in mid August. These fields can then profit more from the dry season because they a.re not sown until early November. In our opinion, therefore, the difference in yield of 5 % is a real basis for further calculations.
Yet a fourth question is the relation between the yields in the two cropping seasons. The most suitable comparison would be between yield of a main crop after fallow and an off-season crop after rice, because these data are more reliable than others. Yet the yields of the two crops cannot be compared outright, since the proportion of varieties was not the same in both; for, ever since the introduction of SML 81b it has been customary to assign it to those fields which were cropped with rice also in the preceding season. Thus an off-season crop after rice would largely consist of SML 81b, while a main crop after fallow would, for the greater part, be of other SML varieties. In itself this might not present an insuperable difficulty if it were ascertained that the yield relation of SML 81b after rice and after fallow was equal to that for other SML varieties (see table 59). Since the yield capacity of SML 81b is substantially higher than that of the other SML varieties, it is therefore necessary to correct for varietal proportions. For the years 1957 and 1958 the same has been done for Dima, because the share of this variety in the various crops would widely fluctuate. For other varieties no correction was considered necessary.
For both polders the average yields were calculated of a main crop after fallow and an off-season crop after rice, specified between SML 81b (or Dima) and the other varieties. These calculations were carried out for seven main crops and an equal number of autumn crops. As checks for comparison those crops were taken which had been sown that same year. Next, two series of comparable yield figures were drawn up. In the first the yields obtained from the main crops were compared with the yields from the off-season crops, calculated on the basis of the same proportions between varieties. The second series started from the yield results of an autumn crop, after which the production from the corresponding main crop was corrected for the same varietal proportion (table 60).
The two calculation methods almost invariably yielded the same results for the Wageningen Polder, while for the Prince Bernhard Polder differences were great in some years. This is explained by the fact that the former polder is more than ten
185
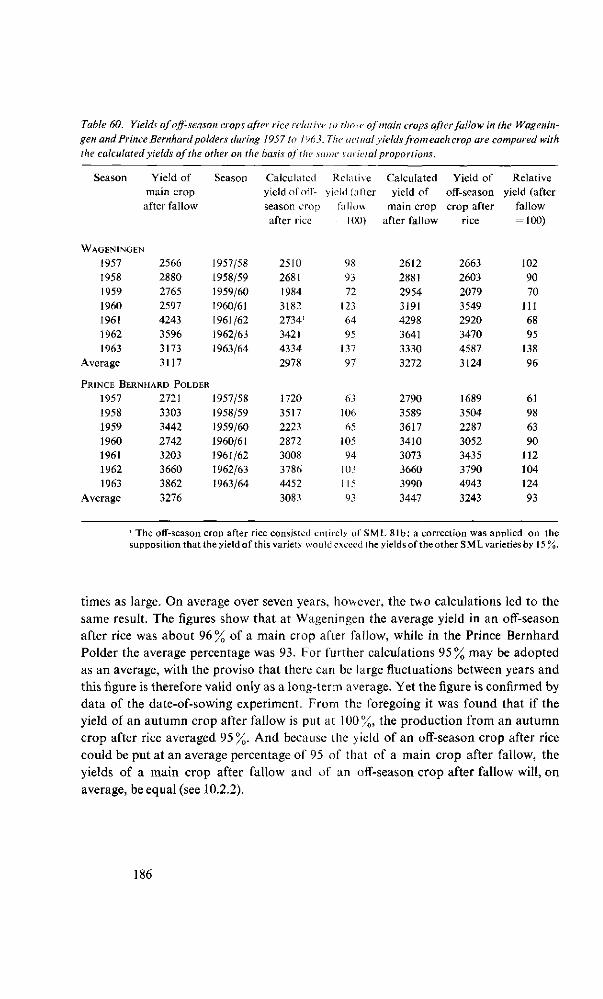
Table 60. Yields of off-season crops after rice relative to those of main crops after fallow in the Wageningen and Prince Bernhard polders during 1957 to 1963. The actual yields from each crop are compared with the calculated yields of the other on the basis of the same varietal proportions.
Season Yield of main crop after fallow
WAGENINGEN
1957 1958 1959 1960 1961 1962 1963
Average
2566 2880 2765 2597 4243 3596 3173 3117
Season
1957/58 1958/59 1959/60 1960/61 1961/62 1962/63 1963/64
P R I N C E B E R N H A R D P O L D E R
1957 1958 1959 1960 1961 1962 1963
Average
2721 3303 3442 2742 3203 3660 3862 3276
1957/58 1958/59 1959/60 1960/61 1961/62 1962/63 1963/64
Calculated yield of offseason crop after rice
2510 2681 1984 3182 2734' 3421 4334 2978
1720 3517 2223 2872 3008 3786 4452 3083
Relative yield (after
fallow 100)
98 93 72
123 64 95
137 97
63 106 65
105 94
103 1 15 93
Calculated yield of
main crop after fallow
2612 2881 2954 3191 4298 3641 3330 3272
2790 3589 3617 3410 3073 3660 3990 3447
Yield of off-season crop after
rice
2663 2603 2079 3549 2920 3470 4587 3124
1689 3504 2287 3052 3435 3790 4943 3243
Relative yield (after
fallow = 100)
102 90 70
111 68 95
138 96
61 98 63 90
112 104 124 93
1 The off-season crop after rice consisted entirely of SML 81b; a correction was applied on the supposition that the yield of this variety would exceed the yields of the other SML varieties by 15%.
times as large. On average over seven years, however, the two calculations led to the same result. The figures show that at Wageningen the average yield in an off-season after rice was about 96% of a main crop after fallow, while in the Prince Bernhard Polder the average percentage was 93. For further calculations 95% may be adopted as an average, with the proviso that there can be large fluctuations between years and this figure is therefore valid only as a long-term average. Yet the figure is confirmed by data of the date-of-sowing experiment. From the foregoing it was found that if the yield of an autumn crop after fallow is put at 100%, the production from an autumn crop after rice averaged 95%. And because the yield of an off-season crop after rice could be put at an average percentage of 95 of that of a main crop after fallow, the yields of a main crop after fallow and of an off-season crop after fallow will, on average, be equal (see 10.2.2).
186
10.4.2 Discussion of some cropping systems
In discussing some rotation systems we shall confine ourselves mainly to the principal agricultural aspects of this problem, ignoring several details that can best be considered under the prevailing circumstances. Costs have not been calculated. Any cropping system should be flexible, as physical condition of the soil materially affects yield and quality of the grain (see chapters 3 and 11). If weather conditions are adverse, it is better to sow a smaller area, whereas in good weather a larger number of fields may be cropped.
Expected yields are based on the assumption that at present at Wageningen and Prince Bernhard Polder an average yield of a main crop after fallow or of an offseason crop after fallow of 3800 kg/ha ( 100%) can be realized. The yield of an autumn crop after rice may then be fixed at 95% or 3610 kg/ha. With an occupation of about 125 % of the area with rice the average yield of a main crop after rice can be put at 85 % of that of a main crop after fallow, provided that the fields which dry badly in March-April are not sown again in May. If so, the average yield of a main crop after rice may be estimated at 3230 kg/ha.
Occupation of 100%. When the whole area has only one crop a year (occupation of 100%), average yield can be estimated at 3800 kg/ha. If rice is grown exclusively as a main crop, work is unevenly distributed and machinery and storage space are used inefficiently. A more even distribution of rice over the two seasons (e.g., 65+35%) goes far to meet these objections, but this system still has two great disadvantages. The overhead costs are heavy with a small rice area and fallowing of large areas in the major wet period (the main season) is not recommended from the viewpoints of water supply, soil improvement and control of diseases, pests and red rice. The aim is therefore to crop part of the area twice a year.
Occupation of J25%. With an occupation of 125%, several cropping schemes can be visualized, under which the estimated total annual yield is invariably 4560 kg/ha. An increase in land occupation by 25% thus causes the annual yield to increase by 20%. The choice of cropping system does not affect the total yield because after a fallow period the yields of a main crop and an off-season crop will be equal. However, the quality of the product does differ between the harvest in September-October and in February-March. The grain quality of an autumn crop is, as a rule, much better than that of a main crop (12.5). This argues in favour of enlarging the area to be sown in October-November at the expense ofthat to be sown in April-May. This will scarcely hamper harvesting, as over eight years ( 1956 to 1963) the average number of operating hours per ha in the Wageningen Polder was the same for a main as for an off-season crop. Over those years the average yields of the two crops were equal, while the precipitation in the chief harvesting months (September and March) was approximately the same. Important differences in lodging between the two crops are considered unlikely; but at New Nickerie the average rainfall over many years was higher for
187
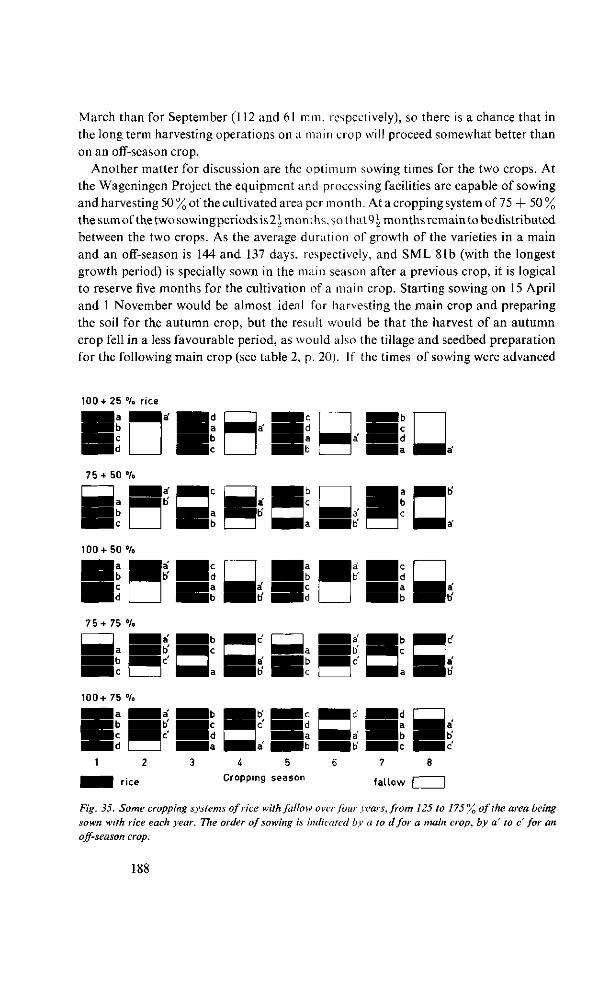
March than for September (112 and 61 mm, respectively), so there is a chance that in the long term harvesting operations on a main crop will proceed somewhat better than on an off-season crop.
Another matter for discussion are the optimum sowing times for the two crops. At the Wageningen Project the equipment and processing facilities are capable of sowing and harvesting 50 % of the cultivated area per month. At a cropping system of 75 + 50 % the sum of the two sowingperiods is 2\ months, so that 9 \ months remain to be distributed between the two crops. As the average duration of growth of the varieties in a main and an off-season is 144 and 137 days, respectively, and SML 81b (with the longest growth period) is specially sown in the main season after a previous crop, it is logical to reserve five months for the cultivation of a main crop. Starting sowing on 15 April and 1 November would be almost ideal for harvesting the main crop and preparing the soil for the autumn crop, but the result would be that the harvest of an autumn crop fell in a less favourable period, as would also the tillage and seedbed preparation for the following main crop (see table 2, p. 20). If the times of sowing were advanced
100 + 25 % rice
75 + 50 %
• - - • - • z 100 + 50 %
l^Ba- 5^2C I I S S a s^Ja- 5^JC I I | | H B b • • b ' • • i d I | i^Bb B B t
75 + 75 %
BH: HB ••Ja • »
100+ 75 %
•a | b •
• • f c • • i d
|a lb' • •
4 5 6 Cropping season fallow
Fig. 35. Some cropping systems of rice with fallow over four years, from 125 to 175% of the area being sown with rice each year. The order of sowing is indicated by a to d for a main crop, by a' to c' for an off-season crop.
188
by a month the reverse picture would result. Therefore, the sowing periods adopted at Wageningen, from 1 April till mid May and from mid October till mid November, may be regarded as best. Optimum sowing periods when two crops are grown per year on part of the area are more fully discussed by DE WIT (1960).
If rice is grown once a year (100% occupation), 12 months are available for the growth of the crop and the ensuing long fallow; but if, on the other hand, two crops a year are grown on the whole area, only six months are, on an average, available for the cultivation of one crop and a short fallow period. For intermediate occupations of the area with rice it is possible to shorten the long fallows in favour of the short ones. The soil is thereby given a better chance to recover before it has again to be sown after a short fallow. In practice, therefore, it is customary to earmark only the earliest reaped area for cropping with rice shortly afterwards, and to fallow the last harvested fields for a long period. Under the 75 , 50 % cropping scheme at Wageningen (see fig. 35) the area sown early in April is subsequently sown again early in November, sc that the interval from sowing to sowing is 7 months. The earliest sown off-season area is sown anew in the first half of May, so that here the interval between sowings is 6| months. This gain of time of 1 and h month, respectively, is achieved at the expense of the long fallow periods, which are shortened by half a month.
With a constant sowing and harvesting capacity of 50% of the area per month, the average time available for the growth of one crop and for the subsequent short fallow diminishes by a week as the occupation of the land with rice is increased by 25 percentage units. The time available for the culture of one crop and the subsequent long fallow will be shortened by half a month as the occupation with rice increases by 25 percentage units. At 175% of area under rice per year the latter period is still 10-|-months; the time for the growth of one crop and the subsequent short fallow is then reduced to 6\ months.
The possibility of shortening the duration of the long fallow period in favour of the short fallow is also closely tied to the duration of sowing periods. By doubling the sowing and harvesting capacity and by shortening the sowing periods by 50% this possibility is likewise reduced to half. Hence there is also an optimum duration for the two sowing periods.
The duration of the short and long fallows has been discussed at some length because it affects the yield expectations. The yield estimates at the beginning of this section are based on an average occupation with rice of about 125%, the average time available, both at Wageningen and in the Prince Bernhard Polder, for the culture of one crop followed by a short or a long fallow being 6 | and \\\ months, respectively. Since the two crops grow for about 140 days, it cannot be expected that a further increase in the occupation with rice will proportionally increase annual yields. Increasing the equipment will not provide a solution either. In the yield estimates above, an increase of the area under rice from 100 to 125 % corresponded with a rise in annual yield of 20%, so that with rectilinear extrapolation the maximum annual yield could be 180% of a single crop per year. For virtually the same period, however, as that on which the yield estimates are based, the crop-rotation experiment shows that rice
189
grown invariably twice a year yielded only 120 % of a main crop after fallow. This is a clear warning against cultivating two crops a year on too much of the area.
Occupation of 150%. If it is decided to change over to the cultivation of 150% of rice per year (see fig. 35), machinery must be increased to prevent the end of harvest time from overlapping the beginning of sowing. If only 50% of the area can be sown and harvested per month, there are only nine months left for growing two crops. Even with harvesting capacity remaining the same, tractors and implements become heavily taxed because the area to be tilled and prepared for seeding during the short fallow period has risen, for both crops, from 25 to 50% of the polder area. More equipment is desirable anyway to be able to sow some more than the planned area in favourable weather without having also to extend the sowing time appreciably. For an average occupation of 150 %, the off-season crop will often have to be larger than 50 or 75 % of the area, because in September-October the chances of satisfactorily tilling and preparing the soil during the short fallow period are greater than they are in March and April. Generally, when cropping 150% of the area with rice per year, as compared with a rotation scheme of 75 + 50%, there is little room for manoeuvre. In what follows this will be discussed more amply.
The change from 125 to 150% occupation with rice has the further consequence that the overall production of a main crop falls off in quality. A poor physical condition of the soil is often accompanied by the occurrence of the physiological disease which adversely affects the milling quality of the grain (see 11.4 and 11.6). This reduction in grain quality of a main harvest is mostly in the lower-yielding fields, whose contribution increases from 25 to 50 % of the area. The yield of a main crop after rice relative to one after fallow (85 % in the present case) may fluctuate greatly from year to year and lower yields usually involve lower quality and higher costs of processing. As under a cropping scheme of 150% of rice per year 50% of the area must, on average, be sown in both seasons after a short period of fallow, the loss of quality referred to above cannot be avoided by enlarging the off-season sowing at the cost of the main crop.
By intensifying the cultivation from 125 to 150 % of the area with rice the further question arises of what should be done if in April part of the area cannot be satisfactorily tilled and prepared for sowing during the short fallow. The chance of this happening is much greater at the beginning of the major wet season than at the end of the major dry season, and this is why only this case is discussed. When cropping is 125% (fig. 35), the problem is fairly simple because, if sowing does take place and the yield of a rice crop after fallow is put at 100, the yield expectations of this area for the main season and the next two seasons will amount to lOOx + 0 + 100. If, on the other hand, sowing is delayed half a year, the estimated yields for three consecutive seasons would be 0 + 100 + 85. As a low value of x also implies loss of quality and cracked grains are less in an off-season crop than in a main crop (see 12.5), the area should not be prepared for sowing but added to the area to be sown in October. The consequences for the division of work and the extension of sowing time are of minor importance,
190
since only a comparatively small number of fields are concerned. This method is preferred to persisting in sowing the area in May-June by delaying sowing date.
At 150% occupation with rice the problem becomes more difficult. If half the planned area can no longer be adequately prepared for sowing during the short fallow in April-May and if the sowing and harvesting capacity is again 50% of the area per month, there are four possible choices: ( 1 ) tilling the area and sowing it; (2) postponing the sowing six months and enlarging the autumn crop accordingly; (3) as (2) but maintaining the autumn sowing at the same size: and (4), a compromise between (2) and (3). The first choice is rarely justified agronomically (low yields and poor grain quality). The second implies that the sowing period for the off-season crop has to be extended by half a month. Delaying the end of sowing by about two weeks is highly indésirable because harvesting and sowing in the next year would then overlap more and the short fallow in March-April would be two weeks shorter. Advancing the commencing date would also be unattractive, because the first sown area would then have benefited too little from the major dry season ; but it is still considered better than delaying. Under a cropping scheme of 75 — 75%, full compensation during an offseason is not justified because the whole area would then be under rice and no field improvement (see chapter 2) could be carried out. The next year the grower would find considerable difficulty in preparing for sowing the whole area for the main crop within the short fallow. Such risks cannot be undertaken. Under a cropping scheme of 100 + 50% of rice there are better chances of partial compensation, although here, too, full compensation during the off-season does not appear warranted. The third choice is easiest. The loss of yield on the area left fallow in May is partly compensated by the rise in estimated yield for the next autumn crop on this area. The same applies to an equal area, because it can benefit by the major dry season in September-October for half a month longer. Choices (3) and (4) hold out the best prospects; the last, however, demands more of the machinery and sufficient irrigation water must be available.
Thus various provisions need to be made at the Wageningen Project to change from the 75 + 50 % system to a 75 + 75% system with the same prospects of grain yield. This is considered technically possible as far as implements and machinery are concerned; higher standards have to be met in the matter of water supply. The greatest difficulty, however, is the inconstant weather in March and April, which in some years prevents adequate preparation of the harvested fields du ring the short fallow period. The rainfall figures for these months over a number of years indicate that the chance of this situation is rather great. Figures for New Nickerie over 56 years show that the chance of wet weather in March-April is about as great as of dry. The somewhat arbitrary criterion applied here was minima of 76 mm of rain per month and 300 mm in the two months for a wet period and maxima of 133 and 200 mm, in one and two months, respectively, for a dry one. From 1907 to 1962 there were, for these months, 24 dry and 21 wet years, the remaining 11 years were intermediate.
The cropping scheme of 75 + 75 % offers few alternatives if only part of the area
191
can be sown with a main crop after a short fallow. An average occupation of the area with rice of 150% is therefore unlikely to be successful at the Wageningen Project in the near future. This means that on the basis of an average yield of 3800 kg/ha from a main crop after fallow an average annual production of 5300 kg/ha cannot yet be obtained. Since the maintenance of 125% occupation with rice is no longer economically attractive, we would recommend raising the percentage to an average of about 135. Over a four-year period this could, for instance, be achieved as follows: 75 + 60% in the first year , 55 +80% in the second, 70 + 65% in the third year and 75 + 65 % in the fourth.
In the Prince Bernhard Polder a cropping system of 100 + 33 % has been adopted because of the critical water supply situation in the off-season. The main crop is sown from 1 April till mid May and the off-season crop late in October. For the area which has three consecutive rice crops the interval between sowings is 6J months in both cases; for the main crop and subsequent long fallow there will then remain 11J months. For this polder, the October sowing should be extended to about 50% of the area under favourable weather conditions and the date of ending sowing delayed by a corresponding number of days. If March and April are particularly rainy, the sowing of the main crop can be restricted to, say, 80 or 90 % of the area.
10.4.3 Final remarks
The chief obstacles to raising the occupation with rice above approximately 150% are the fairly great chance of a wet spell in March-April and the rather long growth period of the varieties. With a more frequent cultivation of rice, there is a greater chance that a larger area has to remain fallow during the main season. More attention should, therefore, be paid to the practice of flood fallowing during the major rainy season (see 3.5). Better implements are needed for wet tillage so that the physical condition of the soil deteriorates as little as possible (see 3.3). Tolerance to adverse soil conditions and short duration of growth constitute important criteria in improving the crop by breeding (see 13.2). As long as there is no justification for cropping more than 50 to 75 % of the area in the off-season, this season should be profitably spent in a further levelling of fields.
To raise the profit still further, dry cultivation of rice during the off-season in the Prince Bernhard Polder merits close consideration because SML varieties have proved adequately resistant to drought and because the chemical control of grasses no longer presents an insuperable difficulty. In the Wageningen Polder the culture of dry-land rice is unlikely to be successful, because the different layout of the polder (see 1.4) practically rules out any flushing with irrigation water during spells of dry weather; brief submergence of the fields seems necessary during severe droughts to further the establishment of the seedlings or to promote growth of the crop. As soon as the sowing of the traditional off-season crop is over, that of the dry-land crop of rice should follow.
192
10.5 Summary
A" the Wageningen Project and in the Prince Bernhard Polder it is customary to cultivate rice on 75 and 100%, respectively, of the area during the main season (sowing time from 1 April till mid May). After this main crop is harvested, 50 and 33 % of the respective polders are resown with rice. As no suitable green manures or cover crops were available, the remaining area was left fallow. By reference to the results of a date-of-sowing experiment, a rotation trial and an analysis of yields of commercial fields in both polders over the years 1957 to 1963, the question of how far it is technically feasible and agronomically justified to sow a still larger area annually with rice was fully discussed.
In the date-of-sowing experiment, flowering was latest after sowing about mid March. From this sowing date until mid August a postponement of sowing by 30 days advanced flowering by 10 days with Skk and by 3 days with SML 81b. After sowing Skk in October-November the panicles emerged about five weeks earlier than when sown in March; with SML 81b the difference was about one week. The greatest fluctuations between years in the time from sowing till heading were found in Skk when sown in February-March. This is because this variety is very sensitive just then to slight variations in natural day-length; the differences are attributed to the influence of weather conditions on photoperiodic response.
The number of productive panicles per plant and the grain yield appeared to be independent of the date of sowing. Until the plants were about nine weeks old, there was no systematic seasonal influence on the rate of growth. In Skk, however, plant height at harvest was evidently correlated with sowing date; a longer duration of growth gave taller plants at harvest. The straw yield of Skk was also influenced by season, whereas in SML 81b the straw weight was independent of seeding date. In Skk, season clearly affected grain-to-straw ratio; high values were obtained from treatments with a short growth period. With SML 81b there was no relation between this ratio and date of sowing.
In the crop-rotation experiment the treatments with: (1) twice rice per year, (2) rice alternating with dry fallow and (3) rice alternating with Crotalaria quinquefolia, were compared during five to seven years. The highest annual yields per ha were obtained from treatment 1, averaging 20% more than those of treatment 2. The small differences in average yield between a main and an off-season crop were chiefly ascribed to diffeiences in the soil at sowing. The yield of a main crop after rice was, on average, about 60% of that after half a year's dry fallow (treatment 2). Crotalaria increased grain yield of the next rice crop by an avei age of 10 % over that following dry fallow. The results of cropping systems with three rice crops and one dry or flood fallow or Crotalaria suggest that the after-effect of a fallow period or of Crotalaria is restricted to the next rice crop. The crop-rotation systems did not cause any marked change in the chemical fertility of the soil.
From the analysis of yields of commercial fields, four main conclusions were drawn: 1. After a fallow of about six months the yields of a main crop are, over a number of
193
years, equal to those of an off-season crop. 2. The number of previous rice crops is of no consequence in deciding whether partic
ular fields should again be cropped with rice. The decisive factors are the state of tillage and the recovery of the soil after harvesting the preceding crop.
3. At the Wageningen Project and in the Prince Bernhard Polder the respective yields of a main crop after rice were 76 and 88 % ofthat when preceded by a fallow lasting about six months. The causes of the differences among these figures and between them and those of the crop-rotation experiment were stated.
4. The yield of an off-season crop after rice averaged 95 % of that of one following a fallow period of about six months. Fallowing or cropping in the main season was thus of little consequence to rice cultivation in the period from October to March. By cropping part of the area twice a year with rice a higher annual production can
be ensured. A cropping on 125% of the area per year increased average annual production by approximately 20% at Wageningen and in the Prince Bernhard Polder. When two crops are grown per year on a larger part of the area, the total production, however, will not increase proportionately because the fallow periods get shorter. This cannot be remedied by providing more machinery.
Various cropping systems, under which from 125 to 150% of the polder area is cultivated annually with rice, were discussed. The final conclusion is that the systems now in use are no longer economically attractive, so that the aim should be an increase in cultivation of rice twice a year. The inherent problems are not primarily of a technical nature ; the chief impediments are the chance of a wet spell in March-April and the fairly long growth period of the varieties. Several possibilities have been suggested to increase annual yields under a given cropping scheme.
194

Part II Quality of the grain and improvement of the crop by breeding
11 Effect of harvesting date on some characteristics of the grain
In 1956 an extensive study was begun into the effect of date of harvest on several quality features of the grain, especially moisture content, percentage cracked grain, milling recovery and amount of breakage, but also to 1000-grain weight, grain dimensions and the percentage of chalky kernels. At first almost only commercial varieties were involved but in later years the investigation was extended over a wider range. For varietal research these experiments also covered new varieties and promising lines to test their sensitivity to breakage.
The results of these investigations up to about 1960 have already been published (TEN HAVE, 1958b, c, d, 1963). The main results of the experiments, continued till 1963/64, are summarized below.
11.1 Material and methods
The investigation lasted for 11 seasons; each trial included from 7 to 18 varieties and lines. The net plot size per variety ranged from 70 to 90 m2; all varieties, with a few exceptions, were sown once. The culture and plant care did not, in principle, differ from those used in practice. Harvesting lasted for about four weeks, beginning 5 to 10 days before maturity. Samples were from 6 to 10 random places, 2 to 3 m2 in all, being reaped by sickle. The intention was to obtain 1 kg grain per variety daily or on alternate days. In 1956 harvesting took place between 11.00 and 14.00 h, in subsequent years between 12.00 and 14.00 h. When it rained in the morning no harvesting was done, unless the grain had dried sufficiently.
The grain was threshed immediately. Till 1959 this was done with a field-trial thresher; in later years a panicle thresher was used. Next, moisture content was measured twice or thrice with a Universal Moisture Tester; for two seasons an Aqua Part moisture meter was employed. The samples were then spread out on flat trays of plaited bamboo (tampahs) and carefully dried on the drying floor. In rainy weather and at night the tampahs with grain were kept indoors. This slow drying obviated an increase in cracking or breakage (STAHEL, 1933a; TEN HAVE, 1958d). After moisture content had fallen to 11 to 13 %, samples were kept for a couple of months in hermetically sealed tins.
The grain was cleaned with a Zaanland Miniature Clipper. The milling tests were carried out in triplicate (3 X 100 g paddy) with a Universale sample-mill of Guidetti
197
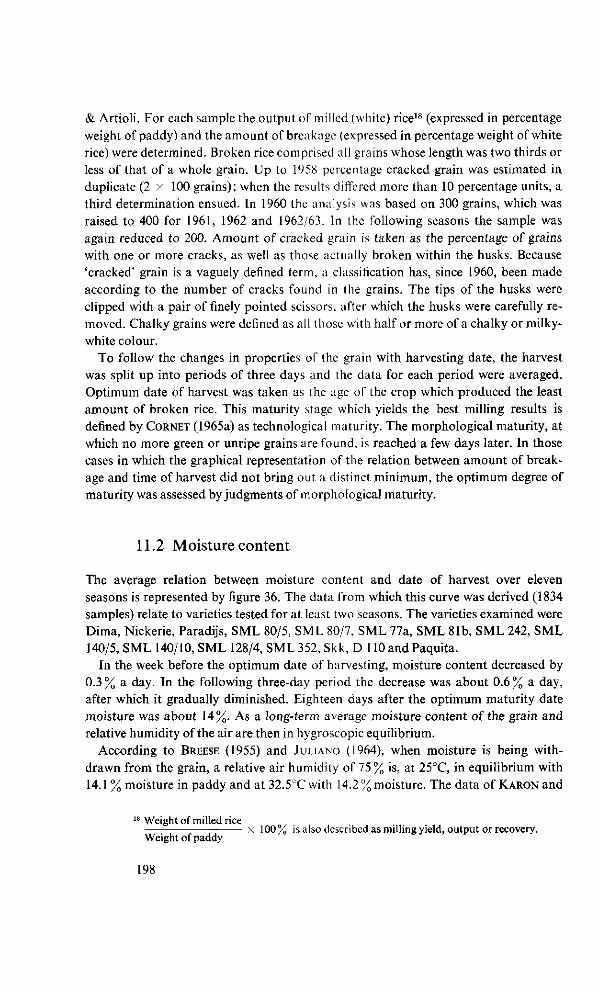
& Artioli. For each sample the output of milled (white) rice18 (expressed in percentage weight of paddy) and the amount of breakage (expressed in percentage weight of white rice) were determined. Broken rice comprised all grains whose length was two thirds or less of that of a whole grain. Up to 1958 percentage cracked grain was estimated in duplicate (2 x 100 grains); when the results differed more than 10 percentage units, a third determination ensued. In 1960 the analysis was based on 300 grains, which was raised to 400 for 1961, 1962 and 1962/63. In the following seasons the sample was again reduced to 200. Amount of cracked grain is taken as the percentage of grains with one or more cracks, as well as those actually broken within the husks. Because 'cracked' grain is a vaguely defined term, a classification has, since 1960, been made according to the number of cracks found in the grains. The tips of the husks were clipped with a pair of finely pointed scissors, after which the husks were carefully removed. Chalky grains were defined as all those with half or more of a chalky or milky-white colour.
To follow the changes in properties of the grain with harvesting date, the harvest was split up into periods of three days and the data for each period were averaged. Optimum date of harvest was taken as the age of the crop which produced the least amount of broken rice. This maturity stage which yields the best milling results is defined by CORNET (1965a) as technological maturity. The morphological maturity, at which no more green or unripe grains are found, is reached a few days later. In those cases in which the graphical representation of the relation between amount of breakage and time of harvest did not bring out a distinct minimum, the optimum degree of maturity was assessed by judgments of morphological maturity.
11.2 Moisture content
The average relation between moisture content and date of harvest over eleven seasons is represented by figure 36. The data from which this curve was derived (1834 samples) relate to varieties tested for at least two seasons. The varieties examined were Dima, Nickerie, Paradijs, SML 80/5, SM L 80/7, SML 77a, SML 81b, SML 242, SML 140/5, SML 140/10, SML 128/4, SML 352, Skk, D 110 andPaquita.
In the week before the optimum date of harvesting, moisture content decreased by 0.3% a day. In the following three-day period the decrease was about 0.6% a day, after which it gradually diminished. Eighteen days after the optimum maturity date moisture was about 14%. As a long-term average moisture content of the grain and relative humidity of the air are then in hygroscopic equilibrium.
According to BREESE (1955) and JULIANO (1964), when moisture is being withdrawn from the grain, a relative air humidity of 75% is, at 25°C, in equilibrium with 14.1 % moisture in paddy and at 32.5CC with 14.2% moisture. The data of KARON and
18 Weight of milled rice x 100% is also described as milling yield, output or recovery.
Weight of paddy
198
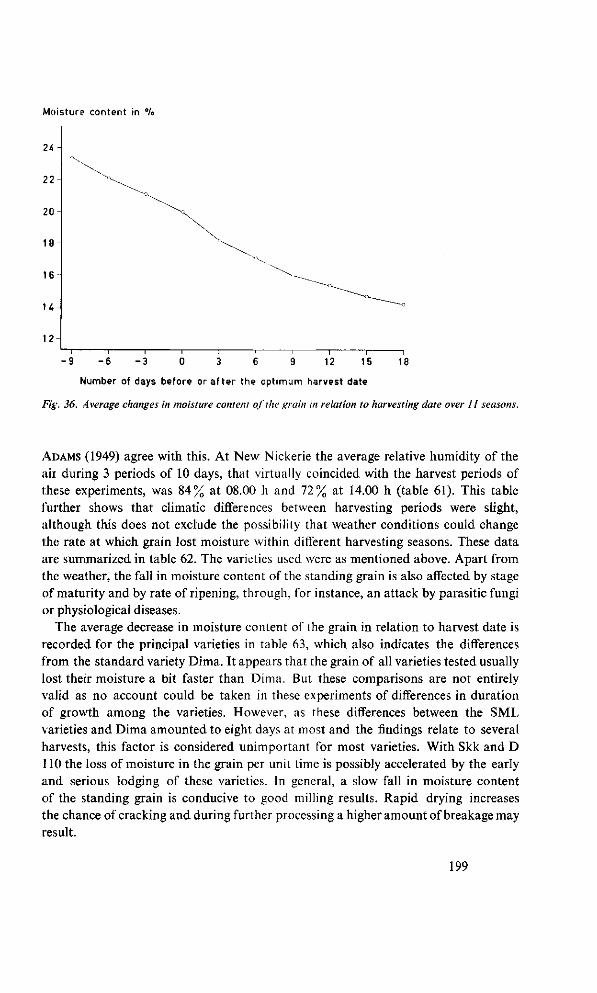
Moisture content in %
2U
22 -
20
18
16
1 4 H
12
- 9 - 6 - 3 0 3 6 9 12 15 18
Number of days before or after the optimum harvest date
Fig. 36. Average changes in moisture content of the grain in relation to harvesting date over 11 seasons.
ADAMS (1949) agree with this. At New Nickerie the average relative humidity of the ail during 3 periods of 10 days, that virtually coincided with the harvest periods of these experiments, was 84% at 08.00 h and 72% at 14.00 h (table 61). This table further shows that climatic differences between harvesting periods were slight, although this does not exclude the possibility that weather conditions could change the rate at which grain lost moisture within different harvesting seasons. These data are summarized in table 62. The varieties used were as mentioned above. Apart from the weather, the fall in moisture content of the standing grain is also affected by stage of maturity and by rate of ripening, through, for instance, an attack by parasitic fungi or physiological diseases.
The average decrease in moisture content of the grain in relation to harvest date is recorded for the principal varieties in table 63, which also indicates the differences from the standard variety Dima. It appears that the grain of all varieties tested usually lost their moisture a bit faster than Dima. But these comparisons are not entirely valid as no account could be taken in these experiments of differences in duration of growth among the varieties. However, as these differences between the SML varieties and Dima amounted to eight days at most and the findings relate to several harvests, this factor is considered unimportant for most varieties. With Skk and D 110 the loss of moisture in the grain per unit time is possibly accelerated by the early and serious lodging of these varieties. In general, a slow fall in moisture content of the standing grain is conducive to good milling results. Rapid drying increases the chance of cracking and during further processing a higher amount of breakage may result.
199
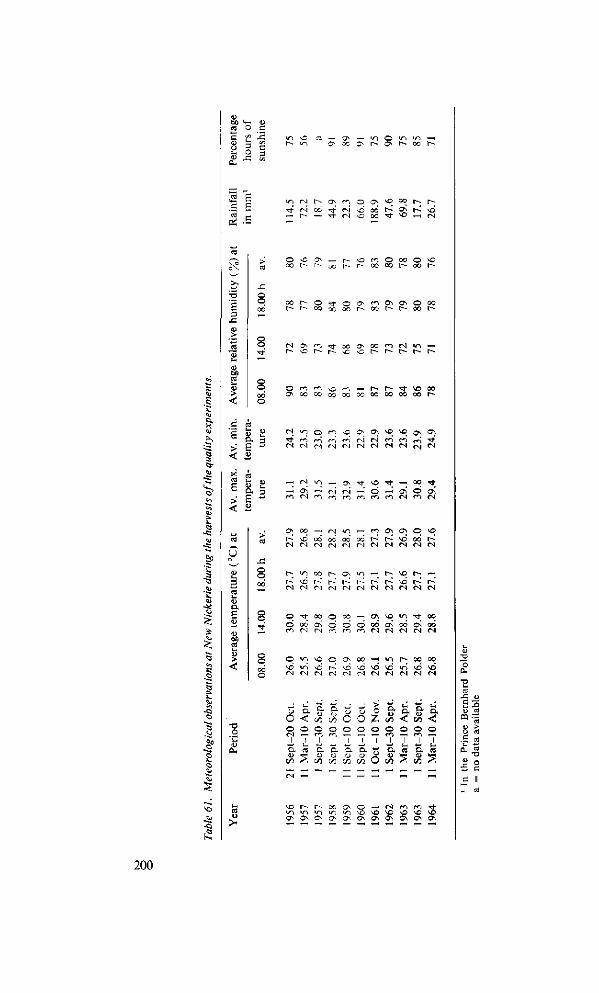
% s
-o
e*
c
.S
<r->
^f
—
<N < J r~~
r~^ OO
•a S 3
so CS LH
o o
> s 3
<: 2
£2
ü
ex S
O
r^ o o\ <> °°, r-- r--r i ^ od r^ $ t ^ \o (N \D cc ^ ^ ) -H fN
r- oo r~-
co r- O T^ o t ~ - T~~~ O O O O O O
r-- \ o t~~- t~~~
o^ M &\ C>i o oo h OO h h CO h
O r+-, C-, vC ("*-, — f - t~- "*t ^O 00 O N o o o o c o c c o o o o o o c c o o r -
es in o O ^O ^O OV <3\ (N N n r n f ^ 3 f ^ t r , r^ , , . , , - , .
H N "O « fly —' ç^ — es' r-i
T J - ^ ^ - OO T J -
- ' ö H o( d oS r*-» m r*i e s f*"i e s
O co — e-!«/") — r n ^ O O ^ O
e s ( N ( ^ ] ( N < N r s f s e s ( N e s e s
t-;• l^J OO f - CT\ 'T) i-H f - - V£) r- ; — i
r - ^ ' O r > - " r ^ r ^ r - ^ i - ^ r - ^ ' O t - ^ r - - ^ e s r s f N ( N r - i ( N e S f S e S f S e s
O ^ O O O O O — 0\ \D V~i -*t OO
© < n v o © O N C O ' - H i / - i r - - ; o o c c
o o (N
*_, a co
(N
5. < o - _ tS
2
^
o co o r*-i
w CL O
CO
o. o co o f*".
1 D.
CO
Oct
. O
ct.
Nov
.
o ^ O.
CO
—
o — •
,L a co
—
o -7
1 0
0 —
0 .
co 0 f l l
+L a co
S-i
0 -* 1 CS
S ^
CO
O c*1
+L & (0
co
l-i
< 0 -r u C3
S 1—1
G
"C PH
• e
£ -,
X)
'5 >
ca 0
II
ca
200
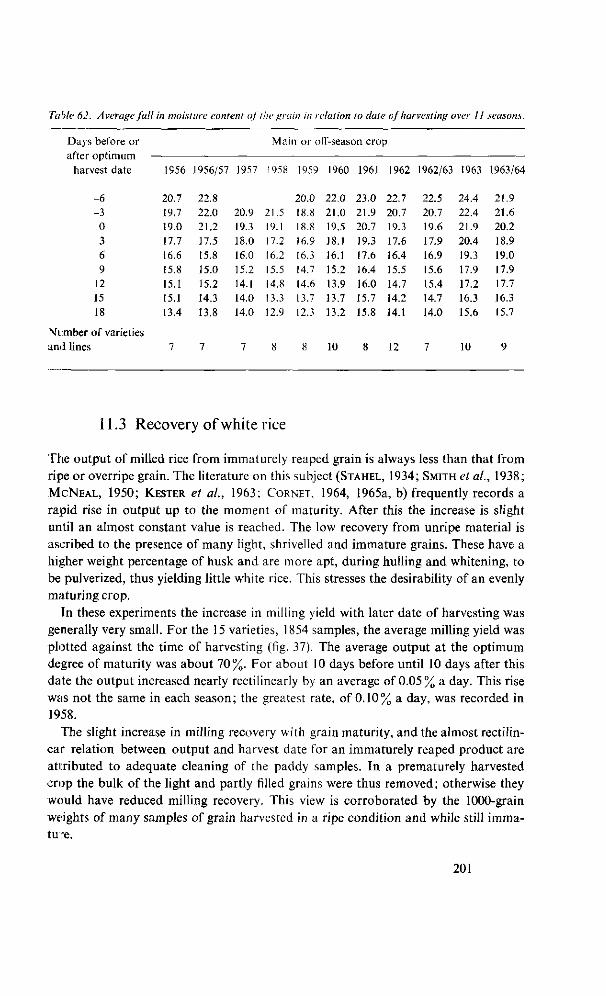
Fable 62. Average fall in moisture content of the grain in relation to date of harvesting over II seasons.
Days before or after optimum
harvest date
-6 -3 0 3 6 9
12 15 18
Number of varieties and lines
1956
20.7 19.7 19.0 17.7 16.6 15.8 15.1 15.1 13.4
7
1956/57
22.8 22.0 21.2 17.5 15.8 15.0 15.2 14.3 13.8
7
1957
20.9 19.3 18.0 16.0 15.2 14.1 14.0 14.0
7
Main or off-season crop
1958
21.5 19.1 17.2 16.2 15.5 14.8 13.3 12.9
8
1959
20.0 18.8 18.8 16.9 16.3 14.7 14.6 13.7 12.3
8
1960
22.0 21.0 19.5 18.1 16.1 15.2 13.9 13.7 13.2
10
1961
23.0 21.9 20.7 19.3 17.6 16.4 16.0 15.7 15.8
8
1962
22.7 20.7 19.3 17.6 16.4 15.5 14.7 14.2 14.1
12
1962/63
22.5 20.7 19.6 17.9 16.9 15.6 15.4 14.7 14.0
7
1963
24.4 22.4 21.9 20.4 19.3 17.9 17.2 16.3 15.6
10
1963/64
21.9 21.6 20.2 18.9 19.0 17.9 17.7 16.3 15.7
9
11.3 Recovery of white rice
The output of milled rice from immaturely reaped grain is always less than that from ripe or overripe grain. The literature on this subject (STAHEL, 1934; SMITH et al., 1938; MCNEAL, 1950; KESTER et al., 1963; CORNET, 1964, 1965a, b) frequently records a rapid rise in output up to the moment of maturity. After this the increase is slight until an almost constant value is reached. The low recovery from unripe material is ascribed to the presence of many light, shrivelled and immature grains. These have a higher weight percentage of husk and are more apt, during hulling and whitening, to be pulverized, thus yielding little white rice. This stresses the desirability of an evenly maturing crop.
In these experiments the increase in milling yield with later date of harvesting was generally very small. For the 15 varieties, 1854 samples, the average milling yield was plotted against the time of harvesting (fig. 37). The average output at the optimum degree of maturity was about 70%. For about 10 days before until 10 days after this date the output increased nearly rectilinearly by an average of 0.05% a day. This rise was not the same in each season; the greatest rate, of 0.10% a day, was recorded in 1958.
The slight increase in milling recovery with grain maturity, and the almost rectilinear relation between output and harvest date for an immaturely reaped product are attributed to adequate cleaning of the paddy samples. In a prematurely harvested crop the bulk of the light and partly filled grains were thus removed; otherwise they would have reduced milling recovery. This view is corroborated by the 1000-grain weights of many samples of grain harvested in a ripe condition and while still immature.
201
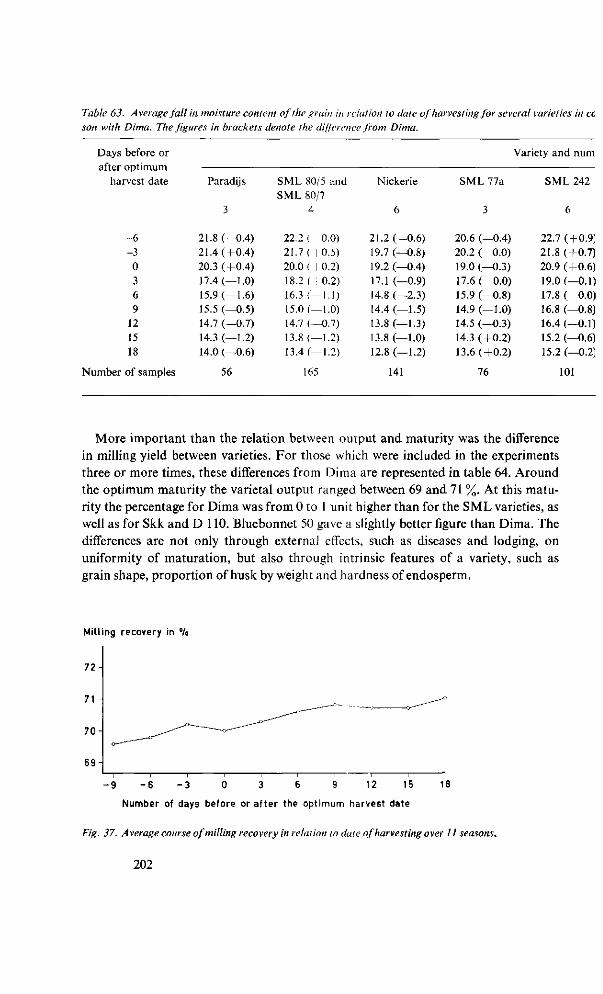
Table 63. Average fall in moisture content of the grain in relation to date of harvesting for several varieties in cc son with Dima. The figures in brackets denote the difference from Dima.
Days before or after optimum
harvest date
-6 -3 0 3 6 9
12 15 18
Number of samples
Paradijs
3
21.8 (—0.4) 21.4 (+0.4) 20.3 (+0.4) 17.4 (—1.0) 15.9 (—1.6) 15.5 (—0.5) 14.7 (—0.7) 14.3 (—1.2) 14.0 (—0.6)
56
SML 80/5 and SML 80/7
4
22.2 ( 0.0) 21.7 ( I 0.5) 20.0 ( 1 0.2) 18.2 ( \ 0.2) 16.3 ( — 1.1) 15.0 1—1.0) 14.7 (—0.7) 13.8 (—1.2) 13.4 (—1.2)
165
Nickerie
6
21.2 (—0.6) 19.7 (—0.8) 19.2 (—0.4) 17.1 (—0.9) 14.8 (—2.3) 14.4 (—1.5) 13.8 (—1.3) 13.8 (—1.0) 12.8 (—1.2)
141
Variety and num
SML 77a
3
20.6 (—0.4) 20.2 ( 0.0) 19.0 (—0.3) 17.6 ( 0.0) 15.9 (—0.8) 14.9 (—1.0) 14.5 (—0.3) 14.3 (+0.2) 13.6 (+0.2)
76
SML 242
6
22.7 (+0.9; 21.8 (+0.7) 20.9 (+0.6) 19.0 (—0.1) 17.8 ( 0.0) 16.8 (—0.8) 16.4 (—0.1) 15.2 (—0.6) 15.2 (—0.2]
101
More important than the relation between output and maturity was the difference in milling yield between varieties. For those which were included in the experiments three or more times, these differences from Dima are represented in table 64. Around the optimum maturity the varietal output ranged between 69 and 71 %. At this maturity the percentage for Dima was from 0 to 1 unit higher than for the SML varieties, as well as for Skk and D 110. Bluebonnet 50 gave a slightly better figure than Dima. The differences are not only through external effects, such as diseases and lodging, on uniformity of maturation, but also through intrinsic features of a variety, such as grain shape, proportion of husk by weight and hardness of endosperm.
Milling recovery in °/o
72
71
70
69
- 9 - 6 - 3 0 3 6 9 12 15
Number of days before or after the optimum harvest date
18
Fig. 37. Average course of milling recovery in relation to date of harvesting over 11 seasons.
202
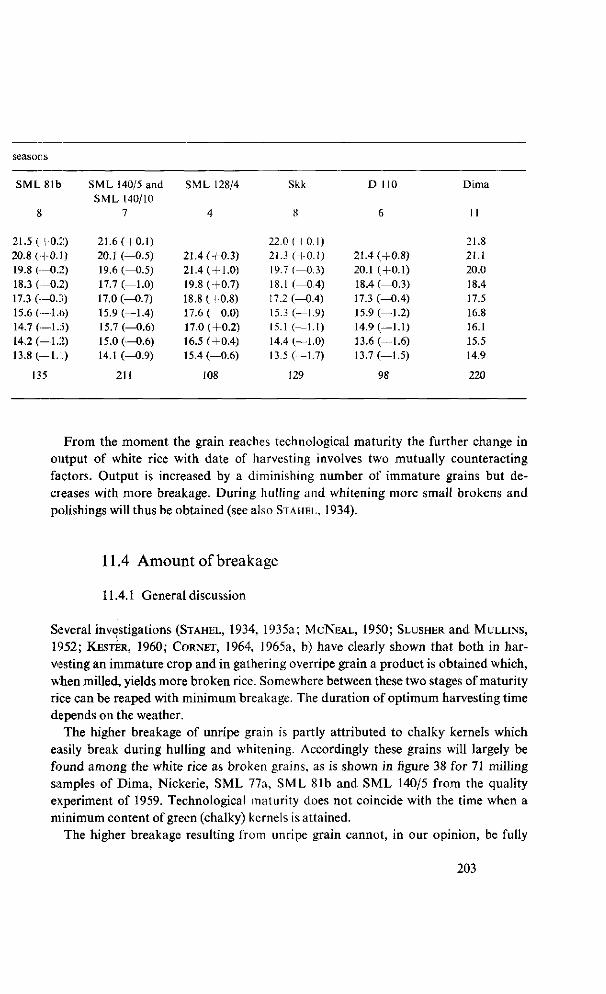
seasons
SML81b
8
21.5 (+0.2) 20 .8 ( f0 .1 ) 19.8 (—0.2) 18.3 (—0.2) 17.3 (—0.3) 15.6 (—1.6) 14.7 (—1.5) 14.2 (—1.2) 13.8 (—1.1)
135
SML 140/5 and SML 140/10
7
21.6 ( + 0.1) 20.1 (—0.5) 19.6 (—0.5) 17.7 (—1.0) 17.0 (—0.7) 15.9 (—1.4) 15.7 (—0.6) 15.0 (—0.6) 14.1 (—0.9)
211
SML 128/4
4
21.4 (+0.3) 21.4 (+1.0) 19.8 ( + 0.7) 18.8 (+0.8) 17.6 ( 0.0) 17.0 (+0.2) 16.5 (+0.4) 15.4 (—0.6)
108
Skk
8
22.0 ( 1 0.1) 21.3 ( + 0.1) 19.7 (—0.3) 18.1 (—0.4) 17.2 (—0.4) 15.3 (—1.9) 15.1 (—1.1) 14.4 (—1.0) 13.5 (—1.7)
129
D 110
6
21.4 (+0.8) 20.1 (+0.1) 18.4 (—0.3) 17.3 (—0.4) 15.9 (—1.2) 14.9 (—1.1) 13.6 (—1.6) 13.7 (—1.5)
98
Dima
11
21.8 21.1 20.0 18.4 17.5 16.8 16.1 15.5 14.9
220
From the moment the grain reaches technological maturity the further change in output of white rice with date of harvesting involves two mutually counteracting factors. Output is increased by a diminishing number of immature grains but decreases with more breakage. During hulling and whitening more small brokens and polishings will thus be obtained (see also STAHEL, 1934).
11.4 Amount of breakage
11.4.1 General discussion
Several investigations (STAHEL, 1934, 1935a; MCNEAL, 1950; SLUSHER and MULLINS,
1952; KESTÉR, 1960; CORNET, 1964, 1965a, b) have clearly shown that both in harvesting an immature crop and in gathering overripe grain a product is obtained which, when milled, yields more broken rice. Somewhere between these two stages of maturity rice can be reaped with minimum breakage. The duration of optimum harvesting time depends on the weather.
The higher breakage of unripe grain is partly attributed to chalky kernels which easily break during hulling and whitening. Accordingly these grains will largely be found among the white rice as broken grains, as is shown in figure 38 for 71 milling samples of Dima, Nickerie, SML 77a, SML 81b and SML 140/5 from the quality experiment of 1959. Technological maturity does not coincide with the time when a minimum content of green (chalky) kernels is attained.
The higher breakage resulting from unripe grain cannot, in our opinion, be fully
203
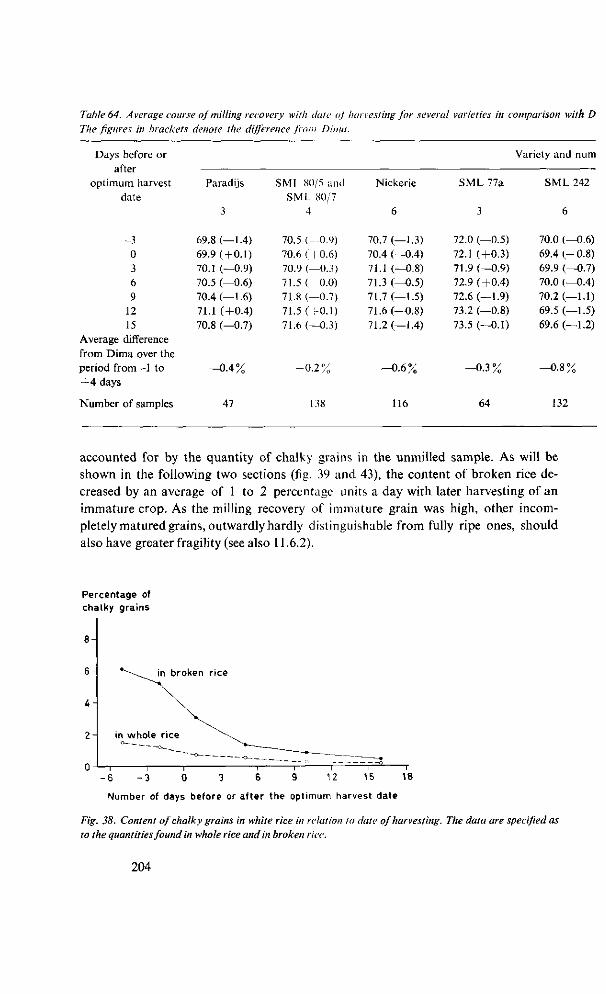
Table 64. Average course of milling recovery with dale o)'harvesting for several varieties in comparison with D
The figures in brackets denote the difference from Dima.
Days before or after
optimum harvest date
-3 0 3 6 9
12 15
Average difference from Dima over the period from -1 to +4 days
Number of samples
Paradijs
3
69.8 (—1.4) 69.9 (+0.1) 70.1 (—0.9) 70.5 (—0.6) 70.4 (—1.6) 71.1 (+0.4) 70.8 (—0.7)
—0.4%
47
SMI. 80/5 and S ML 80/7
4
70.5 (—0.9) 70.6 (1 0.6) 70.9 (—0.3) 71.5 ( 0.0) 71.8 (—0.7) 71.5 (-1-0.1) 71.6 (—0.3)
+ 0.2%
138
Nickerie
6
70.7 (—1.3) 70.4 (—0.4) 71.1 (—0.8) 71.3 (—0.5) 71.7 (—1.5) 71.6 (—0.8) 71.2 (—1.4)
- 0 . 6 %
116
SML 77a
3
72.0 (—0.5) 72.1 (+0.3) 71.9 (—0.9) 72.9 (+0.4) 72.6 (—1.9) 73.2 (—0.8) 73.5 (—0.1)
- 0 . 3 %
64
Variety and num
SML 242
6
70.0 (—0.6) 69.4 (—0.8) 69.9 (—0.7) 70.0 (—0.4) 70.2 (—1.1) 69.5 (—1.5) 69.6 (—1.2)
- 0 . 8 %
132
accounted for by the quantity of chalky grains in the unmilled sample. As will be shown in the following two sections (fig. 39 and 43), the content of broken rice decreased by an average of 1 to 2 percentage units a day with later harvesting of an immature crop. As the milling recovery of immature grain was high, other incompletely matured grains, outwardly hardly distinguishable from fully ripe ones, should also have greater fragility (see also 11.6.2).
Percentage of chalky grains
4 -
in broken r ice
- 6 - 3 0 3 6 9 12 15
Number of days before or a f ter the optimum harvest date
-r 18
Fig. 38. Content of chalky grains in white rice in relation to date of harvesting. The data are specified as to the quantities found in whole rice and in broken rice.
204
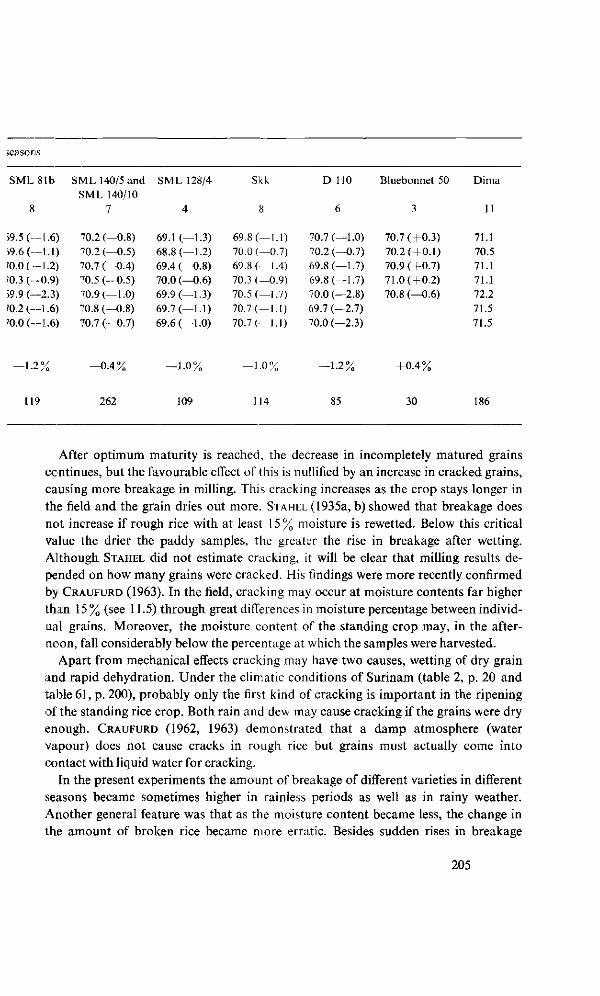
seasons
SML 81b
8
59.5 (—1.6) 59.6 (—1.1) '0.0 (—1.2) '0.3 (—0.9) 59.9 (—2.3) '0.2 (—1.6) '0.0 (—1.6)
SML 140/5 and SML 140/10
7
70.2 (—0.8) 70.2 (—0.5) 70.7 (—0.4) 70.5 (—0.5) 70.9 (—1.0) 70.8 (—0.8) 70.7 (—0.7)
SML 128/4
4
69.1 (—1.3) 68.8 (—1.2) 69.4 (—0.8) 70.0 (—0.6) 69.9 (—1.3) 69.7 (—1.1) 69.6 (—1.0)
Skk
8
69.8 (—1.1) 70.0 (—0.7) 69.8 (—1.4) 70.3 (—0.9) 70.5 (—1.7) 70.7 (—1.1) 70.7 (—1.1)
D 110
6
70.7 (—1.0) 70.2 (—0.7) 69.8 (—1.7) 69.8 (—1.7) 70.0 (—2.8) 69.7 (—2.7) 70.0 (—2.3)
Bluebonnet 50
3
70.7 (+0.3) 70.2 (+0.1) 70.9 (+0.7) 71.0 ( + 0.2) 70.8 (—0.6)
Dima
11
71.1 70.5 71.1 71.1 72.2 71.5 71.5
-1.2% —0.4% —1-0% - 1 . 0% —1.2% +0.4°
119 262 109 114 85 30 186
After optimum maturity is reached, the decrease in incompletely matured grains continues, but the favourable effect of this is nullified by an increase in cracked grains, causing more breakage in milling. This cracking increases as the crop stays longer in the field and the grain dries out more. STAHEL (1935a, b) showed that breakage does not increase if rough rice with at least 15 % moisture is rewetted. Below this critical value the drier the paddy samples, the greater the rise in breakage after wetting. Although STAHEL did not estimate cracking, it will be clear that milling results depended on how many grains were cracked. His findings were more recently confirmed by CRAUFURD (1963). In the field, cracking may occur at moisture contents far higher than 15 % (see 11.5) through great differences in moisture percentage between individual grains. Moreover, the moisture content of the standing crop may, in the afternoon, fall considerably below the percentage at which the samples were harvested.
Apart from mechanical effects cracking may have two causes, wetting of dry grain and rapid dehydration. Under the climatic conditions of Surinam (table 2, p. 20 and table 61, p. 200), probably only the first kind of cracking is important in the ripening of the standing rice crop. Both rain and dew may cause cracking if the grains were dry enough. CRAUFURD (1962, 1963) demonstrated that a damp atmosphere (water vapour) does not cause cracks in rough rice but grains must actually come into contact with liquid water for cracking.
In the present experiments the amount of breakage of different varieties in different seasons became sometimes higher in rainless periods as well as in rainy weather. Another general feature was that as the moisture content became less, the change in the amount of broken rice became more erratic. Besides sudden rises in breakage
205
unexpected falls occurred, although the mean trend of broken rice content with harvesting date was still upwards. As this phenomenon cannot be attributed to any errors in the harvesting, drying or processing of the samples, the falls must be explained by the swelling of the endosperm through which cracks may disappear again if cracked grains are exposed to moisture for some time. STAHEL (1936) soaked newly harvested and dried paddy of various moisture contents in water for periods ranging from a few hours to about 2\ days, and then traced the relation between the amount of breakage of the (dried) samples and the length of soaking time. The trend between varieties was for the maximum quantity of broken rice to be reached sooner if the paddy had less moisture before wetting, and for the output of whole rice to increase subsequently until it regained an almost constant level after a lapse of time.
Although in the experiments the rainfall was, in several cases, reflected in the response curves for broken-rice content of various varieties, there was often no such relation. The explanation should be sought in the fact that the effect of rain on the amount of breakage is conditioned by the time and the intensity of the rainfall, and by the temperature and relative humidity of the air just before the grain is moistened. It should further be added that the distance from the harvested plots to the pluviometer varied from 200 to 500 m, so that the registered amount would sometimes differ widely from the actual rainfall on the crop. The meteorological data available are therefore inadequate for close scrutiny of the effect of rain and dew on cracking and breakage.
Temperature is another aspect of the weather which affects the sensitivity of the grain to breakage. Experience and research in America (STANSEL et ah, 1961) and Japan (NAGATO and EBATA, 1960, 1965; EBATA, 1961; NAGATO et al, 1961; NAGAI,
1963) have revealed that at higher temperatures more chalky and milk-white spotted grains are found in the product than at lower temperatures. JODON (1955), too, points out that there may be a relation between the temperature during ripening and the percentage of chalky or milk-white kernels. These chalky spots on or in the grain probably are related to an irregular arrangement of the cells and a smaller accumulation of starch (NAGATO and EBATA, 1960, 1965; EBATA and NAGATO, 1960; NAGATO
et al., 1961). The lesser hardness of these grains (NAGATO and EBATA, 1959, 1965; NAGATO, 1962) would then probably be due to a lower endosperm density, which would at the same time account for the opacity and milk-white colour.
Other investigations suggest that the occurrence of chalky grains and milk-white spots is not a specific effect of temperature, but results from disturbances in the supply of water and nutrients to the grain. Thus, according to CHEANEY and WYCHE (1955), draining off the water too early before harvest may increase chalkiness (see also 6.6). Experiments by BOLLICH and MIEARS (1961) and BOLLICH (1962a) suggest the same with low light intensity. In Madagascar (ANON., 1958) grains on the main culm seemed more translucent than those on the tillers and that in any panicle the grains on the periphery were more translucent than those at the base. The translucency was supposed to increase with good growth conditions; in case of lodging it was much less.
STANSEL et al. (1961) and HALICK (1961) found that the amylose-amylopectin ratio
206
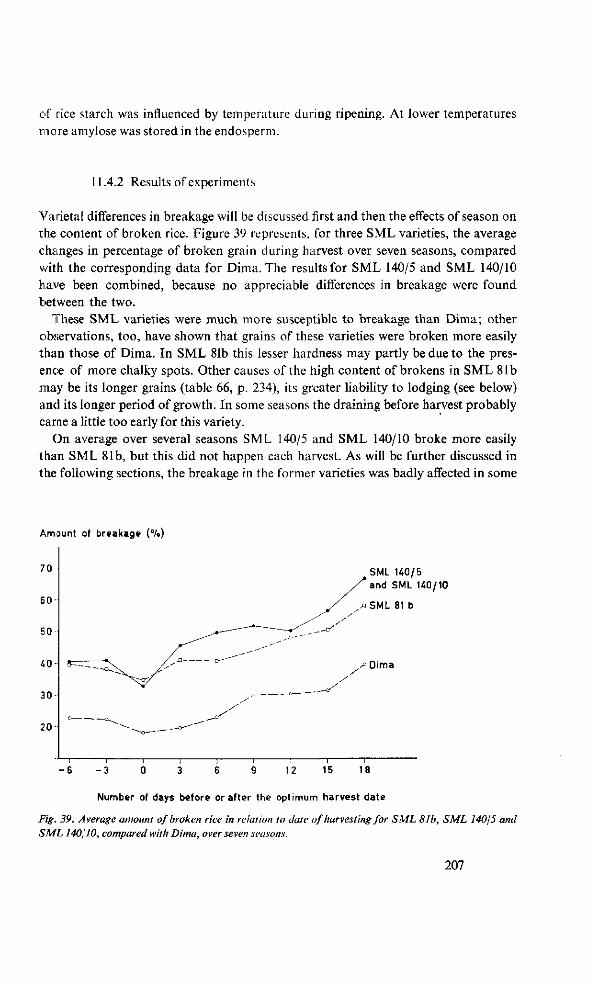
of rice starch was influenced by temperature during ripening. At lower temperatures more amylose was stored in the endosperm.
11.4.2 Results of experiments
Varietal differences in breakage will be discussed first and then the effects of season on trie content of broken rice. Figure 39 represents, for three SML varieties, the average changes in percentage of broken grain during harvest over seven seasons, compared with the corresponding data for Dima. The results for SML 140/5 and SML 140/10 have been combined, because no appreciable differences in breakage were found between the two.
These SML varieties were much more susceptible to breakage than Dima; other observations, too, have shown that grains of these varieties were broken more easily than those of Dima. In SML 81b this lesser hardness may partly be due to the presence of more chalky spots. Other causes of the high content of brokens in SML 81b may be its longer grains (table 66, p. 234), its greater liability to lodging (see below) and its longer period of growth. In some seasons the draining before harvest probably came a little too early for this variety.
On average over several seasons SML 140/5 and SML 140/10 broke more easily than SML 81b, but this did not happen each harvest. As will be further discussed in the following sections, the breakage in the former varieties was badly affected in some
Amount of breakage (%)
70
60
50
40
30
20
SML HO/5 and SML U0/10
^•SML 81 b
-° Dima
1 1 1 1 1 1 1 1 —
- 6 - 3 0 3 6 9 12 15 18
Number of days before or after the optimum harvest date
Fig. 39. Average amount of broken rice in relation to date of harvesting for SML 81b, SML 140/5 and SML 140110, compared with Dima, over seven seasons.
207
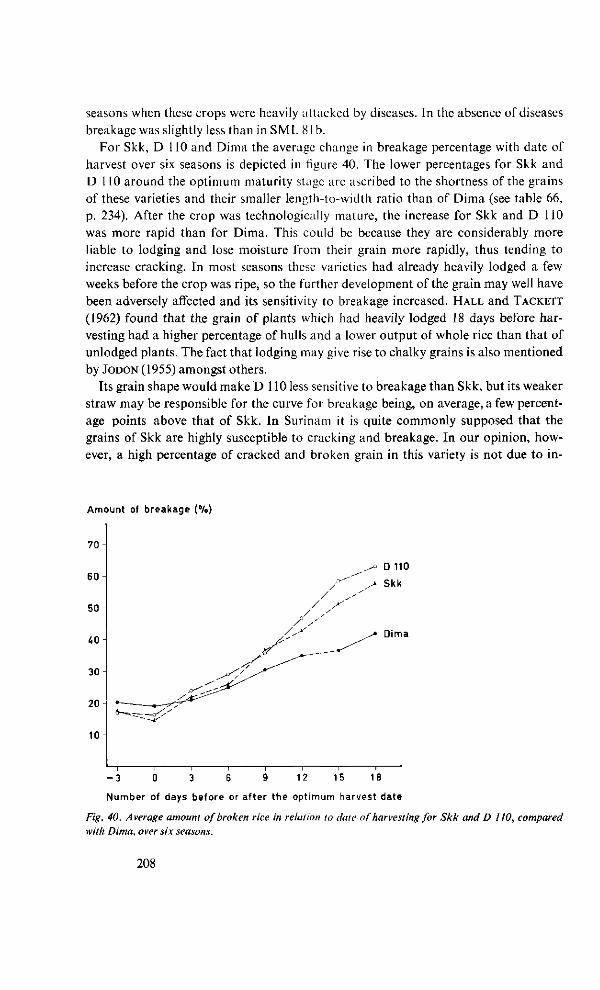
seasons when these crops were heavily attacked by diseases. In the absence of diseases breakage was slightly less than in S ML 81b.
For Skk, D 110 and Dirna the average change in breakage percentage with date of harvest over six seasons is depicted in figure 40. The lower percentages for Skk and D 110 around the optimum maturity stage arc ascribed to the shortness of the grains of these varieties and their smaller length-to-width ratio than of Dima (see table 66, p. 234). After the crop was technologically mature, the increase for Skk and D 110 was more rapid than for Dima. This could be because they are considerably more liable to lodging and lose moisture from their grain more rapidly, thus tending to increase cracking. In most seasons these varieties had already heavily lodged a few weeks before the crop was ripe, so the further development of the grain may well have been adversely affected and its sensitivity to breakage increased. HALL and TACKETT
(1962) found that the grain of plants which had heavily lodged 18 days before harvesting had a higher percentage of hulls and a lower output of whole rice than that of unlodged plants. The fact that lodging may give rise to chalky grains is also mentioned by JODON (1955) amongst others.
Its grain shape would make D 110 less sensitive to breakage than Skk, but its weaker straw may be responsible for the curve for breakage being, on average, a few percentage points above that of Skk. In Surinam it is quite commonly supposed that the grains of Skk are highly susceptible to cracking and breakage. In our opinion, however, a high percentage of cracked and broken grain in this variety is not due to in-
Amount of breakage (%)
70-
60
50
40-
30-
20-
10-
*-^___ +~~~7s
/ / ,
Sf>^
^ D 110
„> Skk
^* Dima
- 3 0 3 6 9 12 15 18
Number of days before or after the opt imum harvest date
Fig. 40. Average amount of broken rice in relation to date of harvesting for Skk and D 110, compared with Dima, over six seasons.
208
herent grain properties, but should be attributed to other factors, among which weak straw, late harvesting and improper drying are the most important.
For varieties included in these quality experiments for three or more seasons the average amounts of breakage in contrast to Dima are summed up in table 65. By comparing the varieties over several seasons a more reliable picture is obtained of varietal differences, because of differences in growth duration, and because the weather conditions during harvest affect the amount of cracked grain and, indirectly, the content of brokens in the finished white rice. If for a practical comparison a haivest period of six days is taken (lying around the optimum of from - 1 to + 4 days), Paradijs, SML 80/5, SML 80/7, Nickerie, SML 77a and SML 242 produced 1 to 3 percentage units more broken rice on average than Dima. For SML 81b, SML 140/5, SML 140/10 and SML 128/4 the difference in percentage breakage from Dima averaged from 18 to 20 units. The Skk and D 110 varieties averaged from 0 to 1 unit more breakage than Dima during thir six-day period. The breakage of Bluebonnet 50, averaged over three seasons (1961, 1962 and 1962/63), amounted to a little over 9% during a harvest of from - 1 to + 7 days around the optimum date of maturity.
The grains of the first group of varieties are, on the whole, somewhat longer than those of Dima and they generally lost moisture a little more rapidly in the field. This more rapid drying of the grain was accompanied by a greater increase in cracking. The low values for Bluebonnet 50 are attributed to hard and small grains. These are shorter than those of the SML varieties tested by an average percentage of about 15, the length-to-width ratio being 3.4 against 3.7 to 4.1 for the SML varieties. The broken-rice content of Bluebonnet 50 in table 65 is not directly comparable with that of the standard variety in that the former ripened normally during the seasons under consideration, whereas the latter was affected by diseases.
To give a clear general picture of changes in percentage breakage with date of harvest, the varieties were classed into three groups, after which the seasonal response curves were plotted. Among the group with little breakage were Dima, Nickerie, Paradijs, SML 80/5, SML 80/7, SML 77a and SML 242. This category will hereafter be referred to as the Dima group. The SML 81b group included SML 81b, SML 140/5, SML 140/10 and SML 128/4, while Skk and D 110 formed a third group. Over the first five seasons the relevant results are shown in figure 41 for the most important dates of harvest.
Slight differences in the seasonal response curves within each group are, in general, accounted for by random errors, small variations in growth duration and the effect of varying weather during harvest, whether or not combined with differences in the drying rate of the grain. The breakage curves for the Dima group in 1956, 1956/57, 1957 and 1959 are on much the same level and do not show any essential differences from one another. The anomalous breakage curves for the Dima and SML 81b groups in 1958 seems due to the weather, which caused a higher degree of cracking (see also fig. 46, p. 217).
For subsequent years the breakage curves arc shown in figure 42. With the excep-
209
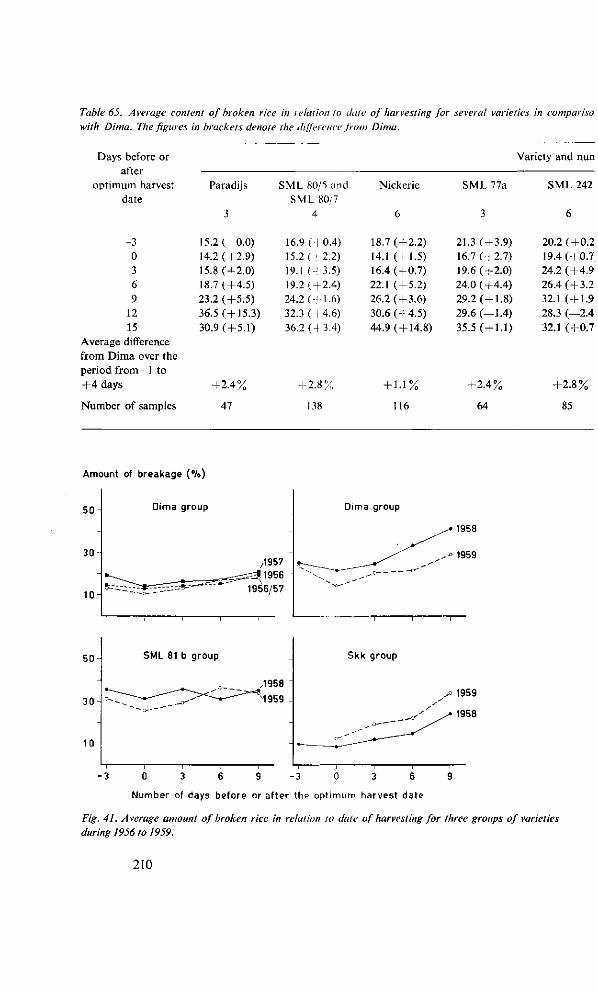
Table 65. Average content of broken rice in relation to dale of harvesting for several varieties in compariso with Dima. The figures in brackets denote the différence from Dima.
Days before or after
optimum harvest date
Paradijs SML 80/5 and SML 80/7
4
Nickerie
Variety and nun
SML 77a
3
-3 0 3 6 9
12 15
Average difference from Dima over the period from -1 to + 4 days
Number of samples
15.2 ( 0.0) 14.2 ( + 2.9) 15.8 (+2.0) 18.7 (+4.5) 23.2 ( + 5.5) 36.5 (+15.3)
30.9 (+5.1)
- 2 . 4 %
47
16.9 ( I 0.4) 15.2 ( : 2.2) 19.1 (+ 3.5) 19.2 ( + 2.4) 24.2 (-i 1.6)
32.3 (+4.6) 36.2 (-1 3.4)
+ 2.8%
138
18.7 (-14.1 (-16.4 (-22.1 (-
26.2 (-
2.2) -1.5) -0.7) 5.2) 3.6)
30.6 (+4.5) 44.9 ( + 14.8)
+ 1.1%
116
21.3 ( + 3.9) 16.7 (+2.7) 19.6 (+2.0) 24.0 (+4.4) 29.2 (+1.8) 29.6 (—1.4) 35.5 (+1.1)
-2.4^
64
Amount of breakage (%>)
Dima group Dima group
0 3 6 9 - 3 0 3 6 9
Number of days before or after the optimum harvest date
Fig. 41. Average amount of broken rice in relation to date of harvesting for three groups of varieties during 1956 to 1959.
210
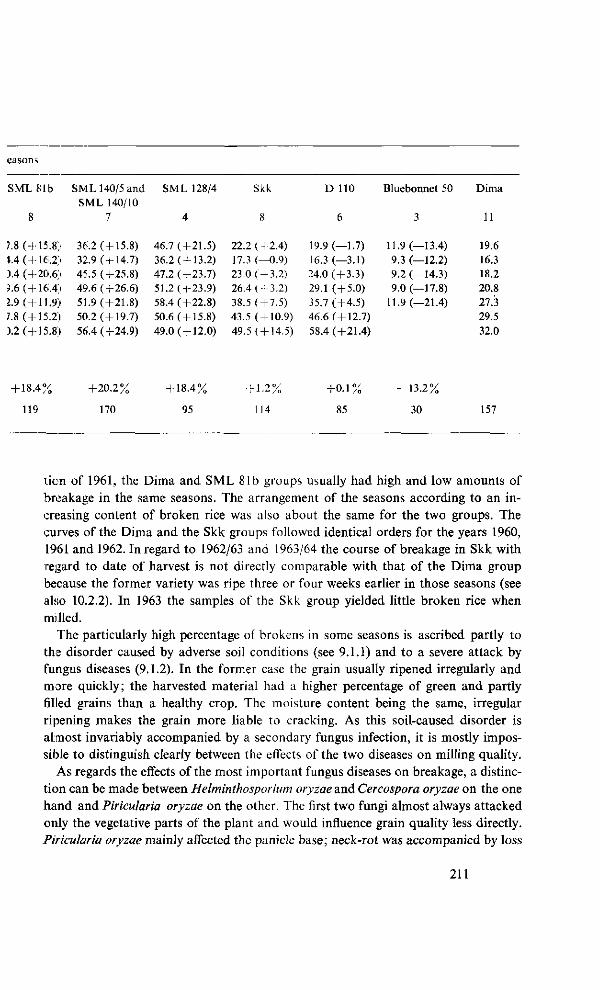
easons
SML81t>
8
7.8 ( +15.8) U (4-16.2) ).4 ( + 20.6) 5.6 ( + 16.4) 1.9 (+11.9) 7.8 (+15.2) ) .2(+15.8)
+ 18.4%
119
SML 140/5 and SML 140/10
7
36.2 (+15.8) 32.9 ( + 14.7) 45.5 (+25.8) 49.6 (+26.6) 51.9 (+21.8) 50.2 (+19.7) 56.4 (+24.9)
+20 .2%
170
SML 128/4
4
46.7 ( + 21.5) 36.2 ( + 13.2) 47.2 (+23.7) 51.2 (+23.9) 58.4 (+22.8) 50.6 ( + 15.8) 49.0 ( + 12.0)
+ 18.4%
95
Skk
8
22.2 (+2.4) 17.3 (—0.9) 23.0 ( -3 .2 ) 26.4 (--3.2) 38.5 ( + 7.5) 43.5 ( + 10.9) 49.5 ( + 14.5)
+ 1.2%
114
D 110
6
19.9 (—1.7) 16.3 (—3.1) 24.0 (+3.3) 29.1 (+5.0) 35.7 (+4.5) 46.6 ( + 12.7) 58.4 (+21.4)
+0.1 %
85
Bluebonnet 50
3
11.9 (—13.4) 9.3 (—12.2) 9.2 (—14.3) 9.0 (—17.8)
11.9 (—21.4)
- 1 3 . 2 %
30
Dima
11
19.6 16.3 18.2 20.8 27.3 29.5 32.0
157
tien of 1961, the Dima and SML 81b groups usually had high and low amounts of breakage in the same seasons. The arrangement of the seasons according to an increasing content of broken rice was also about the same for the two groups. The curves of the Dima and the Skk groups followed identical orders for the years 1960, 1961 and 1962. In regard to 1962/63 and 1963/64 the course of breakage in Skk with regard to date of harvest is not directly comparable with that of the Dima group because the former variety was ripe three or four weeks earlier in those seasons (see also 10.2.2). In 1963 the samples of the Skk group yielded little broken rice when milled.
The particularly high percentage of brokens in some seasons is ascribed partly to the disorder caused by adverse soil conditions (see 9.1.1) and to a severe attack by fungus diseases (9.1.2). In the former case the grain usually ripened irregularly and more quickly; the harvested material had a higher percentage of green and partly filled grains than a healthy crop. The moisture content being the same, irregular ripening makes the grain more liable to cracking. As this soil-caused disorder is almost invariably accompanied by a secondary fungus infection, it is mostly impossible to distinguish clearly between the effects of the two diseases on milling quality.
As regards the effects of the most important fungus diseases on breakage, a distinction can be made between Helminthosporium oryzae and Cercospora oryzae on the one hand and Piricularia oryzae on the other. The first two fungi almost always attacked only the vegetative parts of the plant and would influence grain quality less directly. Piricularia oryzae mainly affected the panicle base ; neck-rot was accompanied by loss
211
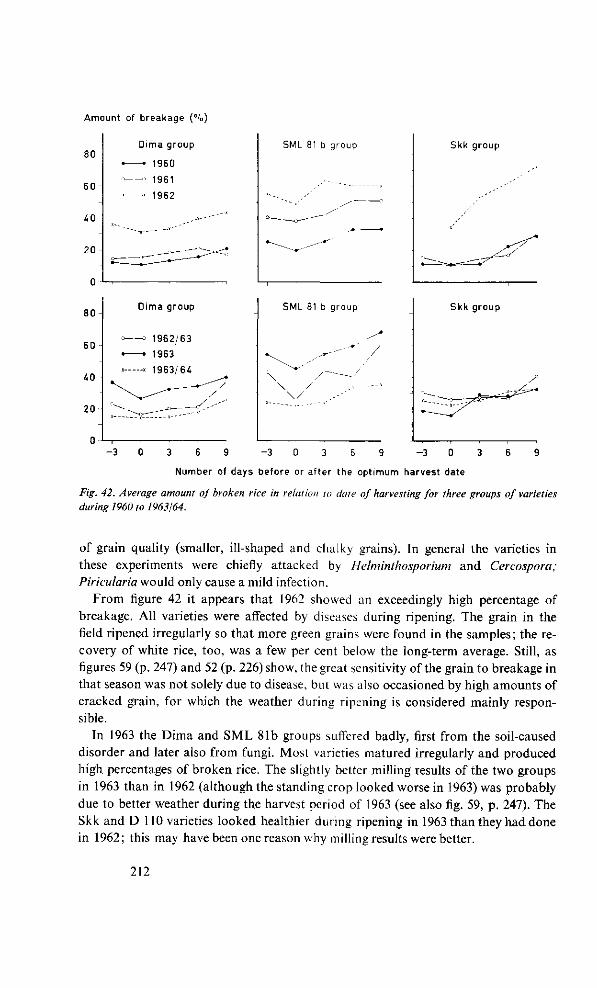
Amount of breakage (°/o)
80
6 0 -
4 0 -
2 0 -
Dima group
— 1960
— 1961
—- 1962
0
80 H
60
40
20 H
SML 81 b group Skk group
Dima group
° = 1962/63
• • 1963
»--—» 1963/64
SML 81 b group Skk group
- 3 0 3 6 9 - 3 0 3 6 9 - 3 0 3 6 9
Number of days before or af ter the optimum harvest date
Fig. 42. Average amount of broken rice in relation to date of harvesting for three groups of varieties
during 1960 to 1963/64.
of grain quality (smaller, ill-shaped and chalky grains). In general the varieties in these experiments were chiefly attacked by Helminthosporium and Cercospora; Piricularia would only cause a mild infection.
From figure 42 it appears that 1962 showed an exceedingly high percentage of breakage. All varieties were affected by diseases during ripening. The grain in the field ripened irregularly so that more green grains were found in the samples; the recovery of white rice, too, was a few per cent below the long-term average. Still, as figures 59 (p. 247) and 52 (p. 226) show, the great sensitivity of the grain to breakage in that season was not solely due to disease, but was also occasioned by high amounts of cracked grain, for which the weather during ripening is considered mainly responsible.
In 1963 the Dima and SML 81b groups suffered badly, first from the soil-caused disorder and later also from fungi. Most varieties matured irregularly and produced high percentages of broken rice. The slightly better milling results of the two groups in 1963 than in 1962 (although the standing crop looked worse in 1963) was probably due to better weather during the harvest period of 1963 (see also fig. 59, p. 247). The Skk and DUO varieties looked healthier during ripening in 1963 than they had done in 1962; this may have been one reason why milling results were better.
212
In the harvest season of 1962/63 there appeared to be a fairly clear relation between symptoms of disease after flowering and the amount of breakage. This relation was not always observed probably because the effects of the various diseases on breakage are not alike and because the weather during harvest also influences fragility, as the following examples will illustrate. In I960 the samples of Nickerie yielded normal percentages of broken rice, although this variety had been heavily attacked by fungi in that season. The other healthy varieties likewise yielded normal amounts of breakage. In 1961 all varieties developed excellently, until late in that season Dima and. the SML 140's were seriously attacked by fungi. Dima had a normal amount of breakage, whereas the 140's, maturing about a week later, yielded very high percentages of broken rice.
In 1963/64 all varieties ripened in good health, and the samples of the Dima and SML 81b groups had a low percentage broken rice. During the first week after Dima and SML 242 were ready for harvest it rained almost daily, so that the grain remained moist and the percentage of cracked grain and breakage remained low. Next came a virtually rainless spell. This sequence of weather conditions proved less favourable to the SML 81b group because its growth period was nearly a week longer than of Dima and SML 242.
11.4.3 Final considerations on causes of breakage
Harvesting unripe grain results in a high percentage of breakage in milling. This percentage will be lower with later harvest until the grain has acquired its optimum maturity. This decrease in breakage goes hand in hand with a decrease in the proportion of incompletely matured grains and a fall in moisture content. The speed with which the grain dries in the field depends on weather, health of the crop and lodging; hence these three factors also influence the time when cracking occurs.
An even maturation of the standing crop is very important if all grains are to reach their optimum degree of maturity at about the same time. In that case it will be possible, at the right time of harvesting, to obtain a product with few immature and cra.cked grains. Besides the factors already mentioned, a uniform and slow ripening of the grain depends also on many aspects of cultural practices. The amount of breakage at about the optimum date for harvest depends on all these factors as well as on intrinsic grain properties of the variety, such as shape, size and hardness.
After optimum ripeness the increase in breakage due to cracking exceeds the decrease due to a further fall in the content of immature kernels. The uniformity, at optimum maturity, between grains for factors such as moisture content, chalkiness and cracked kernels, and the weather conditions during the ensuing period determine the: increase in broken rice with delayed harvesting.
To indicate the fall and rise in content of broken rice in relation to the time of harvest by a few figures, the data for seasons with much and with little breakage have been separately grouped for the Dima and the SML 81b category. Among the seasons
213
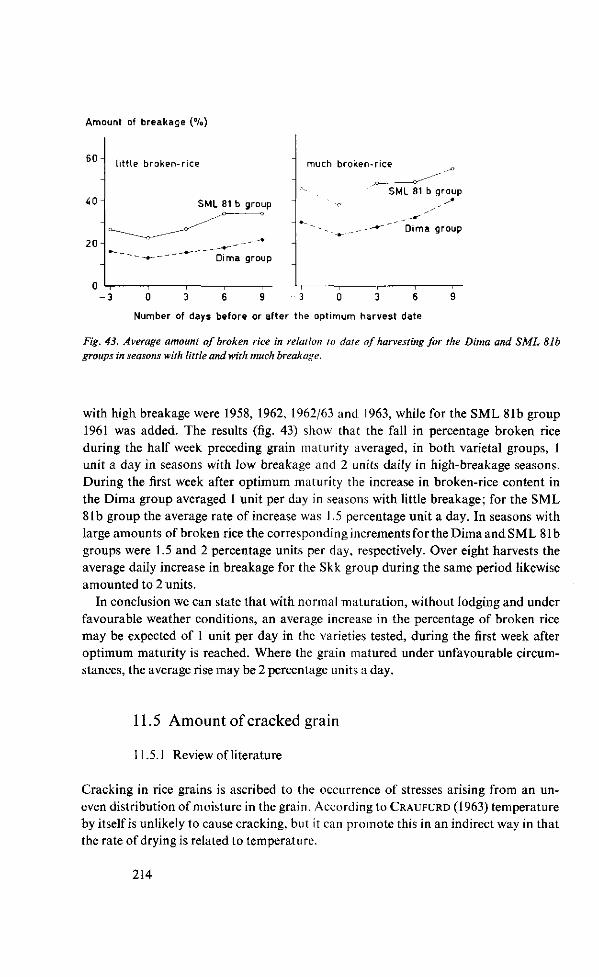
Amount of breakage (%)
6 0 -
40
2 0 -
n
l i t t le broken-rice
SMI 81 b group
° — —• •— — —•— — ~~
~-*-- Dima group
-
-
much broken-rice
SML 81 b group
•-- _. - " ~ ~ , __ ^ - * " Dima group
- 3 0 3 6 9 - 3 0 3 6 9
Number of days before or after the optimum harvest date
Fig. 43. Average amount of broken rice in relation to date of harvesting for the Dima and SML 81b groups in seasons with little and with much breakage.
with high breakage were 1958, 1962, 1962/63 and 1963, while for the SML 81b group 1961 was added. The results (fig. 43) show that the fall in percentage broken rice during the half week preceding grain maturity averaged, in both varietal groups, 1 unit a day in seasons with low breakage and 2 units daily in high-breakage seasons. During the first week after optimum maturity the increase in broken-rice content in the Dima group averaged 1 unit per day in seasons with little breakage; for the SML 81b group the average rate of increase was 1.5 percentage unit a day. In seasons with large amounts of broken rice the corresponding increments forthe Dima and SML 81b groups were 1.5 and 2 percentage units per day, respectively. Over eight harvests the average daily increase in breakage for the Skk group during the same period likewise amounted to 2 units.
In conclusion we can state that with normal maturation, without lodging and under favourable weather conditions, an average increase in the percentage of broken rice may be expected of 1 unit per day in the varieties tested, during the first week after optimum maturity is reached. Where the grain matured under unfavourable circumstances, the average rise may be 2 percentage units a day.
11.5 Amount of cracked grain
11.5.1 Review of literature
Cracking in rice grains is ascribed to the occurrence of stresses arising from an uneven distribution of moisture in the grain. According to CRAUFURD (1963) temperature by itself is unlikely to cause cracking, but it can promote this in an indirect way in that the rate of drying is related to temperature.
214
Lossofwaterhardenstheendosperm(K.ONDoundOKAMURA, 1929/30a;STAHEL,1935b;
DE MONTGRAND, 1958/59; NAGATO et ui, 1964). Hence, the drier the grain, the more
inlensive the cracking on moistening. The phenomenon that no cracking occurs where
the moisture content of the grains exceeds 15% is associated by RHIND (1962) and
CRAUFURD (1963) with the physical properties of rice starch. In potato starch, F ISH
(1957; quoted by RHIND, 1962) found that the gel is brittle below 15% moisture, but
becomes plastic above this percentage. Apparently when grains with more than 15%
moisture absorb or lose water, stresses in the endosperm are not enough to cause
cracking.
NAGATO et al. (1964) showed that cracking through the absorption of moisture
i ncreased as the dry grains had been soaking in water longer, until the moisture content
reached about 20%. As moisture further increased, the cracks gradually disappeared;
at 30% they were practically gone. STAHEL (1936) by his investigation obtained simi
lar results. The conclusion is that if freshly harvested, dry paddy is wetted long enough,
in many cases a better product can, after careful drying, be obtained from subsequent
milling.
When water is absorbed, cracking starts in the inside of the grains, whence the
cracks can extend to the periphery (STAHEL, 1936). Regarding the occurrence of
stresses in the grain due to wetting, SECKINGER et al. (1964) found in wheat grains a
moisture gradient of 4 percentage units over a distance of 1 mm. Absorption and
loss of water by rice grains, according to NAGATO et al. (1964), proceed fastest a round
the embryo. Both the pericarp (NAGATO et al., 1964; DE MONTGRAND, 1958/59) and
the husks (KONDO und OKAMURA, 1929/30b) prevent a rapid penetration of water,
thereby counteracting the development of cracks. This explains why in milling the
relative humidity of the air and the temperature greatly affect the results (AUTREY
et ah, 1955; KLOMP, 1963). The best milling results may be looked forward to if during
the process the rice is in hygroscopic equilibrium with the surrounding air.
When cracking occurs during drying, the cracks will originate on the outside of the
grains and can thence extend inwards (DE MONTGRAND, 1958/59). Numerous investi
gations have indicated that rapid drying of wet paddy increases breakage. Generally
speaking, milling results are poorer if drying takes place :
L. at higher temperatures (HENDERSON, 1954; WASSERMAN et al, 1956 a, b ; M C N E A L ,
1961 ; ARBOLEDA et al., 1964/65);
2. at lower discharge rates of the grain (WASSERMAN et al, 1958; FAULKNER and
WRATTEN, 1964);
3. in fewer stages (HENDERSON, 1954; THOMPSON et al., 1955; WASSERMAN et al.,
1956a, b ; M C N E A L , 1961);
4. at lower relative humidities of the drying air (SCHMIDT and HUKILL, 1956; SCHMIDT
andJEBE, 1959).
The greater breakage of the grain must, in these cases, be attributed to the larger
number of cracks.
215
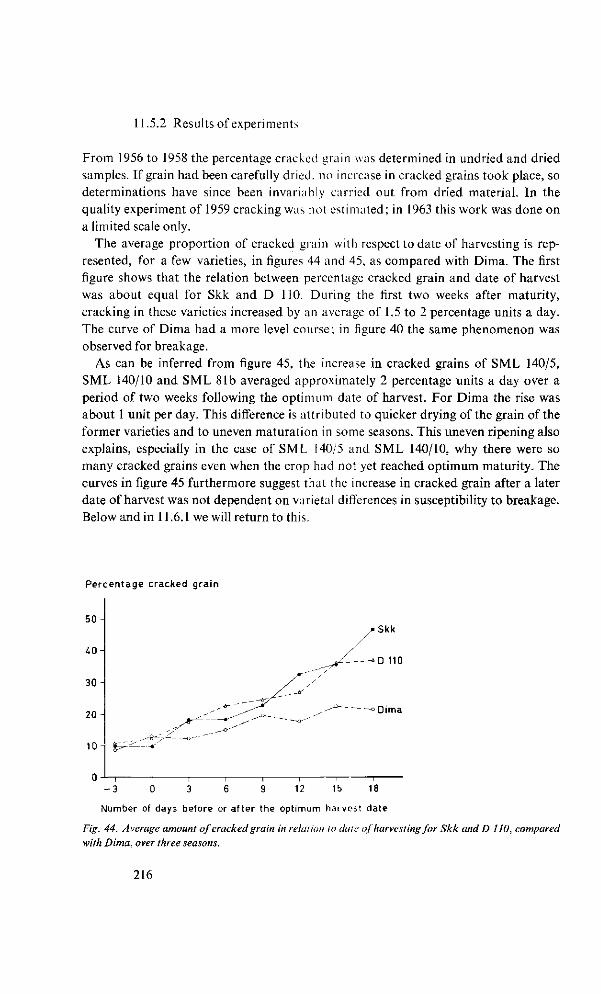
11.5.2 Results of experiments
From 1956 to 1958 the percentage cracked grain was determined in undried and dried samples. If grain had been carefully dried, no increase in cracked grains took place, so determinations have since been invariably carried out from dried material. In the quality experiment of 1959 cracking was not estimated; in 1963 this work was done on a limited scale only.
The average proportion of cracked grain with respect to date of harvesting is represented, for a few varieties, in figures 44 and 45, as compared with Dima. The first figure shows that the relation between percentage cracked grain and date of harvest was about equal for Skk and D 110. During the first two weeks after maturity, cracking in these varieties increased by an average of 1.5 to 2 percentage units a day. The curve of Dima had a more level course; in figure 40 the same phenomenon was observed for breakage.
As can be inferred from figure 45, the increase in cracked grains of SML 140/5, SML 140/10 and SML 81b averaged approximately 2 percentage units a day over a period of two weeks following the optimum date of harvest. For Dima the rise was about 1 unit per day. This difference is attributed to quicker drying of the grain of the former varieties and to uneven maturation in some seasons. This uneven ripening also explains, especially in the case of SML 140/5 and SML 140/10, why there were so many cracked grains even when the crop had not yet reached optimum maturity. The curves in figure 45 furthermore suggest that the increase in cracked grain after a later date of harvest was not dependent on varietal differences in susceptibility to breakage. Below and in 11.6.1 we will return to this.
Percentage cracked gra in
5 0 -
40
30
20
1 0 - ^
0 - 3 0 3 6 9 12 15 18
Number of days before or af ter the optimum harvest date
Fig. 44. Average amount of cracked grain in relation to dale of harvesting for Skk and D I JO, compared with Dima, over three seasons.
216
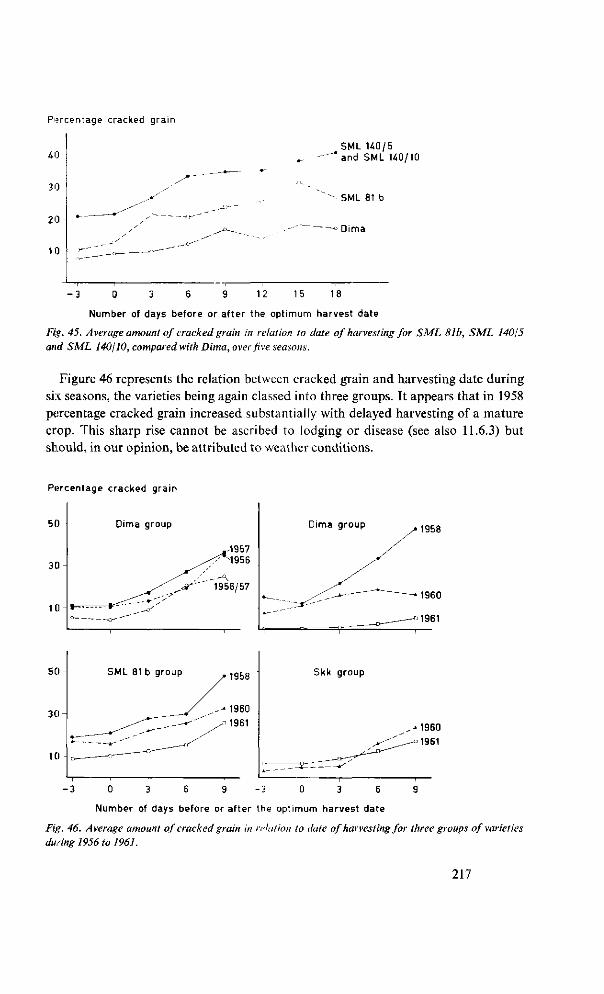
Percentage cracked grain
40
30
20
10
SML 140/5 " * and SML 140/10
^ SML 81 b
—-o Dima
- 3 0 3 6 9 12 15 18
Number of days before or after the optimum harvest date
Fig. 45. Average amount of cracked grain in relation to date of harvesting for SML 81b, SML 140/5 and SML 140/10, compared with Dima, over five seasons.
Figure 46 represents the relation between cracked grain and harvesting date during six seasons, the varieties being again classed into three groups. It appears that in 1958 percentage cracked grain increased substantially with delayed harvesting of a mature crop. This sharp rise cannot be ascribed to lodging or disease (see also 11.6.3) but should, in our opinion, be attributed to weather conditions.
Porcentage cracked grain
0 3 6 9 - 3 0 3 6
Number of days before or after the optimum harvest date
Fig. 46. Average amount of cracked grain in relation to date of harvesting for three groups of varieties during 1956 to 1961.
217
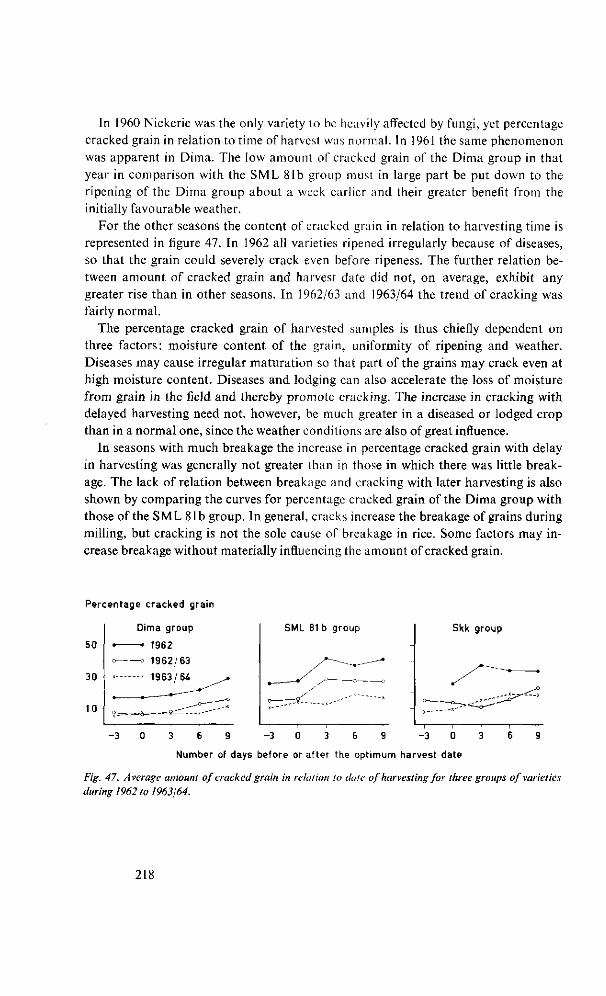
In 1960 Nickerie was the only variety to be heavily affected by fungi, yet percentage cracked grain in relation to time of harvest was normal. In 1961 the same phenomenon was apparent in Dima. The low amount of cracked grain of the Dima group in that year in comparison with the SML 81b group must in large part be put down to the ripening of the Dima group about a week earlier and their greater benefit from the initially favourable weather.
For the other seasons the content of cracked grain in relation to harvesting time is represented in figure 47. In 1962 all varieties ripened irregularly because of diseases, so that the grain could severely crack even before ripeness. The further relation between amount of cracked grain and harvest date did not, on average, exhibit any greater rise than in other seasons. In 1962/63 and 1963/64 the trend of cracking was fairly normal.
The percentage cracked grain of harvested samples is thus chiefly dependent on three factors: moisture content of the grain, uniformity of ripening and weather. Diseases may cause irregular maturation so that part of the grains may crack even at high moisture content. Diseases and lodging can also accelerate the loss of moisture from grain in the field and thereby promote cracking. The increase in cracking with delayed harvesting need not, however, be much greater in a diseased or lodged crop than in a normal one, since the weather conditions are also of great influence.
In seasons with much breakage the increase in percentage cracked grain with delay in harvesting was generally not greater than in those in which there was little breakage. The lack of relation between breakage and cracking with later harvesting is also shown by comparing the curves for percentage cracked grain of the Dima group with those of the SML 81b group. In general, cracks increase the breakage of grains during milling, but cracking is not the sole cause of breakage in rice. Some factors may increase breakage without materially influencing the amount of cracked grain.
Percentage cracked grain
50
30
10
Dima group
— 1962
-^ 1962/63
1963/64
SML 81 b group Skk group
-3 0 3 6 9 -3 0 3 6 9 -3 0 3 6 9
Number of days before or af ter the optimum harvest date
Fig. 47. Average amount of cracked grain in relation to date of harvesting for three groups of varieties during 1962 to 1963/64.
218
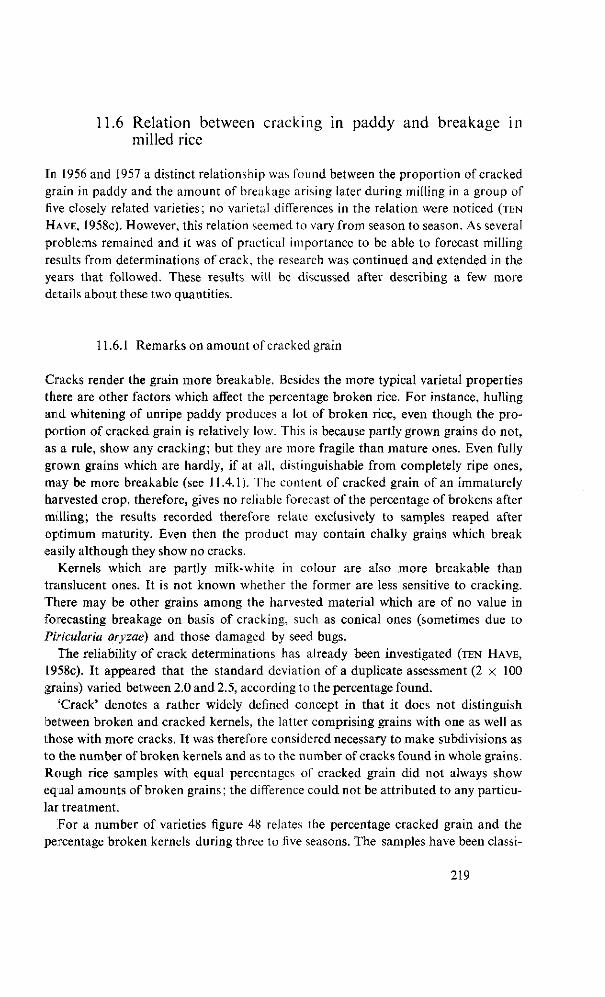
11.6 Relation between cracking in paddy and breakage in milled rice
In 1956 and 1957 a distinct relationship was found between the proportion of cracked grain in paddy and the amount of breakage arising later during milling in a group of five closely related varieties; no varietal differences in the relation were noticed (TEN HAVE, 1958C). However, this relation seemed to vary from season to season. As several problems remained and it was of practical importance to be able to forecast milling results from determinations of crack, the research was continued and extended in the years that followed. These results will be discussed after describing a few more details about these two quantities.
11.6.1 Remarks on amount of cracked grain
Cracks render the grain more breakable. Besides the more typical varietal properties there are other factors which affect the percentage broken rice. For instance, hulling arid whitening of unripe paddy produces a lot of broken rice, even though the proportion of cracked grain is relatively low. This is because partly grown grains do not, as a rule, show any cracking; but they are more fragile than mature ones. Even fully grown grains which are hardly, if at all, distinguishable from completely ripe ones, may be more breakable (see 11.4.1). The content of cracked grain of an immaturely harvested crop, therefore, gives no reliable forecast of the percentage of brokens after milling; the results recorded therefore relate exclusively to samples reaped after optimum maturity. Even then the product may contain chalky grains which break easily although they show no cracks.
Kernels which are partly milk-white in colour are also more breakable than translucent ones. It is not known whether the former are less sensitive to cracking. There may be other grains among the harvested material which are of no value in forecasting breakage on basis of cracking, such as conical ones (sometimes due to Piricularia Oryzaé) and those damaged by seed bugs.
The reliability of crack determinations has already been investigated (TEN HAVE,
1958c). It appeared that the standard deviation of a duplicate assessment (2 x 100 grains) varied between 2.0 and 2.5, according to the percentage found.
'Crack' denotes a rather widely defined concept in that it does not distinguish between broken and cracked kernels, the latter comprising grains with one as well as those with more cracks. It was therefore considered necessary to make subdivisions as to the number of broken kernels and as to the number of cracks found in whole grains. Rough rice samples with equal percentages of cracked grain did not always show equal amounts of broken grains; the difference could not be attributed to any particular treatment.
For a number of varieties figure 48 relates the percentage cracked grain and the percentage broken kernels during three to five seasons. The samples have been classi-
219
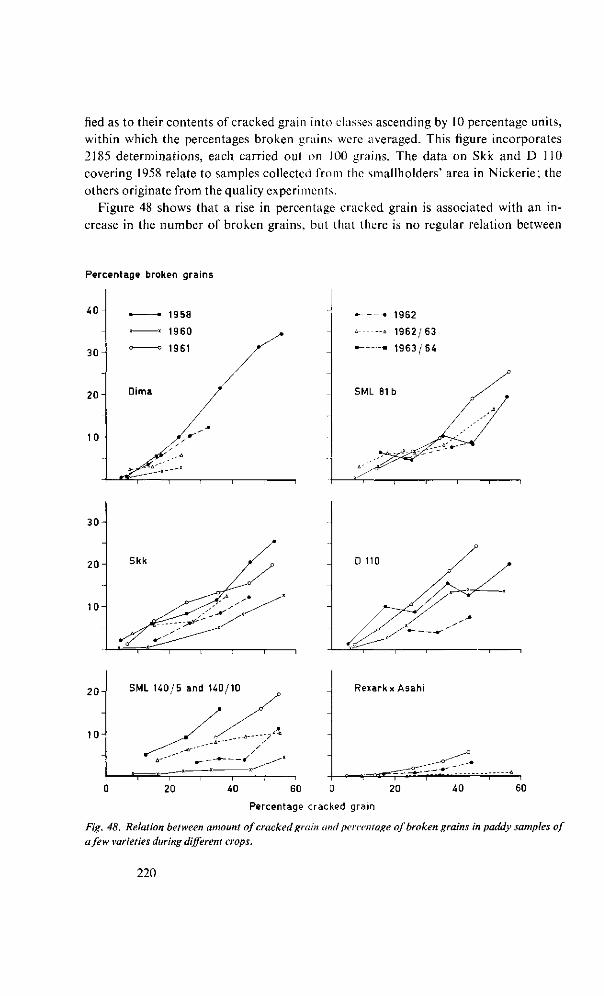
fied as to their contents of cracked grain into classes ascending by 10 percentage units, within which the percentages broken grains were averaged. This figure incorporates 2185 determinations, each carried out on 100 grains. The data on Skk and D 110 covering 1958 relate to samples collected from the smallholders' area in Nickerie; the others originate from the quality experiments.
Figure 48 shows that a rise in percentage cracked grain is associated with an increase in the number of broken grains, but that there is no regular relation between
Percentage broken grains
40-
30-
20-
10-
• • 1958
Dima /
/>^ yj* - '"*
J^^*
• 1962
« 1962/63
• • 1963 /64
SML 81b
30-
20-
~ 10-
Skk /
r^^^JI'^ ' *
1 I * 1 1 ! 1
x
D 110
SML 140/5 and 140/10 Rexark x Asahi
60 0 20
Percentage cracked grain
Fig. 48. Relation between amount of cracked grain and percentage of broken grains in paddy samples of
a few varieties during different crops.
220
the two. A comparison of figures 41, 42. 46 and 47 (relating amounts of broken rice or cracked, grain to date of harvesting) with figure 48 shows that broken grain in paddy was not correlated with crop health. Nor was the presence of broken grains in the long-grain varieties tested related to susceptibility of the variety to breakage. The relationship between the percentage cracked grain and the amount of broken grains is probably determined largely by weather conditions. It is noteworthy that in the short-
Percentage Percentage
5 0 -
30 -
1CH
Skk,1960 c
whole grains /^_--—~~"~"^
i i i i i i i i
Number of cracks
> 3
3
Percentage
5 0 -
3 0 -
SML 140/5 and 140/10, 1960 / > 3
whole grains
10
broken grains
i l i i 1
20 40 60 80 ' - ;
Percentage
SML 77a,1958
1 50
30-
10
D
broken grains
i 1 1
> 2
2
1
— i 1 1 1 1 1 1
20 40 60 80
Percentage cracked grain
Fig. 49. Relation between amount of cracked grain and number of cracks found in the whole and in the
broken grains of four different crops.
221
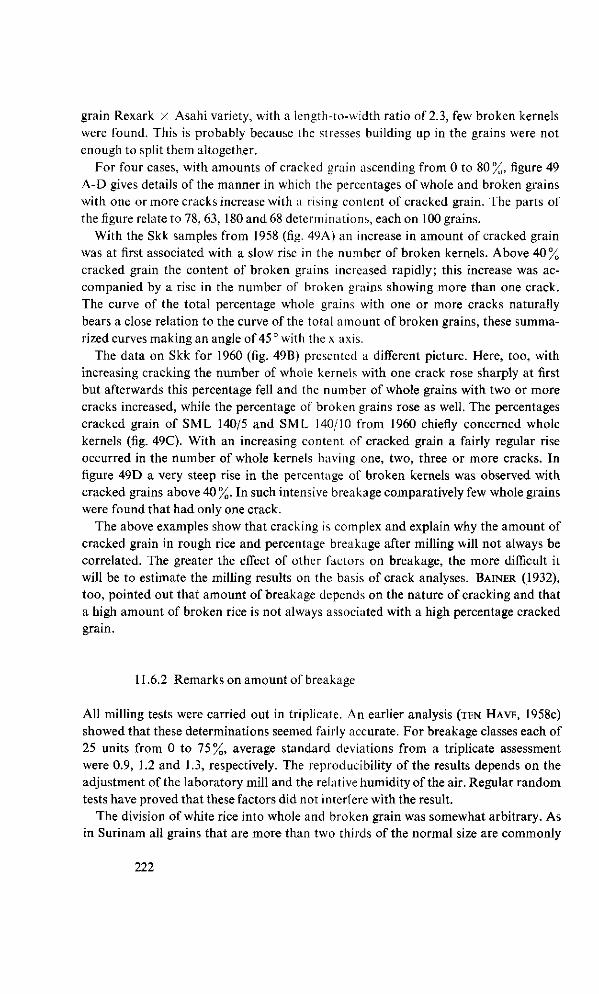
grain Rexark x Asahi variety, with a length-to-width ratio of 2.3, few broken kernels were found. This is probably because the stresses building up in the grains were not enough to split them altogether.
For four cases, with amounts of cracked grain ascending from 0 to 80%, figure 49 A-D gives details of the manner in which the percentages of whole and broken grains with one or more cracks increase with a rising content of cracked grain. The parts of the figure relate to 78, 63, 180 and 68 determinations, each on 100 grains.
With the Skk samples from 1958 (fig. 49A) an increase in amount of cracked grain was at first associated with a slow rise in the number of broken kernels. Above 40% cracked grain the content of broken grains increased rapidly; this increase was accompanied by a rise in the number of broken grains showing more than one crack. The curve of the total percentage whole grains with one or more cracks naturally bears a close relation to the curve of the total amount of broken grains, these summarized curves making an angle of 45° with thex axis.
The data on Skk for 1960 (fig. 49B) presented a different picture. Here, too, with increasing cracking the number of whole kernels with one crack rose sharply at first but afterwards this percentage fell and the number of whole grains with two or more cracks increased, while the percentage of broken grains rose as well. The percentages cracked grain of SML 140/5 and SML 140/10 from 1960 chiefly concerned whole kernels (fig. 49C). With an increasing content of cracked grain a fairly regular rise occurred in the number of whole kernels having one, two, three or more cracks. In figure 49D a very steep rise in the percentage of broken kernels was observed with cracked grains above 40%. In such intensive breakage comparatively few whole grains were found that had only one crack.
The above examples show that cracking is complex and explain why the amount of cracked grain in rough rice and percentage breakage after milling will not always be correlated. The greater the effect of other factors on breakage, the more difficult it will be to estimate the milling results on the basis of crack analyses. BAINER (1932), too, pointed out that amount of breakage depends on the nature of cracking and that a high amount of broken rice is not always associated with a high percentage cracked grain.
11.6.2 Remarks on amount of breakage
All milling tests were carried out in triplicate. An earlier analysis (TEN HAVE, 1958c) showed that these determinations seemed fairly accurate. For breakage classes each of 25 units from 0 to 75%, average standard deviations from a triplicate assessment were 0.9, 1.2 and 1.3, respectively. The reproducibility of the results depends on the adjustment of the laboratory mill and the relative humidity of the air. Regular random tests have proved that these factors did not interfere with the result.
The division of white rice into whole and broken grain was somewhat arbitrary. As in Surinam all grains that are more than two thirds of the normal size are commonly
222
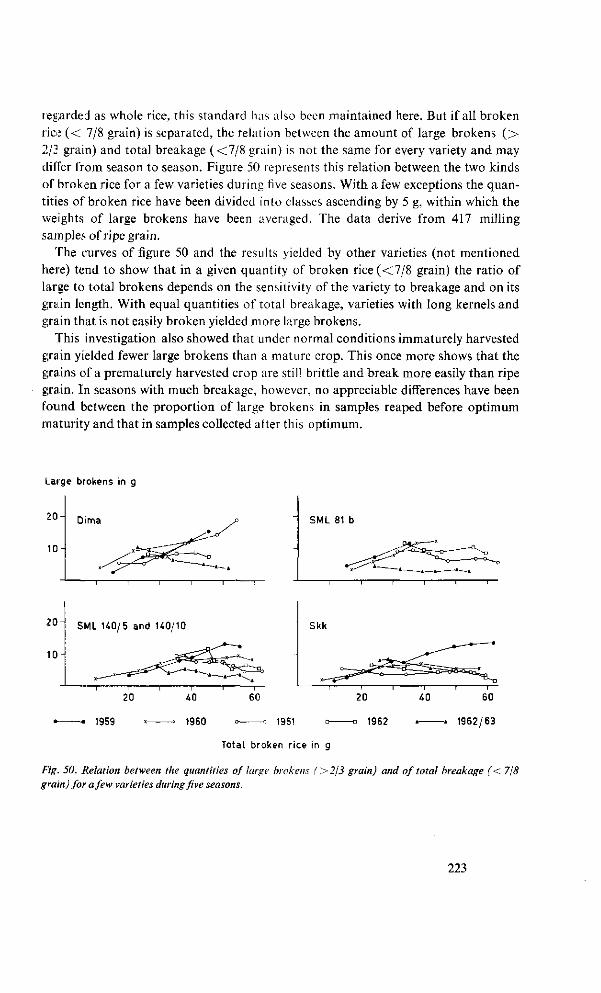
regarded as whole rice, this standard has also been maintained here. But if all broken rice ( < 7/8 grain) is separated, the relation between the amount of large brokens ( > 2/2 grain) and total breakage (<7/8 grain) is not the same for every variety and may differ from season to season. Figure 50 represents this relation between the two kinds of broken rice for a few varieties during five seasons. With a few exceptions the quantities of broken rice have been divided into classes ascending by 5 g, within which the weights of large brokens have been averaged. The data derive from 417 milling samples of ripe grain.
The curves of figure 50 and the results yielded by other varieties (not mentioned here) tend to show that in a given quantity of broken rice (<7/8 grain) the ratio of large to total brokens depends on the sensitivity of the variety to breakage and on its grain length. With equal quantities of total breakage, varieties with long kernels and gra.in that is not easily broken yielded more large brokens.
This investigation also showed that under normal conditions immaturely harvested gra.in yielded fewer large brokens than a mature crop. This once more shows that the grains of a prematurely harvested crop are stil! brittle and break more easily than ripe grain. In seasons with much breakage, however, no appreciable differences have been found between the proportion of large brokens in samples reaped before optimum maturity and that in samples collected after this optimum.
Large brokens in g
20
10
Dima SML 81 b
20
10 -
SML UO/5 and 140/10 Skk
20 n 1 1 1—
40 60
1959 1960 ° o 1961 -a 1962 » » 1962/63
Total broken rice in g
Fig. 50. Relation between the quantities of large brokens (>2/3 grain) and of total breakage (< 7/8 grain) for a few varieties during five seasons.
223
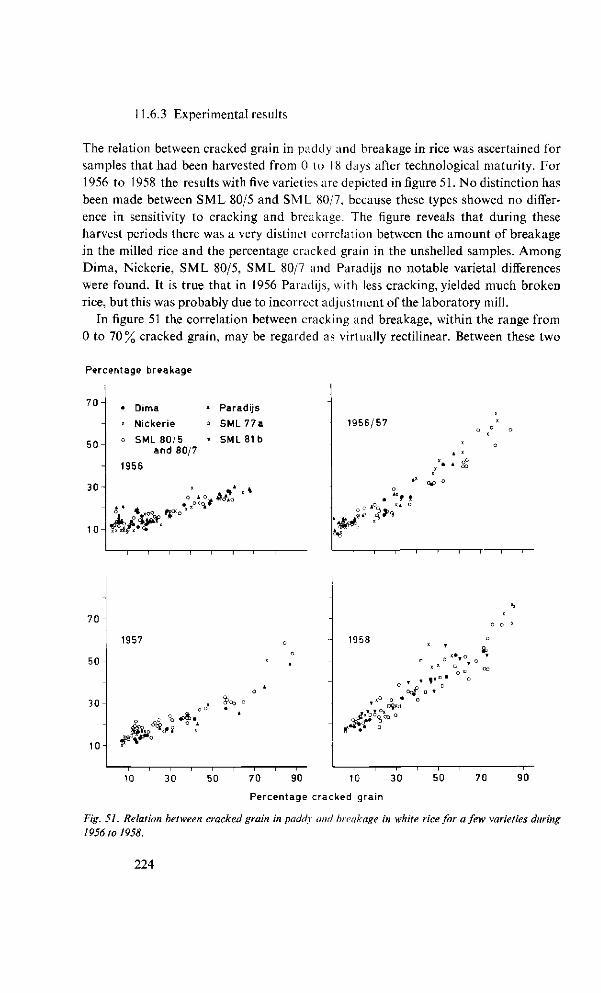
11.6.3 Experimental results
The relation between cracked grain in paddy and breakage in rice was ascertained for samples that had been harvested from 0 to 18 days after technological maturity. For 1956 to 1958 the results with five varieties are depicted in figure 51. No distinction has been made between S ML 80/5 and SML 80/7, because these types showed no difference in sensitivity to cracking and breakage. The figure reveals that during these harvest periods there was a very distinct correlation between the amount of breakage in the milled rice and the percentage cracked grain in the unshelled samples. Among Dima, Nickerie, SML 80/5, SML 80/7 and Paradijs no notable varietal differences were found. It is true that in 1956 Paradijs, with less cracking, yielded much broken rice, but this was probably due to incorrect adjustment of the laboratory mill.
In figure 51 the correlation between cracking and breakage, within the range from 0 to 70% cracked grain, may be regarded as virtually rectilinear. Between these two
Percentage breakage
7 0 -
5 0 -
3 0 -
1 0 -
• Dima ' Paradijs
« Nickerie - SML 77a
o SML 80/5 ' SML 81b and 80/7
1956
X * 4
1956/57
• f »
'$4 s« q<*^
1 1 r-
-
7 0 -
50 -
30 -
10-
1957 o
A
O
• i
1958
y P D
( f ** .* D
10 30 50 70 90 10 30
Percentage cracked grain
50 70 90
Fig. 51. Relation between cracked grain in paddy and breakage in white rice for a few varieties during 1956 to 1958.
224
quantities almost the same relation was found in 1956 and 1957. If the percentage breakage is denoted by y while x signifies the percentage cracked grain, the regression line for 1956 can be represented by y =- 0.27x + 10.3. For 1957 the corresponding formula would be y = 0.3 lx + 11.1. The regression curves for 1956/57 and 1958 likewise bore a great resemblance to each other. For the former season, with cracked grain percentages ranging from 0 to 70, a relation of y = 0.56x + 7.6 was found, whereas the regression line for 1958 could be represented by y = 0.58x + 13.9. The percentage breakage was therefore about 6 units lower in 1956/57 than in 1958, which mjans that in the first season the grain was less breakable.
The gradient of the regression line is closely related to the nature of cracking, the process of which is shown by figure 49 to be insufficiently characterized by the amount of cracked grains. The results of 1956/57, 1957 and 1958 show that the gradient increases as the percentage cracked grain rises above approximately 60. This tendency becomes more marked if samples harvested still later are included in the investigation. Besides the percentage cracked grain, therefore, the way in which the grains are cracked also affects the milling results.
Figure 52 brings out the relationship between cracking and breakage for some of the same varieties and SML 77a and D 110 from 1958 to 1962/63. These results show that in some seasons the amounts of cracked grain of various rice varieties are an im reliable index of the percentage breakage to be expected in milling. Available data show that low cracking in these cases is mostly followed by high breakage, which suggests that other factors made the grain more fragile. As such may be mentioned: (1) attacks by diseases, (2) lodging and (3) unfavourable weather during and after maturation. The effect of the last factor is complicated as weather affects the content of chalky or milk-white spotted grains as well as the way in which cracking progresses. Moreover we must not rule out the chance that on rainy days part of the cracks may disappear while the grains retain a relatively greater sensitivity to breakage.
[n figure 52 the regression curves of Dima, SML 77a and SML 81b in 1958 ran almost parallel but the percentage breakage of SML 81b was about 4 units higher than that of the first two varieties. This, too, goes to show that the grain of SML 81b is more fragile than that of the Dima group. The regression curves of Dima and Skk for 1958 also had the same gradient, but over the whole range of cracked grain percentages the amount of breakage of Skk was some 6 percentage units below that of Dima. This difference is put down to the smaller grain-length of Skk and may probably be associated also with the fewer broken grains in this variety (see fig. 48). The regression line of D 110 in 1958 rose a bit more steeply than that of Skk.
In 1960 a more unfavourable relationship between cracking and breakage was observed in Skk and D 110. In both varieties a rise in cracked grain percentage was accompanied by an almost equal rise in percentage breakage. In SML 77a breakage appeared in 1960 to be less dependent on cracking than it had been in 1958. The favourable slope of the regression curves of SML 140/5 and SML 140/10 in 1960 is associated with an exceptionally low percentage of broken grains in the rough rice of these varieties in that season (see fig. 49).
225
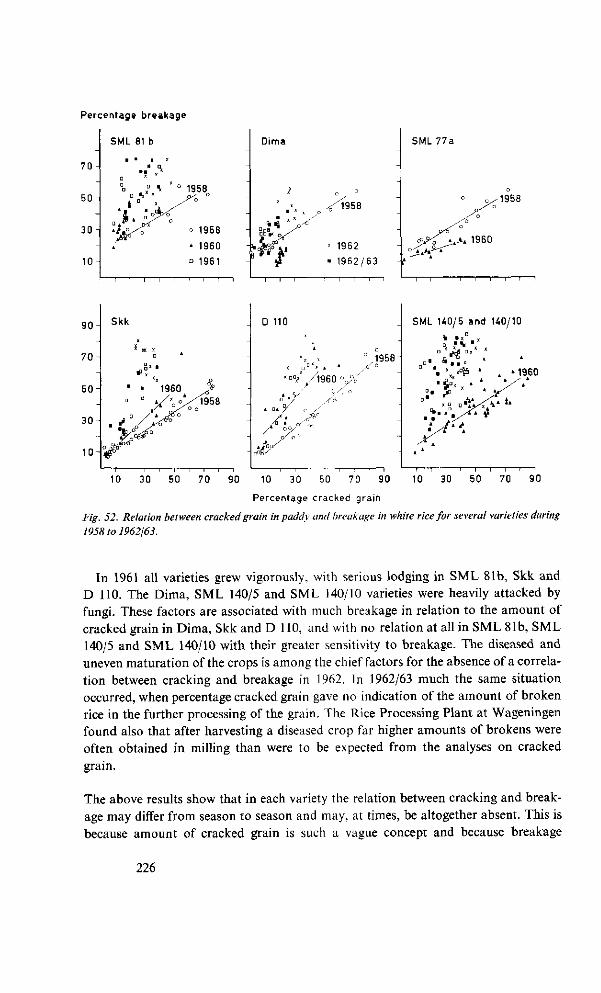
Percentage breakage
7 0 -
5 0 -
3 0 -
10-
SML 81 b
• • • X
" X G X
? \ ' ° n "x* »
0 * O'S
1958 O-' °
° 1958
» 1960
D 1961
Dima
/
n 4 4 * "o-^ '
tiff
o
^ 1 9 5 8
« 1962
• 1962/63
SML 77a
1958
- i — i — i — i
9 0 -
7 0 -
5 0 -
3 0 -
10 -
Skk
• > 1960
O
D 110
*•
"DD/ , / l 9 6 0 <
/• ' f f * 1 "
<r o '
o
19 ,0 U
^
SML 140/5 a
* . x D
o ; v • o ^ o ,
• "x » *
o • * ' • ' « ' . • ^ A D «° ü'*ï> °-'\/t> ' y» «* r 4
1 ' • ! ' 1 1
id 140/10
X *
' A * 1960 . / i
k x ^ ' J ' V
— i — i — i — i
10 30 50 70 90 10 30 50 70 90 10 30 50 70 90
Percentage cracked grain
Fig. 52. Relation between cracked grain in paddy and breakage in white rice for several varieties during
1958 to 1962/63.
In 1961 all varieties grew vigorously, with serious lodging in SML 81b, Skk and D 110. The Dima, SML 140/5 and SML 140/10 varieties were heavily attacked by fungi. These factors are associated with much breakage in relation to the amount of cracked grain in Dima, Skk and D 110, and with no relation at all in SML 81b, SML 140/5 and SML 140/10 with their greater sensitivity to breakage. The diseased and uneven maturation of the crops is among the chief factors for the absence of a correlation between cracking and breakage in 1962. In 1962/63 much the same situation occurred, when percentage cracked grain gave no indication of the amount of broken rice in the further processing of the grain. The Rice Processing Plant at Wageningen found also that after harvesting a diseased crop far higher amounts of brokens were often obtained in milling than were to be expected from the analyses on cracked grain.
The above results show that in each variety the relation between cracking and breakage may differ from season to season and may, at times, be altogether absent. This is because amount of cracked grain is such a vague concept and because breakage
226
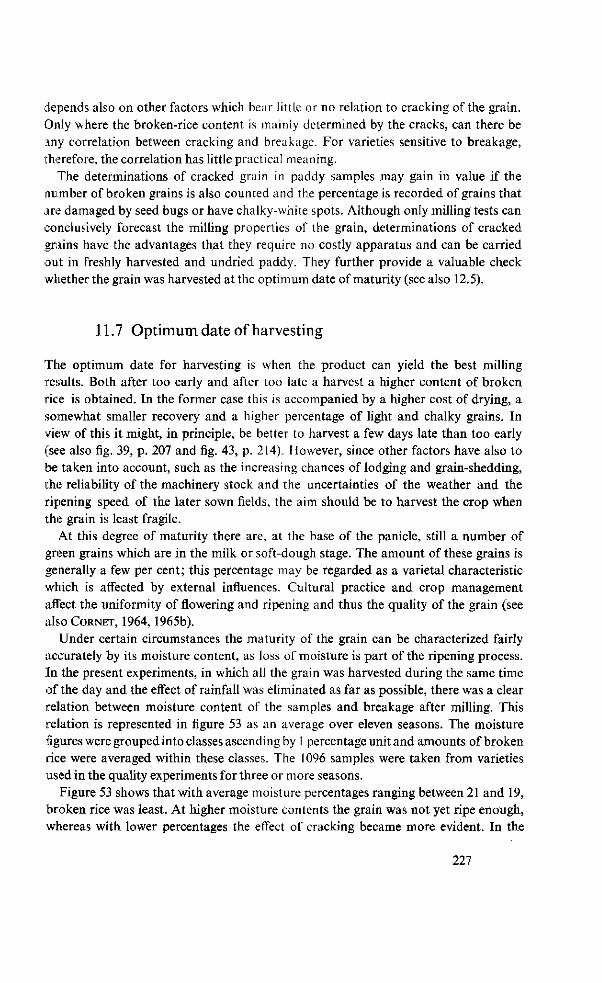
depends also on other factors which bear little or no relation to cracking of the grain. Only where the broken-rice content is mainly determined by the cracks, can there be any correlation between cracking and breakage. For varieties sensitive to breakage, therefore, the correlation has little practical meaning.
The determinations of cracked grain in paddy samples may gain in value if the number of broken grains is also counted and the percentage is recorded of grains that are damaged by seed bugs or have chalky-white spots. Although only milling tests can conclusively forecast the milling properties of the grain, determinations of cracked grains have the advantages that they require no costly apparatus and can be carried out in freshly harvested and undried paddy. They further provide a valuable check whether the grain was harvested at the optimum date of maturity (see also 12.5).
11.7 Optimum date of harvesting
The optimum date for harvesting is when the product can yield the best milling results. Both after too early and after too late a harvest a higher content of broken rice is obtained. In the former case this is accompanied by a higher cost of drying, a somewhat smaller recovery and a higher percentage of light and chalky grains. In view of this it might, in principle, be better to harvest a few days late than too early (see also fig. 39, p. 207 and fig. 43, p. 214). However, since other factors have also to be taken into account, such as the increasing chances of lodging and grain-shedding, the reliability of the machinery stock and the uncertainties of the weather and the ripening speed of the later sown fields, the aim should be to harvest the crop when the grain is least fragile.
At this degree of maturity there are, at the base of the panicle, still a number of green grains which are in the milk or soft-dough stage. The amount of these grains is generally a few per cent; this percentage may be regarded as a varietal characteristic which is affected by external influences. Cultural practice and crop management affect the uniformity of flowering and ripening and thus the quality of the grain (see also CORNET, 1964,1965b).
Under certain circumstances the maturity of the grain can be characterized fairly accurately by its moisture content, as loss of moisture is part of the ripening process. In the present experiments, in which all the grain was harvested during the same time of the day and the effect of rainfall was eliminated as far as possible, there was a clear relation between moisture content of the samples and breakage after milling. This relation is represented in figure 53 as an average over eleven seasons. The moisture figures were groupedinto classes ascendingby 1 percentage unit and amounts of broken rice were averaged within these classes. The 1096 samples were taken from varieties used in the quality experiments for three or more seasons.
Figure 53 shows that with average moisture percentages ranging between 21 and 19, broken rice was least. At higher moisture contents the grain was not yet ripe enough, whereas with lower percentages the effect of cracking became more evident. In the
227
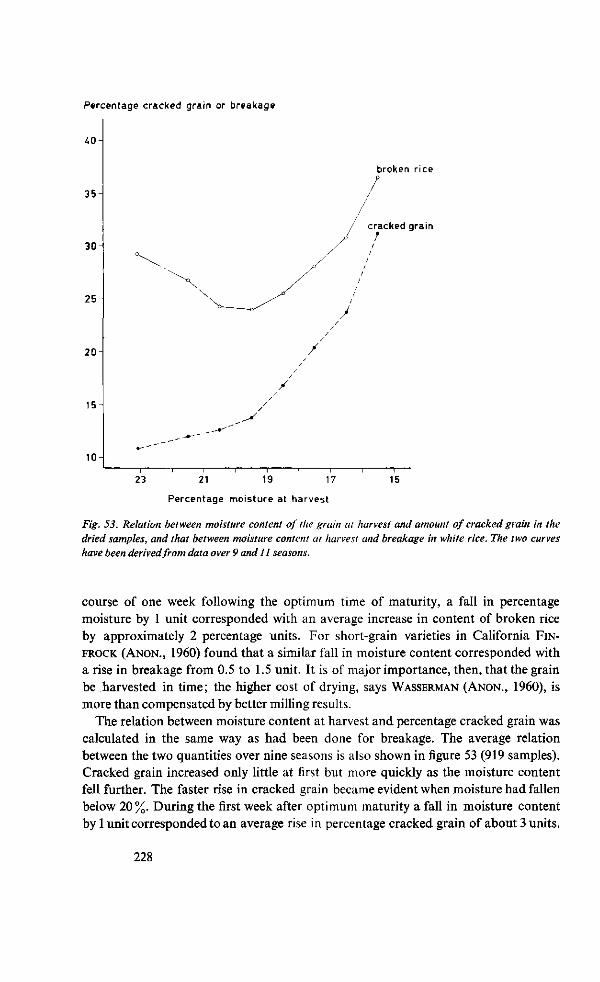
Percentage cracked grain or breakage
40
3 5 -
30
25
2 0 -
15-
10
broken r ice
/ /
23 21 19 17 15
Percentage moisture at harvest
Fig. 53. Relation between moisture content of the grain at harvest and amount of cracked grain in the dried samples, and that between moisture content at harvest and breakage in white rice. The two curves have been derived from data over 9 and 11 seasons.
course of one week following the optimum time of maturity, a fall in percentage moisture by 1 unit corresponded with an average increase in content of broken rice by approximately 2 percentage units. For short-grain varieties in California FIN-FROCK (ANON., 1960) found that a similar fall in moisture content corresponded with a rise in breakage from 0.5 to 1.5 unit. It is of major importance, then, that the grain be harvested in time; the higher cost of drying, says WASSERMAN (ANON., 1960), is more than compensated by better milling results.
The relation between moisture content at harvest and percentage cracked grain was calculated in the same way as had been done for breakage. The average relation between the two quantities over nine seasons is also shown in figure 53 (919 samples). Cracked grain increased only little at first but more quickly as the moisture content fell further. The faster rise in cracked grain became evident when moisture had fallen below 20%. During the first week after optimum maturity a fall in moisture content by 1 unit corresponded to an average rise in percentage cracked grain of about 3 units.
228
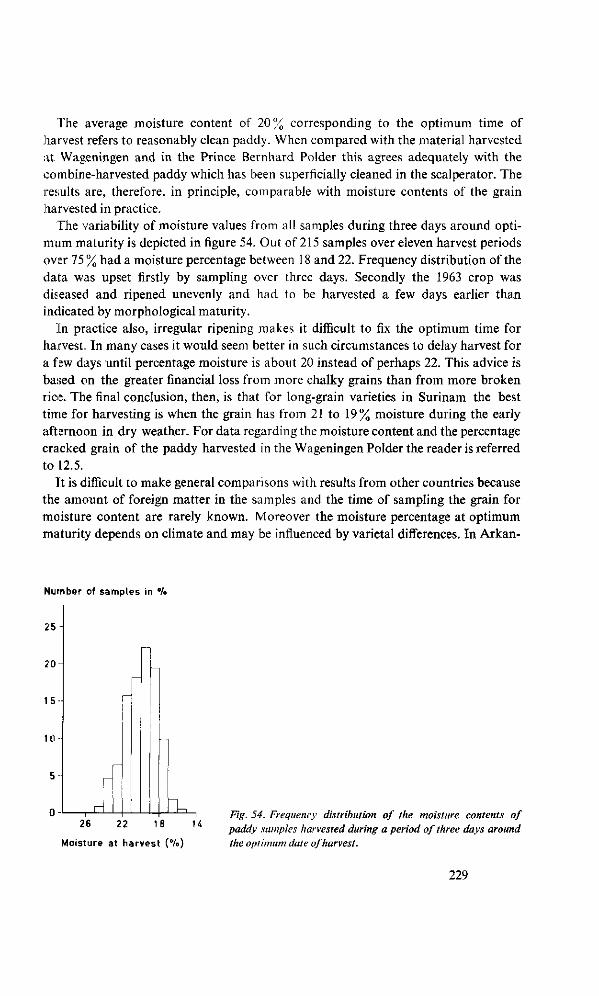
The average moisture content of 20% corresponding to the optimum time of harvest refers to reasonably clean paddy. When compared with the material harvested at Wageningen and in the Prince Bernhard Polder this agrees adequately with the combine-harvested paddy which has been superficially cleaned in the scalperator. The results are, therefore, in principle, comparable with moisture contents of the grain harvested in practice.
The variability of moisture values from all samples during three days around optimum maturity is depicted in figure 54. Out of 215 samples over eleven harvest periods over 75 % had a moisture percentage between 18 and 22. Frequency distribution of the data was upset firstly by sampling over three days. Secondly the 1963 crop was diseased and ripened unevenly and had to be harvested a few days earlier than indicated by morphological maturity.
In practice also, irregular ripening makes it difficult to fix the optimum time for harvest. In many cases it would seem better in such circumstances to delay harvest for a few days until percentage moisture is about 20 instead of perhaps 22. This advice is based on the greater financial loss from more chalky grains than from more broken rice. The final conclusion, then, is that for long-grain varieties in Surinam the best time for harvesting is when the grain has from 21 to 19% moisture during the early afternoon in dry weather. For data regarding the moisture content and the percentage cracked grain of the paddy harvested in the Wageningen Polder the reader is referred to 12.5.
It is difficult to make general comparisons with results from other countries because the amount of foreign matter in the samples and the time of sampling the grain for moisture content are rarely known. Moreover the moisture percentage at optimum maturity depends on climate and may be influenced by varietal differences. In Arkan-
Number of samples in %
25
15
111
J ± 26 22 18 U
Moisture at harvest (7o)
Fig. 54. Frequency distribution of the moisture contents of paddy samples harvested during a period of three days around the optimum date of harvest.
229
sas MCNEAL (1950) found a range of optimum moisture from 23 to 17% for some varieties. Similar figures are given in more recent American literature for the best condition for harvesting. In France CORNI:r (1965a) gives a range from 24 to 22%, while NAGAI (1959) states that the harvested grain in Japan usually has 20 to 25% moisture.
If, on the other hand, the product is intended for seed, it is generally better to delay harvesting until moisture content is lower. This will mean a slightly higher output of high grade seed and cheaper drying. Cracking is of no importance to seed quality; GREGG et al. (1957) proved this experimentally. Harvesting too late, however, should be avoided as well. In addition to the risks already mentioned a later harvest would involve a higher percentage of hulled grains, which is a financial loss. As a standard for harvesting seed rice a moisture content of about 18 % can be adopted.
11.8 Summary
During eleven seasons the effect was investigated of date of harvesting on some quality characteristics of the grain. Optimum harvesting date (technological maturity) is defined as the time for reaping, when the product will yield the best milling results. In the week before optimum maturity percentage moisture of the grain in the field fell by an average of 0.3 a day; in the next three days the decrease was about 0.6 a day, after which the rate gradually diminished. Slow drying seems conducive to good milling results.
The output of milled rice from immature grain was slightly less than that from ripe or overripe grain; over about 20 days around optimum maturity output rose, on an average, by 0.05 % per day. This very slight increase is attributed to adequate cleaning so that a prematurely harvested sample had few light and green grains, which would otherwise have had a strong adverse effect on milling recovery. Near optimum maturity milling output of the different varieties ranged between about 69 and 71 %; for Dima the figure was 0 to 1 unit higher than for the SML varieties, Skk and D 110. The differences observed are ascribed to the effect of external factors, such as diseases and lodging, on the uniformity of maturation, and to varietal characteristics such as grain shape, proportion of husk and hardness of the endosperm.
Unripe grain is more fragile during milling because of green or chalky kernels and probably also of other incompletely matured grains, which are scarcely distinguishable from ripe ones. After optimum maturity the decrease in immature grains still continues but its effect is nullified by an increase in cracking. The amount of broken rice at the optimum date of harvest depends on varietal properties of the grain, weather during ripening, incidence of disease and lodging, and on many other factors influencing the uniformity of maturation. The composition of the grain in the field at optimum maturity and the weather conditions thereafter determine the increase in breakage with a delay in harvesting.
On varietal differences in breakage behaviour in relation to harvesting date, the
230
varieties have been classified into three groups represented by Dima, SML 81b and Skk. Causes of the varietal differences were discussed. On an average over several seasons the fall in amount of broken rice of the Dima and SML 81b groups, during half a week before technological maturity, was 1 percentage unit a day in seasons with little breakage and 2 units per day in seasons with much breakage. During the first week after optimum maturity (in favourable weather, in the absence of lodging and with a healthy crop) an average increase in percentage breakage of 1 unit a day may be expected for the Dima and SML 81b groups. If, on the other hand, the ripening is under adverse conditions, an average daily rise by 2 percentage units may be anticipated.
The amount of cracked grain was mainly conditioned by three factors; moisture content of the grain, uniformity of ripening and weather conditions. On average over a series of seasons the percentage cracked grain increased by 1 to 2 units a day during a period of two weeks following optimum maturity.
Extensive studies showed that the relation between cracking in paddy and breakage in milled rice depends on variety but may differ from season to season and is sometimes altogether absent. Three reasons are: (1) percentage cracked grains does not indicate the number of cracks per grain, nor whether the grains have split through cracking; (2) more broken rice is obtained from immature grain, despite the low amount of cracked grains; (3) breakage is caused not only by cracking but also by such factors as disease and lodging, which are not much related to cracking. Only where fragility is mainly due to cracking can there be a clear correlation between cracked grain in paddy and breakage after milling. With all varieties tested and in all seasons the determinations of cracked grain proved a valuable check whether the harvest had been well timed.
The maturity of the grain can, under certain conditions, be characterized fairly accurately by moisture content. In the present experiments it was found that average breakage was least when moisture was from 21 to 19%. During one week after optimum maturity a fall in moisture content of 1 percentage unit corresponded with an average rise in percentage breakage of about 2 units. However, if the grain is intended for seed, harvest should be delayed till moisture is approximately 18 %.
231
12 Research into some quality characteristics of the grain
12.1 Introduction
The concept of quality in paddy, husked rice (cargo) or milled rice covers a range of properties, each of which has a bearing on the ultimate use of the product. The various ratings of the product's quality are mostly of limited value in themselves; in many cases they slightly overlap.
The moisture content, 1000-grain weight, hectolitre weight and grain dimensions of paddy samples, and output of cargo or of white rice and percentage breakage give important information. Other properties of paddy relate to the uniformity of the grain, and content of foreign matter such as red rice and weed seeds. For husked rice percentage breakage is one of the most important features of quality. Hulling and whitening bring out also such properties as the presence of chalky, yellow, damaged and conical grains and the translucency of the product. To get a good impression of the commercial value of rice, culinary and tasting tests are equally necessary, and physicochemical investigations of white rice are required if the product is intended for more specific uses.
The quality studies related first to the stage of maturity at harvest (see chapter 11) and secondly to determinations that were of importance to breeding. The present chapter summarizes work on grain dimensions, 1000-grain weight and water-uptake capacity of different varieties, and on physicochemical examinations of rice samples at Beaumont (Texas) and Detmold (Germany). The chapter closes with a review of the quality of paddy harvested in the Wageningen Polder during 1956 to 1963. Samples were analysed by the Rice Processing Plant and we processed the data.
12.2 Grain dimensions and 1000-grain weight
The 1000-grain weight and the dimensions of grains are useful values and are specific to each variety, apart from some variation with growth conditions and cleaning. If, however, determinations take place over a number of seasons and relate to varieties grown under similar conditions, these figures are reliable as varietal characteristics.
Grains were measured with a Schlieper micrometer, directly readable to 0.1 mm. Each value was based on 50 hand-husked grains; width and thickness refer to the largest diameter. The 1000-grain weight was estimated from three lots of 500 grains (cleaned paddy) ; values were converted to 10 % moisture.
232
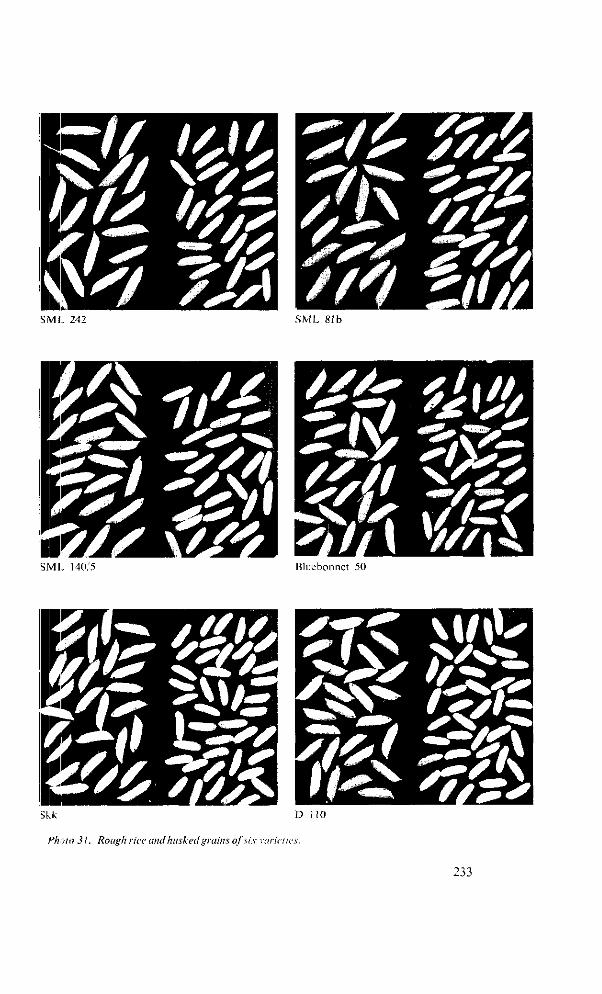
SML 81b
SML 140/5 Bluebonnct 50
D 110
Photo 31. Rough rice and husked grains of six varieties.
233
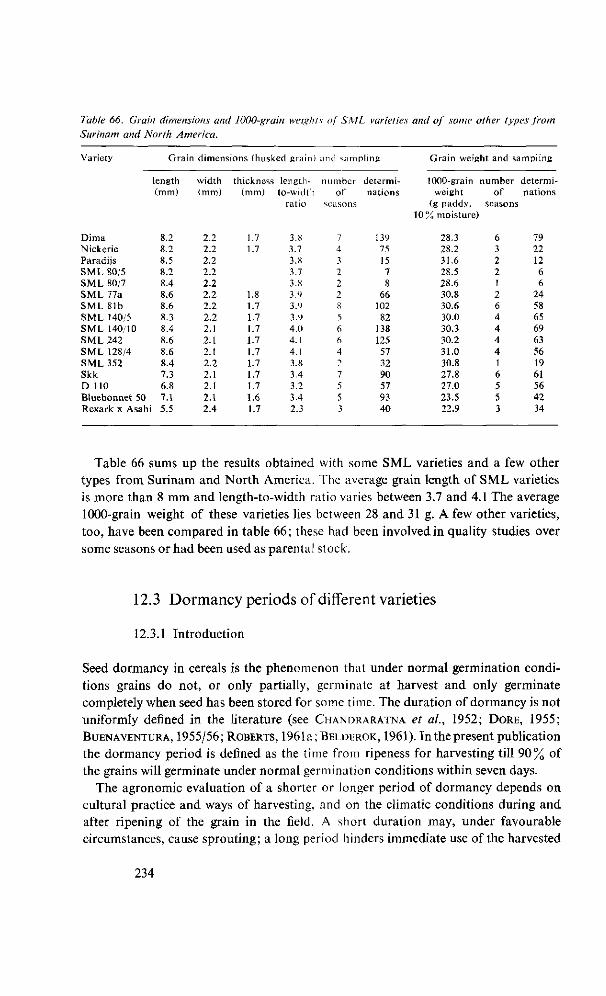
Table 66. Grain dimensions and 1000-grain weights of S ML varieties and of some other types from
Surinam and North America.
Variety
Dima Nickerie Paradijs SML 80/5 SML 80/7 SML 77a SML 81b SML 140/5 SML 140/10 SML 242 SML 128/4 SML 352 Skk D 110 Bluebonnet 50 Rexark x Asahi
Grain
length (mm)
8.2 8.2 8.5 8.2 8.4 8.6 8.6 8.3 8.4 8.6 8.6 8.4 7.3 6.8 7.1
i 5.5
dimensions (hus
width (mm)
2.2 2.2 2.2 2.2 2.2 2.2 2.2 2.2 2.1 2.1 2.1 2.2 2.1 2.1 2.1 2.4
iked grain)
thickness length-(mm)
1.7 1.7
1.8 1.7 1.7 1.7 1.7 1.7 1.7 1.7 1.7 1.6 1.7
to-width ratio
3.8 3.7 3.8 3.7 3.S 3.9 3.9 3.9 4.0 4.1 4.1 3.8 3.4 3.2 3.4 2.3
and sampling
number of'
seasons
7 4 3 2 2 2 8 5 6 6 4 t
7 5 5 3
determinations
139 75 15 7 8
66 102 82
138 125 57 32 90 57 93 40
Grain weight and sampling
1000-grain : weight
(g paddy, 10% moisture)
28.3 28.2 31.6 28.5 28.6 30.8 30.6 30.0 30.3 30.2 31.0 30.8 27.8 27.0 23.5 22.9
number of
seasons
6 3 2 2 1 2 6 4 4 4 4 1 6 5 5 3
determinations
79 22 12 6 6
24 58 65 69 63 56 19 61 56 42 34
Table 66 sums up the results obtained with some SML varieties and a few other types from Surinam and North America. The average grain length of SML varieties is more than 8 mm and length-to-width ratio varies between 3.7 and 4.1 The average 1000-grain weight of these varieties lies between 28 and 31 g. A few other varieties, too, have been compared in table 66; these had been involved in quality studies over some seasons or had been used as parental slock.
12.3 Dormancy periods of different varieties
12.3.1 Introduction
Seed dormancy in cereals is the phenomenon that under normal germination conditions grains do not, or only partially, germinate at harvest and only germinate completely when seed has been stored for some time. The duration of dormancy is not uniformly defined in the literature (see CHANDRARATNA et al., 1952; DORE, 1955; BUENAVENTURA, 1955/56; ROBERTS, 1961a; BELDKROK, 1961). In the present publication the dormancy period is defined as the time from ripeness for harvesting till 90% of the grains will germinate under normal germination conditions within seven days.
The agronomic evaluation of a shorter or longer period of dormancy depends on cultural practice and ways of harvesting, and on the climatic conditions during and after ripening of the grain in the field. A short duration may, under favourable circumstances, cause sprouting; a long period hinders immediate use of the harvested
234
grain for seed. A long dormancy may furthermore cause much trouble from dropseed growth in the next crop.
The causes of dormancy in rice are yet unknown. For rice (ROBERTS, 1961b) and wheat (BELDEROK, 1961) water uptake by the grain was independent of dormancy. ROBERTS (1961b) showed that germination was inhibited by the husks, and by the pericarp or testa, or both. Duration of dormancy can be shortened by storing the seed in oxygen for some time; higher storage temperatures weaken the effect of oxygen (ROBERTS, 1962).
ROBERTS (1962) found a negative linear relation between storage temperature and log. mean dormancy period over the range from 27° to 47 °C. On the basis of this he devised a simple procedure to break or shorten the dormancy of paddy by keeping the dried seed for seven days at 47 °C. This method is useful in breeding work where two or three generations are grown per year (CARPENTER and ROBERTS, 1962). This heat treatment of seed was afterwards tested on a large scale in the Philippines (JENNINGS
and DE JESUS, 1964). They recommend keeping the seed for four or five days at 50°C to break dormancy. For deeply dormant seed this treatment must be continued a few days longer. Undried grain may be used if the treatment allows rapid drying, as high temperature and high percentage moisture together are detrimental to viability (e.g., HUTCHINSON, 1944; MCFARLANE^O/ . , 1955).
GHOSH (1960, 1962) found that the dormancy period of rice depends on the weather during grain formation; grain tested soon after harvesting in the dry season germinated better than after harvesting in the wet season. The experience of JENNINGS and DE JESUS (1964) is in agreement with this. In the case of wheat BELDEROK (1961, 1964, 1965) observed that the dormancy period of a certain variety was not the same every year. He found a negative relation between the average diurnal temperature in the dough stage of the grain and duration of dormancy. At the same average diurnal temperature a lengthening of the dough stage shortened dormancy. Continued research (BELDEROK, 1963) revealed that the dormancy of wheat and barley is related to the incompleteness of protein synthesis in the embryo at harvesting maturity. No changes occurred at first in the nitrogen compounds in the embryos of dormant grains; later there was a gradual decrease in soluble proteins and an equal increase in insoluble ones. In the endosperm nitrogen compounds did not change during after-ripening of the seed.
The occurrence of similar processes during ripening of rice grains in the field and during after-ripening is suggested likely by the work of KESTER et al. (1963). Nitrogen compounds soluble in 1 % NaCl from milled Caloro and Calrose rice fell during ripening to a constant value a few weeks after the grain was ripe. Water-extractable amino nitrogen in Calrose in 1957 declined as ripening progressed. According to BELDEROK (personal information) the lapse of time before soluble protein acquires a constant value is related to the dormancy period of the grain. This opinion is strengthened by the data of KESTER et al. (1963) as the dormancy periods of Caloro and Calrose are about one or two weeks.
235
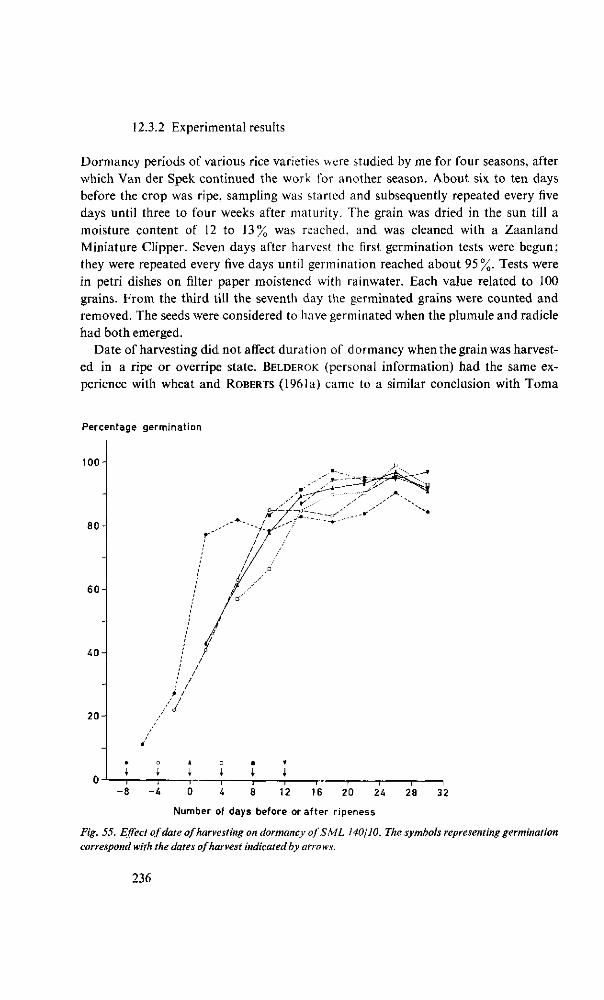
12.3.2 Experimental results
Dormancy periods of various rice varieties were studied by me for four seasons, after which Van der Spek continued the work for another season. About six to ten days before the crop was ripe, sampling was started and subsequently repeated every five days until three to four weeks after maturity. The grain was dried in the sun till a moisture content of 12 to 13% was reached, and was cleaned with a Zaanland Miniature Clipper. Seven days after harvest the first germination tests were begun; they were repeated every five days until germination reached about 95%. Tests were in petri dishes on filter paper moistened with rainwater. Each value related to 100 grains. From the third till the seventh day the germinated grains were counted and removed. The seeds were considered to have germinated when the plumule and radicle had both emerged.
Date of harvesting did not affect duration of dormancy when the grain was harvested in a ripe or overripe state. BELDEROK (personal information) had the same experience with wheat and ROBERTS (1961a) came to a similar conclusion with Toma
Percentage germination
100 -
80
60
40
2 0 -
J I I i i ~~i r p 1 1 r i 1 r
- 8 - 4 0 4 8 12 16 20 24 28 32
Number of days before or a f ter r ipeness
Fig. 55. Effect of date of harvesting on dormancy of S ML 140/10. The symbols representing germination correspond with the dates of harvest indicated by arro ws.
236
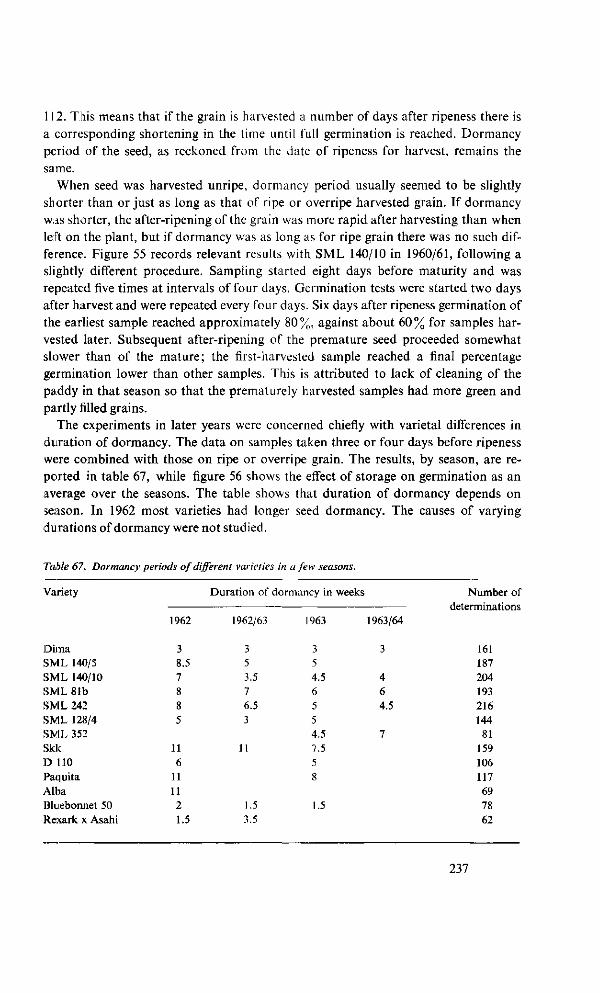
112. This means that if the grain is harvested a number of days after ripeness there is a corresponding shortening in the time until full germination is reached. Dormancy period of the seed, as reckoned from the date of ripeness for harvest, remains the same.
When seed was harvested unripe, dormancy period usually seemed to be slightly shorter than or just as long as that of ripe or overripe harvested grain. If dormancy was shorter, the after-ripening of the grain was more rapid after harvesting than when left on the plant, but if dormancy was as long as for ripe grain there was no such difference. Figure 55 records relevant results with SML 140/10 in 1960/61, following a slightly different procedure. Sampling started eight days before maturity and was repeated five times at intervals of four days. Germination tests were started two days after harvest and were repeated every four days. Six days after ripeness germination of the earliest sample reached approximately 80%, against about 60% for samples harvested later. Subsequent after-ripening of the premature seed proceeded somewhat slower than of the mature; the first-harvested sample reached a final percentage germination lower than other samples. This is attributed to lack of cleaning of the paddy in that season so that the prematurely harvested samples had more green and partly filled grains.
The experiments in later years were concerned chiefly with varietal differences in duration of dormancy. The data on samples taken three or four days before ripeness were combined with those on ripe or overripe grain. The results, by season, are reported in table 67, while figure 56 shows the effect of storage on germination as an average over the seasons. The table shows that duration of dormancy depends on season. In 1962 most varieties had longer seed dormancy. The causes of varying durations of dormancy were not studied.
Table 67. Dormancy periods of different varieties in a few seasons.
Variety
Dima SML 140/5 SML 140/10 SML 81b SML 242 SML 128/4 SML 352 Skk D HO Paquita Alba Bluebonnet 50 Rexark x Asahi
1962
3 8.5 7 8 8 5
11 6
11 11 2 1.5
Duration of
1962/63
3 5 3.5 7 6.5 3
11
1.5 3.5
dormancy in
1963
3 5 4.5 6 5 5 4.5 7.5 5 8
1.5
weeks
1963/64
3
4 6 4.5
7
Number of determinations
161 187 204 193 216 144 81
159 106 117 69 78 62
237
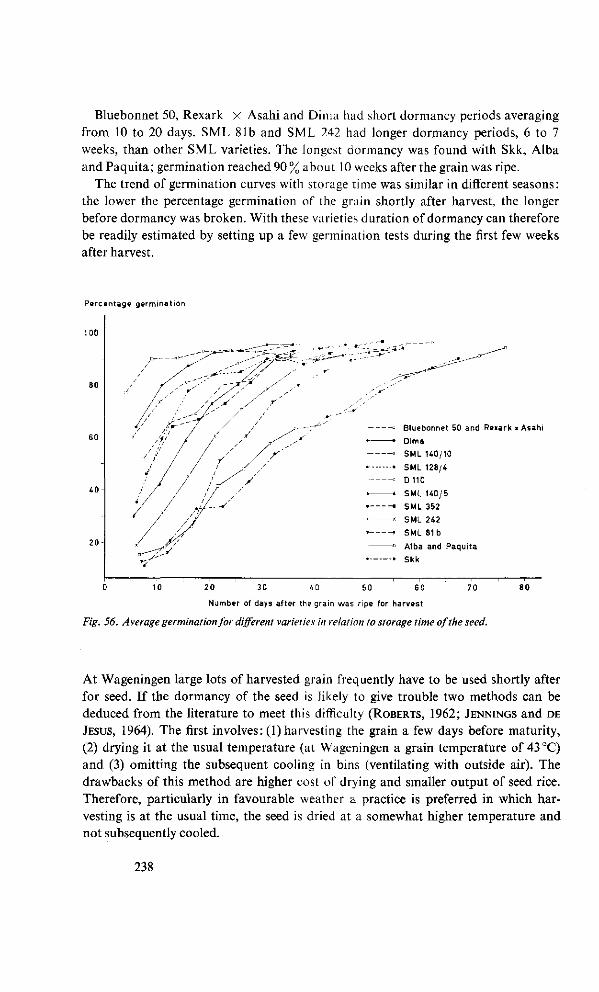
Bluebonnet 50, Rexark x Asahi and Di ma had short dormancy periods averaging from 10 to 20 days. SML 81b and SML 242 had longer dormancy periods, 6 to 7 weeks, than other SML varieties. The longest dormancy was found with Skk, Alba and Paquita; germination reached 90 % about 10 weeks after the grain was ripe.
The trend of germination curves with storage time was similar in different seasons: the lower the percentage germination of the grain shortly after harvest, the longer before dormancy was broken. With these varieties duration of dormancy can therefore be readily estimated by setting up a few germination tests during the first few weeks after harvest.
Percentage germination
100
60
4 0 -
20
i^ä5:
Bluebonnet 50 and Rexark x Asahi
Dima
SML U0/10
SML 128/4
D 110
SML 140/5
SML 352
SML 242
SML 81b
Alba and Paquita
Skk
10 70 20 30 40 50 60
Number of days after the grain was ripe for harvest
Fig. 56. Average germination for different varieties in relation to storage time of the seed.
80
At Wageningen large lots of harvested grain frequently have to be used shortly after for seed. If the dormancy of the seed is likely to give trouble two methods can be deduced from the literature to meet this difficulty (ROBERTS, 1962; JENNINGS and DE
JESUS, 1964). The first involves: (1)harvesting the grain a few days before maturity, (2) drying it at the usual temperature (at Wageningen a grain temperature of 43 °C) and (3) omitting the subsequent cooling in bins (ventilating with outside air). The drawbacks of this method are higher cost of drying and smaller output of seed rice. Therefore, particularly in favourable weather a practice is preferred in which harvesting is at the usual time, the seed is dried at a somewhat higher temperature and not subsequently cooled.
238
12.4 Physicochemical characteristics of rice
12.4.1 Introduction
The demands made on milled rice may vary from country to country with eating habits and with special processing of the product in the food industry. As the products of the Wageningen Project are mainly exported to Europe where they compete with rice from the United States, Thailand and Burma, the cooking and processing properties must accord fairly well with those made in North America on long-grain varieties. The rice must cook dry and fluffy, the individual grains must remain intact, must not stick together and must have good consistency. Particularly for parboiling, canning and preparing quick-cooking products high demands are made on the integrity of the grains and cooking consistency.
Quality testing of milled SML rice can therefore be based on physicochemical tests that have been adopted in America for evaluating cooking and processing behaviour of varieties and promising lines. Several quick and fairly simple methods have been devised for this purpose. Some of these procedures require only small samples and thus are suitable for use in breeding. Selections with undesirable cooking and processing properties can thus be eliminated early (see also BEACHELL and HALICK, 1957 a, b).
Milled rice is about 90% starch. Besides the starch fractions (amylose and amylo-pectin) the nature and quantity of other grain components such as cell-wall material and proteins, probably influence the swelling and disintegration during and after cooking (LITTLE and DAWSON, 1960). HALICK and KELLY (1959), HALICK (1961), KESTER (1961), STANSEL et al. (1961) and BEACHELL and STANSEL (1963) point out that the growth conditions for the crop also affect the physicochemical properties. Much more research is still necessary to elucidate these influences and the relation between physicochemical values and the behaviour of rice when cooked and steamed, whether under high pressure or not. An extensive review of these determinations and of experimental results in the Philippines is given by JULIANO et al. (1964a). German research in this field has been described by PELSHENKE and HAMPEL (1958, 1960).
The testing of SML breeding material for its culinary quality has been on a limited scale. Milled samples of promising lines were given to several persons for them to judge the culinary quality and taste after cooking by the usual methods. In 1959, 1960 and 1962 samples of different varieties and promising lines were sent to the Regional Rice Quality Testing Laboratory at Beaumont and to the Federal German Research Institution for Cereal Processing at Detmold for a physicochemical examination. The results confirmed general experience that the cooking characteristics of rice broadly correspond with the classification of varieties into short-, medium- and long-grain types. As since 1958 rather frequent use has been made of short- and medium-grain varieties for hybridization, more attention should be paid to quality testing in breeding stock. So various methods of determining the physicochemical properties of rice will be discussed in more detail.
239
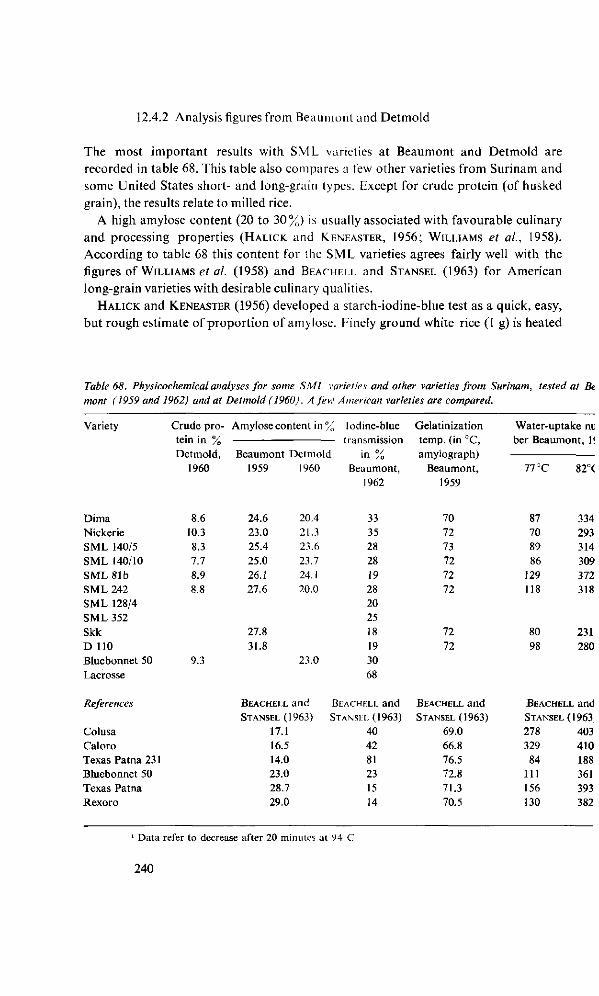
12.4.2 Analysis figures from Beaumont and Detmold
The most important results with SML varieties at Beaumont and Detmold are
recorded in table 68. This table also compares a few other varieties from Surinam and
some United States short- and long-grain types. Except for crude protein (of husked
grain), the results relate to milled rice.
A high amylose content (20 to 30%) is usually associated with favourable culinary
and processing properties (HALICK and KENEASTER, 1956; WILLIAMS et al., 1958).
According to table 68 this content for the SML varieties agrees fairly well with the
figures of WILLIAMS et al. (1958) and BEACHELL and STANSEL (1963) for American
long-grain varieties with desirable culinary qualities.
HALICK and KENEASTER (1956) developed a starch-iodine-blue test as a quick, easy,
but rough estimate of proportion of amylose. Finely ground white rice (1 g) is heated
Table 68. Physicochemical analyses for some SML varieties and other varieties from Surinam, tested at Be mont (1959 and 1962) and at Detmold (1960). A few American varieties are compared.
Variety
Dima Nickerie
SML 140/5 SML 140/10
SML 81b SML 242 SML 128/4
SML 352
Skk D 110 Bluebonnet 50
Lacrosse
References
Colusa
Caloro Texas Patna 231 Bluebonnet 50
Texas Patna
Rexoro
Crude protein in %
Detmold, 1960
8.6
10.3
8.3 7.7
8.9 8.8
9.3
Amylose content in %
ß A i n m r t t i t T l p tmAl H
1959
24.6 23.0
25.4
25.0 26.1 27.6
27.8
31.8
1960
20.4
21.3 23.6
23.7
24.1 20.0
23.0
Iodine-blue transmission
in % Beaumont,
1962
33
35 28
28
19 28
20 25
18
19
30 68
BEACHELL and BEACHELL and STANSEL (1963) STANSEL (1963)
17.1 16.5
14.0 23.0 28.7 29.0
40 42
81 23
15 14
Gelatinization temp, (in °C, amylograph)
Beaumont,
1959
70
72
73 72
72 72
72
72
BEACHELL and STANSEL (1963)
69.0
66.8 76.5 72.8
71.3 70.5
Water-uptake nu ber Beaun
77 °C
87
70 89
86
129 118
80
98
lont, 1:
82°(
334 293 314
309 372
318
231
280
BEACHELL and
STANSEL (1963 278
329 84
111 156
130
403 410 188 361
393 382
1 Data refer to decrease after 20 minutes at 94 C
240
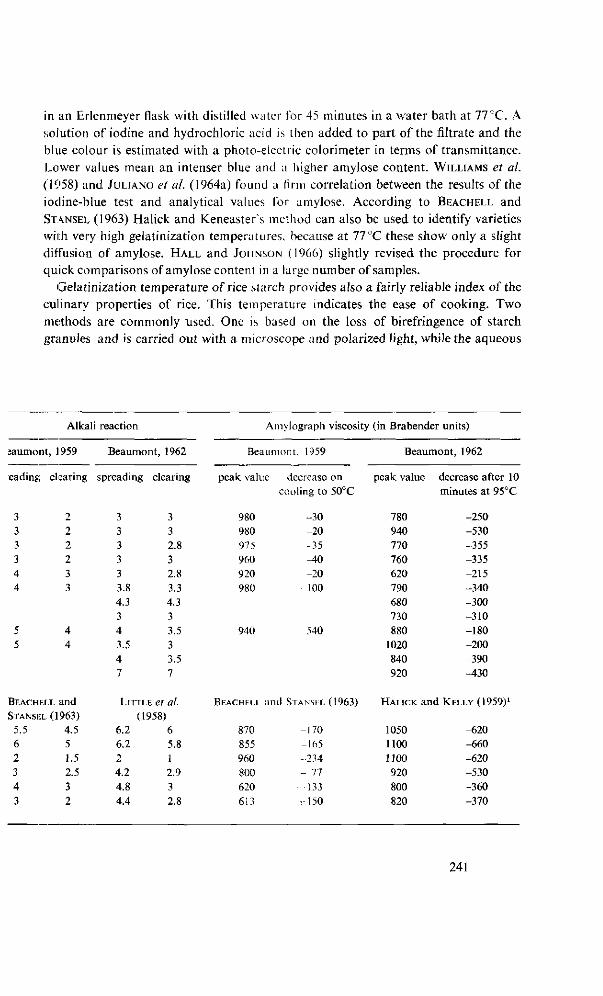
in an Erlenmeyer flask with distilled water for 45 minutes in a water bath at 77 CC. A solution of iodine and hydrochloric acid is then added to part of the filtrate and the blue colour is estimated with a photo-electric colorimeter in terms of transmittance. Lower values mean an intenser blue and a higher amylose content. WILLIAMS et al. (1958) and JULIANO et al. (1964a) found a firm correlation between the results of the iodine-blue test and analytical values for amylose. According to BEACHELL and STANSEL (1963) Halick and Keneaster's method can also be used to identify varieties with very high gelatinization temperatures, because at 77°C these show only a slight diffusion of amylose. HALL and JOHNSON (1966) slightly revised the procedure for quick comparisons of amylose content in a large number of samples.
Gelatinization temperature of rice starch provides also a fairly reliable index of the culinary properties of rice. This temperature indicates the ease of cooking. Two methods are commonly used. One is based on the loss of birefringence of starch granules and is carried out with a microscope and polarized light, while the aqueous
Alkal
saumont, 1959
eading clearing
3 2 3 2 3 2 3 2 4 3 4 3
5 4 5 4
BEACHELL and
STANSEL (1963)
5.5 4.5 6 5 2 1.5 3 2.5 4 3 3 2
i reaction
Beaumont, 1962
spreading
3 3 3 3 3 3.8 4.3 3 4 3.5 4 7
clearing
3 3 2.8 3 2.8 3.3 4.3 3 3.5 3 3.5 7
LITTLE et al.
(1958) 6.2 6.2 2 4.2 4.8 4.4
6 5.8 1 2.9 3 2.8
A mylograph viscosity (in Brabender units)
Beaumont. 1959
peak value
980 980 975 960 920 980
940
BEACHELL an
870 855 960 800 620 613
decrease cooling to
-30 -20 -35 -40 -20 100
540
id STANSEL
-170 -165 -234 - 77
133 r l 5 0
on 50°C
(1963)
Beaumont, 1962
peak value
780 940 770 760 620 790 680 730 880
1020 840 920
decrease after 10 minutes at 95°C
-250 -530 -355 -335 -215 -340 -300 -310 -180 -200 -390 -430
HALICK and KELLY (1959)1
1050 1100 1100 920 800 820
-620 -660 -620 -530 -360 -370
241
Suspension of the rice flour is slowly heated. The temperature at which it disappears is called birefringence end-point temperature (or BEPT). The other method uses an amylograph with a sample of 100 g finely ground white rice. Gelatinization temperature is taken as the point where viscosity begins to increase (HALICK and KELLY, 1959). Between the results of the two methods HALICK et al. (1960) found a very significant correlation coefficient of 0.939.
BEACHELL and STANSEL (1963) classify varieties by gelatinization temperatures into three groups, with low (62° to 69 °C), intermediate, and high values (75c to 80°C). The SML varieties (table 68) belong to the intermediate group. The short- and medium-grain American varieties usually have lower gelatinization points than the long-grain types. Some of the exceptions are Toro (long grain) and Early Prolific (medium grain), which have a low and a high value, respectively. According to BEACHELL and STANSEL long-grain varieties with intermediate gelatinization temperatures are more suitable than those with lower or higher values. Varieties with low gelatinization temperatures are not suitable for parboiling, canning or quick-cooking processes, regardless of their amylose contents or setback values (see below).
In addition to the direct methods described above there are also a few indirect procedures for quick and rough estimates of the gelatinization temperature. HALICK
and KELLY (1959) demonstrated a clear relation between water absorption by whole-grain milled rice at temperatures below boiling-point and gelatinization temperature. With temperatures at or above gelatinization point rice absorbs water rapidly and swells considerably, whereas at lower temperatures the water uptake is only small. They submerged 2 g whole white rice in a large quantity of distilled water for 45 minutes in a water bath at 77° or 82 °C. At 77 C varieties with low gelatinization points can be distinguished by greater water absorption from those with higher points. Varieties with a high gelatinization temperature (such as Early Prolific and Texas Patna 231) have small water uptake at 77 and 82 °C. The quantities are expressed in water-uptake numbers, defined as water absorption in ml per 100 g rice.
The above method resembles that of HOGAN and PLANCK (1958), who found that uptake of water was correlated to culinary properties of rice when it was soaked for 20 to 30 minutes at 70 °C.
The alkali response test of LITTLE el al. (1958) also produces values which are closely related to gelatinization temperature; the method can be used to indicate cooking quality of a variety. It is based on swelling, dispersion and solubility of rice starch in dilute potassium hydroxide. A few whole grains of white rice are soaked for 23 hr in 1.7% KOH solution, after which spreading and clearing are evaluated. Spreading indicates the swelling and disintegration of the grains, while clearing relates to the dispersion and solution of the starch granules, accompanied by a loss of opacity of the starch. The response is evaluated on a numerical scale from 1 to 7 for the least and greatest reaction, respectively. LITTLE et al. (1958) found that slight clearing and slight to moderate spreading were characteristic of dry-cooking long-grain varieties; the short- and medium-grain types generally showed high figures for spreading and clearing.
242
Table 68 shows that the SML varieties yielded favourable figures according to this testing method. Lacrosse (a short-grain variety, cooking soft and sticky) had highest values. The low values for Texas Patna 231 are in keeping with the general experience that this variety needs longer cooking than an average American long-grain variety.
The viscosity characteristics of an aqueous suspension of finely ground white rice are determined with an amylograph (see HALICK and KELLY, 1959). The paste is slowly heated to 94° or 95°C to determine the maximum viscosity. The temperature of the paste is maintained at this level for 20 minutes to measure the decrease in viscosity as an index of cooking consistency. The paste is then slowly cooled to 50°C. The difference between peak viscosity and that after cooling is called setback value.
HALICK and KELLY (1959) and. KESTER (1961) observed that varieties rich in amylose generally had a lower peak viscosity than those poor in amylose. A slight decline in viscosity or a rise in it after cooling to 50 C is associated, with rétrogradation of the starch, by which is understood the change of starch in a dissolved or hydrated state into a form that is insoluble in water. The degree of rétrogradation closely depends on the amylose component, and, as shown by BEACHELL and STANSEL (1963) and Ju-LiANO et al. (1964a,b), high positive setback values accompany high amylose contents of i:herice starch.
Table 68 indicates that the SML varieties, Dima, Skk and D 110, compare well with dry-cooking American long-grain varieties. For special uses, such as canning and quick-cooking processes, the SML varieties might be less suitable because of their small negative setback values. This point needs further investigation, particularly as the viscosity characteristics of rice are rather sensitive to external influences.
12.4.3 Water-uptake capacity of rice in cooking
The cooking properties of newly harvested rice are poorer than after storage for a few months. SREENIVASAN (1939), VERGHESE ( 1953), and DESIKACHAR and SUBRAHMANYAN
(1960) found that freshly harvested rice absorbed less water during cooking, displayed less swelling and cooked less dry. Old rice had a clearer cooking water and lost fewer nutrients into the liquid. DESIKACHAR and SUBRAHMANYAN (1959) found that the grains of newly reaped rice burst more easily so that cell contents escape into the water and make it rather turbid. They associate the better cooking quality of old rice with stronger cell walls.
Physicochemical changes in the other components of the grain probably also play a part in improving the cooking characteristics. KESTER et al. (1963) demonstrated that peak viscosity and water absorption at 77 and 82°C (by Halick and Kelly's method) of immaturely harvested grain at first had fairly high values, but that these declined during ripening. From about 0 to 10 days before optimum date of harvest (least breakage) both quantities were at their lowest, after which they increased. These results, too, indicate that some processes in the grain are not complete by the optimum date of harvest (see also 12.3).
243
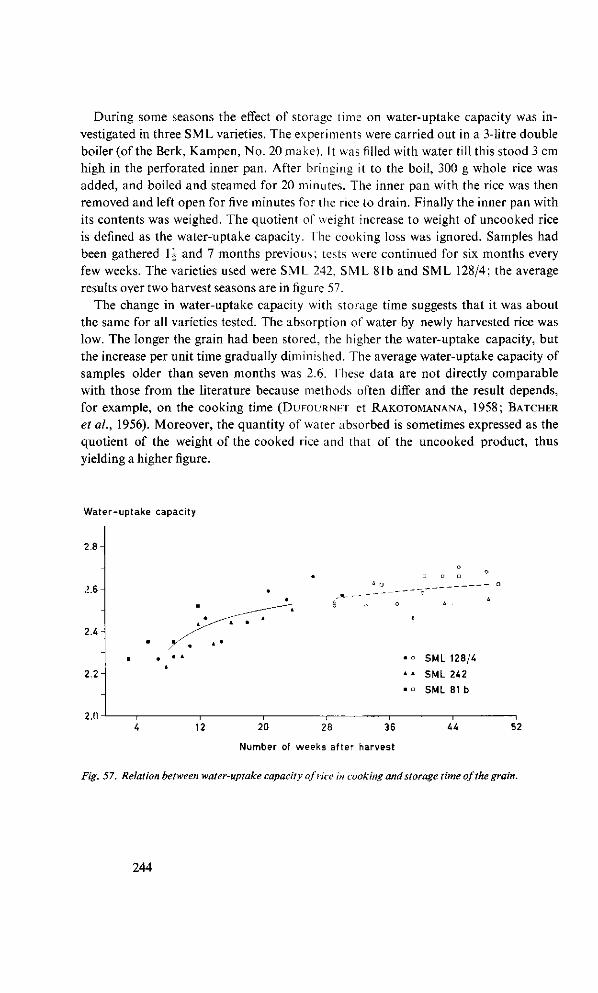
During some seasons the effect of storage time on water-uptake capacity was investigated in three SML varieties. The experiments were carried out in a 3-litre double boiler (of the Berk, Kampen, No. 20 make). It was filled with water till this stood 3 cm high in the perforated inner pan. After bringing it to the boil, 300 g whole rice was added, and boiled and steamed for 20 minutes. The inner pan with the rice was then removed and left open for five minutes for the rice to drain. Finally the inner pan with its contents was weighed. The quotient of weight increase to weight of uncooked rice is defined as the water-uptake capacity. The cooking loss was ignored. Samples had been gathered 1-J and 7 months previous; tests were continued for six months every few weeks. The varieties used were SML 242, SML 81b and SML 128/4; the average results over two harvest seasons are in figure 57.
The change in water-uptake capacity with storage time suggests that it was about the same for all varieties tested. The absorption of water by newly harvested rice was low. The longer the grain had been stored, the higher the water-uptake capacity, but the increase per unit time gradually diminished. The average water-uptake capacity of samples older than seven months was 2.6. These data are not directly comparable with those from the literature because methods often differ and the result depends, for example, on the cooking time (DUFOURNHT et RAKOTOMANANA, 1958; BATCHER
et al., 1956). Moreover, the quantity of water absorbed is sometimes expressed as the quotient of the weight of the cooked rice and that of the uncooked product, thus yielding a higher figure.
Water-uptake capacity
2 . 8 -
;>.6-
2 . 4 -
2 . 2 -
o n
•
•
7 • *
A
•
• •
A O
Ä r j
0 o
D O D
0 A
• ° SML 128/4
» » SML 242
• ° SML 81 b
4 12 20 28 36 44 52
Number of weeks after harvest
Fig. 57. Relation between water-uptake capacity of rice in cooking and storage time of the grain.
244
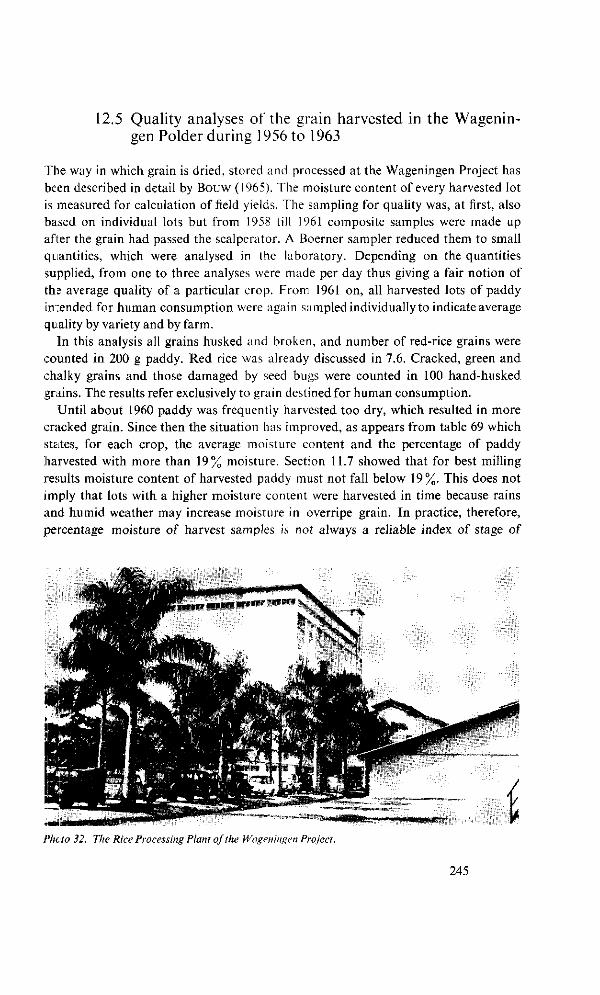
12.5 Quality analyses of the grain harvested in the Wageningen Polder during 1956 to 1963
The way in which grain is dried, stored and processed at the Wageningen Project has been described in detail by Bouw (1965). The moisture content of every harvested lot is measured for calculation of field yields. The sampling for quality was, at first, also based on individual lots but from 1958 till 1961 composite samples were made up after the grain had passed the scalpcrator. A Boerner sampler reduced them to small quantities, which were analysed in the laboratory. Depending on the quantities supplied, from one to three analyses were made per day thus giving a fair notion of the average quality of a particular crop. From 1961 on, all harvested lots of paddy intended for human consumption were again sampled individually to indicate average quality by variety and by farm.
In this analysis all grains husked and broken, and number of red-rice grains were counted in 200 g paddy. Red rice was already discussed in 7.6. Cracked, green and chalky grains and those damaged by seed bugs were counted in 100 hand-husked grains. The results refer exclusively to grain destined for human consumption.
Until about 1960 paddy was frequently harvested too dry, which resulted in more cracked grain. Since then the situation has improved, as appears from table 69 which states, for each crop, the average moisture content and the percentage of paddy harvested with more than 19% moisture. Section 11.7 showed that for best milling results moisture content of harvested paddy must not fall below 19%. This does not imply that lots with a higher moisture content were harvested in time because rains and humid weather may increase moisture in overripe grain. In practice, therefore, percentage moisture of harvest samples is not always a reliable index of stage of
Photo 32. The Rice Processing Plant of the Wageningen Project.
245
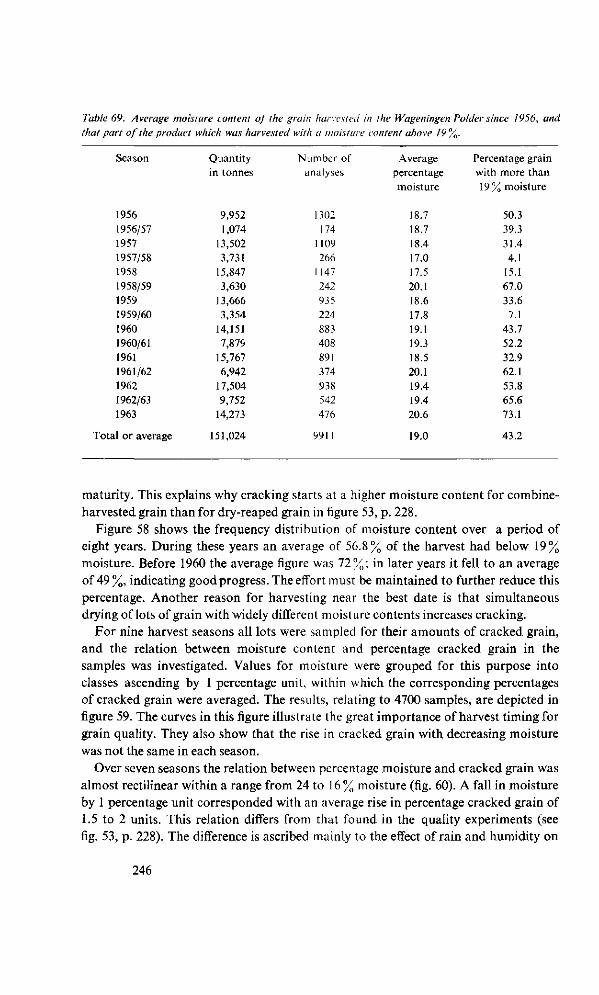
Table 69. Average moisture content of the grain harvested in the Wageningen Polder since 1956, and that part of the product which was harvested with a moisture content above 19%.
Season
1956 1956/57 1957 1957/58 1958 1958/59 1959 1959/60 1960 1960/61 1961 1961/62 1962 1962/63 1963
Total or average
Quantity in tonnes
9,952 1,074
13,502 3,731
15,847 3,630
13,666 3,354
14,151 7,879
15,767 6,942
17,504 9,752
14,273
151,024
Number of analyses
1302 174
1 109 266
1147 242 935 224 883 408 891 374 938 542 476
9911
Average percentage moisture
18.7 18.7 18.4 17.0 17.5 20.1 18.6 17.8 19.1 19.3 18.5 20.1 19.4 19.4 20.6
19.0
Percentage grain with more than 19% moisture
50.3 39.3 31.4 4.1
15.1 67.0 33.6 7.1
43.7 52.2 32.9 62.1 53.8 65.6 73.1
43.2
maturity. This explains why cracking starts at a higher moisture content for combine-harvested grain than for dry-reaped grain in figure 53, p. 228.
Figure 58 shows the frequency distribution of moisture content over a period of eight years. During these years an average of 56.8% of the harvest had below 19% moisture. Before 1960 the average figure was 72%; in later years it fell to an average of 49 %, indicating good progress. The effort must be maintained to further reduce this percentage. Another reason for harvesting near the best date is that simultaneous drying of lots of grain with widely different moisture contents increases cracking.
For nine harvest seasons all lots were sampled for their amounts of cracked grain, and the relation between moisture content and percentage cracked grain in the samples was investigated. Values for moisture were grouped for this purpose into classes ascending by 1 percentage unit, within which the corresponding percentages of cracked grain were averaged. The results, relating to 4700 samples, are depicted in figure 59. The curves in this figure illustrate the great importance of harvest timing for grain quality. They also show that the rise in cracked grain with decreasing moisture was not the same in each season.
Over seven seasons the relation between percentage moisture and cracked grain was almost rectilinear within a range from 24 to 16 % moisture (fig. 60). A fall in moisture by 1 percentage unit corresponded with an average rise in percentage cracked grain of 1.5 to 2 units. This relation differs from that found in the quality experiments (see fig. 53, p. 228). The difference is ascribed mainly to the effect of rain and humidity on
246
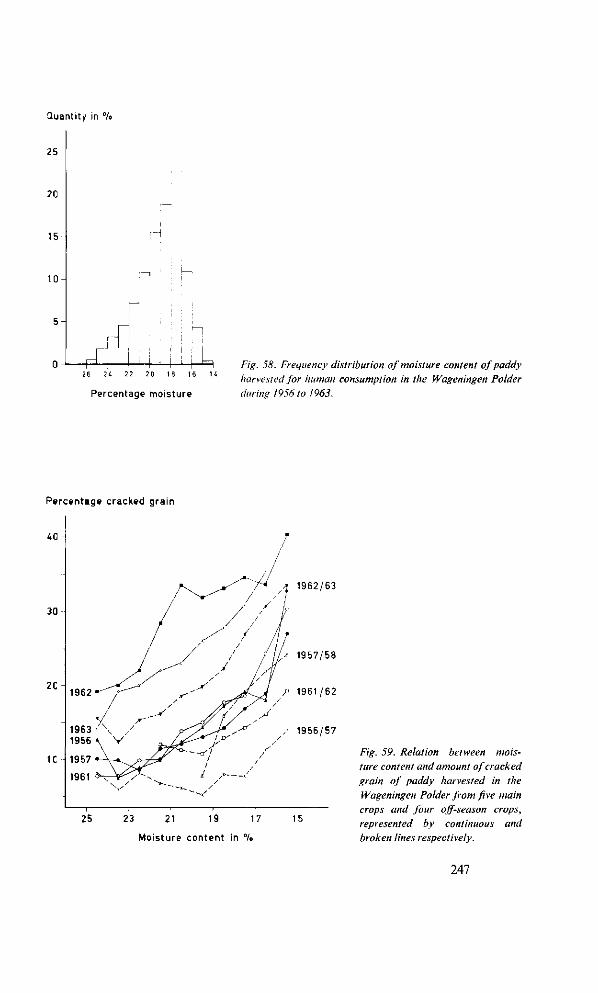
Quantity in %
25
20
15
1 0 -
5 -
n-
r ~~
rf
r
r--i
: — i
i •
I—,
; h
! i U 26 24 22 20 IS 16 U
Percentage moisture
Fig. 58. Frequency distribution of moisture content of paddy harvested for human consumption in the Wageningen Polder during 1956 to 1963.
Percentage cracked grain
4 0 -
30
2C-
1C
1962/63
1956/57
25 23 21 19 17
Moisture content in °A>
15
Fig. 59. Relation between moisture content and amount of cracked grain of paddy harvested in the Wageningen Polder from five main crops and four off-season crops, represented by continuous and broken lines respectively.
247
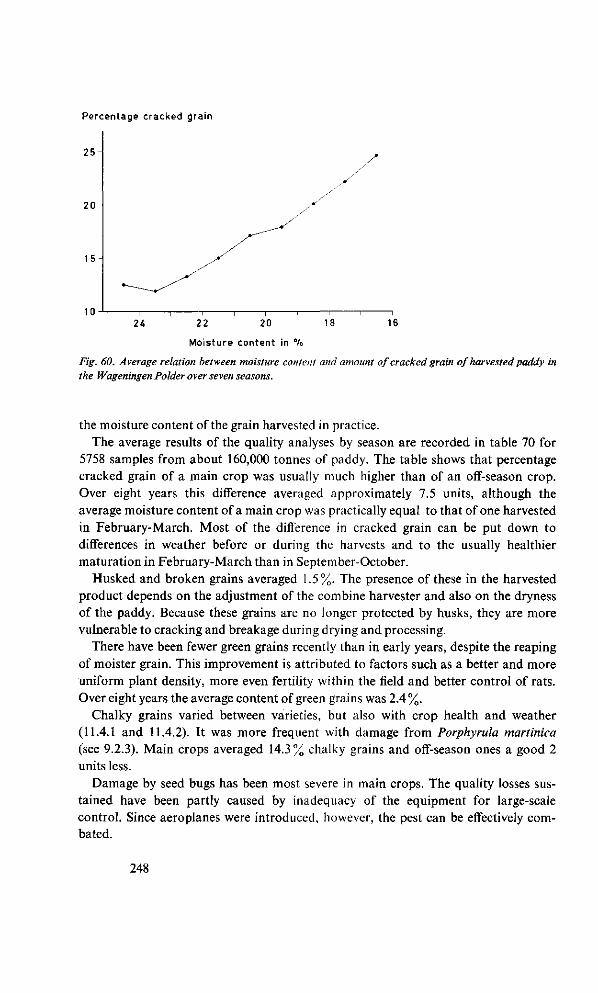
Percentage cracked grain
2 5 -
2 0 -
15
10-4 24 22 20 18 16
Moisture content in °/o
Fig. 60. Average relation between moisture content and amount of cracked grain of harvested paddy in the Wageningen Polder over seven seasons.
the moisture content of the grain harvested in practice. The average results of the quality analyses by season are recorded in table 70 for
5758 samples from about 160,000 tonnes of paddy. The table shows that percentage cracked grain of a main crop was usually much higher than of an off-season crop. Over eight years this difference averaged approximately 7.5 units, although the average moisture content of a main crop was practically equal to that of one harvested in February-March. Most of the difference in cracked grain can be put down to differences in weather before or during the harvests and to the usually healthier maturation in February-March than in September-October.
Husked and broken grains averaged 1.5%. The presence of these in the harvested product depends on the adjustment of the combine harvester and also on the dryness of the paddy. Because these grains are no longer protected by husks, they are more vulnerable to cracking and breakage during drying and processing.
There have been fewer green grains recently than in early years, despite the reaping of moister grain. This improvement is attributed to factors such as a better and more uniform plant density, more even fertility within the field and better control of rats. Over eight years the average content of green grains was 2.4 %.
Chalky grains varied between varieties, but also with crop health and weather (11.4.1 and 11.4.2). It was more frequent with damage from Porphyrula martinica (see 9.2.3). Main crops averaged 14.3% chalky grains and off-season ones a good 2 units less.
Damage by seed bugs has been most severe in main crops. The quality losses sustained have been partly caused by inadequacy of the equipment for large-scale control. Since aeroplanes were introduced, however, the pest can be effectively combated.
248
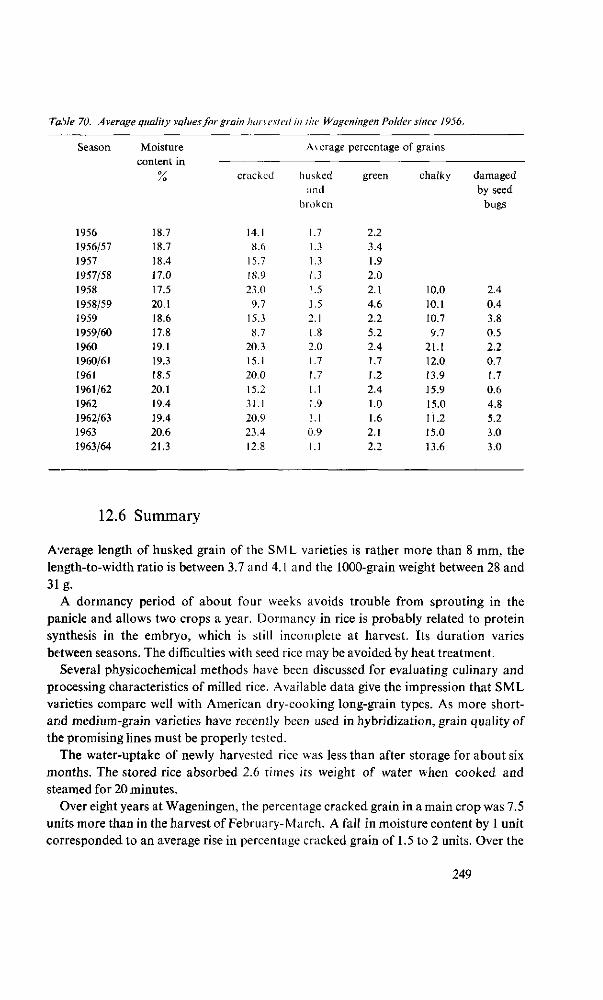
Taille 70. Average qualify values for grain harvested in the Wageningen Polder since 1956.
Season
1956 1956/57 1957 1957/58 1958 1958/59 1959 1959/60 1960 1960/61 1961 1961/62 1962 1962/63 1963 1963/64
Moisture content in
°/ /o
18.7 18.7 18.4 17.0 17.5 20.1 18.6 17.8 19.1 19.3 18.5 20.1 19.4 19.4 20.6 21.3
cracked
14.1 8.6
15.7 18.9 23.0 9.7
15.3 8.7
20.3 15.1 20.0 15.2 31.1 20.9 23.4 12.8
Average
husked and
broken
1.7 1.3 1.3 1.3 1.5 1.5 2.1 1.8 2.0 1.7 1.7 I.I 1.9 1.1 0.9 1.1
percentage
green
2.2 3.4 1.9 2.0 2.1 4.6 2.2 5.2 2.4 1.7 1.2 2.4 1.0 1.6 2.1 2.2
of grains
chalky
10.0 10.1 10.7 9.7
21.1 12.0 13.9 15.9 15.0 11.2 15.0 13.6
damaged by seed
bugs
2.4 0.4 3.8 0.5 2.2 0.7 1.7 0.6 4.8 5.2 3.0 3.0
12.6 Summary
Average length of husked grain of the SML varieties is rather more than 8 mm, the length-to-width ratio is between 3.7 and 4.1 and the 1000-grain weight between 28 and 31 g.
A dormancy period of about four weeks avoids trouble from sprouting in the pa.nicle and allows two crops a year. Dormancy in rice is probably related to protein synthesis in the embryo, which is still incomplete at harvest. Its duration varies between seasons. The difficulties with seed rice may be avoided by heat treatment.
Several physicochemical methods have been discussed for evaluating culinary and processing characteristics of milled rice. Available data give the impression that SML varieties compare well with American dry-cooking long-grain types. As more short-arid medium-grain varieties have recently been used in hybridization, grain quality of the promising lines must be properly tested.
The water-uptake of newly harvested rice was less than after storage for about six months. The stored rice absorbed 2.6 times its weight of water when cooked and steamed for 20 minutes.
Over eight years at Wageningen, the percentage cracked grain in a main crop was 7.5 units more than in the harvest of February-March. A fall in moisture content by 1 unit corresponded to an average rise in percentage cracked grain of 1.5 to 2 units. Over the
249
eight years the content of husked and broken grains averaged 1.5%; over 1960 to 1963 that of green grains was 1.8%. The average percentage of chalky grains was 14.3 for a main crop; for a February-March harvest it was a good 2 units lower. Losses of quality through seed bugs are of less importance since the introduction of aerial spraying.
250
13 Breeding
13.1 Introduction
In Surinam A.D. van Dijk from New Nickerie was the first to initiate actual rice breeding. By hybridization and rigid panicle selection he obtained some valuable stock, from which a few varieties were afterwards isolated at the Agricultural Experiment Station (Mastenbroek) and by the S.M.L. (Van der Meulen). Until 1959 these va.rieties were the only ones suitable for mechanical cultivation.
The Mechanized Rice Farm in Nickerie, established by the Consulting Engineers H.N. van Dijk, needed a variety with much stronger straw than the locally grown Skrivimankoti (Skk). The cultivation of D 79 (also designated as B.G. 79) and Rexoro he.rdly brought any improvement. Therefore, between 1941 and 1949, A.D. van Dijk attemped to breed a variety suitable for mechanical culture. According to personal information the history was as follows.
In 1941 he found in Rexoro (introduced from the United States in 1940) an atypical plant of particular sturdiness, erect habit and with long panicles. The offspring of this plant and the cropping system in that field suggest that this hybrid was a natural cross between Rexoro and D 79. Selections were made from the progeny during eight generations. The type emerging from this in 1946 was named Aurora by Van Dijk. On account of difficult threshing this variety was grown only on a limited scale for a few years. In 1946 Aurora and Skk were crossed and he selected lines for four generations. Among the other crosses he made, that between Skk and Rexoro can be mentioned.
When the staff of the Agricultural Experiment Station was extended by a rice breeder and the S.M.L. made a start with breeding, Van Dijk generously placed his material at the disposal of both institutions. The seed samples which the S.M.L. received were derived from Aurora and the two hybrid populations referred to.
At the Agricultural Experiment Station, in 1953, the Dima variety was obtained from Van Dijk's stock. At first it was still heterogeneous but Dima was purified by continued line selection. Mastenbroek continued rice breeding until he left Surinam in 1960. His work was taken over first by A.H. van Dijk and then by Hasselbach. Dima is the only variety suited to mechanical culture that has been developed by the Agricultural Experiment Station until now.
Van Dijk's material proved also to be of gieat value for the breeding programme of S.M.L. Progress was rapid and promising lines were used as basic stock.for crossing. In 1955 the varieties Nickerie and Paradijs were released, followed in 1956 by
251
SML 80/5 and SML 80/7. These varieties exhausted the direct possibilities of this material.
At first the question would sometimes be raised if the S.M.L.'s breeding work might not come to duplicate the Agricultural Experiment Station's work, but co-ordination and exchange of material obviated this danger. The dangerous lack of suitable varieties for mechanical cultivation made the need for early results urgent. Mastenbroek's attention to strong straw and good grain quality made a welcome contribution to the Foundation's breeding work.
13.2 Breeding objectives
The purpose of breeding is to obtain varieties superior in one or more respects to existing ones. Selection must be based on the properties of the present commercial varieties and the breeding material available. It needs a thorough knowledge of cultural practices and of the characteristics of the varieties in use. Fixing too high standards for selection or biasing selection towards certain characteristics may involve great risks; too low a standard would result in a large breeding stock of poor value.
The method of cultivation and the care of the plants should be such that the characteristics are clearly recognizable so that the best genetic types can be selected. As will be discussed in more detail in 13.5, plants are always selected individually so that all visible characteristics of a plant can be carefully weighed against one another. More often than not, a compromise has to be accepted. We recommend regular evaluation of available breeding stock and a check on the generations used for selection. Desirable traits of frequent occurrence can be selected more rigorously, while lacking features should be provided promptly by importing promising parental stock and by suitable crosses.
Selection is based on the following features: 1. yielding capacity 2. desirable milling, cooking and processing characteristics 3. resistance to lodging and favourable response to nitrogen 4. resistance to diseases and pests 5. suitability for culture in both seasons 6. short duration of growth 7. tolerance to adverse soil conditions 8. ease of threshing 9. rapid early growth
10. smooth straw and hulls 11. moderate seed dormancy The characters can be classed into four groups, relating respectively to yield capacity, quality, crop security and ease and simplicity of culture. The following sections will discuss the significance of these traits for cultivation by machine and by smallholders in Nickerie, and the manner of selecting these features.
252
13.2.1 Mechanical culture
Yielding capacity. Yield depends on number of plants per unit area, number of panicles per plant and weight per panicle. In selecting, these components must be considered as a unit. In transplanted rice, tillering capacity is readily recognised as one of the most important yield components but in mechanical cultivation, with broadcast sowing, this factor should not be underrated (chapter 5). In broadcast seeding various circumstances may cause sparse or irregular plant density. Thus it is important to have varieties that compensate for these defects and still ripen uniformly.
In 5.4.2 it was demonstrated that effective tillering largely depends on seed rate. Only at a low seed rate could effective tillering be increased by nitrogen. At a normal plant density no further increase was observed with rates higher than 30 kg N/ha (8.4.8). Low tillering capacity can be only partly offset by higher seed rate; plant type and growth habit may restrict effective tillering (see 5.2.2, 5.4.10 and 8.4.9).
Selection was based mainly on number of panicles and their aggregate weight, which can be evaluated by a side sweep of the hand, drawing together the panicles. With experience this can be used to weigh them and to check uniformity of height and ripeness. The plants were also evaluated for length, density and firmness of the panicle, sterility, presence of awns, and exsertion of the panicle from the leaf sheath. The selection criterion for yield is by comparison. Selection for such a quantitative character was not rigorous in early generations; rigidity increased later (see 13.5.2).
Desirable milling, cooking and processing characteristics. Quality of the rice is of much importance because most of the product of the Wageningen Project and the Prince Bernhard Polder is exported to Europe. Quality has been discussed in chapters 11 and 12. Wageningen gained its reputation for high quality rice with the Van Dijk material. Further breeding work improved only the size of the grain (table 66,p. 234). An increase in 1000-grain weight over 30 g and length-to-width ratio over 4 was not considered desirable, as this probably would only be possible at the expense of other valuable varietal characteristics. Recent changes in market demands have slightly reduced the importance of grain length and shape so that the criteria for selection can be slightly lowered. This eases selection for resistance to breakage and for high output of milled rice. Our selection standard for grain size and shape was: 1000-grain weight over 28 g and length-to-width ratio over 3.7.
Selection for grain quality was in stages. In hybrid populations grains were evaluated merely by shape and size. Sometimes a few grains were broken between the lingers, which indicates fragility, translucency, and chalkiness in the endosperm. Selected material from varieties and lines was inspected in the laboratory with a hand-operated shelling device. Since grain quality depends on various factors, this rather rough method of screening was used merely for negative selection. Quality testing of promising lines and varieties have been described in chapters 11 and 12.
253
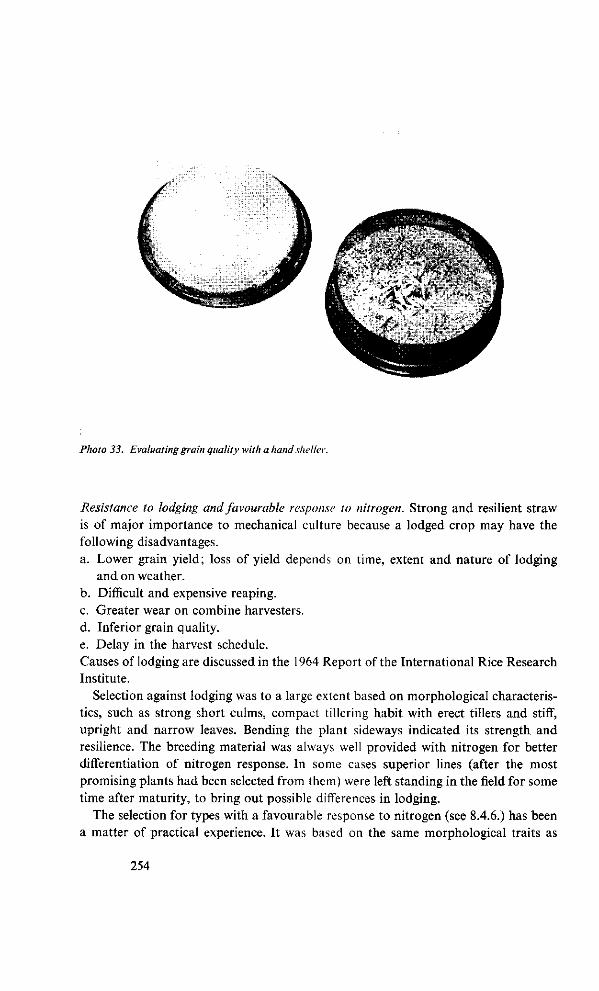
Photo 33. Evaluating grain quality with a handsheller.
Resistance to lodging and favourable response to nitrogen. Strong and resilient straw is of major importance to mechanical culture because a lodged crop may have the following disadvantages. a. Lower grain yield; loss of yield depends on time, extent and nature of lodging
and on weather. b. Difficult and expensive reaping. c. Greater wear on combine harvesters. d. Inferior grain quality. e. Delay in the harvest schedule. Causes of lodging are discussed in the 1964 Report of the International Rice Research Institute.
Selection against lodging was to a large extent based on morphological characteristics, such as strong short culms, compact tillering habit with erect tillers and stiff, upright and narrow leaves. Bending the plant sideways indicated its strength and resilience. The breeding material was always well provided with nitrogen for better differentiation of nitrogen response. In some cases superior lines (after the most promising plants had been selected from them) were left standing in the field for some time after maturity, to bring out possible differences in lodging.
The selection for types with a favourable response to nitrogen (see 8.4.6.) has been a matter of practical experience. It was based on the same morphological traits as
254
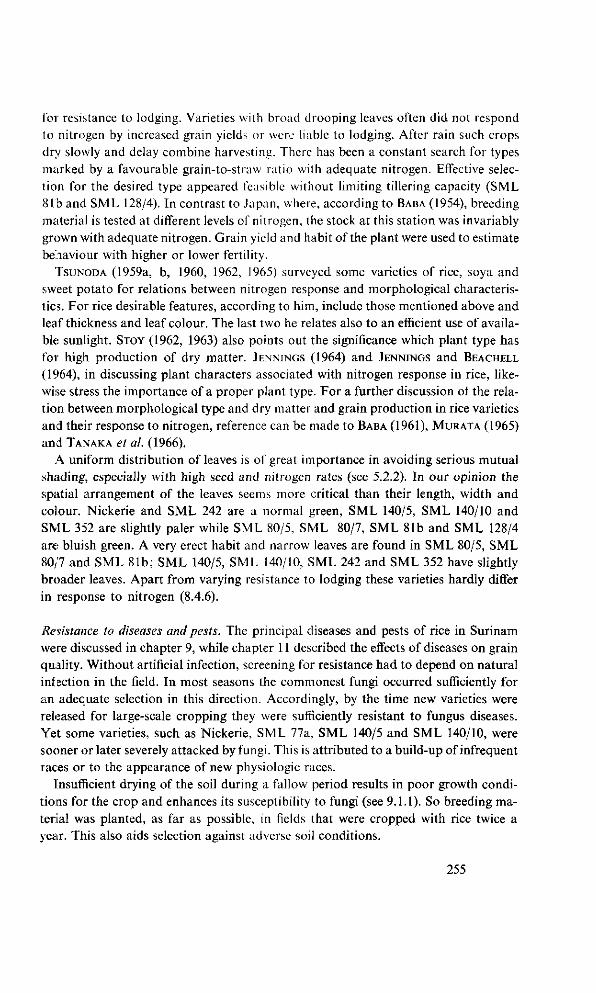
for resistance to lodging. Varieties with broad drooping leaves often did not respond to nitrogen by increased grain yields or were liable to lodging. After rain such crops dry slowly and delay combine harvesting. There has been a constant search for types marked by a favourable grain-to-straw ratio with adequate nitrogen. Effective selection for the desired type appeared feasible without limiting tillering capacity (SML 81 b and SML 128/4). In contrast to Japan, where, according to BABA (1954), breeding material is tested at different levels of nitrogen, the stock at this station was invariably grown with adequate nitrogen. Grain yield and habit of the plant were used to estimate behaviour with higher or lower fertility.
TSUNODA (1959a, b, 1960, 1962, 1965) surveyed some varieties of rice, soya and sweet potato for relations between nitrogen response and morphological characteristics. For rice desirable features, according to him, include those mentioned above and leaf thickness and leaf colour. The last two he relates also to an efficient use of available sunlight. STOY (1962, 1963) also points out the significance which plant type has for high production of dry matter. JENNINGS (1964) and JENNINGS and BEACHELL
(1964), in discussing plant characters associated with nitrogen response in rice, likewise stress the importance of a proper plant type. For a further discussion of the relation between morphological type and dry matter and grain production in rice varieties and their response to nitrogen, reference can be made to BABA (1961), MURATA (1965) and TANAKA et al. (1966).
A uniform distribution of leaves is of great importance in avoiding serious mutual shading, especially with high seed and nitrogen rates (see 5.2.2). In our opinion the spatial arrangement of the leaves seems more critical than their length, width and colour. Nickerie and SML 242 are a normal green, SML 140/5, SML 140/10 and SML 352 are slightly paler while SML 80/5, SML 80/7, SML 81b and SML 128/4 are bluish green. A very erect habit and narrow leaves are found in SML 80/5, SML 80/7 and SML 81b; SML 140/5, SML 140/10, SML 242 and SML 352 have slightly broader leaves. Apart from varying resistance to lodging these varieties hardly differ in response to nitrogen (8.4.6).
Resistance to diseases and pests. The principal diseases and pests of rice in Surinam were discussed in chapter 9, while chapter 11 described the effects of diseases on grain quality. Without artificial infection, screening for resistance had to depend on natural infection in the field. In most seasons the commonest fungi occurred sufficiently for an adequate selection in this direction. Accordingly, by the time new varieties were released for large-scale cropping they were sufficiently resistant to fungus diseases. Yet some varieties, such as Nickerie, SML 77a, SML 140/5 and SML 140/10, were sooner or later severely attacked by fungi. This is attributed to a build-up of infrequent races or to the appearance of new physiologic races.
Insufficient drying of the soil during a fallow period results in poor growth conditions for the crop and enhances its susceptibility to fungi (see 9.1.1). So breeding material was planted, as far as possible, in fields that were cropped with rice twice a year. This also aids selection against adverse soil conditions.
255
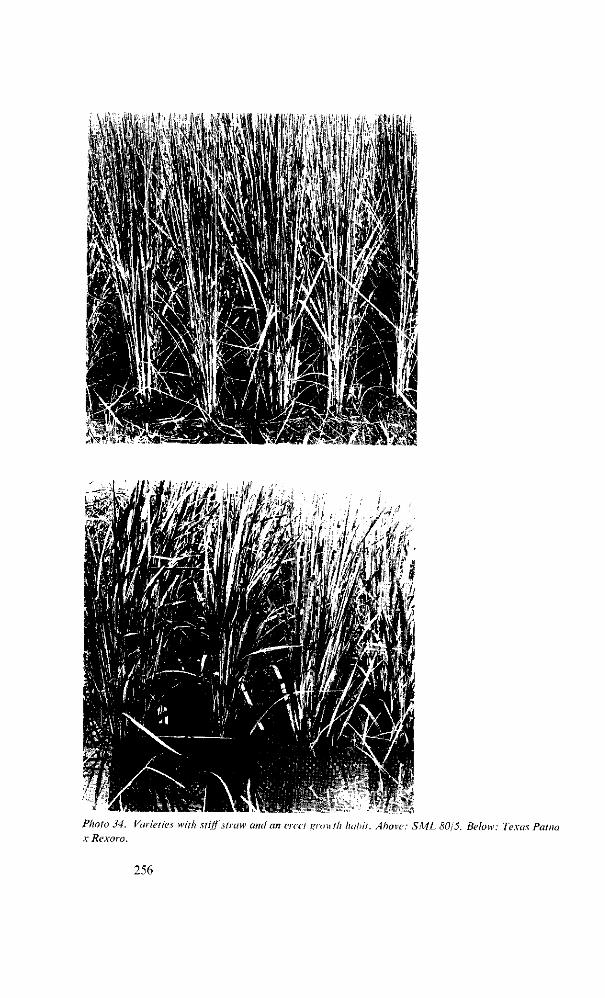
PAoto 3¥. Varieties with stiff straw and an erect growth hcihit. Above: SML 80/5. Below: Texas Pattia x Rexoro.
256
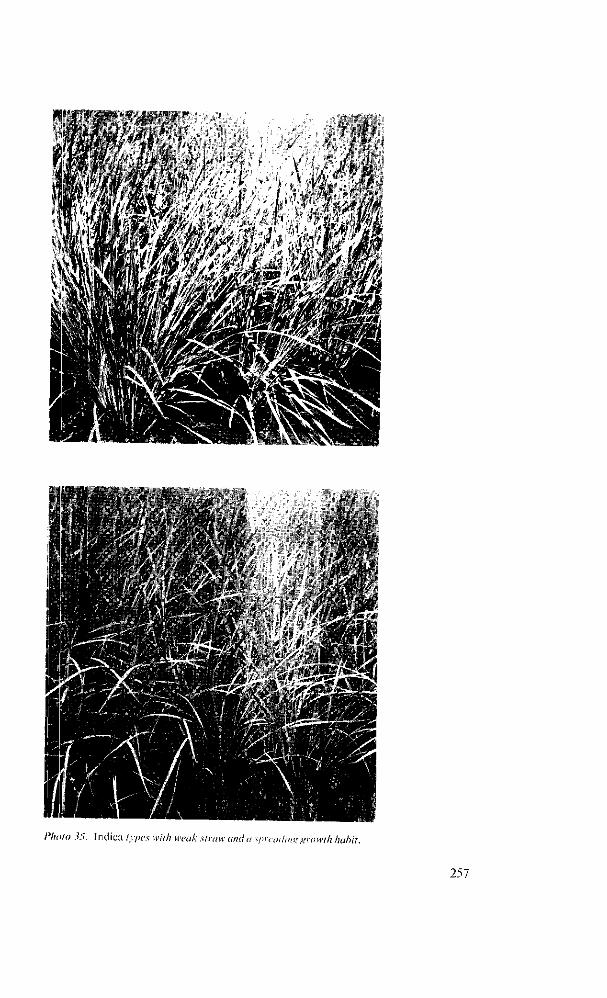
/7;<J/O .?„V Indica/.iy«'.v w///i weak straw and a .s/n-ctulim,' growth habit.
257
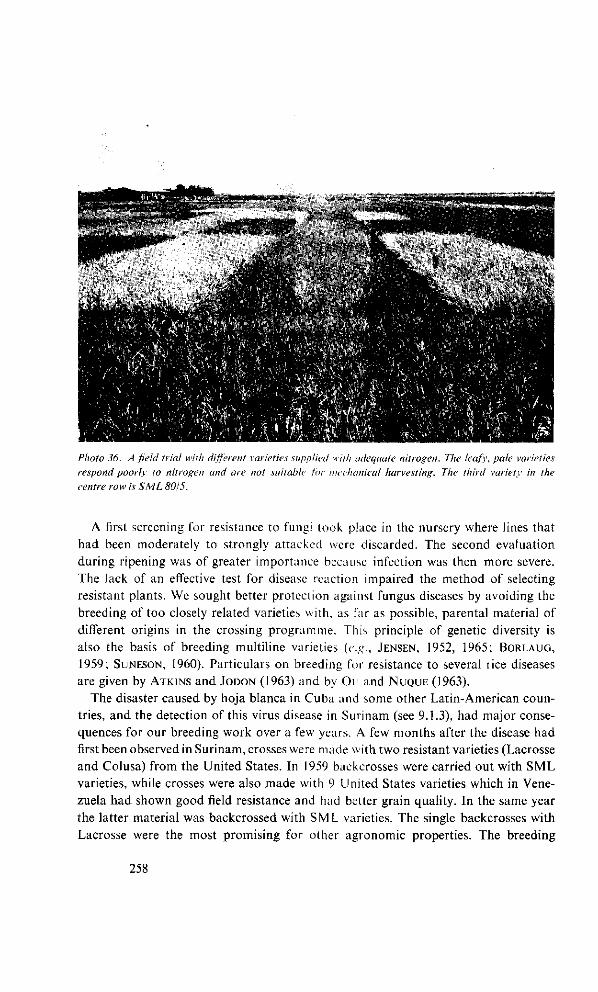
te* i « : i 4,-f^K1
• vf fir f
Photo 36. A field trial with different varieties supplied with adequate nitrogen. The leafy, pale varieties respond poorly to nitrogen and are not suitable for mechanical harvesting. The third variety in the centre row is SML 8015.
A first screening for resistance to fungi took place in the nursery where lines that
had been moderately to strongly attacked were discarded. The second evaluation
during ripening was of greater importance because infection was then more severe.
The lack of an effective test for disease reaction impaired the method of selecting
resistant plants. We sought better protection against fungus diseases by avoiding the
breeding of too closely related varieties with, as far as possible, parental material of
different origins in the crossing programme. This principle of genetic diversity is
also the basis of breeding multiline varieties (e.g., JENSEN, 1952, 1965; BORLAUG,
1959; SUNESON, 1960). Particulars on breeding for resistance to several rice diseases
are given by ATKINS and JODON (1963) and by Ou and NUQUE (1963).
The disaster caused by hoja blanca in Cuba and some other Latin-American coun
tries, and the detection of this virus disease in Surinam (see 9.1.3), had major conse
quences for our breeding work over a few years. A few months after the disease had
first been observed in Surinam, crosses were made with two resistant varieties (Lacrosse
and Colusa) from the United States. In 1959 backcrosses were carried out with SML
varieties, while crosses were also made with 9 United States varieties which in Vene
zuela had shown good field resistance and had better grain quality. In the same year
the latter material was backcrossed with SML varieties. The single backcrosses with
Lacrosse were the most promising for other agronomic properties. The breeding
258
possibilities of the remaining material proved disappointing, especially as resistance to this virus disease could not be tested. As the fear of hoja blanca in Surinam abated, attention to the breeding of resistance to this disease diminished as well.
Among the selection stock differences were found in the amount of damage to different lines by insect pests. The feasibility of breeding for these characters was enhanced by limiting the control of borers, delphacids and mites.
United States varieties were often more heavily attacked than SML types by larvae of Rupela albineUa. WOUTERS19 found, in field trials, that these larvae prefer a thin, vigorously growing crop. With plants or' approximately equal maturity he found more larvae in transplanted than in direct sown material. These observations agree with those of PATHAK (1964) and with KAWADA (1954), who state that borers prefer thick culms. WOUTERS20 further observed that SML 81b is less preferred by borers than the other SML varieties, possibly also because of its smaller culm diameter.
STUBBS and WOUTERS21 noticed several times that crops of SML 81b would often harbour far fewer delphacids than other varieties. According to information by VAN DER SPEK (1965) the same experience was obtained with SML 81b in Panama.
Suitability for culture in both seasons and short duration of growth. For economic reasons about 25 to 30% of the Wageningen and Prince Bernhard polders produces two crops of rice per year. By planting most of the breeding material twice a year it can be incidentally selected for high yields in both seasons.
Varieties with a short growth period have many advantages. Sensitivity to adverse soil conditions and the duration of growth are among the limitations to more double cropping (10.4). Shorter-duration varieties mean a shorter submergence of fields, more time for tillage and recovery of the soil and a more flexible cropping system. Indirectly, a shorter growth period may benefit grain quality. Other advantages involve water consumption and crop care. For the Surinam climate and the practice of cultivating two crops per year, the intention is a growth duration of about 120 days. A short duration of growth is more important for an off-season crop than for a main crop in the most appropriate times for tillage, sowing and harvesting (see 10.4).
United States varieties have several times been used as parental material in breeding for earliness. Their growth periods were a few weeks shorter than of SML varieties so that some progress has already been achieved. The recent introduction of some very early maturing varieties (such as Belle Patna and Vegold, about 100 days) from the southern United States increase the chance of success through repeated backcrossing with SML types. The first crosses with the very early maturing varieties were carried out by Van der Spek in 1964.
Tolerance to adverse soil conditions. A severely reduced soil causes a physiological disease, to which the SML varieties vary in resistance (9.1.1). As well as a loss of grain yield a considerable loss of quality may result (chapter 11). Until about 1957 the
19 Landbouwkundig-technisch jaarverslag van de S.M.L., 1957, p. 34. 20 Landbouwkundig-technisch jaarverslag van de S.M.L., 1962, p. 38. 21 Landbouwkundig-technisch jaarverslag vandeS.M.L., 1959: 19; 1960: 36; 1961: 39-40.
259
sensitivity to adverse soil conditions was not clearly noticed so that selection for resistance could only begin later.
Most of the fields used for breeding stock were cropped twice a yeai to allow selection for this characteristic. For instance, from 1950 to 1956, the average occupation of the six permanent selection fields was 145% (one annual rice crop = 100%), which was raised in the next seven years to 174%. Several fields have been planted with rice from 12 to 14 times consecutively (fig. 34, p. 179). The experience was, however, that this practice still did not allow successful selection.
From 1957 to 1963 the average duration from transplanting till harvesting was 125 and 116 days for main and off-season crops, respectively. In favourable weather the ensuing fallow period would prevent a severe reduction of the soil for the next crop. It would then be desirable to flood the fields earlier and deliberately promote reduction by extra puddling. Selections can easily be tested by the direct sowing method. In the United States a purposeful selection has, since 1954, been conducted for resistance to a similar physiological disorder called straighthead, in which the breeding material is likewise sown on land which provokes it and the field is not drained during the growth of the crop (ATKINS et a/., 1957).
A number of suitable parental varieties have been used for hybridization purposes since 1960. In 1963, when the breeding stock was large enough, a number of crosses were made also with local types of red rice, which had disease resistance, rapid early growth, good tillering and a shorter duration of growth. In February 1964 the first backcrosses were made with SML varieties. It is hoped that some good types will eventually be isolated from these crosses.
Ease of threshing. Threshing quality must be a compromise between too easy shedding and too difficult threshing. Losses are high at both extremes. SML 81b sheds too easily when reaped by hand (peasant culture in Surinam) or when the crop has badly lodged. Difficulty of threshing can be partly overcome by adjusting the threshing drum of the combine harvester but this increases hulled and broken grains.
This trait can be easily selected in the field by drawing together a few panicles in the hand and gently squeezing them once or twice. The number of grains shed is a fairly good index.
Rapid early growth. With varieties that have excellent seedling vigour the first three weeks after sowing are less risky and less water is needed (chapter 4). After that time rapid early growth is mainly important for weed suppression (see 7.2). Even now that most weeds can be controlled effectively by chemicals, a rapid seedling development remains of great importance to Surinam's mechanical rice culture.
In breeding for this purpose many crosses have been made with indica varieties, which also highly tolerated adverse soil conditions. The types used were, however, weak-strawed and had a poor response to nitrogen, but rapid early growth, stiff straw and a favourable nitrogen response can be combined into a single variety (SML 140/5, SML 140/10, SML 352 and Temerin).
260
Smooth straw and hulls. Rough (pubescent) leaves and husks greatly increase wear on combine harvesters and other equipment, besides producing irritating dust. Since smooth straw and chaff were not found among Van Dijk's material, the first crosses to transfer this characteristic were already made in 1953/54. Among commercial varieties, SML 81b and SML 352 possess this desirable feature. Glabrous leaves were always associated with glabrous glumes: the character is often controlled by a single recessive gene (NAGAO et al., 1960; CHANDRARATNA, 1964).
Moderate seed dormancy. A dormancy period of about a month seems best (12.3). Varieties more susceptible to lodging (e.g., SML 81b) need a slightly longer period.
For double cropping of breeding stock, seed is usually sown again four weeks after harvest, causing some incidental selection for dormancy. If the seed still germinates insufficiently, it is germinated for one or two more days, and the seeding rate is. raised according to ultimate germination percentage.
13.2.2 Culture by smallholders in Nickerie
Since 1961 breeding work of S.M.L. has also been aimed at varieties suitable for cultivation by smallholders in Nickerie, where most farmers still transplant and harvest manually. It is necessary to review the selection criteria for this system of rice culture, where they deviate from those just discussed. The currently grown varieties (Skk, D U O and SML varieties) serve for comparison, while account must also be taken of various new developments and possibilities for this cultivation (see UBELS, 1961).
The standards for plant type can be less strict for height, resistance to lodging and nitrogen response. Rapid initial growth, early closing and good tillering capacity are highly desirable features. JENNINGS and BEACHELL (1964), in discussing the need for and the possibilities of developing nitrogen-responsive varieties in the tropics, over-stress short culm and narrow upright leaves, but insufficiently emphasize the properties just mentioned. In Dima, slow initial growth and poor closing were among the main reasons why its introduction to smallholders of Nickerie failed. For transplanting the seedlings must also be easily pulled up with few breakages at the stem base. After Dima had been introduced to smallholders, it was feared that stiff straw was associated with difficulty in pulling up the seedlings, but these properties proved not to be mutually exclusive (SML 81b and SML 140/10).
In view of current methods of harvesting, drying and processing, selection for resistance to breakage should be rigid. Threshing should certainly not be easier than for mechanical harvesting, while a long dormancy period of the grain is important. The average dormancy period of Skk (about 10 weeks) is more favourable to the smallholder than that of D 110 (about 5 weeks).
As long as there are no adequate possibilities of cultivating two crops a year, a moderate sensitivity to photoperiod is no objection. Yet in years when water is scarce
261
and planting is delayed, a good crop should still be possible. The culture of two generations per year and the consequent selection for a weak photoperiodic response are considered more important than strict breeding for a long dormancy period.
13.3 Basic stock
13.3.1 Stock in 1951
When breeding began the following material was available: a. varieties grown locally in Surinam and Guyana ; b. 24 varieties from Indonesia, partly developed by Van der Meulen ; c. 51 varieties deriving mainly from the United States, Italy and India ; d. 9 hybrid populations from Indonesia ; e. the Van Dijk stock consisting of 17 seed samples.
Of the varieties found in Surinam, Skk was by far the most important and was planted on about 80 % of the rice area. Its average yield is fair (some 3000 kg/ha for the Nickerie district), but its two serious defects for mechanical culture are very weak straw and great sensitivity to season. Mastenbroek tried in vain to improve the stiffness of the straw by line selection within Skk. Earlier this had been attempted in Indonesia with the same variety by Van der Meulen (personal information) but with as little success. Nor were the other Guyana varieties suited to mechanical culture.
Of the United States types already in use in Surinam, Rexoro had slightly extended its area about 1950. It had better grain, stronger straw and weaker photoperiodic response than Skk. According to varietal trials by Van der Meulen and Mastenbroek its yield was about 25 % less than of Skk. For the Prince Bernhard Polder Rexoro was at first the only variety suitable for large-scale cultivation. Therefore the Agricultural Research Department at once started producing pure seed. Line selection in this variety was soon discontinued, because Rexoro was replaced first by Bluebonnet and then by Bluebonnet 50.
Among Indonesian varieties only Mas could equal Skk in yield, but it had also very weak straw. The only other useful introductions as parents for crosses were some types from the United States.
From the best populations brought in from Indonesia, 133c (Bluebonnet x Benga-wan) and 134c (Bluebonnet x Mas), no variety could be obtained. The best lines were used for crosses. These parents had stiffer straw than Skk and glabrous leaves.
By far the best opportunities for selection were in Van Dijk's material. From this stock four varieties were isolated. Paradijs was soon replaced, chiefly because of its susceptibility to lodging on the newly reclaimed lands. Some data on yield of the other three varieties (Nickerie, SML 80/5 and SM L 80/7) are in table 79, p. 288.
262
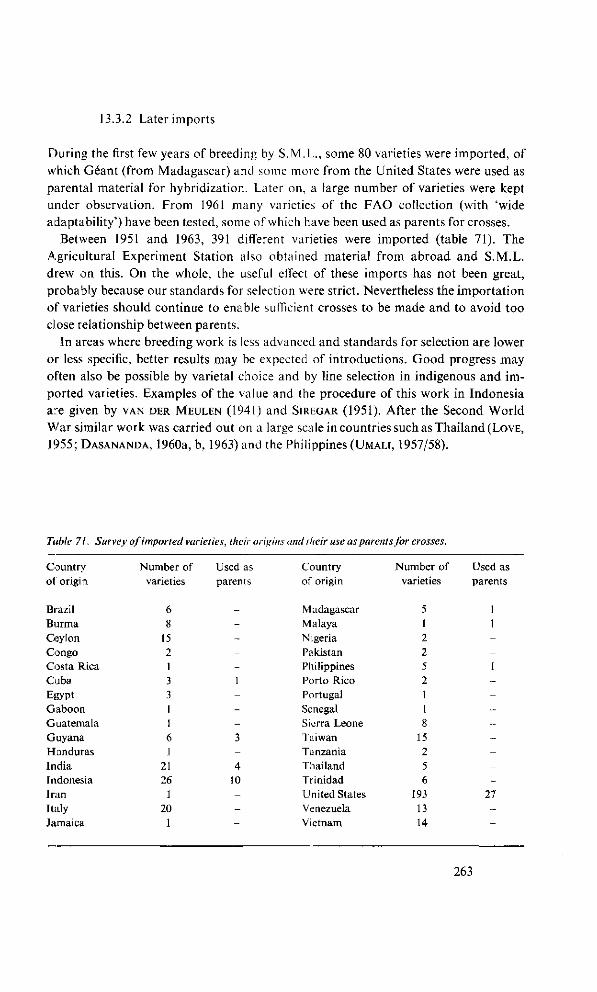
13.3.2 Later imports
During the first few years of breeding by S.M.L., some 80 varieties were imported, of which Géant (from Madagascar) and some more from the United States were used as parental material for hybridization. Later on, a large number of varieties were kept under observation. From 1961 many varieties of the FAO collection (with 'wide adaptability') have been tested, some of which have been used as parents for crosses.
Between 1951 and 1963, 391 different varieties were imported (table 71). The Agricultural Experiment Station also obtained material from abroad and S.M.L. drew on this. On the whole, the useful effect of these imports has not been great, probably because our standards for selection were strict. Nevertheless the importation of varieties should continue to enable sufficient crosses to be made and to avoid too close relationship between parents.
In areas where breeding work is less advanced and standards for selection are lower or less specific, better results may be expected of introductions. Good progress may often also be possible by varietal choice and by line selection in indigenous and imported varieties. Examples of the value and the procedure of this work in Indonesia are given by VAN DER MEULEN (1941) and SIREGAR (1951). After the Second World War similar work was carried out on a large scale in countries such as Thailand (LOVE,
1955; DASANANDA, 1960a, b, 1963) and the Philippines (UMALI, 1957/58).
Table 71. Survey of imported varieties, their origins and their use as parents for crosses.
Country of origin
Brazil Burma Ceylon Congo Costa Rica Cuba Egypt Gaboon Guatemala Guyana Honduras India Indonesia Iran Italy Jamaica
Number of varieties
6 8
15 2 1 3 3 1 1 6 1
21 26
1 20
1
Used as parents
-----1
---3
-4
10
--^
Country of origin
Madagascar Malaya Nigeria Pakistan Philippines Porto Rico Portugal Senegal Sierra Leone Taiwan Tanzania Thailand Trinidad United States Venezuela Vietnam
Number of varieties
5 1 2 2 5 2 1 1 8
15 2 5 6
193 13 14
Used as parents
1 1
--1
--------
27 -—
263
13.4 Crossing technique and raising Fx plants
Parental combinations must be carefully determined. Yet the choice of parents should not be too rigid so that good combinations are missed. For instance, SML 77a demonstrates the occurrence of transgression in respect to stiffness of straw. Cytoplasmic inheritance shows the desirability of reciprocal crosses. A large number of crosses are necessary to increase the chances of desirable gene combinations and to obtain a large genetic diversity. Selection methods should allow early discarding of poor hybrid populations, allowing time and scope for new combinations. Regular crossing makes for a harmonious composition of breeding stock over the different generations.
Crosses were often made with lines that were not yet breeding fully true to type and whose properties were only partially known. This accelerated improvements in the varietal stock (see table 76, p. 277). The time thus gained more than compensated the extra work involved.
13.4.1 Emasculation and pollination
Methods of emasculation are based on: (a) mechanical removal of the anthers and (b) killing the pollen with hot water or hot air. In both procedures the 'glumes' may sometimes be partly cut away. A detailed description of the commonest methods is given by CHANDRARATNA (1964).
In Surinam the suction method is applied as developed by VAN DER MEULEN (1932/ 33) in Indonesia. After the lemma and palea have been cut back, the stamens are sucked off with a fine glass nozzle attached to a small vacuum pump. The procedure is as follows.
The maternal plants are potted a few days before crossing and preferably placed in a well-lit working room. Panicles already in bloom are removed. For crossing panicles are selected which are in the second or third day of flowering; spikelets that have ceased to bloom and those which have not yet matured are removed. The maturity of the spikelets can be ascertained by the position of the anthers (by transmitted light) and to some extent by the colour of the lemma and palea. Spikelets are removed also if the filaments have elongated so much that anthers are in the upper part of the floret, because of the later risk of self-pollination. Next the panicle is thinned somewhat further to facilitate the operation. Preferably some 20 florets are retained.
After cutting away a third or half of the lemma and palea of 5 to 10 spikelets with a pair of curved scissors, the stamens are sucked off carefully so that no anthers are opened and other floral parts are not damaged. Another batch of spikelets is then treated. This step-by-step emasculation reduces the chance of self-fertilization which is facilitated by the treatment; warmth speeds flowering. Success of avoiding self-pollination is checked with a magnifying glass to see that the stigmas are free from pollen. The fingers, scissors and glass nozzle must be cleaned regularly with alcohol. After emasculation the panicle is covered with a paper bag.
264

4m
Photo 37. Emasculation by sucking off the
These operations are performed between 07.00 and 09.00 h. According to the literature (JENNINGS et ai, 1964; CARPENTER and ROBERTS, 1962) the emasculation is equally or more feasible on the previous afternoon but, personally, we preferred carrying out this fine work in the early morning.
This emasculation method is little used, perhaps because it is not known. Yet it is satisfactory. The damage to the florets seems to be less important than the advantage of easier pollination and less dependence on the time of emasculation (see also JENNINGS et al, 1964).
Pollination was usually a few hours after emasculation. The following method was used. Between 09.30 and 10.30 h sufficient panicles of the parent are gathered and put in a glass of water on a sheltered and sunny spot. The use of different male parents on the same morning requires adequate precautions to prevent accidental pollination.
After flowering started, one or two ripe anthers (distinguishable by their lighter colour) are taken away by the filaments with curved and fine-pointed forceps. Their contents are dusted onto the stigmas of a female spikelet. A magnifying glass is used
265
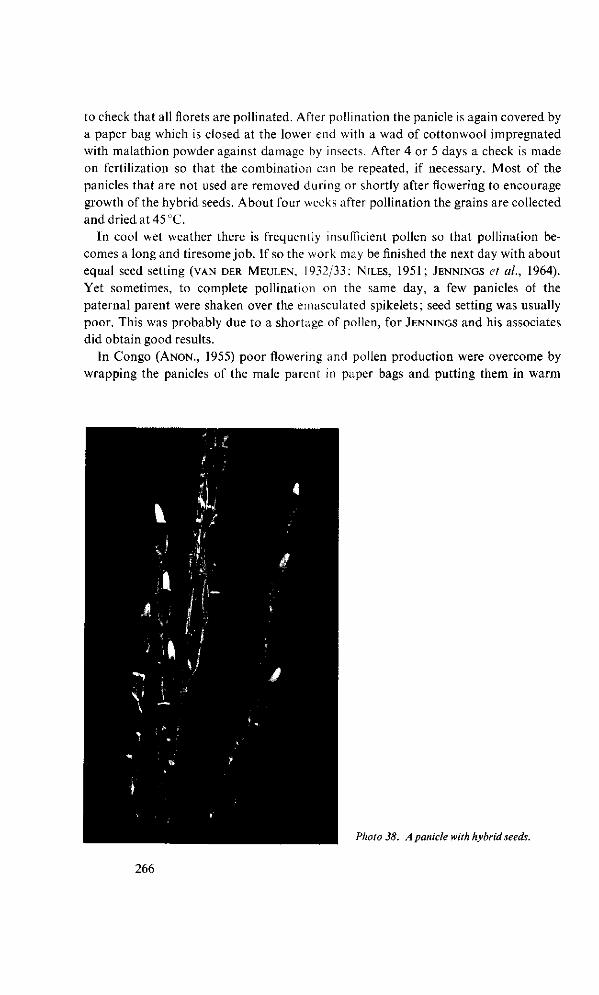
to check that all florets are pollinated. After pollination the panicle is again covered by
a paper bag which is closed at the lower end with a wad of cottonwool impregnated
with malathion powder against damage by insects. After 4 or 5 days a check is made
on fertilization so that the combination can be repeated, if necessary. Most of the
panicles that are not used are removed during or shortly after flowering to encourage
growth of the hybrid seeds. About four weeks after pollination the grains are collected
and dried at 45 °C.
In cool wet weather there is frequently insufficient pollen so that pollination be
comes a long and tiresome job. If so the work may be finished the next day with about
equal seed setting (VAN DER MEULEN, 1932/33; NILES, 1951; JENNINGS et al., 1964).
Yet sometimes, to complete pollination on the same day, a few panicles of the
paternal parent were shaken over the emasculated spikelets; seed setting was usually
poor. This was probably due to a shortage of pollen, for JENNINGS and his associates
did obtain good results.
In Congo (ANON. , 1955) poor flowering and pollen production were overcome by
wrapping the panicles of the male parent in paper bags and putting them in warm
Photo 38. A panicle with hybrid seeds.
266
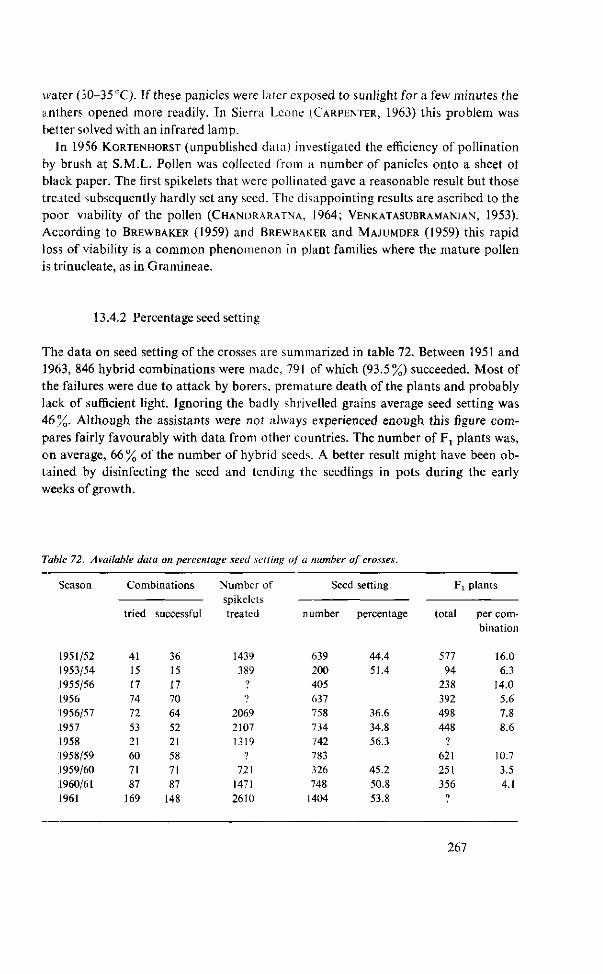
water (30-35 °C). If these panicles were later exposed to sunlight for a few minutes the anthers opened more readily. In Sierra Leone (CARPENTER, 1963) this problem was belter solved with an infrared lamp.
In 1956 KORTENHORST (unpublished data) investigated the efficiency of pollination by brush at S.M.L. Pollen was collected from a number of panicles onto a sheet ot black paper. The first spikelets that were pollinated gave a reasonable result but those treated subsequently hardly set any seed. The disappointing results are ascribed to the poor viability of the pollen (CHANDRARATNA, 1964; VENKATASUBRAMANIAN, 1953). According to BREWBAKER (1959) and BREWBAKER and MAJUMDER (1959) this rapid loss of viability is a common phenomenon in plant families where the mature pollen is trinucleate, as in Gramineae.
13.4.2 Percentage seed setting
The data on seed setting of the crosses are summarized in table 72. Between 1951 and 1963, 846 hybrid combinations were made, 791 of which (93.5%) succeeded. Most of the failures were due to attack by borers, premature death of the plants and probably lack of sufficient light. Ignoring the badly shrivelled grains average seed setting was 46%. Although the assistants were not always experienced enough this figure compares fairly favourably with data from other countries. The number of F1 plants was, on average, 66 % of the number of hybrid seeds. A better result might have been obtained by disinfecting the seed and tending the seedlings in pots during the early weeks of growth.
Table 72. Available data on percentage seed setting of a number of crosses.
Season
1951/52 1953/54 1955/56 1956 (956/57 1957 1958 1958/59 1959/60 1960/61 1961
Combinations
tried
41 15 17 74 72 53 21 60 71 87
169
successful
36 15 17 70 64 52 21 58 71 87
148
Number of spikelets treated
1439 389
9
') 2069 2107 1319
7
721 1471 2610
Seed setting
number
639 200 405 637 758 734 742 783 326 748
1404
percentage
44.4 51.4
36.6 34.8 56.3
45.2 50.8 53.8
F t
total
577 94
238 392 498 448
?
621 251 356
9
plants
per combination
16.0 6.3
14.0 5.6 7.8 8.6
10.7 3.5 4.1
267
Only few data are available on the percentage self-fertilization; it is estimated to have been between 5 and 8. Though this percentage is rather high, it is acceptable if the self-fertilized plants in the F1 generation can be clearly identified (for instance by choice of maternal parent, duration of growth and heterosis).
An average of 7 plants to each combination were raised in F r Except where hybrid sterility occurred, each of these plants yielded from 1500 to 3000 grains. Depending on the number of characters involved, this number of F t plants was usually large enough to grow an Fa population of sufficient size.
13.4.3 Raising F1 plants
About four weeks after harvest the hybrid seeds were laid out on moist filter paper in petri dishes, about a week before planting in the nursery bed. They were transplanted in the field five or six weeks later. If a cross yields only a few plants they can be profitably split. This method seems better than trying to obtain ratoon shoots for additional seed production (gain of time, fewer risks). Wide spacing (50 X 50 cm) and careful tending promote grain yield. Damage by birds can be prevented by covering the plants after flowering with half-inch wire netting.
At maturity the plants originating from selling were first removed; the poorest plants were next discarded. This rejection was felt necessary because of the chance of undesirable cross-fertilization and because crosses were often from impure lines or types with insufficiently known properties. Especially where one or both parents were still impure, the seed of the F1 plants was multiplied separately. Since 1961, when all hybrid populations were sown directly, the grain of each combination was harvested and threshed in bulk.
13.5 Selection in later generations
13.5.1 General review up to 1963
A few seasons before the varieties derived from the Van Dijk populations were released, the first crosses were made between promising lines from this stock and Géant, Bluebonnet and lines from the hybrid populations 133e and 134e (first group). As the favourable characteristics of the Van Dijk stock became more apparent and other breeding material from former years yielded little of value, numerous mutual crosses were made, from 1954 till 1957, between Van Dijk lines (second group). The hope was to combine the favourable characters within this material into some new varieties. Promising lines from the progeny of both groups were crossed mutually and with Skk and Mas.
From this breeding stock (245 hybrid populations) the following commercial varieties have been obtained: SML81b, SML 140/5, SML 140/10, SML 242 and SML
268

Van Dijk stock Bluebonnet
Nickerie 77/5/6/3 Dima SML 80/5 SML 80/7 77/5/3/« 1955 1953 1956 1956
134c/11/1/11
SML 77a
~~r~ Fi
SML 242 1960
81 a SML 81 b 1958
SML UO/5 SML 140/10 1959 1959
SML 128/4 1961
131/1/1/1
SML 352 1963
Fig. 61. Genealogy of SML varieties and year of their release.
128/4 (see fig. 61). They all yielded much more than the earlier varieties (table 79, p. 288) and surpassed them in disease resistance and grain size. The resistance to lodging was about equal but the average growth period was a few days longer. Intercrossing of these varieties and related lines has failed to bring further improvement; most of this material has been gradually rejected through susceptibility to diseases.
The next step in breeding, making crosses with shorter-duration varieties and with indica types highly tolerant to reduced soil and growing rapidly initially, had to be delayed for some years because of the serious menace of hojablanca. The hybrid populations obtained in the course of breeding for resistance to hojablanca yielded SML 352. It was fairly tolerant to adverse soil conditions, had good seedling vigour but a low output of whole rice. Many valuable types were found among these populations. Further selection by Van der Spek has resulted in two more varieties, Apura and Temerin.
In 1960 the interrupted crossing programme was resumed. Since then numerous crosses have been made between promising material of existing stock and United States varieties, indica types from Surinam, Guyana and Indonesia and a few varieties imported through FAO. This programme extended the objectives to cultivation by smallholders in Nickerie. The gradual expansion of breeding stock reached in 1961 between 15,000 to 20,000 selections per year (table 73).
269
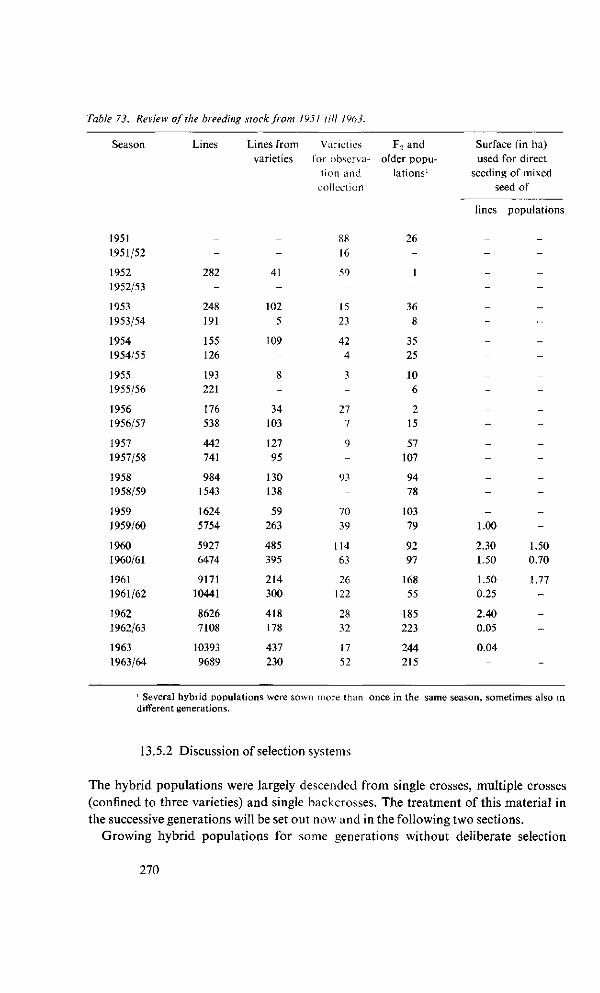
Table 73. Review of the breeding stock from 1951 till 1963.
Season Lines Lines from Varieties F 2 and varieties for observa- older popu-
tion and lations1
collection
Surface (in ha) used for direct
seeding of mixed seed of
lines populations
1951
1951/52
1952
1952/53
1953
1953/54
1954
1954/55
1955
1955/56
1956
1956/57
1957
1957/58
1958
1958/59
1959
1959/60
1960
1960/61
1961
1961/62
1962
1962/63
1963
1963/64
--
282 -
248 191
155 126
193 221
176 538
442 741
984 1543
1624
5754
5927
6474
9171
10441
8626
7108
10393
9689
--
41 -
102 5
109 -
8 -
34 103
127 95
130 138
59 263
485 395
214 300
418 178
437 230
88 16
59 -
15 23
42 4
3 -
27 7
9 -
93 -
70 39
114 63
26 122
28 32
17 52
26 -
1 -
36 8
35 25
10 6
2 15
57 107
94 78
103 79
92 97
168 55
185 223
244 215
--
----
--
--
--
--
--
-1.00
2.30
1.50
1.50
0.25
2.40
0.05
0.04
-
--
--
--
--
--
--
--
--
--
1.50
0.70
1.77
-
----
1 Several hybrid populations were sown more than once in the same season, sometimes also in different generations.
13.5.2 Discussion of selection systems
The hybrid populations were largely descended from single crosses, multiple crosses (confined to three varieties) and single backcrosses. The treatment of this material in the successive generations will be set out now and in the following two sections.
Growing hybrid populations for some generations without deliberate selection
270
must be rejected under Surinam conditions as such populations cannot be exposed to effective natural selection in favour of desirable types. Often it is even necessary to select in hybrid populations to prevent useful characters (short straw, long grains and short growth period) from being eliminated by natural selection. In selecting from the populations listed above, the following methods can be used: a. mass selection, followed by line (pedigree) selection; b. line selection; c. combinations of mass selection and line selection.
The significance of these selection procedures and their application to S.M.L.'s breeding work are discussed below. A general review of rice-breeding techniques is the FAO publication compiled by HARRINGTON (1952). Rice breeding in the United States was summarized by ADAIR et al. ( 1966).
Mass selection, followed by line selection. Mass selection means selection of some desired character or characters after which the seed of the selected material is sown in bulk. The purpose of mass selection is to confine the population by collecting plants which approach the desired types, in order to increase the chances of finding the desired genotypes in later generations. As the genetic mechanism of most of the characters under selection is insufficiently known and some properties (such as absence of pubescence and awns) are controlled by recessive genes, selection in early generations must not be too rigorous. Yet the amount of material must be restricted as far as possible without the risk of losing valuable gene combinations. Where, as here, many selection criteria relate to qualitative and easily distinguishable characters, and selection is based on individual plants, semi-skilled labour can be readily trained for this system of mass selection. It is cheap and simple.
After mass selection until about F5 to F7, a change can be made to line selection. This is preferably started in a favourable season when the main characters under selection are distinct. The chances of selecting almost homozygous types have by then considerably increased, so that further selection within the lines hardly offers any new possibilities. The main objection to this method is that for a few generations the seed of numerous phenotypically attractive plants is bulked without any chance of testing favourable characters in individual progenies. The most drastic remedy is to practise line selection from F2 down, by which the object is also more quickly achieved.
Line selection. Line selection means the system of selecting individual plants or panicles, whose progeny is grown separately. Except for the subsequent handling of the seed, line selection in F2 is essentially the same as (positive) mass selection in that generation. In some cases (as with a small F2 population, or crosses between genetically widely divergent parents) line selection can better be started in F3. The necessity of isolating a large number of plants from F2 makes line selection during the first few generations much dearer and more laborious than mass selection. However, selection is more effective in individual progenies than in a population. The weakness of line selection lies in the generation when it is first practised. This weakness
271
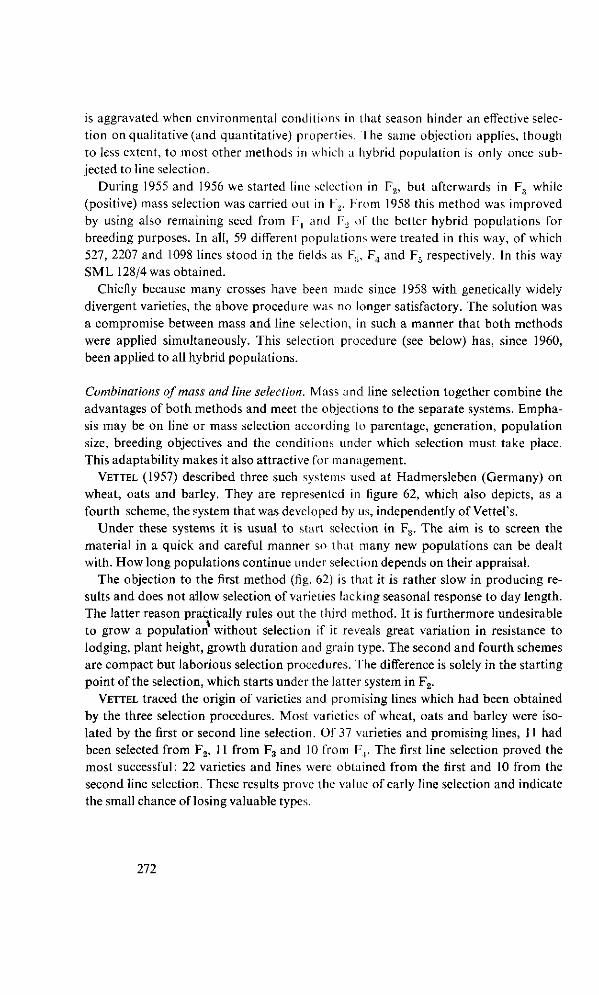
is aggravated when environmental conditions in that season hinder an effective selection on qualitative (and quantitative) properties. The same objection applies, though to less extent, to most other methods in which a hybrid population is only once subjected to line selection.
During 1955 and 1956 we started line selection in F2, but afterwards in F3 while (positive) mass selection was carried out in F2. From 1958 this method was improved by using also remaining seed from F, and F.2 of the better hybrid populations for breeding purposes. In all, 59 different populations were treated in this way, of which 527, 2207 and 1098 lines stood in the fields as F.,, F4 and F5 respectively. In this way SML 128/4 was obtained.
Chiefly because many crosses have been made since 1958 with genetically widely divergent varieties, the above procedure was no longer satisfactory. The solution was a compromise between mass and line selection, in such a manner that both methods were applied simultaneously. This selection procedure (see below) has, since 1960, been applied to all hybrid populations.
Combinations of mass and line selection. Mass and line selection together combine the advantages of both methods and meet the objections to the separate systems. Emphasis may be on line or mass selection according to parentage, generation, population size, breeding objectives and the conditions under which selection must take place. This adaptability makes it also attractive for management.
VETTEL (1957) described three such systems used at Hadmersleben (Germany) on wheat, oats and barley. They are represented in figure 62, which also depicts, as a fourth scheme, the system that was developed by us, independently of Vettel's.
Under these systems it is usual to start selection in F3. The aim is to screen the material in a quick and careful manner so that many new populations can be dealt with. How long populations continue under selection depends on their appraisal.
The objection to the first method (fig. 62) is that it is rather slow in producing results and does not allow selection of varieties lacking seasonal response to day length. The latter reason practically rules out the third method. It is furthermore undesirable to grow a population without selection if it reveals great variation in resistance to lodging, plant height, growth duration and grain type. The second and fourth schemes are compact but laborious selection procedures. The difference is solely in the starting point of the selection, which starts under the latter system in F2.
VETTEL traced the origin of varieties and promising lines which had been obtained by the three selection procedures. Most varieties of wheat, oats and barley were isolated by the first or second line selection. Of 37 varieties and promising lines, 11 had been selected from F2, 11 from F3 and 10 from F,. The first line selection proved the most successful: 22 varieties and lines were obtained from the first and 10 from the second line selection. These results prove the value of early line selection and indicate the small chance of losing valuable types.
272
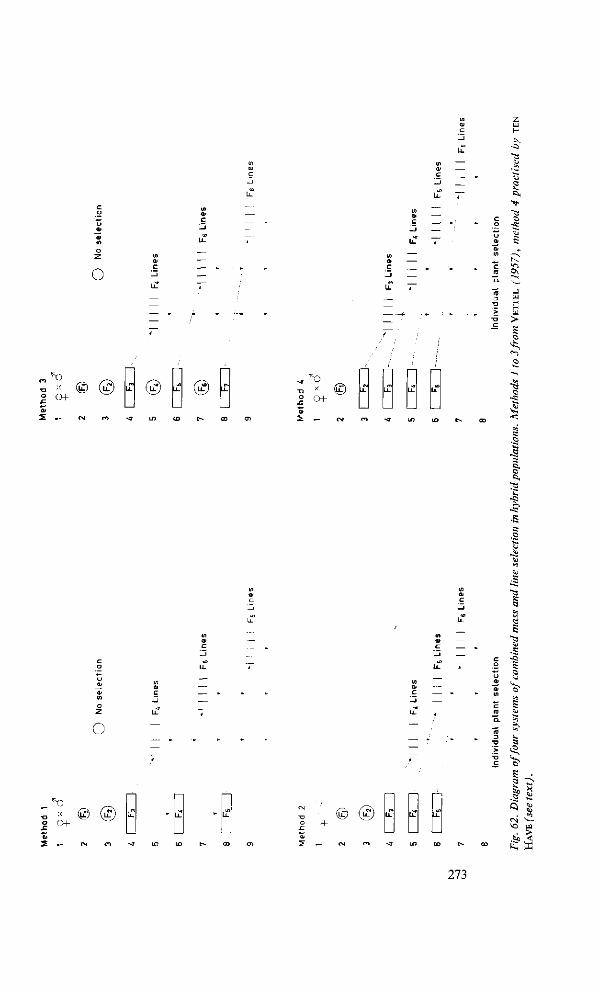
o
z
~ 1^
> S
en w
•a :<
° C>f © x
CM-IL I I IL I I
•3 s o,
LÜ - O
TS &
*C IL I I 1 1
1 ^
IP Q <N vo 6/1
t;
^ " i
M
> < X
273
13.5.3 Selection in hybrid populations
Until 1960 direct sowing of hybrid populations in the field was not felt to be justified in view of the risks of failure, uneven density and contamination with volunteer rice. Therefore transplanting was practised. The spacing was 20 cm each way and one plant per 'hill'. Seed of each Fx plant was grown separately because many F. and F6 lines were used for crossing. The F2 and F., populations averaged about 3 to 15 sub-plots with a total area of 50 to 250 m2 (or between 1200 and 6000 plants). These rather small numbers of plants per hybrid combination were considered sufficient because: a. the parents were fairly closely related, b. many similar crosses were carried out, c. seed of each F1 plant was separately grown, d. the size of the F3 population was adjusted according to the appraisal of the F2, e. individual plant selection was practised, f. remaining seed of the best populations was used afterwards.
As the quantity of breeding stock increased rapidly, it became urgent to introduce a working method requiring less labour. After successful experiments with direct sowing of populations in 1960, this practice was adopted for all hybrid populations.
Depending on seed rate either plant or panicle selection can be practised. Panicle selection, however, yields too little seed to ensure sufficient progeny under local cultural practice. Individual plant selection even provides enough seed for simple quality testing and allows storage of superfluous seed for later selection if the hybrid populations proved promising. Individual plant selection allows more effective evaluation of a larger number of characters such as tillering, plant type, uniform ripening and resistance to diseases and lodging.
To permit adequate selection for tillering without producing too much trouble from lodging, seed rate was fixed at 40 to 50 kg/ha. It produced a closed crop (chapter 5). Uniform density was encouraged by sowing germinated seed on mud and flooding the field after about five days.
Apart from the substantial saving of labour and expense and the shortening of the growth duration by about three weeks, direct seeding enables effective selection from far more plants per unit area. Density averaged from 60 to 90 plants per m2. The occurrence of volunteer rice has caused only a little trouble. Direct seeding also means less reliance on certain fields, allowing more flexibility and better selection for certain characters.
The average plot size of an F2 population was 90 m2 during the last five seasons (1961 to 1963). For later generations the figures were: 220 m2 for F3, 300 m2 for F4
and 200 m2 for F5. Table 74 reviews the number of hybrid populations and the number of combina
tions which were grown from Fi to F6. Though some objections may be raised against it, elimination of poor combinations was practised from Fx. Mass selection generally ended in F4 ; in F5 only lines were selected. Remaining seed of better populations was used in later seasons.
274
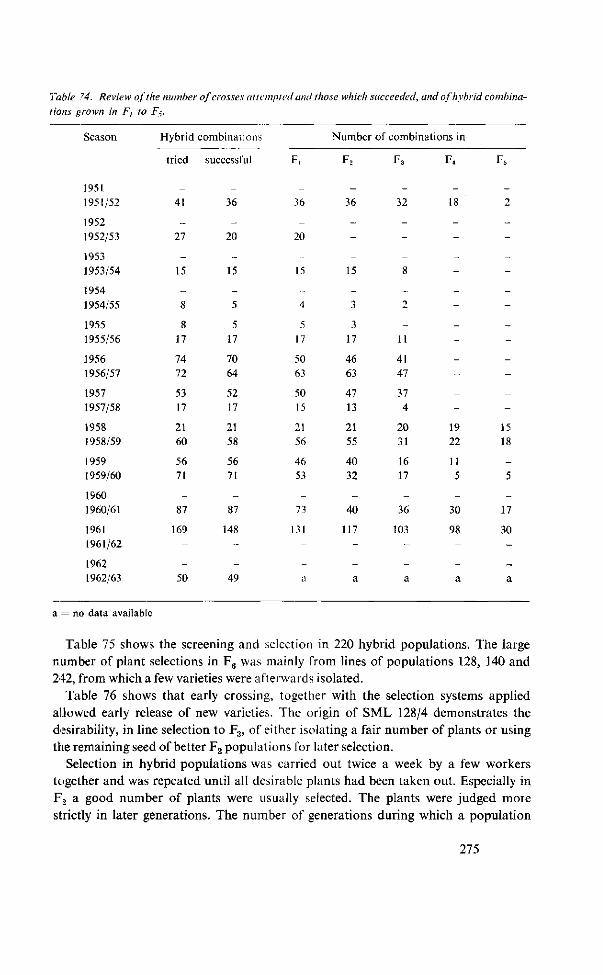
Table 74. Review of the number of crosses at tempted and those which succeeded, and of hybrid combina
tions grown in Ft to F5.
Season
1951 1951/52
1952 1952/53
1953 1953/54
1954 1954/55
1955 1955/56
1956 1956/57
1957 1957/58
1958 1958/59
1959 1959/60
1960 1960/61
1961 1961/62
1962 1962/63
Hybrid combinations
tried
„
41
~ 27
-15
-8
8 17
74 72
53 17
21 60
56 71
-87
169
--
50
successful
_ 36
-20
-15
-5
5 17
70 64
52 17
21 58
56 71
-87
148
--
49
F,
-36
-20
-15
4
5 17
50 63
50 15
21 56
46 53
-73
131
--a
Number of combinations in
F2
_ 36
---
15
-3
3 17
46 63
47 13
21 55
40 32
-40
117
--a
F 3
_ 32
---8
-2
-11
41 47
37 4
20 31
16 17
-36
103
--a
F4
_ 18
------------
19 22
11 5
-30
98
--a
F5
_ 2
------------
15 18
-5
-17
30
--a
a = no data available
Table 75 shows the screening and selection in 220 hybrid populations. The large number of plant selections in F6 was mainly from lines of populations 128, 140 and 242, from which a few varieties were afterwards isolated.
Table 76 shows that early crossing, together with the selection systems applied allowed early release of new varieties. The origin of SML 128/4 demonstrates the desirability, in line selection to F3, of either isolating a fair number of plants or using the remaining seed of better F2 populations for later selection.
Selection in hybrid populations was carried out twice a week by a few workers together and was repeated until all desirable plants had been taken out. Especially in F2 a good number of plants were usually selected. The plants were judged more strictly in later generations. The number of generations during which a population
275
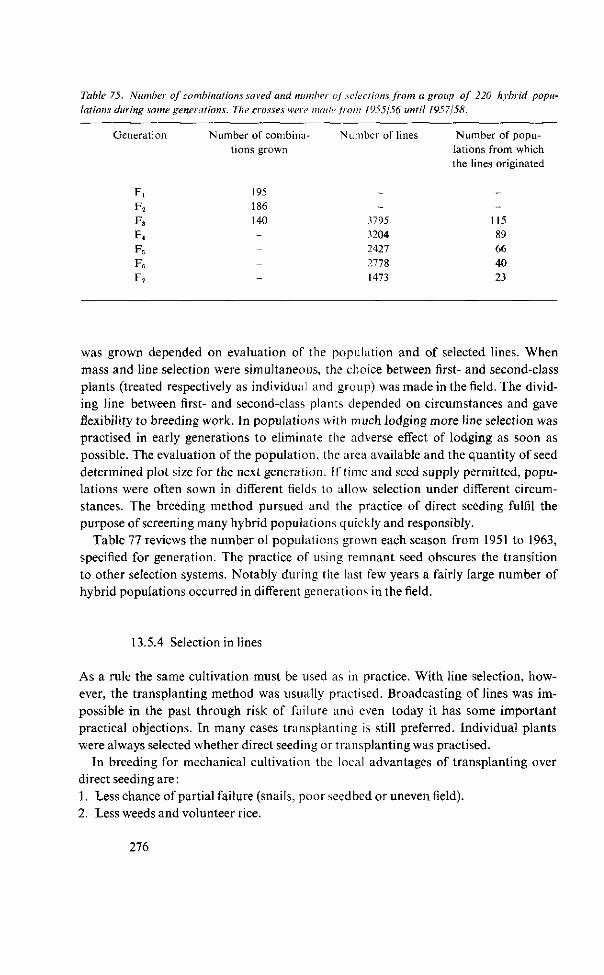
Table 75. Number of combinations saved and number of selections from a group of 220 hybrid populations during some generations. The crosses were made from 1955/56 until 1957/58.
Generation
F!
F2
F 3
F4
F6
F„ F7
Number of combinations grown
195 186 140
---—
N umber of lines
-_ -
3795 3204 2427 2778 1473
Number of populations from which the lines originated
_ -
115 89 66 40 23
was grown depended on evaluation of the population and of selected lines. When mass and line selection were simultaneous, the choice between first- and second-class plants (treated respectively as individual and group) was made in the field. The dividing line between first- and second-class plants depended on circumstances and gave flexibility to breeding work. In populations with much lodging more line selection was practised in early generations to eliminate the adverse effect of lodging as soon as possible. The evaluation of the population, the area available and the quantity of seed determined plot size for the next generation. If time and seed supply permitted, populations were often sown in different fields to allow selection under different circumstances. The breeding method pursued and the practice of direct seeding fulfil the purpose of screening many hybrid populations quickly and responsibly.
Table 77 reviews the number of populations grown each season from 1951 to 1963, specified for generation. The practice of using remnant seed obscures the transition to other selection systems. Notably during the last few years a fairly large number of hybrid populations occurred in different generations in the field.
13.5.4 Selection in lines
As a rule the same cultivation must be used as in practice. With line selection, however, the transplanting method was usually practised. Broadcasting of lines was impossible in the past through risk of failure and even today it has some important practical objections. Tn many cases transplanting is still preferred. Individual plants were always selected whether direct seeding or transplanting was practised.
In breeding for mechanical cultivation the local advantages of transplanting over direct seeding are: 1. Less chance of partial failure (snails, poor seedbed or uneven field). 2. Less weeds and volunteer rice.
276
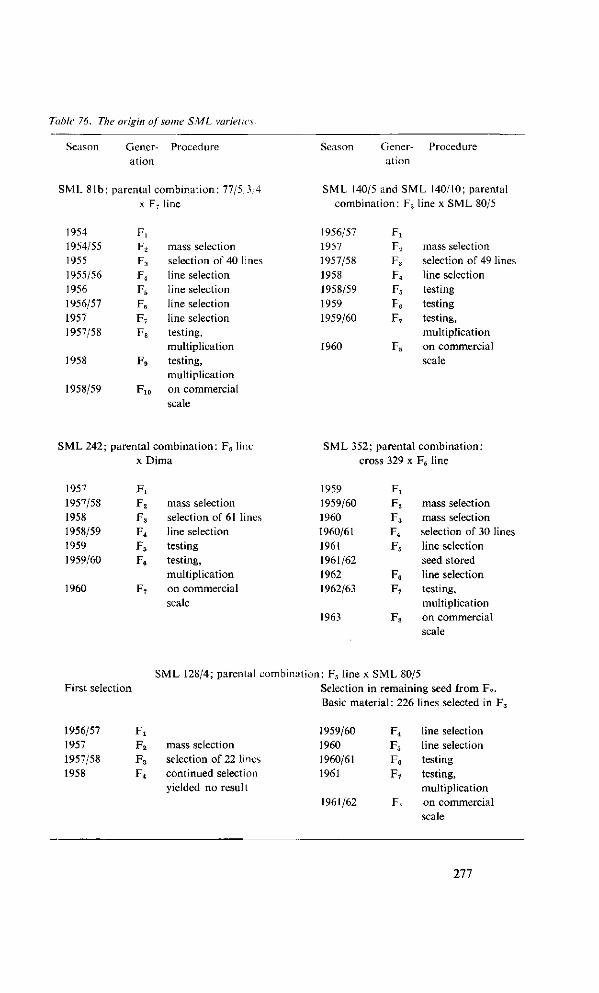
Table 76. The origin of some S ML varieties.
Season Gener- Procedure ation
SML 81b; parental combination: 77/5 3,4 x F7 line
Season Gener- Procedure ation
SML 140/5 and SML 140/10; parental combination: Fä line x SML 80/5
1954 1954/55 1955 1955/56 1956 1956/57 1957 1957/58
1958
1958/59
FL
F.,
F 3
F4
F5
F6
F7
F 8
F9
F10
mass selection selection of 40 line selection line selection line selection line selection testing, multiplication testing, multiplication on commercial scale
1956/57 1957 1957/58 1958 1958/59 1959 1959/60
1960
F l
F2
F 3
F4
F5
F6
F 7
F8
mass selection selection of 49 lines line selection testing testing testing, multiplication on commercial scale
SML 242; parental combination: F 6 line x Dima
SML 352; parental combination: cross 329 x F5 line
1957 1957/58 1958 1958/59 1959 1959/60
1960
Fx
F 2
F 3
F 4
F5
F6
F7
mass selection selection of 61 lines line selection testing testing, multiplication on commercial scale
1959 1959/60 1960 1960/61 1961 1961/62 1962 1962/63
1963
F , F2
F 3
F4
F5
Fe F ,
Fs
mass selection mass selection selection of 30 lines line selection seed stored line selection testing, multiplication on commercial scale
SML 128/4; parental First selection
1956/57 1957 1957/58 1958
Fx F 2
F 3
F4
mass selection selection of 22 lines continued selection yielded no result
Selection in remaining seed from F2 . Basic material: 226 lines selected in F 3
1959/60 1960 1960/61 1961
1961/62
F4
F5
F6
F 7
F8
line selection line selection testing testing, multiplication on commercial scale
277
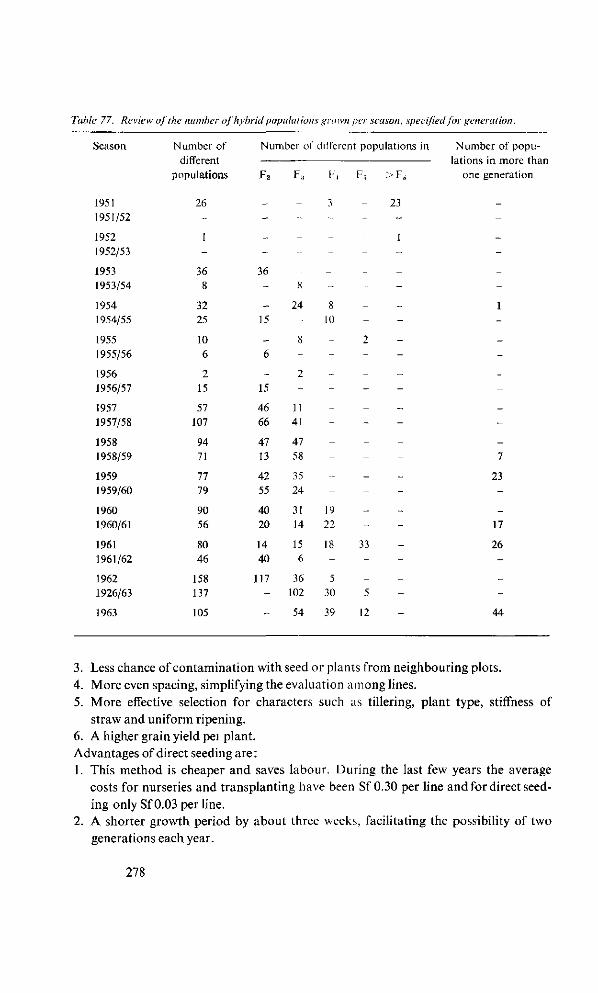
Table 77. Review of the number of hybrid populations grown per season, specified for generation.
Season
1951 1951/52
1952 1952/53
1953 1953/54
1954 1954/55
1955 1955/56
1956 1956/57
1957 1957/58
1958 1958/59
1959 1959/60
1960 1960/61
1961 1961/62
1962 1926/63
1963
Number of different
populations
26
-
1
-36 8
32 25
10 6
2 15
57 107
94 71
77 79
90 56
80 46
158 137
105
Number of different populations in Number of popu-lations in more than
F2 F;, F-', F.-, >F.5 one generation
36
15
15
8
24
3
10
23
46 66
47 13
42 55
40 20
14 40
117 -„
11 41
47 58
35 24
31 14
15 6
36 102
54
--_ -
-
19 22
18
-5
30
39
--------
33
--5
12
7
23
17
26
44
3. Less chance of contamination with seed or plants from neighbouring plots. 4. More even spacing, simplifying the evaluation among lines. 5. More effective selection for characters such as tillering, plant type, stiffness of
straw and uniform ripening. 6. A higher grain yield pei plant. Advantages of direct seeding are: 1. This method is cheaper and saves labour. During the last few years the average
costs for nurseries and transplanting have been Sf 0.30 per line and for direct seeding only Sf 0.03 per line.
2. A shorter growth period by about three weeks, facilitating the possibility of two generations each year.
278
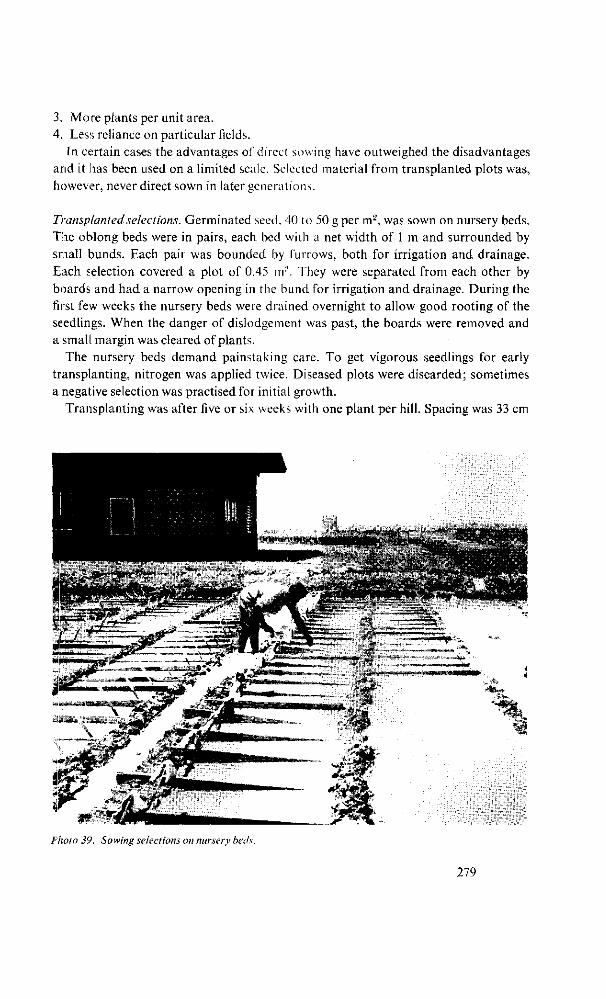
3. More plants per unit area. 4. Less reliance on particular fields.
In certain cases the advantages of direct sowing have outweighed the disadvantages and it has been used on a limited scale. Selected material from transplanted plots was, however, never direct sown in later generations.
Transplanted selections. Germinated seed, 40 to 50 g per m2, was sown on nursery beds. The oblong beds were in pairs, each bed with a net width of 1 m and surrounded by snail bunds. Each paii was bounded by furrows, both for irrigation and drainage. Each selection covered a plot of 0.45 m2. They were separated from each other by boards and had a narrow opening in the bund for irrigation and drainage. During the first few weeks the nursery beds were drained overnight to allow good rooting of the seedlings. When the danger of dislodgement was past, the boards were removed and a small margin was cleared of plants.
The nursery beds demand painstaking care. To get vigorous seedlings for early transplanting, nitrogen was applied twice. Diseased plots were discarded; sometimes a negative selection was practised for initial growth.
Transplanting was after five or six weeks with one plant per hill. Spacing was 33 cm
—« A i..v•-££.•"•' — • • r i " CaPWfe J • tg**
Fhoto 39. Sowing selections on nursery beds.
279
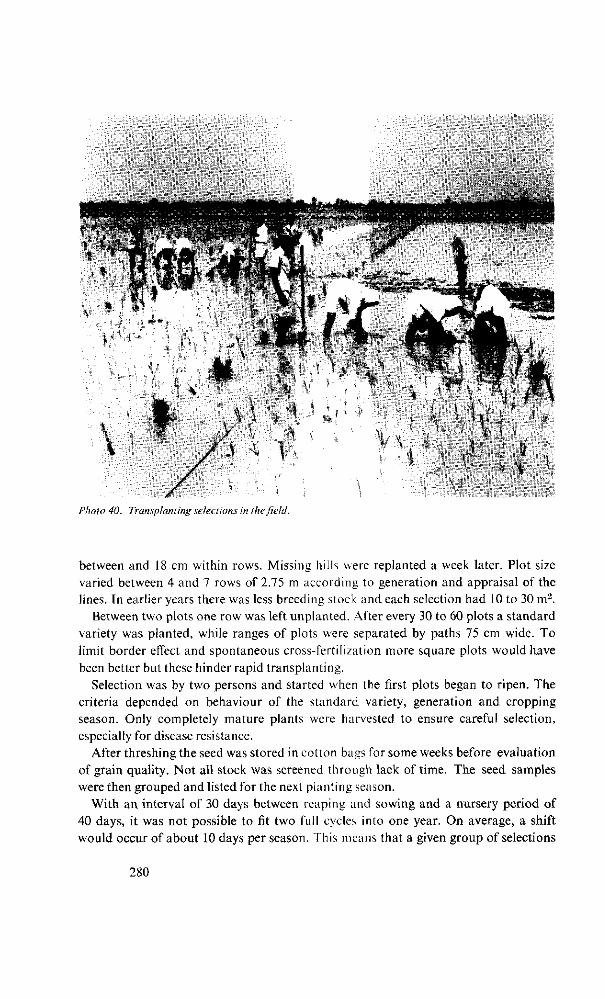
Photo 40. Transplanting selections in the field.
between and 18 cm within rows. Missing hills were replanted a week later. Plot size varied between 4 and 7 rows of 2.75 m according to generation and appraisal of the lines. In earlier years there was less breeding stock and each selection had 10 to 30 m2.
Between two plots one row was left implanted. After every 30 to 60 plots a standard variety was planted, while ranges of plots were separated by paths 75 cm wide. To limit border effect and spontaneous cross-fertilization more square plots would have been better but these hinder rapid transplanting.
Selection was by two persons and started when the first plots began to ripen. The criteria depended on behaviour of the standard variety, generation and cropping season. Only completely mature plants were harvested to ensure careful selection, especially for disease resistance.
After threshing the seed was stored in cotton bags for some weeks before evaluation of grain quality. Not all stock was screened through lack of time. The seed samples were then grouped and listed for the next planting season.
With an interval of 30 days between reaping and sowing and a nursery period of 40 days, it was not possible to fit two full cycles into one year. On average, a shift would occur of about 10 days per season. This means that a given group of selections
280
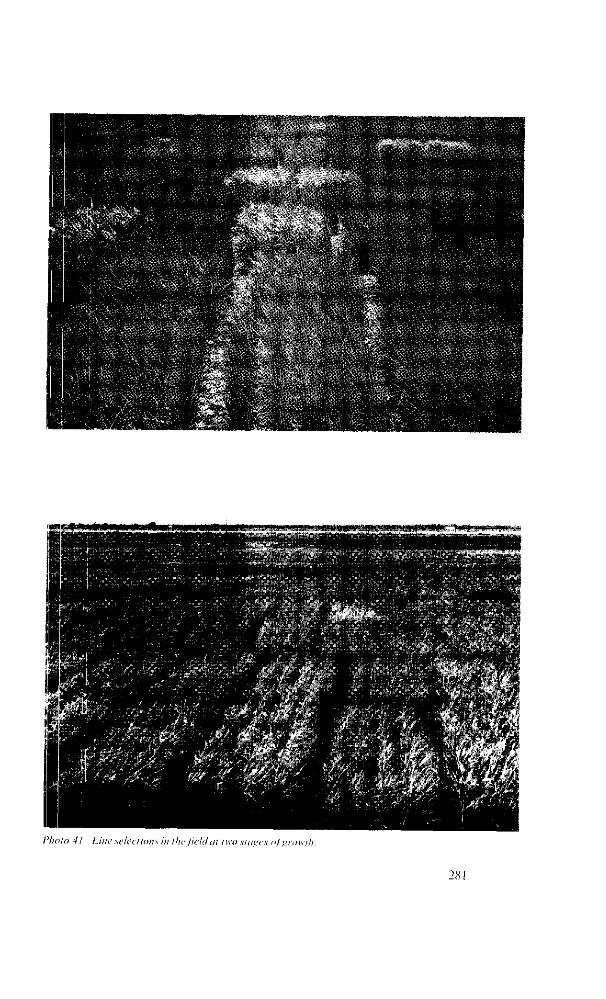
**/.-* J
, . ' • • • ; <•
fft' •V-ift
î* 5^. . , ..Jïw,
t & ;
. •£•'$* &-•**; Aly ï r '
/>/«•>/« 4/ /.///e selections in the field al two smites «I xrowih.
281
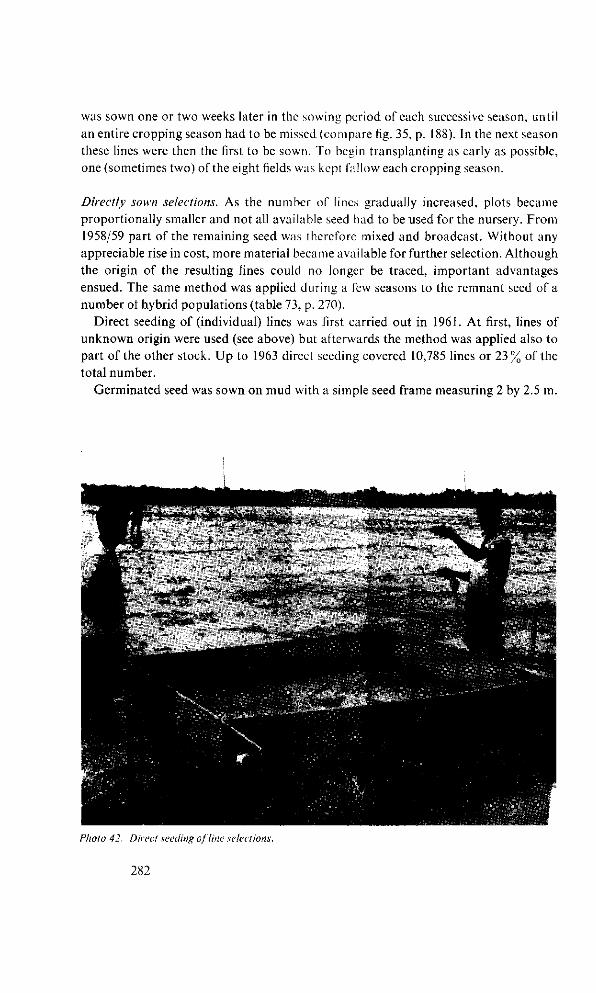
was sown one or two weeks later in the sowing period of each successive season, until an entire cropping season had to be missed (compare fig. 35, p. 188). In the next season these lines were then the first to be sown. To begin transplanting as early as possible, one (sometimes two) of the eight fields was kept fallow each cropping season.
Directly sown selections. As the number of lines gradually increased, plots became proportionally smaller and not all available seed had to be used for the nursery. From 1958/59 part of the remaining seed was therefore mixed and broadcast. Without any appreciable rise in cost, more material became available for further selection. Although the origin of the resulting lines could no longer be traced, important advantages ensued. The same method was applied during a few seasons to the remnant seed of a number ot hybrid populations (table 73, p. 270).
Direct seeding of (individual) lines was first carried out in 1961. At first, lines of unknown origin were used (see above) but afterwards the method was applied also to part of the other stock. Up to 1963 direct seeding covered 10,785 lines or 23% of the total number.
Germinated seed was sown on mud with a simple seed frame measuring 2 by 2.5 m.
Photo 42. Direct seeding of tine selections.
282
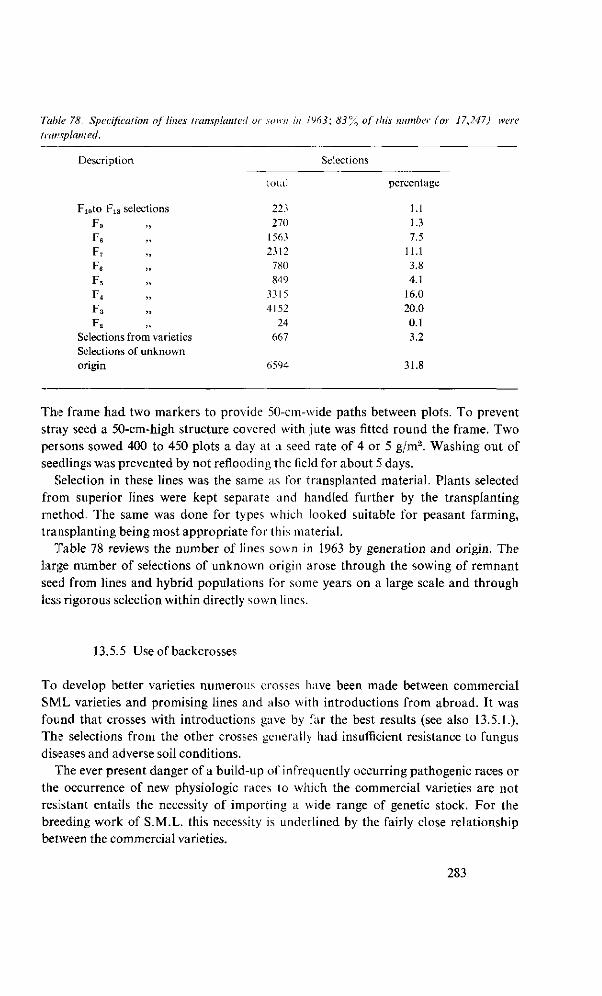
Table 78. Spécification of lines transplanted or sown in 1963; 83% of this number (or 17,247) were transplanted.
Description
F10to F13 selections
F 9
F e
F, F6
F 5
F 4
F 3
F 2
Selections from varieties Selections of unknown origin
Selections
total
223 270
1563 2312 780 849
3315 4152
24 667
6594
percentage
1.1 1.3 7.5
11.1 3.8 4.1
16.0 20.0 0.1 3.2
31.8
The frame had two markers to provide 50-cm-wide paths between plots. To prevent stray seed a 50-cm-high structure covered with jute was fitted round the frame. Two persons sowed 400 to 450 plots a day at a seed rate of 4 or 5 g/m2. Washing out of seedlings was prevented by not reflooding the field for about 5 days.
Selection in these lines was the same as for transplanted material. Plants selected from superior lines were kept separate and handled further by the transplanting method. The same was done for types which looked suitable for peasant farming, transplanting being most appropriate for this material.
Table 78 reviews the number of lines sown in 1963 by generation and origin. The large number of selections of unknown origin arose through the sowing of remnant seed from lines and hybrid populations for some years on a large scale and through less rigorous selection within directly sown lines.
13.5.5 Useofbackcrosses
To develop better varieties numerous crosses have been made between commercial SML varieties and promising lines and also with introductions from abroad. It was found that crosses with introductions gave by far the best results (see also 13.5.1.). The selections from the other crosses generally had insufficient resistance to fungus diseases and adverse soil conditions.
The ever present danger of a build-up of infrequently occurring pathogenic races or the occurrence of new physiologic races lo which the commercial varieties are not resistant entails the necessity of importing a wide range of genetic stock. For the breeding work of S.M.L. this necessity is underlined by the fairly close relationship between the commercial varieties.
283
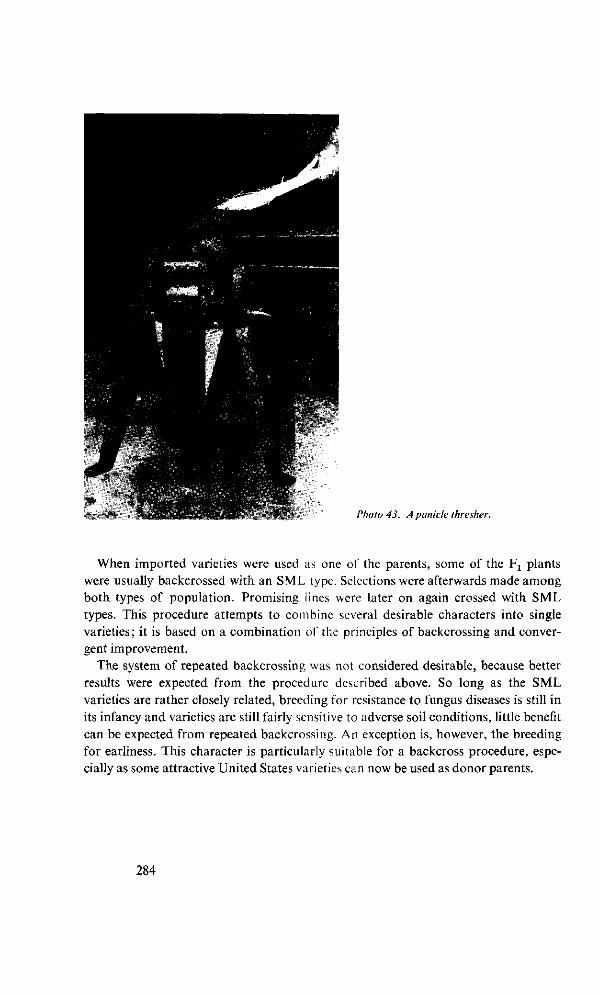
Photo 43. A panicle thresher.
When imported varieties were used as one of the parents, some of the ¥1 plants were usually backcrossed with an SML type. Selections were afterwards made among both types of population. Promising lines were later on again crossed with SML types. This procedure attempts to combine several desirable characters into single varieties; it is based on a combination of the principles of backcrossing and convergent improvement.
The system of repeated backcrossing was not considered desirable, because better results were expected from the procedure described above. So long as the SML varieties are rather closely related, breeding for resistance to fungus diseases is still in its infancy and varieties are still fairly sensitive to adverse soil conditions, little benefit can be expected from repeated backcrossing. An exception is, however, the breeding for earliness. This character is particularly suitable for a backcross procedure, especially as some attractive United States varieties can now be used as donor parents.
284
13.5.6 Artificial mutations
The practical purpose of inducing artificial mutations by radiation or chemical mutagens is to improve an otherwise valuable variety in one or more respects. When only one character is concerned, a few backcrosses with the original variety will be necessary to eliminate unfavourable side-effects, whether visible or not. If more characters are concerned, convergent crosses will be needed as well to transfer these characters to the original variety. The same purpose can generally be achieved more simply and certainly by choosing suitable parents and conducting one or more standard backcross procedures. In case more than one character is involved the ultimate variety can be obtained either by a combination cross or by convergent crosses. The choice of donor parents and the effectiveness of selection for the desired characters will determine the ultimate outcome.
In Surinam BEKENDAM (1961) investigated mutation by X-rays in the Nickerie and Holland varieties. We applied line selection within some of the material for a few seasons. The results were disappointing; in the breeding stock already available, possibilities of crop improvement were much better.
By far the greater part of mutation research on rice has been carried out in Japan. It has been summarized by KAWAI (1962) and by MATSUO and YAMAGUCHI (1962), while NAYAR (1965) surveys the world literature on mutation research in rice. NAYAR concludes that no new variety obtained by mutation breeding has as yet been released for commercial cultivation although numerous valuable mutants are recorded.
In many rice-cultivating countries hybridization was not started until about 1950, and imports of varieties and valuable genetic stock may therefore still offer considerable possibilities. The World Catalogue of Genetic Stocks of Rice22 gives a clear indication in this respect. Out of the 1344 varieties recorded in it till 1961, 25 % originated from crosses. For Japan, the United States, Italy, Taiwan and Madagascar an average of 67% of the listed varieties were from crosses; for other participating countries the percentage was only 7.
MYERS (1960) said of mutation research, 'the problem is not whether, but where it should be studied' and 'ye t it has been my observation that there is today more need to point out some limitations of radiation breeding than to emphasize its potentialities'. This is particularly meaningful for rice. In view of the present situation of rice research and rice breeding in the tropics and in many subtropical regions, the conclusion must be that the use of artificial mutations to improve this crop is, on the whole, premature.
22 World catalogue of genetic stocks of rice, FAO, 1950. Supplement 1 to 8: 1951 - 1961.
285
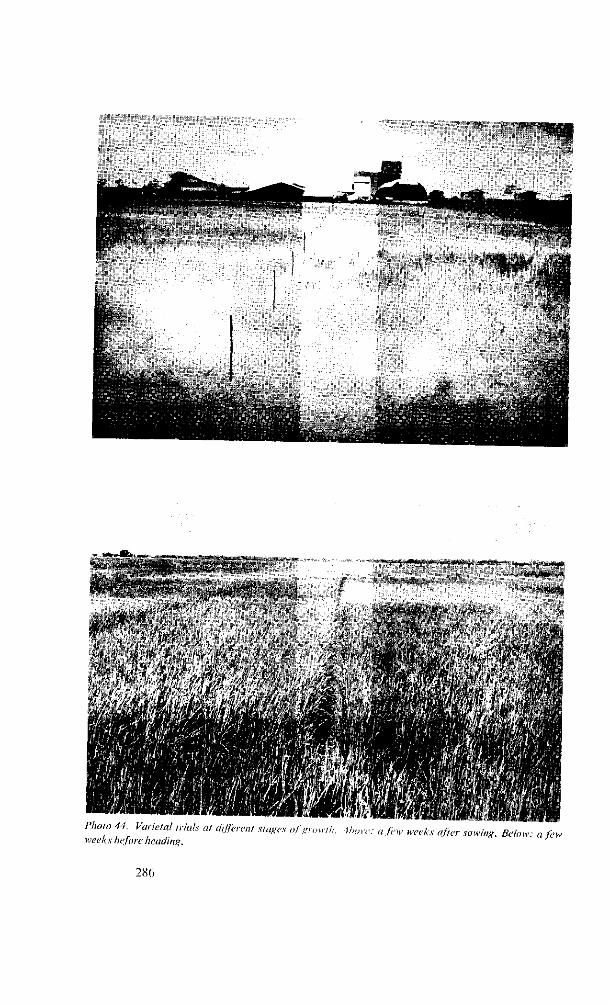
hu.-fin'--J i .
htm Photo 44. Varied triah at different stages „j , „„„,/ , . .,/„„,,. „ few wceks afm, sgwi ^low a few weeks before heading.
286
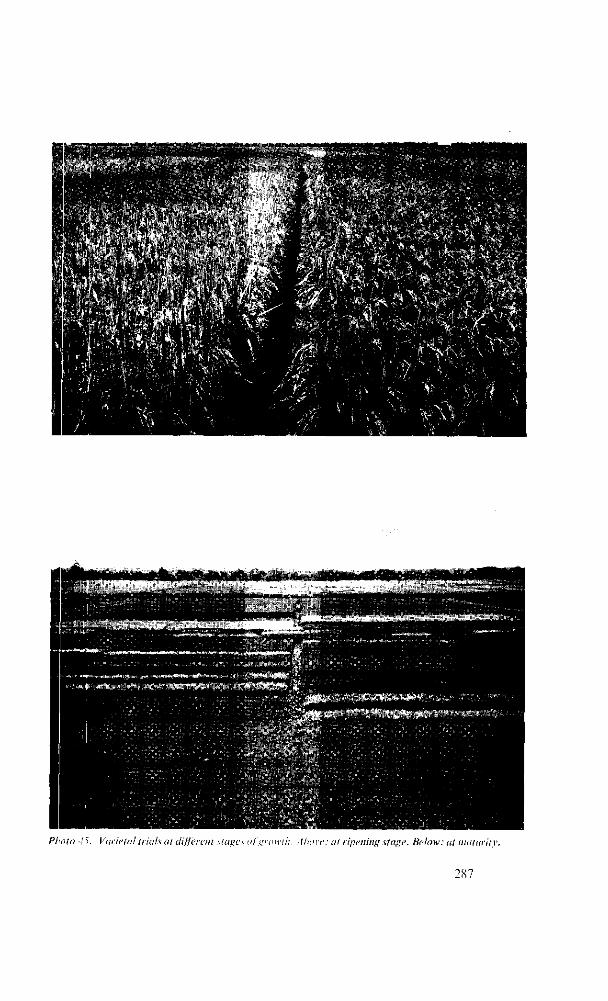
.fnk.1 ^ »ri
fiïfi&Ù V ' 1 . •
•i ;••'
fc,.t| i.-. .; ,|> ï] |.'f
r .v'... ••-• >\JäL^v?
Photo 45. Var iel al trials at different stages o I'growth. A hove: at ripening stage. Below: at maturity.
287
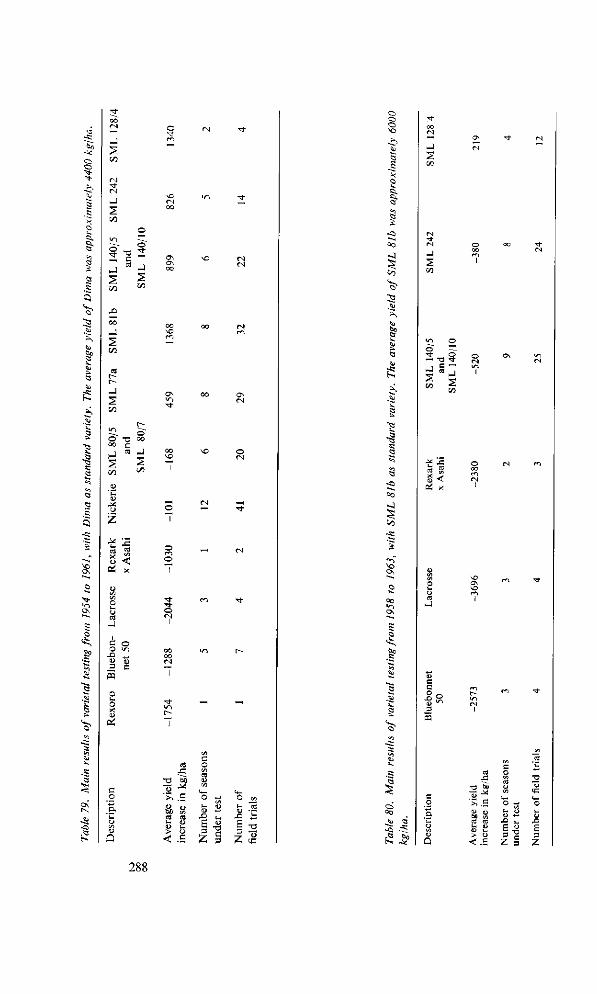
<3
~5 -it: o f • »
<N
J S CO
<N
O
2 5
° 2
co ^
HJ
-s: h »s
. ^ J
5v <3
> "« u. 1 3
s: a
-J S co
»/-> 0 00
J 5 co
« -J
pq
m -*t
•/-i r -
x;
< .s
•o £:
i -o
I -o 00
5
00
I -s:
00 •o
Je
-i; •Si S
o>
0 X 1> 3
5
•* _ o — TJ f
1 c " >-J es ,
05 «
-Si
tS $
T3 [« '>> 0 M
rt
bfi
- .5 0 en C3 X u
<.S Z
288
13.6 Varietal testing
The testing of promising lines in varietal trials was begun as soon as these lines had reached sufficient uniformity (e.g., table 76, p. 277). A plot size of 20 to 40 instead of 50 to 70 m2 was often adopted through shortage of seed. The design was invariably a random block experiment, usually with four replicates and with one or two standard varieties. The seed rate in 1954 was only 60 kg/ha but afterwards it was increased to between 100 and 110 kg/ha for a 1000-grain weight of 30 g and a germination capacity of' at least 95 % (see chapter 5).
From the second test outstanding lines were generally included also in varietal trials scattered about the Wageningen Polder. If prospects remained good, they were also included in seed rate and nitrogen level experiments. Diverse growth conditions were chosen (see also DORST, 1958) to seek out quickly the strong and the weak points of promising varieties. The field experiments were under normal cultural operations except that seed was not disinfected and plots were not drained during vegetative growth (see 6.5.2). Grain quality, and culinary and taste properties of the white rice were tested as described in chapters 11 and 12.
The provisional results govern the decision whether to release a new variety. The area on which the new variety is to be grown is fixed according to the results of continued investigation and practical experience. The apportionment of commercial varieties over the area is such that the favourable features of each variety are utilized to best advantage. The average yield of each variety does not therefore give a precise comparison of yield between varieties.
Tables 79 and 80 summarize the yield of principal varieties tested in the Prince Bernhard Polder. Varieties from the Van Dijk stock yielded substantially more than United States varieties such as Rexoro and Bluebonnet 50. Later varieties (SML 81b, SML 140/5, SML 140/10, SML 242 and SML 128/4) raised the yield still further. With the recent release of SML 352 we believe a period has begun of improvement in such characteristics as tolerance to adverse soil conditions, rapid early growth and a shorter growth duration. Of the varieties released from 1958 till 1963 table 81 summarizes a number of important characteristics. More particulars about these varieties are to be found in previous chapters.
13.7 Maintenance of varieties and production of seed rice
When a promising line was found which was eligible for a first inclusion in a varietal trial, the following measures were taken. 1. Outstanding plants were chosen for continued line selection. 2. Seed was saved from a uniform group of superior plants for producing breeder's
seed. 3. Through positive mass selection seed was obtained for a varietal trial.
If the line proved insufficiently uniform, the second measure was delayed till the next
289
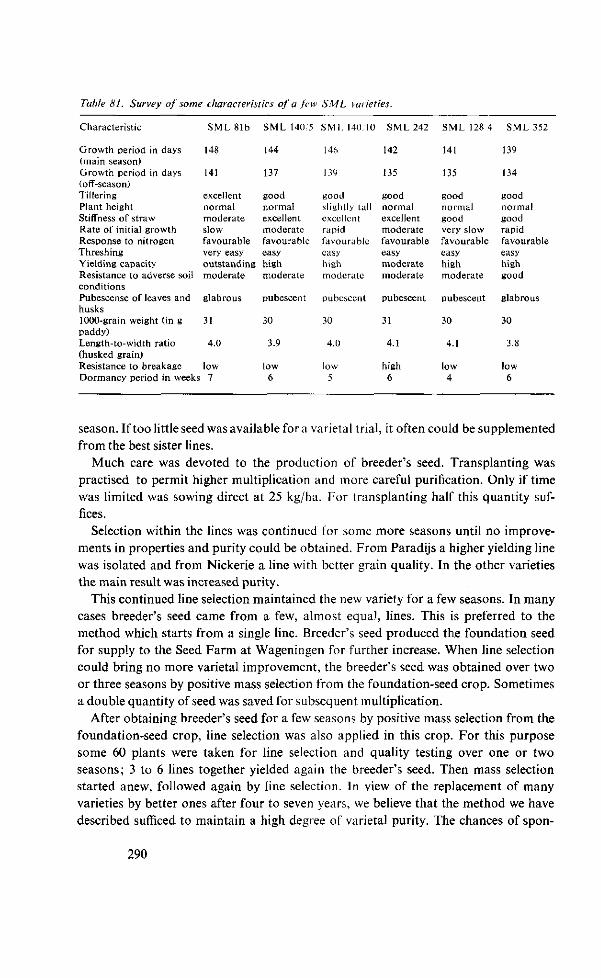
Table 81. Survey of some characteristics of a few SML varieties.
Characteristic
Growth period in days (main season) Growth period in days (off-season) Tillering Plant height Stiffness of straw Rate of initial growth Response to nitrogen Threshing Yielding capacity Resistance to adverse soil conditions Pubescense of leaves and husks 1000-grain weight (in g paddy) Length-to-width ratio (husked grain) Resistance to breakage
SML 81b
148
141
excellent normal moderate slow favourable very easy outstanding moderate
glabrous
31
4.0
low Dormancy period in weeks 7
SML 140 5
144
137
good normal excellent moderate favourable easy high moderate
pubescent
30
3.9
low 6
SMI . 140.10
146
139
good slightly tall excellent rapid favourable easy high moderate
pubescent
30
4.0
low 5
SML 242
142
135
good normal excellent moderate favourable easy moderate moderate
pubescent
31
4.1
high 6
SML 128 4
141
135
good normal good very slow favourable easy high moderate
pubescent
30
4.1
low 4
SML 352
139
134
good normal good rapid favourable easy high good
glabrous
30
3.8
low 6
season. If too little seed was available for a varietal trial, it often could be supplemented from the best sister lines.
Much care was devoted to the production of breeder's seed. Transplanting was practised to permit higher multiplication and more careful purification. Only if time was limited was sowing direct at 25 kg/ha. For transplanting half this quantity suffices.
Selection within the lines was continued for some more seasons until no improvements in properties and purity could be obtained. From Paradijs a higher yielding line was isolated and from Nickerie a line with better grain quality. In the other varieties the main result was increased purity.
This continued line selection maintained the new variety for a few seasons. In many cases breeder's seed came from a few, almost equal, lines. This is preferred to the method which starts from a single line. Breeder's seed produced the foundation seed for supply to the Seed Farm at Wageningen for further increase. When line selection could bring no more varietal improvement, the breeder's seed was obtained over two or three seasons by positive mass selection from the foundation-seed crop. Sometimes a double quantity of seed was saved for subsequent multiplication.
After obtaining breeder's seed for a few seasons by positive mass selection from the foundation-seed crop, line selection was also applied in this crop. For this purpose some 60 plants were taken for line selection and quality testing over one or two seasons; 3 to 6 lines together yielded again the breeder's seed. Then mass selection started anew, followed again by line selection. In view of the replacement of many varieties by better ones after four to seven years, we believe that the method we have described sufficed to maintain a high degree of varietal purity. The chances of spon-
290
taneous crossing were reduced by avoiding border plants for line and mass selection and by eliminating borders, 1 to 2 m wide, in harvesting foundation seed. For natural cross-fertilization in Surinam there are no figures; in breeding and maintaining varieties it caused little inconvenience.
The production of foundation seed was under the direct supervision of the breeder. Formerly this seed was produced by transplanting (one plant per hill), but later it was directly sown (40 to 50 kg/ha), as far as possible on fallowed fields. A severe purification took place regularly with special regard to uniform flowering and ripening. The crop was harvested manually and threshed with a field-trial thresher.
Every year about 1000 kg foundation seed of each variety was supplied to the Seed Farm at Wageningen. There it was usually multiplied twice (into registered and first grown certified seed, respectively) before it was released for a commercial crop. These seed plots were carefully chosen to minimize trouble from volunteer and red rice.
The Wageningen Project produces seed for its own need, for the Prince Bernhard Polder, and, to a certain extent, for the Government. The Government supply, for cultivation by smallholders, began in 1959 and has since increased (in 1963 and 1964, 109 and 230 tonnes). The smallholders' area under SML varieties had a similar trend. In 1961 and 1966 about 15 and 40% of their rice area in Nickerie was planted or sown with SML varieties.
Several small lots of seed were exported to other countries, where a few SML varieties have been well received. Thus HOLSHEIMER (1965) records that the prospects for some SML varieties in the British Solomon Islands are favourable. A striking success were the results with SML 81b and SML 140/5 in some Central American countries. According to VAN DER SPEK (1965), almost all the large mechanized farms in Panama, Costa Rica, Nicaragua and El Salvador have replaced United States varieties by SML 81b and SML 140/5, because of their greater resistance to Piricularia oryzae and hoja blanca and of their higher yields. In 1965 over 15 % of the total rice area in those countries was under the SML varieties.
Figure 63 depicts the changes in the varietal pattern in the Wageningen Polder through the years. During the first few years Dima ranked first but in recent years more than half the area has been occupied by SML 81b. The rapid extension of the area under SML 80/5 and SML 80/7 has been due to their special suitability for newly reclaimed land but their low tolerance to adverse soil conditions and increasing susceptibility to fungi has made early replacement necessary. Neither are SML 140/5, SML 140/10 and SML 128/4 sown any more today through increased damage by fungi. These facts stress the necessity of rapid development of new varieties and of more effective breeding for resistance to fungus diseases.
291
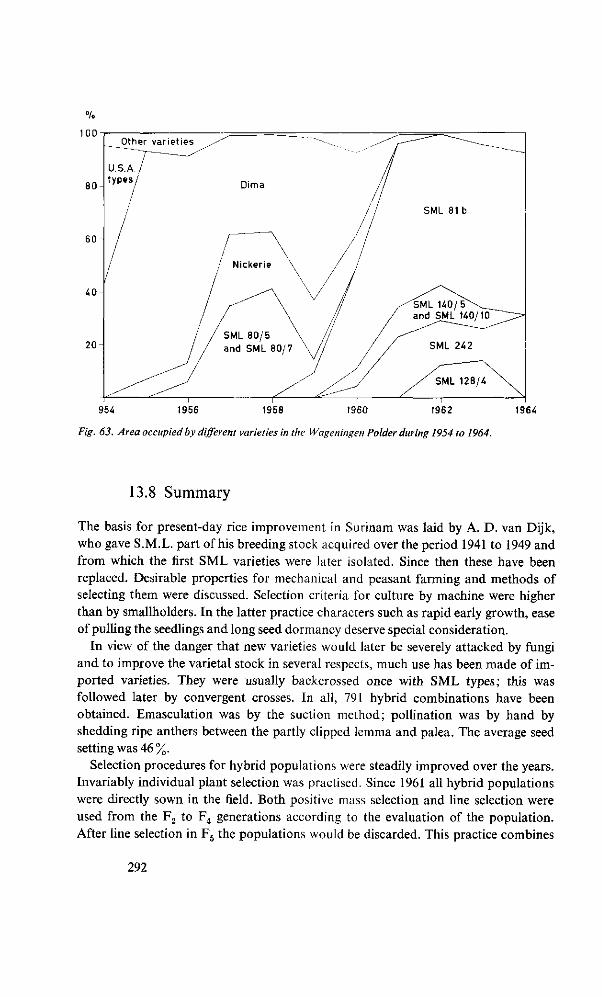
954 1956 1958 1960 1962 1964
Fig. 63. Area occupied by different varieties in the Wageningen Polder during 1954 to 1964.
13.8 Summary
The basis for present-day rice improvement in Surinam was laid by A. D. van Dijk, who gave S.M.L. part of his breeding stock acquired over the period 1941 to 1949 and from which the first SML varieties were later isolated. Since then these have been replaced. Desirable properties for mechanical and peasant farming and methods of selecting them were discussed. Selection criteria for culture by machine were higher than by smallholders. In the latter practice characters such as rapid early growth, ease of pulling the seedlings and long seed dormancy deserve special consideration.
In view of the danger that new varieties would later be severely attacked by fungi and to improve the varietal stock in several respects, much use has been made of imported varieties. They were usually backcrossed once with SML types; this was followed later by convergent crosses. In all, 791 hybrid combinations have been obtained. Emasculation was by the suction method; pollination was by hand by shedding ripe anthers between the partly clipped lemma and palea. The average seed setting was 46 %.
Selection procedures for hybrid populations were steadily improved over the years. Invariably individual plant selection was practised. Since 1961 all hybrid populations were directly sown in the field. Both positive mass selection and line selection were used from the F2 to F4 generations according to the evaluation of the population. After line selection in F5 the populations would be discarded. This practice combines
292
the advantages of mass and line selection and meets the objections to both these methods. Similar breeding systems were described by VETTEL (1957) for the improvement of wheat, oats and barley. They are very flexible in practice and many hybrid populations can be dealt with rapidly and responsibly. Another way to develop new varieties rapidly was the use of promising lines from early generations for crosses. The varieties developed by the writer were first grown for commercial production between the F7 and F10 generations.
In general, transplanting was preferred for selection work in lines. From 1961 to 1963 about 23 % of the lines was broadcast on mud (plot size 5 m2). The reserve seed stock of hybrid populations and lines was stored for a few seasons and used for additional breeding purposes if the material proved promising. This practice was of much value and easy to manage.
The production of foundation seed was under the direct supervision of the breeder. Seed was delivered at regular intervals to the Seed Farm at Wageningen. The Wageningen Project further multiplied this seed and also increasingly supplied Surinam with seed rice. Exports have so far been limited but are expected to increase. Noteworthy is the rapid expansion of some S ML varieties in various South and Central American countries, so that in 1965 the area under SML varieties outside Surinam was many times larger than the Wageningen Polder.
293
References
ANONYMOUS
ANONYMOUS
ANONYMOUS
ANONYMOUS
ANONYMOUS
ANONYMOUS
ABICHANDANI, C. T.
and S. PATNAIK
ACQUAYE, D. K.
and R. K. CUNNINGHAM
ADAIR, C. R.
and K. ENGLER
ADAIR, C. R. et al.
ADAMS, J. E.
and R. J. HANKS
AGLIBUT, A. P. et al.
AHMAD, N.
AMSON, F. W. VAN
en O. E. HASSELBACH
ARBOLEDA, J. R. et al.
1955
1956
1958
1960
1963
1964
1958
1965
1955
1966
1964
1962/63
1963
1966
1964/65
ARMY, T. J. et al.
ATKINS, J. G. et al.
ATKINS, J. G.
and N. E. JODON
1961
1957
1963
L'hybridation artificielle du riz. Bull. d'Inform. Inéac, 4, no. 1:47-48. Rice and its manuring. International Potash Institute, Berne; 58 pp. Etude sur la translucidité du riz à Madagascar. Riz et Riziculture, 4, no. 1: 10-17. High moisture rice proves high profits in California. Rice J., 63, no. 4: 8-10. International Rice Research Institute, Philippines. Annual Report 1963: 40. Studiesof lodging.In: Annual Report 1964,The International Rice Research Institute, Philippines: 37-48. Nitrogen changes and fertilizer losses in lowland waterlogged soils. J. Indian Soc. Soil Sei., 6: 87-93. Losses of nitrogen by ammonia volatilization from surface-fertilized tropical forest soils. Trop. Agric., Trin.,42: 281-292. The irrigation and culture of rice. In: Water. U.S.D.A. Yearbook of Agric. : 389-394.
Rice breeding and testing methods in the United States. In: Rice in the United States: varieties and production. U.S.D.A. Agriculture Handbook no. 289: 19-64. Evaporation from soil shrinkage cracks. Proc. Soil Sei. Soc. Amer., 28: 281-284. Influence of pre-heading and post-heading drainage upon tillering, growth, maturity, yield, and other characteristics of Milfor 6-2 and Peta. Philipp. Agricst., 46: 215-234. The effect of evolution of gases and reducing conditions in a submerged soil on its subsequent physical status. Trop. Agric, Trin., 40: 205-209.
Een moldrainage onderzoek op oud rijstland. Surinaamse Landb.,14: 12-24. Effect of drying air temperature and storage on the viability, milling recovery and nutrient contents of Peta rice variety. Philipp. Agricst., 48: 128-143. Effect of tillage and chemical weed control practices on soil moisture losses during the fallow period. Proc. Soil Sei. Soc. Amer., 25:410-413. Testing and breeding American rice varieties for resistance to straighthead. IRC Newsletter, 6, no. 2 : 12-15. Aspects of breeding rice for resistance to diseases, particularly blast (Piricularia oryzae). In: Symposium on rice problems. IRC Newsletter, Special Issue: 41-52.
294
AUTREY, H. S. et al.
BABA, I.
BABA, I.
and T. H A R A D A
BABA, I.
BABA, I. et al.
1955
1954
1954
1961
1965
BAINER, R.
BATCHER, O. M. et al.
BEACHELL, H. M.
and J. V. HALICK
BEACHELL, H. M.
and J. V. HALICK
BEACHELL, H. M.
and J. W. STANSEL
BEACHER, R. L.
BEACHER, R. L.
and J. P. WELLS
BEERS, W. F. J. VAN
1932
1956
1957a
1957b
1963
1952
1960
1961
BEERS, W . F. J. V A N 1962
B E K E N D A M , J. 1961
BELDEROK, B. 1961
BELDEROK, B. 1963
BELDEROK, B. 1964
Effects of milling conditions on breakage of rice grains.
J. Agric. and Food Chem., 3: 593-599.
Breeding of rice variety suitable for heavy manuring. In:
Studies on rice breeding: 167-184. (A sep. volume of Jap. J. Breed., 4.)
Physiologic;! 1 diseases of rice plant in Japan. In: Studies on rice breeding: 101-150. (A sep. volume of Jap. J. Breed., 4.) Mechanism of response to heavy manuring in rice varieties.
IRC Newsletter, 10, no. 4: 9-16.
Mineral nutrition and the occurrence of physiological diseases. In: The mineral nutrition of the rice plant: 173-195.
Proc. Symposium IRRI, 1964. The Johns Hopkins Press,
Baltimore, Maryland. Harvesting and drying rough rice in California. Univ. of
California Coll. of Agr., Agr. Exp. Stat., Bull. 541 ; 29 pp.
Development and application of methods for evaluating
cooking and eating quality of rice. RiceJ., 59, no. 13:4-8, 32.
Breeding for improved milling, processing and cooking
characteristics of rice. IRC Newsletter, 6, no. 2: 1-7. Processing and cooking qualities of rice and methods for their determination. Presented sixth Meeting Working Party
on Rice Breeding, IRC, FAO, Vercelli, Italy; 9 pp.
Selecting rice for specific cooking characteristics in a breeding program. In: Symposium on rice problems. IRC Newsletter,
Special Issue: 25-40. Rice fertilization. Results of tests from 1946 through 1951.
Agr. Exp. Stat., Univ. of Arkansas Coll. of Agric., Bull. 522; 31 pp. Rice fertilizer studies, 1952 to 1958. Agr. Exp. Stat., Univ.
of Arkansas Div. of Agric, Bull. 620; 37 pp. Een oriënterend onderzoek naar de oorzaken en de middelen ter voorkoming van schimmelaantastingen bij rijst in het
„Wageningen-project", Suriname. Voorlopig verslag, mei 1961. Stencilled report; 18 pp. Internationaal instituut voor
landaanwinning en cultuurtechniek, Wageningen, Nederland.
Een oriënterend onderzoek naar de oorzaken en de middelen
ter voorkoming van schimmelaantastingen bij rijst in het „Wageningen-project", Suriname (Juli 1961). Aanvulling 1 ; 16 pp. Stencilled report S.M.L., Surinam. Inductie van mutaties bij rijst door röntgenbestraling.
Meded. Landbouwhogeschool, Wageningen, Nederland, 61
( l ) ; 6 8 p p . Studies on dormancy in wheat. Proc. Int. Seed Testing Ass., 26, no. 4: 697-760. Verslag van het in 1963 verrichte onderzoek aangaande
kiemrust en schot. In: Tienjarenplan voor Graanonderzoek van het Ned. Graan-Centrum, Verslag over het tiende jaar: 87-99.
Invloed van het weer vóór de oogst op kiemrust en neiging tot schieten bij tarwe. TNO Nieuws, 19, no. 221: 419^425.
295
BELDEROK, B.
BEST, R.
BOEREMA, E . B .
BOEREMA, E . B .
BOEREMA, E . B .
and D . J. MCDONALD
BOLHUIS, G. G.
und J. W. VAN DIJK
BOLLICH, C. N.
and R. J. MIEARS
BOLLICH, C. N .
BOLLICH, C. N.
BOONACKER, J.
en A. W. DROST
BORLAUG, N. E.
1955
1961
1962;
19621
1907
1959
Bouw, T.
BOYNTON, D .
BRANDES, G. A.
BREESE, M. H.
BREWBAKER, J. L.
BREWBAKER, J. L.
and S. K. MAJUMDER
1954
1962
1955
1959
1959
BROADBENT, F. E. et al.
1965 Einflusz der Witterung vor der Ernte auf die Keimruhedauer und die Auswuchsneigung des Weizens. Zeitschr. für Acker- und Pflhuu, 122: 297-313.
1961 Some aspects of photoperiodism in rice (Oryza sativa L.). Dissertatie Wageningen; 87 pp. Elsevier publishing company, Amsterdam, The Netherlands.
1964a Control of barnyard grass in rice in the Murrumbidgee Irrigation Area using 3,4 - dichloropropionanilide. FAO, IRC. Joint Meeting of the Working Parties, Manila, Philippines; 10 pp.
1964b Nutritional studies. In: Annual Report 1963-1964 of the Rice Section at Yanco Agr. Res. Stat., Yanco, N.S.W., Australia. Stencilled report: 8-15.
1964 The influence of time of drainage on quality and yield of rice in New South Wales. FAO, IRC. Ninth Meeting, Manila, Philippines; 4 pp. Reis Anbau und Düngung in Ostasien. Ruhr-Stickstoff, Bochum; 69 pp. Light intensity - nitrogen fertility experiment. In: 53rd Annual Progress Report Rice Exp. Stat., Crowley, Louisiana : 30-48. Uniform light intensity - nitrogen fertility experiment. In : 54th Annual Progress Report Rice Exp. Stat., Crowley, Louisiana: 25-36. Rate of seeding - nitrogen fertility experiment. In: 54th Annual Progress Report Rice Exp. Stat., Crowley, Louisiana: 37-47. Rijstcultuur. Inspectie van den Landbouw in West-Indië, Bull. no. 8; 35 pp. The use of multilineal or composite varieties to control airborne epidemic diseases of self-pollinated crop plants. Proc. First Internat. Wheat Gen. Symp.: 12-27. Held at Univ. of Manitoba, Canada, 1958.
1965 Drying, storage and processing of rice in the Wageningen mill. In: Proc. Congress Agric. Res. in the Guianas, Paramaribo, 1963. Landbouwproefst. Suriname, Bull. 82: 303-333. Nutrition by foliar application. Annu. Rev. PL Physiol., 5: 31-54. Stam F-34 proved successful for grass and weed control in rice. Rice J., 65, no. 1: 8, 10, 12, 37-39. Hysteresis in the hygroscopic equilibria of rough rice at 25 °C. Cereal Chemistry, 32: 481^487. Biology of the angiosperm pollen grain. Indian J. Gen. Plant Breed., 19: 121-133.
Incompatibility and the pollen grain. In: Recent advances in botany; IX Internat. Bot. Congress, Montreal, vol. 2: 1503-1508.
1958 Transformations and movement of urea in soils. Proc. Soil Sei. Soc. Amer., 22: 303-307.
296
BPOESHART, H. et al.
BUCHNER, A .
und J. KRADEL
BUENAVENTURA, M. R.
CARPENTER, A. J.
and E. H. ROBERTS
CARPENTER, A. J.
CARTER, L. C.
CHANDRARATNA, M. F. et al.
CHANDRARATNA, M. F.
CHAO, T.
and W. KROONTJE
CHAPMAN, A. L.
and M. L. PETERSON
1961/62
1955/56
1962
1963
1944
1952 1964
1964
1962
CHATEAU, R.
CHAUDHRY, M. S.
and E. O. MCLEAN
CHEANEY, R. L.
CHEANEY, R. L.
and R. H. WYCHE
CORNET, M.
CORNET, M.
CORNET, M.
COYAUD, Y .
CRAUFURD, R. Q.
1955
1964
1965a
1965b
1950 1962
CUAUFURD, R . Q .
CRUZ, T. C.
and S. N. TILO
DASANANDA, S.
1965 The c fleet of water conditions and oxidation-reduction status ol' riee soils on the availability of soil and fertilizer phosphate. Plain and Soil, 23: 305-313. Die Anwendung von Harnstoff als Düngemittel. Zeit sehr. für Acker- und Pflbau, 114: 1-22. Dormancy periods of promising rice varieties. Philipp.
Agricsl., 39: 558-570. Some useful techniques in speeding up rice-breeding programmes. Einp. J. Exper. Agric., 30: 127-131. Objectives and methods in rice breeding and selection in Sierra Leone. L'Agronomie tropicale, 18, no. 8: 783-785. Rice fertilizers for increased production. Rice J., 47, no. 3; 5 pp. Seed dormancy in rice. Trop. Agriculturist, 108: 261-264. Genetics and breeding of rice. Longmans, Green and Co. Ltd., London; 389 pp. Relationships between ammonia volatilization, ammonia concentration and water evaporation. Proc. Soil Sei. Soc. Amer., 28: 393-395. The seedling establishment of rice under water in relation to temperature and dissolved oxygen. Crop Science, 2: 391-395.
1959 Recherche sur l'influence de l'époque d'application du 2, 4-D sur différentes variétés de riz à Richard-Toll (Sénégal). Ri: et Riziculture, 5, no. 2/3: 117-119.
1963 Comparative effects of flooded and unflooded soil conditions and nitrogen application on growth and nutrient uptake by rice plants. Agron. J., 55: 565-567.
1955 Effect of time of draining of rice on the prevention of straighthead. Texas Agr. Exp. Stat. - Texas A and M College system, Progress report 1774; 5 pp. Effect of fertilization on the milling quality of rice. Texas Agr. Exp. Stat. - Texas A and M College system, Progress report 1748; 4 pp. Le rendement à l'usinage du riz. Bull. d'Inform. Rizicult. de France, no. 93: 9-21. Les essais variétés, campagne 1964. Bull. d'Inform. Rizicult. de France, no. 100:27-36. Les essais variétés, campagne 1964. Bull. d'Inform. Rizicult. de France, no. 101: 21-30. Le riz. Archives de l'Office Indochinois du Riz, no. 30; 308 pp. Moisture changes in raw and parboiled paddy in West Africa and their influence upon milling quality. I. Moisture changes in the ripening crop. Emp. J. Exper. Agric., 30: 315 320.
1963 Sorption and desorption in raw and parboiled paddy. J. Sei. Food Agr ie., 14: 744-750.
1956/57 The response to fertilization of lowland rice planted at différent spacings. Philipp. Agricst., 40: 51-56.
1960a Method of reducing the number of varieties in Thailand. IRC Newsletter, 9, no. 1: 7-11.
297
DASANANDA, S.
DASANANDA, S.
DATTA, N. R.
and N. P. DATTA
DAVIS, L. L.
DEMIRLICAKMAK, A. et al.
DESAI, A. D . et al.
DESIKACHAR, H. S. R.
a nd V. SUBRAHMANYAN
DESIKACHAR, H. S. R.
and V. SUBRAHMANYAN
DlNTHER, J. B . M . VAN
DlNTHER, J. VAN
DlNTHER, J. B . M . VAN
1960b 1963
1963
1950
1963
1957
1959
1960
1956
1960
1961
DlNTHER, J. B . M . VAN
and R. W. STUBBS
1965
DlRVEN, J. G . P .
en A. G. SMIT
DlRVEN, J. G . P .
and H. JONGE POERINK
DlRVEN, J. G . P .
en V. K. R. EHRENCRON
DORE, J.
DORE, J.
and P. V. THEVAN
DORE, J.
DORST, J. C.
DUFOURNET, R.
et RAKOTOMANANA
EBATA, M.
and K. NAGATO
EBATA, M.
1953
1955
1964
1955
1959
1960
1958
1958
1960
1961
Rice in Thailand. IRC Newsletter, 9, no. 4: 23-29. Breeding for adaptability to greater range of ecological condition. In: Symposium on rice problems. IRC Newsletter, Special Issue: 17 23. Responses to phosphate in rice and wheat in different soils. J. Indian Sac. Soil Sei., 11: 117-128. California rice production. Cal. Agr. Ext. Service. Coll. of Agric, Univ. of California, Circ. 163; 55 pp. The influence of seed size and seeding rate on yield and yieldcomponentsof barley. Canad. J. Plant Sei., 43: 330-337. Drainage for rice fields. Sulphide toxicity. J. Indian Soc. Soil Sei., 5: 155 161.
Expansion of new and old rice during cooking. Cereal Chemistry, 36: 385-391. The relative effects of enzymatic and physical changes during storage on the culinary properties of rice. Cereal Chemistry, 37: 1-8. Control of Pomacea (Ampullaria) snails in rice fields. Landbouwproefst. Suriname, Bull. 68; 20 pp. Bestrijding van rijstboorders in Suriname. Meded. Landb-Hogesch., Gent, 25: 1531-1541. The effect of precipitation on the break of diapause in the white rice borer Rupela albinella (Cr.) in Surinam (South America). Meded. Lab. voor Entom., Wageningen, no. 66; 6 pp. Summary of research on the control of rice snails in Surinam. In: Proc. Congress Agric. Res. in the Guianas, Paramaribo, 1963. Landbouwproefst. Suriname, Bull. 82: 415-420. Onkruiden in rijstvelden. Surinaamse Landb., 1: 14-19.
Weeds in rice and their control in Suriname. Trop. Agric, Trin., 32: 115-123. Sporenelementen in weidegronden. Surinaamse Landb., 12: 11-21. Dormancy and viability of padi seed. Malay. Agric. J., 38: 163-173. Studies on seed germination and seedling growth in rice (Oryza sativa L.). Trop. Agric, Trin., 36: 15-34. The relation of flowering and maturation period in some Malayan rices to sowing date and latitude. Malay. Agric. J., 43: 28-48. Use of variation or replications in breeding work. Euphytica, 7:111-118. Essais de cuisson de riz à la station agronomique du lac Alaotra (Madagascar). Riz et Riziculture, 4, no. 1: 18-33. Studies on white-core rice kernel. III. Relations between white-core occurrence and development of starch tissue in rice kernel. Proc. Crop Sei. Soc Japan, 29, no. 1: 93-96. Studies on white-core rice kernel. IV. Effects of night temperature in ripening time upon the occurrence and types of white-core kernels. Proc. Crop Sei. Soc. Japan, 29, no. 4: 409-411.
298
El FERSON, J. N .
ERNST, J. W.
and H. F. MASSEY
EVANS, H.
EVATT, N. S.
EVATT, N. S. et al.
FAULKNER, M. D.
and F. T. WRATTEN
FORTANIER, E. J.
1964
1960
1962
1958
1960
1964
1962
FOTH, H. D . et al. 1964
Fox, W. E. 1964
FUENTE, R. K. DE LA et al. 1956/57
GrASSER, J. K. R. 1962
GHOSH, B. N.
GHOSH, B. N.
GHOSH, B. N.
GIGLIOLI, E. G.
GLANDER, H.
and A. v. PETER
GLYNNE, M. D.
and D. B. SLOPE
GOARIN, P.
Go BAN HONG
1954
1960
1962
1959
1962
1957
1960
1957
GREGG, B. R. et al. 1957
New developments in rice in Central America and Panama. Rice.I., 67. no. 8: 6-8, 10. The clïects of several factors on volatilization of ammonia formed from urea in the soil. Proc. Soil Sei. Soc. Amer., 24: 87 90.
Flood-fallowing - A consideration of its mechanism, its advantages and disadvantages. Sugar J., 25, no. 6: 27-30. Fertilizer-water depths tests on rice, 1956-57. Texas Agr. Exp. Stat. Texas A and M Coll. system, Progress report 2006;4 pp.
The response of short-strawed rice varieties to varying levels of nitrogen fertilization. IRC Newsletter, 9, no. 3 : 5-12. Rice drying and processing. In: 56th Annual Progress Report Rice Exp. Stat., Crowley, Louisiana: 18-72. Rapport inzake het onderzoek naar mogelijkheden van verbouw tweede gewassen en boomcultures voor het Wage-ningen-project, Suriname. Verdere mechanisatie en midden-stands-landbouw. S.M.L., Den Haag, Nederland; 187 pp. Effect of row spacing distance on oat performance. Agron. J., 56: 70-73.
Cracking characteristics and field capacity in a swelling soil. Soil Science (Baltimore), 98: 413. The effect of two herbicides on rice plants sprayed at different stages of growth. Philipp. Agricst., 40: 352-360. Investigations on rice growing in British Guiana. II. Field experiments to best effects of fertilizers, lime, and cultivations on yield, composition, and nutrient uptake. J. Soil Science, 13: 321-332.
Studies on the physiology of rice. VII. Effect of varying water levels on growth of rice in relation to nitrogen absorption. Proc. Nat. Inst. Sei. India, 20: 371-387. Studies on germination of spring (boro) and summer (aus) paddy to determine dormancy and viability. Indian J. Agric. Sei., 30: 129-134.
Agro-meteorological studies on rice. I. Influence of climatic factors on dormancy and viability of paddy seeds. Indian J. Agric. Sei., 32: 235-241. Mechanized rice production at the Mahaicony-Abary Scheme, British Guiana. Trop. Agric., Trin., 36: 2-14. Discoveries and experience of manuring rice. Green Bull. 6; Verlagsgesellschaft für Ackerbau, Hannover; 36 pp. The effect of seed rate and nitrogen on lodging and yield of spring barley (field experiments 1954 and 1955). J. Agric. Science, 49: 454-458.
Note sur le lessivage des herbicides par des pluies tropicales. L'Agronomie tropicale, 15, no. 4 : 450-454. Onderzoekingen over de minerale voeding van sawahrijst (Oryza saliva L.). (On the mineral nutrition of lowland rice, Oryza. saliva L.). Contrib. Gen. Agric. Res. Stat., Bogor, no. 150; 193 pp.
Influence of sun-checking on germination of rice seed. Proc. Ass. Southern Agric. Workers, 54: 66.
299
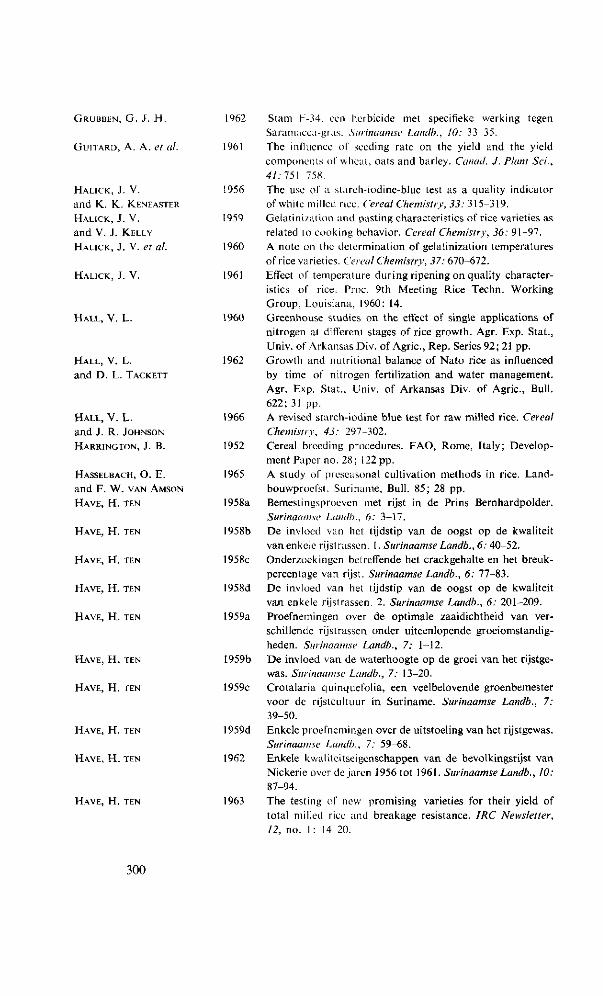
GRUBBEN, G . J . H.
GuiTARD, A. A. et al.
HALICK, J. V.
and K. K. KENEASTER
HALICK, J. V.
and V. J. KELLY
HALICK, J. V. et al.
HALICK, J. V.
1962
1961
1956
1959
1960
1961
HALL, V. L. 1960
HALL, V. L. 1962
and D. L. TACKETT
HALL, V. L. 1966
and J. R. JOHNSON
HARRINGTON, J. B. 1952
HASSELBACH, O. E. 1965
and F. W. VAN AMSON
HAVE, H. TEN 1958a
HAVE, H. TEN 1958b
HAVE, H. TEN 1958c
HAVE, H. TEN 1958d
HAVE, H . TEN 1959a
HAVE, H. TEN 1959b
HAVE, H. TEN 1959C
HAVE, H. TEN 1959d
HAVE, H. TEN 1962
HAVE, H. TEN 1963
Stam F-34, een herbicide met specifieke werking tegen Saramacca-gras. Surinaamse Landb., 10: 33-35. The influence of seeding rate on the yield and the yield components of wheal, oats and barley. Canad. J. Plant Sei., 41:151 758.
The use of a. starch-iodine-blue test as a quality indicator of white milled rice. Cereal Chemistry, 33: 315-319. Gelatinization and pasting characteristics of rice varieties as related to cooking behavior. Cereal Chemistry, 36: 91-97. A note on the determination of gelatinization temperatures of rice varieties. Cereal Chemistry, 37: 670-672. Effect of temperature during ripening on quality characteristics of rice. Proc. 9th Meeting Rice Techn. Working Group, Louisiana, I960: 14.
Greenhouse studies on the effect of single applications of nitrogen at different stages of rice growth. Agr. Exp. Stat., Univ. of Arkansas Div. of Agric, Rep. Series 92; 21 pp. Growth and nutritional balance of Nato rice as influenced by time of nitrogen fertilization and water management. Agr. Exp. Stat., Univ. of Arkansas Div. of Agric, Bull. 622; 31 pp.
A revised starch-iodine blue test for raw milled rice. Cereal Chemistry, 43: 297-302. Cereal breeding procedures. FAO, Rome, Italy; Development Paper no. 28 ; 122 pp. A study of preseasonal cultivation methods in rice. Land-bouwproefst. Suriname, Bull. 85; 28 pp. Bemestingsproeven met rijst in de Prins Bernhardpolder. Surinaamse Lanclb., 6: 3-17. De invloed van hel tijdstip van de oogst op de kwaliteit van enkele rijstrassen. 1. Surinaamse Landb., 6: 40-52. Onderzoekingen betreffende het crackgehalte en het breukpercentage van rijst. Surinaamse Landb., 6: 77-83. De invloed van het tijdstip van de oogst op de kwaliteit van enkele rijstrassen. 2. Surinaamse Landb., 6: 201-209. Proefnemingen over de optimale zaaidichtheid van verschillende rijstrassen onder uiteenlopende groeiomstandig-heden. Surinaamse Landb., 7: 1-12.
De invloed van de waterhoogte op de groei van het rijstge-was. Surinaamse Landb., 7: 13-20. Crotalaria quinquefolia, een veelbelovende groenbemester voor de rijstcultuur in Suriname. Surinaamse Landb., 7: 39-50. Enkele proefnemingen over de uitstoeling van het rijstgewas. Surinaamse Landb., 7: 59-68. Enkele kwaliteitseigenschappen van de bevolkingsrijst van Nickerie over de jaren 1956 tot 1961. Surinaamse Landb., 10: 87-94. The testing of new promising varieties for their yield of total milled rice and breakage resistance. LRC Newsletter, 12, no. 1 : 14 20.
300
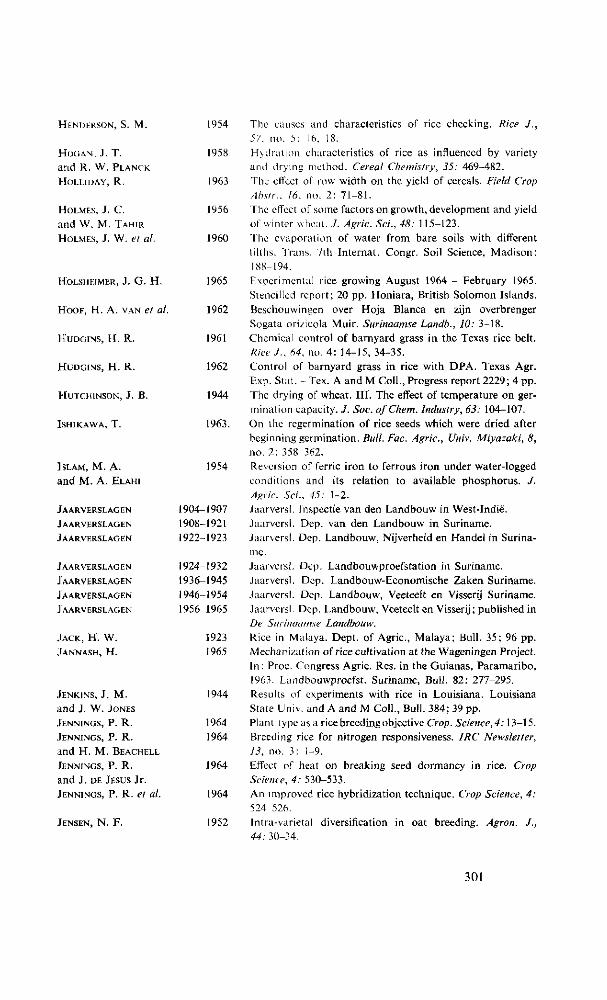
HENDERSON, S. M.
Hoc;AN, J. T. and R. W. PLANCK
H O L L I D AY, R .
HOLMES, J. C.
and W. M. TAHIR
HOLMES, J. W. et al.
HOLSHEIMER, J. G . H .
H O O F , H. A. VAN et al.
HUDGINS, H. R.
HUDGINS, H. R.
HUTCHINSON, J. B.
ISHIKAWA, T.
ISLAM, M. A.
and M. A. ELAHI
JAARVERSLAGEN
JAARVERSLAGEN
JAARVERSLAGEN
JAARVERSLAGEN
JAARVERSLAGEN
JAARVERSLAGEN
JAARVERSLAGEN
JACK, H. W.
JANNASH, H.
1904-1908-1922
1924-1936-1946-1956-
1954
1958
1963
1956
1960
1965
1962
1961
1962
1944
1963.
1954
-1907 -1921 -1923
-1932 -1945 -1954 -1965
1923 1965
JENKINS, J. M. 1944
and J. W. JONES
JENNINGS, P. R. 1964
JENNINGS, P. R. 1964
and H. M. BEACHELL
JENNINGS, P. R. 1964
and J. DE JESUS Jr.
JENNINGS, P. R. et al. 1964
JENSEN, N . F. 1952
The causes and characteristics of rice checking. Rice J., 57. no. 5: 16, 18. Hydration characteristics of rice as influenced by variety and drying method. Cereal Chemistry, 35: 469-482. The elfect of row width on the yield of cereals. Field Crop Ahsir.. 16, no. 2: 71-81.
The effect of some factors on growth, development and yield of winter wheat. / . Agric. Sei., 48: 115-123. The evaporation of water from bare soils with different tilths. Trans. 7th Internat. Congr. Soil Science, Madison: 188-194.
Experimental rice growing August 1964 - February 1965. Stencilled report; 20 pp. Honiara, British Solomon Islands. Beschouwingen over Hoja Bianca en zijn overbrenger Sogata orizicola Muir. Surinaamse Landb., 10: 3-18. Chemical control of barnyard grass in the Texas rice belt. Rice J., 64, no. 4: 14-15, 34-35.
Control of barnyard grass in rice with DPA. Texas Agr. Exp. Stat. - Tex. A and M Coll., Progress report 2229; 4 pp. The drying of wheat. III. The effect of temperature on germination capacity. J. Soc. ofChem. Industry, 63: 104-107. On the rcgermination of rice seeds which were dried after beginning germination. Bull. Fac. Agric, Univ. Miyazaki, 8, no. 2: 358-362.
Reversion of ferric iron to ferrous iron under water-logged conditions and its relation to available phosphorus. J. Agric. Sei., 45: 1-2.
Jaarversl. Inspectie van den Landbouw in West-Indië. Jaarversl. Dep. van den Landbouw in Suriname. Jaarversl. Dep. Landbouw, Nijverheid en Handel in Suriname.
Jaarversl. Dep. Landbouwproefstation in Suriname. Jaarversl. Dep. Landbouw-Economische Zaken Suriname. Jaarversl. Dep. Landbouw, Veeteelt en Visserij Suriname. Jaarversl. Dep. Landbouw, Veeteelt en Visserij; published in De Surinaamse Landbouw.
Rice in Malaya. Dept. of Agric, Malaya; Bull. 35; 96 pp. Mechanization of rice cultivation at the Wageningen Project. In: Proc. Congress Agric. Res. in the Guianas, Paramaribo, 1963. Landbouwproefst. Suriname, Bull. 82: 277-295. Results of experiments with rice in Louisiana. Louisiana State Univ. and A and M Coll., Bull. 384; 39 pp. Plant type as a rice breeding objective Crap. Science,4:13-15. Breeding rice for nitrogen responsiveness. IRC Newsletter, 13, no. 3: 1-9.
Effect of heat on breaking seed dormancy in rice. Crop Science, 4: 530-533. An improved rice hybridization technique. Crop Science, 4: 524 526. Intra-varietal diversification in oat breeding. Agron. J., 44: 30-34.
301
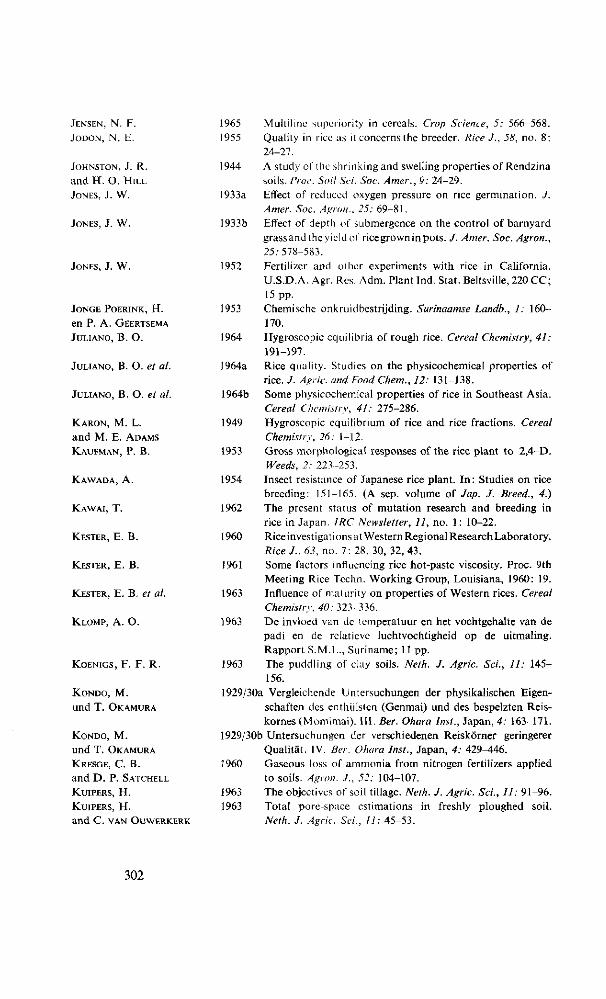
JENSEN, N. F.
JODON, N. E.
JOHNSTON, J. R.
and H. O. H ILL
JONES, J. W.
JONES, J. W.
JONES, J. W.
J O N G E P O E R I N K , H .
en P. A. GEERTSEMA
JULIANO, B. O.
JULIANO, B. O. et al.
JULIANO, B. O. et al.
KARON, M. L.
and M. E. ADAMS
KAUFMAN, P. B.
KAWADA, A.
KAWAI, T.
KESTER, E. B.
KESTER, E. B.
KESTER, E. B. et al.
KLOMP, A. O.
KOENIGS, F. F. R.
KONDO, M.
und T. OKAMURA
KONDO, M.
und T. OKAMURA
KRESGE, C. B.
and D. P. SATCHELL
KUIPERS, H.
KUIPERS, H.
and C. VAN OUWERKERK
1965 Multiline superiority in cereals. Crop Science, 5: 566-568. 1955 Quality in rice as it concerns the breeder. Rice J., 58, no. 8:
24-27. 1944 A study of the shrinking and swelling properties of Rendzina
soils. Proc. Soil Sei. Soc. Amer., 9: 24-29. 1933a Effect of reduced oxygen pressure on rice germination. / .
Amer. Soc. Agron.. 25: 69-81. 1933b Effect of depth of submergence on the control of barnyard
grassand the yield of ricegrown in pots. J. Amer. Soc. Agron., 25:578-583.
1952 Fertilizer and other experiments with rice in California. U.S.D.A. Agr. Res. Adm. Plant Ind. Stat. Beltsville, 220 CC; 15 pp.
1953 Chemische onkruidbestrijding. Surinaamse Landb., 1: 160-170.
1964 Hygroscopic equilibria of rough rice. Cereal Chemistry, 41: 191-197.
1964a Rice quality. Studies on the physicochemical properties of rice. J. Agric. and Food Chem., 12: 131-138.
1964b Some physicochemical properties of rice in Southeast Asia. Cereal Chemistry, 41: 275-286.
1949 Hygroscopic equilibrium of rice and rice fractions. Cereal Chemistry, 26: 1-12.
1953 Gross morphological responses of the rice plant to 2,4-D. Weeds, 2: 223-253.
1954 Insect resistance of Japanese rice plant. In : Studies on rice breeding: 151-165. (A sep. volume of Jap. J. Breed., 4.)
1962 The present status of mutation research and breeding in rice in Japan. IRC Newsletter, 11, no. 1: 10-22.
1960 Rice investigat i ons at Western Regional Research Laboratory. Rice J., 63, no. 7: 28, 30, 32, 43.
1961 Some factors influencing rice hot-paste viscosity. Proc. 9th Meeting Rice Tcchn. Working Group, Louisiana, 1960: 19.
1963 Influence of maturity on properties of Western rices. Cereal Chemistry, 40: 323 336.
1963 De invloed van de temperatuur en het vochtgehalte van de padi en de relatieve luchtvochtigheid op de uitmaling. Rapport S.M.L., Suriname; 11 pp.
1963 The puddling of clay soils. Neth. J. Agric. Sei., 11: 145-156.
1929/30a Vergleichende Untersuchungen der physikalischen Eigenschaften des enthülsten (Genmai) und des bespelzten Reiskornes (Momimai). III. Ber. Ohara Inst., Japan, 4: 163-171.
1929/30b Untersuchungen der verschiedenen Reiskörner geringerer Qualität. IV. Ber. Ohara Inst., Japan, 4: 429^146.
1960 Gaseous loss of ammonia from nitrogen fertilizers applied to soils. Agron. J., 52: 104-107.
1963 The objectives of soil tillage. Neth. J. Agric. Sei., 11: 91-96. 1963 Total pore-space estimations in freshly ploughed soil.
Neth. J. Agric. Sei., 11: 45-53.
302
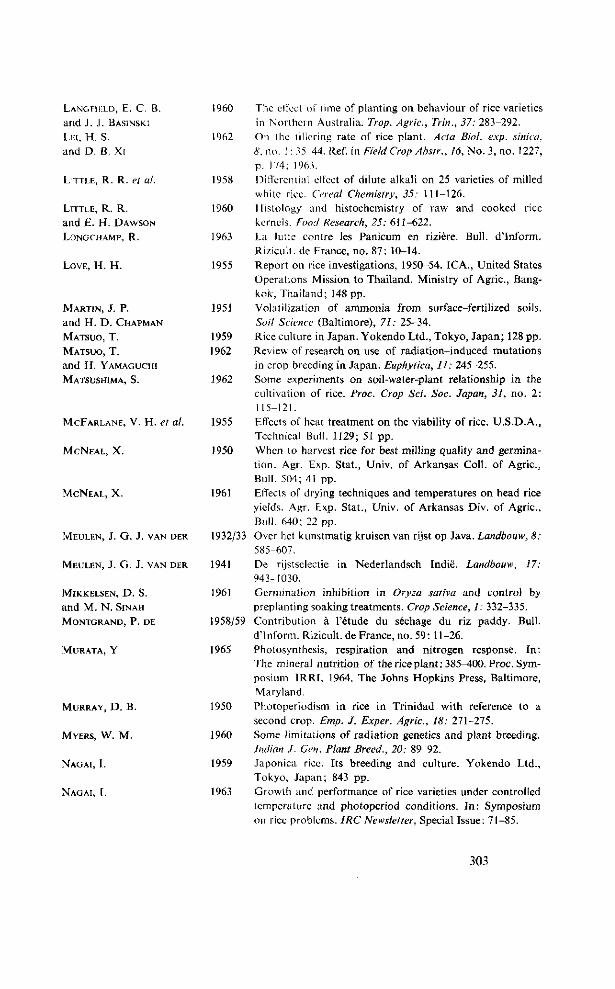
LANGFIKLD, E. C. B.
and J. J. BASINSM
Ut , H. S. and D. B. Xi
LTTLE, R. R. et al.
LITTLE, R. R.
and E. H. DAWSON
LONGCHAMP, R.
LOVE, H. H.
MARTIN, J. P.
and H. D . CHAPMAN
MATSUO, T.
MATSUO, T.
and H. YAMAGUCHI
MATSUSHIMA, S.
MCFARLANE, V. H. et al.
MCNEAL, X.
1960
1962
1958
1960
1963
1955
1951
1959 1962
1962
1955
1950
MCNEAL, X. 1961
MEULEN, J. G. J. VAN DER 1932/33
MEULEN, J. G. J. VAN DER 1941
MIKKELSEN, D. S. 1961
and M. N. SINAH
MONTGRAND, P. DE 1958/59
MURATA, Y 1965
MURRAY, D. B. 1950
MYERS, W. M. 1960
NAGAI, I. 1959
NAG AI, T. 1963
The ctïcct of time of planting on behaviour of rice varieties in Northern Australia. Trop. Agiic, Trin., 37: 283-292. On the tillering rate of rice plant. Acta Biol. exp. sinica, 8, no. 1 : 35 44. Ref. in Field Crop Ahstr., 16, No. 3, no. 1227, p . 174; 1963.
Differential effect of dilute alkali on 25 varieties of milled white rice. Cereal Chemistry, 35: 111-126. Histology and histochemistry of raw and cooked rice kernels. Food Research, 25: 611-622.
La lutte contre les Panicum en rizière. Bull. d'Inform. Rizicult. de France, no. 87: 10-14. Report on rice investigations, 1950-54. ICA., United States Operations Mission to Thailand. Ministry of Agric., Bangkok, Thailand; 148 pp. Volatilization of ammonia from surface-fertilized soils. Soil Science (Baltimore), 71: 25-34. Rice culture in Japan. Yokendo Ltd., Tokyo, Japan; 128 pp. Review of research on use of radiation-induced mutations in crop breeding in Japan. Euphytica, 11: 245-255. Some experiments on soil-water-plant relationship in the cultivation of rice. Proc. Crop Sei. Soc. Japan, 31, no. 2: 115-121.
Effects of heat treatment on the viability of rice. U.S.D.A., Technical Bull. 1129; 51 pp. When to harvest rice for best milling quality and germination. Agr. Exp. Stat., Univ. of Arkansas Coll. of Agric., Bull. 504; 41 pp. Effects of drying techniques and temperatures on head rice yields. Agr. Exp. Stat., Univ. of Arkansas Div. of Agric., Bull. 640; 22 pp. Over het kunstmatig kruisen van rijst op Java. Landbouw, 8: 585-607. De rijstsclectie in Nederlandsch Indië. Landbouw, 17: 943-1030. Germination inhibition in Oryza sativa and control by preplanting soaking treatments. Crop Science, 1: 332-335. Contribution à l'étude du séchage du riz paddy. Bull. d'Inform. Rizicult. de France, no. 59: 11-26. Photosynthesis, respiration and nitrogen response. In: The mineral nutrition of the rice plant: 385-400. Proc. Symposium IRRI, 1964, The Johns Hopkins Press, Baltimore, Maryland.
Photoperiodism in rice in Trinidad with reference to a second crop. Emp. J. Exper. Agric, 18: 271-275. Some limitations of radiation genetics and plant breeding. Indian ./. Gen. Plant Breed., 20: 89-92. Japonica rice. Its breeding and culture. Yokendo Ltd., Tokyo, Japan; 843 pp.
Growth and performance of rice varieties under controlled temperature and photoperiod conditions. In: Symposium on rice problems. IRC Newsletter, Special Issue: 71-85.
303
NAGAO, S. et al.
NAGATO, K.
and M. EBÂTA
NAGATO, K.
and M. EBATA
NAGATO, K. et al.
NAGATO, K.
NAGATO, K. et al.
NAGATO, K.
and M. EBATA
NAYAR, N. M.
NlLES, J. J .
NOJIMA, K.
OELKE, E. A.
OSTENDORF, F . W.
Ou, S. H. and F. NUQUE
Ou, S. H.
Ou, S. H. and K. G. GOH
OVERWATER, C .
PATHAK, M. D.
PATRICK Jr., W. H .
and M. B. STURGIS
PATRICK JR . , W. H.
and R. WYATT
PATRICK JR . , W. H . et al.
1962
1964
1965
1965
1951
1963
1966 1954
1963
1965
1966
1960
1964
1955
1964
1964
PELSHENKE, P. F.
und G. HAMPEL
1960 Gcnetical studies on ricc plant. XXV. Inheritance of three morphological characters, pubescence of leaves and floral glumes, and déformation of empty glumes. J. Facii/t. Agric, Hokkaido Univ., 51, no. 2: 299-314.
1959 Studies on white-core rice kernel. II. On the physical proper-tiesof the kernel. lJroc. Crop Sei. Soc. Japan, 28, no. 1 : 46-50.
1960 Effects of temperature in the ripening periods upon the development and qualities of lowland rice kernels. Proc. Crop Sri. Soc. Japan, 28, no. 3: 275-278.
1961 On the adaptability of rice varieties to high temperature in the ripening periods. Proc. Crop Sei. Soc. Japan, 29, no. 3 : 337-340. On the hardness of rice endosperm. Proc. Crop Sei. Soc. Japan, 31, no. I: 102-107. On the formation of cracks in rice kernels during wetting and drying of paddies. Proc. Crop Sei. Soc. Japan, 33, no. 1 : 82-89. Effects of high temperature during ripening period on the development and the quality of rice kernels. Proc. Crop Sei. Soc. Japan, 34, no. 1: 59-66. Radiation genetical research in rice - A review. IRC Newsletter, 14, no. 1 : 1-20. Hybridization methods with paddy. Trop. Agriculturist, 107: 25-29. Irrigation and drainage. In : Theory and practice of growing rice: 399-425. Edited by M. Matsubayashi et al. Ministry of Agric. and For. Tokyo, Japan. Water depth and rice yields. Rice J., 69, no. 7: 69-70. Ons klimaat. 3. Hoe warm het was, en wanneer. Surinaamse Landb., 2: 9-12.
The relation between leaf and neck resistance to the rice blast disease. IRC Newsletter, 12, no. 4: 30-35. Rice diseases of obscure nature in tropical Asia with special reference to „mentek" disease in Indonesia. IRC Newsletter, 14, no. 2: 4-10.
Further experiment on „penyakit merah" disease of rice in Malaysia. IRC Newsletter, 15, no. 2: 31-33. Tien jaren Prins Bernhard Polder 1950-1960. Surinaamse Landb., 8: 161-218. Varietal resistance as a method of rice stem borer control. IRC Newsletter, 13, no. 1: 15-21. Concentration and movement of oxygen as related to absorption of ammonium and nitrate nitrogen by rice. Proc. Soil Sei. Soc. Amer., 19: 59-62.
Soil nitrogen loss as a result of alternate submergence and drying. Proc. Soil Sei. Soc. Amer., 28: 647-653. Effect of draining and reflooding a field on the yield of rice. In: 56th Annual Progress Report Rice Exp. Stat., Crowley, Louisiana: 144-146.
1958 Untersuchungen an Importreis. Getreide und Mehl, 8, no. 3 : 17-22.
304
PELSHENKE, P. F.
and G. HAMPEL
PEERASOVITS, I.
PEILLIS, E.
PONNAMPERUMA, F. N.
PONNAMPERUMA, F. N.
PONS, L. J.
PONS, L. J.
PONS, L. J.
PONS, L. J.
ar.d L S . ZONNEVELD
POONAI, P .
RHIND, D .
ROBERTS, E. H.
ROBERTS, E. H.
ROBERTS, E. H.
ROSSEM, C . VAN
SAVANT, N. K.
atid R. ELLIS JR.
SCHMIDT, J. L.
and W. V. HUKILL
SCHMIDT, J. L.
and E .H . JEBE
1965
1960
1962
1961a
1961b
1962
1917
1964
1956
1959
SECKINGER, H. L. et al.
1960 New methoüs of evaluating cooking qualities of rice. Rice J.. 63, no. 9: 22. 24-29, 35.
1959 A rizs vizellâtottsâga és növekedése közötti néchâny összefüggés. (Some correlations between the supply of water and growth of rice plants). Agrokémia és Talajtan, 8, no. 3: 227 242.
1962 The germination and establishment of rice seed sown into water. Ausir. J. Exp. Agric. An. Husb., 2: 181-184.
1960 Lime as an amendment for the acid lateritic rice soils of Ceylon. Trop. Agriculturist, 116: 243-252.
1965 Dynamic aspects of flooded soils and the nutrition of the rice plant. In: The mineral nutrition, of the rice plant: 295-328. Proc. Symposium IRRT, 1964. The Johns Hopkins Press, Baltimore, Maryland.
1963 Interim rapport bodemkundig advieswerk voor de S.M.L. te Wageningen. Rapport S.M.L., Suriname; 14 pp.
1964 Verslag van de opmerkingen en discussies over cultuur-methoden en grondbewerking voor machinale rijstbouw. Stencilled report; 20 pp.
1965 Pyrites as a factor controlling Chemical „ripening" and formation of „cat clay", with special reference to the coastal plain of Surinam. In: Proc. Congress Agr. Res. in the Guianas, Paramaribo, 1963. Landbouwproefst. Suriname, Bull. 82: 141-162. Soil ripening and soil classification. International Institute for Land Reclamation and Improvement, Wageningen, The Netherlands, Publication 13; 128 pp. Why and how to control Jharanga or „dropseed" in rice fields. 77«' Rice Review, 2, no. 2: 13-15. The breakage of rice in milling: a review. Trop. Agric, Trin., 39: 19-28.
Dormancy of rice seed. I. The distribution of dormancy periods. ./. Exper. Bot., 12: 319-329. Dormancy in rice seed. II. The influence of covering structures. J. Exper. Bot., 12: 430-445.
Dormancy in rice seed. III. The influence of temperature, moisture, and gaseous environment. J. Exper. Bot., 13: 75-94. De hoeveelheden der voornaamste voedingsstoffen, die door een rijstoogst aan den grond onttrokken worden. Meded. Agr. Chem. Lab., Buitenzorg, no. 17: 1-17. Changes in redox potential and phosphorus availability in submerged soil. Soil Science (Baltimore), 98: 388-394. Effect of artificial drying on the yield of head rice and the germination of rice. Rice J., 59, no. 13: 28-31. The effect of artificial drying on the yield of head rice and the germination of rice. Transactions ASAE, 2, no. 1: 26- 29, 31.
1964 A micro method for determining moisture distribution in wheat kernels, based on iodine staining. Cereal Chemistry, 41: 80 87.
305
SHAPIRO, R. E.
SHAPIRO, R. E.
SIMS, J. L. et al.
SlREGAR, H.
SLUSHER, M. W.
and T. MULLINS
SMITH JR., R. J.
SMITH JR., R. J.
SMITH, W. D. et al.
S P E K , E. V. V A N D E R
SREENIVASAN, A.
STAHEL, G.
STAHEL, G.
STAHEL, G.
STAHEL, G.
STAHEL, G.
STAHEL, G.
STANSEL, J. W. et al.
STANSEL, J. W. et al.
STOY, V.
STOY, V.
1958a
1958b
1965
1951
1952
1958
1961
1938
1965
1939
1933a
1933b
1934
1935a
1935b
1936
1961
1965
1962
1963
Effect of flooding on availability of phosphorus and nitrogen. Soil Science (Baltimore), 85: 190-197. Effect of organic matter and flooding on availability of soil and synthetic phosphates. Soil Science (Baltimore), 85: 267-272.
Effect of rates and timing of nitrogen fertilization onperform-ance of rice varieties, 1957-1962. Agr. Exp. Stat., Univ. of Arkansas Div. of Agric, Report series 142; 45 pp. Variëteitenkeuze en lijnenselectie bij rijst. Landbouw, 23: 485-509.
Rice mill yield and grade in relation to variety and method of harvest. Agr. Exp. Stat., Univ. of Arkansas Coll. of Agric, Bull. 526; 36 pp.
The differential varietal response of rice to 2,4-D as influenced by the stage of growth and the rate of application. Rice J., 61, no. 10: 18-19, 26-27.
Progress in barnyardgrass control in rice in the United States since 1959. Meeting Working Party Rice Prod, and Prot., IRC, FAO, New Delhi; 5 pp.
Effect of date of harvest on yield and milling quality of rice. U.S.D.A., Washington, D.C., Circ. 484; 20 pp. Verslag van een dienstreis naar Midden-Amerika. Stencilled report S.M.L., Surinam; 39 pp.
Studies on quality in rice. IV. Storage changes in rice after harvest. Indian J. Agric. Sei., 9: 208-222. Het gedrag van enkele in Suriname gekweekte rijstsoorten bij het pellen. Landbouwproefst. Suriname, Serie overdruk, no. 1; 16 pp.
De rijstcultuur in Suriname. Landbouwproefst. Suriname, no. 2; 41 pp.
Verdere bijdragen tot de kennis van het gedrag bij het pellen van enkele in Suriname gekweekte rijstsoorten. Landbouwproefst. Suriname, Serie overdruk, no. 3; 18 pp. Bijdragen tot de kennis van het ontstaan van „suncracks" bij rijst. Landbouwproefst. Suriname, Serie overdruk, no. 4 ; 18 pp.
Breakage of rice in milling in relation to the condition of the paddy. Trop. Agric, Trin., 72:255-261. Breuk in rijst. Landbouwproefst. Suriname, Serie overdruk, no. 8; 26 pp.
Influence of temperature on heading dates and grain characteristics of rice. Proc. 9th Meeting Rice Techn. Working Group, Louisiana, 1960: 14—15.
The influence of light intensity and nitrogen fertility on rice yields components of yield. Rice J., 68, no. 4: 34-35, 49. Dry matter production as an objective in plant breeding. Eucarpia, 3rd Congress, Paris: 31-47. Some plant physiological aspects of the breeding of high yielding varieties. In: Recent plant breeding research, Svalöf 1946-1961; p. 264-275. Edited by E. Akerberg and A. Hagberg. Almqvist & Wiksell, Stockholm and John Wiley & Sons, New York, London.
306
SUNESON, C . A.
TAKAHASHI, J.
TA:<AHASHI, J.
TAKAHASHI, J.
TAKAHASHI, N.
TAKEDA, T.
and H. MARUTA
TANAKA, A. et al.
TANAKA, A.
TANAKA, A.
TANAKA, A.
TANAKA, A. et al.
TANAKA, I. et al.
T A N S I N H O U W
TAYLOR, D. L.
THOMPSON, J. H. et al.
TSUNODA, K.
and S. MATSUSHIMA
TSUNODA, S.
1960 Genetic diversity - A protection against plant diseases and insects. Anion../., 52: 319-321.
1960a Review of investigations on physiological diseases of rice. r. IRC Newsletter, 9, no. 1: 1-6.
1960b Review ot' investigations into physiological diseases of rice. II . IRC Newsletter, 9, no. 2 : 17-24.
1960c Potash and the cultivation of rice. Fertilité, no. 11 : 13-22. 1960 The pattern of water absorption in rice seed during the
germination. 1. The relationship between the pattern and the germination velocity. Proc. Crop Sei. Soc. Japan, 29, no. 1: 1-3.
1955 Studies on C0 2 exchange in crop plants. III. The effect of light intensity and spacing on the photosynthetic rate of rice-seedlings. Proc. Crop Sei. Soc. Japan, 24, no. 1: 34-40.
1964 Growth habit of the rice plant in the tropics and its effect on nitrogen response. Int. Rice Res. Inst., Philipp., Techn. Bull. 3; 80 pp.
1965a Examples of plant performance. In : The mineral nutrition of the rice plant: 37-49. Proc. Symposium IRRI, 1964. The Johns Hopkins Press, Baltimore, Maryland.
1965b Plant characters related to nitrogen response in rice. I n : The mineral nutrition of the rice plant: 419-435. Proc. Symposium IRRI, 1964. The Johns Hopkins Press, Baltimore, Maryland.
1966 Mutual shading as a factor limiting the yield response of rice to application of nitrogen, phosphorus and potassium fertilizers. Plant and Soil, 25: 201-210.
1966 Photosynthesis, respiration, and plant type of the tropical rice plant. Int. Rice Res. Inst., Philipp., Techn. Bull. 7; 46 pp.
1965 Influence of drainage on the growth of rice plant in rice field. 3. The influence of irrigation management on the nutrient uptake, yield of rice plant and the mineral nitrogen content in soil. Proc. Crop Sei. Soc. Japan, 33, no. 4: 335-343.
1939 Rapport omtrent de te nemen maatregelen ter bevordering van de kwaliteitsverbetering van gepelde rijst in Suriname. In : Verslag over de jaren 1938 en 1939 Dep. van Landb. -Ec. Zaken Suriname: 81-100.
1942 Influence of oxygen tension on respiration, fermentation, and growth in wheat and rice. Amer. J. Bot., 29: 721-738.
1955 Drying characteristics of Western rice - Colusa 1600 variety. Rice J., 58, no. 11: 14, 16, 18, 19, 52.
1962 Analysis of yield-determining process and its application to yield prediction and culture improvement of lowland rice. LXI1. Effects of irrigation-water temperature under different water-depths on the growth, grain yield and yield-components of rice. Proc. Crop Sei. Soc. Japan, 31, no. 1: 19-22.
1959a A developmental analysis of yielding ability in varieties of field crops. I. Leaf area per plant and leaf area ratio. Jap. J. Breed., 9: 161-168.
307
TSUNODA, S .
TSUNODA, S.
TSUNODA, S.
TSUNODA, S.
ÜBELS, E.
UMALI, D . L.
VENKATASUBRAMANIAN,
VERGHESE, E.
VETTEL, F.
J.
I960
1962
1965
1961
1957/58
M. K. 1953
1953 1957
VLAMIS, J.
and A. R. DAVIS
VOETS, B.
WAHHAB, A. et al.
WARKENTIN, B. P.
WASSERMAN, T. et al.
1943
1961
1957
1962
1956a
WASSERMAN, T. et al.
WASSERMAN, T. et al.
WILLIAMS, V. R. et al.
WILLIS, W. H.
and M. B. STURGIS
WIT , TH . P. M. DE
1959b A developmental analysis of yielding ability in varieties of field crops. II. The assimilation-system of plants as affected by the form, direction and arrangement of single leaves. Jap. ./. lined., 9: 237-244.
A developmental analysis of yielding ability in varieties of field crops. 111. The depth of green colour and the nitrogen content of leaves. Jap. J. Breed., 10: 107-111. A developmental analysis of yielding ability in varieties of field crops. IV. Quantitative and spatial development of the stem-system. Jap. J. Breed., 12: 49-56. Leaf characters and nitrogen response. In: The mineral nutrition of the rice plant: 401-418. Proc. Symposium 1RRI, 1964. The Johns Hopkins Press, Baltimore, Maryland. Modernisering van de rijstbouw in Nickerie. Landbouw-proefst. Suriname, Meded. no. 26; 59 pp. Status of rice improvement in the Philippines. Philipp. Agricst., 41: 423-431.
Pollen and pollen-tube studies in rice. Madras Agric. / . , 40: 395-414. New and old rice. Madras Agric. J., 40: 113-115. Züchtungsmethodische Fragen der Neu- und Erhaltungszüchtung bei Weizen, Gerste und Hafer. Deutsche Akad. Landwirtschaftswissenschaften Berlin; Sitzungsberichte, 6, no. 6; 39 pp.
Germination, growth, and respiration of rice and barley seedlings at low oxygen pressures. Plant Physiology, 18: 685-692. Het klimaat van Suriname. Landbouwproefst. Suriname. Stencilled report; 3 pp. Loss of ammonia from ammonium sulphate under different conditions when applied to soils. Soil Science (Baltimore), 84: 249-255. Water retention and swelling pressure of clay soils. Canad. J. Soil Sei., 42: 189-196. Drying characteristics of Western rice - Caloro variety. I. Equal moisture removal and constant drying air temperatures in all passes. Rice J., 59, no. 3: 12-16.
1956b Drying characteristics of Western rice - Caloro variety. I I . Varying drying air temperature and amount of moisture removed in each pass. Rice J., 59, no. 4: 41-45.
1958 Improvements in commercial drying of Western rice. Part 1. Mixing type dryer. Rice J., 61, no. 4 : 30-32, 34-36, 38.
1958 Varietal differences in amylose content of rice starch. / . Agric. and Food Cliem., 6: 47-48.
1944 Loss of nitrogen from flooded soil as affected by changes in temperature and reaction. Proc. Soil Sei. Soc. Amer., 9: 106-113.
1960 The Wageningen Rice Project in Surinam. Dissertatie Wageningen; 293 pp. S.M.L., Koninginnegracht 66, Den Haag, Nederland.
308
WIT, T H . P. M. DE
WORMER, T H . M.
WOUTERS, L. J. A.
WOUTERS, L. J. A.
WYCHE, R. H.
and R. L. CHEANEY
WVCHE, R. H.
and R. L. CHEANEY
YAMADA, N.
YAMADA, N.
YUAN, WEN LIN
and F. N. PONNAMPERUMA
1961 Resultados de experimented con Stam F-34, un herbicida nuevo para cl arroz. Agronomia Tropical, 11, no. 2: 119-129.
1953 Morphologische waarnemingen aan rijstplanten, gegroeid bij verschillende lengten van de photoperiode. Dissertatie Wageningen; 153 pp. Uitgeverij Excelsior, Den Haag.
1965a The control ol' pests and diseases at the Wageningen Rice Project in Surinam. In: Proc. Congress Agric. Res. in the Guianas. Paramaribo, 1963. Landbouwproefst. Suriname, Buil. 82: 369-407.
1965b Lijst gebruikte bestrijdingsmiddelen in het Wageningen Project. Stencilled report S.M.L., Surinam; 5 pp.
1949 Effect on rice yields of nitrogenous fertilizers applied as a topdressing to dry, wet and flooded soils. Texas Agr. Exp. Stat. -Tex. A and M Coll., Progress report 1207; 2 pp.
1951 The efficiency of fertilizer applications on dry, wet and flooded soils, as measured by rice yields. Texas Agr. Exp. Stat. - Tex. A and M Coll., Progress report 1355; 2 pp.
1963 Photosynthesis and dry matter production in rice plants. In: Symposium on rice problems. IRC Newsletter, Special Issue: 87-96.
1965 Some problems of irrigation and drainage in rice culture. IRC Newsletter, 14, no. 3: 13-30.
1966 Chemical retardation of the reduction of flooded soils and the growth ol' rice. Plant and Soil, 25: 347-360.
309
Copyright © 2022 FDOKUMEN