Diversity of global rice markets and the science required for consumer-targeted rice breeding
12
Diversity of Global Rice Markets and the Science Required for Consumer-Targeted Rice Breeding Mariafe Calingacion 1,2,3 , Alice Laborte 1 , Andrew Nelson 1 , Adoracion Resurreccion 1,3 , Jeanaflor Crystal Concepcion 1,3 , Venea Dara Daygon 1,3¤b , Roland Mumm 4,5 , Russell Reinke 3,6¤a , Sharifa Dipti 3,7 , Priscila Zaczuk Bassinello 3,8 , John Manful 3,9 , Sakhan Sophany 3,10 , Karla Cordero Lara 3,11 , Jinsong Bao 3,12 , Lihong Xie 3,13 , Katerine Loaiza 3,14 , Ahmad El-hissewy 3,15 , Joseph Gayin 3,16 , Neerja Sharma 3,17 , Sivakami Rajeswari 3,18 , Swaminathan Manonmani 3,18 , N. Shobha Rani 3,19 , Suneetha Kota 3,19 , Siti Dewi Indrasari 3,20 , Fatemeh Habibi 3,21 , Maryam Hosseini 3,21 , Fatemeh Tavasoli 3,21 , Keitaro Suzuki 3,22 , Takayuki Umemoto 3,23 , Chanthkone Boualaphanh 3,24 , Huei Hong Lee 3,25 , Yiu Pang Hung 25 , Asfaliza Ramli 3,26 , Pa Pa Aung 3,27 , Rauf Ahmad 3,28 , Javed Iqbal Wattoo 3,29 , Evelyn Bandonill 3,30 , Marissa Romero 3,30 , Carla Moita Brites 3,31 , Roshni Hafeel 3,32 , Huu-Sheng Lur 3,33 , Kunya Cheaupun 3,34 , Supanee Jongdee 3,35 , Pedro Blanco 3,36 , Rolfe Bryant 3,37 , Nguyen Thi Lang 3,38 , Robert D. Hall 3,4,5 , Melissa Fitzgerald 1,3 * ¤b 1 International Rice Research Institute, Los Ban ˜ os, Laguna, Philippines, 2 Laboratory of Plant Physiology, Wageningen University, Wageningen, The Netherlands, 3 International Network for Quality Rice, 4 Plant Research International, Wageningen, The Netherlands, 5 Centre for BioSystems Genomics, Wageningen, The Netherlands, 6 Yanco Agricultural Institute, NSW Department of Industry and Investment, PMB, Yanco, New South Wales, Australia, 7 Grain Quality and Nutrition Division, Bangladesh Rice Research Institute (BRRI), Gazipur, Bangladesh, 8 EMBRAPA Rice and Beans, Santo Antonio de Goia ´s, GO, Brazil, 9 Africa Rice Center (AfricaRice), Cotonou, Republic of Benin, 10 Cambodian Agricultural Research and Development Institute, Phnom Penh, Cambodia, 11 Mejoramiento Genetico de Arroz INIA CRI Quilamapu, Vicente Mendez, Chile, 12 Institute of Nuclear Agricultural Sciences, Zhejiang University, Hua Jiachi Campus, Hangzhou, China, 13 China National Rice Research Institute, Hangzhou, China, 14 Laboratorio de Calidad FLAR-CIAT, CIAT, Cali-Palmira, Colombia, 15 Rice Research Section, Field Crops Research Institute, A.R.C., Rice Research & Training Center, Sakha, Kafr El-Shiekh, Egypt, 16 CSIR-Food Research Institute, Accra, Ghana, 17 Rice Section, Department of Plant Breeding and Genetics, Punjab Agricultural University Ludhiana, Ludhiana, India, 18 Department of Rice, Centre for Plant Breeding and Genetics, Tamil Nadu Agricultural University Coimbatore, Tamil Nadu, India, 19 Crop Improvement Section, Directorate of Rice Research, Rajendra Nagar, Hyderabad, AP, India, 20 Indonesian Center for Rice Research (ICRR) BB Padi, Sukamandi, Subang Jawa Barat, Indonesia, 21 Rice Research Institute of Iran (RRII), Rasht, I.R. Iran, 22 NARO Institute of Crop Science, 2-1-18 Kannondai, Tsukuba, Ibaraki, Japan, 23 NARO Hokkaido Agricultural Research Centre, Toyohira, Sapporo, Hokkaido, Japan, 24 Rice and Cash Crop Research Institute, NAFRI, Vientiane, Lao PDR, 25 Faculty of Agriculture and Food Science, Universiti Putra Malaysia, Bintulu Sarawak, Malaysia, 26 Pusat Penyelidikan Padi dan Tanaman Industri, MARDI Seberang Perai Beg Berkunci, Seberang Perai Pulau Penang, Malaysia, 27 Plant Biotechnology Center, Myanmar Agriculture Service, Ministry of Agriculture and Irrigation, Yangon, Myanmar, 28 Rice Programme, National Agricultural Research Centre, Islamabad, Pakistan, 29 National Institute for Biotechnology and Genetic Engineering, Faislabad, Pakistan, 30 Rice Chemistry and Food Science Division, Philippine Rice Research Institute, Maligaya, Science City of Mun ˜ oz, Nueva Ecija, Philippines, 31 Instituto Nacional de Investigacao Agraria e Veterinaria, Quinta do Marques, Oeiras, Portugal, 32 Rice Research Station, Department of Agriculture, Ambalantota, Sri Lanka, 33 Department of Agronomy, National Taiwan University, Taiwan, 34 Pathumthani Rice Research Centre, Bureau of Rice Research and Development, Thailand, 35 Khon Kaen Rice Research Center, Khon Kaen, Thailand, 36 Rice Research Program, National Agricultural Research Institute, INIA Treinta y Tres, Treinta y Tres, CP, Uruguay, 37 USDA-ARS, Dale Bumpers National Rice Research Center, Stuttgart, Arkansas, United States of America, 38 Genetic & Plant Breeding Division, Cuulong Delta Rice Research Inst., Can Tho, Viet Nam Abstract With the ever-increasing global demand for high quality rice in both local production regions and with Western consumers, we have a strong desire to understand better the importance of the different traits that make up the quality of the rice grain and obtain a full picture of rice quality demographics. Rice is by no means a ‘one size fits all’ crop. Regional preferences are not only striking, they drive the market and hence are of major economic importance in any rice breeding / improvement strategy. In this analysis, we have engaged local experts across the world to perform a full assessment of all the major rice quality trait characteristics and importantly, to determine how these are combined in the most preferred varieties for each of their regions. Physical as well as biochemical characteristics have been monitored and this has resulted in the identification of no less than 18 quality trait combinations. This complexity immediately reveals the extent of the specificity of consumer preference. Nevertheless, further assessment of these combinations at the variety level reveals that several groups still comprise varieties which consumers can readily identify as being different. This emphasises the shortcomings in the current tools we have available to assess rice quality and raises the issue of how we might correct for this in the future. Only with additional tools and research will we be able to define directed strategies for rice breeding which are able to combine important agronomic features with the demands of local consumers for specific quality attributes and hence, design new, improved crop varieties which will be awarded success in the global market. Citation: Calingacion M, Laborte A, Nelson A, Resurreccion A, Concepcion JC, et al. (2014) Diversity of Global Rice Markets and the Science Required for Consumer-Targeted Rice Breeding. PLoS ONE 9(1): e85106. doi:10.1371/journal.pone.0085106 Editor: Wengui Yan, National Rice Research Center, United States of Ameirca Received July 8, 2013; Accepted November 22, 2013; Published January 14, 2014 This is an open-access article, free of all copyright, and may be freely reproduced, distributed, transmitted, modified, built upon, or otherwise used by anyone for any lawful purpose. The work is made available under the Creative Commons CC0 public domain dedication. PLOS ONE | www.plosone.org 1 January 2014 | Volume 9 | Issue 1 | e85106
-
Upload
independent -
Category
Documents
-
view
0 -
download
0
Transcript of Diversity of global rice markets and the science required for consumer-targeted rice breeding

Diversity of Global Rice Markets and the ScienceRequired for Consumer-Targeted Rice BreedingMariafe Calingacion1,2,3, Alice Laborte1, Andrew Nelson1, Adoracion Resurreccion1,3,
Jeanaflor Crystal Concepcion1,3, Venea Dara Daygon1,3¤b, Roland Mumm4,5, Russell Reinke3,6¤a,
Sharifa Dipti3,7, Priscila Zaczuk Bassinello3,8, John Manful3,9, Sakhan Sophany3,10, Karla Cordero Lara3,11,
Jinsong Bao3,12, Lihong Xie3,13, Katerine Loaiza3,14, Ahmad El-hissewy3,15, Joseph Gayin3,16,
Neerja Sharma3,17, Sivakami Rajeswari3,18, Swaminathan Manonmani3,18, N. Shobha Rani3,19,
Suneetha Kota3,19, Siti Dewi Indrasari3,20, Fatemeh Habibi3,21, Maryam Hosseini3,21,
Fatemeh Tavasoli3,21, Keitaro Suzuki3,22, Takayuki Umemoto3,23, Chanthkone Boualaphanh3,24,
Huei Hong Lee3,25, Yiu Pang Hung25, Asfaliza Ramli3,26, Pa Pa Aung3,27, Rauf Ahmad3,28,
Javed Iqbal Wattoo3,29, Evelyn Bandonill3,30, Marissa Romero3,30, Carla Moita Brites3,31,
Roshni Hafeel3,32, Huu-Sheng Lur3,33, Kunya Cheaupun3,34, Supanee Jongdee3,35, Pedro Blanco3,36,
Rolfe Bryant3,37, Nguyen Thi Lang3,38, Robert D. Hall3,4,5, Melissa Fitzgerald1,3*¤b
1 International Rice Research Institute, Los Banos, Laguna, Philippines, 2 Laboratory of Plant Physiology, Wageningen University, Wageningen, The Netherlands,
3 International Network for Quality Rice, 4 Plant Research International, Wageningen, The Netherlands, 5 Centre for BioSystems Genomics, Wageningen, The Netherlands,
6 Yanco Agricultural Institute, NSW Department of Industry and Investment, PMB, Yanco, New South Wales, Australia, 7 Grain Quality and Nutrition Division, Bangladesh
Rice Research Institute (BRRI), Gazipur, Bangladesh, 8 EMBRAPA Rice and Beans, Santo Antonio de Goias, GO, Brazil, 9 Africa Rice Center (AfricaRice), Cotonou, Republic of
Benin, 10 Cambodian Agricultural Research and Development Institute, Phnom Penh, Cambodia, 11 Mejoramiento Genetico de Arroz INIA CRI Quilamapu, Vicente
Mendez, Chile, 12 Institute of Nuclear Agricultural Sciences, Zhejiang University, Hua Jiachi Campus, Hangzhou, China, 13 China National Rice Research Institute,
Hangzhou, China, 14 Laboratorio de Calidad FLAR-CIAT, CIAT, Cali-Palmira, Colombia, 15 Rice Research Section, Field Crops Research Institute, A.R.C., Rice Research &
Training Center, Sakha, Kafr El-Shiekh, Egypt, 16 CSIR-Food Research Institute, Accra, Ghana, 17 Rice Section, Department of Plant Breeding and Genetics, Punjab
Agricultural University Ludhiana, Ludhiana, India, 18 Department of Rice, Centre for Plant Breeding and Genetics, Tamil Nadu Agricultural University Coimbatore, Tamil
Nadu, India, 19 Crop Improvement Section, Directorate of Rice Research, Rajendra Nagar, Hyderabad, AP, India, 20 Indonesian Center for Rice Research (ICRR) BB Padi,
Sukamandi, Subang Jawa Barat, Indonesia, 21 Rice Research Institute of Iran (RRII), Rasht, I.R. Iran, 22 NARO Institute of Crop Science, 2-1-18 Kannondai, Tsukuba, Ibaraki,
Japan, 23 NARO Hokkaido Agricultural Research Centre, Toyohira, Sapporo, Hokkaido, Japan, 24 Rice and Cash Crop Research Institute, NAFRI, Vientiane, Lao PDR,
25 Faculty of Agriculture and Food Science, Universiti Putra Malaysia, Bintulu Sarawak, Malaysia, 26 Pusat Penyelidikan Padi dan Tanaman Industri, MARDI Seberang Perai
Beg Berkunci, Seberang Perai Pulau Penang, Malaysia, 27 Plant Biotechnology Center, Myanmar Agriculture Service, Ministry of Agriculture and Irrigation, Yangon,
Myanmar, 28 Rice Programme, National Agricultural Research Centre, Islamabad, Pakistan, 29 National Institute for Biotechnology and Genetic Engineering, Faislabad,
Pakistan, 30 Rice Chemistry and Food Science Division, Philippine Rice Research Institute, Maligaya, Science City of Munoz, Nueva Ecija, Philippines, 31 Instituto Nacional
de Investigacao Agraria e Veterinaria, Quinta do Marques, Oeiras, Portugal, 32 Rice Research Station, Department of Agriculture, Ambalantota, Sri Lanka, 33 Department of
Agronomy, National Taiwan University, Taiwan, 34 Pathumthani Rice Research Centre, Bureau of Rice Research and Development, Thailand, 35 Khon Kaen Rice Research
Center, Khon Kaen, Thailand, 36 Rice Research Program, National Agricultural Research Institute, INIA Treinta y Tres, Treinta y Tres, CP, Uruguay, 37 USDA-ARS, Dale
Bumpers National Rice Research Center, Stuttgart, Arkansas, United States of America, 38 Genetic & Plant Breeding Division, Cuulong Delta Rice Research Inst., Can Tho,
Viet Nam
Abstract
With the ever-increasing global demand for high quality rice in both local production regions and with Western consumers,we have a strong desire to understand better the importance of the different traits that make up the quality of the rice grainand obtain a full picture of rice quality demographics. Rice is by no means a ‘one size fits all’ crop. Regional preferences arenot only striking, they drive the market and hence are of major economic importance in any rice breeding / improvementstrategy. In this analysis, we have engaged local experts across the world to perform a full assessment of all the major ricequality trait characteristics and importantly, to determine how these are combined in the most preferred varieties for eachof their regions. Physical as well as biochemical characteristics have been monitored and this has resulted in theidentification of no less than 18 quality trait combinations. This complexity immediately reveals the extent of the specificityof consumer preference. Nevertheless, further assessment of these combinations at the variety level reveals that severalgroups still comprise varieties which consumers can readily identify as being different. This emphasises the shortcomings inthe current tools we have available to assess rice quality and raises the issue of how we might correct for this in the future.Only with additional tools and research will we be able to define directed strategies for rice breeding which are able tocombine important agronomic features with the demands of local consumers for specific quality attributes and hence,design new, improved crop varieties which will be awarded success in the global market.
Citation: Calingacion M, Laborte A, Nelson A, Resurreccion A, Concepcion JC, et al. (2014) Diversity of Global Rice Markets and the Science Required forConsumer-Targeted Rice Breeding. PLoS ONE 9(1): e85106. doi:10.1371/journal.pone.0085106
Editor: Wengui Yan, National Rice Research Center, United States of Ameirca
Received July 8, 2013; Accepted November 22, 2013; Published January 14, 2014
This is an open-access article, free of all copyright, and may be freely reproduced, distributed, transmitted, modified, built upon, or otherwise used by anyone forany lawful purpose. The work is made available under the Creative Commons CC0 public domain dedication.
PLOS ONE | www.plosone.org 1 January 2014 | Volume 9 | Issue 1 | e85106

Funding: This work was supported by International Network for Quality Rice (INQR), International Rice Research Institute (IRRI), Wageningen University Research(WUR), and the Monsanto Beachell Borlaug Scholarship Foundation. The funders had no role in study design, data collection and analysis, decision to publish, orpreparation of the manuscript.
Competing Interests: The authors have declared that no competing interests exist.
* E-mail: [email protected]
¤a Current address: International Rice Research Institute, National Institute of Crop Science, Gwonsun-gu, Suwon, Republic of Korea,¤b Current address: School of Agriculture and Food Science, University of Queensland, St Lucia, Queensland, Australia
Introduction
Economic growth in Asia over the past thirty years has
increased incomes and lifted millions out of poverty [1]. Globally,
confidence is growing that the first Millennium Development Goal
(to cut extreme hunger and poverty by half) will be met, and that
economic growth will continue, and lift millions more from
poverty [2]. It is projected that by 2050 Asia will account for half
of the world’s economic output [3], and be home to the largest
proportion of middle classes, who will increasingly demand higher
quality food, including higher quality rice [3–6]. However,
coupled with economic growth in Asia, population pressure is
increasing, agricultural land is being lost to urbanisation, and there
is significant loss of workers from farms as the younger generation
moves to cities [2]. Furthermore, climate change is predicted to
have a severe impact on agricultural production in Asian countries
[7].
Rice consumption per capita in many Asian countries is
decreasing steadily due to changing dietary habits as a result of
western influence, such as increased intake of dairy, meat and fast
foods, and economic development [8]. Despite this decline,
current projections of population growth indicate that an
additional 8 million tonnes of rice must be produced each year
in Asia [9]. Furthermore, western countries have started eating
rice regularly [10], and continued growth of Asian communities
within western countries has increased the market size for rice as
well as creating awareness and appreciation of rice-based meals
[11]. Taken together, for a developing Asia these factors all
indicate that resource use efficiency must increase significantly in
future rice production, and must meet the dual requirements of
increasing production with fewer resources, while meeting the
market demands of increasingly discerning consumers.
Many countries still grow traditional varieties of rice such as
Khao Dawk Mali 105, selected in 1958 in Thailand [12], or
popular, long-standing, improved varieties such as IR64 released
in 1985 in the Philippines [12] and Swarna released in 1979 in
India. This is despite significant national investment in rice
improvement programs and continual release of new, high-
yielding varieties. Adoption of these improved varieties by rice
farmers is conditional upon consumer acceptance of the sensory
and cooking properties of the grain [13]. People prefer a specific
type of rice for a number of reasons. A survey conducted in
Cambodia revealed that different quality traits were prioritised by
different actors in the rice value chain. These traits included grain
shape and appearance, aroma, texture and lack of chalk (ACIAR
CSE-2009-005 Rice Market Survey). Consumers are readily able
to determine if the sensory properties of a new variety are
acceptable. However, when a new variety is not acceptable, it is
difficult for consumers to describe why, and this makes it difficult
for rice research programs to conduct the type of research that will
deliver relevant selection tools to breeding programs.
Most of the studies conducted on rice consumer preferences
have focused on the requirements of a particular country [14–21],
but the rice market is now global, and there is a need for a more
holistic perspective on consumer preferences relating to rice grain
quality and its geographic variability. This will allow for a more
targeted approach towards developing and disseminating new rice
varieties which have an increased probability of adoption and
acceptance.
The establishment of the International Network for Quality
Rice (INQR), made it possible to conduct a survey of consumer
preferences for rice quality in different rice-consuming regions.
The INQR serves as the platform for all experts working on rice
grain quality to: exchange information; establish new and
standardised protocols for measuring different quality parameters;
and identify new traits of physical, sensory and nutritional quality
(https://inqr.irri.org). Through the INQR, experts in 23 countries
participated in the survey reported here.
In the present paper we describe an extensive analysis of
regional preferences for the main features of rice quality that are
routinely measured in quality evaluation programs – length and
shape of the grain, amylose content, gelatinisation temperature, gel
consistency and aroma. Our objectives are to understand the
specific market requirements for rice in each country in Asia as
close to the provincial level as possible, and in some of Asia’s
export markets, and to identify gaps that investment and research
must fill to increase the ability of rice breeders to develop high-
yielding, climate-ready varieties with the quality traits required by
the consumers in their local markets.
Methods
Data collection and analysisA survey was conducted among the members of the INQR.
They were asked to identify the three most popular varieties of rice
from their respective countries, and where possible disaggregated
to the provincial, regional or state level (Table S1). Information
was supplied for the commonly measured quality traits of grain
length and shape, amylose content, gel consistency, gelatinisation
temperature and aroma. For countries unable to measure all traits,
samples of the chosen varieties were sent to the International Rice
Research Institute (IRRI) for phenotyping of those traits. The
consumer preferences for grain quality traits presented here refer
to the characteristics of the three most popular varieties identified
per region (country, state or province). Although variations in
preferences exist within a region, only the dominant preferences
are captured here.
Data for each quality trait was mapped in units based on
administrative level (e.g., whole country, state, province) using
boundaries denoted in the Global Administrative Areas (GADM)
database (www.gadm.org). There are a total of 92 spatial units for
which we have data on preference for at least two grain quality
traits (Figure S1).
Data from the survey were classified as previously defined
[22,23]. The classes of grain length of milled rice in Asian rice
improvement programs are defined as short (,5.5 mm), medium
(5.51–6.6 mm), long (6.61–7.5 mm) and extra-long (.7.51 mm)
[22]. These definitions differ from those described in the CODEX
Diversity of Rice Markets
PLOS ONE | www.plosone.org 2 January 2014 | Volume 9 | Issue 1 | e85106

standard (198-1995) and by the European Commission [24], both
of which define long grains as being 6 mm or more. For the
purposes of this paper, which focuses on Asian rice, we have
retained the classes for grain dimensions defined by Khush et al.
(1979), and used the classifications for all other traits that were
described by Juliano et al. (1985). Grain shape (length/width) was
classified as bold (,2), medium (2 – 3) or slender (.3). Amylose
content was classified as waxy (, 0%), low (2 – 19%), intermediate
(20–25%) or high (.25%). Categories for gel consistency were soft
(.60 mm), intermediate (40–60 mm) or hard (,40 mm). Gelati-
nisation temperature was classified as low (,70uC), intermediate
(70–74uC) or high (.74uC).
The potential market share of each country was estimated based
on FAO data on rice consumption per capita over a period of 20
years (Table S2) from 1990–2009 (the most recent available year:
[25]). The countries in the INQR dataset account for over 90% of
the global rice consumption, indicating that the data cover a
substantial proportion of the global rice market.
Length and shape of the grainAt IRRI, the length and width of grains were measured using a
Cervitec Grain Inspector 1625 (FOSS Analytical, Hoganas,
Sweden). For grain lengths reported from elsewhere, length and
width were measured using calipers or a calibrated scanner.
Amylose contentColourimetric method. Amylose content was measured
using the standard iodine colourimetric method ISO 6647-2-
2011 [26]. Briefly, ethanol (1 mL, 95%) and 1 M sodium
hydroxide (9 mL) were added to rice flour (100 mg), and this
was heated in a boiling water bath until gelatinisation of the starch
occurred. After cooling, 1 M acetic acid (1 mL) and iodine
solution (2 mL) were added and the volume was made up to
100 mL with Millipore water. The iodine solution was prepared
by dissolving 0.2 g iodine and 2.0 g potassium iodide in 100 mL
Millipore water. Absorbance of the solution was measured using
an Auto Analyser 3 (Bran+Luebbe, Norderstedt, Germany) at
600 nm. Amylose content was quantified from a standard curve
generated from absorbance values of 4 well-known standard rice
varieties (IR65, IR24, IR64 and IR8).
Size exclusion chromatography. Rice samples with low,
intermediate and high amylose were selected and analysed using
SEC exactly as previously described [27]. Rice flour (50 mg) was
gelatinised, then debranched with isoamylase (Pseudomonas,
Megazyme, Wicklow, Ireland) at 50uC for 2h, with regular
agitation. An aliquot of each debranched solution (40mL) was
analysed using SEC (Waters, Alliance 2695,Waters,Milford, USA)
equipped with an Ultrahydrogel 250 column (Waters).
Genotyping the Waxy gene. Genomic DNA was extracted
from rice leaves of the low amylose varieties from Cambodia,
Thailand, Australian, and Japan using the method described
previously [28]. Leaf samples were frozen in liquid nitrogen and
ground into fine powder prior to addition of extraction buffer.
PCR amplification was performed using a G-Storm Thermal
Cycler (model GS1, Gene Technologies Ltd, Essex, UK) in a 20-
mL reaction volume containing forward and reverse primers
(Table 2), designed with Primer 3 software [29], and components
from KAPA HiFi HotStart PCR Reagent Kit (KAPA Biosystems,
Boston, Massachusetts, USA). Twenty microliters of the PCR
product were electrophoresed through a 1.2% agarose gel, stained
with SybrSafe nucleic acid stain (Invitrogen, Carlsbad, CA, USA),
and visualized using a non-ultraviolet transilluminator (Dark
Reader DR195M, Clare Chemicals, Dolores, CO, USA). PCR
fragments from agarose gels were purified using the QIAquick Gel
Extraction Kit (Qiagen, Hilden, Germany) according to the
manufacturer’s instruction. Sequencing of the PCR products was
done by Macrogen Inc., Seoul, South Korea. Nucleotide
sequences were retrieved and aligned using BIOEDIT software
[30] with the Nipponbare rice Wx gene sequence from
GRAMENE [31] as the reference.
Gelatinisation temperatureGelatinisation temperature was measured using a DSC Q100
instrument (TA Instrument, New Castle, DE, USA) [32]. Rice
flour (4 mg) was mixed with Millipore water (8 mg) in hermetic
aluminium pans which were then sealed. The pans were heated
under pressure from 25 to 120uC at 10uC min21. Some countries
reported gelatinisation temperature as alkali spreading values,
which were determined as previously described [33], and values
ascribed to high, intermediate or low by the correlations reported
previously [32].
Gel consistencyGel consistency was determined as previously described [34].
Rice flour (100 mg) was mixed with ethyl alcohol (0.2 mL)
containing 0.025% thymol blue and 0.2 M potassium hydroxide
(2 mL) and heated in a boiling water bath for 8 min. After heating,
the sample tubes were allowed to cool in an ice-water bath and
immediately laid horizontally on the table. Gel consistency was
measured by the length of the cold rice paste in the culture tube
held horizontally for one hour. Hard, medium and soft gel
standards, IR48, PSBRC9 and IR42, respectively, were included
in every set.
AromaThe current definition of aromatic rice is the presence of the
volatile compound 2-acetyl-1-pyrroline (2AP). This was quantified
at IRRI using gas chromatography (Agilent 6890N, Santa Clara,
CA, USA) equipped with a flame ionisation detector [35]. For
those rice samples not measured at IRRI, aroma was determined
by smelling and tasting cooked grains.
Volatile analysis of aromatic rice by gas chromatography-mass spectrometry (GCMS)
Volatile compounds in the aromatic rice from Iran, Pakistan,
India and the Greater Mekong Sub-region (GMS) were analysed.
Headspace volatile compounds of selected aromatic rice were
collected by solid phase microextraction using a 65-mm poly-
dimethylsiloxane-divinylbenzene fibre (Supelco, Bellefonte, USA)
and analysed using GC-MS (GC 8000, Fisons Instruments,
Cheshire, UK) [36]. GCMS raw data were processed using
MetAlign [37] to extract and align the mass signals, and MSClust
[38] to remove signal redundancy per metabolite and reconstruct
mass spectra. The PCA plot was constructed using SIMCA-P 12.0
(Umetrics AB, Umeau, Sweden).
Results and Discussion
Without an understanding of consumer preference for rice grain
quality, wide adoption of any newly developed rice variety is not
guaranteed. Hence, identifying the grain traits that govern
acceptance is important to guide a successful breeding program.
Quality attributes of the most popular rice varieties consumed in
the countries and provinces of Asia, as well as for some of the rice-
growing countries in other continents have been collected.
Currently, rice grain quality is classified in terms of its physical,
cooking and sensory characteristics. The physical appearance of
the grain defines its price in the market, whereas the cooking and
Diversity of Rice Markets
PLOS ONE | www.plosone.org 3 January 2014 | Volume 9 | Issue 1 | e85106

sensory properties determine the reputation of the variety [39].
Grain appearance, the first thing a consumer sees, is defined by
length, width and shape (ratio of length and width); and chalk,
which consumers dislike [40] unless the variety is targeted towards
use in paella or risotto. The physical traits of the grain are
immediately recognisable even to an untrained eye. Cooking
quality is a measure of the time and fuel required to cook the rice,
and this is indirectly measured by gelatinisation temperature [32].
Sensory properties are influenced by amylose content [41], gel
consistency [34,42] and also gelatinisation temperature [43].
Length and shape of the grainThe defined classes of grain length differ between Asian and
European standards [22,24], but for the purposes of this work, the
Asian classification of length, as defined by Khush, et al. (1979)
was used. Rice consumers in parts of South East Asia - Thailand,
Lao PDR, Cambodia, Malaysia, and Philippines prefer long and
slender grains (Figure 1). Consumers in Indonesia and Bangladesh
prefer grains that are medium in length and slender. In North
Asia, the Japanese, Taiwanese and South Koreans eat short and
bold rice grains, whereas in several states of India, and Sri Lanka,
both short and medium grains are popular. In most of Pakistan
and the Indian states of Punjab and Haryana, the extra long grains
characteristic of basmati rice are popular, and long grains are also
popular in most of Iran and parts of Pakistan (Figure 1).
Rice consumers in the large countries of China, and India have
regional differences in preferences for grain length and shape.
Consumers in China prefer rice grains that are either short and
bold, or are long in size but with the grain shape ranging from
medium to slender depending on province. Indian rice preferenc-
es, on the other hand, are composed of an even more varied set of
grain types- from short to medium, long and extra-long in length
with shapes ranging from bold to slender (Figure 1).
Understanding the genetic basis of length should assist in
harmonising the definitions of grain length between the European
and Asian standards. Seven Quantitative Trait Loci (QTLs) for
grain length have been reported and three for grain width [44].
Biallelic variation at the GS3 locus appears to exert the most
control over grain length [45]. All the short and medium grains
genotyped carry the C-allele and all the long and extra-long grains
carry the A-allele [46,47]. However the association studies done
for the gene GS3 were all on paddy rice, and not on polished rice
[45–47], so the range of white grain length of those carrying the C
and A alleles is not yet known, and this information would enable
the differences between the standards to be resolved.
Figure 2A shows four clear groups for grain length. Koshihikari
from Japan and Pandan Wangi from Indonesia, both of which are
likely to be in the grain length range for allele C of GS3, differ in
grain length and do so reliably. Furthermore, the basmati rices
around 8.0 mm and KDML105 at 6.8 mm both carry the A-allele
of GS3 [46]. Another gene associated with grain length, GL3, has
recently been cloned [48], but its presence has not been associated
widely with grain length in diverse germplasm. We therefore have
four reliable phenotypes of grain length (Figure 2A), and two
genotypes at the GS3 loci, but as other QTLs and genes such as
GL3 are further understood, the complete genetic regulation of
grain length should become known.
Grain shape is often used to describe the physical dimensions of
grains. This is the ratio of length and width, and three classes are
defined: bold (,2), medium (2.1 – 3), and slender (.3).
Confusingly, these terms could also describe width. Figure 2B
shows the percentage of each grain shape category for each length
Figure 1. Regional variation in rice length and shape (length/width) of the three most popular varieties in the countries, states, andprovinces of Asia. In some regions, more than one type of grains lengths and shapes are preferred. Colours represent length, and lines representthe shape. Additional information for other regions can be found in Table 2. Data were obtained from INQR representatives from each region.doi:10.1371/journal.pone.0085106.g001
Diversity of Rice Markets
PLOS ONE | www.plosone.org 4 January 2014 | Volume 9 | Issue 1 | e85106

class for all the varieties in the present paper. Interestingly, as grain
length increases, the proportion of slender grains increases and the
proportion of bold grains decreases. However, Fitzgerald et al.
(2009) showed a grain with length and width 11 and 3.8 mm
respectively, which places an extra-long grain into the medium
shape classification. This suggests that selection has driven the
trend seen in Figure 2B, but the diversity of rice could encompass
all grain shapes for all length classes. If the rice community intends
to continue using grain shape to describe the dimensions of the
grain, it would be useful to also always include the length in order
to avoid confusion.
Amylose contentAmylose, a linear polymer of glucose units linked primarily by
a-1,4 linkages, influences texture and the potential of cooked
grains to retrograde after cooking. This is also one of the major
traits used in the selection process for eating quality among rice
breeding programs [41]. Hence, most of the INQR members were
familiar with the amylose classes popular in their region.
Consumers in Lao PDR and the Isan region of Thailand prefer
waxy or sticky rice (Figure 3). In Japan, Taiwan, Cambodia,
Thailand, parts of Lao PDR, Egypt and Australia, consumers
prefer low amylose rice, as do consumers in the northern and
south-western provinces of China, and southern Vietnam (Figure
3, Table 1). Rice with intermediate amylose content is preferred in
Iran, Pakistan, Malaysia, Philippines, many states in India, and
some provinces of China, Vietnam, Indonesia and Uruguay. High
amylose varieties are popular in Myanmar, Sri Lanka, provinces of
Indonesia, and many states of India (Figure 3). High AC rice is
also preferred in Ghana, Senegal, Suriname, Colombia and parts
of Uruguay (Table 1).
The amylose classes are associated with polymorphisms in the
Waxy gene (Wx) [49] which encodes for the granule-bound starch
synthase (GBSSI) enzyme that is responsible for amylose synthesis
Figure 2. A: Grains ordered from shortest to longest, showing different widths (mm) in each class except the extra-long class. B:Histogram showing the proportion of bold (black), medium (light grey) and slender (dark grey) grain shapes within each length class for all thepopular rices discussed in the present paper.doi:10.1371/journal.pone.0085106.g002
Diversity of Rice Markets
PLOS ONE | www.plosone.org 5 January 2014 | Volume 9 | Issue 1 | e85106

[50]. A G-T polymorphism at the 5’ splice site at intron 1 results in
two functional alleles Wxa and Wxb, which differentiate low
amylose from high and intermediate classes [51]. An A-C
polymorphism in exon 6, Wxin discriminates intermediate from
high amylose [52,53]. The waxy phenotype is a null mutation with
a 23-bp duplication in exon 2 which causes a frame-shift resulting
in non-functional GBSSI protein [54] and no amylose [41,55].
Each class of amylose is a range of 4 – 12 percentage points.
Figure 3 has been plotted on the basis of the traditionally-defined
classes. However, data from different countries indicated that
popular rice varieties span each range. For example, the low
amylose varieties from Thailand and Cambodia are 12–15%
amylose, whereas the low amylose varieties from Japan, China,
Korea and Australia are about 18–19% amylose. These varieties
are all the same Waxy haplotype, with the single-nucleotide
polymorphism (SNP) at intron 1. The same variation within class
was found for the intermediate and high amylose classes.
In order to visualise the amylose content more clearly, varieties
with amylose content across the range of each class were analysed
using size exclusion chromatography (SEC). The SEC traces
clearly demonstrate that within a typical amylose class, different
levels of amylose and amylopectin were observed (Figure 4). For
the low amylose class there was a clear group of lower amylose
varieties, which were the Thai and Cambodian indica varieties, and
a clear group with higher amylose which are the Australian and
Japanese temperate japonica varieties. However, the range in the
other two classes is due to a difference in the amount of
amylopectin chains (Figure 4). Those at the upper end of the
intermediate and high amylose class had a significantly lower
percentage of amylopectin than those at the lower end of the
amylose class (Figure 4). Since only the low amylose haplotype
showed differences in the amylose chains, the coding region of the
Wx gene was sequenced for each, to determine the presence of
another allele. However, no sequence differences were found,
Figure 3. Regional variation in amylose content of the three most popular varieties in the countries, states, and provinces of Asia. Insome regions, two types of amylose class are preferred. Additional information for other regions can be found in Table 2. Data were obtained fromINQR representatives from each region.doi:10.1371/journal.pone.0085106.g003
Table 1. Primers used to sequence Wx gene of low AACvarieties.
Primer Name Sequence (5’-3’)Size(bp)
Wx_ex1F CAATGCAACGTACGCCAAG 19
Wx_ex1R CCTGGGTGTGTTTCTCTAGACTC 23
Wx_ex2aF GTGGGCTAGCTGACCTAGATTTG 23
Wx_ex2aR TGTTTAAGGTTTGGTGAGCCTA 22
Wx_ex2bF CCAAGAAACTGCTCCTTAAGTCC 23
Wx_ex2bR GTACCTGTCTGCAACCTTGATCT 23
Wx_ex3-6F GCATTGGATGGATGTGTAATGT 22
Wx_ex3-6R GGCTGGTAGTTGTTCTTCAGGT 22
Wx_ex6-9F GGAAGCATCACGAGTTTACCAT 22
Wx_ex6-9R CTTGCCTTGTCAGAATCAATCA 22
Wx_ex10-11F CAACCACGGTAAGAACGAATG 21
Wx_ex10-11R AGGGCTGGAGAAATCAACAAG 21
Wx_ex12-13F CTGCAGGGGATGAGATACG 19
Wx_ex12-13R TGTAGATCTCAGGCTCTTCAAGG 23
Wx_ex14F TGTTTGCAACATGGATTTCAGGG 23
Wx_ex14R TCCTGAGTCAAACTACTGCTCCT 23
doi:10.1371/journal.pone.0085106.t001
Diversity of Rice Markets
PLOS ONE | www.plosone.org 6 January 2014 | Volume 9 | Issue 1 | e85106

suggesting either that the difference in amylose is due to loci other
than Wx, interactions relating to amylose that are specific to either
the indica or tropical japonica germplasm class, or that the amylose
content is lower when this haplotype is grown under tropical
conditions. This allele of the Wx gene leading to low amylose is
sensitive to high temperature [56]. However, it is possible that
main climate difference between the countries could be humidity,
although no relationship between amylose content and humidity
has yet been demonstrated. For intermediate and high amylose,
the data indicate that amylopectin synthesis is also involved in
amylose content, and presents an opportunity to discover the
biochemical and genetic bases of varying amylopectin content.
The range in amylose content of varieties within each class
suggests that an additional sub-categorisation within each amylose
class would be valuable to define clearly the differences within rice
that belong to the same amylose haplotype. Low amylose rice
could be further classified into subclass A and B with amylose
content 11–15% and 16–19%, respectively. Similarly, the
intermediate amylose group may be divided into subclass A with
amylose contents between 20–22%, and subclass B with 23–24%
amylose. High amylose can also be categorised into subclass A and
B with amylose content 25–27% and .27%, respectively.
Although the underlying genetics for each sub-class has not been
elucidated, it would be valuable to adopt these descriptors to
facilitate understanding in the global rice literature.
Gel consistencyGel consistency is a test that was developed to differentiate
between the texture of cooked rice from the high and intermediate
amylose classes [34]. It measures the distance travelled by a gel
after cooking and was developed for varieties of 24–30% amylose
[34]. Gel consistency is not measured in a number of countries
because high amylose rices are not part of the rice improvement
program.
It was expected that only the rice improvement programs
developing high and intermediate amylose would be using a gel
consistency test, such as Iran, Pakistan, Thailand, Philippines,
Tamil Nadu in India, Sarawak in Malaysia and Kalimantan in
Indonesia and some others (Figure 5). However other countries
also reported values for gel consistency (Figure 5, Table 1), even
those where low amylose varieties are developed. Most countries
that reported gel consistency values prefer soft or intermediate gel
consistency, which indicates soft-texture in varieties with high
amylose. The genetic basis of gel consistency is a SNP in exon 10
of the Waxy gene [42]. This SNP has only been associated with gel
consistency for varieties with a functional intron 1 [42], which
excludes the lower amylose varieties.
Gelatinisation temperatureGelatinisation temperature describes the temperature that
starch granules begin to melt, and the grains begin to cook [57].
It ranges from 55 – 85uC in domesticated rice, and correlates with
the cooking time of rice and the final cooked texture [32]. In the
countries of South and Central Asia, gelatinisation temperature is
intermediate to high, which means the rice takes about 4 min
longer to cook than rice with low gelatinisation temperature, such
as is found in some Southeast Asian countries (Figure 6).
Gelatinisation temperature is divided into two groups by allelic
variation in SSlla [58–60]. The SNPs in SSlla define four
haplotypes [58,61] and two haplotypes associate with high and
two with low gelatinisation temperature [32]. Intermediate
gelatinisation temperature varieties are found in all haplotype
groups [32], suggesting that another locus interacts with SSlla to
produce the intermediate phenotype.
Many of the popular varieties have been genotyped for the SSlla
locus [32], and the genotype associates with the phenotypes
reported in Figure 6, in all cases.
The additional cooking time required for rice of high
gelatinisation temperature leads to an enormous amount of extra
energy used when expressed on a population basis. It has been
estimated that each minute less cooking time globally represents
2500 years cooking time saved per day [12]. Thus if all countries
could lower the gelatinisation time, and thereby cooking time of
their popular varieties, this would lead to significant savings of fuel,
and a measureable reduction in the carbon footprint of rice.
AromaAromatic rice varieties are of great interest in the market
because they command a higher price than non-aromatic rice.
The two types of aromatic rice are basmati and jasmine. Aromatic
rice is characterised by the presence of a popcorn / baked bread-
like flavour compound called 2-acetyl-1-pyrroline (2AP). Although
Table 2. Grain quality traits in non-Asian rice-growing countries.
Country Length Shape Amylose Aroma Gel Con Gel Temp
Australia Medium and long, Medium Low 1 of 3 Low and intermediate
Egypt Medium and long, Slender and medium Low
Ghana Medium and long, Slender High 1 of 3 Soft and intermediate Low and intermediate
Uganda Medium and long Slender and medium Intermediate and high 1 of 3 Soft and intermediate Intermediate to high
Senegal Medium and long, Slender and medium High Soft Intermediate and high
Portugal Long and medium Slender and medium intermediate Intermediate and high
Suriname Extra-long, Slender High Low
Chile Short and long, Bold Intermediate Low
Colombia Long Slender High Low and intermediate
Brazil Long Intermediate and high Intermediate Intermediate and high
Uruguay Long Slender Intermediate and high Low and intermediate
USA Medium and long Slender and medium Low and intermediate Low and intermediate
Some countries do not measure all traits.doi:10.1371/journal.pone.0085106.t002
Diversity of Rice Markets
PLOS ONE | www.plosone.org 7 January 2014 | Volume 9 | Issue 1 | e85106

generally only present in very low amounts, its low odour
threshold means that 2AP is easily detected by consumers [62].
In both jasmine and basmati rice breeding programs, the
presence of 2AP is used to select fragrant progeny. 2AP is
determined subjectively either by sniffing a gram of rice grains that
have been soaked for an hour in potassium hydroxide, quantita-
tively by gas chromatography, or by detecting the mutation in the
gene that associates with aroma [35].
Figure 7 shows that aromatic rice is very important in the
Greater Mekong Subregion (GMS), Malaysia, Iran, Pakistan, the
states of Punjab and Haryana of India and some provinces of
Indonesia. In Iran, the aromatic varieties are sadri types, which
group together genetically with the basmati rices of Pakistan and
India [63]. Most of those varieties are traditional, and the
improved varieties grown in Pakistan and India are derived from
traditional basmati parents. The fragrant rices in the GMS are
indica jasmine types, and these are mostly traditional varieties. The
taste and aroma of South and Central Asian and the GMS jasmine
rices are distinctly different, although all have 2AP and all have
been shown to carry the common mutation in the fragrance gene
[35].
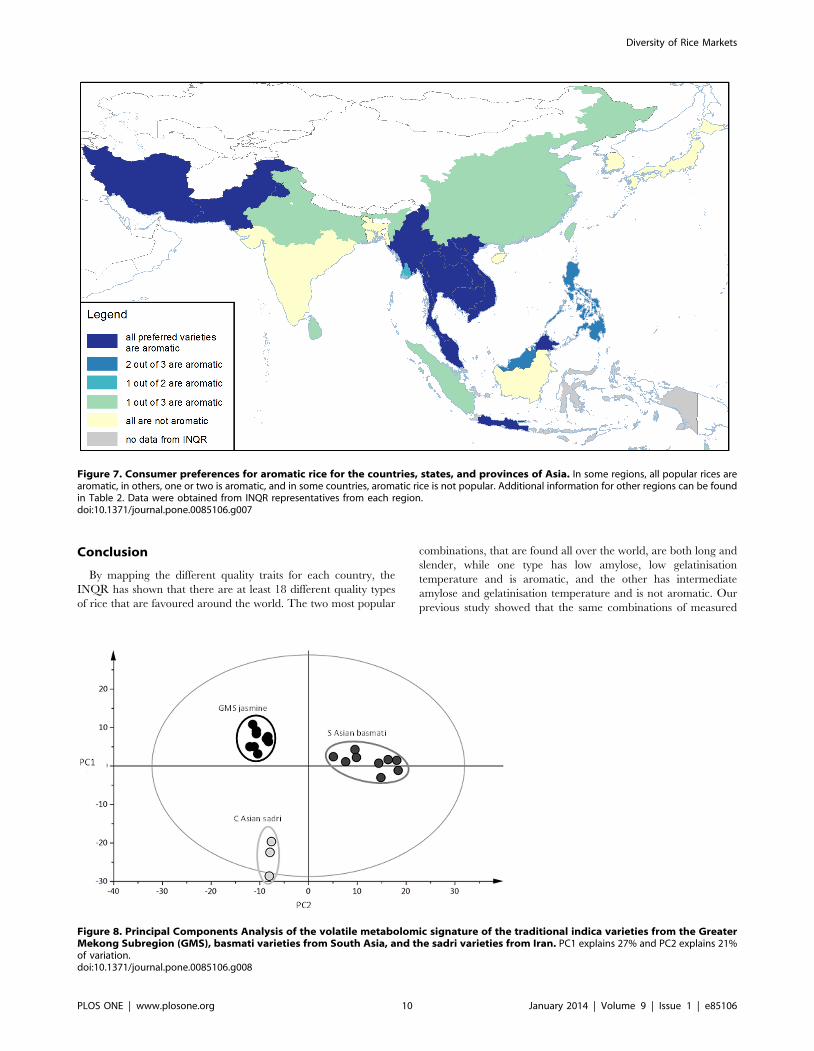
The fragrance of rice is a function of the volatile compounds
emitted from the grains. Deep analysis of a selection of the sadri
rices from Iran, the basmati rices from Pakistan, Punjab and the
jasmine rices from the GMS shows that there are distinct
differences in the volatile profile between the three germplasm
classes (Figure 8). Moreover, in a sensory analysis previously
carried out using the same popular varieties discussed here, the
sadri rices were characterised as sweet dairy, the Thai indica rices
as popcorn and the basmati as haylike [64], consistent with the
different volatile signatures observed in Figure 8.
Rice fragrance is almost always defined based on the presence of
2AP. However, Figure 8, showing the metabolomic signatures of
the varieties in this paper, and other studies working with jasmine
and basmati types [65,66] have shown that other compounds and
fragrance descriptors also contribute to the aroma of jasmine and
basmati rices. Given the importance of these three classes of rice to
Iran, Pakistan and to some states of India, and the countries in the
GMS, it seems that improving yields in those regions requires a
deeper understanding of the important compounds of fragrance
for each type, and research to deliver robust phenotyping tools
that are able to distinguish between the three types of aroma.
Grain quality combinationsUsing the information for the quality traits we currently
measure, the number of different combinations of quality were
determined (Figure 9). Immediately, the complexity of local
preference becomes evident. Based on the combinations, there
were 18 grain types found, spanning Asia, Australia, and the main
rice producing countries of Europe, Africa and the Americas. For
short grain, there are just two types of quality; for medium length
grain, there are seven types, with one type being aromatic,
represented by Pandan Wangi from Indonesia and Paw San
Hmwe from Myanmar. For the extra long grains, there is just one
type, and these are the basmati rices from Pakistan and the north-
western states of India. The highest number of combinations was
found in the long grain class (Figure 9), and five of the eight
combinations are aromatic.
Figure 9 shows that consumer preferences from several
countries are described by exactly the same combinations of grain
quality. Some of these make sense, such as the long, slender, waxy,
aromatic varieties from Isan in Thailand and Lao PDR since these
two regions spent many years together in the ancient Kingdom of
Siam. However, other common combinations cannot be explained
by common heritage. For example, BRS Primavera from Brazil
has exactly the same combinations of quality as IR64 from the
Philippines (Figure 9). However, a previous study undertaken by
the INQR included these two varieties and found that their taste,
flavour and texture differ significantly [64]. There are many such
examples in Figure 9 that can be compared in the same way. This
indicates that our suite of phenotyping tools for grain quality is
insufficient to distinguish fully the properties that consumers use to
make decisions.
Figure 4. Size exclusion chromatograms of low (A), intermedi-ate (B) and high (C) amylose varieties. Each curve is the average often different rice varieties from each end of the range in each class. Ineach class, those with high amylose are shown by the grey curves, andthose with lower amylose are shown by the black curve. Chains ofamylose elute before 14 min and amylopectin chains after 14 min.doi:10.1371/journal.pone.0085106.g004
Diversity of Rice Markets
PLOS ONE | www.plosone.org 8 January 2014 | Volume 9 | Issue 1 | e85106

Figure 5. Consumer preferences for texture based on gel consistency values. In many countries and regions, gel consistency is notmeasured (grey). Additional information for the other regions can be found in Table 2. Data obtained from INQR representatives from each region.doi:10.1371/journal.pone.0085106.g005
Figure 6. Regional variation in gelatinisation temperature of the three most popular varieties in the countries, states, andprovinces of Asia. In some regions, two classes are preferred. Additional information for other regions can be found in Table 2. Data were obtainedfrom INQR representatives from each region.doi:10.1371/journal.pone.0085106.g006
Diversity of Rice Markets
PLOS ONE | www.plosone.org 9 January 2014 | Volume 9 | Issue 1 | e85106
Conclusion
By mapping the different quality traits for each country, the
INQR has shown that there are at least 18 different quality types
of rice that are favoured around the world. The two most popular
combinations, that are found all over the world, are both long and
slender, while one type has low amylose, low gelatinisation
temperature and is aromatic, and the other has intermediate
amylose and gelatinisation temperature and is not aromatic. Our
previous study showed that the same combinations of measured
Figure 7. Consumer preferences for aromatic rice for the countries, states, and provinces of Asia. In some regions, all popular rices arearomatic, in others, one or two is aromatic, and in some countries, aromatic rice is not popular. Additional information for other regions can be foundin Table 2. Data were obtained from INQR representatives from each region.doi:10.1371/journal.pone.0085106.g007
Figure 8. Principal Components Analysis of the volatile metabolomic signature of the traditional indica varieties from the GreaterMekong Subregion (GMS), basmati varieties from South Asia, and the sadri varieties from Iran. PC1 explains 27% and PC2 explains 21%of variation.doi:10.1371/journal.pone.0085106.g008
Diversity of Rice Markets
PLOS ONE | www.plosone.org 10 January 2014 | Volume 9 | Issue 1 | e85106

quality traits are still different when eaten by consumers [64]. This
strongly indicates that quality evaluation teams are not able to
provide sufficient information to enable breeders to select for
market quality, and suggests that new science needs to be brought
to rice quality to develop new trait combinations of aroma, flavour
and texture that match market demands. This paper presents a
framework for classifying the global variation in rice grain quality,
which can be further enumerated as required, and reinforces the
need for improved objective measurement within each quality
category to capitalise on the considerable investment in variety
development and to meet better the needs of a growing population
of discerning consumers demanding high quality rice.
Supporting Information
Figure S1 Spatial units depicting level of detail of dataon preferred rice traits.
(TIF)
Table S1 Varieties nominated by each country as mostpopular.
(DOCX)
Table S2 Rice consumption per capita per country from2004 – 2009 (FAOStat 2013).(DOCX)
Acknowledgments
The authors thank the International Rice Research Institute (IRRI) and
the International Network for Quality Rice (INQR) for funding the survey
of consumer preference. MC also thanks the Monsanto Beachell-Borlaug
International Scholarship Program. RDH acknowledges additional funding
from the Netherlands Genomics Initiative. AL and AN thank the Japan
Rice Breeding Program and the CGIAR Global Rice Science Partnership
(GRiSP).
The boundaries, colours, denominations, and other information shown
on any map in this work do not imply any judgment on the part of IRRI
concerning the legal status of any territory or the endorsement or
acceptance of such boundaries.
Author Contributions
Conceived and designed the experiments: MF MC. Performed the
experiments: All. Analyzed the data: MC MF AL AN. Contributed
reagents/materials/analysis tools: AL AN VD JC MF AR. Wrote the
paper: MF MC RH RR TU.
References
1. Lee J-W, Hong K (2012) Economic growth in Asia: Determinants and prospects.
Japan and the World Economy 24: 101–113.
2. FAO WaI (2012) The State of Food Insecurity in the World 2012. Economic
growth is necessary but not sufficient to accelerate reduction of hunger and
malnutrition.. Rome FAO.
3. Government A (2012) Australia in the Asian Century.
4. ADB (2012) Food Security and Poverty in Asia Pacific: Key Challenges and
Policy Issues. Philippines: Asian Development Bank.
5. ANZ (2012) Greener Pastures: The global soft commodity opportunity for
Australia and New Zealand. 80 p.
6. Foundation TG (2012) Feeding Asia and the World’ Australia has the potential
to be a global food superpower.
7. Stern N (2006) The Economics of Climate Change, The Stern Review. In:
Office of Climate Change BG, editor: Cambridge. pp. 700.
8. Pingali P (2007) Westernization of Asian diets and the transformation of food
systems: Implications for research and policy. Food Policy 32: 281–298.
9. Mohanty S (2013) Trends in Global Rice Production. Rice Today 13: 44–45.
10. Supakornchuwong C, Suwannaporn P (2012) Attitudes toward rice compared
with potatoes and pasta among british, french, dutch and belgian consumers.
Journal of Sensory Studies 27: 71–77.
Figure 9. Number of different quality types in each grain length class based on combinations of the current tools for measuringquality: grain length (blue), shape, amylose content (red), gelatinisation temperature (green), and the presence of aroma.doi:10.1371/journal.pone.0085106.g009
Diversity of Rice Markets
PLOS ONE | www.plosone.org 11 January 2014 | Volume 9 | Issue 1 | e85106

11. Suwannaporn P, Linnemann A, Chaveesuk R (2008) Consumer preference
mapping for rice product concepts. British Food Journal 110: 595–606.
12. Fitzgerald MA, McCouch SR, Hall RD (2009) Not just a grain of rice: the quest
for quality. Trends in Plant Science 14: 133–139.
13. Boualaphanh C, Daygon VD, Calingacion MN, Sanitchon J, Jothityangkoon D,et al. (2011) Use of New Generation Single Nucleotide Polymorphism
Genotyping for Rapid Development of Near-Isogenic Lines in Rice. Crop Sci51: 2067–2073.
14. Tomlins KI, Manful JT, Larwer P, Hammond L (2005) Urban consumer
preferences and sensory evaluation of locally produced and imported rice inWest Africa. Food Quality and Preference 16: 79–89.
15. Rachmat R, Thahir R, Gummert M (2006) The empirical relationship betweenprice and quality of rice at market level in West Java. Indonesian Journal of
Agricultural Science 7: 27–33.
16. Musa M, Othman N, Fatah FA (2011) Determinants of Consumers PurchasingBehavior for Rice in Malaysia. American International Journal of Contempo-
rary Research 1 159–167.
17. Minten B, Murshid KAS, Reardon T (2013) Food Quality Changes and
Implications: Evidence from the Rice Value Chain of Bangladesh. WorldDevelopment 42: 100–113.
18. Diako C, Sakyi-Dawson E, Bediako-Amoa B, Saalia FK, Manful JT (2010)
Consumer Perceptions, Knowledge and Preferences for Aromatic Rice Types inGhana
19. Azabagaoglu MO, Gaytancioglu O (2009) Analyzing consumer preferences todifferent rice varieties in Turkey. Agricultura Tropica Et Subtropica 42: 118–
125.
20. Anang BT, Adjetey SNA, Abiriwe SA (2011) Consumer preferences for ricequality characteristics and the effects on price in the Tamale metropolis,
northern region, Ghana. International Journal of AgriScience 1: 67–74.
21. Abazari A, Mojaverian S-M, Hosseini-Yekani S-A (2012) Effective Factors on
Rice Consumers’ Preferences: A Case Study of Urban Consumers in
Mazandaran Province of Iran. American Journal of Scientific Research 70–79.
22. Khush GS, Paule CM, de la Cruz N. Rice grain quality evaluation and
improvement at IRRI; 1979; Los Banos. International Rice Research Institute.pp. 22–31.
23. Juliano BO (1985) Criteria and Tests for Rice Grain Qualities. In: Juliano BO,
editor. Rice Chemistry and Technology. 2nd ed. St. Paul, MN: AmericanAssociation of Cereal Chemists, Inc,. pp. 43–524.
24. Commission E (2003) Council Regulation (EC) No 1785/2003 on the commonorganisation of the market in rice. Official Journal of the European Union: 1–18.
25. FAOSTAT (2013). www.faostat.fao.org
26. International Organization for Standardization (2011) ISO/DIS 6647-2: 2011–Rice—Determination of amylose content—Part 2: Routine methods. 10.
27. Ward RM, Gao Q, de Bruyn H, Gilbert RG, Fitzgerald MA (2006) ImprovedMethods for the Structural Analysis of the Amylose-Rich Fraction from Rice
Flour. Biomacromolecules 7: 866–876.
28. Virk PS, Ford-Lloyd BV, Jackson MT, Newbury HJ (1995) Use of RAPD for the
study of diversity within plant germplasm collections. Heredity 74: 170–179.
29. Rozen S, Skaletsky H (1999) Primer3 on the WWW for General Users and forBiologist Programmers. In: Misener S, Krawetz S, editors. Bioinformatics
Methods and Protocols: Humana Press. pp. 365–386.
30. Hall TA (1999) BioEdit: a user-friendly biological sequence alignment editor and
analysis program for Windows 95/98/NT. Nucleic Acid Symposium Series no
41: Oxford University Press.
31. Ware DH, Jaiswal P, Ni J, Yap IV, Pan X, et al. (2002) Gramene, a Tool for
Grass Genomics. Plant Physiology 130: 1606–1613.
32. Cuevas RP, Daygon VD, Corpuz HM, Reinke RF, Waters DLE, et al. (2010)
Melting the secrets of gelatinisation temperature in rice. Functional Plant
Biology 37: 439–447.
33. Little R, Hilder G, Dawson E (1958) Differential effect of dilute alkali on 25
varieties of milled white rice. Cereal Chemistry Journal 35.
34. Cagampang GB, Perez CM, Juliano BO (1973) A gel consistency test for eating
quality in rice. Journal of the Science of Food and Agriculture 24: 1589–1594.
35. Fitzgerald MA, Sackville Hamilton NR, Calingacion MN, Verhoeven HA,Butardo VM (2008) Is there a second fragrance gene in rice? Plant
Biotechnology Journal 6: 416–423.
36. Calingacion M, Boualaphanh C, Daygon V, Anacleto R, Sackville Hamilton R,
et al. (2012) A genomics and multi-platform metabolomics approach to identify
new traits of rice quality in traditional and improved varieties. Metabolomics 8:771–783.
37. Lommen A, Kools H (2012) MetAlign 3.0: performance enhancement byefficient use of advances in computer hardware. Metabolomics 8: 719–726.
38. Tikunov Y, Laptenok S, Hall R, Bovy A, de Vos R (2012) MSClust: a tool forunsupervised mass spectra extraction of chromatography-mass spectrometry ion-
wise aligned data. Metabolomics 8: 714–718.
39. Fitzgerald MA (2010) Cereal grains. Rice: characteristics and qualityrequirements. Woodhead Publishing Series in Food Science, Technology and
Nutrition. pp. 212–236.
40. Zhao X, Fitzgerald M (2013) Climate Change: Implications for the Yield of
Edible Rice. PLoS ONE 8: e66218.41. Fitzgerald MA, Bergman CJ, Resurreccion AP, Moller J, Jimenez R, et al. (2009)
Addressing the dilemmas of measuring amylose in rice. Cereal Chemistry 86:
492–498.42. Tran N, A, Daygon V, D, Resurreccion A, Cuevas R, P,, Corpuz H, et al. (2011)
A single nucleotide polymorphism on the Waxy gene explains gel consistency.Theoretical & Applied Genetics 123: 519–525.
43. Umemoto T, Horibata T, Aoki N, Hiratsuka M, Yano M, et al. (2008) Effects of
variations in starch synthase on starch properties and eating quality of rice. PlantProduction Science 11: 472–480.
44. Huang R, Jiang L, Zheng J, Wang T, Wang H, et al. (2012) Genetic bases of ricegrain shape: so many genes, so little known. Trends in Plant Science.
45. Fan C, Xing Y, Mao H, Lu T, Han B, et al. (2006) GS3, a major QTL for grainlength and weight and minor QTL for grain width and thickness in rice, encodes
a putative transmembrane protein. TAG Theoretical and Applied Genetics 112:
1164–1171.46. Fan CC, Yu SB, Wang CR, Xing YZ (2009) A causal C-A mutation in the
second exon of GS3 highly associated with rice grain length and validated as afunctional marker. Theoretical and Applied Genetics 118: 465–472.
47. Takano-Kai N, Jiang H, Kubo T, Sweeney M, Matsumoto T, et al. (2009)
Evolutionary History of GS3, a Gene Conferring Grain Length in Rice.Genetics, 182 182: 1323–1334.
48. Zhang X, Wang J, Huang J, Lan H, Wang C, et al. (2012) Rare allele ofOsPPKL1 associated with grain length causes extra-large grain and a significant
yield increase in rice. Proceedings of the National Academy of Sciences of theUnited States of America 109: 21534–21539.
49. Sano Y (1984) Differential regulation of waxy gene expression in rice
endosperm. Theoret Appl Genetics 68: 467–473.50. Smith AM, Denyer K, Martin C (1997) The synthesis of the starch granule.
Annu Rev Plant Physiol Plant Mol Biol 48: 67–87.51. Ayres NM, McClung AM, Larkin PD, Bligh HFJ, Jones CA, et al. (1997)
Microsatellites and a single-nucleotide polymorphism differentiate apparenta-
mylose classes in an extended pedigree of US rice germ plasm. Theor ApplGenet 94: 773–781.
52. Chen M-H, Bergman C, Pinson S, Fjellstrom R (2008) Waxy gene haplotypes:Associations with apparent amylose content and the effect by the environment in
an international rice germplasm collection. Journal of Cereal Science 47: 536–545.
53. Mikami I, Uwatoko N, Ikeda Y, Yamaguchi J, Hirano HY, et al. (2008) Allelic
diversification at the wx locus in landraces of Asian rice. 116: 979–989.54. Wanchana S, Toojinda T, Tragoonrung S, Vanavichit A (2003) Duplicated
coding sequence in the waxy allele of tropical glutinous rice (Oryza sativa L.).Plant Science 165: 1193–1199.
55. Cuevas R, P,, Fitzgerald M (2012) Genetics of Rice Quality. In: Junjicic S,
editor. Genetic Diversity. Rijeka, Croatia: In-Tech.56. Larkin PD, Park WD (2003) Association of waxy gene single nucleotide
polymorphisms with starch characteristics in rice (Oryza sativa L.). MolecularBreeding 12: 335–339.
57. Slade L, Levine H (1989) A food polymer science approach to selected aspects ofstarch gelatinization and retrogradation. In: Millane R, BeMiller JN,
Chandrasekaran R, editors. Frontiers in Carbohydrate Research 1 Food
Applications. London: Elsevier. pp. 215–270.58. Waters DLE, Henry RJ, Reinke RF, Fitzgerald MA (2006) Gelatinization
temperature of rice explained by polymorphisms in starch synthase. PlantBiotechnology Journal 4: 115–122.
59. Umemoto T, Yano M, Satoh H, Shomura A, Nakamura Y (2002) Mapping of a
gene responsible for the difference in amylopectin structure between japonica-type and indica-type rice varieties. Theoretical and Applied Genetics 104: 1–8.
60. Bao J-S, Corke H, Sun M (2006) Nucleotide diversity in starch synthase IIa andvalidation of single nucleotide polymorphisms in relation to starch gelatinization
temperature and other physicochemical properties in rice (Oryza sativa L.).
Theoretical and Applied Genetics 113: 1171–1183.61. Umemoto T, Aoki N (2005) Single-nucleotide polymorphisms in rice starch
synthase IIa that alter starch gelatinisation and starch association of the enzyme.Functional Plant Biology 32: 763–768.
62. Buttery RG, Ling LC, Juliano BO, Turnbaugh JG (1983) Cooked rice aromaand 2-acetyl-1-pyrroline. Journal of Agricultural and Food Chemistry 31: 823–
826.
63. Courtois B, Frouin J, Greco R, Bruschi G, Droc G, et al. (2012) GeneticDiversity and Population Structure in a European Collection of Rice. Crop Sci
52: 1663–1675.64. Champagne ET, Bett-Garber KL, Fitzgerald MA, Grimm CC, Lea J, et al.
(2010) Important Sensory Properties Differentiating Premium Rice Varieties.
Rice 3: 270–281.65. Limpawattana M, Shewfelt RL (2010) Flavor Lexicon for Sensory Descriptive
Profiling of Different Rice Types. Journal of Food Science 75: S199–S205.66. Bryant RJ, McClung AM (2011) Volatile profiles of aromatic and non-aromatic
rice cultivars using SPME/GC–MS. Food Chemistry 124: 501–513.
Diversity of Rice Markets
PLOS ONE | www.plosone.org 12 January 2014 | Volume 9 | Issue 1 | e85106