Representativeness and efficiency of bird and insect conservation in Norwegian boreal forest reserve
11
101 Conservation Biology, Pages 101–111 Volume 11, No. 1, February 1997 Representativeness and Efficiency of Bird and Insect Conservation in Norwegian Boreal Forest Reserves JOGEIR N. STOKLAND University of Oslo, Department of Biology, Division of Zoology, P.O. Box 1050–Blindern, N–0316 Oslo, Norway, email [email protected] Abstract: I quantified local species richness of birds in different forest types and of beetles in spruce forests at different altitudes. In both cases I quantified timber production as a measure of land acquisition cost and used the ratio between the species richness and timber production as a measure of conservation cost-effi- ciency. I found a positive correlation between timber production and local species richness of birds as well as beetles, indicating that the forests most valuable for forestry are also the ones most valuable for biodiversity conservation. I used different selection procedures for combining sites in a reserve network to find the mini- mum set of sites that included all vulnerable species. The minimum set of sites for birds was 30% spruce for- est, 30% pine forest, and 40% broad-leaved forest (the three main forest types). The minimum set of sites for the beetles was uniformly distributed along the altitudinal gradient. Both minimum sets were most cost-effi- cient for species conservation. I suggest that equal coverage of different productivity classes is more efficient for optimizing biodiversity conservation than over-representing low productivity sites. Less than 1% of Norwe- gian boreal forests have been protected as nature reserves. The reserve network is fairly representative with respect to altitude, but it is seriously skewed toward low productivity sites. The current network is suboptimal with respect to forest type representativeness, species protection, and cost-efficiency. This is a result of an inef- ficient strategy of selecting reserve sites and an unfortunate combination of selection criteria. Representatividad y Eficiencia en la Conservación de Aves e Insectos en las Reservas de Bosque Boreal de Noruega Resumen: Se cuantificó la riqueza local de especies de aves en diferentes tipos de bosques y la riqueza de coleópteros en bosques de coníferas a diferentes altitudes. En ambos casos, se cuantificó la producción made- rera como una medidad del costo de adquisición de la tierra, así mismo se utilizó la relación entre la riqueza de las especies y y la producción maderera como una estimación de conservación costo-eficiencia. Se encon- tró una correlación positiva entre la producción maderera y la riqueza local de especies de aves y coleópteros, indicando que los bosques más valiosos para actividades forestales, lo son también para conser- vación de la biodiversidad. Se utilizaron diferentes procedimientos de selección para combinar sitios en una red de reservas para encontrar el mínimo juego de sitios que incluyeraon especies vulnerables. El mínimo juego de sitios para aves fue 30% de bosque de Picea, 30% de Pinar y 40% de bosque caducifolio (los tres tipos de bosques mas importantes). El mínimo juego de sitios para coleópteros se encontró uniformemente dis- tribuído a lo largo de un gradiente altitudinal. Se sugiere que una cobertura igual de las diferentes clases pro- ductivas es mas eficiente en la optimización de la conservación de la biodiversidad que cuando se sobre-rep- resentan sitios de baja productividad. Menos del 1% de los bosques boreales de Noruega han sido protegidos como reservas de la naturaleza. La red de reservas es razonablemente representativa con respecto a la alti- tud, pero se encuentra seriamente sesgada hacia sitios de baja productividad. La actual red no es óptima con respecto a tipos de bosque representados, protección de especies y costo-eficiencia. Esto es resultado de una in- eficiente estrategia en la selección de sitios de reserva y a una desafortunada combinación de criterios de se- lección. Paper submitted March 8, 1995; revised manuscript accepted December 19, 1995.
-
Upload
independent -
Category
Documents
-
view
1 -
download
0
Transcript of Representativeness and efficiency of bird and insect conservation in Norwegian boreal forest reserve
101
Conservation Biology, Pages 101–111Volume 11, No. 1, February 1997
Representativeness and Efficiency of Bird and Insect Conservation in Norwegian Boreal Forest Reserves
JOGEIR N. STOKLAND
University of Oslo, Department of Biology, Division of Zoology, P.O. Box 1050–Blindern, N–0316 Oslo, Norway, email [email protected]
Abstract:
I quantified local species richness of birds in different forest types and of beetles in spruce forests atdifferent altitudes. In both cases I quantified timber production as a measure of land acquisition cost andused the ratio between the species richness and timber production as a measure of conservation cost-effi-ciency. I found a positive correlation between timber production and local species richness of birds as well asbeetles, indicating that the forests most valuable for forestry are also the ones most valuable for biodiversityconservation. I used different selection procedures for combining sites in a reserve network to find the mini-mum set of sites that included all vulnerable species. The minimum set of sites for birds was 30% spruce for-est, 30% pine forest, and 40% broad-leaved forest (the three main forest types). The minimum set of sites forthe beetles was uniformly distributed along the altitudinal gradient. Both minimum sets were most cost-effi-cient for species conservation. I suggest that equal coverage of different productivity classes is more efficientfor optimizing biodiversity conservation than over-representing low productivity sites. Less than 1% of Norwe-gian boreal forests have been protected as nature reserves. The reserve network is fairly representative withrespect to altitude, but it is seriously skewed toward low productivity sites. The current network is suboptimalwith respect to forest type representativeness, species protection, and cost-efficiency. This is a result of an inef-ficient strategy of selecting reserve sites and an unfortunate combination of selection criteria.
Representatividad y Eficiencia en la Conservación de Aves e Insectos en las Reservas de Bosque Boreal de Noruega
Resumen:
Se cuantificó la riqueza local de especies de aves en diferentes tipos de bosques y la riqueza decoleópteros en bosques de coníferas a diferentes altitudes. En ambos casos, se cuantificó la producción made-rera como una medidad del costo de adquisición de la tierra, así mismo se utilizó la relación entre la riquezade las especies y y la producción maderera como una estimación de conservación costo-eficiencia. Se encon-tró una correlación positiva entre la producción maderera y la riqueza local de especies de aves ycoleópteros, indicando que los bosques más valiosos para actividades forestales, lo son también para conser-vación de la biodiversidad. Se utilizaron diferentes procedimientos de selección para combinar sitios en unared de reservas para encontrar el mínimo juego de sitios que incluyeraon especies vulnerables. El mínimojuego de sitios para aves fue 30% de bosque de Picea, 30% de Pinar y 40% de bosque caducifolio (los tres tiposde bosques mas importantes). El mínimo juego de sitios para coleópteros se encontró uniformemente dis-tribuído a lo largo de un gradiente altitudinal. Se sugiere que una cobertura igual de las diferentes clases pro-ductivas es mas eficiente en la optimización de la conservación de la biodiversidad que cuando se sobre-rep-resentan sitios de baja productividad. Menos del 1% de los bosques boreales de Noruega han sido protegidoscomo reservas de la naturaleza. La red de reservas es razonablemente representativa con respecto a la alti-tud, pero se encuentra seriamente sesgada hacia sitios de baja productividad. La actual red no es óptima conrespecto a tipos de bosque representados, protección de especies y costo-eficiencia. Esto es resultado de una in-eficiente estrategia en la selección de sitios de reserva y a una desafortunada combinación de criterios de se-
lección.
Paper submitted March 8, 1995; revised manuscript accepted December 19, 1995.

102
Efficiency of Bird and Insect Conservation Stokland
Conservation BiologyVolume 11, No. 1, February 1997
Introduction
Creation of nature reserves is an important measure forstemming the accelerating extinction of species anddegradation of natural habitats. Assessing effectivenessof alternative reserve networks has recently become anarea of active research, and key topics include selectingcomplementary sites, identifying minimum sets, and de-signing spatial configurations for efficient species con-servation (Bedward et al. 1992; Pressey et al. 1993). Thecost of reserves for alternative land uses, which I con-sider here, has been addressed several times but hasbeen only superficially investigated beyond consideringcost as proportional to reserve area.
The challenge of identifying a minimum set of sitesrepresenting maximum biological diversity was over-shadowed during the SLOSS (single large or several smallreserves) debate, which focused on extreme combina-tions of refuge numbers and areas in nature reserve de-sign (e.g., Diamond 1975; Simberloff & Abele 1976;Whitcomb et al. 1976; Margules et al. 1982). Simberloffand Abele (1982) concluded that the theory of islandbiogeography gives no clear recommendation with re-spect to few large or many small refuges. Recently, Lo-molino (1994) summarized that most empirical studiestend to show that higher species richness occurs in ac-cumulations of small reserves. Lomolino further showedthat accumulation from small to large refuges, as well asfrom large to small refuges, was inferior in maximizingspecies richness compared to the best combination ofreserves found by an exhaustive sampling of several setsof candidate reserves.
An alternative approach to reserve network designemphasizes the need to cover the maximum variation ofnatural features prior to considering reserve size andnumbers (Kirkpatrick 1983; Margules et al. 1988; Pres-sey & Nicholls 1989
a
). This approach has developednew selection methods that put together highly comple-mentary sites that represent the feature variation in aminimum or near minimum set of sites (Pressey et al.1993). In empirical studies natural features have beenland type attributes and plant communities (Purdie &Blick 1986; Pressey & Nicholls 1989
b
), species lists(Kirkpatrick 1983; Margules & Stein 1989; Rebelo &Siegfried 1992; Sætersdal et al. 1993), or a combinationof the two (Margules et al. 1988). This approach hasshown to be far more efficient in selecting representa-tive reserve networks than traditional ranking proce-dures, which tend to duplicate similar sites (Pressey &Nicholls 1989
a
; Sætersdal et al. 1993).The motivation for identifying minimum networks
that maximize biological diversity is the political or eco-nomic (often ill-defined) limits in setting aside areas forconservation purposes. Bedward et al. (1992) arguedthat the cost of networks should preferably reflect op-portunity costs for alternative land use, but they were
unable to explore this beyond network area due to inac-cessible data. The opportunity cost is particularly rele-vant in forest ecosystems because timber productionvaries greatly from less productive to highly productivesites. In Scandinavia timber production varies by a factorof 10, and productivity also imposes marked patterns indiversity of most species groups. This has important im-plications for strategies aimed at providing a balance be-tween logging and conservation. A Norwegian forest re-serve plan has currently been launched in which siteshave been selected on the basis of a ranking procedure.I assess alternatives using updated selection procedures,and I quantify the efficiency of alternative networks byusing the ratio between cumulated species richness andtotal potential timber production in the networks.
Methods
Study Area and Forest Conservation
The study was conducted in southeastern Norway, a re-gion of 40,500 km
2
and 60% of the productive forests inNorway (Tomter 1993). Most of the area is boreal forest,but hemiboreal forests comprise a transition zone to asmall amount of nemoral forest in the south. The conifer-ous tree line in the region varies between 900 and 950 m,above which there is a 50 to 100–m belt of sub-alpinebirch forest. The region is dominated by low and mediumproductive forests (Fig. 1b). About 50% of the productiveforest area is dominated by spruce, 40% by pine, andslightly more than 10% by deciduous (hardwood) forest.The proportion of deciduous forest decreases to 5.4% inmature forests (logging class V; Tomter 1993). Borealforest productivity is primarily determined by the lengthof the growing season (closely correlating with altitudeand latitude) and the soil supply of water and nutrition(both reflected by the vegetation). Because the latitudi-nal scope of this study was quite narrow, forest produc-
Figure 1. Altitudinal distribution of the total forest area and the forest reserve network in southeastern Norway (a), and the proportion of total forest area and the forest reserve network in southeastern Nor-way in three forest productivity classes (b).

Conservation BiologyVolume 11, No. 1, February 1997
Stokland Efficiency of Bird and Insect Conservation
103
tivity is primarily a result of altitude and vegetation type(Fig. 2).
Clear-felling has commonly been the adopted loggingmethod in Norway for the past 50 years. The logging his-tory is, however, several hundred years old, and todayonly 0.6% of the productive forest area is older than 160years (Tomter 1993). During 1990–1994 the Norwegianreserve network was extended to cover 0.9% of the pro-ductive forest area, and it comprises 152 km
2
boreal for-est and 3–4 km
2
nemoral forest in southeastern Norway(Haugen 1991; I. Haugen personal communication). Thenetwork is fairly representative with respect to altitude,although there is a slight under-representation of areasbelow 200 m and a slight over-representation above 500 m(Fig. 1a). There is, however, a serious skew toward re-serves of low productivity and a corresponding under-representation of highly productive areas (Fig. 1b). Dataon tree composition are currently available for abouthalf of the reserve area. This information indicates thatspruce forests are somewhat over-represented and pineforests somewhat under-represented, whereas the pro-portion of deciduous forest is about 5% in the reserves.
Species and Forest Data
Data on birds and beetles were collected from sites inthe boreal and hemiboreal part of the region. Birds werecensused at 40 sites stratified in different types of ma-ture forest stands using 36–ha plots. The sites, purposelyselected to cover all tree species compositions, were dis-tributed between 40 to 600 m above sea level. Becausethe tree composition varied internally in some census
sites, I divided each census plot into subplots of 4 ha toachieve more homogenous units when I related localspecies richness to tree composition and altitude. Ineach subplot I recorded the vegetation type and the soildepth at eight different points. Altogether, I encoun-tered 56 species or 84% of all boreal forest birds insoutheastern Norway (omitting nocturnal species). I de-fined a subset of 32 species, which were more or lessconfined to mature forest, as potentially vulnerable toforestry (hereafter referred to as vulnerable species).This set should not be confused with red-listed species(although a few of the species are red-listed) because itincludes all woodpeckers and tits, of which several arequite common. These species have experienced exten-sive habitat loss due to forestry, and population declineis documented for several of these species in Finland(Järvinen & Väisänen 1977; Väisänen et al. 1986).
I collected beetles using 10 window traps in 0.5–haplots at 17 different sites in mature or old-growth myrtil-lus type spruce forest at elevations from 150 to 870 m(i.e., all forested altitudes). A total of 309 species wascollected, which is 10%–20% of the forest dwelling bee-tle species in Norway. I defined a subset of 91 species aspotentially vulnerable to forestry (referred to as vulnera-ble species). These species need medium to very de-cayed wood for fulfilling their life-cycle. Like the vulner-able bird species, several beetle species are quitecommon. The forestry is nevertheless removing a sub-stantial part of their habitat when trees are logged andtaken away instead of being allowed to go through thedecay process in the forest.
I calculated forest productivity in the bird census plotsand at the beetle trapping sites from altitude, vegetationtype, and soil depth using regression equations devel-oped by Nilsen and Larsson (1992). Annual timber pro-duction was further calculated from Tveite and Braastad(1981) who showed the empirical relationship betweenproductivity and timber production when optimal log-ging is adopted. For birds I calculated the timber pro-duction for each census plot, and for beetles I calculatedthe timber production per hectare at the sample site.
Reserve Selection Methods
Research on reserve selection has developed severalmethods for maximizing the natural variation in reservenetworks. The ultimate purpose of such methods is toassist applied conservation work, and they should betested on several data sets to evaluate their efficiency. Ihave tested the performance of three methods:
•
Iterative selection is a stepwise procedure in which allunselected sites are examined and the one which addsmost new features is chosen each time a new site is in-cluded in the network (Kirkpatrick 1983; Margules etal. 1988). Note that many site combinations remain
Figure 2. Timber production in relation to altitude and forest understory vegetation in southeastern Nor-way. The dark-shaded vegetation type was used in the elevation study of beetle species. Blank cells indicate missing data (Source: Anonymous 1981).

104
Efficiency of Bird and Insect Conservation Stokland
Conservation BiologyVolume 11, No. 1, February 1997
unexamined when using this method because se-lected sites are not later dropped out in favor of oth-ers. There are several variations of the iterative selec-tion method (see Pressey et al. 1993 for a review), andthe features used as criteria may be land type at-tributes (including plant communities) as well as spe-cies lists. Thus, the approach strongly emphasizescomplimentarity among the selected sites. I used thenumber of (1) all new species and (2) new vulnerablespecies as reserve selection criteria. In cases of tied al-ternatives at a step (i.e., several sites with the samenumber of new species), the site with the highest spe-cies richness was selected.
•
Constrained selection is an approach that maximizesfeature variation among the selected sites under theconstraint that total area (or acquisition cost) shouldnot exceed an upper limit. In addition, all site combi-nations are examined, ensuring that the true optimal isfound. This approach was first introduced in reserveselection by Cocks and Baird (1989) who adopted thetechnique of integer programming. I used an analo-gous algorithm that runs through all possible combina-tions of sites and picks out the most species rich com-bination of sites in sets from one to
n
sites. Each runwas subjected to the constraint that total timber pro-duction (reflecting acquisition cost) should not ex-ceed a user-specified upper level. Thus, a series of sev-eral runs produced an array of maximum cumulatedspecies richness attainable at each constraint level.
•
Ecological coverage selection is a novel approach thatfacilitates site selection based on site features in orderto cover or represent an ecological gradient (e.g., alti-tude) in a pre-determined manner. This enables com-parisons of one gradient coverage with alternative,presumably better, coverages. A target attribute deter-mines the position of candidate sites along the gradi-ent, and the sites are split in two groups with values ofthe attribute above and below a chosen target value. Aset of
n
sites is established by random selection ofsites from the two groups such that the resulting aver-age of the target attribute ends up near the chosen tar-get value. The cumulated species richness is calcu-lated for 100 replicated sets and averaged over thesereplicates. This process is carried out for different setsizes. The procedure also allows selection from one ofthe two groups. As the target attributes in this study, Ichose the percentage of deciduous trees for birds andaltitude for the beetles.
I assessed the performance of the three selectionmethods by using a simple efficiency index. The imple-mentation cost of a reserve network, in terms of acquisi-tion cost or lost logging opportunity (income), is pro-portional to the accumulated timber production for theselected set of sites:
P
5
∑
area (i)
3
production (i),
where i denotes the sites. Referring to R as the cumu-lated species richness in a selected set, I used R/P or“richness-to-production ratio” as an index to measurethe conservation cost-efficiency of single sites as well asfor sets of several sites.
Throughout, I have used the term
cumulated speciesrichness
for overall species richness in a reserve net-work comprising several sites and
local species richness
for species richness of the individual sites.
Results
Forest Productivity and Local Species Richness
The local bird species richness increased significantly withhigher proportion of deciduous trees (Fig. 3a,
p
decid.
,
0.001, two-way ANOVA). In deciduous forests the speciesrichness decreased with increasing elevation, whereas co-niferous forests (less than 40% deciduous trees) had simi-lar species richnesses at different altitudes (Fig. 3a,
p
,
0.01, interaction term in two-way ANOVA). There is a sys-tematic relationship between ground vegetation and treecomposition, and high proportions of deciduous treesalso indicate more productive sites. The local speciesrichness to timber production ratio was fairly similar formost forest types and altitudes, but it increased at higherelevations in coniferous forests (Fig. 3c,
p
decid.
,
0.001,
p
elev.
,
0.05, two-way ANOVA). The ratio increased be-
Figure 3. Species richness of all bird species (a) and vulnerable bird species (b) in subplots of 4 ha in forests with different proportions of deciduous trees (0–100%) in three altitude intervals (0–200 m, 201–400 m, 401–600 m) (error bars indicate SD), and the corre-sponding ratios between species richness and timber production (c) and (d) (numbers above columns indi-cate number of subplots).

Conservation BiologyVolume 11, No. 1, February 1997
Stokland Efficiency of Bird and Insect Conservation
105
cause species richness did not change with altitude,whereas the timber production decreased. In deciduousforests the local species richness and timber productiondecreased more or less in parallel with increasing altitudeand the ratio remained stable. This general pattern wasalso found among the vulnerable birds (Fig. 3d,
p
decid.
,
0.01,
p
elev.
5
0.07, two-way ANOVA).For beetles the local species richness was highest at low
and intermediate altitudes (Fig. 4a,
p
,
0.05, ANOVA).This tendency was even more pronounced for the vulnera-ble species (Fig. 4a,
p
,
0.001, ANOVA). Although the spe-cies richness decreased with increasing altitude, the rich-ness-to-production ratio seemed to increase (Fig. 4b,
p
5
0.07, ANOVA) because timber production de-creased more rapidly. The species richness of the vul-nerable species decreased more or less in parallel withtimber production, and their richness-to-production ra-
tio remained fairly stable with increasing altitude (Fig.4b, NS, ANOVA).
Maximizing Species Richness in Multiple Sites
There are clear patterns in local species richness andspecies turnover along forest gradients. I used iterativeselection to find the combination of forest habitats thatmaximized the cumulated species richness in a mini-mum set of sites. This was done for all species includingvulnerable species.
When I selected sites to cumulate the total bird speciesrichness in a minimum set, all species were encounteredin 14 out of 40 sites (Fig. 5a). The tree composition in theselected sites rapidly stabilized to around 35% spruceand deciduous trees and about 30% pine (Fig. 5c). Therewas no altitudinal skew among the selected sites. Theaverage timber production in the selected sites was 141m
3
/year compared to 110 m
3
/year in the remaining 26sites, but the difference was not statistically significant(Mann-Whitney U-test). All vulnerable bird species wereencountered in a minimum set of 11 sites (Fig. 5b). Inthese the tree composition was quite similar to thatwhich maximized total species richness, but the propor-tion of deciduous trees was perhaps slightly higher (Fig.5d). The average production in selected and non-selected sites was 4.1 and 3.1 m
3
/ha/year, respectively(
p
,
0.1, Mann-Whitney U-test). The accumulation of to-tal species richness was almost as good as when the siteswere selected on the basis of vulnerable species. Fromthe sixth site the selection based on vulnerable species
Figure 4. Local species richness of all beetle species and vulnerable beetle species in spruce forest in three altitude intervals (a) (error bars indicate SD), and the corresponding ratios between species richness and timber production (b) (sites are identical to those in a).
Figure 5. The cumulated number of bird species in 14 out of 40 sites chosen with the iterative selection method (a), and the running average in tree composi-tion of these sites (c). The cumulated number of vul-nerable bird species in 11 out of 40 sites chosen with the iterative selection method (b), and the correspond-ing tree composition of these sites (d).
106
Efficiency of Bird and Insect Conservation Stokland
Conservation BiologyVolume 11, No. 1, February 1997
performed exactly as well for total species richness aswhen total species richness itself was maximized. Thereverse was also true. All vulnerable species were en-countered from the thirteenth site when the sites wereselected on the basis of all new species.
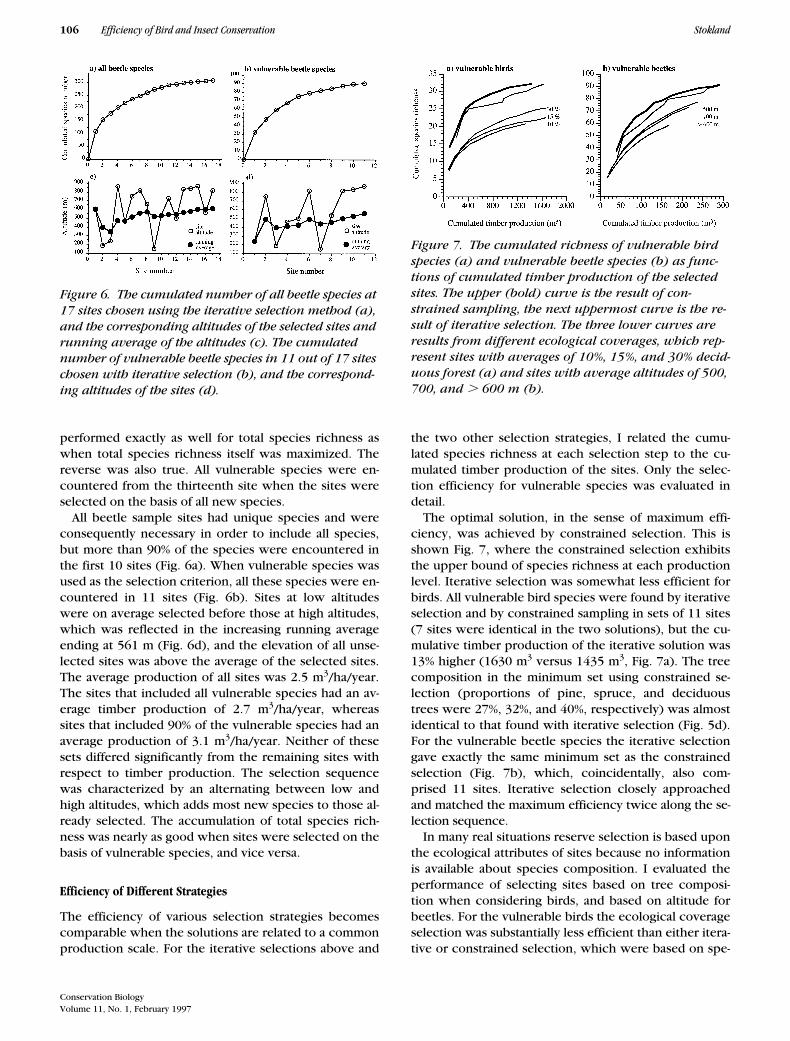
All beetle sample sites had unique species and wereconsequently necessary in order to include all species,but more than 90% of the species were encountered inthe first 10 sites (Fig. 6a). When vulnerable species wasused as the selection criterion, all these species were en-countered in 11 sites (Fig. 6b). Sites at low altitudeswere on average selected before those at high altitudes,which was reflected in the increasing running averageending at 561 m (Fig. 6d), and the elevation of all unse-lected sites was above the average of the selected sites.The average production of all sites was 2.5 m
3
/ha/year.The sites that included all vulnerable species had an av-erage timber production of 2.7 m
3
/ha/year, whereassites that included 90% of the vulnerable species had anaverage production of 3.1 m
3
/ha/year. Neither of thesesets differed significantly from the remaining sites withrespect to timber production. The selection sequencewas characterized by an alternating between low andhigh altitudes, which adds most new species to those al-ready selected. The accumulation of total species rich-ness was nearly as good when sites were selected on thebasis of vulnerable species, and vice versa.
Efficiency of Different Strategies
The efficiency of various selection strategies becomescomparable when the solutions are related to a commonproduction scale. For the iterative selections above and
the two other selection strategies, I related the cumu-lated species richness at each selection step to the cu-mulated timber production of the sites. Only the selec-tion efficiency for vulnerable species was evaluated indetail.
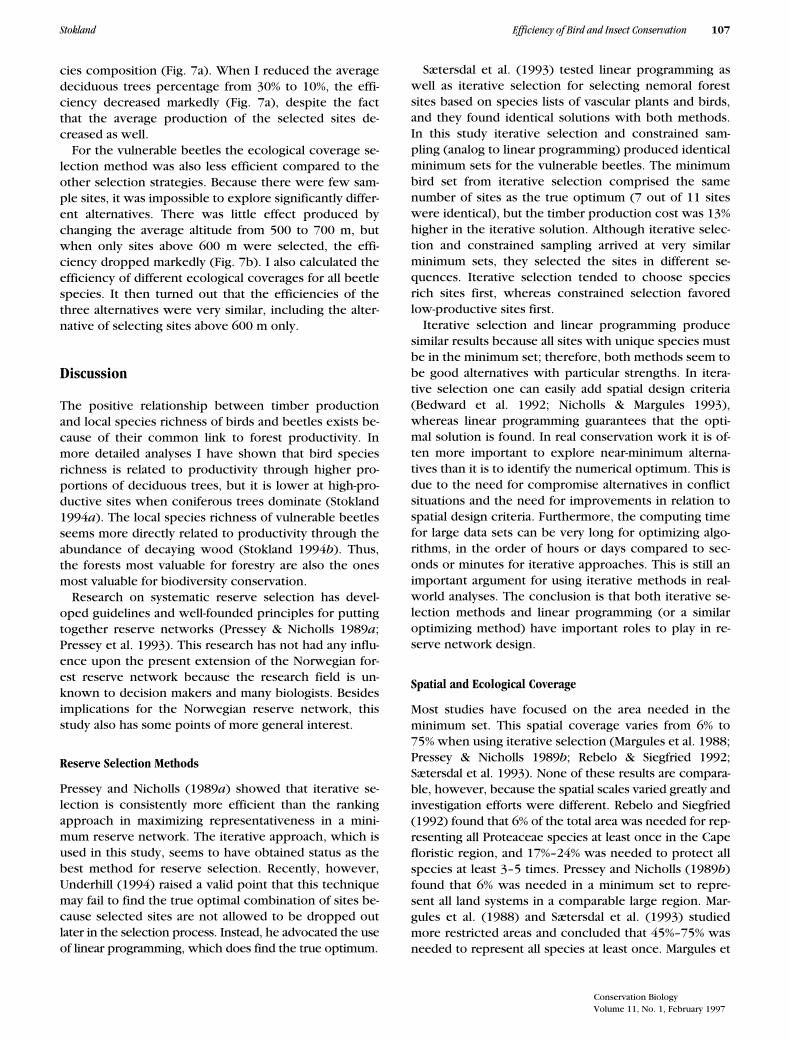
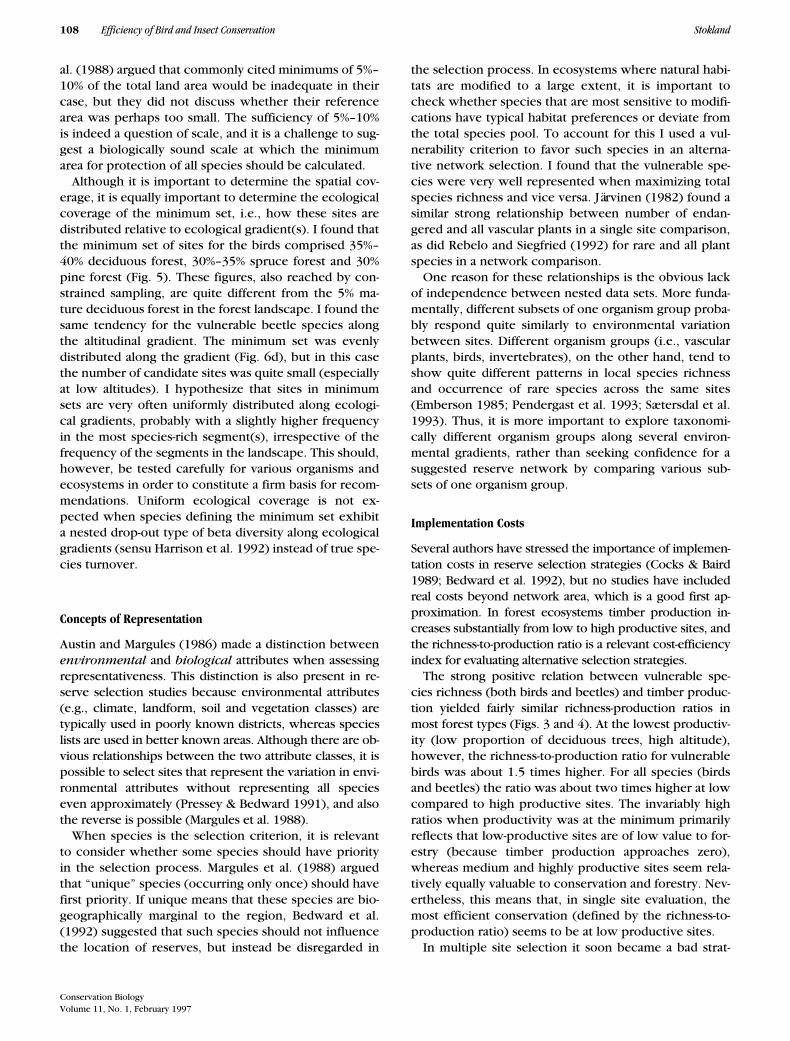
The optimal solution, in the sense of maximum effi-ciency, was achieved by constrained selection. This isshown Fig. 7, where the constrained selection exhibitsthe upper bound of species richness at each productionlevel. Iterative selection was somewhat less efficient forbirds. All vulnerable bird species were found by iterativeselection and by constrained sampling in sets of 11 sites(7 sites were identical in the two solutions), but the cu-mulative timber production of the iterative solution was13% higher (1630 m
3
versus 1435 m
3
, Fig. 7a). The treecomposition in the minimum set using constrained se-lection (proportions of pine, spruce, and deciduoustrees were 27%, 32%, and 40%, respectively) was almostidentical to that found with iterative selection (Fig. 5d).For the vulnerable beetle species the iterative selectiongave exactly the same minimum set as the constrainedselection (Fig. 7b), which, coincidentally, also com-prised 11 sites. Iterative selection closely approachedand matched the maximum efficiency twice along the se-lection sequence.
In many real situations reserve selection is based uponthe ecological attributes of sites because no informationis available about species composition. I evaluated theperformance of selecting sites based on tree composi-tion when considering birds, and based on altitude forbeetles. For the vulnerable birds the ecological coverageselection was substantially less efficient than either itera-tive or constrained selection, which were based on spe-
Figure 6. The cumulated number of all beetle species at 17 sites chosen using the iterative selection method (a), and the corresponding altitudes of the selected sites and running average of the altitudes (c). The cumulated number of vulnerable beetle species in 11 out of 17 sites chosen with iterative selection (b), and the correspond-ing altitudes of the sites (d).
Figure 7. The cumulated richness of vulnerable bird species (a) and vulnerable beetle species (b) as func-tions of cumulated timber production of the selected sites. The upper (bold) curve is the result of con-strained sampling, the next uppermost curve is the re-sult of iterative selection. The three lower curves are results from different ecological coverages, which rep-resent sites with averages of 10%, 15%, and 30% decid-uous forest (a) and sites with average altitudes of 500, 700, and . 600 m (b).
Conservation BiologyVolume 11, No. 1, February 1997
Stokland Efficiency of Bird and Insect Conservation
107
cies composition (Fig. 7a). When I reduced the averagedeciduous trees percentage from 30% to 10%, the effi-ciency decreased markedly (Fig. 7a), despite the factthat the average production of the selected sites de-creased as well.
For the vulnerable beetles the ecological coverage se-lection method was also less efficient compared to theother selection strategies. Because there were few sam-ple sites, it was impossible to explore significantly differ-ent alternatives. There was little effect produced bychanging the average altitude from 500 to 700 m, butwhen only sites above 600 m were selected, the effi-ciency dropped markedly (Fig. 7b). I also calculated theefficiency of different ecological coverages for all beetlespecies. It then turned out that the efficiencies of thethree alternatives were very similar, including the alter-native of selecting sites above 600 m only.
Discussion
The positive relationship between timber productionand local species richness of birds and beetles exists be-cause of their common link to forest productivity. Inmore detailed analyses I have shown that bird speciesrichness is related to productivity through higher pro-portions of deciduous trees, but it is lower at high-pro-ductive sites when coniferous trees dominate (Stokland1994
a
). The local species richness of vulnerable beetlesseems more directly related to productivity through theabundance of decaying wood (Stokland 1994
b
). Thus,the forests most valuable for forestry are also the onesmost valuable for biodiversity conservation.
Research on systematic reserve selection has devel-oped guidelines and well-founded principles for puttingtogether reserve networks (Pressey & Nicholls 1989
a
;Pressey et al. 1993). This research has not had any influ-ence upon the present extension of the Norwegian for-est reserve network because the research field is un-known to decision makers and many biologists. Besidesimplications for the Norwegian reserve network, thisstudy also has some points of more general interest.
Reserve Selection Methods
Pressey and Nicholls (1989
a
) showed that iterative se-lection is consistently more efficient than the rankingapproach in maximizing representativeness in a mini-mum reserve network. The iterative approach, which isused in this study, seems to have obtained status as thebest method for reserve selection. Recently, however,Underhill (1994) raised a valid point that this techniquemay fail to find the true optimal combination of sites be-cause selected sites are not allowed to be dropped outlater in the selection process. Instead, he advocated the useof linear programming, which does find the true optimum.
Sætersdal et al. (1993) tested linear programming aswell as iterative selection for selecting nemoral forestsites based on species lists of vascular plants and birds,and they found identical solutions with both methods.In this study iterative selection and constrained sam-pling (analog to linear programming) produced identicalminimum sets for the vulnerable beetles. The minimumbird set from iterative selection comprised the samenumber of sites as the true optimum (7 out of 11 siteswere identical), but the timber production cost was 13%higher in the iterative solution. Although iterative selec-tion and constrained sampling arrived at very similarminimum sets, they selected the sites in different se-quences. Iterative selection tended to choose speciesrich sites first, whereas constrained selection favoredlow-productive sites first.
Iterative selection and linear programming producesimilar results because all sites with unique species mustbe in the minimum set; therefore, both methods seem tobe good alternatives with particular strengths. In itera-tive selection one can easily add spatial design criteria(Bedward et al. 1992; Nicholls & Margules 1993),whereas linear programming guarantees that the opti-mal solution is found. In real conservation work it is of-ten more important to explore near-minimum alterna-tives than it is to identify the numerical optimum. This isdue to the need for compromise alternatives in conflictsituations and the need for improvements in relation tospatial design criteria. Furthermore, the computing timefor large data sets can be very long for optimizing algo-rithms, in the order of hours or days compared to sec-onds or minutes for iterative approaches. This is still animportant argument for using iterative methods in real-world analyses. The conclusion is that both iterative se-lection methods and linear programming (or a similaroptimizing method) have important roles to play in re-serve network design.
Spatial and Ecological Coverage
Most studies have focused on the area needed in theminimum set. This spatial coverage varies from 6% to75% when using iterative selection (Margules et al. 1988;Pressey & Nicholls 1989
b
; Rebelo & Siegfried 1992;Sætersdal et al. 1993). None of these results are compara-ble, however, because the spatial scales varied greatly andinvestigation efforts were different. Rebelo and Siegfried(1992) found that 6% of the total area was needed for rep-resenting all Proteaceae species at least once in the Capefloristic region, and 17%–24% was needed to protect allspecies at least 3–5 times. Pressey and Nicholls (1989
b
)found that 6% was needed in a minimum set to repre-sent all land systems in a comparable large region. Mar-gules et al. (1988) and Sætersdal et al. (1993) studiedmore restricted areas and concluded that 45%–75% wasneeded to represent all species at least once. Margules et
108
Efficiency of Bird and Insect Conservation Stokland
Conservation BiologyVolume 11, No. 1, February 1997
al. (1988) argued that commonly cited minimums of 5%–10% of the total land area would be inadequate in theircase, but they did not discuss whether their referencearea was perhaps too small. The sufficiency of 5%–10%is indeed a question of scale, and it is a challenge to sug-gest a biologically sound scale at which the minimumarea for protection of all species should be calculated.
Although it is important to determine the spatial cov-erage, it is equally important to determine the ecologicalcoverage of the minimum set, i.e., how these sites aredistributed relative to ecological gradient(s). I found thatthe minimum set of sites for the birds comprised 35%–40% deciduous forest, 30%–35% spruce forest and 30%pine forest (Fig. 5). These figures, also reached by con-strained sampling, are quite different from the 5% ma-ture deciduous forest in the forest landscape. I found thesame tendency for the vulnerable beetle species alongthe altitudinal gradient. The minimum set was evenlydistributed along the gradient (Fig. 6d), but in this casethe number of candidate sites was quite small (especiallyat low altitudes). I hypothesize that sites in minimumsets are very often uniformly distributed along ecologi-cal gradients, probably with a slightly higher frequencyin the most species-rich segment(s), irrespective of thefrequency of the segments in the landscape. This should,however, be tested carefully for various organisms andecosystems in order to constitute a firm basis for recom-mendations. Uniform ecological coverage is not ex-pected when species defining the minimum set exhibita nested drop-out type of beta diversity along ecologicalgradients (sensu Harrison et al. 1992) instead of true spe-cies turnover.
Concepts of Representation
Austin and Margules (1986) made a distinction between
environmental
and
biological
attributes when assessingrepresentativeness. This distinction is also present in re-serve selection studies because environmental attributes(e.g., climate, landform, soil and vegetation classes) aretypically used in poorly known districts, whereas specieslists are used in better known areas. Although there are ob-vious relationships between the two attribute classes, it ispossible to select sites that represent the variation in envi-ronmental attributes without representing all specieseven approximately (Pressey & Bedward 1991), and alsothe reverse is possible (Margules et al. 1988).
When species is the selection criterion, it is relevantto consider whether some species should have priorityin the selection process. Margules et al. (1988) arguedthat “unique” species (occurring only once) should havefirst priority. If unique means that these species are bio-geographically marginal to the region, Bedward et al.(1992) suggested that such species should not influencethe location of reserves, but instead be disregarded in
the selection process. In ecosystems where natural habi-tats are modified to a large extent, it is important tocheck whether species that are most sensitive to modifi-cations have typical habitat preferences or deviate fromthe total species pool. To account for this I used a vul-nerability criterion to favor such species in an alterna-tive network selection. I found that the vulnerable spe-cies were very well represented when maximizing totalspecies richness and vice versa. Järvinen (1982) found asimilar strong relationship between number of endan-gered and all vascular plants in a single site comparison,as did Rebelo and Siegfried (1992) for rare and all plantspecies in a network comparison.
One reason for these relationships is the obvious lackof independence between nested data sets. More funda-mentally, different subsets of one organism group proba-bly respond quite similarly to environmental variationbetween sites. Different organism groups (i.e., vascularplants, birds, invertebrates), on the other hand, tend toshow quite different patterns in local species richnessand occurrence of rare species across the same sites(Emberson 1985; Pendergast et al. 1993; Sætersdal et al.1993). Thus, it is more important to explore taxonomi-cally different organism groups along several environ-mental gradients, rather than seeking confidence for asuggested reserve network by comparing various sub-sets of one organism group.
Implementation Costs
Several authors have stressed the importance of implemen-tation costs in reserve selection strategies (Cocks & Baird1989; Bedward et al. 1992), but no studies have includedreal costs beyond network area, which is a good first ap-proximation. In forest ecosystems timber production in-creases substantially from low to high productive sites, andthe richness-to-production ratio is a relevant cost-efficiencyindex for evaluating alternative selection strategies.
The strong positive relation between vulnerable spe-cies richness (both birds and beetles) and timber produc-tion yielded fairly similar richness-production ratios inmost forest types (Figs. 3 and 4). At the lowest productiv-ity (low proportion of deciduous trees, high altitude),however, the richness-to-production ratio for vulnerablebirds was about 1.5 times higher. For all species (birdsand beetles) the ratio was about two times higher at lowcompared to high productive sites. The invariably highratios when productivity was at the minimum primarilyreflects that low-productive sites are of low value to for-estry (because timber production approaches zero),whereas medium and highly productive sites seem rela-tively equally valuable to conservation and forestry. Nev-ertheless, this means that, in single site evaluation, themost efficient conservation (defined by the richness-to-production ratio) seems to be at low productive sites.
In multiple site selection it soon became a bad strat-

Conservation BiologyVolume 11, No. 1, February 1997
Stokland Efficiency of Bird and Insect Conservation
109
egy to accumulate low-productive coniferous sites forthe vulnerable bird species because species-poor sitesthen are duplicated while implementation costs increase(Fig. 7a). The efficiency of ecological coverage selectionimproved when the proportion of deciduous trees in-creased from 10% to 30%, but the complementary solu-tions from constrained and iterative selection were farmore efficient. For vulnerable beetle species there was avery similar pattern. Complementary solutions weremost efficient, characterized by a uniform ecologicalcoverage of the ecological (i.e., altitude) gradient. Unfor-tunately, the beetle data was not sufficient to explorethe full variation of various altitude coverages. However,when I sampled sites above 600 m only, the efficiencyfor the vulnerable species decreased (Fig. 7b). The effi-ciency of selecting sites above 600 m for all beetle spe-cies, on the other hand, was similar to those of sites withaverages of 500–700 m.
The general conclusion is that complementary reservenetworks, which include several species-rich, high pro-ductive sites, seem to be the most cost-efficient strategywhen timber costs are considered. This is analogous tothe basic finding when ranking and iterative selectionmethods are compared. Evaluation based on static crite-ria (here, single site cost-efficiency) is useful in recom-mending single sites, but static criteria should not be ap-plied in multiple site selection because the value of anadditional site depends on the attributes of the sites al-ready selected.
It is premature to generalize that a substantial propor-tion of high-productive forest, together with mediumand low-productive sites, is the most efficient conserva-tion strategy for all organisms. The declining speciesrichness of many organism groups with altitude (Hågvar1976; Solhøy 1976) and latitude (Lahti et al. 1988;Väisänen & Heliövaara 1994; but see Kouki et al. 1994)indicate that this generalization may be valid, but a posi-tive relationship between species richness and produc-tivity is not sufficient to make this conclusion (cfr. theefficiency result of all beetle species). It seems more ap-propriate to conclude that a similar coverage of produc-tivity classes is at least as efficient and probably more ef-ficient than over-representing low-productive sites formaximizing representativeness of most organism groups.
The efficiency results of this study also have some im-plications beyond reserve selection strategies. “New” or“multiple use” forestry has broadened the scope of for-est management research to include biodiversity as newdecision criterion (Kuusipalo & Kangas 1994). This de-velopment is welcomed because it indicates biodiversityeffects of various forestry practices. This study showsthat the efficiency of conservation measures (such asnon-logging in small key biotopes) varies with site prop-erties and forest productivity. Another point is that thebiodiversity effect of a single management plan is scale-dependent. This is analogous to the single site-multiple
site differences: a management plan yielding a reason-able local balance between timber harvest and speciesrichness may produce undesired effects if adoptedthroughout an extended region. This regional biodiver-sity effect is far more important than the local effect.
The Norwegian Forest Reserve Network
The reserve network in Norwegian boreal forests com-prises 0.9% of the productive forest area including therecent extension. Despite a scientific recommendationto protect at least 2% of the productive forest (Baadsvik1988), the current spatial coverage is considered politi-cally “reasonable.” In addition to the spatial deficiency,the reserve network also has some serious weaknessesin ecological coverage because low-productive siteshave been over-represented. This is a result of an unfor-tunate combination of ranking criteria, an inefficient se-lection strategy, and a lack of relevant biological infor-mation about the candidate sites. The criteria by whichall sites were ranked were biogeographical representa-tiveness, area, naturalness, and species richness of vas-cular plants (Haugen 1991). Particularly large and mini-mally logged areas achieved a high rank as so-called“type areas.” Together, these independently good criteriaconstituted a poor combination, because low-produc-tive sites that have been moderately utilized by forestryreceived the highest scores. Subsequently, the inefficientstrategy of only selecting top-ranked sites (Pressey &Nicholls 1989
a
) was applied, and similar sites were re-peatedly picked out in different biogeographical regions.This serious bias was somewhat counteracted by select-ing assumed species-rich or vulnerable “special areas,” butso-called supplementary areas intended to balance theecological coverage of different forest types were explic-itly downweighted in the selection process (Haugen 1991).A further unfortunate factor was the misleading label “Co-niferous forest plan” instead of the more appropriate “Bo-real forest plan.” This moved the attention away from theimportant diversity element of boreal deciduous trees.
Information about species composition and quantita-tive coverage of vegetation types as well as tree compo-sition was critically missing for the candidate sites. Thus,it was impossible to perform any analysis of complemen-tarity to suggest more representative networks. The in-sufficient survey work and the suboptimal selectionstrategy have probably caused a highly suboptimal useof money for biodiversity conservation. Sætersdal andBirks (1993) demonstrated a similar inappropriateness inthe nemoral forest network in western Norway becauseof the failure to cover the ecological variation appropri-ately. They identified four forest communities based onnumerical analyses of vascular plants from sixty samplesites. One community was not represented at all in theexisting network of 12 reserves, whereas another wasonly represented in one reserve.

110
Efficiency of Bird and Insect Conservation Stokland
Conservation BiologyVolume 11, No. 1, February 1997
The Value of Deciduous Forests
In addition to the bird analyses above, I have found thatnear 50% deciduous forests was the optimum for beetlessampled in various mature forests including some nem-oral stands (Stokland 1995). The importance of decidu-ous forests is further indicated by the host tree relationsof insects. Among the minimum 900 Scandinavian beetlespecies living in dead wood, 46% live exclusively in de-ciduous trees (28% when nemoral specialists are omit-ted), 19% in coniferous trees, and 35% in both (calcu-lated primarily from Saalas 1917; Palm 1951; Palm 1959).For several hundred phytophagous macrolepidopteraspecies deciduous trees host more than 10 times asmany species as coniferous trees (Seppanen 1970).Thus, even if deciduous-dominated stands comprise asmall proportion of the boreal forests, they are very im-portant to the species richness.
Recommendations regarding scales and spatial ar-rangements of reserves are difficult to make using thisstudy. The conclusion about deciduous forests wasbased on birds censused in 36–ha plots. In another study(Stokland 1995) I sampled beetles using window traps in0.5–ha plots and found (sub)populations of deciduous-specific beetles in isolated deciduous stands as small as 3ha. The other extreme is represented by the endangeredWhite-backed woodpecker (
Dendrocopus leucotus
)with a home-range of about 100 ha, mature, deciduous-dominated forest for each breeding pair. These findingsindicate that mature deciduous stands are valuable irre-spective of their size. There are two types of boreal de-ciduous woodlands in Scandinavia: (1) small, perma-nent, highly productive patches dominated by aspen,birch, or alder on south-facing slopes or in riparian sitesand (2) patches of all sizes and various productivity asso-ciated with successions following wildfires. In general,it is not feasible to match the criterion of deciduousdominance with large reserves (10–100 km
2
) becausedeciduous-dominated woodlands often are much smaller.Thus, in order to over-represent the proportion of decid-uous-dominated stands in the reserve network, a substan-tial part of the network should be allocated to such for-est types. Among these one should allow reservessmaller than the lower limit of about 1 km
2
. Further-more, some large reserves should be managed as “forestfire reserves” in order to maintain succession stages ofdeciduous forest together with the other qualities ofburned forests.
Recommendations
The skew in the Norwegian forest reserve network im-plies some obvious recommendations. First, more re-sources should be invested in survey work to establish afirm basis for guidelines before a further extension of
the reserve network is made. Such survey work shouldquantify tree composition and extent of different vegeta-tion types and establish comparable species lists of rele-vant vulnerable organism groups. The surveys should becarried out in existing reserves as well as in promisingsupplementary sites. My analyses show that promisingsites are various high-productive forest types and decid-uous-dominated forests (riparian forests, forests onsouth-facing hillsides). Second, one should carry out aproper cost-efficiency analysis based on iterative andconstrained selection to identify sites that best balancethe existing reserve network. Third, future extensionsshould allow small forest refuges and actively include ad-jacent forestry-modified stands that will eventually re-generate into old-growth states.
Acknowledgments
I thank S. Dale, R. A. Ims, N. C. Stenseth, and M. Sæters-dal for valuable comments on the manuscript. I alsowish to express my sincere thanks to E. Pierce whokindly improved the English. Financial support for thework was received from The Norwegian Research Council.
Literature Cited
Anonymous. 1981. The national forest survey 1964–76, Hedmarkcounty. Norwegian Institute of Land Inventory, Ås.
Austin, M. P., and C. R. Margules. 1986. Assessing representativeness.Pages 45–67 in M. B. Usher, editor. Wildlife conservation evalua-tion. London.
Baadsvik, K. 1988. Forslag til retningslinjer for barskogsvern. DN-rap-port 3 -1988. Directorate for Nature Management, Trondheim, Nor-way.
Bedward, M., R. L. Pressey, and D. A. Keith. 1992. A new approach forselecting fully representative reserve networks: addressing effi-ciency, reserve design and land suitability with an iterative analysis.Biological Conservation
62:
115–125.Cocks, K. D., and I. A. Baird. 1989. Using mathematical programming
to address the multiple reserve selection problem: an examplefrom the Eyre peninsula, South Australia. Biological Conservation
49:
113–130.Diamond, J. M. 1975. The island dilemma: lessons of modern biogeo-
graphic studies for the design of natural reserves. Biological Con-servation
7:
129-146.Emberson, R. M. 1985. Comparisons of site conservation value using
plant and soil arthropod species. Bulletin - British Ecological Soci-ety
16:
16-17.Harrison, S., S. J. Ross, and J. H. Lawton. 1992. Beta diversity on geo-
graphic gradients in Britain. Journal of Animal Ecology
61:
151–158.Haugen, I. 1991. Barskog i Øst-Norge. Utkast til verneplan. DN-rapport
1991-5. Directorate for Nature Management, Trondheim, Norway.Hågvar, S. 1976. Altitudinal zonation of the invertebrate fauna on
branches of birch (Betula pubescens Ehrh.). Norwegian Journal ofEntomology
23:
61–74.Järvinen, O. 1982. Conservation of endangered plant populations: sin-
gle large or several small reserves? Oikos
38:
301–307.Järvinen, O., and R. A. Väisänen. 1977. Long-term changes of the North
European land bird fauna. Oikos
29:
225–228.Kirkpatrick, J. B. 1983. An iterative method for establishing priorities

Conservation BiologyVolume 11, No. 1, February 1997
Stokland Efficiency of Bird and Insect Conservation
111
for the selection of nature reserves: an example from Tasmania. Bi-ological Conservation
25:
127–134.Kouki, J. P., P. Niemelä, and M. Viitasaari. 1994. Reversed latitudinal
gradient in species richness of sawflies (Hymenoptera, Symphyta).Annales Zoologici Fennici
31:
83–88.Kuusipalo, J., and J. Kangas. 1994. Managing biodiversity in a forestry
environment. Conservation Biology
8:
450–460.Lahti, T., A. Kurrto, and R. A. Väisänen. 1988. Floristic composition
and regional species richness of vascular plants in Finland. AnnalesBotanici Fennici
25:
281–291.Lomolino, M. V. 1994. An evaluation of alternative strategies for building
networks of nature reserves. Biological Conservation
69:
243–249.Margules, C., A. J. Higgs, and R. W. Rafe. 1982. Modern biogeographic
theory: are there any lessons for nature reserve design? BiologicalConservation
24:115–128.Margules, C. R., A. O. Nicholls, and R. L. Pressey. 1988. Selecting net-
works of reserves to maximise biological diversity. Biological Con-servation 43:63–76.
Margules, C. R., and J. L. Stein. 1989. Patterns in the distribution of spe-cies and the selection of nature reserves: an example from Euca-lyptus forests in south-eastern New South Wales. Biological Conser-vation 50:219–238.
Nicholls, A. O., and C. R. Margules. 1993. An upgraded reserve selec-tion algorithm. Biological Conservation 64:165–169.
Nilsen, P., and J. Larsson. 1992. Bonitering av skog ved hjelp av vege-tasjonstype og egenskaper ved voksestedet (Site index estimationfrom vegetation type and site properties). Rapport Skogforsk 22:1–43.
Palm, T. 1951. Die Holz- und Rinden-käfer der nordscwedischenLaubbäume. Meddelanden 40 (2), Statens Skogsforskningsinstitut,Stockholm.
Palm, T. 1959. Die Holz- und Rinden-käfer der süd- und mittelscwedis-chen Laubbäume. Pages 1–374 in Opuscula Entomologica Suppl.XVI.
Pendergast, J. R., R. M. Quinn, J. H. Lawton, B. C. Eversham, and D. W.Gibbons. 1993. Rare species, the coincidence of diversity hotspotsand conservation strategies. Nature 365:335–337.
Pressey, R. L., and M. Bedward. 1991. Mapping the environment at dif-ferent scales: benefits and costs for nature conservation. Pages 7–13 in C. R. Margules and M. P. Austin 1991, editors. Nature conser-vation: cost effective biological surveys and data analysis. CSIRO,Australia.
Pressey, R. L., and A. O. Nicholls. 1989a. Efficiency in conservationevaluation: scoring versus iterative approaches. Biological Conser-vation 50:199–218.
Pressey, R. L., and A. O. Nicholls. 1989b. Application of a numerical al-gorithm to the selection of reserves in semi-arid New South Wales.Biological Conservation 50:263–278.
Pressey, R. L., C. J. Humphries, C. R. Margules, R. I. Vane-Wright, andP. H. Williams. 1993. Beyond opportunism: key principles for sys-tematic reserve selection. TREE 8:124–128.
Purdie, R. W., and R. Blick. 1986. Selection of a conservation reservenetwork in the Mulga biogeographic region of south-westernQueensland, Australia. Biological Conservation 38:369–384.
Rebelo, A. G., and W. R. Siegfried. 1992. Where should nature reservesbe located in the Cape floristic region, South Africa? Models for thespatial configuration of a reserve network aimed at maximizing theprotection of floral diversity. Conservation Biology 6:243–252.
Saalas, U. 1917. Die Fichtenkäfer Finlands I. Annales Academiae Scien-tiarium Fennicae, ser. A 8:1–547.
Seppanen, E. 1970. Suomen suurperhostoukkien ravintokasvit. WSOY,Helsinki.
Simberloff, D. S., and L. C. Abele. 1976. Island biogeography theoryand conservation practice. Science 191:285–286.
Simberloff, D., and L. C. Abele. 1982. Refuge design and island bioge-ography theory: effects of fragmentation. American Naturalist 120:41–50.
Solhøy, T. 1976. Terrestrial gastropods (Mollusca, Gastropoda: Basom-matophora and Stylommatophora). Pages 23–45 in Fauna of theHardangervidda, no. 10. Zoological Museum, Bergen.
Stokland, J. N. 1994a. Avian species diversity in relation to tree compo-sition and productivity in mature boreal forests. Paper I in Biologi-cal diversity and conservation strategies in Scandinavian boreal for-ests. Ph.D. thesis. University of Oslo, Oslo.
Stokland, J. N. 1994b. Altitude and latitude gradients in species rich-ness of beetles (Coleoptera) in northern Europe. Paper III in Bio-logical diversity and conservation strategies in Scandinavian borealforests. Ph.D. thesis. University of Oslo, Oslo.
Stokland, J. N. 1995. Artsmangfold og virkesproduksjon i sydøst-norskenaturskoger. Aktuelt fra Skogforsk 13:1–16.
Sætersdal, M., and H. J. B. Birks. 1993. Assessing the representativenessof nature reserves using multivariate analysis: vascular plants andbreeding birds in deciduous forests, Western Norway. BiologicalConservation 65:121–132.
Sætersdal, M., J. M. Line, and H. J. B. Birks. 1993. How to maximize bi-ological diversity in nature reserve selection: vascular plants andbreeding birds in deciduous woodlands, Western Norway. Biologi-cal Conservation 66:131–138.
Tomter, S. M., editor. Statistics of forest conditions and resources inNorway. Norwegian Institute of Land Inventory, Ås.
Tveite, B., and H. Braastad. 1981. Bonitering av gran, furu og bjørk.Norsk Skogbruk 1981 (4):17–22.
Underhill, L. G. 1994. Optimal and suboptimal reserve selection algo-rithms. Biological Conservation 70:85–87.
Väisanen, R. A., O. Järvinen, and P. Rauhala. 1986. How are extensivehuman-caused habitat alterations expressed on the scale of localbird populations in boreal forests? Ornis Scandinavica 17:282–292.
Väisänen, R., and K. Heliövaara. 1994. Hot spots of insect diversity innorthern Europe. Annales Zoologici Fennici 31:71–81.
Whitcomb, R. F., J. F. Lynch, P. A. Opler, and C. S. Robbins. 1976. Is-land biogeography and conservation: strategy and limitation. Sci-ence 193:1030–1032.