How Do Teachers Deal with the Heuristic of Representativeness
16
How Do Teachers Deal with the Heuristic of Representativeness? Lucía Zapata Cardona Universidad de Antioquia, Colombia – Educación en Ciencias Experimentales y Matemáticas (GECEM) [email protected] Summary This is a phenomenological study that examines how teachers perceive students’ thinking about chance situations when students have used heuristics-based reasoning, and how teachers help students to overcome that heuristic-based reasoning. The particular heuristic examined in this study is the representativeness, a heuristic widely explored in the literature. In-depth interviews were used to elicit the perceptions of five statistics teachers from different schools in a southeastern U.S. state. Each teacher participated in two one- hour interviews where they were confronted with tasks related to the heuristic of representativeness. Teachers were asked to predict students’ responses, students’ difficulties and teachers’ interventions. Interviews were recorded and transcribed for hermeneutic analysis. Results suggest that expert teachers are more accurate in predicting students’ difficulties and in providing pedagogical strategies than novice teachers. KEYWORDS. Expert-Novice, Teacher Knowledge, Probabilistic Thinking, Representativeness. Introduction Participation in modern society requires an increasing familiarity with data and chance; however, research shows that people have difficulties reasoning in situations of uncertainty (Garfield & Ahlgren, 1988). The research literature is full of studies that describe the difficulties students (and even teachers) have in dealing with uncertainty, but little has been revealed about the pedagogical implications of those difficulties and how teachers may help students to overcome them. This study attempts to fill the gap and make connections between what is known about students’ difficulties in reasoning about uncertainty when students have used the heuristic of representativeness, and how teachers might deal with those difficulties. Literature Review Studies in thinking about chance abound, not only in statistics education, but also in mathematics education and educational psychology. Most of the studies on this topic have focused exclusively on how students think, but studies on how teachers assist students to overcome their intuitive thinking about chance are scarce. Research on thinking about chance may be classified into two approaches. The first has looked at data collected exclusively from forced-choice responses. That is, multiple-choice tasks have been given, generally, to college students and then analyzed through statistical tools. Researchers have sought to identify whether the students reasoned properly and to identify the more common errors made by students in their solutions (Green, 1983; Kahneman & Tversky, 1972, 1996; Lecoutre, 1992; Moutier & Houdé, 2003; Ross & Degroot, 1982; Tentori, Bonini, & Osherson, 2004; Tversky & Kahneman, 1973, 1974, 1983). These studies have been helpful in illuminating the common errors students make in reasoning about chance, but have not been successful in providing a detailed description of students’ thinking or in offering explanations of why students may favor a particular option. ICME 11 2008 – Topic Study Group 13: Research and development in the teaching and learning of probability
Transcript of How Do Teachers Deal with the Heuristic of Representativeness
How Do Teachers Deal with the Heuristic of Representativeness? Lucía Zapata Cardona Universidad de Antioquia, Colombia – Educación en Ciencias Experimentales y Matemáticas (GECEM) [email protected]
Summary This is a phenomenological study that examines how teachers perceive students’ thinking about chance situations when students have used heuristics-based reasoning, and how teachers help students to overcome that heuristic-based reasoning. The particular heuristic examined in this study is the representativeness, a heuristic widely explored in the literature. In-depth interviews were used to elicit the perceptions of five statistics teachers from different schools in a southeastern U.S. state. Each teacher participated in two one-hour interviews where they were confronted with tasks related to the heuristic of representativeness. Teachers were asked to predict students’ responses, students’ difficulties and teachers’ interventions. Interviews were recorded and transcribed for hermeneutic analysis. Results suggest that expert teachers are more accurate in predicting students’ difficulties and in providing pedagogical strategies than novice teachers.
KEYWORDS. Expert-Novice, Teacher Knowledge, Probabilistic Thinking, Representativeness.
Introduction Participation in modern society requires an increasing familiarity with data and chance; however,
research shows that people have difficulties reasoning in situations of uncertainty (Garfield & Ahlgren, 1988). The research literature is full of studies that describe the difficulties students (and even teachers) have in dealing with uncertainty, but little has been revealed about the pedagogical implications of those difficulties and how teachers may help students to overcome them. This study attempts to fill the gap and make connections between what is known about students’ difficulties in reasoning about uncertainty when students have used the heuristic of representativeness, and how teachers might deal with those difficulties.
Literature Review Studies in thinking about chance abound, not only in statistics education, but also in mathematics education and educational psychology. Most of the studies on this topic have focused exclusively on how students think, but studies on how teachers assist students to overcome their intuitive thinking about chance are scarce.
Research on thinking about chance may be classified into two approaches. The first has looked at data collected exclusively from forced-choice responses. That is, multiple-choice tasks have been given, generally, to college students and then analyzed through statistical tools. Researchers have sought to identify whether the students reasoned properly and to identify the more common errors made by students in their solutions (Green, 1983; Kahneman & Tversky, 1972, 1996; Lecoutre, 1992; Moutier & Houdé, 2003; Ross & Degroot, 1982; Tentori, Bonini, & Osherson, 2004; Tversky & Kahneman, 1973, 1974, 1983). These studies have been helpful in illuminating the common errors students make in reasoning about chance, but have not been successful in providing a detailed description of students’ thinking or in offering explanations of why students may favor a particular option.
ICME 11 2008 – Topic Study Group 13: Research and development in the teaching and learning of probability
The second approach to research on thinking about chance has also employed multiple-choice items, but with a deeper exploration of students’ reasoning through clinical interviews (Jones, Langrall, Thornton, & Mogill, 1999; Konold, 1989, 1995; Piaget & Inhelder, 1975; Polaki, 2002; Wagner, 2006). Although they do not allow generalization, these studies have become great resources for understanding students’ thinking about chance and have aptly complemented studies using the first approach.
It is important to mention that Shaughnessy (1992) suggested that research on teacher knowledge of
probability was needed, but there has been little response to his suggestion. For example, most research focusing on the heuristic of representativeness comes from psychological research, particularly from Amos Tversky and Daniel Kahneman (Kahneman & Tversky, 1972, 1996; Tversky & Kahneman, 1973, 1974, 1983). Most recently, statistics educators Hirsch and O’Donnell (2001) explored the heuristic of representativeness but focused exclusively on student responses.
Representativeness is a strategy of thinking where “people estimate the likelihood of a sample based on
how closely it resembles the population” (Garfield, 1995, p. 27). It is associated with the misunderstanding of the law of large numbers, with the influence of the results of previous events, and also with the idea that the probability of the intersection of two events is higher than that of the events themselves. Thus, representativeness has been explored by researchers under different names: conjunction fallacy, law of large numbers, and gambler’s fallacy.
The majority of these studies have centered on right or wrong answers of the respondents; and only few
have examined students’ thinking in probability and effective methods of teaching. There is almost nothing in research literature, which focuses on teaching strategies establishing stable intuitions and successful approaches in learners to cope with pertinent tasks. While few have concentrated on an interpretation of students’ answers, even less have taken into account the relative ambiguity of the tasks. This feature prompts students to reformulate their own problem from the task given and solve it (Borovcnik & Bentz, 1991).
There is an urgent need to develop and test potential strategies to teach students so that they master successfully tasks related to this complex subject. One step toward that direction might lie in exploring what strategies practicing teachers use to assist their students in transforming their heuristic-based thinking into normative thinking. This is the topic of the present study.
Methodoloy
A qualitative approach with phenomenology as a theoretical perspective (Crotty, 2004) and a hermeneutic analysis (Patton, 2002) were used to investigate how well teachers understand difficulties in students’ reasoning with respect to representativeness and what strategies teachers claim to use to assist students in their thinking. An expert-novice contrast was used to analyze the data. Most research in mathematics education using the expert-novice contrast has mainly used student teachers in their last year of preparation as novices (e.g., Borko et al., 1992; Livingston & Borko, 1990). For this study, the novices were practicing teachers in their first years of teaching. This aspect might be useful to enrich the available research and contribute to the understanding of the nature of expertise: how novices become experts.
The participants were five high school statistics teachers from the southeastern United States chosen by
using snowball or chain sampling (Patton, 2002). Table 1 shows basic characteristics of the participants’ background such as years of experience in teaching statistics, academic level attained and level of the class taught.
2
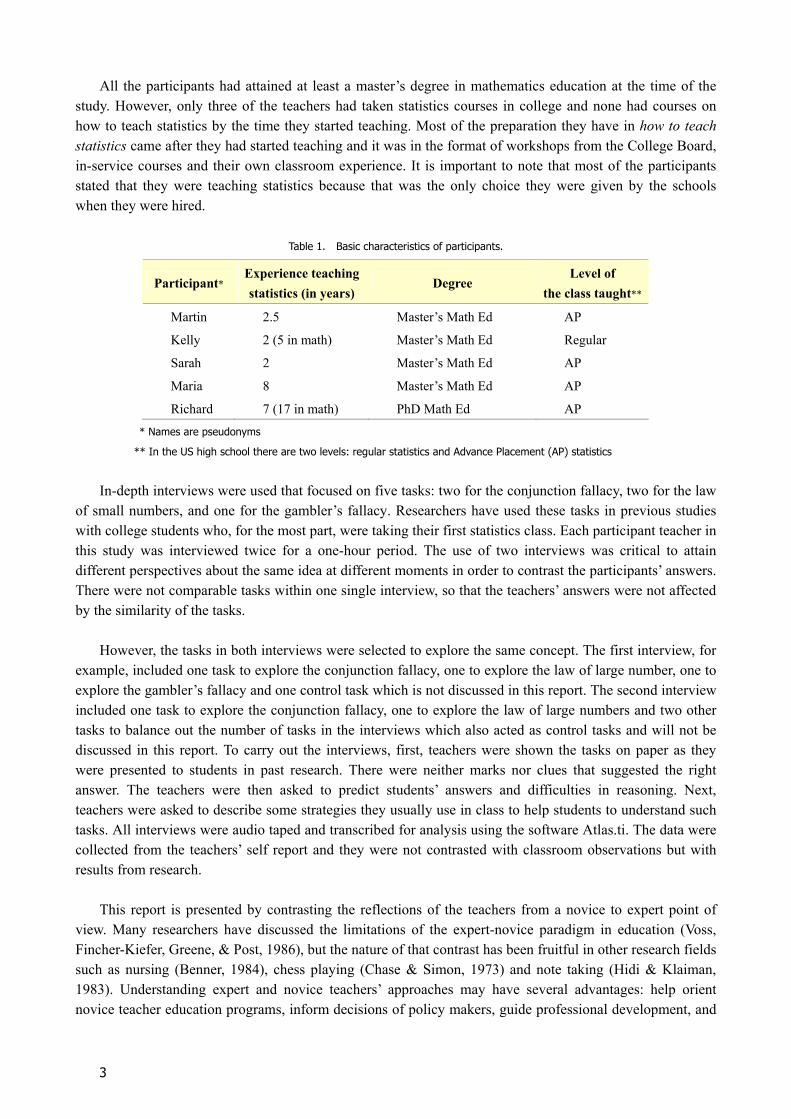
All the participants had attained at least a master’s degree in mathematics education at the time of the study. However, only three of the teachers had taken statistics courses in college and none had courses on how to teach statistics by the time they started teaching. Most of the preparation they have in how to teach statistics came after they had started teaching and it was in the format of workshops from the College Board, in-service courses and their own classroom experience. It is important to note that most of the participants stated that they were teaching statistics because that was the only choice they were given by the schools when they were hired.
Table 1. Basic characteristics of participants.
Participant* Experience teaching statistics (in years)
Degree Level of
the class taught**
Martin 2.5 Master’s Math Ed AP Kelly 2 (5 in math) Master’s Math Ed Regular Sarah 2 Master’s Math Ed AP Maria 8 Master’s Math Ed AP Richard 7 (17 in math) PhD Math Ed AP
* Names are pseudonyms
** In the US high school there are two levels: regular statistics and Advance Placement (AP) statistics
In-depth interviews were used that focused on five tasks: two for the conjunction fallacy, two for the law
of small numbers, and one for the gambler’s fallacy. Researchers have used these tasks in previous studies with college students who, for the most part, were taking their first statistics class. Each participant teacher in this study was interviewed twice for a one-hour period. The use of two interviews was critical to attain different perspectives about the same idea at different moments in order to contrast the participants’ answers. There were not comparable tasks within one single interview, so that the teachers’ answers were not affected by the similarity of the tasks.
However, the tasks in both interviews were selected to explore the same concept. The first interview, for
example, included one task to explore the conjunction fallacy, one to explore the law of large number, one to explore the gambler’s fallacy and one control task which is not discussed in this report. The second interview included one task to explore the conjunction fallacy, one to explore the law of large numbers and two other tasks to balance out the number of tasks in the interviews which also acted as control tasks and will not be discussed in this report. To carry out the interviews, first, teachers were shown the tasks on paper as they were presented to students in past research. There were neither marks nor clues that suggested the right answer. The teachers were then asked to predict students’ answers and difficulties in reasoning. Next, teachers were asked to describe some strategies they usually use in class to help students to understand such tasks. All interviews were audio taped and transcribed for analysis using the software Atlas.ti. The data were collected from the teachers’ self report and they were not contrasted with classroom observations but with results from research.
This report is presented by contrasting the reflections of the teachers from a novice to expert point of
view. Many researchers have discussed the limitations of the expert-novice paradigm in education (Voss, Fincher-Kiefer, Greene, & Post, 1986), but the nature of that contrast has been fruitful in other research fields such as nursing (Benner, 1984), chess playing (Chase & Simon, 1973) and note taking (Hidi & Klaiman, 1983). Understanding expert and novice teachers’ approaches may have several advantages: help orient novice teacher education programs, inform decisions of policy makers, guide professional development, and
3
inform teaching and teacher education research.
Analysis
Each concept, the conjunction fallacy, the law of large numbers and the gambler’s fallacy, is analyzed and presented according to the participant teachers’ reflections. Each concept is exposed starting with the most novice teachers Martin and Kelly, following with Sarah who is doing the transition form novice to expert, and finishing with Maria and Richard who are experts. Although the years of experience was considered at the beginning of the study as a potential variable to determine expertise, that was not exactly the case in this study. For example, Kelly had been in the classroom longer than Sarah; however Sarah showed more understanding at predicting students’ difficulties than Kelly did.
The Conjunction Fallacy
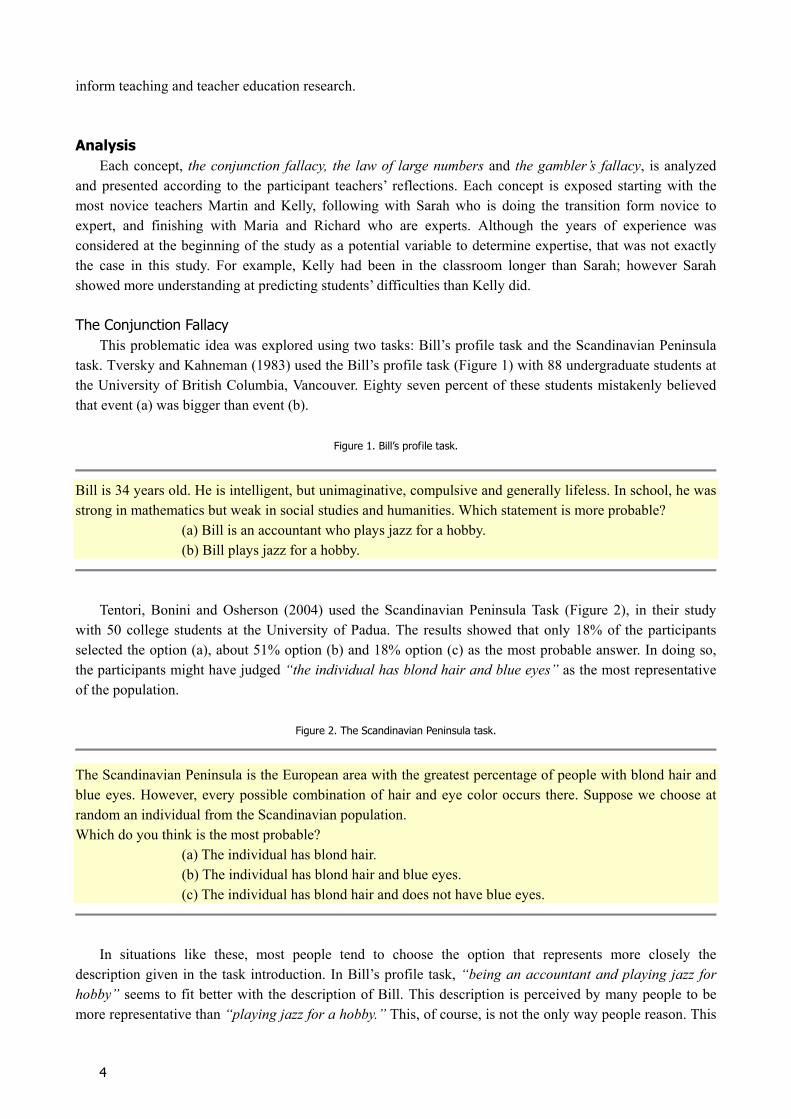
This problematic idea was explored using two tasks: Bill’s profile task and the Scandinavian Peninsula task. Tversky and Kahneman (1983) used the Bill’s profile task (Figure 1) with 88 undergraduate students at the University of British Columbia, Vancouver. Eighty seven percent of these students mistakenly believed that event (a) was bigger than event (b).
Figure 1. Bill’s profile task.
Bill is 34 years old. He is intelligent, but unimaginative, compulsive and generally lifeless. In school, he was strong in mathematics but weak in social studies and humanities. Which statement is more probable? (a) Bill is an accountant who plays jazz for a hobby. (b) Bill plays jazz for a hobby.
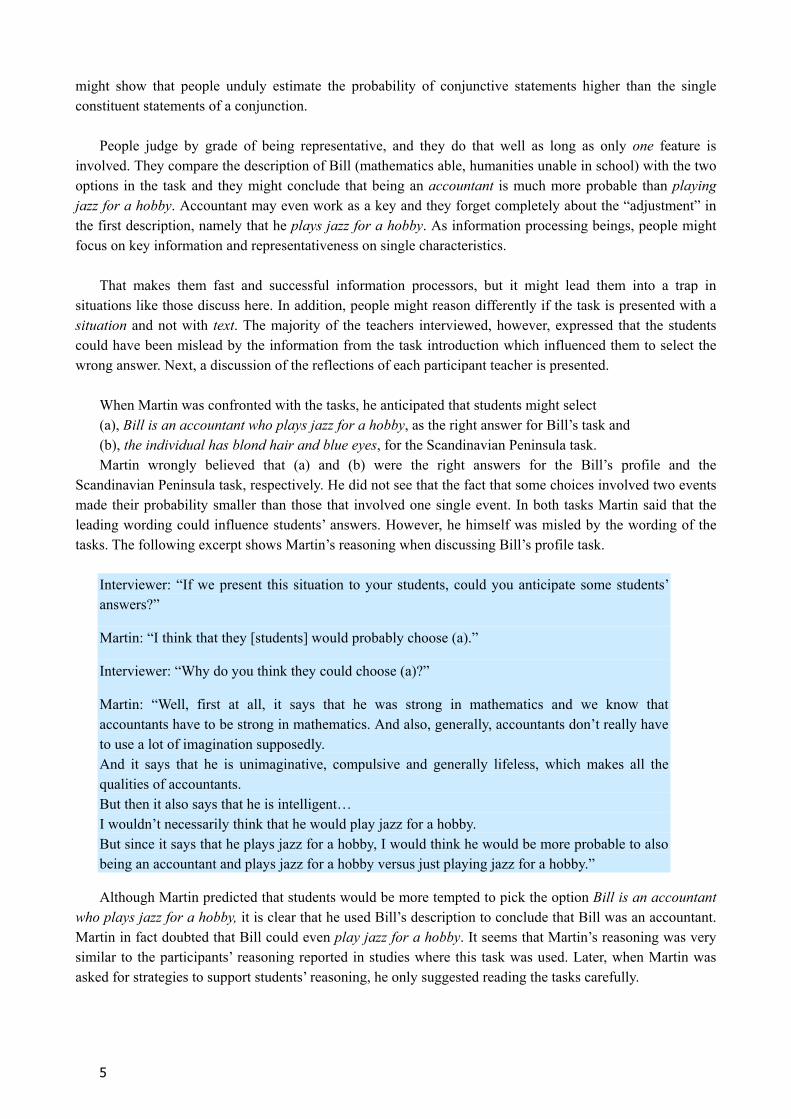
Tentori, Bonini and Osherson (2004) used the Scandinavian Peninsula Task (Figure 2), in their study
with 50 college students at the University of Padua. The results showed that only 18% of the participants selected the option (a), about 51% option (b) and 18% option (c) as the most probable answer. In doing so, the participants might have judged “the individual has blond hair and blue eyes” as the most representative of the population.
Figure 2. The Scandinavian Peninsula task.
The Scandinavian Peninsula is the European area with the greatest percentage of people with blond hair and blue eyes. However, every possible combination of hair and eye color occurs there. Suppose we choose at random an individual from the Scandinavian population. Which do you think is the most probable? (a) The individual has blond hair. (b) The individual has blond hair and blue eyes. (c) The individual has blond hair and does not have blue eyes.
In situations like these, most people tend to choose the option that represents more closely the description given in the task introduction. In Bill’s profile task, “being an accountant and playing jazz for hobby” seems to fit better with the description of Bill. This description is perceived by many people to be more representative than “playing jazz for a hobby.” This, of course, is not the only way people reason. This
4
might show that people unduly estimate the probability of conjunctive statements higher than the single constituent statements of a conjunction.
People judge by grade of being representative, and they do that well as long as only one feature is
involved. They compare the description of Bill (mathematics able, humanities unable in school) with the two options in the task and they might conclude that being an accountant is much more probable than playing jazz for a hobby. Accountant may even work as a key and they forget completely about the “adjustment” in the first description, namely that he plays jazz for a hobby. As information processing beings, people might focus on key information and representativeness on single characteristics.
That makes them fast and successful information processors, but it might lead them into a trap in
situations like those discuss here. In addition, people might reason differently if the task is presented with a situation and not with text. The majority of the teachers interviewed, however, expressed that the students could have been mislead by the information from the task introduction which influenced them to select the wrong answer. Next, a discussion of the reflections of each participant teacher is presented.
When Martin was confronted with the tasks, he anticipated that students might select (a), Bill is an accountant who plays jazz for a hobby, as the right answer for Bill’s task and (b), the individual has blond hair and blue eyes, for the Scandinavian Peninsula task. Martin wrongly believed that (a) and (b) were the right answers for the Bill’s profile and the
Scandinavian Peninsula task, respectively. He did not see that the fact that some choices involved two events made their probability smaller than those that involved one single event. In both tasks Martin said that the leading wording could influence students’ answers. However, he himself was misled by the wording of the tasks. The following excerpt shows Martin’s reasoning when discussing Bill’s profile task.
Interviewer: “If we present this situation to your students, could you anticipate some students’ answers?”
Martin: “I think that they [students] would probably choose (a).”
Interviewer: “Why do you think they could choose (a)?”
Martin: “Well, first at all, it says that he was strong in mathematics and we know that accountants have to be strong in mathematics. And also, generally, accountants don’t really have to use a lot of imagination supposedly. And it says that he is unimaginative, compulsive and generally lifeless, which makes all the qualities of accountants. But then it also says that he is intelligent… I wouldn’t necessarily think that he would play jazz for a hobby. But since it says that he plays jazz for a hobby, I would think he would be more probable to also being an accountant and plays jazz for a hobby versus just playing jazz for a hobby.”
Although Martin predicted that students would be more tempted to pick the option Bill is an accountant who plays jazz for a hobby, it is clear that he used Bill’s description to conclude that Bill was an accountant. Martin in fact doubted that Bill could even play jazz for a hobby. It seems that Martin’s reasoning was very similar to the participants’ reasoning reported in studies where this task was used. Later, when Martin was asked for strategies to support students’ reasoning, he only suggested reading the tasks carefully.
5
When discussing the Scandinavian Peninsula task, Martin reasoned similarly as he did in Bill’s profile task and he was again misled by the wording:
“the individual has blond hair and blue eyes, because it says [the task] the greatest percentage of people have blond hair and blue eyes.”
This time again, Martin wrongly reasoned as the majority of the students reported in previous studies. Kelly, another participant teacher in the study, also predicted that students’ answers might be option Bill
is an accountant who plays jazz for a hobby and the individual has blond hair and blue eyes because that was her own reasoning. She did not see the compound events in the choices. In both tasks the justifications for the selection of the most probable answers were associated with the introductory description of the tasks. The following excerpts from the interviews illustrate this fact.
Interviewer: “I would like you to look at this task and predict some potential answers from your students.”
Kelly: “I would be tempted to mark (a) because if you think you are strong in mathematics maybe you chose to become an accountant. But at the same time, I do not know that there is necessarily a logic connection between any of the information that is given in any of those choices.”
When Kelly was confronted with the Scandinavian Peninsula task, she applied a similar reasoning. Kelly let the introductory descriptions orient her decision:
“I think that absolutely most students are going to mark (b) [choice (b)], blond hair and blue eyes and they are going to do that because they read Scandinavian Peninsula. And they already have some preconceptions about Scandinavians that they have blond hair and blue eyes. And to certain extend that conception is reinforced by … the first sentence which says “the greatest percentage of the people with blond hair and blue eyes.”… So, you really have to read this carefully and try to put aside any prior knowledge. So, you are not tempted to answer this question based on what you think might be true.” (Kelly interview)
Kelly predicted potential difficulties in students’ reasoning when confronted with these kinds of tasks. She said that the lack of understanding of the tasks, the unfamiliar contexts for students, the leading wording and the fact that the situations do not have any quantifiers could be some of the difficulties students might face. Kelly also mentioned that in spite of all these potential difficulties, these tasks were not
“beyond the understanding of any of my [her] students.”
In doing so, she underestimated students’ difficulties. When referring to the unfamiliar contexts, Kelly said
“they [students] do not know anybody who plays jazz, they don’t know anybody who is an accountant, they don’t know if mathematics has anything really to do with playing jazz.”
In the Scandinavian Peninsula task, Kelly mentioned that students could better understand this task than the Bill’s profile task because the context was more familiar for the students:
6
“I think this is the question that my students could better relate to and understand. I think this question make more sense to them, because … they all are familiar with inheritance trace. And so, I think students would feel better with this question than they would with that one [Bill’s profile task].” (Kelly interview)
Kelly mentioned that some of the strategies she would use to help students to deal with these tasks would be: to use graphical representation to help to the visualization, work out model problems beforehand, and insert the tasks in familiar context for students. She said that if the context were slightly changed for a more familiar one, that might be enough for students to solve the problem. However, research has a lot of examples where the conjunction fallacy has been studied in multiple contexts and students preferred the choices that resembled the most to the introductory description of the tasks.
Sarah, another participant teacher, predicted that students could be inclined to select the option that was
better described in the introductory part of the task. However, she noticed that the tasks involved compound events which made the probability smaller. Sarah not only anticipated students’ more probable answers to the tasks but also identified the correct ones. She explained:
“I think that a lot of my students might be tempted to choose (b) the individual has blond hair and blue eyes because of the initial statement that was made “the Scandinavian peninsula is the European area with the greatest percentage of people with blond hair and blue eyes.” So, I think because that statement was made it’s gonna lead them to choose choice (b) because of the way that question was worded… If you are looking at statement (a) again, you are just looking at one event; the individual has blond hair regardless of eye color… But in statement (b) you have to meet two requirements, having blond hair and blue eyes. And the same in statement (c), you have to meet two requirements.” (Sarah interview)
Sarah’s predictions about students’ difficulties were associated with the leading wording of the tasks, with the fact that the tasks did not have quantifiers for relating these tasks to probability and with the fact that some of the choices in the tasks had compound events. Sarah’s suggested strategies, however, were associated with graphical representations of the tasks and with students’ careful reading of the problem:
“We could maybe write down or underline key things in the problem … We don’t know anything about his [Bill’s] job. So statement (a) there seems to be two items going on in it, and statement (b) it seems that there is just one.” (Sarah interview)
Maria identified the right answers and anticipated that students might be tempted to select the options that resemble the most to the initial descriptions in the tasks:
“They’re gonna most likely just read the problem and connect these adjectives [from the initial description] to that problem.”
She predicted that the students’ orthodox view, the leading wording of the tasks, the lack of numerical information, and the inability to recognize compound events might prevent students from getting the correct answers to the tasks. Maria said for example:
“I tend to think [that] problems like these where there is not a lot of numerical information, …
7

the kids are not sure what to do, [or] how to operate with it mathematically or statistically.”
Maria offered some interesting and some less interesting strategies to help students deal with these kinds of tasks. She said she might use graphical representation to help students visualized, give some quantities or percentages to the tasks, propose some simulation and relate the tasks to formulas. The three former strategies sounds like strategies that might help students deal with the stereotypical view Maria mentioned. However, the latter strategy seems to be a little bit too formal for the students’ first encounter with the tasks and it might keep promoting the students’ stereotypical view. The following excerpts from Marias’ interview illustrate the fact.
Interviewer: “If one of your students were faced with this question for the first time and they had difficulties, what could be your intervention for helping them to understand the situation?”
Maria: “I guess, I might choose to present it in formulas. They [the students] have an easier time, they tell me, with just relating thing back to formulas. So, I might look at a formula …where the kids are given the probability that Bill is an accountant, [and] kids are given the probability he plays jazz for a hobby. And then make them focus on the compound situation of part (a).”
Richard, another participant teacher, identified the right answers to the tasks and predicted that they could be difficult tasks for students. He said the students might select the choices by taking into account the adjectives from the introductory description of the tasks. Richard also argued that the fact that the tasks did not have numerical information might suggest the students that those were not tasks about probability but about logic. Richard, additionally, stated that the students’ inability to identify that the tasks had compound events and the leading wordings of the tasks were some aspects that might influence the students’ responses:
“they [students] might think strong in mathematics is a clue he is good in math…. They would probably think … the information leads towards strong in mathematics so, they probably think he [Bill] is an accountant and plays jazz for a hobby.”
Related to the pedagogical strategies, Richard mentioned that the graphical representation might help students in understanding the problem visually but students also need to be confronted with these kinds of tasks regularly throughout the curriculum.
It is compelling to notice from the descriptions that all the participants’ teachers coincided that the
wording of the tasks could be confusing for students. However, only three of the teachers dealt successfully with the leading wording, identified compound events, and found the correct answers for the tasks. The teachers mentioned several potential difficulties in students’ reasoning. Some were as basic as consider the context of the tasks and some were as complex as the inability to recognize the compound events.
The participant teachers who predicted the most complex difficulties in students’ reasoning were able to suggest the most complex strategies to orient students with the tasks. The pedagogical strategies suggested also had some degree of complexity. There were strategies as simple as a careful reading of the tasks and strategies as complex as generating a simulation.
A remarkable fact is that the most complex strategies were mentioned the teachers who were able to
identify the complexity of the tasks. Those who did not see any complexity in the tasks and underestimated students’ difficulties offered simple strategies. Maria and Richard were the ones offering the more complexity in the predictions, and their repertoire of strategies appeared to be broader than that of Martin and Kelly. Aspect that is not gratuitous taking into consideration that Maria and Richard were the most experienced teachers in the study.
8
The Law of Large Numbers “The law of larger numbers ensures that very large samples are highly representative of the populations
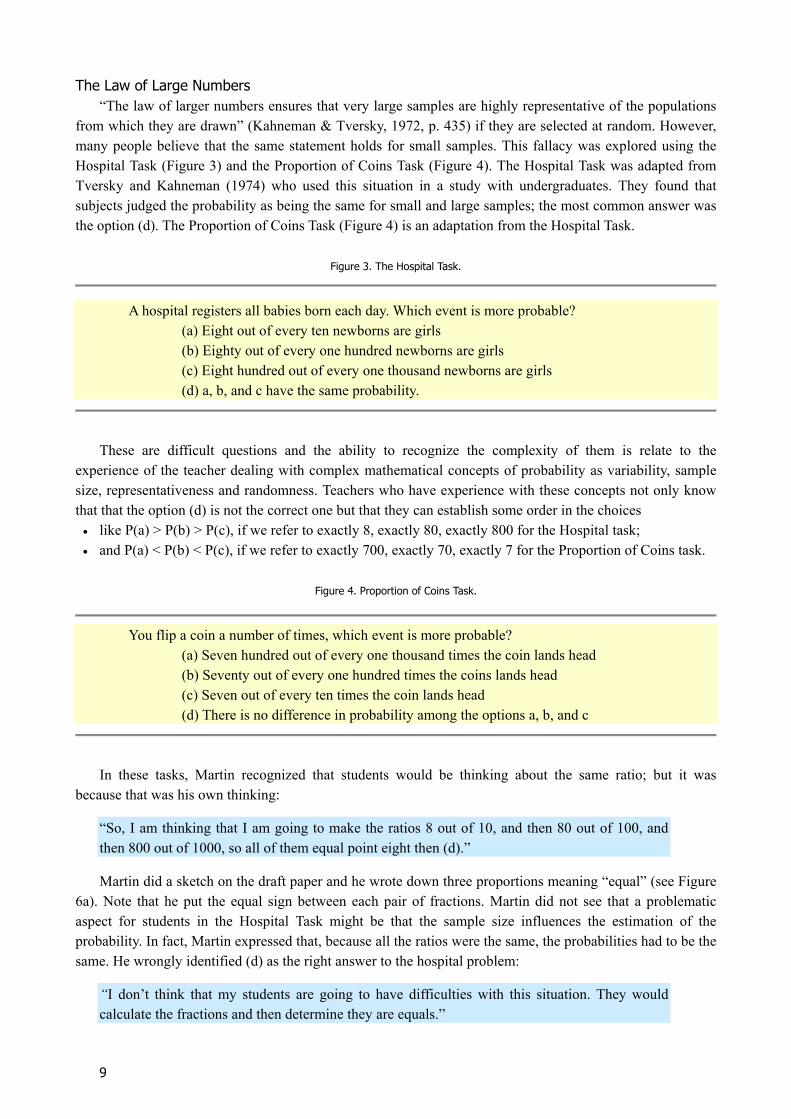
from which they are drawn” (Kahneman & Tversky, 1972, p. 435) if they are selected at random. However, many people believe that the same statement holds for small samples. This fallacy was explored using the Hospital Task (Figure 3) and the Proportion of Coins Task (Figure 4). The Hospital Task was adapted from Tversky and Kahneman (1974) who used this situation in a study with undergraduates. They found that subjects judged the probability as being the same for small and large samples; the most common answer was the option (d). The Proportion of Coins Task (Figure 4) is an adaptation from the Hospital Task.
Figure 3. The Hospital Task.
A hospital registers all babies born each day. Which event is more probable? (a) Eight out of every ten newborns are girls (b) Eighty out of every one hundred newborns are girls (c) Eight hundred out of every one thousand newborns are girls (d) a, b, and c have the same probability.
These are difficult questions and the ability to recognize the complexity of them is relate to the experience of the teacher dealing with complex mathematical concepts of probability as variability, sample size, representativeness and randomness. Teachers who have experience with these concepts not only know that that the option (d) is not the correct one but that they can establish some order in the choices • like P(a) > P(b) > P(c), if we refer to exactly 8, exactly 80, exactly 800 for the Hospital task; • and P(a) < P(b) < P(c), if we refer to exactly 700, exactly 70, exactly 7 for the Proportion of Coins task.
Figure 4. Proportion of Coins Task.
You flip a coin a number of times, which event is more probable? (a) Seven hundred out of every one thousand times the coin lands head (b) Seventy out of every one hundred times the coins lands head (c) Seven out of every ten times the coin lands head (d) There is no difference in probability among the options a, b, and c
In these tasks, Martin recognized that students would be thinking about the same ratio; but it was
because that was his own thinking:
“So, I am thinking that I am going to make the ratios 8 out of 10, and then 80 out of 100, and then 800 out of 1000, so all of them equal point eight then (d).”
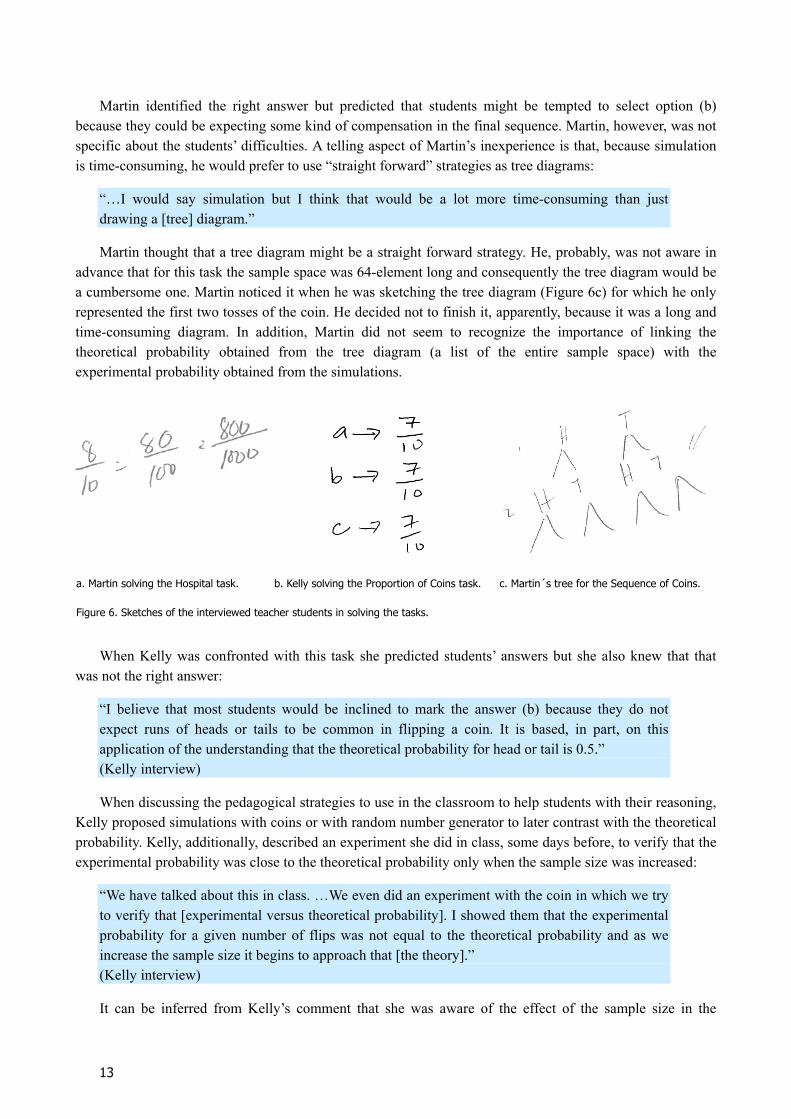
Martin did a sketch on the draft paper and he wrote down three proportions meaning “equal” (see Figure 6a). Note that he put the equal sign between each pair of fractions. Martin did not see that a problematic aspect for students in the Hospital Task might be that the sample size influences the estimation of the probability. In fact, Martin expressed that, because all the ratios were the same, the probabilities had to be the same. He wrongly identified (d) as the right answer to the hospital problem:
“I don’t think that my students are going to have difficulties with this situation. They would calculate the fractions and then determine they are equals.”
9

In this statement, he seemed to think that the problem would be solved by simply calculating the ratios. He was unable to anticipate students’ difficulties and consequently failed to provide a sensible intervention for helping students because he himself was struggling. These results are not surprising if we consider that Martin was at a novice level.
Kelly’s thought process was similar to Martin. Kelly stated that because the fractions were the same the probabilities were the same:
“I think that most students that I teach from grades 9 thru 12 are comfortable enough with the fact that 8 over 10 is equal to 80 over 100 is equal to 800 over 1000. The quality of fractions is not an issue for them.” (Kelly interview)
When discussing the Proportion of Coins task, Kelly used the same reasoning used in the Hospital task. She did a sketch, shown in Figure 6b, in which to each option she associated the same fraction. Kelly did that and immediately after she concluded that the options were equal. In addition, Kelly said that student would not have difficulties with the problem because they are familiar with fractions and proportions.
Since Kelly did not see the complexity of these tasks and she reduced them to a comparison of equivalent fractions, she was not able to either anticipate students’ difficulties or provide reasonable strategies to encourage students’ reasoning. Kelly was convinced that these were simple tasks when in reality they demand knowledge of mathematical concepts of probability.
Sarah had a very appealing response to these two tasks. She was not able to identify the complexity of
the Hospital task, but she recognized the complexity of the Proportion of Coins task. Sarah did not see the Hospital task as a complex item and she applied similar strategies to those applied by Martin and Kelly to solve it:
“I think my students would say that all three statements a, b and c are saying the same thing.”
Later, when Sarah was asked to anticipate students’ potential difficulties she answered:
“I think they have strong experience and background with ratio and fractions and they’re able to recognize equivalences within those.”
The only problematic situation that Sarah saw in the Hospital task was the fact that a hospital with 1000 new born was an unrealistic situation for students to work on.
When Sarah was confronted with the Proportion of Coins task, she had a different approach. She realized that the task was not as simple as it looks like and she expressed that one of the students’ difficulties might be try to solve it form an algebraic point of view:
“I think that students would start to think about it algebraically and start thinking about the ratios of each of these options and see that the ratios are equivalent. So, I think that that would be a problematic area for students in this question.” (Sarah interview)
Sarah suggested several strategies to help students in their reasoning in understanding the task. She recommended doing simulations, combining the class’ results and contrasting with the theoretical probability. The difference in Sarah’s responses to the two tasks might be due to the slight change in the context because in essence the two tasks were the same. However, another explanation might be due to the fact that the Hospital task was discussed prior to the Proportion of Coins task (in a previous interview) and the participant might have reflected about it and have a new perception of the complexity of the tasks.
10

Maria identified the complexity of the tasks as soon as she saw them. She knew that although the ratios
were the same, the probabilities were different. Maria predicted that students might have difficulties because they come into the statistics class with a deterministic view of the world. She said that students come into the statistics class asking “what is the answer?” Additionally, Maria stated that students’ background mainly reinforces ratios and proportions and the study of variation is almost ignored. Maria predicted that students might be misled by the fact that the ratios were the same:
“I think kids before being taught anything would think they are the same… They’re coming in mainly learning ratios and proportions…. They’re gonna say, eight out of ten, eighty out of a hundred, eight hundred out of one thousand all are the same ratio… I think that first though they are probably to fall victims to just calculating the proportions.” (Maria interview)
The strategies Maria suggested to help students to deal with these tasks were different types of simulation (with dice or coins, random number tables or computers for large numbers) to see the behavior of long run and short run and the variation of small samples. Maria also recommended framing the tasks in context meaningful for students, like a basketball shots:
“I think through simulations certainly is a good way for them to visible see what is taking place and distinguish between short run and long run. They would be able to make sense out of this eventually. Something in short run is gonna show something different than at the long run.” (Maria interview)
A very fascinating aspect to highlight from the participants’ discussions about the law of large numbers is that Maria was the only teacher who talked explicitly about short run, long run, and variation. This might be due, in part, to the fact that Maria was the participant who had taken the higher number of statistics courses in college and also because she was the one with the most experience in teaching statistics.
Richard recognized that these were difficult tasks for students. He identified that the choices with the
smaller samples would have the higher probability. Besides this, Richard predicted that the fact that the tasks had the same ratio could be tricky for students:
“I think that a lot of them [students] would probably look at the proportions and, without doing any calculation, would say (d).”
Richard explained that students were accustomed to work from an arithmetic point of view where fraction and ratio could be the first thing to come into their minds. Additionally, Richard expressed that, to help students with their probabilistic thinking, he would suggest a theoretical and an experimental approach. Richard mentioned computing the probability of each choice using binomial probability, doing simulations with a coin or random number table, and repeating the experimental probability many times until getting close to the theoretical probability:
“We talk about the binomial distribution and how the probability is spread out over all the possible outcomes. And so then, they start to realize that even though each of the scenarios are [have] the same proportion, that they don’t have the same probability… Well, there are a couple of ways [I would introduce this to students]. One way, of course, would be to compute those probabilities using binomial probability. Another
11
way would be to do the simulations. … If we treat the gender as been a fifty-fifty chance, fifty percent of boys fifty percent of girls, we could flip a coin or use a random number generator. And we could simulate ten new born. And we can count the number of boys and girls and we can repeat that many times to get an experimental probability. And we could do the same thing having one hundred new born.“ (Richard interview)
Thus, Maria and Richard’s responses were richer and more detailed than Martin and Kelly’s responses. The experienced teachers were very explicit in making the connection between theoretical probability (calculations using the binomial probability) and experimental probability (simulations) to illustrate to students that the sample size is directly related to the estimation of probability and that small samples show a larger variation than large samples.
These two tasks were the most challenging for teachers. Only two teachers, Maria and Richard, were
able to identify the right answers, anticipate some students’ difficulties, and provide suitable pedagogical interventions. These two teachers predicted that students would encounter challenges recognizing that each statement has a different probability. The rest of the teachers—Martin, Kelly and Sarah once—predicted that students would not have difficulties in these tasks because the fractions were the same. Statements like this suggest that the teachers did not recognize the correct answers for the tasks and were not conscious of the influence of sample size in the estimation of probability. Thus, if teachers were not successful in identifying the right answers or predicting students’ difficulties, then they might not be able to provide reasonable strategies to help students to deal with the tasks.
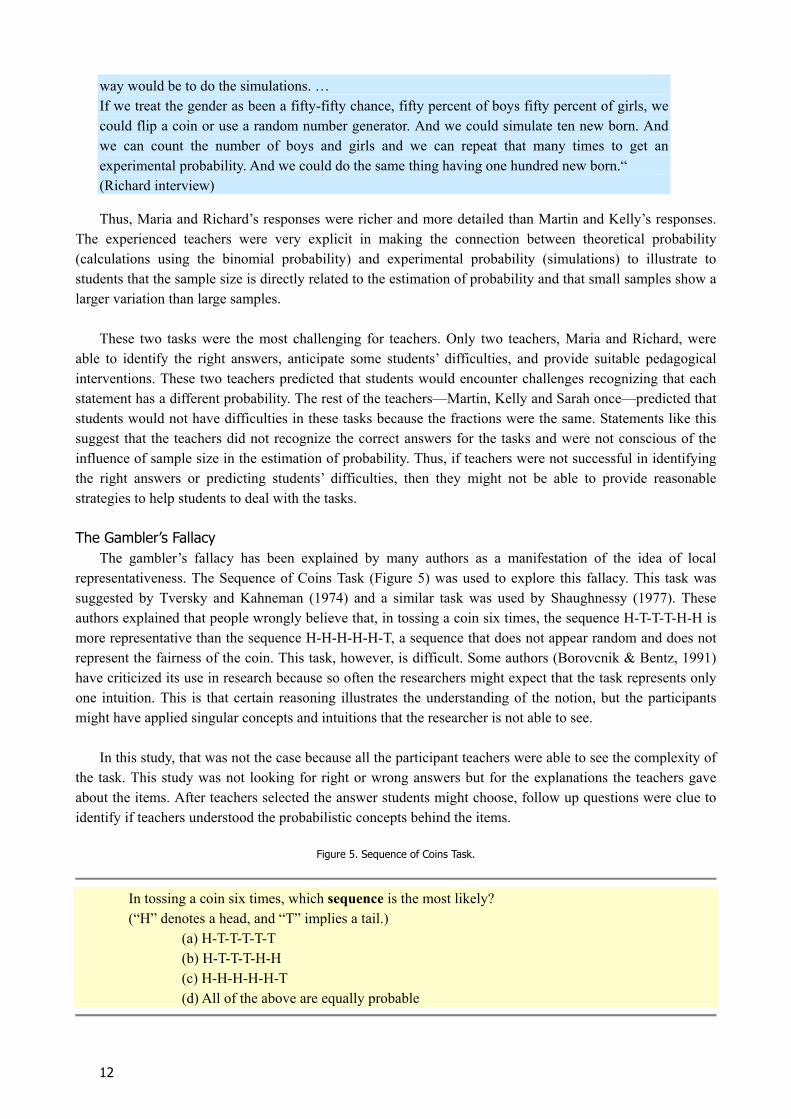
The Gambler’s Fallacy
The gambler’s fallacy has been explained by many authors as a manifestation of the idea of local representativeness. The Sequence of Coins Task (Figure 5) was used to explore this fallacy. This task was suggested by Tversky and Kahneman (1974) and a similar task was used by Shaughnessy (1977). These authors explained that people wrongly believe that, in tossing a coin six times, the sequence H-T-T-T-H-H is more representative than the sequence H-H-H-H-H-T, a sequence that does not appear random and does not represent the fairness of the coin. This task, however, is difficult. Some authors (Borovcnik & Bentz, 1991) have criticized its use in research because so often the researchers might expect that the task represents only one intuition. This is that certain reasoning illustrates the understanding of the notion, but the participants might have applied singular concepts and intuitions that the researcher is not able to see.
In this study, that was not the case because all the participant teachers were able to see the complexity of
the task. This study was not looking for right or wrong answers but for the explanations the teachers gave about the items. After teachers selected the answer students might choose, follow up questions were clue to identify if teachers understood the probabilistic concepts behind the items.
Figure 5. Sequence of Coins Task.
In tossing a coin six times, which sequence is the most likely?
(“H” denotes a head, and “T” implies a tail.) (a) H-T-T-T-T-T (b) H-T-T-T-H-H (c) H-H-H-H-H-T (d) All of the above are equally probable
12
Martin identified the right answer but predicted that students might be tempted to select option (b)
because they could be expecting some kind of compensation in the final sequence. Martin, however, was not specific about the students’ difficulties. A telling aspect of Martin’s inexperience is that, because simulation is time-consuming, he would prefer to use “straight forward” strategies as tree diagrams:
“…I would say simulation but I think that would be a lot more time-consuming than just drawing a [tree] diagram.”
Martin thought that a tree diagram might be a straight forward strategy. He, probably, was not aware in advance that for this task the sample space was 64-element long and consequently the tree diagram would be a cumbersome one. Martin noticed it when he was sketching the tree diagram (Figure 6c) for which he only represented the first two tosses of the coin. He decided not to finish it, apparently, because it was a long and time-consuming diagram. In addition, Martin did not seem to recognize the importance of linking the theoretical probability obtained from the tree diagram (a list of the entire sample space) with the experimental probability obtained from the simulations.
a. Martin solving the Hospital task. b. Kelly solving the Proportion of Coins task. c. Martin´s tree for the Sequence of Coins.
Figure 6. Sketches of the interviewed teacher students in solving the tasks.
When Kelly was confronted with this task she predicted students’ answers but she also knew that that
was not the right answer:
“I believe that most students would be inclined to mark the answer (b) because they do not expect runs of heads or tails to be common in flipping a coin. It is based, in part, on this application of the understanding that the theoretical probability for head or tail is 0.5.” (Kelly interview)
When discussing the pedagogical strategies to use in the classroom to help students with their reasoning, Kelly proposed simulations with coins or with random number generator to later contrast with the theoretical probability. Kelly, additionally, described an experiment she did in class, some days before, to verify that the experimental probability was close to the theoretical probability only when the sample size was increased:
“We have talked about this in class. …We even did an experiment with the coin in which we try to verify that [experimental versus theoretical probability]. I showed them that the experimental probability for a given number of flips was not equal to the theoretical probability and as we increase the sample size it begins to approach that [the theory].” (Kelly interview)
It can be inferred from Kelly’s comment that she was aware of the effect of the sample size in the
13
experimental probability; however, it is interesting to highlight that she did not recall that knowledge in the previous two episodes that explored the law of large numbers. This could reinforce the idea that those tasks were really complex or they were not powerful enough to activate her knowledge of the effect of the sample size in the experimental probability.
When discussing this task with Sarah, she predicted students would choose the sequence H-T-T-T-H-H
but knowing that that was not the correct answer.
“I would say my students would probably choose (b) because they would probably think that is unlikely to get a string of five tails in a row.”
Sarah also mentioned that the fact that students do not see each event as independent from the previous one would be a difficulty in solving the task. Later, Sarah discussed that simulations tossing a coin might be helpful for students to understand the problem from an experiential point of view.
When Maria was presented with this task, she predicted that students would select the option with some
mixture among the heads and tails, but she knew that was not the correct answer:
“I’m tempted to say they are going to pick this (b) just simply because they’re just thinking of a mixture of different things.”
Maria also explained that students’ might have difficulties if they are not aware of the fact that each event is independent from the previous one. She mentioned that doing simulations with the coins or with random number tables might be used to help students understanding.
Similarly, Richard identified the sequence H-T-T-T-H-H as the more probable answer students would
choose just because there was equal number of heads and tails. Richard, as the other teachers, also recognized that was not the correct answer:
“I believe that most of my students would probably look at this and they would probably choose (b) only because there is three of each [heads and tails].”
Richard explained that students might have several difficulties understanding this task: Students might not see long runs as very probable, they might not see that each event is an independent trial, they might transfer the theoretical probability of getting heads or tails (0.5) to this task to conclude that they should be half heads and half tails, or they might not see that in this task the order is important. Richard explained that it is clear that three heads and three tails is the most probable result when tossing the six coins without taking care of the order; however, students might not see the importance of the order. To help students deal with the above difficulties, he suggested having students list out the entire sample space to see that each choice has the same probability, calculate the theoretical probability of each choice and do simulations, either with manipulative or technology, to contrast the experimental results with the theoretical probability.
There are several things to highlight from this task. All the teachers predicted the students’ most probable
answer and that prediction coincided with the students’ choice reported in the literature. All the teachers coincided in recognizing that the students’ most probable choice was not the correct answer and that most of the students’ difficulties might be related to the inability to see that the events were independent. The strategy most teachers suggested for helping students in re-organizing their thinking related to this task was simulation; however, each teacher offered a different type and with different levels of complexity. For example, Richard suggested flipping coins and keeping track of the sequences, doing a larger simulation
14
using random generator from a computer spreadsheet, and comparing those results with the theoretical probabilities obtained from the listing of the sample space.
Martin only expressed one action: making the tree diagram. In contrast, Richard integrated several
actions in the same intervention: real simulation with coins, simulation using technology, and listing the sample space and comparing the experimental probability with the theoretical probability. This contrast reveals that teachers might share similar ideas in their interventions in the classroom; however, experienced teachers seem to describe more articulated and more integrated interventions than novice teachers.
Conclusion The results from this study suggest that expert and novice teachers deal with the heuristics of
representativeness differently. Experts and novices seem to perceive the heuristic differently, see students’ difficulties differently and use strategies to help students differently.
• Teachers who struggled with identifying correct answers and potential students’ difficulties in
chance situations were less capable of offering support to students to overcome difficulties in thinking about the heuristic of representativeness.
• Teachers concurred that students are more successful in conceptual understanding when they have activity-based courses and graphical representations for chance situations such as simulations, graphics, and diagrams. However, the descriptions given by novice teachers that portray classroom interventions were far from hands-on activities in teaching.
• Even though novice teachers were able to identify some difficulties in students’ reasoning, their interventions were less articulated and less integrated than expert teachers’ interventions.
• Novice teachers in statistics need a great deal of support. Although the teachers from this study had a strong preparation in mathematics education, the reality shows that they had little exposure to statistics and statistics education prior to becoming statistics teachers.
• Experienced teachers were more reflective and detailed in their explanations and had more strategies to share with their students. Expertise in teaching statistics seems to be an associated factor for the accuracy of teachers’ predictions of students’ difficulties and for correct understanding of probability.
Although we still do not know enough about the development of expertise to confidently design teacher
preparation programs, findings from this study provide some initial guidance. Novice teachers should take advantage of the knowledge of expert teachers through participation in learning communities or teamwork where experts share their experience to support novices. It is in this manner that novice practice becomes expert practice.
References Benner, P. E. (1984). From novice to expert: Excellence and power in clinical nursing practice. Menlo Park,
CA: Addison-Wesley. Borovcnik, M., & Bentz, H.-J. (1991). Empirical research in understanding probability. In R. Kapadia & M.
Borovcnik (Eds.), Chance encounters: Probability in education (Vol. 12, pp. 73–105). Dordrecht, The Netherlands: Kluwer.
Chase, W. G., & Simon, H. A. (1973). Perception in chess. Cognitive Psychology, 4, 55–81. Crotty, M. (2004). The foundations of social research: Meaning and perspective in the research process.
Thousand Oaks, CA: Sage
15

Garfield, J. (1995). How students learn statistics. International Statistical Review, 63, 25−34. Garfield, J., & Ahlgren, A. (1988). Difficulties in learning basic concepts in probability and statistics:
Implications for research. Journal for Research in Mathematics Education, 19, 44−63. Green, D. (1983). A survey of probability concepts in 3000 pupils aged 11−16 years. In Proceedings of the
First International Conference on Teaching Statistics (Vol. II, pp. 766−783): University of Sheffield. Hidi, S., & Klaiman, R. (1983). Notetaking by experts and novices: An attempt to identify teachable
strategies. Curriculum Inquiry, 13, 377–395. Hirsch, L. S., & O’Donnell, A. M. (2001). Representativeness in statistical reasoning: Identifying and
assessing misconceptions [Electronic Version]. Journal of Statistics Education 9. Retrieved 13 February 2008 from http://www.amstat.org/publications/jse/v9n2/hirsch.html.
Jones, G. A., Langrall, C. W., Thornton, C. A., & Mogill, T. (1999). Students’ probabilistic thinking in instruction. Journal for Research in Mathematics Education, 30, 487−519.
Kahneman, D., & Tversky, A. (1972). Subjective probability: A judgment of representativeness. Cognitive Psychology, 3, 430−454.
Kahneman, D., & Tversky, A. (1996). On the reality of cognitive illusions. Psychological Review, 130, 582−591.
Konold, C. (1989). Informal conceptions of probability. Cognition and Instruction, 6, 59−98. Konold, C. (1995). Confessions of a coin flipper and would-be instructor. American Statistician, 49, 203−209. Lecoutre, M.-P. (1992). Cognitive models and problem spaces in "purely random" situations. Educational
Studies in Mathematics, 23, 557−625. Moutier, S., & Houdé, O. (2003). Judgment under uncertainty and conjunction fallacy inhibition training.
Thinking and Reasoning 9, 185−201. Patton, M. Q. (2002). Qualitative research and evaluation methods (3rd ed.). Thousand Oaks, CA: Sage Piaget, J., & Inhelder, B. (1975). The origin of the idea of chance in children. New York: Norton. Polaki, M. V. (2002). Using instruction to identify key features of Basotho elementary students’ growth in
probabilistic thinking. Mathematical Thinking and Learning, 4, 285−313. Ross, B. M., & Degroot, J. F. (1982). How adolescents combine probabilities. Journal of Psychology, 110,
75−90. Shaughnessy, J. M. (1977). Misconceptions of probability: An experiment with a small-group, activity-based,
model building approach to introductory probability at the college level. Educational Studies in Mathematics, 8, 295−316.
Shaughnessy, J. M. (1992). Research in probability and statistics: Reflections and directions. In D. A. Grouws (Ed.), Handbook of research on mathematics teaching and learning (pp. 465–494). New York: Macmillan.
Tentori, K., Bonini, N., & Osherson, D. (2004). The conjunction fallacy: A misunderstanding about conjunction? Cognitive Science, 28, 467−477.
Tversky, A., & Kahneman, D. (1973). Availability: A heuristic for judging frequency and probability. Cognitive Psychology, 5, 207−232.
Tversky, A., & Kahneman, D. (1974). Judgment under uncertainty: Heuristics and biases. Science, 185, 1124−1131.
Tversky, A., & Kahneman, D. (1983). Extensional versus intuitive reasoning: The conjunction fallacy in probability judgment. Psychological Review, 30, 293−315.
Voss, J. F., Fincher-Kiefer, R. H., Greene, T. R., & Post, T. A. (1986). Individual differences in performance: The contrastive approach to knowledge In R. J. Sternberg (Ed.), Advances in the psychology of human intelligence (Vol. 3, pp. 297−334). Hillsdale, NJ: Erlbaum.
Wagner, J. F. (2006). Transfer in pieces. Cognition and Instruction, 24, 1−71.
16