Report on the case study of Swedish Biofuels - biofit-h2020.eu
46
BIOFIT EU Horizon 2020 no. 8178999 D3.3 Case study – Swedish Biofuels Report on the case study of Swedish Biofuels Retrofitting of an existing bioethanol plant for the production of sustainable aviation fuel (SAF) Nature, dissemination level Report, public Dedicated to Swedish Biofuels (Sweden) Main authors A. Gröngröft, G. C. de Paiva, S. Hauschild (DBFZ), D. Matschegg (BEST), Dr J. Spekreijse (BTG), A. Sagani, V. Tzelepi, D. Kourkoumpas (CERTH) Email lead author [email protected] Date, version 23.12.2021, V1.0
-
Upload
khangminh22 -
Category
Documents
-
view
3 -
download
0
Transcript of Report on the case study of Swedish Biofuels - biofit-h2020.eu

BIOFIT EU Horizon 2020 no. 8178999
D3.3 Case study – Swedish Biofuels
Report on the case study of
Swedish Biofuels
Retrofitting of an existing bioethanol plant for the
production of sustainable aviation fuel (SAF)
Nature, dissemination level Report, public
Dedicated to Swedish Biofuels (Sweden)
Main authors A. Gröngröft, G. C. de Paiva, S. Hauschild (DBFZ),
D. Matschegg (BEST),
Dr J. Spekreijse (BTG),
A. Sagani, V. Tzelepi, D. Kourkoumpas (CERTH)
Email lead author [email protected]
Date, version 23.12.2021, V1.0

2
Table of contents
1 Introduction to the case study ........................................................ 4
2 Case study team.............................................................................. 5
3 Confidentiality ................................................................................ 5
4 Case study description .................................................................... 6
4.1 Current situation ..................................................................................................... 6
4.2 Suggested retrofit .................................................................................................... 9
4.3 Alternative to retrofit ............................................................................................ 10
5 Supply Chain .................................................................................. 12
5.1 Feedstock type and costs ...................................................................................... 12
5.2 Feedstock availability and logistics ....................................................................... 15
5.3 Conclusion on supply chain ................................................................................... 17
6 Market assessment ........................................................................ 18
6.1 Market overview ................................................................................................... 18
6.1.1 EU conventional aviation fuels (CAF) market ........................................................ 18
6.1.2 EU bioethanol market ........................................................................................... 21
6.1.3 Advanced bioethanol production costs ................................................................ 25
6.1.4 EU sustainable aviation fuels (SAF) market ........................................................... 25
6.2 Legal and political framework for sustainable aviation in the EU and Sweden .... 28
6.3 Conclusions on market .......................................................................................... 33
7 Techno-economic assessment ........................................................ 33
8 Sustainability ................................................................................. 34
9 Risks .............................................................................................. 36
9.1 Risk assessment for the retrofit ............................................................................ 36

3
10 Key Performance Indicators (KPI) ................................................... 39
10.1 Technical KPIs ........................................................................................................ 39
10.2 Economic KPIs ........................................................................................................ 40
10.3 Environmental KPIs................................................................................................ 40
11 Conclusions .................................................................................... 42
12 References ..................................................................................... 44

4
1 Introduction to the case study
BIOFIT Case Study: Benefits, challenges and opportunities of integrating Alcohol
to Jet technology on to an existing 1G bioethanol plant
Addressing the increasing demand on sustainable fuels for aviation, this project has
investigated a scenario in which an existing maize-based bioethanol plant of Biocarburantes
de Castilla y León (BCyL) is retrofitted using Swedish Biofuels alcohol to jet (SB ATJ) technology
to produce sustainable aviation fuels (SAF). Currently the bioethanol of BCyL is sold for a
gasoline-ethanol fuel blend for road transport. Using the SB ATJ process, the ethanol can be
converted into a product for the aviation sector. Swedish Biofuels technology converts
alcohols into either synthetic paraffinic kerosene (SPK) or synthetic paraffinic kerosene with
aromatics (SKA). ATJ-SPK can be blended up to 50 % with conventional kerosene following the
requirements of ASTM D7566. The certification of ATJ-SKA is ongoing. Additional by-products
of Swedish Biofuels ATJ process are diesel, meeting diesel standards EN 590 and MK1 (for
Sweden), and high-octane gasoline, meeting gasoline standard EN 228.
This case study has identified the benefits of the integration of an alcohol to jet (ATJ) process
into an existing 1G ethanol plant from a technical, economic, and environmental perspective.
It has targeted the reduction of CO2 emissions, production of new products and of new
markets for the existing ethanol plant. This case study has been made with a focus on the
aviation sector, where there is a need especially for sustainable liquid fuels.
The following questions have been addressed in the case study:
• Which process streams of ethanol production can be used for the ATJ process?
• Is it possible to use residual products from the fermentation stage (fusel oils?)
• Would the retrofit improve the efficiency of the overall ATJ production process?
• What is the economic and ecological performance of the retrofit?
• Which aspects of the supply chain have to be considered both up and downstream of
the conversion plant?

5
2 Case study team
The case study has been conducted by the following partners:
Function Organization Main staff
Case Study Team Leader
DBFZ – Deutsches Biomasseforschungszentrum (Germany)
Arne Gröngröft ([email protected]) Gabriel Costa de Paiva ([email protected])
Case Study Company Swedish Biofuels (Sweden)
Andrew Hull
([email protected]) Angelica Hull ([email protected])
Associated case study company
VERTEX, Biocarburantes de Castilla y León (Spain)
Barbara Coto Suarez
([email protected]) Juan Maria García Alonso ([email protected]) Neme Galán Gallego ([email protected])
Task Leader Supply Chain Assessment
BEST – Bioenergy and Sustainable Technologies (Austria)
Doris Matschegg ([email protected])
Task Leader Techno Economic Assessment
BTG Biomass Technology Group BV (Netherlands)
Jurjen Spekreijse ([email protected])
Task Leader Environmental Assessment
Centre for Research & Technology (Greece)
Dimitris Kourkoumpas ([email protected])
3 Confidentiality
The report has been prepared for sharing among the partners of the case study team only.
However, during the course of the project, this report has been used as the basis for
deliverable D3.3, which, although confidential, has been shared with all the BIOFIT project
partners.
Therefore, parts of the chapters 7 (Techno-economic assessment) and 8 (Sustainability),
within this report, which are not be distributed to a larger group than the case study team,
were removed before creating the deliverable.

6
4 Case study description
4.1 Current situation
Currently, the aviation sector is entirely supplied with fossil jet fuel, provided to the airport by
the refining of fossil crude oil. However, with new ASTM certified technologies, sustainable jet
fuels (SAF) can be produced for commercial application. One of these technologies is the
alcohol to jet (ATJ) process, which enables the production of a green jet fuel if bio-based
alcohol is used as a feedstock (SPK Figure 1). However, with the exception of Swedish Biofuels
small scale production delivering SAF for certification programs, there is still no commercial
production of ATJ fuel in Europe.
This case study identifies the benefits of the integration of an alcohol to jet (ATJ) process into
an existing 1G ethanol plant from a technical, economic, and environmental perspective. The
retrofit of a current maize-based bioethanol plant was studied using Swedish Biofuels ATJ (SB
ATJ) technology to produce SAF, namely synthetic paraffinic kerosene with aromatics (ATJ-
SKA). The suggested retrofit proposes the integration of the SB ATJ process into an existing
bioethanol plant in Spain. The alternative scenario to the retrofit would be the operation of
two separate plants: an ethanol plant and a standalone ATJ facility close to the airport.
Swedish Biofuels ATJ process
The Swedish Biofuels advanced ATJ process extends the use of alcohols as a raw material by
using an individual or a mixture of alcohols with two to five carbon atoms as the starting point
for SAF production. The process includes the synthesis of aromatics as well, resulting in
advanced SAF called synthetic kerosene with aromatics (SKA) (SKA, Figure 2). The advanced
SAF, produced by Swedish Biofuels process, contains the same groups of hydrocarbons as
those found in petroleum derived aviation turbine fuels namely, normal paraffins,
isoparaffins, monocyclic paraffins, dicyclic paraffins, alkylbenzenes and cycloaromatics. The
resulting SAF is identical to jet fuel derived from petroleum with the same or better physical-
chemical properties.
In the first step of Swedish Biofuels ATJ process the individual alcohols, namely, ethanol,
propanol, butanol, pentanol, or their mixtures are dehydrated to a mixture of the
corresponding olefins, which are, in subsequent stages, oligomerised to higher olefins. The
higher olefins are then condensed into higher unsaturated compounds, including aromatics.
At the final stage, the higher unsaturated compounds are hydrogenated to yield the
corresponding paraffins. In the final step, the mixed hydrocarbon product stream is separated
into gasoline, kerosene and diesel by rectification.

7
Figure 1: Overall ATJ-SPK process
Figure 2: Overall ATJ-SKA process
The Swedish Biofuels ATJ technology is innovative in its utilization of well-known process
steps, which are combined to a new production process for SAF. Another innovative aspect of
the Swedish Biofuels concept is the selection of reaction steps which makes it possible to
utilize intermediate process streams of carbon dioxide (CO₂) and hydrogen (H2), to produce
syngas and its further use for production of SAF, diesel and gasoline.
The production of ethanol, propanol, butanol and pentanol can be made using various
pathways from renewable and fossil sources. The alcohols used by Swedish Biofuels for SAF
production are obtained by: 1) sugar fermentation, 2) oxosynthesis aka. hydroformylation,
and 3) as the fusel oil by-product of ethanol production from energy crops and lignocellulosic
raw material such as forest residues. The feedstock flexibility of Swedish Biofuels ATJ process,
allowing the use of any combination of C2-C5 alcohols or a single alcohol in this range, gives a
commercial advantage to reduce the production costs.
To demonstrate that the process is independent of the precise nature of the feedstock, the
SAF has been produced by SB ATJ process both from ethanol, currently the most widely
available alcohol, and from mixed C2-C5 alcohols. As a result of Swedish Biofuels ten year’s
experiences of SAF production and the large market availability of bioethanol, this case study
is made for the combination of the production processes.
Vertex ethanol process
Bioethanol is a liquid and clean biofuel that can replace gasoline directly for use in modified
spark ignition engines or can be used in the form of different gasoline-ethanol blends (E5, E10,
E20 etc.). Currently, bioethanol is mainly produced from crops containing sugar and starch,
such as sugar beet, grain and wheat (the so-called first-generation ethanol or 1G ethanol), but
it can also be produced from agricultural residues (straw, non-food lignocellulosic materials)
and wastes. In the latter case bioethanol is considered as advanced ethanol.

8
Project partner Vertex Bioenergy owns all of the three bioethanol production facilities in
Spain, located in Galicia (Bioetanol Galicia S.A), Cartagena (Ecocarburantes Españoles) and
Salamanca (Biocarburantes de Castilla y Leon S.A.). Together with another facility in France,
Vertex Bioenergy has a total annual production capacity of 780 million litres of ethanol
(391.2 ktoe/y or 615.5 kt/y). For classification, the European production of bioethanol as fuel
has been almost stable since 2014, and was at a level of approximately 5.4 million tonnes in
2018 (Naumann, et al., 2019). In addition to bioethanol, other valuable products such as
animal feed (DDGS), electricity, captured CO2 and corn oil are produced in some of those
plants.
For the case study, bioethanol plant of Biocarburantes de Castilla y León (BCyL) has been
studied. The plant uses corn grain as raw material. In the first step, the raw material is cleaned
and milled. Then, it is mixed with water and heated with steam prior to enzyme addition. This
process allows the conversion of starch polymers into free sugars. Subsequently, the sugars
produced are fermented to obtain an ethanol-rich stream. The CO2 produced in this process
leaves the fermenter and 30% of it is being captured for other uses, reducing the overall
process emissions. After fermentation, the bioethanol-rich stream is subjected to distillation
for obtaining high-purity bioethanol. The remaining stillage is treated and dried to obtain a
protein-rich animal feed (DDGS, distillers dried grains with solubles). In order to fulfil the
thermal energy demand of the process, this facility has three natural gas boilers producing the
steam required for the plant, and a gas turbine, where electricity is generated. The hot gases
from the gas turbine are used to dry the DDGS, while the electricity produced is sold to the
grid.
Figure 3 illustrates the current situation for the BCyL bioethanol plant and the current fossil
jet fuel provision at the airports.

9
Figure 3: Current situation with 1G bioethanol production for road transport fuels and jet fuel production from fossil
resources.
4.2 Suggested retrofit
The suggested retrofit proposes the integration of an ATJ-SKA process into the existing
bioethanol plant from Biocarburantes de Castilla y León in Babilafuente, Salamanca. Provided
that the reduction of CO2 emissions is greater than 60 %, this retrofit opens up the possible
creation of new sales markets for the plant concerned so as to overcome possible periods of
low ethanol demand. Furthermore, the current production and utilisation of synthetic jet fuel
in Europe is practically zero, even though the interest of airlines and logistic companies is high.
This issue might be addressed by a combined facility for the production of ethanol and ATJ.
The aim of the case study is to address the following questions:
• Which process streams of ethanol production can be used for the ATJ process?
• Is it possible to use residual products from the fermentation stage (fusel oils?)
• Would the retrofit improve the efficiency of the overall ATJ production process?
• What is the economic and ecological performance of the retrofit?
• Which aspects of the supply chain have to be considered both upstream and
downstream of the conversion plant?
The suggested retrofit concept is illustrated in Figure 4. For the retrofit scenario the ATJ
process uses alcohols as feedstock, and energy, both provided by the Biocarburantes de
Castilla y León facility. In this case study, part of the product stream (ethanol) is used as the
1G ethanol production
Fossil jet fuel production

10
alcohol source for the ATJ plant and the utilities supply the energy demand. The alcohol to be
used in the ATJ process is drawn from the ethanol plant prior to purification, since any parts
of water remaining do not adversely affect the dehydration step of the ATJ process. Without
the need to purify the alcohol, energy can be saved in the ethanol plant. Furthermore, the
flexibility of the Swedish Biofuels catalyst makes it possible to convert the fusel oils, a waste
stream from the production of ethanol, that are higher chain alcohols. The water from the
dehydration step can be recycled to the utilities of the ethanol plant.
The analysis of the existing steam boilers at the ethanol plant showed that the boilers do not
have spare capacity to provide steam to the ATJ process. Therefore, the steam needed for ATJ
process was assumed to be provided by a waste wood boiler for the retrofit scenario. It should
be noted, that the main objective of the ethanol plant retrofit is to produce sustainable
synthetic jet fuel contributing to a minimum 60% CO2 reduction, as required by airlines, by
integrating the ATJ process into the production of ethanol. Therefore, also the achievable
GHG-emission reductions when changing both the electricity and the entire process energy
demand of the process to renewable energy were calculated in a sensitivity analysis.
Figure 4: Suggested retrofit with the integration of an alcohol to jet process into the existing 1G ethanol plant.
4.3 Alternative to retrofit
The alternative scenario to the retrofit would be the operation of two separate plants: an
ethanol plant and a standalone ATJ facility close to the airport. For this case study, the airport
of Madrid is considered as the hypothetical location for a standalone ATJ plant. A similar
1G ethanol with integrated alcohol to jet production

11
concept is currently being planned by Swedish Biofuels for the airport in Arlanda, Sweden,
using green electricity from the national grid. For the case study, the concept is transferred,
making reasonable modifications to fit the Spanish framework. The ethanol production
remains unchanged, as currently produced by BCyL.
For the ATJ plant, the general process flow is run as described for the retrofit case. A major
difference can be seen in the logistics for the supply of feedstock, as a mixture of C2 – C5
alcohols could be used for the alternative process. For example, the process could use alcohols
partially from bioethanol and from butanol producers, if available. Similarly, Vertex could
supply fusel oil from different ethanol plants to the ATJ production. The feedstock would be
transported to the ATJ plant and all of the necessary infrastructure and utilities for the ATJ
process would be built for the ATJ plant only. Figure 5 exemplifies the alternative scenario of
transporting the ethanol feedstock from the 1G production plant to a stand-alone ATJ refinery
near the airport.
Figure 5: Alternative scenario to produce sustainable aviation fuel in a standalone ATJ plant, not integrated with the
production of ethanol.
1G ethanol production
ATJ production at the airport

12
5 Supply Chain
The supply chain assessment of the case study was conducted for a retrofit in Sweden, which
was initially the foreseen location. Subsequently, the case study location was changed to
Spain.
The supply chain assessment includes potential feedstocks for advanced bioethanol
production and corresponding costs and availability. Logistics and by-products are not part of
this case study. Figure 6 shows first-generation ethanol production, illustrated in blue, and
two possible retrofit options. Aviation fuel production is illustrated in orange.
Figure 6: Ethanol and aviation fuel production scheme
5.1 Feedstock type and costs
Feedstocks for production of SAF are regulated by Annex IX Part A of the RED II. Suitable
feedstocks for ethanol production according to the RED II, are the following: biomass fraction
of mixed municipal or industrial waste, straw, wine lees, corn cobs, forestry and agricultural
residues and other non-food lignocellulosic materials.
Important and available feedstocks for the production of advanced biofuels in Sweden are:
agricultural and forestry residues, lignocellulosic by-products from industry and
biodegradable fractions of municipal solid waste (MSW). Feedstocks for SAF production
should have large yields and a wide distribution area. Further they should not compete with
food production or cause deforestation. (Wei, et al., 2019)
Agricultural residues and SRC: Residues from agriculture, include straw from various crops
(wheat straw, rice husks, etc), corn stover and black/brown liquor. These residues often
remain on the fields, are used as feed, or used for energy production. Energy crops, such as
miscanthus or short rotation coppice (SRC) are grown specifically for energy production and

13
therefore are not residues. However, short rotation coppice is considered as advanced
according to RED II.
Forestry residues: Forest or logging residues include tree sections above ground, such as
branches, needles, tree top pieces, trunk sections etc., mainly from harvest operations. Since
these residues are not suitable for material use, they are chipped and used energetically.
Lignocellulosic by-products: Lignocellulosic by-products from wood processing industries,
such as saw mills or pulp and paper plants, include sawdust, bark, fibres.
Biogenic fractions of MSW: Municipal solid waste consists of fossil organic (plastics) and
biogenic fractions, such as food, paper and wood.
Figure 7 shows the development of different feedstock prices on the Swedish market since
1993. Prices are valid for district heating providers, but they are expected to be similar for
other industries. The prices are shown in SEK/MWh, without taxes (2020 exchange rate: 1 SEK
= 0.095 €). The prices of all fuels have increased over the last years. Refined fuels (pre-treated
fuels, such as pellets or briquettes) were, and still are, more expensive compared to wood
chips, by-products and recycled fuels. Wood chips and other woody by-products are similar in
price, between 160 and 200 SEK/MWh (15-19 €/MWh). The cheapest fuel for about 100
SEK/MWh (9.5€/MWh) is recycled fuel, which can be fossil, renewable or a blend of both.
Figure 7: Fuel prices excl. taxes in SEK/MWh1
The price of straw is estimated at between 5-6 €/GJ (18.0-21.6 €/MWh). Prices of logging
residues or by-products from industries in Sweden, range from 5.1-5.8 €/GJ (18.4-
1 http://pxexternal.energimyndigheten.se/pxweb/en/?rxid=ee03e1ee-e561-4ef6-8f06-aae44b13c8b3

14
20.9 €/MWh). (Wormslev, Pedersen, Eriksen, Bugge, & Skov, 2016) Harvesting and extraction
operation of forestry residues cost between 23-25 €/m³. (Lundmark, Athanassiadis, &
Wetterlund, Supply assessment of forest biomass - A bottom-up approach for Sweden, 2015)
From an economic point of view, the most interesting residual feedstocks for biofuels
production are forest residues, bark and sawdust. (Lundmark, et al., 2017)
For the production of 241,670m³/y first-generation bioethanol, 562,800 t/y of corn (with a
water content of 14 wt.%) would be needed. Estimating a price of 200 €/t corn, feedstock
costs per year amount to 112,560,000 €/y. Assuming a calorific value of corn of 18.6 MJ/kg
dm, the energy input of the feedstock amounts to 2,556,000 MWh. This indicates the following
annual feedstock costs:
• Straw (18.0-21.6 €/MWh): 46,000,000 € - 55,200,000 €
• Wood chips (19 €/MWh): 48,560,000 €
• Logging residues and by-products (15 – 20.9 €/MWh): 38,340,000 € - 53,420,000 €
These costs are just a first estimate. Real feedstock costs rely on contracts with suppliers.
Using residues reduces feedstocks costs by more than the half. However, pre-treatment, such
as drying, increases feedstock costs again. Additionally, prices are highly dependent on area,
transport distance and competing utilization.
Feedstock costs are a main part of ethanol production and represent on average 33-39% of
total production costs. (Witcover & B. Williams, 2020) Increasing biofuel production, generally
results in increasing feedstock prices. However, according to the integrated modelling
approach of (Ouraich, Wetterlund, Forsell, & Lundmark, 2018), price increases of forestry
residues will not exceed 3%, with a biofuels production target of 30 TWh by 2030. This
indicates that production of large amounts of biofuels does not significantly increase
feedstock competition. Competition is expected to be local only and affected by local
availability of forestry residues.

15
5.2 Feedstock availability and logistics
Table 1 shows the theoretical potential of feedstock
production in some parts of Sweden in 2020. Production
figures are calculated by the recognized S2Biom tool, which
was co-funded by the EU. This tool considers technical and
sustainable limits, but not the current utilization rate of the
various feedstocks. The theoretical potential of feedstock
production is allocated to Swedish regions. The different
regions are illustrated in Figure 8. Arlanda, the location of
the bioethanol production plant, is located in Östra Sverige.
This means that, due to the shorter distance, feedstock from
this region is favoured, followed by Södra Sverige and Norra
Mellansverige.
Table 1: Feedstock production Sweden [kt dm/y]2
Feedstock Södra Sverige
Östra Sverige
Norra Mellansverige
Total
Logging residues 1,293 834 769 2,896
Road side vegetation 64 38 27 129
Energy grasses 506 331 66 903
Straw 1,015 1,053 151 2,219
Grassland 431 150 36 617
Saw mill residues 3,849 916 1,389 6,154
Wood processing residues 248 201 55 504
Bark 761 346 415 1,522
MSW (biodegradable) 849 758 170 1,777
In Östra Sverige, straw, saw mill by-products and logging residues are the most available fuels.
The energy input of the feedstock has to be 2,556 GWh, which is equal to 9,201 TJ. Using
logging residues or saw mill residues (18.85 MJ/kg dm), would require an amount of about
488,150 t per year. Using straw (17.28 MJ/kg dm) would require about 532,500 t. Comparing
the theoretical production with the demand of the bioethanol production plant shows that
theoretically there would be sufficient feedstock available. However, the share of feedstock
which would be needed by the bioethanol production plant, is quite high. Additionally, the EU
emission trading system (EU-ETS), introduced in 2013, gives incentives to industries for
2 https://s2biom.wenr.wur.nl/
Figure 8: Map of Sweden

16
producing their own renewable electricity. This reduced the availability and increased the
price of wood residues for biofuel production. (Wormslev, Pedersen, Eriksen, Bugge, & Skov,
2016) An increase of biofuels production could lead to increased profitability of material-
producing industries, due to increasing demand for their by-products. (Lundmark, et al., 2017)
In the following, the use of previously mentioned feedstocks is briefly described.
Agricultural residues and SRC: The land use for agriculture in Sweden is about 8%, which is
relatively low within the EU. However, straw is produced in large amounts in Sweden. It is
mostly used for feed and bedding material for animals, but significant amounts remain on the
field for soil amendment. It is estimated that the potential of straw is about 3% of biomass
supply in Sweden. The potential is estimated to be about 1 million tonnes, equivalent to 15 PJ,
which makes straw promising as a feedstock. The availability of straw depends on location,
and there is competition with other uses. (Wormslev, Pedersen, Eriksen, Bugge, & Skov, 2016)
In 2016, about 14 ha were used to produce biomass from short rotation coppice. (Calderón,
Gauthier, & Jossart, 2018) The short-term potential of short rotation coppice is small, about
1.5 PJ. However, in order to avoid that, roundwood is used for energy generation. In the long-
term, short rotation coppice could be fostered. (Lundmark, et al., 2017)
Forestry residues: Sweden practises sustainable forest management, which means that less
wood is felled than grows back annually, resulting in a net growth of Swedish forests. In
Sweden, forests cover more than 60% of the landscape and forest biomass counts for about
85% of bioenergy, mostly for heat and power. About half of the forests are privately owned,
25% are owned by the state and the other 25% are public owners. (Wormslev, Pedersen,
Eriksen, Bugge, & Skov, 2016) In 2016, Sweden produced 74 million m³ of roundwood, which
was the highest amount within the EU. (Calderón, Gauthier, & Jossart, 2018) About 60% of
global roundwood is produced in four countries, one of them is Sweden. Therefore, the
amount of logging residues is also high and Sweden can mobilize large volumes at reasonable
prices. (Fulvio, Forsell, Lindroos , Korosuo, & Gusti, 2016) Due to changed harvesting methods
(whole tree harvesting), logging residues are becoming more important. However, not all
forest residues can be removed from the forest because of economic and ecological reasons,
since these residues provide habitat, improve soils and provide nutrients.
Production, import, export, consumption and stock of wood fuels in the EU28 Member States
is nearly balanced. Domestically produced wood fuel is often consumed in the same country.
(Calderón, Gauthier, & Jossart, 2018) In particular for residues, transport is not expected to
be economically feasible.
Logging residues are mainly used for heat and energy production. In Sweden there are about
40 power plants with more than 0.2MW. (Fulvio, Forsell, Lindroos , Korosuo, & Gusti, 2016)
Availability of logging residues depends on location and transportation distance. (Wormslev,

17
Pedersen, Eriksen, Bugge, & Skov, 2016) In general, wood residues have the most promising
potential in Sweden. The technical potential is estimated at 54-130PJ. (Wormslev, Pedersen,
Eriksen, Bugge, & Skov, 2016)
Lignocellulosic by-products:
Since the forest industry is important in Sweden, there is also a highly developed wood
processing industry. Wood fibre consumption in Sweden amounted to 81 million m³ (solid
volume), without bark. Most of the wood fibres were used in the pulp and paper industry
(46.4 million m³), followed by sawmills (33.6%) and the wood-panel industry (0.8 million m³).
By-products from the sawmills are used in the pulp and paper and wood-panel industries.
Nearly all of the residues from the pulp and paper industry are used for plant energy and
heating. (Wormslev, Pedersen, Eriksen, Bugge, & Skov, 2016) In Sweden there are about 57
pulp mills. (Fulvio, Forsell, Lindroos , Korosuo, & Gusti, 2016) About 86.4 PJ of lignocellulosic
by-products were used for energy production and could be partly also used for biofuels
production (Wormslev, Pedersen, Eriksen, Bugge, & Skov, 2016) The potential of
lignocellulosic by-products in Sweden is estimated as high.
Biogenic fraction of MSW: Waste from households is mainly used for decentralized heat and
power plants and district heating. The demand for incineration is higher than domestic
production, which leads to import, mainly from Norway. The most common method for
treatment of biodegradable fractions of municipal solid waste is anaerobic digestion, for the
production of biogas, heat and electricity. (Wormslev, Pedersen, Eriksen, Bugge, & Skov, 2016)
In 2015, Sweden had 33 operational Waste-to-Energy plants and treated 5.62 million tonnes
of waste thermally. (Calderón, Gauthier, & Jossart, 2018) The potential is seen as low, due to
large import and long transport distances. (Wormslev, Pedersen, Eriksen, Bugge, & Skov,
2016)
Future feedstock demand is expected to increase, due to increasing demand for SAF. The study
“Sustainable jet fuel for aviation” by (Wormslev, Pedersen, Eriksen, Bugge, & Skov, 2016)
estimate future feedstock demand via three scenarios regarding fuel conversion efficiency
(low 5%, medium 15% and high 25%) An average energy content of 15 GJ/t (dried wood
residues 20 GJ/t, waste 10 GJ/t) is assumed. According to that study, in 2020, the amount of
feedstock needed for SAF production in Sweden lies between 140 and 700 kt, in 2030 between
1,500 and 7,500 kt and in 2050 between 4,000 and 21,000 kt.
5.3 Conclusion on supply chain
In this case study, the following feedstocks were considered: agricultural and forestry
residues, lignocellulosic by-products and biogenic fractions of municipal solid waste. The latter
show only low potential in Sweden. From an economic point of view, the most interesting
residual feedstocks for biofuels production are wood residues and lignocellulosic by-products,

18
in particular bark and sawdust. In Östra Sverige, straw, saw mill residues and logging residues
are the most available fuels. However, the size of the plant would require a high share of the
potential feedstocks (see Table 2).
Table 2: Feedstock availability Sweden (dm = dry matter)
Feedstock Availability [kt dm/y]
Demand [kt dm/y]
Demand [%]
Straw 1,053 606 57.5
Saw mill residues 916 555 60.6
Logging residues 834 555 66.5
Since the current utilization of the various feedstocks is hard to estimate, it is expected that
either some different feedstocks have to be used, or transport distance has to be increased.
Additionally, sustainability criteria, e.g. from RED II, have to be considered.
6 Market assessment
The market assessment of the case study was conducted for a retrofit in Sweden, which was
initially the foreseen location. Subsequently the case study location was changed to Spain.
The market assessment of this case study gives an overview of the European conventional
aviation fuel (CAF) market, sustainable aviation fuel (SAF) market and advanced bioethanol
market. Additionally, bioethanol production costs and the legal and political framework
regarding carbon free aviation in the EU and Sweden are addressed.
6.1 Market overview
6.1.1 EU conventional aviation fuels (CAF) market
According to Fuels Europe the demand for CAF in the EU amounted to 62.8 million tonnes in
2018.3 More than 3.8 billion passengers were transported by air in 2016 and this amount will
double over the next 20 years. The largest and fastest growing air passenger markets are the
USA, China and India. (Wei, et al., 2019) In 2016, the final energy consumption of international
aviation amounted to 47,482 ktoe (equal to 46,3 million t) and of domestic aviation in EU28 it
amounted to 5,849 ktoe (equal to 5.7 million t). All of this CAF had fossil origin, according to
Bioenergy Europe. (Calderón, Gauthier, & Jossart, 2018) The development of CAF
consumption, production and import is shown in Figure 9. Since 2012, consumption rose
3 https://www.fuelseurope.eu/dataroom/static-graphs/
19
steadily up to nearly 60,000 kt in 2018. CAF consumption is expected to increase further at a
1.5% annual growth rate. (Wei, et al., 2019)
Figure 9: Net trade flows for CAF in EU28 (in kt)4
In Europe, almost 100 refineries were operating, but due to uneconomic conditions caused
by, gasoline overproduction, among others, 16 of them have already shut down. Production
capacity and utilization rate are both decreasing. However, this situation was a driving force
for biorefineries in some cases. (Chiaramonti & Goumas, 2019) Before 2000, the EU28 was
exporting CAF, since then it is imported. The amount of imported CAF was growing
continuously and reached 18,300 ktoe (equal to 17.8 million t) in 2017. (EUROSTAT, 2019) The
main suppliers for CAF in the EU are countries from Middle East (60%) and Asia (30%). There
is a lack of domestic CAF supply, the import dependency lies above 30%. (Chiaramonti &
Goumas, 2019)
According to the EU Reference Scenario, the current share of CAF in final energy demand in
the transport sector is about 16%. A slight increase to 17% by 2030 and up to 18% by 2050 is
estimated. (Capros, 2016) Aviation needs about 12% of the refined products. (Chiaramonti &
Goumas, 2019)
4 https://www.fuelseurope.eu/dataroom/static-graphs/

20
In 2015, fuel costs accounted for about 27% of airlines operation costs. (Wei, et al., 2019) The
development of CAF price is shown in Figure 10. The average price is expected to increase at
a 2.7% annual growth rate. (Wei, et al., 2019) The price of CAF is highly dependent on the
crude oil price. The price drop in early 2020 can be explained by the Covid-19 pandemic. The
resulting economic crisis and lockdowns within several member states led to CAF being
cheaper than crude oil. Prices are expected to rise again, but further development is unclear.
Figure 10: Aviation fuel and crude oil price development (in $/barrel)5
Sweden
Sweden has a large number of airports. Stockholm Arlanda, Stockholm Bromma, Göteborg
Landvetter and Malmö are the most important ones. Jet-A1 is imported through major ports,
such as Gävlehamn (Port of Gävle) and further delivered by train to Arlanda. The Swedish
airline industry employs 44,000 people and contributes 2.77 billion € to the Swedish GDP.
Sweden is export dependent and therefore air freight is important for the economy.
(Wormslev, Pedersen, Eriksen, Bugge, & Skov, 2016) In Sweden, CAF demand in 2014 was
about 1,196 million litres (equal to 964 kt), about 99% of it was Jet-A1. A long-term traffic
forecast by Swedavia (Swedish aviation infrastructure company) indicates annual passenger
growth of about 2.1% over the next three decades in Sweden. The total increase of departing
5 https://www.iata.org/en/publications/economics/fuel-monitor/

21
passengers is estimated to be 27% between 2017 and 2030. The number of departing
passengers in 2030 is estimated to be about 29.65 million, compared with 23.37 million in
2017. (Statens Offentliga Utredningar, 2019)
A projection of future demand was made by the Danish Energy Agency and the PRIMES model
of the EU, using EUROSTAT data, among others. According to this projection Sweden will have
a CAF demand of about 1,199 million litres (equal to 966.4 kt) in 2050 (Wormslev, Pedersen,
Eriksen, Bugge, & Skov, 2016) However, due to the current Covid-19 pandemic, the resulting
economic crisis and the drop of oil prices, predictions of future demand are expected to
become less accurate.
6.1.2 EU bioethanol market
The EU produced about 3.53 million t of bioethanol in 2017. The production capacity is
estimated to be about 7.07 million t. 81% of the bioethanol produced is used in the transport
sector. (EurObserv'ER, 2019) Figure 11 shows the development of first-generation bioethanol
production and consumption in the EU from 2007 to 2018. One can see the formation of a
market equilibrium, through an alignment of supply and demand. (Naumann, et al., 2019)
Figure 11: Development of EU bioethanol market (Naumann, et al., 2019)
More than 50% of bioethanol produced in the EU comes from Germany, France and the UK.
(EurObserv'ER, 2019) In 2016, Sweden had a bioethanol production capacity of 178 kt and
produced 172.6 kt. 3.1 kt of bioethanol were imported to Sweden. (Calderón, Gauthier, &
Jossart, 2018) In 2018, Sweden consumed 206.4 kt bioethanol. (EurObserv'ER, 2019)

22
The current production of advanced bioethanol in the EU is estimated at around 50 million
litres. (Flach, Lieberz, & Bolla, 2019) This is equivalent to 39,700 t/y, assuming a density of
0.794 kg/l. Most advanced bioethanol producers utilize agricultural residues, such as wheat
straw or corn stover. Borregaard, Domsjö Fabriker and AustroCel Hallein are utilizing brown
liquor from wood pulping for their production. St1 is fermenting organic wastes to bioethanol.
(ETIP Bioenergy, 2020)
Table 3 lists operational advanced bioethanol production facilities in Europe. The joint
capacity amount to 63,420 t/y. This indicates a current capacity utilization of about 60%.
Table 3: Operational advanced bioethanol production facilities6
Company Country City TRL Start-up year Capacity (t/y)
Borregaard Industries ChemCell Ethanol
Norway Sarpsborg 9 1938 15,800
Domsjö Fabriker Sweden Ornskoldsvik 8 1940 19,000
St1 Cellulonix Kajaani
Finland Kajaani 6-7 2017 8,000
St1 Etanolix Jokioinen
Finland Jokioinen 9 2011 7,000
Chempolis Ltd. Biorefining Plant
Finland Oulu 6-7 2008 5,000
St1 Etanolix Gothenburg
Sweden Gothenburg 9 2015 4,000
Clariant Sunliquid
Germany Straubing 6-7 2012 1,000
St1 Etanolix Hamina
Finland Hamina 9 2008 1,000
St1 Etanolix Vantaa
Finland Vantaa 9 2009 1,000
St1 Etanolix Lahti
Finland Lahti 9 2009 1,000
IFP Futurol
France Bucy-Le-Long 6-7 2016 350
SEKAB Biorefinery Demo Plant
Sweden Ornskoldsvik 8 2004 160
Borregaard BALI Biorefinery Demo
Norway Sarpsborg 6-7 2012 110
Table 4 lists advanced bioethanol production facilities, which are currently under construction.
The joint capacity amounts to 96,000 t/y. (ETIP Bioenergy, 2020)
6 http://www.etipbioenergy.eu/images/ETIP-B-SABS2_WG2_Current_Status_of_Adv_Biofuels_Demonstrations_in_Europe_Mar2020_final.pdf
23
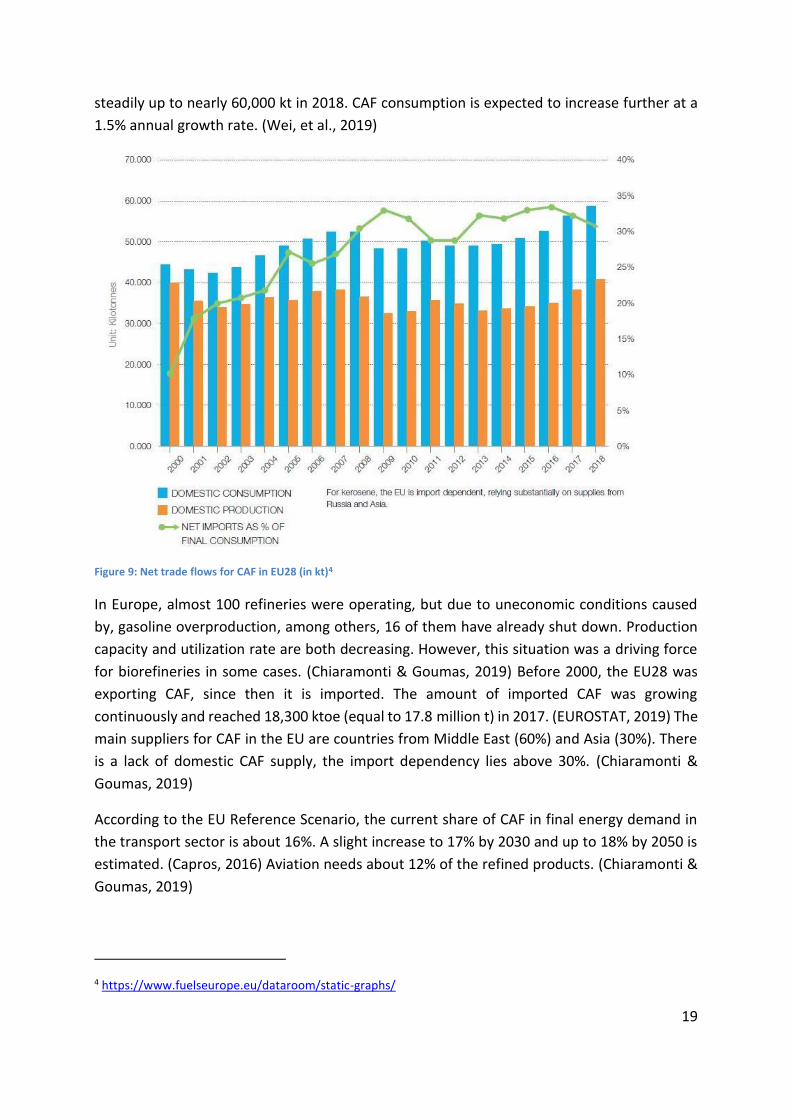
Table 4: Advanced bioethanol production facilities under construction
Company Country City TRL Start-up year Capacity (t/y)
Clariant Romania
Romania Podari 8 2021 50,000
AustroCel Hallein Austria Hallein 8 2020 30,000
ArcelorMittal Ghent Steelanol
Belgium Ghent 9 2020 16,000
Following advanced bioethanol production facilities, with a joint capacity of 380,000 t/y, are
planned for the next years (see Table 5).
Table 5: Planned advanced bioethanol production facilities
Company Country City TRL Start-up year Capacity (t/y)
Kanteleen Voima Nordfuel biorefinery
Finland Haapavesi 6-7 2021 65,000
INA
Croatia Sisak 8 - 55,000
Enviral Leopoldov Site
Slovakia Leopoldov 9 - 50,000
St1 Cellulonix Kajaani 2
Finland Kajaani 8 2024 40,000
St1 Cellulonix Pietarsaari
Norway Pietarsaari 8 2024 40,000
St1 Cellulonix Follum
Norway Ringerike 8 2024 40,000
Versalis Crescentino restart
Italy Crescentino 8 2020 40,000
ORLEN Poludnie Jedlicze Site
Poland Jedlicze 9 - 25,000
Sainc Energy Limited Cordoba
Spain Villaralto 8 2020 25,000
The current production capacity of advanced bioethanol in Europe amounts to 63,420 t/y. A
further capacity of 96,000 t/y is currently under construction. Additionally, a capacity of
380,000 t/y is planned, most of it by 2024. If all of the planned plants are constructed, the
total advanced bioethanol production capacity of Europe will be 539,420 t/y (see Figure 12).

24
Figure 12: Advanced bioethanol production capacity in Europe (in thousand tonnes per year)
Sweden is already investing in advanced biofuels production. Currently there are three
advanced bioethanol production plants in Sweden, with a joint capacity of 23,160 t/y..
Based on the data of the EU Reference Scenario and considering the 7% cap and the ILUC
Directive, 10-15 Mtoe (equal to 15.7-23.5 million t) of advanced bioethanol production is
feasible by 2030. About the same amount of advanced renewable diesel (HVO) is feasible by
2030. These amounts of advanced biofuels would represent 6% to 9% of the total energy use
in the European transport sector, without double counting. In order to realize this scenario for
advanced bioethanol, each year 5-10 plants would need to be installed. According to SGAB,
there would be enough biomass, waste streams and residues available to reach this scenario.
(Maniatis, Landälv, Waldheim, van der Heuvel, & Kalligeros, 2017)
The main barriers for cellulosic bioethanol are high research and production costs and
regulatory uncertainties. (Flach, Lieberz, & Bolla, 2019) Feedstock availability, quality and
price variations are not seen as a burden for an increase in advanced bioethanol production.
(IRENA, 2019) It is estimated that lignocellulosic bioethanol will find suitable conditions for
market development considering RED II. (Chiaramonti & Goumas, 2019)
Currently, there is no global trade in advanced bioethanol. A scenario of a study conducted by
E4tech estimates a supply of advanced bioethanol outside of the EU of about 3.6 billion litres
(equal to 2.9 million t) by 2030. Half of it is expected to be produced in the USA. It is further
estimated that only about 0.9 billion litres (equal to 0.7 million t) would be available for import
to the EU. This is due to incentives for advanced bioethanol within the USA. It is estimated
that there would be enough lignocellulosic waste and residues to produce up to 718 billion
litres (equal to 570.1 million t) advanced bioethanol worldwide by 2030. This indicates that
feedstock availability is not limiting future EU imports. (E4tech, 2019)

25
6.1.3 Advanced bioethanol production costs
In general, biofuels are more expensive than fossil fuels. A main part of biofuel production
costs is the feedstock cost. Therefore, biofuels based on waste streams seem to be the most
competitive, except if an intensive pre-treatment of the waste stream is necessary. It is
expected that in the mid to long-term, competitiveness of advanced bioethanol will increase,
due to economies of scale and learning curve effects. (Festel, Würmseher, Rammer, & Boles
Eckhard, 2014) However, production costs of advanced biofuels have not decreased in recent
years. On average, feedstock costs represent 33-39% of total costs and operation costs
represent 33-42%. (Witcover & B. Williams, 2020) Table 6 shows total lignocellulosic
bioethanol production costs in low, medium and high cost scenarios. According to that,
production costs vary between 85 and 158 €/MWh (equivalent to about 630 €/t and
1,180 €/t). Considered are: capital costs, costs for feedstock, enzymes and operation and
maintenance. (Landälv, Waldheim, Maniatis, van den Heuvel, & Kalligeros, 2017) The report
“Advanced Biofuels – Potential for Cost Reduction”7, published by IEA Bioenergy Task 39 in
2020, confirmed that these cost estimations are still reasonable.
Table 6: Production costs of lignocellulosic bioethanol (Landälv, Waldheim, Maniatis, van den Heuvel, & Kalligeros, 2017)
6.1.4 EU sustainable aviation fuels (SAF) market
In EU28 the production capacity of pure SAF amounted to 1,000 t/y from 2015 to 2017 and
increased to 7,000 t/y in 2018, according to EUROSTAT. Since 2011, 22 airlines were
performing more than 3,000 commercial passenger flights, using SAF blends (up to 50%). In
2016, 4.5 million litres (equal to 3,600 t/y) of SAF were produced globally. Which is double the
amount of 2015. (Wei, et al., 2019)
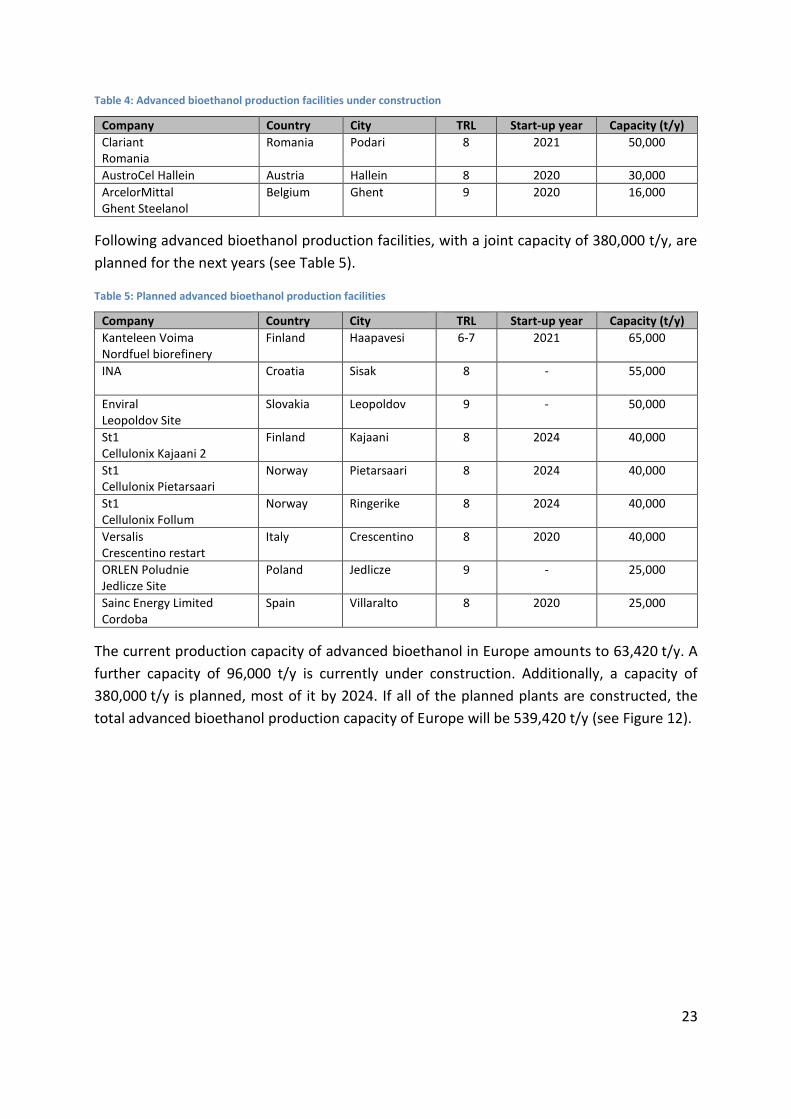
Figure 13 shows a scenario analysis conducted by ICAO. The low scenario would replace 4% of
CAF. For that, an annual SAF production of 20 million t/y would be needed by 2050. The
7 http://task39.sites.olt.ubc.ca/files/2020/02/Advanced-Biofuels-Potential-for-Cost-Reduction-Final-Draft.pdf
26
maximum scenario of 100% SAF would require the construction of about 170 new
biorefineries every year from 2020 to 2050. Both scenarios would require a production of SAF
of 5 million t/y by 2025. However, off-take agreements only covered 0.9 million t/y in 2017.
(Chiaramonti & Goumas, 2019) It is expected that low quota obligations of SAF will have a
negligible effect on demand for air travel services and aviation fuels. Example: A blend-in ratio
of 20% is causing a price increase of 16% for fuel, which increases ticket prices by 4.8%.
(Wormslev, Pedersen, Eriksen, Bugge, & Skov, 2016)
Figure 13: Expected aviation fuel consumption (ICAO)8
Global aviation fuel consumption will increase to 22.88 EJ (equal to 532.6 million t) in 2040.
The global potential of energy from residual lignocellulosic biomass was 42.54 EJ/y in 2005.
Global SAF production could reach (estimated) 21.46 EJ (equal to 499.1 million t), which would
be about 94% of global aviation fuel consumption in 2040. (Wei, et al., 2019)
Demand for SAF is rising, but there are still challenges. The main challenges are feedstock
availability, economics and sustainability. (Wei, et al., 2019) SAF can be produced in a price
range of 0.8-2.2 €/l. In comparison CAF production costs are about 0.25 €/l. The costs of SAF
are about 3 to 9 times higher compared to CAF. Also, the current ETS carbon price (about
24€/tCO2) is not sufficient to fill this gap. (Wormslev, Pedersen, Eriksen, Bugge, & Skov, 2016)
Sweden
The current market share of SAF in Sweden is still small, but there are some initiatives, such
as the Fly Green Fund Initiative and ongoing research. The aviation industry in Sweden shows
8 https://www.icao.int/Meetings/CAAF2/Documents/CAAF.2.WP.006.4.en.Revised.pdf

27
great interest and the potential for increasing SAF in Sweden is promising. SAF demand in
Sweden is assumed to be 160 million litres (equal to 129 kt) by 2030, and 450 million litres
(equal to 362.7 kt) by 2050, according to (Wormslev, Pedersen, Eriksen, Bugge, & Skov, 2016).
Sweden already has a production capacity of 23,160 t/y advanced bioethanol production,
which could be further processed to SAF. Additionally, there is the PREEM refinery in
Gothenburg, currently co-processing tall oil to produce diesel with renewable content for road
transport. This refinery could also produce SAF in future, using existing infrastructure.
(Wormslev, Pedersen, Eriksen, Bugge, & Skov, 2016) SAF can be produced with various
feedstocks via various production pathways. Therefore, future SAF production is hard to
estimate.
The ATJ pathway for SAF production has a good chance to enter the commercialization stage,
once adequate economic conditions are available. (Chiaramonti & Goumas, 2019) The price
of SAF produced from the market available ethanol (ATJ-SKA produced from Swedish Biofuels)
is expected to be three to five times higher than that of Jet A-1, which is a CAF. The price of
the feedstock is the main factor for the production cost of SAF. Using the ability of Swedish
Biofuels ATJ technology to convert syngas, SAF production costs can be decreased by using
90% syngas and 10% alcohol. If additionally, wood waste is used as feedstock, the ATJ SAF
price will come close to that of Jet A-1. (Zschocke, 2012)
Swedish Biofuels currently runs a small production plant, which produces around 5 l/h, 24 h a
day of mixed product. Around half of it is SAF, with an annual production of SAF of about 16 t.
A future production capacity of 20,000 t/y of fuels is planned. The volume of SAF from such
production is about 1% of jet fuels consumed by Arlanda airport.
In 2018, the Swedish Government appointed a special inquiry to describe and quantify
supplementary measures to reach national climate targets. If a reduction obligation is
introduced, the inquiry assumes the following results for total SAF demand and associated
costs. The total amount of SAF will be 10.9 kt by 2021, 56.4 kt by 2025 and 341.7 kt by 2030.
The total additional costs of SAF utilization is expected at 162 million SEK in 2021, 560 million
SEK in 2025, reaching 2,544 million SEK in 2030. More details of the inquiry can be found in
chapter 6.2. The total additional costs will affect ticket prices for passengers. It is estimated
that the price for a domestic one-way ticket from Sweden will increase by 3 SEK in 2021, 10
SEK in 2025 and 41 SEK in 2030. For European flights these additional costs are expected to
double (6 SEK in 2021, 19 SEK in 2025 and 78 SEK in 2030). And for intercontinental flights the
prices will increase by 19 SEK in 2021, 61 SEK in 2025 and 250 SEK in 2030 (Statens Offentliga
Utredningar, 2019).
Additional costs for SAF will be a burden for passengers. Their willingness to pay is estimated
to be insufficient, which makes policy measures to promote an increase of SAF, even more
important. The lowest production cost for SAF is estimated to be about 8-10 SEK/l. In

28
comparison, fossil jet fuel costs about 6 SEK/l. Selling price of SAF, taking supply and demand,
growing production capacities and a certain profit margin into consideration, is estimated at
18 SEK/l by 2021, 14 SEK/l by 2025 and 12 SEK/l by 2030. (Statens Offentliga Utredningar,
2019)
Possible co-products of the SB ATJ process are other transport fuels or biochemicals, which
are of interest to the chemical industry. Currently companies operating naphtha crackers are
interested in buying bio-based naphtha from companies like NESTE or UPM, in order to add
green feedstock to its chemical production processes. Adding high value chemicals to SAF
production output can improve the overall business case.
6.2 Legal and political framework for sustainable aviation in the EU and Sweden
Aviation is a policy-driven area, where the political framework determines the development
of markets, research and investments. Policy can provide significant support. EU emission
targets alone only lead to minor increase in SAF production. Additional subsidies are necessary
in order to reach the 14% target, and the 0.2% advanced biofuels target by 2022 of the RED II.
Most of the Member States have more than enough sustainable feedstock to meet these
targets, however incentives for advanced biofuels and SAF are small. E.g. RED II includes a 1.2
multiplier for replacing fuel in the aviation sector. However, EU aviation industry would prefer
full double-counting in order to achieve economic sustainability. (Chiaramonti & Goumas,
2019)
The RED II established the framework that will drive the market of SAF. However, follow-up
actions from EU and MS are still necessary. Investments can only occur in stable, long-term,
and well-defined policy framework, in particular for the aviation sector, given the procedural
and technical complexity. RED II policy provisions have to be implemented quickly and in an
economic and doable way in order to develop a market for SAF in Europe. Therefore, scaling
up the production capacities of SAF will be required and large investments (demonstration,
certification, plants) have to be taken. (Chiaramonti & Goumas, 2019)
The International Civil Aviation Organization (ICAO) is developing a Carbon Offsetting and
Reduction Scheme for International Aviation (CORSIA). ICAO set the ambitious target of 50%
GHG emission reduction until 2050 (compared to 2005). CORSIA aims to implement that each
airline has to compensate its emissions, above a baseline. A first pilot phase, is planned for
2021-2023, followed by a voluntary phase from 2024-2016 and, finally by a mandatory phase
from 2027-2035. This scheme aims for offsetting 80% of the air traffic growth after 2020.
(Chiaramonti & Goumas, 2019)
Coordination of RED II and CORSIA will be crucial for the aviation sector. Key components of
both policies are minimum sustainability criteria and how these are ensured and certified.
Mandates for SAF were already announced by some Member States. It is likely that Sweden

29
also has such plans. SAF volumes produced must be registered, they have to be accounted
under both, RED II and CORSIA. CO2 savings calculation need particular attention, since there
are differences in national emission counting. It must be ensured that the transposition of
these two schemes in MS legislation takes this into account to avoid carbon counting conflicts.
However, GHG emission reduction requirements are quite different (10% for CORSIA, 65% for
RED II). (Chiaramonti & Goumas, 2019)
In 2011, the European Commission, in coordination with airlines and biofuel producers,
launched the “European Advanced Biofuels Flightpath”9 initiative to develop and promote a
roadmap targeting a production of 2 million tonnes of SAF by 2020. During the life time of the
initiative and over more than ten years, the Flightpath core team, of which Swedish Biofuels
was an active member, contributed a significant amount of time to support the SAF value
chain development and promote the production, storage and distribution of SAF. Despite the
production target of 2020 not being reached, a number of significant achievements have been
made including seven ASTM certified pathways for SAF production, longer term policies,
implementation of mandates and other SAF incentives at a national level. Furthermore, a
number of substantial obstacles related to economics, policy and market related issues, were
identified and addressed.
The current projects and initiatives, such as “Bioport Holland”10 or IATA11 also aim for
supporting SAF production in Europe. For example, IATA introduced three emission targets for
the whole aviation industry. One is to cut net emissions in half by 2050 compared to 2005.
Examples for European airlines, with long-term contracts for SAF are Lufthansa and KLM. (Wei,
et al., 2019)
The price of CAF is much lower than that of SAF. Therefore, incentives or compensation
mechanisms are needed to overcome the price gap for airlines and to create a market, attract
investors and to reduce risks. Efforts for further cost reduction should be focused (feedstock
productivity, cheap catalyst, equipment, reaction conditions, etc.) (Wei, et al., 2019)
Supporting policies and research are key for large-scale deployment of SAF, e.g. for sustainable
feedstock production. Innovative feedstocks, which require minimum resources in terms of
land, water quality and nutrients should be developed. E.g. the USA`s Renewable Fuel
Standard (RFS) increases the availability of price-competitive SAF with support and incentives
for agriculture and technology providers. (Wei, et al., 2019)
Carbon pricing would increase the competitiveness of SAF (Wei, et al., 2019) The price gap
between fossil fuels and biofuels in aviation is even higher than in road transport. Additionally,
9 https://www.biofuelsflightpath.eu/about 10 https://www.icao.int/environmental-protection/GFAAF/Pages/Project.aspx?ProjectID=37 11 https://www.iata.org/

30
aviation fuels are often tax exempted. This makes policies even more important in order to
create a market. (Chiaramonti & Goumas, 2019) Aviation is responsible for about 2% of CO2
emission induced by humans and about 12% CO2 emissions in the transport sector. Since 2012,
flights entering the EU are required to pay for CO2 emissions due to the EU Emission Trading
System (ETS) (Wei, et al., 2019)
Decarbonization of the aviation sector is a main driver for SAF. However, new SAF has to be
certified by ASTM, which is a long and expensive process (3 norms, certification process). The
certification process brings technical and financial barriers. Given the estimation that the
average certification process needs about four years and that the RED II covers 10 years, the
need for stable and long-term policies in order to find investors is even more clear.
(Chiaramonti & Goumas, 2019)
ATJ-SPK is already certified by ASTM. Possible feedstocks are: biomass used for starch and
sugar production and cellulosic biomass for isobutanol and ethanol production. ATJ-SPK can
be blended up to 50% (ICAO, 2018). Once it is certified, it is suggested that SB-SKA can be used
as 100% neat fuel for flights (Wormslev, Pedersen, Eriksen, Bugge, & Skov, 2016).
Sweden
At the time of writing the report, there were no mandatory measures for increasing the share
of SAF in Sweden. E.g. Indonesia has a SAF mandate of 2%, rising to 5% until 2025. However,
the option of a fuel quota obligation system has been under investigation by the Swedish
Energy Agency and the Swedish Transport Agency. However, the ticket prices would be
increased and this would result in Swedish airlines being less competitive. Some voluntary
initiatives, such as the Fly Green Fund Initiative mechanism are gaining popularity.
The Ministry of Environment and Energy of Sweden published Sweden`s draft integrated
national energy and climate plan (NECP), according to European Regulation. This draft report
is a summary of Sweden`s climate change and energy policies. Climate targets are shown in
Figure 14. (Ministry of the Environment and Energy)

31
Figure 14: Overview on Sweden`s climate targets (Ministry of the Environment and Energy)
Domestic aviation is excluded from the reduction of -70% of emissions from domestic
transport, since aviation is included in the EU-ETS. However, emissions from domestic flights
are included in the zero net-emission until 2045 target. Currently, aviation causes about 1% of
Sweden`s GHG emissions. (Swedish Climate Policy Council, 2019)
Additionally, the Ministry of Environment and Energy of Sweden, published “The Swedish
climate policy framework12”, in 2017. It includes the Climate Act (started January 1st, 2018),
Sweden´s climate goals and it introduced an independent Climate Policy Council. (Wormslev,
Pedersen, Eriksen, Bugge, & Skov, 2016) This independent climate policy council is evaluating
policies and the progress to achieve the climate goals. (Ministry of the Environment and
Energy, 2017) The report of the Swedish Climate Policy Council, published in 201913,
summarizes that the progress to achieve the climate goals is too slow. One reason is that
sectors included in the EU-ETS (e.g. aviation) account for almost 40% of Sweden´s GHG
emissions and there is currently no mechanism to bring these emissions to net zero. However,
in April 2018, an excise duty was introduced on air travel and there was also an inquiry14 into
a greater use of biofuels for aviation reported. (Swedish Climate Policy Council, 2019) The tax
is on commercial flights and is paid from the airline for passengers travelling from a Swedish
Airport. Dependent on the final destination, there are various levels of tax (SEK 61, 255, 408).
(Ministry of the Environment and Energy)
12 https://www.government.se/495f60/contentassets/883ae8e123bc4e42aa8d59296ebe0478/the-swedish-climate-policy-framework.pdf 13 https://www.klimatpolitiskaradet.se/wp-content/uploads/2019/09/climatepolicycouncilreport2.pdf 14 https://www.regeringen.se/493238/contentassets/6d591e58fd9b4cad8171af2cd7e59f6f/biojet-for-flyget-sou-201911

32
Inquiry “Biojet för flyget”
The Inquiry “Biojet för flyget” was published in 2019. Tasks are, analysing how biofuels for
aviation can be supported, and finding answers for the questions which policies are suitable
and what blending ratio is reasonable. The main proposal for reducing GHG emissions is a
reduction obligation for aviation fuels. For that, fuel suppliers would need to blend CAF with
SAF. The volume ratio for SAF needs to meet the reduction obligation, depending on GHG
emission reduction. In contrast to a blending obligation, a reduction obligation favours SAF
with high GHG emission reduction. However, there is no ceiling for total CAF emissions, which
could lead to an overall increase in emissions if demand for aviation fuels is increasing
drastically.
Reduction levels are set until 2030 (27%), targeting 100% SAF by 2045. If the reduction
obligation is unfulfilled, there would be a reduction obligation fee, which is significantly higher
than the cost of blending SAF. In order to reach sufficient production capacity, investments of
about 5 billion SEK are estimated.15
The reduction obligation could impact climate with two different effects, fuel shift (CAF is
replaced by SAF) or altered travel patterns (reduced flying, transfer with other mode of
transport). Figure 15 shows the climate impact of these effects, calculated with reference
scenarios, compared to 2017. GHG emission reduction of fuel shift is expected to be much
higher than of reduced flying. (Statens Offentliga Utredningar, 2019)
Figure 15: Climate impact - fuel shift, altered travel patterns
15 http://fossilfritt-sverige.se/in-english/roadmaps-for-fossil-free-competitiveness/roadmap-the-aviation-industry-summary/

33
It is estimated that biofuels will contribute as a central part for GHG emission reduction until
2030. Therefore, the requirements on how to produce SAF with high GHG emission reductions
were also studied in this case study as part of the sensitivity analyses in the sustainability
assessment. However, there are still uncertainties regarding price and supply development
due to competing demand for biomass from aviation, shipping and other industries (Swedish
Climate Policy Council, 2019) SAF can be only one measure to reduce GHG emissions.
Increasing efficiency, electrification etc. are also needed to achieve Sweden`s climate targets.
(Statens Offentliga Utredningar, 2019)
Disclaimer: The assessment of the political framework for fossil carbon free aviation in the EU
and Sweden was conducted in 2020 and 2021. Some of the details may have changed since
the study was done.
6.3 Conclusions on market
Even though there is huge interest in SAF from Swedish aviation industry and initiatives, SAF
production rises slowly. The projected SAF demand for Sweden by 2030 is higher than current
total global SAF production. Main barriers for SAF deployment are economic, policy and
market related issues. Biomass feedstock costs vary and have high contribution on SAF
production costs. However, research regarding feedstock and production pathways is
estimated to decrease costs of SAF significantly. Additionally, European and national climate
goals foster the use of advanced biofuels, also in aviation sector. Sweden´s target of fossil free
aviation until 2045 is seen as a main driver towards SAF production. Several Member States
are already investing in advanced biofuels production and there is a huge increase in capacity
and production planned in Europe. Main uncertainty is still regarding long-term policies, which
would have major contribution on investments and subsequent market growth.
7 Techno-economic assessment
The economic feasibility of the retrofit was determined by using economic metrics, such as
IRR and NPV. In addition, a sensitivity analysis was performed to understand the impact of
variation in premium and OPEX on the economic feasibility. Using the current input values and
assumptions, the retrofit is economically feasible, with an NPV of 8.6 M€, an IRR of 30.1% and
a payback period of 3 years. However, the investment is relatively small compared to the cash
flow. For this reason, a small decrease in the premiums for the bio-based fuels, or a small
increase in the OPEX will quickly result in negative economic metrics, which decrease rapidly
with decreasing premiums or increasing OPEX costs. Should the premium for bio-based jet
fuels reach below 1,100 €/t, or the OPEX costs increase by 1.5%, the retrofit becomes
economically unfeasible. On the other hand, this also means that small increases in the

34
premium and small decreases in the OPEX will result in very positive economic metrics. For
example, an increase in premium for bio-based jet fuel to 1,400 €/t results in an NPV of 52.2
M€, an IRR of 126.8 %, and a payback period of 0.8 years. Moreover, a decrease in OPEX of 2%
results in an NPV of 20.5 M€, an IRR of 57% and a payback period of 1.8 years. Overall, the
retrofit is economically feasible, however, due to the large impact of small changes in the
OPEX or profit, there are high risks associated with the uncertainties.
8 Sustainability
The present work investigated the environmental performance of the integration of the ATJ-
SKA process into the existing 1G ethanol plant. A thorough life cycle analysis has been carried
out for this purpose employing the REDII and the Impact 2002+ methodology.
The total GHG emissions for the production of 241,670 m3 of BCyL bioethanol (current
situation) are evaluated at 296,831 tCO2eq./y (with CO2 use.) The relevant GHG emissions
figure per 1 MJ of final ethanol is 53.26 gCO2eq./MJ. This value agrees with the value in the RED
II Directive, estimating the GHG emissions at 56.80 gCO2eq./MJ. Having addressed the entire
life cycle of the BCyL bioethanol production facility, it can be argued that the operation of both
the natural gas cogeneration system and the natural gas-fuelled boilers are the most
important contributors to GHG emissions, due to the main pollutants emitted (e.g. carbon
dioxide (CO2), nitrogen oxides (NOx), organic compounds gases, etc.) when burning natural
gas.
On the other hand, the GHG emissions related to the ethanol facility retrofitted with the ATJ-
SKA process amount to 455,658 tCO2eq/y. The main adverse impact is associated with the grid
electricity supply to cover the electricity intensive processes of both productions, with the
required electricity being supplied by the Spanish electricity mix, which is still dominated by
fossil fuels (oil, gas and coal). The corresponding GHG emissions figure per 1 MJ of final fuels,
namely, avgas, jet fuel, diesel, gasoline and condensate products, are estimated at 52.23
gCO2/MJ. This value is comparable with values in the relevant literature, estimating GHG
emissions of renewable jet fuel at 71 gCO2/MJ16. A large-scale penetration of renewables in
the electricity generation mix alone, will lead to a more environment-friendly energy
production approach, improving the environmental footprint of the retrofitted facility. More
specifically, a potential increase of renewable energy – from 37% to 74% - in the electricity
mix will cause a decrease in the total global warming potential in the order of 21%. In addition,
16 De Jong S, Antonissen K, Hoefnagels R, Lonza L, Wang M, Faaij A and Junginger M. Life-cycle analysis of greenhouse gas emissions from renewable jet fuel production. BIOTECHNOLOGY FOR BIOFUELS 10 (64); 2017. JRC106178

35
when the renewables share in the generation mix is expected to reach 100%, there is going to
be a further decrease in the GHG emissions (about 23% as compared to that of 74% RES).
The GHG emissions for the stand-alone ATJ-SKA process (bioethanol delivered by truck to the
ATJ plant) are evaluated at 457,379 tCO2eq/y. The relevant GHG emissions figure per final fuel
is estimated at 54.56 gCO2/MJ, including GHG emissions of ethanol. GHG emissions attributed
to the standalone ATJ plant result from energy provided by the national grid and needed for
pumping and preheating the ethanol.
In order to provide comparable results with the fuel comparator determined by the RED II
Directive (estimated at 94 gCO2eq/MJ), the GHG emissions savings, defined as the emissions
avoided from the production of biofuels, have been calculated per MJ of energy produced
from ethanol. It was found that 43% emissions savings are associated with the current
situation with 1G bioethanol production, whilst 44% and 42% are related to the retrofitted
facility with the ATJ process and the standalone ATJ plant with BCyL bioethanol as a feedstock,
respectively. As expected, future electricity generation mixes with increased penetration of
renewables could certainly lead to a further increase on emissions savings. Indeed, in 2030,
with 74% share of renewables, the emissions savings are estimated to be about 56% for the
retrofitted facility, and 54% for the stand-alone ATJ-SKA process with BCyL bioethanol as a
feedstock. In 2050, with 100% share of green electricity, but still using natural gas in the
ethanol plant, the emissions savings increase further, reaching about 67% and 63% in cases of
the retrofit and the alternative scenario, respectively. It is evident, therefore, that renewable
jet fuels from corn-based ethanol can provide significant GHG mitigation, as compared to
conventional fossil fuels. It was further shown that the retrofitted facility with the ATJ process
exhibits higher GHG emissions savings (67%) than the stand-alone ATJ plant (63%).
In general, sustainability of SAF will improve significantly in the future by the transition to
sustainable alternative energy on the national level or locally at the production site. The
Swedish Biofuels ATJ technology is GHG emissions neutral; the majority of emissions is
associated with the existing 1G ethanol production. It is worth noting that if sustainable local
energy sources are implemented for meeting both the electricity and heat requirements of
the retrofitted facility and the stand-alone ATJ plant, the emissions savings will reach 95%
and 94.5%, respectively. These high percentage figures present a major improvement of the
environmental impact of the existing 1G bioethanol production plant. The production and use
of hydrogen may also play an important role in future jet fuel production towards reducing
the emission intensity of jet fuels, especially when produced through electrolysis from
renewable electricity. The ability of SB ATJ technology to process the CO2, produced at the
fermentation stage, and green hydrogen as additional feedstocks for SAF production could
further increase the GHG emissions savings, potentially leading to negative carbon emissions.
A summary of the results of the environmental analysis is presented in Table 7.

36
Table 7. Overview results of environmental assessment in scenarios of Swedish Biofuels case study.
Scenario Emissions per MJ of fuel (gCO2eq/MJ) Saving compared to REDII (%)
Baseline Scenario 53.26 43.34
Current retrofit scenario based on
existing 1G bioethanol plant 52.23 44.00
Sustainable retrofit scenario 4.93 95.00
Current alternative scenario based
on existing 1G bioethanol plant
53.67 40.33
Sustainable alternative scenario 5.13 94.50
KPIs
The results of the environmental KPIs in the retrofit scenario are presented in Table 8.
Table 8. Environmental KPIs results on Swedish Biofuels case study.
KPI Value
Current energy supply
Value
Sustainable energy supply
Carbon dioxide Equivalent Emission Reduction of supply chain and
operation 44% 95%
Increased efficiency of resources consumption
Not estimated Not estimated
9 Risks
9.1 Risk assessment for the retrofit
A comprehensive list of risks was compiled by the case study team. Only the risks directly
related to the retrofitting and retrofitted situation have been considered. The current
situation and alternative were left out of the scope of the risk assessment.
The probability and consequence of each risk was determined in a survey amongst all case
study members and mean values are presented in Table 9. By multiplying the results for
probability and consequence a total risk was calculated, which allows a ranking of the risks.

37
Table 9: List of risks, their probability and consequence and the resulting total risk
Nr. Risk probability consequence total risk
(1 = low, 4 = high)
(1 = little, 4 = severe)
(1-16)
1 ATJ kerosene is not considered advanced biofuel when utilizing maize-based ethanol, EtOH plant has to undergo 2 retrofits (1. from 1G to advanced fuels, 2. to ATJ adaption)
3,1 3,2 10,0
2 Aviation sector is not willing to pay the green premium
2,2 3,2 7,2
3 Competition with other sectors like road transport or chemical market is more attractive to market ethanol than conversion by ATJ
2,4 2,9 7,1
4 Increasing prices for sustainable feedstock for ethanol production
2,9 3,0 8,7
5 Not enough green electricity is locally available to achieve high GHG emissions
1,9 3,2 6,1
6 Unsupportive or only short-term policies frameworks lead to changes in the market (e.g. green premiums)
2,7 3,2 8,6
7 Other biokerosene technologies enter market with cheaper solution
2,5 2,4 5,9
8 By-products contribute less to economic viability than assumed (e.g. because markets are not developed)
1,8 2,8 4,9
9 Increasing electricity prices 2,4 2,7 6,5
10 ATJ-SKA might not pass the ASTM certification process
1,6 3,3 5,3
11 Not sufficient flexibility of the plant to switch between products according to market situation
1,9 2,1 4,0
12 Bankruptcy or change in strategic direction of value chain partners
2,1 3,1 6,6
13 Adverse reactions from the public 1,6 2,4 3,8
According to the ranking and the representation in the scatter plot (Figure 16), special
attention has thus been drawn to risks 1, 4 and 6:
• To deal with risk 1, the transfer of the retrofit scenario to a dedicated 2G ethanol plant
could be interesting. Many of the results of this case study like the mass and energy
balances of the retrofit would be very similar for an integration into 2G ethanol
production.
• Risk 4 is difficult to approach and needs measures that are already needed for the
existing 1G ethanol production, like increasing flexibility to use different feedstocks
and other measures to react to changing markets.
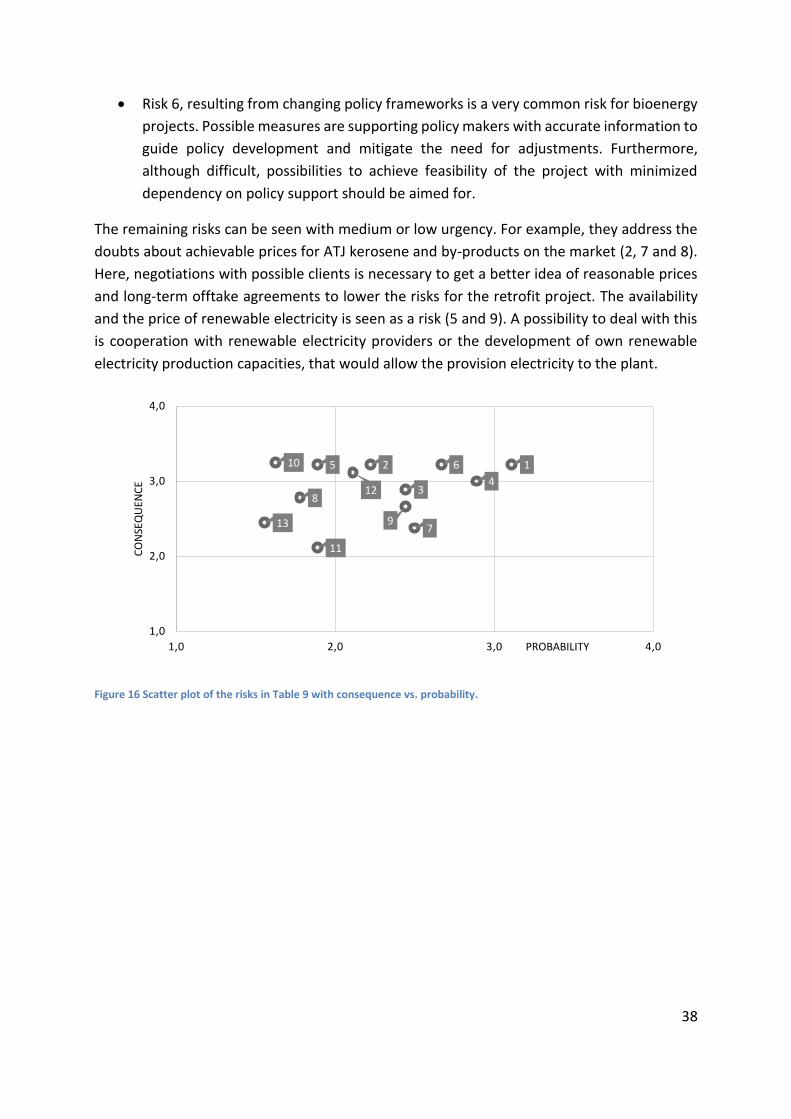
38
• Risk 6, resulting from changing policy frameworks is a very common risk for bioenergy
projects. Possible measures are supporting policy makers with accurate information to
guide policy development and mitigate the need for adjustments. Furthermore,
although difficult, possibilities to achieve feasibility of the project with minimized
dependency on policy support should be aimed for.
The remaining risks can be seen with medium or low urgency. For example, they address the
doubts about achievable prices for ATJ kerosene and by-products on the market (2, 7 and 8).
Here, negotiations with possible clients is necessary to get a better idea of reasonable prices
and long-term offtake agreements to lower the risks for the retrofit project. The availability
and the price of renewable electricity is seen as a risk (5 and 9). A possibility to deal with this
is cooperation with renewable electricity providers or the development of own renewable
electricity production capacities, that would allow the provision electricity to the plant.
Figure 16 Scatter plot of the risks in Table 9 with consequence vs. probability.
12
34
5 6
7
8
9
10
11
12
13
1,0
2,0
3,0
4,0
1,0 2,0 3,0 4,0
CO
NSE
QU
ENC
E
PROBABILITY

39
10 Key Performance Indicators (KPI)
The KPIs have been calculated for this retrofit case study including technical KPIs, economic
KPIs and environmental KPIs and are discussed below.
KPI value
Increase in biomass converted per year 0
Increase in bioenergy or biofuel generated per year -8%
Internal rate of return; IRR 30.1%
CAPEX reduction compared to alternative N.A.
Carbon dioxide Equivalent Emission Reduction of supply chain and operation
44% - 95% *
Increased efficiency of resources consumption N.A.
* 44% current case of mainly fossil energy sources in Spain
* 95% for case of sustainable local energy sources
10.1 Technical KPIs
The following technical KPIs were calculated for all case studies in the BIOFIT project. Although
presented here, some of the KPIs are more suitable for other case studies.
• Increase in biomass converted per year
In this case study there is no direct increase in biomass conversion for the retrofit scenario
compared to the current situation. The retrofit aims at producing a more versatile product
spectrum with applications in higher value markets. But there is no direct impact on the
amount of biomass converted.
• Increase in bioenergy or biofuel generated per year
The retrofit that is considered in this case study, could lead to an increase in the production
of bio-based jet fuel as a main product and the by-products naphtha and diesel. At the same
time, bioethanol, that is currently used as a biofuel in road transport, is consumed for the jet
fuel production. Thus, there is a net decrease of 471 TJ/y (8%) in biofuels production in the
retrofit scenario. At the same time, 2,507 TJ/y of new types of biofuel are produced.
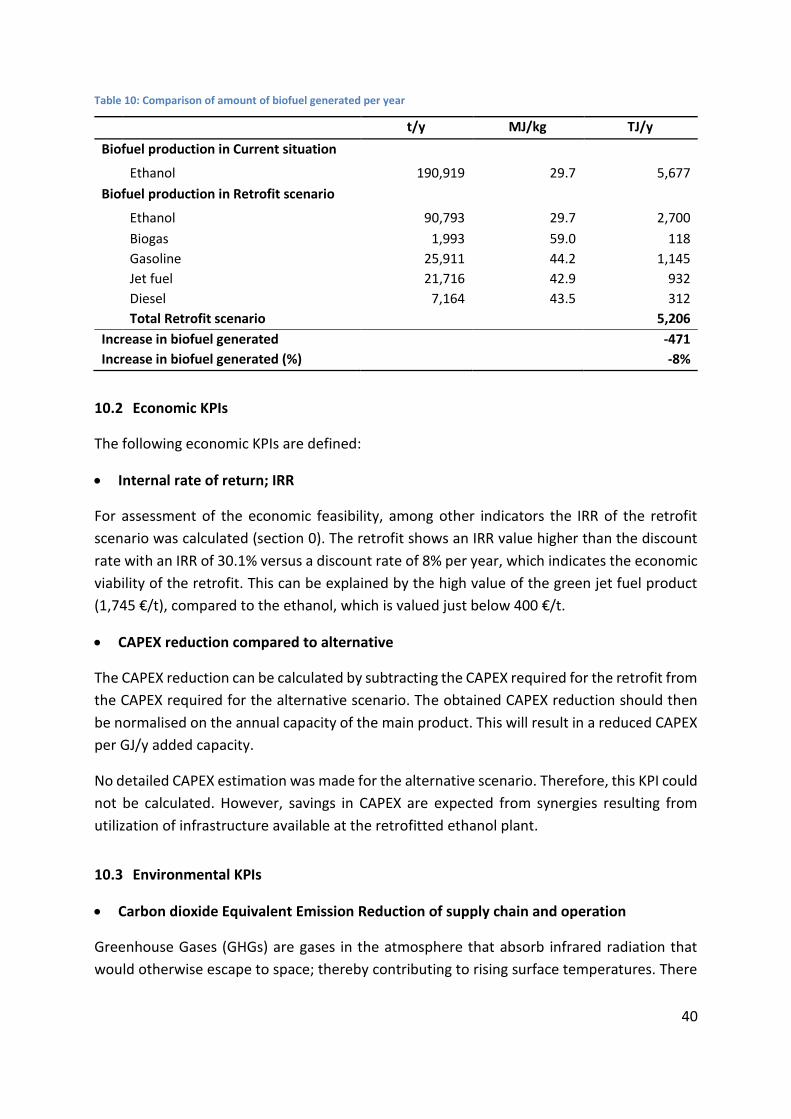
40
Table 10: Comparison of amount of biofuel generated per year
t/y MJ/kg TJ/y
Biofuel production in Current situation
Ethanol 190,919 29.7 5,677
Biofuel production in Retrofit scenario
Ethanol 90,793 29.7 2,700
Biogas 1,993 59.0 118
Gasoline 25,911 44.2 1,145
Jet fuel 21,716 42.9 932
Diesel 7,164 43.5 312 Total Retrofit scenario
5,206
Increase in biofuel generated
-471
Increase in biofuel generated (%)
-8%
10.2 Economic KPIs
The following economic KPIs are defined:
• Internal rate of return; IRR
For assessment of the economic feasibility, among other indicators the IRR of the retrofit
scenario was calculated (section 0). The retrofit shows an IRR value higher than the discount
rate with an IRR of 30.1% versus a discount rate of 8% per year, which indicates the economic
viability of the retrofit. This can be explained by the high value of the green jet fuel product
(1,745 €/t), compared to the ethanol, which is valued just below 400 €/t.
• CAPEX reduction compared to alternative
The CAPEX reduction can be calculated by subtracting the CAPEX required for the retrofit from
the CAPEX required for the alternative scenario. The obtained CAPEX reduction should then
be normalised on the annual capacity of the main product. This will result in a reduced CAPEX
per GJ/y added capacity.
No detailed CAPEX estimation was made for the alternative scenario. Therefore, this KPI could
not be calculated. However, savings in CAPEX are expected from synergies resulting from
utilization of infrastructure available at the retrofitted ethanol plant.
10.3 Environmental KPIs
• Carbon dioxide Equivalent Emission Reduction of supply chain and operation
Greenhouse Gases (GHGs) are gases in the atmosphere that absorb infrared radiation that
would otherwise escape to space; thereby contributing to rising surface temperatures. There
41
are six major GHGs: carbon dioxide (CO2), methane (CH4), nitrous oxide (N2O),
hydrofluorocarbons (HFCs), perfluorocarbons (PFCs), and sulphur hexafluoride (SF6).
Emissions of other gases can be converted to CO2 equivalents through specific methodologies.
Since the main sources for CO2 emissions are combustion processes related to energy
generation and transport, CO2 emissions can therefore be considered a useful indicator to
assess the contribution of retrofitting on climate change.
It was found that the retrofit scenario leads to 44% savings of CO2 emissions compared to
fossil jet fuel (section 8). The results for the retrofit scenario were slightly better than for the
current practice of ethanol production and the alternative scenario with standalone plants. It
is evident, therefore, that renewable jet fuels from corn-based ethanol can provide significant
GHG mitigation, as compared to conventional fossil fuels. Through a sensitivity analysis it was
demonstrated that the biggest proportion of the AtJ process emissions are related to its
electricity consumption. Hence, considering the growth of the proportion of renewable energy
(currently 37% in Spain) to 74% in 2030 and 100% in 2050, the retrofitted facility would lead
to 56% and 67% savings of CO2 emissions compared to fossil jet fuel, respectively.
It is worth noting that if sustainable local energy sources are implemented for meeting both
the electricity and heat requirements of the retrofitted facility and the stand-alone ATJ plant,
the emissions savings will reach 95% and 94.5%, respectively. These high percentage figures
present a major improvement of the environmental impact of the existing 1G bioethanol
production plant. The production and use of hydrogen may also play an important role in
future jet fuels production towards reducing the emission intensity of jet fuels, especially
when produced through electrolysis from renewable electricity. The capture and storage of
the biogenic carbon dioxide from the fermentation process could also further increase the
GHG emissions savings and potentially lead to negative carbon emissions.
• Increased efficiency of resources consumption
The specific KPI “increased efficiency of resources consumption” measures the degree to
which renewable fuels have substituted fossil and/or nuclear fuels in the case study, and
therefore contributed to the decarbonisation of the European economy. However, in this case
study, only renewable corn-based ethanol is used as feedstock in both the retrofit and the
alternative scenario; thus, this KPI is not estimated.

42
11 Conclusions
This case study identifies the benefits of the integration of an alcohol to jet (ATJ) process into
an existing 1G ethanol plant from a technical, economic, and environmental perspective. The
retrofit of a current maize-based bioethanol plant was studied using Swedish Biofuels ATJ (SB
ATJ) technology to produce a sustainable aviation fuel (SAF), namely synthetic paraffinic
kerosene with aromatics (ATJ-SKA).
It was found that the combination of SB ATJ with current ethanol production has synergies
when waste from the production of ethanol, fusel oils, and hydrated ethanol can be
processed, without the need of dewatering in molecular sieves. Further synergies can result
from heat and power integration, but would require significant changes in the existing ethanol
plant and were not studied in detail.
Furthermore, it was discussed that by using SB ATJ technology, the CO2, produced at the
fermentation stage of the current ethanol plant, and green hydrogen can be used as an
additional feedstock to ethanol. This will increase the feedstock for fuel production, reduce
the land used for biomass production, increase the GHG emissions reductions and potentially
even lead to negative carbon emissions. The use of hydrogen and CO2 was not part of the
current study as there is no green electricity available at the ethanol plant site for the
production of hydrogen.
The Techno-economic assessment concluded that in this case study the revenue is much
higher than the investment, but there are a number of risks. In particular, the sensitivity
analysis showed that small changes in feedstock costs may have a strong effect on the
economic feasibility of the retrofit.
Results of the Market assessment evidenced the ambitious plans for use of sustainable
aviation fuels, e.g. from European and national authorities as well as ICAO (International
Council of Aviation Organization), highlighting the direction of the market development.
Feedstock-wise, a significant increase of advanced bioethanol production facilities is planned
in the EU. Accordingly, a literature research showed that the feedstock availability for this case
study is not a burden.
The Sustainability Assessment showed that the ATJ plant is CO2, neutral but the current
ethanol plant is severely affected by the unavailability of sustainable power for the production
process, namely electricity and natural gas. A transition from fossil to sustainable heat and
power on the national level will contribute to a significant improvement of GHG emissions
savings from the current ethanol plant. A finding was the importance of using renewable
energy both in the ethanol production and in the ATJ process. It was shown that, with future
electricity generation mixes with an increased proportion of renewables, significant GHG
mitigation, up to 67% as compared to conventional fossil fuels, can be reached. With further

43
improvements of replacing the natural gas with a sustainable alternative for the current
ethanol production, e.g. producing steam from renewable energy, GHG emission reductions
of ~95% can be achieved.
Based on the results of this study, the recommendation is made to encourage retrofitting of
existing ethanol production plants with ATJ processes to accelerate the availability of SAF
volumes on the European market. Furthermore, the results of the present work are expected
to provide useful information to policy makers for developing and proposing appropriate
energy and environmental policies that will encourage the implementation of clean energy
technologies at a European level, so as to minimize the environmental footprint of the aviation
sector.

44
12 References
Calderón, C., Gauthier, G., & Jossart, J.-M. (2018). Statistical Report 2018. Bioenergy Europe.
Capros, P. (2016). EU Reference Scenario 2016 - Energy, transport and GHG emissions - Trends
to 2050. European Commission .
Chiaramonti, D., & Goumas, T. (2019). Impacts on industrial-scale market deployment of
advanced biofuels and recycled carbon fuels from the EU Renewable Energy Directive
II. Applied Energy.
Dietrich, S., Oehmichen, K., Zech, K., Müller-Langer, F., Majer, S., Kalcher, J., . . . Reichmuth.
(2017). Machbarkeitsanalyse für eine PTG-HEFA-Hybridraffinerie in Deutschland.
Deutsches Biomasseforschungszentrum.
E4tech. (2019). E20 Supply and Demand Study.
ETIP Bioenergy. (2020). Current status of advanced biofuels demonstration in Europe. ETIP
Bioenergy.
EurObserv'ER. (2019). Biofuels Barometer.
EUROSTAT. (2019). Eurostat Statistics Explained. Retrieved from
https://ec.europa.eu/eurostat/statistics-
explained/index.php?title=Oil_and_petroleum_products_-
_a_statistical_overview&oldid=315177#Trade_in_petroleum_products
Festel, G., Würmseher, M., Rammer, C., & Boles Eckhard. (2014). Modelling production cost
scenarios for biofuels and fossil fuels in Europe. Journal of Cleaner Production.
Flach, B., Lieberz, S., & Bolla, S. (2019). EU Biofuels Annual 2019. Global Agricultural
Information Network.
Fulvio, F., Forsell, N., Lindroos , O., Korosuo, A., & Gusti, M. (2016). Spatially explicit
assessment of roundwood and logging residues availability and costs for the EU 28.
Scandinavian Journal of Forest Research.
Geleynse, D. S., Brandt, K., Garcia-Perez, D. M., Wolcott, D. M., & Zhang, D. X. (2018,
November 05). The Alcohol-to-Jet Conversion Pathway for Drop-In Biofuels: Techno-
Economic Evaluation. ChemSusChem, pp. 3692-3692.

45
Hull, A. (2018). Production of jet fuel from ethanol and its perspectives. Retrieved from
https://ec.europa.eu/energy/sites/ener/files/documents/16_angelica_hull-
swedish_biofuels.pdf
ICAO. (2018). Sustainable Aviation Fuels Guide.
IEA. (2019, 06). International Energy Agency. Retrieved from
https://webstore.iea.org/download/direct/2803
IRENA. (2019). Advanced Biofuels. What holds them back? International Renewable Energy
Agency.
Landälv, I., Waldheim, L., Maniatis, K., van den Heuvel, E., & Kalligeros, S. (2017). Building up
the future - Cost of Biofuel.
Lundmark, R., Athanassiadis, D., & Wetterlund, E. (2015). Supply assessment of forest biomass
- A bottom-up approach for Sweden. Sweden: Biomass and Bioenergy.
Lundmark, R., Forsell, N., Leduc, S., Lundgren, J., Ouraich, I., Petterson, K., & Wetterlund, E.
(2017). Large-scale implementation of biorefineries - New value chains, products and
efficient biomass feedstock utilisation.
Maniatis, K., Landälv, I., Waldheim, L., van der Heuvel, E., & Kalligeros, S. (2017). Building up
the Future. Sub Group on Advanced Biofuels.
Ministry of the Environment and Energy. (2017). The Swedish climate policy framework.
Ministry of the Environment and Energy. (n.d.). Sweden`s draft integrated national energy and
climate plan.
Naumann, K., Schröder, J., Oehmichen, K., Etzold, H., Müller-Langer, F., Remmele, E., . . .
Schmidt, P. (2019). Monitoring Biokraftstoffsektor 4. Auflage. DBFZ.
Ouraich, I., Wetterlund, E., Forsell, N., & Lundmark, R. (2018). A spatial-explicit price impact
analysis of increased biofuel production on forest feedstock markets: A scenario
analysis for Sweden. Biomass and Bioenergy.
Scott Geleynse, K. B.-P. (2018, September 13). The Alcohol-to-Jet Conversion Pathway for
Drop-In Biofuels: Techno-Economic Evaluation. Chemistry-Sustainability-Energy-
Materials, pp. 3728-3741.
Statens Offentliga Utredningar. (2019). Biojet för flyget - Betänkande av Utredningen om
styrmedel för att främja användning av biobränsle för flyget.
Swedish Climate Policy Council. (2019). Report of the Swedish Climate Policy Council 2019.

46
Wei, H., Liu, W., Chen, X., Yang, Q., Li, J., & Chen, H. (2019). Renewable bio-jet fuel production
for aviation: A review. Fuel.
Witcover, J., & B. Williams, R. (2020). Comparison of "Advanced" biofuel cost estimates: Trends
during rollout of low carbon fuel policies. Transportation Research Part D.
Wormslev, E. C., Pedersen, J., Eriksen, C., Bugge, R., & Skov, N. (2016). Sustainable jet fuel for
aviation. Denmark: Nordic Council of Ministers.
Zschocke, A. (2012). High Biofuel Blends in Aviation (HBBA). Deutsche Lufthansa AG.
Disclaimer
This project has received funding from the European Union’s Horizon 2020 research and innovation programme under grant agreement n° 817999.
The content of the document reflects only the authors’ views. The European Union is not liable for any use that may be made of the information contained therein.