report on audit & assessment of quality of service of cellular ...
64
TELECOM REGULATORY AUTHORITY OF INDIA REPORT ON AUDIT & ASSESSMENT OF QUALITY OF SERVICE OF CELLULAR MOBILE TELEPHONE SERVICES FOR SOUTH ZONE KARNATAKA Report Period: Jan. - March 2015 cs Datamation Research Services Pvt. Ltd Plot No 361, 1 st Floor, Patparganj Indl. Area, Delhi-110 092
-
Upload
khangminh22 -
Category
Documents
-
view
2 -
download
0
Transcript of report on audit & assessment of quality of service of cellular ...
TELECOM REGULATORY AUTHORITY OF INDIA
REPORT
ON
AUDIT & ASSESSMENT OF QUALITY OF SERVICE
OF
CELLULAR MOBILE TELEPHONE SERVICES
FOR
SOUTH ZONE
KARNATAKA
Report Period: Jan. - March 2015
cs Datamation Research Services Pvt. Ltd
Plot No 361, 1stFloor, Patparganj Indl. Area,
Delhi-110 092
CONTENTS
CHAPTER-1: INTRODUCTION ..................................................................................................................... 3
1.0 Objectives of the Audit and Assessment of Quality of Service ............................................................ 3
2.0. Scope of work to be undertaken ............................................................................................................ 3
3.0. Quality Parameters to be audited in respect of the Basic (Wire line), Telephone Services, Broadband,
and Mobile Telephone Services ....................................................................................................................... 3
4.0 Coverage, Sampling & Research Methodology for the Southern Zone (Karnataka)......................... 12
5.0. Procedure adopted for Quality and Assessment of the Services ........................................................ 13
CHAPTER-2: EXECUTIVE SUMMARY .................................................................................................... 23
I. Preface ..................................................................................................................................................... 23
II. Findings from Quality of Service Audit (Operator wise for each parameter) ..................................... 24
CHAPTER-3: AUDIT –PMR DATA VERIFICATION RESULTS ........................................................... 27
3.0 Cellular Mobile Telephone Service ..................................................................................................... 27
3.1 PMR Data Verification Results for .................................................................................................. 27
3.1.1 Karnataka Circle (Jan.’15) ........................................................................................................... 27
3.1.2 Karnataka Circle (Feb.’15) ........................................................................................................... 28
3.1.3 Karnataka Circle (March’15) ....................................................................................................... 29
3.1.4 Summarized PMR Data ................................................................................................................ 30
3.2 3 Days Live Test Audit Report ........................................................................................................ 31
3.3.0 Operator Assisted Drive Test ....................................................................................................... 33
3.3.1 Rout covered during the Drive test in Karnataka Circle (Jan. - March’15) ................................. 35
3.4 CUSTOMER SERVICE QUALITY PARAMETERS ................................................................... 37
3.5 Redressal .......................................................................................................................................... 39
3.5.1 Performance (live calling for billing complaints) ......................................................................... 39
3.5.2 Live calling to call centre ............................................................................................................. 39
3.5.3 Level 1 Live Calling ..................................................................................................................... 40
3.6 Inter Operator Call Assessment ....................................................................................................... 40
CAPTER-4: DETAILED FINDINGS, ANALYSIS AND GRAPHICAL REPRESENTATION ............. 42
4.0 Cellular Mobile Telephone Service ..................................................................................................... 42
4.1 CUSTOMER SERVICE QUALITY PARAMETERS ................................................................... 42
4.2 Summarized PMR Data Results in Table & Graphical ................................................................... 46
4.3 Drive Test Measurements Audit Report .......................................................................................... 50
4.4 Live Test Summary and Graphical Representation ......................................................................... 56
CHAPTER-5: FINDINGS AND ANALYSIS ................................................................................................ 62
2
CHAPTER-1: INTRODUCTION
1.0 Objectives of the Audit and Assessment of Quality of Service: Telecom Regulatory Authority of India has been entrusted important task of laying down the standards of
quality of service to be provided by the service providers and ensuring that the quality of service is
provided as per norms; and also TRAI is responsible for conducting the periodical audit of such services
provided by the service providers so as to protect the interest of the consumers of telecommunications
service. TRAI engaged Datamation for the Southern Zone (Karnataka circle) for the audit and assessment
of Quality of Service of service provided for Basic (Wire line) Telephone Services, Broadband and Cellular
Mobile Telephone Services by various Operators, as per the scope of work detailed in the tender document.
2.0. Scope of work to be undertaken:
The scope of work Audit and Assessment of Quality of Service of service providers as mandated by TRAI
includes:
(a) Preparation of Performance Monitoring reports (PMRs) and up- loading in the system.
(b) Live measurements of the performance of Service Providers (SPs) against the benchmarks for
three days during each audit.
(c) Monthly audit based on one month data of the SPs.
(d) Drive test of the RF networks.
(e) Audit of the performance of call centres with respect to their accessibility and percentage of calls
answered by the operators and random customer feedback by calling the customers to get feedback of
the services provided by the service providers.
(f) Transfer of data generated by the RF drive test / live measurements / PMR/ monthly audit to the
server located at TRAI premises on real time basis.
3.0. Quality Parameters to be audited in respect of the Basic (Wire line), Telephone Services,
Broadband, and Mobile Telephone Services:
Basic (Wire line Services): The parameters for Basic Telephone Service (Wire line) consist of various
QoS indicators, which can be audited and assessed objectively, and include parameters like fault
incidences, call completion rates / answer to seizure ratio, POI congestion and customer service parameters
viz. mean time to repair faults, metering and billing credibility (post-paid and pre-paid), resolution of
billing/charging complaints, period of applying credit/waiver/adjustment to customer’s account, response
time to the customer for assistance, termination/closure of service, time taken for refund of security deposit
after closures; provision of a telephone after registration of demand, shift of telephone connection, etc. This
work was not carried out in the Q3.
3
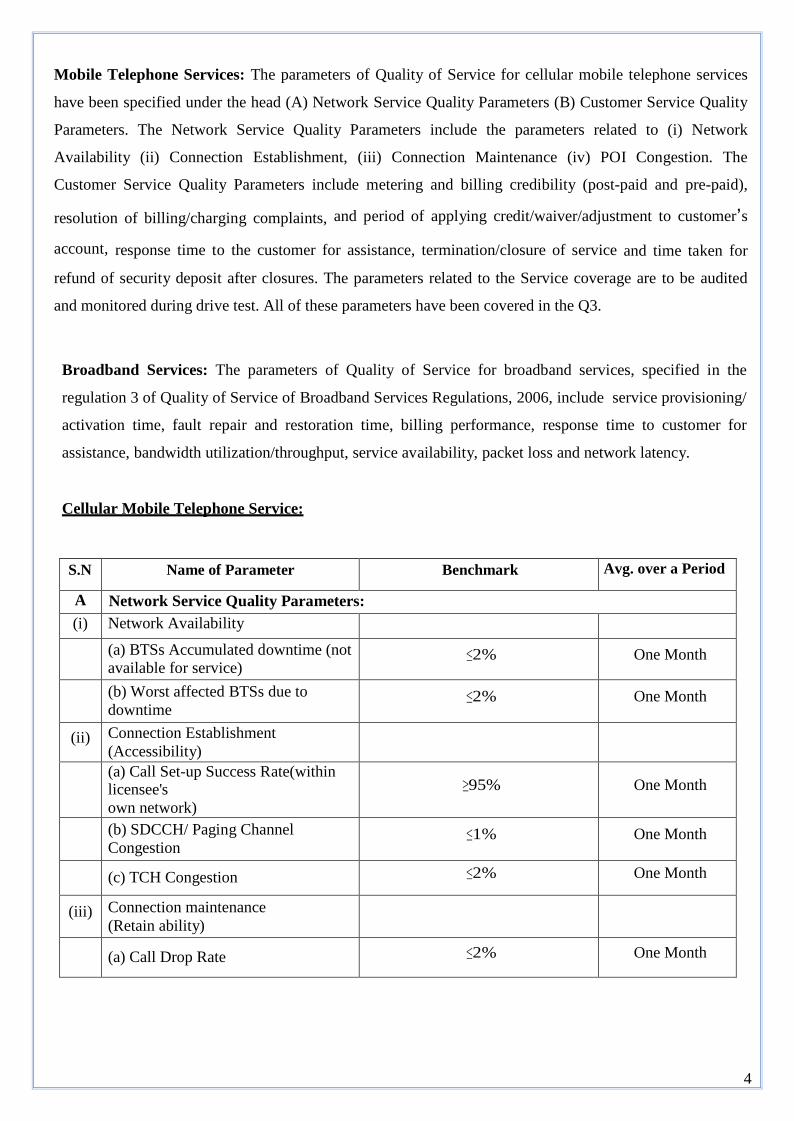
Mobile Telephone Services: The parameters of Quality of Service for cellular mobile telephone services
have been specified under the head (A) Network Service Quality Parameters (B) Customer Service Quality
Parameters. The Network Service Quality Parameters include the parameters related to (i) Network
Availability (ii) Connection Establishment, (iii) Connection Maintenance (iv) POI Congestion. The
Customer Service Quality Parameters include metering and billing credibility (post-paid and pre-paid),
resolution of billing/charging complaints, and period of applying credit/waiver/adjustment to customer’s
account, response time to the customer for assistance, termination/closure of service and time taken for
refund of security deposit after closures. The parameters related to the Service coverage are to be audited
and monitored during drive test. All of these parameters have been covered in the Q3.
Broadband Services: The parameters of Quality of Service for broadband services, specified in the
regulation 3 of Quality of Service of Broadband Services Regulations, 2006, include service provisioning/
activation time, fault repair and restoration time, billing performance, response time to customer for
assistance, bandwidth utilization/throughput, service availability, packet loss and network latency.
Cellular Mobile Telephone Service:
S.N Name of Parameter Benchmark Avg. over a Period
A Network Service Quality Parameters:
(i) Network Availability
(a) BTSs Accumulated downtime (not
available for service) ≤2% One Month
(b) Worst affected BTSs due to
downtime
≤2%
One Month
(ii) Connection Establishment
(Accessibility)
(a) Call Set-up Success Rate(within licensee's
own network)
≥95%
One Month
(b) SDCCH/ Paging Channel
Congestion
≤1%
One Month
(c) TCH Congestion ≤2% One Month
(iii) Connection maintenance
(Retain ability)
(a) Call Drop Rate ≤2% One Month
4

(b) Worst affected cells having
more than 3% TCH drop
(call drop) rate
≤5% up to 31.03.2011
≤3% From01.04.2011
One Month
(c) connections with good voice
quality ≥ 95% One Month
(iv) Point of Interconnection(POI)
Congestion ( on individual POI)
≤0.5%
One Month
B Customer Service Quality Parameters:
(v)
Metering and billing credibility–
post-Paid
Not more than 0.1% of bills
issued should be disputed over a
billing cycle
One Billing Cycle
(vi)
Metering and billing credibility–-
pre- paid
Not more than 1 complaint per 1000
customers i.e.0.1% complaints for
metering, charging, credit, and
validity
One Quarter
vii) (a)Resolution of billing/ charging
complaints
100% within 4 weeks
One Quarter
(b) Period of applying credit/ waiver/
adjustment to customer’s account from
the date of resolution of complaints
within 1 week of resolution of
complaint
One Quarter
(viii) Response Time to the customer for
assistance
(a) Accessibility of call centre/
customer care
≥ 95%
One Quarter
(b) Percentage of calls answered by
the operators (voice to voice) within 60 seconds
≥ 90%
One Quarter
(ix)
Termination/closure of service ≤ 7 days One Quarter
(x) Time taken for refund of deposits
after closures
100% within 60 days
One Quarter
5
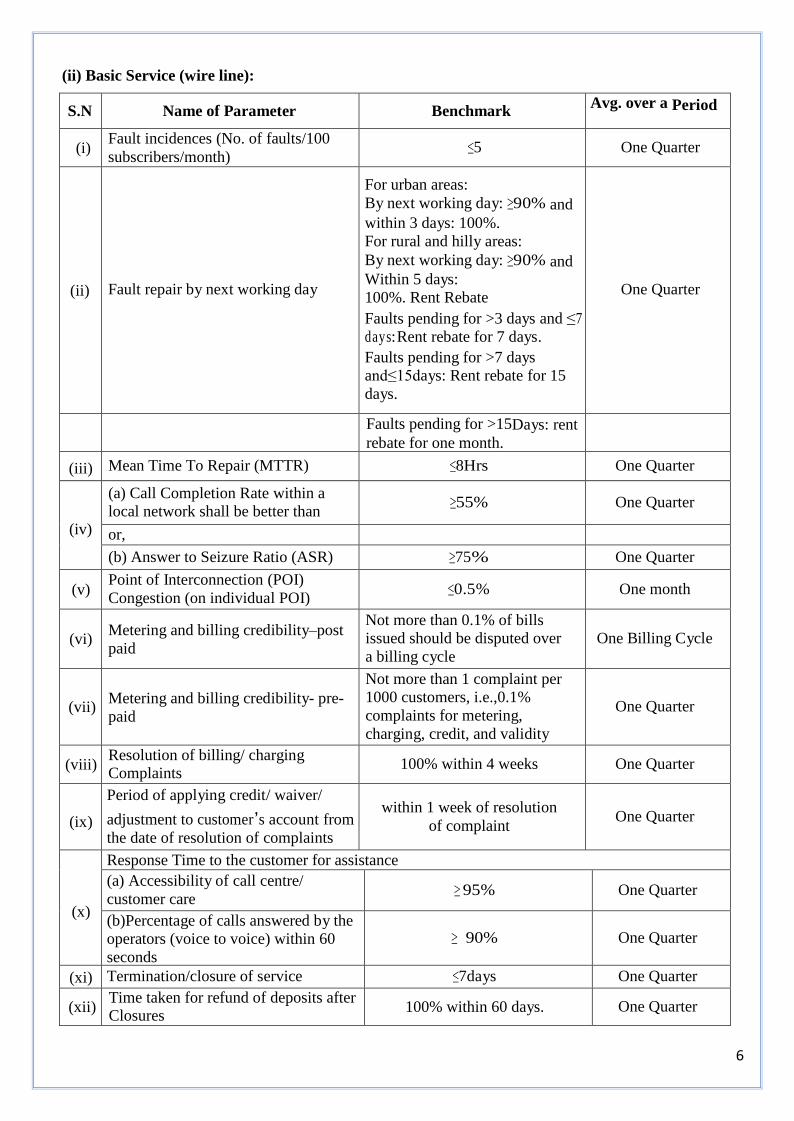
(ii) Basic Service (wire line):
S.N
Name of Parameter
Benchmark Avg. over a Period
(i) Fault incidences (No. of faults/100
subscribers/month)
≤5
One Quarter
(ii)
Fault repair by next working day
For urban areas:
By next working day: ≥90% and
within 3 days: 100%.
For rural and hilly areas:
By next working day: ≥90% and
Within 5 days:
100%. Rent Rebate
Faults pending for >3 days and ≤7
d a y s: Rent rebate for 7 days.
Faults pending for >7 days
and≤15days: Rent rebate for 15
days.
One Quarter
Faults pending for >15Days: rent
rebate for one month.
(iii) Mean Time To Repair (MTTR) ≤8Hrs One Quarter
(iv)
(a) Call Completion Rate within a
local network shall be better than
≥55%
One Quarter
or,
(b) Answer to Seizure Ratio (ASR) ≥75% One Quarter
(v) Point of Interconnection (POI)
Congestion (on individual POI)
≤0.5%
One month
(vi)
Metering and billing credibility–post
paid
Not more than 0.1% of bills
issued should be disputed over
a billing cycle
One Billing Cycle
(vii)
Metering and billing credibility- pre-
paid
Not more than 1 complaint per
1000 customers, i.e.,0.1%
complaints for metering,
charging, credit, and validity
One Quarter
(viii) Resolution of billing/ charging Complaints
100% within 4 weeks
One Quarter
(ix)
Period of applying credit/ waiver/
adjustment to customer’s account from
the date of resolution of complaints
within 1 week of resolution
of complaint
One Quarter
(x)
Response Time to the customer for assistance
(a) Accessibility of call centre/
customer care
≥ 95%
One Quarter
(b)Percentage of calls answered by the
operators (voice to voice) within 60
seconds
≥ 90%
One Quarter
(xi) Termination/closure of service ≤7days One Quarter
(xii) Time taken for refund of deposits after Closures
100% within 60 days.
One Quarter
6
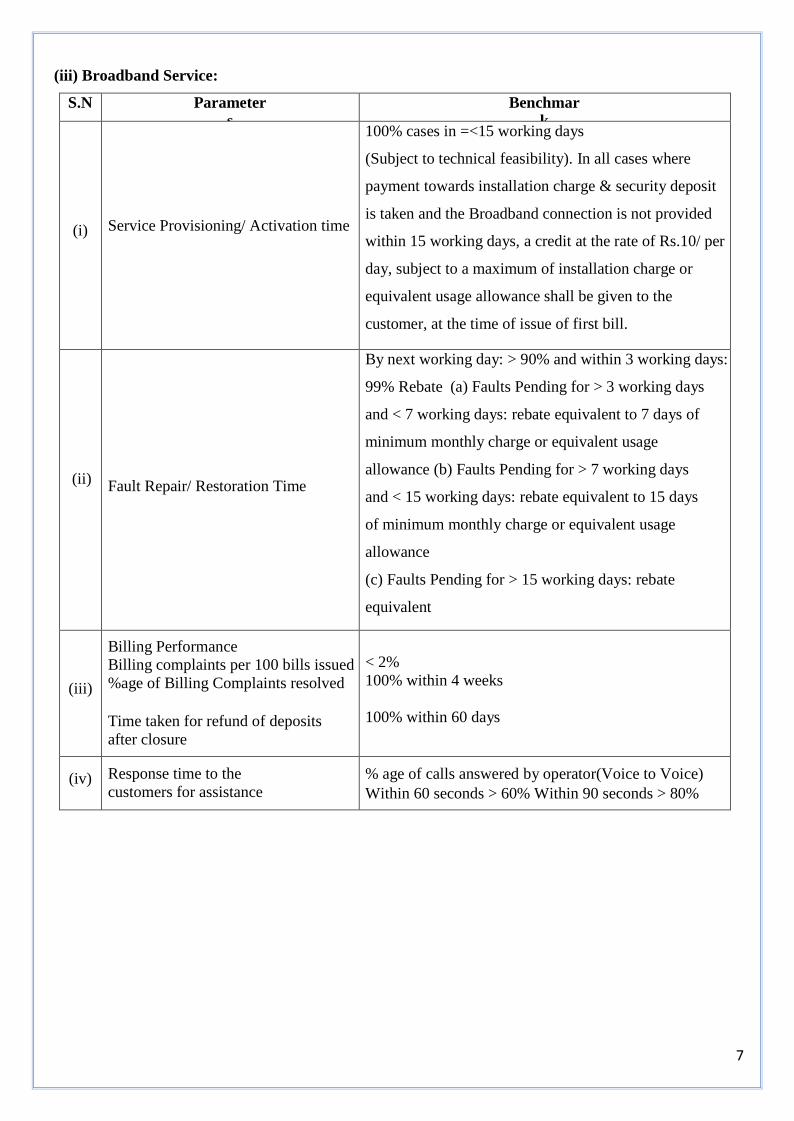
(iii) Broadband Service:
S.N Parameter
s
Benchmar
k
(i)
Service Provisioning/ Activation time
100% cases in =<15 working days
(Subject to technical feasibility). In all cases where
payment towards installation charge & security deposit
is taken and the Broadband connection is not provided
within 15 working days, a credit at the rate of Rs.10/ per
day, subject to a maximum of installation charge or
equivalent usage allowance shall be given to the
customer, at the time of issue of first bill.
(ii)
Fault Repair/ Restoration Time
By next working day: > 90% and within 3 working days:
99% Rebate (a) Faults Pending for > 3 working days
and < 7 working days: rebate equivalent to 7 days of
minimum monthly charge or equivalent usage
allowance (b) Faults Pending for > 7 working days
and < 15 working days: rebate equivalent to 15 days
of minimum monthly charge or equivalent usage
allowance
(c) Faults Pending for > 15 working days: rebate
equivalent
(iii)
Billing Performance
Billing complaints per 100 bills issued
%age of Billing Complaints resolved
Time taken for refund of deposits
after closure
< 2%
100% within 4 weeks
100% within 60 days
(iv)
Response time to the
customers for assistance
% age of calls answered by operator(Voice to Voice)
Within 60 seconds > 60% Within 90 seconds > 80%
7
8
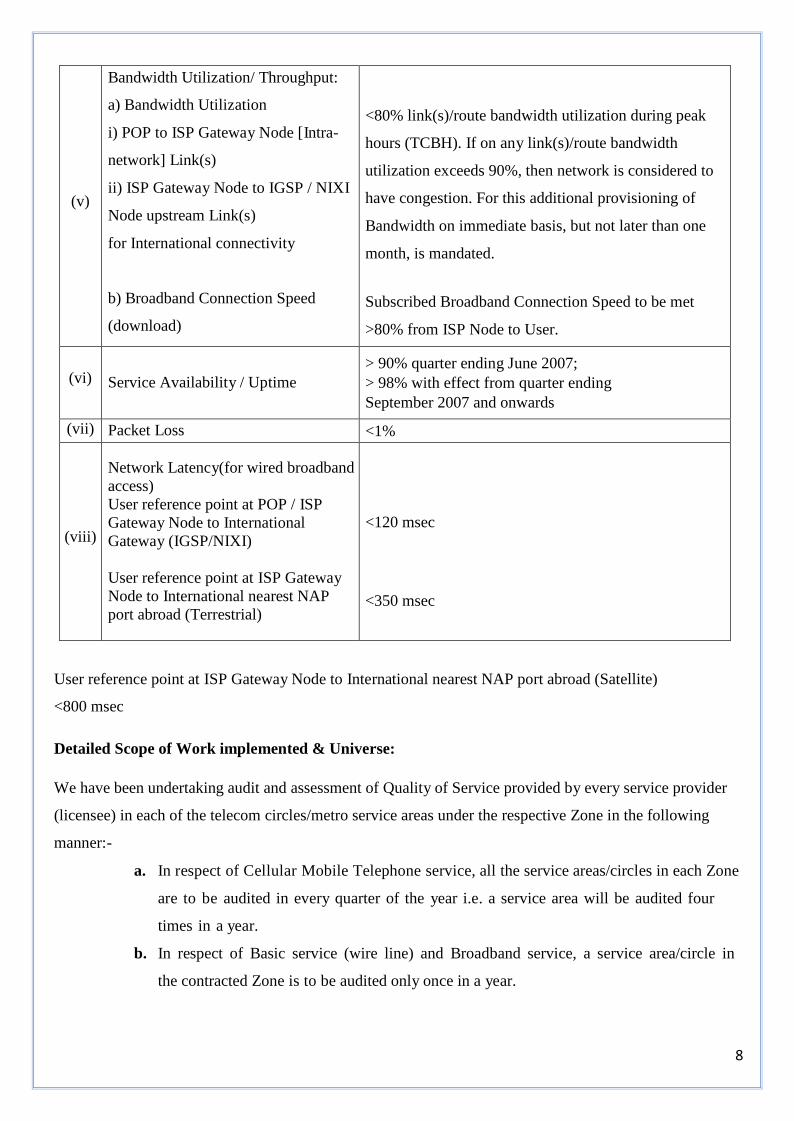
(v)
Bandwidth Utilization/ Throughput:
a) Bandwidth Utilization
i) POP to ISP Gateway Node [Intra-
network] Link(s)
ii) ISP Gateway Node to IGSP / NIXI
Node upstream Link(s)
for International connectivity
b) Broadband Connection Speed
(download)
<80% link(s)/route bandwidth utilization during peak
hours (TCBH). If on any link(s)/route bandwidth
utilization exceeds 90%, then network is considered to
have congestion. For this additional provisioning of
Bandwidth on immediate basis, but not later than one
month, is mandated.
Subscribed Broadband Connection Speed to be met
>80% from ISP Node to User.
(vi)
Service Availability / Uptime
> 90% quarter ending June 2007;
> 98% with effect from quarter ending
September 2007 and onwards
(vii) Packet Loss <1%
(viii)
Network Latency(for wired broadband
access)
User reference point at POP / ISP
Gateway Node to International
Gateway (IGSP/NIXI)
User reference point at ISP Gateway
Node to International nearest NAP
port abroad (Terrestrial)
<120 msec
<350 msec
User reference point at ISP Gateway Node to International nearest NAP port abroad (Satellite)
<800 msec
Detailed Scope of Work implemented & Universe:
We have been undertaking audit and assessment of Quality of Service provided by every service provider
(licensee) in each of the telecom circles/metro service areas under the respective Zone in the following
manner:-
a. In respect of Cellular Mobile Telephone service, all the service areas/circles in each Zone
are to be audited in every quarter of the year i.e. a service area will be audited four
times in a year.
b. In respect of Basic service (wire line) and Broadband service, a service area/circle in
the contracted Zone is to be audited only once in a year.
11
We under took the audit work for the Mobile services as follows: -.
(a) Generation of reports at service providers site as part of QoS monitoring reports i.e. quarterly
Performance Monitoring Reports (PMRs) and monthly Point of Interconnect (POI) Congestion Reports
for Basic and Cellular Mobile Services with reference to the records maintained by the service provider
and the system logs for the period. We generated the quarterly PMR at site and uploaded it on real time
basis on the server at TRAI, Delhi.
The PMR report formats and parameters were finalized and any modifications or additions of
parameters were undertaken in consultation with TRAI. The scope covered all future PMR parameters
as and when defined by TRAI during the duration of the contract. The PMRs were generated on
monthly basis for the Network Service Quality Parameters of cellular mobile telephone services and on
quarterly basis for Customer Service Quality Parameters of cellular mobile telephone services, basic
(wire line) services and broadband services as per the parameters specified. The PMRs so generated
were uploaded on the server latest by 7th
of the following month.
(b) Verification of the performance of service providers against the Quality of Service benchmarks laid
down by TRAI using live measurement for three days for the parameters for the services as specified
during the month in which the audit and assessment is carried out. The results were uploaded live on
the server;
(c) Verification of the performance of service providers against the Quality of Service benchmarks, for the
parameters and for the services as specified in clause 1.9, laid down by TRAI using the data for the
entire month during which the live measurement as per clause (b) above is carried out; the results were
uploaded live on the server;
(d) Drive tests of the mobile networks of service providers; the results were uploaded live on the server.
We carried out an analysis of the drive test and loaded the results giving such information and in such
format as agreed by TRAI.
(e) Audit of the performance of call centers with respect to their accessibility and percentage of calls
answered by the operators, test calling and random customer feedback by calling the customers to get
feedback of the services of the service providers was also carried out by Datamation. The Automatic
Call Distribution (ACD) records were also verified for the calls answered by the operators within
60 seconds.
3.1 Sampling Universe:
The Telecom Licensed Service Areas / Circle for the purpose of audit and assessment are:
South Zone: Karnataka
The audit and assessment of Quality of Service has been conducted for BSNL, MTNL, private basic service
providers, unified access service providers, cellular mobile service providers and ISPs (providing
broadband service) in various service areas for basic telephone service (wire line), cellular mobile

12
telephone service and broadband service. We were required to conduct the audit and assessment of
Quality of Service of Broadband Service only in respect of the service providers who are having broadband
subscriber base of more than 10,000 subscribers in their licensed service area. The updated data in respect
of licensees (service providers) who have commissioned service and their subscriber base/Mobile
Switching Centre (MSCs)/BTS‟/ Exchanges / Internet Service Providers Central Nodes (ISP Nodes) is
supposed to be be intimated by TRAI from time to time and we carried out the audit and assessment
of Quality of Service accordingly thereafter.
The audit and assessment of Quality of Service for all the service providers in a Telecom Circle/Metro
Service Area/ Licensed Service Area were completed in the same quarterly period.
Generation of performance reports against QOS benchmarks:
4.0 Coverage, Sampling & Research Methodology for the Southern Zone (Karnataka):
Sample size for cellular mobile services:
100% Gate way MSCs (GMSC) and Mobile Switching Centre (MSC) of all the Cellular Mobile Service
Provider (CMSP) or Unified Access Service Providers (UASP) were covered in specified circles/ service
areas in respective Zone in each of the quarterly period.
Number of exchanges to be covered for Basic (Wire line) services: (Not covered in this Quarter)
The break-up of the total number of exchanges of BSNL, MTNL and private basic service operators circle/
service area-wise, including urban and rural exchanges, and the number of exchanges, both urban and rural,
that shall be covered during the year (i.e. four quarters) for audit and assessment of the Quality of Service
shall be obtained from TRAI. As per the break-up of number of exchanges to be covered in a year, 556
urban exchanges and 1508 rural exchanges, totaling 2064 exchanges are proposed to be covered. The
exchanges shall evenly be spread over in about 10% of SDCAs to the extent possible with each service
provider in specified circles/ service areas. A service area/circle in the contracted Zone shall be audited
only once in a year.
Number of POPs to be covered for Broadband Services: (Not covered in this Quarter)
We propose to first visit the ISP‟s Central Node in licensed service area and identify the total number of
Point of Presence (POPs) in each service area. Thereafter, the sample for audit and assessment of Point of
Presence shall be decided in such a way that minimum 5% (five percent) of the Points of Presence of ISP
spread over in 10% (ten percent) SDCAs in specified service area/telecom circle shall be covered. The
POPs are proposed to be evenly spread over in the licensed service area. A service area/circle shall be
audited only once in a year.
13
4.1 Primary Data Collection and Quality Control: The primary data was collected only as per the
structured questionnaire and through field visits as per mode and protocol indicated and already
approved by TRAI.
The primary data was collected by Datamation’s RAN Engineers. The following measures, amongst
others, were adopted to ensure good quality of data:
Contents of questionnaire along with techniques and tools used for the survey and data collection
after approval of TRAI were shared with all the trained / skilled investigating personnel
at the beginning of the survey through orientation;
Standardized data collection tool and guidelines were designed by the project team;
Monitoring and supervision of field Engineers was done by team leader and field team leaders.
4.2 Secondary data collection and use: To achieve the set objectives of the survey, information from
secondary sources was also used, including information supplied from TRAI and various other relevant
media/sources.
Data processing, analysis and Report writing: after collection of data and field work, data processing was
done by editing, validation of data for removing duplication or incomplete information, etc. and tabulation.
Analysis of data was done as per the scope of work and deliverables. After completion of compilation of
data and analysis, reports were compiled and submitted to TRAI which will include details on comparable
parameters state wise.
5.0. Procedure adopted for Quality and Assessment of the Services:
The generation and verification of performance of service providers against QOS benchmarks involved
measuring of specified reporting parameters, checking of complete records, analysis of procedure and
method utilized by various service providers in measuring the parameters and method of averaging for the
purpose of reporting. We included critical findings licensee-wise in each quarterly report.
Audit methods and procedures:
To measure each quality of service parameter defined by TRAI, the two main sources of data collection
identified were:
Audit of the MIS reports at exchanges (OMC or MSCs) or ISP Node of the service provider.
Primary data collection and check back calls (live observations done during the visits)
The audit was conducted in each centre of study to generate various types of data. Thus, for data collection,
following activities were undertaken during the appraisal exercise.
12
Collection of MIS data of OMC or MSC or ISP Node:
For this TRAI has suggested to the service providers to maintain the QoS source data in a proper format.
From the source data, we generated the quarterly/monthly performance monitoring reports (PMR).
Methodology adopted was checked against instructions and standards to see if the measurements adhere to
specifications.
Live Measurements and Live Data Collation:
During the audit and assessment, following activities were undertaken for live measurements and live data
collection.
a) Audit and Assessment of complaint redressal and provisioning of new broadband
Connections: (Not conducted this Quarter)
Telephonic interviews are proposed to be conducted among a sample of subscribers of telephone –
In basic service (wireline) for those customers who reported a fault complaint, billing dispute
In case of Mobile operators, who have had a recent billing dispute
In case of Broadband service for those who requested for a new connection reported a fault
complaint, billing dispute, complaint of Broadband connection speed (download).
Data shall be obtained on:
Occurrence of fault complaints
Clearance of fault within stipulated time
Incidence of billing disputes
Clearance of billing complaints within stipulated time
Attendance to requests for closure/ termination of service
Sampling Procedure & quality control: In order to get a correct and meaningful result from audit it is
important to ensure that the right sampling procedure is followed. Equally important is the process of
ensuring that quality control parameters are put in place. Care shall be taken to distribute the sample to
obtain a random list. The distribution of sample sizes shall be evenly distributed. The sampling procedure
for various activities to be carried is given below:
Sample for telephonic interview for billing complaints:
The sample size for telephonic interview of billing complaints in each audit shall be 100 subscribers or the
total number of complaints, whichever is less per service provider for each service in a licensed service
area. All the complaints booked shall be treated as the total population for selection of samples.
13
Sample for telephonic interview for new connection for Broadband Service:
The sampling frame shall be for Point of Presence /ISP Node of Broadband Service Provider. Here, the
total sample size (10% of the applicants in the previous month or 100 whichever is less for every service
provider) has been randomly selected from the records /registers to make check back calls.
Sample for telephonic interview for service complaints/ requests:
The operator is required to provide the details of the service complaints/ requests for the month previous to
the audit month for Cellular Mobile Telephone Services, Basic (wireline) Services and Broadband
Services. For broadband services, complaints related to download speed are proposed to be covered. From
the list of these complaints /requests (10% or 100 per service provider per license service area, whichever
is less) sample has been drawn randomly to make check back calls. A notice of minimum3 (three) weeks
was provided to the service provider by us for arranging and supplying the data required for audit of
exchanges, ISP nodes and MSCs to be covered.
b) Audit and Assessment of Call Centre/ customer care promptness and live measurement through
test calls:
Test calls were made to assess the availability and efficiency of Level 1 services and complaint centre
accessibility. The telephone /SIM Cards/Instruments for testing purposes were provided by the
concerned service provider(s) in whose network the audit and assessment of Quality of Service is carried
out. The details regarding test calls are:
(a) Testing of Level 1Services:
Level1 Services include police, fire, ambulance (Emergency services) in the case of both Mobile service
providers and basic telephone service providers. Test calls were made from all the levels working in a
particular SDCA visited. Again, the total sample sizes (150 per license service area per service per quarter)
were equally distributed among the different SDCAs visited, and the distribution among the active levels is
in proportion to the capacity of each level in that SDCA.
(b) Inter-operator call assessment:
Inter Network calls i.e. calls made from one operator to another within the same license were made to
judge the ease of connectivity amongst the operators.
A sample of 2 X50 test calls per service provider within the licensed service area was made at different
point of time to the free test numbers of another service provider (50 calls between 1000 to1300
Hrs and 50 calls between 1500 to 1700 hrs for basic service and between 1100 to 1400 hrs and between
1600 to 1900 hrs) for cellular mobile service. The results of these calls were compiled and reported
14
separately for each service provider service area-wise.
The telephone/ SIM Cards /Instruments for testing purposes were provided by the concerned service
provider(s) in whose network the audit and assessment of Quality of Service is carried out.
(c) Testing of Complaint Centre Accessibility and response time:
(i) Basic Telephone Service (wire line) and Cellular Mobile Telephone Service:
We measured the performance of both basic telephone service (wire line) & cellular mobile services against
the benchmarks of the following Quality of Service parameters:-
Response time to the customer for assistance:
(a) Accessibility of call centre/customer care >= 95%
(b) % age of calls answered by the operator (voice to voice):
Within 60 seconds = 90%
The procedure for assessment of the performance in respect of above parameters was made using the traffic
data at the point of termination to call centre from mobile/ basic telephone network. Traffic at the tandem
or trunk or gateway MSC out going circuits to IVR of call centre w a s measured as per the traffic
counter available in the respective switch to assess the accessibility of call centre.
In the case of parameter % of call answered by the operator voice to voice, assessment of IVR traffic data
and CRM traffic data was analyzed during the time consistent busy hour (TCBH) of call centre. In addition,
w e also made the test calls and correlated the results with the traffic data analysis.
The procedure (IVR menu and sub-menu) and ease of accessing the operator within the benchmark laid
down by TRAI, both post-paid and pre-paid customers were assessed and reported. In this regard
para3.11.4 of the Explanatory Memorandum to the Standards of Quality of Service of Basic
Telephone Service (Wire line) and Cellular Mobile Telephone Service Regulations, 2009 and provisions of
the Telecom Consumers Complaint Redressal Regulations, 2012 was being followed.
(ii) Broadband service:
We propose to measure the performance of Broadband service against the benchmarks of the following
Quality of Service parameters:-
Response time to the customer for assistance: % age of calls answered by operator (voice to voice):
Within 60 seconds = 60%
Within 90 seconds = 80%
Measurement:
A sample of 2 X 50 calls per service provider is proposed to be made at different point of time to the call
centre of each service provider from each licensed service area (50 calls between 1000 to 1300 Hrs. and 50
15
calls between 1500 to1700 hrs.) for basic telephone service (wireline) and similarly, 2X50 calls to the call
centre of each service provider (50 calls between 1100 to 1400 hrs. and 50 calls between 1600 to 1900 hrs.)
for cellular mobile telephone service from each licensed service area to ensure statistical significance. The
time to connect to IVR shall be noted for all these calls. This is the wait time before an automatic answer
machine (IVR) message begins. We then propose to measure the gap between the time when the last digit
of the number is dialed, and the time when the IVR message begins. Similarly the wait time before a Call
Centre agent responds to a test call shall be measured for all such test calls.
Verification and audit of records:
We propose to verify and audit the following records in respect of Basic Telephone Service (wire line):
Call Centre records for complaints
FRS details for fault complaints, fault repair and MTTR (Mean Time to Repair)
Commercial records for billing details, billing disputes and redressal there of
Past traffic reports at local and TAX (Trunk Automatic exchanges) for Call
Completion Rate/Answer to Seizure Ratio calculations
Checking of customer complaint handling through live test at the call centre
100 Nos. of service complaints / requests and 100 Nos. of billing related complaints shall be
taken up by the auditing agency for verifying their redressal as per the record of the service
provider.
We verified and audited the following records in respect of Cellular Mobile Telephone Service:
Call Centre records for complaints
Network maintenance and planning department (OMC and Drive Test) records for QOS
parameters
System / Network outage details, Call Set-up Success Rate, Blocked Call Rate, Call Drop Rate,
worst affected cells having more than 3 % TCH drop rate, Voice Quality, Service Coverage
and POI congestion
Commercial and customer care records for billing disputes, redressal and refunds of payment
Checking of customer complaint handling through live test at the call centre
100 Nos. of service complaints/ requests and 100 Nos. of billing related complaints w e r e
taken up by the auditing Agency for verifying their redressal as per the record of the service
provider.
We propose to verify& audit records maintained by Broadband service providers relating to:
Call Centre records for complaints
FRS details for fault complaints, fault repair
Records for requests for new connection, and supplementary services

16
Commercial records for billing details, billing disputes and redressal there of
Checking of customer complaint handling through live test at the call centre
Service complaints/ requests and billing related complaints shall be taken up by the
auditing agency for verifying their redressal as per the record of the service provider.
Bandwidth Utilization/ Throughput
Broadband connection speed
Service Availability/Uptime
Packet Loss and Latency measurements
Network performance parameters like Bandwidth Utilization/Throughput including Broadband Connection
Speed, Packet Loss and Latency shall be measured on sample basis.
The detailed methodology for each Quality of Service parameter as given in the Explanatory
Memorandum to the quality of Service of Broadband Service Regulations, 2006 dated 6th October 2006
(11 of 2006) was followed. The signature of the Nodal Officer nominated by the service provider for
coordination with the audit agency were taken on all the formats containing the verified data for all the
parameters
We shall take live measurements and collection of one month data or audit by actual visit to such NOC,
OMC, call centre and billing centre.
17
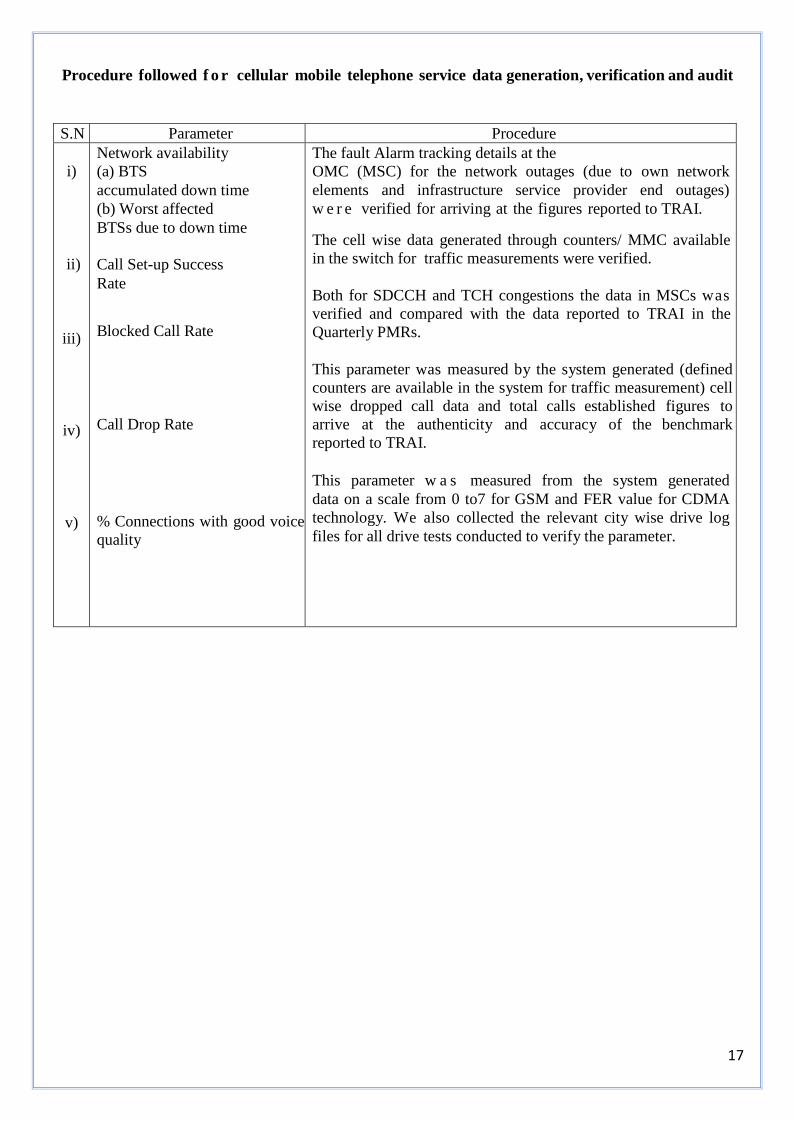
Procedure followed f o r cellular mobile telephone service data generation, verification and audit
S.N Parameter Procedure
i)
ii)
iii)
iv)
v)
Network availability
(a) BTS
accumulated down time
(b) Worst affected
BTSs due to down time
Call Set-up Success
Rate
Blocked Call Rate
Call Drop Rate
% Connections with good voice
quality
The fault Alarm tracking details at the
OMC (MSC) for the network outages (due to own network
elements and infrastructure service provider end outages)
w e r e verified for arriving at the figures reported to TRAI.
The cell wise data generated through counters/ MMC available
in the switch for traffic measurements were verified.
Both for SDCCH and TCH congestions the data in MSCs was
verified and compared with the data reported to TRAI in the
Quarterly PMRs.
This parameter was measured by the system generated (defined
counters are available in the system for traffic measurement) cell
wise dropped call data and total calls established figures to
arrive at the authenticity and accuracy of the benchmark
reported to TRAI.
This parameter w a s measured from the system generated
data on a scale from 0 to7 for GSM and FER value for CDMA
technology. We also collected the relevant city wise drive log
files for all drive tests conducted to verify the parameter.
18
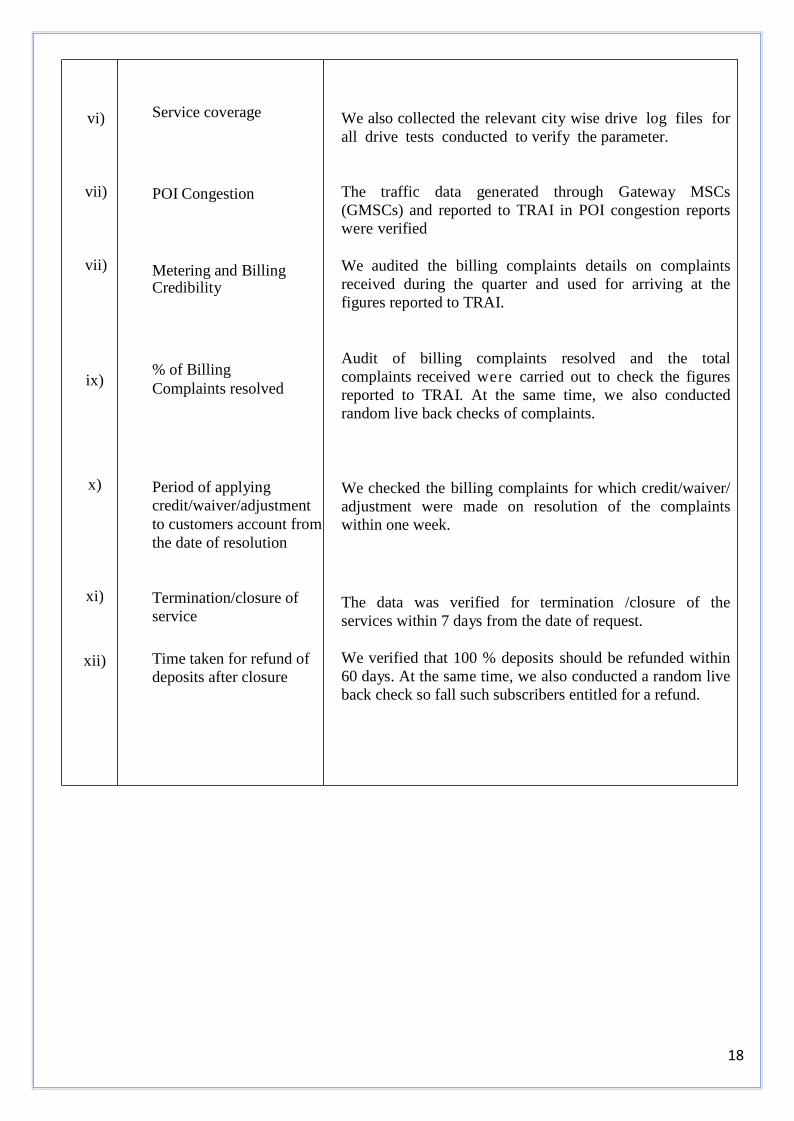
vi)
vii)
vii)
ix)
x)
xi)
xii)
Service coverage
POI Congestion
Metering and Billing Credibility
% of Billing
Complaints resolved
Period of applying
credit/waiver/adjustment
to customers account from
the date of resolution
Termination/closure of
service
Time taken for refund of
deposits after closure
We also collected the relevant city wise drive log files for
all drive tests conducted to verify the parameter.
The traffic data generated through Gateway MSCs
(GMSCs) and reported to TRAI in POI congestion reports
were verified
We audited the billing complaints details on complaints
received during the quarter and used for arriving at the
figures reported to TRAI.
Audit of billing complaints resolved and the total
complaints received were carried out to check the figures
reported to TRAI. At the same time, we also conducted
random live back checks of complaints.
We checked the billing complaints for which credit/waiver/
adjustment were made on resolution of the complaints
within one week.
The data was verified for termination /closure of the
services within 7 days from the date of request.
We verified that 100 % deposits should be refunded within
60 days. At the same time, we also conducted a random live
back check so fall such subscribers entitled for a refund.
19
Drive Tests:
In the case of Cellular Mobile Service, the exercise of QoS assessment shall not be limited to generation,
verification and audit of data, but we shall also verify the parameters by conducting extensive drive test in
all service areas, as per the details given below, to assess the network performance.
There are two types of drive tests that were conducted. One is operator assisted drive test and the other is
independent drive tests. The details of these drive tests are given below:
Operator Assisted Drive Tests: The primary aims of these drive tests is to cross-check/ validate the data
on Quality of Service being provided by the telecom service providers to TRAI. These drive tests were
conducted in such a manner so as to enable identification of network element deficiency and initiation of
improvements. The operator assistance was desired to ensure a greater audit transparency.
In each licensed service area drive test in three cities, having high population, medium population and low
population, were conducted every month for each service provider covering a minimum distance of 100
kilometers in city area and adjoining are as including important indoor sites. These cities were proposed
and finalized by TRAI. The results of analysis of data generated during such drive tests were uploaded,
immediately on completion of the drive test, to the central server at TRAI.
Independent Drive Tests: We shall do independent drive tests in Q4 spread across the contracted zone
limited to a maximum of 10 drive tests per licensed service area, in a year. The location for these
drive tests was selected based on the subscriber complaints being received by TRAI or as decided by
TRAI. Independent drive test covered a city and adjoining areas covering a minimum distance of 100
kilometers including congested areas and important indoor sites. The results of analysis of data generated
during such drive tests will be uploaded, immediately on completion of the drive test, to the central server
at TRAI.

20
Drive Test Methodology:
For drive test following procedure was adopted:
i. We obtained a coverage map from the service provider before starting the drive test and
studied the coverage detail in terms of the signal strength. Based on the signal strength as
depicted in the coverage map, the drive test was done to check the following parameters:
a. Coverage-Signal strength
b. Voice quality
c. Call setup success rate
d. Blocked calls e. Call drop rate
ii. The drive test covered selected cities and adjoining towns/ rural areas where the service
provider has commenced service, including congested areas and indoor sites.
iii. The drive test covered the routes including expressways, major and secondary roads / streets,
Commercial, residential areas/Commercials estates to check the in-building network
performance.
iv. The drive tests of each mobile network were conducted between 10 am and 8 pm on
weekdays.
v. The Vehicle used in the drive tests was equipped with the test tool that automatically
generates calls on the mobile telephone networks.
vi. The speed of the vehicle was kept at around 30-50 km/hour (around 30 km/hr in case of
geographically small cities)
vii. The holding period of each test call was 120 seconds.
viii. A test call was generated 10 seconds after the previous test call is completed.
ix. Measurement using engineering handsets was not done
x. The dedicated originating and terminating mobile unit’s antenna was placed at the same
height and in the same vehicle. Moreover, the height of the antenna was uniform in case of all
service providers.
21
6.0 Reporting Formats:
We developed data formats including executive summary, critical findings and detailed data analysis
thereof for reporting the results of such audit and assessment. We submitted to TRAI sample design and
sample reporting formats within 4 weeks of signing of the agreement. All these reports were enabled as
online reports with sufficient flexibility of querying against various parameters.
6.1 Deliverables:
Quarterly Reports: We are submitting quarterly reports in the formats approved by TRAI for the purpose.
Five copies of such report during the quarterly period were submitted to TRAI within the time period given
in the delivery schedule.
The report also contained the Audit results of service areas including executive summary, critical findings
and comparison of performance of the service providers on various qualities of service parameters for
which Audit work was undertaken during the quarter.
Reports were submitted for approval within one month of the completion of each quarter for audit and
assessment of QoS parameters for basic service, cellular mobile service and broadband service. The report
contained the findings on audit and assessment of QOS provided by service providers carried out in
accordance with Clause 2 above. The report contained performance of each service provider for each
licensed service area against the Quality of Service parameters. The report also contained a comparative
analysis of performance of all the service providers in a licensed service area. The report also contained an
Executive Summary and critical finding along with detailed analysis.
A separate report shall also be submitted for each company/group of companies at the end of the year. The
report contained an Executive Summary and critical finding along with detailed analysis to share with the
service provider and take further follow-up action.
22
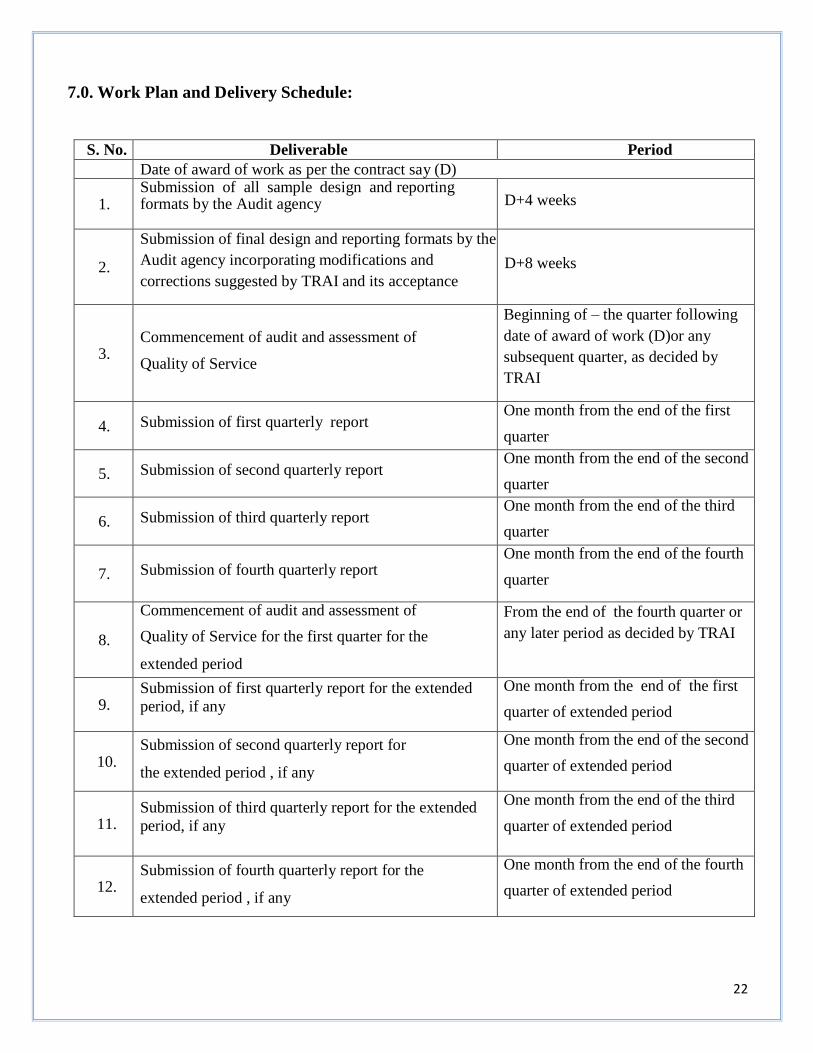
7.0. Work Plan and Delivery Schedule:
S. No. Deliverable Period
Date of award of work as per the contract say (D)
1. Submission of all sample design and reporting formats by the Audit agency
D+4 weeks
2.
Submission of final design and reporting formats by the
Audit agency incorporating modifications and
corrections suggested by TRAI and its acceptance
D+8 weeks
3.
Commencement of audit and assessment of
Quality of Service
Beginning of – the quarter following
date of award of work (D)or any
subsequent quarter, as decided by
TRAI
4.
Submission of first quarterly report One month from the end of the first
quarter
5.
Submission of second quarterly report One month from the end of the second
quarter
6.
Submission of third quarterly report One month from the end of the third
quarter
7.
Submission of fourth quarterly report
One month from the end of the fourth
quarter
8.
Commencement of audit and assessment of
Quality of Service for the first quarter for the
extended period
From the end of the fourth quarter or
any later period as decided by TRAI
9. Submission of first quarterly report for the extended
period, if any
One month from the end of the first
quarter of extended period
10. Submission of second quarterly report for
the extended period , if any
One month from the end of the second
quarter of extended period
11. Submission of third quarterly report for the extended
period, if any
One month from the end of the third
quarter of extended period
12. Submission of fourth quarterly report for the
extended period , if any
One month from the end of the fourth
quarter of extended period

23
CHAPTER-2: EXECUTIVE SUMMARY
I. Preface
This report presents the growth trends for the telecom services in India for the quarter ending
March 2015.This report provides a broad perspective on the Telecom Services to serve as a reference
document for various stakeholders, research agencies and analysts. Under the Unified Access Service
(UAS) Regime, the details of subscriber base under wireless services, both GSM & CDMA technologies
have been combined.
This report highlights the findings for the audit & assessment of Quality of Service of Cellular Mobile
Services in South Circle (Karnataka) in 3rd quarter (Jan. – March 2015). The primary data collection and
verification of records (PMR data verification – quarterly) maintained by various operators was undertaken
during the period Jan. – March 2015.
Following are the various operators covered in Karnataka circle (South Zone) for Cellular Mobile
(Wireless) services QoS audit & assessment. The Month of audit & TCBH information is also given below:
S.I. Name of Service Provider Month of Audit TCBH Hour
GSM Operators
1 Aircel Ltd Jan.-March’15 1900-2000 Hrs
2 Airtel Ltd Jan.-March’15 1900-2000 Hrs
3 BSNL Jan.-March’15 1900-2000 Hrs
4 Idea Jan.-March’15 1900-2000 Hrs
5 Reliance Communication (GSM) Jan.-March’15 1900-2000 Hrs
6 Tata Communications (GSM) Jan.-March’15 1900-2000 Hrs
7 Vodafone Jan.-March’15 1900-2000 Hrs
CDMA Operators
8 MTS (CDMA) Jan.-March’15 1900-2000 Hrs
9 Reliance Communication (CDMA) Jan.-March’15 1900-2000 Hrs
10 Tata Communications (CDMA) Jan.-March’15 1900-2000 Hrs
24
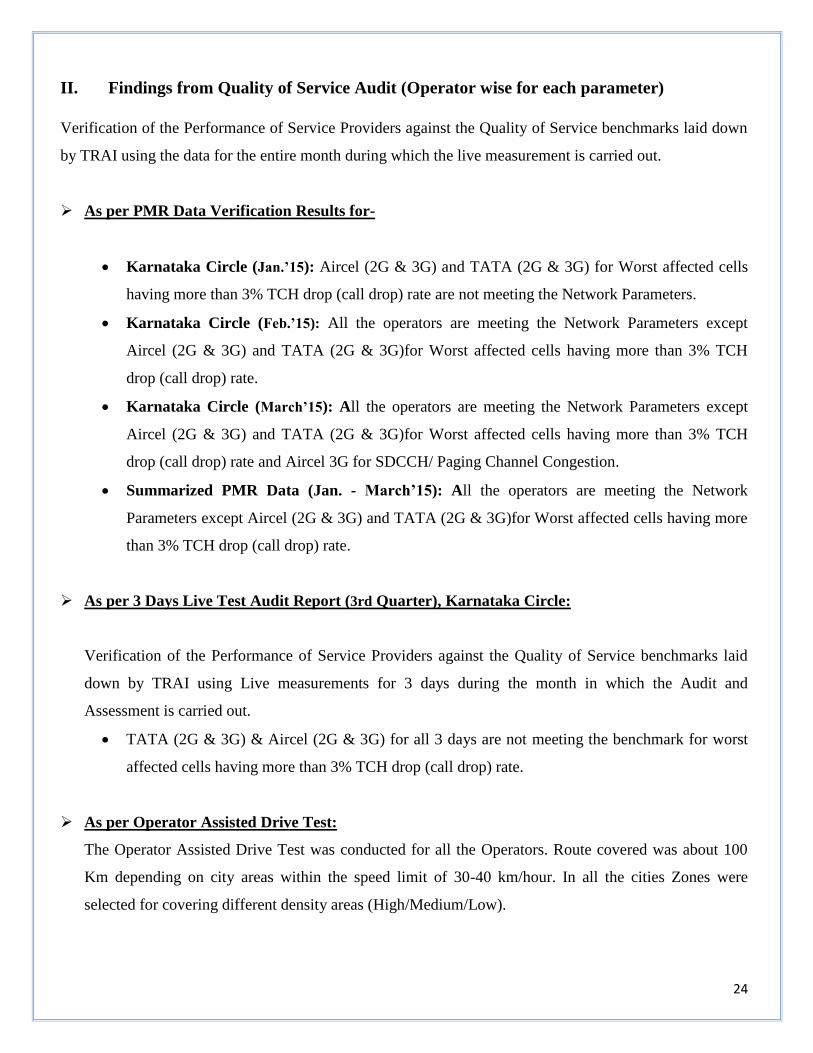
II. Findings from Quality of Service Audit (Operator wise for each parameter)
Verification of the Performance of Service Providers against the Quality of Service benchmarks laid down
by TRAI using the data for the entire month during which the live measurement is carried out.
As per PMR Data Verification Results for-
Karnataka Circle (Jan.’15): Aircel (2G & 3G) and TATA (2G & 3G) for Worst affected cells
having more than 3% TCH drop (call drop) rate are not meeting the Network Parameters.
Karnataka Circle (Feb.’15): All the operators are meeting the Network Parameters except
Aircel (2G & 3G) and TATA (2G & 3G)for Worst affected cells having more than 3% TCH
drop (call drop) rate.
Karnataka Circle (March’15): All the operators are meeting the Network Parameters except
Aircel (2G & 3G) and TATA (2G & 3G)for Worst affected cells having more than 3% TCH
drop (call drop) rate and Aircel 3G for SDCCH/ Paging Channel Congestion.
Summarized PMR Data (Jan. - March’15): All the operators are meeting the Network
Parameters except Aircel (2G & 3G) and TATA (2G & 3G)for Worst affected cells having more
than 3% TCH drop (call drop) rate.
As per 3 Days Live Test Audit Report (3rd Quarter), Karnataka Circle:
Verification of the Performance of Service Providers against the Quality of Service benchmarks laid
down by TRAI using Live measurements for 3 days during the month in which the Audit and
Assessment is carried out.
TATA (2G & 3G) & Aircel (2G & 3G) for all 3 days are not meeting the benchmark for worst
affected cells having more than 3% TCH drop (call drop) rate.
As per Operator Assisted Drive Test:
The Operator Assisted Drive Test was conducted for all the Operators. Route covered was about 100
Km depending on city areas within the speed limit of 30-40 km/hour. In all the cities Zones were
selected for covering different density areas (High/Medium/Low).

25
Karnataka Circle:
In Bijapur RCOM GSM for Blocked Call Rate (<=3%), TATA GSM for 0-5(with frequency
hopping) failed to achieve the respective benchmarks.
In Davangeree IDEA, RCOM GSM & TATA GSM for 0-5(with frequency hopping) failed to
achieve the respective benchmarks.
In Gulbarga TATA GSM for 0-5(with frequency hopping) failed to achieve the respective
benchmarks
Level 1 Live Calling (Emergency No.) Q3
Level 1 calling such as calling at emergency no. like Police, Fire, Ambulance and others were
made so as to check the service of such short codes. In different cities of Karnataka it was
found to be functional.
Performance (live calling for billing complaints):
We have made live calling to customers as per their complaints details and we verified their
complaint and we found that most of the complaints are resolved within the time line and all
the operators are meeting the TRAI benchmarks.
Live calling to call centre:-
In live calling to call centers we found that all the operators are meeting their benchmark
except Aircel, Rcom (GSM & CDMA) and TATA CDMA for both Calls got connected to
agent within 90 Sec and %age of calls got answered are not meeting the benchmark.
Inter Operator Call Assessment
In the inter-operator call assessment test, calls were made from one operator to other operator
so as to check congestion on both the operators’ network. In such cases, the radio part, switch
part and the POI in between the operators are involved and hence if any congestion is found in
the network, it may be due to any of these parts. The result shows that there is not much
congestion on the operator network; however the congestion was shown with all the operators
BSNL, Vodafone, Airtel, Rcom, Tata, Idea, Aircel and MTS service provider.
26
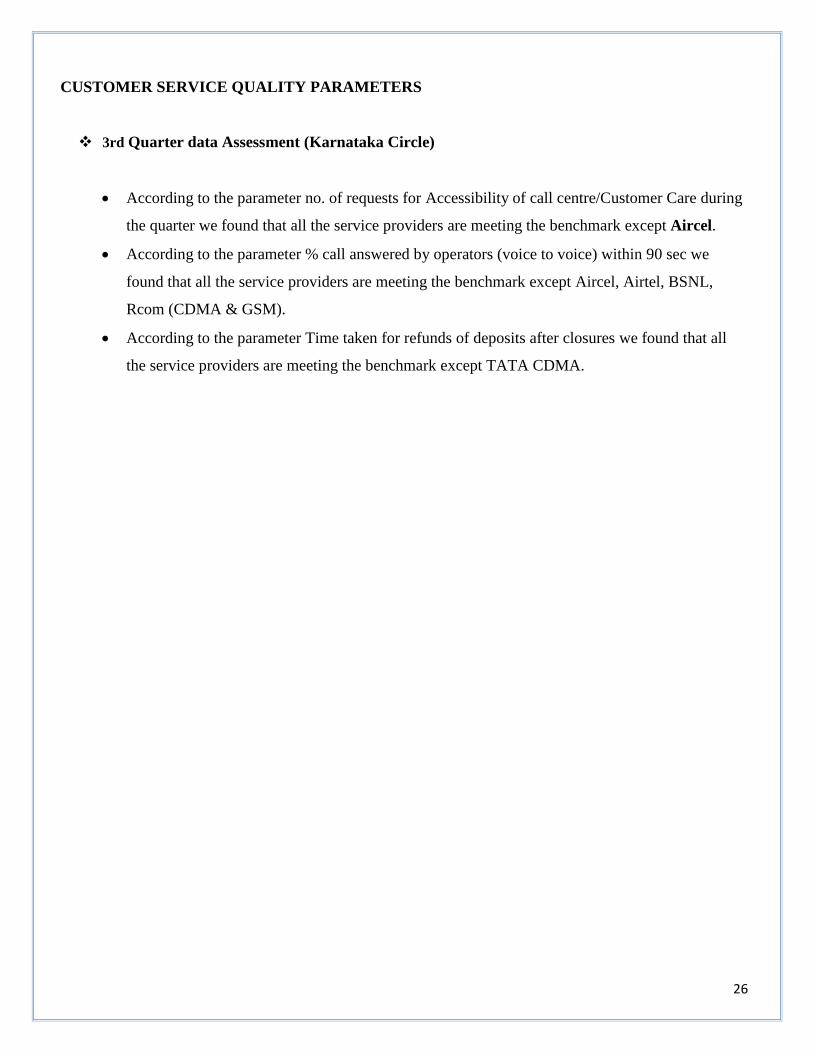
CUSTOMER SERVICE QUALITY PARAMETERS
3rd Quarter data Assessment (Karnataka Circle)
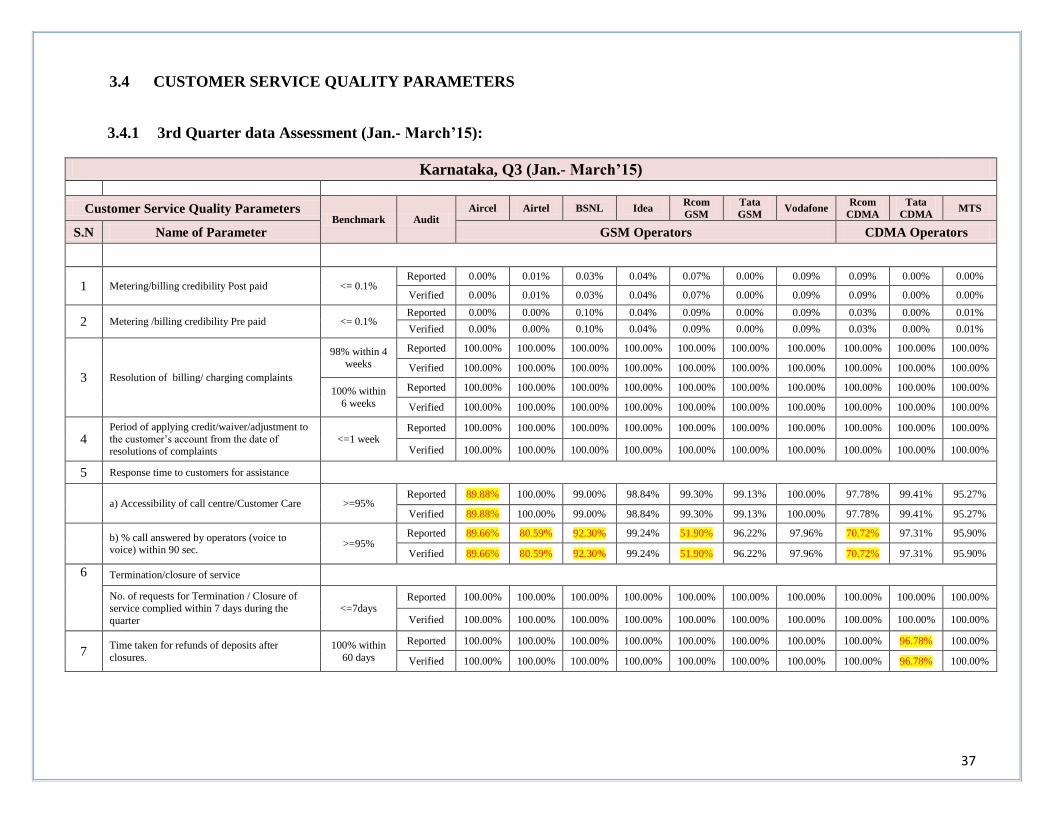
According to the parameter no. of requests for Accessibility of call centre/Customer Care during
the quarter we found that all the service providers are meeting the benchmark except Aircel.
According to the parameter % call answered by operators (voice to voice) within 90 sec we
found that all the service providers are meeting the benchmark except Aircel, Airtel, BSNL,
Rcom (CDMA & GSM).
According to the parameter Time taken for refunds of deposits after closures we found that all
the service providers are meeting the benchmark except TATA CDMA.
27
CHAPTER-3: AUDIT –PMR DATA VERIFICATION RESULTS
3.0 Cellular Mobile Telephone Service
3.1 PMR Data Verification Results for
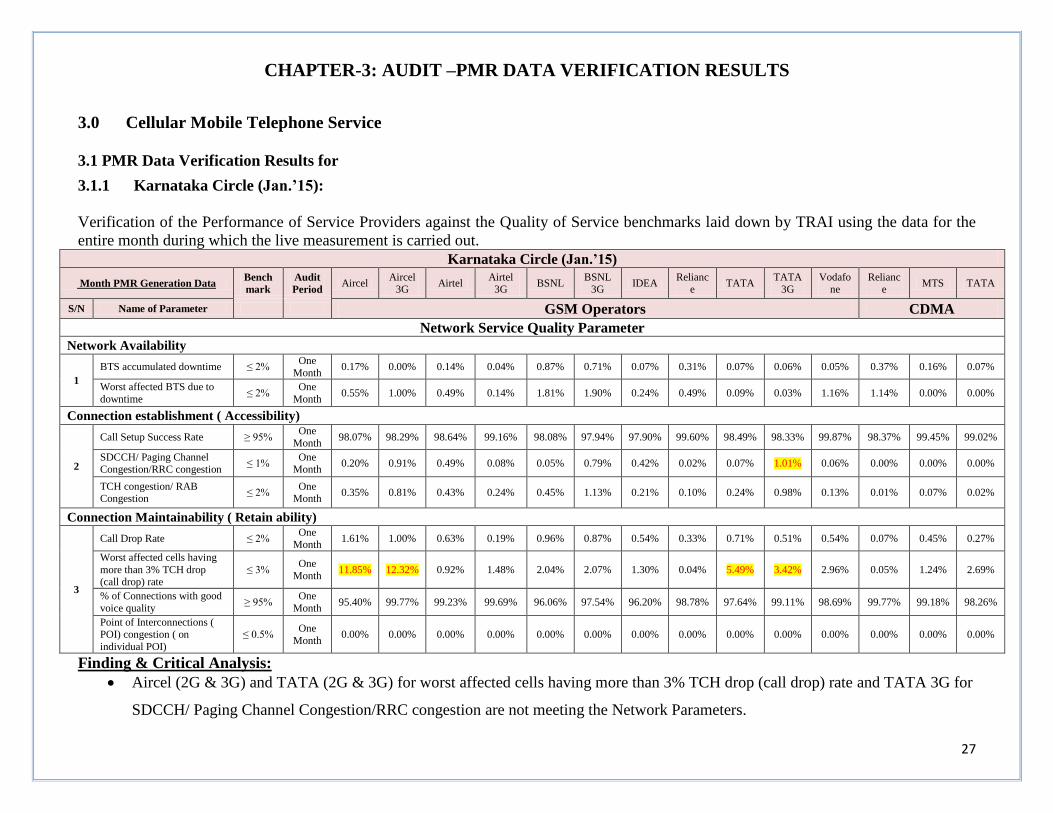
3.1.1 Karnataka Circle (Jan.’15):
Verification of the Performance of Service Providers against the Quality of Service benchmarks laid down by TRAI using the data for the
entire month during which the live measurement is carried out.
Karnataka Circle (Jan.’15)
Month PMR Generation Data Bench
mark
Audit
Period Aircel
Aircel 3G
Airtel Airtel
3G BSNL
BSNL 3G
IDEA Relianc
e TATA
TATA 3G
Vodafone
Reliance
MTS TATA
S/N Name of Parameter GSM Operators CDMA
Network Service Quality Parameter Network Availability
1
BTS accumulated downtime ≤ 2% One
Month 0.17% 0.00% 0.14% 0.04% 0.87% 0.71% 0.07% 0.31% 0.07% 0.06% 0.05% 0.37% 0.16% 0.07%
Worst affected BTS due to
downtime ≤ 2%
One
Month 0.55% 1.00% 0.49% 0.14% 1.81% 1.90% 0.24% 0.49% 0.09% 0.03% 1.16% 1.14% 0.00% 0.00%
Connection establishment ( Accessibility)
2
Call Setup Success Rate ≥ 95% One
Month 98.07% 98.29% 98.64% 99.16% 98.08% 97.94% 97.90% 99.60% 98.49% 98.33% 99.87% 98.37% 99.45% 99.02%
SDCCH/ Paging Channel Congestion/RRC congestion
≤ 1% One
Month 0.20% 0.91% 0.49% 0.08% 0.05% 0.79% 0.42% 0.02% 0.07% 1.01% 0.06% 0.00% 0.00% 0.00%
TCH congestion/ RAB Congestion
≤ 2% One
Month 0.35% 0.81% 0.43% 0.24% 0.45% 1.13% 0.21% 0.10% 0.24% 0.98% 0.13% 0.01% 0.07% 0.02%
Connection Maintainability ( Retain ability)
3
Call Drop Rate ≤ 2% One
Month 1.61% 1.00% 0.63% 0.19% 0.96% 0.87% 0.54% 0.33% 0.71% 0.51% 0.54% 0.07% 0.45% 0.27%
Worst affected cells having
more than 3% TCH drop (call drop) rate
≤ 3% One
Month 11.85% 12.32% 0.92% 1.48% 2.04% 2.07% 1.30% 0.04% 5.49% 3.42% 2.96% 0.05% 1.24% 2.69%
% of Connections with good
voice quality ≥ 95%
One
Month 95.40% 99.77% 99.23% 99.69% 96.06% 97.54% 96.20% 98.78% 97.64% 99.11% 98.69% 99.77% 99.18% 98.26%
Point of Interconnections ( POI) congestion ( on
individual POI)
≤ 0.5% One
Month 0.00% 0.00% 0.00% 0.00% 0.00% 0.00% 0.00% 0.00% 0.00% 0.00% 0.00% 0.00% 0.00% 0.00%
Finding & Critical Analysis:
Aircel (2G & 3G) and TATA (2G & 3G) for worst affected cells having more than 3% TCH drop (call drop) rate and TATA 3G for
SDCCH/ Paging Channel Congestion/RRC congestion are not meeting the Network Parameters.
28
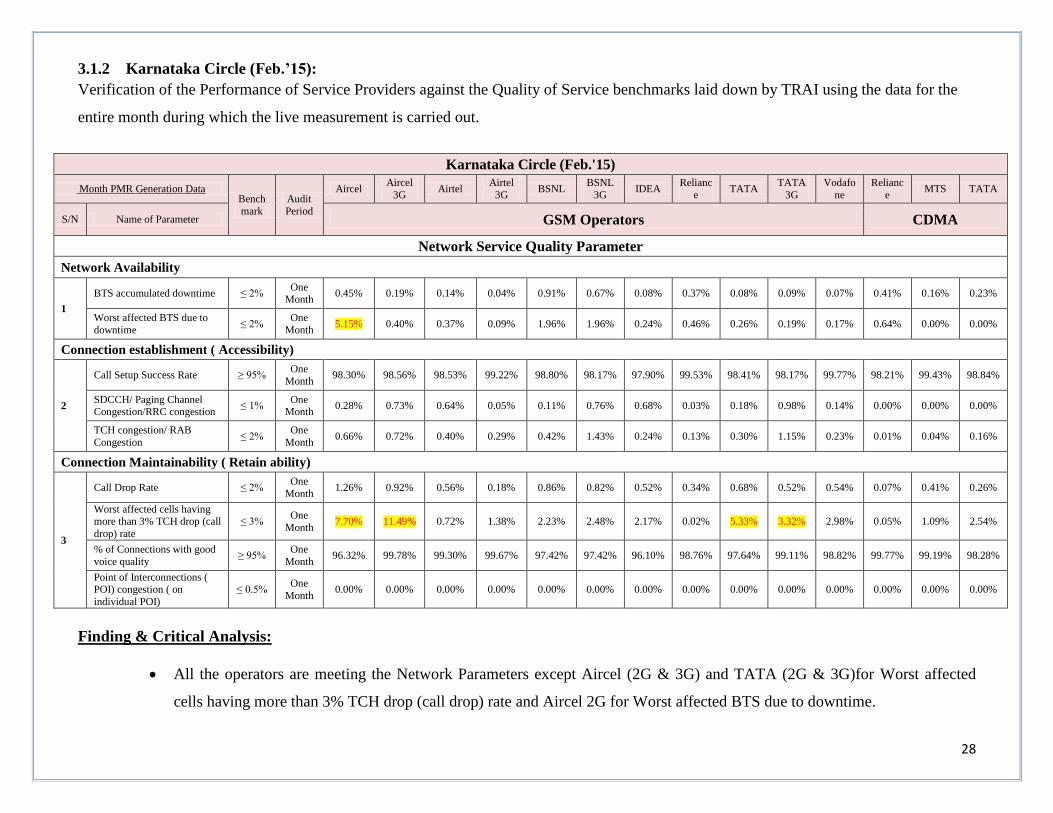
3.1.2 Karnataka Circle (Feb.’15):
Verification of the Performance of Service Providers against the Quality of Service benchmarks laid down by TRAI using the data for the
entire month during which the live measurement is carried out.
Karnataka Circle (Feb.'15)
Month PMR Generation Data Bench
mark
Audit
Period
Aircel Aircel
3G Airtel
Airtel
3G BSNL
BSNL
3G IDEA
Relianc
e TATA
TATA
3G
Vodafo
ne
Relianc
e MTS TATA
S/N Name of Parameter GSM Operators CDMA
Network Service Quality Parameter
Network Availability
1
BTS accumulated downtime ≤ 2% One
Month 0.45% 0.19% 0.14% 0.04% 0.91% 0.67% 0.08% 0.37% 0.08% 0.09% 0.07% 0.41% 0.16% 0.23%
Worst affected BTS due to
downtime ≤ 2%
One
Month 5.15% 0.40% 0.37% 0.09% 1.96% 1.96% 0.24% 0.46% 0.26% 0.19% 0.17% 0.64% 0.00% 0.00%
Connection establishment ( Accessibility)
2
Call Setup Success Rate ≥ 95% One
Month 98.30% 98.56% 98.53% 99.22% 98.80% 98.17% 97.90% 99.53% 98.41% 98.17% 99.77% 98.21% 99.43% 98.84%
SDCCH/ Paging Channel Congestion/RRC congestion
≤ 1% One
Month 0.28% 0.73% 0.64% 0.05% 0.11% 0.76% 0.68% 0.03% 0.18% 0.98% 0.14% 0.00% 0.00% 0.00%
TCH congestion/ RAB
Congestion ≤ 2%
One
Month 0.66% 0.72% 0.40% 0.29% 0.42% 1.43% 0.24% 0.13% 0.30% 1.15% 0.23% 0.01% 0.04% 0.16%
Connection Maintainability ( Retain ability)
3
Call Drop Rate ≤ 2% One
Month 1.26% 0.92% 0.56% 0.18% 0.86% 0.82% 0.52% 0.34% 0.68% 0.52% 0.54% 0.07% 0.41% 0.26%
Worst affected cells having more than 3% TCH drop (call
drop) rate
≤ 3% One
Month 7.70% 11.49% 0.72% 1.38% 2.23% 2.48% 2.17% 0.02% 5.33% 3.32% 2.98% 0.05% 1.09% 2.54%
% of Connections with good
voice quality ≥ 95%
One
Month 96.32% 99.78% 99.30% 99.67% 97.42% 97.42% 96.10% 98.76% 97.64% 99.11% 98.82% 99.77% 99.19% 98.28%
Point of Interconnections ( POI) congestion ( on
individual POI)
≤ 0.5% One
Month 0.00% 0.00% 0.00% 0.00% 0.00% 0.00% 0.00% 0.00% 0.00% 0.00% 0.00% 0.00% 0.00% 0.00%
Finding & Critical Analysis:
All the operators are meeting the Network Parameters except Aircel (2G & 3G) and TATA (2G & 3G)for Worst affected
cells having more than 3% TCH drop (call drop) rate and Aircel 2G for Worst affected BTS due to downtime.
29
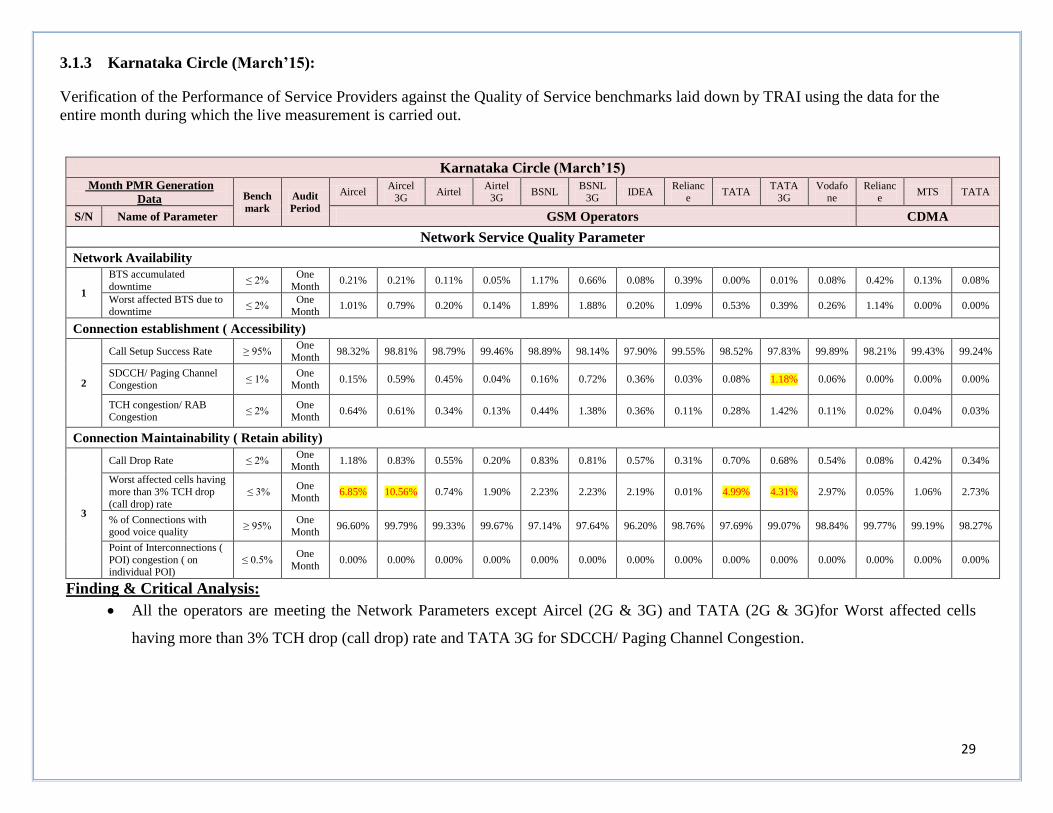
3.1.3 Karnataka Circle (March’15):
Verification of the Performance of Service Providers against the Quality of Service benchmarks laid down by TRAI using the data for the
entire month during which the live measurement is carried out.
Karnataka Circle (March’15) Month PMR Generation
Data Bench
mark
Audit
Period
Aircel Aircel
3G Airtel
Airtel 3G
BSNL BSNL
3G IDEA
Reliance
TATA TATA
3G Vodafo
ne Relianc
e MTS TATA
S/N Name of Parameter GSM Operators CDMA
Network Service Quality Parameter
Network Availability
1
BTS accumulated
downtime ≤ 2%
One
Month 0.21% 0.21% 0.11% 0.05% 1.17% 0.66% 0.08% 0.39% 0.00% 0.01% 0.08% 0.42% 0.13% 0.08%
Worst affected BTS due to downtime
≤ 2% One
Month 1.01% 0.79% 0.20% 0.14% 1.89% 1.88% 0.20% 1.09% 0.53% 0.39% 0.26% 1.14% 0.00% 0.00%
Connection establishment ( Accessibility)
2
Call Setup Success Rate ≥ 95% One
Month 98.32% 98.81% 98.79% 99.46% 98.89% 98.14% 97.90% 99.55% 98.52% 97.83% 99.89% 98.21% 99.43% 99.24%
SDCCH/ Paging Channel
Congestion ≤ 1%
One
Month 0.15% 0.59% 0.45% 0.04% 0.16% 0.72% 0.36% 0.03% 0.08% 1.18% 0.06% 0.00% 0.00% 0.00%
TCH congestion/ RAB Congestion
≤ 2% One
Month 0.64% 0.61% 0.34% 0.13% 0.44% 1.38% 0.36% 0.11% 0.28% 1.42% 0.11% 0.02% 0.04% 0.03%
Connection Maintainability ( Retain ability)
3
Call Drop Rate ≤ 2% One
Month 1.18% 0.83% 0.55% 0.20% 0.83% 0.81% 0.57% 0.31% 0.70% 0.68% 0.54% 0.08% 0.42% 0.34%
Worst affected cells having
more than 3% TCH drop
(call drop) rate
≤ 3% One
Month 6.85% 10.56% 0.74% 1.90% 2.23% 2.23% 2.19% 0.01% 4.99% 4.31% 2.97% 0.05% 1.06% 2.73%
% of Connections with
good voice quality ≥ 95%
One
Month 96.60% 99.79% 99.33% 99.67% 97.14% 97.64% 96.20% 98.76% 97.69% 99.07% 98.84% 99.77% 99.19% 98.27%
Point of Interconnections (
POI) congestion ( on individual POI)
≤ 0.5% One
Month 0.00% 0.00% 0.00% 0.00% 0.00% 0.00% 0.00% 0.00% 0.00% 0.00% 0.00% 0.00% 0.00% 0.00%
Finding & Critical Analysis:
All the operators are meeting the Network Parameters except Aircel (2G & 3G) and TATA (2G & 3G)for Worst affected cells
having more than 3% TCH drop (call drop) rate and TATA 3G for SDCCH/ Paging Channel Congestion.
30
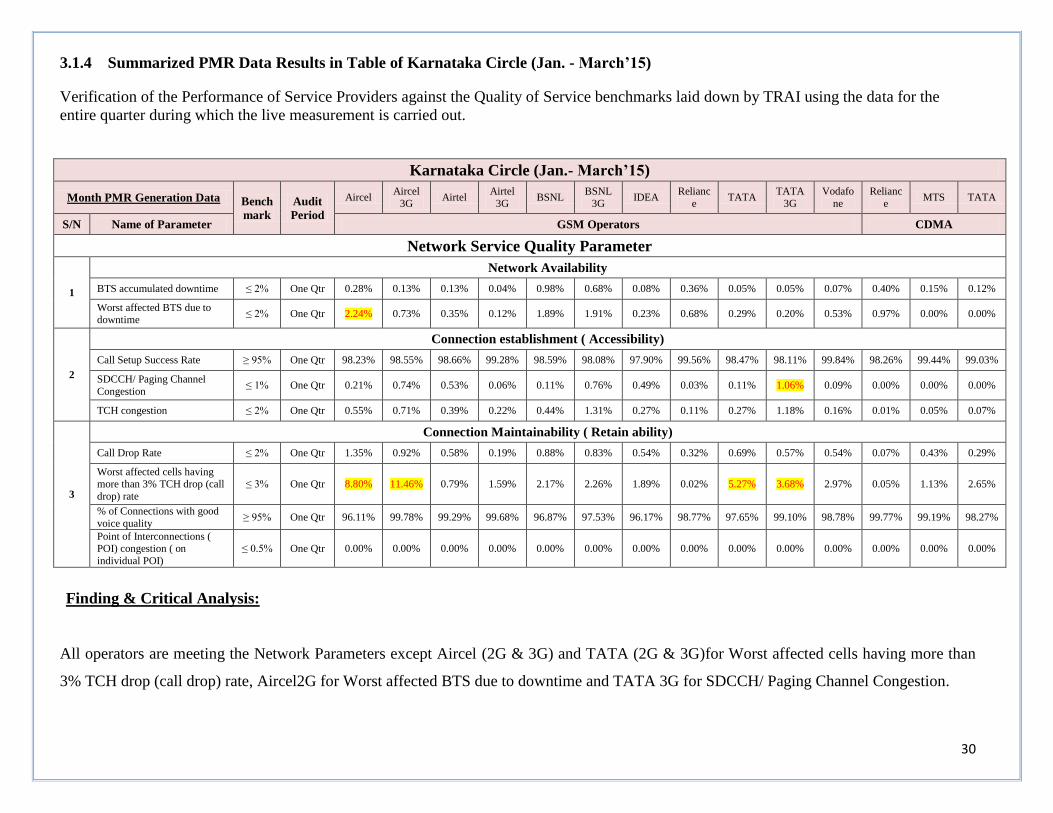
3.1.4 Summarized PMR Data Results in Table of Karnataka Circle (Jan. - March’15)
Verification of the Performance of Service Providers against the Quality of Service benchmarks laid down by TRAI using the data for the
entire quarter during which the live measurement is carried out.
Karnataka Circle (Jan.- March’15)
Month PMR Generation Data Bench
mark
Audit
Period
Aircel Aircel
3G Airtel
Airtel
3G BSNL
BSNL
3G IDEA
Relianc
e TATA
TATA
3G
Vodafo
ne
Relianc
e MTS TATA
S/N Name of Parameter GSM Operators CDMA
Network Service Quality Parameter
1
Network Availability BTS accumulated downtime ≤ 2% One Qtr 0.28% 0.13% 0.13% 0.04% 0.98% 0.68% 0.08% 0.36% 0.05% 0.05% 0.07% 0.40% 0.15% 0.12%
Worst affected BTS due to downtime
≤ 2% One Qtr 2.24% 0.73% 0.35% 0.12% 1.89% 1.91% 0.23% 0.68% 0.29% 0.20% 0.53% 0.97% 0.00% 0.00%
2
Connection establishment ( Accessibility)
Call Setup Success Rate ≥ 95% One Qtr 98.23% 98.55% 98.66% 99.28% 98.59% 98.08% 97.90% 99.56% 98.47% 98.11% 99.84% 98.26% 99.44% 99.03%
SDCCH/ Paging Channel
Congestion ≤ 1% One Qtr 0.21% 0.74% 0.53% 0.06% 0.11% 0.76% 0.49% 0.03% 0.11% 1.06% 0.09% 0.00% 0.00% 0.00%
TCH congestion ≤ 2% One Qtr 0.55% 0.71% 0.39% 0.22% 0.44% 1.31% 0.27% 0.11% 0.27% 1.18% 0.16% 0.01% 0.05% 0.07%
3
Connection Maintainability ( Retain ability) Call Drop Rate ≤ 2% One Qtr 1.35% 0.92% 0.58% 0.19% 0.88% 0.83% 0.54% 0.32% 0.69% 0.57% 0.54% 0.07% 0.43% 0.29%
Worst affected cells having more than 3% TCH drop (call
drop) rate
≤ 3% One Qtr 8.80% 11.46% 0.79% 1.59% 2.17% 2.26% 1.89% 0.02% 5.27% 3.68% 2.97% 0.05% 1.13% 2.65%
% of Connections with good
voice quality ≥ 95% One Qtr 96.11% 99.78% 99.29% 99.68% 96.87% 97.53% 96.17% 98.77% 97.65% 99.10% 98.78% 99.77% 99.19% 98.27%
Point of Interconnections ( POI) congestion ( on
individual POI)
≤ 0.5% One Qtr 0.00% 0.00% 0.00% 0.00% 0.00% 0.00% 0.00% 0.00% 0.00% 0.00% 0.00% 0.00% 0.00% 0.00%
Finding & Critical Analysis:
All operators are meeting the Network Parameters except Aircel (2G & 3G) and TATA (2G & 3G)for Worst affected cells having more than
3% TCH drop (call drop) rate, Aircel2G for Worst affected BTS due to downtime and TATA 3G for SDCCH/ Paging Channel Congestion.
31
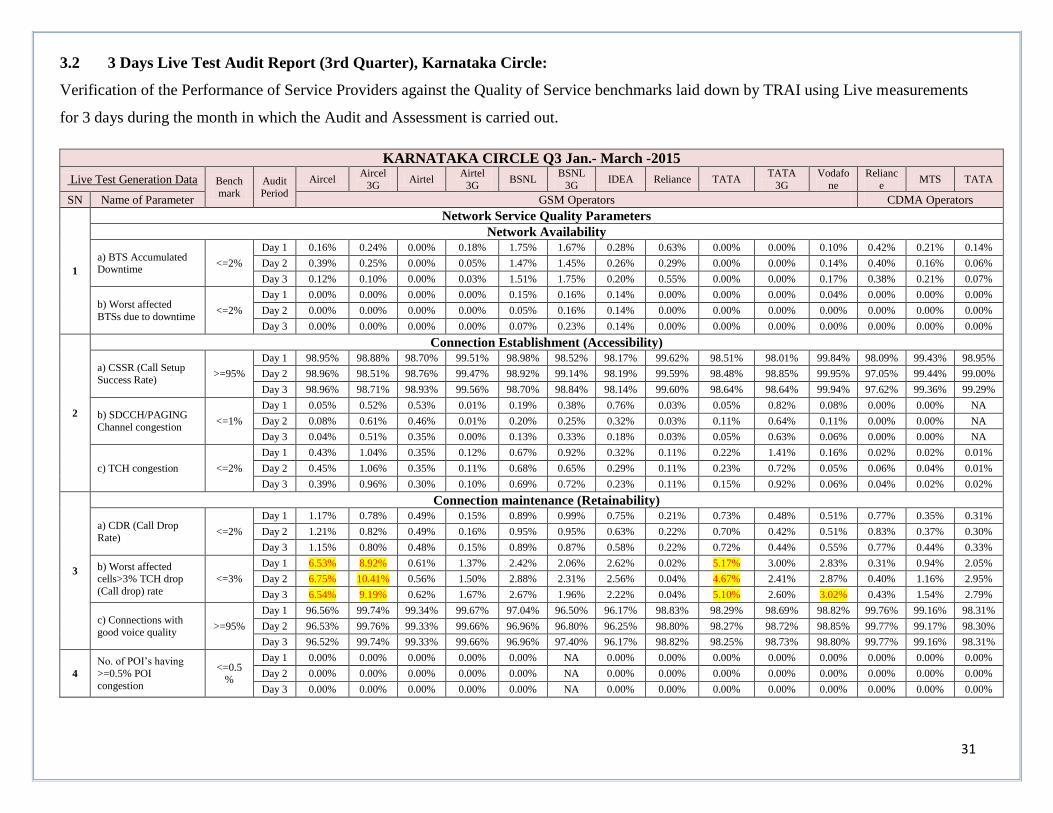
3.2 3 Days Live Test Audit Report (3rd Quarter), Karnataka Circle:
Verification of the Performance of Service Providers against the Quality of Service benchmarks laid down by TRAI using Live measurements
for 3 days during the month in which the Audit and Assessment is carried out.
KARNATAKA CIRCLE Q3 Jan.- March -2015
Live Test Generation Data Bench
mark
Audit
Period
Aircel Aircel
3G Airtel
Airtel
3G BSNL
BSNL
3G IDEA Reliance TATA
TATA
3G
Vodafo
ne
Relianc
e MTS TATA
SN Name of Parameter GSM Operators CDMA Operators
1
Network Service Quality Parameters
Network Availability
a) BTS Accumulated Downtime
<=2%
Day 1 0.16% 0.24% 0.00% 0.18% 1.75% 1.67% 0.28% 0.63% 0.00% 0.00% 0.10% 0.42% 0.21% 0.14%
Day 2 0.39% 0.25% 0.00% 0.05% 1.47% 1.45% 0.26% 0.29% 0.00% 0.00% 0.14% 0.40% 0.16% 0.06%
Day 3 0.12% 0.10% 0.00% 0.03% 1.51% 1.75% 0.20% 0.55% 0.00% 0.00% 0.17% 0.38% 0.21% 0.07%
b) Worst affected
BTSs due to downtime <=2%
Day 1 0.00% 0.00% 0.00% 0.00% 0.15% 0.16% 0.14% 0.00% 0.00% 0.00% 0.04% 0.00% 0.00% 0.00%
Day 2 0.00% 0.00% 0.00% 0.00% 0.05% 0.16% 0.14% 0.00% 0.00% 0.00% 0.00% 0.00% 0.00% 0.00%
Day 3 0.00% 0.00% 0.00% 0.00% 0.07% 0.23% 0.14% 0.00% 0.00% 0.00% 0.00% 0.00% 0.00% 0.00%
2
Connection Establishment (Accessibility)
a) CSSR (Call Setup
Success Rate) >=95%
Day 1 98.95% 98.88% 98.70% 99.51% 98.98% 98.52% 98.17% 99.62% 98.51% 98.01% 99.84% 98.09% 99.43% 98.95%
Day 2 98.96% 98.51% 98.76% 99.47% 98.92% 99.14% 98.19% 99.59% 98.48% 98.85% 99.95% 97.05% 99.44% 99.00%
Day 3 98.96% 98.71% 98.93% 99.56% 98.70% 98.84% 98.14% 99.60% 98.64% 98.64% 99.94% 97.62% 99.36% 99.29%
b) SDCCH/PAGING
Channel congestion <=1%
Day 1 0.05% 0.52% 0.53% 0.01% 0.19% 0.38% 0.76% 0.03% 0.05% 0.82% 0.08% 0.00% 0.00% NA
Day 2 0.08% 0.61% 0.46% 0.01% 0.20% 0.25% 0.32% 0.03% 0.11% 0.64% 0.11% 0.00% 0.00% NA
Day 3 0.04% 0.51% 0.35% 0.00% 0.13% 0.33% 0.18% 0.03% 0.05% 0.63% 0.06% 0.00% 0.00% NA
c) TCH congestion <=2%
Day 1 0.43% 1.04% 0.35% 0.12% 0.67% 0.92% 0.32% 0.11% 0.22% 1.41% 0.16% 0.02% 0.02% 0.01%
Day 2 0.45% 1.06% 0.35% 0.11% 0.68% 0.65% 0.29% 0.11% 0.23% 0.72% 0.05% 0.06% 0.04% 0.01%
Day 3 0.39% 0.96% 0.30% 0.10% 0.69% 0.72% 0.23% 0.11% 0.15% 0.92% 0.06% 0.04% 0.02% 0.02%
3
Connection maintenance (Retainability)
a) CDR (Call Drop
Rate) <=2%
Day 1 1.17% 0.78% 0.49% 0.15% 0.89% 0.99% 0.75% 0.21% 0.73% 0.48% 0.51% 0.77% 0.35% 0.31%
Day 2 1.21% 0.82% 0.49% 0.16% 0.95% 0.95% 0.63% 0.22% 0.70% 0.42% 0.51% 0.83% 0.37% 0.30%
Day 3 1.15% 0.80% 0.48% 0.15% 0.89% 0.87% 0.58% 0.22% 0.72% 0.44% 0.55% 0.77% 0.44% 0.33%
b) Worst affected cells>3% TCH drop
(Call drop) rate
<=3%
Day 1 6.53% 8.92% 0.61% 1.37% 2.42% 2.06% 2.62% 0.02% 5.17% 3.00% 2.83% 0.31% 0.94% 2.05%
Day 2 6.75% 10.41% 0.56% 1.50% 2.88% 2.31% 2.56% 0.04% 4.67% 2.41% 2.87% 0.40% 1.16% 2.95%
Day 3 6.54% 9.19% 0.62% 1.67% 2.67% 1.96% 2.22% 0.04% 5.10% 2.60% 3.02% 0.43% 1.54% 2.79%
c) Connections with
good voice quality >=95%
Day 1 96.56% 99.74% 99.34% 99.67% 97.04% 96.50% 96.17% 98.83% 98.29% 98.69% 98.82% 99.76% 99.16% 98.31%
Day 2 96.53% 99.76% 99.33% 99.66% 96.96% 96.80% 96.25% 98.80% 98.27% 98.72% 98.85% 99.77% 99.17% 98.30%
Day 3 96.52% 99.74% 99.33% 99.66% 96.96% 97.40% 96.17% 98.82% 98.25% 98.73% 98.80% 99.77% 99.16% 98.31%
4
No. of POI’s having
>=0.5% POI
congestion
<=0.5%
Day 1 0.00% 0.00% 0.00% 0.00% 0.00% NA 0.00% 0.00% 0.00% 0.00% 0.00% 0.00% 0.00% 0.00%
Day 2 0.00% 0.00% 0.00% 0.00% 0.00% NA 0.00% 0.00% 0.00% 0.00% 0.00% 0.00% 0.00% 0.00%
Day 3 0.00% 0.00% 0.00% 0.00% 0.00% NA 0.00% 0.00% 0.00% 0.00% 0.00% 0.00% 0.00% 0.00%
32
Finding & Critical Analysis:
All the service providers are meeting all the benchmarks except Aircel (2G & 3G) and TATA (GSM) for
all 3 days and Vodafone for day 3 for Worst affected cells>3% TCH drop (Call drop) rate.
33
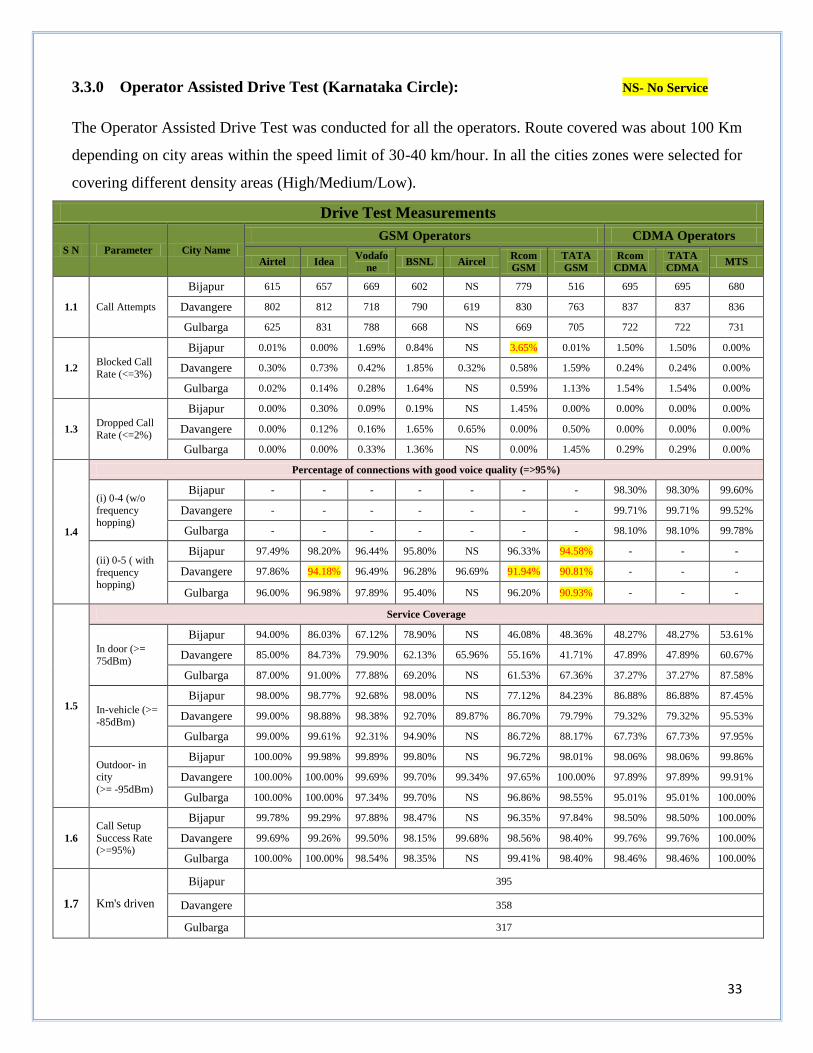
3.3.0 Operator Assisted Drive Test (Karnataka Circle): NS- No Service
The Operator Assisted Drive Test was conducted for all the operators. Route covered was about 100 Km
depending on city areas within the speed limit of 30-40 km/hour. In all the cities zones were selected for
covering different density areas (High/Medium/Low).
Drive Test Measurements
S N Parameter City Name
GSM Operators CDMA Operators
Airtel Idea Vodafo
ne BSNL Aircel
Rcom
GSM
TATA
GSM
Rcom
CDMA
TATA
CDMA MTS
1.1 Call Attempts
Bijapur 615 657 669 602 NS 779 516 695 695 680
Davangere 802 812 718 790 619 830 763 837 837 836
Gulbarga 625 831 788 668 NS 669 705 722 722 731
1.2 Blocked Call
Rate (<=3%)
Bijapur 0.01% 0.00% 1.69% 0.84% NS 3.65% 0.01% 1.50% 1.50% 0.00%
Davangere 0.30% 0.73% 0.42% 1.85% 0.32% 0.58% 1.59% 0.24% 0.24% 0.00%
Gulbarga 0.02% 0.14% 0.28% 1.64% NS 0.59% 1.13% 1.54% 1.54% 0.00%
1.3 Dropped Call
Rate (<=2%)
Bijapur 0.00% 0.30% 0.09% 0.19% NS 1.45% 0.00% 0.00% 0.00% 0.00%
Davangere 0.00% 0.12% 0.16% 1.65% 0.65% 0.00% 0.50% 0.00% 0.00% 0.00%
Gulbarga 0.00% 0.00% 0.33% 1.36% NS 0.00% 1.45% 0.29% 0.29% 0.00%
1.4
Percentage of connections with good voice quality (=>95%)
(i) 0-4 (w/o
frequency hopping)
Bijapur - - - - - - - 98.30% 98.30% 99.60%
Davangere - - - - - - - 99.71% 99.71% 99.52%
Gulbarga - - - - - - - 98.10% 98.10% 99.78%
(ii) 0-5 ( with
frequency hopping)
Bijapur 97.49% 98.20% 96.44% 95.80% NS 96.33% 94.58% - - -
Davangere 97.86% 94.18% 96.49% 96.28% 96.69% 91.94% 90.81% - - -
Gulbarga 96.00% 96.98% 97.89% 95.40% NS 96.20% 90.93% - - -
1.5
Service Coverage
In door (>=
75dBm)
Bijapur 94.00% 86.03% 67.12% 78.90% NS 46.08% 48.36% 48.27% 48.27% 53.61%
Davangere 85.00% 84.73% 79.90% 62.13% 65.96% 55.16% 41.71% 47.89% 47.89% 60.67%
Gulbarga 87.00% 91.00% 77.88% 69.20% NS 61.53% 67.36% 37.27% 37.27% 87.58%
In-vehicle (>=
-85dBm)
Bijapur 98.00% 98.77% 92.68% 98.00% NS 77.12% 84.23% 86.88% 86.88% 87.45%
Davangere 99.00% 98.88% 98.38% 92.70% 89.87% 86.70% 79.79% 79.32% 79.32% 95.53%
Gulbarga 99.00% 99.61% 92.31% 94.90% NS 86.72% 88.17% 67.73% 67.73% 97.95%
Outdoor- in city
(>= -95dBm)
Bijapur 100.00% 99.98% 99.89% 99.80% NS 96.72% 98.01% 98.06% 98.06% 99.86%
Davangere 100.00% 100.00% 99.69% 99.70% 99.34% 97.65% 100.00% 97.89% 97.89% 99.91%
Gulbarga 100.00% 100.00% 97.34% 99.70% NS 96.86% 98.55% 95.01% 95.01% 100.00%
1.6
Call Setup
Success Rate (>=95%)
Bijapur 99.78% 99.29% 97.88% 98.47% NS 96.35% 97.84% 98.50% 98.50% 100.00%
Davangere 99.69% 99.26% 99.50% 98.15% 99.68% 98.56% 98.40% 99.76% 99.76% 100.00%
Gulbarga 100.00% 100.00% 98.54% 98.35% NS 99.41% 98.40% 98.46% 98.46% 100.00%
1.7 Km's driven
Bijapur 395
Davangere 358
Gulbarga 317

34
Finding & Critical Analysis:
In Bijapur RCOM GSM for Blocked Call Rate (<=3%), TATA GSM for 0-5(with frequency
hopping) failed to achieve the respective benchmarks.
In Davangeree IDEA, RCOM GSM & TATA GSM for 0-5(with frequency hopping) failed to
achieve the respective benchmarks.
In Gulbarga TATA GSM for 0-5(with frequency hopping) failed to achieve the respective
benchmarks.
35
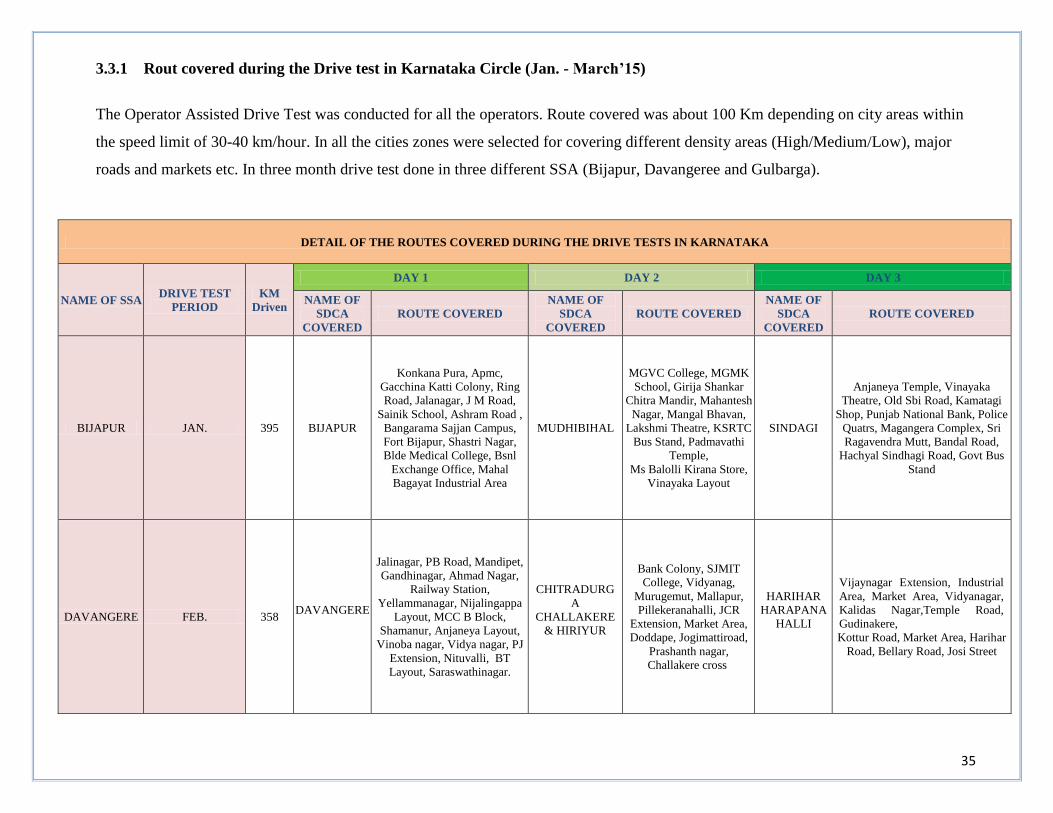
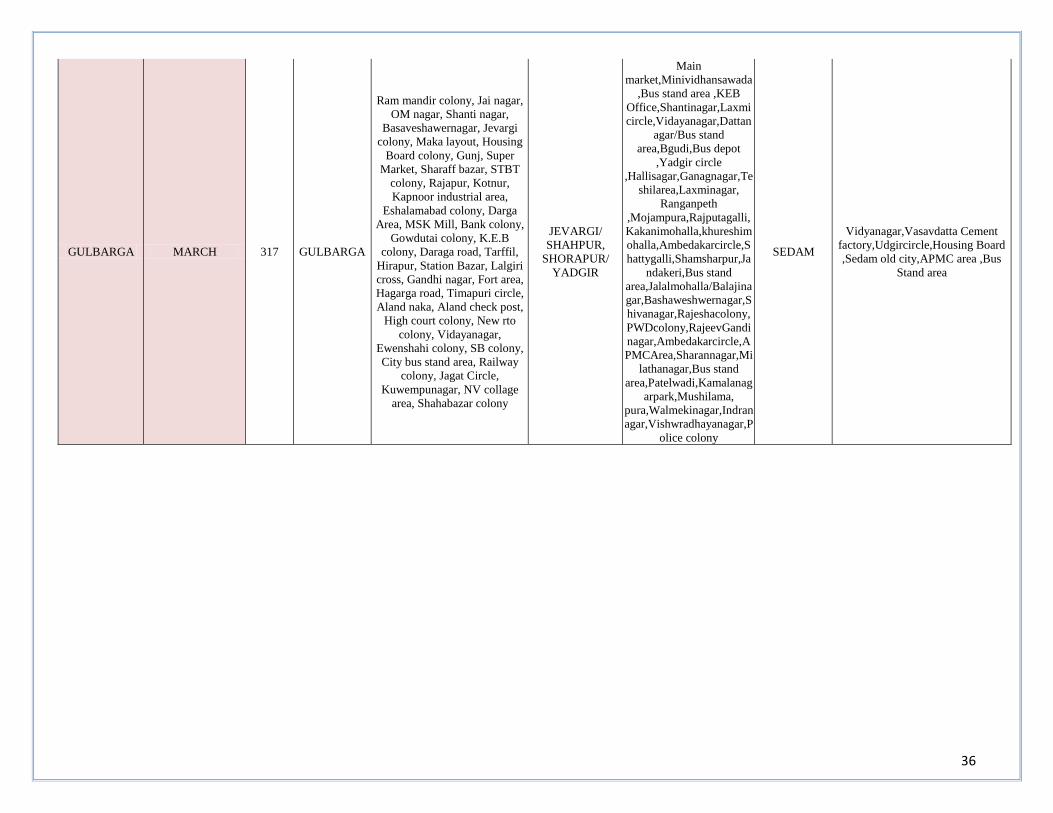
3.3.1 Rout covered during the Drive test in Karnataka Circle (Jan. - March’15)
The Operator Assisted Drive Test was conducted for all the operators. Route covered was about 100 Km depending on city areas within
the speed limit of 30-40 km/hour. In all the cities zones were selected for covering different density areas (High/Medium/Low), major
roads and markets etc. In three month drive test done in three different SSA (Bijapur, Davangeree and Gulbarga).
DETAIL OF THE ROUTES COVERED DURING THE DRIVE TESTS IN KARNATAKA
NAME OF SSA DRIVE TEST
PERIOD
KM
Driven
DAY 1 DAY 2 DAY 3
NAME OF
SDCA
COVERED
ROUTE COVERED
NAME OF
SDCA
COVERED
ROUTE COVERED
NAME OF
SDCA
COVERED
ROUTE COVERED
BIJAPUR JAN. 395 BIJAPUR
Konkana Pura, Apmc,
Gacchina Katti Colony, Ring
Road, Jalanagar, J M Road,
Sainik School, Ashram Road ,
Bangarama Sajjan Campus,
Fort Bijapur, Shastri Nagar,
Blde Medical College, Bsnl
Exchange Office, Mahal
Bagayat Industrial Area
MUDHIBIHAL
MGVC College, MGMK
School, Girija Shankar
Chitra Mandir, Mahantesh
Nagar, Mangal Bhavan,
Lakshmi Theatre, KSRTC
Bus Stand, Padmavathi
Temple,
Ms Balolli Kirana Store,
Vinayaka Layout
SINDAGI
Anjaneya Temple, Vinayaka
Theatre, Old Sbi Road, Kamatagi
Shop, Punjab National Bank, Police
Quatrs, Magangera Complex, Sri
Ragavendra Mutt, Bandal Road,
Hachyal Sindhagi Road, Govt Bus
Stand
DAVANGERE FEB. 358 DAVANGERE
Jalinagar, PB Road, Mandipet,
Gandhinagar, Ahmad Nagar,
Railway Station,
Yellammanagar, Nijalingappa
Layout, MCC B Block,
Shamanur, Anjaneya Layout,
Vinoba nagar, Vidya nagar, PJ
Extension, Nituvalli, BT
Layout, Saraswathinagar.
CHITRADURG
A
CHALLAKERE
& HIRIYUR
Bank Colony, SJMIT
College, Vidyanag,
Murugemut, Mallapur,
Pillekeranahalli, JCR
Extension, Market Area,
Doddape, Jogimattiroad,
Prashanth nagar,
Challakere cross
HARIHAR
HARAPANA
HALLI
Vijaynagar Extension, Industrial
Area, Market Area, Vidyanagar,
Kalidas Nagar,Temple Road,
Gudinakere,
Kottur Road, Market Area, Harihar
Road, Bellary Road, Josi Street
36
GULBARGA MARCH 317 GULBARGA
Ram mandir colony, Jai nagar,
OM nagar, Shanti nagar,
Basaveshawernagar, Jevargi
colony, Maka layout, Housing
Board colony, Gunj, Super
Market, Sharaff bazar, STBT
colony, Rajapur, Kotnur,
Kapnoor industrial area,
Eshalamabad colony, Darga
Area, MSK Mill, Bank colony,
Gowdutai colony, K.E.B
colony, Daraga road, Tarffil,
Hirapur, Station Bazar, Lalgiri
cross, Gandhi nagar, Fort area,
Hagarga road, Timapuri circle,
Aland naka, Aland check post,
High court colony, New rto
colony, Vidayanagar,
Ewenshahi colony, SB colony,
City bus stand area, Railway
colony, Jagat Circle,
Kuwempunagar, NV collage
area, Shahabazar colony
JEVARGI/
SHAHPUR,
SHORAPUR/
YADGIR
Main
market,Minividhansawada
,Bus stand area ,KEB
Office,Shantinagar,Laxmi
circle,Vidayanagar,Dattan
agar/Bus stand
area,Bgudi,Bus depot
,Yadgir circle
,Hallisagar,Ganagnagar,Te
shilarea,Laxminagar,
Ranganpeth
,Mojampura,Rajputagalli,
Kakanimohalla,khureshim
ohalla,Ambedakarcircle,S
hattygalli,Shamsharpur,Ja
ndakeri,Bus stand
area,Jalalmohalla/Balajina
gar,Bashaweshwernagar,S
hivanagar,Rajeshacolony,
PWDcolony,RajeevGandi
nagar,Ambedakarcircle,A
PMCArea,Sharannagar,Mi
lathanagar,Bus stand
area,Patelwadi,Kamalanag
arpark,Mushilama,
pura,Walmekinagar,Indran
agar,Vishwradhayanagar,P
olice colony
SEDAM
Vidyanagar,Vasavdatta Cement
factory,Udgircircle,Housing Board
,Sedam old city,APMC area ,Bus
Stand area
37
3.4 CUSTOMER SERVICE QUALITY PARAMETERS
3.4.1 3rd Quarter data Assessment (Jan.- March’15):
Karnataka, Q3 (Jan.- March’15)
Customer Service Quality Parameters Benchmark Audit
Aircel Airtel BSNL Idea Rcom
GSM
Tata
GSM Vodafone
Rcom
CDMA
Tata
CDMA MTS
S.N Name of Parameter GSM Operators CDMA Operators
1 Metering/billing credibility Post paid <= 0.1% Reported 0.00% 0.01% 0.03% 0.04% 0.07% 0.00% 0.09% 0.09% 0.00% 0.00%
Verified 0.00% 0.01% 0.03% 0.04% 0.07% 0.00% 0.09% 0.09% 0.00% 0.00%
2 Metering /billing credibility Pre paid <= 0.1% Reported 0.00% 0.00% 0.10% 0.04% 0.09% 0.00% 0.09% 0.03% 0.00% 0.01%
Verified 0.00% 0.00% 0.10% 0.04% 0.09% 0.00% 0.09% 0.03% 0.00% 0.01%
3 Resolution of billing/ charging complaints
98% within 4
weeks
Reported 100.00% 100.00% 100.00% 100.00% 100.00% 100.00% 100.00% 100.00% 100.00% 100.00%
Verified 100.00% 100.00% 100.00% 100.00% 100.00% 100.00% 100.00% 100.00% 100.00% 100.00%
100% within
6 weeks
Reported 100.00% 100.00% 100.00% 100.00% 100.00% 100.00% 100.00% 100.00% 100.00% 100.00%
Verified 100.00% 100.00% 100.00% 100.00% 100.00% 100.00% 100.00% 100.00% 100.00% 100.00%
4 Period of applying credit/waiver/adjustment to
the customer’s account from the date of resolutions of complaints
<=1 week Reported 100.00% 100.00% 100.00% 100.00% 100.00% 100.00% 100.00% 100.00% 100.00% 100.00%
Verified 100.00% 100.00% 100.00% 100.00% 100.00% 100.00% 100.00% 100.00% 100.00% 100.00%
5 Response time to customers for assistance
a) Accessibility of call centre/Customer Care >=95% Reported 89.88% 100.00% 99.00% 98.84% 99.30% 99.13% 100.00% 97.78% 99.41% 95.27%
Verified 89.88% 100.00% 99.00% 98.84% 99.30% 99.13% 100.00% 97.78% 99.41% 95.27%
b) % call answered by operators (voice to voice) within 90 sec.
>=95% Reported 89.66% 80.59% 92.30% 99.24% 51.90% 96.22% 97.96% 70.72% 97.31% 95.90%
Verified 89.66% 80.59% 92.30% 99.24% 51.90% 96.22% 97.96% 70.72% 97.31% 95.90%
6 Termination/closure of service
No. of requests for Termination / Closure of
service complied within 7 days during the
quarter
<=7days Reported 100.00% 100.00% 100.00% 100.00% 100.00% 100.00% 100.00% 100.00% 100.00% 100.00%
Verified 100.00% 100.00% 100.00% 100.00% 100.00% 100.00% 100.00% 100.00% 100.00% 100.00%
7 Time taken for refunds of deposits after
closures.
100% within
60 days
Reported 100.00% 100.00% 100.00% 100.00% 100.00% 100.00% 100.00% 100.00% 96.78% 100.00%
Verified 100.00% 100.00% 100.00% 100.00% 100.00% 100.00% 100.00% 100.00% 96.78% 100.00%

38
Finding & Critical Analysis:-
According to the parameter no. of requests for Accessibility of call centre/Customer Care during the
quarter we found that all the service providers are meeting the benchmark except Aircel.
According to the parameter % call answered by operators (voice to voice) within 90 sec we found
that all the service providers are meeting the benchmark except Aircel, Airtel, BSNL, Rcom
(CDMA & GSM).
According to the parameter Time taken for refunds of deposits after closures we found that all the
service providers are meeting the benchmark except TATA CDMA.
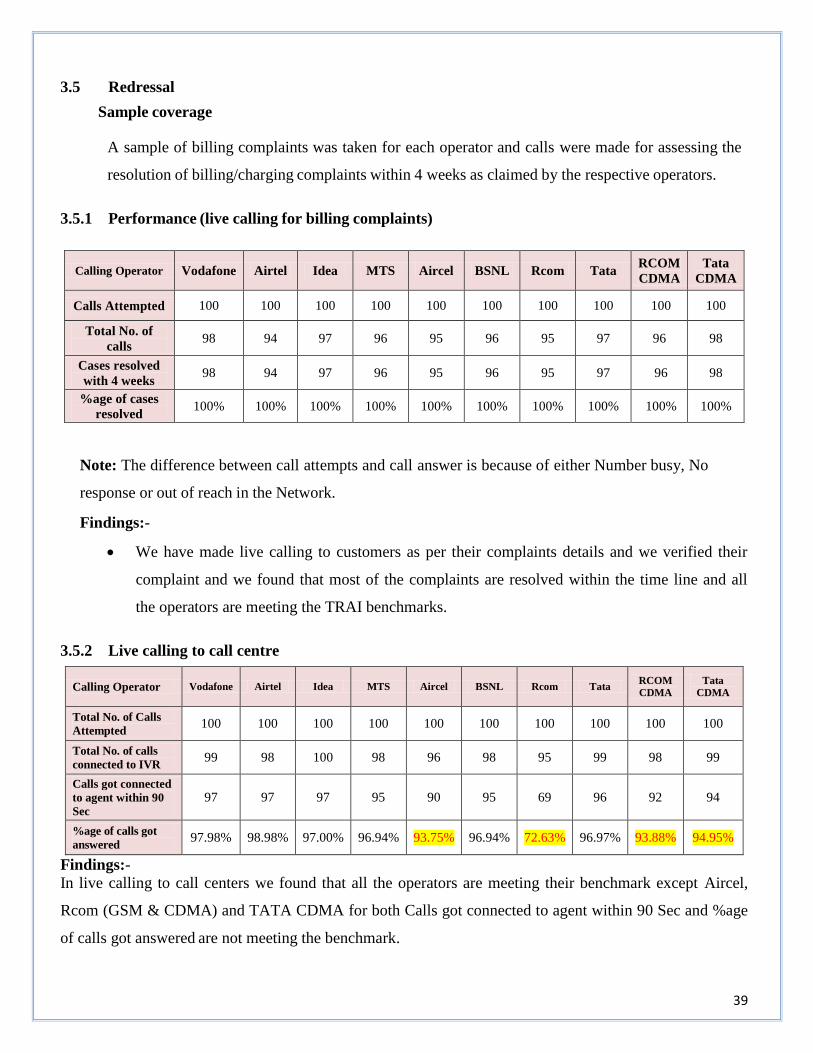
39
3.5 Redressal
Sample coverage
A sample of billing complaints was taken for each operator and calls were made for assessing the
resolution of billing/charging complaints within 4 weeks as claimed by the respective operators.
3.5.1 Performance (live calling for billing complaints)
Calling Operator Vodafone Airtel Idea MTS Aircel BSNL Rcom Tata RCOM
CDMA
Tata
CDMA
Calls Attempted 100 100 100 100 100 100 100 100 100 100
Total No. of
calls 98 94 97 96 95 96 95 97 96 98
Cases resolved
with 4 weeks 98 94 97 96 95 96 95 97 96 98
%age of cases
resolved 100% 100% 100% 100% 100% 100% 100% 100% 100% 100%
Note: The difference between call attempts and call answer is because of either Number busy, No
response or out of reach in the Network.
Findings:-
We have made live calling to customers as per their complaints details and we verified their
complaint and we found that most of the complaints are resolved within the time line and all
the operators are meeting the TRAI benchmarks.
3.5.2 Live calling to call centre
Calling Operator Vodafone Airtel Idea MTS Aircel BSNL Rcom Tata RCOM
CDMA
Tata
CDMA
Total No. of Calls
Attempted 100 100 100 100 100 100 100 100 100 100
Total No. of calls
connected to IVR 99 98 100 98 96 98 95 99 98 99
Calls got connected
to agent within 90
Sec
97 97 97 95 90 95 69 96 92 94
%age of calls got
answered 97.98% 98.98% 97.00% 96.94% 93.75% 96.94% 72.63% 96.97% 93.88% 94.95%
Findings:-
In live calling to call centers we found that all the operators are meeting their benchmark except Aircel,
Rcom (GSM & CDMA) and TATA CDMA for both Calls got connected to agent within 90 Sec and %age
of calls got answered are not meeting the benchmark.
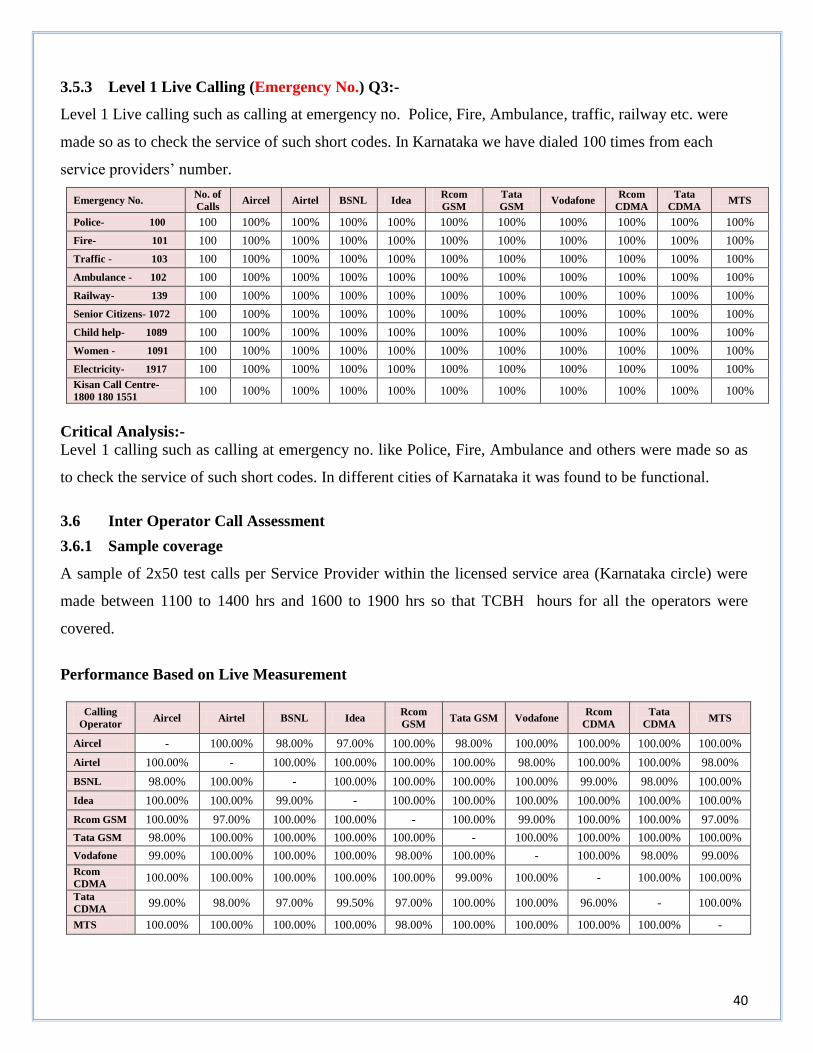
40
3.5.3 Level 1 Live Calling (Emergency No.) Q3:-
Level 1 Live calling such as calling at emergency no. Police, Fire, Ambulance, traffic, railway etc. were
made so as to check the service of such short codes. In Karnataka we have dialed 100 times from each
service providers’ number.
Emergency No. No. of
Calls Aircel Airtel BSNL Idea
Rcom
GSM
Tata
GSM Vodafone
Rcom
CDMA
Tata
CDMA MTS
Police- 100 100 100% 100% 100% 100% 100% 100% 100% 100% 100% 100%
Fire- 101 100 100% 100% 100% 100% 100% 100% 100% 100% 100% 100%
Traffic - 103 100 100% 100% 100% 100% 100% 100% 100% 100% 100% 100%
Ambulance - 102 100 100% 100% 100% 100% 100% 100% 100% 100% 100% 100%
Railway- 139 100 100% 100% 100% 100% 100% 100% 100% 100% 100% 100%
Senior Citizens- 1072 100 100% 100% 100% 100% 100% 100% 100% 100% 100% 100%
Child help- 1089 100 100% 100% 100% 100% 100% 100% 100% 100% 100% 100%
Women - 1091 100 100% 100% 100% 100% 100% 100% 100% 100% 100% 100%
Electricity- 1917 100 100% 100% 100% 100% 100% 100% 100% 100% 100% 100%
Kisan Call Centre-
1800 180 1551 100 100% 100% 100% 100% 100% 100% 100% 100% 100% 100%
Critical Analysis:-
Level 1 calling such as calling at emergency no. like Police, Fire, Ambulance and others were made so as
to check the service of such short codes. In different cities of Karnataka it was found to be functional.
3.6 Inter Operator Call Assessment
3.6.1 Sample coverage
A sample of 2x50 test calls per Service Provider within the licensed service area (Karnataka circle) were
made between 1100 to 1400 hrs and 1600 to 1900 hrs so that TCBH hours for all the operators were
covered.
Performance Based on Live Measurement
Calling
Operator Aircel Airtel BSNL Idea
Rcom
GSM Tata GSM Vodafone
Rcom
CDMA
Tata
CDMA MTS
Aircel - 100.00% 98.00% 97.00% 100.00% 98.00% 100.00% 100.00% 100.00% 100.00%
Airtel 100.00% - 100.00% 100.00% 100.00% 100.00% 98.00% 100.00% 100.00% 98.00%
BSNL 98.00% 100.00% - 100.00% 100.00% 100.00% 100.00% 99.00% 98.00% 100.00%
Idea 100.00% 100.00% 99.00% - 100.00% 100.00% 100.00% 100.00% 100.00% 100.00%
Rcom GSM 100.00% 97.00% 100.00% 100.00% - 100.00% 99.00% 100.00% 100.00% 97.00%
Tata GSM 98.00% 100.00% 100.00% 100.00% 100.00% - 100.00% 100.00% 100.00% 100.00%
Vodafone 99.00% 100.00% 100.00% 100.00% 98.00% 100.00% - 100.00% 98.00% 99.00%
Rcom
CDMA 100.00% 100.00% 100.00% 100.00% 100.00% 99.00% 100.00% - 100.00% 100.00%
Tata
CDMA 99.00% 98.00% 97.00% 99.50% 97.00% 100.00% 100.00% 96.00% - 100.00%
MTS 100.00% 100.00% 100.00% 100.00% 98.00% 100.00% 100.00% 100.00% 100.00% -
41
Critical Analysis:-
In the inter-operator call assessment test, calls were made from one operator to other operator so as to
check congestion on both the operators’ network. In such cases, the radio part, switch part and the POI
in between the operators are involved and hence if any congestion is found in the network, it may be due
to any of these parts. The result shows that there is not much congestion on the operator network;
however the congestion was shown with all the operators BSNL, Vodafone, Airtel, Rcom, Tata, Idea,
Aircel and MTS service provider.
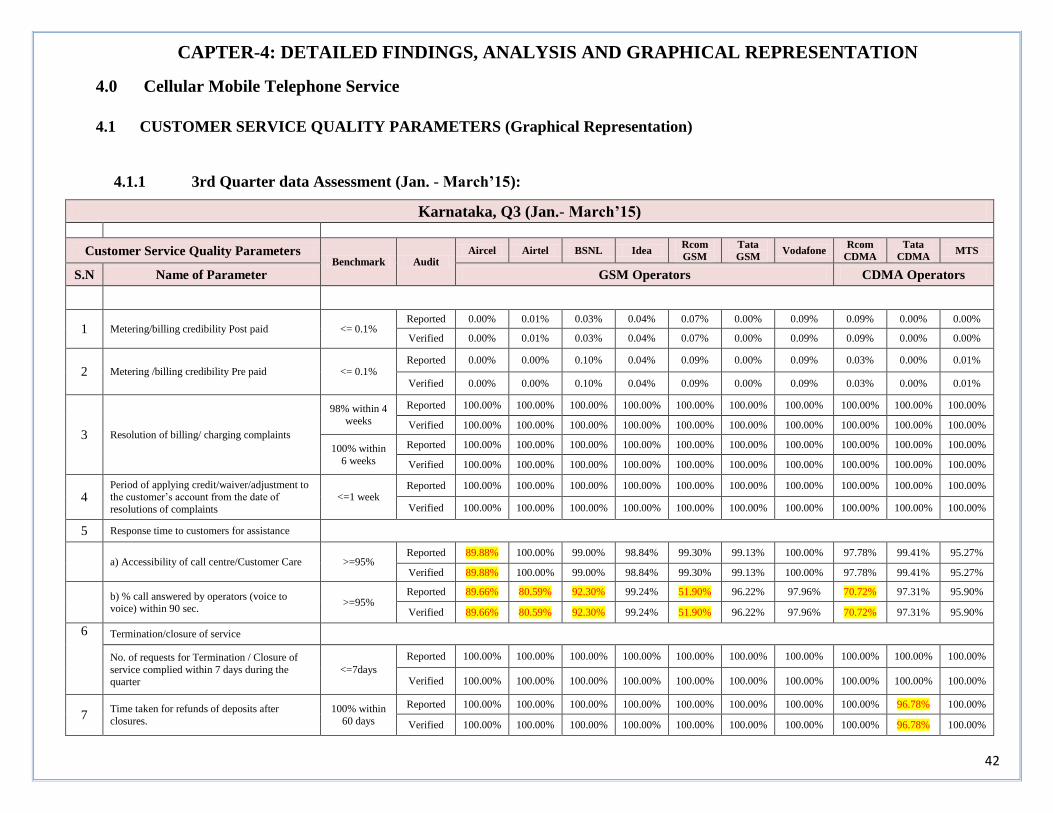
42
CAPTER-4: DETAILED FINDINGS, ANALYSIS AND GRAPHICAL REPRESENTATION
4.0 Cellular Mobile Telephone Service
4.1 CUSTOMER SERVICE QUALITY PARAMETERS (Graphical Representation)
4.1.1 3rd Quarter data Assessment (Jan. - March’15):
Karnataka, Q3 (Jan.- March’15)
Customer Service Quality Parameters Benchmark Audit
Aircel Airtel BSNL Idea Rcom
GSM
Tata
GSM Vodafone
Rcom
CDMA
Tata
CDMA MTS
S.N Name of Parameter GSM Operators CDMA Operators
1 Metering/billing credibility Post paid <= 0.1% Reported 0.00% 0.01% 0.03% 0.04% 0.07% 0.00% 0.09% 0.09% 0.00% 0.00%
Verified 0.00% 0.01% 0.03% 0.04% 0.07% 0.00% 0.09% 0.09% 0.00% 0.00%
2 Metering /billing credibility Pre paid <= 0.1% Reported 0.00% 0.00% 0.10% 0.04% 0.09% 0.00% 0.09% 0.03% 0.00% 0.01%
Verified 0.00% 0.00% 0.10% 0.04% 0.09% 0.00% 0.09% 0.03% 0.00% 0.01%
3 Resolution of billing/ charging complaints
98% within 4
weeks
Reported 100.00% 100.00% 100.00% 100.00% 100.00% 100.00% 100.00% 100.00% 100.00% 100.00%
Verified 100.00% 100.00% 100.00% 100.00% 100.00% 100.00% 100.00% 100.00% 100.00% 100.00%
100% within
6 weeks
Reported 100.00% 100.00% 100.00% 100.00% 100.00% 100.00% 100.00% 100.00% 100.00% 100.00%
Verified 100.00% 100.00% 100.00% 100.00% 100.00% 100.00% 100.00% 100.00% 100.00% 100.00%
4 Period of applying credit/waiver/adjustment to the customer’s account from the date of
resolutions of complaints
<=1 week Reported 100.00% 100.00% 100.00% 100.00% 100.00% 100.00% 100.00% 100.00% 100.00% 100.00%
Verified 100.00% 100.00% 100.00% 100.00% 100.00% 100.00% 100.00% 100.00% 100.00% 100.00%
5 Response time to customers for assistance
a) Accessibility of call centre/Customer Care >=95% Reported 89.88% 100.00% 99.00% 98.84% 99.30% 99.13% 100.00% 97.78% 99.41% 95.27%
Verified 89.88% 100.00% 99.00% 98.84% 99.30% 99.13% 100.00% 97.78% 99.41% 95.27%
b) % call answered by operators (voice to voice) within 90 sec.
>=95% Reported 89.66% 80.59% 92.30% 99.24% 51.90% 96.22% 97.96% 70.72% 97.31% 95.90%
Verified 89.66% 80.59% 92.30% 99.24% 51.90% 96.22% 97.96% 70.72% 97.31% 95.90%
6 Termination/closure of service
No. of requests for Termination / Closure of
service complied within 7 days during the quarter
<=7days
Reported 100.00% 100.00% 100.00% 100.00% 100.00% 100.00% 100.00% 100.00% 100.00% 100.00%
Verified 100.00% 100.00% 100.00% 100.00% 100.00% 100.00% 100.00% 100.00% 100.00% 100.00%
7 Time taken for refunds of deposits after
closures.
100% within
60 days
Reported 100.00% 100.00% 100.00% 100.00% 100.00% 100.00% 100.00% 100.00% 96.78% 100.00%
Verified 100.00% 100.00% 100.00% 100.00% 100.00% 100.00% 100.00% 100.00% 96.78% 100.00%
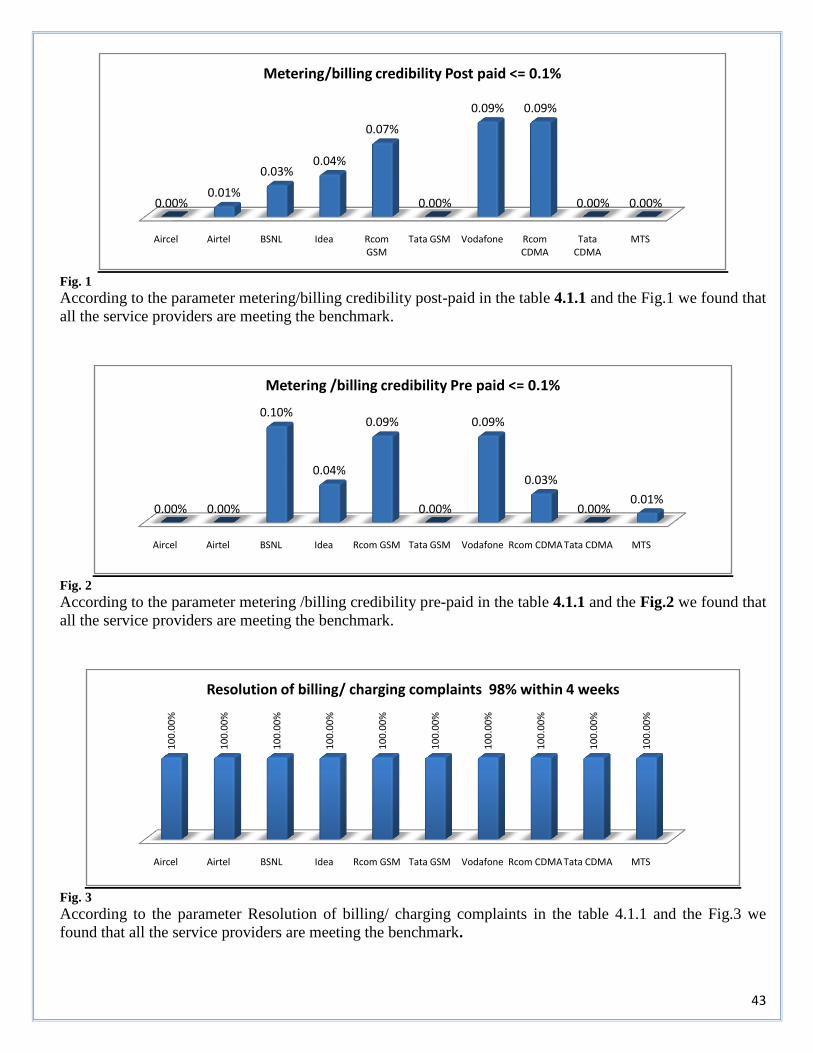
43
Fig. 1
According to the parameter metering/billing credibility post-paid in the table 4.1.1 and the Fig.1 we found that
all the service providers are meeting the benchmark.
Fig. 2
According to the parameter metering /billing credibility pre-paid in the table 4.1.1 and the Fig.2 we found that
all the service providers are meeting the benchmark.
Fig. 3
According to the parameter Resolution of billing/ charging complaints in the table 4.1.1 and the Fig.3 we
found that all the service providers are meeting the benchmark.
Aircel Airtel BSNL Idea Rcom GSM
Tata GSM Vodafone Rcom CDMA
Tata CDMA
MTS
0.00%0.01%
0.03%0.04%
0.07%
0.00%
0.09% 0.09%
0.00% 0.00%
Metering/billing credibility Post paid <= 0.1%
Aircel Airtel BSNL Idea Rcom GSM Tata GSM Vodafone Rcom CDMA Tata CDMA MTS
0.00% 0.00%
0.10%
0.04%
0.09%
0.00%
0.09%
0.03%
0.00%0.01%
Metering /billing credibility Pre paid <= 0.1%
Aircel Airtel BSNL Idea Rcom GSM Tata GSM Vodafone Rcom CDMA Tata CDMA MTS
10
0.0
0%
10
0.0
0%
10
0.0
0%
10
0.0
0%
10
0.0
0%
10
0.0
0%
10
0.0
0%
10
0.0
0%
10
0.0
0%
10
0.0
0%
Resolution of billing/ charging complaints 98% within 4 weeks
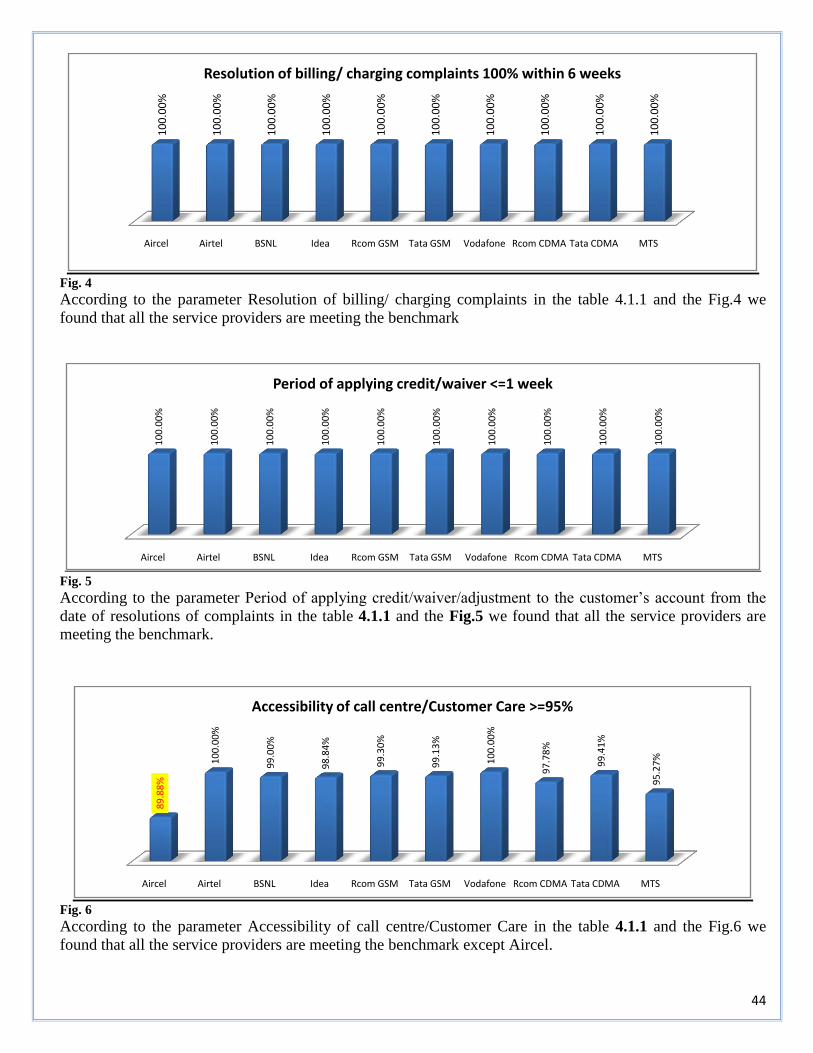
44
Fig. 4
According to the parameter Resolution of billing/ charging complaints in the table 4.1.1 and the Fig.4 we
found that all the service providers are meeting the benchmark
Fig. 5
According to the parameter Period of applying credit/waiver/adjustment to the customer’s account from the
date of resolutions of complaints in the table 4.1.1 and the Fig.5 we found that all the service providers are
meeting the benchmark.
Fig. 6
According to the parameter Accessibility of call centre/Customer Care in the table 4.1.1 and the Fig.6 we
found that all the service providers are meeting the benchmark except Aircel.
Aircel Airtel BSNL Idea Rcom GSM Tata GSM Vodafone Rcom CDMA Tata CDMA MTS
10
0.0
0%
10
0.0
0%
10
0.0
0%
10
0.0
0%
10
0.0
0%
10
0.0
0%
10
0.0
0%
10
0.0
0%
10
0.0
0%
10
0.0
0%
Resolution of billing/ charging complaints 100% within 6 weeks
Aircel Airtel BSNL Idea Rcom GSM Tata GSM Vodafone Rcom CDMA Tata CDMA MTS
10
0.0
0%
10
0.0
0%
10
0.0
0%
10
0.0
0%
10
0.0
0%
10
0.0
0%
10
0.0
0%
10
0.0
0%
10
0.0
0%
10
0.0
0%
Period of applying credit/waiver <=1 week
Aircel Airtel BSNL Idea Rcom GSM Tata GSM Vodafone Rcom CDMA Tata CDMA MTS
89
.88
%
10
0.0
0%
99
.00
%
98
.84
%
99
.30
%
99
.13
%
10
0.0
0%
97
.78
%
99
.41
%
95
.27
%
Accessibility of call centre/Customer Care >=95%
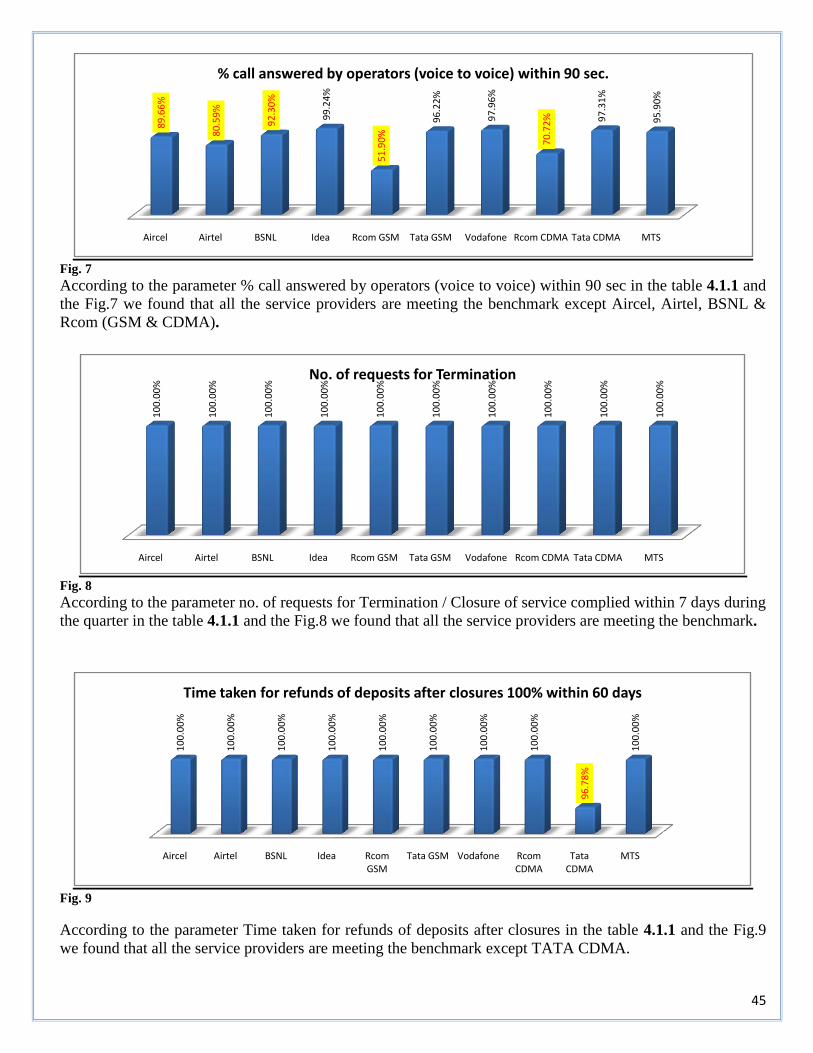
45
Fig. 7
According to the parameter % call answered by operators (voice to voice) within 90 sec in the table 4.1.1 and
the Fig.7 we found that all the service providers are meeting the benchmark except Aircel, Airtel, BSNL &
Rcom (GSM & CDMA).
Fig. 8 According to the parameter no. of requests for Termination / Closure of service complied within 7 days during
the quarter in the table 4.1.1 and the Fig.8 we found that all the service providers are meeting the benchmark.
Fig. 9
According to the parameter Time taken for refunds of deposits after closures in the table 4.1.1 and the Fig.9
we found that all the service providers are meeting the benchmark except TATA CDMA.
Aircel Airtel BSNL Idea Rcom GSM Tata GSM Vodafone Rcom CDMA Tata CDMA MTS
89
.66
%
80
.59
%
92
.30
%
99
.24
%
51
.90
%
96
.22
%
97
.96
%
70
.72
% 97
.31
%
95
.90
%
% call answered by operators (voice to voice) within 90 sec.
Aircel Airtel BSNL Idea Rcom GSM Tata GSM Vodafone Rcom CDMA Tata CDMA MTS
10
0.0
0%
10
0.0
0%
10
0.0
0%
10
0.0
0%
10
0.0
0%
10
0.0
0%
10
0.0
0%
10
0.0
0%
10
0.0
0%
10
0.0
0%
No. of requests for Termination
Aircel Airtel BSNL Idea Rcom GSM
Tata GSM Vodafone Rcom CDMA
Tata CDMA
MTS
10
0.0
0%
10
0.0
0%
10
0.0
0%
10
0.0
0%
10
0.0
0%
10
0.0
0%
10
0.0
0%
10
0.0
0%
96
.78
%
10
0.0
0%
Time taken for refunds of deposits after closures 100% within 60 days

46
4.2 Summarized PMR Data Results in Table & Graphical
4.2.1 Karnataka Circle (Jan. - March’15):
Karnataka Circle (Jan.- March’15)
Month PMR Generation Data Bench
mark
Audit
Period
Aircel Aircel
3G Airtel
Airtel
3G BSNL
BSNL
3G IDEA
Relianc
e TATA
TATA
3G
Vodafo
ne
Relianc
e MTS TATA
S/N Name of Parameter GSM Operators CDMA
Network Service Quality Parameter
1
Network Availability
BTS accumulated downtime ≤ 2% One
Qtr 0.28% 0.13% 0.13% 0.04% 0.98% 0.68% 0.08% 0.36% 0.05% 0.05% 0.07% 0.40% 0.15% 0.12%
Worst affected BTS due to downtime
≤ 2% One Qtr
2.24% 0.73% 0.35% 0.12% 1.89% 1.91% 0.23% 0.68% 0.29% 0.20% 0.53% 0.97% 0.00% 0.00%
2
Connection establishment ( Accessibility)
Call Setup Success Rate ≥ 95% One
Qtr 98.23% 98.55% 98.66% 99.28% 98.59% 98.08% 97.90% 99.56% 98.47% 98.11% 99.84% 98.26% 99.44% 99.03%
SDCCH/ Paging Channel
Congestion ≤ 1%
One
Qtr 0.21% 0.74% 0.53% 0.06% 0.11% 0.76% 0.49% 0.03% 0.11% 1.06% 0.09% 0.00% 0.00% 0.00%
TCH congestion ≤ 2% One
Qtr 0.55% 0.71% 0.39% 0.22% 0.44% 1.31% 0.27% 0.11% 0.27% 1.18% 0.16% 0.01% 0.05% 0.07%
3
Connection Maintainability ( Retain ability)
Call Drop Rate ≤ 2% One
Qtr 1.35% 0.92% 0.58% 0.19% 0.88% 0.83% 0.54% 0.32% 0.69% 0.57% 0.54% 0.07% 0.43% 0.29%
Worst affected cells having more
than 3% TCH drop (call drop) rate
≤ 3% One
Qtr 8.80% 11.46% 0.79% 1.59% 2.17% 2.26% 1.89% 0.02% 5.27% 3.68% 2.97% 0.05% 1.13% 2.65%
% of Connections with good voice quality
≥ 95% One Qtr
96.11% 99.78% 99.29% 99.68% 96.87% 97.53% 96.17% 98.77% 97.65% 99.10% 98.78% 99.77% 99.19% 98.27%
Point of Interconnections ( POI)
congestion ( on individual POI) ≤ 0.5%
One
Qtr 0.00% 0.00% 0.00% 0.00% 0.00% 0.00% 0.00% 0.00% 0.00% 0.00% 0.00% 0.00% 0.00% 0.00%
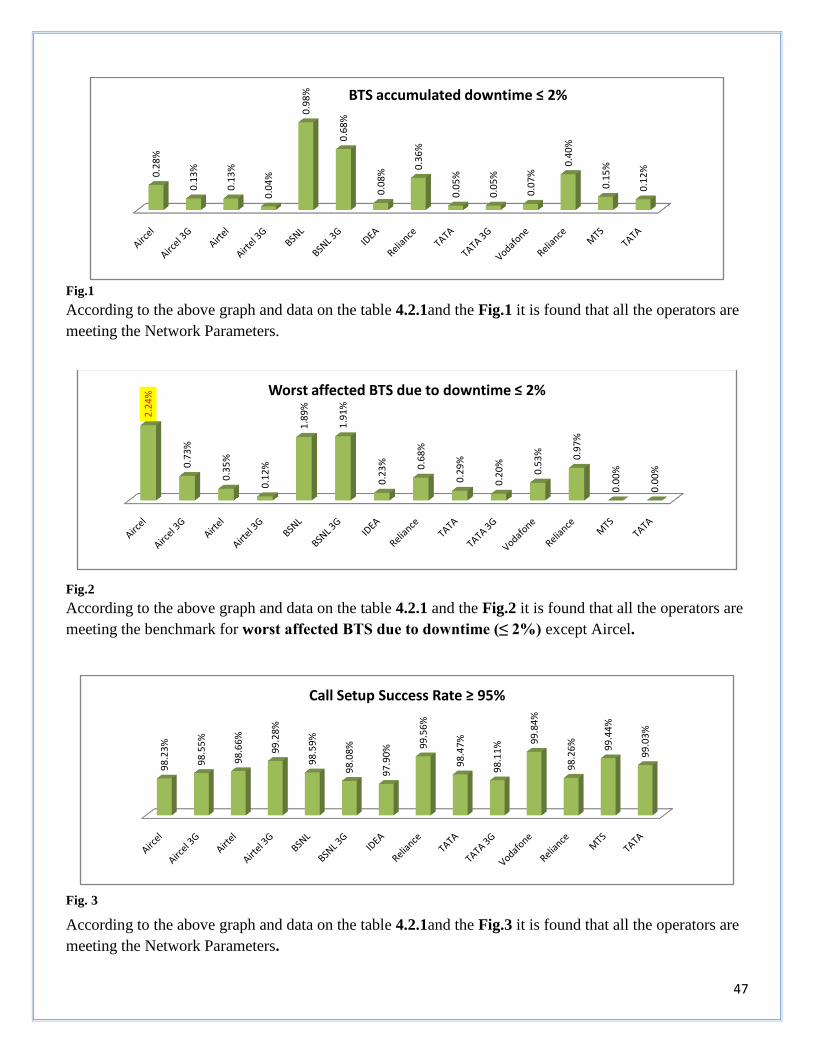
47
Fig.1
According to the above graph and data on the table 4.2.1and the Fig.1 it is found that all the operators are
meeting the Network Parameters.
Fig.2
According to the above graph and data on the table 4.2.1 and the Fig.2 it is found that all the operators are
meeting the benchmark for worst affected BTS due to downtime (≤ 2%) except Aircel.
Fig. 3
According to the above graph and data on the table 4.2.1and the Fig.3 it is found that all the operators are
meeting the Network Parameters.
0.2
8%
0.1
3%
0.1
3%
0.0
4%
0.9
8%
0.6
8%
0.0
8%
0.3
6%
0.0
5%
0.0
5%
0.0
7%
0.4
0%
0.1
5%
0.1
2%
BTS accumulated downtime ≤ 2%
2.2
4%
0.7
3%
0.3
5%
0.1
2%
1.8
9%
1.9
1%
0.2
3% 0.6
8%
0.2
9%
0.2
0%
0.5
3% 0.9
7%
0.0
0%
0.0
0%
Worst affected BTS due to downtime ≤ 2%
98
.23
%
98
.55
%
98
.66
%
99
.28
%
98
.59
%
98
.08
%
97
.90
% 99
.56
%
98
.47
%
98
.11
% 99
.84
%
98
.26
% 99
.44
%
99
.03
%
Call Setup Success Rate ≥ 95%
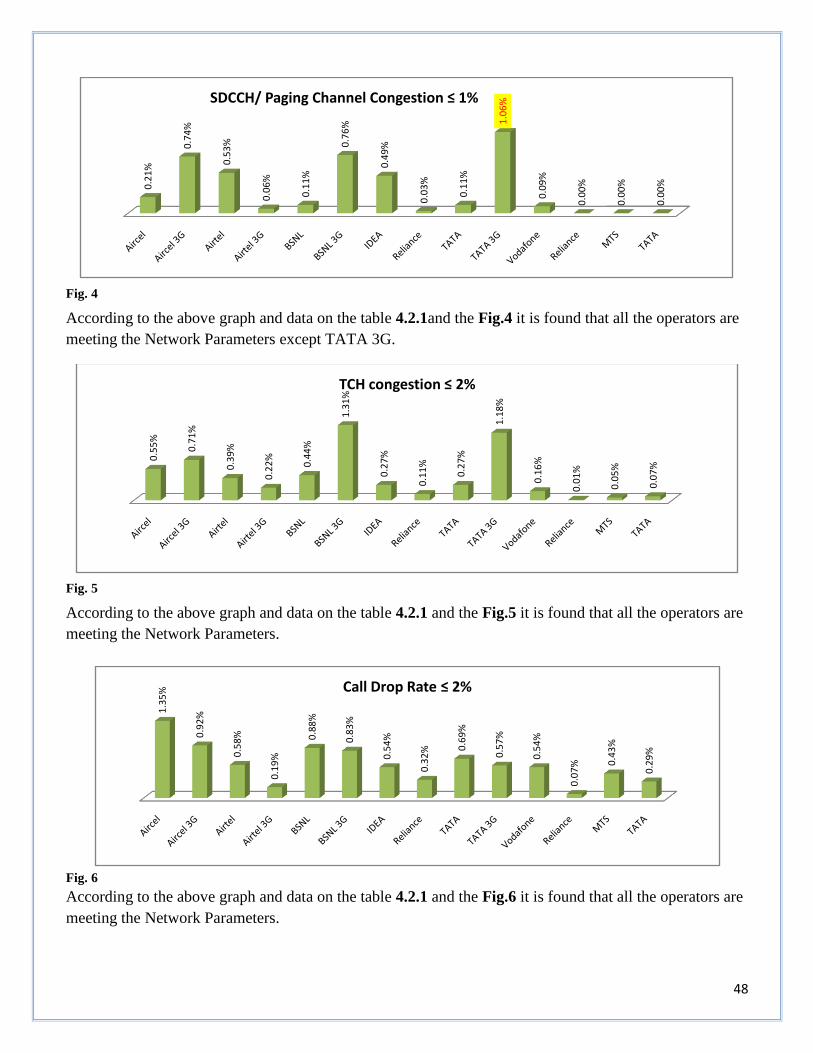
48
Fig. 4
According to the above graph and data on the table 4.2.1and the Fig.4 it is found that all the operators are
meeting the Network Parameters except TATA 3G.
Fig. 5
According to the above graph and data on the table 4.2.1 and the Fig.5 it is found that all the operators are
meeting the Network Parameters.
Fig. 6
According to the above graph and data on the table 4.2.1 and the Fig.6 it is found that all the operators are
meeting the Network Parameters.
0.2
1%
0.7
4%
0.5
3%
0.0
6%
0.1
1%
0.7
6%
0.4
9%
0.0
3%
0.1
1%
1.0
6%
0.0
9%
0.0
0%
0.0
0%
0.0
0%
SDCCH/ Paging Channel Congestion ≤ 1%
0.5
5%
0.7
1%
0.3
9%
0.2
2%
0.4
4%
1.3
1%
0.2
7%
0.1
1%
0.2
7%
1.1
8%
0.1
6%
0.0
1%
0.0
5%
0.0
7%
TCH congestion ≤ 2%
1.3
5%
0.9
2%
0.5
8%
0.1
9%
0.8
8%
0.8
3%
0.5
4%
0.3
2% 0
.69
%
0.5
7%
0.5
4%
0.0
7% 0
.43
%
0.2
9%
Call Drop Rate ≤ 2%

49
Fig.7
According to the above graph and data on the table 4.2.1and the Fig.7 it is found that all the operators are
meeting the Network Parameters except Aircel 2G & 3G and TATA GSM & 3G.
Fig. 8
According to the above graph and data on the table 4.2.1and the Fig.8 it is found that all the operators are
meeting the Network Parameters.
Fig. 9
According to the above graph and data on the table 4.2.1and the Fig.9 it is found that all the operators are
meeting the benchmark of network parameter.
8.8
0% 11
.46
%
0.7
9%
1.5
9%
2.1
7%
2.2
6%
1.8
9%
0.0
2%
5.2
7%
3.6
8%
2.9
7%
0.0
5%
1.1
3%
2.6
5%
Worst affected cells having more than 3% TCH drop (call drop) rate%
96
.11
% 99
.78
%
99
.29
%
99
.68
%
96
.87
%
97
.53
%
96
.17
% 98
.77
%
97
.65
%
99
.10
%
98
.78
%
99
.77
%
99
.19
%
98
.27
%
% of Connections with good voice quality ≥ 95%
0.0
0%
0.0
0%
0.0
0%
0.0
0%
0.0
0%
0.0
0%
0.0
0%
0.0
0%
0.0
0%
0.0
0%
0.0
0%
0.0
0%
0.0
0%
0.0
0%
Point of Interconnections ( POI) congestion ( on individual POI) ≤ 0.5%
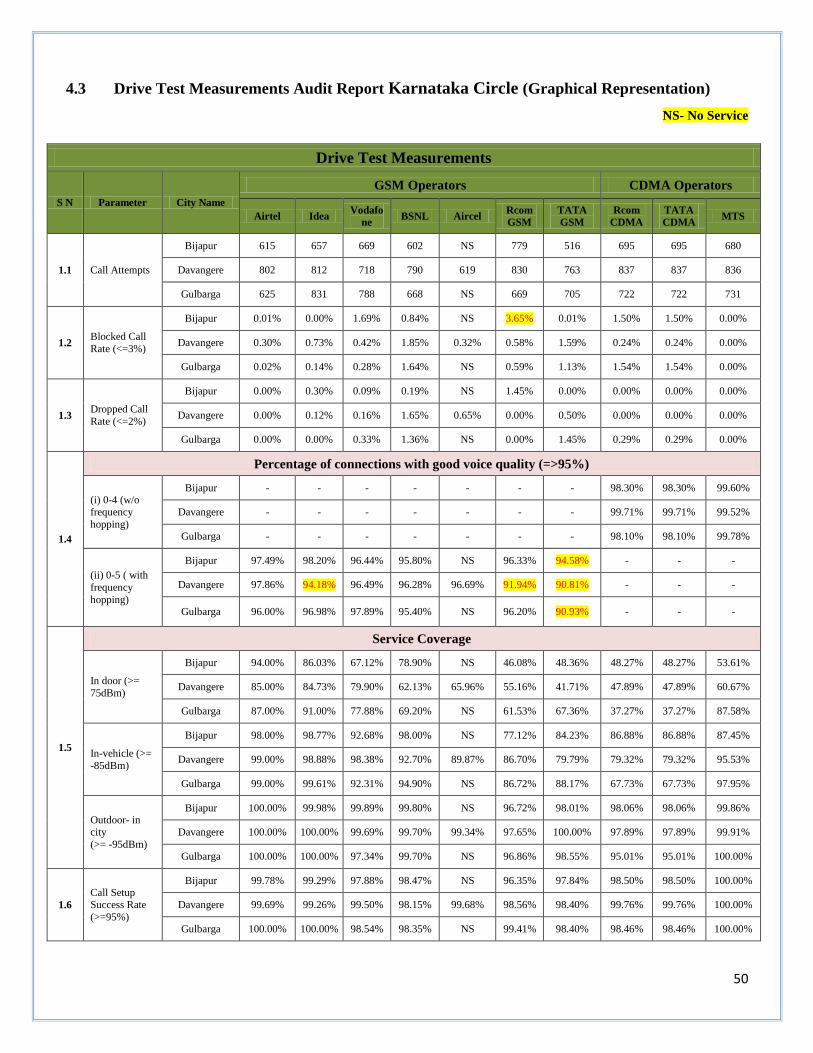
50
4.3 Drive Test Measurements Audit Report Karnataka Circle (Graphical Representation)
NS- No Service
Drive Test Measurements
S N Parameter City Name
GSM Operators CDMA Operators
Airtel Idea Vodafo
ne BSNL Aircel
Rcom
GSM
TATA
GSM
Rcom
CDMA
TATA
CDMA MTS
1.1 Call Attempts
Bijapur 615 657 669 602 NS 779 516 695 695 680
Davangere 802 812 718 790 619 830 763 837 837 836
Gulbarga 625 831 788 668 NS 669 705 722 722 731
1.2 Blocked Call
Rate (<=3%)
Bijapur 0.01% 0.00% 1.69% 0.84% NS 3.65% 0.01% 1.50% 1.50% 0.00%
Davangere 0.30% 0.73% 0.42% 1.85% 0.32% 0.58% 1.59% 0.24% 0.24% 0.00%
Gulbarga 0.02% 0.14% 0.28% 1.64% NS 0.59% 1.13% 1.54% 1.54% 0.00%
1.3 Dropped Call
Rate (<=2%)
Bijapur 0.00% 0.30% 0.09% 0.19% NS 1.45% 0.00% 0.00% 0.00% 0.00%
Davangere 0.00% 0.12% 0.16% 1.65% 0.65% 0.00% 0.50% 0.00% 0.00% 0.00%
Gulbarga 0.00% 0.00% 0.33% 1.36% NS 0.00% 1.45% 0.29% 0.29% 0.00%
1.4
Percentage of connections with good voice quality (=>95%)
(i) 0-4 (w/o frequency
hopping)
Bijapur - - - - - - - 98.30% 98.30% 99.60%
Davangere - - - - - - - 99.71% 99.71% 99.52%
Gulbarga - - - - - - - 98.10% 98.10% 99.78%
(ii) 0-5 ( with
frequency
hopping)
Bijapur 97.49% 98.20% 96.44% 95.80% NS 96.33% 94.58% - - -
Davangere 97.86% 94.18% 96.49% 96.28% 96.69% 91.94% 90.81% - - -
Gulbarga 96.00% 96.98% 97.89% 95.40% NS 96.20% 90.93% - - -
1.5
Service Coverage
In door (>=
75dBm)
Bijapur 94.00% 86.03% 67.12% 78.90% NS 46.08% 48.36% 48.27% 48.27% 53.61%
Davangere 85.00% 84.73% 79.90% 62.13% 65.96% 55.16% 41.71% 47.89% 47.89% 60.67%
Gulbarga 87.00% 91.00% 77.88% 69.20% NS 61.53% 67.36% 37.27% 37.27% 87.58%
In-vehicle (>=
-85dBm)
Bijapur 98.00% 98.77% 92.68% 98.00% NS 77.12% 84.23% 86.88% 86.88% 87.45%
Davangere 99.00% 98.88% 98.38% 92.70% 89.87% 86.70% 79.79% 79.32% 79.32% 95.53%
Gulbarga 99.00% 99.61% 92.31% 94.90% NS 86.72% 88.17% 67.73% 67.73% 97.95%
Outdoor- in city
(>= -95dBm)
Bijapur 100.00% 99.98% 99.89% 99.80% NS 96.72% 98.01% 98.06% 98.06% 99.86%
Davangere 100.00% 100.00% 99.69% 99.70% 99.34% 97.65% 100.00% 97.89% 97.89% 99.91%
Gulbarga 100.00% 100.00% 97.34% 99.70% NS 96.86% 98.55% 95.01% 95.01% 100.00%
1.6
Call Setup Success Rate
(>=95%)
Bijapur 99.78% 99.29% 97.88% 98.47% NS 96.35% 97.84% 98.50% 98.50% 100.00%
Davangere 99.69% 99.26% 99.50% 98.15% 99.68% 98.56% 98.40% 99.76% 99.76% 100.00%
Gulbarga 100.00% 100.00% 98.54% 98.35% NS 99.41% 98.40% 98.46% 98.46% 100.00%

51
4.3.1 Call Attempts: -
Fig.4.3.1
According to the table and the fig. 4.3.1 it shows the no. of calls attempted in different city.
4.3.2 Blocked Call Rate (<=3%):-
Fig.4.3.2
According to the table and the fig. 4.3.2 it shows that Rcom GSM in Bijapur is meeting the benchmark of
Blocked Call Rate.
0100200300400500600700800900
Call Attempts
Bijapur
Davangere
Gulbarga
0.00%
0.50%
1.00%
1.50%
2.00%
2.50%
3.00%
3.50%
4.00%
Blocked Call Rate (<=3%)
Bijapur
Davangere
Gulbarga
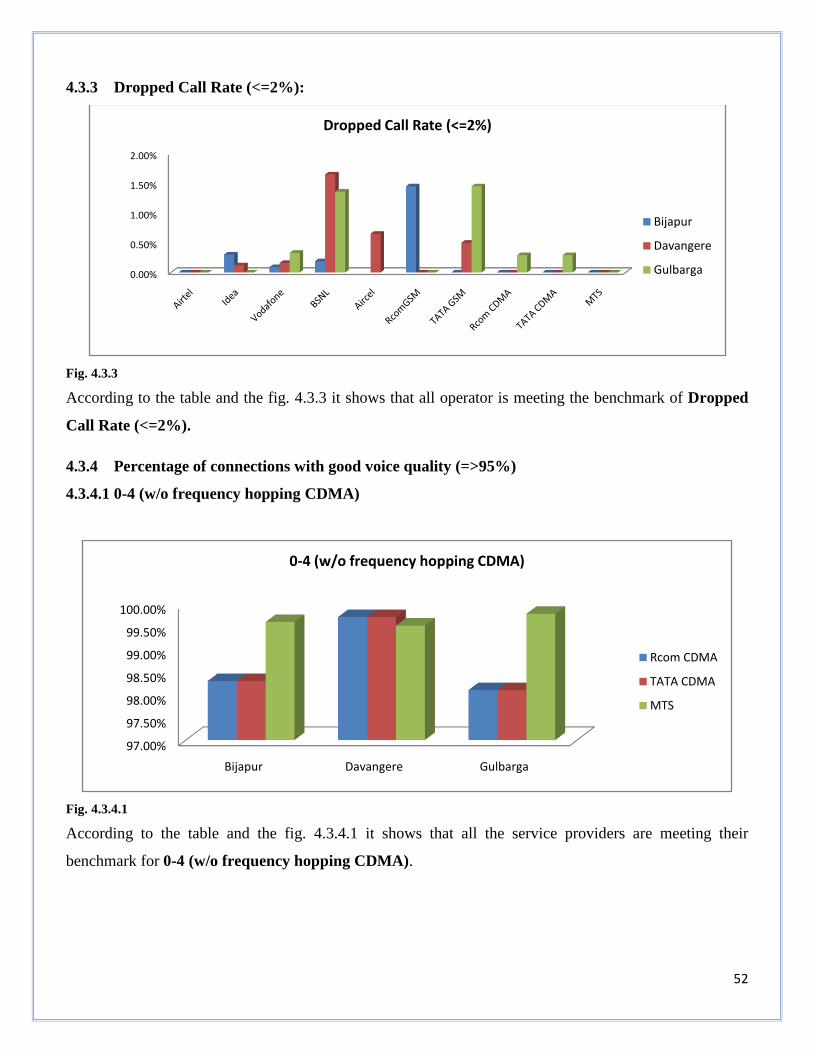
52
4.3.3 Dropped Call Rate (<=2%):
Fig. 4.3.3
According to the table and the fig. 4.3.3 it shows that all operator is meeting the benchmark of Dropped
Call Rate (<=2%).
4.3.4 Percentage of connections with good voice quality (=>95%)
4.3.4.1 0-4 (w/o frequency hopping CDMA)
Fig. 4.3.4.1
According to the table and the fig. 4.3.4.1 it shows that all the service providers are meeting their
benchmark for 0-4 (w/o frequency hopping CDMA).
0.00%
0.50%
1.00%
1.50%
2.00%
Dropped Call Rate (<=2%)
Bijapur
Davangere
Gulbarga
97.00%
97.50%
98.00%
98.50%
99.00%
99.50%
100.00%
Bijapur Davangere Gulbarga
0-4 (w/o frequency hopping CDMA)
Rcom CDMA
TATA CDMA
MTS

53
4.3.4.2 0-5 (with frequency hopping GSM)
Fig. 4.3.4.2
According to the table and the fig. 4.3.4.2, it shows Idea, Rcom GSM & TATA GSM in Davangeree and
Tata GSM in Bijapur & Gulbarga are not meeting the benchmark of Voice Quality (0-5 (with frequency
hopping GSM).
4.3.5 Service Coverage
4.3.5.1 In door (>= -75dBm)
Fig.4.3.5.1
According to the table and the fig. 4.3.5.1, it shows that all service providers are meeting the benchmark
for indoor (>= -75dBm).
86.00%
88.00%
90.00%
92.00%
94.00%
96.00%
98.00%
100.00%
Airtel Idea Vodafone BSNL Aircel RcomGSM TATA GSM
0-5 ( with frequency hopping) (=>95%)
Bijapur
Davangere
Gulbarga
0.00%10.00%20.00%30.00%40.00%50.00%60.00%70.00%80.00%90.00%
100.00%
In door (>= -75dBm)
Bijapur
Davangere
Gulbarga
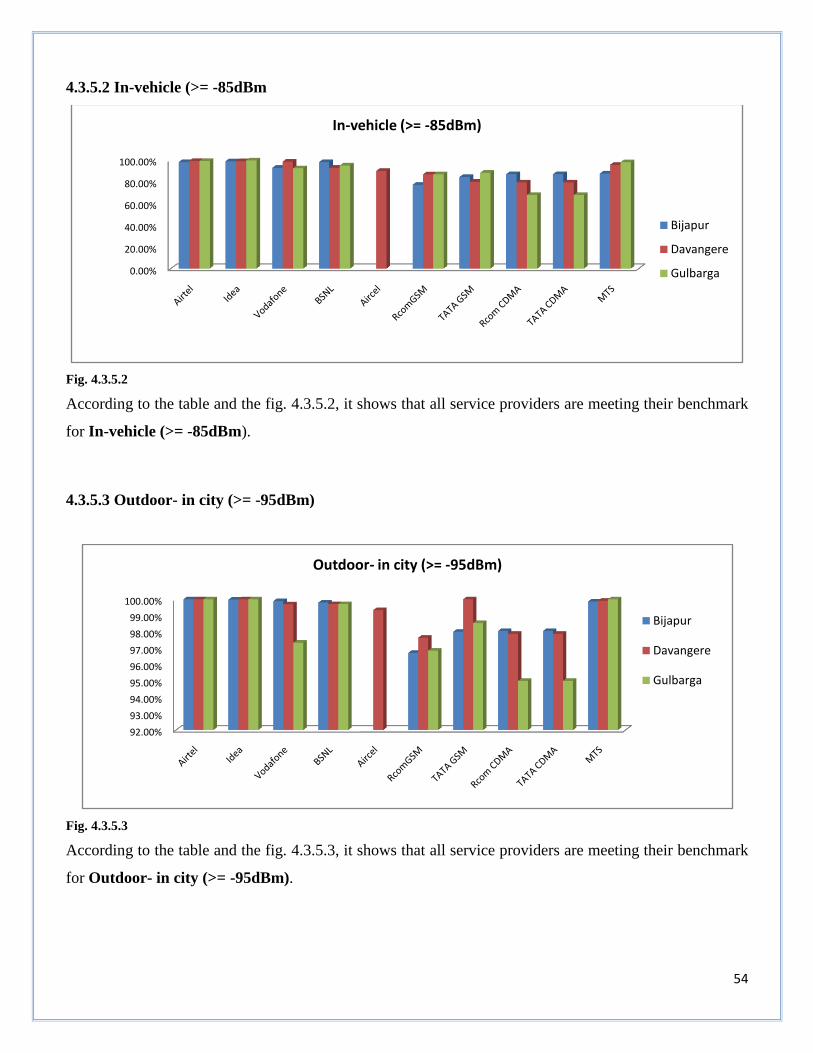
54
4.3.5.2 In-vehicle (>= -85dBm
Fig. 4.3.5.2
According to the table and the fig. 4.3.5.2, it shows that all service providers are meeting their benchmark
for In-vehicle (>= -85dBm).
4.3.5.3 Outdoor- in city (>= -95dBm)
Fig. 4.3.5.3
According to the table and the fig. 4.3.5.3, it shows that all service providers are meeting their benchmark
for Outdoor- in city (>= -95dBm).
0.00%
20.00%
40.00%
60.00%
80.00%
100.00%
In-vehicle (>= -85dBm)
Bijapur
Davangere
Gulbarga
92.00%
93.00%
94.00%
95.00%
96.00%
97.00%
98.00%
99.00%
100.00%
Outdoor- in city (>= -95dBm)
Bijapur
Davangere
Gulbarga
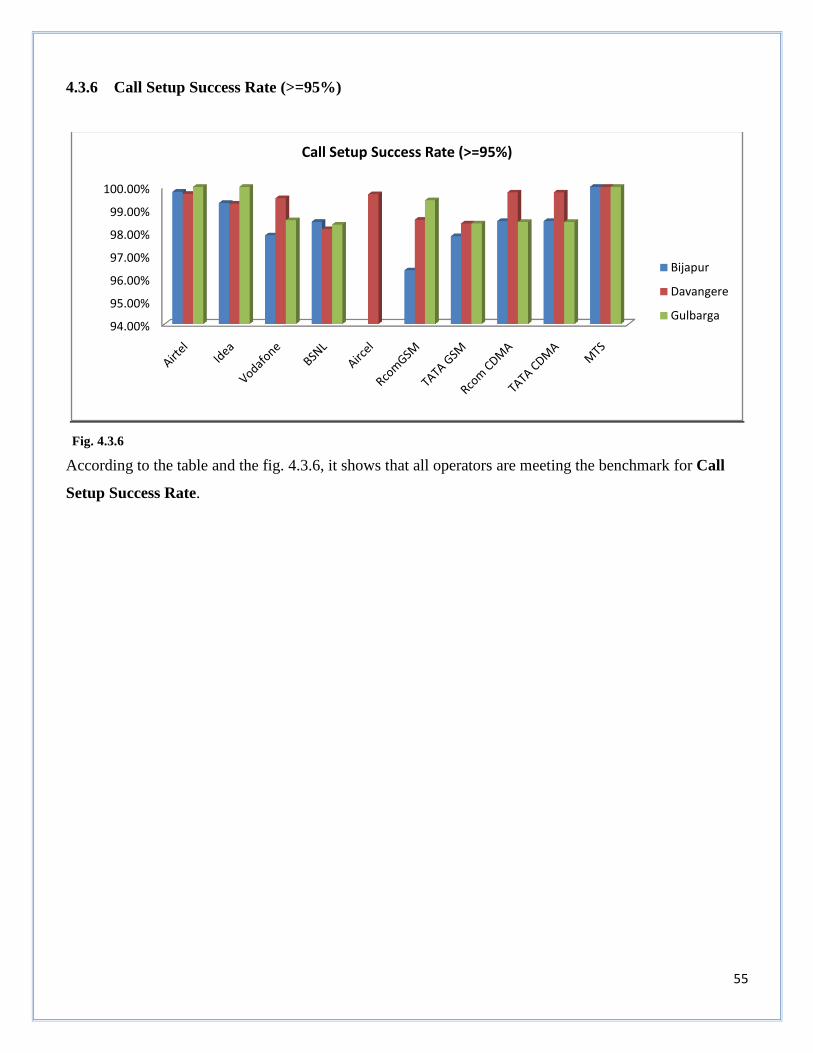
55
4.3.6 Call Setup Success Rate (>=95%)
Fig. 4.3.6
According to the table and the fig. 4.3.6, it shows that all operators are meeting the benchmark for Call
Setup Success Rate.
94.00%
95.00%
96.00%
97.00%
98.00%
99.00%
100.00%
Call Setup Success Rate (>=95%)
Bijapur
Davangere
Gulbarga
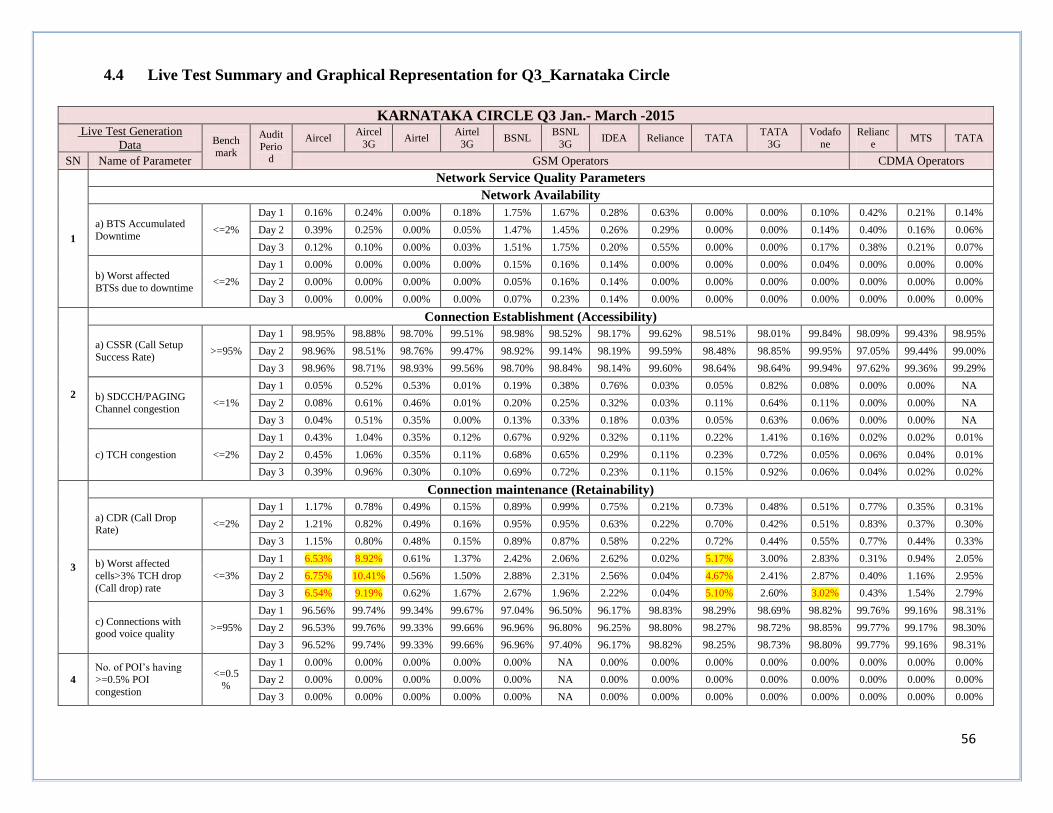
56
4.4 Live Test Summary and Graphical Representation for Q3_Karnataka Circle
KARNATAKA CIRCLE Q3 Jan.- March -2015 Live Test Generation
Data Bench
mark
Audit
Period
Aircel Aircel
3G Airtel
Airtel
3G BSNL
BSNL
3G IDEA Reliance TATA
TATA
3G
Vodafo
ne
Relianc
e MTS TATA
SN Name of Parameter GSM Operators CDMA Operators
1
Network Service Quality Parameters
Network Availability
a) BTS Accumulated
Downtime <=2%
Day 1 0.16% 0.24% 0.00% 0.18% 1.75% 1.67% 0.28% 0.63% 0.00% 0.00% 0.10% 0.42% 0.21% 0.14%
Day 2 0.39% 0.25% 0.00% 0.05% 1.47% 1.45% 0.26% 0.29% 0.00% 0.00% 0.14% 0.40% 0.16% 0.06%
Day 3 0.12% 0.10% 0.00% 0.03% 1.51% 1.75% 0.20% 0.55% 0.00% 0.00% 0.17% 0.38% 0.21% 0.07%
b) Worst affected
BTSs due to downtime <=2%
Day 1 0.00% 0.00% 0.00% 0.00% 0.15% 0.16% 0.14% 0.00% 0.00% 0.00% 0.04% 0.00% 0.00% 0.00%
Day 2 0.00% 0.00% 0.00% 0.00% 0.05% 0.16% 0.14% 0.00% 0.00% 0.00% 0.00% 0.00% 0.00% 0.00%
Day 3 0.00% 0.00% 0.00% 0.00% 0.07% 0.23% 0.14% 0.00% 0.00% 0.00% 0.00% 0.00% 0.00% 0.00%
2
Connection Establishment (Accessibility)
a) CSSR (Call Setup
Success Rate) >=95%
Day 1 98.95% 98.88% 98.70% 99.51% 98.98% 98.52% 98.17% 99.62% 98.51% 98.01% 99.84% 98.09% 99.43% 98.95%
Day 2 98.96% 98.51% 98.76% 99.47% 98.92% 99.14% 98.19% 99.59% 98.48% 98.85% 99.95% 97.05% 99.44% 99.00%
Day 3 98.96% 98.71% 98.93% 99.56% 98.70% 98.84% 98.14% 99.60% 98.64% 98.64% 99.94% 97.62% 99.36% 99.29%
b) SDCCH/PAGING
Channel congestion <=1%
Day 1 0.05% 0.52% 0.53% 0.01% 0.19% 0.38% 0.76% 0.03% 0.05% 0.82% 0.08% 0.00% 0.00% NA
Day 2 0.08% 0.61% 0.46% 0.01% 0.20% 0.25% 0.32% 0.03% 0.11% 0.64% 0.11% 0.00% 0.00% NA
Day 3 0.04% 0.51% 0.35% 0.00% 0.13% 0.33% 0.18% 0.03% 0.05% 0.63% 0.06% 0.00% 0.00% NA
c) TCH congestion <=2%
Day 1 0.43% 1.04% 0.35% 0.12% 0.67% 0.92% 0.32% 0.11% 0.22% 1.41% 0.16% 0.02% 0.02% 0.01%
Day 2 0.45% 1.06% 0.35% 0.11% 0.68% 0.65% 0.29% 0.11% 0.23% 0.72% 0.05% 0.06% 0.04% 0.01%
Day 3 0.39% 0.96% 0.30% 0.10% 0.69% 0.72% 0.23% 0.11% 0.15% 0.92% 0.06% 0.04% 0.02% 0.02%
3
Connection maintenance (Retainability)
a) CDR (Call Drop Rate)
<=2%
Day 1 1.17% 0.78% 0.49% 0.15% 0.89% 0.99% 0.75% 0.21% 0.73% 0.48% 0.51% 0.77% 0.35% 0.31%
Day 2 1.21% 0.82% 0.49% 0.16% 0.95% 0.95% 0.63% 0.22% 0.70% 0.42% 0.51% 0.83% 0.37% 0.30%
Day 3 1.15% 0.80% 0.48% 0.15% 0.89% 0.87% 0.58% 0.22% 0.72% 0.44% 0.55% 0.77% 0.44% 0.33%
b) Worst affected
cells>3% TCH drop
(Call drop) rate
<=3%
Day 1 6.53% 8.92% 0.61% 1.37% 2.42% 2.06% 2.62% 0.02% 5.17% 3.00% 2.83% 0.31% 0.94% 2.05%
Day 2 6.75% 10.41% 0.56% 1.50% 2.88% 2.31% 2.56% 0.04% 4.67% 2.41% 2.87% 0.40% 1.16% 2.95%
Day 3 6.54% 9.19% 0.62% 1.67% 2.67% 1.96% 2.22% 0.04% 5.10% 2.60% 3.02% 0.43% 1.54% 2.79%
c) Connections with good voice quality
>=95%
Day 1 96.56% 99.74% 99.34% 99.67% 97.04% 96.50% 96.17% 98.83% 98.29% 98.69% 98.82% 99.76% 99.16% 98.31%
Day 2 96.53% 99.76% 99.33% 99.66% 96.96% 96.80% 96.25% 98.80% 98.27% 98.72% 98.85% 99.77% 99.17% 98.30%
Day 3 96.52% 99.74% 99.33% 99.66% 96.96% 97.40% 96.17% 98.82% 98.25% 98.73% 98.80% 99.77% 99.16% 98.31%
4
No. of POI’s having
>=0.5% POI
congestion
<=0.5
%
Day 1 0.00% 0.00% 0.00% 0.00% 0.00% NA 0.00% 0.00% 0.00% 0.00% 0.00% 0.00% 0.00% 0.00%
Day 2 0.00% 0.00% 0.00% 0.00% 0.00% NA 0.00% 0.00% 0.00% 0.00% 0.00% 0.00% 0.00% 0.00%
Day 3 0.00% 0.00% 0.00% 0.00% 0.00% NA 0.00% 0.00% 0.00% 0.00% 0.00% 0.00% 0.00% 0.00%
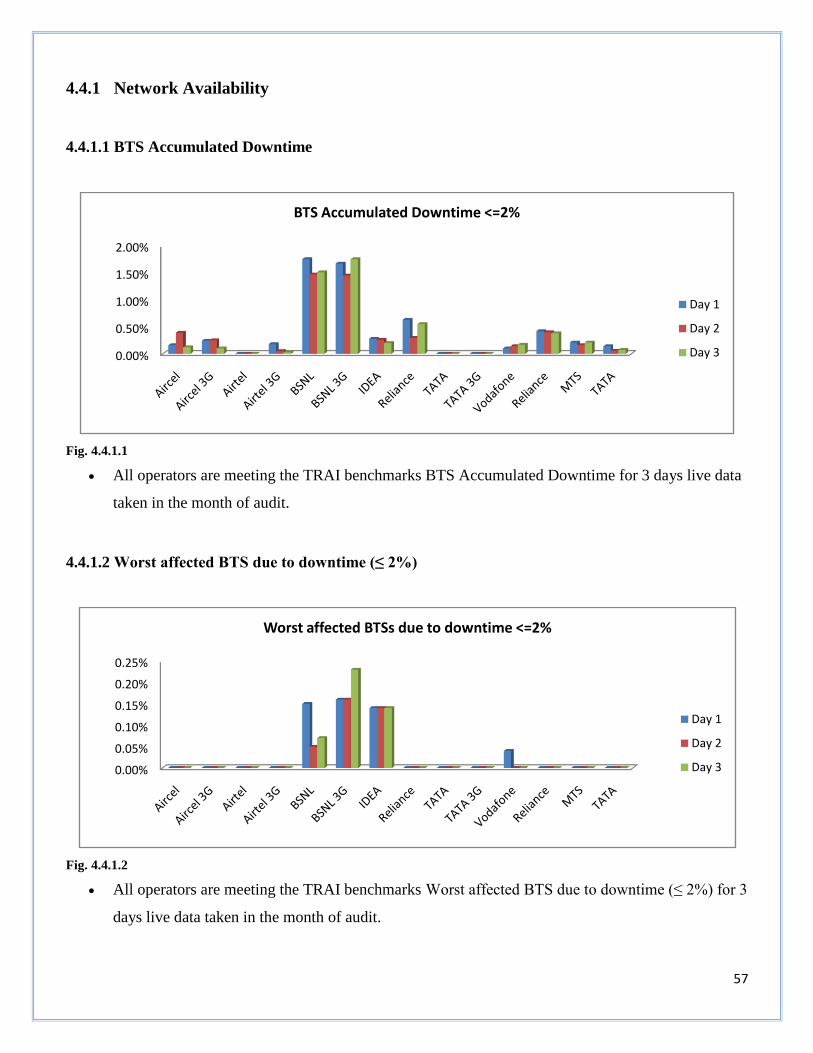
57
4.4.1 Network Availability
4.4.1.1 BTS Accumulated Downtime
Fig. 4.4.1.1
All operators are meeting the TRAI benchmarks BTS Accumulated Downtime for 3 days live data
taken in the month of audit.
4.4.1.2 Worst affected BTS due to downtime (≤ 2%)
Fig. 4.4.1.2
All operators are meeting the TRAI benchmarks Worst affected BTS due to downtime (≤ 2%) for 3
days live data taken in the month of audit.
0.00%
0.50%
1.00%
1.50%
2.00%
BTS Accumulated Downtime <=2%
Day 1
Day 2
Day 3
0.00%
0.05%
0.10%
0.15%
0.20%
0.25%
Worst affected BTSs due to downtime <=2%
Day 1
Day 2
Day 3
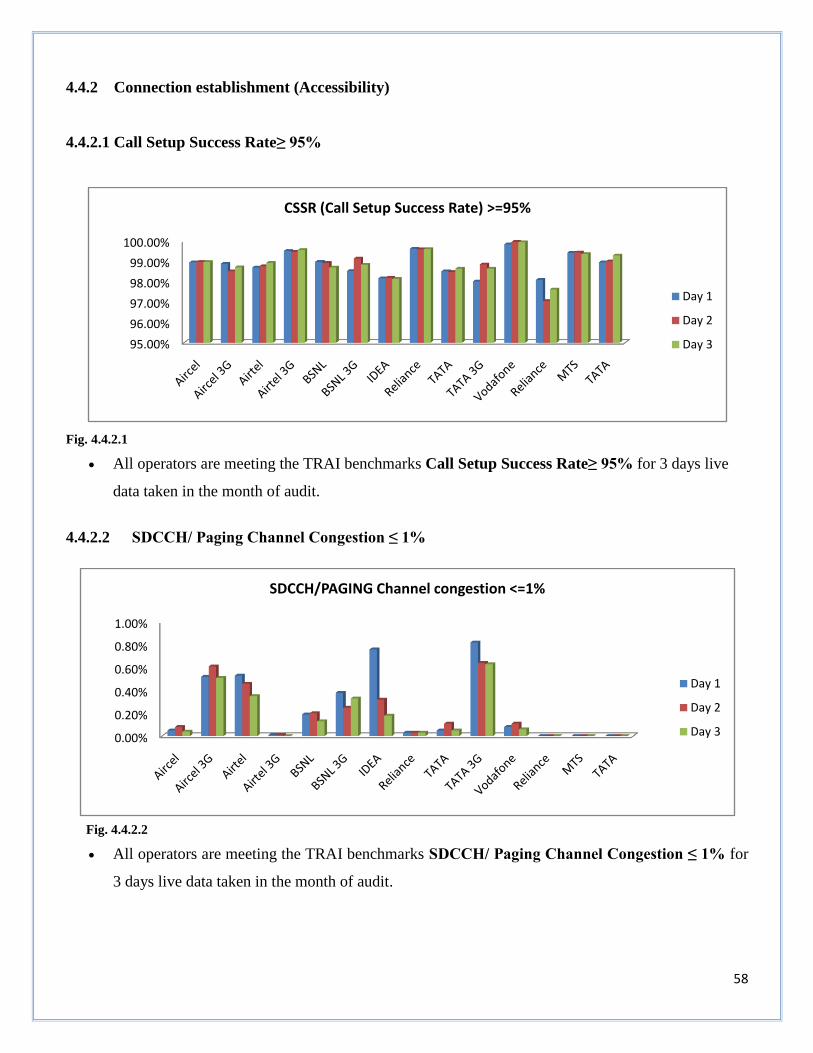
58
4.4.2 Connection establishment (Accessibility)
4.4.2.1 Call Setup Success Rate≥ 95%
Fig. 4.4.2.1
All operators are meeting the TRAI benchmarks Call Setup Success Rate≥ 95% for 3 days live
data taken in the month of audit.
4.4.2.2 SDCCH/ Paging Channel Congestion ≤ 1%
Fig. 4.4.2.2
All operators are meeting the TRAI benchmarks SDCCH/ Paging Channel Congestion ≤ 1% for
3 days live data taken in the month of audit.
95.00%
96.00%
97.00%
98.00%
99.00%
100.00%
CSSR (Call Setup Success Rate) >=95%
Day 1
Day 2
Day 3
0.00%
0.20%
0.40%
0.60%
0.80%
1.00%
SDCCH/PAGING Channel congestion <=1%
Day 1
Day 2
Day 3
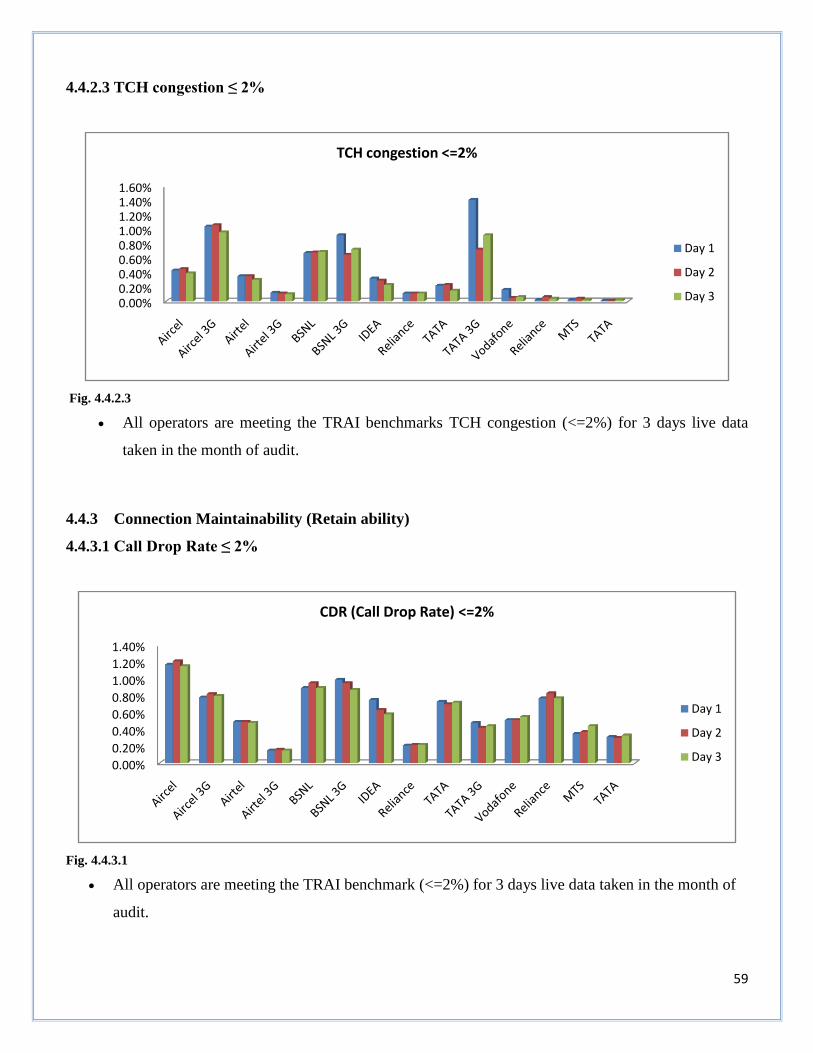
59
4.4.2.3 TCH congestion ≤ 2%
Fig. 4.4.2.3
All operators are meeting the TRAI benchmarks TCH congestion (<=2%) for 3 days live data
taken in the month of audit.
4.4.3 Connection Maintainability (Retain ability)
4.4.3.1 Call Drop Rate ≤ 2%
Fig. 4.4.3.1
All operators are meeting the TRAI benchmark (<=2%) for 3 days live data taken in the month of
audit.
0.00%0.20%0.40%0.60%0.80%1.00%1.20%1.40%1.60%
TCH congestion <=2%
Day 1
Day 2
Day 3
0.00%
0.20%
0.40%
0.60%
0.80%
1.00%
1.20%
1.40%
CDR (Call Drop Rate) <=2%
Day 1
Day 2
Day 3

60
4.4.3.2 Worst affected cells having more than 3% TCH drop (call drop) rate
Fig. 4.4.3.2
Aircel (2G& 3G) & TATA (GSM) for all 3days and Vodafone for day 3 are not meeting the
benchmark for worst affected cells having more than 3% TCH drop (call drop) rate.
4.4.3.3 % of Connections with good voice quality ≥ 95%
Fig. 4.4.3.3
All operators are meeting the TRAI benchmarks (=> 95%) for 3 days live data taken in the month of
audit.
0.00%
2.00%
4.00%
6.00%
8.00%
10.00%
12.00%
Worst affected cells>3% TCH drop (Call drop) rate <=3%
Day 1
Day 2
Day 3
94.00%
95.00%
96.00%
97.00%
98.00%
99.00%
100.00%
Connections with good voice quality >=95%
Day 1
Day 2
Day 3

61
4.4.3.4 Point of Interconnections (POI) congestion (on individual POI) ≤ 0.5%
Fig. 4.4.3.4
All operators are meeting the TRAI benchmarks (≤ 0.5%) for 3 days live data taken in the month of
audit.
0.00%10.00%20.00%30.00%40.00%50.00%60.00%70.00%80.00%90.00%
100.00%
No. of POI’s having >=0.5% POI congestion <=0.5%
Day 1
Day 2
Day 3

62
CHAPTER-5: FINDINGS AND ANALYSIS
Verification of the Performance of Service Providers against the Quality of Service benchmarks laid down
by TRAI using the data for the entire month during which the live measurement is carried out.
As per PMR Data Verification Results for-
Karnataka Circle (Jan.’15): Aircel (2G & 3G) and TATA (2G & 3G) for Worst affected cells
having more than 3% TCH drop (call drop) rate are not meeting the Network Parameters.
Karnataka Circle (Feb.’15): All the operators are meeting the Network Parameters except
Aircel (2G & 3G) and TATA (2G & 3G)for Worst affected cells having more than 3% TCH
drop (call drop) rate.
Karnataka Circle (March’15): All the operators are meeting the Network Parameters except
Aircel (2G & 3G) and TATA (2G & 3G)for Worst affected cells having more than 3% TCH
drop (call drop) rate and Aircel 3G for SDCCH/ Paging Channel Congestion.
Summarized PMR Data (Jan. - March’15): All the operators are meeting the Network
Parameters except Aircel (2G & 3G) and TATA (2G & 3G)for Worst affected cells having more
than 3% TCH drop (call drop) rate.
As per 3 Days Live Test Audit Report (3rd Quarter), Karnataka Circle:
Verification of the Performance of Service Providers against the Quality of Service benchmarks laid
down by TRAI using Live measurements for 3 days during the month in which the Audit and
Assessment is carried out.
TATA (2G & 3G) & Aircel (2G & 3G) for all 3 days are not meeting the benchmark for worst
affected cells having more than 3% TCH drop (call drop) rate.
As per Operator Assisted Drive Test:
The Operator Assisted Drive Test was conducted for all the Operators. Route covered was about 100
Km depending on city areas within the speed limit of 30-40 km/hour. In all the cities Zones were
selected for covering different density areas (High/Medium/Low).
63
Karnataka Circle:
In Bijapur RCOM GSM for Blocked Call Rate (<=3%), TATA GSM for 0-5(with frequency
hopping) failed to achieve the respective benchmarks.
In Davangeree IDEA, RCOM GSM & TATA GSM for 0-5(with frequency hopping) failed to
achieve the respective benchmarks.
In Gulbarga TATA GSM for 0-5(with frequency hopping) failed to achieve the respective
benchmarks
Level 1 Live Calling (Emergency No.) Q3
Level 1 calling such as calling at emergency no. like Police, Fire, Ambulance and others were
made so as to check the service of such short codes. In different cities of Karnataka it was
found to be functional.
Performance (live calling for billing complaints):
We have made live calling to customers as per their complaints details and we verified their
complaint and we found that most of the complaints are resolved within the time line and all
the operators are meeting the TRAI benchmarks.
Live calling to call centre:-
In live calling to call centers we found that all the operators are meeting their benchmark
except Aircel, Rcom (GSM & CDMA) and TATA CDMA for both Calls got connected to
agent within 90 Sec and %age of calls got answered are not meeting the benchmark.
Inter Operator Call Assessment
In the inter-operator call assessment test, calls were made from one operator to other operator
so as to check congestion on both the operators’ network. In such cases, the radio part, switch
part and the POI in between the operators are involved and hence if any congestion is found in
the network, it may be due to any of these parts. The result shows that there is not much
congestion on the operator network; however the congestion was shown with all the operators
BSNL, Vodafone, Airtel, Rcom, Tata, Idea, Aircel and MTS service provider.
64
CUSTOMER SERVICE QUALITY PARAMETERS
3rd Quarter data Assessment (Karnataka Circle)
According to the parameter no. of requests for Accessibility of call centre/Customer Care during
the quarter we found that all the service providers are meeting the benchmark except Aircel.
According to the parameter % call answered by operators (voice to voice) within 90 sec we
found that all the service providers are meeting the benchmark except Aircel, Airtel, BSNL,
Rcom (CDMA & GSM).
According to the parameter Time taken for refunds of deposits after closures we found that all
the service providers are meeting the benchmark except TATA CDMA.