The molecular ecology of Antarctic terrestrial and limnetic invertebrates and microbes
Upload
khangminh22Category
view
0download
0
Report for the Institute {)f Terrestrial Ecology (Bangor) on a Visit to Sri Lanka to Assess the Market Impact of a Potential Increase in Production of Banana Resulting from High Density Intercropping of Banana with Rubber
Ann Gray
November 1997
Natural Resources Institute Central Avenue Chatham Maritime Kent :ME4 4TB United Kingdom

TABLE OF CONTENTS
ACKNOWLEDGE1\1ENTS ... . .. .......... . ... .. .......................................... . . .. ............... . ... . .. ... ... . i SUl\1J.'v1ARY ..... ---- -- ... -.. ········· ........ ........... ...... ................. ...... ..... .. ....... . ....................... . iii REco~NDATIONS .. ............. ......... .... .......... . .. . . ... .. ... . ............. .. . .. ...... ... . . . ........ ... ... . .. v
lN1RODUCTION -- ------ · ··-·-- ---- ·----·----- .... ............ . .... ........... ............... . ... .. ........................ 1 Background .. ...... ........ ....... ......... .... ... .... ... ...... .. ... ........... ... ............... ..... ............... .. 1 Terms of Reference ..... .. .. ...... ...... ... .. ........... ..... ...... .... .... ..... .............. ..... ... .............. 1 Methodology .. ...... .... ... ......... .. .... ..... ...... .... .. ........ .. .................. .. ............ ... .. .. ... .. ..... 1
PRODUCTION OF BANANA .......... ... ... ....... ......... ... ..... . .. ... .. .... ...... ... .. ... . ............ .... . .. -.. .. 3 PRODUCTION OF RUBBER -. .......... . .......... .. . . ............. . ....... ........... . .... -.... . .... . ........ .. .. .... .. 4
T:HE RUBBER SUBSIDY ..... ... ..... ........... ....... ... .. ......... .. .............. .... .. . .. ......................... . 6
RUBBER/BANANA FARMING SYSTEMS . . . .. .. ... . .. . . ... .. .. . .. . ... . ... . .. .. . ... .. . ..... . ...... .... ...... ... ... 7 Smallholder landowner intercropping with immature rubber .. ...... .. .. ... .... .... .. .... ..... 7 Landowner with immature rubber crop leasing land to intercropping ...... ............... 8 contractor .... .................... ........ ............................... ......... ............. ..... ... .... .... ......... 8 Smallholder landowner growing immature rubber as a monocrop .. ........ .............. .. 9 Estate Rubber Plantations ............................................................. .... .. .. ......... .. ...... 9 Reasons for Intercroppingwith Banana .. .... ...................... .. ...................... .. ... ...... 10 Profitability of Banana Intercropping ..... ......... ... .. ........... .... ... .......... ... .. .. .... ........ 11
THE MARKETING OF BANANA .. . ...... .. ............... . .... ... ... .. ........ ..... ... .. ... ......... .. .. . ..... .... 14 Key Players in the Marketing System .............. ........................................... .. ......... 14 The Marketing System .... .. .. ... ....... .... ... .. .. .. ... ... ........ .. ..................... ..... ............. .. .. 17 Transport ..... ......... .. ....... .. ........ ..... .. ...... .. .............. .... ....... .... .. .............. .. ... .. ... .. .... 21 Marketing Margins .... .............. .... .......... ..... ..... .. .... ..... .... ... .. ..... ..... ..... .. .... .. ......... . 21 Losses ................... ......... .. ......... ........ .. .... .. ... ....... ................ ......................... .... .... 22 Prices ........ ....... .... ... .................. ..... ........ ... ... .... ... .. ............... .. ........ ...................... 22 Quality .................... ..... ... ........ ... ...... .......... ..... .............................. .. ... ............. ..... 22 Seasonality ..... ............................. ... .. ............... .... .......... .. .. ...... .. ... ...... .. .. .. ..... .. ..... 22 The Level of Efficiency in the Banana Market.. .. ........ .... .. ......... .................. .. . , ... .. 24
D01\1ESTIC CONSUMPTION OF BANANA . . ... .. __ .. __ .... __ ... . . _. __ . . .. .... . . . .. . . .......... . .. . . .. . .. ....... 25 EXPORT OF FRESH AND PROCESSED BANANAS FROM SRI LANKA .. ..................... ... ... .. 26 POTENTIAL FOR EXPANSION OF T:HE EXPORT MARKET _ ... _ .. . .. ..... . ... ......... ... ........... . .... 27
POTENTIAL UPTAKE OF T:HE TECHNOLOGY __ ... _ .. . . .. . _ ... . _ . ..... _ .. . . _ ..... ...... _ .... . .... .. .. . .... . . _. 28 Profitability of Banana Compared to Other Intercrops ........... ...... .. .......... .... ........ 28 Level of Initial Capital Investment Required ................................................... .. ... 28 Fertiliser Use ........ ... ... .... ...... .. .................. .. ................................... .............. ........ 28 Smallholder Farm Management Practices and Dissemination of Information ..... . 29
T:HE POTENTIAL IMP ACT ON T:HE MARKET OF ADoPTION OF T:HE TECHNOLOGY _ ...... ... . 29
CONCLUSIONS . . ... . .. ... ... ..... .... . .. .... .. ........ ..... .. . .. .... .. . ... . .. .. .. . .. .... .. . . . .......... .... . ... ......... 33
APPENDICES: ...... .... ... -. .... ........ ... ... . .. ..... .. .. .. .... .. .. . ... .. . ..... . . .. ... ..... ..... .. . .. .. -.. .. ...... ... ... 34 APPENDIX 1: OTHER PROJECTS AIMING TO INCREASE PRODUCTION OF BANANA
APPENDIX 2 : ITINERARY
APPENDIX 3: REFERENCES

FIGURES
FIGURE 1: MAP OF SRI LANKA SHOWING RUBBER GROWING AREAS ......... ... .. .. .. ......... . ii
FIGURE 2: AVERAGE PRODUCTION OF BANANA IN EIGHT PRINCIPAL DISTRICTS, 1991-
1995 ······ ··· ········ ·· ······················ ·· ··· ·· ···· ····· ······· ····· ··········· ···· ····· ··· ······ ·· ····· ·········· 3
FIGURE 3 : AGRICULTURAL LAND USE IN SRI LANKA .... .. ................... ..... ......... ...... ...... . 4
FIGURE 4: RUBBER GROWING DISTRICTS ....... ......... ... ..... ....... ........ .. ......... .. .... ........ .... . 5
FIGURE 5: THE MARKETING CHAIN FOR BANANA IN SRI LANKA ........... ....... ... .. ......... 16
FIGURE 6 : MAP OF SRI LANKA SHOWING THE MAIN BANANA DISTRIBUTION CHANNELS
IN 1HE SOUTH WEST OF THE COUNTRY .. .... .. .. ..... ........... ... ....... ... ..... ... .. .... .. ... .. .. . 20
FIGURE 7: MONTHLY AVERAGE WHOLESALE PRICES OF BANANA, 1996 .... .. ..... ......... 22
FIGURE 8: GRAND SEASONAL INDEX FOR AVERAGE WHOLESALE BANANA PRICES IN
SRI LANKA 1992-1996 ···· ··· ··· ········· ··· ········ ····· ···· ··· ······· ········· ········· ··· ·· ·· ··········· · 23
FIGURE 9: PER CAPITA ANNuAL CONSUMPTION OF BANANA, KG 1986-87 .... ............. 25
FIGURE 10: ESTIMATED ANNuAL PER CAPITA CONSUMPTION OF BANANA, KG 1997 .. 26
FIGURE 11: EXPORTS FROM SRI LANKA TO THE MAJOR DESTINATIONS, 1994-96 ....... 27
TABLES
TABLE 1: MARKETING MARGINS .... ..... ....... .. .............. .... ... . ... . .... .......... ..... ..... .... ... .... 21
TABLE 2: CURRENT ESTIMATED SMALLHOLDER PRODUCTION OF BANANA UNDER
RUBBER/BANANA INTERCROPPING SYSTEMS ...... ...... ... .......... .. ... ... .... ... .... ......... 3 0
TABLE 3: POTENTIAL MARKET IMP ACT OF SMALLHOLDER ADOPTION OF THE TECHNOLOGY .... .... .. .. .... .. .. .. .... ... . ... ... .... ... ....... .. .. .. .. .. .. .. ....... ... .. ...... .... ............. 31
TABLE 4: POTENTIAL MARKET IMPACT OF ESTATE ADOPTION OF THE TECHNOLOGY .. 32
Abbreviations DFID
EDB
GSI NRl RMA RRISL SLR
Department for International Development Export Development Board Grand Seasonal Index Natural Resources Institute Rapid Market Appraisal Rubber Research Institute of Sri Lanka Sri Lankan Rupee
Exchange Rate The exchange rate at the time of the study was £1 =SLR 96

Acknowledgements The author would like to thank Dr. Lakshman Rodrigo and Mr~ Upananda Herath of the Rubber Research Institute of Sri Lanka for their hard work and invaluable assistance in the collection and analysis of data for this report. Thanks should also go to Mr. Rohana Gunawardena, Mr. M. Dharmadasa and Mr. Mudaligae, the Rubber Development Officers in the areas visited, for their ~ssistance. Thanks also to the farmers, traders and businesses without whose cooperation this study would not have been possible.

Figure 1: Map of Sri Lanka Showing Rubber Growing Areas
Colombo
'\'", .... ·. ...... .. , I .
/ /
. \ ··,
I 'Ktii'UI\CS;!.]S.
o~a
\
{
Dry Zone
'\ // ' \
/ I /
/
WetZo111:
/ .i!; --"
... I
r I
I
I
, ~ 1E'' Monaragal:~
- Rubber Growing area
.,...
...... _ _,.. l \.. -~ E.-n'oilipit)-.l '.... .
·-- .. i
lndiw Ocean
Source: The National Atlas (1988), Survey Department of Sri Lanka, Rodrigo, 1997
11

Summary 1. The aim of this report is to assess the potential market impact of an increase in banana production arising from widespread adoption of a system of high density bananarubber intercropping in Sri Lanka (referred to as 'the technology' in this report).
2. This is preparatory to a project proposed by the Institute of Terrestrial Ecology (Bangor) for funding under DFID's Plant Sciences Research Programme, which is intended to identify agronomic practices suitable for adoption by low-resource farmers and aimed at improving income generation. It builds on an earlier project, carried out by the Institute of Terrestrial Ecology (Bangor) in collaboration with the Rubber Research Institute of Sri Lanka, which found that high density intercropping of banana with immature rubber can increase profits by more than 350% over the present recommended one row system of intercropping.
3. In this study the market for banana in Sri Lanka has been characterised and the potential impact of increased banana production on the domestic market as a result of the project has been assessed. Aspects ofboth production and marketing were examined in order to understand the likely increase in production from current levels which would arise as a result of the technology, and the impact ofthis increase in production on the market. The potential for expansion in the export market has also been appraised.
4 _ Banana is consumed as a snack food or as a dessert after a meaL It has a symbolic importance in Sri Lanka, and it is always provided at functions and gatherings. It is a relatively expensive food and as such is likely to be regarded as a superior good, for which demand increases as income increases.
5. The marketing of banana is conducted under a 'Polla' system, which is a system of rural fairs where large numbers of producers and wholesalers meet to negotiate prices and buy or sell banana.
6. Sri Lanka's banana market is well developed and appears to be reasonably efficient. Banana is brought from the farm to the market either by farmers themselves or by traders, known as 'collectors'_ No problems were encountered of limited access to rural traders or to transport. Furthermore, while transport tends to be slow because the main roads are narrow and crowded, these roads have a tarmac surface which to some extent facilitates transport to the main markets and enables producers and traders to transport produce during the rainy season as well as the dry season.
7. Produce was generally carried by headload from the farm to the road. While this method of transport would not be convenient if production increased substantially, the farms visited had fairly easy access to the nearest road and therefore in those cases it would not be a significant problem.
8. The potential increase in production resulting from adoption of the technology is likely to be small as a percentage of current production (which is about 312 000 MT. according to 1995 data). It is assumed that any increase in production ofbanana will be absorbed by the domestic market since there is limited potential for expansion of the export market A timescale of ten years was estimated to be the minimum for widespread adoption of the technology to take place. In the analysis the maximum possible increase
111

in production has been estimated in order to understand the impact of the 'best case' scenario on the market. It should be noted that it is unlikely that the increase estimated in the best case scenario will be achieved.
9. The potential increase in production resulting from smallholder adoption of the technology was estimated to be between 1.4% and 8% of current production (i.e. between 4 300 and 26 000 MT. per year). The potential increase in production resulting from adoption in the estate sector was estimated to be no more than 16 000 MT. per year, that is, 5% of current production.
1 0. Therefore in ten years the maximum potential increase in production from both the smallholder sector and the estate sector as a result of the technology would be around 13% of current production (i.e. 40 500 MT. per year). However, it is likely that the total increase will in fact be much lower than this, possibly of the order of 5% of current production (i.e. 16 000 MT.).
11. Interviews with domestic traders reveal that there is currently sufficient capacity in the local market to absorb an increase in production ofup to 10%. Over ten years the market's capacity to absorb increased production is likely to be even greater, partly because the population will probably have increased by around 12%, which will cause an increase in domestic demand for banana. Therefore it can be said with some certainty that over the next ten years the market will expand sufficiently to absorb the maximum potential increase in production resulting from the project.
12. Nonetheless, local gluts may arise from increased production in certain areas, especially between May and July when production ofbanana increases slightly and demand falls. The extent to which these gluts affect the local market depends on the speed and efficiency with which the marketing system is able to distribute the banana to areas ofundersupply.
13 . Areas which the project needs to address include the level of initial capital required for high density intercropping of banana, which, if too high, may act as a disincentive for poor farmers. The project plans to investigate the use of organic fertiliser which should significantly reduce the capital costs of the technology. However, ways of overcoming small farmers' apparent lack of knowledge about or unwillingness to follow recommended farm management practices, or use fertiliser, should be addressed. It is likely that uptake of the technology will depend to some extent on the extension services.
14. It can be assumed that at least 50% of smallholder intercroppers have experience of growing banana with rubber and as a result the project will build on the current experience of many smallholders.
IV

Recommendations 15. While the banana marketing system in Sri Lanka should be able to absorb and distribute reasonably efficiently an increase in production, local gluts may still arise at certain times of the year, and thoughts should be given on how to enhance the market at these times. This may include aspects such as:
• timing harvesting of banana in order to spread supply more evenly, or to ensure an increase of production at times of higher demand (December and April);
• encouraging farmers to organise themselves to a greater extent in areas where uptake is likely and local production will be increased;
• enhancing links between farmers and transporters/ traders; • ensuring that the available means of local transport will be able to cope with
an increase in volumes marketed. Extension services and research institutions should be able to provide advice on this.
It is also recommended that:
16. the project is designed in such a way as to encourage farmers to take an active role in the planning and experimental stages. Farmer participatory research is likely to ensure that the project addresses farmers' needs and constraints, and also overcomes some of the difficulties of transfer of information from the project to the farmer;
17. in the initial stages ofthe project further research is carried out into the application and understanding by smallholder farmers of good farm management practices, and the constraints to their adoption of such practices;
18. a study of the comparative profitability of banana versus other intercrops is carried out in order to obtain a clearer prediction of potential uptake ofthe technology;
19. farmers lead the decision on the varieties to be used in the research. While Ambul was the most common variety to be grown and may well be the variety chosen by the farmers, it is possible that some may prefer to choose one of the higher value varieties such as Kolikuttu.
V

Introduction
Background
20. This project is aimed at researching the impact of a higher level of banana-rubber intercropping initially in Sri Lanka and potentially also in India and Malaysia. There has been limited adoption of intercropping among smallholders in Sri Lanka. The project aims to build on previous work which has shown that a high density of intercropping of banana with rubber trees (referred to as 'the technology' in this report) has a beneficial effect of increasing the yield per unit area threefold and also has the potential of increasing profit by 350% (Rodrigo, 1997). Furthermore, this technology may have a positive effect on the health ofboth crops. However, previous work did not investigate the extent to which inorganic fertilisers could be replaced by organic fertilisers. Work on nutrient recycling and the possibility of using green crop residues to recycle nutrients are the focus of the proposed project.
21. The purpose ofthis visit from 16th September to 7th October 1997 was to assess the potential market impact of an increase in production arising from widespread adoption of the technology.
Terms of Reference
• Collect and analyse the secondary data available on the production ofbanana and rubber by district, and other information collected by organisations working in the agricultural sector, in particular related to marketing;
• visit farmers in selected rural areas and carry out case studies on their banana/rubber production and banana marketing practices;
• assess the extent to which the technology would be adopted and estimate the likely increase in banana production resulting from adoption;
• carry out a general characterisation of the marketing system for bananas by visiting selected actors in the banana marketing chain, including traders, cooperatives and transporters;
• assess the future trends in demand in the domestic and export markets for Sri Lankan banana;
• assess the impact of increased production ofbanana on the market.
Methodology
22. Field work was conducted over a three week period. Informal data collection methods were used (including Rapid Market Appraisal (RMA) techniques) together with a review of secondary literature. The principal data collection method took the form of informal semi-structured interviews with individual key informants. Secondary literature was collected from the Export Development Board, the Rubber Development Department, the Department of Census and Statistics, the Agrarian Research and Training Institute and the Central Bank of Sri Lanka.
23. A cross section of informants was selected between: • Farming systems- smallholders, larger scale farmers and government owned
schemes
1

• Market access - isolated villages as well as villages close to Colombo and main roads
• Traders and exporters in the main regional markets and in Colombo markets.
24. The selection of these informants was carried out with the assistance ofDr. Lakshman Rodrigo (agronomist) and Mr. Upananda Herath (economist) of the Rubber Research Institute of Sri Lanka.
25. Although banana is grown all over Sri Lanka, the study concentrated on banana marketing in the south west of the country, coinciding with the rubber growing area.
26. About half the time was spent in Colombo interviewing wholesalers in the local markets, exporters, processors and rubber and banana experts. About twenty wholesalers and four exporters were interviewed for the study. Rubber growers were also visited in Siwaralumulla village, Gampaha district, and Ihala Bopae, near Padukka in Colombo district (shown in the map on page i), both of which had easy access to Colombo markets.
27. The rest of the time was spent in rural areas in Kegalla and Kurunegala district visiting farming villages and markets. About thirty producers were interviewed during the study. The villages visited in Kegalla were Danagama (where the electoral register showed there were 209 households), Danagama Colony (around 250 households), Koondenia (around 67 households), Gondiwala (74 households), Uthuwana and Dehimadua. These villages were located around Mawanella, which is shown on the map on page i. Four rubber estate managers in Kegalla were interviewed and markets at Rambukkana and Allawa in Kurunegala district were also visited.
28. During the field research it was discovered that Embilipitya area in Rathnapura district was very important in terms of production and marketing ofbanana fruit and plants in the south west of the country. Many traders in and around Colombo sold banana from that area, and many farmers in Kegalla bought their planting material from there. Therefore, although it was not in a rubber growing area, it was decided to visit Embilipitya market.
29. Aspects ofboth marketing and production ofbanana were covered in this report. On the marketing side an estimation was made of the current size of the market and the potential future size of the market. In order for the impact of the project on the market to be understood, an estimate was also needed on current production levels and potential increase in production resulting from the technology.
2

Production of Banana
30. The department of Census and Statistics estimated that a total of39 million bunches ofbanana (around 312 000 MT. 1
) were produced in 1995 on around 50 000 hectares2
.
31. Figure 2 shows the production of banana in the eight districts where most land is devoted to this crop.
Figure 2: Average Production of Banana in Eight Principal districts, 1991-1995
8000
7000
VI 6000 Gl .s:::. u
5000 c ::I .c ,; 4000 "C c 3000 Ill Cl)
::I 0 2000 .::: 1-
1000
0 ro ro .J!1 !!! >- Q)
~ (ij (ij ::l -c (ij ro Cl Cl 0.. c i;j 0.. Q) ro E Q) ro :2 c ::,.:: c ::,.:: ro ::J 1ti {9 ::; ~ ::,.::
111 .!!! - 0
111 -Cl c m 111 ~ .0
~ E 0 111 :2 I
District
Source: Department of Census and Statistics, 1996
32. The figure shows that Kurunegala, which devoted the most land to banana between 1991 and 1995, produced on average 7.2 million bunches (57 600 tonnes) per year over the period. The other areas covered in this study, Gampaha and Kegalla, are also significant producers ofbanana, producing on average 3.7 million bunches (29 600 MT.) and 2.4 million bunches (19 200 MT.) respectively per year over the 1991-95 period.
33. In the wet zone, in the south-west of the country, both banana and rubber are planted during the monsoons. There are two monsoons in Sri Lanka, the south-west monsoon which runs from May to August (the Yala season) and brings rain to the southern and western coastal regions and the central hill country. The dry season in these regions is from December to March. The second is the north-east monsoon, which blows from October to January (the Maha season), bringing rain to the north and east of the island.
1 This is assuming that the average weight of one bunch is around 8kg. This assumption was made using data from Rodrigo, 1997 which gave the average weight for a small variety of banana of 6kg per bunch. Traders in the market estimated that an average weight of Ambul was about 10kg, but when three standard sized bunches of Ambul were weighed the average weight was 8kg. 2 This figure, given in data from the Department of Census and Statistics, is high and it is likely that it over estimates the true hectarage. This is because banana is rarely grown at high densities, and therefore on one hectare only a few trees may be grown.
3

34. When planted in moist fertile soil using good planting material, banana will grow into adult size and flower after six months. In practice this usually takes about 9 months to 1 year. It then yields a marketable bunch about 3-4 months later. One sucker is kept on the plant after 3-4 months, and once a flower appears on the mother plant another sucker is kept. After the first harvest another sucker is left and the mother plant is removed. The suckers are also removed one by one after bearing fruit, and a replacement sucker is allowed to grow in each case. A well maintained banana plant therefore consists ofthree shoots, and yields fruit throughout the year. However, the farmer may have to wait as long as 16 months before he starts getting any revenue from the crop.
Production of Rubber
35. Rubber constitutes 8% of agricultural land use in Sri Lanka, as shown in Figure 3. It is grown on 161 479 hectares ofland (Agricultural Crops and Livestock, 1992-3).
Figure 3: Agricultural Land use in Sri Lanka
8%
20"k
i •Rubber
,OPaddy
34~ Coconut
:e Tea
'B Other Crops
Source: Agricultural Crops and Livestock, 1992-3
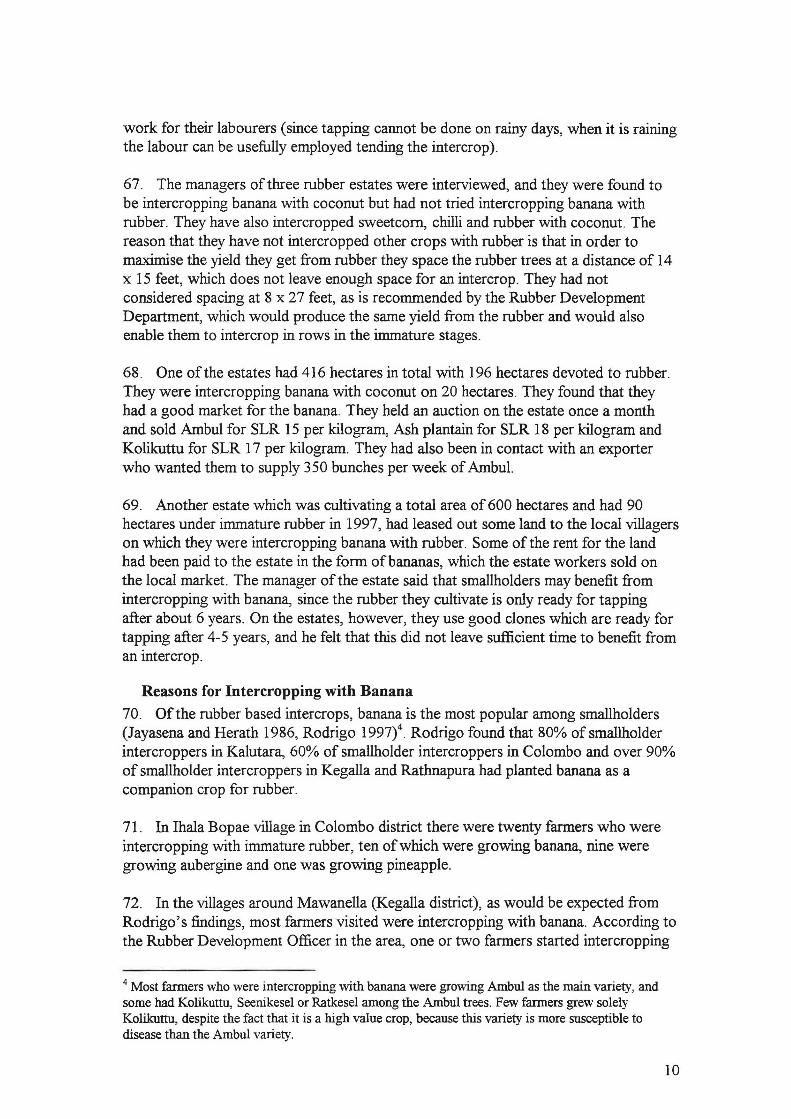
36. Rubber is grown in 14 administrative districts. Figure 4 shows the land area devoted to rubber in the 12 most important rubber growing districts. It shows that Kegalla, Kalutara and Rathnapura districts devote the most land to rubber, and together have 74% of the total rubber growing area. These three districts also have around 35% of the large rubber estates i.e. those above 40 hectares. Fifty percent of the large rubber growing estates are situated in the districts of Galle, Kurunegala, Matara and Monaragala.
4

Figure 4: Rubber Growing Districts
50000
45000
40000
35000
:11 30000 ... !!! 25000 u ~ 20000
15000
10000
5000
0 Q) ~ ~ Q) 0 ~ m m Q) >- m .!!! .!l ~ lii lii "'C lii lii :J :J lii m "S Cl "S a. (!) E n; m Cl n; c Cl "'C a. m Q) m 0
:2 E m :2 ~
Ill Ill ~ lii c 0 c m Ill
~ ~ u m :J c n; (!) :J 0 c:: ~ :2
District
Source: Agricultural Crops and Livestock, 1992-3
37. Ofthe total 161,479 ha of rubber grown in Sri Lanka about 33% is grown in the smallholder sector3(Anonymous 1993, cited in Rodrigo 1997). In terms ofthe number of holders, 70% belong to the smallholder sector. Around 60% of the smallholder sector own less than one hectare (Agricultural Crops and Livestock, 1992-93).
38. The rubber crop provides no return on the investment during the first 6 years. While large scale plantations are able to overcome the problem by adopting annual replanting cycles, this option is not available to smallholders who can little afford such long periods without any income from their investment (Rodrigo 1997). This can act as a barrier to replanting senile rubber trees, i.e. those over 30 years old, (Newman 1985, Rodrigo 1997) resulting in lower yields and poor income generation.
39. One way of overcoming this problem which is used by some smallholder rubber growers is to intercrop immature rubber with other crops, such as banana, pineapple, passion fruit or vegetables. In this way they obtain income from the land in the immature rubber stage. There is evidence to suggest that intercropping does not adversely affect the rubber crop, even when the intercrop is cultivated at high densities (Yogarathnam 1991, Rodrigo, 1997). After about four or five years the rubber canopy becomes too thick reducing the light availability for the intercrop, and so the productivity of latter declines at this stage.
3 Smallholders are defined as those farmers whose main economic objective is to increase their family income. In addition to their land and family labour they also own cash resources. They might also use hired labour and borrowed capital, but they often have limited access to these resources. In Sri Lanka, for administrative purposes, smallholders are defined as those farmers who own less than four hectares of land. Estates, on the other hand, have the objective of maximising the return on investment. In addition to their own capital they make use of land, hired labour and borrowed capital.
5

The Rubber Subsidy
40. It is important to clarify the context within which rubber is grown in Sri Lanka, in order to understand some of the factors which affect farmers decision to grow rubber and to intercrop in the initial stages.
41. Dissemination of information to rubber growers is the responsibility ofthe Rubber Development Officer who is part of the Rubber Development Department. While there are close links between the Rubber Development Officers, the Rubber Development Department and the Rubber Research institute, it appears that the capacity of the Rubber Development Officers to disseminate new ideas is presently limited by lack of funds .
42. All farmers wishing to plant rubber are entitled to a subsidy issued by the Rubber Development Department. The subsidy is given in eight instalments with a total value of SLR 50 3.25 (about £524) per hectare for replanting rubber land and SLR 48 750 (about £508) per hectare for new planting of rubber trees. Farmers claimed that this subsidy covered just under half of the costs of production (including labour).
43. The farmers who were growing rubber generally said that they had chosen this crop because it guaranteed them a stable income throughout their lifetime. It is likely that many were influenced in their decision by the availability of the rubber subsidy.
44. Before each instalment is dispersed the Rubber Development Officer goes to the farm. to check that certain standards have been met. For the first two instalments these standards initially include quality of fencing, soil conservation methods and quality of planting material. Later instalments are given at certain stages over the period of 5-6 years, on the condition that 67% of the trees reach a minimum specified girth when measured 3 ft from the ground. If these standards are not met, then the subsidy payment is withheld. Ifthe girth specified for the eighth instalment (when tapping can begin) is achieved within 5 years of planting, then a further SLR 2500 per hectare is given to the farmer.
45. This subsidy obliges farmers to follow the advice of the Rubber Development Officer or run the risk of losing the subsidy payments. This means that the Rubber Development Officer has a substantial amount of control over the farmers practices during the first 5-6 years of the rubber crop.
46. The Rubber Development Department also lays down guidelines for intercropping. At present only a single row of banana is recommended between the rows of rubber and some farmers who were planting at higher densities were nervous of the reaction ofthe Rubber Development Officer. In one case in Danagama village in Kegalla district a farmer had initially planted banana as a monocrop and then decided to plant rubber later. The result was that he was growing banana at quite high densities, with two or three rows ofbanana in between the rubber. The Rubber Development Officer was still under instructions to recommend only a single row of the intercrop between the rubber, and he intended to advise the farmer to uproot some of the intercrop for fear of damaging the rubber. If the farmer did not comply then he would be in danger of losing the subsidy.
6

47. The spacing for rubber recommended by the Rubber Development Department when the land is intercropped is 8 feet by 27 feet. This leaves sufficient space between the rows of rubber trees to plant the intercrop. Farmers who had consulted the Rubber Development Officer before planting the intercrop had planted the trees in this way. Some farmers, however, had not received this information and had planted the rubber as a monocrop with spacing of 12 x 18 feet, which results in exactly the same number of rubber trees per hectare as the spacing of8 x 27 feet, but leaves less space for the intercrop between the rows.
48. Clearly some farmers had not learned about the recommended practices for intercropping with immature rubber issued by the Rubber Development Department.
49. The fact that the Rubber Development Officer has, in theory, a certain amount of control over farmers practices in the immature stages of the crop may currently limit the extent to which farmers are willing to experiment or be innovative in improving farming methods. However, with better dissemination of information the control by the Rubber Development Officer over farmers practices could be exploited in favour ofthe project.
Rubber/Banana Farming Systems
50. There were several different farming systems practised in the areas visited. Many of the rubber farmers interviewed also had paddy land and land under coconut. Some also had land under tea or fruits. Some were intercropping with coconut and one farmer was encountered who was intercropping banana with a fruit called rambutan.
51. Five principal types of farming system for immature rubber were identified during the study. These were: • Smallholder landowner intercropping with immature rubber • landowner with immature rubber crop leasing land to intercropping contractor • Smallholder landowner growing immature rubber as a monocrop • estate rubber plantation not practising intercropping during the immature stage of
rubber • estate rubber plantations practising intercropping during the immature stage of
rubber.
Smallholder landowner intercropping with immature rubber
52. Rodrigo (1997) conducted a survey of current intercropping practices among smallholders with rubber plantations less than six years old in four rubber growing districts of Sri Lanka (Kalutara, Colombo, Kegalla and Rathnapura). He found that Kegalla had the highest incidence of smallholders currently or recently practising intercropping on immature rubber land (52% of smallholders). This was followed by Colombo, where 44% of smallholders with immature rubber land were or had in the recent past practised intercropping and finally 40% and 23% in Kalutara and Rathnapura respectively.
53 . Many smallholder/landowner rubber intercroppers were encountered during the visit in September 1997 in the villages around Mawanella in Kegalla, and a few in
7

Siwaralumulla village in Gampaha district and Ihala Bopae in Colombo district. Of the farms obseiVed, the intercrop had generally not been planted systematically in rows, but scattered between the rubber trees. Few smallholder/landowners were encountered who were intercropping at high densities with any crop, except in one in Danagama village in Kegalla.
54. While low-density intercropping was common, few rubber smallholder/ landowners were encountered who were intercropping at high densities with any crop, e.g. banana, pineapple or aubergine. This practice was largely being undertaken by commercial contractors, possibly because they had greater access to capital and were less risk averse than some farmers. It may also have been as a result of their objectives being different from the smallholder landowners (e.g. profit maximisation rather than a balance of objectives possibly including stability of income or food security).
Landowner with immature rubber crop leasing land to intercropping
contractor
55. In Siwaralumulla village (Gampaha district) and Ihala Bopae (Colombo district) it was common for landowners to lease out their land to a contractor for a fixed term of 5-10 years. A few cases were seen in the villages around Mawanella (Kegalla district), but this seemed to be limited by a lack of knowledge about the system, or a lack of contractors willing to lease the land.
56. Under the agreement in Siwaralumulla village in Gampaha district no money changed hands, but in return for the land the contractor prepared the land for planting, planted the rubber trees and maintained the rubber throughout the period of tenure. In return he was allowed to plant another crop in between the rubber rows (mainly pineapple in Siwaralumulla village, Gampaha district) and would keep all the returns from the intercrop. When the rubber canopy became too thick for further intercropping he would continue to maintain the land until the period of tenure came to an end.
57. The contracting arrangement was different in Ihala Bope in Colombo district, where the landowner would carry out the initial planting, terracing and fencing of the rubber, and also applies the fertiliser. The contractor simply uses the land and no payment passes in either direction.
58. It appears that this system is popular among landowners who did not want to invest large amounts of time in managing the rubber trees, and yet wanted a steady and guaranteed income from the land. Many of the landowners who were encountered were not farmers themselves, but had other professions, but it was not possible to establish whether this was generally the case. Some of the landowners who had contracted out land had done so because the land was far away from their home and was therefore difficult for them to manage.
59. The landowner had some guarantee that the rubber would be well cared for, since the rubber planting subsidy, to which all rubber growers are entitled, is controlled carefully by the Rubber Development Department. If the contractor fails to reach the standards set out by the Rubber Development Department, then the landowner is alerted to this when the subsidy is refused. It was not established what action the
8

landowner would take in this case, and indeed some of the small landowners interviewed said that they would not like to contract out their land since they were concerned that the rubber would not be adequately cared for.
Smallholder landowner growing immature rubber as a monocrop
60. Some of the smallholder farmers encountered in the villages around Mawanella (Kegalla district) in September 1997 were not intercropping on their immature rubber fields. One of the reasons for this was that their farm was far from their house and therefore they could not control problems of theft and animal damage. In one case the farmer had decided not to intercrop on his immature rubber land because he also had land devoted to tea, coconut and paddy Gust under 6 hectares in total), as well as paddy land that he had contracted out to others, and he did not have time to intercrop or to manage hired labour for intercropping.
61. When asked why they had not contracted out the land during the immature period of rubber, farmers in this area either were unaware of such a practice or believed that contractors would not be interested because their plot of land was too small, or too far away from other houses.
62. In the survey conducted in 1995-6 it was found that over 40% of smallholders who had not intercropped showed a positive attitude towards intercropping. This figure exceeded 60% in Colombo and Rathnapura districts while in Kalutara and Kegalla the majority of farmers who had not intercropped were neutral towards intercropping (Rodrigo, 1997).
63. Rodrigo found that the main reason for not practising intercropping was indifference (36.8% in Kalutara, 19.4% in Colombo, 17.2% in Kegalla and 38.8% in Rathnapura). Security was also perceived to be a major problem, except in Kegalla. Lack of appropriate knowledge of intercropping was another factor, particularly in Kalutara and Rathnapura.
64. A main reason for discontinuing intercropping on rubber lands was the problem of severe shading by the rubber trees, except in the Rathnapura district where soil and environmental conditions were perceived as being unfavourable to intercrops. Problems associated with pests and disease were cited alongside shading as a major reason for discontinuing intercrops in Kegalla (Rodrigo, 1997).
65. It is unlikely that lack of awareness was the reason for farmers not to adopt intercropping, since in 1986 Jayasena and Herath found that over 70% of rubber smallholders were aware of intercropping.
Estate Rubber Plantations
66. The large rubber estates used to be owned and managed by the government, but since 1992 they have been undergoing privatisation. Some are still government owned but are managed by a private company, and some are now both privately owned and managed. Some of the privately managed estates have started to intercrop with rubber and coconut. They benefit from intercropping since they obtain increased income from the land during the immature period of the rubber and they can also guarantee regular
9
work for their labourers (since tapping cannot be done on rainy days, when it is raining the labour can be usefully employed tending the intercrop ).
67. The managers of three rubber estates were interviewed, and they were found to be intercropping banana with coconut but had not tried intercropping banana with rubber. They have also intercropped sweetcom, chilli and rubber with coconut. The reason that they have not intercropped other crops with rubber is that in order to maximise the yield they get from rubber they space the rubber trees at a distance of 14 x 15 feet, which does not leave enough space for an intercrop. They had not considered spacing at 8 x 27 feet, as is recommended by the Rubber Development Department, which would produce the same yield from the rubber and would also enable them to intercrop in rows in the immature stages.
68. One ofthe estates had 416 hectares in total with 196 hectares devoted to rubber. They were intercropping banana with coconut on 20 hectares. They found that they had a good market for the banana. They held an auction on the estate once a month and sold Ambul for SLR 15 per kilogram, Ash plantain for SLR 18 per kilogram and Kolikuttu for SLR 17 per kilogram. They had also been in contact with an exporter who wanted them to supply 350 bunches per week of Ambul.
69. Another estate which was cultivating a total area of 600 hectares and had 90 hectares under immature rubber in 1997, had leased out some land to the local villagers on which they were intercropping banana with rubber. Some of the rent for the land had been paid to the estate in the form ofbananas, which the estate workers sold on the local market. The manager of the estate said that smallholders may benefit from intercropping with banana, since the rubber they cultivate is only ready for tapping after about 6 years. On the estates, however, they use good clones which are ready for tapping after 4-5 years, and he felt that this did not leave sufficient time to benefit from an intercrop.
Reasons for Intercropping with Banana
70. Of the rubber based intercrops, banana is the most popular among smallholders (Jayasena and Herath 1986, Rodrigo 1997t. Rodrigo found that 80% of smallholder intercroppers in Kalutara, 60% of smallholder intercroppers in Colombo and over 90% of smallholder intercroppers in Kegalla and Rathnapura had planted banana as a companion crop for rubber.
71. In Ihala Bopae village in Colombo district there were twenty farmers who were intercropping with immature rubber, ten of which were growing banana, nine were growing aubergine and one was growing pineapple.
72. In the villages around Mawanella (Kegalla district), as would be expected from Rodrigo's findings, most farmers visited were intercropping with banana. According to the Rubber Development Officer in the area, one or two farmers started intercropping
4 Most fanners who were intercropping with banana were growing Ambul as the main variety, and some had Kolikuttu, Seenikesel or Ratkesel among the Ambul trees. Few farmers grew solely Kolikuttu, despite the fact that it is a high value crop, because this variety is more susceptible to disease than the Ambul variety.
10
about 15 to 20 years ago, and the majority of farmers have been intercropping since about 1987.
73. Rodrigo found that the farmers who had chosen to intercrop with banana did so for two reasons. The first was because of financial sustainability resulting from lower capital costs, ready market and high profitability. The second reason was that banana required relatively little attention, and therefore labour requirements were low.
Profitability of Banana Intercropping
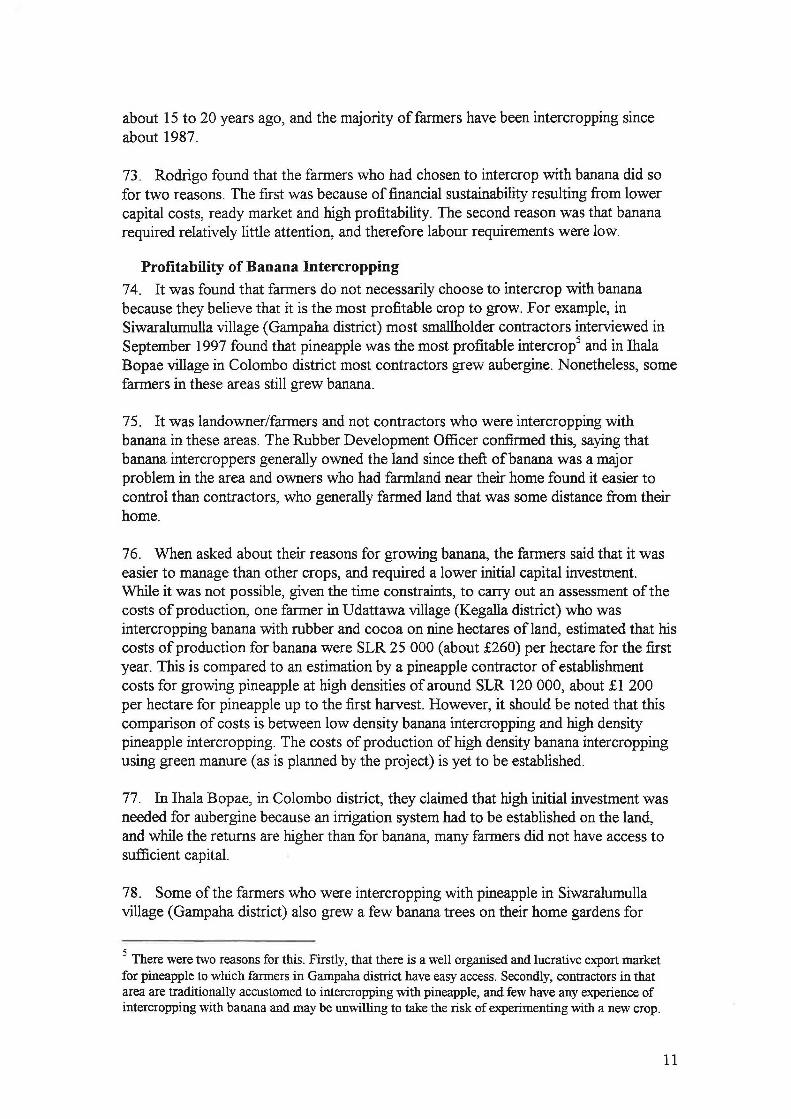
74. It was found that farmers do not necessarily choose to intercrop with banana because they believe that it is the most profitable crop to grow. For example, in Siwaralumulla village ( Gampaha district) most smallholder contractors interviewed in September 1997 found that pineapple was the most profitable intercrop5 and in Ihala Bopae village in Colombo district most contractors grew aubergine. Nonetheless, some farmers in these areas still grew banana.
75. It was landowner/farmers and not contractors who were intercropping with banana in these areas. The Rubber Development Officer confirmed this, saying that banana intercroppers generally owned the land since theft ofbanana was a major problem in the area and owners who had farmland near their home found it easier to control than contractors, who generally farmed land that was some distance from their home.
76. When asked about their reasons for growing banana, the farmers said that it was easier to manage than other crops, and required a lower initial capital investment. While it was not possible, given the time constraints, to carry out an assessment of the costs of production, one farmer in Udattawa village (Kegalla district) who was intercropping banana with rubber and cocoa on nine hectares ofland, estimated that his costs of production for banana were SLR 25 000 (about £260) per hectare for the first year. This is compared to an estimation by a pineapple contractor of establishment costs for growing pineapple at high densities of around SLR 120 000, about £1 200 per hectare for pineapple up to the first harvest. However, it should be noted that this comparison of costs is between low density banana intercropping and high density pineapple inter cropping. The costs of production of high density banana intercropping using green manure (as is planned by the project) is yet to be established.
77. In Ihala Bopae, in Colombo district, they claimed that high initial investment was needed for aubergine because an irrigation system had to be established on the land, and while the returns are higher than for banana, many farmers did not have access to sufficient capital.
78. Some of the farmers who were intercropping with pineapple in Siwaralumulla village (Gampaha district) also grew a few banana trees on their home gardens for
5 There were two reasons for this. Firstly, that there is a well organised and lucrative export market
for pineapple to which fanners in Gampaha district have easy access. Secondly, contractors in that area are traditionally accustomed to intercropping with pineapple, and few have any experience of intercropping with banana and may be unwilling to take the risk of experimenting with a new crop.
11
subsistence use and for sale. The reason given by pineapple intercroppers in Siwaralumulla village (Gampaha district) for not intercropping banana with rubber was that they had no experience of growing the crop at high densities for commercial purposes, and they preferred pineapple since they knew that they had a good market for it.
79. In the villages visited in Kegalla intercropping ofbanana with rubber was much more widespread, even amongst contractors. However, they were not growing it at high densities. Some had two rows ofbanana planted between the rubber, but none were seen who had consistently planted three rows between the rubber. The Rubber Development Officer in the area believed that they choose to grow banana partly because there is a tradition of growing banana in the area, and therefore farmers are experienced with this crop. It may also be a result of a lack of other more profitable opportunities. For example Kegalla is too far from Colombo for farmers in that area to benefit from the export market for pineapple.
80. Rodrigo ( 1997) carried out a financial appraisal of banana intercropping using the technology under three scenarios, ranging from one to three rows of banana grown between the rows of rubber. Inputs used for the technology included labour and inorganic fertiliser. The price of banana fruit was assumed to be SLR 20/kg. Data on costs and yield were collected over a two year period. Yield in the third year was estimated under three scenarios: equal to the second year, 75% ofthe second year's yield and 50% of the second year's yield.
81. He found that the Net Present Value (the present worth ofthe incremental net benefit of the technology) increased with increasing banana density. Also in the case where the third year's yield was assumed to be just 50% of the second year, intercropping rubber with banana was profitable only where three rows of banana were planted between the rubber. Assuming that the third year yield remained the same as in the second year, NPV exceeded SLR 50 000 per hectare at a discount rate of 4.5% for the three row system, compared to just over SLR 12 000 for the one row system.
82. When the price was assumed to be SLR 15 per kilo, none ofthe systems were found to be financially viable. As is shown in the market margin analysis on page 21, the producer price can be lower than this. Inorganic fertiliser contributed 66% towards production costs, and it is for this reason that the project plans to evaluate the extent to which green crop residues can be used to recycle nutrients for the high density technology.
83 . This study did not analyse the profitability of banana compared to other intercrops. Given that adoption of the technology depends on profitability of other rubber intercropping options, an analysis of this would provide a greater understanding of the likelihood of adoption by farmers.
84. Since banana can only be intercropped with rubber for 3-4 years, before the rubber canopy gets too thick, and the farmer receives the first harvest after about 16 months, they receive a revenue from intercropping for about 2-3 years.
12

85 . This can be compared to pineapple, which is a common intercrop among contractors in Siwaralumulla village (Gampaha district), and which yields the first harvest after one year when no hormones are applied. When hormones are applied to the crop, the first harvest can be collected after about eight months and the farmer can harvest twice a year and can ensure that the whole crop ripens at the same time. This is useful for farmers who are trying to time their harvest with the peak seasons on the export market in the Middle East (F eb/March, to coincide with the Moslem festival and August/Sept) . The contractors intercropping with pineapple remove the pineapple after three to four years.
86. In the case of aubergine the contractors were able to cultivate the intercrop for just two years. This activity was clearly profitable despite the high initial investment needed, and it would appear that two years of intercropping aubergine generated more profit than four years of intercropping banana.
13

The Marketing of Banana
87. Farmers generally kept the small bunches of banana for their own consumption and sold the rest. While most farmers claimed to sell most oftheir harvest, only keeping one or two of the smaller bunches, some with smaller plots estimated that they kept around 30% of their harvest.
88. The most common varieties ofbanana that were seen were Ambul (sour banana), Kolikuttu (apple banana), Ratkesel (red banana), Seenikesel (sugar banana), Anamalu (similar in appearance to the Cavendish variety) and Ambun. Another variety which was commonly seen was a plantain which had a greyish green skin, known as Ash plantain. Ambul is sold wholesale in units of one bunch (weighing between 6kg and 15kg). Traders in Colombo estimated that around 60% of their trade in bananas was in the Ambul variety.
89. Kolikuttu is a higher value variety and when it is sold wholesale, the fingers on the bunch are counted before the price is calculated. Producers and collectors selling in the markets sold several bunches together in one consignment.
Key Players in the Marketing System
90. The marketing chain for bananas is shown in Figure 5 on page 16. Many of the banana/rubber intercroppers in the villages around Mawanella (Kegalla district) sold their banana to a 'collector' who came to the farm to harvest and collect the produce. The collectors are wholesalers who perform the initial task of assembling the bananas and transporting them to the market or to the village shop (known as boutiques). This system was not so developed in Ihala Bopae village (Colombo district), possibly because a smaller volume of banana was produced there.
91. When conducting the research the term 'collector' was used by farmers and traders to describe any middleman who assembles banana and takes it from one place to another, irrespective of their purchase arrangements. In this report the term collector is used to describe wholesalers who assemble and purchase the banana, or who fix the price for banana they receive on credit, and resell elsewhere. Some collectors purchase directly from farmers on the farm (rural collectors) and others purchase from farmers or rural collectors in the banana markets (known as fairs).
92. In some secondary literature the term 'collector' has also been used to describe middlemen who do not purchase the produce, but transport it from the producer to the wholesaler and take back the payment to the producer once the wholesaler has sold the produce. In this report these middlemen, who at no point purchase the bananas and bear none of the market risks, have been described as 'agents' . This system of using agents to link up producers and wholesalers was not often encountered during the research into the banana market, and it is likely that it is more prevalent in vegetable marketing.
14

93. The collectors tend to deal regularly with farmers in a certain area, and they have a long standing relationship with them. They start collecting banana two to three days before the local fair, and bring the bananas to the fair the night before trading begins. Generally the collector negotiates with the farmer to establish the price of each bunch before harvest, and then the collector arranges and pays for the produce to be harvested and transported to the fair. The collector usually pays up front for the bananas, but sometimes they get them on credit at a pre-arranged price.
94. One farmer in Danagama village in Kegalla sold his bananas to collectors on a tender basis. Four collectors came to his farm and offered a price for his crop, and he sold the bananas to the highest bidder.
95. Some of the larger farmers, or the farmers who lived near the large rural fairs, took the bananas to the fair themselves, either by tractor or by bicycle. The farmers who sold their bananas to a collector said that they had other work to do and so did not have time to go to the fair once or twice a week. It is also possible that the small quantities harvested by some did not justify hiring transport to the fair.
96. Some farmers also have established contacts with the village boutique where they regularly sell their bananas.
97. No rural collectors were seen in Barawakubuka fair near Embilipitya in Rathnapura district. It is likely that the reason for this is that farmers in the area tend to grow banana at higher den_sities than they do around Kurunegela and Kegalla districts and they have larger quantities to bring to the fair. Therefore the farmers have sufficient volumes of produce to benefit from economies of scale when transporting their produce to market.
15

Figure 5: The Marketing Chain for Banana in Sri Lanka
Village r----"'lboutique
.. . ~ . . :agent':- · ·· ' . ~
.. . . .
=.Jurban sedentary wholesaler
Channel for bananas distributed by traders
· · · · · · · · · ~ Channel for bananas distributed on a commission basis
producer/ exporter
16

The Marketing System
98. Three banana markets, known as 'fairs' or 'Pal/as', were visited, two major fairs, in Kurunegala district ( Allawa and Rambukkana fairs) and one near Embilipitya, Rathnapura district (Barawakubuka fair) . Allawa and Rambukkana fairs were both held twice a week and Barawakubuka fair was held once a week, lasting for three days.
99. On the day that Rambukkana fair was visited, the market tax collector estimated that there were around 1300 bunches (about 10.4 MT.) in the fair. Traders said that two lorry loads go to Colombo each market day from Rambukkana fair, and each carries around 600 bunches.
100. Traders in Rambukkana fair include producers, sedentary wholesalers, collectors and itinerant traders coming to procure banana and take to other markets or to the boutiques in their local area. Sometimes also boutique owners in other areas procure their produce directly from these fairs.
101. The collectors or farmers generally headload the bananas from the farm to the nearest road. From the road they are then transported to the market by bicycle, in the trailer of a tractor or by truck.
102. When the banana arrives at the fair it is unloaded onto the ground and inspected by buyers. The buyers negotiate with the seller until they agree on a price. The buyer loads up the banana into a lorry and takes to another point of sale. Sedentary wholesalers in the fair occasionally negotiate on behalf of the farmers and also obtain credit from the farmer to provide the bananas on credit to the external buyers. This happened because the farmers did not want to bear the risk of lending to external traders, but were happier to lend to the local wholesaler since they had a long standing relationship with him.
1 03 . Allawa fair was larger than Rambukkana, and on the day it was visited there were 3000-4000 bunches (about 24-32 MT.). The main traders at these fairs were producers and rural collectors from the local area and itinerant wholesalers who were taking bananas to major rural centres. Unlike in Rambukkana fair, where consignments of mixed varieties were being sold, in Allawa fair most of the bananas had been sorted by size and variety into separate consignments for sale.
104. Interviews with wholesalers in and around Colombo had revealed that Barawakubuka fair near Embilipitya was very important for banana. Indeed, it was much larger than the two fairs in Kurunegela district, and on the day when it was visited there were around 5000 bunches (40 MT.). The fair runs from Friday to Sunday every week, but on other days of the week other banana fairs are held nearby. The main traders in this fair were producers who were selling their produce to itinerant wholesalers who transported the bananas to the major urban centres of Colombo, Galle, Matare, Rathnapura and Hanbantota (see map on page 19). One trader estimated that around three quarters of the bananas sold in this fair are taken to Colombo. There is no banana of the Ambun variety in this fair, since this variety needs a wet climate, and the fair is in the dry zone of Sri Lanka.
17

1 05. Regional markets, such as Kandy market and Kurunegela purchase banana brought directly to them by local producers and also purchase from collectors coming from the large fairs such as Allawa and Rambukkana.
106. Large volumes ofbanana are taken from the fairs to Colombo. The Pettah market in Colombo is the largest wholesale food market in Sri Lanka. The Manning market, which is the most prominent component of the Pettah Wholesale Food Market, consists of about 1 200 stalls which are rented to traders by Colombo Municipal Council. Of these 800 stalls are used for the vegetable trade while the balance are engaged in trading in fruits and other items such as dried fish, meat, coconuts, eggs and general provisions (Central Bank of Sri Lanka Annual Report, 1996).
107. In Manning market in Colombo, the wholesalers work on a commission basis, keeping 10% of the retail price. They are therefore protected from risk while the itinerant traders supplying them can make a loss. The Central Bank of Sri Lanka Annual Report ( 1996) describes how the marketing of vegetables is conducted in Manning Market and the mechanism is similar to that for banana:
Producers send their produce to the market through agents with a slip indicating the quantity and the trader to whom it should be delivered. The price is determined according to the demand and supply conditions prevailing in the market on that day. Each day, wholesale and retail buyers from the suburban and outstation markets come to the Manning Market to obtain their supplies. Having a good knowledge of the price range in which they could sell each variety of vegetable, they make offers for purchase. Guided by these offers, and his knowledge of supply conditions, the wholesaler then decides the price for each variety of vegetable. Once the price is decided upon, the wholesaler deducts his commission (which is around 10%) and other charges for transportation and handling (loading and unloading) and sends the remainder to the producer through the agent by cheque or cash. As producers usually split the sale of their produce among several traders, they receive an instant feedback if there is any variation in the prices given. This process, therefore, helps to minimise the price variations among traders in the market (Central Bank of Sri Lanka Annual Report, 1996).
108. This implies that the farmers send their produce on a credit basis to the wholesalers in Colombo. While the method of payment for the agent in this system is unclear, it is likely that they are also paid on a commission basis or that they set the price with the farmer before transporting the goods to Colombo and repay after sale. In this system, therefore, the producer and agent bear all the risk.
1 09. Wholesalers in Colombo procured most banana from Embilipitya area (about 120 miles away), where they claimed the quality is the best. They said that banana from Kegalla district, where many rubber growers intercrop with banana, was too expensive. One boutique seller in Siwaralumulla village (Gampaha district) also sold banana from Embilipitya (received through a collector), rather than selling banana grown locally, claiming that banana was still cheaper from Embilipitya despite the fact that it had to be transported a long distance. Some wholesalers in Colombo procured the Anamalu variety from Rathnapura district.
18

110. Traditionally most banana used to go through Manning market before being dispersed to other markets in the capital. However, since the arrangement of a fixed 1 0% commission to the wholesaler does not suit many collectors, they have started bypassing Manning market and directly supplying wholesalers in other markets in and around Colombo where this practice does not occur. Wholesalers in other markets also go directly to fairs to purchase the produce. For this reason, many wholesalers in Manning market had the feeling that the market was getting smaller, whereas in fact it is becoming more decentralised.
111. The large scale collectors often have frequent telephone contact with their wholesaler customers, and are therefore well informed about the market conditions. In some cases the wholesalers in the major towns specify the number of bunches that they want the agent to bring and give an indication as to the prevailing market price in Colombo. The collector uses this information to calculate the price at which he should purchase the banana in the fair.
112. Institutions, such as hospitals, army and the port, obtain their produce from collectors or from urban wholesalers.
19
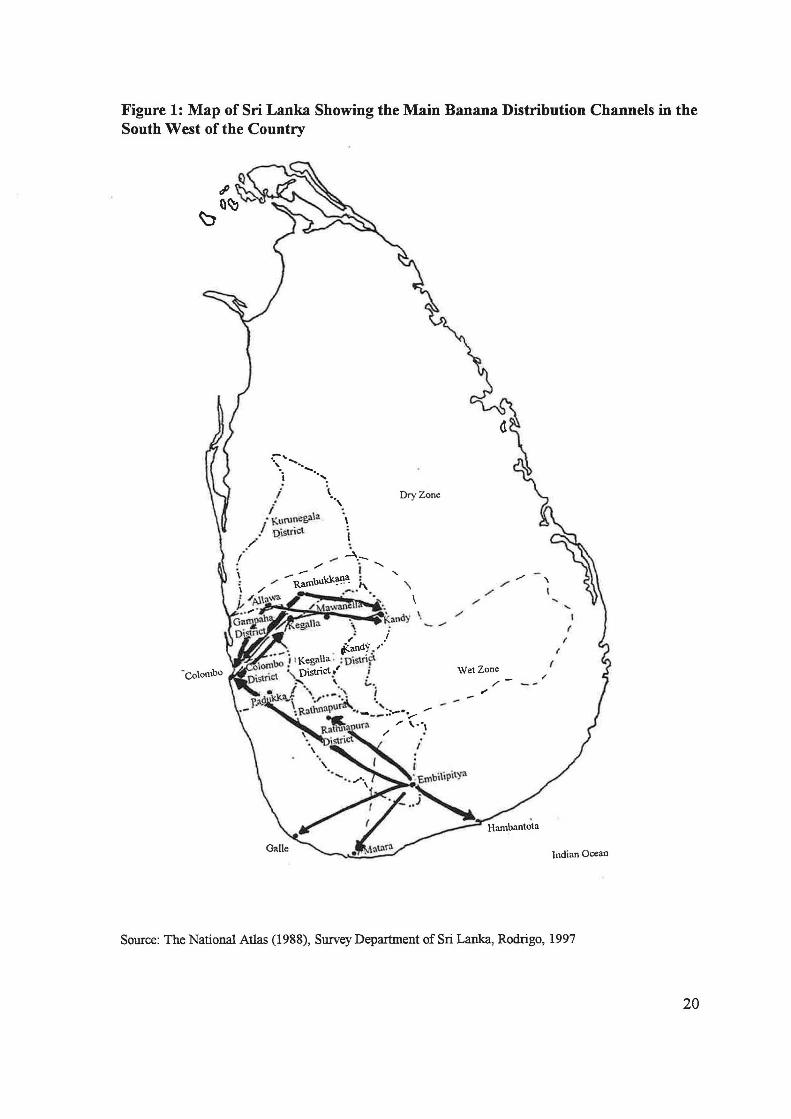
Figure 1: Map of Sri Lanka Showing the Main Banana Distribution Channels in the South West of the Country
-~ ' '~, ~ ~, I . . \
~, ; Dry Zone
; j j.(urun~a\a
/. pistrict ,.. ....
'\ /
' / / I
/ ..... / I ....... _..,.
(
I (
, · colonlbo ~:~;;et ''-District f ! Wet Zone
~ / ,
Indian Ocean
Source: The National Atlas (1988), Smvey Department of Sri Lanka, Rodrigo, 1997
20

Transport
113. Farmers and rural collectors use bicycles, tractors and hire vans to transport the bananas to the rural fairs . Large 5 tonne lorries are available at the local fairs to transport the bananas to the major urban centres in the South West. The collector or agent pays around SLR 10 per bunch ofbananas.
114. Producers and traders said that they never have a problem of scarcity of transport. They often join together in order to share the cost ofhiring a lorry.
115. Bananas are wrapped in dried banana leaves for protection in the tractor trailers or lorries. In some cases rough handling of the banana was seen, with loaders throwing the banana into the truck, and sometimes people sitting on top of the bananas during transport.
Marketing Margins 116. The fact that in many areas banana is not sold on a per kilogram basis complicated the task of calculating the marketing margins. However a rough calculation was made of bananas sold to a collector who sells in Rambukkana market. In the example the bananas were taken on to Colombo market for sale. The findings are shown in Table 1. All prices are given per kilogram ofbananas.
Table 1: Marketing Margins
Ambul %ofw/s mixed %ofw/s mixed %ofw/s price varieties price varieties price
Producer price 13 65% 16 53% 25 71% transport costs 1 1 price in 14.5 21 25 Rambukkana marketing costs transport costs 0.75 0.75 0.75 trader's bus fare/kg 0.3 0.3 0.3 bananas loading & unloading 0.25 0.25 0.25 market fee 0.375 0.375 0.375 total costs 4.375 4.375 4.375 price in Colombo 20 100% 30 100% 35 100% market
w/s marketing costs 80% 49% 44% as % of wholesale margin
Note: The calculations in this table are based on case study information, and therefore provide only a tentative guide to the marketing margins. Generalisations should therefore not be drawn from this table.
117. In the three examples given in Table 1 the farmer received between 53% and 71% of the wholesale price ofbananas in Colombo market. In the case where the farmer sold for the relatively high price of SLR 25 per kilogram, he had taken the banana to the fair himself The itinerant and sedentary wholesalers received a margin of 33% ofthe wholesale price between them, but most of this (67%) resulted from marketing costs. In the other examples the marketing costs were a smaller proportion
21
I

ofthe wholesale price (49% and 44% respectively), probably because they were mixed consignments which contained some high value varieties. These examples provide a rough guideline only, and more examples would be needed to draw more reliable conclusions. Furthermore they do not take into account marketing costs incurred as a result oflosses.
Losses
118. Wholesalers claimed that in general losses caused by physical damage such as bruising, are not very high, losses of quality and shrinkage can be substantial as the bananas age.
Prices
119. Average monthly wholesale prices in 1996 for three varieties of banana are shown in Figure 7.
Figure 7: Monthly Average Wholesale Prices of Banana, 1996
4.50
4.00c-3.50 - -----. ~ 3.oo - /~ AA1 i 2.50 i -~ ~~9? *:;.::::~~ ljl 2.00 [ 150 +'+ + -+-Ambul
:::J . -+-"' 1.00 '-+--+---..-+-+-+.-+- j -x-Ko"kutW --tr- Anamalu
0.50
0.00 : ; c .0 lii 5. >. c :J C) c. 0 > 0 ro Q) ro :::J ...., :::J Q) 0 Q) ...., u. :2 <( :2 ....,
<( en 0 z 0
Month
Source: Agrarian Research and Training Institute, Sri Lanka. 1997.
120. Figure 7 shows that the most commonly available variety ofbanana, Ambul, is the cheapest on the domestic market of the three varieties. Kolikuttu (apple banana) is the most expensive, closely followed by Anamalu. Another variety, Ambun is also expensive. Wholesalers felt that the price of banana and other fruit was quite high compared to other foods, and that many consumers could not afford to buy it.
Quality
121. Variety is the main factor which affects price and smaller bananas also fetch a lower price. Stage of ripening is also important and the price falls if the bananas become too ripe.
Seasonality
122. Figure 7 shows that seasonal price fluctuations are not dramatic, but a small price reduction occurs between May and July. Figure 8 shows the Grand Seasonal Index (GSI) for wholesale banana prices in Sri Lanka between 1992 and 1996. The price data was obtained from the Agrarian Research and Training Institute, 1997. The
22

GSI was calculated according to the 'ratio to moving average method' (Trotter, 1992)6
and shows how the price ofbanana fluctuates monthly around the average price for the year (which has been converted to an index of 1 00). Since the seasonal price changes for the three varieties, Ambul, Kolikuttu and Anamalu were very similar, Figure 8 shows an average of the GSis for the three varieties.
Figure 8: Grand Seasonal Index for Average Wholesale Banana Prices in Sri Lanka 1992-1996
110
105
~ 100
95
90 : c ..0
,_ 0.
,... c "S C) c.. 0 > 0 Ill Q) m m ::;, ::;, Q) 0 Q) ., I.L ~ <( ~ -, -,
<( en 0 z 0
Month
123. There are no large seasonal changes in production since banana is produced throughout the year, but production increases slightly between the months ofMay and July. These are also the months when the supply of other fruits increases and demand falls slightly as consumers switch to other fruits which are in season. One trader in Manning market in Colombo estimated that prices fell by around 10-12% during these months. The price data used above shows that average prices in 1996 fell by between 5% and 18%, depending on the variety, from the January-April period to the May-July period.
124. One collector in Danagama village (Kegalla district) said that between the months ofMay and July fewer wholesalers come to buy banana at the local fair at Allawa. This is possibly because there is greater availability ofbanana in other parts of the country and therefore wholesalers can procure their consignments in areas closer to the market they supply. It may also be because demand for banana falls during this period. Collectors in Rambukkana fair said that in May collectors sometimes make a loss because there is not enough demand in the market.
125. Prices are highest as a result of high demand during the festivals of Christmas in December and New Year in April. A trader in Manning market claimed to double his turnover around Christmas time and said that prices increase by about 20%. The price data for 1996 confirms this, showing a price increase of 16-21% in November and December from the August-October period.
6Trotter, B., 1992. Applying Price Analysis to Marketing Systems: Methods and Examples from the Indonesian Rice Market. Marketing Series 3. Chatham: Natural Resources Institute.
23

126. The collector from Danagama village said that demand in the local fair was good between December and April. He said that at this time of year more collectors enter the market, and it is often difficult for individual collectors to find enough banana.
The Level of Efficiency in the Banana Market
127. The economic efficiency of the market usually refers to the combined effect of the productive efficiency (technical plus operational) with which marketing services are undertaken, and the degree to which the prices provide incentives to producers and consumers that are consistent with resource availability's and demand (exchange efficiency).
128. Technical efficiency refers to the efficiency with which resources are used in marketing, in terms of the ratios of physical inputs and outputs. The extent of losses in handling, transport and storage is an example of a measure of technical efficiency in marketing. Informal interviews with traders suggests that physical losses were not a significant problem in Sri Lanka.
129. Traders said that transport was always readily available, and they had the choice of hiring a van individually or with a group of other traders, or of paying for transport on a per bunch basis in one of several lorries which are available at the large fairs. However, the poor condition of the roads in Sri Lanka leads to technical inefficiencies, increasing journey time and pushing up marketing costs.
130. Operational efficiency is defined as the provision of goods or services at least cost, and using an optimal combination of inputs. Sources of operational inefficiency include lack of incentives and inadequate information (Scarborough, 1992).
131. A necessary condition for a market to be operationally efficient is well organised and rapid transfer of information. While there are some problems of transferring information between producers and traders, especially over longer distances, many larger traders use the telephone in order to communicate market and price information to their customers or suppliers. In this way up to date market information is effectively transmitted. However, many producers and some of the small rural collectors did not have access to telephone facilities and therefore had to bear more risk and would potentially suffer as a result of asymmetries in information between themselves and the larger traders, leaving them open to potential exploitation. This reduces competition and may have the effect of pushing up consumer prices.
132. Within the marketplace all trading is conducted openly. However, in most markets outside Colombo, bananas are sold on a per bunch basis rather than per kilogram, and some large price differences were noted between bunches. This may have been a result of the team's inexperience in assessing the differences in size of the bunches, and it is likely that traders are experienced in this respect.
13 3. There were no significant barriers to entry in the banana market in Sri Lanka. Barriers to entry, which limit incentives for traders to enter the market, are another factor which reduces operational efficiency. These can be in the form of high initial capital investment requirements, predatory pricing methods employed by traders
24

already operating in the market or regulations limiting entry into various aspects of trading. There are many banana traders operating in Sri Lanka, and traders are free to enter and leave the market. The capital investment needed is quite low, and the minimum would only consist of working capital to buy a consignment and pay for transport and market costs. The market therefore appears to have quite a high level of operational efficiency.
134. The market is generally efficient in terms of exchange, although it may take time for localised oversupply to be distributed to areas where supply is lower. There is a free market in bananas and high levels of competition among traders suggests that prices indicate to a considerable extent resource availability's and demand. Seasonal fluctuations in prices demonstrate that prices change according to the seasonal availability ofbanana, but the timescale for such information to be transmitted may nonetheless lead to temporary localised oversupply in times of high production and low demand.
Domestic Consumption of Banana 13 5. Banana is consumed as a snack food or as a dessert after a meal. It has a symbolic importance in Sri Lanka, and it is always provided at functions and gatherings. It is quite expensive in relation to other vegetables and some fruits when they are in season. Banana could be classified as a superior good in Sri Lanka (i.e. one for which demand increases as income increases) and therefore it will not follow the same trends as many other starchy staples, which tend to be inferior goods. However, many people grow banana in their home gardens for subsistence purposes, and some are therefore reluctant to purchase it. The only available household consumption data dates back to 1987, and Figure 9 shows that per capita consumption ofbanana is low.
Figure 9: Per Capita Annual Consumption of Banana, kg 1986-87
Kolikuttu Ambul Anamalu Other Total Urban 1.32 6.24 0.72 0.84 9.12 Rural 0.48 3.12 0.36 0.72 4.68 Estate - 2.28 0.36 0.6 3.24 All Island 0.6 3.6 0.48 0.72 5.4
Source: Consumer Finances and Socio-Economic Survey, 1986-87, Statistics Department, Central Bank of Sri Lanka, 1993 The data includes subsistence consumption as well as purchased banana. NB. The data was given in units of fingers ofbanana and kilogram weights were calculated on the basis of an average of 10 fingers to the kg.
136. According to the data collected by the Statistics Department of the Central Bank of Sri Lanka, between the years 1978-79 and 1986-87 per capita consumption of banana increased by 88% for the whole island. In the absence of more recent studies it is not possible to estimate accurately the increase in per capita consumption over the past ten years, however we can assume that per capita consumption increased by at least as much as over the previous period. As a guideline for this report two scenarios have been assumed. First that per capita consumption increased by 100% over the past 10 years, and second that the increase was 200%. The effect ofthese increases in per capita consumption is shown in Figure 10.
25

Figure 10: Estimated Annual Per Capita Consumption of Banana, kg 1997
Annual per capita consumption ofbanana I
Assuming 100% increase Assuming 200% increase over past 10 years over past 10 y_ears
Urban 18.2 27.4 I
Rural 9.4 14.0 I
Estate 6.5 9.7 All Island 10.8 16.2
I
- --- -- ----- - -- --------- ---I
137. The population in Sri Lanka is 18 million (Statistics Department, Central Bank of Sri Lanka. Sri Lanka Socio-Economic Data, June 1997). Therefore ifwe assume that per capita consumption increased by between 100% and 200% over the past ten years, then consumption would be between 194 000 tonnes and 292 000 tonnes of banana per year. Given the current national banana production of 312 000 tonnes (department of Census and Statistics), it has to be assumed that the second scenario is more likely.
Export of Fresh and Processed Bananas from Sri Lanka 138. The volume ofbanana exported from Sri Lanka is extremely small and was 21.7 tonnes in 1996 (EDB, 1997). The volume increased between 1994 and 1995 from 4 tonnes to 24 tonnes, when some companies started exporting banana by sea, but since then it has remained constant.
139. The main varieties exported are Ambul (sour banana) and Kolikuttu (apple banana). Ratkesel (red banana) and Seenikesel (sugar banana) are also exported. These varieties are high priced speciality bananas and therefore serve only a small, high value niche market in Europe, the Middle East, New Zealand and Pakistan.
140. Few exporters buy banana from the wholesale markets in Colombo. Instead they either cultivate their own produce or go directly to the producers. Some exporters have their own collection centres in the rural areas, although none of these were seen during the visit.
141. The main problems highlighted for the expansion of the export market were the low demand for Sri Lankan varieties and the keeping quality of the bananas. While some exporters felt that Sri Lanka should concentrate on cultivating the Cavendish variety for export, it is unlikely that the country could compete against the large fruit producers such as Latin America, the Caribbean and West Africa. The large-scale banana producing and exporting countries have more advanced technology than Sri Lanka and have lower costs of production since they benefit from economies of scale. According to Mr. Jayashinghe (Assistant Director Sri Lanka Export Development Board), in Sri Lanka the majority ofbanana grown in the wet zone is grown on small plots of 1-2 acres (0.4-0.8 ha) . Because of this Sri Lanka has much higher costs of production and marketing costs, since it cannot benefit from economies of scale in production or marketing.
142. Figure 11 shows the volume of exports from Sri Lanka to the five major destination countries ofNew Zealand, Germany, U.K. United Arab Emirates and
26
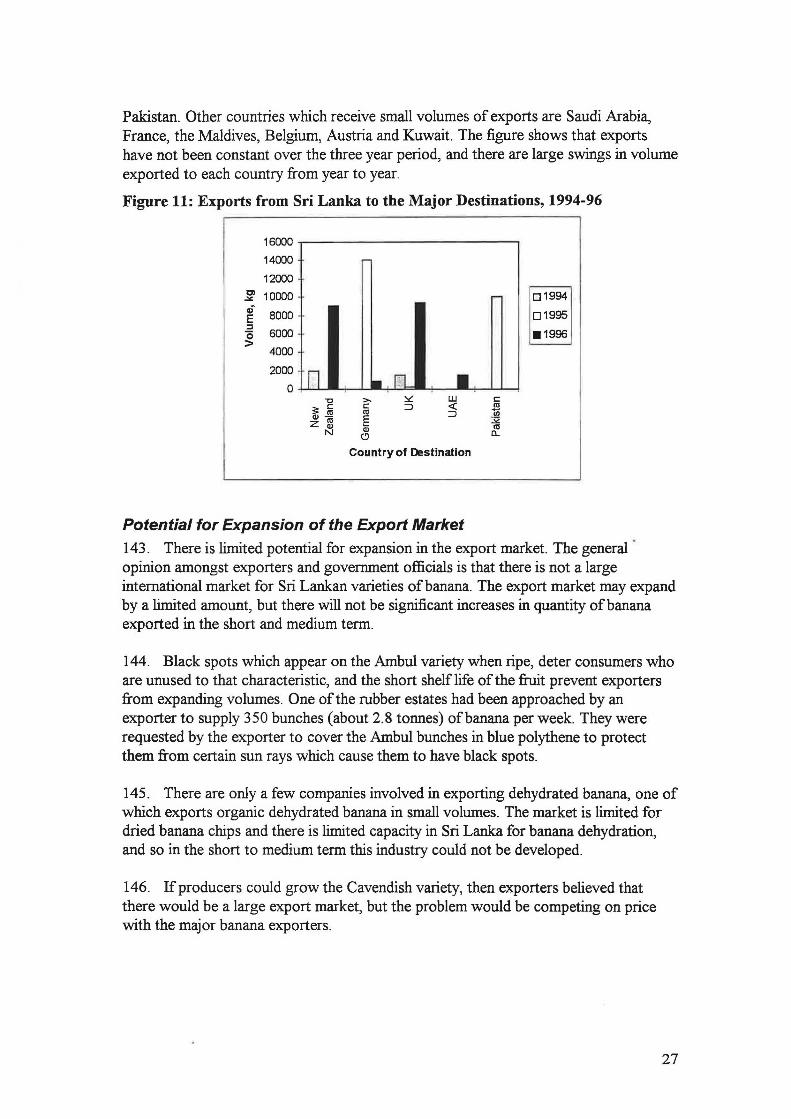
Pakistan. Other countries which receive small volumes of exports are Saudi Arabia, France, the Maldives, Belgium, Austria and Kuwait. The figure shows that exports have not been constant over the three year period, and there are large swings in volume exported to each country from year to year.
Figure 11: Exports from Sri Lanka to the Major Destinations, 1994-96
16000
14000
12000
~ 10000 Q)
8000 E ::I 0 6000 >
4000
2000
0 nl m • -c
s: lii ~Si
N
>c: m E lii
C)
~ ;:)
w <( ;:)
Country of Destination
Potential for Expansion of the Export Market
1:: m iil :;2 m
a..
01994
01995
.1996
143. There is limited potential for expansion in the export market. The general · opinion amongst exporters and government officials is that there is not a large international market for Sri Lankan varieties ofbanana. The export market may expand by a limited amount, but there will not be significant increases in quantity ofbanana exported in the short and medium term.
144. Black spots which appear on the Ambul variety when ripe, deter consumers who are unused to that characteristic, and the short shelflife of the fruit prevent exporters from expanding volumes. One ofthe rubber estates had been approached by an exporter to supply 350 bunches (about 2.8 tonnes) of banana per week. They were requested by the exporter to cover the Ambul bunches in blue polythene to protect them from certain sun rays which cause them to have black spots.
145. There are only a few companies involved in exporting dehydrated banana, one of which exports organic dehydrated banana in small volumes. The market is limited for dried banana chips and there is limited capacity in Sri Lanka for banana dehydration, and so in the short to medium term this industry could not be developed.
146. If producers could grow the Cavendish variety, then exporters believed that there would be a large export market, but the problem would be competing on price with the major banana exporters.
27

Potential Uptake of the Technology
Profitability of Banana Compared to Other Intercrops
147. The technology has the potential of providing substantial benefits to smallholders. Rodrigo ( 1997) showed that yield per unit of land can increase threefold and profits can increase by as much as 350% under the technology.
148. Smallholders may be attracted to the technology since it enables them to receive an income from the land during the immature stages ofthe rubber. Furthermore risk is reduced by intercropping and income can be more evenly distributed.
149. The income per hectare from intercropped banana which was not grown at high densities varied from SLR 1800 to SLR 4000 per hectare per month7
. In order to calculate the profitability of banana accurate data is needed on costs of production. This was not collected owing to time constraints.
150. Without knowledge of the profitability of other intercrops compared to banana, it is not possible to accurately predict the extent to which farmers or contractors will adopt the technol{)gy. While it is unlikely that the contractors who are currently intercropping at high densities with high value crops such as pineapple and aubergine will be willing to change to growing banana, there may be scope for smallholder farmers currently growing banana to change their intercropping practices according to the recommendations of the project.
151. It is worth considering why, when the intensified technology for pineapple and aubergine developed of its own accord, this has not happened for banana. While one or two fanners were encountered who were intercropping banana at higher densities than the one row system, they were not fertilising the banana and achieving maximum output from the land. Most contractors who were intercropping at high densities said that they had no experience of growing banana on a commercial scale, but the reason for this may be because banana is not as profitable as some other crops.
Level of Initial Capital Investment Required
152. Many farmers had not intercropped more profitable crops such as pineapple and aubergine because they were constrained by lack of capital for the establishment stages of the crop. Therefore, providing the project successfully manages to reduce the initial capital costs from intercropping high density banana, by, for example, developing the use ofbanana leaves as green fertiliser, it will provide a possible means by which these farmers can increase their income from the land.
Fertiliser Use
153 . Rodrigo ( 1997) found that on average about 50% of the smallholder fanners in Kalutara, Kegalla, Colombo and Rathnapura used fertiliser for banana intercrops, the greatest percentage (77%) being in the Colombo district.
7 This was calculated using yield estimates shown on page 30 and multiplying by an average price of SLR 150 per bllllch (around SLR 19 per kilogram).
28

154. However, one of the Rubber Development Officers in Kegalla believed that most farmers with whom he worked were not using fertiliser on their intercrops. He said that the farmers believed that the leaf fall from the rubber plants was sufficient to fertilise the land. He believed that farmers would not be willing to use inorganic fertiliser, but would be more willing to use organic fertiliser such as poultry manure, paddy straw or the leaves of legumes.
15 5. However, at present farmers have limited knowledge of organic fertiliser and they would have to be educated about its use. There is currently no extension programme on this. One of the larger farmers in Udattawa village near Mawanella (Kegalla district) who had contracted out land to grow banana reported using inorganic fertiliser when he planted the banana and then poultry manure, but he seemed to be the exception rather than the rule.
Smallholder Farm Management Practices and Dissemination of Information
156. The intensified technology of banana intercropping is likely to require skilled management practices. Many of the smallholder banana intercroppers were not using and probably were not aware of recommended management practices of fertiliser application, spacing of the crop or of disease control. It is currently the responsibility of the Rubber Development Officers to disseminate this information, but their capacity to do this is limited by lack of funds. This aspect needs to be addressed to ensure that information about the findings ofthe project is adequately disbursed to farmers.
The Potentia/Impact on the Market of Adoption of the Technology 157. The timescale for adoption is assumed to be around ten years. The assumption was based on the fact that smallholder yearly replanting of rubber occurs at the rate of around 1000 hectares per year (Rubber Research Institute). Therefore if farmers immediately adopted the technology it would take a minimum of two and a half years for all the immature rubber area to be intercropped at high densities (smallholder intercropped area is 2400 hectares). Since it takes time for information to be disseminated it has been assumed that adoption would take around four times longer than the minimum time, i.e. 10 years.
158. Given the fact that the potential for expansion in the export and processed product markets is limited in the short and medium term, it is unlikely that any increase in production will be absorbed by the export market. It will therefore have to be absorbed by the domestic market.
159. The estimated current production ofbanana by banana rubber intercroppers is 3453 tonnes as is shown in Table 2. This will be used as the baseline scenario against which possible increases in production resulting from the technology will be calculated.
29

Table 2: Current Estimated Smallholder Production of Banana under Rubber/Banana Intercropping Systems
Explanation of~omation
Rubber area (ha) 161 000 Immature Rubber area (ha) 40 250 about 25% of rubber area Smallholder immature rubber area 13 283 about 33% of rubber is grown on smallholder land Smallholder intercropped area (ha) 2657 estimated that about 20% of smallholders practise
intercropping with immature rubber Smallholder banana intercropped area 1328 50% of intercroppers grow banana (ha) Annual yield per hectare under current 2.6 No. of plants per hectare - 500, on average about system (MT.) 65% of the plants give a harvest, average weight
per bunch- 8kg (Rodrigo, 1997), therefore annual yield per hectare: 500 X 0.65 X 8= 2.6 MT. 8
Total production under current system 3453 2.6 X 1328 (MT.)
Sources oflnformation for Calomations: Rodrigo (1997), Annual Review of the Rubber Research Institute 1996, Agriomtural Crops and Livestock, 1992-93
160. The technology will have the impact of increasing annual yield from 2.6 MT. per hectare to 5. 8 5 MT. per hectare9
. The impact on total production of adoption of the technology is considered under two scenarios. Under Scenario A 20% of farmers with immature rubber land are assumed to intercrop and 50% of those intercroppers are assumed to grow banana (as in the baseline scenario).
161. Under scenario B it is assumed that more farmers have adopted intercropping over the ten year period, and 50% of farmers with immature rubber intercrop, and 75% of intercroppers grow banana.
162. Under both scenarios it is assumed that all banana intercroppers adopt the technology.
163. While it is unlikely that the adoption rates given in scenario B would be achieved, the intention is to estimate the maximum possible increase in production so as to understand what impact this may have on the market.
164. The estimated increase in production as a percentage of current production (312 000 MT.) is shown in Table 3.
8 The data for current yield was roughly checked in informal interviews with farmers. Four farmers were asked the yield they were currently getting from their land, and their answers ranged between 144 and 636 bunches/ha/year. On average the yield was around 339 bunches/ha/year (2.7 MT.). 9 No. of plants per hectare- 1500, on average about 65% of the plants give a harvest average weight per bunch- 8kg, assume 75% of this yield is attained because yield falls after second year due to the shade of rubber (Rodrigo, 1977). Therefore annual yield per hectare= 1500 x 0.65 x 8 x 0.75= 5.85 MT.
30
'

Table 3: Potential Market Impact of Smallholder Adoption of the Technology
Scenario A Scenario B 20% of farmers intercrop 50% of farmers intercrop 50% of intercroppers grow 75% ofintercroppers grow banana at high density banana at high density
Smallholder banana 1 328 4 981 intercropped area (ha) Annual yield per ha under 5.85 5.85 new technology (MT.) Total production under new 7770 29138 technology (MT.)
Increase in production (MT.) 4 317 25 685 Increase as % of current 1.4% 8.2% production
- - ----- --
165. Table 3 shows that if all current smallholder banana intercroppers adopt the technology, then the increase of production would be insignificant, at just over 4 000 MT., i.e. 1. 4% of current production. The maximum impact arising as a result of the technology would be under scenario B, which causes an increase in production of just under 26 000 MT., i.e. 8% of current production. However, it is extremely unlikely that scenario B could be achieved within 1 0 years, and probably would not be achieved even in the long term (see 'Potential Uptake of the Technology' on page 28). Therefore it can be said with some certainty that smallholder production would increase by less than 8% as a result of the technology.
166. The large scale rubber estates may have some interest in adopting the technology. While the estates which were encountered on the visit have started intercropping with coconut, none of them were currently intercropping banana with rubber. The estates who were intercropping banana with coconut were positive about the market for banana, but had not considered intercropping with rubber. In order to intercrop with rubber they would have to alter the spacing of their rubber trees (currently at 14' x 15'). It is unlikely that more than 10% ofthe immature rubber land on the estates will be devoted to banana as a result of the technology.
167. If we assume that no rubber estates are currently intercropping banana with rubber, and we assume that in ten years time between 5% and 10% of estate immature rubber land will be intercropped with banana, then we can calculate the likely increase in production. This is shown in Table 4.
168. Table 4 shows that the maximum increase in banana production in the rubber estate sector is just under 16 000 MT. (about 5% of current production) assuming that 10% ofthe estate immature rubber land is intercropped with banana using the technology.
169. Therefore the maximum potential increase in production resulting from adoption both in the smallholder and the estate sector would be about 13% of current production (40 500 MT.). It is likely, however, that the total increase will in fact be much lower than this, possibly of the order of 5% of current production (16 000 MT.).
31

Table 4: Potential Market Impact of Estate Adoption of the Technology
Current production 5% intercropped rubber 10% intercropped rubber land under banana land under banana
Rubber area (ha) 161 000 161 000 161 000 Immature rubber area 40 250 40 250 40 250 (ha) Estate immature rubber 26 968 26 968 26 968 area/ intercropped area (ha)!
Estate banana 0 1 348 2 697 intercropped area Yield per hectare under 5.85 5.85 new technology Total production 0 7 888 15 776 Increase in production - 7 888 15 776 resulting from technology_ Increase in production - 2.5% 5.1% as % of current total production 1 About 67% of rubber is grown on estate land. It is assumed that once the estates start intercropping on the immature rubber land all of this area will be intercropped.
170. As for the market's capacity to absorb the additional quantity produced, many traders interviewed believed that they could increase turnover by 15-20%, without reducing the price (although it should be noted that this is an individual perspective and the impact on price of turnover in the whole market increasing by 20% will be totally different to one trader increasing turnover by this amount). When asked why they did not expand immediately, some said that it was because production was limited, some said that they did not have sufficient capital, or that they were waiting for retailers who buy on credit to repay the loan.
171 . It should also be noted that the population in Sri Lanka is increasing by 1.1% (Central Bank of Sri Lanka, 1997), and therefore, assuming that this rate of increase and per capita consumption remain constant, the market is likely to expand by at least 11.6% over the next ten years (i.e. (1.011 10
- 1) * 100). Since per capita consumption ofbanana increased by 88% over the period 1978-79 to 1986-87, it is likely there will be an increase over the next ten years and so the market will expand by more than 11.6%.
172. This, together with the fact that there appears to be some slack currently in the market suggests that the market does have capacity to absorb an increase in production ofbetween 10% and 20% over the next ten years. The impact ofthe technology on the domestic banana market is therefore likely to be small and it is unlikely that the price of banana will be affected.
173 . While the impact of the technology on the banana market as a whole may be limited, local gluts may arise from increased production in certain areas, and this may be exacerbated by seasonal gluts and fall in demand between May and July. The extent
32

to which these local gluts affect the local market depends on the efficiency with which the marketing system is able to distribute the banana. This is discussed on page 24.
Conclusions
174. The market impact of adoption of the technology is likely to be small. Domestic demand for bananas is high and there is potential for expansion of production. Local gluts may, however, arise, especially during May to July, when there is a slight increase in production and demand falls owing to the fact that there are many other substitutes on the market. This may need to be addressed by finding ways in which the marketing system can be improved so as to distribute localised oversupply to other parts of the country.
175. There is limited potential for expansion in the export market, owing to the fact that the demand for the Sri Lankan varieties of banana is limited to a small niche market. Furthermore, if Sri Lanka were to adopt the Cavendish variety which is consumed by the international mainstream market, she would have difficulties competing with the major banana producers since her costs of production are likely to be much higher. This is because they do not benefit from economies of scale which the major producers gain from cultivating large estates using advanced technology.
33
Appendices:
Appendix 1: Other Projects Aiming to Increase Production of Banana in Sri Lanka
During the field work two projects were encountered which have an objective of increasing the production ofbanana.
One is the Perennial Crop Development Project which is based in eight districts including Kegalla, Gampaha, Kandy and Badulla districts. This project, which started in 1989 and finishes this year (1997), is funded by the Asian Development Bank. It provides a loan (at 14% interest) and subsidy to farmers for growing fruits such as pineapple and banana (SLR 3000 per acre, about £31), and spices such as pepper and cardamom to farmers with more than 1 acre (0.4 hectares) ofland. There is a five year grace period for the loan. The project has also granted loans for small scale processing of fruits and spices. The second phase of this project is due to start this year and will place more emphasis on marketing. (source: Mr. H.M.S Heenkenda, Senior Agronomist, Perennial Crop Development Project) .
The other is the Agricultural Development Project for Fruits, based around the Uda Walawe reservoir, in Rathnapura and Monaragala districts. This project is also funded by the Asian Development Bank and has the approval of the Mahaweli Economic Agency (a government agency created as a result of a large irrigation project known as the Mahaweli project) . Producers around Embilipitya in Rathnapura district said that banana production in that area had been promoted by the Mahaweli Authority for about 20 years. According to Mr. P. Korale Vidana (Manager ofMarketing Services, Mahaweli Economic Agency), over 3 000 hectares ofland have been converted from paddy to banana in Uda Walawe area (near Embilipitya market) as a result of the project.
34

Appendix 2: Itinerary
17th Sept.
18th Sept. advisor)
19th Sept.
20th Sept.
22nd Sept
23rd Sept
24th Sept
25th Sept
26th Sept
Arrival in Colombo Meeting with Dr. Lakshman Rodrigo (agronomist, researcher of intercropping) and Mr. Upananda Herath (agricultural economist)
Meeting with Mr. Ranjit Wijesinha, (marketing/agro-processing
AgEnt
Interview with wholesalers in Manning Market and Kirillapona Market
Meeting with Mr. L.P. Rupasena (Head ofMarketing and Food Policy) Agrarian Research and Training Institute.
Meeting with Mr. J.M.J.K Jayashinghe (Assistant Director), Mr. Pradeep Dharmadasa (Information Unit) and Mr. S.J.Silva (Assistant Director of Policy), Sri Lanka Export Development Board.
Meeting with Mr. Ranjit Panabokke (Managing Director) Eastern and Allied Agencies Limited (Exporter) .
Meeting with Mr. Rohana Gunawardena (Rubber Development Officer, Rubber Development Department). Interview with rubber growers and rubber pineapple/banana intercroppers in Siwaralumulla Village, Gampaha district.
Travel to Kegalla district.
Meeting with Mr. M. Dharmadasa (Rubber Development Officer, Rubber Development Department)
Interviews with banana/rubber intercroppers in Mahawella village.
Interviews with banana/rubber intercroppers and banana traders in Kegalla district
Visit to Rambukkana Market, Kurunegela district, interview with wholesalers
Visit to Rambukkana Market, interview with collectors and farmer/traders
Visit to Rubber estates. Interview with Mr. S.B. Dissanayake, Pitakanda Estate, Mr. S.B. Pilapitya, Notting Hill Estate, Mr. G.W. Silvan, Muwankanda Estate. Visit to UdaPolla Estate.
Visit to Kandy

27th Sept
29th Sept
30th Sept
1st Oct
2nd Oct
3rd Oct
4th Oct
6th Oct
7th Oct
Meeting with Mr. H.M. S. Heenkenda, Senior Agronomist, ADB funded Perennial Crop Development Project
Visit to Kandy Horticultural Division, Ministry of Agriculture
Visit to Kandy market, interview with wholesalers and retailers
Interview with banana/rubber intercroppers in Kegalla district
Interview with rubber monocroppers in Kegalla district
Visit to Allawa market, Kurunegela district, interview with farmers and traders
Travel to Colombo
Meeting with Mr. J.L Kurukulasuriya (exporter), Herak Holdings (PTE) Ltd.
Meeting with Mr. D. J Anderson (Managing Director) AgEnt
Meeting with Mr. N . Ranasinghe (exporter) Ranfer Group
Meeting with Mr. Roy Clark (Export Manager) and Mr. Sharm Weragoda (Managing Director) Morgenland Lanka (PVT) ltd.
Visit to village near Colombo (Ihala Bopae). Meeting with Mr. Mudaligae (Rubber Development Officer, Rubber Development Department). Meeting with rubber farmers.
Visit to Ihala Bopae village. Meeting with rubber farmers
Travel to Embilipitya, Rathnapura district
Visit to Embilipitya banana market, Rathnapura district. Interviews with producer/sellers and traders
Meeting with Mr. P. Korale Vidana (Manager ofMarketing Services) Mahaweli Economic Agency
Return to London
Appendix 3: References Department of Census and Statistics, 1994. Agricultural Crops and Livestock, 1992-93 . Ministry of Planning and Implementation.
Anonymous, 1993 . Ferguson's Sri Lanka directory 125th edition. The Associated Newspapers of Ceylon Ltd. Colombo.
Central Bank of Sri Lanka Annual Report, 1996
Central Bank of Sri Lanka, Sri Lanka Socio-Economic Data, June 1997
Handbook for the Ceylon Farmer, by Agricola. A Studio Times Publication, Sri Lanka.
Jayasena W. G. and Herath H.M.G., 1986. Innovation, receptivity and adoption in rubber smallholding of Sri Lanka. SSRP Research Study- No 71, ARTI, Sri Lanka.
Rodrigo L., 1997. Population Density Effects on Light and Water Use of Rubber/Banana Interculture Systems of Sri Lanka. Ph.D. thesis, University of Wales, Bangor.
Scarborough V. and Kydd J., 1992. Economic Analysis of Agricultural Markets: A Manual. Natural Resources Institute. Chatham, U.K
Yogarathnam N., 1991. Review ofthe Adaptive Research Unit. In: Annual Review 1991. The Rubber Research Institute of Sri Lanka, Sri Lanka.
Copyright © 2022 FDOKUMEN