REPOR T RESUMES - ERIC
34
REPOR T RESUMES ED 016 356 EF 001 000 THE EFFECT OF THERMAL ENVIRONMENT ON LEARNING, A PILOT STUDY. SY- PECCOLO, CHARLES IOWA UNIV., IOWA CITY, IOWA CTR. FOR RES. SCH.ADM. PUB DATE 62 EDRS PRICE MF-S0.25 HC.41.40 33P. DESCRIPTORS- *AIR CONDITIONING, *ENVIRONMENTAL CRITERIA, *ENVIRONMENTAL RESEARCH, *LEARNING, *THERMAL ENVIRONMENT, AIR CONDITIONING EQUIPMENT, BUILDING DESIGN, CLIMATE CONTROL, CONTROLLED ENVIRONMENT, DESIGN NEEDS, EDUCATIONAL EXPERIMENTS, ENVIRONMENTAL INFLUENCES, HEATING, PHYSICAL ENVIRONMENT, TEMPERATURE, VENTILATION, THIS IS A REPORT OF A FIRST PILOT STUDY WHICH PRECEDES A SERIES OF STUDIES BEING CONDUCTED BY THE IOWA CENTER FOR RESEARCH IN SCHOOL ADMINISTRATION AND LENNOX INDUSTRIES INC.; MARSHALLTOWN, IOWA. IT IS A DIGEST OF A THESIS BY DR. CHARLES PECCOLO WHO SERVED AS RESEARCHER ON THIS FIRST STUDY. THE STUDY AIMED AT MEASURING THE EFFECTS OF THERMAL CONDITIONS ON THE LEARNING PROCESS AND ON LEARNING. THE CONCERN WAS TO STUDY THE MODEL ENVIRONMENT AS NOW ESTABLISHED BY RESEARCH AND WRITINGS AND TO COMPARE IT WITH A MARGINAL ENVIRONMENT. THE FOURTH GRADE SUBJECTS USED WERE TESTED IN VARIOUS FUNCTIONS UNDER TWO COMTRASTING THERMAL ENVIRONMENTS WHICH DIFFERED IN TEMPERATURE, HUMIDITY, AND AIR MOVEMENT. THE FIRST PIECE OF RESEARCH SHOWED DEFINITE BENEFITS FOR CHILDREN IN A CAREFULLY CONTROLLED THERMAL ENVIRONMENT. HOWEVER: SCHOOL BOARDS AND SUPERINTENDENTS SHOULD NOT EMBARK ON AMBITIOUS PROGRAMS TO AIR CONDITION SCHOOLS USING THIS RESEARCH AS THE SOLE BASIS FOR DOING SO. THIS RESEARCH ALONG WITH OTHER EVIDENCE CAN GIVE STRONG SUPPORT FOR CONSIDERATION OF THERMAL CONDITIONS IN PLANNING SCHOOLS. THIS DIGEST INCLUDES--(1) INTRODUCTION TO THE PROBLEM, (2) DEVELOPMENT OF THE THERMAL CONCEPT AND A REVIEW OF THE LITERATURE, (3) EXPERIMENTAL PROCEDURES AND CONDITIONS, (4) ANALYSIS OF THE RESULTS, AND (5) SUMMARY AND CONCLUSIONS. CHARTS, GRAPHS, AND TABLES ARE INCLUDED. (RK)
-
Upload
khangminh22 -
Category
Documents
-
view
0 -
download
0
Transcript of REPOR T RESUMES - ERIC
REPOR T RESUMESED 016 356 EF 001 000THE EFFECT OF THERMAL ENVIRONMENT ON LEARNING, A PILOT STUDY.SY- PECCOLO, CHARLES
IOWA UNIV., IOWA CITY, IOWA CTR. FOR RES. SCH.ADM.
PUB DATE 62EDRS PRICE MF-S0.25 HC.41.40 33P.
DESCRIPTORS- *AIR CONDITIONING, *ENVIRONMENTAL CRITERIA,*ENVIRONMENTAL RESEARCH, *LEARNING, *THERMAL ENVIRONMENT, AIRCONDITIONING EQUIPMENT, BUILDING DESIGN, CLIMATE CONTROL,CONTROLLED ENVIRONMENT, DESIGN NEEDS, EDUCATIONALEXPERIMENTS, ENVIRONMENTAL INFLUENCES, HEATING, PHYSICALENVIRONMENT, TEMPERATURE, VENTILATION,
THIS IS A REPORT OF A FIRST PILOT STUDY WHICH PRECEDES ASERIES OF STUDIES BEING CONDUCTED BY THE IOWA CENTER FORRESEARCH IN SCHOOL ADMINISTRATION AND LENNOX INDUSTRIES INC.;MARSHALLTOWN, IOWA. IT IS A DIGEST OF A THESIS BY DR. CHARLESPECCOLO WHO SERVED AS RESEARCHER ON THIS FIRST STUDY. THESTUDY AIMED AT MEASURING THE EFFECTS OF THERMAL CONDITIONS ONTHE LEARNING PROCESS AND ON LEARNING. THE CONCERN WAS TOSTUDY THE MODEL ENVIRONMENT AS NOW ESTABLISHED BY RESEARCHAND WRITINGS AND TO COMPARE IT WITH A MARGINAL ENVIRONMENT.THE FOURTH GRADE SUBJECTS USED WERE TESTED IN VARIOUSFUNCTIONS UNDER TWO COMTRASTING THERMAL ENVIRONMENTS WHICHDIFFERED IN TEMPERATURE, HUMIDITY, AND AIR MOVEMENT. THEFIRST PIECE OF RESEARCH SHOWED DEFINITE BENEFITS FOR CHILDRENIN A CAREFULLY CONTROLLED THERMAL ENVIRONMENT. HOWEVER:SCHOOL BOARDS AND SUPERINTENDENTS SHOULD NOT EMBARK ONAMBITIOUS PROGRAMS TO AIR CONDITION SCHOOLS USING THISRESEARCH AS THE SOLE BASIS FOR DOING SO. THIS RESEARCH ALONGWITH OTHER EVIDENCE CAN GIVE STRONG SUPPORT FOR CONSIDERATIONOF THERMAL CONDITIONS IN PLANNING SCHOOLS. THIS DIGESTINCLUDES--(1) INTRODUCTION TO THE PROBLEM, (2) DEVELOPMENT OFTHE THERMAL CONCEPT AND A REVIEW OF THE LITERATURE, (3)EXPERIMENTAL PROCEDURES AND CONDITIONS, (4) ANALYSIS OF THERESULTS, AND (5) SUMMARY AND CONCLUSIONS. CHARTS, GRAPHS, ANDTABLES ARE INCLUDED. (RK)
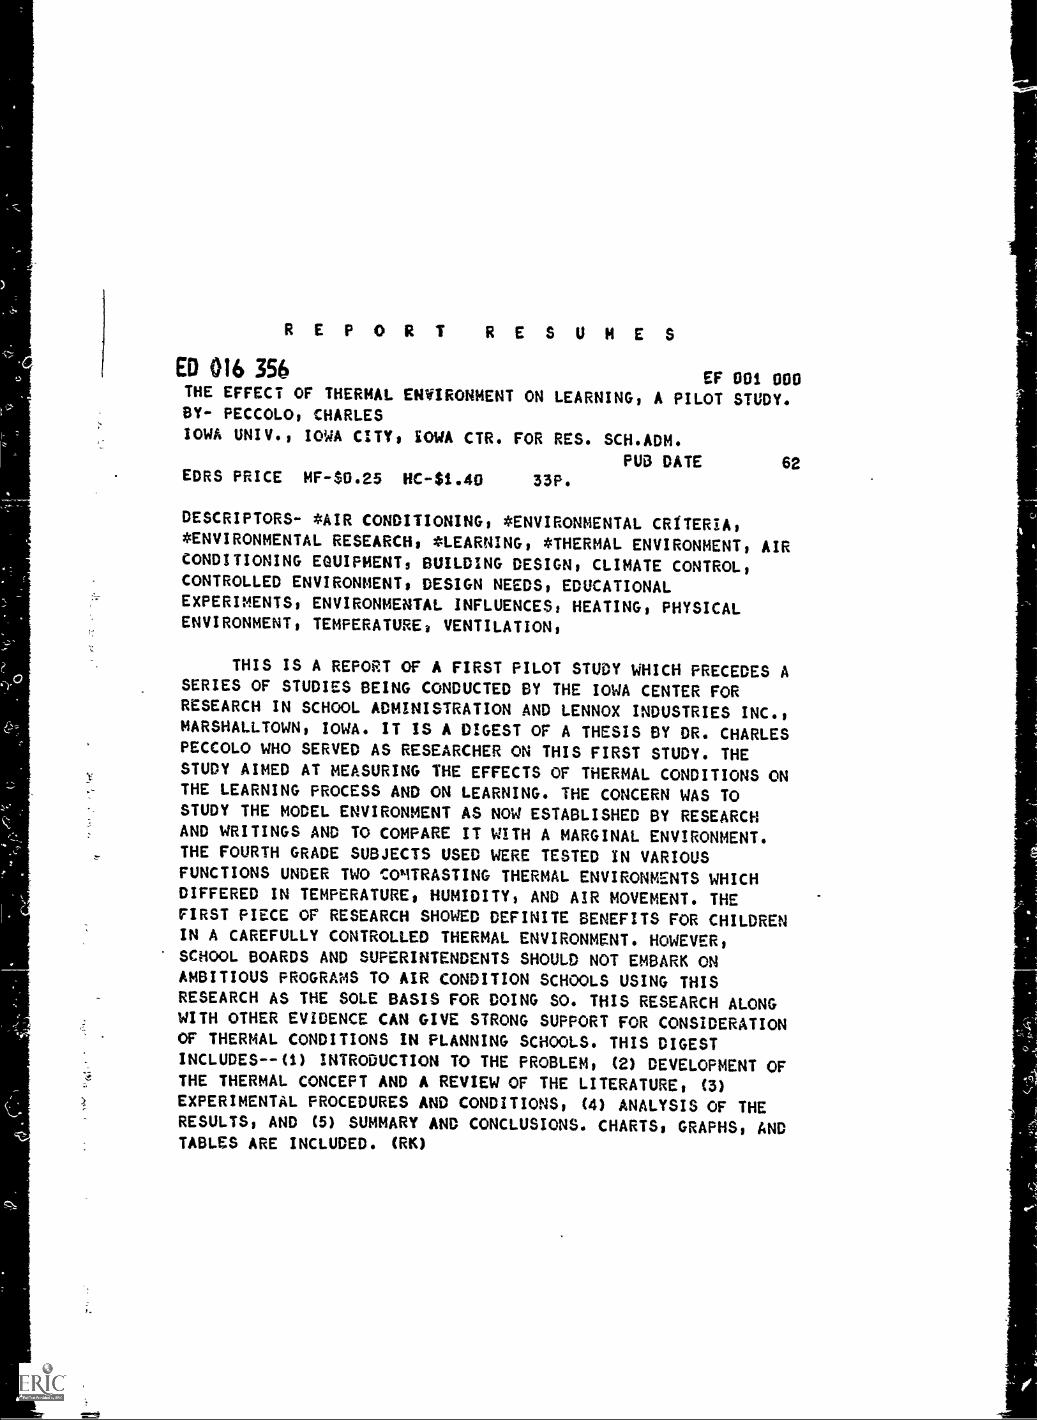
The Effect of Thermal Environment
On Learning
A Pilot Study
1
A Digest
of a Ph.D. Dissertation by Charles Peccolo
U.S. DEPARTMENT OF HEALTH, EDUCATION it WELFARE
OFFICE OF EDUCATION
THIS DOCUMENT HAS BEEN REPRODUCED EXACTLY AS RECEIVED FROM THE
PERSON OR ORGANIZATION ORIGINATING IT, POINTS OF VIEW OR OPINIONS...,
STATED DO NOT NECESSARILY REPRESENT OFFICIAL OFFICE OF EDUCATION
POSITION OR POLICY.
.111IL
Ac
a
4
=5
'41111141_,:,...--z_
4 4
-,
IOWA CENTER FOR RESEARCH IN SCHOOL ADMINISTRATIONCOLLEGE OF EDUCATION
0° PUNIVERSITY OF IOWA
IOWA CITY, IOWA1962
Price $2.00
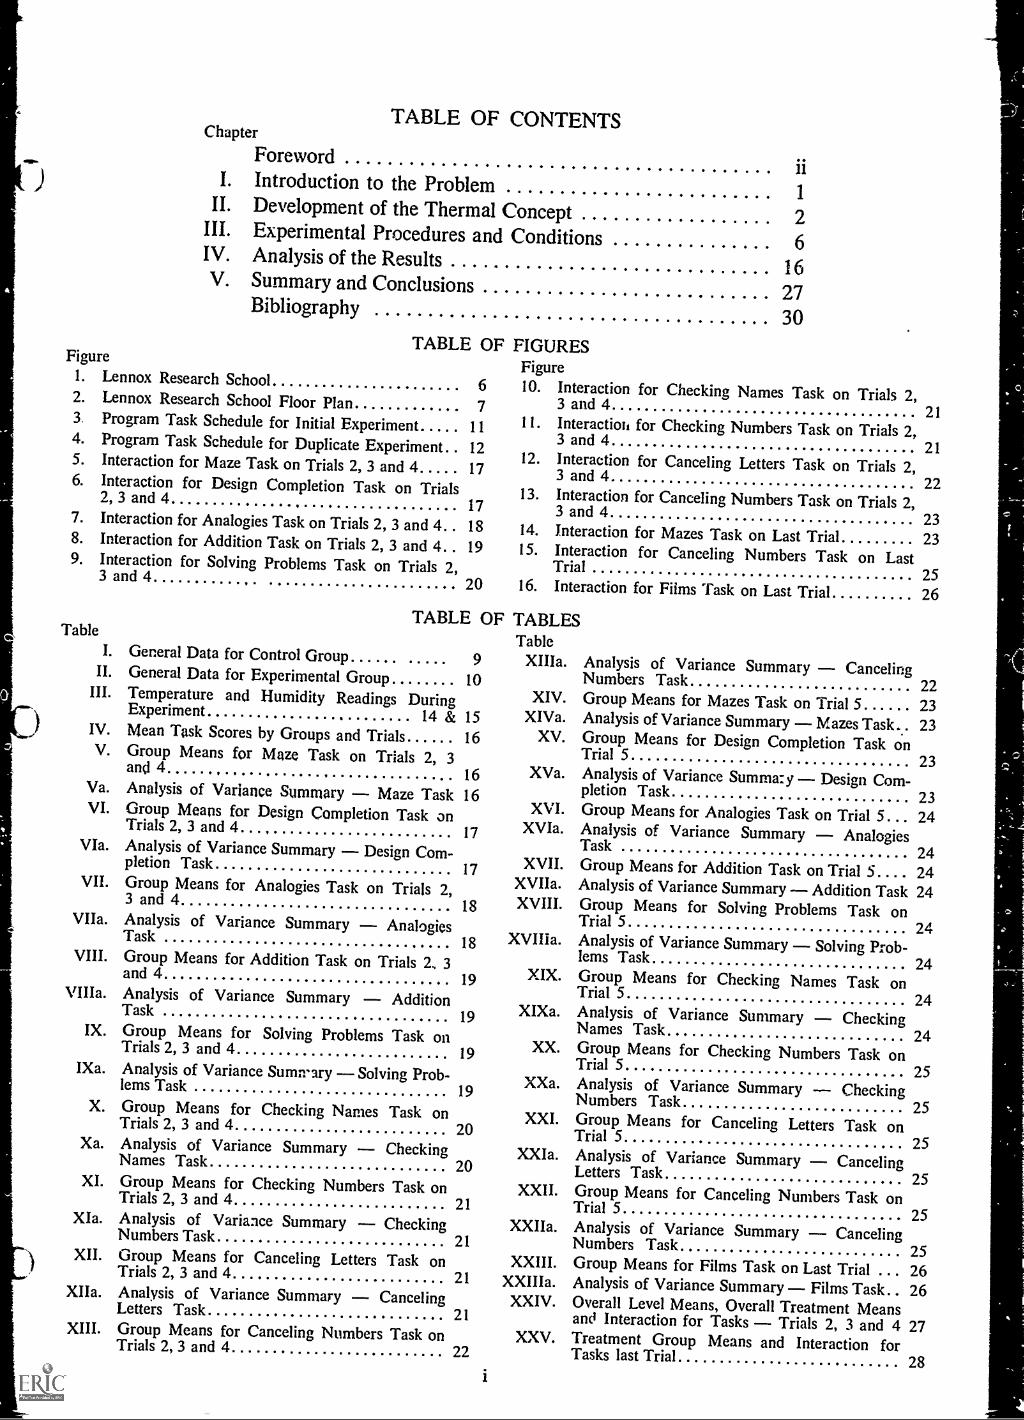
TABLE OF CONTENTSChapter
Forewordii
I. Introduction to the Problem III. Development of the Thermal Concept 2III. Experimental Procedures and Conditions 6IV. Analysis of the Results 16V. Summary and Conclusions 27
Bibliography 30TABLE OF
Figure1. Lennox Research School 62. Lennox Research School Floor Plan 73. Program Task Schedule for Initial Experiment 114. Program Task Schedule for Duplicate Experiment. 125. Interaction for Maze Task on Trials 2, 3 and 4 176. Interaction for Design Completion Task on Trials2, 3 and 4 177. Interaction for Analogies Task on Trials 2, 3 and 4 188. Interaction for Addition Task on Trials 2, 3 and 4 199. Interaction for Solving Problems Task on Trials 2,3 and 4 20
FIGURESFigure10. Interaction for Checking Names Task on Trials 2,3 and 4
2111. Interactioti for Checking Numbers Task on Trials 2,3 and 4
2112. Interaction for Canceling Letters Task on Trials 2,3 and 4 2213. Interaction for Canceling Numbers Task on Trials 2,3 and 4 2314. Interaction for Mazes Task on Last Trial 2315. Interaction for Canceling Numbers Task on Last
Trial 2516. Interaction for Films Task on Last Trial 26
TABLE OF TABLESTable
TableI. General Data for Control Group 9 XIIIa.
II. General Data for Experimental Group 10III. Temperature and Humidity Readings During
Experiment 14 & 15IV. Mean Task Scores by Groups and Trials 16V. Group Means for Maze Task on Trials 2, 3
and 4 ,. 16Va. Analysis of Variance Summary Maze Task 16VI. Group Means for Design Completion Task on
Trials 2, 3 and 4 17VIa. Analysis of Variance Summary Design Com-
pletion Task 17VII. Group Means for Analogies Task on Trials 2,
3 and 4 18VIIa. Analysis of Variance Summary Analogies
Task 18VIII. Group Means for Addition Task on Trials 2., 3
and 4 19VIIIa. Analysis of Variance Summary Addition
Task 19IX. Group Means for Solving Problems Task on
Trials 2, 3 and 4 19IXa. Analysis of Variance Summary Solving Prob-
lems Task 19X. Group Means for Checking Names Task on
Trials 2, 3 and 4 20Xa. Analysis of Variance Summary Checking
Names Task 20XI. Group Means for Checking Numbers Task on
Trials 2, 3 and 4 21XIa. Analysis of Variance Summary Checking
Numbers Task 21XII. Group Means for Canceling Letters Task on
Trials 2, 3 and 4 21XIIa. Analysis of Variance Summary Canceling
Letters Task 21XIII. Group Means for Canceling Numbers Task on
Trials 2, 3 and 4 22
i
Analysis of Variance Summary CancelingNumbers Task 22
XIV. Group Means for Mazes Task on Trial 5 23XIVa. Analysis of Variance Summary Mazes Task 23
XV. Group Means for Design Completion Task onTrial 5 23XVa. Analysis of Variance Summary Design Com-
pletion Task 23XVI. Group Means for Analogies Task on Trial 5 . 24
XVIa. Analysis of Variance Summary AnalogiesTask 24
XVII. Group Means for Addition Task on Trial 5 24XVIIa. Analysis of Variance Summary Addition Task 24XVIII. Group Means for Solving Problems Task on
Trial 5 24XVIlia. Analysis of Variance Summary Solving Prob-lems Task 24
XIX. Group Means for Checking Names Task onTrial 5 24
XIXa. Analysis of Variance Summary CheckingNames Task 24
XX. Group Means for Checking Numbers Task onTrial 5 25XXa. Analysis of Variance Summary Checking
Numbers Task 25XXI. Group Means for Canceling Letters Task onTrial 5 25
XXIa. Analysis of Variance Summary CancelingLetters Task 25
XXII. Group Means for Canceling Numbers Task onTrial 5 25XXIIa. Analysis of Variance Summary Canceling
Numbers Task 25XXIII. Group Means for Films Task on Last Trial 26
XXIIIa. Analysis of Variance Summary Films Task 26XXIV. Overall Level Means, Overall Treatment Means
and Interaction for Tasks Trials 2, 3 and 4 27XXV. Treatment Group Means and Interaction for
Tasks last Trial 28

FOREWORD
This is the report of a first pilot study w hich precedes a se-ries of studies being conducted by the Iowa Center For ResearchIn School Administration and Lennox Industries Inc., Mar-shalltown, Iowa, led to a Ph. D. dissertation. This is a digestof a thesis by Dr. Charles Peccolo (Department of Education,Kansas State University), who served as researcher on thisfirst study These studies are aimed at measuring the effects ofthe thermal conditions (a combination of temperature, hu-midity, and air movement) on the !earning process and onlearning.
In this study and in the next several to follow, no attemptwas made or will be made to establish what the maximum en-vironment should be. We are presently concerned with studyingthe model environment as now established by research and writ-ings, and comparing it with a marginal environment (one inwhich the temperature, humidity and the air movement are allnon-controlled). To establish how "bad" we could make themarginal environment we merely put instruments which meas-ured heat, humidity and air movement in classrooms in theschool building (an old one) from which the children came. Wehad readings from 12 different parts of the classroom every 60seconds. The conditions in the classroom of the home schoolwere such that it was hard to make the conditions in the experi-mental school room as bad.
The ideas fo! this research were developed by staff membersin educational psychology and educational administration at theUniversity of Iowa. The research team approached Lennox In-dustries Inc. with the idea, and the Lennox Industries Inc.agreed to cooperate in every way. Consequently Lennox In-dustries Inc. made available their model laboratory schoolbuilding and all essential school equipment, the services of aresearch engineer, and all necessary standardized instrumentsfor measuring thermal conditions.
Dr. William Eller, an educational psychologist and specialistin reading provided the necessary insights on how to measurelearning, and ways to approach the problem. Dr. Eller is nowProfessor of Education at the University of Buffalo, Buffalo,
Nel,A. York. His part in this study and in the planning of futurestudies has been indispensable.
The Saydel Consolidated School Dist[ ici, P.O. Des Moines,Iowa was then approached by the researchers to determinewhether they would be interested in cooperating in the researchproject. After an initial visit with the superintendent of schools,
ho was quick to see the possibilities, and subsequent visits withthe administrative and teaching staff and the board of education,the Saydel school system joined the research team.
This research project required the cooperation of industry,d public school system, and university researchers. No one ofthese could have conducted this research alone. Special recogni-tion must be given to Mr. Horace Oliver, Superintendent of theSaydel Public Schools, Mr. John Norris, President of LennoxIndustries, Mr. Norman Rutgers, Marketing Manager of Len-nox Industries, and Mr. Frank Nogel and Miss Elsie Grant,principals of the elementary schools involved. Mr. James For-sythe, Guidance Director, gave much aid in helping gather thedata on the children involved when the experimental groupswere selected. The four elementary school teachers, Lillie Elings,Annabelle Lane, Alma Smith and Marjery Fjelde, proved to bereal masters in their profession. With their help the childrenwere enthusiastic and curious participators.
A final word of warning should be offered. While this firstpiece of research shows definite benefits for children in a care-fully controlled thermal environment no one expects schoolboards and superintendents to embark on ambitious programs toair condition schools using this research as the sole basis for do-ing so. When this research is used with other evidence availableit does make a good case for careful attention to thermal condi-tions in school buildings which should be planned at the time ofconstruction or extensive remodeling.
Willard R. Lane - DirectorThe Iowa Center For ResearchIn School Administration
ABBREVIATIONS
F-value Represents a test statistic used to evaluate the statistical significance ofobserved differences. (Not to be confused with Fahrenheit [F]).
S.D. Standard deviation.S Source.df Degrees of freedom.ms Mean square.C Control group in marginal environment.E Experimental group in model environment.
ii
CHAPTER 1 INTRODUCTION TO THE PROBLEM
Throughout the ages the problem of the thermal em iron-ment keeping reasor "bly dry and warm (or cool) has beenclosely related, in the mind of man, with the associated prob-'ems of food and of survival.
The phrase "thermal environment" is a relatil,e1), recent ad-dition to the vocabulary of school administrators and teachers.However, the control of temperature, humidity, air- movement,air cleanliness and cold mall aspects of our enl, ironment whichthew ord "thermal" implies, has long been man's concern. Primi-tive man was not able to control his thermal enironment in anyway so he was forced to adapt himself to the environment. Ourpresent forms of shelter and clothing have evolved from thisadaptation process. After the discovery of fire, man began toprogress in his search for some type of positive control over thevarious elements of his thermal environment (28: 163). Fromthe primitive control of external cold by heating of the air, ther-mal control has evolved through the ingenuity of heating andair-conditioning engineers to creating practically any indoorclimate desired. Air can now be treated so as to control simul-taneously its temperature, humidity, movement and cleanliness,and be distributed within a building in such a manner that thecomfort, health, and efficiency of its occupants are kept at anoptimum level.
The ProblemControl of the thermal environment has now reached an ad-
vanced stage. But to what extent are the thermal conditions be-ing controlled in the classroom? What are the optimum thermalconditions needed for various kinds of learning? Is a certaintype of environment more suitable to performance in skill sub-jects and yet another for memorization of facts? Are the es-tablished standards of comfort based on adult norms and uti-lized in classrooms the same for children and adults? Do publicschool educators recognize the many factors involved in deter-mining and maintaining an adequate thermal environment?This study was an attempt to learn more about the area sug-gested by the previous questions.
More specifically the primary consideration of this studywas to test the following hypothesis:
H: There is no difference in learning under recommendedmodel conditions and marginal thermal conditions.
Historical Background and NeedAlthough it is true that there is no specific scientific research
which establishes a definite relationship between learning andthermal environment, architects, physiologists, engineers andsome educators have issued and written many positive state-ments concerning this relationship. They have probably takentheir leads from the research findings of industry and business.The following paragraphs will illustrate the confident nature ofthe writings in the field of thermal environment.
In 1838, Samuel Lewis, the first State Superintendent of theCommon Schools of Ohio, wrote on the need for proper venti-lation by stating, ". . If the house is dark and ill ventilated, thechildren may be expected to be dull, and careless and disorderlyand perhaps unhealthy." (10)
Harmon (16) noted that for optimum learning and develop-ment the energy organizations (light, sound, and heat) of theclassroom must be brought into a pattern which is in keepingwith the possible realization of the full potentialities of childrenduring the school phase of their development.
Four years later Harmon stated in very strong terms.The heating and ventilation standards are largely concerned
1
ith keeping the child arm and comfortable with the un-derlying concepts of warmth ,end comfort derived from datasecured by stud} ing resting adults and the underlying con-cepts of education taken from the formal programs of theschool of yesterday which looked upon learning as a passiveabsorption process (5:2).Follom ing the same him of thinking, Dean F. Smiley (23:18)
in a group-session report to the American Association of SchoolAdministrators reported that teachers teach better and pupilslearn better if they are provided with an atmospheric environ-ment in m hich they can throw off their heat at a normal rate.Fatigue and nervous tension of both teachers and pupils are re-duced by a pleasantly cool atmosphere.
There has been much written on the subject of thermal en-vironment. The following excerpt from the Nation's Schoolssummarizes the bona fide research which will identify the ther-mal conditions conducive to learning:
. . . As yet little quantitative research has been done on theeffect of changes in temperature and ventilation air on thechild's alertness, attentiveness or comprehension. In recentyears a growing body of statistical evidence indicates thattemperature control, ventilation and other environmentalfactors materially affect the productivity, turnover, absen-teeism and morale of office and industrial workers. . . .
Most school administrators and custodians have attemptedto cope with the individual temperature preferences of teachers.Most are aware of the widely differing temperature require-ments of active basketball players and their sedentary fans. Afew are conscious of the surprising influence of difficult mentaltasks on body temperature, particularly among elementarychildren... .
Such empirical evidence indicates some relationship be-tween temperature and learning. But the school administratorrequires more positive and objective criteria on which to baserecommendations for expenditures on thermal control.
Dr. Herrington holds that two aspects of thermal environ-ment have not been recognized adequately. These are the rela-tion of temperature and posture, and the effect of unfavorablethermal environments on the accuracy of human performance.He writes,
"Even though the deviation from an ideal atmosphere isslight, if the tasks at hand or the pursuit of the interests andactivities desired do not permit an adjustment of activity orposture consonant with the subtle change of postural tonewhich is thermally determined, the individual experiencesdistraction and a subjective sense of effort which is unpleas-ant and fatiguing."
Granted that temperature has a measurable influence on ef-ficiency and safety in various physical and mental tasks, onemight well ask what specific temperature is best for the class-room or for any other school situation. . . .
While relatively little valid quantitative research has beendone on the relationship of thermal environment to learning,the preponderance of available data on efficiency, safety andabsenteeism in offices and industry leads to the conclusion thathuman performance falls off rapidly at temperatures above andbelow a relatively narrow comfort zone. . . .
Body cooling, through convection, evaporation and radia-tion, is the primary problem of human comfort. In fact, cooling,rather than heating, is the primary problem in all classroomheating, ventilating and air conditioning. (26: 86-90)
CHAPTER II DEVELOPMENT OF THE THERMAL CONCEPTA Review of Literature
Even though man has long recognized the effect of the at-mosphere upon human health, comfort, and efficiency, it wasonly in the latter half of the eighteenth century that the first sci-entific theory, the carbon dioxide theory, was advanced to ex-plain why such an influence existed. Since that time two othertheories, the organic effluvia theory and the thermal concept ofventilation, have been given as explanations. (20: 1) These ex-planations have centered around the changes which Winslowand Herrington have shown to occur in a poorly ventilatedspace as a result of human occupancy: (1) a reduction in theoxygen content of the air; (2) an increase in the carbon dioxidecontent of the air; (3) an increase in the amount of partiallyoxidized organic matter to be found in the air; (4) an increasein the air temperature due to heat liberation of the human body;and (5) an increase in the humidity of the air caused by themoisture given off by the body. (28: 166-167)
Carbon Dioxide TheoryEarly physiologists believed that a decrease in the oxygen
supply in an inadequately ventilated room led to sensations ofdiscomfort until the French chemist, Lavoisier, in 1777, pre-sented the view that the presence of carbon dioxide, rather thanthe lack of oxygen, was the chief factor which led to deleteriouseffects. Claude Bernard in 1857 and Lewes in 1860 substanti-ated Lavoisier's views. The conclusion reached by these scien-tists was based on their observation of animals which were con-fined within a small enclosed area.
The carbon dioxide theory of ventilation was proven falseby Pettenkofer, a nineteenth century experimental hygienist, ashe demonstrated that the increase of carbon dioxide even in theworst ventilated room was not enough to bring about the toxicresults which had been observed. Harmful physiological effectsdue either to an oxygen decrease or a carbon dioxide increasewere found to be impossible in the worst ventilated rooms be-cause the oxygen content was not found to decrease below 20%of the total content and the carbon dioxide content was notfound to increase above 0.5% of the total content. These limitsare much more conservative than those which have producedharmful physiological effects. (28: 167-168)
Organic Effluvia TheoryNot only did Pettenkofer help disprove the carbon dioxide
theory but, in 1863, he advanced the belief that the harmful et-fects of poor ventilation were due to the presence of organiceffluvia given off by the rungs and surfaces of the body. Theorganic substances which Pettenkofer maintained were respon-sible for harmful physiological effects were not easily identified.Thus Pettenkofer's theory, which was supported by the Frenchphysiologist, Brown Sequard, was not easily substantiated orrejected. Although Pettenkofer did not believe the presence ofcarbon dioxide in the air to be an important factor in poor ven-tilation, he proposed that carbon dioxide be utilized as an indexto measure the unknown poisons, because the poisons and car-bon dioxide were both waste products of the body and would beexpected to vary together in amount produced. On the basis ofthe fact that the human individual produces about .06 cubicfeet of carbon dioxide per hour, and that normal outdoor aircontains 0.03% of carbon dioxide, advocates of the organic ef-fluvia theory assumed that 0.06% of carbon dioxide in the at-mosphere represented a permissible maximum figure. Thus, bydividing 0.6 cubic foot by .0006-.0003 (or .0003) the figureof 2000 cubic feet of air per person per hour was obtained as adesirable figure. Roughly, this corresponds to 30 cfm per personand on the equally unsound assumption that ventilation couldnot be effected without undesirable drafts at a rate above threeair changes per hour (standards of minimum space allowancesper person were found by dividing 2000 by three). A minimumoutside air figure as well as a minimum space allowance perperson for schools and other crowded places of assembly be-:ame the object of legislation in many states in the country.Some states still have laws based on the thirty cubic feet formula
hich 'was intended to rid enclosed areas of volatile substancesemanating from human bodies. 28: 168-169)
Several proponents of the organic effluvia theory discussedand investigated their theory for several years, but none wereever able to prove that human beings emit any organic poisonsinto the air. Even though the theory was discredited, Winslowand Herrington reported that the resulting "well-meant but mis-guided standards cost millions of dollars in the aggregate andgreatly retarded the development of adequate and efficient meth-ods of air conditioning." (28: 169) Meredith also stated that"as relics of that generation, we still have a few fresh air fiendswho believe they should live in a gale." ( 17: 551)
Thermal Concept of VentilationDoubt of the validity of the theory of organic effluvia was
confirmed by Hermans of Amsterdam in 1883 when he was ableto demonstrate that the air of a chamber containing only 15%of oxygen and as much as 2 to 4% of carbon dioxide was nottoxic, and the ill effects experienced in crowded, inadequatelyventilated rooms were not due to any chemical poisons but toheat and humidity. This new theory was accepted very slowly.(28: 169)
The thermal concept of ventilation received a great impetusfrom Flugge at Breslau in 1905 when he and his pupils per-formed the following experiments:
1. A subject was kept in a poorly ventilated room until thecarbon dioxide content of the air became quite high andsymptoms of discomfort became very great. Fresh, outsideair was then piped to the subject's nostrils so that he wasbreathing fresh air while being surrounded by bad air.There was no relief from the symptoms of discomfort.Neither did any relief come when air of the same tempera-ture and humidity as the room air, but with the correctamount of oxygen and carbon dioxide, was allowed to enterthe room. Immediate relief came when an electric fan wasstarted in the "bad air." (17)2. Air with a low oxygen and high carbon dioxide contentbut of low temperature and low humidity was blown into aroom containing foul air. The uncomfortable subject im-mediately began to experience greater comfort even thoughthe oxygen and carbon dioxide content remained the same.Flugg, concluded that cool, dry, moving air was neededrather than air containing an increased amount of oxygenand a decreased amount of carbon dioxide. He also con-cluded that the subject needed the air around his body. (17)3. A subject was placed in a chamber with a content of1.1% carbon dioxide, a temperature of 86F, and a relativehumidity of 87%. Symptoms of discomfort were recordedand these symptoms were not relieved by breathing freshair from outside the chamber through a tube. Complete re-lief came when the chamber was cooled to 63F, althoughthe carbon dioxide content had risen to 1.6%. (28)4. As a final experiment, the subject was taken into freshair and asked to breathe bad air with a low oxygen and highcarbon dioxide content through a tube. As long as the sub-ject's body was in good air, he was able to breathe the airwhich contained a low percentage of oxygen and a high per-centage of carbon dioxide without any ill effects. (17)Flugge's work was soon confirmed by Haldane and his asso-
ciates in England; by Benedict in the United States; and by theNew York Commission on Ventilation. (17)
Winslow and Herrington state that the following conclusionsreached 30 years before by Flugge and his associates have beenproved correct. (28)
1. Chemical changes in the air produced by any type ofgaseous excreta of human beings do not exercise any dele-terious effect on the health of the occupants of the space in-volved. This is true for both normal and diseased subjects.2. When detrimental health conditions such as fatigue,headache, dizziness, and nausea are observed in closed or
crowded rooms, these conditions are to be attributed en-tirely to inadequate heat loss.3. The thermal properties of our atmospheric environmenttemperature, moisture, air movementare of far greatersignificance for our well-being than the chemical propertiesof the air.As a result of the establishment of the thermal theory of
ventilation, the New York Commission on Ventilation statedthat "the major objective of ventilation, is, therefore, to removethe excess of heat given off by the human body to maintain anatmosphere which will be comfortably cool but not too cold."(20)
The Human Body as a Heat Producing MachineComparison of the human body with a machine is an anal-
ogy that is hard for some people to accept. Although the humanbody is extremely complex, it is subject to some of the samelaws that govern the operation of simple machines. Significantprogress in the field of physiology did not come until scientitstswere able to recognize that complete combustion of foodstuffin a bomb calorimeter and in the human body produced thesame amount of heat. (28) This simple analogy assumes a roleof importance in dealing with the complete picture of thermalcontrol.
ROLE OF METABOLISMThe physiological process called "metabolism" provides for
the energy needs of the body by the combustion of foods. Allmovement of living organisms along with the growth and repairof the various tissues require energy. Food is converted intoenergy in very much the same manner as fuel is burned in a ma-chine. Like other forms of combustion, the process of metabo-lism liberates the energy contained in food, thus permittingwork to be done and heat to be produced. There is a quantita-tive relationship between the intake of fLel, or food, and oxy-gen on the one hand and work done and heat liberated on theother. The human body is slightly more efficient than the steamengine by comparison, being able to convert 20% of the energyvalue of food into physical work as compared with 14% effici-ency for the steam engine. (28)
In discussing the effects of various factors upon flu. metabo-lism rate for an individual, Best and Taylor (4: 611) enumer-ated the following physiological conditions which stimulatemetabolism: (1) muscular work, (2) food, (3) a rise in bodytemperature, or (4) a fall in environmental temperature. Theythen go on to list the seven physiological conditions which in-fluence the basal metabolic rate: (1) age and sex; (2) race andclimate; (3) habits; (4) pregnancy; (5) diet; (6) variations inbarometric pressures; (7) chemical substances. (4)
The physiological concept of heat production is of greatconcern to engineers who plan heating and ventilating systemsfor classroom use. The engineer must convert human heat pro-duction into a term which is compatible with his heat measure-ments. For such a measurement engineers use the term, BritishThermal Unit (Btu). One Btu is roughly equivalent to theamount of heat released in burning a kitchen match.
It is interesting to note that the average sedentary adult oractive school child generates as much heat as a 100 watt elec-tric light bulb. Expressed in terms of Btu's a school child willproduce from 260 to 560 Btuh (Btu per hour) during normalclassr000m activities, depending on age, sex and the specificactivity. Simple arithmetic enables one to estimate the heatproduction of 25 to 30 school children. A teacher walkingslowly will dissipate from 400 to 500 Btuh's. Light factorywork will raise the Btu output to around 750 Btuh and heavierfactory work will cause a heat production of 1,000 to 1,450Btuh. (26)
Body TemperatureThe normal temperature of a healthy human body as de-
termined by placing a thermometer in the mouth is around98.6F. This reading refers to the temperature of the interiorof the body as most skin temperatures are lower than 98.6F.The 98.6F figure represents a mean figure as there is a slightvariation from this reading in the body temperature of somepeople and measurement proves that variations also occur in
the same individual throughout the day. Kleitman (12) hasdemonstrated that man's bodily temperature regularly goes upand down each day on a fairly smooth, wave-like curve, with apeak or plateau in the middle of the waking period and a mini-mum at night during sleep.
From the discussion of metabolism the conclusion might bedrawn that the body is capable of overheating itself. However,the body is also capable of cooling itself in such a way that acompensating effect for the overheating may be reached.
A large per cent of the body heat is lost through the skin,while most of the remainder is given off through the lungs.Specifically, heat is lost from the body through: (1) radiation,convection and conduction; (2) evaporation of water fromthe lungs and skin; (3) raising the inspired air to body tem-perature, and (4) urine and feces. (21: 720)
The means of losing heat from the body mentioned in thepreceding paragraph can become effective only if three heatregulating functions of the body are Yunctioning to bring heatto the skin's surface. These functions are : (1) vaso-motion inthe skin; (2) sweat secretion; and (3) respiration. (21: 721-725)
Elements of the Thermal EnvironmentThe Housing Commission of the Health Organization o!. the
League of Nations (11:505) and the National Council orSchool , House Construction (19:170) urged that, in carefulstudies of thermal influences upon the body, a knowledge of thefour factors of air temperature, air movement, relative humidityand mean radiant temperature is needed.
Winslow and Herrington stated that ideal thermal comfortis experienced when three conditions are maintained: A skintemperature of 91.5P: a minimum heat change in the body tis-sues; and a minimum evaporative rate. (28) The following dis-cussion of the thermal factors that are partially responsibleeither for the presence or absence of these conditions is con-sidered essential to a better understanding of the subject.AIR TEMPERATURE
Because body functions produce from 250 Btuh at rest toover 1200 Btuh at hard physical labor, the temperature of theair must be such that these quantities of heat may be lost to thesurroundings if body temperature is to remain constant. Thisfact probably prompted the British physiologist, Thomas Bed-ford, to state, "A room should be as cool as is compatible withcomfort." (3: 127)
Even though all factors are interwoven, the effect of airtemperature on human activity is perhaps the most importantsingle thermal factor. The importance of air temperature wasstressed by Dr. Herrington when he declared, "Ambient tem-perature alone has been found to have a large effect on the pre-cision of skilled muscular tasks as well as the execution of prac-ticed logic." (9: 64)
American dress customs are somewhat standardized; how-ever, the fact remains that different people dress differently. Be-cause of dress differences, differences in metabolic rates, andreactions of different people to various air temperatures, thesedifferences occur. There are sometimes differences of opinionamong the occupants of a room concerning desirable tempera-tures. (30: 72) In a classroom this situation is complicated be-cause older people generally prefer warmer rooms, thus oftencreating an overheated situation for the children.
Taking the above factors into consideration, one might safe-ly say that optimum air temperatures, or any other thermalfactor, depend upon the activity experienced in a given space.MEAN RADIANT TEMPERATURE
Every classroom has two temperaturesthe air temperature,and the mean temperature of the surrounding surfaces and ob-jects in proportion to the position in which they are located inreference to the body's surface. If excessive air movement isabsent, air temperature and mean radiant temperature havenearly the same effect on comfort. (2: 66) The 1959 Heating,Ventilating, Air Conditioning Guide points out that differentauthorities give 0.3 to 1 degree increase of room temperatureto compensate for one degree depression of the mean radianttemperature. (2) This would indicate that for every degree the
radiant temperature is raised or lowered above or below the airtemperature, an opposite air temperature adjustment must bemade to produce equal sensations of comfort.
RELATIVE HUMIDITYBoth extremes of relative humidity of the air are capable
of influencing comfort. Since people lose about one pound ofmoisture per hour by perspiration while at rest and much morewhile engaged in strenuous activities, skin clamminess must beprevented by evaporation to air dry enough to pick up the mois-ture rapidly, but not so rapidly that the skin, nostrils, and lipsre left dry.
Henry Wright (31: 209) and Winslow and Herrington(29: 187-188) are among those who dispute the importance ofrelative humidity on the comfort of the heated rooms in thewintertime. The three agree that relative humidity has a greatinfluence on comfort in hot, humid atmospheres but stated thatthe influence is practically non-existent at otherwise favorabletemperature conditions. Wright stated: "The humidity problemis actually physical rather than physiological, and a matter ofprotecting the building more than one of protecting the pupils.-(31: 209) Despite the minimum influence of humidity at com-fortable temperature levels, an optimum relative humidity rangedoes seem to exist.
AIR MOVEMENTMost heating and ventilating authorities are in agreement
that some air movement is needed in the classroom. Herringtonattached more importance to air movement than to relative hu-midity and considered air movement an important factor incomparing radiant and convective heating systems. (8: 372)
Herrick pointed out that air movement is necessary by stat-ing:
The human body will not be comfortable in a pool of stag-nant air. Air movement will prevent pockets of excessive hu-midity, equalize temperature throughout a given space, andremove odors and stale air. (7: 442)Under most classroom conditions, air in the classroom is in
motion. Reasons for air motion include natural differences intemperature, infiltration, ventilation, motion of people, andthe heating and cooling systems.
OTHER FACTORSSome other factors that may influence the thermal environ-
ment of the classroom are: (a) microclimatology, (b) solarcontrol, fenestration, illumination, and insulation, and (c) class-room size, occupancy, and socio-economic status of the occu-pants. (26: 91)
Effects of an InadequateThermal Environment
The New York Commission on Ventilation in studies onheating and ventilation found that overheating was responsiblefor two physiological ills. Extreme overheating was found toincrease body temperature, pulse rate, respiration and metabo-lism. A room temperature as low as 75F with 50% relative hu-midity and no air movement was found to cause a definite in-crease in body temperature and pulse rate. The second ill, ananemic condition of the nasal mucosa which makes it highlyreceptive to microbic infection, was shown to be caused by ex-posure to high temperature followed by exposure to chill.(20: 43-45)
McConnell and Yaglou (15: 167) reported experimentsdone in Pittsburg in which effective temperature was varied.The increase in pulse rate almost doubled as the effective tem-perature rose from 60F to 80F and total work in foot poundsdecreased almost 10%. Above 85F effective temperature theheart rate increased and total work in foot pounds decreasedrapidly.
Dr. Frances Ilg, of the Gesell Institute of Child Develop-ment, has observed the instability of internal temperature ofchildren in first grade (ages 51/2 to 6) and in the sixth grade(about 11). Dr. fig says:
Everything is rapidly shifting, blowing hot and cold, ex-pressing extremes. In the first grade you can observe this
with the sudden pulling off of sweaters especially with thegirls during an arithmetic period. I have known their bodytemperature to rise to 102F during the intense intellectualdemands of the arithmetic process. . . . (16:190)Benedict and Talbot (8:369) compared the basal metabolic
rate of children from kindergarten through high school withthat of adults who were present in the same environment. Theyfound a wide range of resting heat production in school popula-tions; this justifies some research on the regulation of heatingsystems They found that the livelier activity of the kindergartenchild at 67F produces the same sensory and physiological effectfor the child as does 75F for the older person. They maintainthat while this is an extreme comparison it is rare indeed thatthe comfort levels of the student and the teacher are not sep-arated by at least 5F.
Kugelmass, (5: 31) working with the caloric requirementsof children and adults, maintains that in a thermal environmentregulated for adults not only is the child more subject to er-ratic chemical body temperature control because of the imma-turity and imperfection of his regulatory mechanisms, but by vir-tue of his proportionately smaller mass area, he is denied theopportunity to lose a corresponding amount of heat throughskin surface channels.
Kleitman (13: 211-234) maintains that rapport with schooltasks goes up as the internal temperature goes up above the av-erage but within the daily differences range. The converse isalso true.
Discomfort and health deficiencies due to an inadequatethermal environment are accompanied by a loss in work effi-ciency. Considerable data regarding accidents and errors inheavy manual work, light assembly work and complex mentaltasks are available. So many of the data relate to mine workersand textile workers that they are not elaborated upon herein.
Research (3: 11-15) has shown that heavy tasks such ascoal mining are done most efficiently in situations where thetemperature is held around 60F and that accidents increase twoto three fold when the temperature approaches 80F.
Light assembly work seems to be more void of accidents at67F while accidents increase both above and below that point.Accidents seem to be related to the involuntary postural con-ditions created both at the higher and lower temperature levels.
Most research in connection with skilled work or complexmental tasks has been done with wireless code reception, typingand office work. Most of these data are in terms of effectivetemperature readings, readings which take into considerationboth dry and wet bulb headings. All data show that errors in-crease as temperature stress increases.RELATED STUDIES
A great amount of work has been done in the productionof literature relating to the thermal environment. A large por-tion of the literature is filled with individual opinions, however,and there seems to be a lack of agreement among workers in thevarious fields which have an interest in control of the thermalenvironment.
Some research has been done regarding the influence of theclassroom environment on learning, but that research has quiteoften been characterized by the use of adult-aged subjects withthe data obtained being applied to children of school age. At thepresent time many manufacturers of heating and ventilatingequipment are conducting experimental studies concerned withthe effects of various types of heating and ventilating equipmenton the classroom environment.
One of the first organizations in the United States to conductstudies in the area of classroom thermal control was the NewYork Commission on Ventilation. (20: V-VI)
The experimental work was conducted between 1913 and1917 but was not published until 1923. Two types of studieswere conducted during this period with one type involvingstudies of physiological and psychological reactions to variousatmospheric conditions, which were produced in the experi-mental chambers at the City College and the other type involv-ing observation of the effect of various atmospheric conditionson school children in actual classroom situations.4
Some of the results of the City College stt ..lies were:i The conclusion that overheating is the primary factor inbad ventilation was confirmed.2. With a given thermal condition, the presence of chemicalvitiation produced no physiological or psychological reac-tion except a slight decrease in physical work and in appetite.3. Overheating produced (a) fundamental physiologicalchanges, (b) marked decrease in physical work performedand (c) abnormal reactions to the mucous membranes ofthe nose and throat which interfered with their adaptationto outdoor atmospheres.4. High moisture content aggravated the effect of high at-mospheric temperatures, but low humidities had no notice-able influence and could not be subjectively detected by thesubject exposed to them. (20: 16-17)The studies conducted in actual classroom situations pro-
duced the following conclusions:1. The ventilation of classrooms by windows alone wasfound to be highly unsatisfactory.2. A system of window-gravity ventilation with air admittedover slanted window boards and tempered by radiation be-low the windows and with gravity exhaust ducts fot remov-ing vitiated air from near the ceiling proved highly satisfac-tory.3. The conditions necessary for satisfactory utilization ofthe window-gravity system of ventila were consideredto be as follows:
a) Radiators should be located beneath the windowsand should extend the full width of the windows.
b) Deflecting boards should be placed at the bottom ofthe windows which open from the bottom.
c) Two window shades should he attached to each win-dow frame, one to be pulled upward and the other down-ward.
d) Exhaust ducts should be placed on the wall oppositethe windows.
e) Classrooms should not be overcrowded.f) A large thermometer with 63F clearly marked should
be displayed in a prominent position on the teacher's desk.4. Careful observations in the classroom showed no differ-ence whatever in the health, physical condition, or mentalperformance of pupils in unhumidified as compared withhumidified rooms.5. Recirculation of classroom air had no harmful effectupon the health of the pupils, but elimination of objection-able odors was difficult.6. The choice for suitable school ventilation method to bebetween plenum ventilation and window gravity ventilation.The atmosphere, as measured by subjective impressions,was more agreeable in a room ventilated by the window-gravity system. Respiratory illnesses were also less pro-nounced in rooms employing window-gravity ventilation.(20: 17-22)
5
During the years 1926 to 1929, the Commission investi-gated, under actual classroom conditions, school ventilation, re-lation of atmospheric temperature to health and efficiency, andthe hygienic values of various systems of school ventilation.Some of the conclus:ons derived from the latter series of studieswere:
1. The major objective of classroom ventilation is the pro-vision of such atmospheric conditions as will facilitate theelimination of heat from the body surface without the pro-duction of objectionable drafts. An objective of a minor na-ture should be the elimination of unwanted body odors bysufficient air change.2. Comfort, efficiency, and resistance against disease aresustained by avoiding overheating.3. Desirable thermal conditions may be obtained by (a)plenum ventilation, (b) by local unit ventilation or (3)window-gravity ventilation with window-gravity ventilationfound to be the most comfortable and economical.4. The physiological effects of radiation and convection ofheat and of ertical variation in temperature need furtherinvestigation.5. Laws requiring a supply of thirty cubic feet of air perminute per pupil have no justification and should be re-placed by laws which outl;ne the major objective of schoolventilation. (20: 65-67)In 1957, Shupp (22) set up a proposed study on the effects
of airconditioning on classroom learning activities. Shupp wasconcerned primarily with reviewing related literature and out-lining a plan for actually determining the effects of air-condi-tioning on learning. After reviewing related literature, Shuppset up a study which included the description of the equipmentneeded, the method of selecting subjects, the selection of schooltasks, the method, and the testing procedure to be utilized in thestudy. The proposed study has never been carried out.
Mincy (18) studied the factors involved in establishing asatisfactory thermal environment in the classroom and con-cluded that although control of humidity and air movement isessential, the control of air temperature is the critical issue inmaintaining an optimum thermal environment.
The purpose of a Texas study by Captain Nolan (21) wasto determine the effect of temperature on learning. He con-cluded that the physical discomfort resulting from high tem-perature conditions does have an adverse influence on academiclearning.
A three year project by the Pinellas County School System(25) in Florida in cooperation with the United States Office ofEducation entitled "An Evaluation of Climate Control As aContributing Factor To an Effective Education Program," isnow underway. One of the phases of this project is a comparisonof gains in achievement in mathematics, science, social studiesand language arts during the 1961 summer session and the1961-62 academic year.
CHAPTER III EXPERIMENTAL PROCEDURES AND CONDITIONSThe object of this research was to investigate the effect of
therms' environment upon mental efficiency and learning. Forthis purpose the subjects used were tested in various functionsunder two contrasting thermal environments which differed intemperature, humidity and air movement.
The evidence from the research literature and from thewriter's experieme suggested the desirability of a rigorouslycontrolled human experiment to determine the effect of tem-perature, humidity and air movement upon learning ability.While it is recognized that other physical factors in the schoolclassroom environment play a part in affecting learning ability,it seemed wise to put this experiment upon as specific a basisas possible by confining the inquiry to the thermal environmentfactors.
It was desirable to have elementary school students as sub-jects (students in the fourth grade) because they are old enoughto accept responsibility and follow directions. Yet they areyoung enough that they are not sufficiently concerned with thethermal conditions to want to alter them. It was necessary tosecure the cooperation of a school district with a large enoughstudent population. It was held desirable to have subjectsmatched in as many respects as possible.
During the period of the experiment the two groups wouldreceive exactly the same treatment, perform the same tasks atthe same time of day, with the exception that one group wouldbe occupying a classroom with a model thermal environment
and the other group a classroom with a marginal thermal en-vironment. To equate motivational factors among the childrenno child would know whether he would occupy the classroomwith the model or marginal thermal environment. During theinquiry the children of both groups would receive the same pe-riodic training in a number of different tasks. A comparisoncould then be made between t'ef amount of improvement shownby the control group of children who were exposed to the margi-nal thermal environment and by the experimental group in themodel thermal environment.
Selection of Schools and StudentsFor the purpose of carrying out the proposed plan the in-
vestigators were fortunate in securing the cooperation of theLennox Industries, Inc., and the Saydel School District in DesMoines, Iowa.
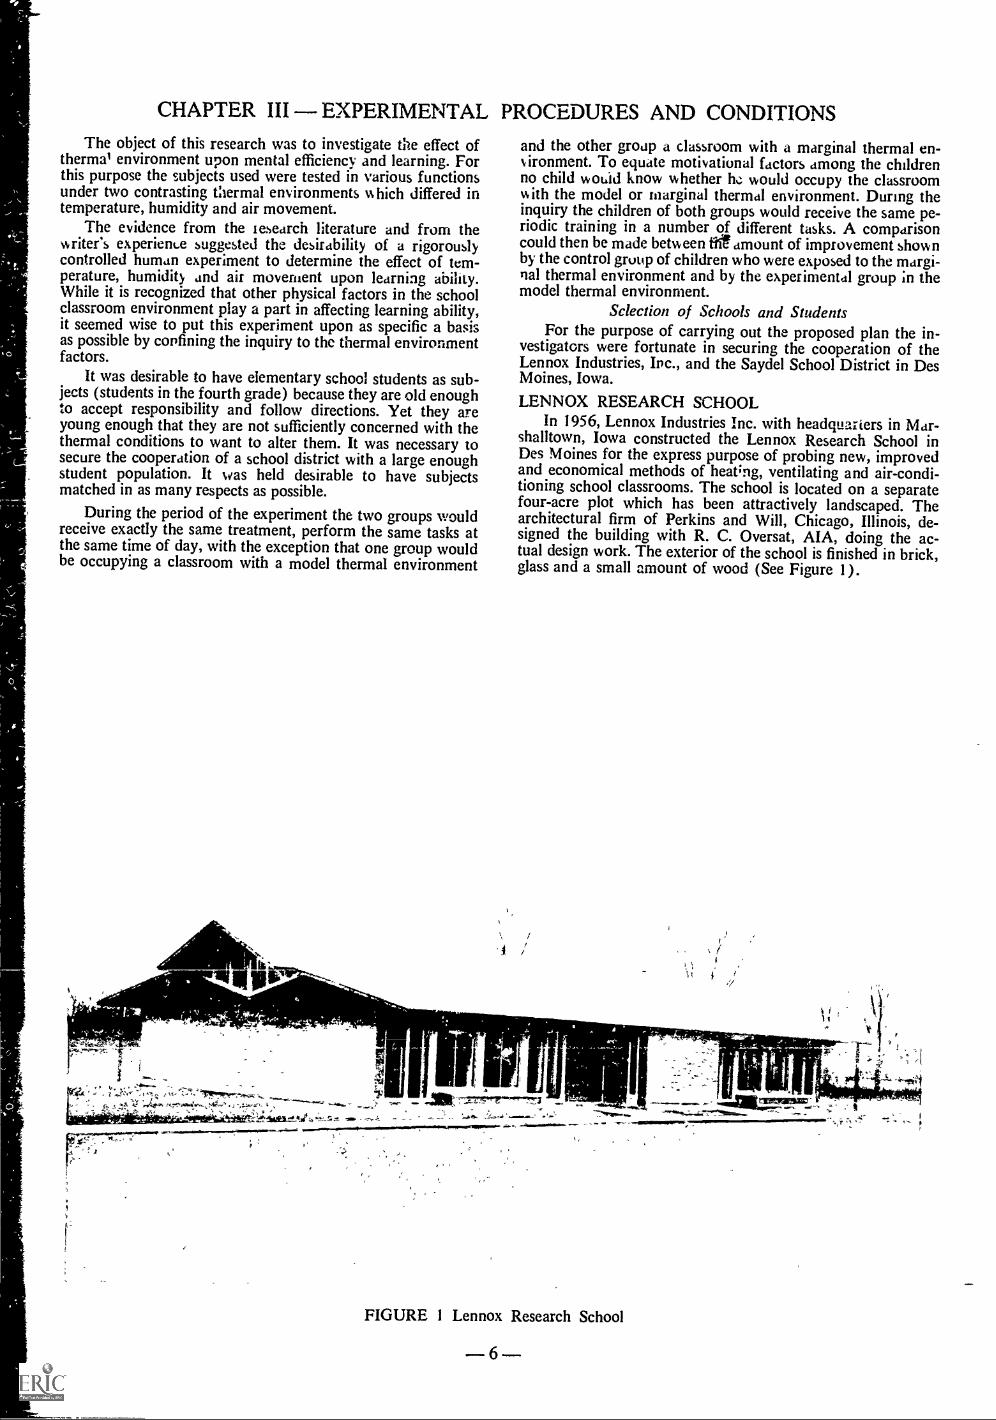
LENNOX RESEARCH SCHOOLIn 1956, Lennox Industries Inc. with headquarters in Mar-
shalltown, Iowa constructed the Lennox Research School inDes Moines for the express purpose of probing new, improvedand economical methods of heat;ng, ventilating and air-condi-tioning school classrooms. The school is located on a separatefour-acre plot which has been attractively landscaped. Thearchitectural firm of Perkins and Will, Chicago, Illinois, de-signed the building with R. C. Oversat, AIA, doing the ac-tual design work. The exterior of the school is finished in brick,glass and a small amount of wood (See Figure 1).
^ ,tae,s,- 7 - _ _ .
FIGURE 1 Lennox Research School
-6-
One classroom was designed for elementary grade childrenand the other for junior high school children. The complete two-classroom proj_ct was intended to represent typical classroomconstruction and be within the budget of the average schooldistrict. The school was designed to represent two typical class-rooms and not to portray a perfect design.
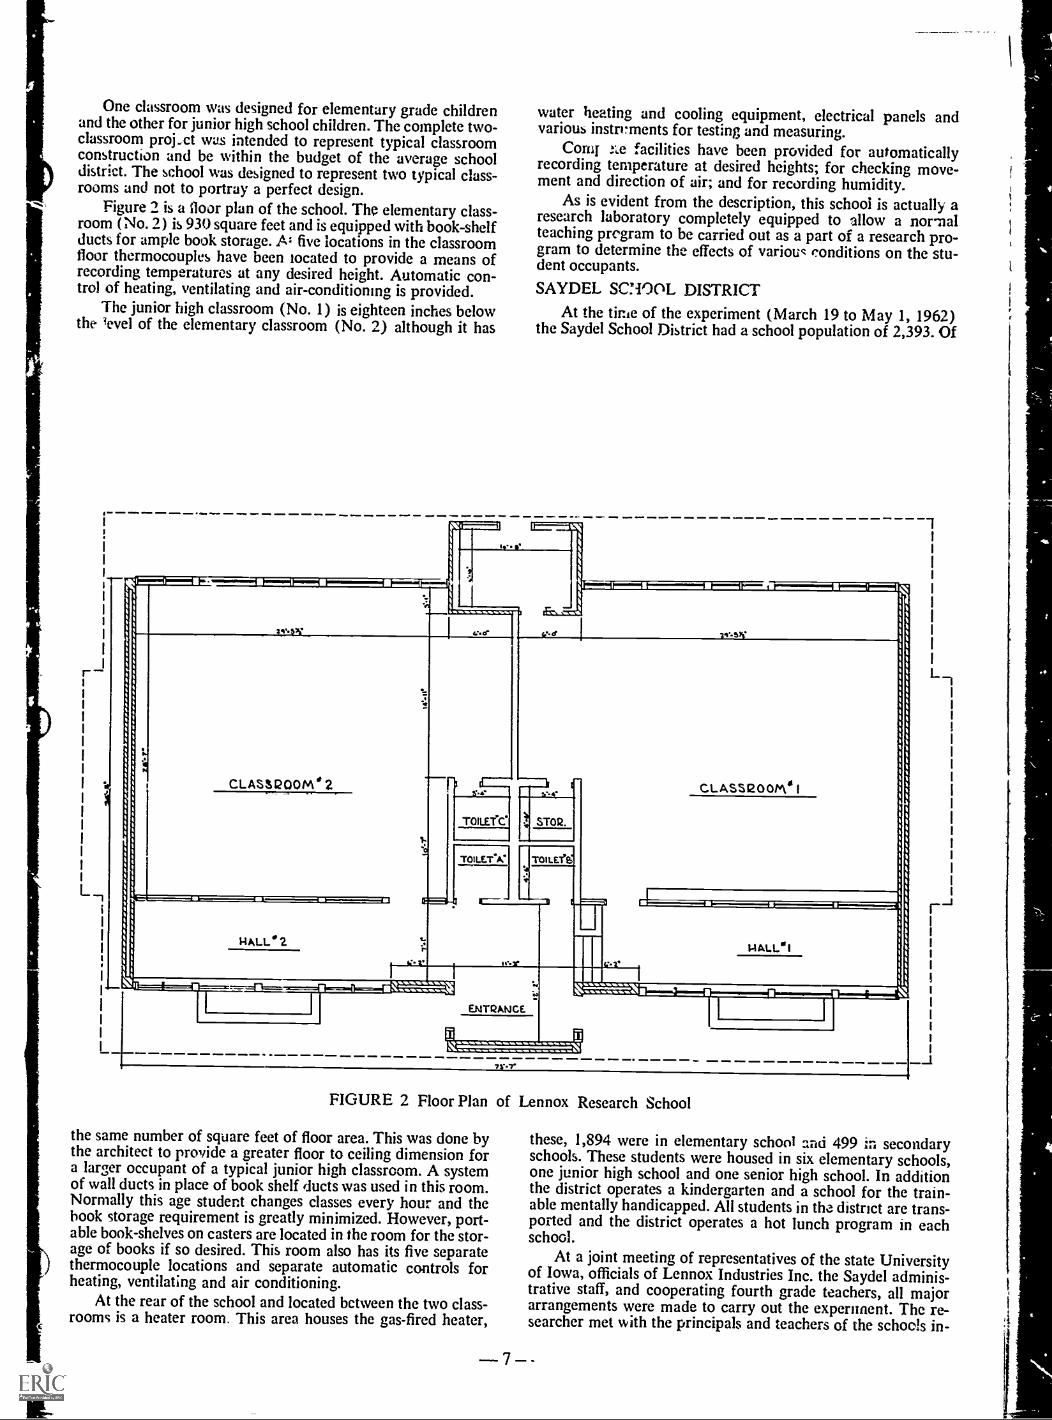
Figure 2 is a floor plan of the school. The elementary class-room (No. 2) is 930 square feet and is equipped with book-shelfducts for ample book storage. Al five locations in the classroomfloor thermocouples have been located to provide a means ofrecording temperatures at any desired height. Automatic con-trol of heating, ventilating and air-conditioning is provided.
The junior high classroom (No. 1) is eighteen inches belowthe level of the elementary classroom (No. 2) although it has
r
L.
water heating and cooling equipment, electrical panels andvarious instrrments for testing and measuring.
Com facilities have been provided for automaticallyrecording temperature at desired heights; for checking move-ment and direction of air; and for recording humidity.
As is evident from the description, this school is actually aresearch laboratory completely equipped to allow a normalteaching program to be carried out as a part of a research pro-gram to determine the effects of various conditions on the stu-dent occupants.
SAYDEL SCNOOL DISTRICTAt the tir.ie of the experiment (March 19 to May 1, 1962)
the Saydel School District had a school population of 2,393. Of
CLASSROOM 2
737.7.
FIGURE 2 Floor Plan of Lennox Research School
the same number of square feet of floor area. This was done bythe architect to provide a greater floor to ceiling dimension fora larger occupant of a typical junior high classroom. A systemof wall ducts in place of book shelf ducts was used in this room.Normally this age student changes classes every hour and thehook storage requirement is greatly minimized. However, port-able book-shelves on casters are located in the room for the stor-age of books if so desired. This room also has its five separatethermocouple locations and separate automatic controls forheating, ventilating and air conditioning.
At the rear of the school and located between the two class-rooms is a heater room. This area houses the gas-fired heater,
7
__s
these, 1,894 were in elementary school arid 499 in secondaryschools. These students were housed in six elementary schools,one junior high school and one senior high school. In additionthe district operates a kindergarten and a school for the train-able mentally handicapped. All students in the district are trans-ported and the district operates a hot lunch program in eachschool.
At a joint meeting of representatives of the state Universityof Iowa, officials of Lennox Industries Inc. the Saydel adminis-trative staff, and cooperating fourth grade teachers, all majorarrangements were made to carry out the experiment. The re-searcher met with the principals and teachers of the schools in-
volved after the general meeting in order to work out the finaldetails.
CANARY LAKE SCHOOLThe subjects for the experiment were the two fourth grades
in the Canary Lake School. The two classes were heterogenouslygrouped so that both classes had covered the same amount -f in-structional material at the time the experiment began. Therewere 29 students enrolled in one class and 28 students in theother. It was possible to select 22 matched pairs of studentsfrom the classes.
The two classet. had occupied similar rooms, the same size,adjacent to each other, on the same side of the building and onthe same floor sir.ce the beginning of school. The thermal con-ditions in the two rooms were the same so that the children hadbeen exposed to similar thermal environments since the begin-ning of the school year.
The school was heated by a central warm air heating systemand the heated al; was discharged ..ito the rooms through a grilllocated at a height of seven feet on an interior wall. The heatedair was discharged at a rate of 400 cfm. The velocity of the airacross the desks was from 5 to 10 feet per minute dependingupon the location of the desk in the room.
The rooms were ventilated by the raising or lowering ofwindows and by opening the door. If the door was not openedthere was a discharge grill (11 inches by 23 inches) w..h 20louvers to let air into the halls. This provided an open free areaof 120 square inches for letting air into the halls. The openingbetween the bottom of the door and the floor provided an .ditional 13-1/2 square inches of free area.
Experiment DuplicatedThe experiment was repeated, the only differences in pro-
cedures being:(1) A second set of fourth grade children. (The 22
matched pairs who initially participated in the experiment arecharacterized as low only because the mean achievement scorefor the group was lower than the mean achievement score forthe 22 matched pairs, labeled high, who were used to duplicatethe experiment. (See Tables I and II).
(2) This second set occupied opposite rooms at the re-search school from the first set.
(3) The morning tasks were changed to afternoon andafternoon tasks changed to morning.SAYLOR CENTER SCHOOL
The second group of subjects came from the two fourthgrades from the Saylor Center School. The two classes wereheterogenously grouped and both classes had covered the sameamount of instructional material at the time of the experiment.There were 27 students in one class and 26 students in the other.Twenty-two match pairs were selected from the classes.
The thermal conditions in both rooms were the same asthose described for the Canary Lake School.
Equating the GroupsThe children were aware that an experiment was in progress
and were eager to participate in a scientific undertaking. Theywere given as full an explanation of the investigation as couldbe understood by them. However, they were not told whichgroup would occupy the room with model thermal conditions.The explanation stressed the possible importance to education,the need for rigorous accuracy and the possible benefits of theresults to the welfare of other school children. Their appreciationof the situation was shown by the fact that the test periods werecharacterized by rapt attention and great effort on the part ofe very subject. Frequently, while the experiment was in prog-ress, one child or anther would ask for information on the find-ings and question the teacher about opening the door or movingabout the room. Members of the classes and the teachers gaveor sent letters of appreciation for having been selected to par-ticipate in the experiment. Although every child in the fourthgrade classes of both schools was included in the experimentalroutine, only the information on 44 matched pairs is reported.
On the basis of the preliminary data, the children were sep-
8
crated into two equal groups, the personnel of one being asnearly like the personnel of the other as possible. The first con-sideration upon which the assignments to the groups were madewas their achievement as measured by their composite score onthe Iowa Test of Basic Skills (I. T. B. S.), taken the latter partof January, 1962.
Ail subjects were ranked in sequence according to testscores and paired in order. They were then assigned to thegroups, one member of each pair to the control group and theother to the experimental group.
Because the composite Basic Skills Test scores were closelysimilar it was possible by shifting equal-scoring children fromone group to the other to obtain a good balance between thegroups in other factors and to allow as many as possible to re-main with their own teachers.
After the children had been assigned in secret to two quitewell-matched groups the principal of the school determinedwhich group would occup} the control room and which wouldoccupy the experimental room.
That the achievement and ability to learn was very nearlyequal in tne groups at the beginning of the investigation is at-tested by their scores on the standardized measures used. (IowaTest of Basic SkillsComposite Score and Arithmetic Com-posite and Otis Quick-Scoring Mental Ability Tests, Beta, FormA)
By referring to the data in Tables I and II the similarity ofthe two groups can be verified.
The overall level of achievement and intelligence for bothgroups was exactly the same (See mean I.T.B.S. score and meanOtis Intelligence score in Tables I and II). The mean ArithmeticComposite score for the control was slightly higher than that ofthe experimental group.
How these factors were equated by proportioning them asequally as possible between the matched groups can be seen inTables I and II. Further reference to the tables will reveal thesimilarity of the standard deviations for each of the preliminarymeasures, indicating that the variation in the two groups wasvery much the same.
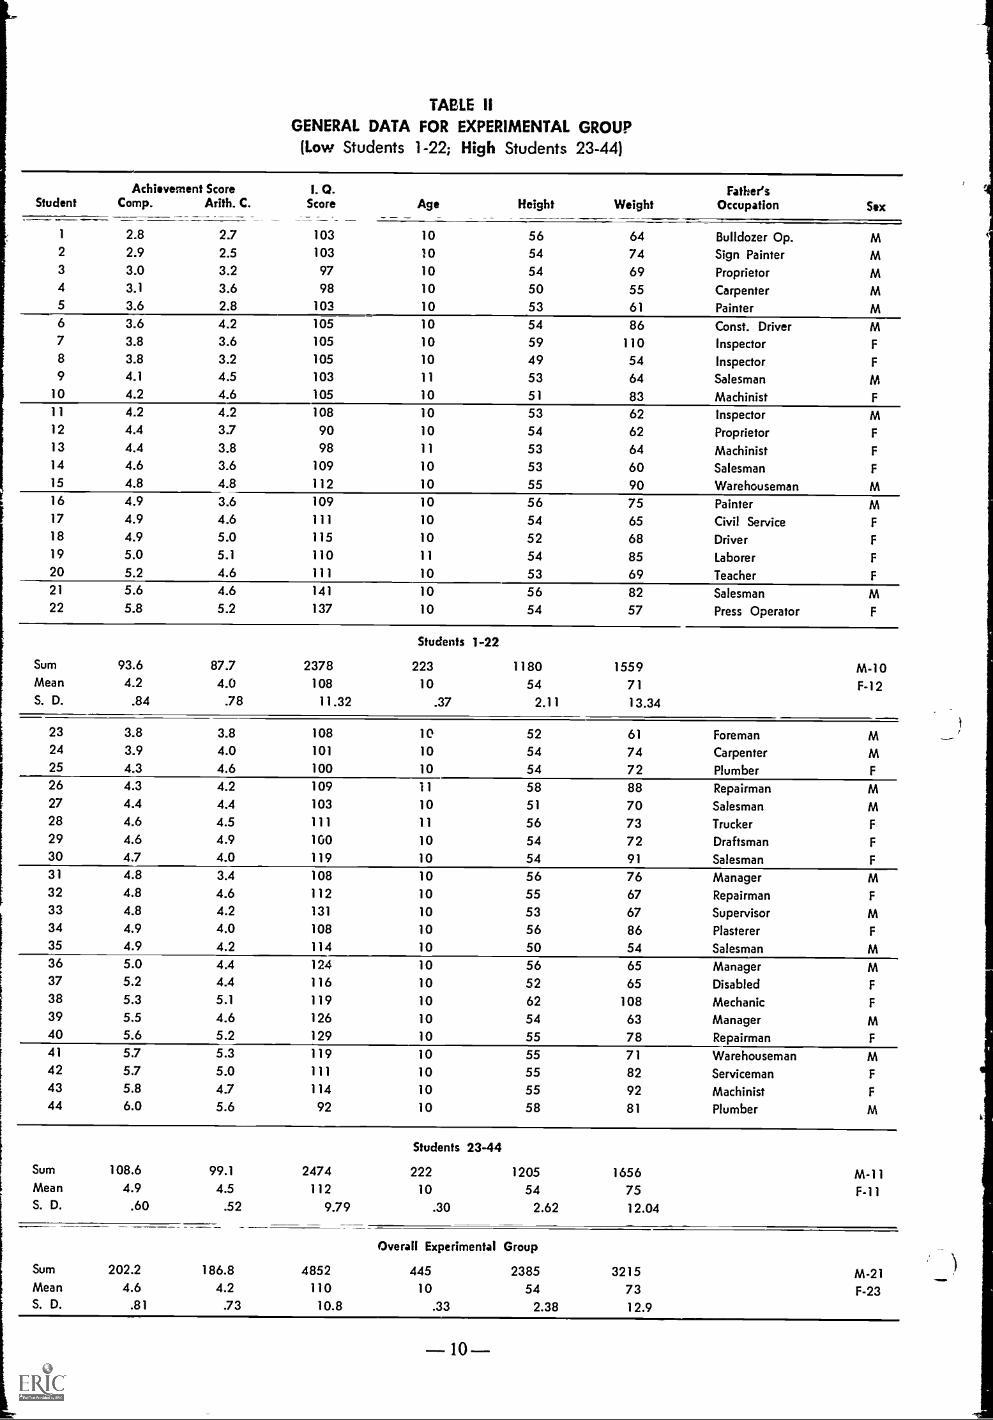
For the control and experimental groups respectively, themean I. T. B. S. Composite scores were 4.6 and 4.6 with stand-ard deviations of .83 and .81; the mean Quotient on the OtisQuick-Scoring Mental Ability, Beta, Form A, were 110 and 110with standard deviations of 13.8 and 10.8; the mean I. T. B. S.Arithmetic Composite scores were 4.4 and 4.2 with standarddeviations of .82 and .73; the mean ages were 10 and 10 withstandard deviations of .30 and .33; the mean heights were 54and 54 inches with standard deviations of 2.5 and 2.4; the meanweights were 73 and 73 with standard deviations of 13.2 and12.9. The control group had 22 boys and 22 girls, and the ex-perimental group had 21 boys and 23 girls.
Program of TasksSeveral considerations governed the choice of material to be
utilized in the measurement of specific learning by the children.It was held desirable to tap as wide a range of types of activityas possible. It was necessary, however, to use for the tasks, ma-terial of the kind and level occurring in public school curriculaand tests that called for fairly short, quick reaction. It was im-portant, of course, to use for every task such material as wouldlend itself to objective measurement. Further it was distinctlydesirable, since the experiment was to deal with healthy, active,energetic boys and girls for a three weeks period. that all tasksshould hold as much intrinsic interest as possible and be so wellwithin the range of the children's ability as to call out their bestefforts.
The program of regularly practiced tasks consisted of 10paper and pencil activities performed in the Lennox ResearchSchool classrooms. The tasks were intended to measure threetypes of activities which take place in the classroom:
(1) Clerical and Routine ActivitiesThe tasks selected tomeasure gain in this type of an activity were (a) CheckingNames, (b) Checking Numbers, (c) Finding and CancelingLetters, and (d) Finding and Canceling Digits. Every task wasperformed once a week for three weeks.
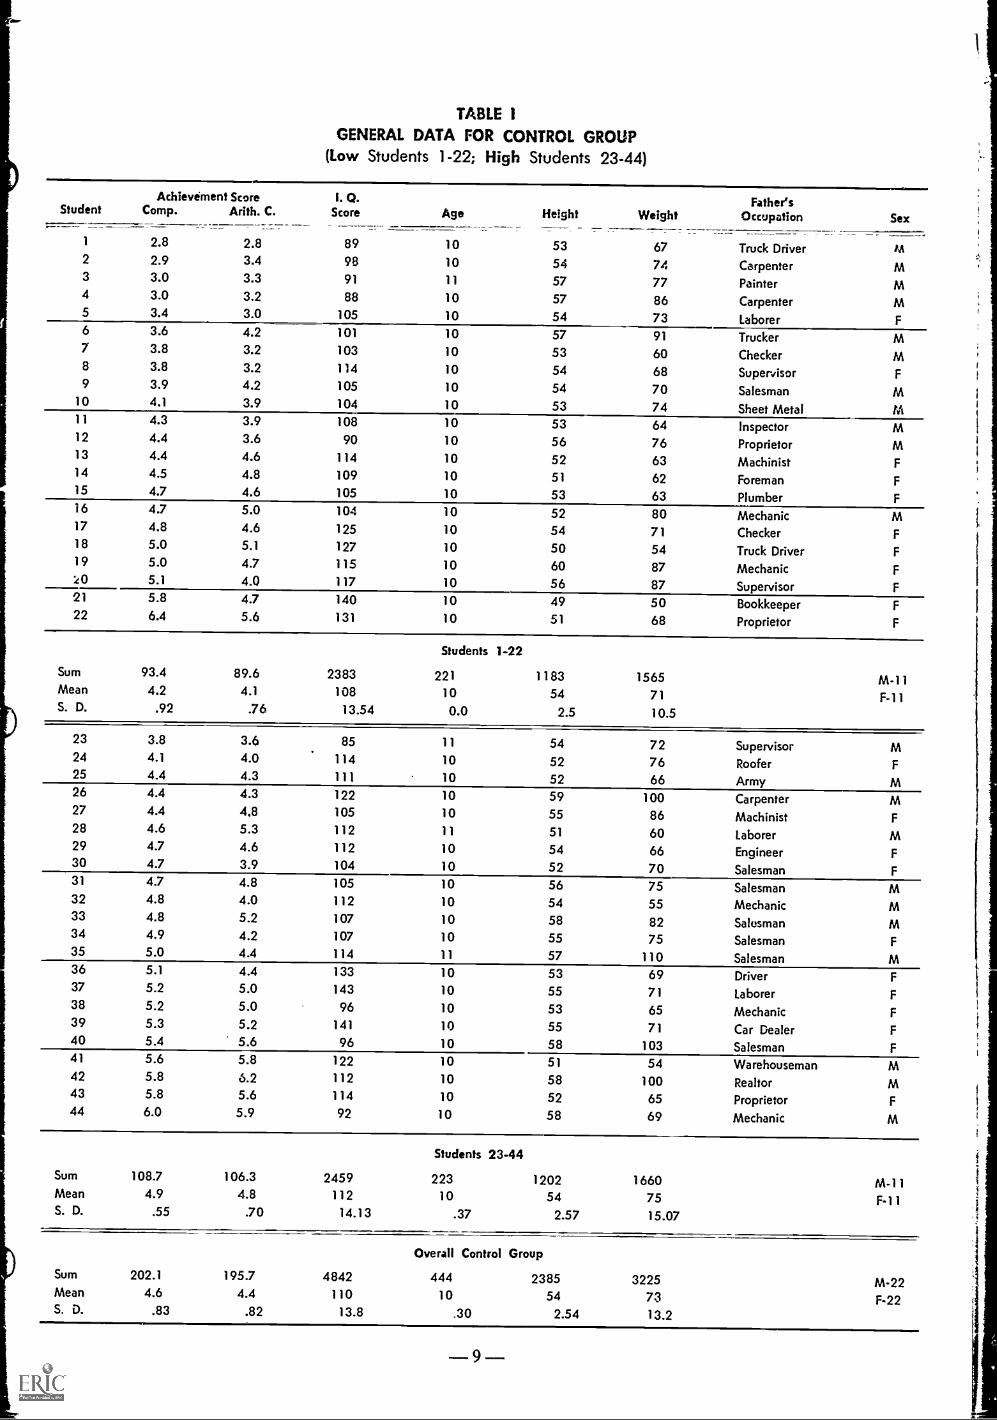
TABLE 1
GENERAL DATA FOR CONTROL GROUP(Low Students 1-22; High Students 23-44)
StudentAchievement Score
Comp. Arith. C.I. O.
Score Age Height WeightFather's
Occupation Sex
1
2
3
4
5
2.8
2.93.03.03.4
.-_-- -
2.83.43.3
3.23.0
8998
91
88
105
10
10
11
10
10
535457
5754
67
74778673
Truck DriverCarpenter
Painter
Carpenter
Laborer
rdt
MMMF
6 3.6 4.2 101 10 57 91 Trucker M7 3.8 3.2 103 10 53 60 Checker M8 3.8 3.2 114 10 54 68 Supervisor F9 3.9 4.2 105 10 54 70 Salesman M
10 4.1 3.9 104 10 53 74 Sheet Metal M11 4.3 3.9 108 10 53 64 Inspector M12 4.4 3.6 90 10 56 76 Proprietor M13 4.4 4.6 114 10 52 63 Machinist F14 4.5 4.8 109 10 51 62 Foreman F15 4.7 4.6 105 10 53 63 Plumber F16 4.7 5.0 104 10 52 80 Mechanic M17 4.8 4.6 125 10 54 71 Checker F18 5.0 5.1 127 10 50 54 Truck Driver F19 5.0 4.7 115 10 60 87 Mechanic F20 5.1 4.0 117 10 56 87 Supervisor F21 5.8 4.7 140 10 49 50 Bookkeeper F22 6.4 5.6 131 10 51 68 Proprietor F
Students 1-22
Sum 93.4 89.6 2383 221 1183 1565 M-11Mean 4.2 4.1 108 10 54 71 F-11S. D. .92 .76 13.54 0.0 2.5 10.5
23
24
25
3.84.1
4.4
344.04.3
85
114
111
11
10
10
54
5252
727666
Supervisor
Roofer
Army
MF
M26 4.4 4.3 122 10 59 100 Carpenter M27 4.4 4.8 105 10 55 86 Machinist F28 4.6 5.3 112 11 51 60 Laborer M29 4.7 4.6 112 10 54 66 Engineer F30 4.7 3.9 104 10 52 70 Salesman F31 4.7 4.8 105 10 56 75 Salesman M32 4.8 4.0 112 10 54 55 Mechanic M33 4.8 5.2 107 10 58 82 Salesman M34 4.9 4.2 107 10 55 75 Salesman F35 5.0 4.4 114 11 57 110 Salesman M36 5.1 4.4 133 10 53 69 Driver F37 5.2 5.0 143 10 55 71 Laborer F38 5.2 5.0 96 10 53 65 Mechanic F39 5.3 5.2 141 10 55 71 Car Dealer F40 5.4 5.6 96 10 58 103 Salesman F41 5.6 5.8 122 10 51 54 Warehouseman M42 5.8 6.2 112 10 58 100 Realtor M43 5.8 5.6 114 10 52 65 Proprietor F44 6.0 5.9 92 10 58 69 Mechanic M
Students 23-44
Sum 108.7 106.3 2459 223 1202 1660 M-11Mean 4.9 4.8 112 10 54 75 F-11S. D. .55 .70 14.13 .37 2.57 15.07
Overall Control Group
Sum 202.1 195.7 4842 444 2385 3225 M-22Mean 4.6 4.4 110 10 54 73 F-22S. D. .83 .82 13.8 .30 2.54 13.2
9
Student Comp.Achievement Score
Arith. C. ScoreI. O.
Age Height Weight OccupationFather's
Sex
1
TABLE UGENERAL DATA FOR EXPERIMENTAL GROUP
(Low Students 1-22; High Students 23-44)
1 2.8 2.7 103 10 56 64 Bulldozer Op. M2 2.9 2.5 103 10 54 74 Sign Painter M3 3.0 3.2 97 10 54 69 Proprietor M4 3.1 3.6 98 10 50 55 Carpenter M5 3.6 2.8 103 10 53 61 Painter M6 3.6 4.2 105 10 54 86 Const. Driver M7 3.8 3.6 105 10 59 110 Inspector F
8 3.8 3.2 105 10 49 54 Inspector F9 4.1 4.5 103 11 53 64 Salesman M
10 4.2 4.6 105 10 51 83 Machinist F
11 4.2 4.2 108 10 53 62 Inspector M12 4.4 3.7 90 10 54 62 Proprietor F
13 4.4 3.8 98 11 53 64 Machinist F
14 4.6 3.6 109 10 53 60 Salesman F
15 4.8 4.8 112 10 55 90 Warehouseman M16 4.9 3.6 109 10 56 75 Painter M17 4.9 4.6 111 10 54 65 Civil Service F
18 4.9 5.0 115 10 52 68 Driver F
19 5.0 5.1 110 11 54 85 Laborer F
20 5.2 4.6 111 10 53 69 Teacher F
21 5.6 4.6 141 10 56 82 Salesman M22 5.8 5.2 137 10 54 57 Press Operator F
Students 1-22
Sum 93.6 87.7 2378 223 1180 1559Mean 4.2 4.0 108 10 54 71S. D. .84 .78 11.32 .37 2.11 13.34
M-10F-12
23 3.8 3.8 108 10 52 61 Foreman M24 3.9 4.0 101 10 54 74 Carpenter M25 4.3 4.6 100 10 54 72 Plumber F
26 4.3 4.2 109 11 58 88 Repairman M27 4.4 4.4 103 10 51 70 Salesman M28 4.6 4.5 111 11 56 73 Trucker F
29 4.6 4.9 100 10 54 72 Draftsman F
30 4.7 4.0 119 10 54 91 Salesman F
31 4.8 3.4 108 10 56 76 Manager M32 4.8 4.6 112 10 55 67 Repairman F
33 4.8 4.2 131 10 53 67 Supervisor M34 4.9 4.0 108 10 56 86 Plasterer F
35 4.9 4.2 114 10 50 54 Salesman M36 5.0 4.4 124 10 56 65 Manager M37 5.2 4.4 116 10 52 65 Disabled F
38 5.3 5.1 119 10 62 108 Mechanic F
39 5.5 4.6 126 10 54 63 Manager M40 5.6 5.2 129 10 55 78 Repairman F
41 5.7 5.3 119 10 55 71 Warehouseman M42 5.7 5.0 111 10 55 82 Serviceman F
43 5.8 4.7 114 10 55 92 Machinist F
44 6.0 5.6 92 10 58 81 Plumber M
Students 23-44
Sum 108.6 99.1 2474 222 1205 1656 M-11Mean 4.9 4.5 112 10 54 75 F-11S. D. .60 .52 9.79 .30 2.62 12.04
Overall Experimental Group
Sum 202.2 186.8 4852 445 2385 3215Mean 4.6 4.2 110 10 54 73S. D. .81 .73 10.8 .33 2.38 12.9
M-21
F-23
- 10 -
,

(2) Reasoning Activities The tasks selected to measuregain in this type of activity were (a) Mazes, (b) Design Com-pletion, (c) Analogies, (d) Addition, and (e) Solving Prob-lems. The Mazes, Design Completion and Analogies tasks wereperformed once a week for the three weeks. The Addition andSoling Problems tasks were daily tasks.
(3) Activities involving new concepts in a content fielde.g., scientific: information was presented on films. The subjectstudied was "The Earth: Its Atmosphere; Changes In Its Sur-face; Resources In Its Crust; and Its Oceans." One film wasshown the first week, two were shown the second week; and onewas shown the last week. The students watched the film andthen took a test over the information presented.
The tasks selected for use in this experimental programwere:
1. MazesAfter the Porteus Test, Vineland Revision andNon-Language Section of California Test of Met al Maturityfive forms. The time allowed for each of the trials was two min-utes.
2. Design CompletionAfter the Detroit Alpha Intelli-gence Test, five forms. The time allowed for each of the trialswas five minutes.
3. AnalogiesAfter the Dominion Tests of Learning Ca-pacity, five forms. The time allowed for each of the trials wasfive minutes.
4. Checking NamesAfter the Minnesota Clerical Test,five forms. The time allowed for each of the trials was 30 sec-onds.
5. Checking NumbersAfter the Minnesota Clerical Test,five forms. The time allowed for each of the trials was 30 sec-onds.
6. Canceling letters on a page of pirnted lettersAfter theThorndike Clerical Test, five forms. The time allowed for eachof the trials was two minutes.
7. Canceling numbers on a page of printed numbersAfterthe Thorndike Clerical Test, five forms. The time allowed foreach of the trials was two minutes.
8. Addition of simple numbersA sheet of addition prob-lems made up of two and three digit numbers which had to beadded, 15 forms. This was a daily task. The digits were differentin each trial. The time allowed for each of the trials was fiveminutes.
9. Solving ProblemsAfter Monroe's Standardized Rea-soning Tests in Arithmetic, the Los Angeles Diagnostic Testsand Iowa Tests of Basic Arithmetic Skills, 15 forms. This wasa daily task. The time allowed for each of the trials was 20 min-utes.
10. FilmsThe Coronet Films series on "The Earth: ItsAtmosphere; Changes in its Surface; Resources in its Crust; ItsOceans" was used. The time allowed for each of the trials was15 minutes with an additional 13 minutes for the showing ofthe film.
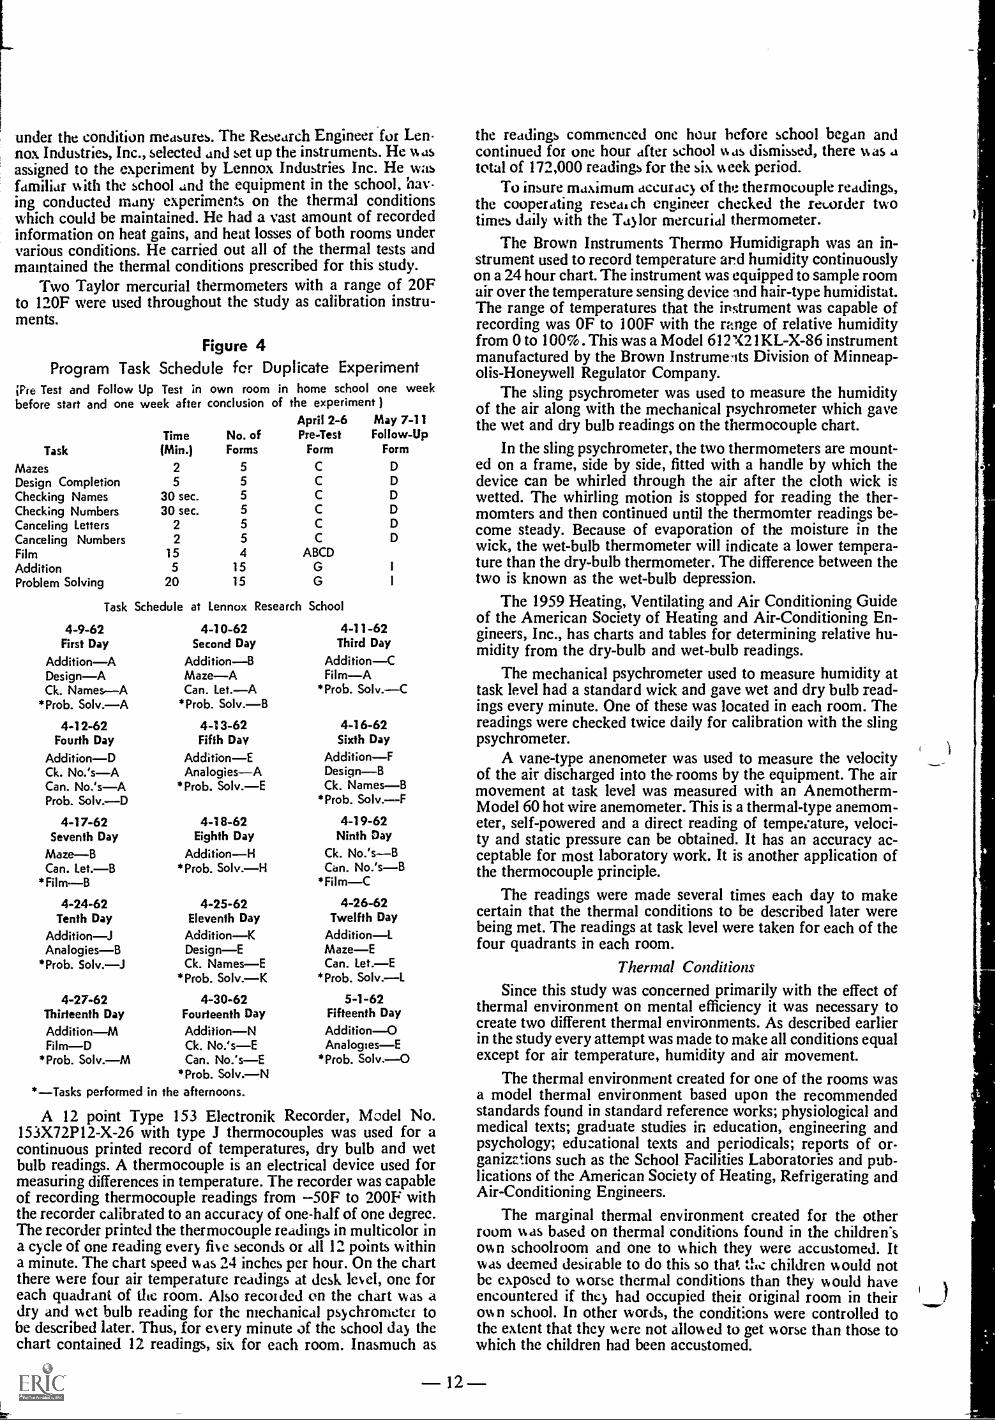
The 10 tasks were administered by the researcher to thechildren of both groups in their own rooms at the home schoola week before the experiment began and again as a post test oneweek following the end of the experiment. Figure 3 denotes thetime schedule of the tasks at the Lennox Research School. Dur-ing the experiment the tasks were performed at the same timewith the researcher being with the control group in the morningon the first day and with the experimental group in the afternoonof the first day and then changing to the experimental group inthe morning of the second day and with the control group in theafternoon of the second day. The researcher alternated witheach group each day throughout the experiment. The regularteacher administered the tasks to the group not with the re-searcher. When a film was scheduled the researcher showed thefilm to both groups and the teachers administered the tests. Theprinted directions accompanying each task were employed asa matter of group instruction, there being no private or indi-vidual help. The timing as set was followed exactly using stopwatches. On every school day about 20 minutes was spent bothmorning and afternoons by every subject in performing these
11
pencil-and-paper tasks, two, three or four in number. Sometasks were repeated each day and some once each week. Thus,each complete repetition required one week.
Figure 3Program Task S&edule for Initial Experiment
(Pre-Test and Follow-Up Test in own room in home school, one weekbefore start and one week after conclusion of the experiment.)
TaskTime(Min.)
No. ofForms
March 12-16Pre-Test
Form
April 9-13Follow-Up
FormMazes 2 5 C DDesign Completion 5 5 C DChecking Names 30 sec. 5 C DChecking Numbers 30 sec. 5 C DCancelling Letters 2 5 C DCancelling Numbers 2 5 C DAnalogies 5 5 C DFilm 15 4 ABCDAddition 5 15 G IProblem Solving 20 15 G I
Task Schedule at Lennox Research School3-19-62First Day
Prob. Solt'. A*AdditionA*DesignACk. NamesA
3-22-62Fourth Day
Prob. Solt'. D*AdditionD*Ck. No 'sA*Can. No.'sA
3-27-62Seventh Day
FilmB*MazeB*Can. Let.B
3-30-62Tenth Day
Prob. Solt'. J*AdditionJ*Analogies--B
4-4-62Thirteenth DayProb. Solt'. M
*AdditionM*FilmD
*Tasks performed in
3-20-62 3-21-62Second Day Third Day
Prob. Solt'. B*AdditionB*MazeA*Can. Let.A
Prob. Solv.C*AdditionC*FilmA
3-23-62 3-26-62Fifth Day Sixth Day
Prob. Solt'. E*AdditionE*Analogies--A
Prob. Solv.F*AdditionF*DesignB*Ck. NamesB
3-28-62 3-29-62Eighth Day Ninth Day
Prob. Solv.H*AdditionH
FilmC*Ck. No.'sB*Can. No.'sB
4-2-62 4-3-62Eleventh Day Twelfth Day
Prob. Solv.K*AdditionK*Design F*Ck. NamesE
Prob. Solv.L*AdditionL*MazeE*Can. Let.E
4-5-62 4-6-62Fourteenth Day Fifteenth DayProb. Solt'. N
*AdditionN*Ck. No.'sE*Can. No.'sE
the afternoons.
Prob. Solt'. -0*Addition-0*Analogies E
The tasks were presented to the children in every periodthroughout the experiment in a folio prepared in advance withthe same tasks in the same order face down on their desks. Thusuntil instructions were ended, questions answered, and the sig-nal to turn over tasks and begin work was given, no child couldsee the material upon which he was to work.
During the second three-week period the various tasks werereversed in order as illustrated in Figure 4. The tasks which wereperformed in the morning session during the first three weekswere performed in the afternoon the second three weeks andvice versa.
All tasks were scored on the day they were administeredso that minor items which needed additional checking, such asfailure to sign or date a test blank, could be cleared up immedi-ately.
The schedules of recitation followed by the classes duringthe first and second three-week periods are found in Appendix,Form E.
Description of the Instruments Used toMeasure Thermal Conditions
Several instruments had to be used in order to obtain thethermal data needed fc r this study. These instruments are knownto be highly accurate in measuring air temperature, relative hu-midity and air movement. The instruments used are identified
under the condition measures. The Research Engineer for Len-nox Industries, Inc., selected and set up the instruments. He wasassigned to the experiment by Lennox Industries Inc. He wasfamiliar with the school and the equipment in the school, hav-ing conducted many experiments on the thermal conditionswhich could be maintained. He had a vast amount of recordedinformation on heat gains, and heat losses of both rooms undervarious conditions. He carried out all of the thermal tests andmaintained the thermal conditions prescribed for this study.
Two Taylor mercurial thermometers with a range of 20Fto 120F were used throughout the study as calibration instru-ments.
Figure 4Program Task Schedule for Dup
;Pre Test and Follow Up Test in own room inbefore start and one week after conclusion of
licate Experimenthome school one week
the experiment )
Time No ofApril 2-6Pre Test
May 7-11Follow-Up
Task (Min.) Forms Form Form
Mazes 2 5 C D
Design Completion 5 5 C D
Checking Names 30 sec. 5 C D
Checking Numbers 30 sec. 5 C D
Canceling Letters 2 5 C D
Canceling Numbers 2 5 C D
Film 15 4 ABCD
Addition 5 15 GProblem Solving 20 15 G
Task Schedule at Lennox Research School
4-9-62 4-10-62 4-11-62First Day Second Day Third Day
AdditionA AdditionB AdditionCDesignA MazeA FilmACk. NamesA Can. Let.A *Prob. Solv.C
*Prob. Solv.A *Prob. Solv.B
4-12-62 4-13-62 4-16-62Fourth Day Fifth Day Sixth Day
AdditionD AdditionE AdditionFCk. No.'sA AnalogiesA DesignBCan. No,'sA *Prob. Solv.E Ck. NamesBProb. Solv.D *Prob. Solv.F
4-17-62 4-18-62 4-19-62Seventh Day Eighth Day Ninth Day
MazeB AdditionH Ck. No.'sBCan. Let.B *Prob. Solv.H Can. No.'sB
*FilmB *FilmC4-24-62 4-25-62 4-26-62
Tenth Day Eleventh Day Twelfth Day
AdditionJ AdditionK AdditionLAnalogiesB DesignE MazeE
*Prob. Solv.J Ck. NamesE Can. Let.E*Prob. Solv.K *Prob. Solv.L
4-27-62 4-30-62 5-1-62Thirteenth Day Fourteenth Day Fifteenth DayAdditionM AdditionN Addition-0FilmD Ck. No.'sE AnalogiesE
*Prob. Solv.M Can. No.'sE *Prob. Solt', -0*Prob. Solv.N
*Tasks performed in the afternoons.
A 12 point Type 153 Electronik Recorder, Model No.153X72P12-X-26 with type J thermocouples was used for acontinuous printed record of temperatures, dry bulb and wetbulb readings. A thermocouple is an electrical device used formeasuring differences in temperature. The recorder was capableof recording thermocouple readings from 50F to 200F withthe recorder calibrated to an accuracy of one-half of one degree.The recorder printed the thermocouple readings in multicolor ina cycle of one reading every fire seconds or all 12 points withina minute. The chart speed was 24 inches per hour. On the chartthere were four air temperature readings at desk level, one foreach quadrant of the room. Also recorded on the chart was adry and wet bulb reading fur the mechanical psychrometer tobe described later. Thus, for every minute of the school day thechart contained 12 readings, six for each room. Inasmuch as
the readings commenced one hour before school began andcontinued for one hour after school was dismissed, there was atotal of 172,000 readings for the six w eek period.
To insure maximum accuracy of the thermocouple readings,the cooperating resea. ch engineer checked the recorder twotimes daily with the Taylor mercurial thermometer.
The Brown Instruments Thermo Humidigraph was an in-strument used to record temperature and humidity continuouslyon a 24 hour chart. The instrument was equipped to sample roomair over the temperature sensing device -Ind hair-type humidistat.The range of temperatures that the instrument was capable ofrecording was OF to 100F with the range of relative humidityfrom 0 to 100%. This was a Model 612X21KL-X-86 instrumentmanufactured by the Brown Instruments Division of Minneap-olis-Honeywell Regulator Company.
The sling psychrometer was used to measure the humidityof the air along with the mechanical psychrometer which gavethe wet and dry bulb readings on the thermocouple chart.
In the sling psychrometer, the two thermometers are mount-ed on a frame, side by side, fitted with a handle by which thedevice can be whirled through the air after the cloth wick iswetted. The whirling motion is stopped for reading the ther-momters and then continued until the thermomter readings be-come steady. Because of evaporation of the moisture in thewick, the wet-bulb thermometer will indicate a lower tempera-ture than the dry-bulb thermometer. The difference between thetwo is known as the wet-bulb depression.
The 1959 Heating, Ventilating and Air Conditioning Guideof the American Society of Heating and Air-Conditioning En-gineers, Inc., has charts and tables for determining relative hu-midity from the dry-bulb and wet-bulb readings.
The mechanical psychrometer used to measure humidity attask level had a standard wick and gave wet and dry bulb read-ings every minute. One of these was located in each room. Thereadings were checked twice daily for calibration with the slingpsychrometer.
A vane-type anenometer was used to measure the velocityof the air discharged into the rooms by the equipment. The airmovement at task level was measured with an Anemotherm-Model 60 hot wire anemometer. This is a thermal-type anemom-eter, self-powered and a direct reading of temperature, veloci-ty and static pressure can be obtained. It has an accuracy ac-ceptable for most laboratory work. It is another application ofthe thermocouple principle.
The readings were made several times each day to makecertain that the thermal conditions to be described later werebeing met. The readings at task level were taken for each of thefour quadrants in each room.
Thermal ConditionsSince this study was concerned primarily with the effect of
thermal environment on mental efficiency it was necessary tocreate two different thermal environments. As described earlierin the study every attempt was made to make all conditions equalexcept for air temperature, humidity and air movement.
The thermal environment created for one of the rooms wasa model thermal environment based upon the recommendedstandards found in standard reference works; physiological andmedical texts; graduate studies in education, engineering andpsychology; educational texts and periodicals; reports of or-gania.'tions such as the School Facilities Laboratories and pub-lications of the American Society of Heating, Refrigerating andAir-Conditioning Engineers.
The marginal thermal environment created for the otherroom was based on thermal conditions found in the children'son schoolroom and one to which they were accustomed. Itwas deemed desirable to do this so that tI1C children would notbe exposed to worse thermal conditions than they would haveencountered if they had occupied their original room in theirown school. In other words, the conditions were controlled tothe extent that they were not allowed to get worse than those towhich the children had been accustomed.
12
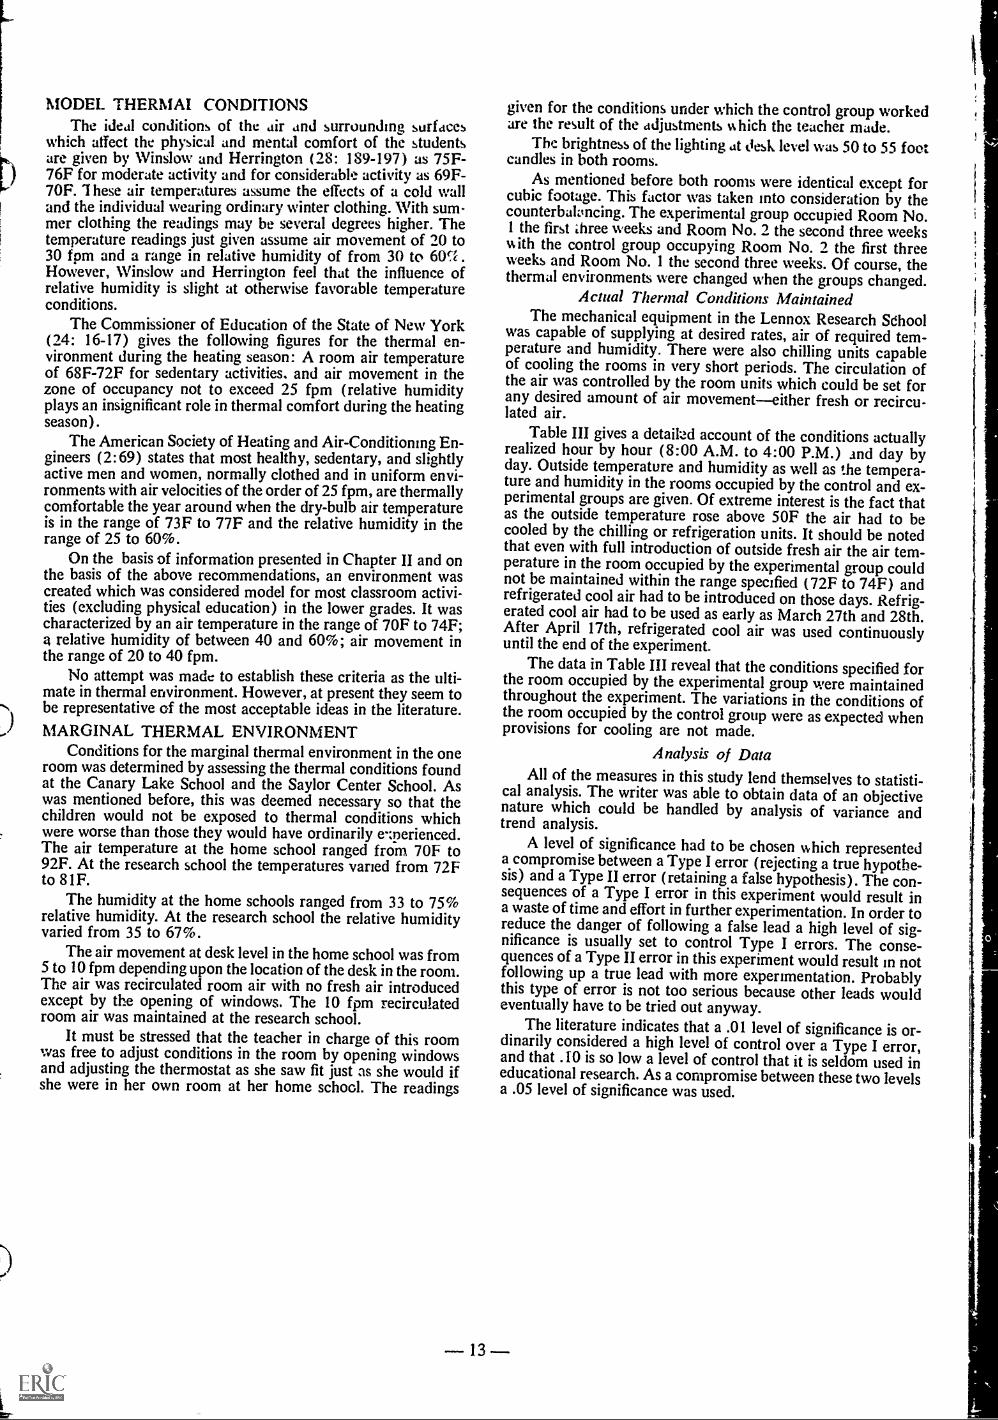
MODEL THERMAL CONDITIONSThe ideal conditions of the air and surrounding surfaces
which affect the physical and mental comfort of the studentsare given by Winslow and Herrington ( 28: 189-197) as 75F-76F for moderate activity and for considerable activity as 69F-70F. 1 hese air temperatures assume the effects of a cold walland the individual wearing ordinary winter clothing. With sum-mer clothing the readings may be several degrees higher. Thetemperature readings just given assume air movement of 20 to30 fpm and a range in relative humidity of from 30 to 60q .
However, Winslow and Herrington feel that the influence ofrelative humidity is slight at otherwise favorable temperatureconditions.
The Commissioner of Education of the State of New York(24: 16-17) gives the following figures for the thermal en-vironment during the heating season: A room air temperatureof 68F-72F for sedentary activities, and air movement in thezone of occupancy not to exceed 25 fpm (relative humidityplays an insignificant role in thermal comfort during the heatingseason).
The American Society of Heating and Air-Conditioning En-gineers (2:69) states that most healthy, sedentary, and slightlyactive men and women, normally clothed and in uniform envi-ronments with air velocities of the order of 25 fpm, are thermallycomfortable the year around when the dry-bulb air temperatureis in the range of 73F to 77F and the relative humidity in therange of 25 to 60%.
On the basis of information presented in Chapter II and onthe basis of the above recommendations, an environment wascreated which was considered model for most classroom activi-ties (excluding physical education) in the lower grades. It wascharacterized by an air temperature in the range of 70F to 74F;a relative humidity of between 40 and 60%; air movement inthe range of 20 to 40 fpm.
No attempt was made to establish these criteria as the ulti-mate in thermal environment. However, at present they seem tobe representative of the most acceptable ideas in the literature.MARGINAL THERMAL ENVIRONMENT
Conditions for the marginal thermal environment in the oneroom was determined by assessing the thermal conditions foundat the Canary Lake School and the Saylor Center School. Aswas mentioned before, this was deemed necessary so that thechildren would not be exposed to thermal conditions whichwere worse than those they would have ordinarily e-Terienced.The air temperature at the home school ranged from 70F to92F. At the research school the temperatures varied from 72Fto 81F.
The humidity at the home schools ranged from 33 to 75%relative humidity. At the research school the relative humidityvaried from 35 to 67%.
The air movement at desk level in the home school was from5 to 10 fpm depending upon the location of the desk in the room.The air was recirculated room air with no fresh air introducedexcept by the opening of windows. The 10 fpm recirculatedroom air was maintained at the research school.
It must be stressed that the teacher in charge of this roomwas free to adjust conditions in the room by opening windowsand adjusting the thermostat as she saw fit just as she would ifshe were in her own room at her home school. The readings
given for the conditions under which the control group workedare the result of the adjustments which the teacher made.
The brightness of the lighting at desk level was 50 to 55 footcandles in both rooms.
As mentioned before both rooms were identical except forcubic footage. This factor was taken into consideration by thecounterbalancing. The experimental group occupied Room No.1 the first three weeks and Room No. 2 the second three weekswith the control group occupying Room No. 2 the first threeweeks and Room No. 1 the second three weeks. Of course, thethermal environments were changed when the groups changed.
Actual Thermal Conditions MaintainedThe mechanical equipment in the Lennox Research School
was capable of supplying at desired rates, air of required tem-perature and humidity. There were also chilling units capableof cooling the rooms in very short periods. The circulation ofthe air was controlled by the room units which could be set forany desired amount of air movementeither fresh or recircu-lated air.
Table III gives a detailed account of the conditions actuallyrealized hour by hour (8:00 A.M. to 4:00 P.M.) and day byday. Outside temperature and humidity as well as the tempera-ture and humidity in the rooms occupied by the control and ex-perimental groups are given. Of extreme interest is the fact thatas the outside temperature rose above 50F the air had to becooled by the chilling or refrigeration units. It should be notedthat even with full introduction of outside fresh air the air tem-perature in the room occupied by the experimental group couldnot be maintained within the range specified (72F to 74F) andrefrigerated cool air had to be introduced on those days. Refrig-erated cool air had to be used as early as March 27th and 28th.After April 17th, refrigerated cool air was used continuouslyuntil the end of the experiment.
The data in Table III reveal that the conditions specified forthe room occupied by the experimental group were maintainedthroughout the experiment. The variations in the conditions ofthe room occupied by the control group were as expected whenprovisions for cooling are not made.
Analysis of DataAll of the measures in this study lend themselves to statisti-
cal analysis. The writer was able to obtain data of an objectivenature which could be handled by analysis of variance andtrend analysis.
A level of significance had to be chosen which representeda compromise between a Type I error (rejecting a true hypothe-sis) and a Type II error (retaining a false hypothesis). The con-sequences of a Type I error in this experiment would result ina waste of time and effort in further experimentation. In order toreduce the danger of following a false lead a high level of sig-nificance is usually set to control Type I errors. The conse-quences of a Type II error in this experiment would result in notfollowing up a true lead with more experimentation. Probablythis type of error is not too serious because other leads wouldeventually have to be tried out anyway.
The literature indicates that a .01 level of significance is or-dinarily considered a high level of control over a Type I error,and that .10 is so low a level of control that it is seldom used ineducational research. As a compromise between these two levelsa .05 level of significance was used.
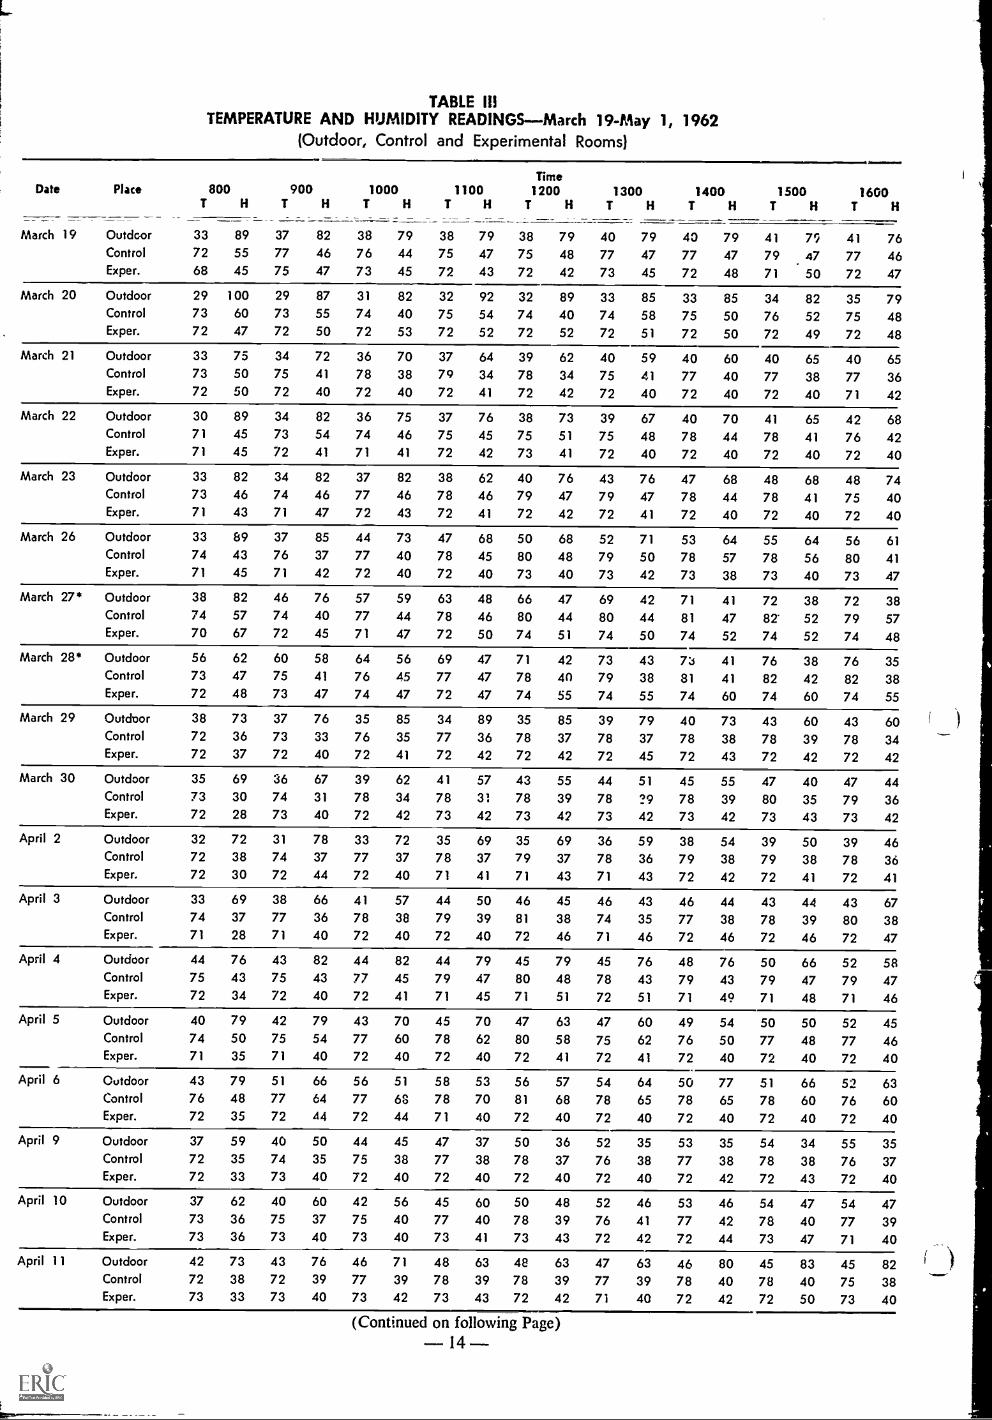
TABLE III
TEMPERATURE AND HUMIDITY READINGS- -March 19-May 1, 1962(Outdoor, Control and Experimental Rooms)
Date Place 800T H
900T H
1000T H T
1100H
1200T
Time
H1300
T H1400
T H1500
T H
.2mmilmmem
1600T H
March 19 Outdoor 33 89 37 82 38 79 38 79 38 79 40 79 40 79 41 72 41 76Control 72 55 77 46 76 44 75 47 75 48 77 47 77 47 79 47 77 46Exper. 68 45 75 47 73 45 72 43 72 42 73 45 72 48 71 50 72 47
March 20 Outdoor 29 100 29 87 31 82 32 92 32 89 33 85 33 85 34 82 35 79Control 73 60 73 55 74 40 75 54 74 40 74 58 75 50 76 52 75 48Exper. 72 47 72 50 72 53 72 52 72 52 72 51 72 50 72 49 72 48
March 21 Outdoor 33 75 34 72 36 70 37 64 39 62 40 59 40 60 40 65 40 65Control 73 50 75 41 78 38 79 34 78 34 75 41 77 40 77 38 77 36Exper. 72 50 72 40 72 40 72 41 72 42 72 40 72 40 72 40 71 42
March 22 Outdoor 30 89 34 82 36 75 37 76 38 73 39 67 40 70 41 65 42 68Control 71 45 73 54 74 46 75 45 75 51 75 48 78 44 78 41 76 42Exper. 71 45 72 41 71 41 72 42 73 41 72 40 72 40 72 40 72 40
March 23 Outdoor 33 82 34 82 37 82 38 62 40 76 43 76 47 68 48 68 48 74Control 73 46 74 46 77 46 78 46 79 47 79 47 78 44 78 41 75 40Exper. 71 43 71 47 72 43 72 41 72 42 72 41 72 40 72 40 72 40
March 26 Outdoor 33 89 37 85 44 73 47 68 50 68 52 71 53 64 55 64 56 61Control 74 43 76 37 77 40 78 45 80 48 79 50 78 57 78 56 80 41Exper. 71 45 71 42 72 40 72 40 73 40 73 42 73 38 73 40 73 47
March 27* Outdoor 38 82 46 76 57 59 63 48 66 47 69 42 71 41 72 38 72 38Control 74 57 74 40 77 44 78 46 80 44 80 44 81 47 82' 52 79 57Exper. 70 67 72 45 71 47 72 50 74 51 74 50 74 52 74 52 74 48
March 28* Outdoor 56 62 60 58 64 56 69 47 71 42 73 43 73 41 76 38 76 35Control 73 47 75 41 76 45 77 47 78 40 79 38 81 41 82 42 82 38Exper. 72 48 73 47 74 47 72 47 74 55 74 55 74 60 74 60 74 55
March 29 Outdoor 38 73 37 76 35 85 34 89 35 85 39 79 40 73 43 60 43 60Control 72 36 73 33 76 35 77 36 78 37 78 37 78 38 78 39 78 34Exper. 72 37 72 40 72 41 72 42 72 42 72 45 72 43 72 42 72 42
March 30 Outdoor 35 69 36 67 39 62 41 57 43 55 44 51 45 55 47 40 47 44Control 73 30 74 31 78 34 78 31 78 39 78 ?9 78 39 80 35 79 36Exper. 72 28 73 40 72 42 73 42 73 42 73 42 73 42 73 43 73 42
April 2 Outdoor 32 72 31 78 33 72 35 69 35 69 36 59 38 54 39 50 39 46Control 72 38 74 37 77 37 78 37 79 37 78 36 79 38 79 38 78 36Exper. 72 30 72 44 72 40 71 41 71 43 71 43 72 42 72 41 72 41
April 3 Outdoor 33 69 38 66 41 57 44 50 46 45 46 43 46 44 43 44 43 67Control 74 37 77 36 78 38 79 39 81 38 74 35 77 38 78 39 80 38Exper. 71 28 71 40 72 40 72 40 72 46 71 46 72 46 72 46 72 47
April 4 Outdoor 44 76 43 82 44 82 44 79 45 79 45 76 48 76 50 66 52 58Control 75 43 75 43 77 45 79 47 80 48 78 43 79 43 79 47 79 47Exper. 72 34 72 40 72 41 71 45 71 51 72 51 71 49 71 48 71 46
April 5 Outdoor 40 79 42 79 43 70 45 70 47 63 47 60 49 54 50 50 52 45Control 74 50 75 54 77 60 78 62 80 58 75 62 76 50 77 48 77 46Exper. 71 35 71 40 72 40 72 40 72 41 72 41 72 40 72 40 72 40
April 6 Outdoor 43 79 51 66 56 51 58 53 56 57 54 64 50 77 51 66 52 63Control 76 48 77 64 77 68 78 70 81 68 78 65 78 65 78 60 76 60Exper. 72 35 72 44 72 44 71 40 72 40 72 40 72 40 72 40 72 40
April 9 Outdoor 37 59 40 50 44 45 47 37 50 36 52 35 53 35 54 34 55 35Control 72 35 74 35 75 38 77 38 78 37 76 38 77 38 78 38 76 37Exper. 72 33 73 40 72 40 72 40 72 40 72 40 72 42 72 43 72 40
April 10 Outdoor 37 62 40 60 42 56 45 60 50 48 52 46 53 46 54 47 54 47Control 73 36 75 37 75 40 77 40 78 39 76 41 77 42 78 40 77 39Exper. 73 36 73 40 73 40 73 41 73 43 72 42 72 44 73 47 71 40
April 11 Outdoor 42 73 43 76 46 71 48 63 48 63 47 63 46 80 45 83 45 82Control 72 38 72 39 77 39 78 39 78 39 77 39 78 40 78 40 75 38Exper. 73 33 73 40 73 42 73 43 72 42 7i 40 72 42 72 50 73 40
(Continued on following Page)-- 14

TABLE III (Cont'd)
Date Place 800T H
900T H
1000T H
1100T H
1200T
Time
H1300
T H1400
T H
1500T H
1600T H
April 12 Outdoor 38 89 38 89 34 92 34 92 34 89 34 92 32 92 34 89 34 82Control 72 35 73 39 74 37 75 39 73 40 78 34 78 35 78 34 76 34Exper. 73 33 72 40 72 40 72 44 72 53 72 40 72 40 72 40 72 40
April 13 Outdoor 32 69 35 59 37 54 40 52 41 53 44 51 45 47 47 46 48 42Control 72 28 74 28 75 35 76 34 77 33 78 33 78 34 77 34 76 33Exper. 72 24 72 39 72 40 72 40 73 40 72 40 72 40 72 42 71 46
April 16 Outdoor 36 70 41 51 46 45 50 39 51 36 50 38 47 39 49 46 50 37
Control 72 28 75 28 79 28 78 32 78 34 78 30 78 31 78 31 78 27Exper. 73 36 73 39 72 42 72 45 72 47 71 50 72 51 73 54 73 54
April 17* Outdoor 41 85 46 71 52 54 57 44 62 32 64 27 65 26 67 23 67 23
Control 72 30 73 32 76 35 78 36 78 34 77 51 79 51 79 48 78 56Exper. 72 33 72 40 73 42 72 41 72 40 72 50 73 52 73 54 72 57
April 18* Outdoor 51 52 57 39_ 61 26 64 27 66 26 66 26 68 25 70 23 69 18
Control 77 25 75 28 78 33 78 34 78 31 78 33 78 33 78 31 78 28Exper. 74 43 72 45 73 54 72 57 72 60 71 53 72 55 72 57 72 57
April 19* Outdoor 45 53 49 41 5? 35 54 31 58 26 59 23 62 21 63 19 64 18
Control 71 28 74 25 75 32 77 31 77 31 77 52 78 30 78 31 78 31
Exper. 73 25 73 39 73 40 72 40 72 40 72 40 72 40 73 40 73 40
April 24* Outdoor 63 41 68 36 72 31 76 26 78 24 80 23 82 20 82 21 82 20Control 73 33 76 32 78 36 78 37 79 38 79 37 78 40 78 47 80 29
Exper. 73 47 73 47 73 50 73 51 73 50 73 53 73 55 73 58 73 50
April 25* Outdoor 64 46 68 40 72 35 77 31 79 28 81 27 82 26 83 27 83 30Control 74 40 76 39 77 43 78 43 79 37 78 43 80 43 81 39 81 42Exper. 73 43 73 43 72 42 73 42 74 43 74 47 74 47 74 50 74 55
April 26* Outdoor 68 63 73 53 77 47 79 44 81 41 83 38 83 37 84 36 83 34
Control 71 50 76 52 79 53 80 53 81 52 79 49 80 50 82 50 79 42Exper. 71 61 73 50 74 51 74 53 74 58 74 52 74 58 74 57 74 43
April 27* Outdoor 71 68 74 62 75 60 73 64 66 87 69 81 69 87 68 20 66 90Control 75 46 77 47 80 52 80 54 81 56 70 61 80 62 80 65 77 60Exper. 72 57 73 57 73 57 73 57 73 57 73 58 73 60 74 60 73 58
April 30* Outdoor 56 96 57 90 58 87 58 83 58 80 59 75 58 72 58 67 57 67
Control 72 56 74 51 75 55 76 51 77 48 73 47 75 47 76 48 74 51
Exper. 72 47 73 50 73 50 73 50 73 50 72 56 73 58 73 36 73 43
May 1* Outdoor 56 59 59 55 63 48 65 40 66 39 67 36 68 33 69 30 68 30Control 72 42 75 43 75 44 76 45 78 43 76 41 77 43 77 40 77 36Exper. 73 37 72 40 73 40 73 42 73 40 71 40 72 40 72 43 71 40
Air Movement:Control Room-10 fpm recirculated airExperimental Room-25 fpm outside air
*Air Conditioning

CHAPTER IV ANALYSIS OF THE RESULTS
The teat of the hypothesis -that there is no difference inlearning under model and marginal classroom thermal en% iron-ment-lies, as far as this investigation is concerned, in the com-parison of the performance of two groups of indi% iduals whodiffered only in the thermal environment they occupied eachday. The other known factors were equated as much as mosthuman experimentation permits.
Comparison of Achievement of Controland Experimental Groups
Learning in this experimental situation was represented bythe number of correct responses made by the subjects to eachtask in a series of repetitions of the tasks. The tasks were chosenfor this program primarily because they represented perform-ance in reasoning ability, clerical ability and ability to recognizenew concepts. It was possible to objectively score every per-formance on every task.
The complete set of data lists the number of correct re-sponses made by each child taking part in this study in each ofhis practice periods, as he progressed in the 10 tasks from thefirst through the last trial. All of the tasks were practiced oncea week with the exception of the addition and problem solvingtasks. These latter tasks were practiced daily during the firstweek, three times the second week and daily the third week.Tasks based on concepts presented via motion pictures weregiven twice during the second week. However, for the uniformi-ty of treatment and reporting, the mean weekly averages of theaddition and problem solving tasks are reported as are the meanperformances on all four film tasks. Since the data in their en-tirety are not printed in this report, a summary of these meanscores as made by the control and experimental groups on eachof the trials is presented in Table IV.
TABLE IVMEAN SCORES MADE BY CONTROL AND EXPERIMENTAL GROUPS
IN FIVE TRIALS OF TEN TASKS
Task Group
HomeSchoolTrial Trial
Research School
Trial Trial
HomeSchool
Trial1 2 3 4 5
Mazes C 3.61 4.23 4.75 5.66 5.25E 3.84 4.20 5.07 6.23 5.70
Design C 30.59 58.55 66.73 75.70 72.52Completion E 26.48 53.16 69.25 80.59 79.02
Checking C 2.84 2.86 4.23 4.20 3.89Names E 2.57 3.89 4.48 5.16 5.14
Checking C 3.82 4.45 5.25 5.89 5.93Numbers E 3.64 5.09 6.23 7.20 6.84
Canceling C 25.32 32.48 31.18 39.84 38.82Letters E 23.64 30.59 33.73 42.25 41.61
Canceling C 45.73 46.89 52.93 55.07 53.23Numbers E 40.61 48.36 54.77 57.43 56.34
Analogies C 10.05 14.18 17.70 17.50 16.48E 1 L34 16.09 18.95 19.55 19.32
Addition C 23.66 27.09 28.45 31.75 31.59E 21.48 27.45 32.11 36.02 35.30
Solving C 10.52 H .77 14.02 14.93 13.41Problems E 11.05 12.89 15.82 17.98 17.84
Films C 8.00 11.09E 7.73 11.80
Although it seems clear from Table IV that there are differ-ences in the performance of the control and experimental groupson the trials, it is necessary to look more closely at these differ-ences.
Analysis of variance procedures were used to analyze thedata from the experiment. The specific statistical design em-ployed to determine what happened to both levels of each treat-ment group as they proceeded from trial 2 through trial 4 inthe research school in their respective thermal environments,
was d three-factor Type VI design. ( 14. 292-297) To determineif the observed differences on Trial 5 at the end of the experi-ment were significant, 4 two factor Type I design (14.267-273)was utilized. All significance tests were conducted at the .05level.
Analysis of Variance by Type VI DesignThe performance of the two groups in the research school
on Trials 2, 3, and 4 are considered first. Since some of the taskswere similar in nature, they are grouped into three broad cate-gories. (1) Reasoning Tasks-Mazes, Design Completion,Analogies, Addition and Soling Proulems, (2) Clerical Rou-tine Tasks-Checking Names, Checking Numbers, CancelingLetters and Canceling Numbers, and (3) Tasks Involving NewConcepts-Science Films.
TABLE VGROUP MEANS FOR MAZE TASK ON TRIALS
2, 3 AND 4Low Level High Level
Trials Aver- Trials Aver-2 3 4 age 2 3 4 age
Con. 4.91 5.09 5.55 5.18 Con. 3.55 4.41 5.77 4.58Exp. 4.55 4.91 6.14 5.20 Exp. 3.86 5.23 6.32 5.14Ave. 4.73 5.00 5.84 5.19 Ave. 3.70 4.82 6.05 4.86
Trials x Treatment Levels x Treatment
Trials2 3
Aver-4 age
Aver-Low High age
Con. 4.23 4.75 5.66 4.88 Con.
Exp. 4.20 5.07 6.23 5.17 Exp
5.18 4.58 4.885.20 5.14 5.17
TABLE VaANALYSIS OF VARIANCE SUMMARY
Source df Ms F (df)
Between S 43 1.183Levels 1 7.333 7.0759* 1,42error (b) 42 1.036
Within S 220 L350Trials 2 66.489Treat. 1 5.470 4.1551* 1,42Trials x Treat. 2 1.936 4.8821* 2,84Trials x Levels 2 8.663Treat. x Levels 1 4.909 3.729C 1,42Trials x Treat. x Levels 2 1.580 3.9839* 2,84Error (w) 210 0.616Error' (w) 84 0.485Error2 (w) 42 1.316Errol) (w) 84 0.396
Totals 263
F .05 = 4.08 df = 1,42 * F significantF .05 = 3.12 df = 2,84
Reasoning TasksMAZES
Table V shows the perlormance on the maze task of each lev-el of the control and experimental groups on each of three trialsat the research school. The overall means for the low and highlevel groups were 5.19 and 4.86 respectively. The overall meansfor the control and experimental groups were 4.88 and 5.17 re-spectively. The differences in the means in both cases were sta-tistically significant. These significance tests are summarized inTable Va. The respective F-values are 7.0759 and 4.1551. Alsogiven in this summary table are the significance tests for the in-teraction effects of interest. The trials x treatments interactionover levels with an F. of 4.8821 and trials x treatments x levelsinteraction (F-3.9839) were both statistically significant. Thetreatments x levels interaction (F-3.7290) was not.
Figure 5 illustrates the nature of the observed interactioneffects graphically. The trials x treatments graph shows that the
- 16 -
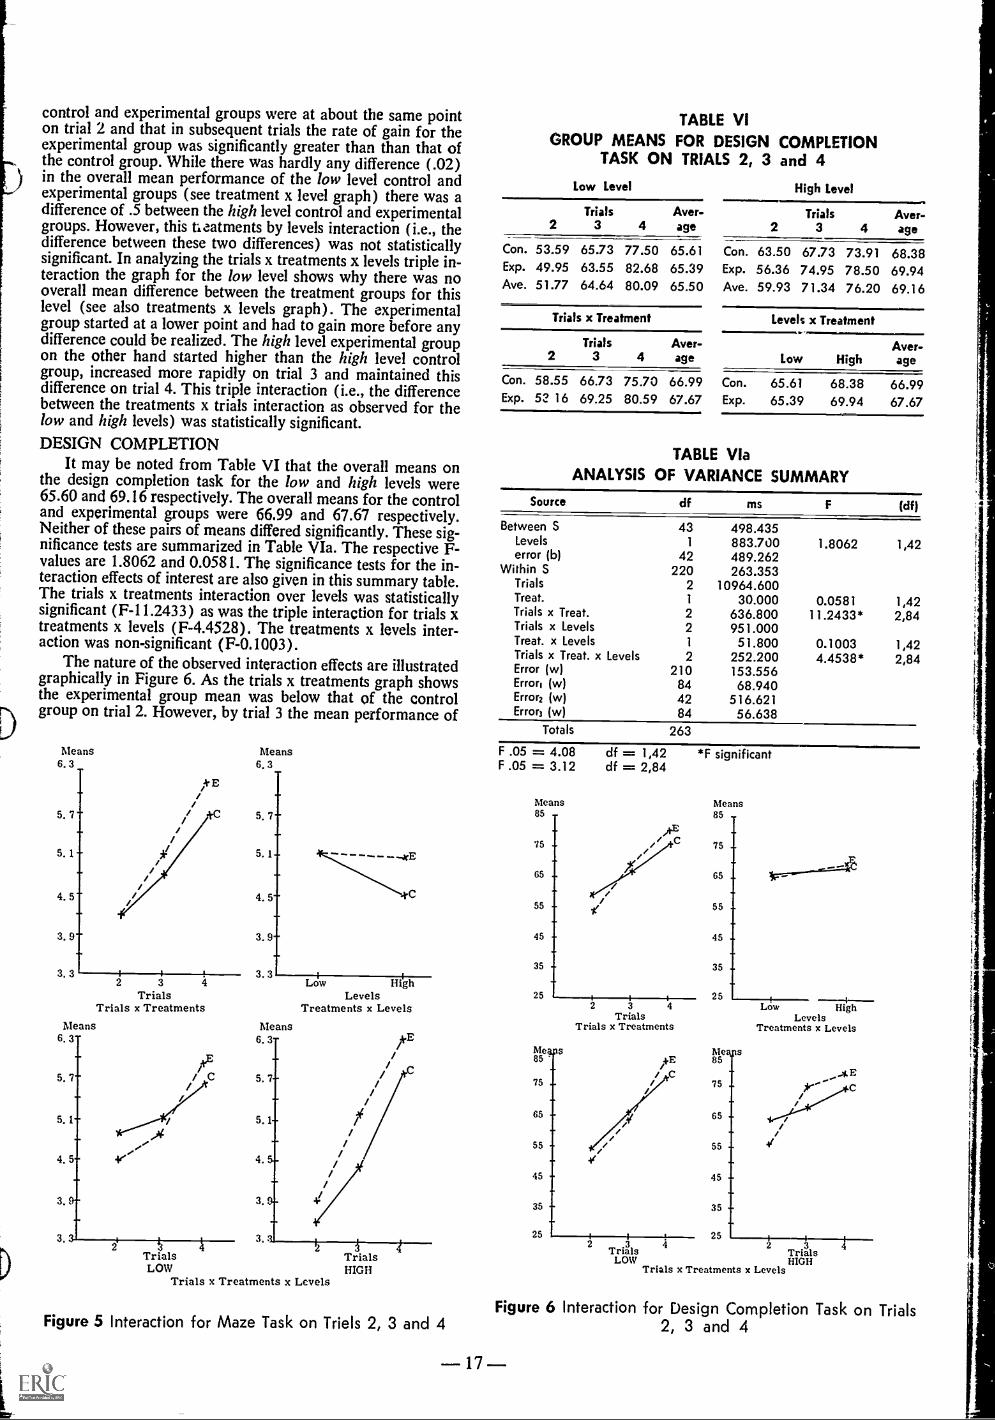
control and experimental groups were at about the same pointon trial 2 and that in subsequent trials the rate of gain for theexperimental group was significantly greater than than that ofthe control group. While there was hardly any difference (.02)in the overall mean performance of the low level control andexperimental groups (see treatment x level graph) there was adifference of .5 between the high level control and experimentalgroups. However, this treatments by levels interaction (i.e., thedifference between these two differences) was not statisticallysignificant. In analyzing the trials x treatments x levels triple in-teraction the graph for the low level shows why there was nooverall mean difference between the treatment groups for thislevel (see also treatments x levels graph). The experimentalgroup started at a lower point and had to gain more before anydifference could be realized. The high level experimental groupon the other hand started higher than the high level controlgroup, increased more rapidly on trial 3 and maintained thisdifference on trial 4. This triple interaction (i.e., the differencebetween the treatments x trials interaction as observed for thelow and high levels) was statistically significant.
DESIGN COMPLETIONIt may be noted from Table VI that the overall means on
the design completion task for the low and high levels were65.60 and 69.16 respectively. The overall means for the controland experimental groups were 66.99 and 67.67 respectively.Neither of these pairs of means differed significantly. These sig-nificance tests are summarized in Table VIa. The respective F-values are 1.8062 and 0.0581. The significance tests for the in-teraction effects of interest are also given in this summary table.The trials x treatments interaction over levels was statisticallysignificant (F-11.2433) as was the triple interaction for trials xtreatments x levels (F-4.4528). The treatments x levels inter-action was non-significant (F-0.1003).
The nature of the observed interaction effects are illustratedgraphically in Figure 6. As the trials x treatments graph showsthe experimental group mean was below that of the controlgroup on trial 2. However, by trial 3 the mean performance of
Means6. 3
....
5. 7
5. 1 -
4.5-
3. 9-
V E////////
33. 3 I
2i
TrialsTrials x Treatments
Means6. 3
.1E
5. 7 // C 5. 7
Means6.3
5. 7 -
5.1- -4E
4. 5-
3. 9
3. 3LOw High
5. 1
4. 5
LevelsTreatments x Levels
//
//
//
4./
3.
Trials TrialsLOW HIGH
Trials x Treatments x Levels
Figure 5 Interaction for Maze Task on Triels 2, 3 and 4
TABLE VIGROUP MEANS FOR DESIGN COMPLETION
TASK ON TRIALS 2, 3 and 4
Low Level High Level
Trials Aver- Trials Aver-2 3 4 age 2 3 4 age
Con. 53.59 65.73 77.50 65.61 Con. 63.50 67.73 73.91 68.38Exp. 49.95 63.55 82.68 65.39 Exp. 56.36 74.95 78.50 69.94Ave. 51.77 64.64 80.09 65.50 Ave. 59.93 71.34 76.20 69.16
Trials x Treatment Levels x Treatment
Trials Aver- Aver-2 3 4 age Low High age
Con. 58.55 66.73 75.70 66.99 Con. 65.61 68.38 66.99Exp. 52 16 69.25 80.59 67.67 Exp. 65.39 69.94 67.67
TABLE VlaANALYSIS OF VARIANCE SUMMARY
Source df ms F (df)
Between S 43 498.435Levels 1 883.700 1.8062 1,42error (b) 42 489.262
Within S 220 263.353Trials 2 10964.600Treat. 1 30.000 0.0581 1,42Trials x Treat. 2 636.800 11.2433* 2,84Trials x Levels 2 951.000Treat. x Levels 1 51.800 0.1003 1,42Trials x Treat. x Levels 2 252.200 4.4538* 2,84Error (w) 210 153.556Error, (w) 84 68.940Error2 (w) 42 516.621Error3 (w) 84 56.638
Totals 263
F .05 = 4.08 df = 1,42 *F significantF .05 = 3.12 df = 2,84
Means Means85 85
75
65
55
45
35
25
AC
2 3Trials
Trials x Treatments
75
65
55
45
35
25 -4.-4 Low High
LevelsTreatments x Levels
Me S Me s85 /+E 85
/ C ..- A E/75 / 75 C
65
55
45
35
65//
55 4/
45
35
25 253Trials Tria3ls
LOW HIGHTrials x Treatments x Levels
Figure 6 Interaction for Design Completion Task on Trials2, 3 and 4
- 17 -
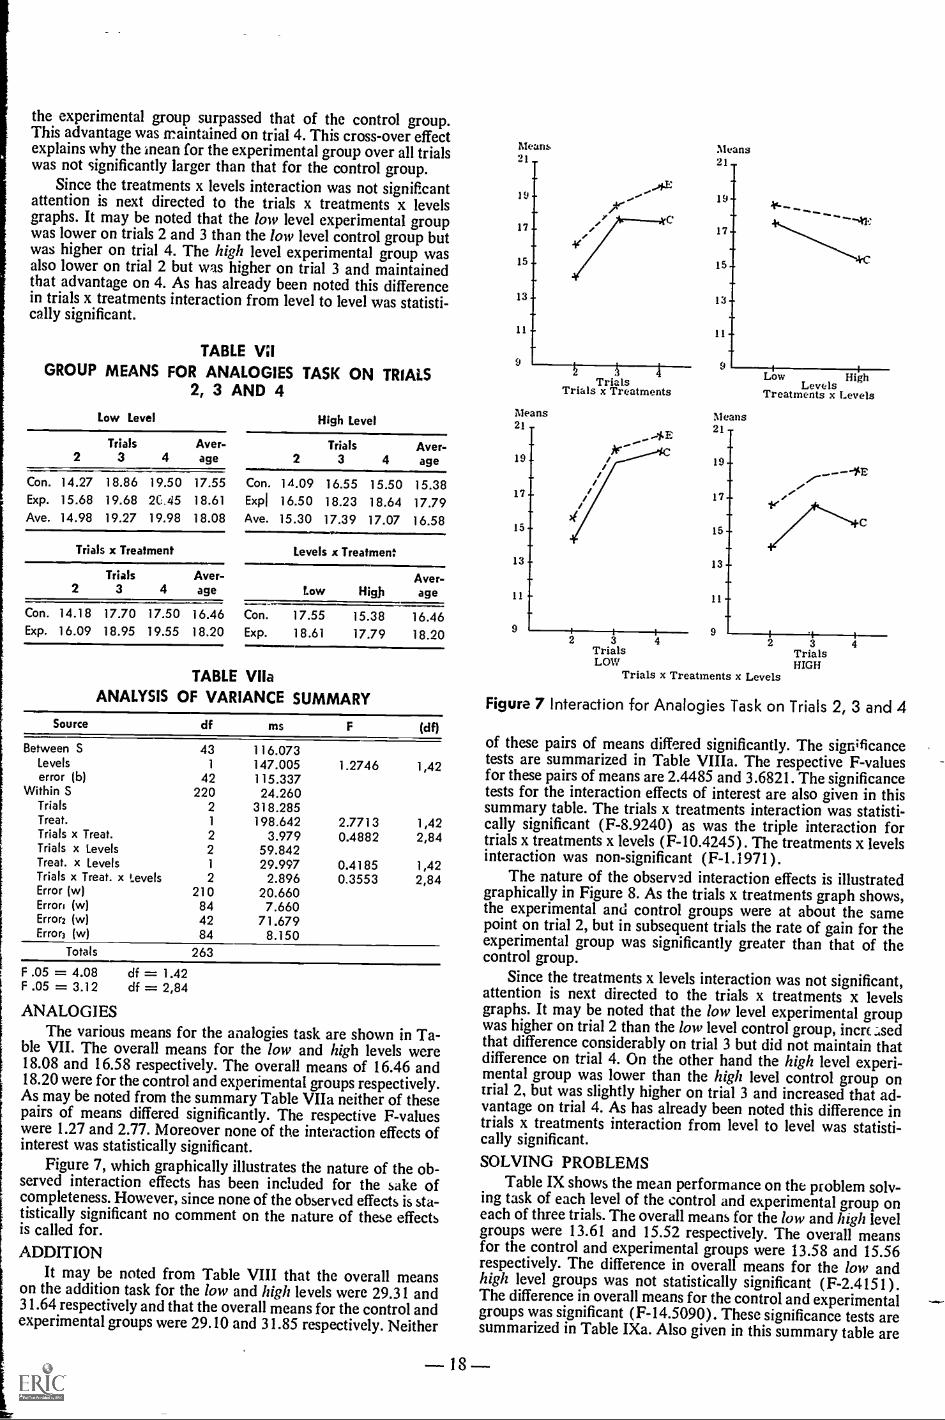
1
the experimental group surpassed that of the control group.This advantage was maintained on trial 4. This cross-over effectexplains why the inean for the experimental group over all trialswas not significantly larger than that for the control group.
Since the treatments x levels interaction was not significantattention is next directed to the trials x treatments x levelsgraphs. It may be noted that the low level experimental groupwas lower on trials 2 and 3 than the low level control group butwas higher on trial 4. The high level experimental group wasalso lower on trial 2 but was higher on trial 3 and maintainedthat advantage on 4. As has already been noted this differencein trials x treatments interaction from level to level was statisti-cally significant.
TABLE VIIGROUP MEANS FOR ANALOGIES TASK ON TRIALS
2, 3 AND 4Low Level High Level
Trials Aver- Trials Aver-2 3 4 age 2 3 4 age
Con. 14.27 18.86 19.50 17.55 Con. 14.09 16.55 15.50 15.38Exp. 15.68 19.68 2C.45 18.61 Expl 16.50 18.23 18.64 17.79Ave. 14.98 19.27 19.98 18.08 Ave. 15.30 17.39 17.07 16.58
Trials x Treatment Levels x Treatment
Trials2 3 4
Aver-age
Aver-Low High age
Con. 14.18 17.70 17.50 16.46 Con.Exp. 16.09 18.95 19.55 18.20 Exp.
17.55 15.38 16.4618.61 17.79 18.20
TABLE VilaANALYSIS OF VARIANCE SUMMARY
Source df ms F (df)
Between S 43 116.073Levels 1 147.005 1.2746 1,42error (b) 42 115.337
Within S 220 24.260Trials 2 318.285Treat. 1 198.642 2.7713 1,42Trials x Treat. 2 3.979 0.4882 2,84Trials x Levels 2 59.842Treat. x Levels 1 29.997 0.4185 1,42Trials x Treat. x Levels 2 2.896 0.3553 2,84Error (w) 210 20.660Errors (w) 84 7.660Error2 (w) 42 71.679Error3 (w) 84 8.150
Totals 263
F .05 = 4.08 df = 1.42F .05 = 3.12 df = 2,84
ANALOGIESThe various means for the analogies task are shown in Ta-
ble VII. The overall means for the low and high levels were18.08 and 16.58 respectively. The overall means of 16.46 and18.20 were for the control and experimental groups respectively.As may be noted from the summary Table VIIa neither of thesepairs of means differed significantly. The respective F-valueswere 1.27 and 2.77. Moreover none of the interaction effects ofinterest was statistically significant.
Figure 7, which graphically illustrates the nature of the ob-served interaction effects has been included for the sake ofcompleteness. However, since none of the observed effects is sta-tistically significant no comment on the nature of these effectsis called for.
ADDITIONIt may be noted from Table VIII that the overall means
on the addition task for the low and high levels were 29.31 and31.64 respectively and that the overall means for the control andexperimental groups were 29.10 and 31.85 respectively. Neither
19
17
15
13
11
TrialsTrials x Treatments
Means21
19
17
15
13-
11-
9
Means21-
19
/
Means21
_-- ....4Eif/ 19/
/17 // 11/
15 15
13 13
11 11-
9 9
Low HighLevels
Treatments x Levels
I *I I3 4
TrialsHIGH
2 3 4 2TrialsLOW
Trials x Treatments x Levels
Figure 7 Interaction for Analogies Task on Trials 2, 3 and 4
of these pairs of means differed significantly. The sign;ficancetests are summarized in Table Villa. The respective F-valuesfor these pairs of means are 2.4485 and 3.6821. The significancetests for the interaction effects of interest are also given in thissummary table. The trials x treatments interaction was statisti-cally significant (F-8.9240) as was the triple interaction fortrials x treatments x levels (F-10.4245). The treatments x levelsinteraction was non-significant (F-1.1971).
The nature of the observed interaction effects is illustratedgraphically in Figure 8. As the trials x treatments graph shows,the experimental and control groups were at about the samepoint on trial 2, but in subsequent trials the rate of gain for theexperimental group was significantly greater than that of thecontrol group.
Since the treatments x levels interaction was not significant,attention is next directed to the trials x treatments x levelsgraphs. It may be noted that the low level experimental groupwas higher on trial 2 than the low level control group, increasedthat difference considerably on trial 3 but did not maintain thatdifference on trial 4. On the other hand the high level experi-mental group was lower than the high level control group ontrial 2, but was slightly higher on trial 3 and increased that ad-vantage on trial 4. As has already been noted this difference intrials x treatments interaction from level to level was statisti-cally significant.
SOLVING PROBLEMSTable IX shows the mean performance on the problem solv-
ing task of each level of the control and experimental group oneach of three trials. The overall means for the low and high levelgroups were 13.61 and 15.52 respectively. The overall meansfor the control and experimental groups were 13.58 and 15.56respectively. The difference in overall means for the low andhigh level groups was not statistically significant (F-2.4151).The difference in overall means for the control and experimentalgroups was significant (F-14.5090). These significance tests aresummarized in Table IXa. Also given in this summary table are
- 18 -
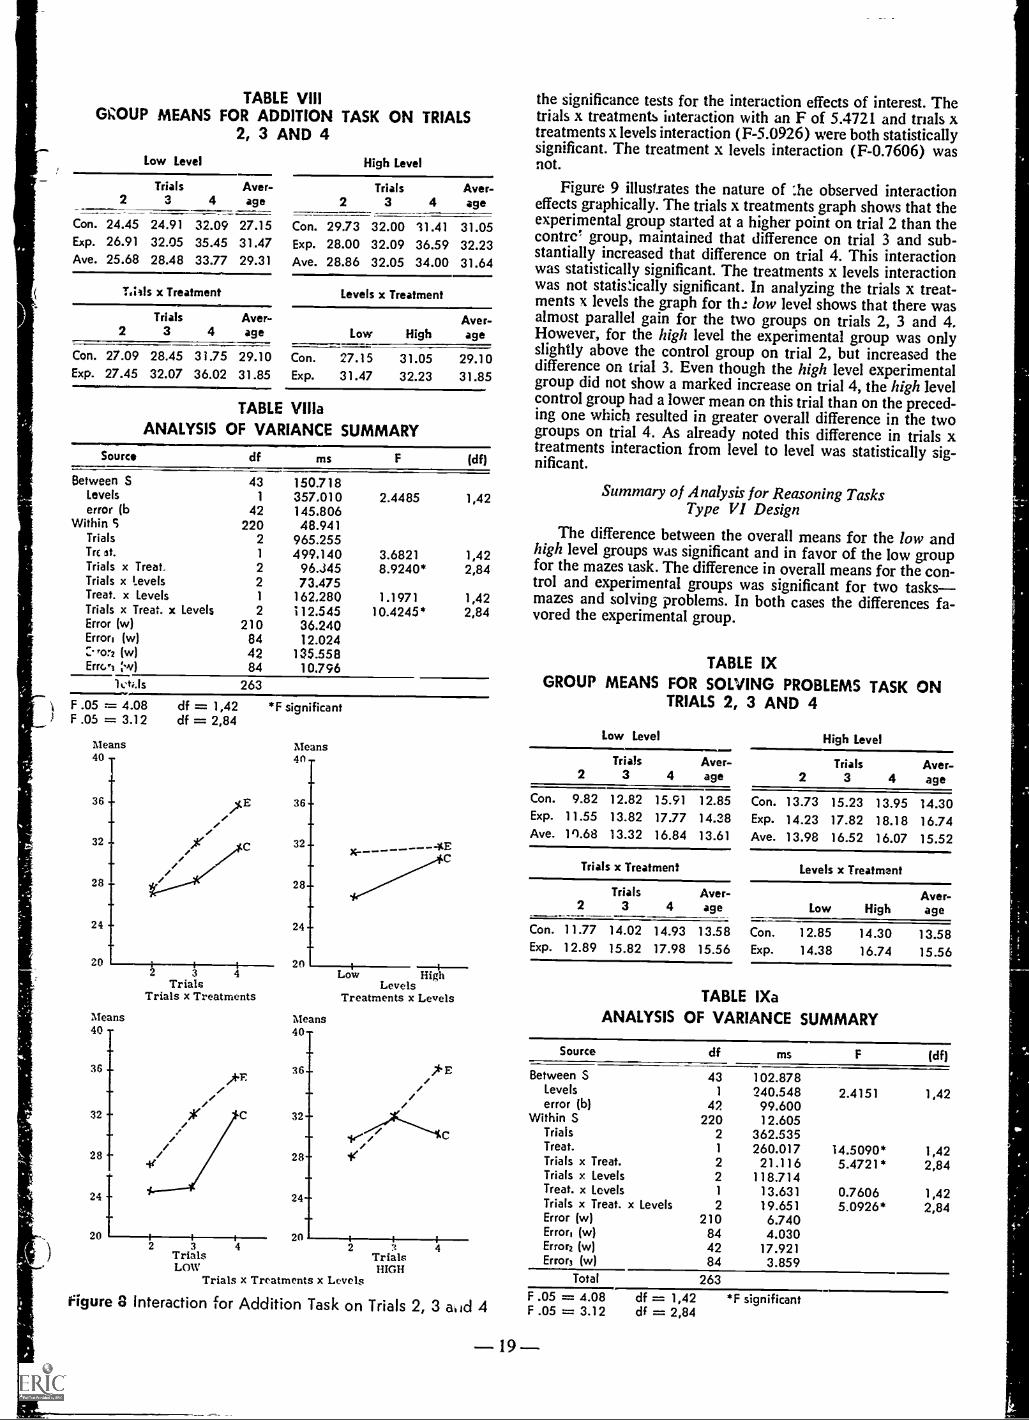
TABLE VIII the significance tests for the interaction effects of interest. TheGROUP MEANS FOR ADDITION TASK ON TRIALS trials x treatments interaction with an F of 5.4721 and trials x
2, 3 AND 4 treatments x levels interaction (F-5.0926) were both statistically
Low Level High Level
Trials Aver- Trials Aver-2 3 4 age 2 3 4 age
Con. 24.45 24.91 32.09 27.15 Con. 29.73 32.00 11.41 31.05Exp. 26.91 32.05 35.45 31.47 Exp. 28.00 32.09 36.59 32.23Ave. 25.68 28.48 33.77 29.31 Ave. 28.86 32.05 34.00 31.64
significant. The treatment x levels interaction (F-0.7606) wasnot.
Figure 9 illustrates the nature of :he observed interactioneffects graphically. The trials x treatments graph shows that theexperimental group started at a higher point on trial 2 than thecontrc' group, maintained that difference on trial 3 and sub-stantially increased that difference on trial 4. This interactionwas statistically significant. The treatments x levels interactionwas not statistically significant. In analyzing the trials x treat-tills x Treatment Levels x Treatmentments x levels the graph for th.: low level shows that there was
Trials Aver- Aver- almost parallel gain for the two groups on trials 2, 3 and 4.2 3 4 age Low High age However, for the high level the experimental group was only
Con. 27.09 28.45 3 i .75 29.10 Con. 27.15 31.05 29.10Exp. 27.45 32.07 36.02 31.85 Exp. 31.47 32.23 31.85
slightly above the control group on trial 2, but increased thedifference on trial 3. Even though the high level experimentalgroup did not show a marked increase on trial 4, the high levelcontrol group had a lower mean on this trial than on the preced-TABLE Villa ing one which resulted in greater overall difference in the two
ANALYSIS OF VARIANCE SUMMARY groups on trial 4. As already noted this difference in trials xSource df ms F (df)
Between S 43 150.718Levels 1 357.010 2.4485 1,42error (b 42 145.806
Within S 220 48.941Trials 2 965.255Tr( st. 1 499.140 3.6821 1,42Trials x Treat. 2 96.445 8.9240* 2,84Trials x Levels 2 73.475Treat. x Levels 1 162.280 1.1971 1,42Trials x Treat. x Levels 2 112.545 10.4245* 2,84Error (w) 210 36.240Error, (w) 84 12.024
rorz (w) 42 135.558Errs.; 84 10.796
263
F .05 = 4.08 df = 1,42 *F significantF .05 = 3.12 df = 2,84
Means40
36
32
28
24
20
)(E
Means40 y
36
32-
28-
24-
20 1
2 3 4 Low HighTrials Levels
Trials x Treatments Treatments x LevelsMeans Means40 -
36 -
32 -
/28
24
20 I i
40-_
36-/
,'E/
32-
28- le-
24-_
t 20 i i I2 3 4 2 3 4Trials Trials
LOW HIGHTrials x Treatments x Levels
figure 8 interaction for Addition Task on Trials 2, 3 acid 4
treatments interaction from level to level was statistically sig-nificant.
Summary of Analysis for Reasoning TasksType VI Design
The difference between the overall means for the low andhigh level groups was significant and in favor of the low groupfor the mazes task. The difference in overall means for the con-trol and experimental groups was significant for two tasks-mazes and solving problems. In both cases the differences fa-vored the experimental group.
TABLE IXGROUP MEANS FOR SOLVING PROBLEMS TASK ON
TRIALS 2, 3 AND 4
Low Level High Level
Trials--Aver- Trials Aver-
2 3 4 age 2 3 4 age
Con. 9.82 12.82 15.91 12.85 Con. 13.73 15.23 13.95 14.30Exp. 11.55 13.82 17.77 14.38 Exp. 14.23 17.82 18.18 16.74Ave. 111.68 13.32 16.84 13.61 Ave. 13.98 16.52 16.07 15.52
Trials x Treatment Levels x Treatment
Trials2 3 4
Aver-age Low High
Aver-age
Con. 11.77 14.02 14.93 13.58 Con. 12.85 14.30 13.58Exp. 12.89 15.82 17.98 15.56 Exp. 14.38 16.74 15.56
TABLE IXaANALYSIS OF VARIANCE SUMMARY
Source df ms F (df)
Between S 43 102.878Levels 1 240.548 2.4151 1,42error (b) 42 99.600
Within S 220 12.605Trials 2 362.535Treat. 1 260.017 14.5090* 1,42Trials x Treat. 2 21.116 5.4721* 2,84Trials x Levels 2 118.714Treat. x Levels 1 13.631 0.7606 1,42Trials x Treat. x Levels 2 19.651 5.0926* 2,84Error (w) 210 6.740Error, (w) 84 4.030Error2 (w) 42 17.921Error) (w) 84 3.859
Total 263F .05 = 4.08 df = 1,42 *F significantF .05 = 3.12 df = 2,84
- 19-
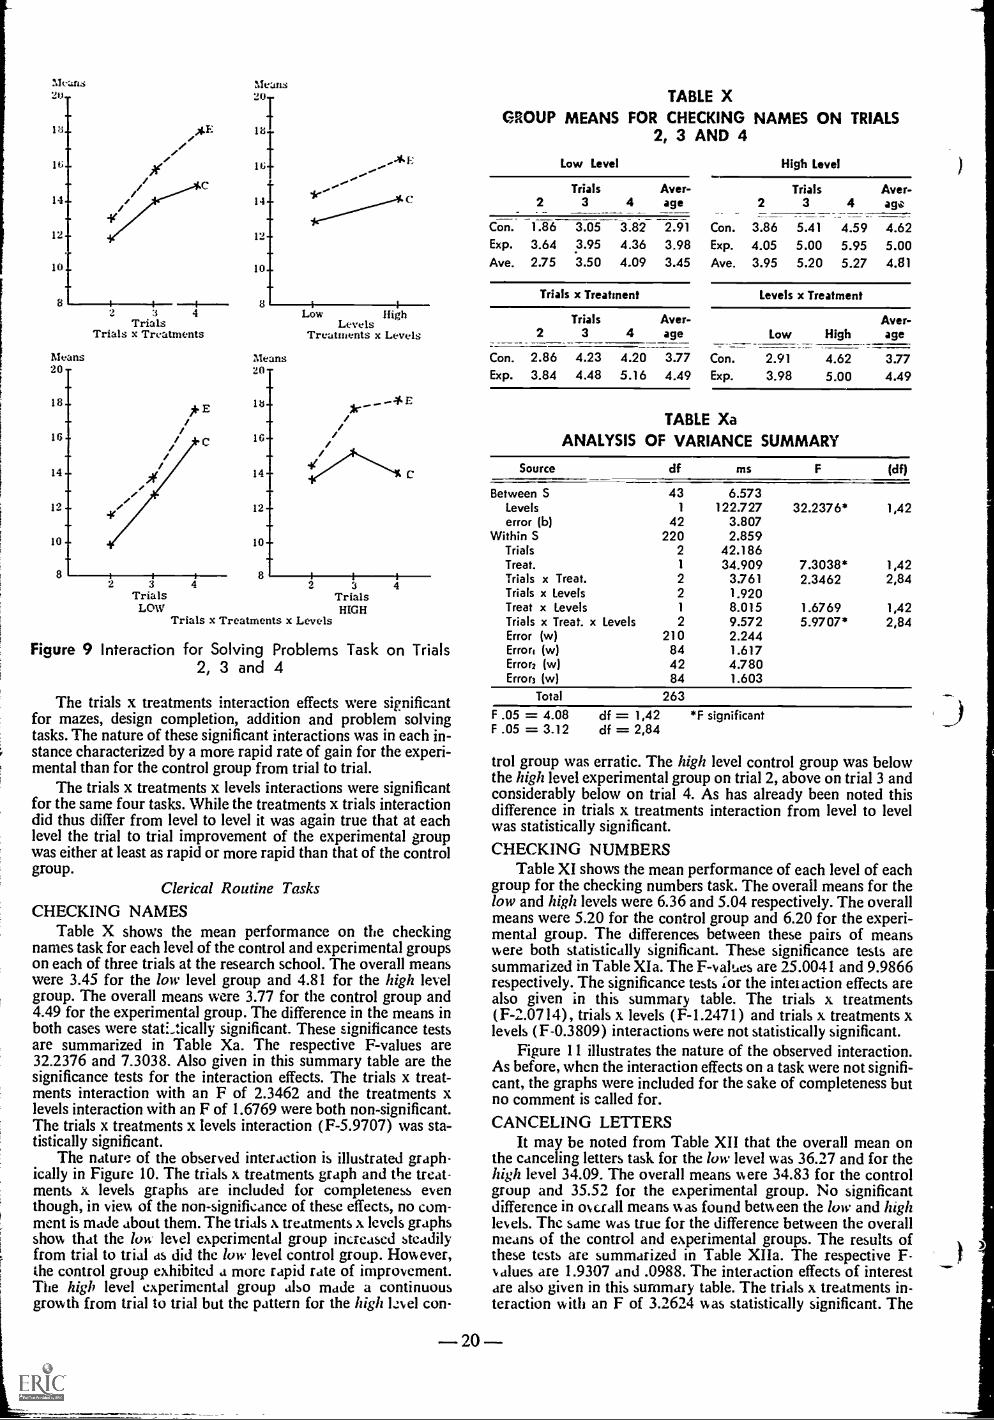
:%Ieans21J-
10-
2 3 4Trials
Trials x Treatments
8 i 1
Low HighLevels
Treatments x Levels
Means Means20- 20-
12
10
lb
16
10-
8 t i t 82 3 4
TrialsLOW
lr-...-4E//
2 3 4TrialsHIGH
Trials x Treatments x Levels
Figure 9 Interaction for Solving Problems Task on Trials2, 3 and 4
The trials x treatments interaction effects were significantfor mazes, design completion, addition and problem solvingtasks. The nature of these significant interactions was in each in-stance characterized by a more rapid rate of gain for the experi-mental than for the control group from trial to trial.
The trials x treatments x levels interactions were significantfor the same four tasks. While the treatments x trials interactiondid thus differ from level to level it was again true that at eachlevel the trial to trial improvement of the experimental groupwas either at least as rapid or more rapid than that of the controlgroup.
Clerical Routine TasksCHECKING NAMES
Table X shows the mean performance on the checkingnames task for each level of the control and experimental groupson each of three trials at the research school. The overall meanswere 3.45 for the low level group and 4.81 for the high levelgroup. The overall means were 3.77 for the control group and4.49 for the experimental group. The difference in the means inboth cases were statistically significant. These significance testsare summarized in Table Xa. The respective F-values are32.2376 and 7.3038. Also given in this summary table are thesignificance tests for the interaction effects. The trials x treat-ments interaction with an F of 2.3462 and the treatments xlevels interaction with an F of 1.6769 were both non-significant.The trials x treatments x levels interaction (F-5.9707) was sta-tistically significant.
The nature of the observed interaction is illustrated graph-ically in Figure 10. The trials x treatments graph and the treat-ments x levels graphs are included for completeness eventhough, in view of the non-significance of these effects, no com-ment is made about them. The trials x treatments x levels graphsshow that the low level experimental group increased steadilyfrom trial to trial as did the low level control group. However,the control group exhibited a more rapid rate of improvement.The high level experimental group also made a continuousgrowth from trial to trial but the pattern for the high k.Nel con-
TABLE XGROUP MEANS FOR CHECKING NAMES ON TRIALS
2, 3 AND 4Low Level High Level
2Trials
3 4Aver-age 2
Trials3 4
Aver-ay.'
Con. 1.86 3.05 3.82 2.91 Con. 3.86 5.41 4.59 4.62Exp. 3.64 3.95 4.36 3.98 Exp. 4.05 5.00 5.95 5.00Ave. 2.75 3.50 4.09 3.45 Ave. 3.95 5.20 5.27 4.81
Trials x Treatment Levels x Treatment
Trials Aver-2 3 4 age Low
Con. 2.86 4.23 4.20 3.77 Con. 2.91Exp. 3.84 4.48 5.16 4.49 Exp. 3.98
Aver-High age
4.62 3.775.00 4.49
TABLE XaANALYSIS OF VARIANCE SUMMARY
Source df ms F (df)
Between S 43 6.573Levels 1 122.727 32.2376* 1,42error (b) 42 3.807
Within S 220 2.859Trials 2 42.186Treat. 1 34.909 7.3038* 1,42Trials x Treat. 2 3.761 2.3462 2,84Trials x Levels 2 1.920Treat x Levels 1 8.015 1.6769 1,42Trials x Treat. x Levels 2 9.572 5.9707* 2,84Error (w) 210 2.244Error' (w) 84 1.617Error2 (w) 42 4.780Error3 (w) 84 1.603
Total 263
F .05 = 4.08F .05 = 3.12
df = 1,42df = 2,84
*F significant
trol group was erratic. The high level control group was belowthe high level experimental group on trial 2, above on trial 3 andconsiderably below on trial 4. As has already been noted thisdifference in trials x treatments interaction from level to levelwas statistically significant.
CHECKING NUMBERSTable XI shows the mean performance of each level of each
group for the checking numbers task. The overall means for thelow and high levels were 6.36 and 5.04 respectively. The overallmeans were 5.20 for the control group and 6.20 for the experi-mental group. The differences between these pairs of meanswere both statistically significant. These significance tests aresummarized in Table XIa. The F-values are 25.0041 and 9.9866respectively. The significance tests ;or the inter action effects arealso given in this summary table. The trials x treatments(F-2.0714), trials x levels (F-1.2471) and trials x treatments xlevels (F-0.3809) interactions were not statistically significant.
Figure 11 illustrates the nature of the observed interaction.As before, when the interaction effects on a task were not signifi-cant, the graphs were included for the sake of completeness butno comment is called for.
CANCELING LETTERSIt may be noted from Table XII that the overall mean on
the canceling letters task for the low level was 36.27 and for thehigh level 34.09. The overall means were 34.83 for the controlgroup and 35.52 for the experimental group. No significantdifference in overall means was found between the low and highlevels. The same was true for the difference between the overallmeans of the control and experimental groups. The results ofthese tests are summarized in Table XIIa. The respective F-Nalues are 1.9307 and .0988. The interaction effects of interestare also given in this summary table. The trials x treatments in-teraction with an F of 3.2624 was statistically significant. The
- 20 -
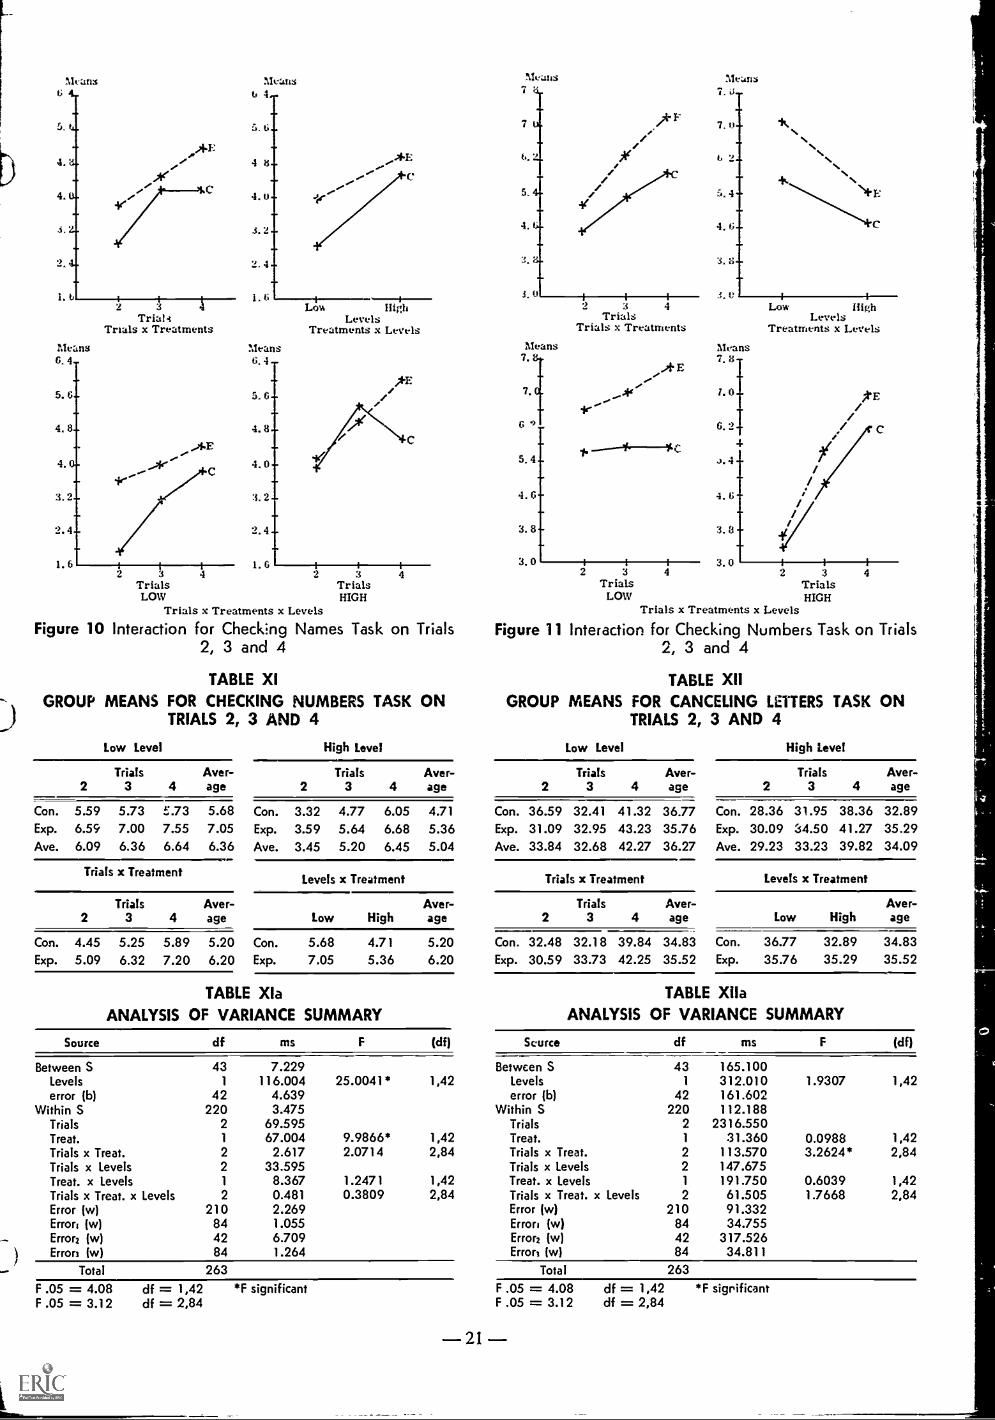
Means
TrialTrials x Treatments
Means6. 4
4. 8
3.2
2.4
1. 6
1.6Low High
LevelsTreatments x Levels
Means6.4 -
5. 6
4. 8
4.0
3. 2
2.4
1.62 3 4 2 3 4
TrialsHIGH
TrialsLOW
Trials x Treatments x Levels
Figure 10 Interaction for Checking Names Task on Trials2, 3 and 4
Nleans7 7.
3. 0
A-F 7.
5. 4
4. 6
3.8
R. I)
2 4 Low HighTrials Levels
Trials x Treatments Treatments x Levels
7.0.
6 1_
5. 4
4. 6
3.8-
Means :Mans7.8. 7. 8
.11* E
7. -
6. 2
J. 4 -
4. t;
3. 8
3.03.02 3 4 2 3
Trials TrialsLOW HIGH
Trials x Treatments x Levels
Figure 11 Interaction for Checking Numbers Task on Trials2, 3 and 4
TABLE XI TABLE XIIGROUP MEANS FOR CHECKING NUMBERS TASK ON GROUP MEANS FOR CANCELING LETTERS TASK ON
TRIALS 2, 3 AND 4 TRIALS 2, 3 AND 4
Low Level High Level
Trials Aver- Trials Aver-2 3 4 age 2 3 4 age
Con. 5.59 5.73 v.73 5.68 Con. 3.32 4.77 6.05 4.71
Exp. 6.59 7.00 7.55 7.05 Exp. 3.59 5.64 6.68 5.36Ave. 6.09 6.36 6.64 6.36 Ave. 3.45 5.20 6.45 5.04
Trials x TreatmentLevels x Treatment
Low Level High Level
2Trials
3 4Aver-age 2
Trials3 4
Aver-age
Con. 36.59 32.41 41.32 36.77 Con. 28.36 31.95 38.36 32.89Exp. 31.09 32.95 43.23 35.76 Exp. 30.09 34.50 41.27 35.29Ave. 33.84 32.68 42.27 36.27 Ave. 29.23 33.23 39.82 34.09
Trials x Treatment Levels x Treatment
Trials Aver- Aver- Trials Aver- Aver-2 3 4 age Low High age 2 3 4 age Low High age
Con. 4.45Exp. 5.09 6.32 7.20 6.20 Exp. 7.05
5.25 5.89 5.20 Con. 5.68 4.71 5.20 Con. 32.48 32.18 39.84 34.83 Con. 36.77 32.89 34.835.36 6.20 Exp. 30.59 33.73 42.25 35.52 Exp. 35.76 35.29 35.52
TABLE XIa TABLE XllaANALYSIS OF VARIANCE SUMMARY ANALYSIS OF VARIANCE SUMMARY
Source df ms F (df) Source df ms F (df)
Total 263
Between S 43 7.229Levels 1 116.004 25.0041* 1,42error (b) 42 4.639
Within S 220 3.475Trials 2 69.595Treat. 1 67.004 9.9866* 1,42Trials x Treat. 2 2.617 2.0714 2,84Trials x Levels 2 33.595Treat. x Levels 1 8.367 1.2471 1,42Trials x Treat. x Levels 2 0.481 0.3809 2,84Error (w) 210 2.269Error, (w) 84 1.055Error2 (w) 42 6.709Errors (w) 84 1.264
F .05 = 4.08F .05 = 3.12
df = 1,42df = 2,84
*F significant
Between S 43 165.100Levels 1 312.010 1.9307 1,42error (b) 42 161.602
Within S 220 112.188Trials 2 2316.550Treat. 1 31.360 0.0988 1,42Trials x Treat. 2 113.570 3.2624* 2,84Trials x Levels 2 147.675Treat. x Levels 1 191.750 0.6039 1,42Trials x Treat. x Levels 2 61.505 1.7668 2,84Error (w) 210 91.332Error, (w) 84 34.755Error2 (w) 42 317.526Errors (w) 84 34.811
Total 263
F .05 = 4.08F .05 = 3.12
df = 1,42df = 2,84
*F significant
- 21 -

treatments x levels and the trials x treatments x levels interactionwith F values of 0.6039 and 1.7668 respectively were not sig-nificant.
Figure 12 shows the nature of the observed interactiongraphically. The trials x treatment graph shows that the experi-mental group was lower than the control group on trial 2, washigher on trial 3 and increased that difference on trial 4. As inthe case of the design completion task, this cross-over effect ex-plains why the mean for the experimental group over all trialswas not significantly larger than that for the control group. Thisdifference in rate of gain was significant. Although the interac-tion effects for treatments x levels and trials x treatments x levelsv ere not significant, the graphs illustrating the interaction areincluded for completeness.
CANCELING NUMBERSThe various means for the canceling-numbers task are
shown in Table XIII. The overall means for the low and highlevels were 53.70 and 51.45 respectively. The overall means of51.63 and 53.32 apply respectively to the control and experi-mental groups. As may be noted from the summary Table XIIIaneither of these pairs of means differ significantly. The respec-tive F-values are 1.7012 and a5529. Moreover, only one of theinteraction effects of interest was statistically significant. Thisone was the trials x treatments x levels interaction with an F of8.8986.
The nature of the observed interaction effects are illustratedgraphically in Figure 13. The trials x treatments and treatmentsx levels interaction graphs are included for completeness. In thecase of the trials x treatments x levels triple interaction thegraph for the low level shows the experimental group to be at alower point on trial 2, a higher point on trial 3 and a lower pointagain on trial 4. The high level experimental group, on the otherhand, started higher than the high level control group, was stillabove, though not by as much, on trial 3 but again increased thedifference on trial 4. This triple interaction as observed for thelow and high levels was significant.
Means46-
42
38-
34-
30-
26
Means46-
42-
38
34-
30-
26
22 22
Means46-
42
38-
34-
2 3 4Trials
Trials x Treatments
/
PE/C
Means46-
42
38
34-
30- 30-
Low HighLevels
Treatments x Levels
26- 26- -
22 222 .i 4 2 3 4
Trials TrialsLOW HIGH
Trials x Treatments x Levels
LFigure 12 Interaction for Canceling Letters Task on Trials2, 3 and 4
Sturm:au of Analysis for Clerical RoutineTasks-Type VI Design
The difference between the overall means for the low andhigh level groups ,.1S significan; and in favor of the high levelfor the checking-names task and significant but in favor of the/ow level group on the checking numbers task. The difference inthe overall means of the control and experimental groups Wasalso significant for the same tasks. In both instances the ad-vantage favored the experimental group.
TABLE XIIIGROUP MEANS FOR CANCELING NUMBERS TASK ON
TRIALS 2, 3 AND 4
Low Level High Level
Trials Aver- Trials Aver-2 3 4 age 2 3 4 age
Con. 46.82 52.59 62.45 53.95 Con. 46.95 53.27 47.68 49.30Exp. 45.86 55.59 58.91 53.45 Exp. 50.86 53.95 55.95 53.59Ave. 46.34 54.09 60.68 53.70 Ave. 48.91 53.61 51.82 51.45
Trials x Treatment Levels x Treatment
Trials2 3
Aver-4 age
Aver-Low High ago
Con. 46.89 52.93 55.07 51.63 Con. 53.95 49.30 51.63Exp. 48.36 54.77 57.43 53.52 Exp. 53.45 53.59 53.52
TABLE XIIIaANALYSIS OF VARIANCE SUMMARY
Source df ms F (df)
Between S 43 200.962Levels 1 336.390 1.7012 1,42error 42 197.737
Within S 220 133.542Trials 2 1744.145
Treat. 1 236.740 0.5529 1,42Trials x Treat. 2 4.355 0.1410 2,84Trials x Levels 2 771.055Treat. x Levels 1 378.220 0.8834 1,42Trials x Treat. x Levels 2 274.805 8,8986* 2,84Error (w) 210 110.359Errors (w) 84 30.938Error2 (w) 42 428.158Errors (w) 84 30.882
Total 263F .05 = 4.08 df = 1,42 *F significantF .05 = 3.12 df = 2,84
The trials x treatments interaction effect was significant forthe canceling letters task. The nature of this significant interac-tion was characterized by a more rapid rate of gain from trial totrial for the experimental group than for the control group.
The trials x treatments x levels interaction effects were sig-nificant for the checking names and canceling numbers tasks.On the checking names task the low level control group appearedto be making more rapid trial to trial progress than the low levelexperimental group. Though the pattern was erratic, this did notseem to be true of the high level groups. However, on the whole,the experimental group tended to be superior to the controlgroup on all trials at both levels, a fact consistent with the previ-ously mentioned overall superiority of the experimental group.On the canceling numbers task there was not much basis forchoice between the two treatments for the low level group, butthe experimental treatment appeared to have the advantage inthe case of the high level group.
Analysis of Variance by Type I Design
Consideration is now given to the statistical significance ofthe difference between the overall means of the control and ex-
- 22 --

TABLE XIVMeans MeansGROUP MEANS FOR MAZES TASK ON TRIAL 5
44 - 44 -
40 40 1 I2 3 4 Low HighTrials Levels
Trials x Treatments Treatments x LevelsMeans Means
-
GO - 60 -.,÷E.
56 - y 56 ....xi.. E
52 -
48 -
44 -
402 3 4
TrialsLOW
52
48 -
44
40
..- --
2 3 4TriaisHIGH
Trials x Treatments x Levels
Figure 13 Interaction for Canceling Numbers Task on Trials2, 3 and 4
Levels x Treatment
Low HighAver-age
Con. 5.41 5.09 5.25Exp. 5.32 6.09 5.70
TABLE XIVaANALYSIS OF VARIANCE SUMMARY
Source df ms F (df)
Between S 43 0.790Levels 1 1.136error (b) 42 0.781
Within S 44 0.909Treat. 1 4.545 6.6307* 1,42Treat. x Levels 1 6.546 9.5095* 1,42error (w) 42 0.688
Total 87
F .05 = 4.08 df = 1,42 *F significant
5 b.
S
5 4.
////
//
/
/////
/
//
/
/
perimental groups on trial 5. The test for significance, using F 4(as the test statistic and .05 as the significance level was carriedout for each of the criterion measures. $ 2
Reasoning TasksMAZES
As shown in Table XIV the means' on this fifth trial for themazes task were 5.25 for the control group and 5.70 for the ex-perimental group. The difference between these means was sta-tistically significant. The significance test is summarized in Ta-ble XIVa. The F-value for the difference between these twomeans is 6.6307. Also summarized in Table XIVa is the signifi-cance test for the treatments x levels interaction effect. This in-teraction was statistically significant (F-9.5095).
The nature of this observed interaction is illustrated graph-ically in Figure 14. There was little difference between the lowlevel experimental and control groups but a considerable differ-ence between the high level experimental and control groups.
DESIGN COMPLETIONOn the design completion task the means on the fifth trial
were 72. 2 for the control group and 79.00 for the experimentalgroup ee Table XV). The difference between these means wasst ically significant (F-4.1477). The significance test is sum-marized in Table XVa. The test for the treatments x levels In-teraction effect was not significant (F-.0943).
ANALOGIES
The means for the analogies task are shown in Table XVI.The control group mean was 16.48 and the experimental groupmean was 19.32. The F-test (see Table XVIa) indicated thatthe difference between these two means was significant (F-7.3906). The treat tents x levels interaction effect was not sig-nificant (F-0.0800).
LowLes els
Treatment, x Lovelx
Figure 14 Interaction for Mazes Task on Last Trial
TABLE XVGROUP MEANS FOR DESIGN COMPLETION TASK ON
TRAIL 5Levels x Treatment
Aver-Low High age
Con. 79.86 65.18 72.52Exp. 85.36 72.64 79.00
TABLE XVaANALYSIS OF VARIANCE SUMMARY
Source df ms F (df)
Between S 43 342.733Levels 1 4131.920error (b) 42 252.514
Within S 44 233.875Treat. 1 923.020 4.1477* 1,42Treat. x Levels 1 20.980 0.0943 1,42error (w) 42 222.536
Total 87
F .05 = 4.08 df = 1,42 *F significant
23
ADDITIONThe means on the addition task were 31.59 for the control
group and 35.30 for the experimental group as shown in TableXVII. The difference between these two means was significant(F-7.2049, see Table XVIIa). The treatments x levels interac-tion effect was not significant (F-.9439).
SOLVING PROBLEMS
The means for the problem solving task are given in TableXVIII. The means for the control and experimental groups werei 3.4 i and 17.84 respectively. The difference between these twomeans was statistically significant (F-34.3466, see TableXVIIIa). There was no significant treatments x levels interac-tion effect for this task (F-1.8292).Sun :mar) of Analysis for Reasoning Tasks-Type 1 Design
The difference between the experimental and control groupsmeans on trial 5 were statistically significant for all of the rea-soning tasks at the .05 level. In every case the advantage laywith the experimental group.
A significant treatments x levels interaction was observedonly in the case of the mazes task. For all practical purposesthere was no difference between the means of the low level con-trol and experimental groups on this task. However, the meanperformance of the high level experimental group was markedlysuperior to that of the high level control group.
Clerical Routine Tasks
CHECKING NAMESThe means for the two groups on the checking names tasks
are shown in Table XIX. The mean for the control group was3.89. The mean for the experimental group was 5.14. The dif-ference between these means was found to be significant (F-13.5476). This significance test is summarized in Table XIXa.Again, there was no significant treatments x levels interactioneffect (F-0.2195) .
TABLE XVIGROUP MEANS FOR ANALOGIES TASK ON TRIAL 5
Levels x Treatment
Aver-Low High age
Con. 16.73 16.26 16.48
Exp. 19.86 18.77 19.32
TABLE XVIaANALYSIS OF VARIANCE SUMMARY
Source df ms F (df)
Between S 43 6L572Levels 1 13.920error 42 62.706
Within S 44 27.011Treat. 1 177.555 7.3906* L42Treat. x Levels 1 L922 0.0800 L42error (w) 42 24.024
Total 87
F .05 = 4.08 df = 1,42 *F significant
TABLE XVIIGROUP MEANS FOR ADDITION TASK ON TRIAL 5
Levels x Treatment
Low HighAver-age
Con. 28.23 34.95 3L59Exp. 33.27 37.32 35.30
TABLE XVIIaANALYSIS OF VARIANCE SUMMARY
Source df MS F (df)
Between SLevels
431
63.168638.286
error (b) 42 49.475Within S 44 47.761
Treat. 1 301.922 7.2049* 1,42Treat. x Levels 1 39.555 0.9439 1,42error (w) 42 41905
Total 87
F .05 = 4.08 df = 1,42 *F significant
TABLE XVIIIGROUP MEANS FOR SOLVING PROBLEMS TASK ON
TRIAL 5Levels x Treatment
Aver-Low High age
Con. 14.00 12.82 13.41
Exp. 17.41 18.27 17.84
TABLE XVIllaANALYSIS OF VARIANCE SUMMARY
Source df ms F (df)
Between S 43 37.933Levels 1 0.555error (b) 42 38.823
Within S 44 22.352Treat. 1 432.101 34.3466* 1,42Treat. x Levels 1 23.013 1.8292 ,42error (w) 42 12.581
Total 87
F .05 = 4.08 df = L42 *F significant
CHECKING NUMBERSThe means for the checking numbers task are given in Table
XX. The difference between the mean of 5.93 for the controlgroup and 6.84 for the experimental group was statistically sig-nificant (F-4.7098, see Table XXa). The F of 0.9537 for theinteraction effect was not significant.
CANCELING LETTERSThe means for the control and experimental groups on the
canceling letters task are shown in Table XXI. They are 38.82and 41.61 respectively. The difference between these two means
TABLE XIXGROUP MEANS FOR CHECKING TASK ON TRIAL 5
Levels x Treatment
Aver-Low High age
Con. 3.41 4.36 3.89
Exp. 4.50 5.77 5.14
TABLE XIXaANALYSIS OF VARIANCE SUMMARY
Source df ms F (df)
Between S 43 2.988Levels 1 27.284error (b) 42 2.410
Within S 44 3.216Treat. 1 34.375 13.5476* 1,42Treat. x Levels 1 0.557 0.2195 1,42error (w) 42 2.537
Total 87
F .05 = 4.08 df = 1,42 *F significant
- 24 -
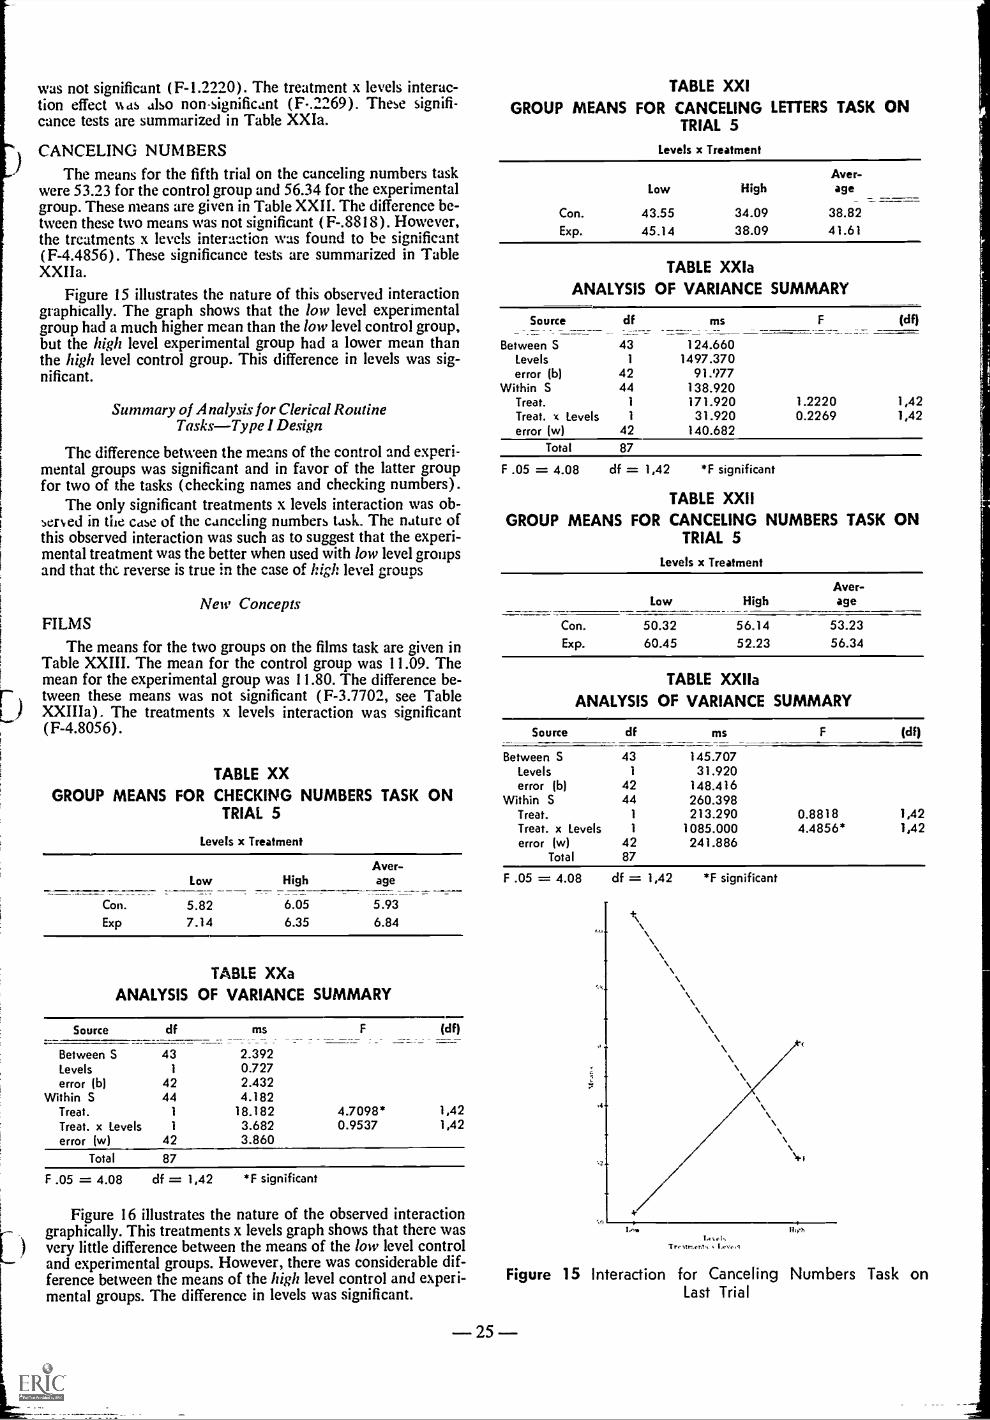
was not significant (F-1.2220). The treatment x levels interac-tion effect was also non-significant (F-.2269). These signifi-cance tests are summarized in Table XXIa.
CANCELING NUM BERSThe means for the fifth trial on the canceling numbers task
were 53.23 for the control group and 56.34 for the experimentalgroup. These means are given in Table XXII. The difference be-tween these two means was not significant (F-.8818). However,the treatments x levels interaction was found to be significant(F-4.4856). These significance tests are summarized in TableXXIIa.
Figure 15 illustrates the nature of this observed interactiongraphically. The graph shows that the low level experimentalgroup had a much higher mean than the low level control group,but the high level experimental group had a lower mean thanthe high level control group. This difference in levels was sig-nificant.
Summary of Analysis for Clerical RoutineTasks-Type I Design
The difference between the means of the control and experi-mental groups was significant and in favor of the latter groupfor two of the tasks (checking names and checking numbers).
The only significant treatments x levels interaction was ob-sened in the case of the canceling numbers task_ The nature ofthis observed interaction was such as to suggest that the experi-mental treatment was the better when used with low level groupsand that the reverse is true in the case of high level groups
New ConceptsFILMS
The means for the two groups on the films task are given inTable XXIII. The mean for the control group was 11.09. Themean for the experimental group was 11.80. The difference be-
, tween these means was not significant (F-3.7702, see Table) XXIIIa). The treatments x levels interaction was significant
(F-4.8056).
TABLE XXGROUP MEANS FOR CHECKING NUMBERS TASK ON
TRIAL 5
Levels x Treatment
LowAver-
High age
Con. 5.82 6.05 5.93
Exp 7.14 6.35 6.84
TABLE XXaANALYSIS OF VARIANCE SUMMARY
Source df ms F (df)
Between S 43 2.392Levels 1 0.727error (b) 42 2.432
Within S 44 4.182Treat. 1 18.182 4.7098* 1,42Treat. x Levels 1 3.682 0.9537 1,42error (w) 42 3.860
Total 87
F .05 = 4.08 df = 1,42 *F significant
Figure 16 illustrates the nature of the observed interactiongraphically. This treatments x levels graph shows that there wasvery little difference between the means of the low level controland experimental groups. However, there was considerable dif-ference between the means of the high level control and experi-mental groups. The difference in levels was significant.
TABLE XXIGROUP MEANS FOR CANCELING LETTERS TASK ON
TRIAL 5
Levels x Treatment
Low HighAver-age
Con. 43.55 34.09 38.82
Exp. 45.14 38.09 41.61
TABLE XXIaANALYSIS OF VARIANCE SUMMARY
Source df ms F (df)
Between S 43 124.660Levels 1 1497.370error (b) 42 91.977
Within S 44 138.920Treat. 1 171.920 1.2220 1,42Treat. x Levels 1 31.920 0.2269 1,42error (w) 42 140.682
Total 87
F .05 = 4.08 df = 1,42 *F significant
TABLE XXIIGROUP MEANS FOR CANCELING NUMBERS TASK ON
TRIAL 5
Levels x Treatment
Low HighAver-age
Con. 50.32 56.14 53.23Exp. 60.45 52.23 56.34
TABLE XXIIaANALYSIS OF VARIANCE SUMMARY
Source df ms F (df)
Between SLevels
431
145.70731.920
error (b) 42 148.416Within S 44 260.398
Treat. 1 213.290 0.8818 1,42Treat. x Levels 1 1085.000 4.4856* 1,42error (w) 42 241.886
Total 87
F .05 = 4.08 df = 1,42 *F significant
IA sr+.TrellInet},
Figure 15 Interaction for Canceling Numbers Task onLast Trial
- 25 -
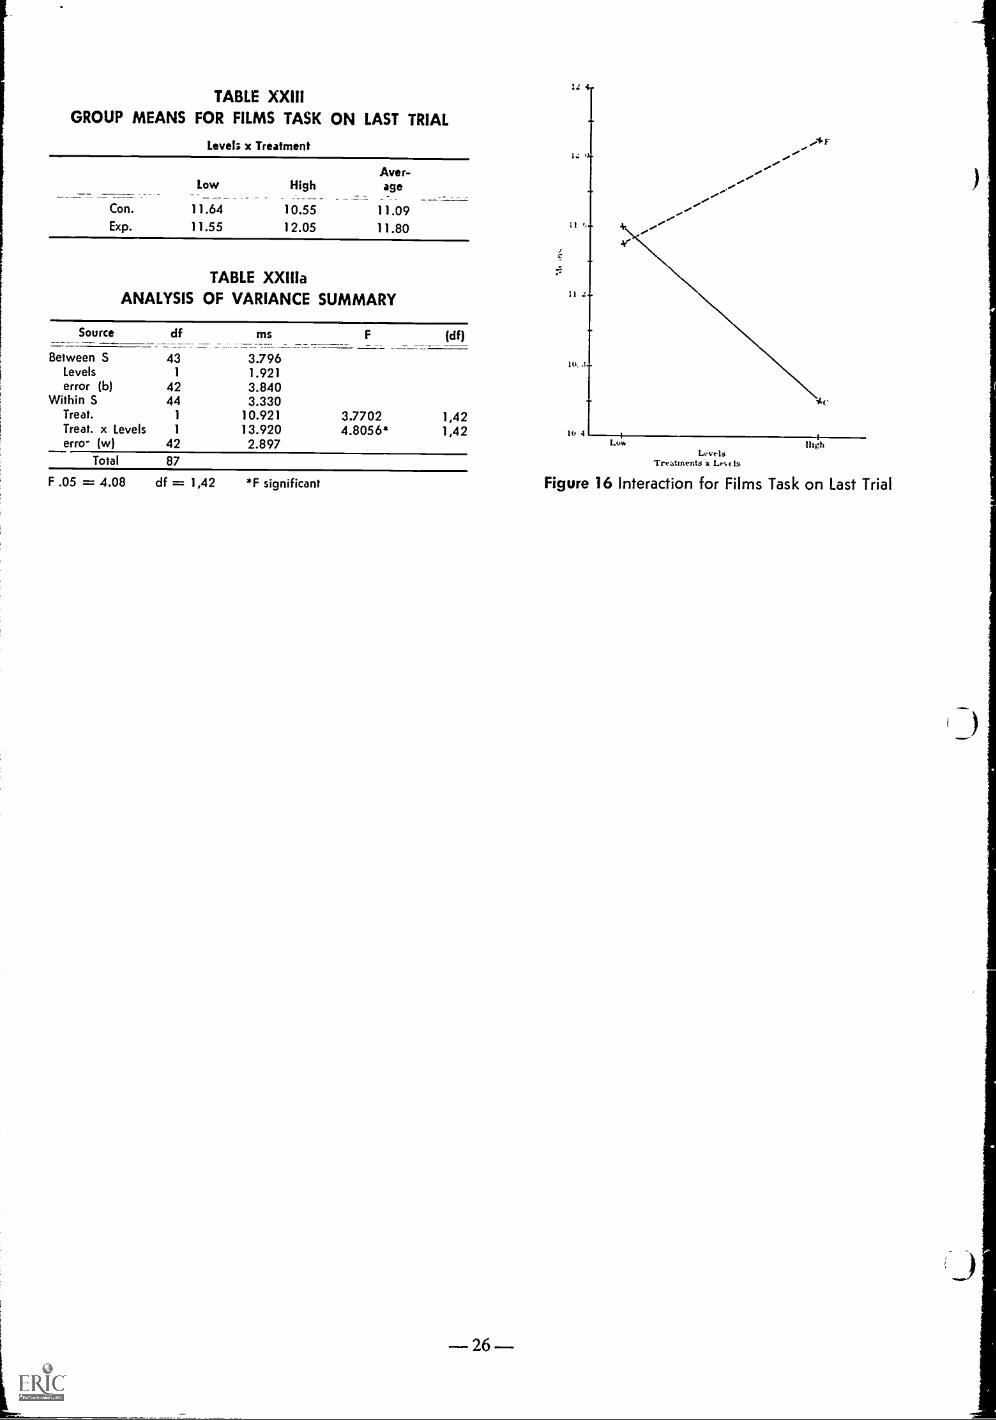
TABLE XXIIIGROUP MEANS FOR FILMS TASK ON LAST TRIAL
Level; x Treatment
Aver-Low High age
Con. 11.64 10.55 11.09Exp. 11.55 12.05 11.80
TABLE XXIIIaANALYSIS OF VARIANCE SUMMARY
Source df ms F (df)
Between S 43 3.796Levels 1 1.921error (b) 42 3.840
Within S 44 3.330Treat. 1 10.921 3.7702 1,42Treat. x Levels 1 13.920 4.8056* 1,42erro- (w) 42 2.897
Total 87
is 4
H
10 4
1.4vt IsTreatments x Lo Is
1110
F .05 = 4.08 df = 1,42 *F significant Figure 16 Interaction for Films Task on Last Trial

CHAPTER V SUMMARY AND CONCLUSIONS
Purpose of the StudyThe purpose of this study was to investigate and obtain ob-
jective evidence on the effect that thermal environments (tem-perature, stir mu% ement and humidity) in school classrooms onthe learning that takes place in those environments.
Procedures
The Lennox Industries, Inc., made available a two roomschool plant in which the thermal environment w as completelycontrolled. A model thermal environment (based on recom-mended standards by authorities in the field) was created andmaintained in one classroom and a marginal classroom environ-ment (based on conditions to which the subjects were accLs-tomed) w as created in the other classroom. This marginal class-room thermal environment was always under the control of theteacher, to alter as she saw fit. The rooms were identical exceptthat the number of cubic feet in one was greater than in theother. Lennox Industries assigned their resident research engi-neer to create, maintain and measure the desired thermal con-ditions.
Two classrooms of fourth grade children were matched soas to insure no significant differences between the classes as toachievement, intelligence, home background, age and sex. Thematched fourth grade children were from the Saydel SchoolDistrict in Des Moines.
During the period of the experiment the two groups receivedexactly the same treatment, performed the same tasks at thesame time of day, with the exception that they occupied roomswith different thermal environments. The children did not know
which room was designated as ideal until after the whole experi-ment was completed.
In addition to their regular classroom activities the gtoupsin each room spent approximately a half hour in the morningand a half hour in the afternoon performing various paper andpencil tasks. These tasks were classified into three broad cate-gories-Reasoning Tasks, Clerical Routine Tasks and Tasks in-volving knowledge of content material obtained by watchingscience films. Seven tasks were performed once a week-Mazes,Design Completion, Analogies, Checking Names, CheckingNumbers, Canceling Letters and Canceling Numbers. The Ad-dition and Solving Problems Tasks were performed daily duringthe first and third weeks but only three times during the secondweek. There was one film shown the first week, two the secondand one the third week.
The tasks were presented to the children throughout the ex-periment in a folio prepared in advance with the same tasks inthe same order face down on their desks. No child saw the ma-terial to be worked on until the signal to start work was given.They all stopped when the signal to stop work was given. Alltasks were scored the day they were administered so that minoritems which needed additional checking were cleared.
The experiment was duplicated by a second set of fourthgrade children matched in the same factors as the first set. Thissecond set (high) was differentiated from the first set (low)only because their mean achievement score (I. T. B. S.) washigher. This second set of children used opposite rooms at theresearch school from the first set for the experimental and con-trol group to counterbalance the physical size factor of the
TABLE XXIV
OVERALL LEVEL MEANS
INTERACTION FOROVERALL TREATMENT
TRIALS
MEANS AND2, 3 AND 4TASKS
Interaction F-Values
GroupLevels
TreatmentGroups
Trialsx
Treat.
Treat.x
Levels
Trialsx
Treat.x
LevelsTasks Low High F-Value Con. Exp. F-Value
Reasoning
Mazes 5.19 4.86 7.0759* 4.88 5.17 4.1551* 4.8821* 3.7290 3.9839*
DesignComp. 65.60 69.16 L8062 66.99 67.67 .0581 H .2433* .1003 4.4528*
Analogies 18.08 16.58 L2746 16.46 18.20 2.7713 .4882 .4185 .3553
Addition 29.31 31.64 2.4485 29.10 3185 3.6821 8.9240* L1971 10.4245*
SolvingProblems 13.61 15.52 2.4151 13.58 15.56 14.5090* 5.4721* .7606 5.0926*
Clerical
CheckingNames 3.45 4.81 32.2376* 3.77 4.49 7.3038* 2.3462 L6769 5.9707*
CheckingNumbers 6.36 5.04 25.0041* 5.20 6.20 9.9866* 2.0714 L2471 0.3809
Cancel.Letters 36.27 34.09 L9307 34.83 35.52 .0988 3.2624* .6039 L7668
Cancel.Numbers 53.70 51.45 L7012 5163 53.52 .5529 .1410 .8834 8.8986
*F - Value is significant.
- 27 -
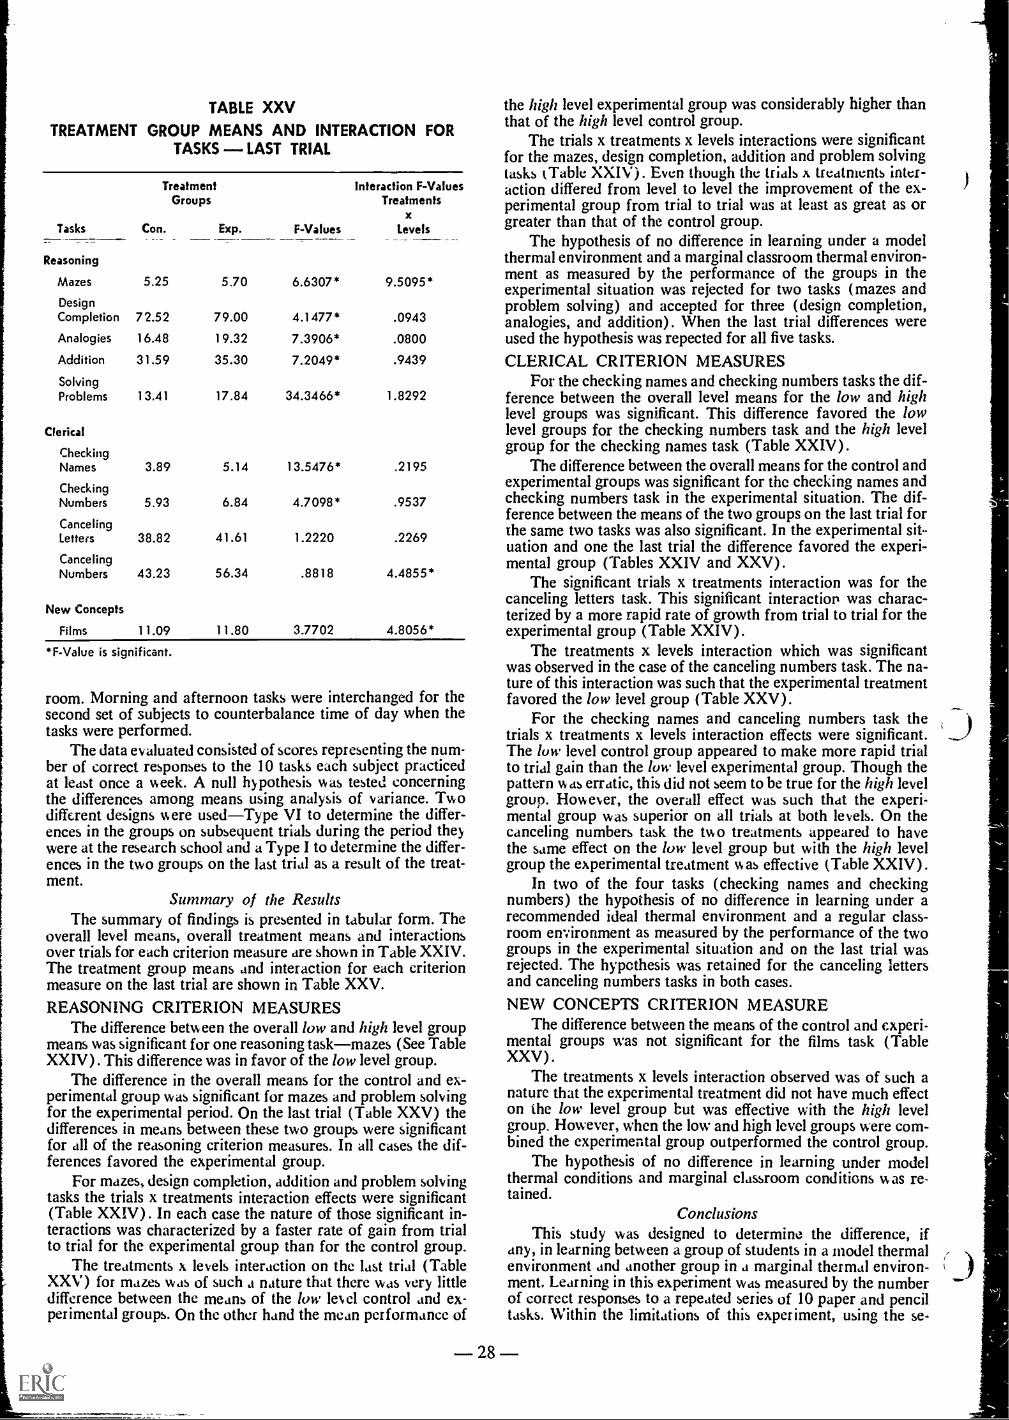
TABLE XXV
TREATMENT GROUP MEANS AND INTERACTION FORTASKS - LAST TRIAL
Tasks
TreatmentGroups
Con. Exp. F-Values
Interaction F-ValuesTreatments
xLevels
Reasoning
Mazes 5.25 5.70 6.6307 * 9.5095*
DesignCompletion 72.52 79.00 4.1477* .0943
Analogies 16.48 19.32 7.3906* .0800
Addition 31.59 35.30 7.2049* .9439
SolvingProblems 13.41 17.84 34.3466* 1.8292
Clerical
CheckingNames 3.89 5.14 13.5476* .2195
CheckingNumbers 5.93 6.84 4.7098* .9537
CancelingLetters 38.82 41.61 1.2220 .2269
CancelingNumbers 43.23 56.34 .8818 4.4855*
New Concepts
Films 11.09 11.80 3.7702 4.8056*
*F-Value is significant.
room. Morning and afternoon tasks were interchanged for thesecond set of subjects to counterbalance time of day when thetasks were performed.
The data evaluated consisted of scores representing the num-ber of correct responses to the 10 tasks each subject practicedat least once a week. A null hypothesis was tested concerningthe differences among means using analysis of variance. Twodifferent designs were used-Type VI to determine the differ-ences in the groups on subsequent trials during the period theywere at the research school and a Type I to determine the differ-ences in the two groups on the last trial as a result of the treat-ment.
Summary of the ResultsThe summary of findings is presented in tabular form. The
overall level means, overall treatment means and interactionsover trials for each criterion measure are shown in Table XXIV.The treatment group means and interaction for each criterionmeasure on the last trial are shown in Table XXV.
REASONING CRITERION MEASURESThe difference between the overall low and high level group
means was significant for one reasoning task-mazes (See TableXXIV). This difference was in favor of the low level group.
The difference in the overall means for the control and ex-perimental group was significant for mazes and problem solvingfor the experimental period. On the last trial (Table XXV) thedifferences in means between these two groups were significantfor all of the reasoning criterion measures. In all cases the dif-ferences favored the experimental group.
For mazes, design completion, addition and problem solvingtasks the trials x treatments interaction effects were significant(Table XXIV) . In each case the nature of those significant in-teractions was characterized by a faster rate of gain from trialto trial for the experimental group than for the control group.
The treatments x levels interaction on the last trial (TableXXV) for mazes was of such a nature that there was very littledifference between the means of the low level control and ex-perimental groups. On the other hand the mean performance of
28
the high level experimental group was considerably higher thanthat of the high level control group.
The trials x treatments x levels interactions were significantfor the mazes, design completion, addition and problem solvingtasks (Table XXIV). Even though the trials x treatments inter-action differed from level to level the improvement of the ex-perimental group from trial to trial was at least as great as orgreater than that of the control group.
The hypothesis of no difference in learning under a modelthermal environment and a marginal classroom thermal environ-ment as measured by the performance of the groups in theexperimental situation was rejected for two tasks (mazes andproblem solving) and accepted for three (design completion,analogies, and addition). When the last trial differences wereused the hypothesis was repected for all five tasks.
CLERICAL CRITERION MEASURESFor the checking names and checking numbers tasks the dif-
ference between the overall level means for the low and highlevel groups was significant. This difference favored the lowlevel groups for the checking numbers task and the high levelgroup for the checking names task (Table XXIV).
The difference between the overall means for the control andexperimental groups was significant for the checking names andchecking numbers task in the experimental situation. The dif-ference between the means of the two groups on the last trial forthe same two tasks was also significant. In the experimental sit-uation and one the last trial the difference favored the experi-mental group (Tables XXIV and XXV).
The significant trials x treatments interaction was for thecanceling letters task. This significant interaction was charac-terized by a more rapid rate of growth from trial to trial for theexperimental group (Table XXIV).
The treatments x levels interaction which was significantwas observed in the case of the canceling numbers task. The na-ture of this interaction was such that the experimental treatmentfavored the low level group (Table XXV).
For the checking names and canceling numbers task thetrials x treatments x levels interaction effects were significant.The low level control group appeared to make more rapid trialto trial gain than the low level experimental group. Though thepattern w as erratic, this did not seem to be true for the high levelgroup. However, the overall effect was such that the experi-mental group was superior on all trials at both levels. On thecanceling numbers task the two treatments appeared to havethe same effect on the low level group but with the high levelgroup the experimental treatment w as effective (Table XXIV).
In two of the four tasks (checking names and checkingnumbers) the hypothesis of no difference in learning under arecommended ideal thermal environment and a regular class-room environment as measured by the performance of the twogroups in the experimental situation and on the last trial wasrejected. The hypothesis was retained for the canceling lettersand canceling numbers tasks in both cases.
NEW CONCEPTS CRITERION MEASUREThe difference between the means of the control and experi-
mental groups was not significant for the films task (TableXXV).
The treatments x levels interaction observed was of such anature that the experimental treatment did not have much effecton the low level group but was effective with the high levelgroup. However, when the low and high level groups were com-bined the experimental group outperformed the control group.
The hypothesis of no difference in learning under modelthermal conditions and marginal classroom conditions was re-tained.
ConclusionsThis study was designed to determine the difference, if
any, in learning between a group of students in a model thermalenvironment and another group in a marginal thermal environ-ment. Learning in this experiment was measured by the numberof correct responses to a repeated series of 10 paper and penciltasks. Within the limitations of this experiment, using the se-
lected tasks, using fourth grade students, and using thermal con-ditions prescribed, the following conclusions seem justified.
On the whole, the experiment showed large improvement onthe part of every child taking part in 10 types of work. In everytask, however, the experimental group which occupied the roomwith model thermal conditions, improved more than the controlgroup.
1. The significantly higher gains made by pupils in the ex-perimental group indicated the prescribed model environmentwas superior to the marginal thermal environment for all rea-soning and some clerical tasks.
2. The superiority of the experimental group on the newconcepts task was not significant and may have been a chancedifference.
3. The interaction between trials and levels and treatmentsindicated the model environment favored the experimentalgroup in all of the tasks, although the experimental effect variedin some tasks from level to level.
REASONING TASKSWhen learning in reasoning tasks is measured by the number
of correct responses on completing mazes and designs; addingcolumns of numbers, determining the relationship of words;and solving word problems involving mathematical processes,the result was a progression in gain for both the control and ex-perimental groups. The rate of gain for the experimental groupwas greater than that of the control group, and the differencebetween the two groups increased with each trial while in theexperimental situation.
In all of the reasoning tasks the differences between themeans was significant by trial S at the .05 level. On the wholethe interaction effects observed favored the experimental groupin all of the tasks,
CLERICAL ROUTINE TASKSWhen mental efficiency is measured by the gain made in the
number of correct responses on successive trials in such tasksas: checking similar names and numbers on a page of namesand numbers; and canceling designated letters and numbers ona page containing rows and columns of letters and numbers, theresults indicate that both the experimental and control groupgained in efficiency through practice, For all of the tasks theoverall observed interaction effects were of such a nature thatthey favored the experimental group. The overall results in thedifferences in performance between the two groups indicatethat the thermal environment does have an effect on mental ef-ficiency when students are performing clerical tasks calling forquick recognition and response. The effect is not nearly as pro-nounced when the clerical tasks are more routine and monot-onous in nature.
TASKS INVOLVING NEW CONCEPTSWhen learning new concepts (presented via films) is meas-
ured by the difference in the number of correct responses madeby the two groups on written tests, the results showed little dif-ference for low level control and experimental groups. How-ever, the difference was much greater for high level control andexperimental groups. While the overall difference betweenmeans was not statistically significant the amount of differenceincreased from trial to trial.
ImplicationsRejection of the null hypothesis, (H: there is no difference
in learning under model thermal conditions and marginal ther-mal conditions) reveals that there is apparently a tenable rela-tionship between the thermal environment in which childrenwork and study and their effectiveness in accomplishing their
goals. The knowledge of this relationship affords us increasedcontrol over our mental functions. It adds to our understanding,gives us the power to increase efficiency in learning, and placeson us the responsibility to provide the necessary environmentfor learning.
Never before has so much been expected of teachers andchildren. With the advent of the age of space and automationteachers and children are expected to teach and learn more, anddo it better than ever before. The results of this first study wouldsuggest that for increased mental efficiency teachers and chil-dren should be exposed to a well controlled thermal environ-ment if they are to meet the demands placed upon them by arapidly changing society.
Further, school administrators, boards of education andarchitects who are responsible for designing and constructingschool buildings have a new dimension to consider in determin-ing economy. This dimension is "economy in learning." The re-lationship accepted in this study suggests that school buildings inwhich the thermal environment is not adequately controlledbring about inefficiency in learning. While this study must beconstrued as only a beginning, it does open up several pertinentquestions about school buildings. First, the literature revealsthat when economies must be effected in school buildings, ade-quate heating, ventilating and control systems are often amongthe first features to be compromised. Second, the use of largeamounts of glass areas in buildings is questionable. Large ex-panses of glass make it extremely difficult to control the thermalenvironment. (In this study refrigerated air had to be used tokeep the experimental room at 72F-74F when the outside tem-perature was above 50F.)
Some areas suggested for further research and study include:1. Will narrower ranges in the control of the elements of
the thermal environment mean proportionately greater gains inlearning?
2. Is there an inter-relationship between temperature, hu-midity and air movement? Will learning be affected if one or twoof these factors are at an optimum level and the third not at anoptimum level?
3. Would the superiority of the group in an ideal thermalenvironment become even greater if the experiment were ex-tended over a greater length of time or would it become asymp-totic, suggestive of a plateau of successful utilization? (Studynow underway)
4. What role, if any, does the thermal environment play inpartially neutral functions like hearing and vision, in pure mem-ory, in the learning of vocabulary, in reaction time of responses,uses of automated teaching devices, in fine muscle work and thecreative arts? (Study now underway)
5. Is there any relationship between pupil and teachermorale and thermal environment?
6. Is there any relationship between learning and environ-ment when one or both groups are in an ideal thermal environ-ment, but one group is in a well-lighted, windowless room?
7. Is there a fatigue factor present which can be overcomein a model environment? Do children tend to tire more by themiddle of the afternoon in a poor thermal environment than ina model environment? (Study now underway)
8. Further analysis should be given to the phenomena dis-proved in this study in regard to individual intelligence and re-action to thermal environment. (Partly included in a study nowunderway)
9. Further studies should be developed using students fromvarious grade levels ranging from kindergarten through college.(Older students-6th gradeare now used in the second studyunderway)
29 ----

SELECTED BIBLIOGRAPHY
1. American Society of Heating and Air-Conditioning Engineers,Inc. Heating, Ventilating, Air Conditioning Guide 1955. Vol.33. New York; American Society of Heating and Air-Condi-tioning Engineers, Inc., 1955.
2. Heating, Ventilating, Air Conditioning Guide1959. New York; American Society of Heating and Air-Con-ditioning Engineers, Inc., 1959.
3. Bedford, Thomas. Basic Principles of Ventilation and Heating.London: H. K. Lewis and Company, Ltd.. 1948.
4. Best, Charles H., and Taylor, Norman B. The PhysiologicalBasis of Medical Practice. Baltimore: The Williams and Wil-kins Company, 1950.
5. Harmon, Darrell G. Controlling the Thermal Environment ofthe Co-ordinated Classroom. Minneapolis: Minneapolis-Hon-eywell Regulator Company, 1953.
6. . The Co-ordinated Classroom. Grand Rapids,Michigan: The American Seating Company, 1949.
7. Herrick, John H., et al From School Plant to School Program.New York: Henry Holt and Company, 1956.
8. Herrington, L. P. "Effect of Thermal Environment on HumanAction," American School and University, 24:367-76, 1952-53.
9. ."Garden of Eden Climate Cited as Man's Ideal,"Heating, Piping, and Air Conditioning, 30:108-109, February,1958.
10. Holy, T. C. "Location, Construction, and Equipment ofSchoolhouses for Health," The A,. erican School Board Jour-nal, 104:19-20, January, 1942.
11. Housing Commission of the Health Di g,anization of the Leagueof Nations, Quarterly Bulletin of the Health Organization ofthe League of Nations, 6:505, June 1937.
12. Kleitman, Nathaniel. "Biological Rhythm and Cycles," Physi-ological Review, 29:36, January, 1949.
13. . Sleep and Wakefulness. Chicago: UniversityPress, 1949.
14. Lindquist, E. F. Design and Analysis of Experiments in Psy-chology and Education. Boston: Houghton Mifflin Company,1956.
15. McConnel, W. J., and Houghton, F. C. "Air Motion, HighTemperatures and Various Humidities-Reactions on HumanBeings," Transactions, 30:167, 1924.
16. McQuade, Walter (ed.). Schoolhouse. New York: Simon andSchuster, 1958.
17. Meredith, Florence L. Hygiene. Philadelphia: The BlakistonCompany, 1941.
18. Mincy, Homer F., Jr. "A Study of Factors Involved in Estab-lishing A Satisfactory Thermal Environment in the Class-room," unpublished Doctoral Thesis, University of Tennessee,Knoxville, 1961.
19. National Council on Schoolhouse Construction. Guide forPlanning School Plans. Nashville, Tennessee: Peabody Col-lege, 1958.
20. New York Commission on Ventilation. School VentilationPrinciples and Practices. New York: Teachers College, Co-lumbia University, 1931.
21. Nolan, James A. "Influence of Classroom Temperature onAcademic Learning." Automated Teaching Bulletin, 1:19-20,1960.
22. Shupp, David Eugene. "A Proposed Research Study on theEffects of Air Conditioning on Learning Activities within aClassroom," unpublished project report, Leland StanfordJunior University, Palo Alto, 1957.
23. Smiley, Dean F. "What Effect Does Temperature Have onStudent Health and Efficiency?" What Can and Should SchoolAdministrators Do About School Air Conditioning? AtlanticCity: February 16, 1960. (Mimeographed)
24. State Education Department. Heating and Ventilating Recom-mendatwn for New York State Schools. Albany: The Uni-versity of the State of New York Press, 1950.
25. Stuart, Fred, Supervisor of Cooperative Research Project#1067 (SAE 9031) Pinellas County Board of Public Instruc-tion, Clearwater, Florida, correspondence between the author,and, November 21, 1961.
26. "Thermal Environment." Portfolio on heating, ventilating andair conditioning for today's schools, The Nation's Schools,63:85-142, May, 1959.
27. University of Minnesota. School Thermal Environment. Min-neapolis. Bureau of Field Studies and Surveys Publications,1961.
28. Winslow, C. E. A., and Herrington, L. P. Temperature andHuman Life. Princeton, New Jersey: Princeton UniversityPress, 1949.
29. Winslow, C E. A., Herrington, L. P., and Gagge, A. P. "Re-lations between Atmospheric Conditions, Physiological Reac-tions and Sensations of Pleasantness," American Journal ofHygiene, 26:103-115, 1937.
30. . "Physiological Reactions of the Human Body toVarying Environmental Temperatures," American Journal ofPhysiology, 120-1-22, 1937.
31. Wright, Henry. "Classroom Heating and Ventilating," Amer-ican School and University, 23 : 197-216, 1951-52.