THE EUR OP EAN HEALTH REPOR T 2002 - PAHO
165
THE EUROPEAN HEALTH REPORT 2002
-
Upload
khangminh22 -
Category
Documents
-
view
2 -
download
0
Transcript of THE EUR OP EAN HEALTH REPOR T 2002 - PAHO
WHO Regional Publications,
European Series, No. 97
Governments and policy-makers are increasingly aware that access to
knowledge enables better policy-making practice. The policy-makers of the
various Member States are also more and more aware that they face
common challenges and can learn useful lessons from across national
boundaries that shed light on their own specific national situation.
The challenge for the Regional Office is to build on the existing data and
experience, to facilitate the sharing of this experience and, ultimately, to
make those data and indicators practically comparable across the countries.
The European health report responds to the statutory requirement to provide
the Member States with essential public health information. It provides a
broad but concise picture of the health status and health determinants in
the Region, and identifies areas for public health action for the Member
States and the European public health community. The report focuses on
concrete evidence useful for decision-makers in public health. Its role is to
summarize and feed back to Member States the information created,
deposited and “accredited” during the Regional Office’s work with Member
States on key topics and issues in public health in Europe, in the context of
the values and principles of WHO as “one Organization”.
The measure of success of this publication will be its appreciation and use
by Member States in their endeavour to improve their own health policies
and systems.
ISBN 92 890 1365 6
Sw.fr. 42.–
TH
E E
UR
OP
EA
N H
EA
LTH
RE
PO
RT
2002
76057 EHRENGLISHCovers 15/08/02 17:25 Side 1
The World Health Organization was established in 1948 as a specialized
agency of the United Nations serving as the directing and coordinating
authority for international health matters and public health. One of
WHO’s constitutional functions is to provide objective and reliable
information and advice in the field of human health, a responsibility that it
fulfils in part through its publications programmes. Through its
publications, the Organization seeks to support national health strategies
and address the most pressing public health concerns.
The WHO Regional Office for Europe is one of six regional offices
throughout the world, each with its own programme geared to the
particular health problems of the countries it serves. The European Region
embraces some 870 million people living in an area stretching from
Greenland in the north and the Mediterranean in the south to the Pacific
shores of the Russian Federation. The European programme of WHO
therefore concentrates both on the problems associated with industrial and
post-industrial society and on those faced by the emerging democracies of
central and eastern Europe and the former USSR.
To ensure the widest possible availability of authoritative information and
guidance on health matters, WHO secures broad international distribution
of its publications and encourages their translation and adaptation. By
helping to promote and protect health and prevent and control disease,
WHO’s books contribute to achieving the Organization’s principal
objective – the attainment by all people of the highest possible level of
health.
76057 EHRENGLISHCovers 15/08/02 17:25 Side 2
i
THEEUROPEAN HEALTH
REPORT 2002
WHO Regional Publications,
European Series, No. 97
WHO Regional Office for Europe
Copenhagen
76057 May2002-v2 20/08/02 17:21 Side 3
ISBN 92 890 1365 6
ISSN 0378-2255
The Regional Office for Europe of the World Health Organization welcomes requestsfor permission to reproduce or translate its publications, in part or in full. Applicationsand enquiries should be addressed to the Publications unit, WHO Regional Office forEurope, Scherfigsvej 8, DK-2100 Copenhagen Ø, Denmark, which will be glad toprovide the latest information on any changes made to the text, plans for new editions,and reprints and translations already available.
© World Health Organization 2002
Publications of the World Health Organization enjoy copyright protection inaccordance with the provisions of Protocol 2 of the Universal Copyright Convention.All rights reserved.
The designations employed and the presentation of the material in this publication donot imply the expression of any opinion whatsoever on the part of the Secretariat of theWorld Health Organization concerning the legal status of any country, territory, city orarea or of its authorities, or concerning the delimitation of its frontiers or boundaries.The names of countries or areas used in this publication are those that obtained at thetime the original language edition of the book was prepared.
The mention of specific companies or of certain manufacturers’ products does notimply that they are endorsed or recommended by the World Health Organization inpreference to others of a similar nature that are not mentioned. Errors and omissionsexcepted, the names of proprietary products are distinguished by initial capital letters.
WHO Library Cataloguing in Publication Data
The European health report 2002
(WHO regional publications. European series ; No. 97)
1.Health status indicators 2.Evaluation studies 3.Socioeconomic factors4.Life style 5.Environmental health 6.Delivery of health care 7.Health policy
8.Health care reform 9.Europe I.Series
ISBN 92 890 1365 6 (NLM Classification : WA 900)ISSN 0378-2255
PRINTED IN DENMARK
76057 May2002-v2 20/08/02 17:21 Side 4

Contents
Acknowledgements v
Foreword 1
Introduction 2
PART ONE – THE HEALTH SITUATION IN THE EUROPEAN REGION 7
The overall situation 8
Life expectancy and mortality 11
Healthy life expectancy 15
The burden of ill health 18Communicable diseases 19Noncommunicable diseases 29Mental health 42Accidents and injuries 44Bibliography 45
Distribution of health in populations 49Child health 49Adolescent health 52Women’s health 56Ageing and health 61Bibliography 63
PART TWO – THE MAJOR DETERMINANTS OF HEALTH 65
Socioeconomic determinants 66Health and development 68Poverty 70Psychosocial factors 71Employment 72Education 73Gender 73Bibliography 74
76057 May2002-v2 20/08/02 17:21 Side 5
Lifestyles 75Nutrition 75Physical activity 79Tobacco 81Alcohol 85Illegal drugs 87Bibliography 91
Physical environment 93Air quality 93Food safety 94Water 97Housing 98Work 99Transport 101Ionizing radiation 102Global environmental changes 102Bibliography 103
PART THREE – HEALTH SYSTEMS POLICIES AND REFORMS 107
Financing 110
Provision of services 114Primary care 115Hospitals 116Quality 119
Resource generation 121Pharmaceuticals 123
Stewardship 126
Bibliography 130
CONCLUSION 135
ANNEX 1. Health systems performance assessment methods 138
ANNEX 2. Statistical tables 148
76057 May2002-v2 20/08/02 17:21 Side 6
AcknowledgementsThis report was largely written, coordinated and edited by Anatoliy Nosikov and
Jean-Paul Jardel, and directed by Anca Dumitrescu, Roberto Bertollini and Nata
Menabde. The main contributors (listed below in alphabetical order) were, except
where otherwise indicated, staff of the WHO Regional Office for Europe at the
time that the report was prepared. Additional help and comments on various drafts
were received from staff of Evidence and Information for Policy at WHO
headquarters in Geneva.
Roger AertgeertsRichard AldersladeKeith BaverstockXavier BonnefoyAssia Brandrup-LukanowLuca BrusatiKees de JoncheereAntonio DuranMikhail EjovLars FallbergAinna Fawcett-HenesyBent FengerJosep FiguerasEmil Gabrielyan (Drug and MedicalTechnologies Agency, Armenia)Brian Gaffney (Health Promotion Agencyfor Northern Ireland, United Kingdom)Bernardus GanterMilagros Garcia-BarberoCees GoosW. Philip T. James (International ObesityTask Force, United Kingdom)Marco JerminiIsuf KaloCecile KnaiRüdiger KrechMichal KrzyzanowskiJoe KutzinUlrich Laukamm-JostenPhilip Lazarov Peter MakaraViviana Mangiaterra Sir Michael Marmot (University of London,United Kingdom)José M. Martin-Moreno (University ofValencia and Spanish Agency for HealthTechnology Assessment, Spain)
Bettina MenneHaik NikogosianPekka Oja (UKK Institute, Finland)Mikael ØstergrenElaine PriceRemigijus ProkhorskasVivian RasmussenFrancesca RacioppiNina Rehn Neville Rigby (International Obesity TaskForce, United Kingdom)Anna RitsatakisDavid RivettAileen RobertsonWolfgang RutzAushra ShatchkuteSylvie StachenkoMuthu Subramanian (Health and HealthCare Assessment, Princeton, USA)Thorkild I.A. Sørensen (Institute ofPreventive Medicine, Denmark)Cristina TiradoAgis TsourosClaude VilainSteven WassilakManfred Wildner (Bavarian Public HealthResearch Center, Ludwig-MaximiliansUniversity, Germany)Isabel YordiRisards ZaleskisErio ZiglioLorenzo Zucchi
Text editing: Frank TheakstonDesign: Tuuli Sauren
v
76057 May2002-v2 20/08/02 17:21 Side 1

1
Foreword
“Matching services to new needs” encapsulates the WHO Regional
Office for Europe’s new strategy for work with countries. The Regional
Office seeks continuously to improve the relevance and quality of its
services to the Member States and their populations. The purpose is to
support them in developing and sustaining their health policies, health
systems and public health programmes. I firmly believe that one of the
most important services that this Office can offer is to provide high-
quality, up-to-date information and analysis that is relevant to policy-
making.
Governments and policy-makers are increasingly aware that access to
knowledge enables better policy-making practice. The policy-makers of the various
Member States are also more and more aware that they face common challenges and
can learn useful lessons from across national boundaries that shed light on their own
specific national situation. The challenge for the Regional Office is to build on the
existing data and experience, to facilitate the sharing of this experience and, ultimately,
to make those data and indicators practically comparable across the countries.
The European health report responds to the statutory requirement to provide the
Member States with essential public health information. It provides a broad but concise
picture of the health status and health determinants in the Region, and identifies areas
for public health action for the Member States and the European public health community.
The report focuses on concrete evidence useful for decision-makers in public health.
Its role is to summarize and feed back to Member States the information created,
deposited and “accredited” during the Regional Office’s work with Member States on
key topics and issues in public health in Europe, in the context of the values and
principles of WHO as “one Organization”.
The measure of success of this publication will be its appreciation and use by
Member States in their endeavour to improve their own health policies and systems.
Marc Danzon
WHO Regional Director for Europe
76057 May2002-v2 20/08/02 17:21 Side 1

2
IntroductionWhere does the WHO European Region stand on the way to health for all?
This report is an attempt to review and assess the situation in Europe and progress
towards the Organization’s goal of building healthy populations and combating ill
health by:
• reducing excess mortality, morbidity and disability, especially in poor and
marginalized populations;
• promoting healthy lifestyles and reducing risks to human health that arise from
environmental, economic, social and behavioural causes;
• developing health systems that equitably improve health outcomes, respond to
people’s legitimate demands and are financially fair; and
• framing an enabling policy and creating an institutional environment for the
health sector, and promoting an effective health dimension to social, economic,
environmental and development policy.
To that effect the report provides in its first section, a comparative assessment of
the health situation and trends in terms of life expectancy, healthy life expectancy
and the burden of ill health, and reviews the distribution of health in and between
population groups. The second section reviews the evolution of the major
determinants of health, stressing the importance of socioeconomic factors.
The third section is devoted to health care systems, the performance of which is
essential to the achievement of the objectives of public health improvement, equity
of access and solidarity in financing. Focusing on an analysis of the key functions
of health systems, this section uncovers opportunities and trends in health system
reform and policy implementation.
In its attempt to summarize and compare the most important trends in health
status, health determinants and risk factors, and the performance of health care
systems among the countries in the Region, the report seeks to build on the new
WHO framework for measuring and reporting on the health of populations and
the health systems performance assessment (HSPA), as developed for the World
health report 2000. Use is made of available quantitative and qualitative
information from various sources – with their limitations in terms of accuracy,
completeness and comparability – including estimates of healthy life expectancy
76057 May2002-v2 20/08/02 17:21 Side 2
3
and burden of diseases used in The world health report 2000, data reported by
Member States, publications of international organizations, scientific publications,
and information collected by WHO technical programmes. Pending further study
of this issue, countries are grouped on the basis of their geographical location or by
using the traditional (but less and less relevant) distinction between such entities as
the European Union (EU), the countries of central and eastern Europe (CCEE)
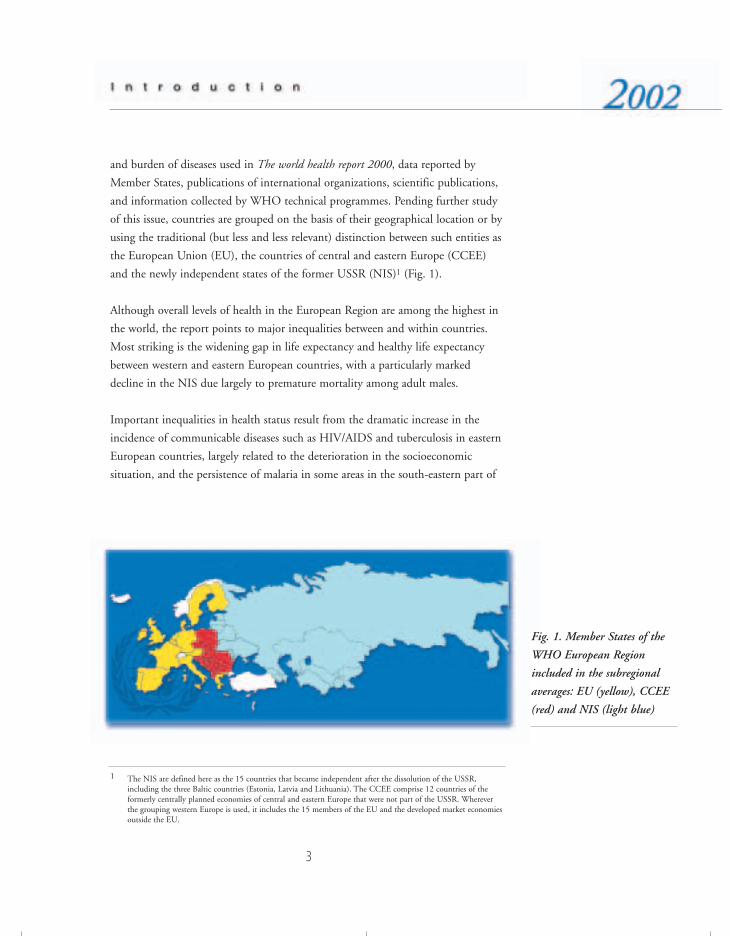
and the newly independent states of the former USSR (NIS)1 (Fig. 1).
Although overall levels of health in the European Region are among the highest in
the world, the report points to major inequalities between and within countries.
Most striking is the widening gap in life expectancy and healthy life expectancy
between western and eastern European countries, with a particularly marked
decline in the NIS due largely to premature mortality among adult males.
Important inequalities in health status result from the dramatic increase in the
incidence of communicable diseases such as HIV/AIDS and tuberculosis in eastern
European countries, largely related to the deterioration in the socioeconomic
situation, and the persistence of malaria in some areas in the south-eastern part of
Fig. 1. Member States of the
WHO European Region
included in the subregional
averages: EU (yellow), CCEE
(red) and NIS (light blue)
1 The NIS are defined here as the 15 countries that became independent after the dissolution of the USSR,including the three Baltic countries (Estonia, Latvia and Lithuania). The CCEE comprise 12 countries of theformerly centrally planned economies of central and eastern Europe that were not part of the USSR. Whereverthe grouping western Europe is used, it includes the 15 members of the EU and the developed market economiesoutside the EU.
76057 May2002-v2 20/08/02 17:21 Side 3
4
the Region. Nevertheless, cardiovascular diseases, cancer, diabetes mellitus and
other noncommunicable diseases account for most of the burden of ill health and
the east-west gap in life expectancy in Europe. Most of these diseases are associated
with common risk factors related to lifestyles and the socioeconomic environment.
As shown by the results achieved in some western European countries, great
improvements are possible in the prevention of these diseases and in reducing
premature mortality. Particular efforts are also needed in reducing the increasing
burden of mental disorders, as well as the incidence and consequences of injuries,
particularly in childhood.
Analysis of the distribution of health among specific population groups again
reveals that, despite a general improvement on average, major inequalities persist
with respect to infant and child mortality, risky behaviour in adolescents, the
health of women in general and the specific risks linked to reproduction, middle-
aged men (for whom there are major inequalities within countries and large
east–west differences) and opportunities for healthy ageing.
The report underlines the relation between socioeconomic factors and health.
Poverty, in particular, is recognized as the most important single determinant of ill
health while, as stressed by the Commission on Macroeconomics and Health,
investment in health must be considered as a concrete input into economic
development and poverty reduction. The report reviews evidence on health
determinants related to lifestyles, stressing the benefits of a healthy diet and
physical exercise and the worrying trends in unhealthy behaviour such as tobacco,
alcohol and drug use, particularly in younger age groups. It summarizes the
situation and trends concerning exposure to the most important environmental
health hazards, for the prevention of which intersectoral efforts and international
cooperation are required in the context of sustainable development.
Health systems and services are undergoing major transformations in the European
Region. First, countries are striving to better balance sustainability and solidarity in
financing. Most western European countries maintain relatively high levels of
solidarity. While the CCEE and NIS are also committed to solidarity in finance,
problems with the economic sustainability of new insurance mechanisms lead in
many cases to considerable reductions in the accessibility and affordability of
health services. Second, there is an increasing trend towards strategic purchasing as
76057 May2002-v2 20/08/02 17:21 Side 4
5
a way of allocating resources to providers to maximize health gain, including
separating provider and purchaser functions, moving from passive reimbursement
to proactive purchasing, and selecting providers according to their
cost–effectiveness. Contracting mechanisms and performance-based payment
become central to effective purchasing. Third, countries are adopting more
aggressively updated or new strategies to improve efficiency in health service
delivery. Fourth, effective stewardship is proving central to the success of health
system reform. The government mostly plays this role, involving health policy
leadership, appropriate regulation and effective intelligence, but stewardship may
also involve other bodies such as professional organizations.
It is hoped that the findings in this report, despite its recognized limitations, will
help Member States assess their progress towards health for all and further develop
their own capacities in the field of health and health-related information, as a tool
for improving health policy formulation and programme management.
76057 May2002-v2 20/08/02 17:21 Side 5

76057 May2002-v2 20/08/02 17:25 Side 134

7
The overall situation
Life expectancy andmortality
Healthy life expectancy
The burden of ill health
Distribution of health in populations
76057 May2002-v2 20/08/02 17:22 Side 7
8
The overall situation
The European Region of WHO includes some of the richest countries in the
world, while others are extremely poor. Worse, a larger number of countries now
belong to the less “well-to-do” than ten years ago. In 2000 (or latest available year),
gross domestic product (GDP) per head ranged from US $255 to over
US $42 000. The CCEE and NIS have seen the greatest deterioration in the past
decade. Income poverty has spread from affecting only a small proportion of the
population (3.3% in 1987–1988) to about a half in some countries. In those
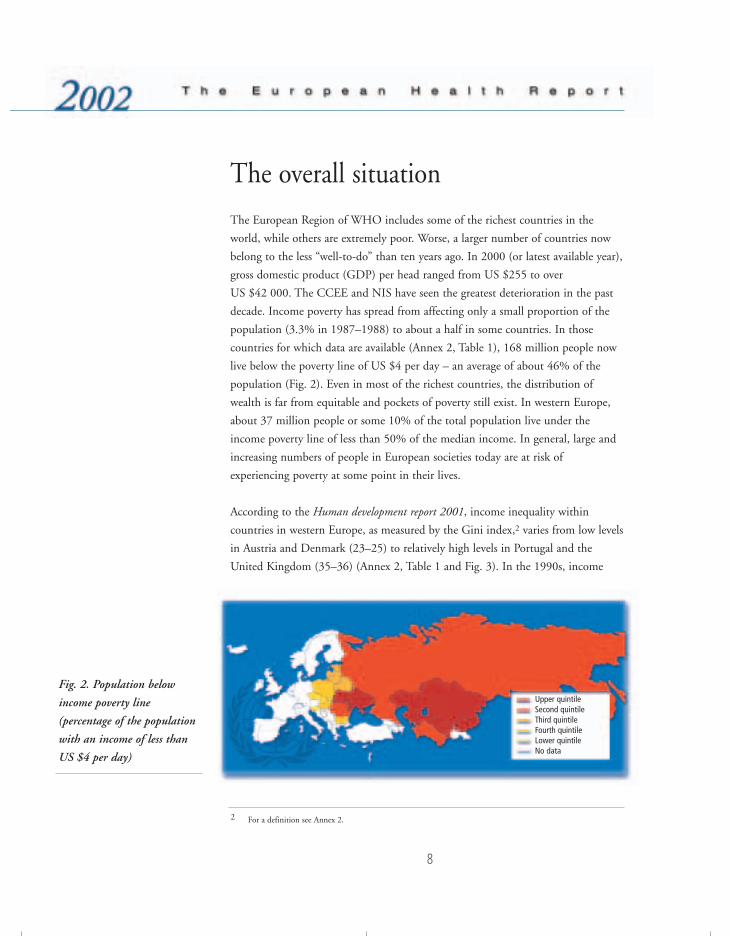
countries for which data are available (Annex 2, Table 1), 168 million people now
live below the poverty line of US $4 per day – an average of about 46% of the
population (Fig. 2). Even in most of the richest countries, the distribution of
wealth is far from equitable and pockets of poverty still exist. In western Europe,
about 37 million people or some 10% of the total population live under the
income poverty line of less than 50% of the median income. In general, large and
increasing numbers of people in European societies today are at risk of
experiencing poverty at some point in their lives.
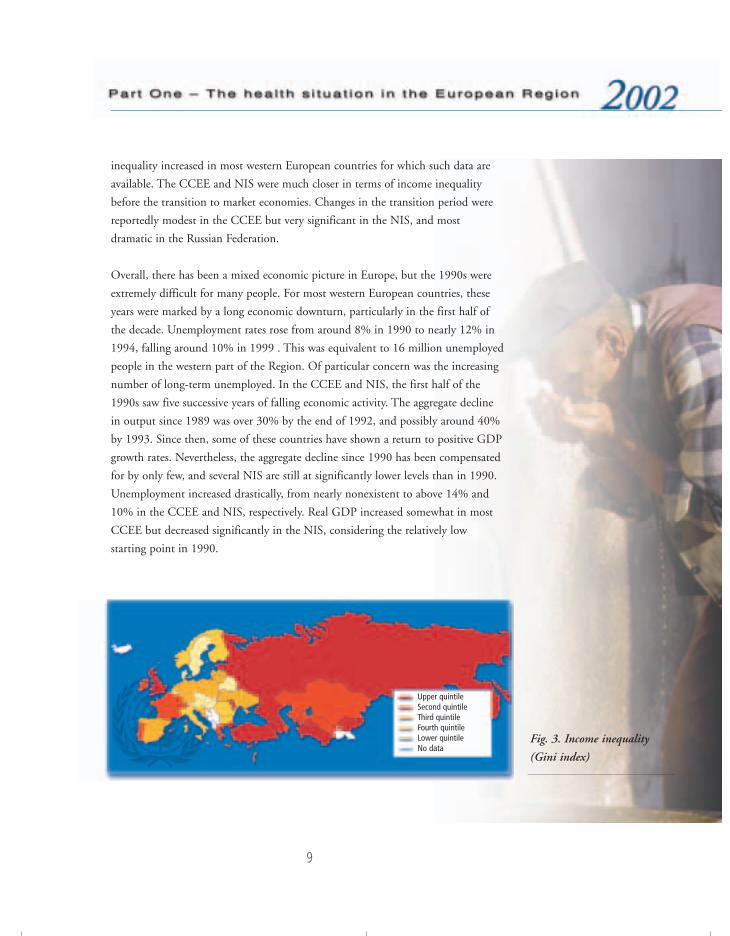
According to the Human development report 2001, income inequality within
countries in western Europe, as measured by the Gini index,2 varies from low levels
in Austria and Denmark (23–25) to relatively high levels in Portugal and the
United Kingdom (35–36) (Annex 2, Table 1 and Fig. 3). In the 1990s, income
Fig. 2. Population below
income poverty line
(percentage of the population
with an income of less than
US $4 per day)
2 For a definition see Annex 2.
Upper quintileSecond quintileThird quintileFourth quintileLower quintileNo data
76057 May2002-v2 20/08/02 17:22 Side 8
9
inequality increased in most western European countries for which such data are
available. The CCEE and NIS were much closer in terms of income inequality
before the transition to market economies. Changes in the transition period were
reportedly modest in the CCEE but very significant in the NIS, and most
dramatic in the Russian Federation.
Overall, there has been a mixed economic picture in Europe, but the 1990s were
extremely difficult for many people. For most western European countries, these
years were marked by a long economic downturn, particularly in the first half of
the decade. Unemployment rates rose from around 8% in 1990 to nearly 12% in
1994, falling around 10% in 1999 . This was equivalent to 16 million unemployed
people in the western part of the Region. Of particular concern was the increasing
number of long-term unemployed. In the CCEE and NIS, the first half of the
1990s saw five successive years of falling economic activity. The aggregate decline
in output since 1989 was over 30% by the end of 1992, and possibly around 40%
by 1993. Since then, some of these countries have shown a return to positive GDP
growth rates. Nevertheless, the aggregate decline since 1990 has been compensated
for by only few, and several NIS are still at significantly lower levels than in 1990.
Unemployment increased drastically, from nearly nonexistent to above 14% and
10% in the CCEE and NIS, respectively. Real GDP increased somewhat in most
CCEE but decreased significantly in the NIS, considering the relatively low
starting point in 1990.
Fig. 3. Income inequality
(Gini index)
Upper quintileSecond quintileThird quintileFourth quintileLower quintileNo data
76057 May2002-v2 20/08/02 17:22 Side 9
10
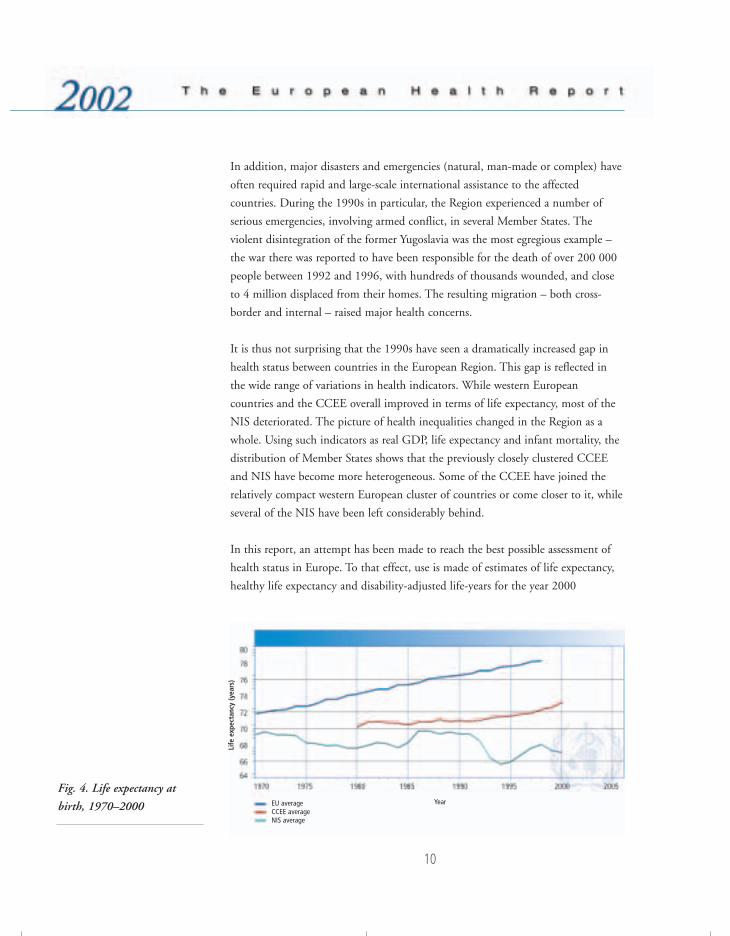
Fig. 4. Life expectancy at
birth, 1970–2000
In addition, major disasters and emergencies (natural, man-made or complex) have
often required rapid and large-scale international assistance to the affected
countries. During the 1990s in particular, the Region experienced a number of
serious emergencies, involving armed conflict, in several Member States. The
violent disintegration of the former Yugoslavia was the most egregious example –
the war there was reported to have been responsible for the death of over 200 000
people between 1992 and 1996, with hundreds of thousands wounded, and close
to 4 million displaced from their homes. The resulting migration – both cross-
border and internal – raised major health concerns.
It is thus not surprising that the 1990s have seen a dramatically increased gap in
health status between countries in the European Region. This gap is reflected in
the wide range of variations in health indicators. While western European
countries and the CCEE overall improved in terms of life expectancy, most of the
NIS deteriorated. The picture of health inequalities changed in the Region as a
whole. Using such indicators as real GDP, life expectancy and infant mortality, the
distribution of Member States shows that the previously closely clustered CCEE
and NIS have become more heterogeneous. Some of the CCEE have joined the
relatively compact western European cluster of countries or come closer to it, while
several of the NIS have been left considerably behind.
In this report, an attempt has been made to reach the best possible assessment of
health status in Europe. To that effect, use is made of estimates of life expectancy,
healthy life expectancy and disability-adjusted life-years for the year 2000
EU averageCCEE average NIS average
Life
exp
ecta
ncy
(yea
rs)
Year
76057 May2002-v2 20/08/02 17:22 Side 10
11
published in the The world health report 2001, as well as mortality and morbidity
data reported by Member States and recorded in the database of the WHO
Regional Office for Europe, together with data from other sources as appropriate.
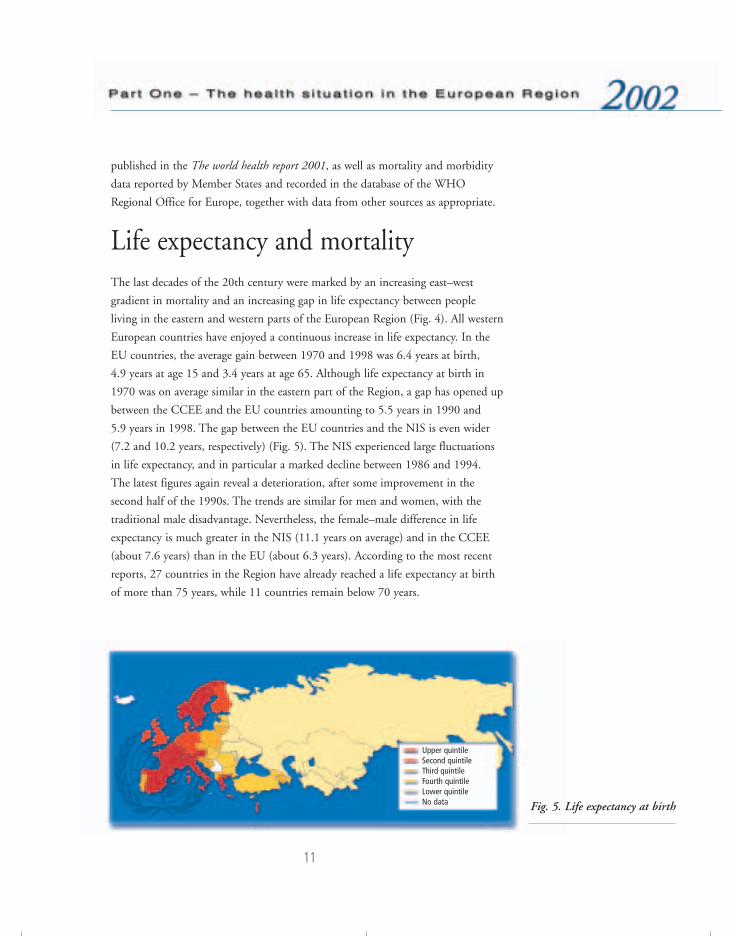
Life expectancy and mortalityThe last decades of the 20th century were marked by an increasing east–west
gradient in mortality and an increasing gap in life expectancy between people
living in the eastern and western parts of the European Region (Fig. 4). All western
European countries have enjoyed a continuous increase in life expectancy. In the
EU countries, the average gain between 1970 and 1998 was 6.4 years at birth,
4.9 years at age 15 and 3.4 years at age 65. Although life expectancy at birth in
1970 was on average similar in the eastern part of the Region, a gap has opened up
between the CCEE and the EU countries amounting to 5.5 years in 1990 and
5.9 years in 1998. The gap between the EU countries and the NIS is even wider
(7.2 and 10.2 years, respectively) (Fig. 5). The NIS experienced large fluctuations
in life expectancy, and in particular a marked decline between 1986 and 1994.
The latest figures again reveal a deterioration, after some improvement in the
second half of the 1990s. The trends are similar for men and women, with the
traditional male disadvantage. Nevertheless, the female–male difference in life
expectancy is much greater in the NIS (11.1 years on average) and in the CCEE
(about 7.6 years) than in the EU (about 6.3 years). According to the most recent
reports, 27 countries in the Region have already reached a life expectancy at birth
of more than 75 years, while 11 countries remain below 70 years.
Fig. 5. Life expectancy at birth
Upper quintileSecond quintileThird quintileFourth quintileLower quintileNo data
76057 May2002-v2 20/08/02 17:22 Side 11
12
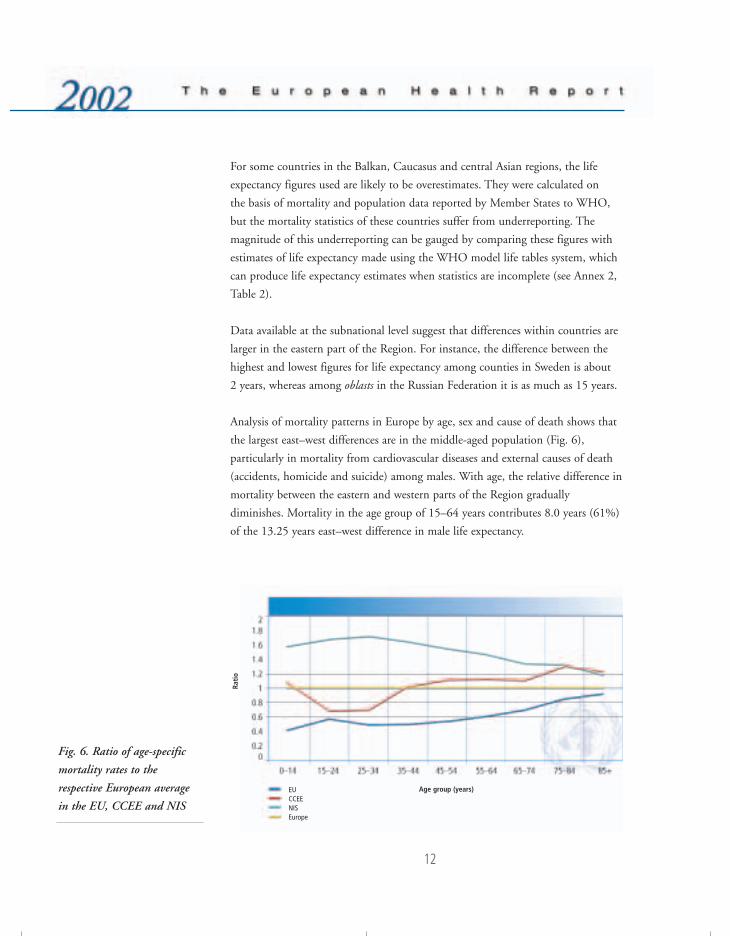
Fig. 6. Ratio of age-specific
mortality rates to the
respective European average
in the EU, CCEE and NIS
For some countries in the Balkan, Caucasus and central Asian regions, the life
expectancy figures used are likely to be overestimates. They were calculated on
the basis of mortality and population data reported by Member States to WHO,
but the mortality statistics of these countries suffer from underreporting. The
magnitude of this underreporting can be gauged by comparing these figures with
estimates of life expectancy made using the WHO model life tables system, which
can produce life expectancy estimates when statistics are incomplete (see Annex 2,
Table 2).
Data available at the subnational level suggest that differences within countries are
larger in the eastern part of the Region. For instance, the difference between the
highest and lowest figures for life expectancy among counties in Sweden is about
2 years, whereas among oblasts in the Russian Federation it is as much as 15 years.
Analysis of mortality patterns in Europe by age, sex and cause of death shows that
the largest east–west differences are in the middle-aged population (Fig. 6),
particularly in mortality from cardiovascular diseases and external causes of death
(accidents, homicide and suicide) among males. With age, the relative difference in
mortality between the eastern and western parts of the Region gradually
diminishes. Mortality in the age group of 15–64 years contributes 8.0 years (61%)
of the 13.25 years east–west difference in male life expectancy.
EUCCEENISEurope
Age group (years)
Rati
o
76057 May2002-v2 20/08/02 17:22 Side 12
13
Dramatic changes in mortality in the Russian Federation and in other countries in
the European part of the former USSR have attracted the attention of many
researchers and politicians. There is practically no precedent for changes of this
magnitude in peacetime, and they coincided with the profound socioeconomic
changes in these countries. In-depth mortality studies demonstrated that the
pattern of alcohol consumption in these countries played a significant role.
Analysis of changes in mortality by cause and age during the decline in life
expectancy up to 1994, and the subsequent improvement in 1995–1997, has
shown that these changes were mainly due to changes in external causes of death
and a sudden occurrence of cardiovascular diseases among middle-aged adults.3
In some CCEE life expectancy also changed considerably in the 1990s; it is
difficult to identify a common pattern, but in general the trend is towards
increasing life expectancy in most of these countries.
Mortality from the leading causes of death shows a similarly wide range among
European countries, as for life expectancy and total mortality (Fig. 7). On average,
cardiovascular diseases are responsible for about half of the total mortality.
However, the ratios of cardiovascular to total mortality rates standardized for age,
vary from about 35% in the western part of the Region to about 60% in some
eastern European countries. Cancer is responsible for close to 20% of the overall
mortality in Europe, ranging from about 30% in some western countries to about
10% in the eastern part of the Region. Accidents and other external causes of
injury and poisoning contribute about 9% to overall mortality (about 6% and
12% on average in the western and eastern parts of the Region, respectively).
External causes of death play a particularly important role in younger age groups.
For those under 65 years of age, external causes are responsible for about 20% of
overall mortality, compared to 31% and 23%, respectively, for cardiovascular
diseases and cancer.
Mortality indicators for cardiovascular diseases and cancer reflect aspects of health
status that are influenced more by determinants such as lifestyles and the
socioeconomic situation rather than the performance of health care services. In
contrast, the so-called “avoidable mortality” indicators are better suited to
estimating the performance of these services. These are the causes of death that, to
3 SHKOLNIKOV, V. ET AL. Changes in life expectancy in Russia in the mid-1990s. Lancet, 357: 917–921 (2001).
76057 May2002-v2 20/08/02 17:22 Side 13

14
a large extent, could be prevented by timely and effective interventions, although
the occurrence of some such conditions, for example diabetes and tuberculosis, is
associated with the major determinants of health, especially poverty. Trends, and
the distribution of these indicators among European countries in general, follow
the same east–west pattern. Mortality from appendicitis and cervical cancer is on
average about 2–3 times higher in the central and eastern parts of the Region than
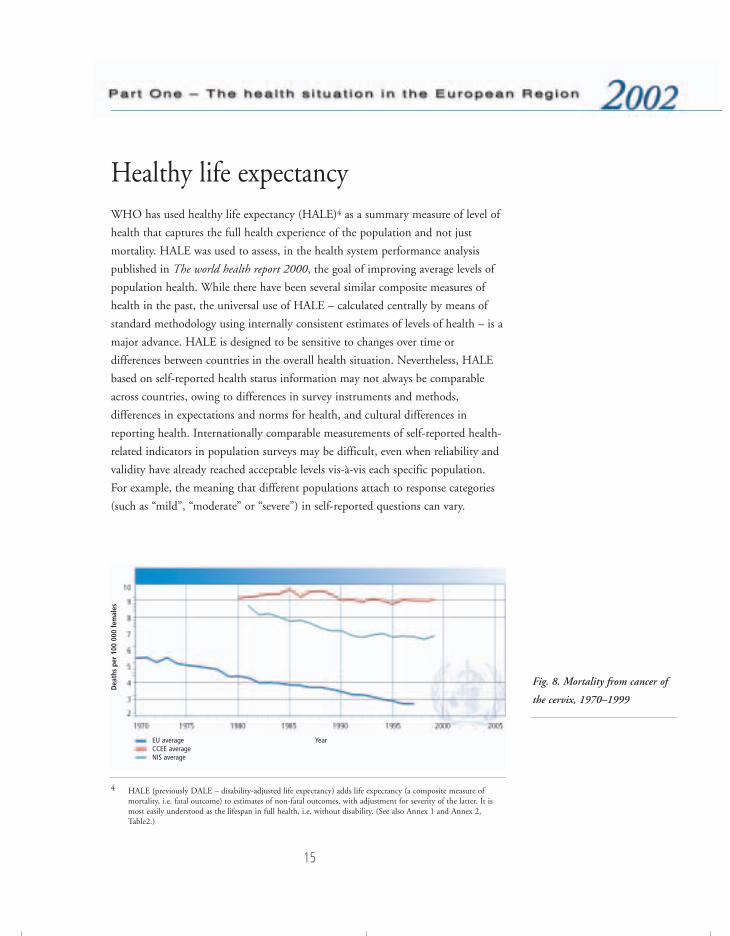
in the western countries (Fig. 8).
Fig. 7. Mortality from
leading causes of death in the
WHO European Region,
latest available data
Republic of MoldovaKazakhstan
Russian FederationBelarus
NIS averageTurkmenistan
UkraineKyrgyzstanUzbekistan
HungaryRomaniaTajikistan
LatviaBulgariaCroatiaEstonia
CEE averageSlovakia
PolandFYMa
AzerbaijanLithuaniaEUROPE
Czech RepublicAlbania
PortugalArmenia
IrelandSlovenia
DenmarkMalta
FinlandBelgium
United KingdomGermany
LuxembourgNetherlandsEU average
NorwayAustria
IsraelGreeceIceland
SpainSweden
ItalyFrance
Switzerland
Cardiovascular diseases
Cancer
External causes
Other causes
0 200 400 600 800 1000 1200 1400 1600
a FYM: the former Yugoslav Republic of Macedonia.
Deaths per 100 000 population
76057 May2002-v2 20/08/02 17:22 Side 14
15
Healthy life expectancyWHO has used healthy life expectancy (HALE)4 as a summary measure of level of
health that captures the full health experience of the population and not just
mortality. HALE was used to assess, in the health system performance analysis
published in The world health report 2000, the goal of improving average levels of
population health. While there have been several similar composite measures of
health in the past, the universal use of HALE – calculated centrally by means of
standard methodology using internally consistent estimates of levels of health – is a
major advance. HALE is designed to be sensitive to changes over time or
differences between countries in the overall health situation. Nevertheless, HALE
based on self-reported health status information may not always be comparable
across countries, owing to differences in survey instruments and methods,
differences in expectations and norms for health, and cultural differences in
reporting health. Internationally comparable measurements of self-reported health-
related indicators in population surveys may be difficult, even when reliability and
validity have already reached acceptable levels vis-à-vis each specific population.
For example, the meaning that different populations attach to response categories
(such as “mild”, “moderate” or “severe”) in self-reported questions can vary.
4 HALE (previously DALE – disability-adjusted life expectancy) adds life expectancy (a composite measure ofmortality, i.e. fatal outcome) to estimates of non-fatal outcomes, with adjustment for severity of the latter. It ismost easily understood as the lifespan in full health, i.e. without disability. (See also Annex 1 and Annex 2,Table2.)
Fig. 8. Mortality from cancer of
the cervix, 1970–1999
EU averageCCEE average NIS average
Dea
ths
per
100
000
fem
ales
Year
76057 May2002-v2 20/08/02 17:22 Side 15
16
To improve the methodological and empirical basis for measuring population
health, WHO has initiated a data collection strategy with Member States. This
employs a standardized instrument, together with new statistical methods for
adjusting self-reported health measures according to comparable scales. HALE
estimates for 2000 for all countries are based on a mix of survey data for some
countries (with its own uncertainty due to sampling and systematic biases) and
analyses of disability prevalence in the Global Burden of Disease project,5 which
draws on a wide range of epidemiological and demographic data of varying degrees
of uncertainty. The new methods used in the WHO Multi-country Household
Survey Study6 increase the comparability of self-reported data across countries and
represent a major step forward in the use of self-reported data on health. Building
on this experience, WHO is developing improved health status measurement
techniques for a world health survey to be carried out in 2002.
Worldwide, HALE at birth in 2000 ranged from 39 years for African males and
females to almost 66 years for females in the countries of western Europe. Regional
HALE at age 60 in 2000 ranged from 8.3 years in Africa to around 16 years for
females in Europe, North America and the WHO Western Pacific Region. In the
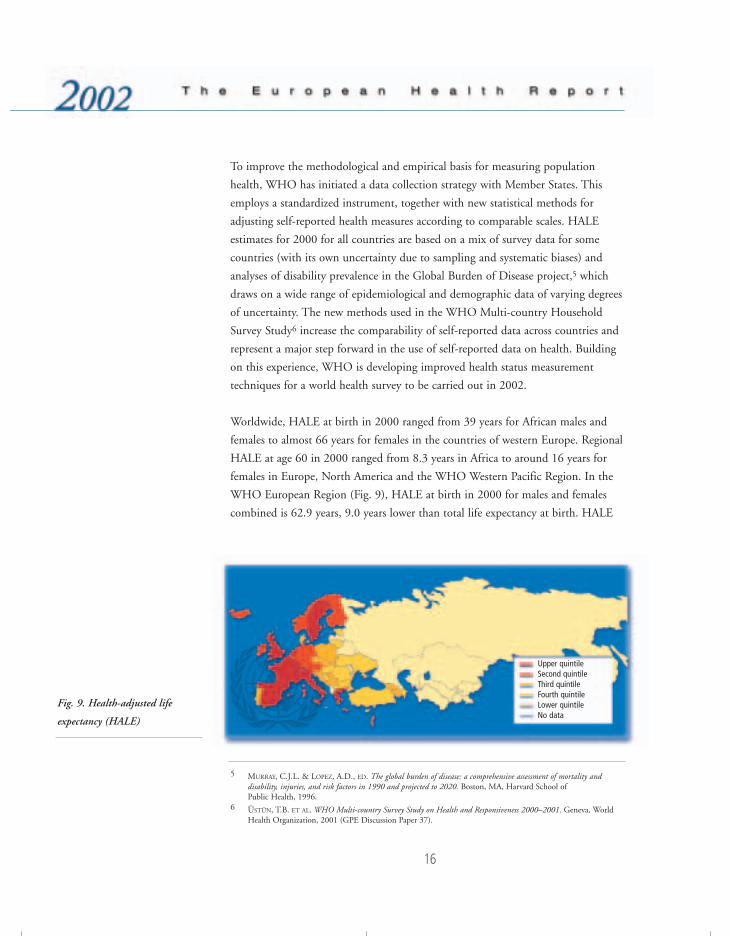
WHO European Region (Fig. 9), HALE at birth in 2000 for males and females
combined is 62.9 years, 9.0 years lower than total life expectancy at birth. HALE
Fig. 9. Health-adjusted life
expectancy (HALE)
5 MURRAY, C.J.L. & LOPEZ, A.D., ED. The global burden of disease: a comprehensive assessment of mortality anddisability, injuries, and risk factors in 1990 and projected to 2020. Boston, MA, Harvard School of Public Health, 1996.
6 ÜSTÜN, T.B. ET AL. WHO Multi-country Survey Study on Health and Responsiveness 2000–2001. Geneva, WorldHealth Organization, 2001 (GPE Discussion Paper 37).
Upper quintileSecond quintileThird quintileFourth quintileLower quintileNo data
76057 May2002-v2 20/08/02 17:22 Side 16
17
at birth for females is 5.9 years greater than that for males; in comparison, total life
expectancy at birth is almost 8.2 years higher for females than for males. HALE at
birth ranges from 50.3 years for Russian men to 72.2 years for women in the low-
mortality countries of western Europe.
Most industrialized western European countries, with a HALE at birth of around
70 years (68 years for males and 72 years for females), are part of a group of
countries led by Japan, where women had an estimated average HALE in 2000 of
76.3 years at birth. There is, however, a considerable range of uncertainty in the
ranking of countries, with typical 95% uncertainty ranges of around 3 years for
developed countries.
In the Russian Federation, HALE is 60.6 for females, 5 years below the European
average, but just 50.3 years for males, 9.6 years below the European average. This
is one of the widest gender gaps in the world and reflects the sharp increase in
adult male mortality in the early 1990s. From 1987 to 1994, the risk of premature
death increased by 70% for Russian males. Between 1994 and 1998, male life
expectancy improved, but has declined significantly again in the last three years.
Similar rates exist for other countries of the former USSR.
While a lower life expectancy is generally associated with a lower HALE, there are
large variations in HALE for any given level of life expectancy. For example, for
countries with a life expectancy of 70 years, HALE varies from 57 to 61.5 years, a
non-trivial variation. If male and female HALE are considered separately, the range
of variation increases to 57–65 years for a total life expectancy of 70 years. These
differences partially reflect variations in the impact of health promotion and
prevention policies, as well as the levels of performance of the health systems in
general.
76057 May2002-v2 20/08/02 17:22 Side 17

18
The burden of ill healthOverall levels of health in the European Region are among the highest in the
world. In 2000, an estimated 153.1 million DALYs (disability-adjusted life-years)7
were lost due to deaths or new cases of disease or injury occurring in that year.
This represents about 10.4% of the global total (1472 million DALYs),
substantially less than the Region’s share of the world’s population (14.4%).
Nevertheless, very substantial differences exist within the Region in the magnitude
of disease burden.
For the Region as a whole, ischaemic heart disease was the leading cause of disease
burden in 2000 (premature death plus non-fatal outcomes resulting from new
cases of the disease), accounting for 15.5 million DALYs or 10.1% of the overall
burden of disease and injury. The proportions were similar for both males (11.0%)
and females (9.0%). The second leading cause (both sexes combined) was
cerebrovascular diseases (10.4 million or 6.8% of regional DALYs), substantially
higher in females (8.3%) than in males (5.6%). The top ten causes of disease
burden for males, females and both sexes combined are shown in Table 1. In
addition to major vascular diseases disorders due to alcohol use and depression,
while not leading causes of death, are the third and fourth causes of DALYs lost for
men, respectively, followed by suicide and road traffic accidents, lung cancer and
chronic lung diseases. Other conditions accounting for more than 2% of DALYs
among men include lower respiratory infections, poisonings, hearing loss, cirrhosis
of the liver, and Alzheimer disease and other dementias. Among women,
depression is the second cause and Alzheimer disease the fourth. Other causes
accounting for more than 2% of DALYs among women include osteoarthritis,
breast cancer, hearing loss, lower respiratory infections and diabetes mellitus.
Although the composition of leading causes of disease burden is similar across the
various subregions of Europe, the size of the effect varies. In men, for example,
ischaemic heart disease caused 13% of DALYs lost in eastern Europe in 2000,
compared with 9.1% in western and northern Europe. Road traffic accidents
7 The DALY expresses years of life lost to premature death and years lived with a disability of specified severity andduration. One DALY is thus one lost year of healthy life. Using DALYs as a measure of disease burden allowsmajor causes of disability such as mental health conditions, hearing loss and osteoarthritis to be recognized asmajor causes of disease burden, despite the fact that mortality from these conditions is generally low.
76057 May2002-v2 20/08/02 17:22 Side 18
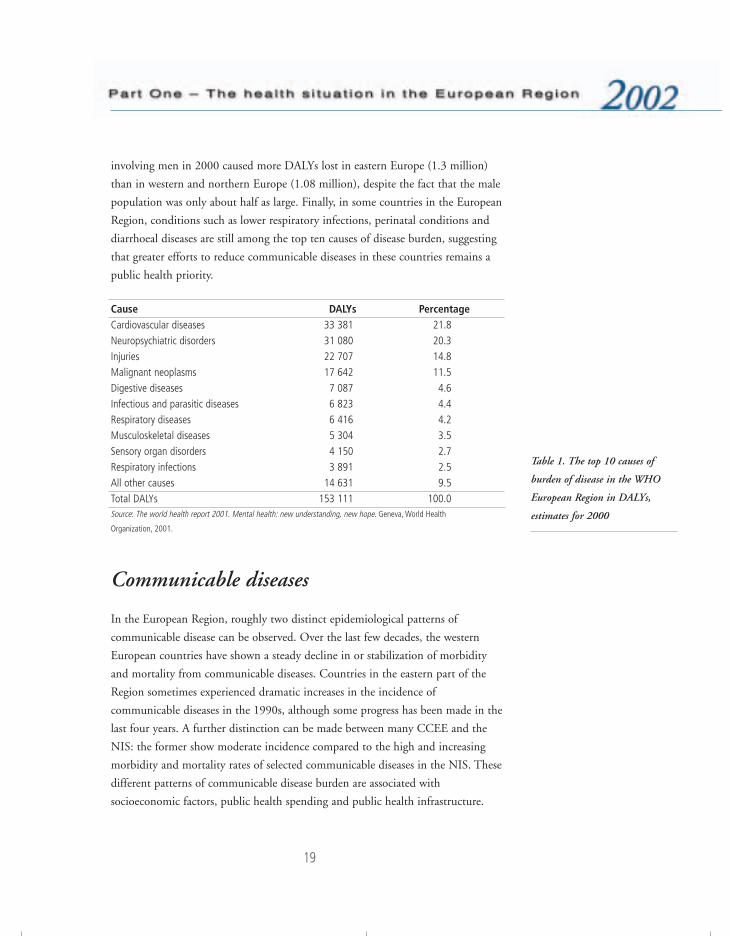
19
involving men in 2000 caused more DALYs lost in eastern Europe (1.3 million)
than in western and northern Europe (1.08 million), despite the fact that the male
population was only about half as large. Finally, in some countries in the European
Region, conditions such as lower respiratory infections, perinatal conditions and
diarrhoeal diseases are still among the top ten causes of disease burden, suggesting
that greater efforts to reduce communicable diseases in these countries remains a
public health priority.
Cause DALYs Percentage Cardiovascular diseases 33 381 21.8 Neuropsychiatric disorders 31 080 20.3 Injuries 22 707 14.8 Malignant neoplasms 17 642 11.5 Digestive diseases 7 087 4.6 Infectious and parasitic diseases 6 823 4.4 Respiratory diseases 6 416 4.2 Musculoskeletal diseases 5 304 3.5 Sensory organ disorders 4 150 2.7 Respiratory infections 3 891 2.5 All other causes 14 631 9.5 Total DALYs 153 111 100.0 Source: The world health report 2001. Mental health: new understanding, new hope. Geneva, World Health
Organization, 2001.
Communicable diseases
In the European Region, roughly two distinct epidemiological patterns of
communicable disease can be observed. Over the last few decades, the western
European countries have shown a steady decline in or stabilization of morbidity
and mortality from communicable diseases. Countries in the eastern part of the
Region sometimes experienced dramatic increases in the incidence of
communicable diseases in the 1990s, although some progress has been made in the
last four years. A further distinction can be made between many CCEE and the
NIS: the former show moderate incidence compared to the high and increasing
morbidity and mortality rates of selected communicable diseases in the NIS. These
different patterns of communicable disease burden are associated with
socioeconomic factors, public health spending and public health infrastructure.
Table 1. The top 10 causes of
burden of disease in the WHO
European Region in DALYs,
estimates for 2000
76057 May2002-v2 20/08/02 17:22 Side 19
20
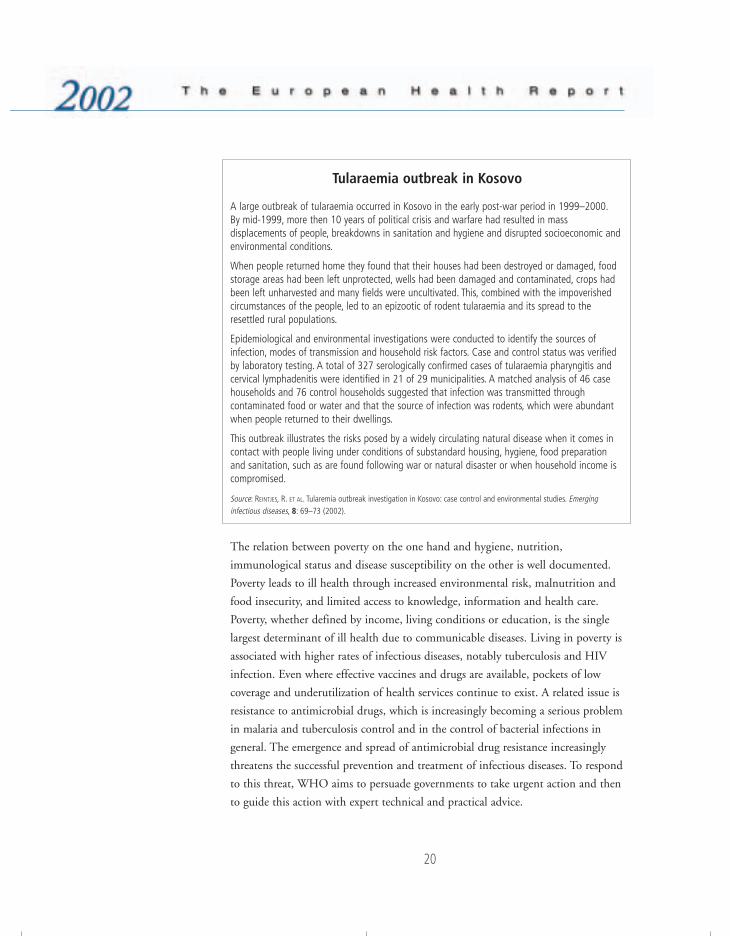
Tularaemia outbreak in Kosovo
A large outbreak of tularaemia occurred in Kosovo in the early post-war period in 1999–2000.By mid-1999, more then 10 years of political crisis and warfare had resulted in massdisplacements of people, breakdowns in sanitation and hygiene and disrupted socioeconomic andenvironmental conditions.
When people returned home they found that their houses had been destroyed or damaged, foodstorage areas had been left unprotected, wells had been damaged and contaminated, crops hadbeen left unharvested and many fields were uncultivated. This, combined with the impoverishedcircumstances of the people, led to an epizootic of rodent tularaemia and its spread to theresettled rural populations.
Epidemiological and environmental investigations were conducted to identify the sources ofinfection, modes of transmission and household risk factors. Case and control status was verifiedby laboratory testing. A total of 327 serologically confirmed cases of tularaemia pharyngitis andcervical lymphadenitis were identified in 21 of 29 municipalities. A matched analysis of 46 casehouseholds and 76 control households suggested that infection was transmitted throughcontaminated food or water and that the source of infection was rodents, which were abundantwhen people returned to their dwellings.
This outbreak illustrates the risks posed by a widely circulating natural disease when it comes incontact with people living under conditions of substandard housing, hygiene, food preparationand sanitation, such as are found following war or natural disaster or when household income iscompromised.
Source: REINTJES, R. ET AL. Tularemia outbreak investigation in Kosovo: case control and environmental studies. Emerginginfectious diseases, 8: 69–73 (2002).
The relation between poverty on the one hand and hygiene, nutrition,
immunological status and disease susceptibility on the other is well documented.
Poverty leads to ill health through increased environmental risk, malnutrition and
food insecurity, and limited access to knowledge, information and health care.
Poverty, whether defined by income, living conditions or education, is the single
largest determinant of ill health due to communicable diseases. Living in poverty is
associated with higher rates of infectious diseases, notably tuberculosis and HIV
infection. Even where effective vaccines and drugs are available, pockets of low
coverage and underutilization of health services continue to exist. A related issue is
resistance to antimicrobial drugs, which is increasingly becoming a serious problem
in malaria and tuberculosis control and in the control of bacterial infections in
general. The emergence and spread of antimicrobial drug resistance increasingly
threatens the successful prevention and treatment of infectious diseases. To respond
to this threat, WHO aims to persuade governments to take urgent action and then
to guide this action with expert technical and practical advice.
76057 May2002-v2 20/08/02 17:22 Side 20

21
Increased trade and population movement have facilitated the spread of infectious
diseases inside and beyond national borders. This trend is a growing concern for
policy-makers, as it can negatively influence national capacities to deal with such
threats. It is thus necessary to develop and maintain the ability to observe, in a
systematic, timely and efficient manner, the occurrence of infectious diseases.
National surveillance systems should be able to collect, analyse and disseminate
relevant and timely data on the distribution of and trends in communicable
diseases, so that adequate control measures can be implemented. The early warning
systems of national surveillance networks are crucial in avoiding unnecessary
interventions and restrictions on travel and trade.
Priorities in the area of communicable diseases in the European Region remain
unchanged. They include the prevention and control of HIV and sexually
transmitted infections, campaigns to control tuberculosis and malaria, poliomyelitis
eradication, measles elimination, and further improvement in the surveillance and
control of other communicable diseases. Enhanced national surveillance networks
and laboratory capacities are crucial for supporting related programmes, including
the strengthening of early warning systems for bacterial meningitis, foodborne and
waterborne diseases, hepatitis C, cholera, influenza and newly emerging epidemic
diseases.
Recent events have made it clear that the international community must address
the possible intentional release of biological agents as a public health priority.
WHO has agreed on critical areas for developing activities such as the
strengthening of surveillance systems and early warning of health effects due to the
natural or deliberate use of biological agents. The World Health Assembly, in
resolution WHA54.14, was fully aware that the strengthening of epidemiological
and laboratory surveillance and of disease control activities at national level was the
main defence against the international spread of communicable diseases.
Sexually transmitted infections (STI), including HIV/AIDSAn estimated 1.56 million people are now living with HIV/AIDS in the WHO
European Region. There are approximately one million in the CCEE and the
central Asian republics alone (compared to 420 000 just two years ago). Thus this
region has currently the steepest increase in HIV infection rates in the world
76057 May2002-v2 20/08/02 17:22 Side 21

22
(Fig. 10). For example, the cumulative number of people living with HIV/AIDS in
the Russian Federation has doubled every year since 1995. Despite this explosive
spread, the epidemic is still at an early stage: 75% of new cases of HIV are in
injecting drug users, 77% are in men, and 84% are in people under the age of
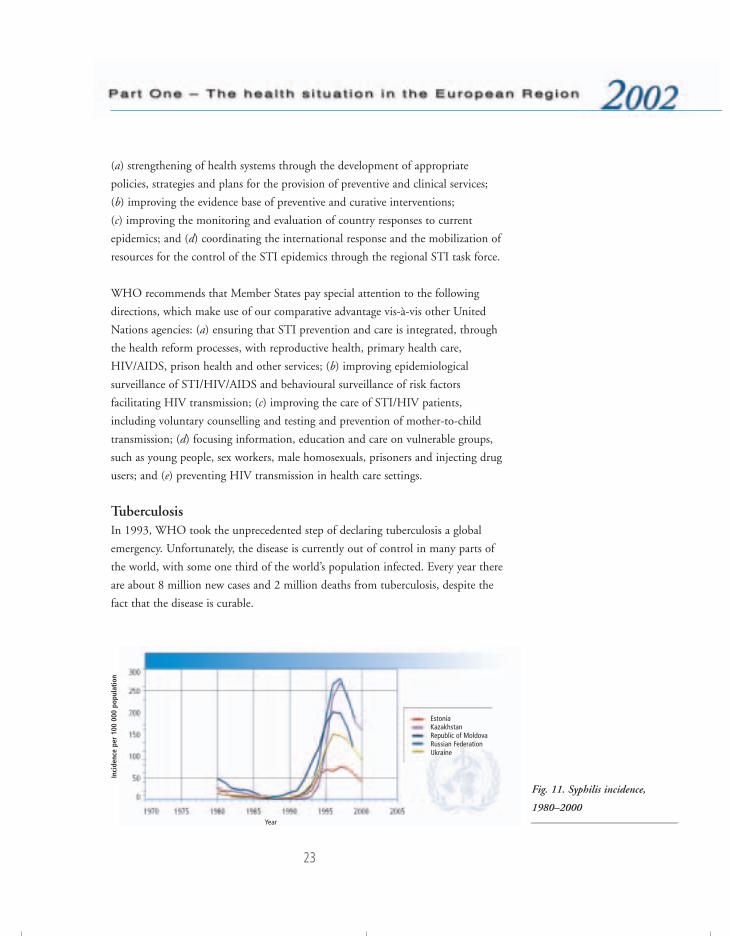
30 years. This pattern of HIV transmission and the STI epidemics occurring at the
same time (Fig. 11) creates the potential for massive outbreaks of sexually
transmitted HIV infections. It could lead in a few years to a large-scale and
generalized HIV/AIDS epidemic. There is thus an urgent need to dramatically
scale up current responses at national and international levels.
The policy response of the Member States has partly been inadequate. HIV/AIDS
is still often perceived as a medical problem and, therefore, not sufficiently
considered as a candidate for appropriate multisectoral attention and action.
Collaboration between medical services is often sporadic. Cross-departmental
coordination and collaboration are lacking in many governments. Many
interventions are therefore being implemented in isolation and lack coverage, and
the information on lessons learned is not widely shared. Including budgets for
antiretroviral therapy in health and social services programmes represents a
particular challenge.
The currently deployed STI/HIV/AIDS prevention and care strategy of the
Regional Office takes into account the situation assessment outlined above. As a
co-sponsor of the Joint United Nations Programme on HIV/AIDS (UNAIDS) in
the Region, and at country level through the United Nations theme groups on
HIV/AIDS, the STI/HIV/AIDS programme focuses on the following policies:
Fig. 10. Incidence of HIV
infection, 1994–2001, most
affected countries
Russian FederationLatviaUkraineBelarusRepublic of MoldovaEstonia
Inci
denc
e pe
r m
illio
n po
pula
tion
76057 May2002-v2 20/08/02 17:22 Side 22
23
(a) strengthening of health systems through the development of appropriate
policies, strategies and plans for the provision of preventive and clinical services;
(b) improving the evidence base of preventive and curative interventions;
(c) improving the monitoring and evaluation of country responses to current
epidemics; and (d) coordinating the international response and the mobilization of
resources for the control of the STI epidemics through the regional STI task force.
WHO recommends that Member States pay special attention to the following
directions, which make use of our comparative advantage vis-à-vis other United
Nations agencies: (a) ensuring that STI prevention and care is integrated, through
the health reform processes, with reproductive health, primary health care,
HIV/AIDS, prison health and other services; (b) improving epidemiological
surveillance of STI/HIV/AIDS and behavioural surveillance of risk factors
facilitating HIV transmission; (c) improving the care of STI/HIV patients,
including voluntary counselling and testing and prevention of mother-to-child
transmission; (d) focusing information, education and care on vulnerable groups,
such as young people, sex workers, male homosexuals, prisoners and injecting drug
users; and (e) preventing HIV transmission in health care settings.
TuberculosisIn 1993, WHO took the unprecedented step of declaring tuberculosis a global
emergency. Unfortunately, the disease is currently out of control in many parts of
the world, with some one third of the world’s population infected. Every year there
are about 8 million new cases and 2 million deaths from tuberculosis, despite the
fact that the disease is curable.
Fig. 11. Syphilis incidence,
1980–2000
EstoniaKazakhstanRepublic of MoldovaRussian Federation Ukraine
Inci
denc
e pe
r 10
0 00
0 po
pula
tion
Year
76057 May2002-v2 20/08/02 17:22 Side 23

24
Tuberculosis is also a serious problem in the WHO European Region: in 2000
there were about 370 000 newly detected cases compared with 231 600 in 1991.
Most of these cases occurred in the CCEE and NIS, where tuberculosis is
increasing dramatically (Fig. 12). In addition, multidrug-resistant tuberculosis,
which is more difficult and almost 100 times more expensive to treat, is spreading
in the Region, the highest levels in the world being found in Estonia, Latvia and
the Russian Federation, where respectively 14%, 9% and 6–9% of multidrug-
resistant tuberculosis were detected among new cases between 1996 and 1999.
Tuberculosis is out of control in prisons in many of the NIS; one Siberian prison
reports a prevalence of 7% of inmates. Multidrug resistance is widespread in
prisons. The co-epidemic of tuberculosis and HIV is still not widespread in the
Region, but HIV infection is spreading rapidly in the NIS and could fuel the co-
epidemic. Cases of co-morbidity increased in the last few years, from a few dozen
to 2106 in Ukraine, and in 2000 there were 1658 new cases in the Russian
Federation.
In 1995, in collaboration with international partners, WHO initiated DOTS8
pilot projects in the European Region. The DOTS strategy capitalizes on a proven
effective combination of (a) government commitment, including funding, for
comprehensive and sustained control activities and (b) highly cost-effective
methods of case detection and standardized and supervised chemotherapy, the
results of which must be regularly verified and reported. According to World Bank
Fig. 12. Tuberculosis incidence,
1974–2000EU averageCCEE average NIS average
8 DOTS: directly observed treatment, short-course.
Inci
denc
e pe
r 10
0 00
0 po
pula
tion
Year
76057 May2002-v2 20/08/02 17:22 Side 24
25
studies, the DOTS strategy is among the most cost-effective of all health care
interventions available in low- and middle-income countries. In 1997, an
economic evaluation in Armenia confirmed that the DOTS strategy was more
cost-effective than the tuberculosis control strategy used before. A similar
evaluation conducted in the Ivanovo oblast in the Russian Federation concluded
that the cost per cured case of tuberculosis using the DOTS strategy was
US $1626, compared to US $6293 under the previous strategy.
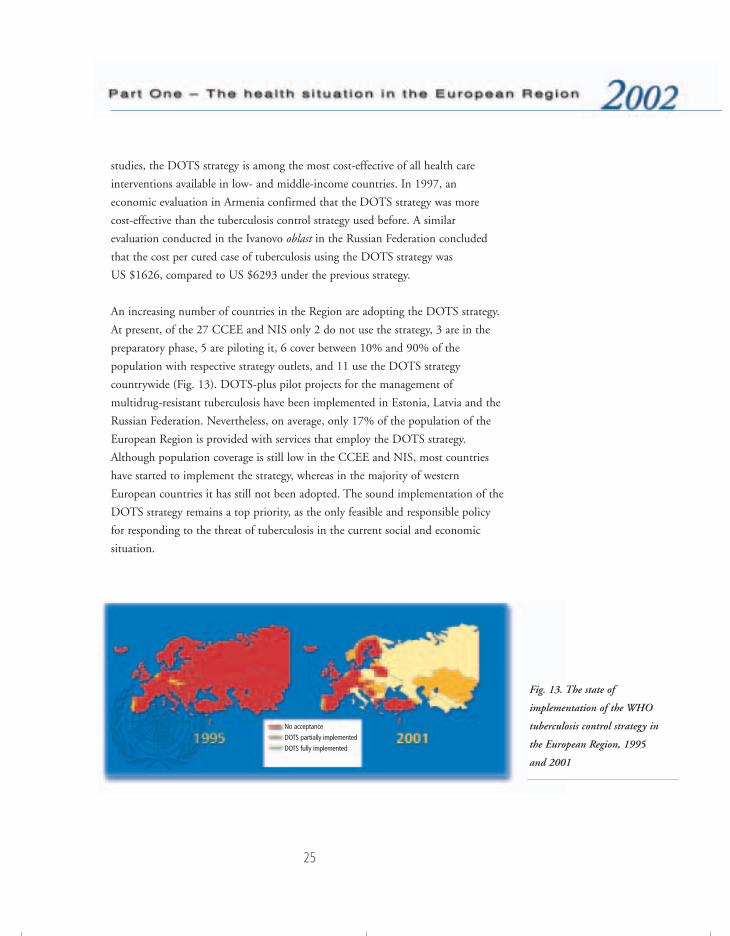
An increasing number of countries in the Region are adopting the DOTS strategy.
At present, of the 27 CCEE and NIS only 2 do not use the strategy, 3 are in the
preparatory phase, 5 are piloting it, 6 cover between 10% and 90% of the
population with respective strategy outlets, and 11 use the DOTS strategy
countrywide (Fig. 13). DOTS-plus pilot projects for the management of
multidrug-resistant tuberculosis have been implemented in Estonia, Latvia and the
Russian Federation. Nevertheless, on average, only 17% of the population of the
European Region is provided with services that employ the DOTS strategy.
Although population coverage is still low in the CCEE and NIS, most countries
have started to implement the strategy, whereas in the majority of western
European countries it has still not been adopted. The sound implementation of the
DOTS strategy remains a top priority, as the only feasible and responsible policy
for responding to the threat of tuberculosis in the current social and economic
situation.
Fig. 13. The state of
implementation of the WHO
tuberculosis control strategy in
the European Region, 1995
and 2001
No acceptance
DOTS partially implemented
DOTS fully implemented
76057 May2002-v2 20/08/02 17:22 Side 25
26
Expanding the coverage of the DOTS strategy to other countries and areas in the
Region is vital. The multidrug-resistant tuberculosis crisis in “hot spots” must be
addressed as an international emergency. The main challenges for effective control
remain health sector reform, disease prevention and control in prisons, and the
protection of health personnel. However, most governments in the CCEE and NIS
are financially unable to implement the DOTS strategy without external aid.
The assistance of the international community and donors is thus crucial for
controlling the tuberculosis epidemic.
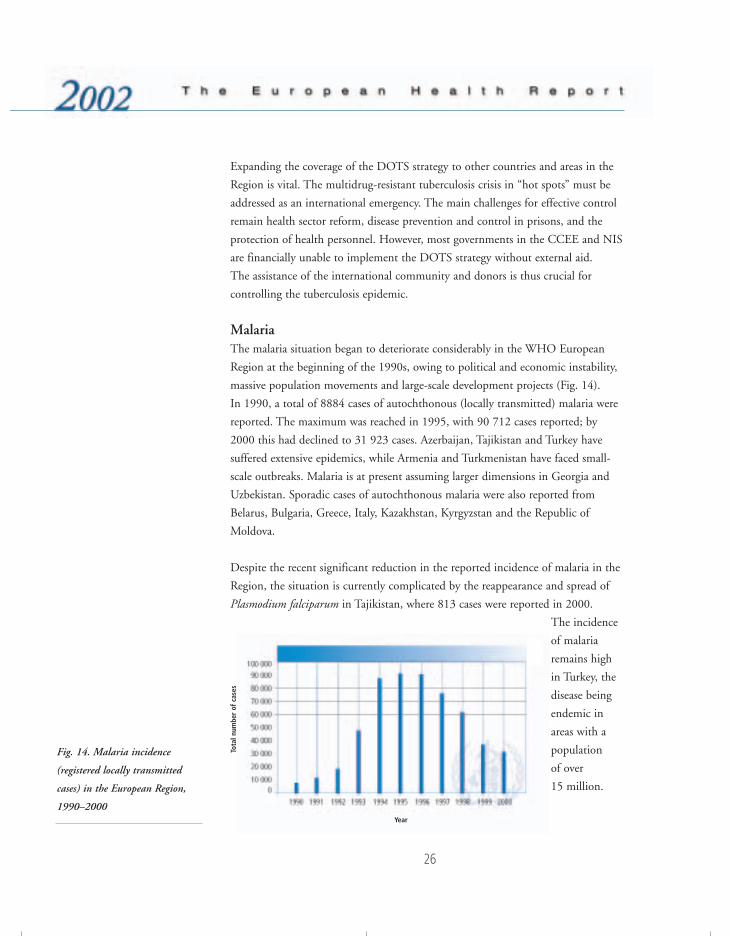
MalariaThe malaria situation began to deteriorate considerably in the WHO European
Region at the beginning of the 1990s, owing to political and economic instability,
massive population movements and large-scale development projects (Fig. 14).
In 1990, a total of 8884 cases of autochthonous (locally transmitted) malaria were
reported. The maximum was reached in 1995, with 90 712 cases reported; by
2000 this had declined to 31 923 cases. Azerbaijan, Tajikistan and Turkey have
suffered extensive epidemics, while Armenia and Turkmenistan have faced small-
scale outbreaks. Malaria is at present assuming larger dimensions in Georgia and
Uzbekistan. Sporadic cases of autochthonous malaria were also reported from
Belarus, Bulgaria, Greece, Italy, Kazakhstan, Kyrgyzstan and the Republic of
Moldova.
Despite the recent significant reduction in the reported incidence of malaria in the
Region, the situation is currently complicated by the reappearance and spread of
Plasmodium falciparum in Tajikistan, where 813 cases were reported in 2000.
The incidence
of malaria
remains high
in Turkey, the
disease being
endemic in
areas with a
population
of over
15 million.
Fig. 14. Malaria incidence
(registered locally transmitted
cases) in the European Region,
1990–2000Year
Tota
l num
ber
of c
ases
76057 May2002-v2 20/08/02 17:22 Side 26
27
In response to this situation, a regional strategy to roll back malaria (RBM) was
developed and applied in 1999. The goal is to interrupt transmission, and
particularly that of falciparum malaria, by 2010. The regional RBM programme
addresses malaria-related issues through advocacy at regional and country levels,
encouraging institutional development, promoting RBM resource mobilization,
improving capacities for disease management, building capacities for timely
response to emergency situations, strengthening surveillance mechanisms and local
operational research, ensuring community mobilization and enhancing
intersectoral collaboration.
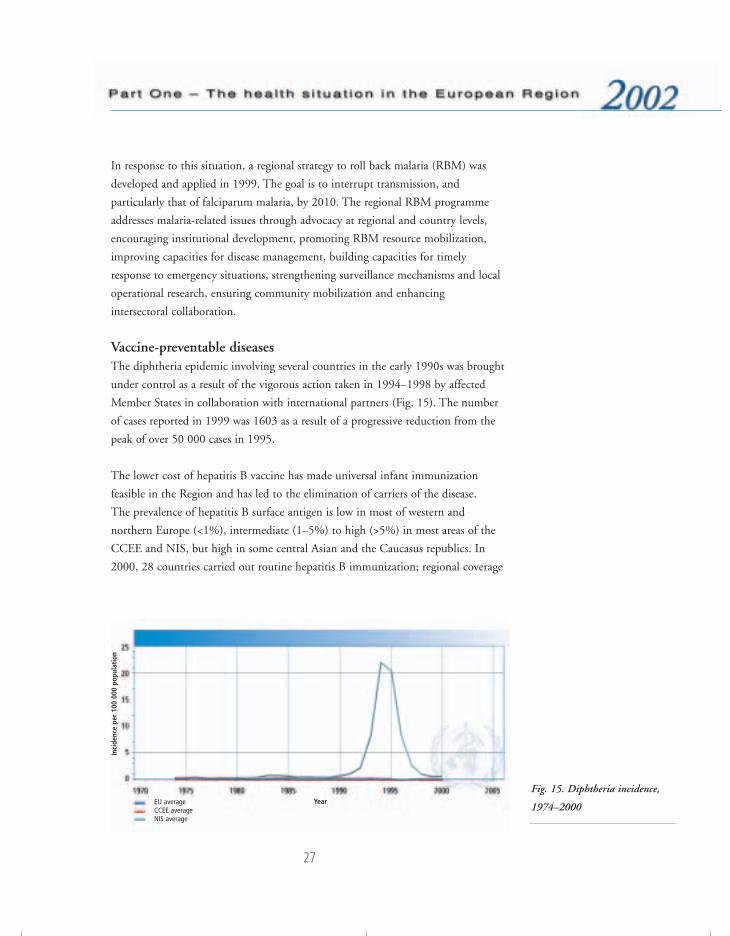
Vaccine-preventable diseasesThe diphtheria epidemic involving several countries in the early 1990s was brought
under control as a result of the vigorous action taken in 1994–1998 by affected
Member States in collaboration with international partners (Fig. 15). The number
of cases reported in 1999 was 1603 as a result of a progressive reduction from the
peak of over 50 000 cases in 1995.
The lower cost of hepatitis B vaccine has made universal infant immunization
feasible in the Region and has led to the elimination of carriers of the disease.
The prevalence of hepatitis B surface antigen is low in most of western and
northern Europe (<1%), intermediate (1–5%) to high (>5%) in most areas of the
CCEE and NIS, but high in some central Asian and the Caucasus republics. In
2000, 28 countries carried out routine hepatitis B immunization; regional coverage
Fig. 15. Diphtheria incidence,
1974–2000EU averageCCEE average NIS average
Year
Inci
denc
e pe
r 10
0 00
0 po
pula
tion
76057 May2002-v2 20/08/02 17:22 Side 27

28
in 1999 was 24% (26 countries reporting), up from 4% in 1990 (4 countries
reporting).
Coordinated interregional mass vaccination campaigns under “Operation
MECACAR” has resulted in no cases of poliomyelitis due to indigenous strains of
wild poliovirus being reported since November 1998. Three cases in Bulgaria in
March–May 2001 occurred in a high-risk minority subpopulation and were caused
by a wild poliovirus strain originating from northern India; rapid detection
permitted prompt control through immunization campaigns.
In 1999, despite declining incidence, reported cases of measles exceeded 17 900
(Fig. 16). In many countries, however, measles surveillance is limited and few
countries include routine laboratory confirmation. This complicates the problem of
assessing the current burden of the disease in the Region while preparing Member
States for measles elimination. Improving immunization services and offering new
vaccine antigens are among WHO’s goals in Europe. Therefore, the Global
Alliance for Vaccines and Immunization,9 a broad partnership supporting
immunization systems, provides a great opportunity for making better use of
vaccines and strengthening national immunization programmes in the 11 eligible
countries of the Region. Further emphasis will be placed on the expanded
utilization of under-used vaccines, the enhancement of cold chain and logistics
systems and the promotion of safe immunization practices.
Fig. 16. Measles incidence,
1974–2000
9 http://www.vaccinealliance.org, accessed 21 May 2002.
EU averageCCEE average NIS average
Year
Inci
denc
e pe
r 10
0 00
0 po
pula
tion
76057 May2002-v2 20/08/02 17:22 Side 28
29
The poliomyelitis outbreak in Bulgaria emphasizes the need for high-quality
surveillance and maintenance of high immunization levels throughout every
subpopulation of all Member States until global eradication is complete and
certified. Many countries’ authorities are now eager to move to strengthening
measles surveillance and are targeting measles elimination. Measles elimination in
the Region requires the achievement and maintenance of very high routine
immunization coverage with a first dose of measles vaccine, ensuring that there is
the opportunity for a second dose and strengthening surveillance and laboratory
confirmation. Accelerated control of rubella and congenital rubella will be included
in the activities planned for measles elimination.
The main challenge in terms of vaccine-preventable diseases is the mobilization of
resources to implement the strategies in the Member States in economic transition,
and ensuring the political will for implementation in some western European
countries. Member States have made substantial progress towards self-sufficient,
sustainable national immunization services, widely accepted as highly cost-effective
programmes. Reported regional immunization coverage in 1999 was 94% for
DTP3 and 90% for measles vaccine.
Noncommunicable diseasesNoncommunicable diseases (NCDs) are a set of chronic diseases of major public
health importance that represent the bulk of morbidity, disability and premature
death in the WHO European Region. These diseases accounted for about 75% of
the burden of disease expressed in DALYs in 2000. Cardiovascular diseases were
responsible for about 21.8%, malignant neoplasms for 11.5%, asthma and chronic
obstructive pulmonary diseases for 4.2%, rheumatoid arthritis and osteoarthritis
for 3.5%, and diabetes mellitus for 1.6%. NCDs are expected to account for an
even greater share of the disease burden, estimated at over 80%, by 2020. The
growing epidemic of NCDs is also responsible for most of the widening gap in life
expectancy, mortality and quality of life among and within countries in the
European Region, and in the world.
However, information on the existing and growing burden of NCDs is still mainly
based on mortality data, which cannot adequately reflect their outcome in terms of
the burden of ill health and disability on individuals, health systems and societies
at large. There are few comparable data from population surveys. The source of
76057 May2002-v2 20/08/02 17:22 Side 29
30
information is therefore limited to studies in selected subnational sites, such as the
WHO MONICA (MONItoring CArdiovascular diseases) Project, that monitor
the occurrence of events that reflect these diseases. Major efforts are undertaken to
strengthen capacities for data collection and improve the evidence base for health
policies in Member States. WHO will support these efforts, in particular as part of
the world health survey in 2002.
The most prominent NCDs, such as cardiovascular diseases, cancer, chronic
obstructive pulmonary disease and diabetes, are linked by common preventable
risk factors related to lifestyle, such as tobacco use, unhealthy diet, obesity and
physical inactivity. Psychosocial stress has also been identified as important in the
development of chronic disease, especially cardiovascular diseases.10 In addition,
there is clear evidence that the development of NCDs is influenced by
socioeconomic circumstances.11 This is shown by the occurrence of diseases in
different social groups not only within countries but also between countries.12
The increase in the incidence of NCDs is seen disproportionately in poor and
disadvantaged populations.
Data related to risk factors are collected in several countries, but there is a need to
improve intercountry comparability. Internationally, there are also examples of data
collection on risk factors. Through the CINDI programme13 some countries have
collaborated to develop standardized approaches to data collection and risk factor
surveys. Initiatives such as the CINDI Health Monitor survey14 based on the
FINBALT survey methodology, or the joint WHO/EU EUROHIS project on
common methods and instruments for health interview surveys, have also set
standards and protocols for the collection of data on risk factors and health
behaviour. Comparable data on levels of physiological risk factors, such as high
blood pressure and high serum cholesterol levels, are not systematically collected in
all countries of the WHO European Region. There have been proposals for data
10 HEMINGWAY, H. & MARMOT, M. Evidence-based cardiology: psychosocial factors in the aetiology and prognosisof coronary heart disease. Systematic review of prospective cohort studies. British medical journal, 318:1460–1467 (1999).
11 MARMOT, M. & BOBAK, M. International comparators and poverty and health in Europe. British medical journal,321: 1124–1128 (2000).
12 WORLD BANK. World development report 1993. New York, Oxford University Press, 1993.13 CINDI is a collaborative international effort to provide participating countries with a framework or approach for
activities aimed at preventing or controlling risk factors common to NCDs. Experience gained in several nationaldemonstration projects, such as the North Karelia Project in Finland, shows that such work can provide apowerful tool for the development of national policy.
14 http://www.euro.who.int/Document/Chr/Cinheamonquest.pdf, accessed 29 May 2002.
76057 May2002-v2 20/08/02 17:22 Side 30
31
harmonization through an international risk factor surveillance programme (the
EURALIM project15).
There now exists a body of knowledge and experience on opportunities for action
to control NCDs. They are to a great extent preventable through interventions
against the major common risk factors and their socioeconomic determinants in
the population. Several studies show that changes in risk factors explain changes in
mortality, as was the case with mortality from ischaemic heart disease in Finland.16
Action to prevent these diseases should therefore focus on controlling the risk
factors in an integrated manner. The state of development and accessibility of the
health care system will also have an impact on the outcome of noncommunicable
diseases. Nevertheless, it needs to be made clear that risk factors and the quality
and accessibility of health care are distributed by socioeconomic factors in the
population.
WHO recognizes NCD prevention and control as a major health issue that needs
to be comprehensively addressed in the 21st century. HEALTH2117 has provided a
framework for diminishing the burden of NCDs by focusing on the need to tackle
the determinants of these diseases and to influence risk factors and health
behaviour. WHO, in World Health Assembly resolution WHA51.18, has
committed itself to the development of an umbrella strategy to address the burden
of NCD and to the provision of leadership in its implementation. Many countries
of the Region are developing or have developed policies to work towards the
objectives of the WHO global strategy: to map emerging epidemics, to reduce
exposure to common risk factors, and to strengthen health care through
surveillance, health promotion, disease prevention and effective interventions.
A survey was carried out by WHO in 200118 to provide an assessment of the
national capacity for NCD prevention and control with respect to health policy,
programmes and infrastructures in all six regions of WHO. The following are the
key findings for the European Region.
15 http://www.epidemiology.ch/euralim, accessed 21 May 2002.16 VARTIAINEN, A. ET AL. British medical journal, 309: 23–27 (1994).17 HEALTH21: the health for all policy framework for the WHO European Region. Copenhagen, WHO Regional Office
for Europe, 1999 (European Health for All Series, No. 6).18 Assessment of national capacity for noncommunicable disease prevention and control. The report of a global survey.
Geneva, World Health Organization, 2001 (document WHO/MNC/01.2).
76057 May2002-v2 20/08/02 17:22 Side 31
32
• NCD policies exist in 59% of countries, and specific cardiovascular, diabetes
and cancer plans exist in 50%, 54% and 62% of the Member States,
respectively.
• Some 63% of countries report having a dedicated unit for NCD prevention,
but less than 46% report having a budget line specifically allocated to NCDs.
• National reference centres for diabetes and cancer are reported for 66% and
71% of countries, respectively.
• Strengthening of concrete action on NCDs would require that countries place a
higher priority on NCDs and improve their capacity for policy development.
• Effective surveillance systems and reliable data on the major risk factors are key
prerequisites for NCD programme planning, priority-setting and evaluation.
The prevalence of smoking and of diabetes are the most frequently reported
NCD indicators in 88% and 80% of countries, respectively. Data on diet,
hypertension, anthropometric measurements and physical activity were
collected in about 70% of countries. Only 44% of countries in the Region
include risk factor data in their annual health reporting system.
• Adequate training of health professionals in the prevention and management of
NCDs remains an important challenge in many countries.
• Integrated efforts for the prevention and control of NCDs are critical to the
success of many NCD initiatives. A partnership approach is crucial in dealing
with the broad range of NCD risk factors. The survey suggests that
nongovernmental organizations (NGOs) appear to be involved in NCD
prevention and control activities in many countries of the Region. The main
activities reported are: education (94%), prevention (98%), public awareness
(89%) and patient management (86%). Fewer NGOs (62%) are involved with
NCD policy development.
Cardiovascular diseasesCardiovascular diseases (CVD) include hypertension, coronary heart disease
(CHD), cerebrovascular disease (stroke), peripheral vascular disease, heart failure,
rheumatic heart disease, congenital heart disease and cardiomyopathies. According
to the World health report estimates for 2000, these represent the first cause of
disease burden expressed in DALYs in the WHO European Region as a whole.
They rank second to neuropsychiatric disorders only in countries that have
76057 May2002-v2 20/08/02 17:22 Side 32
33
achieved very low child and very low adult mortality, i.e. the developed market
economies of western Europe and some EU accession countries.
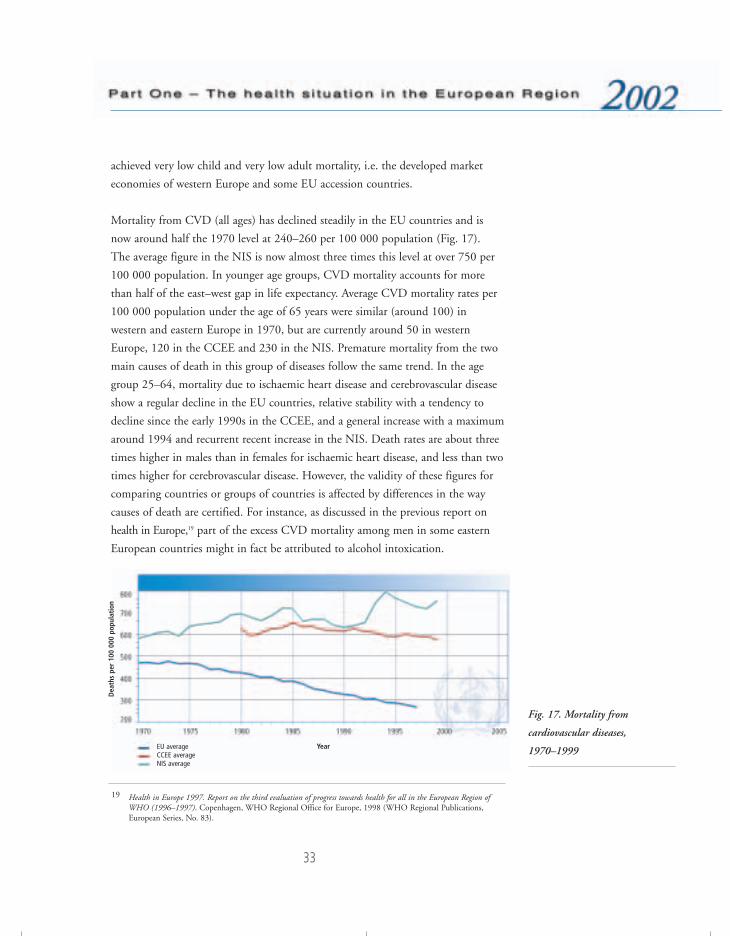
Mortality from CVD (all ages) has declined steadily in the EU countries and is
now around half the 1970 level at 240–260 per 100 000 population (Fig. 17).
The average figure in the NIS is now almost three times this level at over 750 per
100 000 population. In younger age groups, CVD mortality accounts for more
than half of the east–west gap in life expectancy. Average CVD mortality rates per
100 000 population under the age of 65 years were similar (around 100) in
western and eastern Europe in 1970, but are currently around 50 in western
Europe, 120 in the CCEE and 230 in the NIS. Premature mortality from the two
main causes of death in this group of diseases follow the same trend. In the age
group 25–64, mortality due to ischaemic heart disease and cerebrovascular disease
show a regular decline in the EU countries, relative stability with a tendency to
decline since the early 1990s in the CCEE, and a general increase with a maximum
around 1994 and recurrent recent increase in the NIS. Death rates are about three
times higher in males than in females for ischaemic heart disease, and less than two
times higher for cerebrovascular disease. However, the validity of these figures for
comparing countries or groups of countries is affected by differences in the way
causes of death are certified. For instance, as discussed in the previous report on
health in Europe,19 part of the excess CVD mortality among men in some eastern
European countries might in fact be attributed to alcohol intoxication.
Fig. 17. Mortality from
cardiovascular diseases,
1970–1999EU averageCCEE average NIS average
19 Health in Europe 1997. Report on the third evaluation of progress towards health for all in the European Region ofWHO (1996–1997). Copenhagen, WHO Regional Office for Europe, 1998 (WHO Regional Publications,European Series, No. 83).
Year
Dea
ths
per
100
000
popu
lati
on
76057 May2002-v2 20/08/02 17:22 Side 33
34
The WHO MONICA Project20 tracked CHD rates, risk factors and coronary care
in predefined populations in 37 countries from the mid-1980s to the mid-1990s,
to get an accurate picture of CVD levels and trends. Trends in CHD rates were
similar to those in the routine mortality statistics, even though the latter tended to
underestimate death rates from CHD in many countries. The Project thus validates
the use of routine death data for monitoring long-term trends in death from
CHD. The greatest fall in CHD rates in men occurred in three north European
populations: North Karelia and Kuopio in Finland, and Northern Sweden. With
the exception of Catalonia (Spain), male populations experiencing a notable
increase in rates were predominantly from central and eastern Europe. In women,
the populations experiencing significant increases again tended to be from central
and eastern Europe, but the general pattern of increases and decreases appeared to
be less consistent. Where mortality rates were falling, prolonged survival
contributed one third and a decrease in CHD rates two thirds, on average, of the
total change in these rates, indicating the importance of both the prevention of
heart disease and improved care of acute events.
The results show that CHD rates are declining in most MONICA centres, and
there is no reason why these improvements cannot be continued and extended to
other countries. More generally, evidence of a positive change has been
documented in several western European countries. This is at least partially due to
improved primary and secondary prevention as well as improved non-invasive and
surgical treatment of patients. WHO has given priority to the prevention and
control of CVD as an indication of its policy to accelerate these favourable trends.
CancerAccording to data officially reported to the Regional Office, cancer is responsible
for close to one fifth of all deaths, ranging from about 30% in some western
European countries to about 10% in some countries in the east of the
Region (Fig. 18). It is also responsible for a large proportion of years of life lost
and years lived with disability. The average cancer mortality rate in people aged
0–64 years is 79 per 100 000 population in the EU, 104 in the CCEE and 99 in
the NIS. In people aged 65 and over, the rates are respectively 1065, 1024 and
785, that is the CCEE and particularly the NIS show lower rates than the EU,
20 http://www.who.int/inf-pr-1999/en/pr99-27.html, accessed 7 May 2002.
76057 May2002-v2 20/08/02 17:22 Side 34
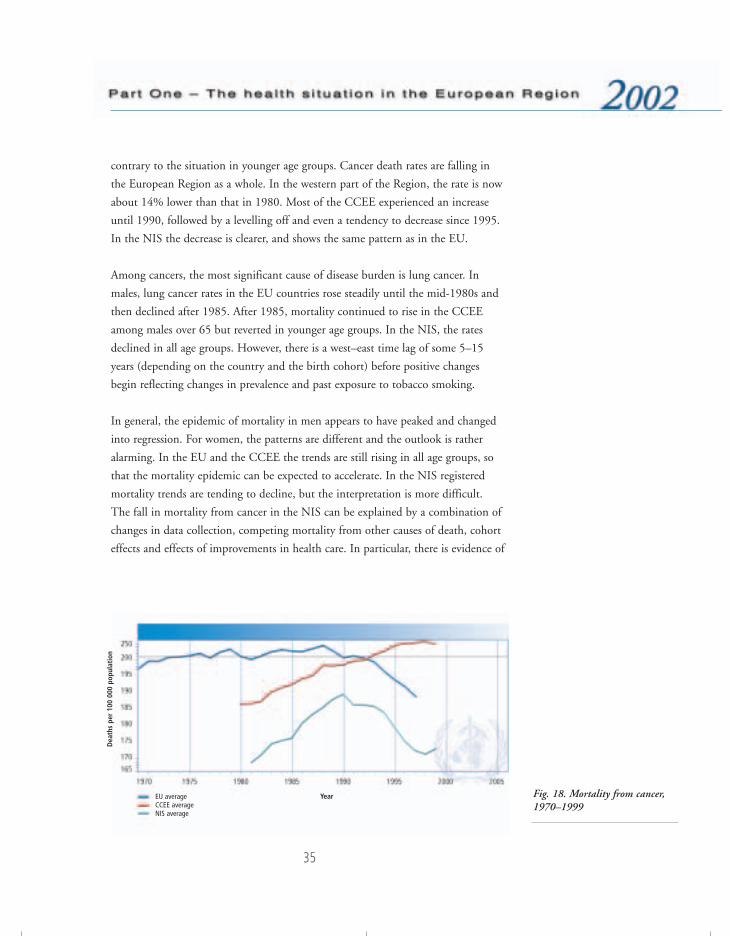
35
contrary to the situation in younger age groups. Cancer death rates are falling in
the European Region as a whole. In the western part of the Region, the rate is now
about 14% lower than that in 1980. Most of the CCEE experienced an increase
until 1990, followed by a levelling off and even a tendency to decrease since 1995.
In the NIS the decrease is clearer, and shows the same pattern as in the EU.
Among cancers, the most significant cause of disease burden is lung cancer. In
males, lung cancer rates in the EU countries rose steadily until the mid-1980s and
then declined after 1985. After 1985, mortality continued to rise in the CCEE
among males over 65 but reverted in younger age groups. In the NIS, the rates
declined in all age groups. However, there is a west–east time lag of some 5–15
years (depending on the country and the birth cohort) before positive changes
begin reflecting changes in prevalence and past exposure to tobacco smoking.
In general, the epidemic of mortality in men appears to have peaked and changed
into regression. For women, the patterns are different and the outlook is rather
alarming. In the EU and the CCEE the trends are still rising in all age groups, so
that the mortality epidemic can be expected to accelerate. In the NIS registered
mortality trends are tending to decline, but the interpretation is more difficult.
The fall in mortality from cancer in the NIS can be explained by a combination of
changes in data collection, competing mortality from other causes of death, cohort
effects and effects of improvements in health care. In particular, there is evidence of
Fig. 18. Mortality from cancer,1970–1999
EU averageCCEE average NIS average
Year
Dea
ths
per
100
000
popu
lati
on
76057 May2002-v2 20/08/02 17:22 Side 35
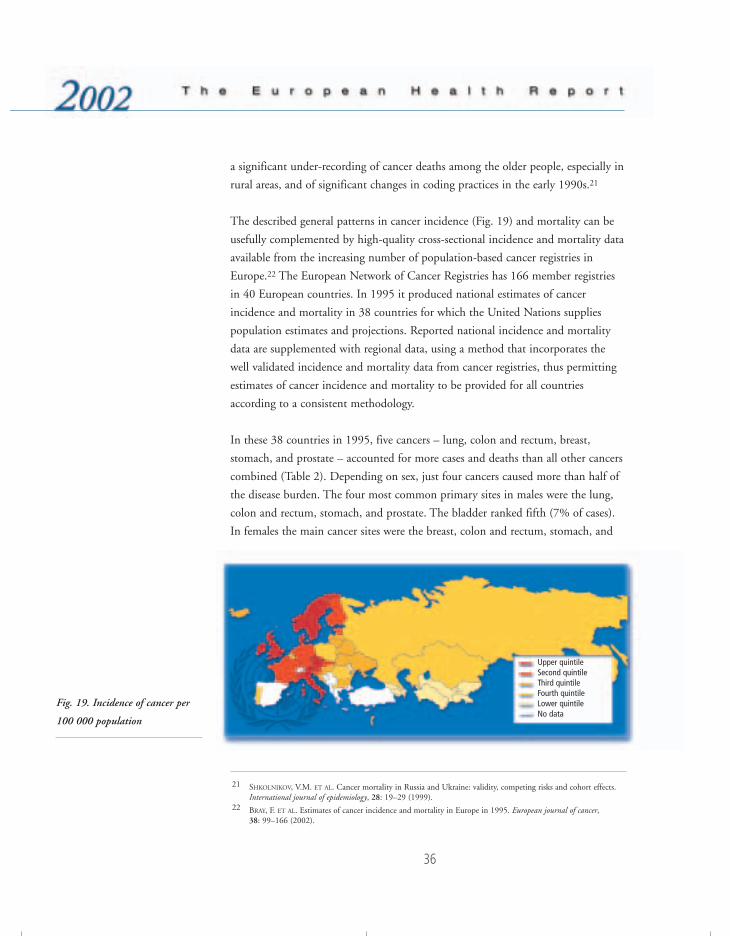
36
a significant under-recording of cancer deaths among the older people, especially in
rural areas, and of significant changes in coding practices in the early 1990s.21
The described general patterns in cancer incidence (Fig. 19) and mortality can be
usefully complemented by high-quality cross-sectional incidence and mortality data
available from the increasing number of population-based cancer registries in
Europe.22 The European Network of Cancer Registries has 166 member registries
in 40 European countries. In 1995 it produced national estimates of cancer
incidence and mortality in 38 countries for which the United Nations supplies
population estimates and projections. Reported national incidence and mortality
data are supplemented with regional data, using a method that incorporates the
well validated incidence and mortality data from cancer registries, thus permitting
estimates of cancer incidence and mortality to be provided for all countries
according to a consistent methodology.
In these 38 countries in 1995, five cancers – lung, colon and rectum, breast,
stomach, and prostate – accounted for more cases and deaths than all other cancers
combined (Table 2). Depending on sex, just four cancers caused more than half of
the disease burden. The four most common primary sites in males were the lung,
colon and rectum, stomach, and prostate. The bladder ranked fifth (7% of cases).
In females the main cancer sites were the breast, colon and rectum, stomach, and
Fig. 19. Incidence of cancer per
100 000 population
21 SHKOLNIKOV, V.M. ET AL. Cancer mortality in Russia and Ukraine: validity, competing risks and cohort effects.International journal of epidemiology, 28: 19–29 (1999).
22 BRAY, F. ET AL. Estimates of cancer incidence and mortality in Europe in 1995. European journal of cancer,38: 99–166 (2002).
Upper quintileSecond quintileThird quintileFourth quintileLower quintileNo data
76057 May2002-v2 20/08/02 17:22 Side 36
37
lung. Cancer of the cervix and uterus shared fifth place (6% each). Overall
incidence23 in males were highest in western Europe followed by the CCEE, with
extremely high rates in the Czech Republic and Hungary. In women, the highest
rates were observed in northern Europe, particularly in Denmark but also in Iceland.
The number of deaths reflects both incidence and rate of survival. By far the
biggest killer was lung cancer. Owing to the poor prognosis, the absolute number
of deaths almost matched the absolute incidence. Deaths from cancers of the colon
and rectum ranked second, followed by stomach cancer, which, owing to its poorer
rate of survival, ranked higher than breast cancer. The most common cause of
death from cancer in males was lung cancer, while in females it was breast cancer.
The general patterns that emerge, despite some remaining reservations due to data
quality and availability in some parts of the Region, are consistent with
information on past exposures and interventions. This overall impression, however,
should not hide the diversity in trends and levels of occurrence by cancer type, age
and sex, and geography. These complex developments only reconfirm the need for
cancer control measures that are well focused on the specific situation of the target
population group, on the basis of sufficient epidemiological evidence and regular
surveillance.
Globally, it is estimated that simply applying existing knowledge could prevent a
quarter of all cancers. A third are curable using today’s technology, and this can be
confidently predicted to rise to one half over the next 25 years. But the appropriate
expertise has to be widely accessible. For those who cannot be cured, effective
palliation of symptoms, especially pain, should be a basic human right. Effective
strategies, political will, skilled persuasion and good media relations, as well as
international, professional and industrial collaboration, will be vital to achieve this
target.
The WHO strategy is to improve cancer control through the development of
national cancer programmes, which take into account the epidemiology of cancer,
educational standards, existing resources and the economic status of the health care
system in each country. Central to this initiative is the so-called “cancer priority
23 Non-melanoma skin cancers are not included in the estimates of all cancers.
76057 May2002-v2 20/08/02 17:22 Side 37
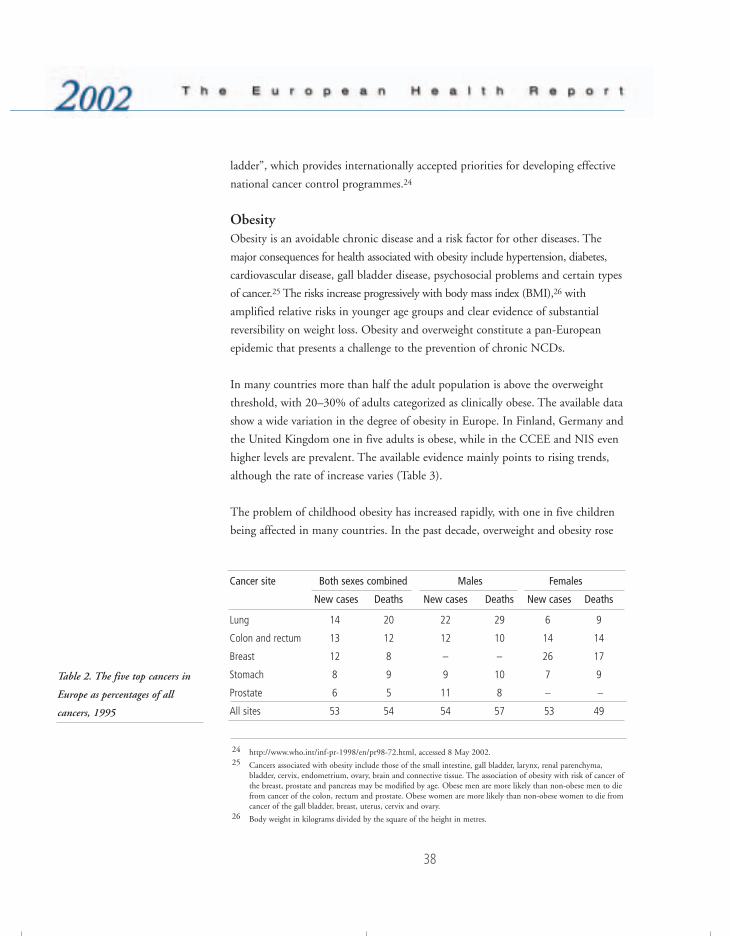
38
ladder”, which provides internationally accepted priorities for developing effective
national cancer control programmes.24
ObesityObesity is an avoidable chronic disease and a risk factor for other diseases. The
major consequences for health associated with obesity include hypertension, diabetes,
cardiovascular disease, gall bladder disease, psychosocial problems and certain types
of cancer.25 The risks increase progressively with body mass index (BMI),26 with
amplified relative risks in younger age groups and clear evidence of substantial
reversibility on weight loss. Obesity and overweight constitute a pan-European
epidemic that presents a challenge to the prevention of chronic NCDs.
In many countries more than half the adult population is above the overweight
threshold, with 20–30% of adults categorized as clinically obese. The available data
show a wide variation in the degree of obesity in Europe. In Finland, Germany and
the United Kingdom one in five adults is obese, while in the CCEE and NIS even
higher levels are prevalent. The available evidence mainly points to rising trends,
although the rate of increase varies (Table 3).
The problem of childhood obesity has increased rapidly, with one in five children
being affected in many countries. In the past decade, overweight and obesity rose
Cancer site Both sexes combined Males Females
New cases Deaths New cases Deaths New cases Deaths
Lung 14 20 22 29 6 9
Colon and rectum 13 12 12 10 14 14
Breast 12 8 – – 26 17
Stomach 8 9 9 10 7 9
Prostate 6 5 11 8 – –
All sites 53 54 54 57 53 49
Table 2. The five top cancers in
Europe as percentages of all
cancers, 1995
24 http://www.who.int/inf-pr-1998/en/pr98-72.html, accessed 8 May 2002.25 Cancers associated with obesity include those of the small intestine, gall bladder, larynx, renal parenchyma,
bladder, cervix, endometrium, ovary, brain and connective tissue. The association of obesity with risk of cancer ofthe breast, prostate and pancreas may be modified by age. Obese men are more likely than non-obese men to diefrom cancer of the colon, rectum and prostate. Obese women are more likely than non-obese women to die fromcancer of the gall bladder, breast, uterus, cervix and ovary.
26 Body weight in kilograms divided by the square of the height in metres.
76057 May2002-v2 20/08/02 17:22 Side 38
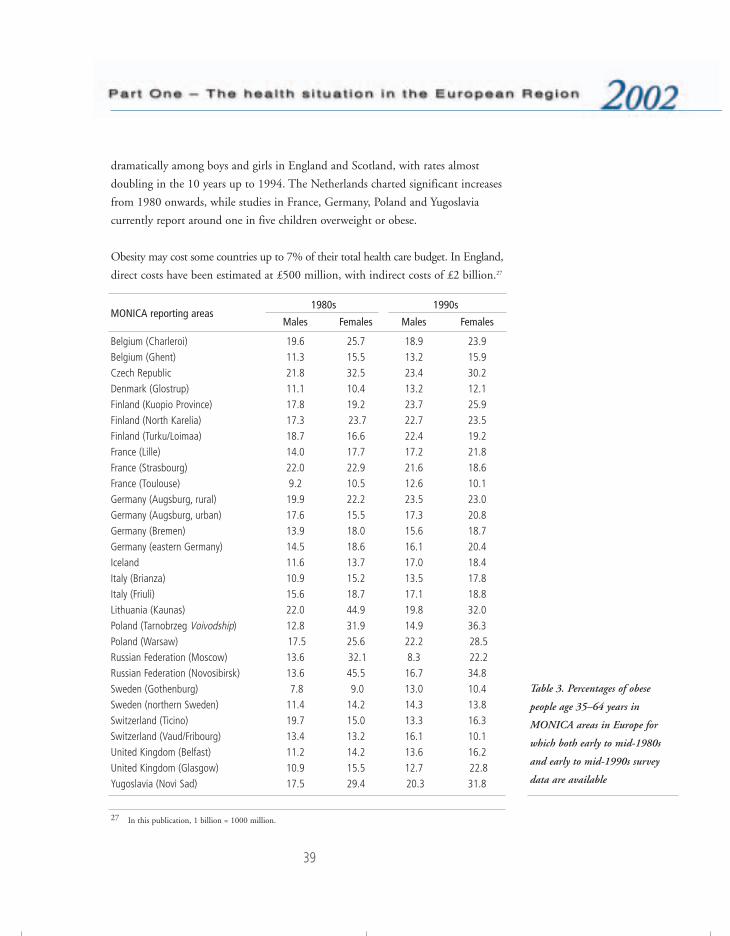
39
dramatically among boys and girls in England and Scotland, with rates almost
doubling in the 10 years up to 1994. The Netherlands charted significant increases
from 1980 onwards, while studies in France, Germany, Poland and Yugoslavia
currently report around one in five children overweight or obese.
Obesity may cost some countries up to 7% of their total health care budget. In England,
direct costs have been estimated at £500 million, with indirect costs of £2 billion.27
1980s 1990sMONICA reporting areas
Males Females Males Females
Belgium (Charleroi) 19.6 25.7 18.9 23.9 Belgium (Ghent) 11.3 15.5 13.2 15.9 Czech Republic 21.8 32.5 23.4 30.2 Denmark (Glostrup) 11.1 10.4 13.2 12.1 Finland (Kuopio Province) 17.8 19.2 23.7 25.9 Finland (North Karelia) 17.3 23.7 22.7 23.5 Finland (Turku/Loimaa) 18.7 16.6 22.4 19.2 France (Lille) 14.0 17.7 17.2 21.8 France (Strasbourg) 22.0 22.9 21.6 18.6 France (Toulouse) 9.2 10.5 12.6 10.1 Germany (Augsburg, rural) 19.9 22.2 23.5 23.0 Germany (Augsburg, urban) 17.6 15.5 17.3 20.8 Germany (Bremen) 13.9 18.0 15.6 18.7 Germany (eastern Germany) 14.5 18.6 16.1 20.4 Iceland 11.6 13.7 17.0 18.4 Italy (Brianza) 10.9 15.2 13.5 17.8 Italy (Friuli) 15.6 18.7 17.1 18.8 Lithuania (Kaunas) 22.0 44.9 19.8 32.0 Poland (Tarnobrzeg Voivodship) 12.8 31.9 14.9 36.3 Poland (Warsaw) 17.5 25.6 22.2 28.5 Russian Federation (Moscow) 13.6 32.1 8.3 22.2 Russian Federation (Novosibirsk) 13.6 45.5 16.7 34.8 Sweden (Gothenburg) 7.8 9.0 13.0 10.4 Sweden (northern Sweden) 11.4 14.2 14.3 13.8 Switzerland (Ticino) 19.7 15.0 13.3 16.3 Switzerland (Vaud/Fribourg) 13.4 13.2 16.1 10.1 United Kingdom (Belfast) 11.2 14.2 13.6 16.2 United Kingdom (Glasgow) 10.9 15.5 12.7 22.8 Yugoslavia (Novi Sad) 17.5 29.4 20.3 31.8
Table 3. Percentages of obese
people age 35–64 years in
MONICA areas in Europe for
which both early to mid-1980s
and early to mid-1990s survey
data are available
27 In this publication, 1 billion = 1000 million.
76057 May2002-v2 20/08/02 17:23 Side 39
40
In Germany, recent estimates have suggested even higher costs of DM20 billion, at
1995 values. In France, with a lower level of obesity, direct costs are in the range of
4.2–8.7 billion francs at 1992 values – up to 1.5% of total health costs.
Comprehensive strategies have yet to be developed that address the problem of
overweight and obesity among adults and children at population level.
Governments must develop stronger approaches to nutrition and physical activity
that require coordinated intersectoral commitment at all levels. Too often, policy-
makers assume that the only way to help is through personalized health education;
this is manifestly failing, as shown by the huge interest in slimming and in
slimming foods and other aids to weight reduction, together with escalating rates
of overweight and obesity. Europe needs to develop broader, more coherent policies
to counteract the pressures conducive to obesity that now affect huge populations.
Diabetes mellitusThe number of people living with diabetes mellitus is rapidly increasing in most
countries. In the European Region, about 22.5 million adults are affected. Some
5–15% of all people with diabetes have type 1 diabetes, which strikes mainly
children and adolescents, requiring them to inject insulin several times a day for
the rest of their lives. The rest of those afflicted have type 2 diabetes, which appears
typically in middle age. However, there is no doubt that diabetes, especially type 2,
is being diagnosed more frequently and earlier in life. It has changed from an “old
people’s disease” to a disease afflicting people in the first half of their life. The
ensuing high level of blood sugar is usually accompanied by high blood pressure
and disturbances of blood cholesterol levels.
Diabetes is still an important cause of excess perinatal mortality in many countries,
still the commonest cause of blindness in people of working age, one of the most
common causes of kidney failure, and the commonest cause of leg amputation.
Generally, those who suffer from diabetes have a 3–4 times higher risk of dying
prematurely from cardiovascular disease than the rest of the population. The cost
to the health system is enormous: a recent Swedish study estimated the cost of
diabetes at some 8% of the total health budget, the highest proportion being
related to treating complications. Overall mortality from diabetes is shown in
Fig. 20.
76057 May2002-v2 20/08/02 17:23 Side 40
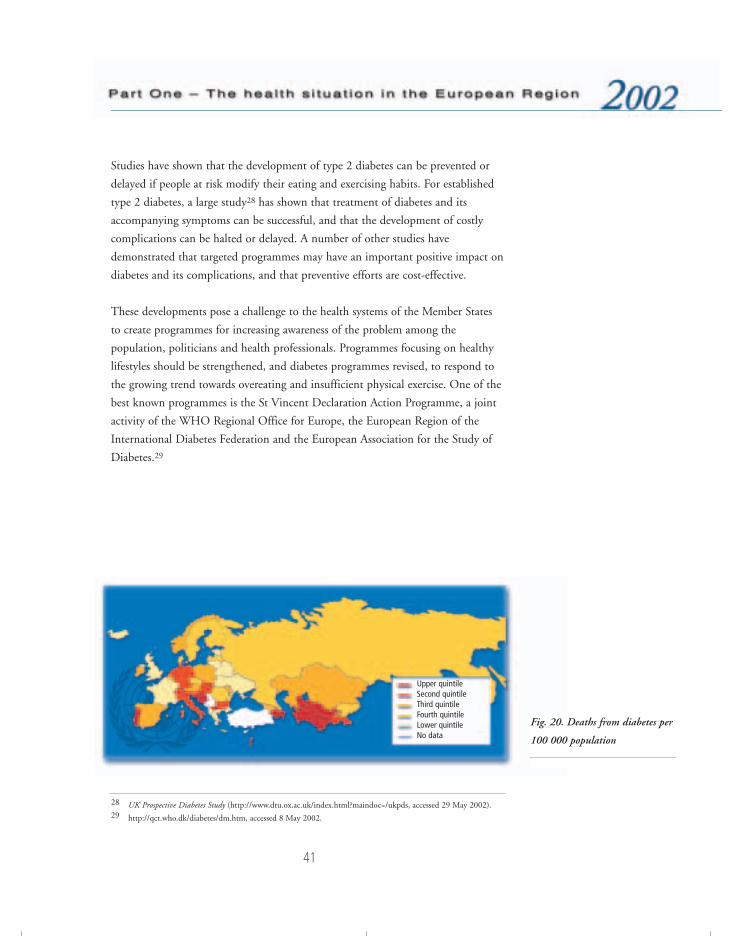
41
Studies have shown that the development of type 2 diabetes can be prevented or
delayed if people at risk modify their eating and exercising habits. For established
type 2 diabetes, a large study28 has shown that treatment of diabetes and its
accompanying symptoms can be successful, and that the development of costly
complications can be halted or delayed. A number of other studies have
demonstrated that targeted programmes may have an important positive impact on
diabetes and its complications, and that preventive efforts are cost-effective.
These developments pose a challenge to the health systems of the Member States
to create programmes for increasing awareness of the problem among the
population, politicians and health professionals. Programmes focusing on healthy
lifestyles should be strengthened, and diabetes programmes revised, to respond to
the growing trend towards overeating and insufficient physical exercise. One of the
best known programmes is the St Vincent Declaration Action Programme, a joint
activity of the WHO Regional Office for Europe, the European Region of the
International Diabetes Federation and the European Association for the Study of
Diabetes.29
Fig. 20. Deaths from diabetes per
100 000 population
28 UK Prospective Diabetes Study (http://www.dtu.ox.ac.uk/index.html?maindoc=/ukpds, accessed 29 May 2002).29 http://qct.who.dk/diabetes/dm.htm, accessed 8 May 2002.
Upper quintileSecond quintileThird quintileFourth quintileLower quintileNo data
76057 May2002-v2 20/08/02 17:23 Side 41
42
Mental healthMental health problems are increasing significantly. According to the Global
Burden of Disease estimates,30,31 mental and neurological disorders figure among
the leading causes of disease and disability. Neuropsychiatric disorders represent
11.5% of the global burden of disease. Of the 10 leading causes of disability, 5 are
mental disorders: unipolar major depression, alcohol dependence, bipolar
depression, schizophrenia and obsessive–compulsive disorder. Depression alone
accounts for 4.1% of the total, ranking fourth among the leading causes of disease
burden. By 2020 it is expected to be the second leading cause of DALYs lost,
second only to ischaemic heart disease. Worldwide, mental ill health is responsible
for a greater burden of disease than cancer, and in some European countries the
mortality from suicide now exceeds that from road traffic accidents. The burden is
even greater when taking into account the association with other conditions, such
as depression and cardiovascular diseases.
The magnitude of the burden of mental distress and disorders, ranging from stress
through depression and neurosis to major psychosis, is generally underestimated.
In the European Region, the proportion of the population with serious mental
disorders, as registered and reported by countries, varies from under 1% to 6%,
with most countries in the range of 1–3%. The prevalence of some conditions such
as anxiety varies from country to country, perhaps because of cultural differences,
while the rates for other conditions such as schizophrenia are similar between
countries, at around 1–2%. But less serious disorders, frequently unregistered, are
much more prevalent. The vast majority of minor mental disorders are dealt with
in the community itself or at primary care level, only a small proportion being
treated through the specialized mental health services. Studies show that mental
health problems account for up to 30% of consultations with general practitioners
in Europe.
Depression has considerable disabling effects and also leads to increased mortality.
The mortality rates due to suicide and self-inflicted injuries range from 11 to 36
per 100 000 population in European countries. While there is a slow decline on
30 MURRAY, C.J.L. & LOPEZ, A.D., ED. The global burden of disease. A comprehensive assessment of mortality anddisability from diseases, injuries, and risk factors in 1990 and projected to 2020. Boston, MA, Harvard School ofPublic Health, 1996.
31 Mental disorders may be defined as a set of symptoms or behaviour reflecting a cerebral dysfunction, associatedin most cases with distress and interference with personal functions.
76057 May2002-v2 20/08/02 17:23 Side 42
43
average in the EU countries and the CCEE, the trend in the NIS, after a sharp
decrease in 1984–1986, showed an increase in the 1990s. Up to 60% of people
with depression can recover with a proper combination of antidepressant drugs and
psychotherapy. Cognitive psychotherapy seems to be particularly effective. Nordic
studies showed a 20–30% decrease in suicide rates after general practitioners were
trained to recognize and treat depression.
The causes and impact of mental health disorders vary with different social and
economic factors. In eastern Europe, mental health problems have been associated
with the decrease in life expectancy over the past decade, related to economic and
social changes over the same period. In particular, there is some evidence for a
relationship between socioeconomic disadvantage and the prevalence of depression.
In the European Region, mental health is characterized by three main factors. First,
the levels of the economic, psychosocial and environmental determinants of health
have a major impact on people’s wellbeing and the provision of mental health
services. Second, the persisting stigmatization of mental disorders leaves many
patients to the custodial services, with consequences for the timeliness of
intervention, the humanization of services and the reintegration of the mentally ill
into society. Third, conditions related to stress and helplessness, such as depression,
suicide, alcoholism, and violent and risk-taking behaviour, still have a major
impact on morbidity and premature mortality, especially in the eastern part of the
Region. Gender issues are also important here, reflected in the decreasing life
expectancy for men while women seem to be better able to cope with stress and
social change. In other countries, gender-specific patterns can be found in high-risk
populations, such as adolescents, single people and women under social pressure.
Standards of mental health care differ greatly across Europe. Many European
countries spend less than 3% of their health budgets on mental health care,
although the consequences of mental ill health can amount to one third to one half
of health care costs. Very large hospitals still exist in eastern European countries,
treating up to 50% of all patients, while countries in the west of the Region tend
to prefer treatment in the community. This latter model also encounters problems,
however, such as a lack of accessibility to health professionals and the reluctance of
communities to accept people with mental disorders.
76057 May2002-v2 20/08/02 17:23 Side 43
44
The importance attached by WHO to mental health was reflected in several events
in 2001. The theme chosen for the World Health Day was “Stop exclusion – dare
to care”. The World Health Assembly discussed all aspects of mental health.
The world health report 2001 provided a comprehensive review of mental health
problems and their contributing factors, and outlined policies for their prevention
and for the treatment and care of mentally ill patients as well as the promotion and
protection of mental health. In particular, the stigma associated with mental health
is one of the main obstacles to early prevention and treatment, as well as to
reintegrating mentally vulnerable people into society.
Accidents and injuriesIntentional and unintentional injuries are a large problem, relatively neglected in
many countries. Violence and self-inflicted injuries represent a major public health
concern because of their increasing significance within the global burden of diseases.
Accidents, other causes of injuries and poisoning are responsible for about one
tenth of overall mortality (around 6% and 12% on average, respectively, in the
western and eastern parts of the European Region). External causes are the leading
causes of mortality in younger age groups, and they therefore account for a large
proportion of premature deaths. On average, the standardized death rate due to
external causes in 1999 was below 40 per 100 000 population in the EU (a
reduction of more than 30% compared to 1980). From 1980 to 1992, the CCEE
had an average mortality rate of around 80 per 100 000, though it then declined
steadily to 65 per 100 000 in 1999. In the NIS there was, on average, a
considerable decline from 140 to 92 per 100 000 between 1980 and 1987,
followed by a sharp increase to 188 in 1994 (Fig. 21). Since then the situation has
improved, but the average figure is still above the 1980 level.
Some 30–40% of deaths in children aged 1–14 are caused by injuries due to traffic
accidents, to other external causes such as poisoning, drowning, fires and falls, and
to violence. The rates vary among countries, with averages of 33% in the EU
countries, 40% in the CCEE and 33% in the NIS. Injuries not only cause deaths
but also an important burden of disability and suffering among children.
76057 May2002-v2 20/08/02 17:23 Side 44
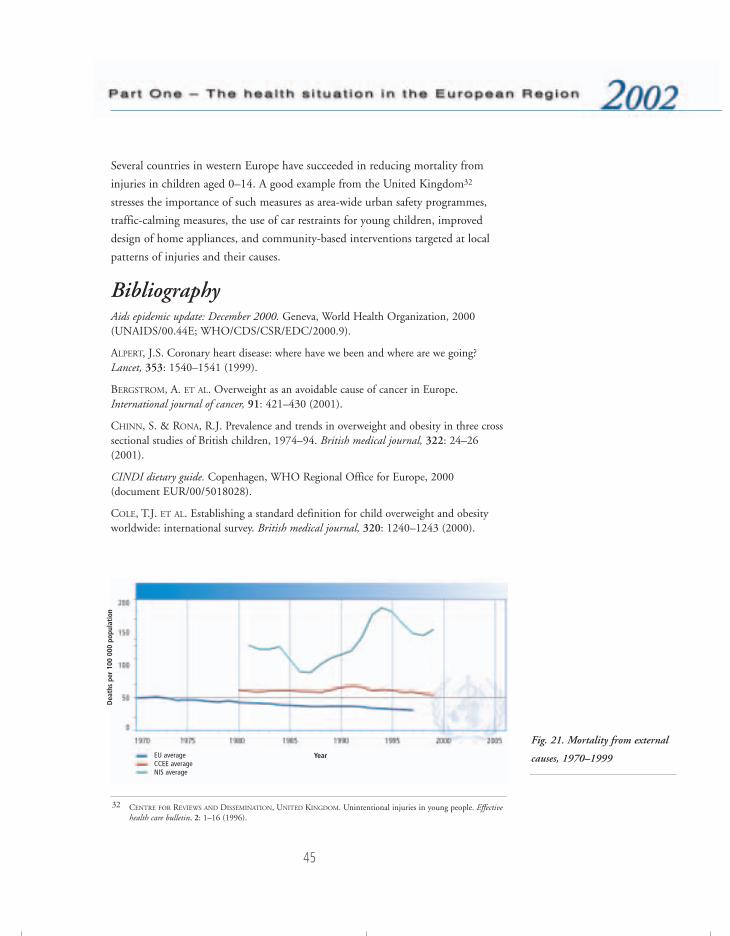
45
Several countries in western Europe have succeeded in reducing mortality from
injuries in children aged 0–14. A good example from the United Kingdom32
stresses the importance of such measures as area-wide urban safety programmes,
traffic-calming measures, the use of car restraints for young children, improved
design of home appliances, and community-based interventions targeted at local
patterns of injuries and their causes.
BibliographyAids epidemic update: December 2000. Geneva, World Health Organization, 2000(UNAIDS/00.44E; WHO/CDS/CSR/EDC/2000.9).
ALPERT, J.S. Coronary heart disease: where have we been and where are we going?Lancet, 353: 1540–1541 (1999).
BERGSTROM, A. ET AL. Overweight as an avoidable cause of cancer in Europe.International journal of cancer, 91: 421–430 (2001).
CHINN, S. & RONA, R.J. Prevalence and trends in overweight and obesity in three crosssectional studies of British children, 1974–94. British medical journal, 322: 24–26(2001).
CINDI dietary guide. Copenhagen, WHO Regional Office for Europe, 2000(document EUR/00/5018028).
COLE, T.J. ET AL. Establishing a standard definition for child overweight and obesityworldwide: international survey. British medical journal, 320: 1240–1243 (2000).
32 CENTRE FOR REVIEWS AND DISSEMINATION, UNITED KINGDOM. Unintentional injuries in young people. Effectivehealth care bulletin, 2: 1–16 (1996).
Fig. 21. Mortality from external
causes, 1970–1999EU averageCCEE average NIS average
Year
Dea
ths
per
100
000
popu
lati
on
76057 May2002-v2 20/08/02 17:23 Side 45
46
DE GUERRA MACEDO, C. & MELGAARD, B. The legacies of polio eradication. Bulletin ofthe World Health Organization, 78: 283–284 (2000).
Determinants of the burden of disease in the European Union. Stockholm, NationalInstitute of Public Health, 1997 (F-serien No. 24).
DETOURNAY, B. ET AL. Obesity morbidity and health care costs in France: an analysis ofthe 1991–1992 Medical Care Household Survey. International journal of obesity andrelated metabolic disorders, 24: 151–155 (2000).
Diabetes atlas 2000. Brussels, International Diabetes Federation, 2000.
DYE, C. ET AL. Consensus statement. Global burden of tuberculosis: estimatedincidence, prevalence, and mortality by country. WHO Global Surveillance andMonitoring Project. Journal of the American Medical Association, 282: 677–686 (1999).
EHTISHAM, S. ET AL. Type 2 diabetes mellitus in UK children – an emerging problem.Diabetic medicine, 17: 867–871 (2000).
ESPINAL, M. & RAVIGLIONE, M., ED. Coordination of DOTS-plus pilot projects forthe management of MDR-TB: proceedings of a meeting. Geneva, World HealthOrganization, 1999 (document WHO/CDS/CPC/TB/99.262).
ESPINAL, M. ET AL. Anti-Tuberculosis drug resistance in the world. Report No. 2.Prevalence and trends. Geneva, World Health Organization, 2000 (documentWHO/CDC/TB/2000.278).
EUCAN: cancer incidence, mortality and prevalence in the European Union. Lyon,International Agency for Research on Cancer, 1999 (CD-ROM).
European Regional Consultation on the Introduction of Second-Generation HIVSurveillance Guidelines. Copenhagen, WHO Regional Office for Europe, 2001(document EUR/01/5026722).
FAGOT-CAMPAGNA, A. Emergence of type 2 diabetes mellitus in children:epidemiological evidence. Journal of pediatric endocrinology & metabolism, 13(Suppl 6):1395–1402 (2000).
FREDRIKS, A.M. ET AL. Body index measurements in 1996–97 compared with 1980.Archives of disease in childhood, 82: 107–112 (2000).
GAVI: Global Alliance for Vaccines and Immunization (http://www.vaccinealliance.com,accessed 8 May 2002).
Global tuberculosis control: WHO report. Geneva, World Health Organization, 2000(document WHO/CDS/TB/2000.275).
Health in Europe 1997. Report on the third evaluation of progress towards health for all inthe European Region of WHO (1996–1997). Copenhagen, WHO Regional Office forEurope, 1998 (WHO Regional Publications, European Series, No. 83).
76057 May2002-v2 20/08/02 17:23 Side 46
47
HEITMANN, B. L. Ten-year trends in overweight and obesity among Danish men andwomen aged 30–60 years. International journal of obesity and related metabolic disorders,24: 1347–1352 (2000).
HESEKER, H. & SCHMID, A. Epidemiology of obesity. Therapeutische Umschau. Revuethérapeutique, 57: 478–481 (2000).
HIV/AIDS surveillance in Europe – Report No. 63. Paris, European Centre for theEpidemiological Monitoring of AIDS, 2000.
Joint United Nations Programme on HIV/AIDS (http://www.unaids.org, accessed 30 July2001).
KUDEL’KINA, N. A. & MOLOKOV, A. L. [Detection and prevalence of risk factors todevelop chronic non-infectious diseases in the organized population group in WestSiberia.] Terapevticheskii arkhiv, 73(1): 8–12 (2001) [in Russian].
LAHTI-KOSTI, M. ET AL. Age, education and occupation as determinants of trends inbody mass index in Finland from 1982 to 1997. International journal of obesity andrelated metabolic disorders, 24: 1669–1676 (2000).
LISSNER, L. ET AL. Social Mapping of the Obesity Epidemic in Sweden. Internationaljournal of obesity and related metabolic disorders, 24: 801–805 (2000).
Major cardiovascular study shows substantial regional differences. Geneva, World HealthOrganization, 1999 (Press release WHO/27).
MARTIN-DU PAN, R. C. & HERAIEF, E. Ten questions on the causes and consequencesof obesity: stress hormones. Revue médicale de la Suisse romande, 121(1): 51–55 (2001).
METHERS, C. ET AL. Report on the burden of disease and injury study in Australia.Canberra, Australian Institute of Health and Welfare, 1999.
MIGLIORI, G. B. ET AL. Cost–effectiveness analysis of tuberculosis control policies inIvanovo Oblast, Russian Federation. Bulletin of the World Health Organization, 76:475–483 (1998).
MURRAY, C. J. L. & LOPEZ, A. D., ED. The global burden of disease: a comprehensiveassessment of mortality and disability, injuries, and risk factors in 1990 and projected to2020. Boston, MA, Harvard School of Public Health, 1996.
NATIONAL PUBLIC HEALTH INSTITUTE, FINLAND. Health behaviour and health amongFinnish adult population, spring 2001. Helsinki, Julkaisija Utgivare, 2001.
New data on the prevention of mother-to-child transmission of HIV and their policyimplications: conclusions and recommendations. WHO Technical Consultation on Behalf ofthe UNFPA/UNICEF/WHO/UNAIDS Interagency Task Team on Mother-to-ChildTransmission of HIV, Geneva, 11–13 October 2000. Geneva, World HealthOrganization, 2001 (document WHO/RHR/01.28).
Obesity: preventing and managing the global epidemic. Report of a WHO Consultation onObesity. Geneva, World Health Organization, 2000 (documentWHO/NUT/NCD/98.1).
76057 May2002-v2 20/08/02 17:23 Side 47

48
POSTON, W.S. & FOREYT, J.P. Obesity is an environmental issue. Atherosclerosis,146(29): 201–209 (1999).
Principles for preventing HIV infection among drug users. Copenhagen, WHO RegionalOffice for Europe, 1998 (document EUR/ICP/LVNG 02 06 01).
Progress with roll back malaria in the WHO European Region – regional and countryupdates. Copenhagen, WHO Regional Office for Europe, 2000 (documentEUR/00/5024939).
Roll Back Malaria – a global partnership (http://www.rbm.who.int, accessed 30 July2001).
Stop TB Initiative (http://www.stoptb.org, accessed 19 May 2002).
Strategy to control tuberculosis in the WHO European Region. Copenhagen, WHORegional Office for Europe, 2000 (document EUR/00/5017620).
Strategy to roll back malaria in the WHO European Region. Copenhagen, WHORegional Office for Europe, 1999 (document EUR/ICP/CMDS 08 03 02).
Tackling obesity in England. Report by the Comptroller and Auditor General. London,National Audit Office Publications, 2001.
TANSELLA, M. ET AL. Common mental disorders in primary care: essays in honour ofProfessor Sir David Goldberg. London & New York, Routledge, 1999.
The global burden of disease. (http://www.who.int/msa/mnh/ems/dalys/intro.htm,accessed 13 August 2001).
The World health report 2000. Health systems: improving performance. Geneva, WorldHealth Organization, 2000.
THORNICROFT, G. J. & SZMUKLER, G. Textbook of community psychiatry. Oxford,Oxford University Press, 2001.
Vaccines, immunization and biologicals: 2000–2001 strategy. Geneva, World HealthOrganization, 2000 (document WHO/V&B/00.02).
VARTIAINEN, E. ET AL. Changes in risk factors explain changes in mortality fromischaemic heart disease in Finland. British medical journal, 309(6946): 23–27 (1994).
WORLD BANK. World development report 1993: investing in health. Oxford, OxfordUniversity Press, 1993.
WORLD HEALTH ORGANIZATION. Vaccines, immunization and biologicals: measles(http://www.who.int/vaccines/intermediate/measles.htm, accessed 30 July 2001).
76057 May2002-v2 20/08/02 17:23 Side 48

49
Distribution of health in populationsChild health
The chances of a child being born healthy and surviving the first year of his or her
life vary throughout the Region. In general, western European countries have
achieved remarkably low levels of infant mortality, although there are still
significant inequalities between social groups within countries. In the eastern part
of the Region, infant mortality rates decreased steadily in the past two decades but
are still high compared to those in western European countries. According to the
latest reported official data, 6 countries in the Region still have infant mortality
rates above 20 per 1000 live births (though other sources report higher levels and
in more countries), while 30 countries record rates below 10 per 1000. Perinatal
conditions are the major causes of infant mortality and, among those, unwanted
pregnancies and pregnancies in teenagers are some of the most important risk
factors in both eastern and western Europe.
There are also major inequalities with regard to the probability of dying before five
years of age (Fig. 22). The figures range from less than 5 to more than 50 deaths
per 1000 live births, with averages of 6 per 1000 in the EU, 15 per 1000 in the
CCEE, and 26 per 1000 in the NIS. Children are still dying from diseases that are
preventable or curable. In many countries, diarrhoeal diseases and acute respiratory
infections are responsible for a large proportion of morbidity and mortality among
children under five years of age. Under-five mortality due to accidents and other
Fig. 22. Probability of dying
before 5 years of age
Upper quintileSecond quintileThird quintileFourth quintileLower quintileNo data
76057 May2002-v2 20/08/02 17:23 Side 49
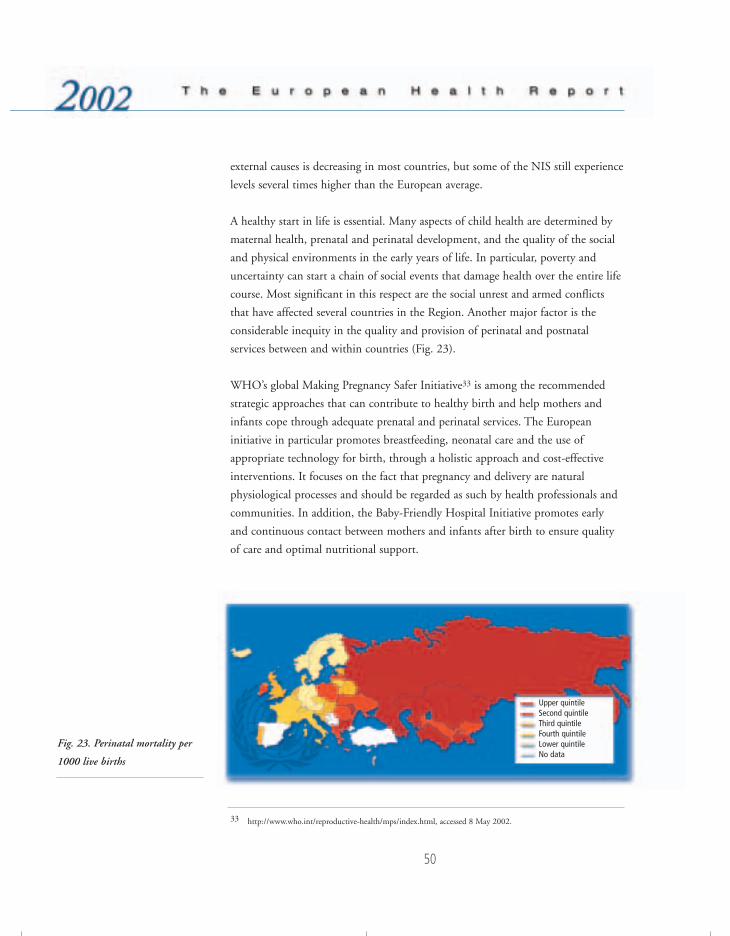
50
external causes is decreasing in most countries, but some of the NIS still experience
levels several times higher than the European average.
A healthy start in life is essential. Many aspects of child health are determined by
maternal health, prenatal and perinatal development, and the quality of the social
and physical environments in the early years of life. In particular, poverty and
uncertainty can start a chain of social events that damage health over the entire life
course. Most significant in this respect are the social unrest and armed conflicts
that have affected several countries in the Region. Another major factor is the
considerable inequity in the quality and provision of perinatal and postnatal
services between and within countries (Fig. 23).
WHO’s global Making Pregnancy Safer Initiative33 is among the recommended
strategic approaches that can contribute to healthy birth and help mothers and
infants cope through adequate prenatal and perinatal services. The European
initiative in particular promotes breastfeeding, neonatal care and the use of
appropriate technology for birth, through a holistic approach and cost-effective
interventions. It focuses on the fact that pregnancy and delivery are natural
physiological processes and should be regarded as such by health professionals and
communities. In addition, the Baby-Friendly Hospital Initiative promotes early
and continuous contact between mothers and infants after birth to ensure quality
of care and optimal nutritional support.
Fig. 23. Perinatal mortality per
1000 live births
Upper quintileSecond quintileThird quintileFourth quintileLower quintileNo data
33 http://www.who.int/reproductive-health/mps/index.html, accessed 8 May 2002.
76057 May2002-v2 20/08/02 17:23 Side 50
51
The WHO/UNICEF strategy on Integrated Management of Childhood Illness
aims at reducing mortality and morbidity through the provision of basic care for
the most common childhood illnesses, as well as preventive measures (such as
immunization and better infant and child nutrition, including breastfeeding) and
improved family and community practices. It is addressed at countries in the
Region experiencing high levels of infant and child mortality due in large part to
communicable diseases. In addition, the strategy promotes the continued healthy
development of children.
Mother-to-child transmission is the overwhelming cause of HIV infection in
young children. The number of children born to HIV-infected mothers in eastern
Europe has increased with the increasing rates of HIV infection among young
women. For example, up to the end of 1999 some 1300 infants had been born to
HIV-infected mothers in Ukraine. Effective and affordable means exist for
preventing HIV transmission from mother to child, but they are not yet available
in all countries of the Region. Mother-to-child transmission should be addressed as
part of a wider response to HIV/AIDS, which includes expanding access to care
and support for HIV-infected mothers and their families. In response to these needs, a
regional interagency task force on mother-to-child transmission has been created.
Within the framework of the First Action Plan for Food and Nutrition Policy for
the WHO European Region, special attention is being paid to the promotion of
healthy nutrition of infants and young children, including the promotion of
exclusive breastfeeding for the first six month of life. Feeding guidelines for infants
and young children have been developed for the countries in the Region,
emphasizing the scientific rationale for the development of national nutrition and
feeding recommendations. By promoting these guidelines, health systems can help
to ensure healthy nutrition for young children.
Child abuse and neglect are major issues of human rights and public health.
World Health Assembly resolution WHA50.19 calls on Member States to make
an effort to eliminate violence against women and children, including child
trafficking and sexual abuse. Abuse and neglect have an impact not only on the
physical and psychological wellbeing of children but also on their development,
leaving such children socially excluded and less equipped to deal with life. These
issues were discussed in depth at the First Meeting on Strategies for Child
76057 May2002-v2 20/08/02 17:23 Side 51
52
Protection,34 convened by the Regional Office in 1998 to examine the implications
of child abuse and the needs for protection from the viewpoint of the health sector.
The conclusions and recommendations of the Meeting constitute guidelines for
intervention in this area for policy-makers and health providers in the Region.
Children are more susceptible than adults to the effects of environmental health
threats and therefore require special protection. The Third Ministerial Conference
on Environment and Health, held in London in 1999, proposed specific action to
address the public health problems of injuries, environmental tobacco smoke,
asthma and emerging threats. Member States should take action in partnership
with international organizations, NGOs and other relevant parties. Furthermore,
an international mechanism has been proposed to develop public health policies in
areas of emerging concern, to coordinate and promote action, to facilitate the
exchange of information between Member States and to provide a forum for the
advocacy of children’s rights.
Adolescent healthThe leading cause of mortality among adolescents is accidents. Rates of mortality
due to external causes in the age group 5–19 years have decreased in most
European countries, but seem to be levelling off at around 28–29 per 100 000
population in the NIS. Teenage pregnancy rates in most countries of western
Europe are between 13 and 25 per 1000 girls aged 15–19 years, with extreme
highs of around 50 in the United Kingdom. Some CCEE, for example Croatia and
Slovenia, also fall in this range, but the other CCEE and the NIS have experienced
2–4 times higher rates, reaching over 100 in Ukraine (Fig. 24). In certain
countries, increases in pregnancies have been observed in girls as young as 12 and
13 years. Unwanted and unplanned pregnancies can lead to dangerous abortions,
with serious health consequences for adolescent girls. WHO is committed to the
implementation of the Programme of Action of the United Nations International
Conference on Population and Development (ICPD) in 199435 and the
recommendations of ICPD + 5 in 1999.36
34 First Meeting on Strategies for Child Protection: report on a WHO meeting. Copenhagen, WHO Regional Office forEurope, 1999 (document EUR/ICP/FMLY 01 03 01).
35 Programme of Action of the International Conference on Population and Development. New York, United Nations,1995.
36 http://www.un.org/popin/icpd5.htm#ICPD+5%20Information, accessed 29 May 2002.
76057 May2002-v2 20/08/02 17:23 Side 52
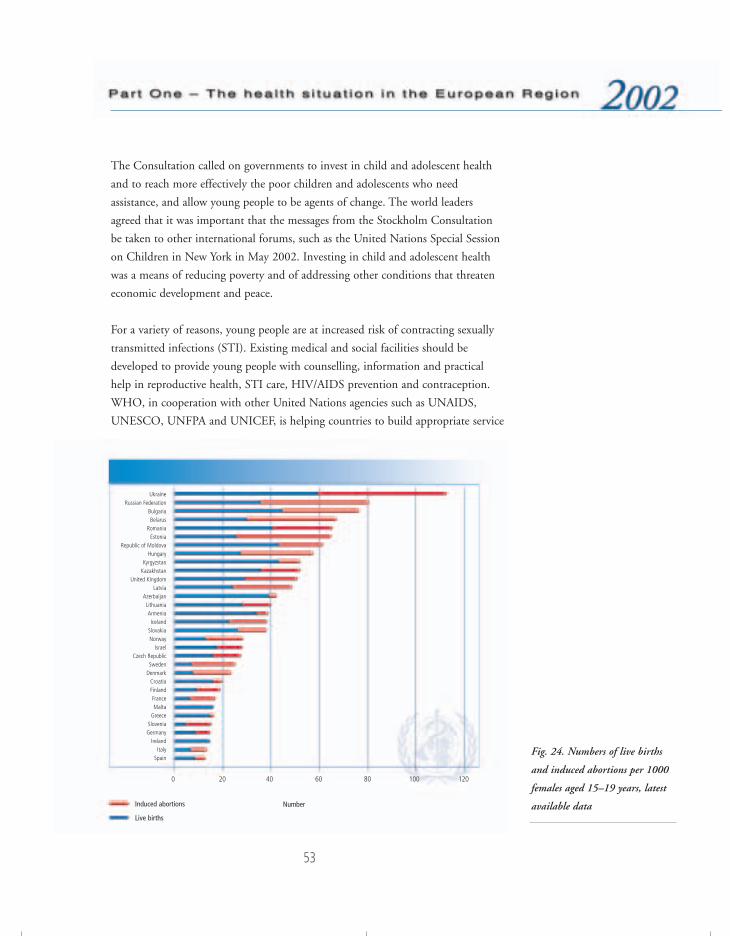
53
The Consultation called on governments to invest in child and adolescent health
and to reach more effectively the poor children and adolescents who need
assistance, and allow young people to be agents of change. The world leaders
agreed that it was important that the messages from the Stockholm Consultation
be taken to other international forums, such as the United Nations Special Session
on Children in New York in May 2002. Investing in child and adolescent health
was a means of reducing poverty and of addressing other conditions that threaten
economic development and peace.
For a variety of reasons, young people are at increased risk of contracting sexually
transmitted infections (STI). Existing medical and social facilities should be
developed to provide young people with counselling, information and practical
help in reproductive health, STI care, HIV/AIDS prevention and contraception.
WHO, in cooperation with other United Nations agencies such as UNAIDS,
UNESCO, UNFPA and UNICEF, is helping countries to build appropriate service
Fig. 24. Numbers of live births
and induced abortions per 1000
females aged 15–19 years, latest
available data
UkraineRussian Federation
BulgariaBelarus
RomaniaEstonia
Republic of MoldovaHungary
KyrgyzstanKazakhstan
United KingdomLatvia
AzerbaijanLithuaniaArmeniaIceland
SlovakiaNorway
IsraelCzech Republic
SwedenDenmark
CroatiaFinlandFranceMalta
GreeceSloveniaGermany
IrelandItaly
Spain
Induced abortions
Live births
0 20 40 60 80 100 120
Number
76057 May2002-v2 20/08/02 17:23 Side 53
54
structures for adolescents, provide affordable contraceptives, and develop school
curricula and other information strategies on sexual and reproductive health. In
view of the STI epidemic and the rise in HIV infection in the eastern parts of the
Region, a WHO-coordinated interagency task force is promoting strategies for safe
sexual behaviour, including the increased use of condoms.
Investing in child and adolescent health strengthens economic development
In a call for commitment to saving children’s lives, WHO and the United Nations Children’s Fund(UNICEF) convened a Global Consultation on Child and Adolescent Health and Development inStockholm on 12–13 March 2002. Experts and political leaders discussed strategies to reach thepoorest and the youngest.
• The Director-General of WHO said that US $66 billion annually until 2007 could save 8 millionlives each year, most of them children’s lives.
• The Executive Director of the United Nations Population Fund noted that, while adolescentsneed the support of adults as they make critical choices in their lives, and a safe environmentwith opportunities to develop into healthy, productive adults, “for many adolescents today,the notion of adolescence as a time of opportunity for self-development, under safe andhealthy conditions, could not be further from their reach”.
• The Executive Director of United Nations Children’s Fund recognized the achievements in thepast decade that had brought better health for children, saved millions of lives and preventeddisability. These included oral rehydration therapy, childhood immunization, effectivetreatments against pneumonia, malaria and other deadly childhood diseases, iodized salt andvitamin A supplements, and progress in promoting breastfeeding and improved infant feedingpractices.
• A representative of the World Bank highlighted inequities: “Poor children and adolescents,excluded from the prosperity and good health of better-off children, are disadvantaged fromthe start. Poverty and inadequate health systems compound their vulnerability to sickness andpossible death, despite our collective knowledge of effective and affordable actions that canprotect children from ill health, and restore health to sick children”.
The increasing prevalence of depressive conditions in young people, especially in
societies in transition, is an urgent problem. Existing successful programmes to
combat mental illness should be disseminated, focusing on detection, intervention
and monitoring of depressive conditions in childhood and adolescence.
There is evidence that adolescents are experimenting with alcohol at younger ages
and are increasingly engaging in high-risk behaviour, such as binge drinking and
76057 May2002-v2 20/08/02 17:23 Side 54
55
mixing alcohol with illicit drugs. One in four deaths among adolescents is due to
alcohol, and in the Region as a whole some 55 000 adolescents die annually in
connection with alcohol consumption. The alcohol industry is trying to infiltrate
the adolescent market through advertising, by developing products targeted at
adolescents and by sponsoring events particularly attractive to young people.
Over the last decade, smoking among adolescents in Europe has increased. Large
multinational companies, with marketing strategies that often associate smoking
with an affluent lifestyle, dominate the tobacco industry. The Framework
Convention on Tobacco Control will be finalized by 2003, as a follow-up to the
WHO European Ministerial Conference for a Tobacco-free Europe, in Warsaw in
February 2002.
One of the most dramatic consequences of the increase in the use of illicit drugs is
the rapid spread of HIV among adolescents. The steepest rise in HIV prevalence is
in the NIS, and is due to the spread of the virus among injecting drug users. So-
called harm reduction strategies have reduced the spread of HIV among drug users
in western European countries.
Overweight and obesity in children and adolescents are increasing in the European
Region. The major problems associated with child obesity are its persistence into
adult life and its association with an increased risk of disease in later life. Another
important consequence of obesity is poor self-esteem and body image. Prevention
of overweight and obesity can best be achieved through reducing the intake of fat,
alcohol and energy-dense foods and increasing physical activity.
Although in general good progress is being made towards Educational standards,
there is a worrisome trend in the European Region for young people to “drop out”
before completing their primary or basic education. There is growing evidence that
leaving school early is associated with health risks such as early pregnancy,
unhealthy behaviour and social exclusion. There is a need to focus on developing
research into the problem and its causes, on innovative extramural education
programmes, on outreach schemes, and on a mixture of educational methodologies
such as peer education.
76057 May2002-v2 20/08/02 17:23 Side 55
56
In the mean time, emphasis has been placed on the school as a social setting within
which health can be developed and sustained through the “health-promoting
school”. Schools provide an educational experience, not only through the
curriculum in the classroom but also through the total environment created in the
school, both physical and psychosocial. The evidence showing that there is a close
correlation between good health and good education lies at the heart of the health-
promoting school initiative. In health-promoting school programmes, all the
components of school life are addressed in relation to their capacity to promote
health. Successful health-promoting schools are able to influence the health
attitudes, values and behaviour of children and adolescents. Health-promoting
school programmes influence the way teachers teach in the classroom, the
relationships schools develop with parents and the community, the social
atmosphere in the school, student participation in decision-making, and the way
schools are managed.
Schools that incorporate skills education and interactive methods to encourage
learning are successful in creating a health-promoting educational environment.
The processes of integrating skills, competencies, knowledge and understanding of
health are not easy for schools to institute. The Regional Office is collaborating
with the Council of Europe and the European Commission in the European
Network of Health Promoting Schools. This is an intersectoral initiative for
promoting the health of children and adolescents within schools, using
internationally understood concepts and approaches and assisting Member States
to build capacity, set standards, draw up guidelines and advocate for the
development of health in schools.
Women’s healthWomen’s health priorities differ across Europe, ranging from primary reproductive
health concerns in the eastern part of the Region to cardiovascular diseases among
women in the western European countries. There have been advances in research
on reproductive health, perinatal health, and screening for breast and cervical
cancer, but an in-depth analysis of gender in relation to the health sector has never
been undertaken. Socioeconomic transition in the eastern part of the Region has
resulted in previous improvements in the health of women being lost. War and
conflict in many countries has further threatened the health of women (Fig. 25).
76057 May2002-v2 20/08/02 17:23 Side 56
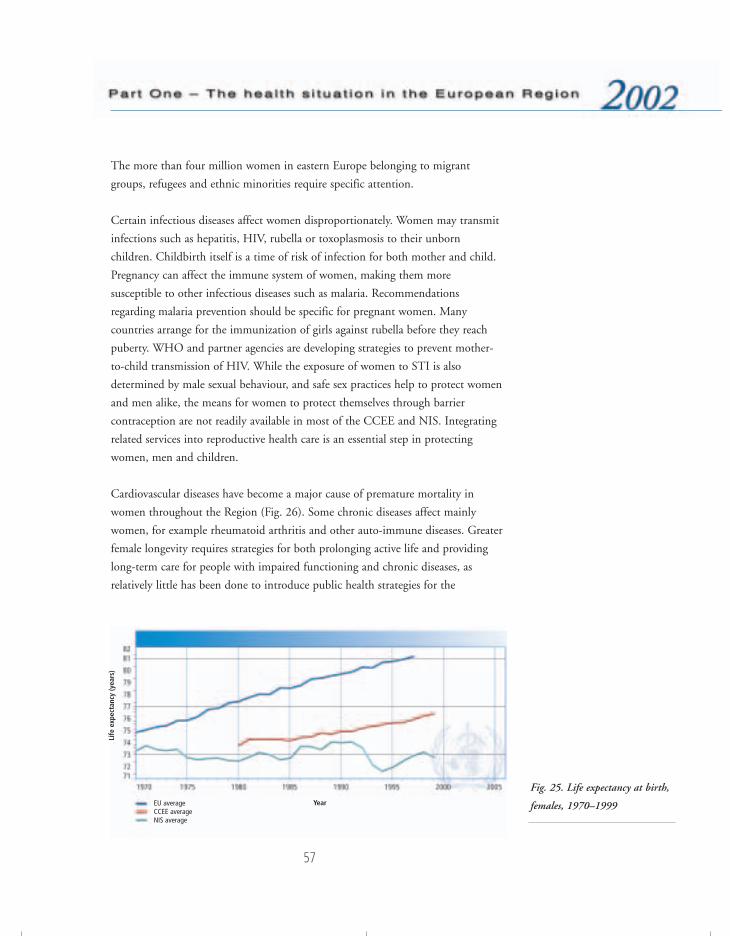
57
The more than four million women in eastern Europe belonging to migrant
groups, refugees and ethnic minorities require specific attention.
Certain infectious diseases affect women disproportionately. Women may transmit
infections such as hepatitis, HIV, rubella or toxoplasmosis to their unborn
children. Childbirth itself is a time of risk of infection for both mother and child.
Pregnancy can affect the immune system of women, making them more
susceptible to other infectious diseases such as malaria. Recommendations
regarding malaria prevention should be specific for pregnant women. Many
countries arrange for the immunization of girls against rubella before they reach
puberty. WHO and partner agencies are developing strategies to prevent mother-
to-child transmission of HIV. While the exposure of women to STI is also
determined by male sexual behaviour, and safe sex practices help to protect women
and men alike, the means for women to protect themselves through barrier
contraception are not readily available in most of the CCEE and NIS. Integrating
related services into reproductive health care is an essential step in protecting
women, men and children.
Cardiovascular diseases have become a major cause of premature mortality in
women throughout the Region (Fig. 26). Some chronic diseases affect mainly
women, for example rheumatoid arthritis and other auto-immune diseases. Greater
female longevity requires strategies for both prolonging active life and providing
long-term care for people with impaired functioning and chronic diseases, as
relatively little has been done to introduce public health strategies for the
Fig. 25. Life expectancy at birth,
females, 1970–1999EU averageCCEE average NIS average
Year
Life
exp
ecta
ncy
(yea
rs)
76057 May2002-v2 20/08/02 17:23 Side 57
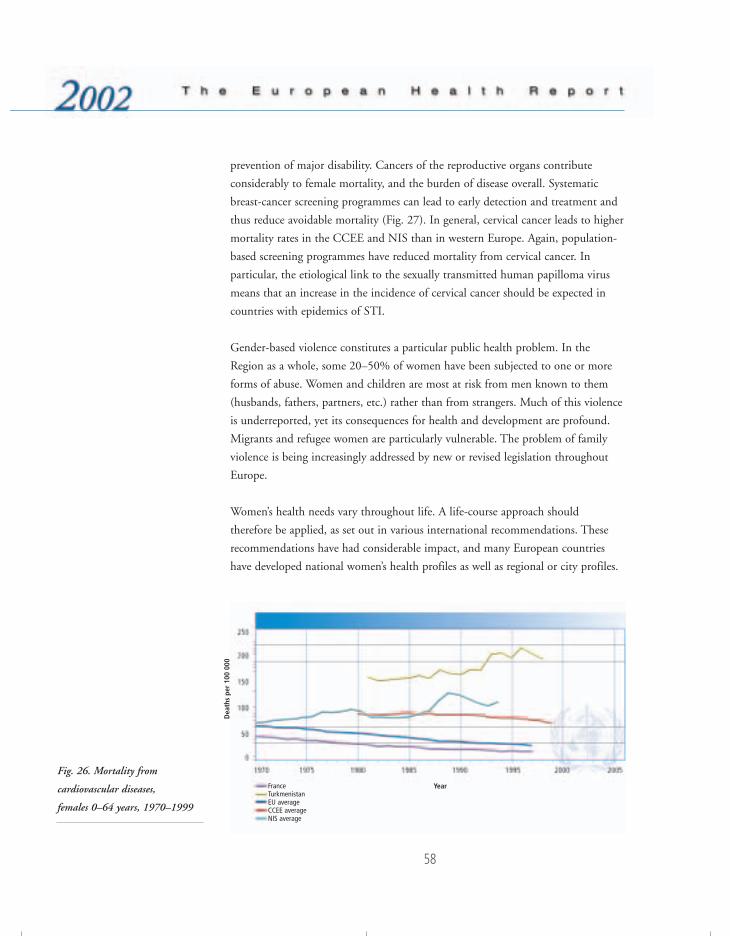
58
prevention of major disability. Cancers of the reproductive organs contribute
considerably to female mortality, and the burden of disease overall. Systematic
breast-cancer screening programmes can lead to early detection and treatment and
thus reduce avoidable mortality (Fig. 27). In general, cervical cancer leads to higher
mortality rates in the CCEE and NIS than in western Europe. Again, population-
based screening programmes have reduced mortality from cervical cancer. In
particular, the etiological link to the sexually transmitted human papilloma virus
means that an increase in the incidence of cervical cancer should be expected in
countries with epidemics of STI.
Gender-based violence constitutes a particular public health problem. In the
Region as a whole, some 20–50% of women have been subjected to one or more
forms of abuse. Women and children are most at risk from men known to them
(husbands, fathers, partners, etc.) rather than from strangers. Much of this violence
is underreported, yet its consequences for health and development are profound.
Migrants and refugee women are particularly vulnerable. The problem of family
violence is being increasingly addressed by new or revised legislation throughout
Europe.
Women’s health needs vary throughout life. A life-course approach should
therefore be applied, as set out in various international recommendations. These
recommendations have had considerable impact, and many European countries
have developed national women’s health profiles as well as regional or city profiles.
Fig. 26. Mortality from
cardiovascular diseases,
females 0–64 years, 1970–1999
FranceTurkmenistanEU averageCCEE average NIS average
Year
Dea
ths
per
100
000
76057 May2002-v2 20/08/02 17:23 Side 58

59
WHO recommends (a) that the implementation of human rights legislation and
instruments is ensured; (b) that equity in women’s status across Europe and within
the European countries is promoted; (c) that discrimination against women is
addressed; (d) that poverty among women is tackled, ensuring that policies for
economic regeneration do not undermine social and health services; and (e) that
appropriate health care is provided, ensuring that unemployed women have proper
access to services through existing health insurance schemes. The Regional Office
has established a European Committee of Experts to monitor, follow up and
provide guidance and leadership in the process, and will work with UNAIDS,
UNFPA, UNHCR, UNICEF, ILO, the EU and the Council of Europe to achieve
the targets set.
Reproductive health and sexual healthReproductive ill health accounts for around 6% of the total disease burden in the
CCEE and NIS. This does not include the proportion of the burden of disease
explained by cancers, HIV infection and STI or the burden of disability explained
by long-term complications of pregnancy and childbirth, or surgical interventions
performed without access to the appropriate recommended technology and
essential drugs. Including these, the burden of disease is closer to 8–10%.
Through a set of targeted interventions, based on the best available evidence and
publicly funded, the countries of western Europe and some of the CCEE have
made remarkable progress in reducing maternal mortality over the past 20 years,
Fig. 27. Mortality from cancer of
the breast, females 0–64 years,
1979–1999
DenmarkTajikistanEU averageCCEE average NIS average
Year
Dea
ths
per
100
000
76057 May2002-v2 20/08/02 17:23 Side 59
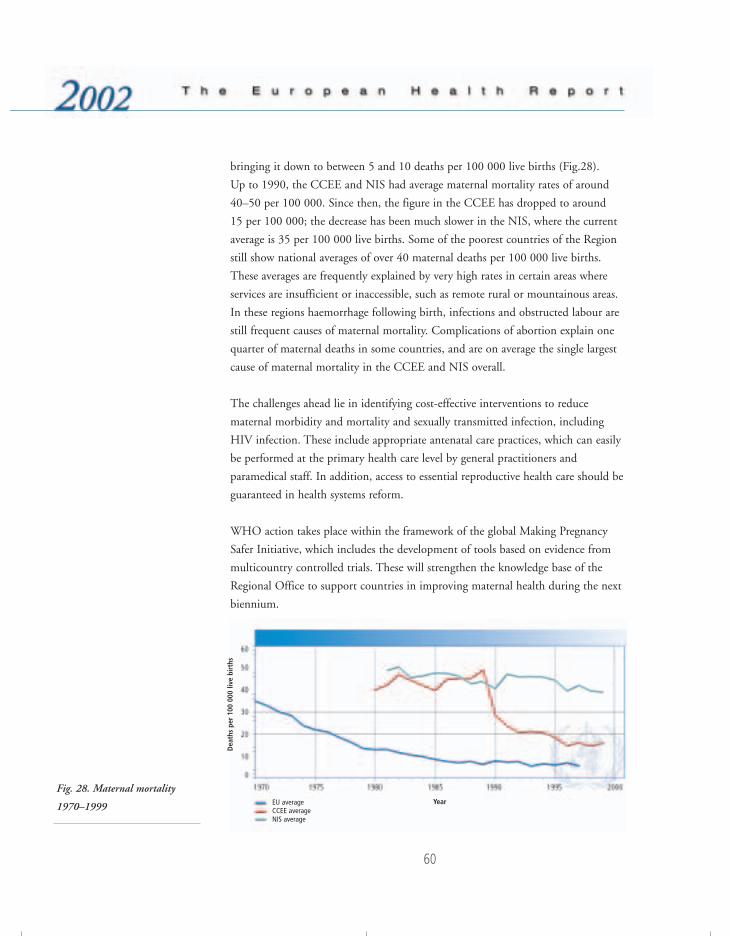
bringing it down to between 5 and 10 deaths per 100 000 live births (Fig.28).
Up to 1990, the CCEE and NIS had average maternal mortality rates of around
40–50 per 100 000. Since then, the figure in the CCEE has dropped to around
15 per 100 000; the decrease has been much slower in the NIS, where the current
average is 35 per 100 000 live births. Some of the poorest countries of the Region
still show national averages of over 40 maternal deaths per 100 000 live births.
These averages are frequently explained by very high rates in certain areas where
services are insufficient or inaccessible, such as remote rural or mountainous areas.
In these regions haemorrhage following birth, infections and obstructed labour are
still frequent causes of maternal mortality. Complications of abortion explain one
quarter of maternal deaths in some countries, and are on average the single largest
cause of maternal mortality in the CCEE and NIS overall.
The challenges ahead lie in identifying cost-effective interventions to reduce
maternal morbidity and mortality and sexually transmitted infection, including
HIV infection. These include appropriate antenatal care practices, which can easily
be performed at the primary health care level by general practitioners and
paramedical staff. In addition, access to essential reproductive health care should be
guaranteed in health systems reform.
WHO action takes place within the framework of the global Making Pregnancy
Safer Initiative, which includes the development of tools based on evidence from
multicountry controlled trials. These will strengthen the knowledge base of the
Regional Office to support countries in improving maternal health during the next
biennium.
Fig. 28. Maternal mortality
1970–1999 EU averageCCEE average NIS average
60
Year
Dea
ths
per
100
000
live
birt
hs
76057 May2002-v2 20/08/02 17:23 Side 60
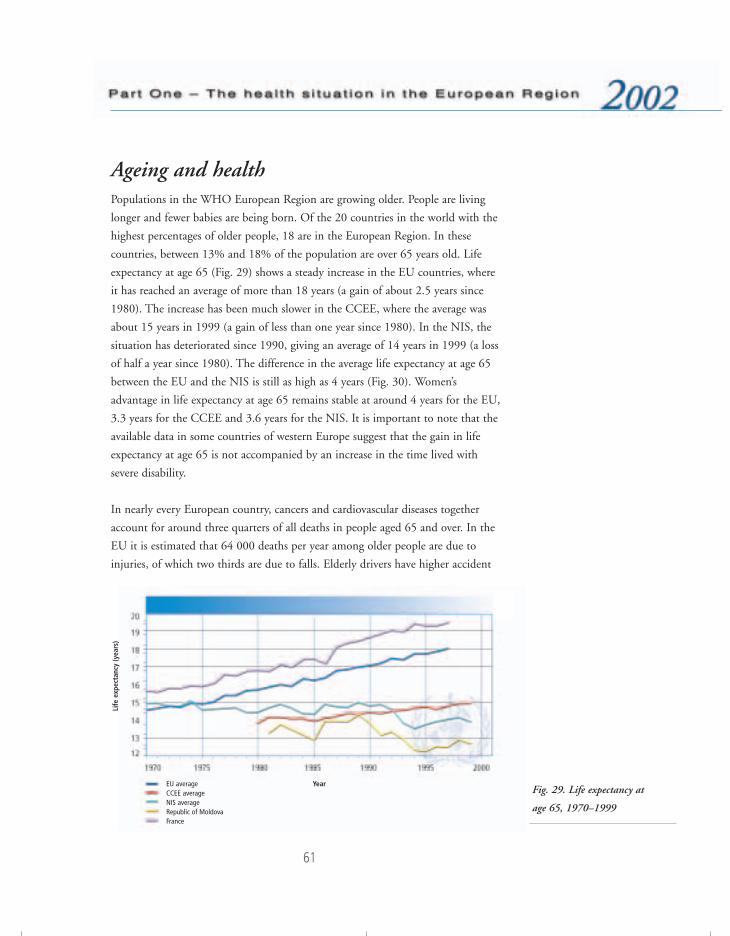
61
Ageing and healthPopulations in the WHO European Region are growing older. People are living
longer and fewer babies are being born. Of the 20 countries in the world with the
highest percentages of older people, 18 are in the European Region. In these
countries, between 13% and 18% of the population are over 65 years old. Life
expectancy at age 65 (Fig. 29) shows a steady increase in the EU countries, where
it has reached an average of more than 18 years (a gain of about 2.5 years since
1980). The increase has been much slower in the CCEE, where the average was
about 15 years in 1999 (a gain of less than one year since 1980). In the NIS, the
situation has deteriorated since 1990, giving an average of 14 years in 1999 (a loss
of half a year since 1980). The difference in the average life expectancy at age 65
between the EU and the NIS is still as high as 4 years (Fig. 30). Women’s
advantage in life expectancy at age 65 remains stable at around 4 years for the EU,
3.3 years for the CCEE and 3.6 years for the NIS. It is important to note that the
available data in some countries of western Europe suggest that the gain in life
expectancy at age 65 is not accompanied by an increase in the time lived with
severe disability.
In nearly every European country, cancers and cardiovascular diseases together
account for around three quarters of all deaths in people aged 65 and over. In the
EU it is estimated that 64 000 deaths per year among older people are due to
injuries, of which two thirds are due to falls. Elderly drivers have higher accident
Fig. 29. Life expectancy at
age 65, 1970–1999
EU averageCCEE averageNIS averageRepublic of Moldova France
Year
Life
exp
ecta
ncy
(yea
rs)
76057 May2002-v2 20/08/02 17:23 Side 61

62
rates per unit distance than middle-aged drivers, and are overrepresented in
accidents with a fatal outcome. Physical violence to older people by carers, in the
home or in institutions, has gained increasing recognition across Europe, along
with sexual and psychological abuse and neglect. Research is currently at the stage
of mapping the extent of the problem and identifying risk factors.
Physical activity is a strong predictor of successful ageing. Systematic reviews
indicate that physical activity is potentia1ly effective in reducing the number of
falls (even at very old age), improving strength, gait and balance, reducing blood
pressure and promoting mental health.
Evidence of age-related rationing of health care interventions has been documented
in some countries in the European Region. There may often be a common
understanding among clinicians that certain treatments are not offered to people
over a particular age. One can expect that the age-related rationing would become
more prominent because of the pressures on the health systems created by the
increasing proportion of older people.
Much of the economic contribution of the older population goes unrecognized.
Older people make substantial contributions in unpaid work in such areas as
agriculture, informal care giving and services. Many European economies depend
on these activities, but include few of them in their assessment of gross national
product, often leaving the contribution made by older citizens unnoticed and
undervalued. At present, consumers aged 50 and over own an estimated 80% of
the wealth in France, Germany, Italy and the United Kingdom, and the same is
Fig. 30. Life expectancy at
age 65 (years)
Upper quintileSecond quintileThird quintileFourth quintileLower quintileNo data
76057 May2002-v2 20/08/02 17:23 Side 62

63
true for many other countries of Europe. Nevertheless, large numbers of the elderly
across Europe are poor.
A wide range of studies has shown the importance of social and economic factors
as major determinants of public health. This is true for older people as much as for
any other group. Public health interventions should thus focus on four key areas:
(a) reducing the burden of access disabilities; (b) reducing the risk factors
associated with the causes of major diseases in old age and promoting healthy
lifestyles; (c) developing primary health care systems that emphasize health
promotion, disease prevention and the provision of cost-effective, equitable and
dignified long-term care; and (d) collaborating with other sectors to make positive
changes in the determinants of healthy active ageing and the quality of life of older
persons.
The Healthy Ageing Programme of the Regional Office works in six action areas:
(a) taking account of the needs of Member States, through a committee of
counterparts and experts; (b) selecting models of best practice and carrying out
demonstration projects; (c) identifying appropriate low-technology instruments
and promoting their use, funding and further development; (d ) promoting the
better use of the assets and resources of older people to lead healthy lives, using
role models and other leading figures in European society; (e) adapting instruments
to measure the quality of life; and (f ) establishing task forces to address new
challenges and ethical concerns in such fields as pharmacology, genetics and
biotechnology as related to healthy ageing.
BibliographyAction for women’s health. Making changes through organizations. Copenhagen, WHORegional Office for Europe, 1997.
Children’s health and the environment. Third Ministerial Conference on Environment andHealth, London, 16–18 June 1999. Copenhagen, WHO Regional Office for Europe,1999 (document EUR/ICP/EHCO 02 02 05/16).
CURRIE, C. ET AL. Health and health behaviour among young people : international report.Copenhagen, WHO Regional Office for Europe, 1999 (document EUR/ICP/IVST 0603 05(A); Health Policy for Children and Adolescents Series, No. 1).
DEHNE, K. & SNOW, R. Integrating STI management into family planning services: whatare the benefits? Geneva, World Health Organization, 1999 (documentWHO/RHR/99.10).
76057 May2002-v2 20/08/02 17:23 Side 63
64
European strategies to combat violence against women. Report of the First TechnicalMeeting, Copenhagen, Denmark, 11–13 December 1997. Copenhagen, WHO RegionalOffice for Europe, 1997 (document EUR/ICP/FMLY 05 03 02).
KOLIP, P. & SCHMIDT, B. Gender and health in adolescence. Copenhagen, WHORegional Office for Europe, 1999 (document EUR/ICP/IVST 06 03 05B).
Making pregnancy safer. Report of the Secretariat. Geneva, World Health Organization,2000 (document EB107/26).
Measles: mortality reduction and regional elimination: strategic plan 2001–2005. Geneva,World Health Organization, 2001 (document WHO/V&B/01.13).
MILLER, A.B. ET AL. Report on Consensus Conference on Cervical Cancer Screening andManagement. Meeting of the International Network on Control of Gynaecological Cancers(INCGC), Tunis, January 28–31, 1999. Geneva, International Network on Control ofGynaecological Cancers, 1999.
POLLICINO, C.A. & SALTMAN, D.C. The relationship between physician cost andfunctional status in the elderly. International journal for quality in health care, 12:425–431 (2000).
RASMUSSEN, V.B. ET AL. The European Network of Health Promoting Schools: the allianceof education and health. Copenhagen, WHO Regional Office for Europe, 1999(document EUR/ICP/IVST 06 03 05).
Report of the Fourth World Conference on Women (Beijing, 4–15 September 1995). NewYork, United Nations, 1995.
SETTERTOBULTE, W. ET AL. Drinking among young Europeans. Copenhagen, WHORegional Office for Europe, 2001 (document EUR/ICP/IVST 06 03 05(C); HealthPolicy for Children and Adolescents Series, No. 3).
Strategic Action Plan for the Health of Women in Europe. Copenhagen, WHO RegionalOffice for Europe, 2001 (document EUR/01/5019540).
Strategies for child protection: report on a WHO Meeting. Copenhagen, WHO RegionalOffice for Europe, 1999 (document EUR/ICP/FMLY 01 03 01).
The second decade: improving adolescent health and development. Geneva, World HealthOrganization, 1998 (document WHO/FRH/ADH/98.18).
WHO REGIONAL OFFICE FOR EUROPE. Health issues of minority women living in Europe.Report of a meeting in Gothenburg, Sweden, 11–12 November 1999. Gothenburg,Göteborg Länstryckeri, 2000.
Women and mental health, with emphasis on special groups. Commission on Status ofWomen, Forty-third Session, 1–12 March 1999. New York, United Nations Economicand Social Council, 1999 (document E/CN.6/1999/L.8/Rev.1).
76057 May2002-v2 20/08/02 17:23 Side 64
65
Socioeconomicdeterminants
Lifestyles
Physical environment
76057 May2002-v2 20/08/02 17:23 Side 65
66
It is now traditional to review a long list of determinants of health, such as genetic
and individual factors, lifestyles, environment, and the availability and effectiveness
of health services. The great differences in health status observed across countries
and among groups within countries have highlighted the fact that all these
determinants are linked to social and economic factors that are at the core of
political and societal development.
Socioeconomic determinantsThe great differences in health status among the countries of the European Region
have thrown into sharp focus factors – beyond health services, genetics and
individual lifestyles – that affect health at the population level. The evidence has
become much clearer that such differences are substantially a manifestation of
social, economic, environmental and institutional determinants. What is less clear
is the precise quantitative individual roles of these various factors.
Universal access to effective health services of reasonable quality is an essential
requirement in an advanced society. Nevertheless, while the failure of individually
focused health services to achieve this goal will contribute to unnecessary suffering
and morbidity, there is little evidence that such failures contribute substantially to
the gross imbalances in public health seen across the European Region. Moreover,
while genetic and lifestyle factors clearly affect an individual’s susceptibility to
disease, their role in the differences in health at population level is much less
evident. Individual lifestyle and risk factors explain only a portion of variations in
the occurrence of disease. Further, the causes of variations in disease among
individuals may be different from the causes of variations among populations. A
quantitative analysis of the burden of disease that can be attributed to different risk
factors37 shows that the largest single contributor worldwide is malnutrition,
accounting for nearly 12% of deaths. Including all other traditional risk factors
accounts for about 40% of the global burden of deaths. Thus about half the global
burden of deaths remain unexplained by these known major risk factors (Fig. 31).
In addition to risk factors, it would be very useful to examine risk conditions that
can be linked directly to social, economic and environmental determinants of
37 MURRAY, C.J.L. & LOPEZ, A.D., ED. The global burden of disease. A comprehensive assessment of mortality anddisability from diseases, injuries, and risk factors in 1990 and projected to 2020. Boston, MA, Harvard School ofPublic Health, 1996.
76057 May2002-v2 20/08/02 17:23 Side 66

67
health. A typical risk condition for population health in Europe is poverty. There is
a developing knowledge base that relates disease patterns to the organization of
society and the way it invests in its human development. Evidence from a number
of sources now indicates that, in addition to raising economic wealth in aggregate,
it is necessary to give attention to the relative distribution of wealth. Health is best
served in more socially cohesive, egalitarian societies with a smaller burden of
relative deprivation.38 In developed societies at least, health is more related to
relative rather than absolute income.39,40
Accordingly, health policies need to aim at reducing the overall burden of
disadvantage. In attempting to reduce health inequalities and create better
conditions for population health, health policy cannot be isolated from other
development policies. Thus the link between health policy and other policy sectors
such as employment, income maintenance and social welfare, housing and
education is crucial in all European Member States. To reduce socioeconomic
38 WILKINSON, R.G. Unhealthy societies: the afflictions of inequalities. London, Routledge, 1996.39 KAWACHI, I. ET AL., ED. Income inequality and health. Vol. 1. The society and population health. New York,
New Press, 1999. 40 WILKINSON, R.G. Health inequalities: relative or absolute material standards? British medical journal, 314:
591–595 (1997).
Fig. 31. Percentage of total
deaths (globally) attributable to
selected risk factors
Malnutrition11.7%
Poor water supply,sanitation, and personal
and domestic hygiene5.3%
Unsafe sex2.2%
Tobacco use6.0%
Alcohol use1.5%
Occupation2.2%
Hypertension5.8%
Physical inactivity3.9%
Undefined risk factors Air pollution60.3% 1.1%
76057 May2002-v2 20/08/02 17:23 Side 67
68
inequality, it is necessary to reduce both the proportion of the population that falls
behind and the distance it falls behind. Evidence suggests that greater income
equality, and the improved social environment that comes with it, act by
enhancing the population’s psychosocial welfare.41,42 By improving social
functioning, reduced income inequality increases the effectiveness of a wide range
of public health and social policy initiatives. Without tackling social inequalities,
progress is likely to be slower and the quality of life poorer.
Health and developmentThe relationship between health and development is fundamental, and the
improvement of people’s health must be a major objective of development. For
poor countries there is a clear relation between GDP per head and life expectancy.
At the lower end of the GDP range, the relationship is quite steep. In more
developed societies, such as those within the European Region where the major
causes of mortality and morbidity are noncommunicable diseases, there is now
strong evidence that the burden of these diseases is also related to the social
environment, and there is growing evidence of the complexity of this
relationship.43,44 While improved health, measured in terms of life expectancy,
generally correlates with income per head of population, there are many exceptions
to this. There are poor countries with relatively good health, and rich countries
with relatively poor health. This complexity increases when income differentials
within countries are added to the discussion, as there are poor groups within rich
countries whose health is well below that of the populations of markedly poorer
countries. In summary, higher income is a positive factor for health, but because of
other operative factors there are many examples where richer people live shorter
lives than poorer people. These operative factors have recently been clarified.45 It
appears that, while GDP per head does have a significantly positive correlation
with life expectancy, this relationship works mainly through the impact of GDP on
41 BRUNNER, E. & MARMOT, M. Social organisation, stress and health. In: Marmot, M. et al., ed. The socialdeterminants of health. Oxford, Oxford University Press, 1999.
42 MCEWEN, B.S. Protective and damaging effects of stress mediators. New England journal of medicine, 338:171–179 (1998).
43 CORNIA, G.A. & PANICCIA, R. The mortality crisis of transitional economies. Oxford, Oxford University Press,2000.
44 LUNDBERG, O. The impact of childhood living conditions on illness and mortality in adulthood. Social scienceand medicine, 36: 1047–1052 (1993).
45 WILKINSON, R.G. Unhealthy societies: the afflictions of inequalities. London, Routledge, 1996.
76057 May2002-v2 20/08/02 17:23 Side 68
69
(a) the incomes of the poor and (b) public expenditure, particularly in health care.
Much therefore depends on how economic wealth is distributed and utilized.
This analysis has led to the definition of two types of processes in the reduction of
mortality. “Growth-mediated” processes work through faster economic growth
with a strong employment component, the enhanced economic prosperity being
used to expand relevant social services such as education, social security and health
care. “Support-mediated” processes work through social programmes of support for
education, health care and other social arrangements. Resources are therefore
needed to develop “resource-led”, low-cost, labour-intensive activities such as
education and health care. Giving priority to these resources is a key requirement
for development.
The recently published report of the WHO Commission on Macroeconomics and
Health46 stresses the central role of investments in health as a concrete input into
economic development and poverty reduction. The macroeconomic evidence
suggests that countries with the weakest conditions of health and education find it
much more difficult to achieve sustained growth than do those with better
conditions of health and education. Health status seems to explain an important
part of the difference in economic growth rates, even after controlling for standard
macroeconomic variables. The Commission calls for a comprehensive global
approach, with concrete goals and specific time frames. Increased health care
coverage for the poor requires greater financial investments in specific health sector
interventions, as well as a properly structured health care delivery system. The
Commission’s report suggests investing in interventions that are known to work,
and whose results can be measured in terms of disease burden and health system
performance. An Action Agenda for Investing in Health for Economic
Development is proposed, asking low- and middle-income countries to plan for
scaling up essential health interventions and increasing budgetary resources for
health, and urging the international community to contribute to this effort in a
coordinated way.
The Regional Office established a programme on investment for health in the mid-
1990s. A series of meetings on this issue culminated in 2000 in a declaration of
specific responsibilities for and action on health investment, aimed at rallying
46 COMMISSION ON MACROECONOMICS AND HEALTH. Macroeconomics and health: investing in health for economicdevelopment. Geneva, World Health Organization, 2001.
76057 May2002-v2 20/08/02 17:23 Side 69
70
governments and NGOs, industry and commerce, civil society and the media to a
plan of action. A WHO European Office for Investment for Health and
Development has been established in Venice, with the purpose of collaborating
with Member States in building their capacity to put the health investment process
to work.
PovertyPoverty and ill health form a vicious circle, poverty being both a major
determinant of poor health and a potential consequence of it. Whether defined by
income, socioeconomic status, living conditions or educational level, poverty is the
single largest determinant of ill health. Living in poverty is associated with lower
life expectancy, high infant mortality, poor reproductive health, a higher risk of
contracting infectious diseases (notably tuberculosis and HIV infection), higher
rates of tobacco, alcohol and drug use, a higher prevalence of noncommunicable
diseases, depression, suicide, antisocial behaviour and violence, and increased
exposure to environmental risks. A report submitted to the WHO Regional
Committee for Europe in 200147 provides evidence for these associations.
All European societies are affected by poverty in some ways (see Annex 2, Table 1),
either in absolute or in relative terms. Even in affluent societies, health inequalities
increase with widening socioeconomic disparities, in a social gradient running
across all socioeconomic groups, the whole society and throughout life. In 1998
some 2% of the population of the European Region (approximately 24 million
people) were estimated to live in absolute poverty.48 Relative poverty49 is significant
to different degrees in most European countries. It can affect up to 50% of the
population in some countries in the eastern part of the Region, but even some
western European countries report figures above 10%.
Unemployment as a cause of poverty and ill health is a major issue in all European
countries. The problem reached an alarming level in the CCEE in the 1990s, and
it remains significant in most western European countries. The impact of
47 Poverty and health: evidence and action in WHO’s European Region. Copenhagen, WHO Regional Office forEurope, 2001 (document EUR/RC51/8).
48 According to the World Bank, “absolute poverty is poverty that does not allow people to afford a minimumconsumption basket of US$2.15 per day”.
49 According to the World Bank, “relative poverty exists where people’s economic resources do not allow them aminimum acceptable way of life in the society in which they live, e.g. an income below 60% of the median”.
76057 May2002-v2 20/08/02 17:23 Side 70
71
unemployment and poverty on young people is of particular importance, in view
of its association with health and social problems such as violence, suicide and
substance use.
Urban poverty is a challenge all over Europe, where two thirds of the population
live in cities. Not only is the number of urban poor increasing, but also the
divisions among social groups within cities. The urban poor are more exposed to
disease because of their housing conditions, lack of sanitation, poor diet and
occupational hazards. They may lack access to, or not make appropriate use of,
health services because they lack resources and knowledge and are often
marginalized. Homelessness has become an important issue in many cities, with
alarming consequences in terms of overall mortality, prevalence of chronic
respiratory diseases, and alcohol and drug dependence.
Ethnic minorities, migrants and refugees are at particular risk of poor health. Their
needs often receive far less attention, and they cannot always be reached through
the usual health and welfare channels. This problem is increasing in many
countries.
WHO’s current corporate strategy states that one central task for the Organization
as a whole is to contribute to reducing poverty by improving health, thus placing
health in the context of human development. WHO is playing a leading role in
the Massive Effort against Diseases of Poverty, with the aim of sustaining economic
development by increasing the access of the world’s poorest people to health goods
and services.
Psychosocial factorsPsychosocial stress is increasingly recognized as a key factor in a number of
conditions, including heart problems and hypertension, alcoholic psychosis,
neurosis, homicide, suicide, accidents, ulcers and cirrhosis of the liver. These all
tend to increase in importance in countries undergoing accelerated social and
economic transitions that are not adequately supported by social policy. For
example, according to one study,50 the unprecedented mortality of the 1990s
50 ZIGLIO, E. ET AL., ED. Investment for health. A discussion of the role of the economic and social determinants.Copenhagen, WHO Regional Office for Europe (Studies on Social and Economic Determinants of PopulationHealth, No. 1) (in press).
76057 May2002-v2 20/08/02 17:23 Side 71

72
experienced by many countries in transition was the result of superimposing the
burden of adjustment on a slow, long-term deterioration in the level of health. The
latter was fuelled by a massive increase in psychosocial stress, mainly induced by
unanticipated rises in unemployment, employment turnover and job insecurity,
but also by the erosion of the family, mounting distress, migration and rising social
stratification. In the countries experiencing a sharp rise in death rates, public policy
did little to contain the health impact of growing social stress.
During the present decade it is clear that, within the European Region, social and
economic determinants of health will continue to play a major role in health
development. They will continue to have an effect on health-related trends,
including the impact of the widening gap in income distribution in many
countries on the likely increase of psychosocial stress in both western and eastern
Europe. The positive and negative impacts of social and economic policies on
social capital, social networks and social cohesion will also need to be closely
monitored, as there is increasing evidence that such issues can have a protective or
destructive effect on population health.
EmploymentAmong employed people, there is a clear association between the grade of
employment on the one hand and mortality and morbidity (including rates of
absence due to sickness) on the other. This relationship remains when adjustment
is made for factors such as level of education and tenure of housing. It seems to be
explained by the higher levels of control, challenge and support enjoyed in higher
grades of work.
Both unemployment and work insecurity have detrimental effects on health,
increasing the risk of psychological and physical disorders and suicide. In the
younger age groups, work insecurity is associated with poor health, irrespective of
any relationship between social class and unemployment. Both the steady, long-
term rise in unemployment in most countries of western Europe and its sudden
steep rise in the NIS are a cause of grave concern for equity in health.
The mechanisms through which these trends affect health and wellbeing are
complex and difficult to disentangle. Nevertheless, there is little doubt that they
76057 May2002-v2 20/08/02 17:23 Side 72
73
are related to various kinds of health risk and damage and a high incidence of
psychosocial and mental health problems.
EducationEducation is an important determinant of health. Educational levels produce a
gradient in mortality and morbidity similar to that produced by income. In the
Russian Federation, for instance, mortality differentials by level of education
widened during the transition period. The gap in life expectancy between the best
and least educated men and women aged 20–69 rose from 1.63 and 1.44 years in
1988–1989 to 1.89 and 1.75 years in 1993–1994, respectively.51
The material and cultural resources of a family have a major influence on a child’s
educational attainment. There is thus a strong social class gradient in educational
qualifications and this, in turn, is a strong predictor of subsequent occupation and
income. Children who attain higher levels of education or technical training have
much better chances in health, as well as in occupation and income.
GenderGender has been recognized as a determinant of health, and gender inequities
contribute to the risk of ill health. Major differences exist among European
countries with regard to the place and roles of women in society. For instance, the
proportion of women in government is about 50% in Sweden, reaches 40–45% in
three countries and is below 20% in most other countries. Women are over-
represented among the poor in Europe, and women’s income is on average only
60–70% of men’s.
Gender roles may determine varying patterns of disease in women and men,
varying types of behaviour in seeking health care, and varying responses by service
providers and researchers. There are clearly gender differences in health that almost
certainly have a biological basis, and there are socioeconomic factors that affect the
magnitude of these gender differences. Women live longer than men but their
double burden of work at home and in the workplace takes a heavy toll in terms of
morbidity, and they are more likely than men to suffer from depression and
51 SHKOLNIKOV, V.M. ET AL. Educational level and adult mortality in Russia: an analysis of routine data 1979 to1994. Social science and medicine, 47: 357–369 (1998).
76057 May2002-v2 20/08/02 17:23 Side 73

74
anxiety. On the other hand, men are more prone to accidents, for example, and it
is the health of working-age men that has deteriorated most in the CCEE and NIS
in recent years. The integration of gender considerations into research programmes
and initiatives is one strategy towards more gender-specific and efficient
interventions in health promotion and protection.
BibliographyACHESON, D. Independent inquiry into inequalities in health. London, Stationery Office,1999.
HEMINGWAY, H. & MARMOT, M. Evidence-based cardiology: psychosocial factors in theaetiology and prognosis of coronary heart disease. Systematic review of prospectivecohort studies. British medical journal, 318: 1460–1467 (1999).
MARMOT, M. & BOBAK, M. International comparators and poverty and health inEurope. British medical journal, 321: 1124–1128 (2000).
MARMOT, M.G. & WILKINSON, R.G. Social determinants of health. Oxford & NewYork, Oxford University Press, 1999.
SEN, A. Health in development. Bulletin of the World Health Organization, 77: 619–623(1999).
United Nations Economic Commission for Europe (http://www.unece.org, accessed 30July 2001).
WILKINSON, R. & MARMOT, M., ED. Social determinants of health: the solid facts.Copenhagen, WHO Regional Office for Europe, 1998 (document EUR/ICP/CHVD03 09 01).
WILKINSON, R.G. Unhealthy societies: the afflictions of inequalities. London, Routledge,1996.
76057 May2002-v2 20/08/02 17:23 Side 74
75
LifestylesNutritionThe burden of disease attributable to nutrition is greater than is often appreciated.
Preliminary analysis from the Institute of Public Health in Sweden suggests that
4.5% of DALYs are lost in EU countries alone owing to poor nutrition, with an
additional 3.7% and 1.4% lost owing to obesity and physical inactivity. The total
percentage of DALYs related to poor nutrition and physical inactivity is therefore
9.7%, compared with 9% related to smoking. Cardiovascular diseases and cancer,
together with diabetes, account for about 30% of the total DALYs lost every year
in the WHO European Region. There is international consensus that saturated
fatty acids help explain the rise in cholesterol levels among the population; this is
fundamental to the epidemic of coronary heart disease, the leading cause of
mortality in the WHO European Region.
Human milk is the best food for infants and provides all the nutrients, as well as
immunological substances, needed for about the first six months of life, after
which appropriate complementary foods should be introduced. Low rates of
exclusive breastfeeding and poor weaning practices can lead to failure to grow
normally. Exclusive breastfeeding helps reduce the risk of iron deficiency, which
can lead to impaired concentration, work and cognitive performance, as well as
behavioural abnormalities in infants. The practice of breastfeeding varies
dramatically between European countries. In the United Kingdom, for instance,
only some 25% of infants are breastfed at three months, compared with over 90%
in Uzbekistan. The rate of exclusive breastfeeding also differs from country to
country: in Sweden about 35% of babies are still exclusively breastfed at six
months, compared with only 1% in Azerbaijan. In many European countries
infants are fed various drinks and foods as early as the first few weeks. Poor feeding
practices lead to increased prevalence of stunting52 and wasting,53 especially in
certain CCEE and NIS.
52 Stunting is defined as a height for age that is less than two standard deviations below the reference (US NationalCenter for Health Statistics) standard.
53 Wasting is defined as a weight for height that is less than two standard deviations below the reference (US National Center for Health Statistics) standard.
76057 May2002-v2 20/08/02 17:23 Side 75
76
Overweight and obesity in both children and adults are increasing problems, and
are due mainly to physical inactivity and excess energy intake. Obesity is
accompanied by serious co-morbidities such as non-insulin dependent diabetes
mellitus and cardiovascular diseases. The risk of diabetes is increased up to 100-
fold by obesity, and 80% of the prevalence of diabetes can be attributed to obesity
and overweight. Obesity has serious complications, is difficult and expensive to
treat and reduces life expectancy by 8–10 years. Prevention of obesity is therefore
the best strategy. Non-insulin dependent diabetes is the most important medical
consequence of obesity and is therefore also becoming one of the major diseases in
Europe, with approximately 4% of the population affected in most countries.
It is estimated that iodine deficiency disorders (IDD)54 may affect approximately
130 million people in the European Region.55 IDD refer to all of the ill-effects of
iodine deficiency that can be prevented by ensuring that the population has an
adequate intake of iodine. They include hypothyroidism, goitre and impaired
mental function. Although IDD are considered unlikely in a number of European
countries, recent surveys of the prevalence of goitre in Europe show that many
people still suffer from moderate iodine deficiency. Iodine deficiency, the first cause
of avoidable mental deficiency, can easily be eradicated through universal salt
iodization. Iron deficiency is another important nutrient deficiency in the
European Region. A high prevalence of iron deficiency anaemia among infants and
children has been reported from the former Yugoslav republics, the central Asian
republics and parts of western Europe.
The consumption of fruit and vegetables reduces the risk of chronic disease. Yet
the majority of countries of the Region do not meet the current WHO
recommendations of 400 g per person per day (Table 4). This is in part explained
by the fact that many countries are in the midst of major socioeconomic and
political reform. Many of the NIS and CCEE are not maximizing their industrial
and agricultural potential, partly as a result of their severance from traditional trade
and financial links with the former Soviet Union. These situations continue to
have a detrimental effect on the food security and nutritional status of the affected
populations. As mentioned above, the relationship between saturated fat and
54 Assessment of iodine deficiency disorders and monitoring their elimination. A guide for programme managers, 2nd ed.Geneva, World Health Organization, 2001 (document WHO/NHD/01.1).
55 WHO global database on IDD (1998 estimate using 1997 population data).
76057 May2002-v2 20/08/02 17:23 Side 76
77
cholesterol level, and by extension increased risk of chronic disease, is well
established. Fat intake is too high in the majority of European countries. WHO
recommends a daily fat intake of less than 30% of total energy (Table 4).
In September 2000, the WHO Regional Committee for Europe endorsed the
First Action Plan for Food and Nutrition Policy, 2000–2005. As part of its
commitments, WHO has produced several comparative analyses of nutrition
policies in the European Member States. The most recent was a situation analysis
compiled from reports written by Member States for the first consultation on the
Action Plan, held in Malta in November 1999. The data presented in Table 5 are
drawn from this analysis and constitute the baseline against which countries will
compare their progress at the ministerial conference on nutrition policy planned
for 2005.
To promote and support the development and implementation of comprehensive
food and nutrition policies, the Regional Office is committed to: (a) collating
existing knowledge and scientific evidence to support food and nutrition policy
development and implementation; (b) stimulating research in areas where the
evidence relating nutrition to health is lacking; (c) developing innovative ways to
communicate scientific knowledge and information on nutritional health;
(d ) collaborating with countries in translating knowledge into action, working
with national counterparts and providing information, experience and expertise as
required; (e) developing cost-effective indicators for surveillance and reporting on
food and nutrition policy; (f ) regularly producing an updated list of new
information, documents and training materials on nutrition policy; and
(g) facilitating surveillance and the sharing of information on nutrition, using
modern communication tools, and maintaining a mechanism for rapid updating.
76057 May2002-v2 20/08/02 17:23 Side 77
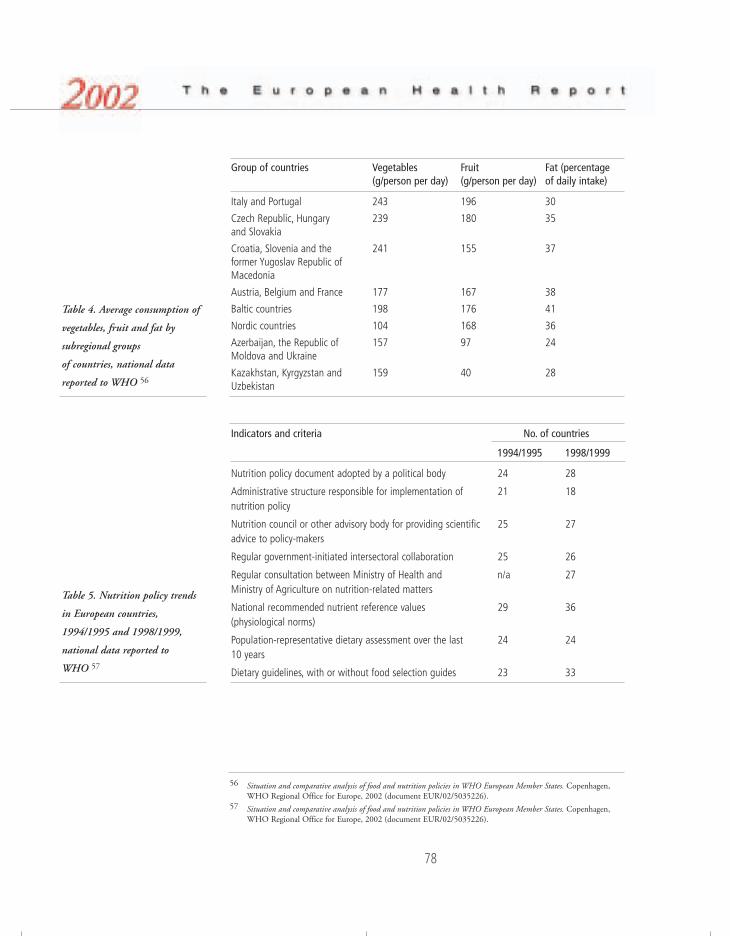
78
Group of countries Vegetables Fruit Fat (percentage (g/person per day) (g/person per day) of daily intake)
Italy and Portugal 243 196 30
Czech Republic, Hungary 239 180 35 and Slovakia
Croatia, Slovenia and the 241 155 37 former Yugoslav Republic of Macedonia
Austria, Belgium and France 177 167 38
Baltic countries 198 176 41
Nordic countries 104 168 36
Azerbaijan, the Republic of 157 97 24 Moldova and Ukraine
Kazakhstan, Kyrgyzstan and 159 40 28Uzbekistan
Indicators and criteria No. of countries
1994/1995 1998/1999
Nutrition policy document adopted by a political body 24 28
Administrative structure responsible for implementation of 21 18nutrition policy
Nutrition council or other advisory body for providing scientific 25 27advice to policy-makers
Regular government-initiated intersectoral collaboration 25 26
Regular consultation between Ministry of Health and n/a 27Ministry of Agriculture on nutrition-related matters
National recommended nutrient reference values 29 36(physiological norms)
Population-representative dietary assessment over the last 24 24 10 years
Dietary guidelines, with or without food selection guides 23 33
56 Situation and comparative analysis of food and nutrition policies in WHO European Member States. Copenhagen,WHO Regional Office for Europe, 2002 (document EUR/02/5035226).
57 Situation and comparative analysis of food and nutrition policies in WHO European Member States. Copenhagen,WHO Regional Office for Europe, 2002 (document EUR/02/5035226).
Table 4. Average consumption of
vegetables, fruit and fat by
subregional groups
of countries, national data
reported to WHO 56
Table 5. Nutrition policy trends
in European countries,
1994/1995 and 1998/1999,
national data reported to
WHO 57
76057 May2002-v2 20/08/02 17:24 Side 78

79
Physical activityPhysically inactive middle-aged and elderly people run a substantially higher risk of
contracting several noncommunicable diseases compared to moderately and highly
active people. It has been estimated that eliminating physical inactivity would
result in 15–39% less coronary heart disease, 33% less stroke, 12% less
hypertension, 12–35% less diabetes, 22–33% less colon cancer, 5–12% less breast
cancer and 18% less osteoporotic fractures. A Finnish estimate of the impact of
physical activity on the use of hospital services showed that most active men spent
36% and most active women 23% fewer days in hospital than the least active
people.
Recent research evidence on the health benefits of physical activity has also
provided new understanding of the dose–response characteristics of activity and
health. While previous recommendations emphasized vigorous uninterrupted
aerobic exercise, newer evidence indicates that health benefits are also accrued
through intermittent daily activity of moderate intensity. This new concept of
health-enhancing physical activity (HEPA) includes many physical activities of a
lifestyle nature, not only during leisure time but also at work, in the home and
during transport.
Several European countries assess population physical activity levels ad hoc, but
only a few conduct regular monitoring. The National Public Health Institute of
Finland has done this since 1978. The level of leisure-time physical activity (at least
twice a week, 30 minutes each time with slight sweating) has increased steadily in
20 years, from about 40% to 60% among both men and women, with an apparent
levelling off in the latter part of the 1990s. During the same period, however,
walking and cycling to and from work decreased steadily, suggesting that people
exercise more but are less physically active.
The Pan-EU Survey of Consumer Attitudes to Physical Activity, Body-weight and
Health, carried out in 1999,58 utilized standard methodology across 15 EU
countries. While none of the outcome measures was designed specifically for
HEPA assessment, the results provide comparable activity patterns across these
countries. Using at least 3.5 hours per week leisure-time physical activity as the
58 http://www.iefs.org/pdf1.pdf, accessed 15 May 2002.
76057 May2002-v2 20/08/02 17:24 Side 79

80
cut-off point, on average 41% of the populations were insufficiently active to
benefit health, although the percentages varied widely from 14 (Finland) to
70 (Portugal) (Fig. 32). In the pooled European data, women were found to
participate less and for shorter periods than men. The proportion of older people
participating for more than 3.5 hours decreased with age, while people with higher
levels of education were more active than those with lower levels.
The European Network for the Promotion of Health-Enhancing Physical
Activity,59 established in 1996, is one of the seven EU health promotion networks.
Its main focus is to facilitate national HEPA policy and strategy development. In
addition to the 15 EU member states, the Network covers Estonia, Iceland, Israel,
Norway, Slovenia and Switzerland. The Network has published guidelines for
HEPA promotion (1996), for the promotion of health-enhancing physical activity
(2000) and for the promotion of walking and cycling as a means of transport
(2000). Major national HEPA promotion initiatives, strategies or programmes have
been developed and are being implemented in many European countries, including
Belgium, Denmark, Finland, the Netherlands, Norway, Slovenia, Spain, Sweden,
Switzerland and the United Kingdom.
Finl
and
Swed
en
Irela
nd
Aust
ria
Net
herla
nds
Luxe
mbo
urg
Denm
ark
Uni
ted
King
dom
Ger
man
y
Fran
ce
Gre
ece
Italy
Belg
ium
Spai
n
Port
ugal
Perc
enta
ge
Fig. 32. Percentages of people in
the EU countries who exercise
insufficiently to benefit health
(less than 3.5 hours per week),
1997
59 http://europa.eu.int/comm/health/ph/programmes/health/proj00_09_en.html, accessed 15 May 2002.
76057 May2002-v2 20/08/02 17:24 Side 80

81
TobaccoAbout 215 million Europeans smoke, of whom 130 million are male (Fig. 33).
The annual number of deaths attributable to the consumption of tobacco products
is estimated at 1.2 million (14% of all deaths). Of these, 700 000 occur in the
CCEE and NIS. According to data from 25 countries, covering 60% of the
population of the Region, average smoking prevalence in the male population is
around 34% for western European countries and 47% for eastern European
countries. In the female population the prevalence is some 25% for western
European countries and 20% for eastern European countries. The smoking
prevalence in males is above 50% in 11 countries and below 30% in 5 countries.
For females, the prevalence is above 30% in 5 countries and below 10% in
3 countries.
Smoking is well established behaviour among young people, and the available data
show almost no signs of a decrease. In Europe as a whole, smoking prevalence
among people aged 15–18 years is estimated at around 30%, with a slight upward
trend and no country showing a decrease in recent years. Gender differences
between countries are particularly noticeable. In those over 15 years, boys report
higher rates than girls in most of the countries in the eastern part of the Region,
though the gap is constantly diminishing. In western Europe, the rates for girls are
(with a few exceptions) higher than those for boys.
Fig. 33. Percentages of daily
smokers aged 15 years and over,
latest available data
Nor
way
FYM
a
Fran
ceCr
oatia
Irela
ndHu
ngar
yN
ethe
rland
sDe
nmar
kG
reec
ePo
land
Ando
rra
Luxe
mbo
urg
Switz
erla
ndBe
lgiu
mU
nite
d Ki
ngdo
mIc
elan
dIs
rael
Spai
nTu
rkey
Bulg
aria
Czec
h Re
publ
icG
erm
any
Slov
enia
Esto
nia
Finl
and
Swed
enAu
stria
Alba
nia
Italy
Lith
uani
aSl
ovak
iaU
krai
neLa
tvia
Kyrg
yzst
anG
eorg
iaRo
man
iaRu
ssia
n Fe
dera
tion
Port
ugal
Kaza
khst
anM
alta
Bela
rus
Arm
enia
MalesFemales
Perc
enta
ge
a FYM: the former Yugoslav Republic of Macedonia.
76057 May2002-v2 20/08/02 17:24 Side 81
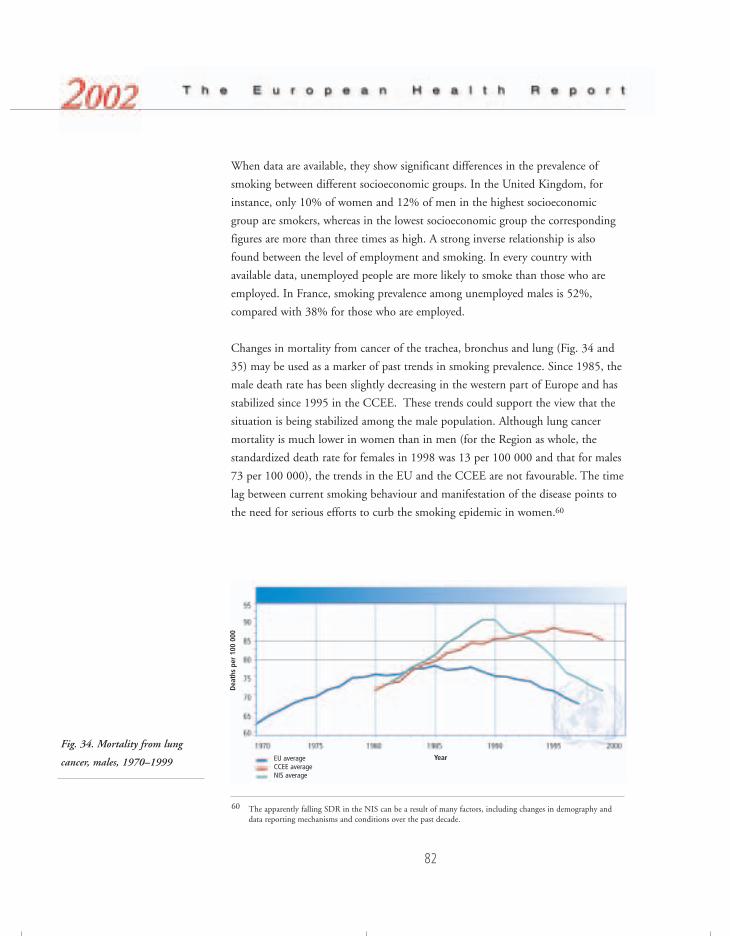
82
When data are available, they show significant differences in the prevalence of
smoking between different socioeconomic groups. In the United Kingdom, for
instance, only 10% of women and 12% of men in the highest socioeconomic
group are smokers, whereas in the lowest socioeconomic group the corresponding
figures are more than three times as high. A strong inverse relationship is also
found between the level of employment and smoking. In every country with
available data, unemployed people are more likely to smoke than those who are
employed. In France, smoking prevalence among unemployed males is 52%,
compared with 38% for those who are employed.
Changes in mortality from cancer of the trachea, bronchus and lung (Fig. 34 and
35) may be used as a marker of past trends in smoking prevalence. Since 1985, the
male death rate has been slightly decreasing in the western part of Europe and has
stabilized since 1995 in the CCEE. These trends could support the view that the
situation is being stabilized among the male population. Although lung cancer
mortality is much lower in women than in men (for the Region as whole, the
standardized death rate for females in 1998 was 13 per 100 000 and that for males
73 per 100 000), the trends in the EU and the CCEE are not favourable. The time
lag between current smoking behaviour and manifestation of the disease points to
the need for serious efforts to curb the smoking epidemic in women.60
Fig. 34. Mortality from lung
cancer, males, 1970–1999
60 The apparently falling SDR in the NIS can be a result of many factors, including changes in demography anddata reporting mechanisms and conditions over the past decade.
EU averageCCEE average NIS average
Year
Dea
ths
per
100
000
76057 May2002-v2 20/08/02 17:24 Side 82
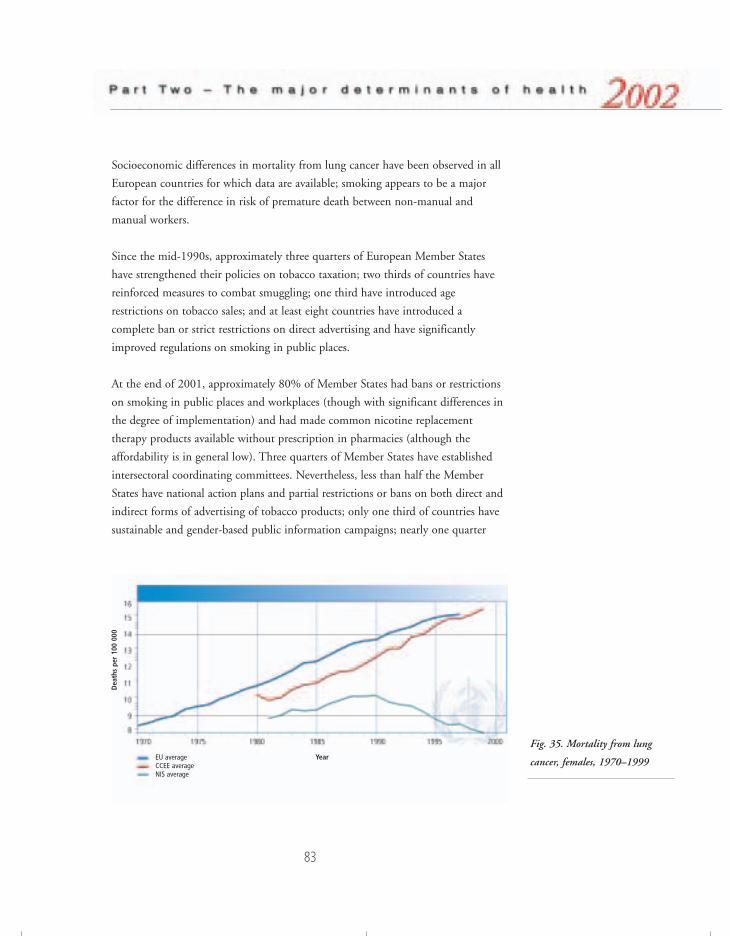
83
Socioeconomic differences in mortality from lung cancer have been observed in all
European countries for which data are available; smoking appears to be a major
factor for the difference in risk of premature death between non-manual and
manual workers.
Since the mid-1990s, approximately three quarters of European Member States
have strengthened their policies on tobacco taxation; two thirds of countries have
reinforced measures to combat smuggling; one third have introduced age
restrictions on tobacco sales; and at least eight countries have introduced a
complete ban or strict restrictions on direct advertising and have significantly
improved regulations on smoking in public places.
At the end of 2001, approximately 80% of Member States had bans or restrictions
on smoking in public places and workplaces (though with significant differences in
the degree of implementation) and had made common nicotine replacement
therapy products available without prescription in pharmacies (although the
affordability is in general low). Three quarters of Member States have established
intersectoral coordinating committees. Nevertheless, less than half the Member
States have national action plans and partial restrictions or bans on both direct and
indirect forms of advertising of tobacco products; only one third of countries have
sustainable and gender-based public information campaigns; nearly one quarter
Fig. 35. Mortality from lung
cancer, females, 1970–1999EU averageCCEE average NIS average
Year
Dea
ths
per
100
000
76057 May2002-v2 20/08/02 17:24 Side 83
84
have earmarked tobacco taxes and restricted access to tobacco products for people
under 18 (also eliminating all major impersonal modes of sale); and almost no
countries reimburse the cost of treatment of tobacco dependence, publish
comprehensive national reports on tobacco control, or have introduced health
warnings covering more than 20% of each external area of the tobacco package.
While most countries have a taxation policy for tobacco products, in general it
does not explicitly refer to public health concerns, and therefore the increase in the
real price of tobacco – where it exist – is not as consistent as it should be.
Introducing new laws and regulations has not always brought tangible results and
several countries, mainly in the eastern part of the Region, are still in the process of
launching them. Furthermore, the lack of a strategy and comprehensive approach
is still characteristic of national tobacco control policies and activities in at least
one third of Member States. In other countries, insufficient coordination
mechanisms, and inadequate funding and monitoring, reduce the effectiveness of
national action. Finally, the lack of public support and public information is still
an important constraint on the effectiveness of many national and local
programmes.
The progress made in monitoring the tobacco-related situation is not adequate to
many new challenges. With the development of smuggling, bootlegging and near-
border purchases and the extension of new forms of tobacco consumption (hand-
rolling, smokeless products, etc.) tobacco use is becoming increasingly
underreported. Furthermore, the quality and methodology of many surveys are not
reliable enough to understand and monitor the dynamics of tobacco use, in
particular for assessing quitting trends and monitoring smoking patterns in
subgroups such as the young and the socioeconomically disadvantaged.
At international level, the main challenges remain standardized surveillance,
implementing measures to combat smuggling, regulating transboundary
advertisement and coordinating action against the tobacco industry. Despite new
bans and restrictions on advertising the industry has still been developing
unscrupulous marketing, promoting “youth anti-smoking education programmes”
and indirect forms of advertising targeted mainly at young people. It has been
trying to influence national and EU policies, in some cases successfully, in order to
delay, weaken or even annul legislation under development or already adopted.
76057 May2002-v2 20/08/02 17:24 Side 84
85
The Framework Convention on Tobacco Control61 is a milestone in an effective
international response to many of these challenges. The vast majority of European
Member States are involved in the negotiation process, and the recently adopted
Warsaw Declaration for a Tobacco-free Europe62 shows that the Region can indeed
play a leading role in finalizing and adopting international legislation to fight the
scourge of tobacco.
Alcohol Each year over 55 000 young Europeans die from the effects of alcohol abuse: one
in four deaths in European men aged 15–29 years is related to alcohol. In addition,
between 40% and 60% of all deaths from injuries are attributable to alcohol.
Alcohol consumption, and particularly acute alcohol intoxication, seems to explain
a considerable portion of the differences in young adult mortality observed
between the west and east of the Region and between males and females. The
welfare, health service, insurance, enforcement and penal costs associated with
drinking, and the costs resulting from loss of production, accrue to a total societal
cost of 1–3% of GDP.
The consumption of alcoholic beverages is estimated to be responsible for about
9% of the total disease burden within the Region, increasing among others the risk
of liver cirrhosis, raised blood pressure, heart disease, stroke, pancreatitis and
cancers of the oropharynx, larynx, oesophagus, stomach, liver and rectum. Alcohol
acutely impairs many aspects of psychomotor and cognitive function. Impairment
of emotional control can result in violence towards oneself or others. Furthermore,
alcohol consumption increases the risk of family, work and social problems such as
failure in work performance, absenteeism, unemployment, accidents, debt and
housing problems. The relationship between alcohol and crime is complex, but
alcohol is directly or indirectly implicated in various types of assault, criminal
behaviour, unintentional injury, violence, homicide and suicide.
Over 90% of the countries in the Region have an annual consumption per person
exceeding two litres of absolute alcohol (the level suggested by the evidence as
being associated with the lowest average death rate). The European Region has the
61 http://www5.who.int/tobacco/page.cfm?pid=40, accessed 15 May 2002.62 http://www5.who.int/tobacco/page.cfm?tld=140, accessed 15 May 2002.
76057 May2002-v2 20/08/02 17:24 Side 85
86
highest alcohol consumption in the world, but the average recorded consumption
of 7.3 litres of pure alcohol per person in 1998 hides considerable differences
between countries, from a low of 0.9 litres to a high of 13.3 litres per person.
Adding unrecorded consumption changes the situation significantly for some
countries, bringing a few of them up to about 20 litres per person.
The European School Survey Project on Alcohol and Other Drugs (ESPAD) shows
that there are clear increases in the proportion of students who use alcohol in the
central and eastern parts of Europe, especially in Lithuania, Poland, Slovakia and
Slovenia. However, the use of alcohol among students is most common in the
Czech Republic, Denmark, Ireland, Malta and the United Kingdom. Of the four
top countries for intoxication rates in 1995, the rates in Denmark and Ireland
increased even further while those in Finland and the United Kingdom remained
largely unchanged.
Regionally, some trends emerge. The Nordic countries show stable levels of alcohol
consumption, except Sweden, which is experiencing a decrease. Consumption is
increasing in Latvia and Lithuania, while Estonia shows a slight decrease. Among
the 15 EU countries, Ireland is the only country where consumption is increasing
considerably, although it is increasing to a lesser extent in Greece, Luxembourg and
Portugal. In the rest of the EU, consumption is decreasing in six countries and is
stable in five. In the CCEE, consumption is increasing in the Czech Republic,
Romania and the former Yugoslav Republic of Macedonia. Finally, in the NIS,
consumption is increasing in Belarus and the Russian Federation.
The development of alcohol policies in the European Region continues to make
progress, despite weaknesses in some areas. Many countries have now coordinated
national alcohol action plans with targets and key activities. Policy changes over the
past few years have shown convergence on some alcohol policy measures. Specific
policy efforts to reduce drink-driving illustrate effective country-level policy
measures, whereby many countries have lowered their on blood alcohol limits and
increased enforcement. The regulatory provisions for alcohol-free environments
have also been increased in many countries to ensure greater public safety and safer
workplaces. Measures to regulate alcohol advertising have had mixed responses:
some countries have introduced restrictions while many others have eased them. In
general, western European countries have moved towards stricter alcohol control
policies, have reduced per capita consumption levels and have lowered alcohol-
76057 May2002-v2 20/08/02 17:24 Side 86
87
related harm to a greater degree than many of the countries in the central or
eastern part of the Region.
Weaknesses in policy effectiveness still remain. The enforcement of codes,
regulations or legislation is a critical factor in policy effectiveness. External
pressures from the alcoholic beverage industry, commercial marketing and illegal
trade militate against further progress. The lack of a collective willingness to
recognize the seriousness of alcohol problems and the wide-ranging damage caused
by alcohol in society is a further obstacle.
With a right mix of policy measures, it is possible to limit the extent of harm done
by alcohol without resorting to abstinence-oriented policies. According to research
evidence, a policy mix that makes use of taxation and control of physical access,
supports drink-driving countermeasures and invests broadly in treatment, and
particularly in primary care, is likely to succeed in reducing the level of problems.
Educational strategies or restrictions on advertising can be added to the mix, as
long as there is reasonable hope of long-term effectiveness. Comprehensive
community action programmes may also have potential effect. The European
Alcohol Action Plan, endorsed by the WHO Regional Committee for Europe on
two occasions over the last ten years, plus the documentation produced by the
Regional Office in support of two ministerial conferences on alcohol, provide a
good basis for policy and programme development.
Illegal drugsAccording to The world health report 2001, 0.4% of the total disease burden is
attributable to illicit drugs (heroin and cocaine). Substance dependence is both a
chronic medical illness and a social problem.63,64 Dependence prevention should
be seen within the context of the broader goal of preventing and reducing drug-
related problems at the population level.65 The goals of therapy are to reduce
morbidity and mortality associated with the use of psychoactive substances. Drug
dependence treatment is cost-effective in reducing drug use (40–60%), and the
63 LESHNER, A.I. Addiction is a brain disease, and it matters. Science, 278 (5335): 45–47 (1997). 64 MCLELLAN, A.T. ET AL. Drug dependence, a chronic medical illness: implications for treatment, insurance, and
outcomes evaluation. Journal of the American Medical Association, 284: 1689–1695 (2000).65 http://www.who.int/whr/2001/main/en/chapter4/index.htm, accessed 15 May 2002.
76057 May2002-v2 20/08/02 17:24 Side 87
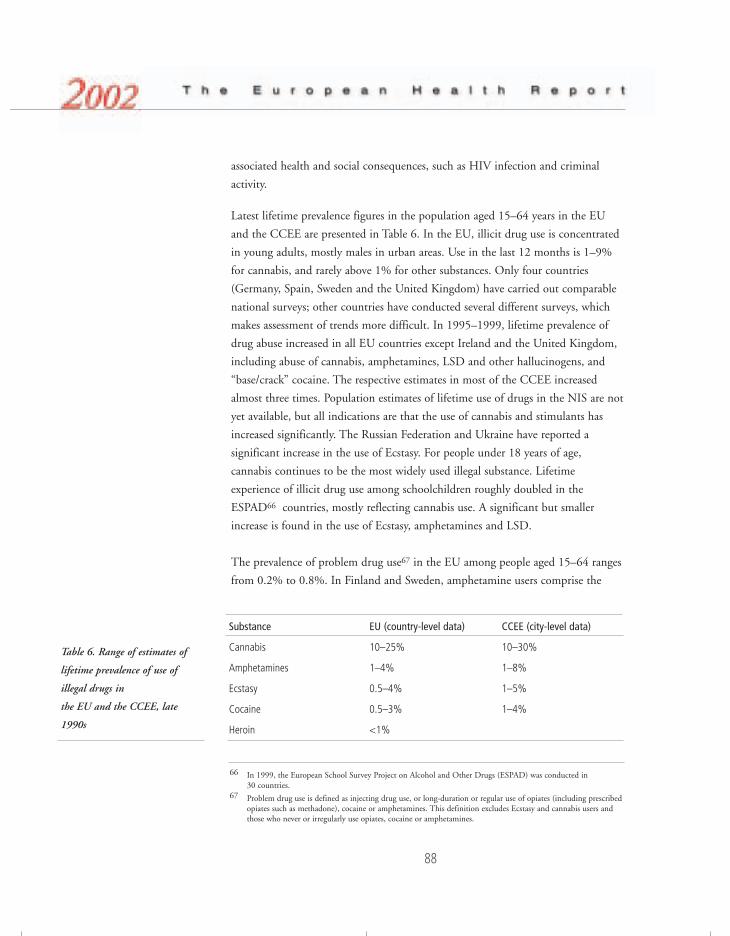
88
associated health and social consequences, such as HIV infection and criminal
activity.
Latest lifetime prevalence figures in the population aged 15–64 years in the EU
and the CCEE are presented in Table 6. In the EU, illicit drug use is concentrated
in young adults, mostly males in urban areas. Use in the last 12 months is 1–9%
for cannabis, and rarely above 1% for other substances. Only four countries
(Germany, Spain, Sweden and the United Kingdom) have carried out comparable
national surveys; other countries have conducted several different surveys, which
makes assessment of trends more difficult. In 1995–1999, lifetime prevalence of
drug abuse increased in all EU countries except Ireland and the United Kingdom,
including abuse of cannabis, amphetamines, LSD and other hallucinogens, and
“base/crack” cocaine. The respective estimates in most of the CCEE increased
almost three times. Population estimates of lifetime use of drugs in the NIS are not
yet available, but all indications are that the use of cannabis and stimulants has
increased significantly. The Russian Federation and Ukraine have reported a
significant increase in the use of Ecstasy. For people under 18 years of age,
cannabis continues to be the most widely used illegal substance. Lifetime
experience of illicit drug use among schoolchildren roughly doubled in the
ESPAD66 countries, mostly reflecting cannabis use. A significant but smaller
increase is found in the use of Ecstasy, amphetamines and LSD.
The prevalence of problem drug use67 in the EU among people aged 15–64 ranges
from 0.2% to 0.8%. In Finland and Sweden, amphetamine users comprise the
66 In 1999, the European School Survey Project on Alcohol and Other Drugs (ESPAD) was conducted in 30 countries.
67 Problem drug use is defined as injecting drug use, or long-duration or regular use of opiates (including prescribedopiates such as methadone), cocaine or amphetamines. This definition excludes Ecstasy and cannabis users andthose who never or irregularly use opiates, cocaine or amphetamines.
Table 6. Range of estimates of
lifetime prevalence of use of
illegal drugs in
the EU and the CCEE, late
1990s
Substance EU (country-level data) CCEE (city-level data)
Cannabis 10–25% 10–30%
Amphetamines 1–4% 1–8%
Ecstasy 0.5–4% 1–5%
Cocaine 0.5–3% 1–4%
Heroin <1%
76057 May2002-v2 20/08/02 17:24 Side 88

89
majority of problem drug users (estimated at 70–80% in Finland in 1997). In
other countries problem drug users are mostly primary opiate users, but often use
several drugs. The use of cocaine in the CCEE is limited because of the high
market prices. In the NIS, the widespread use of homemade ephedrine is a
continual concern, and imported heroin has increasingly replaced locally produced
opiates. Drug use has been spreading from major urban centres to all regions and
among ethnic minorities and prison populations. Data on problem drug use in
central Asia are limited, but there are clear indications of a serious increase. The
most serious trend is the rapid increase of injecting drug use, which has
contributed to the spread of HIV infection. About 70–75% of drug users in
treatment in the CCEE use the intravenous route, ranging from 26% in Budapest
to 96% in Gdansk. In the Russian Federation, the reported range is from 83% in
Novosibirsk to 93% in St Petersburg.
In the EU, reported HIV infection rates in injecting drug users roughly range from
1% in the United Kingdom to 32% in Spain. The latest data suggest that the
overall picture remains unchanged, but there are indications of recent increases in
Austria, Finland, Ireland, Luxemburg, the Netherlands and Portugal, while there is
a clearly declining trend in Spain. Hepatitis C infection rates in injecting drug
users vary from 40% to 90%. Studies indicate that preventive measures can reduce
transmission.68 In the CCEE and NIS, very few reliable data are available on HIV
and hepatitis B and C, but the prevalence of risky behaviour by intravenous drug
users, such as needle sharing, suggest that the danger of epidemics is high.
Acute drug-related deaths (“overdoses”) are an important but potentially
misleading indicator of the drug situation. The current levels, especially among
young people, are a major concern. In the EU, the number of cases reported up to
1999 stabilized at 7000–8000 per year, and actually decreased in some countries.
There was, however, a substantial upward trend until recently in Greece, Ireland
and Portugal, most likely reflecting the late expansion of heroin use in these
countries. Opiates continue to be present in most cases of acute drug-related
deaths, but the presence of other substances considered a risk factor for overdose,
such as alcohol, benzodiazepines or cocaine, is common. Methadone has been
identified in a number of drug-related deaths, pointing to the appearance of
methadone on the illegal market and problems with the prescription services.
68 http://annualreport.emcdda.org, accessed 15 May 2002.
76057 May2002-v2 20/08/02 17:24 Side 89
90
General mortality among drug users is also an important indicator, as opiate users
can have overall mortality rates up to 20 times higher than those of the general
population of the same age, due not only to drug overdoses but also to accidents,
suicides, AIDS and other infectious diseases. A study at nine sites in the EU
showed increasing trends until the mid 1990s, followed by a decrease. The number
of drug-related deaths has increased in the CCEE and NIS, mainly owing to
heroin overdose but also to the poor quality of street heroin and its combination
with some extremely toxic substances such as strychnine.
Overall, drug abuse has become a lasting public health problem in Europe. Eastern
Europe is catching up fast with the west, and most indications are that the overall
situation in the Region as a whole is further deteriorating. Controlling the availability of
illicit drugs has proven to be necessary but has produced mixed results. The availability
of illicit drugs on the black market expanded in the 1990s, and prices of most illicit
substances have decreased almost everywhere. A parallel market for pharmaceutical
preparations, obtained through over-prescription, under-the-counter sales in
pharmacies or diversions from legal channels, is reported to exist in some countries.
Information, education, treatment and rehabilitation are key pillars of national
policies for reducing the demand for drugs in the Region. In addition, most
countries aim to reduce the negative impact on public health of continued drug
abuse, including the prescription of substitution drugs to drug-dependent people,
the promotion of “safe” drug taking, and the establishment of drug injection
rooms to decrease the risk of multiple use of contaminated injecting equipment.
Comprehensive national drug policies aim at reducing the consequences of
problem drug use such as HIV infection, hepatitis B and C and deaths from
overdose. Taking into account the United Nations Declaration on the Guiding
Principles of Drug Demand Reduction,69 special attention must be paid to the
wider implementation of community-based drug prevention programmes, the
development of a public health drug-treatment model that would make services
available to more people in need of treatment, and programmes for reducing harm,
minimizing risk and rehabilitation.
69 http://www.un.org/ga/20special/demand.htm, accessed 15 May 2002.
76057 May2002-v2 20/08/02 17:24 Side 90
91
BibliographyBALADY, G.J. ASCM’s guidelines for exercise testing and prescription. Philadelphia &London, Lippincott Williams & Wilkins, 2000.
BOUCHARD, C. ET AL. Physical activity, fitness and health: 2nd International ConsensusSymposium papers and consensus statement. Champaign, IL, Human Kinetics, 1994.
Comparative analysis of implementation of the Innocenti Declaration in WHO EuropeanMember States. Monitoring Innocenti targets on the protection, promotion and support ofbreastfeeding. Copenhagen, WHO Regional Office for Europe, 1999 (documentEUR/ICP/LVNG 01 01 02).
CORRAO, M.A. Tobacco control country profiles. Atlanta, American Cancer Society, 2000.
Declaration on Young People and Alcohol: the WHO European Ministerial Conference onYoung People and Alcohol, Stockholm, 19–21 February 2001. Copenhagen, WHORegional Office for Europe, 2001 (document EUR/01/5026952).
European Alcohol Action Plan 2000–2005. Copenhagen, WHO Regional Office forEurope, 2000 (document EUR/LVNG 01 05 01).
European Charter on Alcohol. In: Anderson, P., ed. Alcohol – less is better. Report of theWHO European Conference on Health, Society and Alcohol, Paris, 12–14 December 1995.Copenhagen, WHO Regional Office for Europe, 1995 (WHO Regional Publications,European Series, No. 70), pp. 20–21.
EUROPEAN COMMISSION. Promotion of health-enhancing physical activity. Development ofa European strategy, network and action program. Tampere, UKK Institute, 1996.
European Network for Smoking Prevention (http://www.ensp.org, accessed 26 July 2001).
FAOSTAT Database (http://apps.fao.org/lim500/agri_db.pl, accessed 13 August 2001).
FLEISCHER MICHAELSEN, K. ET AL. Feeding and nutrition of infants and young children.Guidelines for the WHO European Region, with emphasis on the former Soviet countries.Copenhagen, WHO Regional Office for Europe, 2000 (WHO Regional Publications,European Series, No. 87).
FOSTER, C. Guidelines for health-enhancing physical activity promotion programmes.Oxford, British Heart Foundation Health Promotion Research Group, 2000.
HAAPANEN-NIEMI, N. The impact of smoking, alcohol consumption, and physicalactivity on use of hospital services. American journal of public health, 89: 691–698(1999).
HARKIN, A.M. ET AL. Smoking, drinking and drug taking in the European Region.Copenhagen, WHO Regional Office for Europe, 1997.
International Narcotics Control Board (http://www.incb.org, accessed 30 July 2001).
JHA, P. & CHALOUPKA, F.J. Tobacco control policies in developing countries. Oxford,Oxford University Press, 2000.
76057 May2002-v2 20/08/02 17:24 Side 91

92
JHA, P. Curbing the epidemic: governments and the economics of tobacco control.Washington, DC, World Bank, 1999.
KESANIEMI, Y.K. ET AL. Dose–response issues concerning physical activity and health:an evidence-based symposium. Medicine and science in sports and exercise, 33(6, Suppl):S351–S358 (2001).
OJA, P. & VUORI, I. Promotion of transport walking and cycling in Europe: strategydirections. Tampere, UKK Institute, 2001.
OJA, P. Descriptive epidemiology of health-related physical activity and fitness. Researchquarterly for exercise and sport, 66: 303–312 (1995).
PATE, R.R. ET AL. Physical activity and public health. A recommendation from theCenters for Disease Control and Prevention and the American College of SportsMedicine. Journal of the American Medical Association, 273: 402–407 (1995).
PETERSEN, S. ET AL. Health and lifestyles in four counties : Results from the third OxfordHealth Lifestyle Survey. Oxford, University of Oxford Health Services Research Unit,1998.
Physical activity and health: a report of the Surgeon General. Atlanta, GA, Centers forDisease Control and Prevention, 1996.
POMPIDOU GROUP. Co-operation Group to Combat Drug Abuse and Illicit Trafficking inDrugs. (http://www.pompidou.coe.int, accessed 30 July 2001).
PRABHAT, J. & CHALOUPKA, F.J. Tobacco control in developing countries. New York,Oxford University Press, 2000.
ROBERTSON, A. ET AL. Nutrition and immunisation survey of Bosnian women andchildren during 1993. International journal of epidemiology, 24: 1163–1170 (1993).
SAMET, J.M. & YOON, S.Y., ED. Women and the tobacco epidemic: challenges for the 21stcentury. Geneva, World Health Organization, 2001 (documentWHO/NMH/TFI/01.1).
Situation and comparative analysis of food and nutrition policies in WHO EuropeanMember States. Copenhagen, WHO Regional Office for Europe, 2002 (documentEUR/02/5035226).
The assessment of drug problems. Copenhagen, WHO Regional Office for Europe, 1998(document EUR/ICP/LVNG 02 06 01 A).
The First Action Plan for Food and Nutrition Policy: WHO European Region 2000–2005.Copenhagen, WHO Regional Office for Europe, 2001 (document EUR/01/5026013).
Third Action Plan for a Tobacco Free Europe 1997–2000. Copenhagen, WHO RegionalOffice for Europe, 1997 (document EUR/ICP/LVNG 01 04 01).
United Nations Office for Drug Control and Crime Prevention (http://www.undcp.org,accessed 30 July 2001).
76057 May2002-v2 20/08/02 17:24 Side 92
93
VAZ DE ALMEIDA, M.D. ET AL. Physical activity levels and body weight in a nationallyrepresentative sample in the European Union. Public health nutrition, 2: 105–113(1999).
WHO Tobacco Free Initiative (http://www5.who.int/tobacco/page.cfm?pid=39, accessed26 July 2001).
WILLIAMS, C., ED. Physical activity and cardiovascular disease prevention in the EuropeanUnion. Brussels, European Heart Network, 1999.
Physical environmentThe effects on human health of environmental hazards have been of growing
concern to the populations of Europe for the past 20 years. The mechanisms
behind environmental effects on the health of populations are complex. Experience
has shown that such effects can be ameliorated only within a context of sustainable
development, by working together with the relevant authorities and stakeholders.
Air quality Although data on exposure levels to inhalable airborne particles are still limited in
Europe, it seems that in northern Europe, PM1070 levels are low, with winter
averages even in urban areas not exceeding 20–30 µg/m3. In western Europe, levels
seem to be higher at 40–50 µg/m3. Levels in some central and eastern European
locations appear to be only a little higher than those measured in cities such as
Amsterdam and Berlin. The concentration of many air pollutants has been
significantly reduced in most of Europe. Recent studies suggest, however, that
short-term variations in particulate matter are associated with adverse health effects
even at low levels of exposure (below 100 µg/m3). The effects range from mild
changes in respiratory function, through increased respiratory and cardiovascular
morbidity, to increased mortality. According to some studies, long-term exposure to
particulate matter is associated with a reduction in life expectancy in the order of
1–2 years. Recent studies have shown that the prevalence of symptoms of
bronchitis in children, and of reduced lung function in children and adults, is
associated with long-term exposure to particulate matter. The overall burden of ill
health related to particulate matter (PM10) may well exceed 100 000 years of life
70 Particulate matter in which 50% of particles have an aerodynamic diameter of less than 10 mm.
76057 May2002-v2 20/08/02 17:24 Side 93

94
lost annually. High concentrations of ozone in the troposphere, typical for the
summer months, lead to an increase in the frequency of respiratory symptoms:
nearly 1000 emergency hospital admissions and more than 2000 premature deaths
per year can be attributed to this pollution in the15 EU countries.
Among indoor air pollutants, environmental tobacco smoke affects health most.
According to some estimates, it could cause each year close to 20 000 deaths from
cardiovascular diseases and 1000 deaths from lung cancer in nonsmokers (mostly
women) in the 15 EU countries alone. In children, some 500 000 episodes of
lower respiratory infection per year could be attributed to exposure to tobacco
smoke. WHO has proposed strategies to implement comprehensive policies on
indoor air quality, but they still need to be considered by the Member States.
Governments take various measures to reduce air pollution levels, or at least to
prevent their increase, and many use the WHO Air Quality Guidelines as a basis
for legally binding air quality standards. The UNECE Convention on Long-range
Transboundary Air Pollution71 and the relevant EC Directives are the main
international legal documents limiting emission of pollutants and regulating air
quality in much of the European Region of WHO. More work is needed to better
assess the health burden of pollution and to develop effective actions for its
reduction in the NIS.
Food safety Foodborne diseases caused by microbiological hazards are a growing public health
problem. The WHO Programme for Surveillance of Foodborne Diseases in Europe
has been collecting official information from the Member States of the WHO
European Region for the last 20 years. Most countries with systems for reporting
foodborne diseases have documented significant increases during that period in the
incidence of diseases caused by microorganisms in food, including Salmonella
(Fig. 36) and Campylobacter. New hazards have emerged in the food chain, such as
enterohaemorrhagic Escherichia coli, multidrug-resistant Salmonella typhimurium
DT-104 and bovine spongiform encephalopathy (BSE). Variant Creutzfeldt-Jakob
disease, with 105 deaths reported in Europe, is strongly linked to exposure to BSE,
but the information currently available is insufficient to make any well founded
prediction about the future incidence of the disease.
71 http://www.unece.org/env/lrtap, accessed 16 May 2002.
76057 May2002-v2 20/08/02 17:24 Side 94

95
According to reports received by WHO, some 77% of outbreaks of foodborne
disease in Europe are due to Salmonella, one third of these being caused by S.
enteritidis. Other agents frequently identified in the investigated outbreaks
included Staphylococcus aureus, Trichinella, Shigella, Clostridium perfringens, toxic
mushrooms, Campylobacter and viruses. Almost 40% of the investigated outbreaks
were related to the consumption of insufficiently cooked eggs, or of foods
containing raw eggs such as mayonnaise, ice cream or cream-filled pastries. The
private home is the single location where most outbreaks occur (more than 40%),
though many outbreaks were connected with kitchens in restaurants, cafeterias and
catering services (22%). These results suggest the need for a better implementation
of the Hazard Analysis and Critical Control Point (HACCP) system in the
restaurant/catering sector, and also for the development of programmes for
consumer education on food safety matters.
Chemicals are a significant source of foodborne disease, although their effects are
often difficult to link with a particular food. Chemical contaminants in food
include natural toxicants such as mycotoxins and environmental contaminants
such as dioxins, mercury, lead and radionuclides. The wide use of food additives,
pesticides and veterinary drugs requires strong measures to ensure food safety.
Information on chemical food contamination in Europe varies and is usually not
recorded in monitoring programmes. In the CCEE, food contamination arises
largely from industrial contamination of air, soil and water – whether from mining
and smelting activities, the energy sector, the agricultural industry or dispersal of
Fig. 36. Incidence of
salmonellosis in selected
European countries, 1985–1998
EstoniaLatviaLithuaniaAustriaGermanyRussian FederationSwitzerlandCyprusEngland and WalesScotland
Inci
denc
e pe
r 10
0 00
0
76057 May2002-v2 20/08/02 17:24 Side 95

96
waste. Contamination of food items usually occurs in these “hot spots” rather than
throughout the whole country. One example is the Aral Sea area, which has been
seriously polluted after 30 years of using its water for irrigation together with heavy
application of insecticides, pesticides, herbicides and defoliants.
Surveillance of foodborne diseases and monitoring of food contamination are
essential tools for risk assessment. For this reason, WHO is directing its efforts
towards developing adequate methods to provide the necessary data for
quantitative microbiological and chemical risk assessment. WHO’s new global
initiative on food safety promotes the strengthening of systems based on laboratory
and epidemiological findings and of their linkages to programmes for monitoring
food contamination. Such assessments can serve as the basis for setting
international standards and guidelines, and for national food regulations or other
initiatives. The Global Environmental Monitoring System/Food Contamination
Monitoring and Assessment (GEMS/Food) programme for the WHO European
Region was established in 1991 to address the specific priorities and needs of the
Region in the field of food contamination.
New technologies, such as genetic engineering, food irradiation and modified-
atmosphere packaging, can improve food production and food safety. Nevertheless,
the potential risks associated with their application should be objectively and
rigorously assessed well before these technologies are widely introduced. WHO is
promoting a holistic approach to the production and safe use of foods derived
from new methods of production, including genetic engineering. A framework for
evaluation, which addresses safety considerations, health benefits, environmental
effects and socioeconomic consequences, supports this approach. The Joint
FAO/WHO Codex Alimentarius Commission decided, in June 1999, to establish
standards, guidelines or recommendations for foods derived from biotechnology.
The First Action Plan for Food and Nutrition Policy, 2000–2005 provides a
framework for promoting public health through food. A comprehensive food and
nutrition policy comprises three strategies: on nutrition, food safety and a
sustainable food supply. The three strategies are interrelated, since the food supply
influences both the safety and composition of food. Close collaboration between
those responsible for nutrition, food safety and food security is required in order to
develop comprehensive, intersectoral policies and concerted action.
76057 May2002-v2 20/08/02 17:24 Side 96

97
WaterPathogenic microorganisms remain the most important danger to drinking-water
and recreational water in the Region, and gastrointestinal diseases are still an
important cause of child morbidity and mortality in some countries. Viruses
(rotavirus, calicivirus and hepatitis A virus) are responsible for 70–80% of
infectious diarrhoea cases in the developed world. Various bacterial pathogens
account for another 10–20% of cases, while parasitic organisms such as Giardia
spp. cause less than 10% of cases. Challenges vary widely in the Region. In the
western part, problems relate essentially to new and emergent diseases, such as
legionellosis and the health impacts of cyanobacteria. In the southern part, water
scarcity is a major concern, highlighting the need for integrated water resource
management. In the eastern part, access to safe and sufficient water and sanitation,
including distribution and economic management, continues to be a serious
problem, together with water scarcity in some sub-regions.
Control of waterborne diseases throughout Europe remains an important issue.
During 1986–1996, the most recent period for which systematically collected data
are available, 710 outbreaks of waterborne disease were reported in 19 European
countries. In addition, 8 countries considered chemical contamination of drinking-
water to be a major problem.
To obtain a clearer picture of the disease burden related to water, more emphasis
needs to be placed on data collection throughout the Region. At present, there is
no systematic reporting of water-related diseases within the European Region, and
available data collected at the national level may not be compatible. The
development of a systematic, homogeneous surveillance mechanism is urgently
needed, and work has begun under the leadership of the WHO collaborating
centre for health-promoting water management and risk communication in Bonn,
Germany.
In light of the above, WHO will continue its strong involvement in normative
work such as: guidelines for evidence-based surveillance and early-warning systems
for water-related diseases; guidelines for drinking-water and recreational water
quality, especially with regard to new and emerging diseases; and re-use of water in
water-scarce areas. Work will also address the health aspects of active resource
76057 May2002-v2 20/08/02 17:24 Side 97
98
(groundwater) management. The Protocol on Water and Health72 being
implemented by Member States will contribute to reducing the burden of water-
related diseases in Europe. Signed by 36 countries, the Protocol is expected to enter
into force by the end of 2003 when at least 16 countries have ratified it.
Housing The housing environment is one of the main settings that affect human health.
The quality of housing plays a decisive role in the health status of the residents,
directly or indirectly. In the CCEE and NIS, around 50–60% of the housing stock
consists of panel block buildings constructed between the 1960s and the 1980s to
supply housing in rapidly growing cities. It is estimated that up to 50% of the
populations in these countries inhabit such prefabricated buildings, with around
60% of newly constructed buildings in large housing estates built according to a
fixed construction pattern.
The poor living conditions in these buildings, caused by outdated construction
methods and a lack of maintenance, pose major problems in many countries and
also represent an unevaluated health risk. The need for modernization of the
housing in these countries was identified long ago, but the privatization of the
housing sector that accompanied transition only made matters worse. The
combination of high private ownership rates, a lack of coordination and
governance, and increasing poverty has turned out to be a major obstacle to basic
maintenance. The CCEE and the Baltic countries have the highest rates of
privatization in Europe (an average 70% compared with 61% in the EU), the
highest increase in housing costs in relation to total household income, and a
decrease in construction rates by 70% since 1990.
There are currently almost no policies by which housing investment is “indexed” to
health gain. In addition, there are significant gaps in knowledge in the area of
housing and health: (a) only few countries carry out regular studies or have a
surveillance system; (b) research has not focused on integrated approaches that deal
with housing and health in a holistic way; (c) the main problem with such research
is the lack of acceptable approaches for risk assessment; and (d) in the field of
72 http://www.unece.org/env/water/text/wh_protocol/text12toc.htm, accessed 16 May 2002.
76057 May2002-v2 20/08/02 17:24 Side 98
99
housing, the “economic” and “engineering” issues, rather than the health aspects,
have prevailed in the decision-making process.
The Regional Office is working on a project on housing and health in
prefabricated panel block buildings in the CCEE, to identify the main issues from
the viewpoint of health and to recommend ways of integrating health aspects into
plans for renovating these buildings.
WorkThe impact of work on health is difficult to assess. Member States operate different
occupational health systems and maintain different lists of occupational diseases.
The reported incidence of occupational diseases varies considerably (for example,
from 0.02 to 1.7 cases per 1000 employees per year in EU countries). These rates
reflect more the legislative requirements and enforcement, and the efficiency of
detection, registration and compensation systems, than the true incidence of
occupational diseases. The severe under-registration of occupational diseases and
accidents leads to underestimation of their real impact on health and
socioeconomic development. In general, occupational accidents are notified much
better than occupational diseases, and their rate is much higher (in EU countries
from 13 to 73 cases per 1000 employees per year). Taking the WHO European
Region workforce to be 400 million people, and the incidence of accidents at work
and the related mortality to be the levels reported in EU countries, the total annual
number of accidents at work in Europe would be in the range of 5.2–29.2 million
per year, and they would cause the death of between 6400 and 55 600 people
every year.
Large numbers of people perceive that work has a strong impact on their health
and wellbeing. In a survey on working conditions in the EU in 2000, 60% of
employed or self-employed people in representative samples considered that work
negatively affected their health (compared to 57% in 1995). Most often, employees
associated with work such symptoms as backache (33%), stress (28%), general
fatigue (23%), muscular pains in the neck and shoulders (23%) or arms and legs
(17%), and headache (13%). Around 9% of workers claimed to have been absent
from work for work-related health reasons during the previous 12 months. Almost
one in ten workers in the EU reported being subject to intimidation at work in
2000, with wide variations between countries. There is a great disparity between
76057 May2002-v2 20/08/02 17:24 Side 99
100
countries (ranging from 1% to 5%) in the percentages of employees reporting
physical violence at work.
The prevention of work-related ill health is not only a legal and moral obligation
but also an important contributor to socioeconomic development. According to
The European Agency for Safety and Health at Work, the costs of work-related
illness range from 2.6% to 3.8% of GNP. Depending on the country, various
elements of costs are taken into account: costs of sick leave and invalidity (€4.8
billion in the Netherlands in 1995), health care costs (€0.6 billion in the
Netherlands in 1995), loss of production due to unfitness for work (€45 billion in
Germany in 1995) and compensation for victims and their families (€6.3 billion
in the United Kingdom). The total costs of accidents and occupational illnesses to
the public purse in Italy in 1996 amounted to €28 billion. Owing to differences
in calculation methods, comparisons between different countries are currently not
possible.
Diseases related to work and the workplace that do not fall into the category of
occupational diseases are increasingly recognized as major public health problems
in many Member States. The work-related diseases also comprise all non-
occupational diseases to whose etiology work contributes, such as musculoskeletal
and mental disorders, cardiovascular and respiratory diseases and cancer. A
significant proportion of cardiovascular diseases is related to working conditions.
There has been a very strong trend since 1997 in Europe to expand the concept of
occupational health from “prevention of occupational diseases and accidents” to
“overall protection and promotion of health at work”. Comprehensive workplace
health impact assessment is expected to include the influence of occupational,
environmental, lifestyle and social determinants of health. This broad approach to
health protection and promotion at work, aimed at maintenance of health and
working ability, is being implemented by a growing number of occupational health
services, enterprises and municipalities, mostly in the EU and accession countries.
ILO Convention No. 161 and Framework Directive EEC/89/391 stimulated the
development of occupational health services in Europe, but still half of EU workers
do not have access to occupational health services, and access to such services in
many countries in the Region is unknown. All countries have a need to educate
and train competent professionals to ensure adequate provision of multidisciplinary
76057 May2002-v2 20/08/02 17:24 Side 100
101
occupational health services. Evidence from 13 countries indicates that
occupational health and safety services can effectively contribute to improving the
employability of workers by supporting the redesign of workplaces, the
maintenance of a healthy and safe work environment, training and education, the
assessment of work demands and functional capacity, medical diagnosis,
rehabilitation and health screening.
Transport Transport policy has a significant impact on health and wellbeing, both positive
and negative. Health gains can include increased opportunities for physical activity
through safe walking and cycling, as well as greater access to jobs, education, health
care and recreation, while health losses can include more sedentary lifestyles, higher
accident rates, more air pollution and noise, and separation of communities.
Vulnerable groups, such as the economically disadvantaged, the elderly and
children, tend to be the most severely adversely affected.
There is a need to further develop and implement methodologies (such as health
impact assessment and evaluation of external costs) and institutional mechanisms
to tackle transport-related issues. An integrated, multisectoral approach involving
all relevant authorities and stakeholders needs to be employed, and more attention
needs to be paid to health considerations in decisions on transport and land use.
Positive and negative transport-related health effects
Brisk walking or cycling for 30 minutes on most days of the week can halve the risk of developingheart disease, diabetes and obesity, and reduce by one third the risk of developing hypertension.
A recent study estimated that some 21 000 deaths per year in Austria, France and Switzerlandcould be attributed to air pollution from traffic, i.e. more than twice the deaths from trafficaccidents in those countries.
Around 65% (450 million) of the people in the European Region are exposed to noise levelsleading to serious annoyance, interference with speech and disturbance of sleep. Noise can alsointerfere with mental activities requiring attention, memory and the ability to deal with complexanalytical problems. Emerging evidence shows an association between high levels of noise andhypertension and ischaemic heart disease.
Traffic accidents still cause some 120 000 deaths and 2.5 million injuries a year in the EuropeanRegion. A third of the reported deaths and serious injuries involve people under 25 years of age.
76057 May2002-v2 20/08/02 17:24 Side 101
102
Towards this goal, the Charter on Transport, Environment and Health73 adopted
at the Third Ministerial Conference on Environment and Health in 1999 outlines
a plan of action and health targets. In 2002, European Member States will decide
whether to negotiate a regional framework convention on transport, environment
and health as a means of addressing the identified gaps in policy.
Ionizing radiationExposure to natural radioactivity can be quite significant in terms of health burden
in some populations. For example, radon in the domestic environment can give
rise to annual doses that exceed the International Commission on Radiological
Protection (ICRP) dose limit for occupational exposure. A small proportion of the
population in countries such as Finland, Sweden and the United Kingdom receive
considerably higher than average doses.
Few releases of ionizing radiation have been reported as a result of accidents at
nuclear power plants or the testing and disposal of weapons. Increases in leukaemia
have been attributed to the Kystym accident in the Russian Federation, and 1800
cases of thyroid cancer to the Chernobyl accident in 1986. Exposure to sources of
ionizing radiation is often associated with a psychosocial effect. In addition to the
induced thyroid cancer, the Chernobyl accident has had significant health
consequences in terms of its psychosocial effects.
In general, Member States follow the recommendations of the ICRP and take
measures to limit exposure to internationally agreed levels where these are available.
At present , however, there are no agreed levels for some exposures. WHO’s global
strategy is to clarify the situation regarding protection of the public from radiation
from these sources. While the prevention of accidents must be the primary
objective for the future, preparedness for accidents is also of great importance.
Global environmental changes Climate change is defined as a statistically significant variation in either the mean
state of the climate or in its variability, persisting for an extended period (typically
decades or longer).74 Most of Europe has experienced an increase in surface air
73 http://www.euro.who.int/eprise/main/who/progs/trt/MainActs/20020321_1, accessed 16 May 2002.74 Intergovernmental Panel on Climate Change (http://www.ipcc.ch, accessed 29 May 2002).
76057 May2002-v2 20/08/02 17:24 Side 102
103
temperatures of around 0.8 °C during the 20th century. In semi-arid Asia,
temperature rises of about 1.3 °C since 1894 have been reported. The impact of
climate change on human health might range from a reduced mortality from
cardiovascular diseases in the winter to an increased risk of coastal and river
flooding (the estimated population in Europe at risk of coastal flooding in 2020 is
around 35 000). Further research is needed to assess the potential burden
attributable to infectious diseases, drought, population displacement, increased
pollution and effects on agriculture. In adopting the London Declaration75 in June
1999, Member States committed themselves to take action towards alleviating
human health effects due to climate change.
Emissions of carbon dioxide are paralleled by emission of other air pollutants,
causing a broad range of health damage including asthma, respiratory infections,
reduced lung function and premature death. The United Nations Framework
Convention on Climate Change and the Kyoto Protocol are the legally binding
instruments developed to reduce emissions from fossil fuel, with potential short-
term benefits for human health. It is assumed that air pollution effects could be
lowered by adopting measures to lower transport, energy, industrial and
agricultural emissions, but there is still a need to develop integrated health impact
assessment of such measures.
Stratospheric ozone protects the earth’s surface from damaging ultraviolet radiation.
Ozone is produced in the upper stratosphere by short-wave sunlight, which
together with chemical reactions dissociates the ozone again to create a dynamic
balance between production and loss. Emissions of inert compounds containing
chlorine and bromine affect this balance. It is estimated that a 10% decrease in
stratospheric ozone would cause 300 000 cases of non-melanoma skin cancer and
4500 cases of melanoma per year worldwide. Average annual changes in the
incidence of non-melanoma skin cancer by type of tumour range from 1% to 6%.
For squamous cell carcinoma and basal cell carcinoma there is an estimated
increase of 2.0 ± 0.5% for each 1% decrease in stratospheric ozone. Over the last
two decades, it has become clear that exposure to ultraviolet B radiation (UVB)
can impair specific and non-specific immune responses. Several studies have shown
that UVB-induced immunomodulation plays at least a partial role in
75 http://www.ifeh.org/london-declaration.html, accessed 16 May 2002.
76057 May2002-v2 20/08/02 17:24 Side 103
104
76 http://www-esd.worldbank.org/mp, accessed 16 May 2002.77 http://www.unccd.int/convention/menu.php, accessed 16 May 2002.
photocarcinogenesis. The Montreal Protocol76 and its amendment are targeting the
phasing out of ozone depleting substances. Currently the interactions between
climate change and the stratospheric chemical processes might delay ozone
recovery by about 20 years. European Member States are engaged in advocating
behavioural, institutional and policy responses.
Climate change and changes in land use play a significant role in central Asian
republics that are subject to drought and desertification, affecting food production.
Climate change may affect this through the balance of the (broadly negative)
effects of changes in temperature and precipitation, and the (broadly positive)
effects of higher carbon dioxide levels on yields of major food crops. The United
Nations Convention to Combat Desertification77 addresses policy measures to
reduce desertification through the implementation of regional plans of action.
BibliographyAir quality guidelines for Europe, 2nd ed. Copenhagen, WHO Regional Office forEurope, 2000 (WHO Regional Publications, European Series, No. 91).
BARTRAM, J. ET AL., ED. Water and health in Europe. Copenhagen, WHO RegionalOffice for Europe, 2002 (WHO Regional Publications, European Series, No. 93).
Charter on Transport, Environment and Health: Third Ministerial Conference onEnvironment and Health, London, 16–18 June 1999. Copenhagen, WHO RegionalOffice for Europe, 1999 (document EUR/ICP/EHCO 02 02 05/9 Rev.4).
DORA, C.A. Different route to health: implications of transport policies. British medicaljournal, 318: 1686–1689 (1999).
EUROPEAN COMMISSION. Developing a sustainable transport system(http://europa.eu.int/comm/environment/trans, accessed 30 July 2001).
EUROPEAN COMMISSION. Environment (http://www.europa.eu.int/comm/environment,accessed 30 July 2001).
EUROPEAN COMMISSION. The European and Allied Countries Collaborative Study Groupof CJD (EUROCJD) (http://www.eurocjd.ed.ac.uk, accessed 29 October 2001).
European Environment Agency (http://www.eea.eu.int, accessed 30 July 2001).
External costs of transport (accident, environmental and congestion costs) in western Europe.Zurich, INFRAS and Karlsruhe, IWW, 2000.
76057 May2002-v2 20/08/02 17:24 Side 104

105
Final report. World Water Council’s Second World Water Forum and Ministerial Conference– from vision to action. The Hague, World Water Council, 2000.
Global Environment Facility (http://www.gefweb.org, accessed 30 July 2001).
KRAMER, M.H. ET AL. Waterborne diseases in Europe 1986–96. Journal of the AmericanWater Works Association, 93: 48–53 (2001).
KUNZLI, N. ET AL. Public-health impact of outdoor and traffic-related air pollution: aEuropean assessment. Lancet, 356: 795–801 (2000).
Overview of the environment and health in Europe in the 1990s: Third MinisterialConference on Environment and Health, London, 16–18 June 1999. Copenhagen, WHORegional Office for Europe, 1999 (document EUR/ICP/EHCO 02 02 05/6).
Policies to reduce exposure to environmental tobacco smoke: report on a WHO WorkingGroup. Copenhagen, WHO Regional Office for Europe, 2000 (documentEUR/00/5020495).
REVENGA, C. Watersheds of the world: ecological value and vulnerability. Washington,DC, World Resources Institute, 1998.
WORLD HEALTH ORGANIZATION. Bovine spongiform encephalopathy (BSE) – Fact SheetNo. 113 (http://www.who.int/inf-fs/en/fact113.html, accessed 29 October 2001).
WORLD HEALTH ORGANIZATION. Variant Creutzfeldt-Jakob disease (VCJD) – Fact SheetNo. 180 (http://www.who.int/inf-fs/en/fact180.html, accessed 29 October 2001).
WORLD HEALTH ORGANIZATION. Water and sanitation(http://www.who.int/water_sanitation_health, accessed 30 July 2001).
76057 May2002-v2 20/08/02 17:24 Side 105

76057 May2002-v2 20/08/02 17:25 Side 134
107
Financing
Provision of services
Resource generation
Stewardship
76057 May2002-v2 20/08/02 17:24 Side 107
108
Using the approach proposed in The world health report 2000, health systems are
defined as “comprising all organizations, institutions and resources that are
devoted to producing health actions. A health action is defined as any effort,
whether in personal health care, public health services or through intersectoral
initiatives, whose primary purpose is to improve health”. European countries have
been witnessing with dismay how, contrary to what was originally expected, cost
increases in health care bear a rather complex relationship with both health gains,
as measured by average life expectancy at birth, and citizens’ satisfaction. In spite
of the fact that countries take different approaches towards health system design
and management, improving the performance of health systems is a high priority
in all Member States of the European Region.
The framework for the health systems performance assessment (HSPA), recently
developed by WHO in collaboration with Member States, was used in The world
health report 2000 to analyse and report on the performance of health systems in
all WHO Member States. The methodology is presented briefly in Annex 1. The
release of The world health report 2000 sparked a vigorous debate. While the
approach and the framework were widely acknowledged as a major and courageous
step forward, the process of producing the report and the interpretation of its
findings were not beyond doubt. Because of the importance of the topic and the
interest of Member States, a consultative process to look at the methods and data
sources was put in place. This included a series of regional consultations and
scientific workshops on certain aspects of the methodology. This work was
ongoing at the time of publication.
The HSPA framework identified three social goals to which the health system
contributes, namely (a) to improve population health (level and distribution), (b)
to improve responsiveness (level and distribution) to the legitimate expectations of
the population, and (c) to ensure fairness in financial contributions to health.
Indicators to measure the achievements of countries with respect to these goals
were developed, as well as an overall indicator of efficiency to show how much was
achieved compared to what could have been achieved given the inputs used, as
follows.
• For the level of health attained in a particular population, the framework uses
the summary indicator of healthy life expectancy (HALE). The distribution of
76057 May2002-v2 20/08/02 17:24 Side 108
109
health is an assessment of the fairness of health outcomes within a given
population.
• The level and distribution of responsiveness try to capture actual experiences of
the people in their interaction with the health system to reflect respect for
persons and client orientation, as measured through key informant surveys.
• The level of fairness in financial contributions is assessed using the total
contributions to health of a household as a percentage of its total expenditure.
An index of overall goal attainment was calculated as a weighted sum of country
scores on the five individual indicators. In addition, the health system’s
performance or efficiency in achieving this level of attainment was measured by
relating the actual attainment to the likely possible attainment, given the resources
used to achieve the current level of health.
Although the principles and practice of public health and individual clinical
services are relatively similar in the countries of the WHO European Region,
countries achieve quite different results in terms of health. One of the main reasons
is that health care systems function differently. The analysis of health system
functions is therefore crucial in understanding, beyond input parameters,
differences in organizational features, availability of means, accessibility, incentives
for professionals, service utilization, etc. Health systems mainly perform their
functions in an integrated way, but recently emphasis has been placed on selected
functions, as certain countries want to separate some functions from others. The
HSPA identifies four major functions of a health system:
• funding has to be ensured (financing, including revenue collection, fund
pooling and purchasing);
• services need to be produced (provision of personal and non-personal health
services);
• inputs have to be “created” (resource generation, including human resources,
facilities and others); and
• the health system needs to be governed (stewardship or oversight function).
The following sections analyse the main trends in the European Region, with
reference to these four functions.
76057 May2002-v2 20/08/02 17:24 Side 109

110
Financing “Fair financing” of health systems incorporates the concept of equity in the
distribution of the burden of funding across the population, and that the need to
pay for health care should not impoverish families. In general, contributions to the
funding of the health system should be made according to ability to pay, and
contributions should be made long before use is made of the service. Additional
objectives of health financing policy are to promote equity in access to care and
efficiency in the use of sectoral resources.
Four broad categories of health funding are commonly defined: general tax
revenues; compulsory contributions to social health insurance funds; voluntary
contributions to (usually private) health insurance funds; and direct out-of-pocket
payments by patients to providers. Studies of equity in the financing of health
systems in western Europe have shown that, as the dominant sources of funding,
general tax revenues or social health insurance produce a considerable degree of
equity. The more clearly funds are redistributed from financially solvent to socially
weak population groups, the more equity there is. Forms of insurance that are
based on the principle of risk equivalence (where the size of the premium equates
to the volume of benefits provided) or out-of-pocket payments (to avoid waiting
lists or to pay for services that do not come within the usual range offered by
health systems) tend to contribute to distributional inequities, since they impose a
disproportionate burden on socially weak and financially less solvent groups.
However, all health systems are funded from a mix of at least two of these, and the
consequences for equity depend on the institutions governing the mix. All
European countries are concerned with ensuring high levels of solidarity in
financing health care, with universal access to health services regardless of ability
to pay.
These findings derive from the equitable tax collection systems and the high levels
of tax collection in western Europe, where most countries maintain relatively high
levels of solidarity in the collection and pooling of financial resources. Switzerland
(1996) and France (2000), for instance, have enacted legislation introducing
universal insurance coverage, and this is virtually true also in most other western
European countries. Funding comes from public or mandated private sources, with
a large component of pre-payment and pooling of resources across income and risk
76057 May2002-v2 20/08/02 17:24 Side 110

111
levels. The CCEE and NIS are also committed to solidarity in financing and
universal access. In several of these countries, however, problems with financial
sustainability caused by the economic recession during the 1990s, and limited
technical capacity to collect resources and implement new insurance mechanisms,
have led de facto to considerable reductions in the affordability and accessibility of
health services. Events such as war and civil strive, such as in Yugoslavia and the
Caucasus region, have also adversely affected the ability to generate revenue. As a
result, in a number of countries access to health care services is possible only
through out-of-pocket payment, either formal or informal. In some countries out-
of-pocket payments have become the predominant means of financing, amounting
to 50–80% of total health revenue. The minimum funding through prepaid
sources and the high out-of-pocket payments explain the low scores in attaining
fairness in financial contributions in these countries. In essence, health financing
has become less equitable since the early 1990s in most of the countries in
transition. It should be stressed, however, that countries in such a macroeconomic
environment face much greater challenges in terms of the policy options available.
It is not easy to change the funding of health systems. Turkey, for example, recently
designed an interesting “Personal Health Insurance Scheme” to extend coverage to
those outside formal employment, with state subsidies linked to recipients’
estimated income, but the plan had to be dropped because of the complex
administrative requirements. Macroeconomic circumstances influence the ability of
a country to mobilize resources for health care. Most countries in transition find it
extremely difficult to raise tax revenues to meet health care expenditure needs.
Informal payments are widespread, and the major challenge is how to (re)establish
official payment mechanisms in this context. In some of the CCEE and NIS, the
introduction of insurance suffers from limited technical capacities to collect and
allocate resources. In some cases health insurance was introduced prematurely and
faced financial difficulties linked to structural deficits of sickness funds, an increase
in labour costs, and distortions in priority-setting. It had not been fully realized
that health insurance schemes do not necessarily create new money for health care,
and can introduce a set of complex dynamics that can adversely affect service
delivery. In some cases the deficits of social insurance funds mean that, in practice,
insurance funds have to maintain coverage of the most basic services and do not
have any reserves for covering additional services as a means of increasing their
insurance market share.
76057 May2002-v2 20/08/02 17:24 Side 111
112
In general, for the poorest countries in the Region, important elements of
financing policy include the need to (a) coordinate all sources of funding under a
common policy framework; (b) reduce duplication in the pooling of funds and the
responsibilities for service provision that result from the existence of vertically
integrated health systems associated with each level of the government’s
administrative structure; and (c) address the issues of access to care and financial
protection for the poor through explicit policies backed with clear financial
incentives. In Kyrgyzstan, the Ministry of Health introduced a package of reforms
in two regions in 2001. This includes the pooling of all budget funds at oblast level
into an insurance fund, and the “purchase” of inpatient services according to the
characteristics of each case. A fixed co-payment is charged for each case, with the
level of the co-payment determined by the patient’s insurance or exemption status.
Persons in exempt categories face the lowest co-payment, and in turn the payment
made by the insurance fund is greatest for them. A campaign was launched to
inform the population of both their responsibilities (i.e. what they have to pay)
and their rights (i.e. that they only have to make one payment and that informal
charging will not be tolerated and should be reported to the insurance fund).
The Ministry is currently developing a revised personnel compensation system to
increase salaries, based in part on the revenues raised from the co-payments.
For the richer countries of western Europe, the need to reform is less urgent.
Nevertheless, all countries are, to varying degrees, reforming their systems. Many
of these reforms, particularly where systems are funded through compulsory
contributions to social health insurance funds, seek to introduce aspects of
competition into the funding process without doing harm to the equity levels that
have been achieved. The mode of competition is consumer choice of insurance
fund. Evidence from the countries that have implemented this (Germany, Israel
and the Netherlands) suggests, however, that balancing equity and competition is
not easy. Adjusting the amounts received by competing funds to match their
revenues with the expected health care costs of those enrolled (risk adjustment) is
technically demanding, and the existing formulae for doing so are imperfect.
Competing insurers still have an incentive to select preferred risks, resulting in
inequities across pools. While it is possible to compensate for these with other
methods, the introduction of markets in health care financing is risky.
In a number of European countries there is a trend towards strategic purchasing as
a way of allocating resources to providers to maximize health gain and health
76057 May2002-v2 20/08/02 17:24 Side 112

113
system performance. In national health system countries such as in Italy and the
United Kingdom, this involves separating the provider and purchaser functions. In
some social health insurance countries in Europe, such as Germany and the
Netherlands, insurers aim to move away from reimbursing services towards more
proactive purchasing services and selecting providers according to cost–effectiveness
criteria. Contracting mechanisms and performance-related payment systems have
become a means for purchasers to influence provider behaviour. For instance, in
some CCEE such as Bulgaria, Estonia and Hungary, the development of
contracting is incorporated into national health policy documents as an instrument
for achieving health policy objectives and thereby increasing health systems
performance. With regard to paying providers, many countries are moving towards
mixed payment systems, with prospective and retrospective components linked to
performance.
Whichever reform strategy is chosen, it is essential that countries include explicit
mechanisms to ensure access to needed care for the poor and protection for all
against financial impoverishment. In addition, the socioeconomic differences in the
health status of vulnerable groups should be taken into account. One way to
account for this is to exempt persons in defined population groups (based on
disease or socioeconomic characteristics) from cost-sharing obligations. Another
way is to subsidize the participation of the non-working or self-employed
population in social health insurance schemes. In Switzerland, the government
subsidizes the participation of those with a low income in private health insurance.
The ability to implement effectively such targeting measures depends on the
administrative capacity of the government.
As most health systems are funded from a mix of sources, evaluating a system on
this basis is difficult. Countries should explore the possibility of separating
decisions on the allocation of funds from those on the source of funds. The source
of funds need not determine the organizational structure of the sector, the
mechanisms by which resources are allocated, or the precision with which
entitlement to benefits is specified. These concepts are particularly important for
the poorer countries in the Region, which must devise ways of coordinating
multiple sources of funds in a situation where resources are constrained. When
considering changes to their systems of health funding, policy-makers should
consider the theoretical advantages of new approaches vis-à-vis the empirical
evidence on the effects of different financing reforms.
76057 May2002-v2 20/08/02 17:24 Side 113
114
Among the main products delivered by WHO are periodic reviews of current
health financing policy issues, specifically through the work of the European
Observatory on Health Care Systems. These reviews have been very useful to
policy-makers throughout the Region, in particular the 1997 book European health
care reform: analysis of current strategies.78 WHO can support informed exchange of
experiences between countries of the Region to keep countries focused on the goals
of health policy rather than the means, and ensure that lessons from one country
are not transferred inappropriately to another without due consideration of the
context in which reforms are implemented. The main challenge is to help the
countries in which public finance has collapsed to varying degrees. In countries
without much prospect of renewed public funding in the near future, the challenge
is to build “bottom-up” risk pooling through community-based prepayment
schemes, with the view that these could eventually be amalgamated into an
appropriate national scheme. In those CCEE and NIS where the decline in public
funding has been severe but not as extreme, such as in the Caucasus, the need is to
make various sources of public and private funding complementary. In particular,
where countries have introduced social health insurance schemes, it is essential that
these do not develop into separate, parallel health systems but are coordinated with
those funded by the Ministry of Health.
Provision of services European countries have adopted a series of strategies to increase cost–effectiveness
in health service provision. These include establishing basic packages of care;
decentralizing provider management; introducing market mechanisms;
restructuring hospital services with an increased role for substitution between
different levels of care; strengthening primary health care services; increasing
patient choice and participation in health services; and improving outcomes
through technology assessment and quality development initiatives. There are a
number of institutional and functional changes aimed at increasing the quality and
responsiveness of service provision, such as clinical guidelines and protocols, peer
review systems, performance and quality indicators, and other information
instruments. Specific examples include the introduction of performance indicators
78 SALTMAN, R.B. & FIGUERAS, J. European health care reform: analysis of current strategies. Copenhagen, WHORegional Office for Europe, 1997 (WHO Regional Publications, European Series, No. 72).
76057 May2002-v2 20/08/02 17:24 Side 114
115
in Italy and the United Kingdom; the promotion of quality circles in several
European countries; the development and implementation of clinical guidelines in
the United Kingdom; and the incorporation of health targets and quality
indicators into contracts in several Spanish regions.
Whereas it does fulfil its promise to ensure better responsiveness, decentralization
sometimes makes the redressing of geographical imbalances more complex and
introduces obstacles to service integration across jurisdictions. In some cases,
decentralization has proved difficult to balance with equity and efficiency. In
Belarus, for instance, the impact of national policies was dramatically weakened by
the devolution to district executive committees of the right to appoint and dismiss
the top management of local providers. Worse, management skills are in limited
supply and are often concentrated in the better-off regions.
Primary care There is considerable agreement among national policy-makers across Europe that,
in principle, primary care should be the lynchpin of a well designed and
performance-focused health care system. A series of reform strategies are being put
in place to increase the performance of primary care. A number of organizational
reforms are giving primary care more power and control over other levels of care.
These reforms typically involve giving primary care professionals (general
practitioners and nurses) and/or institutions (such as health centres or primary care
boards) new levers by which to steer patient treatment, either in hospital or in
nursing-home or home-care settings, thereby leading to better integration of the
different health service delivery sectors. During the 1990s, more active levers were
introduced that gave primary care varying degrees of direct authority over not only
the volume but also the cost and quality of hospital care, and also certain other
primary health care services such as nursing-home and home care.
Among these innovations have been various types of purchasing and contracting as
well as – in several Nordic counties – giving primary care districts authority over
hospitals. A prominent example of these new levers was the introduction of general
practitioner fund-holding schemes in the United Kingdom in 1991, which
devolved certain purchasing powers to the primary care level. This scheme was
superseded in 1999 by the introduction of primary care groups and primary care
trusts, which took responsibility for purchasing. Other experiments, involving the
76057 May2002-v2 20/08/02 17:24 Side 115
116
creation of independent purchasing agencies within which primary care
professionals were given varying degrees of power, developed in the 1990s in
Germany, Italy and Sweden. In Finland, municipally appointed primary care and
social service boards have gained increasing control over hospital funds. There are
also organizational reforms that expand the range of services and/or the functions
of primary care. These reforms expand the duties of primary care professionals to
include new or enhanced services, or services previously delivered by other levels of
care.
Many reforms also focus on the interface between primary care, hospitals and other
forms of care, both to ease access to the hospital and to divert people to more
appropriate services. The rigid division between levels of health care and between
health and social care is becoming blurred, calling for the sharing of a common
goal and adapting service management. Best practice includes strategies for
improving the coordination of care, shifting organizational and care boundaries,
and bypassing or substituting for hospital or inpatient care. As the functions and
services of hospitals change, successful policies often involve adopting a
combination of these strategies.
Advances involving telecommunications and computer technologies in the
provision of clinical services deserve special mention. Interventions and tools
(electronic patient records, monitoring patients at home, laser and robotic surgery,
etc.) unimaginable a generation ago are becoming routine and might well change
the structure of health systems. Telematics is being used as a tool to improve
accessibility, reduce cost and improve quality. Finland and Norway have adopted a
national telemedicine policy, and are investing heavily in infrastructure and in
training health care personnel. Other countries are introducing telemedicine on a
smaller scale, as a tool for clinical consultation and training (for example, feasibility
studies for implementing some sort of telemedicine have been carried out in
Georgia and Kyrgyzstan).
HospitalsHealth system reforms are increasingly focusing on the role of hospitals,
restructuring hospital services, and decentralizing hospital management while
increasing integration within the health system and adopting strategies to improve
performance. Trends in hospital capacity and utilization show marked changes
76057 May2002-v2 20/08/02 17:24 Side 116
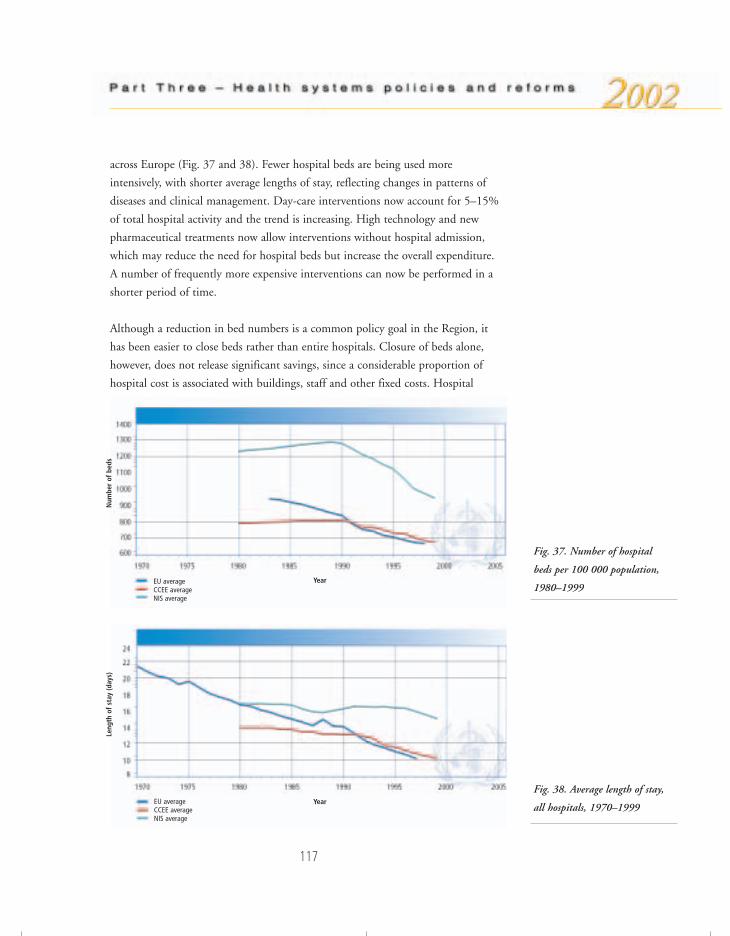
117
across Europe (Fig. 37 and 38). Fewer hospital beds are being used more
intensively, with shorter average lengths of stay, reflecting changes in patterns of
diseases and clinical management. Day-care interventions now account for 5–15%
of total hospital activity and the trend is increasing. High technology and new
pharmaceutical treatments now allow interventions without hospital admission,
which may reduce the need for hospital beds but increase the overall expenditure.
A number of frequently more expensive interventions can now be performed in a
shorter period of time.
Although a reduction in bed numbers is a common policy goal in the Region, it
has been easier to close beds rather than entire hospitals. Closure of beds alone,
however, does not release significant savings, since a considerable proportion of
hospital cost is associated with buildings, staff and other fixed costs. Hospital
Fig. 37. Number of hospital
beds per 100 000 population,
1980–1999
Fig. 38. Average length of stay,
all hospitals, 1970–1999
EU averageCCEE average NIS average
EU averageCCEE average NIS average
Year
Num
ber
of b
eds
Year
Leng
th o
f st
ay (d
ays)
76057 May2002-v2 20/08/02 17:25 Side 117

118
closures and mergers have been more successful where several hospitals have been
grouped under one management structure, as in Ireland and the United Kingdom.
Changes in the structure of hospitals usually require the expansion of ambulatory
care and the construction of new facilities, since hospital reform is often faced with
many large but obsolete buildings. Countries that have overhauled their hospital
systems, such as France, Norway, Spain and the United Kingdom, have done so
partly by mobilizing investment.
In many countries the introduction of the purchaser–provider split has triggered
reforms aimed at hospital decentralization. In national health service countries
these have taken the form of self-governing hospitals or public trusts. Many such
countries are engaged in a debate about the nature of these autonomous hospitals,
including aspects such as legal status, decision rights, market exposure, ownership
and accountability. There has also been an increase in private-sector provision,
competing on an equal basis with public-sector hospitals. Hospital decentralization
is also taking place in the CEE and NIS but less so in the social health insurance
countries of western Europe, where traditionally there is a separation of functions
with a large part of hospital services being provided by the private (mostly non-
profit) sector.
A number of reform strategies are aimed at improving performance within the
hospital structure. These include incentives for optimizing clinical performance,
changes in payment mechanisms, and changes in the organizational environment.
There is growing evidence that the performance of clinical practice in hospitals in
many countries is sub-optimal. The strategies used to address this problem include
clinical quality assurance and clinical audit, the assessment of services performance
against a set of clinical indicators, and the new concept of clinical governance in
which quality is a shared managerial and clinical responsibility. A second main
approach to improving the quality of care is the use of financial incentives through
new methods for paying hospitals; for instance, as noted above, some eastern
European countries are moving away from input-based funding, such as line-item
historical budgets, to more performance-oriented approaches. A combination of
case-mix adjustment and global budgeting is now applied in many western
European countries. A third main approach to improving the quality of care has
emerged from research on the relationship between organizational culture and
quality of care.
76057 May2002-v2 20/08/02 17:25 Side 118
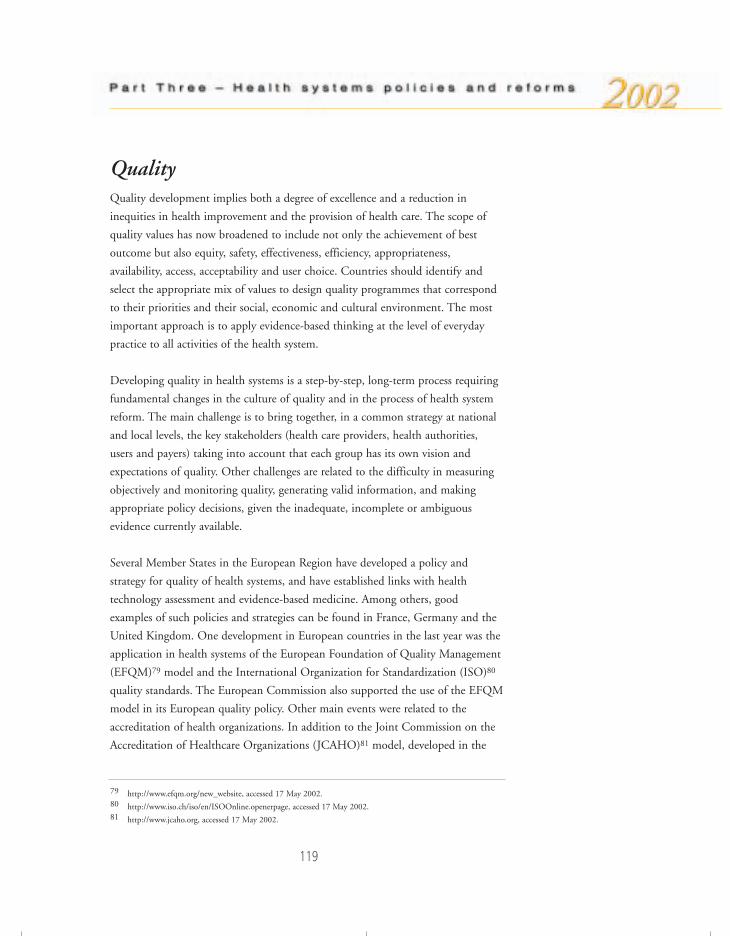
119
Quality Quality development implies both a degree of excellence and a reduction in
inequities in health improvement and the provision of health care. The scope of
quality values has now broadened to include not only the achievement of best
outcome but also equity, safety, effectiveness, efficiency, appropriateness,
availability, access, acceptability and user choice. Countries should identify and
select the appropriate mix of values to design quality programmes that correspond
to their priorities and their social, economic and cultural environment. The most
important approach is to apply evidence-based thinking at the level of everyday
practice to all activities of the health system.
Developing quality in health systems is a step-by-step, long-term process requiring
fundamental changes in the culture of quality and in the process of health system
reform. The main challenge is to bring together, in a common strategy at national
and local levels, the key stakeholders (health care providers, health authorities,
users and payers) taking into account that each group has its own vision and
expectations of quality. Other challenges are related to the difficulty in measuring
objectively and monitoring quality, generating valid information, and making
appropriate policy decisions, given the inadequate, incomplete or ambiguous
evidence currently available.
Several Member States in the European Region have developed a policy and
strategy for quality of health systems, and have established links with health
technology assessment and evidence-based medicine. Among others, good
examples of such policies and strategies can be found in France, Germany and the
United Kingdom. One development in European countries in the last year was the
application in health systems of the European Foundation of Quality Management
(EFQM)79 model and the International Organization for Standardization (ISO)80
quality standards. The European Commission also supported the use of the EFQM
model in its European quality policy. Other main events were related to the
accreditation of health organizations. In addition to the Joint Commission on the
Accreditation of Healthcare Organizations (JCAHO)81 model, developed in the
79 http://www.efqm.org/new_website, accessed 17 May 2002.80 http://www.iso.ch/iso/en/ISOOnline.openerpage, accessed 17 May 2002.81 http://www.jcaho.org, accessed 17 May 2002.
76057 May2002-v2 20/08/02 17:25 Side 119
120
United States, some countries have created their own accreditation tools, as for
instance the King’s Fund model82 in the United Kingdom. Recently, the ALPHA
(Agenda for Leadership in Programs for Healthcare Accreditation) Group83 within
the International Society for Quality (ISQua) brought the different accreditation
models together. Progress was made also in the CCEE, where several initiatives
have been undertaken in the field of institutionalizing quality.
Health technology assessment (HTA), which (broadly defined) is the analysis of
health technology for the purpose of assisting policy-making, began to spread in
Europe in the early 1970s. By 1992, all countries in western Europe had national
and in some cases regional public programmes in HTA, and some eastern
European countries were beginning to become active in the field as well. These
developments led to increasing international collaboration in Europe, so that in
1993 the International Network of Agencies for Health Technology Assessment
(INAHTA) was formed, whose main purpose is fostering communicating and
coordination between HTA agencies. In 2002, INAHTA had almost 40 members,
mainly in Europe. The European Collaboration for Health Technology Assessment
(ECHTA) developed from a need to coordinate activities in Europe, and by 2002
involved the national agencies of all EU member states as well as other countries in
Europe, including Norway and Switzerland. These efforts have revealed the need to
improve communication and information interchange/collaboration in different
areas (methodology, training, research, coverage, evidence for decision-making,
etc.). ECHTA is currently searching for funding to establish a permanent
coordinating activity.
When it was established, the Regional Office programme for quality of care and
health technology assessment focused on measuring and comparing clinical
outcomes. The programme has now developed a broader scope that considers all
components of health systems. This encompasses, in addition to care provision,
other components such as service organizations, finance, technical performance,
clinical practice, clinical training, patient satisfaction, safety and health protection,
and information systems. The Regional Office is creating a framework for quality
development policy based on best practice and “model cases” in countries, and
collecting evidence for ongoing research into quality development. Links are
82 http://194.66.253.160/eKingsFund/html/health_advocacy_prog.html, accessed 17 May 2002.83 http://www.isqua.org.au/isquaPages/Alpha/ALPHAProcess.pdf, accessed 17 May 2002.
76057 May2002-v2 20/08/02 17:25 Side 120
121
strengthened with other quality initiatives in the Region, such as the European co-
operation for Accreditation, the European Organization for Quality and the
European Society for Quality in Healthcare, as well as with international
organizations such as ISQua and the International Society of Technology
Assessment in Health Care.
In relation to service provision in more general terms, the Regional Office seeks to
identify the best practices and develop tools for evaluating the impact of
management and organization on the health of the population and the cost of
services. Facilitating information and developing tools and guidelines for evidence-
based management are the key objectives of this programme area, because many of
the strategies applied in the countries are based on beliefs more than on evidence.
The Regional Office runs several projects focusing on the main challenges and
problems, and an Internet-based database is being established for each of them.
Resource generationProviding health services involves putting together a considerable number of
resources, principally human resources, physical capital and consumables.
Investment decisions and balancing the mix of these resources are critical to the
performance of the health system. There are substantial differences in the levels of
provision of resources between countries of the European Region, revealing the
existing uncertainty as to what constitutes the more cost-effective mix of health
system resources (which in turn is reflected in a high degree of variation in medical
practice between and within countries). Private health expenditure as a percentage
of GDP is shown in Fig. 39.
European Member States differ in the number and mix of beds, human resources
and technology they use (Fig. 40). For instance, the number of doctors in western
Europe ranges from 5.5 per 1000 population in Italy to 1.5 per 1000 in the
United Kingdom, almost a four-fold difference. Similarly, the number of hospital
beds varies from around 10 per 1000 population in France and Germany to 4 per
1000 in Portugal, Spain and the United Kingdom. These differences increase when
we include eastern Europe. For instance, the average number of beds in the NIS is
14 per 1000 population. This higher number of beds, however, does not
76057 May2002-v2 20/08/02 17:25 Side 121
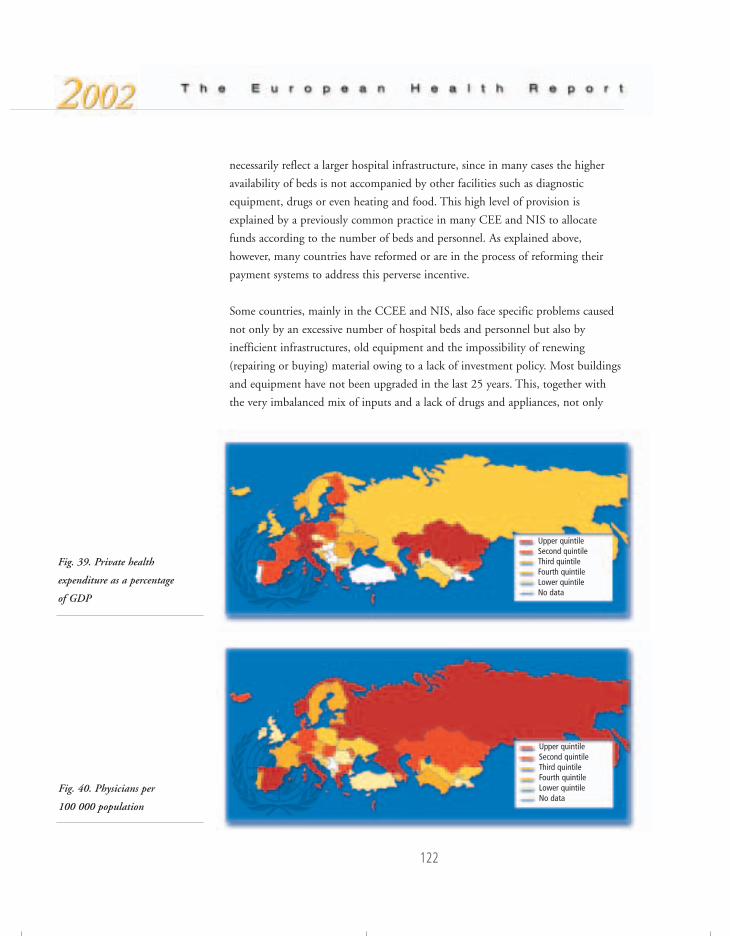
122
Fig. 39. Private health
expenditure as a percentage
of GDP
necessarily reflect a larger hospital infrastructure, since in many cases the higher
availability of beds is not accompanied by other facilities such as diagnostic
equipment, drugs or even heating and food. This high level of provision is
explained by a previously common practice in many CEE and NIS to allocate
funds according to the number of beds and personnel. As explained above,
however, many countries have reformed or are in the process of reforming their
payment systems to address this perverse incentive.
Some countries, mainly in the CCEE and NIS, also face specific problems caused
not only by an excessive number of hospital beds and personnel but also by
inefficient infrastructures, old equipment and the impossibility of renewing
(repairing or buying) material owing to a lack of investment policy. Most buildings
and equipment have not been upgraded in the last 25 years. This, together with
the very imbalanced mix of inputs and a lack of drugs and appliances, not only
Fig. 40. Physicians per
100 000 population
Upper quintileSecond quintileThird quintileFourth quintileLower quintileNo data
Upper quintileSecond quintileThird quintileFourth quintileLower quintileNo data
76057 May2002-v2 20/08/02 17:25 Side 122

123
erodes quality of care but also contributes to low motivation and morale among
health personnel.
Overall, there is a trend towards convergence in the level and composition of
health system resources in the European Region. As noted above, there is a process
of hospital restructuring aimed at closing beds and using the existing infrastructure
more efficiently (in many countries hospital admissions have almost doubled while
length of stay has halved) together with more day care. Other ways of improving
the mix of health system inputs in many European countries are the widespread
adoption of numerus clausus in medical schools and changes in the skill mix of
human resources, with higher priority given to primary care, nursing and public
health professionals.
The main challenge to the further improvement of health systems seems to be in
implementing new ways of working more attuned with the coming “knowledge
society”. A new organizational culture is being formed, in less rigid labour
environments, that values information and understands how it supports all parts of
the organization in improving performance and quality. Flexibility and improved
management of the human capital are key elements for more effective recruitment
and retention strategies. Adapting the education of professionals to these new
considerations is therefore essential for many countries. Reform of medical
education is a top consideration within the EU countries, which are progressing
towards a unified core curriculum in key aspects. Reform has already started in
many of the CCEE, and has received renewed emphasis in Kyrgyzstan and
Tajikistan. The Regional Office is piloting quality indicators in five medical schools
in the Region.
Another way of balancing the mix of health resources is the establishment of
national HTA agencies, in some instances with normative and regulatory power
over the introduction of new technologies. Western Europe is witnessing a
remarkable combination of country- and even region-specific HTA agencies.
PharmaceuticalsPharmaceutical policies in European countries aim at guaranteeing access to
medicines of proven quality, safety and efficacy at a cost that society and the
patient can afford, and to promote the rational use of drugs. Nevertheless, too
76057 May2002-v2 20/08/02 17:25 Side 123
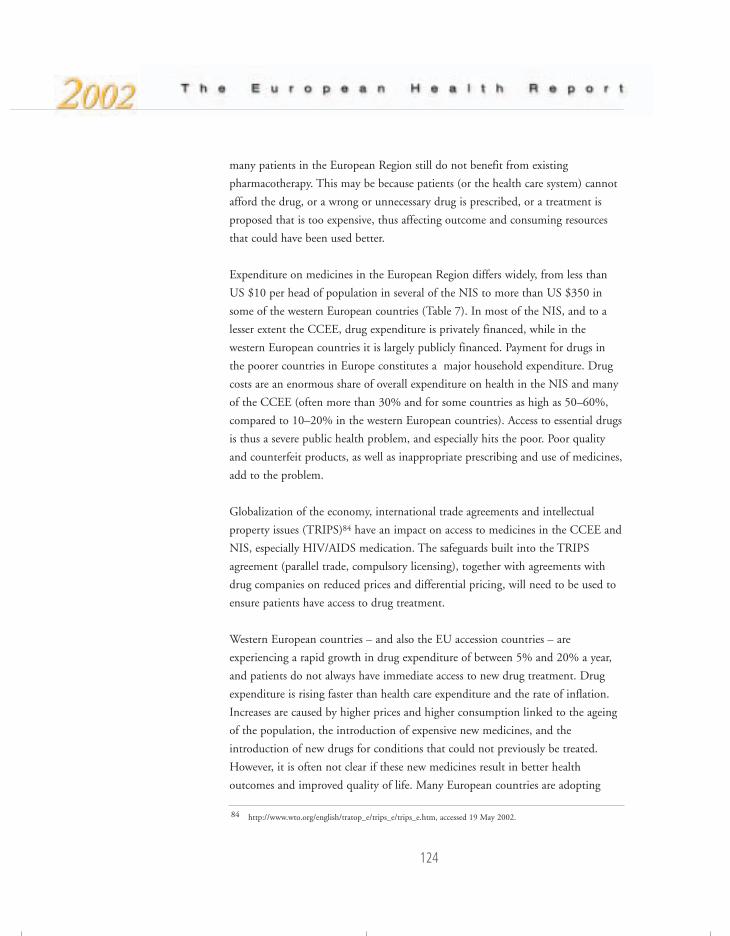
many patients in the European Region still do not benefit from existing
pharmacotherapy. This may be because patients (or the health care system) cannot
afford the drug, or a wrong or unnecessary drug is prescribed, or a treatment is
proposed that is too expensive, thus affecting outcome and consuming resources
that could have been used better.
Expenditure on medicines in the European Region differs widely, from less than
US $10 per head of population in several of the NIS to more than US $350 in
some of the western European countries (Table 7). In most of the NIS, and to a
lesser extent the CCEE, drug expenditure is privately financed, while in the
western European countries it is largely publicly financed. Payment for drugs in
the poorer countries in Europe constitutes a major household expenditure. Drug
costs are an enormous share of overall expenditure on health in the NIS and many
of the CCEE (often more than 30% and for some countries as high as 50–60%,
compared to 10–20% in the western European countries). Access to essential drugs
is thus a severe public health problem, and especially hits the poor. Poor quality
and counterfeit products, as well as inappropriate prescribing and use of medicines,
add to the problem.
Globalization of the economy, international trade agreements and intellectual
property issues (TRIPS)84 have an impact on access to medicines in the CCEE and
NIS, especially HIV/AIDS medication. The safeguards built into the TRIPS
agreement (parallel trade, compulsory licensing), together with agreements with
drug companies on reduced prices and differential pricing, will need to be used to
ensure patients have access to drug treatment.
Western European countries – and also the EU accession countries – are
experiencing a rapid growth in drug expenditure of between 5% and 20% a year,
and patients do not always have immediate access to new drug treatment. Drug
expenditure is rising faster than health care expenditure and the rate of inflation.
Increases are caused by higher prices and higher consumption linked to the ageing
of the population, the introduction of expensive new medicines, and the
introduction of new drugs for conditions that could not previously be treated.
However, it is often not clear if these new medicines result in better health
outcomes and improved quality of life. Many European countries are adopting
124
84 http://www.wto.org/english/tratop_e/trips_e/trips_e.htm, accessed 19 May 2002.
76057 May2002-v2 20/08/02 17:25 Side 124
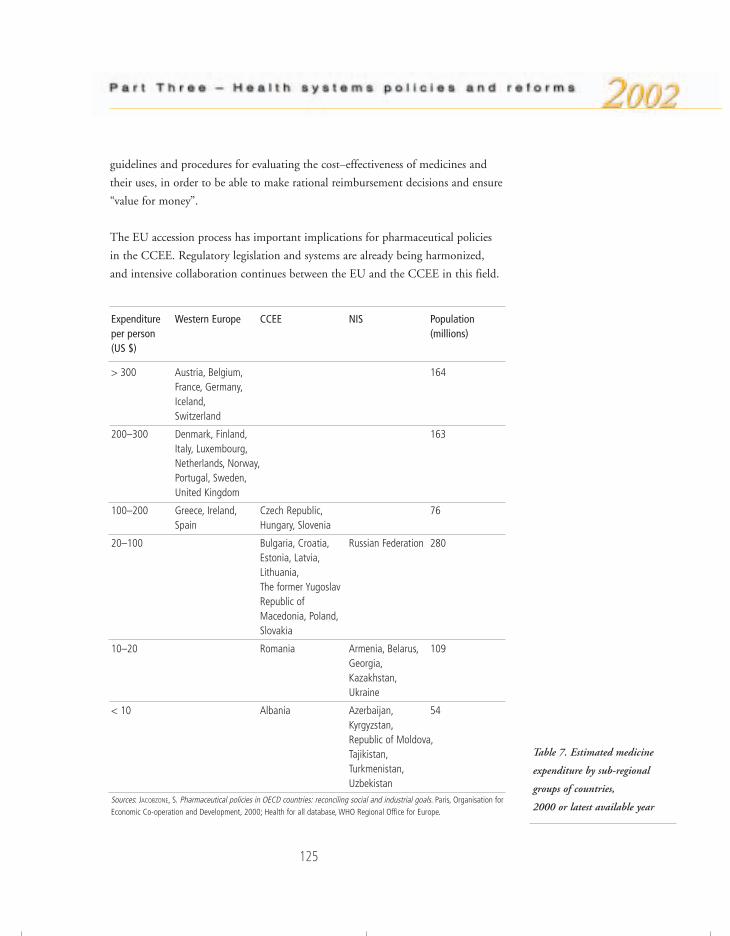
Expenditure Western Europe CCEE NIS Populationper person (millions)(US $)
> 300 Austria, Belgium, 164France, Germany,Iceland,Switzerland
200–300 Denmark, Finland, 163Italy, Luxembourg,Netherlands, Norway,Portugal, Sweden,United Kingdom
100–200 Greece, Ireland, Czech Republic, 76Spain Hungary, Slovenia
20–100 Bulgaria, Croatia, Russian Federation 280Estonia, Latvia,Lithuania,The former Yugoslav Republic of Macedonia, Poland,Slovakia
10–20 Romania Armenia, Belarus, 109Georgia,Kazakhstan,Ukraine
< 10 Albania Azerbaijan, 54 Kyrgyzstan,Republic of Moldova,Tajikistan,Turkmenistan,Uzbekistan
Sources: JACOBZONE, S. Pharmaceutical policies in OECD countries: reconciling social and industrial goals. Paris, Organisation forEconomic Co-operation and Development, 2000; Health for all database, WHO Regional Office for Europe.
125
guidelines and procedures for evaluating the cost–effectiveness of medicines and
their uses, in order to be able to make rational reimbursement decisions and ensure
“value for money”.
The EU accession process has important implications for pharmaceutical policies
in the CCEE. Regulatory legislation and systems are already being harmonized,
and intensive collaboration continues between the EU and the CCEE in this field.
Table 7. Estimated medicine
expenditure by sub-regional
groups of countries,
2000 or latest available year
76057 May2002-v2 20/08/02 17:25 Side 125

There is a growing concern about the provision and financing of pharmaceuticals,
as well as the future of the drug industry in the CCEE. Many of the CCEE already
spend more than 2% of their GDP on drugs. Prescribing habits have been
changing, with a rapid move towards foreign drugs (at western European prices)
without an increase in the drug budget. Policies on generic drugs need to be
actively implemented to counter such trends, while ensuring access to proper drug
treatment for patients in the CCEE.
Most countries in transition are preparing to upgrade the quality of domestically
produced pharmaceuticals to meet international standards and thus ensure more
acceptable levels of quality and safety. Nevertheless, a lack of or inappropriate
regulatory guidance is sometimes detrimental to the smaller producers, while the
larger companies focus on the more profitable products. This may reduce the
availability of low-cost pharmaceuticals, as the alternative is often a more expensive
imported drug. Adequate policy and guidance are required to ensure the successful
transformation of local industries and to stimulate the production of a wide range
of low-cost generic products.
StewardshipThe introduction of market incentives in different sub-sectors of the health system
in European countries has been accompanied by an increase in the volume of
regulation in terms both of new approaches to regulation and of the range of
regulatory tools available. In European countries the need to strengthen the stewardship
role of the state appeared with the introduction of new market mechanisms and
the new balance between the state and market in health systems. Thus, policy-
makers have sought to steer these market incentives to the achievement of social
objectives. For instance, in the field of pharmaceuticals the increase in
entrepreneurial activity has been accompanied by an increase in regulatory efforts
aimed at cost-containment. In parts of the Region, however, regulatory activity has
been clearly insufficient. In the Russian Federation and some CEE countries, for
example, entrepreneurial activity was increased too rapidly and with inadequate
regulation. This has created problems with efficiency and equity, and there are real
concerns about unbridled entrepreneurial freedom. It should be pointed out,
however, that this has been due more to a lack of institutional capacity than to the
particular organizational characteristics of the health system.
126
76057 May2002-v2 20/08/02 17:25 Side 126
127
Evidence shows that what is required is a different and, in many instances, a
strengthened role of the state in its regulatory functions and health policy
leadership. Although stewardship may also involve other agents such as professional
organizations, the health ministry plays the central role in formulating and
implementing health policy. Stewardship is also about health intelligence, coupled
with policy vision and regulatory influence. The political and technical ability to
manage change, to collect and use appropriate information, to regulate the private
sector and to negotiate with the key actors has been crucial to the success or failure
of many health sector reforms in the Region. A good intelligence system combines
information with an understanding of the need to be selective in the information it
generates for policy-makers and users of the health system.
In 1984, the Member States of the WHO European Region adopted the first
common health for all policy for Europe (revised in 1991 and again in 1998).
It was agreed that countries would develop, at national, regional and local levels,
intersectoral policies for health based on the principles of equity in health and
participation in decision-making. By 1990, half of the then Member States had
developed policy documents, but in some instances they were rather vague and
have never been translated into action; they often envisaged unrealistic targets and
did not realistically consider budgetary constraints.
Experience in countries shows that public health policies have reached the political
agenda in very different situations, at different times and in different political and
economic climates. Member States show an increased attention to health
determinants. Finland and the Netherlands have made serious attempts to develop
outcome-oriented policies, and in the United Kingdom the tackling of health
inequalities ranks high on the agenda. Many countries in the Region have now
adopted genuine health policies laying down medium- and long-term objectives
and priorities. In some cases, these policies have been ratified by parliament,
thereby gaining greater legitimacy and continuity. Even countries at lower levels of
economic development, such as Kyrgyzstan, have taken innovative approaches to
integrating health and development, indicating that such an approach can be
useful in different economic and social circumstances.
Owing to the increase in research related to the extent and causes of inequities in
health, the deteriorating health status in the CCEE countries, and the recognition
by organizations such as WHO, the EU and the World Bank of the effect of
76057 May2002-v2 20/08/02 17:25 Side 127
128
poverty on health, the determinants of health (including health systems) have
received greater attention since the mid-1990s. Poverty reduction strategies are
central to the health programme in Georgia. In Lithuania, the strong involvement
of the Parliamentary Health Committee and the National Board of Health in
organizing annual national health policy conferences has greatly facilitated the
process of participatory decision-making and has kept the need for evidence-based
decision-making high on the agenda. Health impact assessment also offers a way of
linking the health sector with other sectors, and countries such as the Netherlands
and Sweden have already gained valuable experience. (In the United Kingdom,
health impact assessment is considered more a consultation process than a tool for
evidence-based decision-making.)
Strong pressures for decentralization and the appearance of new interests groups
have improved the channels of participation in decision-making, including the use
of such modern technologies as the Internet. This has led to improvements in the
information and knowledge base for health policy development, particularly as
related to inequities. There are good examples whereby public health reporting
seems to be influencing the decision-making process. There is an increasing
demand from citizens, and particularly patients, to be involved in decisions
concerning their own health and public health issues – from health policy choices
to the assessment of outcomes. Since 1993, no fewer than 14 European countries
have introduced patients’ charters or laws on patients’ rights. The WHO European
Declaration on the Promotion of Patients’ Rights85 was drawn up in 1994. The
lack of knowledge among health professionals remains in some countries a
significant obstacle to implementing legislation in this domain.
Strengthening health systems in Member States is an identified global priority
for WHO in this biennium and the next, and is reflected in the Regional Office’s
new country strategy.86 The Regional Office aims at helping Member States
understand how they can measure their own performance, identify the factors that
determine performance, and improve their system to better respond to the needs of
their population. The work of the European Observatory on Health Care Systems
is proof of the Office’s effort to produce information and evidence on the links
85 A Declaration on the Promotion of Patients’ Right in Europe. Copenhagen, WHO Regional Office for Europe, 1994(document EUR/ICP/HLE 121).
86 The WHO Regional Office for Europe’s country strategy: “matching services to new needs”. Copenhagen, WHORegional Office for Europe, 2000 (document EUR/RC50/10).
76057 May2002-v2 20/08/02 17:25 Side 128

129
The new Swedish public health policy
In 1997 a National Public Health Committee with a broad parliamentary base was formed. Itsmost important objective was to propose a national strategy and specific goals for public healththat would guide government offices, regional and local public authorities and nongovernmentalorganizations.
At the end of 2000 a green paper was published with proposals for 18 national public healthgoals. The goals were formulated in terms of health determinants and fundamental infrastructuresfor preventive work. A government bill is to be presented to Parliament in 2002. The maindecision of the Committee was to express the goals in terms of determinants of health.
The new policy will make an improved public health a central goal for the entire Swedishgovernment policy. All public authorities at all levels of society will be guided by the goals, whichcover a number of different areas – economic policy, social welfare, the labour market, agriculture,transport and the environment. The main purpose is to achieve a more equal level of public healthwith regard to social class and gender, by influencing all relevant areas of policy and action.
The policy has the following 10 major areas.
1. Improving social security and combating poverty, with the aim of increasing the social capital.It is considered vitally important to avoid large gaps in income.
2. Political power, influence and participation. Democratic rights must exist for all groups insociety, including the socially vulnerable and immigrants. All citizens must be able toparticipate in the political decision-making process.
3. Creating secure and good conditions for children and young people. One way to achieve thisis to improve the economic and social position of families with children. Special support mustbe given to single parents and socially vulnerable families.
4. Healthy workplaces and an improved level of occupational health. Health-related absencefrom work has increased enormously over the last five years.
5. A healthy environment and the provision of safe products. The indoor as well as the outdoorenvironment is important, together with clean air.
6. A health-promoting health service. Improved population health must be an explicit goal forthe health services.
7. Increasing physical activity.
8. Good eating habits and safe food.
9. Reducing tobacco smoking, harmful alcohol consumption and the adverse effects ofgambling. The struggle against narcotics should continue, with the aim of creating a drug-freesociety. The fight against doping in sport should be intensified.
10. Reducing the spread of infectious disease and promoting safe sexual behaviour. This area ofpublic health work focuses on HIV/AIDS and other sexually transmitted infections.
76057 May2002-v2 20/08/02 17:25 Side 129
130
between health policy and health care reforms, and on how health care reforms
affect equity in health. A Health Systems Development Advisory Group and
Expert Panel has been established to help countries develop or improve their health
systems, using a well tested range of tools and methods.
BibliographyAgence nationale d’Accréditation et d’Evaluation en Santé (ANAES) (http://www.anaes.fr,accessed 30 July 2001).
ALTENSTETTER, C. ET AL. Health policy reform, national variations and globalization.Basingstoke, Macmillan, 1997 (Advances in Political Science).
BLANE, D. ET AL. Health and social organization: towards a health policy for the twenty-first century. London, Routledge, 1996.
CHINITZ, D. Balancing competition and solidarity in health care financing, In:Saltman, R.B. et al., ed. Critical challenges for health care reform in Europe. Buckingham,Open University Press, 1998.
CHINITZ, D. ET AL. Governments and health systems: implications of differinginvolvements. Chichester, Wiley, 1998.
DANZON, M. & POITRINAL, P. La santé malade de l’économisme. Le mondediplomatique, 3: 11 (1996).
DONABEDIAN, A. The effectiveness of quality assurance. International journal for qualityin health care, 8: 401–407 (1996).
European Committee for Standardization (http://www.cenorm.be, accessed 30 July 2001).
EUROPEAN FOUNDATION FOR QUALITY MANAGEMENT. EFQM excellence model(http://www.efqm.org, accessed 30 July 2001).
European Monitoring Centre for Drugs and Drug Addiction (EMCDDA)(http://www.emcdda.org, accessed 30 July 2001).
European Observatory on Health Care Systems (http://www.observatory.dk, accessed 26 July 2001).
European Organization for Quality (http://www.eoq.org/start.html, accessed 30 July 2001).
European Society for Quality in Health Care (http://www.esqh.net, accessed 30 July 2001).
76057 May2002-v2 20/08/02 17:25 Side 130
131
FEDERATION FOR INTERNATIONAL COOPERATION OF HEALTH SERVICES AND SYSTEMS
RESEARCH CENTERS (FICOSSER). Proceedings of FICOSSER research, health sectorreform in central and eastern Europe: current trends and priority research. Warsaw,National Centre for Health Systems Management, 1999.
GARCIA-BARBERO, M. Evaluating hospital effectiveness and efficiency. Copenhagen, WHORegional Office for Europe, 2000 (document EUR/ICP/DLVR 03 05 03).
GRIFFITH, B. Competition and containment in health care. International journal ofhealth services, 30: 257–284 (2000).
HAM, C. Health care reform: learning from international experience. Buckingham, OpenUniversity Press, 1997.
HEALTH21. The health for all policy framework for the WHO European Region.Copenhagen, WHO Regional Office for Europe, 1999 (European Health for All Series,No. 6).
HUNTER, D. & BERMAN, P. Public health management – time for a new start?European journal of public health, 7: 345–349 (1997).
International Organization for Standardization (http://www.iso.ch, accessed 30 July 2001).
International Society for Quality in Health Care (ISQUA) (http://www.isqua.org.au,accessed 30 July 2001).
INTERNATIONAL SOCIETY FOR QUALITY IN HEALTH CARE (ISQUA). ALPHA – bringingthe world of healthcare accreditation together(http://www.isqua.org.au/isquaPages/Alpha.html, accessed 20 May 2002).
Joint Commission on Accreditation of Health Care Organizations (http://www.jcaho.org,accessed 30 July 2001).
KALO, I. Development of quality of health systems in Europe. Eurohealth, 6(5):20–22 (2000).
King’s Fund (http://www.kingsfund.org.uk, accessed 30 July 2001).
KUTZIN, J. A descriptive framework for country-level analysis of health care financingarrangements. Health policy, 56: 171–204 (2001).
KUTZIN, J. ET AL. How health insurance affects the delivery of health care in developingcountries. Washington, DC, World Bank, 1992.
LEATHERMAN, S. ET AL. International collaboration: harnessing differences to meetcommon needs in improving quality of care. Quality in health care, 9: 143–144 (2000).
LONDON SCHOOL OF ECONOMICS AND POLITICAL SCIENCE. Health and social care(http://www.lse.ac.uk/Depts/lse_health, accessed 30 July 2001).
LUBITZ, J. & RILEY, G. Trends in Medicare payments in the last year of life. NewEngland journal of medicine, 328: 1092–1096 (1993).
76057 May2002-v2 20/08/02 17:25 Side 131
132
MACKENBACH, N.P. The contribution of medical care to mortality decline: Mckeownrevisited. Journal of clinical epidemiology, 49: 1207–1213 (1996).
MCKEE, M. & HEALY, J., ED. Hospitals in a changing Europe. Buckingham, OpenUniversity Press, 2002.
MCKEE, M. ET AL., ED. Health care in central Asia. Buckingham, Open University Press2002.
MOSSIALOS, E. ET AL., ED. Funding health care: options for Europe. Buckingham, OpenUniversity Press, 2002.
National Institute for Clinical Excellence (http://www.nice.org.uk, accessed 30 July2001).
NEUBERGER, J. The educated patient: new challenges for the medical profession.Journal of internal medicine, 247: 6–10 (2000).
NORMAND, C. Ten popular health economic fallacies. Journal of public health medicine,20: 129–132 (1998).
SALTMAN, R.B. & FERROUSSIER-DAVIS, O. The concept of stewardship in health policy.Bulletin of the World Health Organization, 78: 732–739 (2000).
SALTMAN, R.B. & FIGUERAS, J. European health care reform. Analysis of current strategies.Copenhagen, WHO Regional Office for Europe, 1997 (WHO Regional Publications,European Series, No. 72).
SALTMAN, R.B. EJPH policy forum: risk adjustment strategies in three social healthinsurance countries. European journal of public health, 11: 121 (2001).
SALTMAN, R.B. ET AL. A methodological note on combining health and social careexpenditures into a single statistic for policy-making purposes. European journal ofpublic health, 11: 93–96 (2001).
SALTMAN, R.B. ET AL., ED. Critical challenges for health care reform in Europe.Buckingham, Open University Press, 1998.
SALTMAN, R.B. ET AL., ED. Regulating entrepreneurial behaviour in European health caresystems. Buckingham, Open University Press, 2002.
SAVAS, S.B. MACH: a methodology for analysing contracting in health care. Copenhagen,WHO Regional Office for Europe, 2000 (document EUR/00/5017691).
SCHWARTZ, F.W. ET AL. Fixing health budgets : experience from Europe and NorthAmerica. Chichester, Wiley, 1996.
SHAW, C.D. External quality mechanisms for health care: summary of the ExPeRTproject on visitatie, accreditation, EFQM and ISO assessment in European Unioncountries. External Peer Review Techniques. European Foundation for QualityManagement. International Organization for Standardization. International journal forquality in health care, 12: 169–175 (2000).
76057 May2002-v2 20/08/02 17:25 Side 132
133
SMITH, P. Reforming markets in health care: an economic perspective. Buckingham, OpenUniversity Press, 2000.
Standing Committee of the Hospitals of the European Union (HOPE)(http://www.hope.be, accessed 30 July 2001).
The Ljubljana Charter on Reforming Health Care. Copenhagen, WHO Regional Officefor Europe, 1996 (document EUR/ICP/CARE 9401/CN01).
UNITED NATIONS DEVELOPMENT PROGRAMME. Human development report 2001.Making new technologies work for human development. New York, Oxford UniversityPress, 2001.
VAN DOORSLAER, E. ET AL., ED. Equity in the finance and delivery of health care: aninternational perspective. Oxford, Oxford University Press, 1993.
VIENONEN, M. ET AL. Towards evidence-based health care reform. Bulletin of the WorldHealth Organization, 77: 44–47 (1999).
WAGSTAFF, A. ET AL. Equity in the finance of health care: some further internationalcomparisons. Journal of health economics, 18: 263–290 (1999).
WHO REGIONAL OFFICE FOR EUROPE. The STI Task Force(http://healthdatabases.org/who1, accessed 30 July 2001).
WOODWARD, C.A. Strategies for assisting health workers to modify and improve skills:developing quality health care: a process of change. Geneva, World Health Organization,2000 (document WHO/EIP/OSD/00.1).
WORLD HEALTH ORGANIZATION. Safe Injection Global Network(http://www.injectionsafety.org, accessed 30 July 2001).
76057 May2002-v2 20/08/02 17:25 Side 133

76057 May2002-v2 20/08/02 17:25 Side 134

135
ConclusionAn east–west health divide has opened up within WHO’s European Region, with a
significantly worsening health situation in the east. In some CCEE and NIS,
falling life expectancy and birth rates have contributed to negative population
growth rates. Even within the most affluent countries, unacceptable inequalities in
health status persist among different groups of society. Most of the accumulated
evidence points to the essential role played by the main economic, social,
environmental and institutional determinants of health in the generation and
development of these gaps. What is less clear is the precise quantitative role and
interactions between these various factors, and which links in the causal chain of
events can be broken by public health interventions. In the context of the 1998
World Health Declaration,87 and its commitment to the highest attainable level of
health for all, it is difficult to see such economic and health differentials in
anything other than human rights terms.
Genetic and other personal factors clearly affect individual susceptibility to disease.
There is, however, little indication that these play a substantial role in the
differences in health experience at population level. Individual lifestyle and risk
factors explain only a proportion of the variations in the occurrence of disease.
Rather ample evidence exists that the economic and social environments play a
substantial role at population level. Research relating disease patterns to the
organization of society has demonstrated that differences in health are substantially
a manifestation of economic and social determinants. Evidence from a number of
sources indicates that, in addition to aggregated economic wealth, it is necessary to
pay attention to the relative distribution of wealth. Health is best served in more
socially cohesive societies having a smaller burden of relative deprivation. At least
among developed societies, health is related more to relative than to absolute
income.
Psychosocial stress is increasingly recognized as a factor in a number of conditions,
including hypertension, alcoholic psychosis, neurosis, homicide, suicide, accidental
death, ulcers and cirrhosis of the liver. It is interesting to note that these conditions
all tend to increase in importance in countries undergoing accelerated social and
87 http://www.who.int/archives/hfa/ear7.pdf, accessed 17 May 2002.
76057 May2002-v2 20/08/02 17:25 Side 135
136
economic transitions that are not adequately supported by social policy measures.
If appropriate action is not taken, the widening gap in income distribution in
many countries is likely to increase psychosocial stress in both western and eastern
Europe.
Universal access to effective individual health services is an essential requirement in
advanced societies. Failure of individually focused health services to achieve this
goal will contribute to unnecessary suffering. Although the exact relationships
between health and health care continue to call for research, there is a potential for
health gain in health system development that the European Region cannot afford
to underestimate. As health systems in modern societies grow more diverse and
pluralistic, the key challenge to Member States is to strengthen their capacity to
effectively manage complexity, which includes the capacity to monitor relevant
trends, identify options for change, assess the available evidence, set priorities, draw
up action plans and ensure their implementation, measure outcomes and take
corrective action when needed. There is also scope for the WHO Regional Office
for Europe to provide continuing support to countries in health system
development. This includes systematic reviews of national experiences and advising
on possible processes for health policy formulation, implementation, monitoring
and evaluation; the sharing of information, objectives and priorities; developing a
democratic dialogue and integrated decision-making; setting standards; and
supporting and enhancing the negotiation skills of specific groups.
Improving health requires consideration of the essential relationship and balance
between health and political, social, economic and institutional circumstances, an
integrated view of sustainable development and a holistic approach to public health
policy. Just as health experience has multiple societal determinants, so public health
policy must place responsibility and accountability for health improvement across
all sectors and actors within society. A heightened level of commitment and more
forceful action are needed to deal with the determinants of health. The policies
that are most successful in improving public health are those that deal with
economic growth, human development and health in an integrated way. Income
differentials, health choices, environmental protection and the availability of
education and employment are all variables that are amenable to public policy, and
where changes can lead to improved health and wellbeing for the whole
population. Fiscal and legal measures are powerful regulatory instruments for
76057 May2002-v2 20/08/02 17:25 Side 136

137
tackling the underlying causes of ill health. If such regulations are to be
implemented effectively, all the sectors and institutions concerned within society
must uphold them, and they must, above all, enjoy public support and confidence.
This can be achieved by mobilizing society at large and generating informed
discussion through effective communication.
76057 May2002-v2 20/08/02 17:25 Side 137
138
ANNEX 1
Health systems performanceassessment methodsFor the last few years WHO, in collaboration with its Member States, has
developed a framework for health systems performance assessment (HSPA) with a
view to enhancing the development of national health systems. The world health
report 2000 (WHR2000) provided details of the framework, described indicators
that could be used to measure performance, and reported on an analysis of health
system performance in Member States. The objective was to provide a basis for
building a body of evidence on the relationship between the organization and
outcomes of health systems, so as to provide governments with information for
health policy development.
This annex describes the three components mentioned above and explains the
main methodological issues relevant to them.
A. The HSPA frameworkThe framework includes the boundaries, goals, functions and performance of
health systems.
(i) BoundariesAll resources, organizations and actors that undertake or support health
actions are considered to be part of the health system. A health action is an
action whose primary intent is to promote, protect or improve health.
(ii) GoalsThree intrinsic goals to which the health system contributes are (a) good
health, (b) responsiveness of the health system to people’s non-health
expectations and (c) fairness in financial contributions to health. In
WHR2000, measurements were made of the achievement of countries in
respect of these goals.
76057 May2002-v2 20/08/02 17:25 Side 138
139
(iii) FunctionsThe four main functions are (a) financing (including revenue collection, fund
pooling and purchasing); (b) provision of personal and non-personal health
services; (c) resource generation (including human resources, facilities, etc.)
and (d) the stewardship or oversight function of the health system.
(iv) PerformanceAn index of overall attainment of the goals was calculated as a weighted sum
of country scores on the five individual indicators (see below). In addition,
the efficiency of achieving this level of attainment was measured (called the
performance index). This index measured actual attainment in relation to
“potential” (best possible) attainment given the available health system and
non-health system resources used to produce health.
B. IndicatorsFive indicators were developed to measure the achievement of the health system
goals.
(i) Level of health Up to the end of the millennium, reporting on health status concentrated on
morbidity and mortality statistics and on the incidence and prevalence of
communicable diseases. With the epidemiological transition from communicable
to noncommunicable diseases the measurement of the non-fatal consequences of
diseases, particularly as related to chronic diseases and injuries, has become
increasingly relevant to all Member States.
Based on more than 15 years of work, WHO introduced the concept of “healthy
life expectancy” together with its indicator, disability-adjusted life expectancy
(DALE), a measure of the level of health attained in a particular population. This
has recently been renamed healthy life expectancy (HALE). It is based on life
expectancy at birth but includes an adjustment for time spent in poor health. Life
expectancy at birth is a summary mortality index. Age-specific mortality data can
be obtained from registers of vital statistics, health surveys and sample registration
systems.
76057 May2002-v2 20/08/02 17:25 Side 139
140
The measurement of time spent in poor health depended on standardized results
from cross-sectional surveys using the International Classification of Functioning,
Disability and Health (ICF, previously known as ICIDH-2).
(ii) Distribution of healthTo assess the fairness of the distribution of health outcomes in the population,
WHO proposes that countries measure the distribution of healthy life expectancy
within populations. Since such data are not yet widely available across population
groups, however, data on child survival, which are available at the individual level
for many countries, were used in WHR2000 to measure inequalities in child
survival.
(iii) Level of responsiveness and (iv) distribution of responsivenessEvery health system should aim to respond well and fairly to the legitimate non-
health needs of the population it serves. The indicator of health system
responsiveness is designed to reflect respect for persons and client orientation.
Respect for persons in WHR2000 comprised autonomy, dignity and
confidentiality, while client orientation consisted of prompt attention, quality of
basic amenities, access to social support networks during care, and choice of
provider.
Responsiveness tries to capture the actual experiences of the people and their
interaction with the health system, rather than what they expect from the system.
For WHR2000, surveys of key informants were used to estimate both the level and
distribution of responsiveness.
(v) Fairness in financial contributionsThe fraction of disposable income that each household contributes to the health
system indicates the extent to which resource generation reflects people’s ability to
pay. It was measured as the total contributions of a household to health (out-of-
pocket expenses, taxes, social security payments, etc.) divided by total expenditure
(as a proxy for income) minus subsistence expenditure (taken to be food
expenditure in WHR2000).
Data were drawn from income and expenditure surveys, from tax, social security
and health insurance schedules, and from national health accounts where available.
76057 May2002-v2 20/08/02 17:25 Side 140
141
National health accounts also provide a systematic assessment of the resources put
into the health system from the public and private sectors.
C. Measurement of health system performanceThe performance or efficiency of a health system can be measured by examining
the relationship between the outcomes and the resources used to produce them.
The analysis needs to take into account health system inputs as well as non-health
inputs to the production of health, such as educational attainment. The estimates
made for WHR2000 were based on econometric techniques that have been used
extensively in other sectors of the economy for many years.
Since the publication of WHR2000, a variety of additional data sources have
become available and various methodological modifications have been suggested.
D. Methodological issuesHealthy life expectancy (HALE)To estimate HALE, life expectancy at birth is calculated in the standard way.
Estimates must then be made of the length of time a newborn child can expect to
live in various states of health that are valued less highly than full health. Finally, a
method of valuing this time compared to full health must be developed.
Methods of estimating periods of a lifetime that a person can expect to live in full
health, and in states less than full health, are being continually developed. For
example, household surveys can seek information on the prevalence of different
health states by age and sex, and a WHO multi-country survey study88 is under
way to test possible instruments. People are asked to rate themselves within 6 core
domains identified from an extensive review of the currently available health status
measurement instruments. These 6 domains were chosen from an initial list of 20,
and reflect those areas where there is most agreement about what should be
included in a definition of health. Questions about all 20 domains are asked in
face-to-face household surveys in 15 countries, and these include a novel feature –
the use of performance tests to calibrate self-reported health on selected domains
88 ÜSTÜN, T.B. ET AL. WHO Multi-country Survey Study on Health and Responsiveness 2000–2001. Geneva, WorldHealth Organization, 2001 (GPE Discussion Paper 37).
76057 May2002-v2 20/08/02 17:25 Side 141

142
such as cognition, mobility and vision. For domains where performance tests are
not feasible, vignettes are used for calibration.
WHR2000 used previously published estimates of “disability”. During the last
year, WHO has embarked on large-scale efforts to improve the methodological and
empirical basis for evaluating health states. To address the methodological
challenges WHO, in collaboration with Member States, has initiated a two-tiered
data collection strategy consisting of large household surveys in representative
samples of the general populations in several countries, combined with more
detailed surveys at the same sites among respondents with high levels of
educational attainment.
Cross-country comparabilityA key methodological issue describing health states (and responsiveness) is how
people reply to questions requiring categorical responses such as very poor, poor,
satisfactory, good and very good. Different groups classify themselves in different
ways in terms of the underlying variable being measured. In some surveys, for
example, people who are more highly educated or who have a higher income
report worse levels of health than those with relatively lower education or income,
despite more objective measures of health status suggesting the opposite. In some
countries, old people report their health to be as good as that of younger people,
despite objective evidence to the contrary.
This problem can be viewed as a mapping from an underlying latent variable
measuring the level of health to the observed categorical self-report responses,
which can be different for different sociodemographic groups. WHO is developing
several statistical methods for correcting non-random reporting differences in self-
reported health across different population sub-groups. The first of these is based
on the hierarchical ordered probit (HOPIT) model, which is being used in
conjunction with tests and vignettes, as described above.
Examinations of representative sub-samples of the population can be used to assess
and correct for the non-random reporting differences in self-reported health.
Examples of such tests include the Snellen’s eye chart test for vision and the
posturo-locomotion-manual (PLM) test for mobility. A second corrective
technique is based on the use of vignettes, and is especially useful where the
76057 May2002-v2 20/08/02 17:25 Side 142

143
implementation of examinations (tests) is difficult, expensive or otherwise
impractical.
Vignettes are hypothetical descriptions of individuals for different levels of a given
health domain. Respondents are asked to classify the ability of hypothetical
individuals to care for themselves according to the different possible categories.
They are then asked to rate their own ability to care for themselves according to
the same categories. Different groups of people are found to rate the hypothetical
individual in the vignette differently – implicitly using different cut-off points for
the categories. Their responses to the vignettes are then used to adjust their
responses to questions about their own health using the HOPIT model.
Predictions of corrected health status measurements using vignettes and self-
reporting on the core domain question can be used in a second stage to correct bias
in the self-reporting on the auxiliary questions using the compound HOPIT
model.89
Inequalities in healthThe goal is to estimate inequalities in healthy life expectancy (HALE). WHR2000
included estimates of inequality in child survival based on data from the
demographic and health surveys in developing countries and vital registration data
by small geographical area (district, municipality, etc.) in developed countries. For
countries where data were not available, estimates were based on a regression
model. So far, ten countries have agreed to provide information linking individual
death records to census records or health surveys. In those countries it will be
possible to estimate inequality in HALE using individual records, and then to
compare this estimate with that obtained by using data from small geographical
areas within a country. This comparison will enable the small-area estimates to be
adjusted in countries where individual records are not available. On verification of
the method, we hope to work with many more countries to obtain either linked
data or small-area data; for the others it will be necessary to use a statistical model
to estimate inequality in HALE.
89 Vignettes are also being used to control for cross-country differences in cut-off points in the responsivenesssurveys described below.
76057 May2002-v2 20/08/02 17:25 Side 143
144
Level and distribution of responsivenessA criticism of the methods used in WHR2000 was that the estimates of
responsiveness were based on the replies of a small number of people from a small
number of countries. The multi-country survey study now under way is partly
designed to explore ways of obtaining valid and reliable information on
responsiveness. To date, representative household surveys using either face-to-face
or postal interviews have been undertaken in 68 countries (in some, both methods
have been used at the same time). In addition, surveys of key informants are being
undertaken that will allow a rigorous test of the relationship between the responses
in the different types of survey. Key informant surveys are more convenient,
quicker and cheaper than representative household surveys, which represent the
“gold standard”. The current survey programme will show if the results from the
key informant surveys are consistent with the gold standard approach, and whether
this low-cost, more convenient option provides valid responses.
A major concern with survey instruments that enquire of people’s experience with
the health system is that people from different cultures or socioeconomic
backgrounds may have different expectations. This is the question of cross-country
comparability discussed earlier and would mean, for example, that differences in
their answers might simply reflect differences in their expectations rather than
variations in the responsiveness of the system. In response to this, a key component
and innovation of the WHO surveys is the introduction of vignettes describing
how a hypothetical person is treated with respect to the domains of responsiveness.
For example, someone is described as attending a hospital with insufficient beds or
being overheard in a personal conversation with the doctor. Respondents are asked
to rate the experience of that hypothetical person in terms of how responsive the
system is in that situation. This rating is then used to anchor the rating they give
about their own personal experience, to adjust for differences in their expectations.
The results from the surveys that have been conducted to date are currently being
analysed to see to what extent the vignettes are capturing and adjusting for
differences in expectations.
Fairness of financial contributions to health (FFC)Debate about the FFC indicator has focused on three issues. First, some
commentators have disputed whether people are indeed concerned with fairness of
financial contributions to health. This will be explored in some of the qualitative
76057 May2002-v2 20/08/02 17:25 Side 144
145
work currently under way. Second, in WHR2000 household expenditure data were
available for only 23 Member States and projections had to be made for the other
countries. Third, it was argued that the index did not fully capture people’s
concerns with progressivity in contributions.
Intensive efforts have been made to work with Member States to identify income
and expenditure surveys that can be used to estimate the FFC. Recent surveys are
now available from 70 countries, and for some there are surveys from a number of
different years, providing a total of 96 data points. This search for data from
additional countries is continuing.
The question of progressivity is being explored in two ways. In WHR2000, the
household financial contribution (HFC) was estimated as total health expenditure
divided by effective non-subsistence expenditure. Non-subsistence expenditure was
total household expenditure minus food expenditure, considered to be the most
important item of subsistence expenditure for poor households. This builds
progressivity into the FFC index because richer households spend a lower
proportion of their total expenditure on food than poorer households. However,
this is subject to the criticism that a component of food expenditure is not really
subsistence expenditure (this is particularly true for rich households, whose food
spending includes many items not required for subsistence) so the HFC does not
really capture non-subsistence expenditure in the denominator. Accordingly, the
HFC as calculated for WHR2000 overestimated the percentages of non-
subsistence income richer households contributed to health.
In response, other specifications of the denominator are being explored. They are
all based on a definition of subsistence expenditure as the level required to allow
the household to live above the poverty line ($1 per day in 1985 international
dollars). This was adjusted to the year of the expenditure survey. Food purchasing
power parities (PPPs) rather than the full PPP are used to convert the resulting
estimate in international dollars into domestic currency units, to enable
comparison with the data collected in the surveys. This denominator makes the
HFC more progressive than in WHR2000. In addition, several different functional
forms of the equation defining the index of fairness of financial contributions are
being tried, although at present they are all highly correlated.
76057 May2002-v2 20/08/02 17:25 Side 145
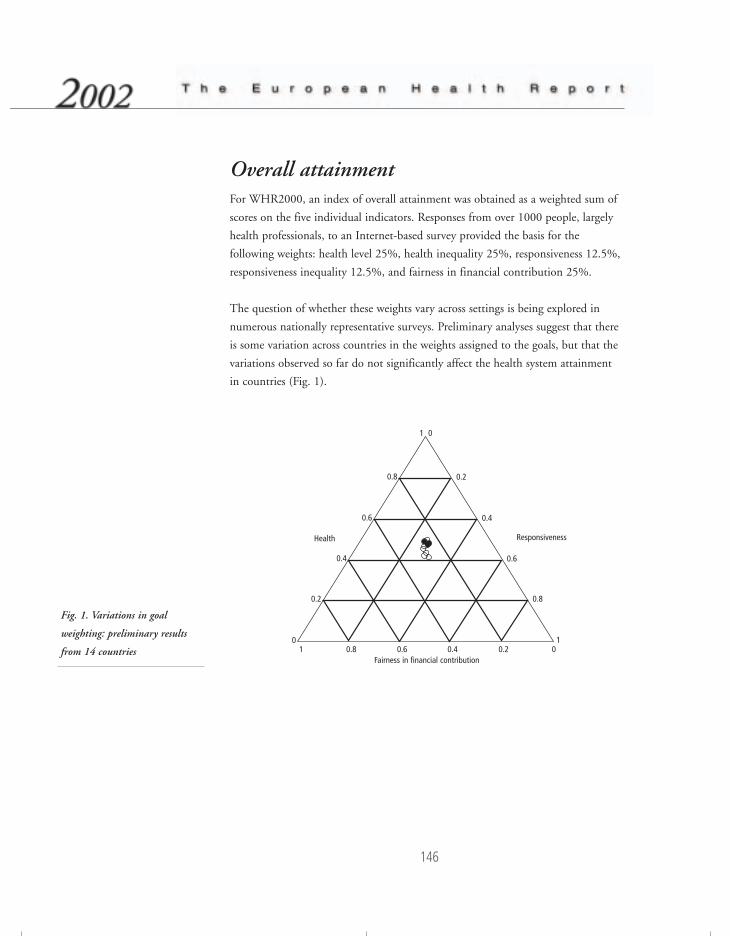
146
Overall attainmentFor WHR2000, an index of overall attainment was obtained as a weighted sum of
scores on the five individual indicators. Responses from over 1000 people, largely
health professionals, to an Internet-based survey provided the basis for the
following weights: health level 25%, health inequality 25%, responsiveness 12.5%,
responsiveness inequality 12.5%, and fairness in financial contribution 25%.
The question of whether these weights vary across settings is being explored in
numerous nationally representative surveys. Preliminary analyses suggest that there
is some variation across countries in the weights assigned to the goals, but that the
variations observed so far do not significantly affect the health system attainment
in countries (Fig. 1).
Fig. 1. Variations in goal
weighting: preliminary results
from 14 countriesFairness in financial contribution
ResponsivenessHealth
1 0
0.2
0.4
0.6
0.8
11 0.8 0.6 0.4 0.2 0
0.2
0.4
0.8
0.6
0
76057 May2002-v2 20/08/02 17:25 Side 146
147
EfficiencyA technical consultation was recently held on econometric methods to measure
the efficiency of health systems. It supported the overall approach of using frontier
production functions90 to estimate efficiency, and strongly supported the need to
separate the inputs to the production process from the determinants of the
observed levels of efficiency. However, the experts had a number of novel
suggestions about how the estimates of production, and the determinants of
efficiency, could be incorporated into the same estimation process, using
techniques still in the process of being developed.
90 Frontier production analysis estimates statistically the maximum possible output that is attainable for giveninputs, based on analysis of the range of outputs observed for health systems with similar inputs. Once themaximum has been estimated, efficiency is defined in terms of distance from this maximum: the closer one is the
more efficient the health system.
76057 May2002-v2 20/08/02 17:25 Side 147
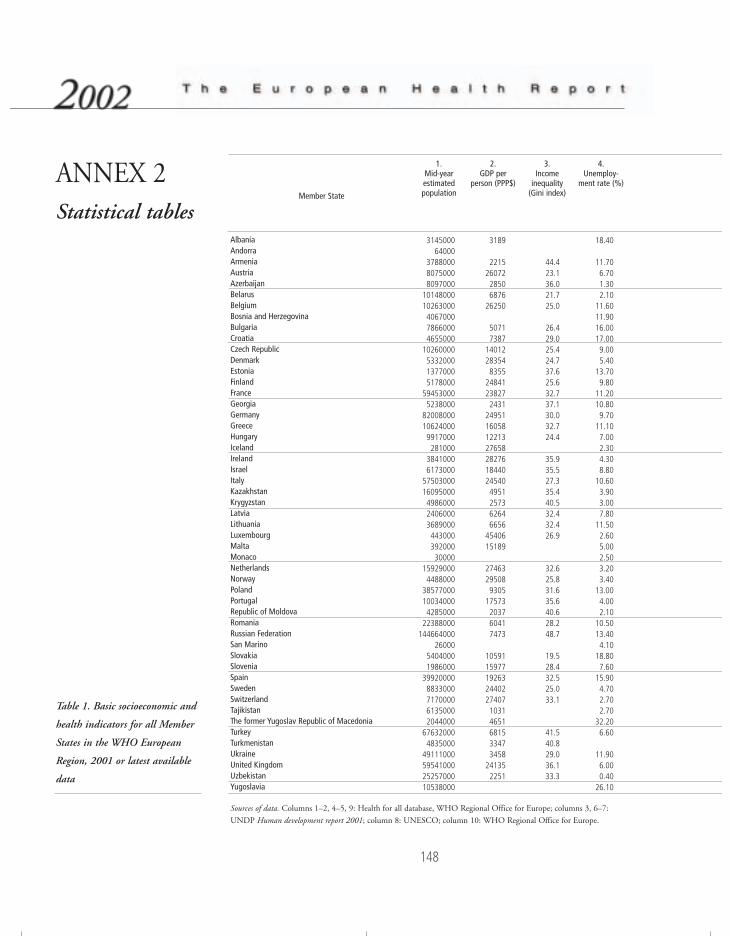
148
ANNEX 2Statistical tables
Table 1. Basic socioeconomic and
health indicators for all Member
States in the WHO European
Region, 2001 or latest available
data
Sources of data. Columns 1–2, 4–5, 9: Health for all database, WHO Regional Office for Europe; columns 3, 6–7:
UNDP Human development report 2001; column 8: UNESCO; column 10: WHO Regional Office for Europe.
Member State
AlbaniaAndorraArmeniaAustriaAzerbaijanBelarusBelgiumBosnia and HerzegovinaBulgariaCroatiaCzech RepublicDenmarkEstoniaFinlandFranceGeorgiaGermanyGreeceHungaryIcelandIrelandIsraelItalyKazakhstanKrygyzstanLatviaLithuaniaLuxembourgMaltaMonacoNetherlandsNorwayPolandPortugalRepublic of MoldovaRomaniaRussian FederationSan MarinoSlovakiaSloveniaSpainSwedenSwitzerlandTajikistanThe former Yugoslav Republic of MacedoniaTurkeyTurkmenistanUkraineUnited KingdomUzbekistanYugoslavia
1.Mid-yearestimatedpopulation
314500064000
378800080750008097000
1014800010263000406700078660004655000
10260000533200013770005178000
594530005238000
82008000106240009917000281000
38410006173000
575030001609500049860002406000368900044300039200030000
159290004488000
38577000100340004285000
22388000144664000
2600054040001986000
399200008833000717000061350002044000
676320004835000
49111000595410002525700010538000
2.GDP per
person (PPP$)
3189
22152607228506876
26250
50717387
14012283548355
24841238272431
249511605812213276582827618440245404951257362646656
4540615189
27463295089305
17573203760417473
105911597719263244022740710314651681533473458
241352251
3.Income
inequality(Gini index)
44.423.136.021.725.0
26.429.025.424.737.625.632.737.130.032.724.4
35.935.527.335.440.532.432.426.9
32.625.831.635.640.628.248.7
19.528.432.525.033.1
41.540.829.036.133.3
4.Unemploy-
ment rate (%)
18.40
11.706.701.302.10
11.6011.9016.0017.009.005.40
13.709.80
11.2010.809.70
11.107.002.304.308.80
10.603.903.007.80
11.502.605.002.503.203.40
13.004.002.10
10.5013.404.10
18.807.60
15.904.702.702.70
32.206.60
11.906.000.40
26.10
76057 May2002-v2 20/08/02 17:25 Side 148

149
5.Total healthexpenditure(percentage
of GDP)
2.84
4.208.200.904.408.803.504.739.047.308.206.106.809.405.10
10.508.706.808.706.108.307.901.902.104.806.206.108.81
8.109.306.207.703.002.602.90
6.507.707.007.90
10.401.204.504.763.504.206.903.007.58
6.Income
poverty line(50% ofmedianincome)
(1987–1997)
10.6
5.2
7.2
5.28.0
7.5
11.113.514.2
3.9
8.16.9
10.16.69.3
13.4
7.Income
poverty line(percentage
of population< US $4/day)(1993–1995)
22.0
15.0
0.8
37.0
4.0
65.088.022.030.0
20.0
66.059.050.0
0.70.7
61.063.0
63.0
8.School lifeexpectancy
(years)
14.5
16.8
12.2
12.814.812.616.015.511.015.813.712.915.213.9
12.1
13.4
15.915.613.014.5
11.6
15.214.1
11.49.5
16.6
9.Probability ofdying before
5 years
20.77
19.225.73
24.4114.717.40
16.0815.948.405.195.73
12.324.525.53
13.775.547.85
10.784.597.007.936.10
25.1533.2912.3711.253.838.03
6.355.309.357.29
22.4322.2019.16
10.125.635.954.296.04
23.0813.65
53.1815.496.86
35.66
76057 May2002-v2 20/08/02 17:25 Side 149
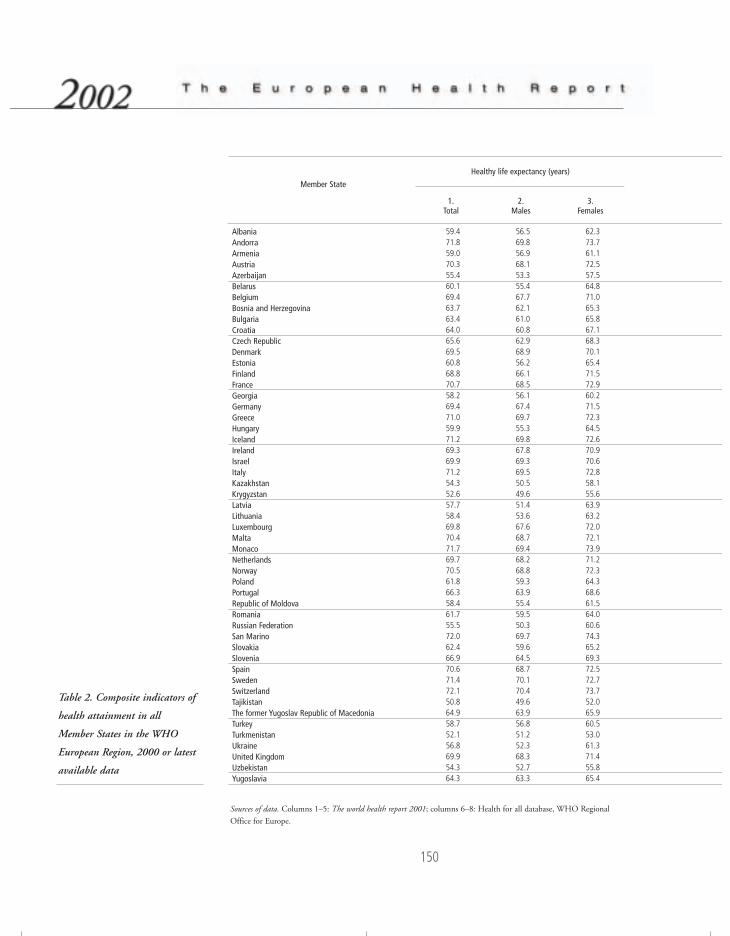
Table 2. Composite indicators of
health attainment in all
Member States in the WHO
European Region, 2000 or latest
available data
Sources of data. Columns 1–5: The world health report 2001; columns 6–8: Health for all database, WHO Regional
Office for Europe.
Member State
AlbaniaAndorraArmeniaAustriaAzerbaijanBelarusBelgiumBosnia and HerzegovinaBulgariaCroatiaCzech RepublicDenmarkEstoniaFinlandFranceGeorgiaGermanyGreeceHungaryIcelandIrelandIsraelItalyKazakhstanKrygyzstanLatviaLithuaniaLuxembourgMaltaMonacoNetherlandsNorwayPolandPortugalRepublic of MoldovaRomaniaRussian FederationSan MarinoSlovakiaSloveniaSpainSwedenSwitzerlandTajikistanThe former Yugoslav Republic of MacedoniaTurkeyTurkmenistanUkraineUnited KingdomUzbekistanYugoslavia
1.Total
59.471.859.070.355.460.169.463.763.464.065.669.560.868.870.758.269.471.059.971.269.369.971.254.352.657.758.469.870.471.769.770.561.866.358.461.755.572.062.466.970.671.472.150.864.958.752.156.869.954.364.3
2.Males
56.569.856.968.153.355.467.762.161.060.862.968.956.266.168.556.167.469.755.369.867.869.369.550.549.651.453.667.668.769.468.268.859.363.955.459.550.369.759.664.568.770.170.449.663.956.851.252.368.352.763.3
3.Females
62.373.761.172.557.564.871.065.365.867.168.370.165.471.572.960.271.572.364.572.670.970.672.858.155.663.963.272.072.173.971.272.364.368.661.564.060.674.365.269.372.572.773.752.065.960.553.061.371.455.865.4
Healthy life expectancy (years)
150
76057 May2002-v2 20/08/02 17:25 Side 150
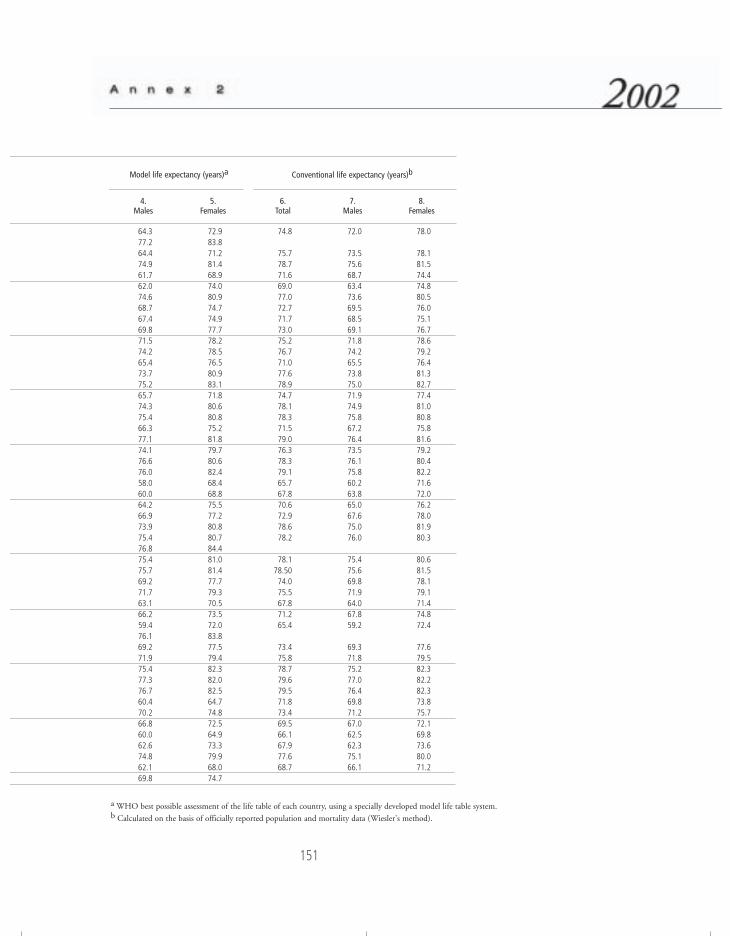
a WHO best possible assessment of the life table of each country, using a specially developed model life table system.b Calculated on the basis of officially reported population and mortality data (Wiesler's method).
4.Males
64.377.264.474.961.762.074.668.767.469.871.574.265.473.775.265.774.375.466.377.174.176.676.058.060.064.266.973.975.476.875.475.769.271.763.166.259.476.169.271.975.477.376.760.470.266.860.062.674.862.169.8
5.Females
72.983.871.281.468.974.080.974.774.977.778.278.576.580.983.171.880.680.875.281.879.780.682.468.468.875.577.280.880.784.481.081.477.779.370.573.572.083.877.579.482.382.082.564.774.872.564.973.379.968.074.7
6.Total
74.8
75.778.771.669.077.072.771.773.075.276.771.077.678.974.778.178.371.579.076.378.379.165.767.870.672.978.678.2
78.178.5074.075.567.871.265.4
73.475.878.779.679.571.873.469.566.167.977.668.7
7.Males
72.0
73.575.668.763.473.669.568.569.171.874.265.573.875.071.974.975.867.276.473.576.175.860.263.865.067.675.076.0
75.475.669.871.964.067.859.2
69.371.875.277.076.469.871.267.062.562.375.166.1
8.Females
78.0
78.181.574.474.880.576.075.176.778.679.276.481.382.777.481.080.875.881.679.280.482.271.672.076.278.081.980.3
80.681.578.179.171.474.872.4
77.679.582.382.282.373.875.772.169.873.680.071.2
Conventional life expectancy (years)bModel life expectancy (years)a
151
76057 May2002-v2 20/08/02 17:25 Side 151
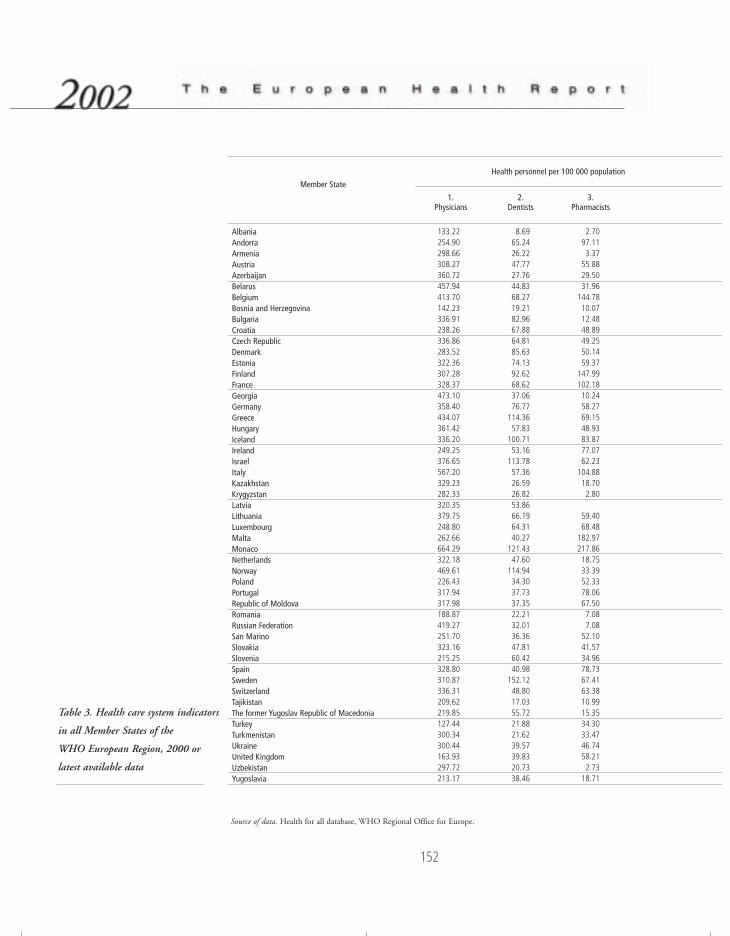
152
Table 3. Health care system indicators
in all Member States of the
WHO European Region, 2000 or
latest available data
Source of data. Health for all database, WHO Regional Office for Europe.
Member State
AlbaniaAndorraArmeniaAustriaAzerbaijanBelarusBelgiumBosnia and HerzegovinaBulgariaCroatiaCzech RepublicDenmarkEstoniaFinlandFranceGeorgiaGermanyGreeceHungaryIcelandIrelandIsraelItalyKazakhstanKrygyzstanLatviaLithuaniaLuxembourgMaltaMonacoNetherlandsNorwayPolandPortugalRepublic of MoldovaRomaniaRussian FederationSan MarinoSlovakiaSloveniaSpainSwedenSwitzerlandTajikistanThe former Yugoslav Republic of MacedoniaTurkeyTurkmenistanUkraineUnited KingdomUzbekistanYugoslavia
1.Physicians
133.22254.90298.66308.27360.72457.94413.70142.23336.91238.26336.86283.52322.36307.28328.37473.10358.40434.07361.42336.20249.25376.65567.20329.23282.33320.35379.75248.80262.66664.29322.18469.61226.43317.94317.98188.87419.27251.70323.16215.25328.80310.87336.31209.62219.85127.44300.34300.44163.93297.72213.17
2.Dentists
8.6965.2426.2247.7727.7644.8368.2719.2182.9667.8864.8185.6374.1392.6268.6237.0676.77
114.3657.83
100.7153.16
113.7857.3626.5926.8253.8666.1964.3140.27
121.4347.60
114.9434.3037.7337.3522.2132.0136.3647.8160.4240.98
152.1248.8017.0355.7221.8821.6239.5739.8320.7338.46
3.Pharmacists
2.7097.113.37
55.8829.5031.96
144.7810.0712.4848.8949.2550.1459.37
147.99102.1810.2458.2769.1548.9383.8777.0762.23
104.8818.702.80
59.4068.48
182.97217.8618.7533.3952.3378.0667.507.087.08
52.1041.5734.9678.7367.4163.3810.9915.3534.3033.4746.7458.212.73
18.71
Health personnel per 100 000 population
76057 May2002-v2 20/08/02 17:25 Side 152
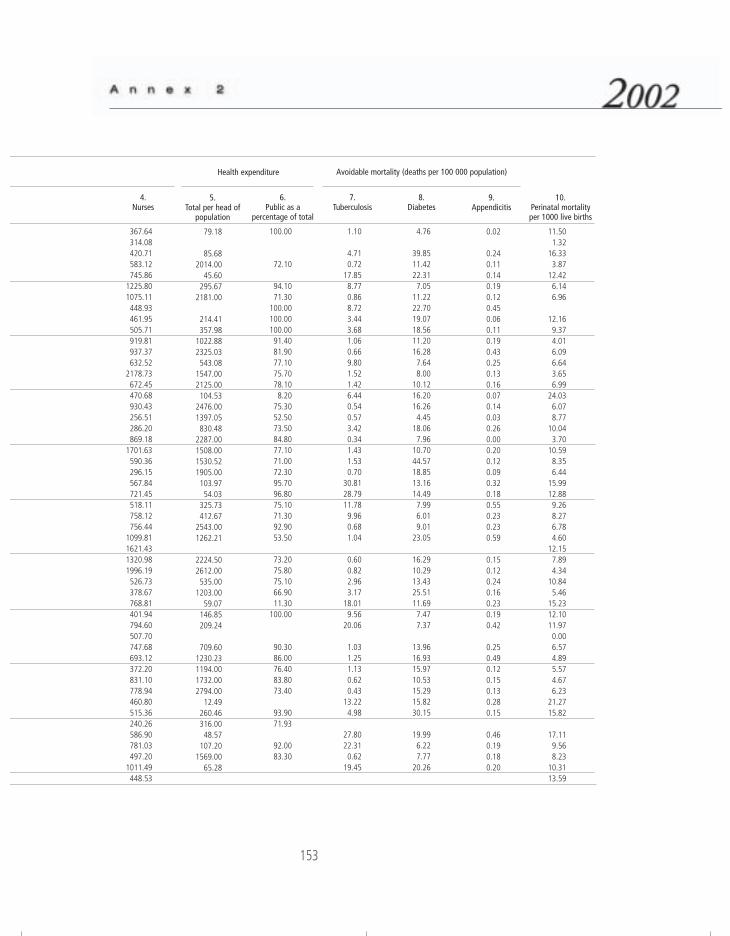
153
4.Nurses
367.64314.08420.71583.12745.86
1225.801075.11448.93461.95505.71919.81937.37632.52
2178.73672.45470.68930.43256.51286.20869.18
1701.63590.36296.15567.84721.45518.11758.12756.44
1099.811621.431320.981996.19526.73378.67768.81401.94794.60507.70747.68693.12372.20831.10778.94460.80515.36240.26586.90781.03497.20
1011.49448.53
5.Total per head of
population
79.18
85.682014.00
45.60295.67
2181.00
214.41357.98
1022.882325.03543.08
1547.002125.00104.53
2476.001397.05830.48
2287.001508.001530.521905.00103.9754.03
325.73412.67
2543.001262.21
2224.502612.00535.00
1203.0059.07
146.85209.24
709.601230.231194.001732.002794.00
12.49260.46316.0048.57
107.201569.00
65.28
6.Public as a
percentage of total
100.00
72.10
94.1071.30
100.00100.00100.0091.4081.9077.1075.7078.108.20
75.3052.5073.5084.8077.1071.0072.3095.7096.8075.1071.3092.9053.50
73.2075.8075.1066.9011.30
100.00
90.3086.0076.4083.8073.40
93.9071.93
92.0083.30
7.Tuberculosis
1.10
4.710.72
17.858.770.868.723.443.681.060.669.801.521.426.440.540.573.420.341.431.530.70
30.8128.7911.789.960.681.04
0.600.822.963.17
18.019.56
20.06
1.031.251.130.620.43
13.224.98
27.8022.310.62
19.45
8.Diabetes
4.76
39.8511.4222.317.05
11.2222.7019.0718.5611.2016.287.648.00
10.1216.2016.264.45
18.067.96
10.7044.5718.8513.1614.497.996.019.01
23.05
16.2910.2913.4325.5111.697.477.37
13.9616.9315.9710.5315.2915.8230.15
19.996.227.77
20.26
Avoidable mortality (deaths per 100 000 population)Health expenditure
9.Appendicitis
0.02
0.240.110.140.190.120.450.060.110.190.430.250.130.160.070.140.030.260.000.200.120.090.320.180.550.230.230.59
0.150.120.240.160.230.190.42
0.250.490.120.150.130.280.15
0.460.190.180.20
10.Perinatal mortalityper 1000 live births
11.501.32
16.333.87
12.426.146.96
12.169.374.016.096.643.656.99
24.036.078.77
10.043.70
10.598.356.44
15.9912.889.268.276.784.60
12.157.894.34
10.845.46
15.2312.1011.970.006.574.895.574.676.23
21.2715.82
17.119.568.23
10.3113.59
76057 May2002-v2 20/08/02 17:25 Side 153
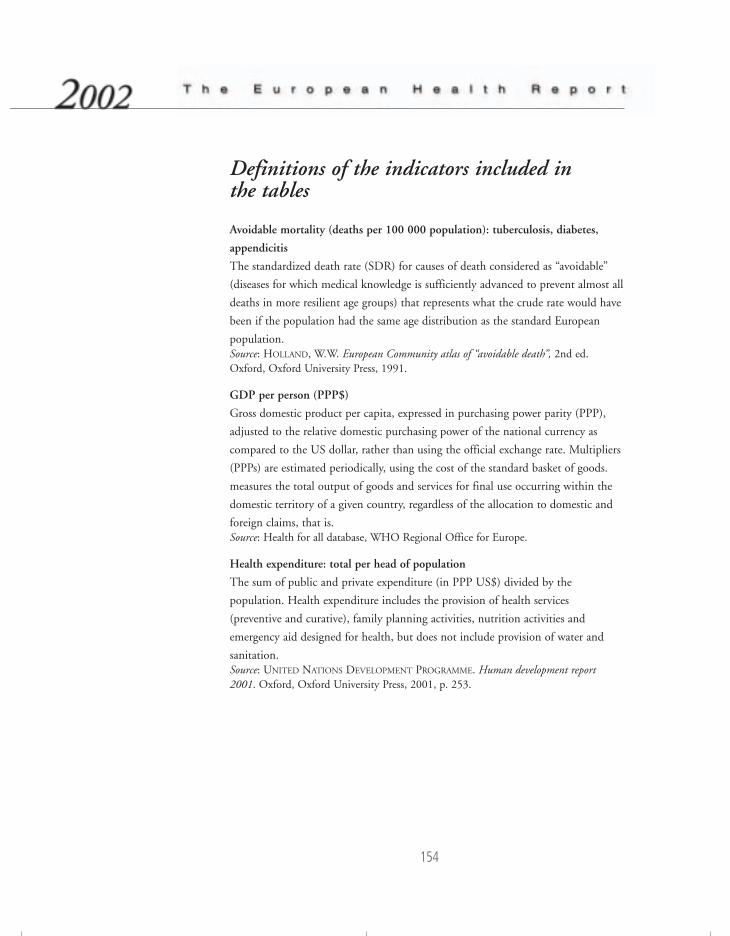
154
Definitions of the indicators included in the tables
Avoidable mortality (deaths per 100 000 population): tuberculosis, diabetes,
appendicitis
The standardized death rate (SDR) for causes of death considered as “avoidable”
(diseases for which medical knowledge is sufficiently advanced to prevent almost all
deaths in more resilient age groups) that represents what the crude rate would have
been if the population had the same age distribution as the standard European
population.Source: HOLLAND, W.W. European Community atlas of “avoidable death”, 2nd ed.Oxford, Oxford University Press, 1991.
GDP per person (PPP$)
Gross domestic product per capita, expressed in purchasing power parity (PPP),
adjusted to the relative domestic purchasing power of the national currency as
compared to the US dollar, rather than using the official exchange rate. Multipliers
(PPPs) are estimated periodically, using the cost of the standard basket of goods.
measures the total output of goods and services for final use occurring within the
domestic territory of a given country, regardless of the allocation to domestic and
foreign claims, that is.Source: Health for all database, WHO Regional Office for Europe.
Health expenditure: total per head of population
The sum of public and private expenditure (in PPP US$) divided by the
population. Health expenditure includes the provision of health services
(preventive and curative), family planning activities, nutrition activities and
emergency aid designed for health, but does not include provision of water and
sanitation.Source: UNITED NATIONS DEVELOPMENT PROGRAMME. Human development report2001. Oxford, Oxford University Press, 2001, p. 253.
76057 May2002-v2 20/08/02 17:25 Side 154
155
Health expenditure: public as a percentage of total
Recurrent and capital spending from government (central and local) budgets,
external borrowings and grants (including donations from international agencies
and nongovernmental organizations) and social (or compulsory) health insurance
funds Together with private health expenditure, it makes up total health
expenditure. Source : UNITED NATIONS DEVELOPMENT PROGRAMME. Human development report2001. Oxford, Oxford University Press, 2001, pp. 252–253.
Health personnel per 100 000 population: physicians, dentists, pharmacists,
nurses
Qualified and authorized personnel for the promotion of health, prevention of
illness, care of the sick and rehabilitation.Source : Health for all database, WHO Regional Office for Europe.
Healthy life expectancy (HALE)
See Annex 1.
Income inequality (Gini index)
Measures the extent to which the distribution of income (or consumption) among
individuals or households within a country deviates from a perfectly equal
distribution. A value of 0 represents perfect equality, a value of 100 perfect
inequality.Source : UNITED NATIONS DEVELOPMENT PROGRAMME. Human development report2001. Oxford, Oxford University Press, 2001, pp. 252–253.
Income poverty line (50% of median income)
The percentage of the population living below the specified poverty line: 50% of
median income, 50% of the median disposable household income.Source : UNITED NATIONS DEVELOPMENT PROGRAMME. Human development report2001. Oxford, Oxford University Press, 2001, p. 253.
Income poverty line (percentage of population < US $4/day)
The percentage of the population living below the specified poverty line: US $4
per day at 1990 international prices, adjusted for purchasing power parity.
Source : UNITED NATIONS DEVELOPMENT PROGRAMME. Human development report
2001. Oxford, Oxford University Press, 2001, p. 253.
76057 May2002-v2 20/08/02 17:25 Side 155
156
Mid-year estimated population
Estimate of resident (de jure) population on 1 July of a given calendar year,
calculated as an average of end-year estimates.Source : Health for all database, WHO Regional Office for Europe.
Perinatal mortality per 1000 live births
Weight-specific (≥ 1000 g) fetal deaths and early neonatal deaths (under seven
days) per 1000 births (live births + stillbirths).Source : Health for all database, WHO Regional Office for Europe.
Probability of dying before 5 years
Number of deaths per 1000 live births until 5 year of age.Source : Health for all database, WHO Regional Office for Europe.
School life expectancy (years)
The total numbers of years of schooling that a child of a certain age can expect to
receive in the future, assuming that the probability of his or her being enrolled in
school at any particular age is equal to the current enrolment ratio for that age.Source : UNESCO Institute for Statistics (http://www.uis.unesco.org/en/stats/stats0.htm, accessed 29 May 2002).
Total health expenditure (percentage of GDP)
Includes: household health expenses; government supplied health services (prisons,
schools, etc.); investment in clinics, laboratories, etc; administration costs; research
and development; occupational medicine; outlays of voluntary and benevolent
institutions.Source : Health for all database, WHO Regional Office for Europe.
Unemployment rate (%)
The proportion of registered unemployed persons, out of the total labour force, on
average per year. The “unemployed” comprise all persons above a specified age
who, during the reference period, were “without work”, “currently available for
work” or “seeking work”.Source : Health for all database, WHO Regional Office for Europe.
76057 May2002-v2 20/08/02 17:25 Side 156
The World Health Organization was established in 1948 as a specialized
agency of the United Nations serving as the directing and coordinating
authority for international health matters and public health. One of
WHO’s constitutional functions is to provide objective and reliable
information and advice in the field of human health, a responsibility that it
fulfils in part through its publications programmes. Through its
publications, the Organization seeks to support national health strategies
and address the most pressing public health concerns.
The WHO Regional Office for Europe is one of six regional offices
throughout the world, each with its own programme geared to the
particular health problems of the countries it serves. The European Region
embraces some 870 million people living in an area stretching from
Greenland in the north and the Mediterranean in the south to the Pacific
shores of the Russian Federation. The European programme of WHO
therefore concentrates both on the problems associated with industrial and
post-industrial society and on those faced by the emerging democracies of
central and eastern Europe and the former USSR.
To ensure the widest possible availability of authoritative information and
guidance on health matters, WHO secures broad international distribution
of its publications and encourages their translation and adaptation. By
helping to promote and protect health and prevent and control disease,
WHO’s books contribute to achieving the Organization’s principal
objective – the attainment by all people of the highest possible level of
health.
76057 EHRENGLISHCovers 15/08/02 17:25 Side 2

WHO Regional Publications,
European Series, No. 97
Governments and policy-makers are increasingly aware that access to
knowledge enables better policy-making practice. The policy-makers of the
various Member States are also more and more aware that they face
common challenges and can learn useful lessons from across national
boundaries that shed light on their own specific national situation.
The challenge for the Regional Office is to build on the existing data and
experience, to facilitate the sharing of this experience and, ultimately, to
make those data and indicators practically comparable across the countries.
The European health report responds to the statutory requirement to provide
the Member States with essential public health information. It provides a
broad but concise picture of the health status and health determinants in
the Region, and identifies areas for public health action for the Member
States and the European public health community. The report focuses on
concrete evidence useful for decision-makers in public health. Its role is to
summarize and feed back to Member States the information created,
deposited and “accredited” during the Regional Office’s work with Member
States on key topics and issues in public health in Europe, in the context of
the values and principles of WHO as “one Organization”.
The measure of success of this publication will be its appreciation and use
by Member States in their endeavour to improve their own health policies
and systems.
ISBN 92 890 1365 6
Sw.fr. 42.–
TH
E E
UR
OP
EA
N H
EA
LTH
RE
PO
RT
2002
76057 EHRENGLISHCovers 15/08/02 17:25 Side 1