PAHO/ACMR 12/10
67
Pan American Health Organization PAHO/ACMR 12/10 Original: English TWELFTH MEETING OF THE ADVISORY COMMITTEE ON MEDICAL RESEARCH Washington, D.C. 25-29 June 1973 GENERAL GUIDELINES FOR ESTABLISHMENT OF A DATA SYSTEM FOR THE ASSESSMENT OF NUTRITION AND HEALTH STATUS The issue of this document does not constitute formal publication. It should not be reviewed, abetracted, or quoted without the consent of the Pan American Health Organization. The authors alone are responsible for statements expressed in signed papers.
-
Upload
khangminh22 -
Category
Documents
-
view
1 -
download
0
Transcript of PAHO/ACMR 12/10
Pan American Health Organization PAHO/ACMR 12/10Original: English
TWELFTH MEETING OF THEADVISORY COMMITTEE ON MEDICAL RESEARCH
Washington, D.C.
25-29 June 1973
GENERAL GUIDELINES FOR ESTABLISHMENT OF A
DATA SYSTEM FOR THE ASSESSMENT OF NUTRITION
AND HEALTH STATUS
The issue of this document does not constitute formal publication. Itshould not be reviewed, abetracted, or quoted without the consent ofthe Pan American Health Organization. The authors alone are responsiblefor statements expressed in signed papers.
'Ud4 /~
IN REPLY REFER TO:
yr PAN AMERICAN HEALTH ORGANIZATION
;_ Pan American Sanitay Bureau, Regional Office f theWORLD HEALTH ORGANIZATION
525 TWENTY-THIRD STREET, N.W., WASHINGTON, D.C. 20037, U.S.A. CABLE ADDRESS: OFSANPAN
TELEPHONE 223-4700
GENERAL GUIDELINES FOR ESTABLISHMENT OF A
DATA SYSTEM FOR THE ASSESSMENT OF NUTRITION
AND HEALTH STATUS*
Preliminary Report
May 1973
To be presented at the Twelfth Meeting of the PAHO Advisory Committeeon Medical Research by Dr. Arnold E. Schaefer, Adviser, NutritionSurveillance, Health Services Department, Pan American Health Organi-zation, Washington, D.C., USA.
- |
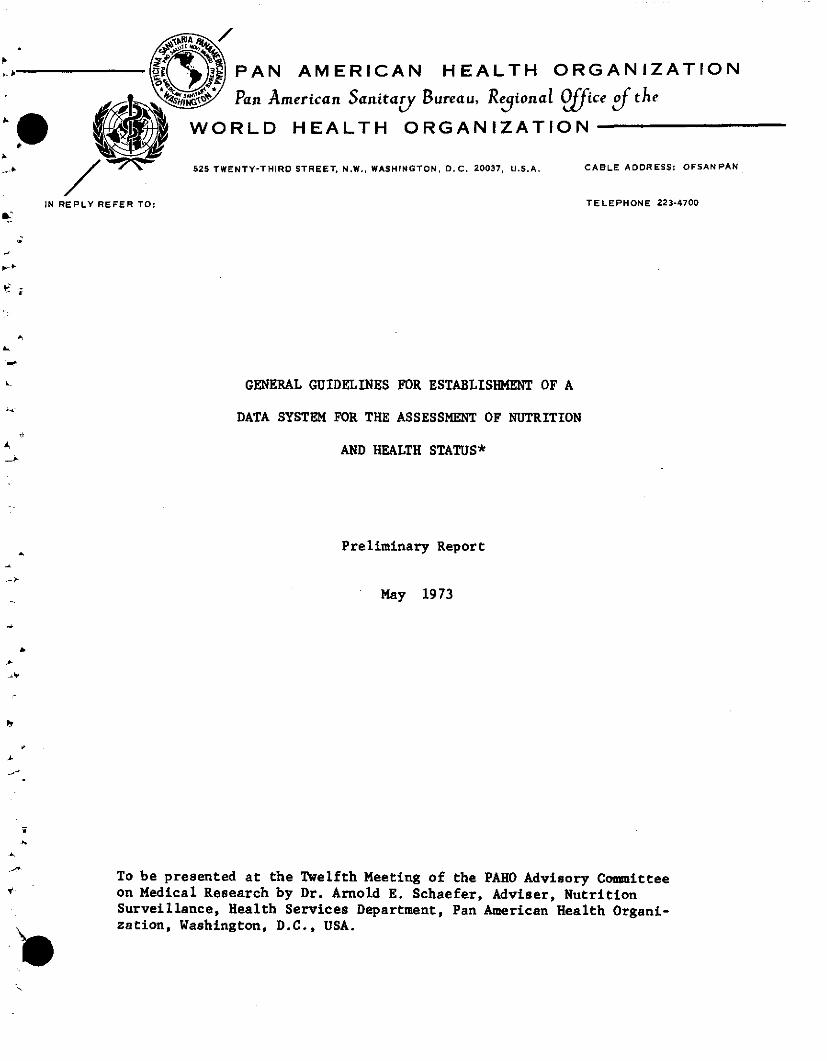
TABLE OF CONTENTS
Page
PREFACE v
CHAPTER I Introduction 1
Objectives of nutrition survey 2
Purpose of the conference in Argentina 2
CHAPTER II Planning and organization of the survey 5
1. Definition of scope 5
1.1 Simplicity or complexity of a
survey 6
2. Priority of nutrition survey
methodology 7
2.1 Sample 7
2.2 Anthropometric measurements 7
2.3 Physical - examination 7
2.4 Biochemical - laboratory studies
on a random subsample 8
2.4.1 Blood analysis 8
2.4.2 Urinary analysis 8
2.4.3 Parasitological 9
2.5 Dietary studies on a subsample 9
2.6 Socio-economic data g
2.7 Agricultural food production,
processing, marketing and pricing 9
i
2.8 Summary of nutrition assessment
procedures 10
CHAPTER III Data collection 11
1. Screening surveys - sample size 11
1.2 Probability sampling 12
2. Attributes to be collected 13
3. Data format guidelines 14
3.1 Preliminary considerations -
background 14
3.2 General information on the survey
area 15
3.3 Survey data collection formats 16
3.3.1 Tentative leader card format 18
3.3.2 Tentative format for detail cards
containing data collected in
the survey 20
3.3.3 Specific information corresponding
to any of the classes - followed
by three connector indicators 21
3.3.4 Sample form for recording leader
card for anthropometric data,
Fig. 1. 25
Sample form for anthropometric data,
Fig. 2 26
Sample form for leader card data for
clinical investigation, Fig. 3,
parts 1 and 2 27-28
ii
Page
Sample for recording clinical
findings, Fig. 4 29
3.4 Tentative codes for clinical
examination data type 10 -0
3.5 Variable identification codes
for anthropometric measurements
data type 20 34
3.6 Variable identification codes for
biochemical determinations,
data type 30 355
CHAPTER IV Guidelines for interpretation of data 57
4.1 Introduction - guides for inter-
pretation of survey data 37
4.2 Limitation of individual methods
of appraisal 38
4.2.1 Anthropometric assessment 38
4.2.2 Physical - medical examination 39
4.2.3 Dietary intake studies 40
4.2.4 Biochemical assessment 41
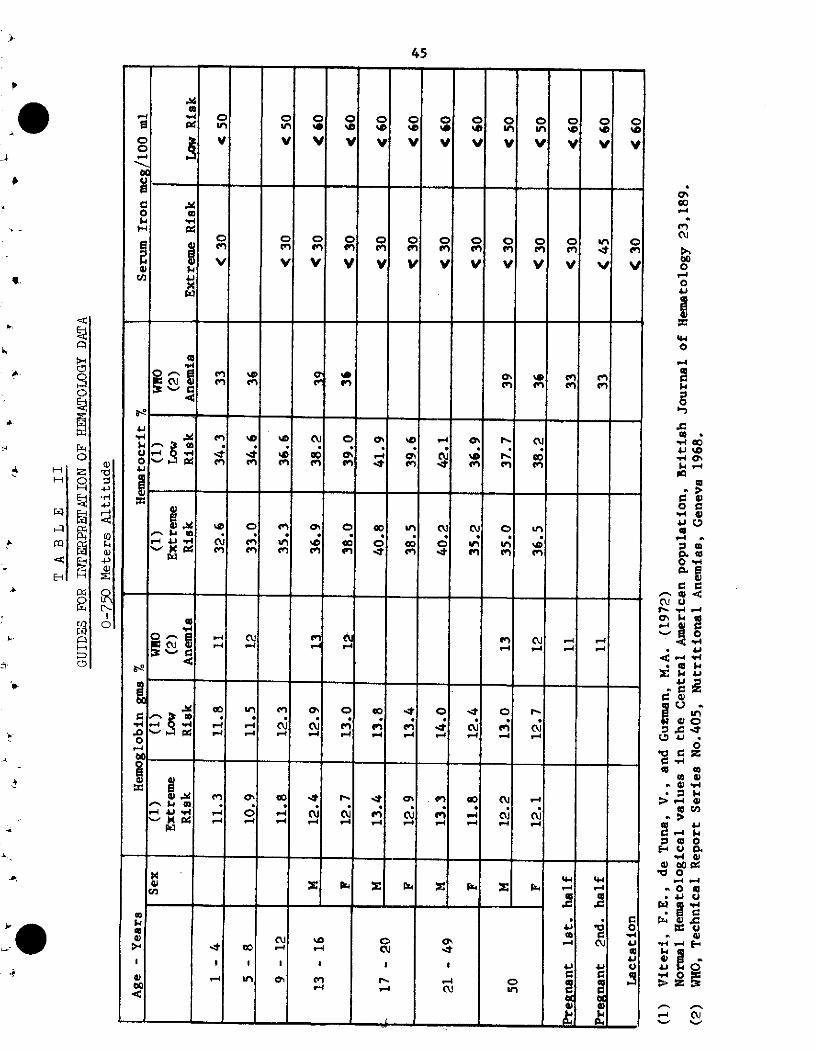
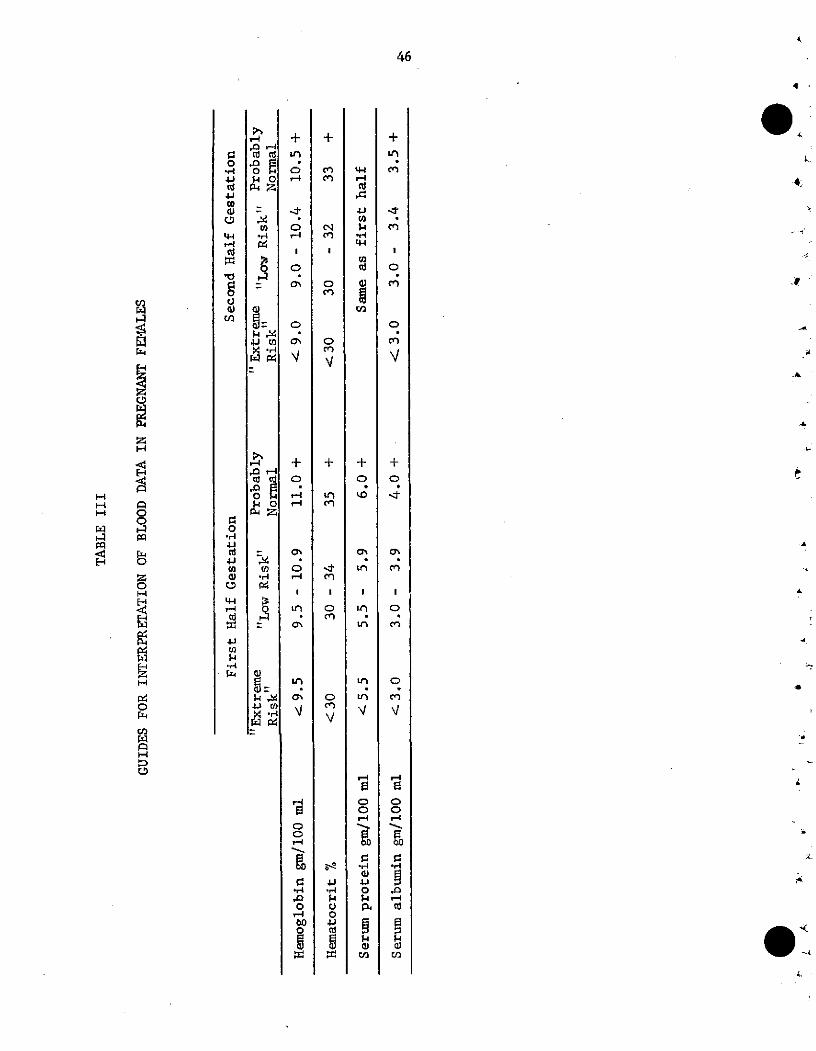
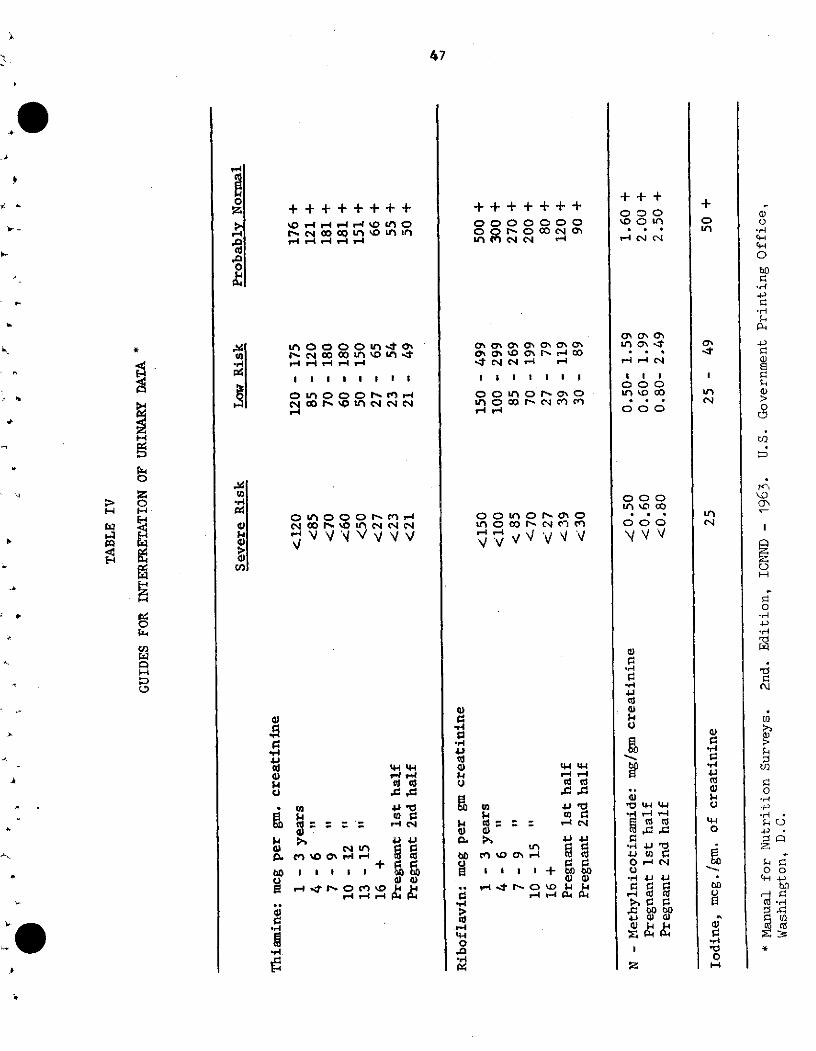
4.3 Guides for interpretation of
biochemical data 44
Table I Blood data 44
Table II Hematology 45
Table III Blood data pregnant
females 46
Table IV Urinary data 47
4.4 Guides for evaluation of
nutrient intake - Table V 48
iii
CHAPTER V
CHAPTER VI
CHAPTER VII
List of tables for data analysis
Topics for research
Recommendations
iv
Page
51
55
57
PREFACE
Prevention of malnutrition requires an interdisciplinary approaclh
of the Health, Agriculture, Education and Economic sectors. Baseline
assessment of nutrition and health status as well as the evaluation ana
monitoring of the effectiveness of intervention programs are essential
components for implementing a coordinated intersectoral National Food
and Nutrition Policy.
The technical workshop convened by the Pan American Health
Organization in Buenos Aires, Argentina in November 1971, directed its
efforts in outlining the basic concepts for establishing a computer
programming system for the storage, retrieval and uniform analysis of
basic nutrition, health and socio-economic data. The survey forms and
data linkage formats were designed to be adaptable and flexible for the
analysis and retrieval of a wide range of health assessment data from
simple anthropometric to complex survey data including dietary, physical
examination, biochemical and other socio-economic health data.
The proposed data analysis and retrieval system and the various
types and priorities of nutrition assessment procedures including sample,
size and selection will be tested in a collaborative PAHO effort with
Chile, Argentina, Peru and Brasil. Retrospective analysis of nutrition
survey data, in reference to identification of the most meaningful tests,
sample size, and correlations is in progress by INCAP as regards further
analysis of the Central America and Panama survey data. Simplicity of the
v
methodology for assessing health - nutrition status and cost of such
programs are directly related to the sample, size and type that is
required to provide informative, reliable data that can be projected
to population groups. In addition to evaluating simple methodology
is the need to identify and collaborate with such existing health units
that could be used for the systematic collection of data on a continuing
basis of one or more key indicators of nutrition-health status employing
standardized methodology.
This manual is intended as a tentative working document to be
tested, reviewed and re-edited. We encourage and welcome your comments,
criticism and suggestions.
vi
1
CHAPTER I
Introduction
PAH0O/WEO, FAO, UNICEF, and other United Nations agencies
are currently cooperating in promoting the formulation, planning
and implementation of nutrition policies in Latin America and the
Caribbean. Nutritional deficiency disease is one of the major
p4blic health problems in this Hemisphere, Knowledge of the
nature, magnitude, and epidemiology of nutritional disorder in the
Region is essential for planning health programs. To plan and
evaluate programs, the availability of baseline data is of utmost
importance.
Little information is available to health services in this
Region on the subject of family size, child spacing, maternal
nutrition and their relationship to infant and maternal health.
A better understanding of nutrition problems through epidemio-
logical surveys is needed to assure better utilization of re-
sources for the combat of malnutrition and to increase the
effectiveness of current health nutrition and social programs.
The "diagnosis" phase of planning entails the collection
of basic data for defining or appraising the general situation,
identifying the principal areas in which health problems occur,
and, whenever possible, quantifying them, so that subsequent pro-
gramming, execution, and evaluation can be undertaken.
The Third Technical Advisory Committee of Nutrition to
PAHO, in September 1970, recommended that research be undertaken
aimed at discovery of valid survey-type tests, analyses, and
2
observations by low-cost procedures aclaptable to: (1) national
nutrition surveys, (2) surveillance of action programs, and (3)
for periodic assessment of changes in the national nutritional
status. In this connection, it would be desirable to develop
techniques to determine the human and economic loss to the
community through malnutrition.
The principal objectives of a nutritian survey are: A
1. To provide data on the incidence of nutritional diseases.
The priority areas in the Region are: protein-calorie x
malnutrition; nutritional anemias; endemic goiter;-hypo-
vitaminosis A; and ariboflavinosis. The priority vulnerable
groups of the population are: pregnant and lactating women and
preschool-age children. The data collectedshodd be in a
format capable of being compared with other results obtained
at different times or locations, or in different countries.
2. To provide socio-economic food and health data which may be
correlated with nutritional findings in order to identify
high-risk groups and local causative factors.
The purpose of the conference held in Buenos Aires. Argentina, «
1971, wa$ as follows:
1. To exchange the latest information concerning the advantages
and limitations of the methodology for analyzing nutrition
survey data.
2. To design a standard questionnaire form for nutrition surveys
in Latin America and the Caribbean, the layout of the form to
be such that it can easily be adapted for different types of
surveys.
3
3. To develop a guideline for computer programming adaptable for
different computer models. (Use of standardized forms and pro-
grams should produce the required statistics sooner and less
expensively than previously-used manual methods), and the re-
sults from different surveys will be more easily comparable
when use is made of a standard system of recording and
analysis..
4. To identify those areas of research which are needed to further
improve data collection and analyses.
5. To establish an information system which, through health
departments or other appropriate agencies, could make data
available to planning officers (national or regional) for
diagnoses, planning, and/or evaluatiDn purposes.
6. To provide the basis for selection and identification of
better (more reliable, sensitive, inexpensive) indicators,
as well as a continuous self-improvement, of the information
system through proper feedback channels.
Associate Objectives
1. To make possible the use of the information contained in the
system for descriptive purposes (establishment of profiles),
as well as in the establishment of guidelines for diagnosis.
For this purpose the system must be consistent and continuous
in data, time, and space.
2. To stimulate the continuous improvement of data collection
procedures through regular use of the information contained
in the system.
4
3. To help in the integration of intersectorial efforts in the
fielc of nutrition and socio-economic development.
To fulfill the stated objectives, the conference participants
agreed that the information system should have the following general
attributes:
1. Basic. standardized data and homogeneous specialized data
2. Continuous in time and complete in geographic coverage
3-. Flexible indexing facilities and data structure with
linking to other information system
4. Built-in mechanisms for self-improvement
4
.
.~~~~~~~~~~~~~~~~~~~~~~~~~~~~~~~~~~~~~~~~~~~~·
. .~~~~~~~~~
- , f~~~~~~~~~~~~~~~c
. -b ~~~~~~~~~~~~~~~~
4
5
CHAPTER II
Planning and organization of the survey
1. Definition of scope
The first and fundamental consideration in the planning of a
nutrition survey is to define its objectives as clearly and pre-
cisely as possible. This is essential, as it serves as a basis
for sampling, methodology to be used and on the interpretation
and utilization of the information obtained. Regardless of the
scope of a nutrition survey, its primary goals should be to
assess nutrition health status, identify the major nutrition pro-
blems, prevalence, location andV cawses, and re-
sources (manpower, economic, agricultural-food, educational and
health services) - for potential practical solution. Of equal
importance is the establishment of nutrition - health baseline
data from which future evaluation of the success or failure of
action programs can be assessed in terms of health, economic and
social benefit. Since nutritional health status of a population
group is not static there is need for continued surveillance of
the effects of the changing food supply, economic and social
status,on health of the population. In many situations, where
resources are limited, the most useful service a nutrition survey
can make is to point to the critical nutritional areas in which
large gains in health and efficiency can be obtained.
The term nutrition survey has a multiplicity of meanings.
To some it connotes an epidemiological survey of specific nutri-
tional diseases, or of selected population groups such as school
6
children, or a combination of these. Similarly, the methods
employed may be limited to one assessment method (such as anthro-
pometric) or a combination of physical, anthropometric, biochem-
ical and dietary -food availability appraisal.
1.1 Simplicity or complexity of a survey;
A survey is carried out to enable inferences from the sample
to the population. Generally, stratifications are made of the
whole population, based on prior infDrmation suggestive of sub-
populations more nearly homogeneous in nutritional status than
the total. These may be based on differences in amounts gnd types
of food available, urban-rural division or on nutritionally~ vul-
nerable age groups such as pregnant-lactating mothers, infants
and preschool children.
Simplicity of a survey reference methodologies to be employed
and Cost in terms of money, personnel nd time are
directly related to sample size- and type of sampling. -,
The logistics of presenting the subjects for study is the
greatest cost item. Next of course, is the time and effort for
examination of each subject. The suggested methodology included
in this manual are proposed for use irrespective of the degree
of simplicity or complexity. Hopefully, simple methodology will
evolve which can serve as a health barometer to monitor change.
Throughout the text, various priorities h.¥bçeen given to
individual tests to indicate the first priority dependent .upon
resources.
4

7
Of the various methodologies given - anthropometric, physical,
biochemical and dietary, the first priority of methods beyond
question is the simple anthropometric assessment.
2. Prioritv of nutrition survey methodology - brief outlile
(number in piarenthesis indicates priority)
2.1 Sample
(1) Random cluster stratification of vulnerable
population groups directed toward 0-5 year
olds, pregnant mothers
(2) Other groups
(3) Random probability sampling*
2.2 Anthropometric measurements**
(1) Height for age
(1) Weight for age
(2) Arm circumference
(2) Skinfold thickness
(2) Head circumference
(3) Others
2.3 Physical - examirnation
(1) Short - abbreviated form - see Ref. (*)
Lists only key indicator lesions of malnutrition
*Ref. "Manual for Nutrition Surveys't 2nd Edition 1963, Inter-departmental Committee on Nutrition for National Defense,NIH, Bethesda, Maryland, U.S. Govt. Printing Office, Wash., D.C.
**'Manual for Internationally Comparable Growth Studies of IatinAmerica and the Caribbean" - Draft Report PAHO 1972
8
(1) Pediatric - Maternal questionnaire, see Ref.(**)
(2) Detailed physical examination - (*) ,
2.4 Biochemical - laboratory studies on a random sub-
sample
(Dependent upon sample size may be 1 in 5 or 1 in 10-
If feasible hemoglobin and hematocrit determinations
to be conducted on all subjects - again priority
given to pregnant mothers and preschool age children)
2.4.1 Blood analysis *
(1) Hemoglobin
(1) Hematocrit
(2) Serum iron or transferrin saturation index on
subsample (1)
(2) Red blood cell and serum folate (subsample)(1 )
(2) Serum vitamin A (subsample)
(2) Serum albumin (protein electrophoresis or a
subsample)
(3) Serum vitamin C
(3) Serum vitamin B12 (subsample)
(4) Other tests as modified glucose tolerance test,
serum cholesterol, aminoacids, RBC, etc.
2.4.2 Urinary analysis *
(2) Urinary creatinine (subsample)
(1) Identification of primary cause of anemia can be restricted tointensive study of a relatively small nurber having evidenceof anemia.
4,
1j
J4
ql
9
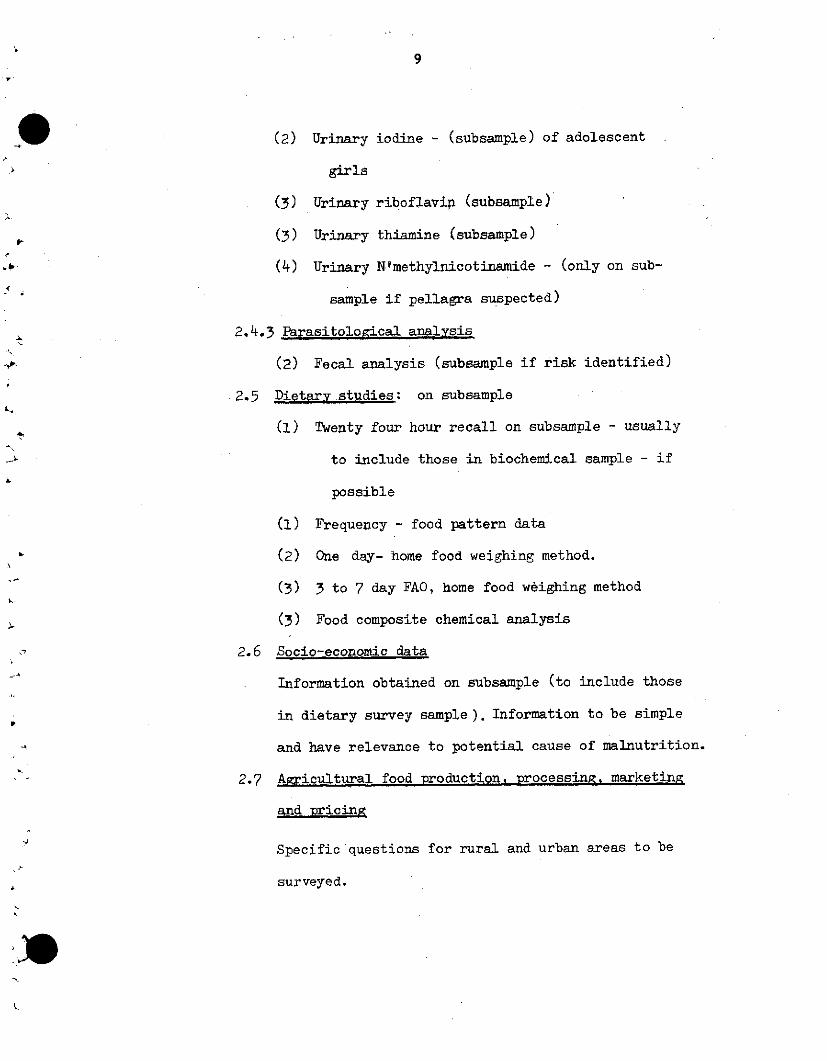
(2) Urinary iodine - (subsample) of adolescent
girls
(3) Urinary riboflavip (subsample)
(3) Urinary thiamine (subsample)
(4) Urinary N'methylnicotinamide - (only on sub-
sample if pellagra suspected)
2.4.3 Parasitological analysis
(2) Fecal analysis (subsample if risk identified)
2.5 Dietary studies: on subsample
(1) Twenty four hour recall on subsample - usually
to include those in biochemical sample - if
possible
(1) Frequency - food pattern data
(2) One day- home food weighing method.
(3) 3 to 7 day FAO, home food wéighing method
(3) Food composite chemical analysis
2.6 Socio-economic data
Information obtained on subsample (to include those
in dietary survey sample). Information to be simple
and have relevance to potential cause of malnutrition.
2.7 Agricultural food production, processing, marketing
and pricina
Specific questions for rural and urban areas to be
surveyed.
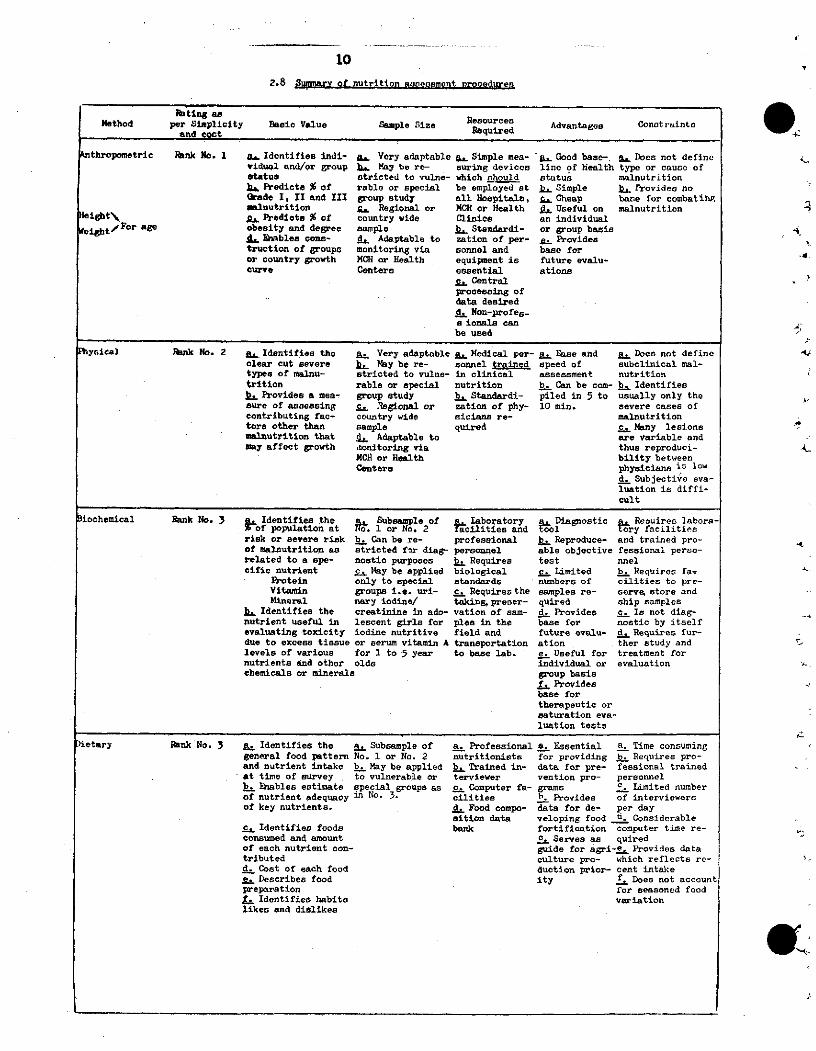
102.8 Summary of nutrition aasecsment nrocoduren
Rating asPatíng as ResourcesMetbod per Simplicity Basic Value Sample Size Requred Advantages Conotaintand eont
nthropemetric Rank No. 1 a, Identifies indi- ga Very adaptable ,. Simple mea- .. Good base-. a, Docs not definevidual and/or group bL May be re- suring devices lino of health type or cauce ofstatus stricted to vulne- which nh'ould status malnutritionbl Predicts % of rable or special be employed at LL Simple b. Provides noQrade I, II and III group study all Nospitals, Cheap base for combatihgpmalnutrition s. Regional or MCH or Health . Useful on malnutrition
eight%\ A. Predicte % of country wide Clinice an individualet,/Foer age obesity and degree sample BL Standardi- or group basis
di Eiables cone- d. Adaptable to zation of per- g. Providestruction of groups monitoring via sonnel and base foror country growth MCH or Health equipment is future evalu-curve Centers eseential ations
c. Centralprocessing ofdata desiredd. Non-profes-a ionala canbe used
Physical RInk No. 2 p. Identifies the aL Very adaptable a. Medical per- a. Ease and a. Does not defineclear cut severe b. May be re- sonnel trained speed of subelinical mal-types of malnu- stricted to vulne- in clinical assessment nutritiontrition rable or apecial nutrition b. Can be com- b. Identifieeb Provides a mea- group etudy b. Standardi- piled in 5 to usually only thesure of asaoesing c. .Rsgional or zation of phy- 10 min. severe cases ofcontributing fac- country wide sicians re- malnutritiontors other than sample quired c. Many lesionsmalnutrition that d, Adaptable to are variable andmay affect growth ,nonitoring via thus reproduci-
MGH or Health bility betweenCenters physicians is low
d. Subjective eva-luation is diffi-cult
Biochemical Rank No. 3 , Identifies the a. Subsa ple of a. Iaboratory a. Diagnosti a. Requir labora-f population at No. 1 or No, 2 facilities and tool try facilities
risk or severe risk b. Can be re- professional b. Reproduce- and trained pro-of malnutrition as atricted for diag- personnel able objective fessional perso-related to a spe- nostic purposes b. Requires test nnelcific nutrient c. May be applied biological c. Limited b. Requires fa,
Protein only to apecial standards numbera of cilities to pre-Vitamin groupa i.e. uri- c. Requires the samples re- serve, store andMineral nary iodine/ taking, preser- quired ship samples
b. Identifies the creatinine in ado- vation of sam- d. Provides c. Is not diag-nutrient useful in lescent girls for ples in the base for nostic by itselfevaluating toxicity iodine nutritive field and future evalu- d. Requires fur-due to excess tissue or serum vitamin A transportation ation ther study andlevels of various for 1 to 5 year to base lab. e. Useful for treatment fornutrients and other olds individual or evaluationchemicals or minerals group basis
,f Providesbase fortherapeutic orsaturation eva-luation tests
Dietary Rhnk No. 3 a Identifies the a. Subsample of a. Professional a. Essential a. Time consuminggeneral food pattern No. 1 or No. 2 nutritioniste for providing b. Requires pro-and nutrient intake b. May be applied b_ Trained in- data for pre- fessional trainedat time of survey , to vulnerable or terviewer vention pro- personnelb. Eiables estimate special group as as c. Computer fa- grams c Limited numberof nutrient adequacy in No. 3. cilities h Provides of interviewersof key nutrients. d. Food compo- data for de- per day
sition data veloping food d. Considerablec. Identifies foods bank fortification computer time re-consumed and amount c. Serves as quiredof each nutrient con- guide for agri-e.. Provides datatributed culture pro- which reflects re-d. Cost of each food duction prior- cent intakee. Describes food ity f. Does not accountpreparation for seasoned foodf. Identifies habits variationlikes and dislikes
e.
-.
e
4-
L-
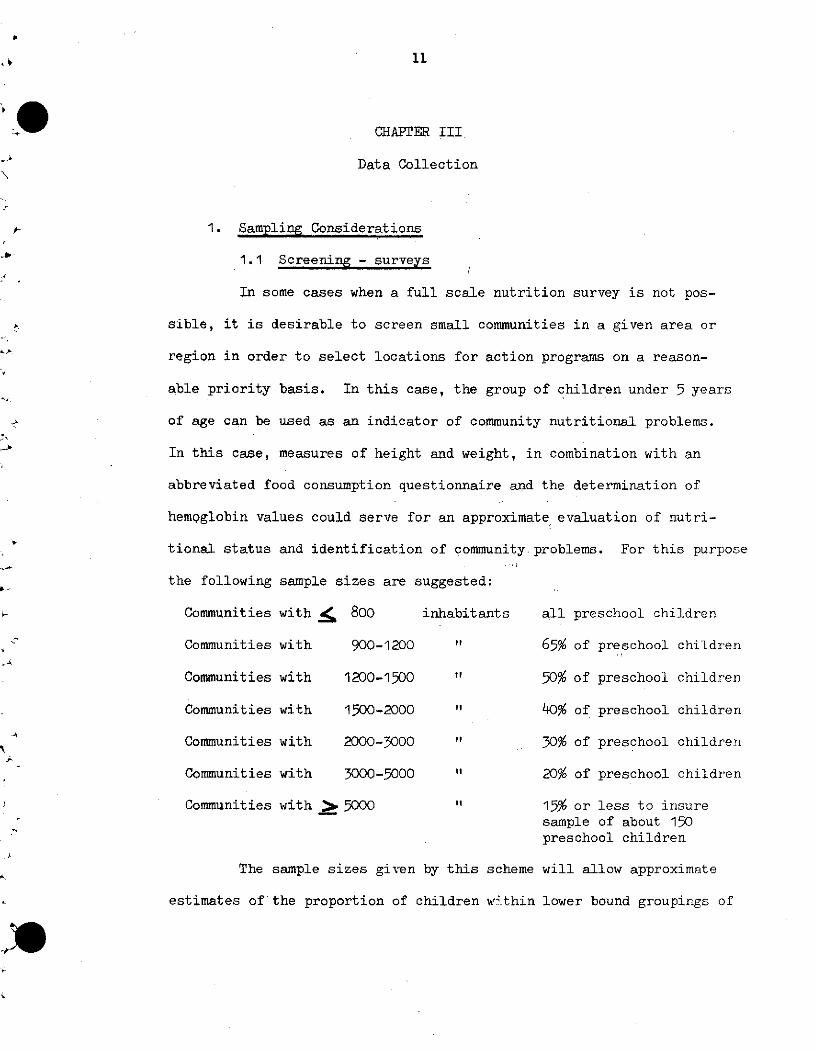
11
CHAPTER III
Data Collection
1. Sampling Considerations
1.1 Screening - surveys
In some cases when a full scale nutrition survey is not pos-
sible, it is desirable to screen small communities in a given area or
region in order to select locations for action programs on a reason-
able priority basis. In this case, the group of children under 5 years
of age can be used as an indicator of community nutritional problems.
In this case, measures of height and weight, in combination with an
abbreviated food consumption questionnaire and the determination of
hemoglobin values could serve for an approximate evaluation of nutri-
tional status and identification of community problems. For this purpose
the following sample sizes are suggested:
Communities with ~ 800 inhabitants all preschool children
Communities with 900-1200 " 65% of preschool children
Communities with 1200-1500 " 50% of preschool children
Communities with 1500-2000 " 40% of preschool children
Communities with 2000-3000 " 30% of preschool children
Communities with 3000-5000 " 20% of preschool children
Communities with _ 5000 15% or less to insuresample of about 150preschool children
The sample sizes given by this scheme will allow approximate
estimates of the proportion of children within lower bound groupings of
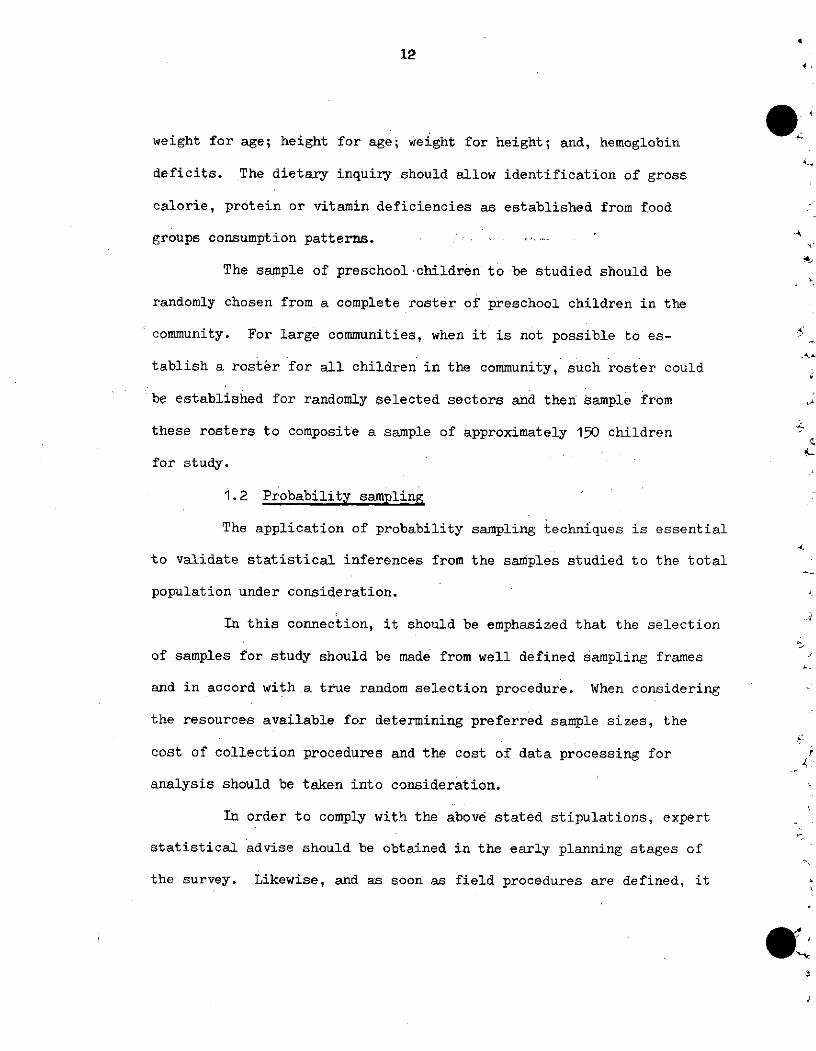
12
weight for age; height for age; Weight for height; and, hemoglobin 0
deficits. The dietary inquiry should allow identification of gross
calorie, protein or vitamin deficiencies as established from food
groups consumption patterns. ..
The sample of preschool children to be studied should be
randomly chosen from a complete roster of preschool children in the
community. For large communities, when it is not possible to es-
tablish a rostér for all children in the community, such roster could
be established for randomly selected sectors and then sample from
these rosters to composite a sample of approximately 150 children
for study.
1.2 Probability sampling
The application of probability sampling techniques is essential
to validate statistical inferences from the samples studied to the total
population under consideration.
In this connection, it should be emphasized that the selection
of samples for study should be made from well defined sampling frames
and in accord with a true random selection procedure. When considering
the resources available for determining preferred sample sizes, the
cost of collection procedures and the cost of data processing for
analysis should be taken into consideration.
In order to comply with the above stated stipulations, expert
statistical advise should be obtained in the early planning stages of
the survey. Likewise, and as soon as field procedures are defined, it
r¿
13
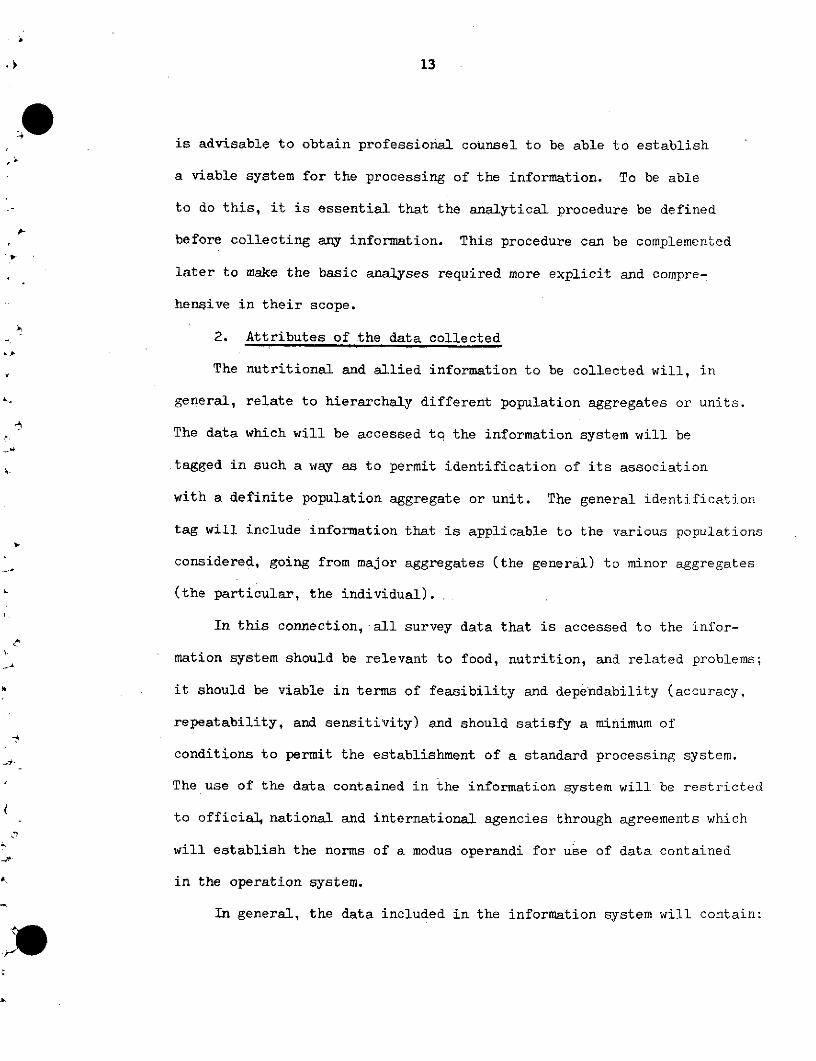
is advisable to obtain professioral counsel to be able to establish
a viable system for the processing of the information. To be able
to do this, it is essential that the analytical procedure be defined
before collecting any information. This procedure can be complemented
later to make the basic analyses required more explicit and compre-
hensive in their scope.
2. Attributes of the data collected
The nutritional and allied information to be collected will, in
general, relate to hierarchaly different population aggregates or units.
The data which will be accessed to the information system will be
tagged in such a way as to permit identification of its association
with a definite population aggregate or unit. The general identification
tag will include information that is applicable to the various populations
considered, going from major aggregates (the general) to minor aggregates
(the particular, the individual).
In this connection,·all survey data that is accessed to the infor-
mation system should be relevant to food, nutrition, and related problems;
it should be viable in terms of feasibility and dependability (accuracy,
repeatability, and sensitivity) and should satisfy a minimum of
conditions to permit the establishment of a standard processing system.
The use of the data contained in the information system will be restricted
to officiai4 national and international agencies through agreements which
will establish the norms of a modus operandi for use of data contained
in the operation system.
In general, the data included in the information system will contain:
14
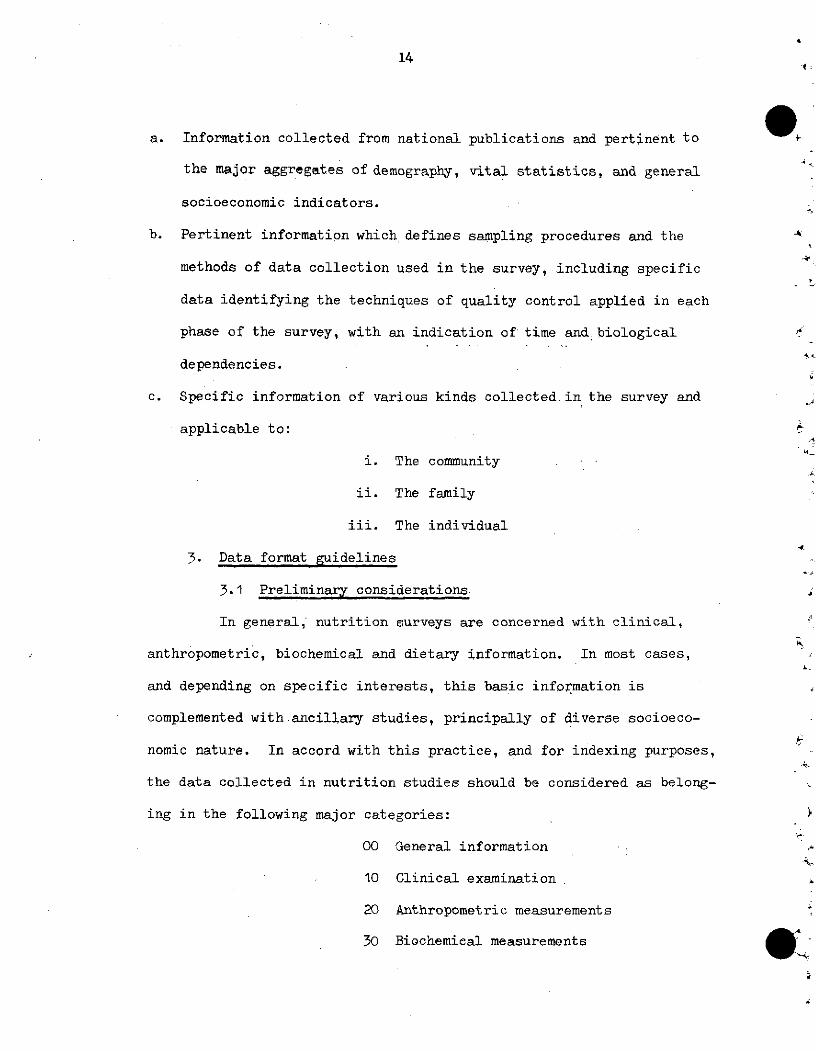
a. Information collected from national publications and pertinent to
the major aggregates of demography, vital statistics, and general
socioeconomic indicators.
b. Pertinent information which defines sampling procedures and the
methods of data collection used in the survey, including specific
data identifying the techniques of quality control applied in each
phase of the survey, with an indication of time and biological
dependencies.
c. Specific information of various kinds collected in the survey and
applicable to:
i. The community
ii. The family
iii. The individual
3. Data format guidelines
3.1 Preliminary considerations
In general, nutrition surveys are concerned with clinical,
anthropometric, biochemical and dietary information. In most cases,
and depending on specific interests, this basic information is
complemented with ancillary studies, principally of diverse socioeco-
nomic nature. In accord with this practice, and for indexing purposes,
the data collected in nutrition studies should be considered as belong-
ing in the following major categories:
00 General information
10 Clinical examination
20 Anthropometric measurements
30 Biochemical measurements
15
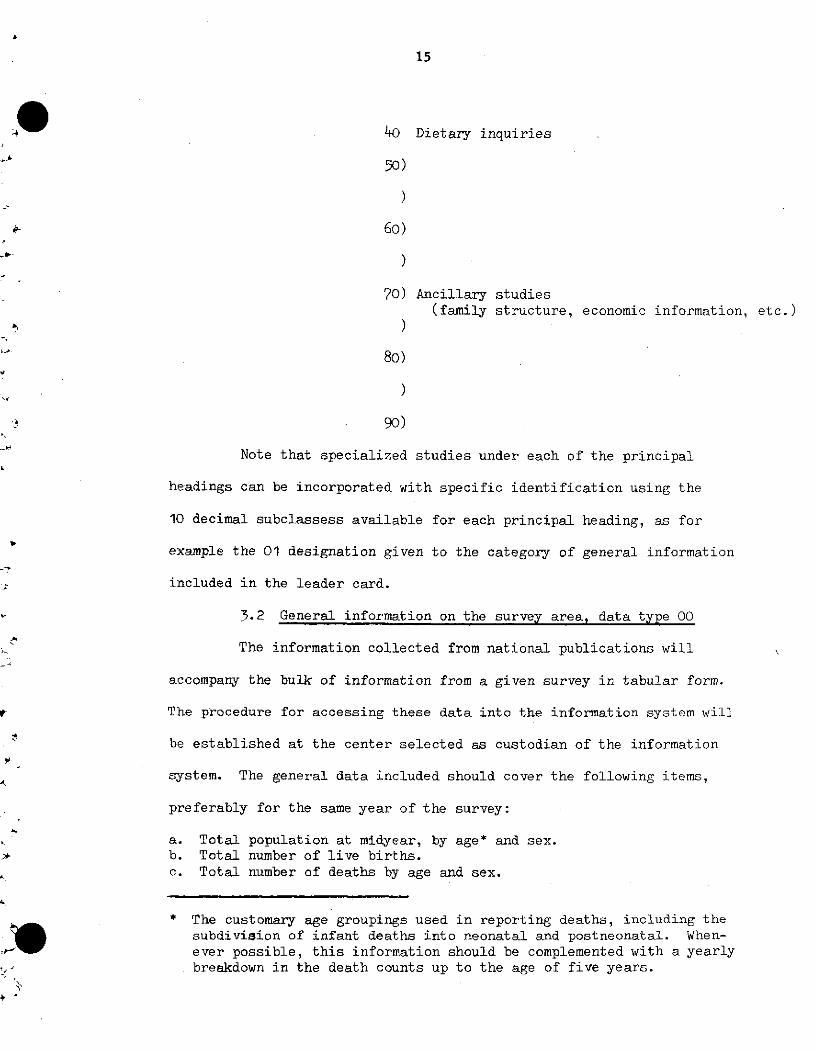
40 Dietary inquiries
50)
60)
70) Ancillary studies(family structure, economic information, etc.)
8o)
90)
Note that specialized studies under each of the principal
headings can be incorporated with specific identification using the
10 decimal subclassess available for each principal heading, as for
example the 01 designation given to the category of general information
included in the leader card.
3.2 General information on the survey area, data type 00
The information collected from national publications will
accompany the bulk of information from a given survey in tabular form.
The procedure for accessing these data into the information system will
be established at the center selected as custodian of the information
system. The general data included should cover the following items,
preferably for the same year of the survey:
a. Total population at midyear, by age* and sex.b. Total number of live births.c. Total number of deaths by age and sex.
* The customary age groupings used in reporting deaths, including thesubdivision of infant deaths into neonatal and postneonatal. When-ever possible, this information should be complemented with a yearlybreakdown in the death counts up to the age of five years.
16
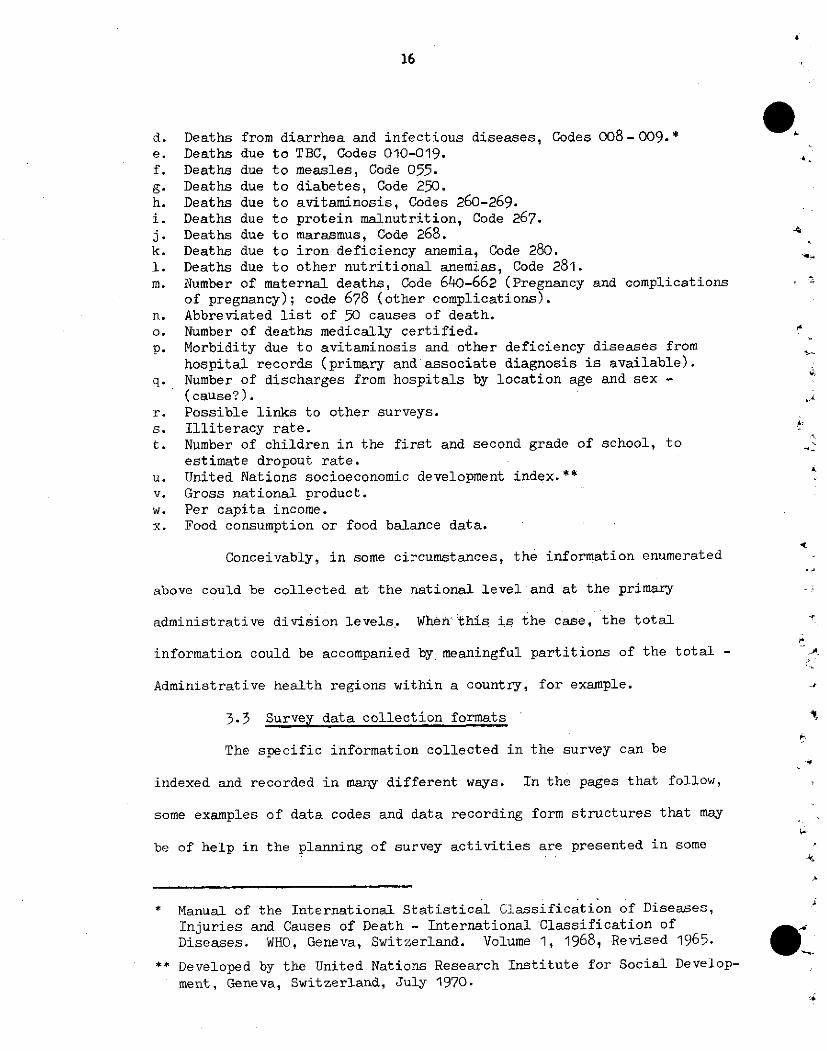
d. Deaths from diarrhea and infectious diseases, Codes 008- 009.*e. Deaths due to TBC, Codes 010-019.f. Deaths due to measles, Code 055.g. Deaths due to diabetes, Code 250.h. Deaths due to avitaminosis, Codes 260-269.i. Deaths due to protein malnutrition, Code 267.j. Deaths due to marasmus, Code 268.k. Deaths due to iron deficiency anemia, Code 280.1. Deaths due to other nutritional anemias, Code 281.m. Number of maternal deaths, Code 640-662 (Pregnancy and complications
of pregnancy); code 678 (other complications).n. Abbreviated list of 50 causes of death.o. Number of deaths medically certified.p. Morbidity due to avitaminosis and other deficiency diseases from
hospital records (primary and associate diagnosis is available).q. Number of discharges from hospitals by location age and sex -
(cause?).r. Possible links to other surveys.s. Illiteracy rate.t. Number of children in the first and second grade of school, to
estimate dropout rate.u. United Nations socioeconomic development index.**v. Gross national product.w. Per capita income.x. Food consumption or food balance data.
Conceivably, in some circumstances, the information enumerated
above could be collected at the national level and at the primary
administrative division levels. When 'this ¡s the case, the total
-
information could be accompanied by meaningful partitions of the total -
Administrative health regions within a country, for example.
3.3 Survey data collection formats
The specific information collected in the survey can be
indexed and recorded in many different ways. In the pages that follow,
some examples of data codes and data recording form structures that may
be of help in the planning of survey activities are presented in some
* Manual of the International Statistical Classification of Diseases,Injuries and Causes of Death - International Classification ofDiseases. WHO, Geneva, Switzerland. Volume 1, 1968, Revised 1965.
** Developed by the United Nations Research Institute for Social Develop-
ment, Geneva, Switzerland, July 1970.
,
. g
,1
17
detail. To illustrate the degree of diversification in the construction
of data record forms, some examples of tested protocols are given in l1he
country nutrition survey reports of Central America and Panama.*The important
feature to be noted in the examples to follow is the considerable flexibility
in the choice of variables for study in the different categories covered in
any given survey. This is made possible by the inclusion of a leader card in
each set of detailed data cards which defines in every case the specific
variables included in the record. It should be noted also that all sets of
detailed data cards are properly linked to constitute a corrected integrated
set of information.
* 1. "Evaluación Nutricional de la Población de Centro América yPanamá - Guatemala". Instituto de Nutrición de Centro Américay Panamá (INCAP); Oficina de Investigaciones Internacionales delos Institutos Nacionales de Salud (EEUU); Ministerio de SaludPública y Asistencia Social; 1969. INCAP V-25.
2. "Evaluación Nutricional de la Población de Centro América yPanamá - El Salvador". Instituto de Nutrición de Centro Américay Panamá (INCAP); Oficina de Investigaciones Internacionales delos Institutos Nacionales de Salud (EEUU); Ministerio de SaludPública y Asistencia Social; 1969. INCAP V-26.
3. "Evaluación Nutricional de la Población de Centro América yPanamá - Nicaragua". Instituto de Nutrición de Centro Américay Panamá (INCAP); Oficina de Investigaciones Internacionales delos Institutos Nacionales de Salud (EEUU); Ministerio de SaludPública y Asistencia Social; 1969. INCAP V-27.
4. "Evaluación Nutricional de la Población de Centro América yPanamá - Costa Rica". Instituto de Nutrición de Centro Américay Panamá (INCAP); Oficina de Investigaciones Internacionales delos Institutos Nacionales de Salud (EEUU); Ministerio de SaludPública y Asistencia Social; 1969. INCAP V-28.
5. "Evaluación Nutricional de la Población de Centro América yPanamá - Honduras". Instituto de Nutrición de Centro Américay Panamá (INCAP); Oficina de Investigaciones Internacionales delos Institutos Nacionales de Salud (EEUU); Ministerio de SaludPública y Asistencia Social; 1969. INCAP V-29.
6. "Evaluación Nutricional de al Población de Centro América yPanamá - Panamáa". Instituto de Nutrición de Centro Américay Panamá (INCAP); Oficina de Investigaciones Internacionales delos Institutos Nacionales de Salud (EEUU); Ministerio de SaludPública y Asistencia Social; 1969. INCAP V-30.
18
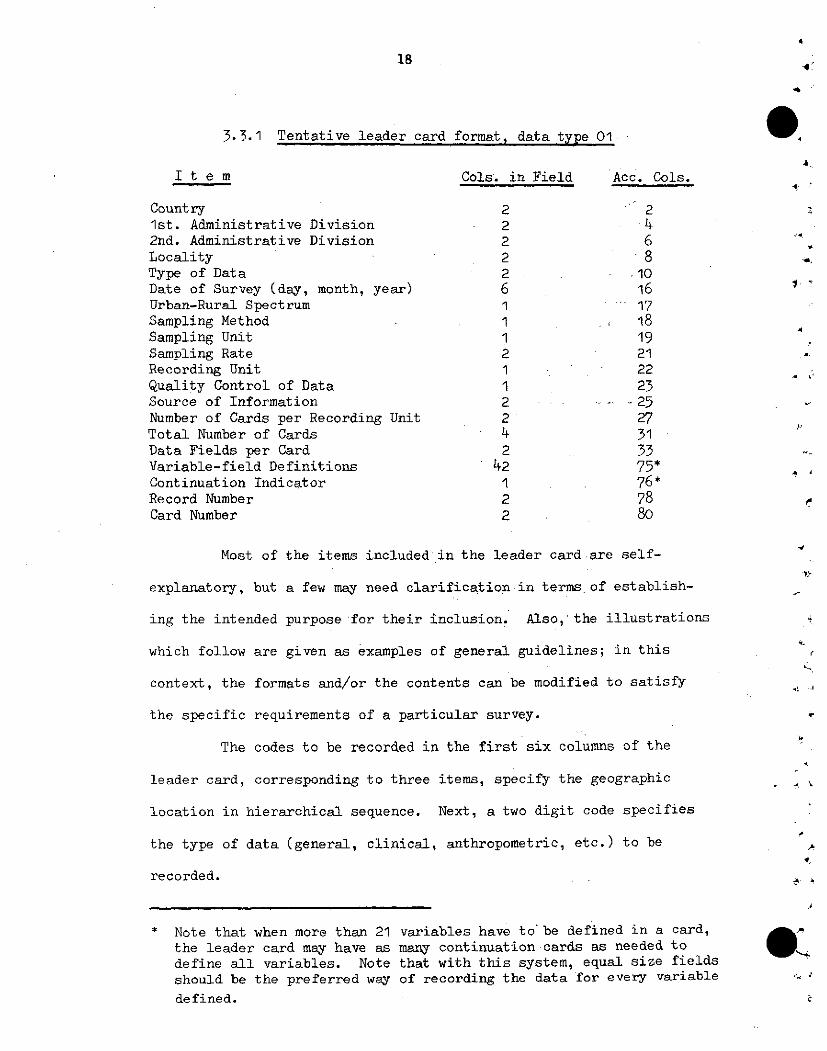
3.3.1 Tentative leader card format, data type 01
I t e m Cols. in Field Acc. Cols.
Country 2 21st. Administrative Division 2 42nd. Administrative Division 2 6 *Locality 2 8 ,
Type of Data 2 -10Date of Survey (day, month, year) 6 16 "Urban-Rural Spectrum 1 17Sampling Method 1 18Sampling Unit 1 19Sampling Rate 2 21 4
Recording Unit 1 22Quality Control of Data 1 23Source of Information 2 . -. .25Number of Cards per Recording Unit 2 27Total Number of Cards 4 31Data Fields per Card 2 33Variable-field Definitions 42 75*Continuation Indicator 1 76*Record Number 2 78Card Number 2 80
Most of the items included in the leader card are self-
explanatory, but a few may need clarification in terms of establish-
ing the intended purpose for their inclusion. Also, the illustrations
which follow are given as examples of general guidelines; in this
context, the formats and/or the contents can be modified to satisfy
the specific requirements of a particular survey. ?
The codes to be recorded in the first six columns of the
leader card, corresponding to three items, specify the geographic ,
location in hierarchical sequence. Next, a two digit code specifies
the type of data (general, clinical, anthropometric, etc.) to be
recorded. .
* Note that when more than 21 variables have to' be defined in a card,the leader card may have as many continuation cards as needed todefine all variables. Note that with this system, equal size fieldsshould be the preferred way of recording the data for every variable "
defined.
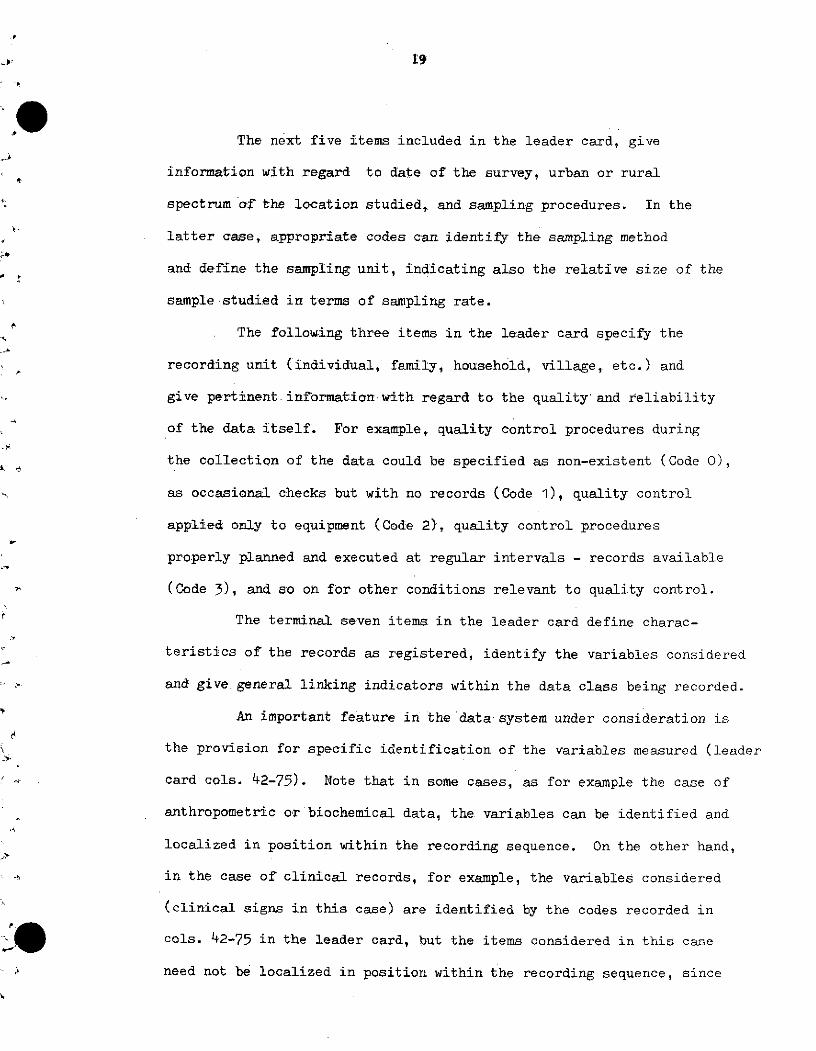
The next five items included in the leader card, give
information with regard to date of the survey, urban or rural
spectrum af the location studied, and sampling procedures. In the
latter case, appropriate codes can identify the sampling method
and define- the sampling unit, indicating also the relative size of the
sample studied in terms of sampling rate.
The following three items in the leader card specify the
recording unit (individual, family, household, village, etc.) and
give pertinent information with regard to the quality and reliability
of the data itself. For example, quality control procedures during
the collection of the data could be specified as non-existent (Code O),
as occasional checks but with no records (Code 1), quality control
applied only to equipment (Code 2), quality control procedures
properly planned and executed at regular intervals - records available
(Code 3), and so on for other conditions relevant to quality control.
The terminal seven items in the leader card define charac-
teristics of the records as registered, identify the variables considered
and give general linking indicators within the data class being recorded.
An important feature in the data system under consideration is
the provision for specific identification of the variables measured (leader'
card cols. 42-75). Note that in some cases, as for example the case of
anthropometric or biochemical data, the variables can be identified and
localized in position within the recording sequence. On the other hand,
in the case of clinical records, for example, the variables considered
(clinical signs in this case) are identified by the codes recorded in
cols. 42-75 in the leader card, but the items considered in this case
need not be localized in position within the recording sequence, since
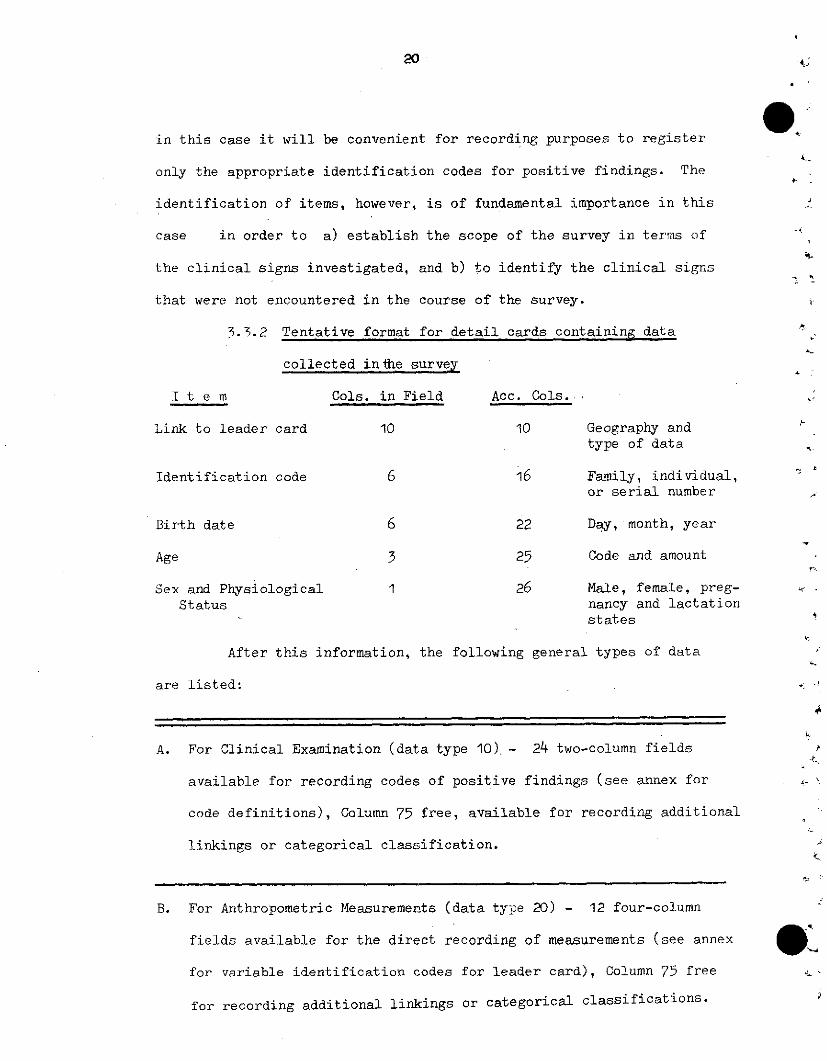
20
in this case it will be convenient for recording purposes to register
only the appropriate identification codes for positive findings. The
identification of items, however, is of fundamental importance in this
case in order to a) establish the scope of the survey in terms of
the clinical signs investigated, and b) to identify the clinical signs
that were not encountered in the course of the survey.
3.3.2 Tentative format for detail cards containing data
collected inthe survey
I t e m Cols. in Field Acc. Cols.
Link to leader card 10 10 Geography and
Identific
Birth dat
Age
Sex and PStatus
type of data
;ation code 6 16 Family, individual,or serial number
te 6 22 Day, month, year
3 25 Code and amount
'hysiological 1 26 Male, female, preg-nancy and lactationstates
After this information, the following general types of data
are listed:
A. For Clinical Examination (data type 10).- 24 two-column fields
available for recording codes of positive findings (see annex for
code definitions), Column 75 free, available for recording additional
linkings or categorical classification.
B. For Anthropometric Measurements (data type 20) - 12 four-column
fields available for the direct recording of measurements (see annex
for variable identification codes for leader card), Column 75 free
for recording additional linkings or categorical classifications.
_____
,
W,.
21
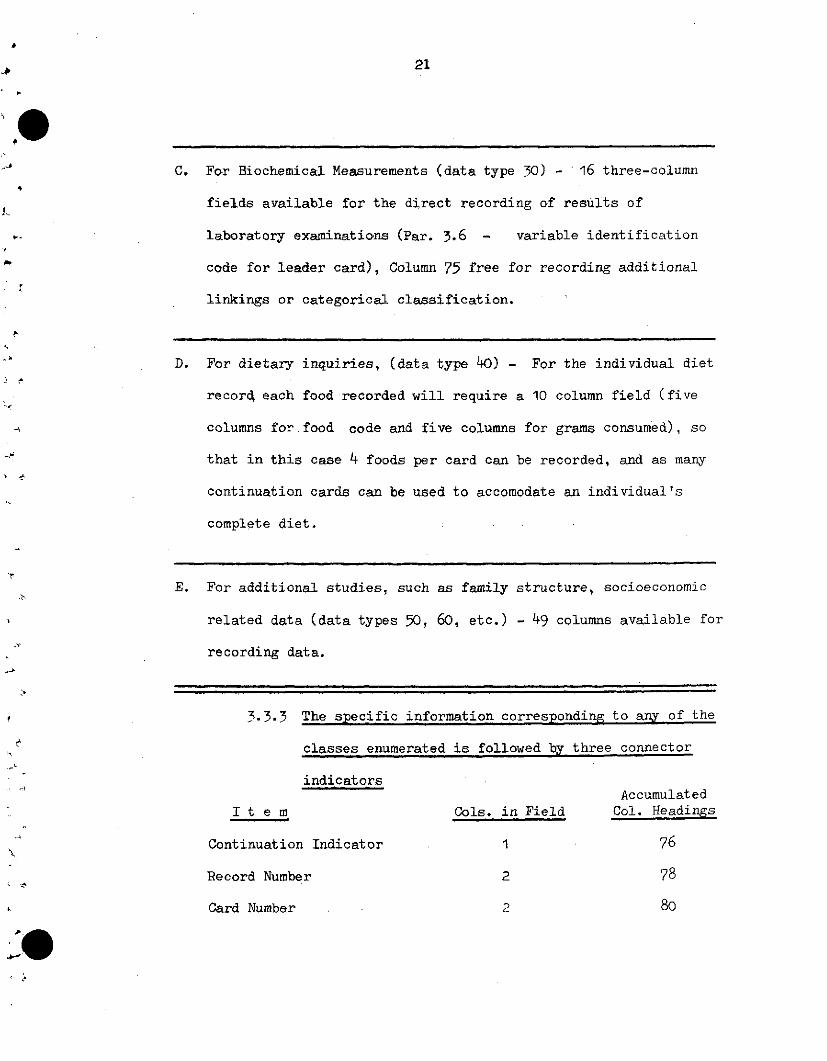
C. For Biochemical Measurements (data type 30) - 16 three-column
fields available for the direct recording of results of
laboratory examinations (Par. 3.6 - variable identification
code for leader card), Column 75 free for recording additional
linkings or categorical classification.
D. For dietary inquiries, (data type 40) - For the individual diet
record each food recorded will require a 10 column field (five
columns for.food code and five columns for grams consumed), so
that in this case 4 foods per card can be recorded, and as many
continuation cards can be used to accomodate an individual's
complete diet.
E. For additional studies, such as family structure, socioeconomic
related data (data types 50, 60, etc.) - 49 columns available for
recording data.
3.3.3 The specific information corresponding to any of the
classes enumerated is followed by three connector
indicatorsAccumulated
I t e m Cols. in Field Col. Headings
Continuation Indicator 1 76
Record Number 2 78
Card Number 2 80
22
The suggested formats given were structured for the recording -;
of data collected on individuals. It should be noted, however, that
the same structure can be used in collecting information for the
family or the community. In the first case, the columns containing
data pertinent to the individual identification, birth date, age and
sex/physical status (cols. 15-26) can be used for data recording,
making available a total of 61 columns for this purpose; the informa-
tion in columns 1-10 and 76-80 are retained for linking purposes. In
the case of community data there is a total of 65 columns available for
data records since no case identification code (cols. 11-16) is needed.
Possible use of these materials are illustrated with an
example for a leader card recording form and the recording form for
selected anthropometric measurements. The recording forms appropriate
for anthropometric data, presented in Figures 1 and 2, will be discussed
in some detail. Note that forms for biochemical data will follow the
same pattern. The clinical forms also allow a similar pattern, except
in terms of the variable identification scheme in the leader card which
does not specify position in the recording sequence. With this in
mind, the sample clinical forms (Figure 3 and 4) should be self-explanatory.
The leader card data form is divided in three sections. General data is
recorded by writing the appropriate code for each item defined in the
preprinted form in columns 1 to 33. All the items in this section are
self-explanatory, although, as stated before, appropriate codes to define
some of the items will have to be developed in accord with policies
established by the custodian of the data baik. As an example, some
23
tentative likely numbers representing codes have been filled in.
The next section in the leader card form is used to identify variables
by writing in the proper two-digit codes which designate each of the
measurements written in the item definition, column; the only pre-
printed material in this part of the formulare the column definitions
for the two digit fields which identify the variables to be entered
by code and name. Since in this example only 10 variables are defined,
the eleven terminal fields are left blank. The final section of the
data fórm is reserved for definition of connectors to continuation
cards (cols. 76-80). The contihuation indicatQr is coded 0 to
indicate there are no continuation cards; the record number 23
identifies a specific type of record within the anthropometry category.
Note that the last item, card number, is used to identify sets of cards
containing the same information uniformly coded. The use of the number-
ing scheme should become clear in the examples given.
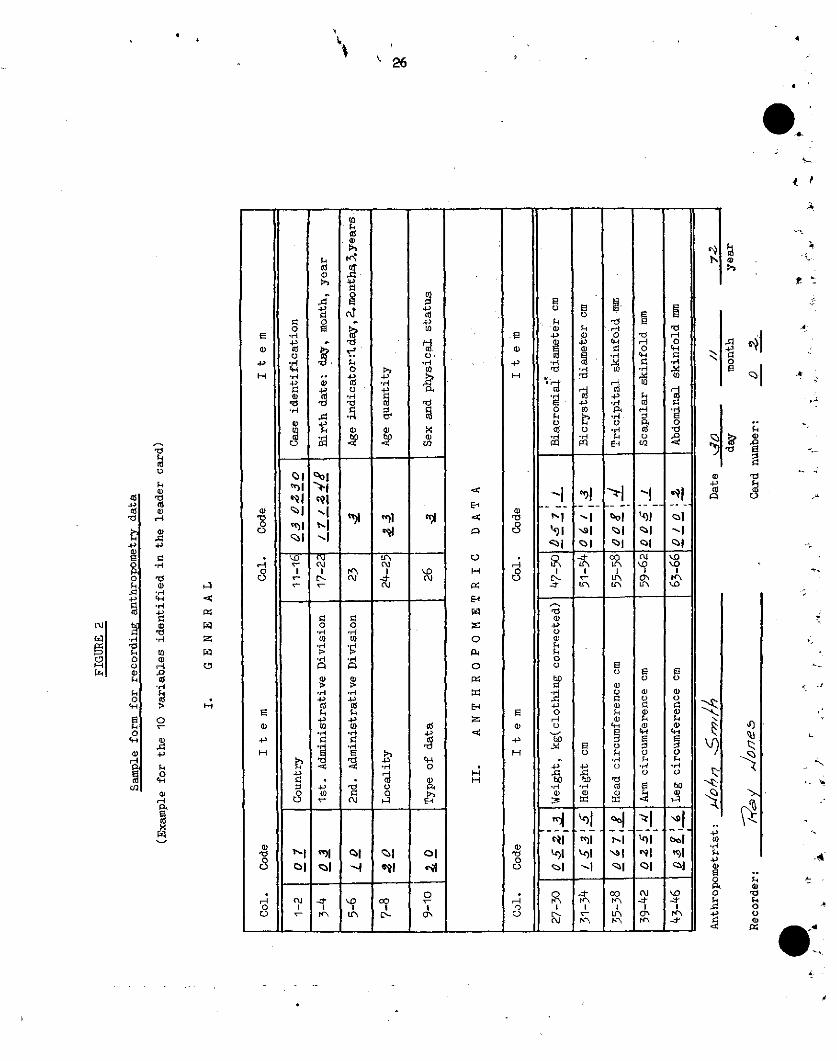
The anthropometric data form corresponding to the leader card
form just described is given in Figure 2. The first 10 columns of
information for linking purposes need not be filled out for every case,
but it is a good idea to fill in this data for sporadic uses at
selected intervals for checking purposes. The remainder of data in
this part of the form is self-explanatory, with the exception of the
sex/physiological status definition; in this case, a 1 digit code can
identify males and different conditions for females associated with
pregnancy and/or lactation. The terminal link data is omitted in the
form, since it can be duplicated at the time of punching from the leader
card, except for the card number, which is recorded at the end of the
24
form for punching in cols. 79-80. Note that initial data cards will
be identified by card number 02, since code 01 in the sequential num-
bering echeme is reserved for leader cards. Each continuation data
card for a case will be identified by sequential card number assign- J,
ment. Additional examples of leader anddata forms are presented in
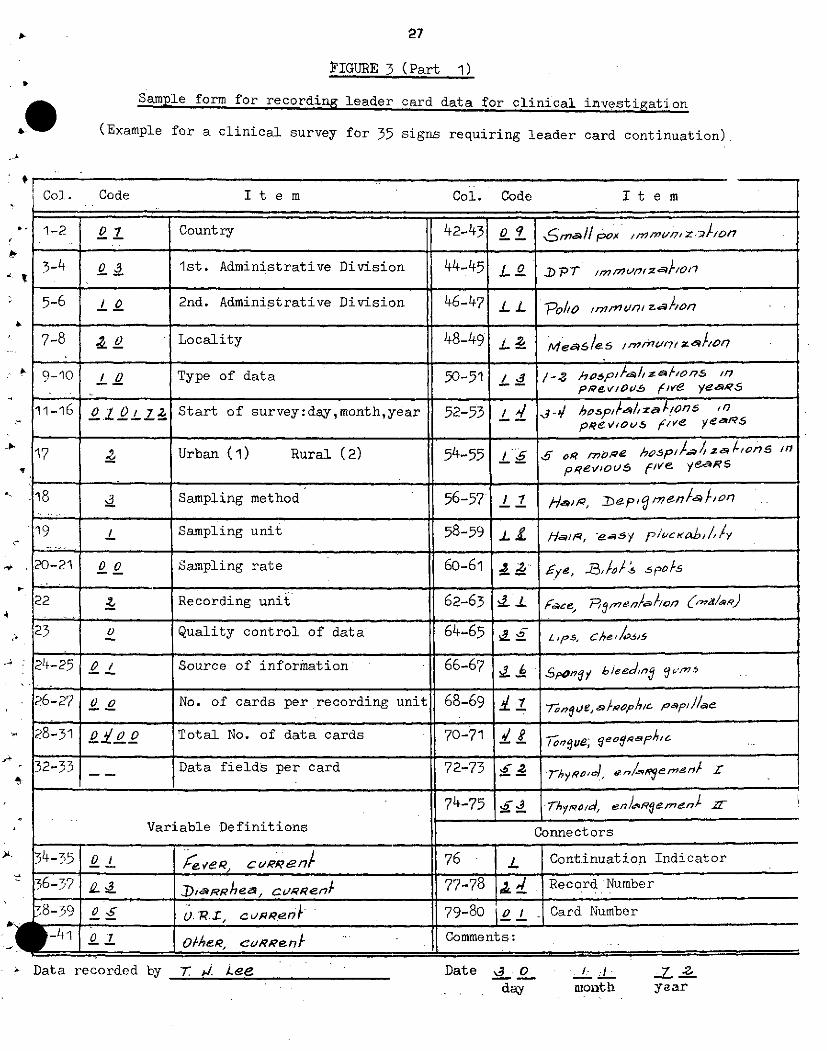
Figures 3 and 4 for the case of clinical information. As stated
before, these forms illustrate the use of continuation cards and the
location for recording of data in the case of clinical examinations.
Note that in this case the code 00 assigned to the item "number of
cards per recording unit" is intended to indicate a variable number
of cards per unit.
e'

3.3.4 FIGURE 1
Sample form for recording leader card data for anthropometric investigation
(Example filled in for an anthropometry survey with 10 measurements included)
Col. Code Item Col. Code It e m
1-2 0 1 Country 42-43 O 9 eg c/Rc_/gef2Ce
3-14 e * 1st. Administrative Division 44-45 i 73/c4oh^l d/aeeR- . L , , ., , , , . , , , . ,.
5-6 / O 2nd. Administrative Division 46-47 / I ¿/c/ys I /aneR
7-8 _o0 Locality 48-49 /
9-10 o Type of data 50-51 L 6 capl ,
11-16 oO 70/ 7; Start of survey:day,month,year 52-53 L1/nal snfold
17 ¿ Urban (1) Rural (2) 54-55
18 Sampling method 56-57
19 Sampling unit 58-59 _ _
20-21 0 o Sampling rate 60-61
22 : Recording unit 62-63 __
,' 23 _ Quality control of data 64-65
24-25 O ¡ Source of information 66-67
26-27 o j No. of cards per recording unit 68-69
28-31 o / Total No. of data cards 70-71
2-33 / Data fields per card 72-73
74-75
Variable Definitions onnectors
134 -35 _ Wep/h 76 o Continuation Indicator
36-37 e2l h 77-78 ' 3 Record Number
38-39 ° s e&d C 9cvmf eReene n¿e79-80 o , Card Number
w -471 02 k m Cscu/m7feRence Comments:
Data recorded by Date 3 odoy month year
ko/X 2Doe
4
\ 26
.d
4JCdo
.r4
.4
n 1
1.4
cd
C)
4>
4J
cd.4-
'si.l
o
o4'c
Id
a)
4'>
4'1
O
gp
til,m
4'
gc,
4,
co
nt
E E
o ioCo C o
4, 4
C> I '.
Co Co c d*H· ..4, 4'
E cd cd*.-4 *
~~ '~ t. 4-4(
'c O
4' 'IN~
cu1 I1y,'
cq'.0
u.'wn
sl
ao
I
o l
oo"
E!a.k
E
H,
H
o0-
E
a,
4'
H-
kd
a>4-'
4,
E
o
o
4'4
Ecd
('4
E
oO
14 0
Err 4,
44
r_4,
u,
rO
s-4
.r
c°4,
'-4
o,.c
r44o
o
4,
o,
.d
O
4 1
0
4-4
n
-
E
4-)
E.oe4.H
'_I
>1
ol>0
41
o
:I
cd
o
o
3
'---
ñIqll_)
z>l
Re
E
H
E
4,
H
uO
4
H
E-4
H
C)H
cro
E--
z
P:O
0
PI
E-4
-:4
H-4
4-)
.r4
4'
o
u.r4
-I
e1\
Eo
*4
1
,41
\>l~l
1A
Iz-
N-
Ei, .
.4o,1
4-4I
Lo
Lrá
Eq)
.,4
.1
E-_
ol
001n
-,o
E
o
a>
E
cd
a
Id
__
Nis1
91
co
'nK\
o
Ee
<d0
fi
-4
o
o
z,
a\
4,e
E
Ei
Cil
o<
N
(rP<'
4-4E
co
'Eo
Cl
-'-1
"O
o
Eo
E
bo
bol
-1"Oyir<"
j)
t:
o olU.,4
$o
·c
0
N
O , t -o '0 lo
4. 0C' g>;
_ _
| l l
i I I i i ii i · -r ii· i
27
PIGURE 3 (Part 1)
Sample form for recording leader card data for clinical investigation
(Example for a clinical survey for 35 signs requiring leader card continuation)
Col. Code It e m Col. Code
1-2 0 1 Country 42-43 0 o pox 9,ml,'lZ./O/
3-4 o 3 1st. Administrative Division 44-45 L p7 p mur,
5-6 _0 2nd. Administrative Division 46-47 £ PO , n/
7-8 ú Locality 48-49 L 2-e-6le6 ,n/mu/77 Z//o/
9-10 I O Type of data 50-51 / 3 /-. hoDpi//lza/,on.s ,i_pRew/ous5 fve ye,¿,S5
11-16 0o 0O 72 Start of survey:day,month,year 52-53 4/ //7 hosp//#zaÍ/on6 "
pReoQ,5 f/Ve ye.re5
17 _ Urban (1) Rural (2) 54-55 _ p o5élofS "7ppevIouV five y~'$
18 _ Sampling method 56-57 1 9 n /on,s .,-7 Har, .. ep'~
m e n
19 / Sampling unit 58-59 L
20-21 0 o Sampling rate 60-61 d z y5 5po/s
-22 Recording unit 62-63 en
23 o Quality control of data 64-65 L h
24-25 0 Source of information 66-67 3 6 po beedinÚ m
26-27 O o No. of cards per recording unit 68-69 7 e
28-31 0 0o Total No. of data cards 70-71 _ 8e a
32-33 __ Data fields per card 72-73 7 hRo d en
74-75 -d- 7-hy,,od, enL/'Reinen/ !
Variable Definitions Connectors
34-35 _ 0 /c n 76 I Continuation Indicator
36-37 ~ RRhea c.en 77-78 8 ,/ Record Number
78-,39 O S .R.I, cussenA ) 79-80 o I Card Number
-41 o 1 cvRRent ~ Comments:
? Data recorded by Date O- _day
It e m
Tr j. Leenionth year
op,:.

28
FIGURE 3 (Part 2)
Sample form for recording leader card data for clinical investigation
(Example for a clinical survey for 35 signs requiring leader card continuation)
It e m Col. Code It e m
1-2 o 1v Country 42-43 9 q ? e//.
3-4 o3 _ st. Administrative Division 44-45 6 ,30 s 7es
5-6 _ o 2nd. Administrative Division 46-47 . d wn/i0 R 7nue eJema
7-8 ._ o Locality 48-49 s _ ,/a/eR/ ans/e edeam
9-10 , 0 Type of data 50-51 8 d geRa/ed e'er
11-16 D t 0 Start of survey:day,month,year 52-53- 8 ' 9 /RaS J6
17 _ Urban (1) Rural (2) 54-55 9 c -OR
18 _ Sampling method 56-57 9 J / so/i/v
19 Z Sampling unit 58-59 . /
20-21; t o Sampling rate 60-61 A)
22 _ Recording unit 62-63 -
23 o Quality control of data 64-65
24-25 o . Source of information 66-67
26-27 o o No. of cards per recording unit 68-69 _
28-31 o0o o Total No. of data cards 70-71 _ _
32-33 _Data fields per card 72-73 _
74-75
Variable De finitions Connect ors
s4-35 _ Thysfoi'¿ en R 7me7II17IIIi6 Continuation Indicator
36-57 . hreIe¢a/ss Rm 77-78 0 Record Number
38-59 s o F)t- e c 79-0 Card Number
_ _ _ _ _ _ _ _ ¿ -
/ Comments:
Data recorded by 7: J. iee Date oday
¡Col. Code
e
I40-LI1 j _
J 1
monthl
--
1
1
_-~'e//gaou yieRr7aj/~ nec>crn
29
FIGURE 4
Sample form for recording clinical findings
(Example for a clinical survey for 35 signs)
I. GENERAL
Col. Code I t e m Col. Code I t e m
1-2 D Country 11-16 10D _03 30 Case identification
3-4 1st. Administrative Division 17-22 l. ,? Birth date: day, monti year
5-'6 0o 2nd, Administrative Division 23 _ Age indicator;-_-- 23 _ ~' 1.days, 2.months, 3.years
7-8 o Locality 124-25 2 3 Age quantity
> 910 L 0 Type of data 26 _ Sex and physical status
II. CL I N I C A L F I N D I N G S
(Identify positive findings by recording appropriate codes and sign names)
-' Col. Code Sign Name Col. Code Sign Name
7-28 o / f , c e55-56 _
9-30 03 Ri4¿*^ 3 wea c 57-58
31-32 ,. *s 2ed -o /3s s yea s 59-60-
33-34 d Che jos//, 61-62
35-36 - 6 Spngy 8leedo , arng 63-64
7-38 £ 3 Nhw,/o/ en/sRegenS 1r 65-66 _
39-40 J Ún,/a/ £3»/K ede,,r 67-68
1-42 z d n, l 69-70
í -44 71-72
tf5-4-6 _ _ 73-75
7-48 C o n n e c t o r s
19-50 - 76 O Continuation indicator
_ 51-52 _ 77-78 d Record Number
'57-541_ _ 79-80 o L Card Numbor,¡ S - -_ -- _ .~~~~~~~
qW miner:, Recorder:
'l D.: .vi,
7bJ. l.ec
Date _ 0day
¡ 1
month year
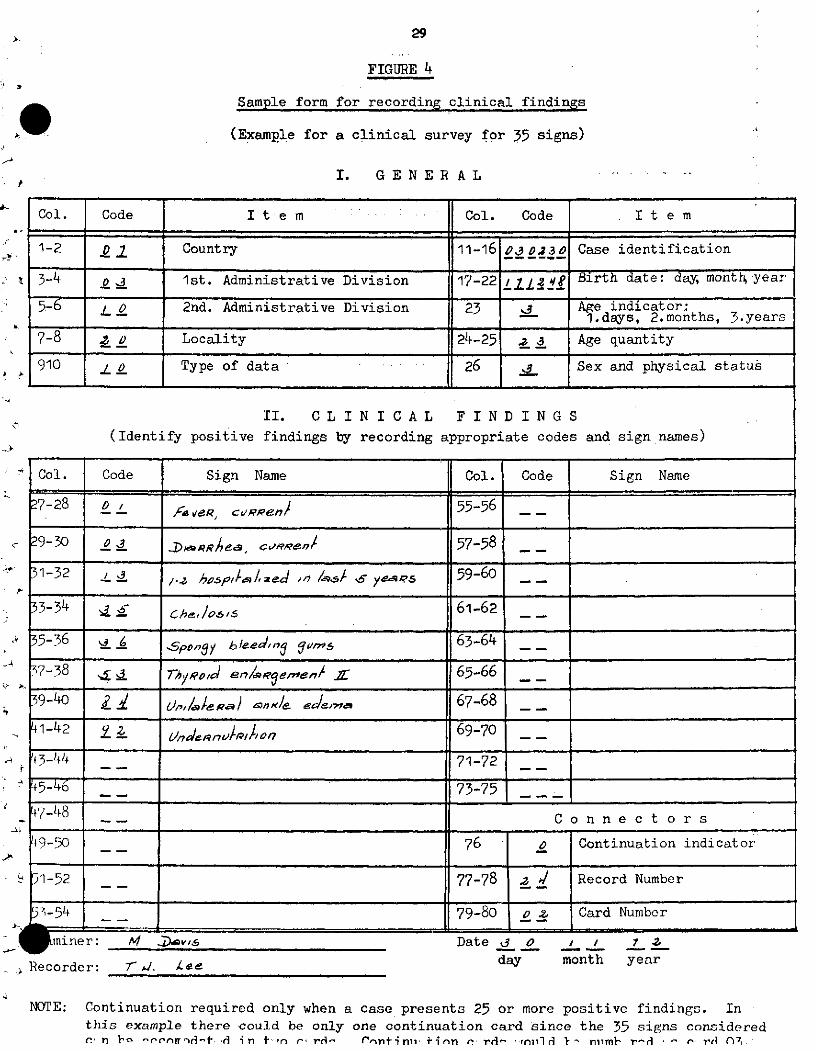
NOTE: Continuation required only when a case presents 25 or more positive findings. Inthis example there could be only one continuation card Since the 35 signs consideredr. n Y' -rrnrir- -t rl i n t1 n r rrit- (rnii ni linm F, rcrl- rnil l<1 niml- r-d -- re, l n7,
,.

30
3.4 Tentative codes for clinical examination, data type 10
Medical History
Illnesses:
Fever, current 01 -
Fever, recurrent 02
Diarrhea, current 03
Diarrhea, recurrent 04
U.R.I., current 05
U.R.I., recurrent 06
Other, current 07 -.
Other, recurrent 08
Immunizations: ~
Smallpox 09
DPT 10
Polio 11
Measles 12
Number of hospitatlizations in previous (5 years?):
1 - 2 13
3 - 4 14
5 or more 15
Clinical Signs
Hair:
Lack of luster 16
Depigmentation 17
Easy pluckability 18
Thinness and sparseness 19
*1=
31
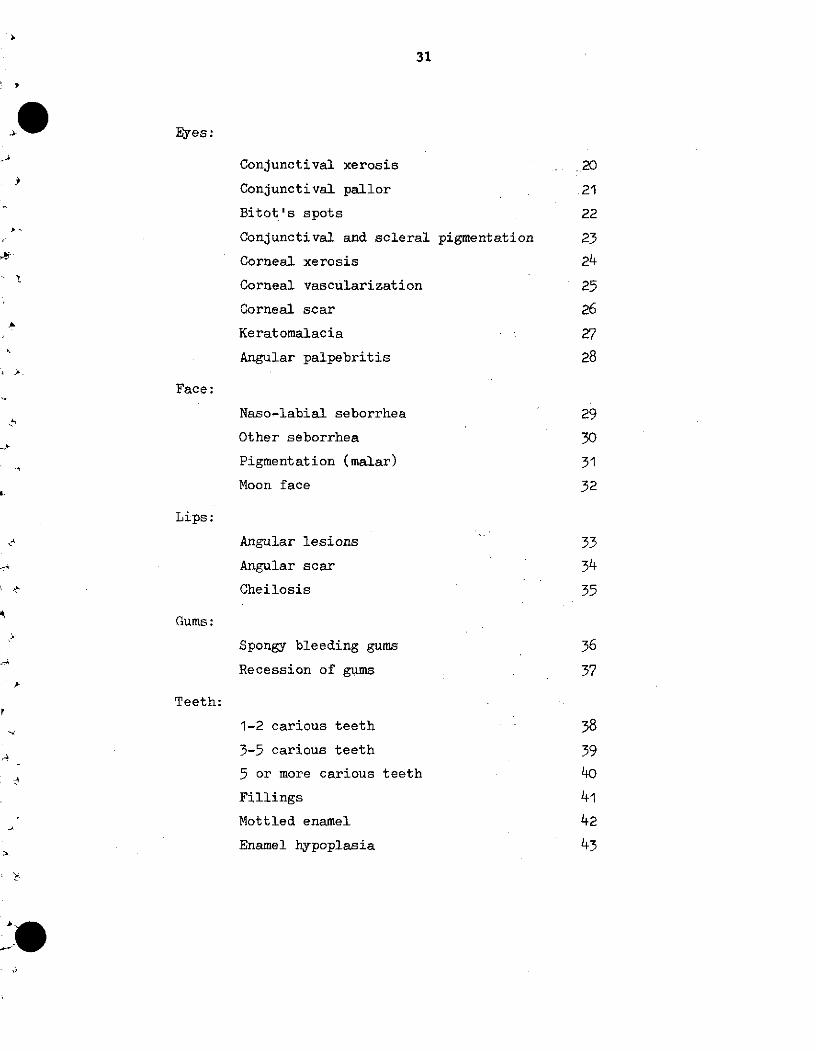
Eyes:
Conjunctival xerosis 20
Conjunctival pallor 21
Bitot's spots 22
Conjunctival and scleral pigmentation 23
Corneal xerosis 24
Corneal vascularization 25
Corneal scar 26
Keratomalacia 27
Angular palpebritis 28
Face:
Naso-labial seborrhea 29
Other seborrhea 30
Pigmentation (malar) 31
Moon face 32
Lips:
Angular lesions 33
Angular scar 34
Cheilosis 35
Gums:
Spongy bleeding gums 36
Recession of gums 37
Teeth:
1-2 carious teeth 38
3-5 carious teeth 39
5 or more carious teeth 40
Fillings 41
Mottled enamel 42
Enamel hypoplasia 43
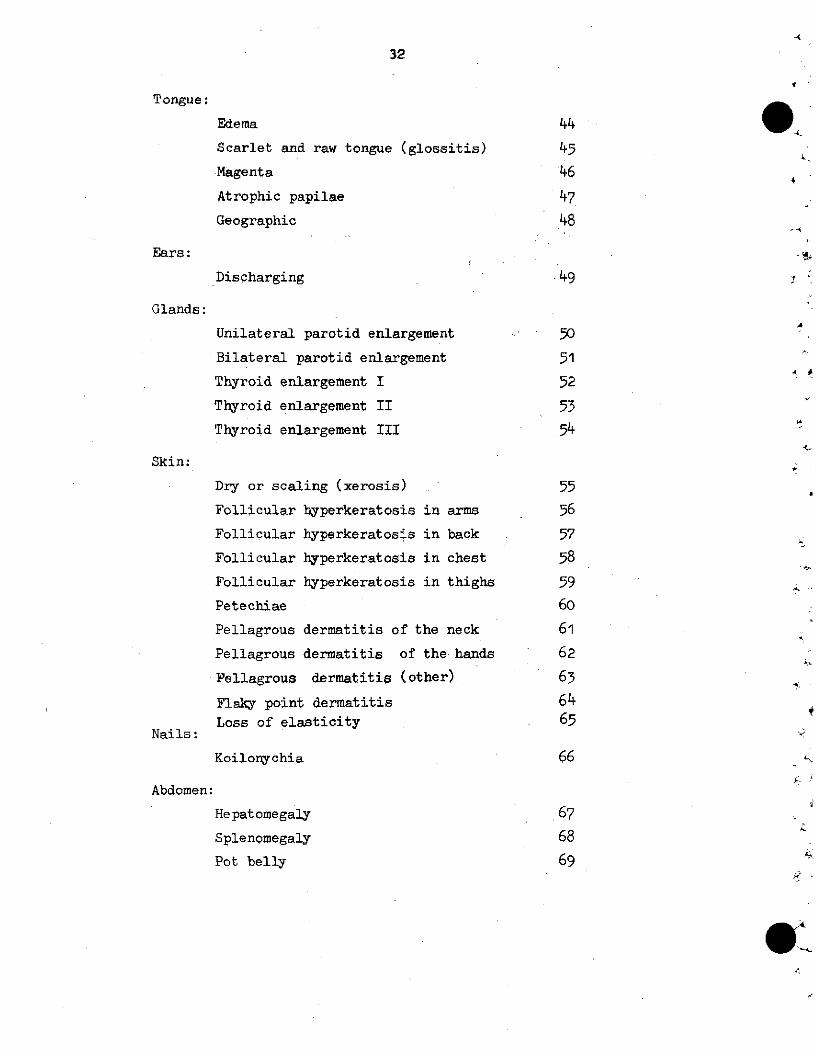
32
Tongue:
Edema 44
Scarlet and raw tongue (glossitis) 45
Magenta 46
Atrophic papilae 47
Geographic 48
Ears:
Discharging .49
Glands:
Unilateral parotid enlargement 50
Bilateral parotid enlargement 51
Thyroid enlargement I 52
Thyroid enlargement II 53
Thyroid enlargement III 54
Skin:
Dry or scaling (xerosis) 55
Follicular hyperkeratosis in arms 56
Follicular hyperkeratos-s in back 57
Follicular hyperkeratosis in chest 58
Follicular hyperkeratosis in thighs 59
Petechiae 60
Pellagrous dermatitis of the neck 61
Pellagrous dermatitis of the hands 62
Pellagrous dermatitis (other) 63
Flaky point dermatitis 64Loss of elasticity 65
Nails:
Koilonychia 66
Abdomen:
Hepatomegaly 67
Splenomegaly 68
Pot belly 69

33
Muscular and skeletal systems:
Muscle wasting 70
Craniotabes 71
Frontal and parietal bossing 72
Epiphyseal enlargement (tender or painless)73
Costochondrial beading 74
Persistently open anterior fontanelle 75
Bow legs 76
Harrison's sulcus 77
Pigeon chest 78
Nervous system:
Sensory loss 79
Motor weakness 80
Loss of position sense 81
Loss of ankle jerk 82
Calf tenderness 83
Edema:
Unilateral ankle edema 84
Bilateral ankle edema 85
Generalized edema 86
Clinical impressions:
Apathy 87
Irritability 88
Marasmus 89
Marasmic-kwashiorkor 90
Kwashiorkor 91
Undernutrition 92
Overnutrition (obesity) 93
Codes 94 to 00 available for naming special conditions to be
investigated.
-4
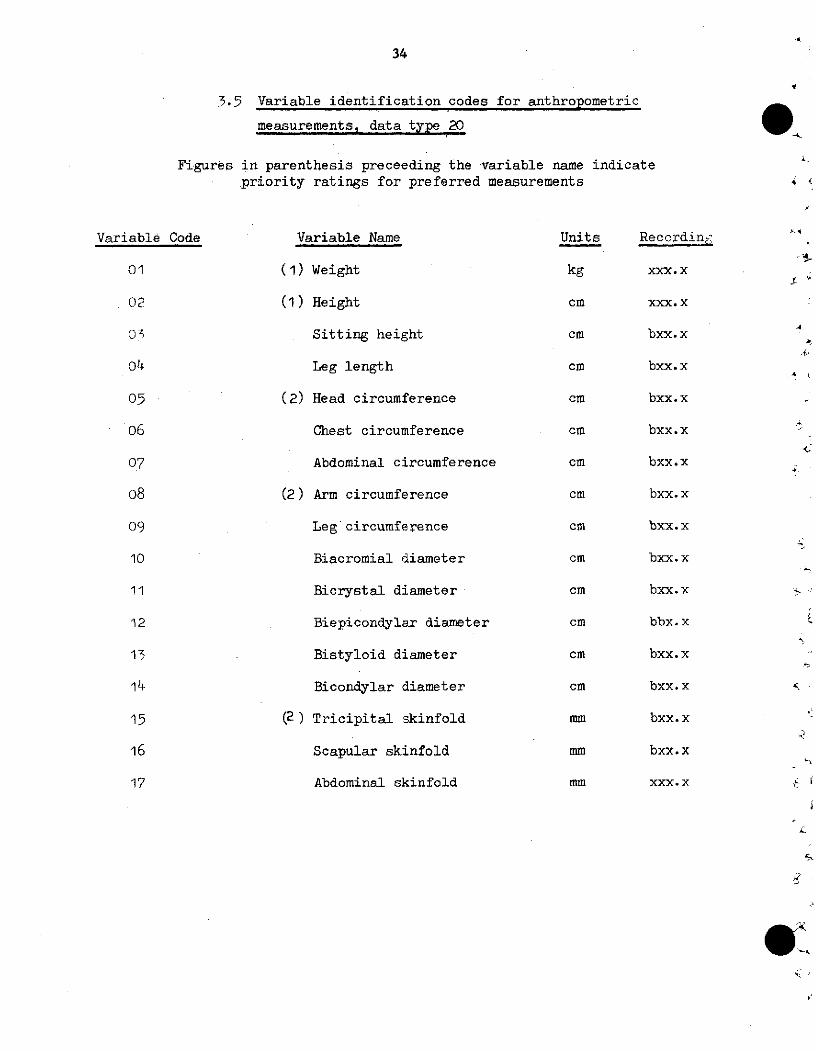
34
3.5 Variable identification codes for anthropometric
measurements, data type 20
Figures in parenthesis preceeding the variable name indicatepriority ratings for preferred measurements
Variable Code
01
02
05
06
07
08
og9
10
11
12
13
14
15
16
17
Variable Name
(1) Weight
(1) Height
Sitting height
Leg length
(2) Head circumference
Chest circumference
Abdominal circumference
(2) Arm circumference
Leg circumference
Biacromial diameter
Bicrystal diameter
Biepicondylar diameter
Bistyloid diameter
Bicondylar diameter
(2) Tricipital skinfold
Scapular skinfold
Abdominal skinfold
'A
<2
Units
kg
cm
cm
cm
cm
cm
cm
cm
cm
cm
cm
cm
cm
cm
mm
mm
mm
Recordin¿c
xxx. x
xxx. x
bxx.x
bxx.x
bxx.x
bxx.x
bxx.x
bxx.x
bxx.x
bxx.x
bxx.x
bbx.x
bxx.x
bxx.x
bxx.x
bxx.x
xxx. x
- -
r'
IK,
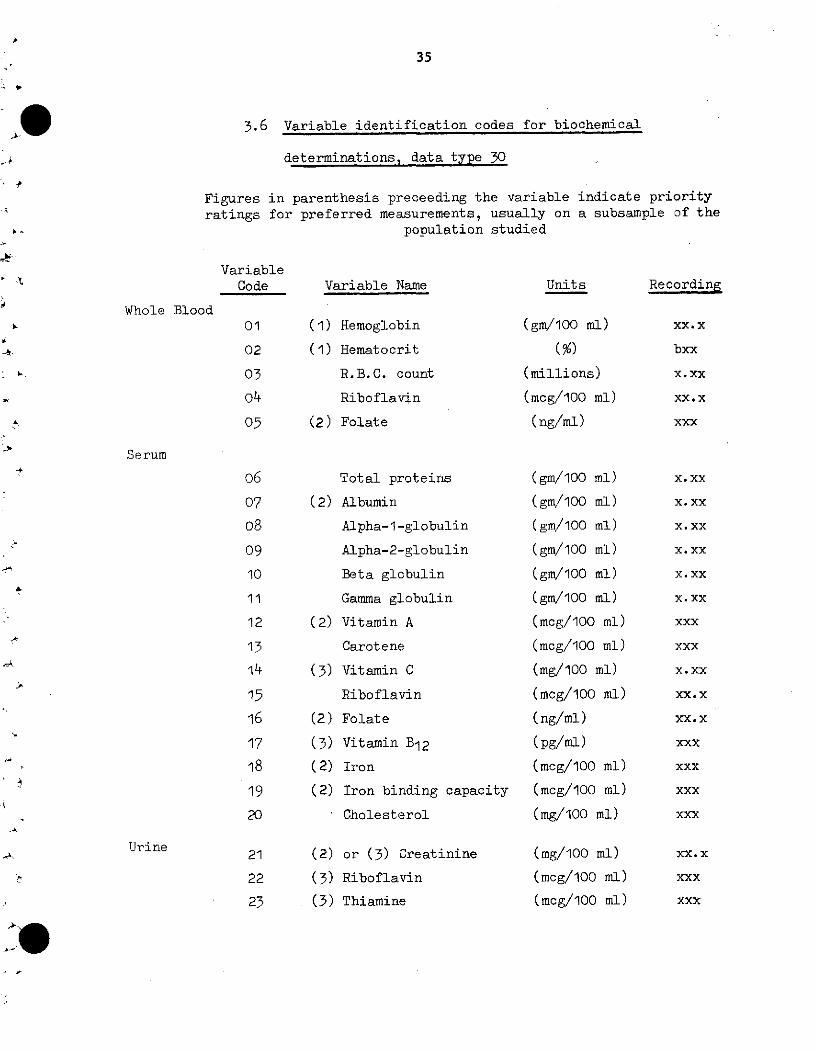
35
3.6 Variable identification codes for biochemical
determinations, data type 30
Figures in parenthesis preceeding the variable indicate priorityratings for preferred measurements, usually on a subsample of the
population studied
VariableCode Variable Name Units Recording
Whole Blood01
02
04
o505
(1) Hemoglobin
(1) Hematocrit
R.B.C. count
Riboflavin
(2) Folate
(gm/100 mi)
(%)(millions)
(mcg/100 ml)
(ng/ml)
Serum
Total proteins
(2) Albumin
Alpha-1 -globulin
Alpha-2-globulin
Beta globulin
Gamma globulin
(2) Vitamin A
Carotene
(3) Vitamin C
Riboflavin
(2) Folate
(3) Vitamin B12
(2) Iron
(2) Iron binding capacity
Cholesterol
(2)
(3)
(3)
or (3) Creatinine
Riboflavin
Thiamine
(gm/100 ml)
(gm/100 ml)
(gm/100 ml)
(gm/100 ml)
(gm/100 ml)
(gm/100 ml)
(mcg/100 ml)
(mcg/100 ml)
(mg/100 ml)
(mcg/100 ml)
(ng/ml)
(pg/ml)
(mcg/100 ml)
(mcg/100 ml)
(mg/100 ml)
(mg/100 ml)
(mcg/100 ml)
(mcg/100 ml)
xx.x
bxx
X. xx
XX. x
xxx
06
07
o809
10
11
12
13
14
15
16
17
18
19
20
x. xx
X. xx
X. xx
X. xx
X. xx
X. xx
xxx
xxx
X. xx
XX. x
XX.x
xxx
xxx
xxx
xxX
XX. x
xxx
xxx
Urine21
22
23
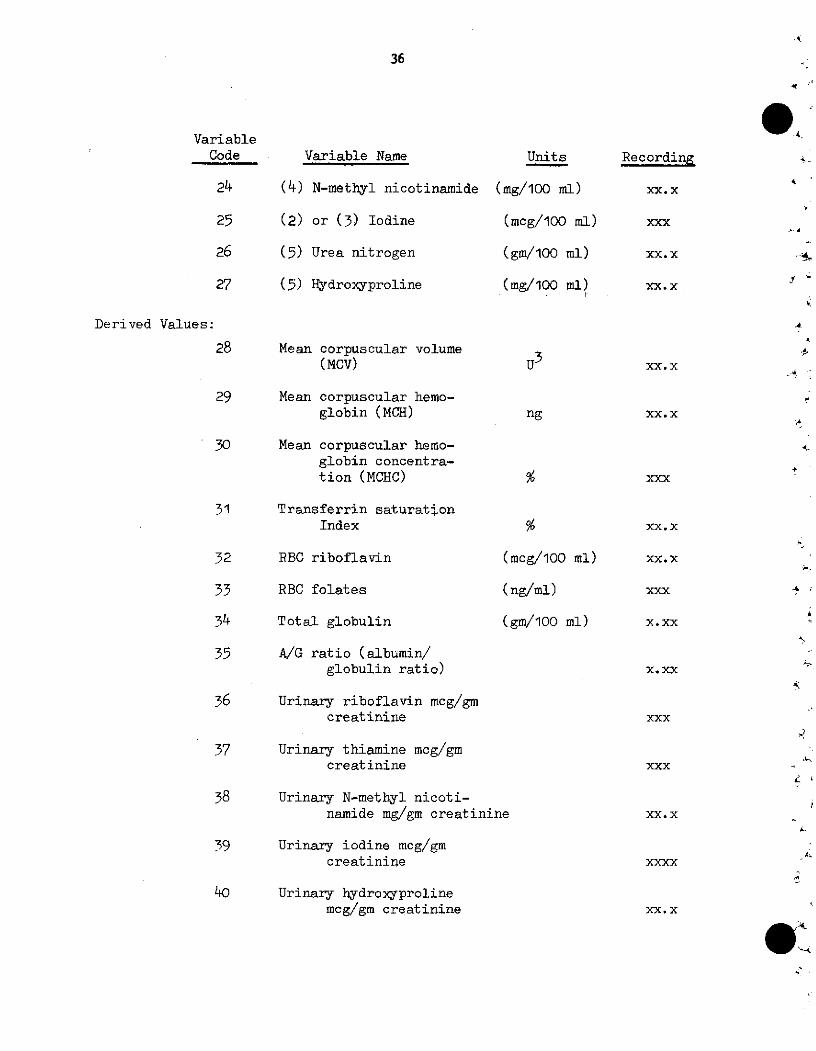
36
VariableCode
24
25
26
27
Variable Name
(4) N-methyl nicotinamide
(2) or (3) Iodine
(5) Urea nitrogen
(5) Hydroxyproline
Derived Values:
28 Mean corpuscular volume(MCV)
29 Mean corpuscular hemo-globin (MCH)
30 Mean corpuscular hemo-globin concentra-tion (MCHC)
31 Transferrin saturationIndex
32 RBC riboflavin (1
33 RBC folates (
34 Total globulin (
35 A/G ratio (albumin/globulin ratio)
36 Urinary riboflavin mcg/gmcreatinine
37 Urinary thiamine mcg/gmcreatinine
38 Urinary N-methyl nicoti-namide mg/gm creatinine
39 Urinary iodine mcg/gmcreatinine
40 Urinary hydroxyprolinemcg/gm creatinine
Units
(mg/100 ml)
(mcg/100 ml)
(gm/100 ml)
(mg/100 ml)p
u3
ng
ncg/100 ml)
ng/ml)
gm/100 ml)
9-4
4,
1~
Recording
xx.x
xxx
xx.X
xx.X
XX. x.4
XX. x
xxx+
XX. x
XX. x
xxx
X.xx
X. xx
xxx
xxx
XX. x
xxxx
4,
4
XX. x
.s
_-,
37
CHAPTER IV
Guidelines for interpretation of survey data
4.1 Introduction
The primary purpose of these guides is to permit within the
limits of knowledge and methods a realistic interpretation of the
data collected during a nutrition survey in terms of character-
izing the nutritional status of population groups. In a nutrition
survey one is concerned with assessment of nutritional status of
population groups, identification of nutrition problems, their
variation, severity and with those factors which influence
nutrition health and the opportunities for betterment.
The spectrum of nutritional health state extends between two
theoretical limits: that of optimal nutrition, when the metabolic
needs are amply satisfied and that of extreme deficiency which re-
sults in severe metabolic-physiologic alteration interfering with
life processes. In between there is a continuous approach of
either extreme. On the elaboration of the Guides for interpre-
tation of data which define the two extremes (optimum health and
ill health to death), several criteria are employed to assist in
describing and identifying that portion of the population that is
at a "severe risk" or at a "deficient or near déficient state",
and likewise that portion of the population that are candidates
for moving into this "deficient or severe risk" state if tissue
nutrient levels deteriorate. These are classified as at "risk".
38
4.2 Limitation of individual methods of appraisal
4.2.1 Anthronometric assessment
Anthropometric data is extremely useful in
characterizing the general health status of individuals
or of population groups. The direction and magnitude
of resulting changes in child growth and adult
physique are beyond doubt the simplest index for
appraising nutrition status. From a Public Health
point of view, the important issue is the definition
of the size of the population at nutritional risk and
an estimate of the severity of risk. Anthropometric
measurements of height and weight are in general sen-
sitive measures of health status of preschool children.
One must keep in mind that growth retardation - height
and/or weight - may and often is due to a combination
of factors such as infectious disease, inborn errors
as well as due to malr.utrition
Weight for age or weight for height is a measure
or index of current nutritional status. The well-known
G6mez classification of malnutrition (PCM) in preschool
children which is based on weight for age enables one to
classify the retardation according to the degree
(severity) of malnutrition
Linear growth is a measure of the deviation from <
growth over an extended period of ,ime reflecting the
past history of malnutrition or ill health.
39
In order to identify the prevalence and severity of mal-
nutrition or growth retardation, the measurements must be compared
for interpretation to a so-called "reference population or standard".
For preschool children the so-called "Harvard standardsf"* have been
widely used throughout the world. (Jelliffe 1966).**
It must be remembered that although anthropometric data
is extremely valuable in characterizing the general health and
nutrition status, this data does not identify the type or cause of
malnutrition.
Note: Standards for interpretation to be inserted at a
later date based on the collaborative anthropometric study for
Latin American.***
4.2.2 Physical - medical examination
Physical examinations and anthropometric measurements
can usually be extended to cover much larger population groups
that can be includedin biochemical and dietary appraisal.
Physical "indicator lesions" of nutritional deficiencies may
come and go unpredictably in mild deficiency states. Few, if
any of the physical signs of suboptimal nutrition in mild forms,
are specifically diagnostic. Other factors or vectors in the
environment may result in similar alterations; the concomitant
* References: Stuart, H.C., and Stevenson, S.S. (1959), "Text-book of Pediatrics". Ed. W.E. Nelson, 7th Edition, Saunders,Philadelphia.
** 'The Assessment of Nutritional Status of the Community", D.B.Jelliffe, WHO, 1966.
*** "Manual of Internationally Comparable Growth Studies in LatinAmerica and the Caribbean." Draft - October 1972, PAHO,
Washington, D. C.
40
presence of several deficiency states may obscure
the appearance of clear cut clinical signs. Those
characteristics which are dependent upon slight
deviation from normal, in cases of suboptimal nutrition,
are invariable susceptible to pronounced differences in
classification and recording among physicians.
Experience demonstrates that there is less likelihood
of divergence of opinion by examiners, for those lesions
characteristic of frank overt deficiency disease. In spite
of these limitations, the prevalence and severity of physical
indicator signs of malnutrition in population groups have
value in nutritional assessment, especially when considered
collectively with dietary, biochemical and anthropometric
data.
4.2.3 Dietary intake studies (see Table 5)
Dietary studies constitute an essential part of any
complete nutrition survey. Populations which for extensive
periods have subsisted on dietary intakes which are marginal
in protective nutrients may fail to reveal any recognized specific
nutritional deficiency lesions; however, they may be at "risk"
of developing overt malnutrition if subjected to further stress.
It must be appreciatéd that dietary data represent only the
situation at a given limited time. Seasonal foods and other
variations of dietary intake may often significantly alter
nutritional status. Likewise, it mus~ be appreciated that dietary
data represent only the situation at a given limited time.
Seasonal foods and other variations of dietary intake may often
significantly alter nutritional status. Likewise, it must be
4
4
4
L
1.
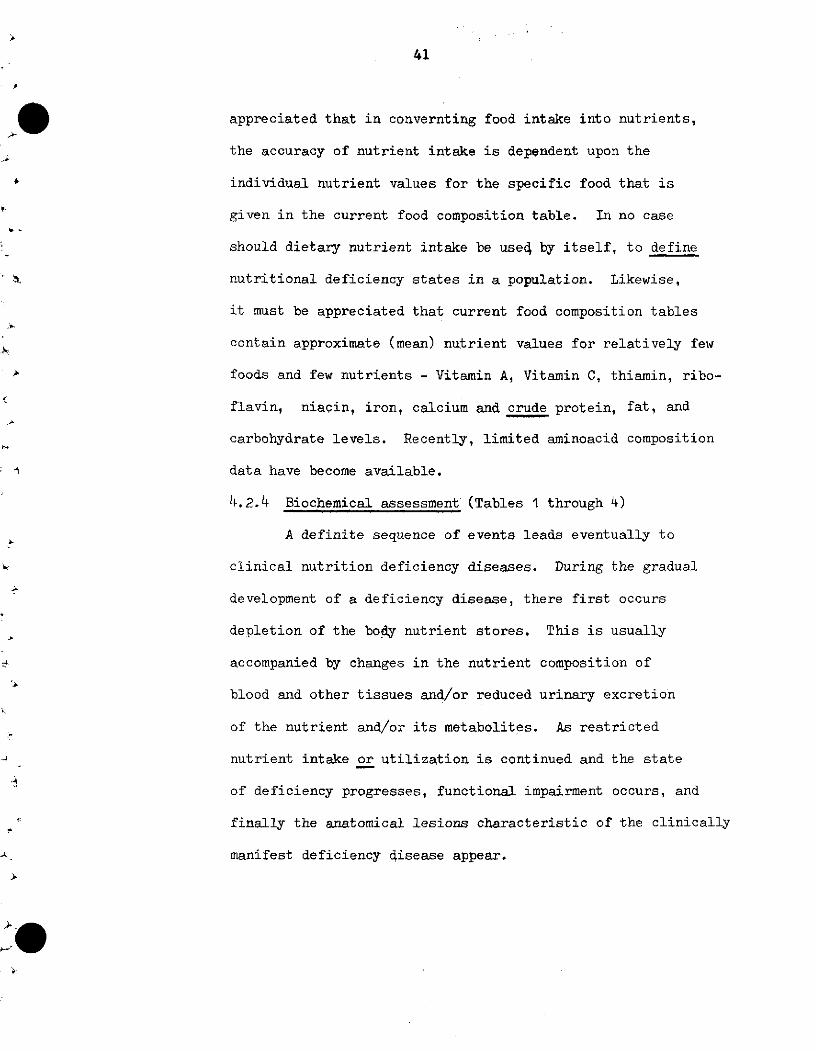
41
appreciated that in convernting food intake into nutrients,
the accuracy of nutrient intake is dependent upon the
individual nutrient values for the specific food that is
given in the current food composition table. In no case
should dietary nutrient intake be useA by itself, to define
nutritional deficiency states in a population. Likewise,
it must be appreciated that current food composition tables
contain approximate (mean) nutrient values for relatively few
foods and few nutrients - Vitamin A, Vitamin C, thiamin, ribo-
flavin, niacin, iron, calcium and crude protein, fat, and
carbohydrate levels. Recently, limited aminoacid composition
data have become available.
4.2.4 Biochemical assessment (Tables 1 through 4)
A definite sequence of events leads eventually to
clinical nutrition deficiency diseases. During the gradual
development of a deficiency disease, there first occurs
depletion of the body nutrient stores, This is usually
accompanied by changes in the nutrient composition of
blood and other tissues and/or reduced urinary excretion
of the nutrient and/or its metabolites. As restricted
nutrient intake or utilization is continued and the state
of deficiency progresses, functional impairment occurs, and
finally the anatomical lesions characteristic of the clinically
manifest deficiency disease appear.
42
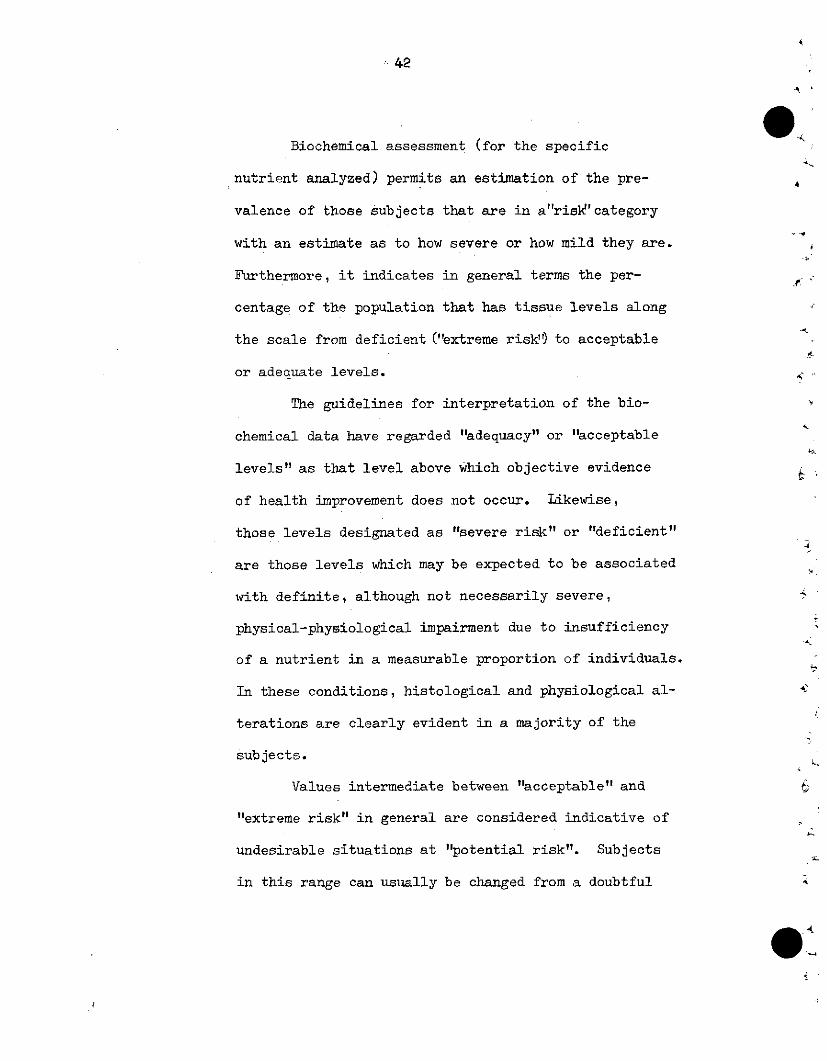
Biochemical assessment (for the specific
nutrient analyzed) permits an estimation of the pre-
valence of those subjects that are in a"risk'category
with an estimate as to how severe or how mild they are.
Furthermore, it indicates in general terms the per-
centage of the population that has tissue levels along
the scale from deficient ('extreme risk") to acceptable
or adequate levels.
The guidelines for interpretation of the bio-
chemical data have regarded "adequacy" or "acceptable
levels" as that level above which objective evidence
of health improvement does not occur. Likewise,
those levels designated as "severe risk" or "deficient"
are those levels which may be expected to be associated
with definite, although not necessarily severe,
physical-physiological impairment due to insufficiency
of a nutrient in a measurable proportion of individuals.
In these conditions, histological and physiological al-
terations are clearly evident in a majority of the
subjects.
Values intermediate between "acceptable" and
"extreme risk" in general are considered indicative of
undesirable situations at "potential risk". Subjects
in this range can usually be changed from a doubtful
43
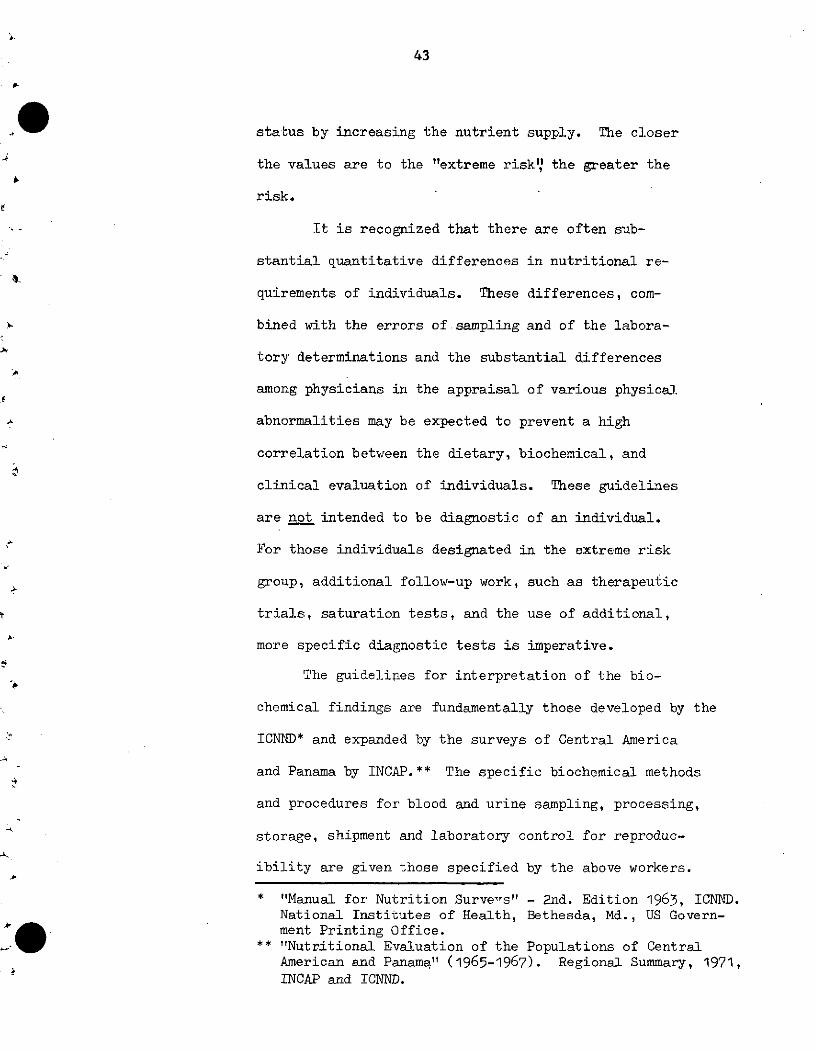
sta-tus by increasing the nutrient supply. The closer
the values are to the "extreme riskI' the greater the
risk.
It is recognized that there are often sub-
stantial quantitative differences in nutritional re-
quirements of individuals. These differences, com-
bined with the errors of sampling and of the labora-
tory determinations and the substantial differences
among physicians in the appraisal of various physical
abnormalities may be expected to prevent a high
correlation between the dietary, biochemical, and
clinical evaluation of individuals. These guidelines
are not intended to be diagnostic of an individual.
For those individuals designated in the extreme risk
group, additional follow-up work, such as therapeutic
trials, saturation tests, and the use of additional,
more specific diagnostic tests is imperative.
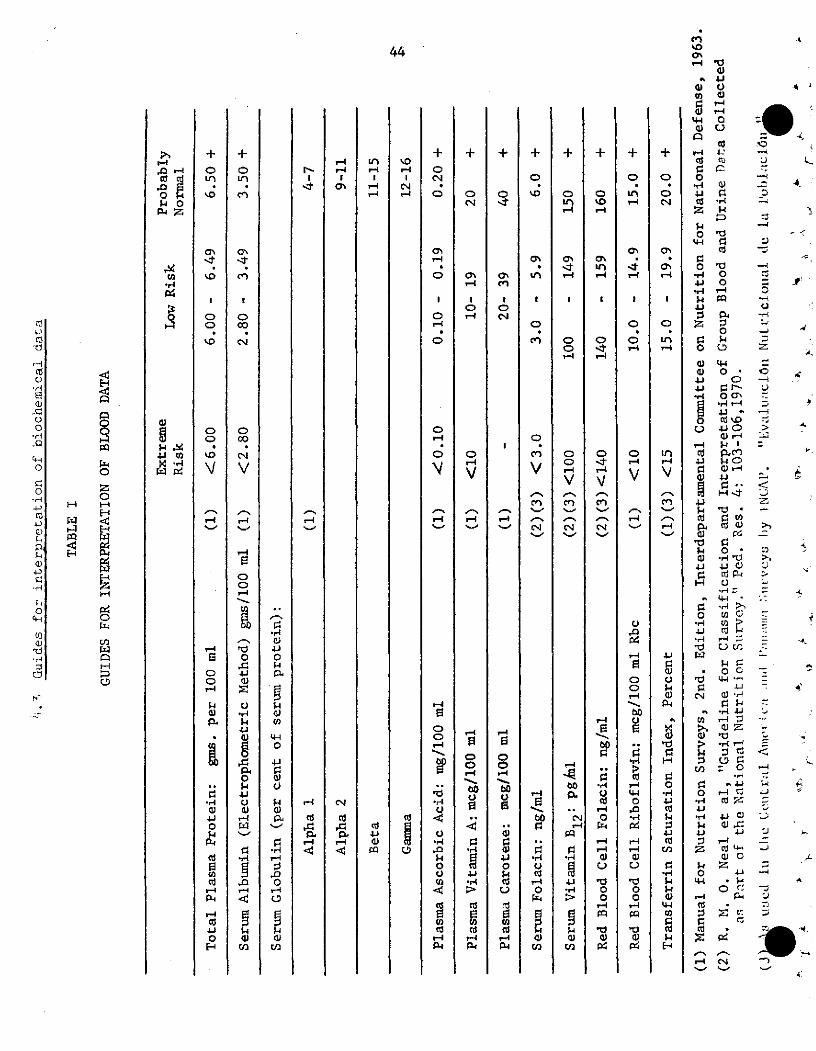
The guidelines for interpretation of the bio-
chemical findings are fundamentally those developed by the
ICNND* and expanded by the surveys of Central America
and Panama by INCAP.** The specific biochemical methods
and procedures for blood and urine sampling, processing,
storage, shipment and laboratory control for reproduc-
ibility are given those specified by the above workers.
* "Manual for Nutrition Surve-s" - 2nd. Edition 1963, ICNND.National Institutes of Health, Bethesda, Md., US Govern-ment Printing Office.
** "Nutritional Evaluation of the Populations of CentralAmerican and Panama" (1965-1967). Regional Summary, 1971,INCAP and ICNND.
+1 + 1+ 1 +
0%
o
1-4
<Y-
n1
ON
o
cli
o
1
B
r~i
'-4O
"4Eí
a0
u
P4
O
00
$-4PW
o
'.
a%
U')
Lo
Oo
V
1
Co
en
o
CSv
'en
N
rc"
60ip
.H
0
V-4
0
·ci
ci
Z
vi
OFz4E)Ci2
U)oLo'-4
0%4
1-
0o\O
ri
'0Lo-4
o OC>
IC111rc1
oo
cnCo
-4
00-4
uv
N
a
c.
4.O>
U-P.,H9$4
o
*4
Co
V-v
cnecm
d
o
aHo
Ho
P-4
P-
-r4
o
Cdrl
oo-4
p-Id
Oo
'-4
C%
4;
'-4
CE
lt
o
o
o
P..
-O
1-4
V
00ri
O
*.4
v'.-4
4-4
Eno
1-4
-4
01 H
oo
0
0ri
bs
a
u
oo
0
N
a%
0%1-4
ot
1-4
n
Lo
P-4
V
$4
ci¡-4
1
lov
H
V_
0
$4
vic
C4
u
;j
ci
aH
*rce
V.
w
$4
W
(o
IdH1
D
, 4J
4 o
0 uC 4 -
0 0-o -o
O ?
O to
ircr4
oe -
.a v
iO rj
l o -
14 4 ·
¿a e
O T.
g4 C:
4 o-_
,) O O'O O-{cfi -
1 -Z F
(d acf i
O 4-i -:
-4 ·
O e '
*,.c vi :
z v,-, -'
o ¿a -44 .$ 4,
vi r* -
vi _
- <- -
44
"-40
o\
h-4
15o fl
$40P i.
C.W
>s .r4
Lo*,,
4i Wá -r
H
,-1
E-4
O
o4:
H
H
e,
-i.
c
m)
4
-4l
rvi
-4
.C
'-4
vi
4i¿a
o
o\
0
0%4
oo
$.0
o
V
<D
'0
-4
o
o
-4
E
$4
Oi
V
cik
O,
¿a
1
ou
Ovi-4
5
o
0
P-
140<
vi
14
el,P-
rd
1
+Oo
Lo
04
Co
ocoC'4N
co
V
eOoo
a
ed
0
$4O>
o
$4.ku
a)w
-4c0
-4
a>u0
.H
9
9!w
m
+o
o0
'-4
o
o
o
o
1-
o'
O>
a"iO
Ni
^ - ^i 4
B
-_40o
o
bD
0
o
-l
$4
o
ej
u)
--i
r4
14
o
0%
1-4
o
-4O
O
o
000
..
¢
Cd0
ci
¿a"-4
u,{
P4p.
r.-e)
c.i
14O>
¿a
o
$4
$4
4-4o
ci0ci
$4e)p-.
e-1
1-4cio0O
[U
45
-4
a
D
ti
-1
cm
el
c:O
'-4
a,cn
~0.
.4-
oo
W
14.
>4
M
0sry
0cn
¥
Oou'l
yIniv
0en
y
Vy
0m,
o'e
0en
y
0o
0
y
o%v'a
0e,
oY
ocrM0V
O
V
o'e
0e,
y
va^
y
o
Vyl
In
V
ot'
¥
o
¥D
o
V*
Vy
uV
o
¥
0my
S Ç-e '0 ' rN e r e " b _
O 2 _n t" m m ¡ 4 e 4 e, e e,
,4
_ M ' v O"u l 0 re 0% 01 U1 fC c 0 L -es 8.. 0 I .O r ._ _ O _ _
9. \d c; , o o _- ; _ _ o] ; __
_4 c X u ~ O _ ~ O r -_ - O O-_;4 P4 9-4 a-4 v4 "W
oj VuD
oo , eo OJ vD Jo 4 0 CU4-4 F4 c' CJ c_ U °N_
h -A 4 -44 -4 -4 -4 --4 -4
4I 4. c 44.1
4.4 U U
4> ~ ! -4 *rc 0% el ,-l ~ -4 r
W~~~~~~- -4 ci0i- - -C -i -1PI I
H-
c :c
HI
HI w
4 ,*,i
Q
a)c:
UEz
RCIO
ili
H
4
0l
a:
40
V-4
O
0
eP:
o
c-04
C
O
14V o
04,
loC
0.'u
0
0
C4cU
-4
.u
4>-4C cu
* 4 .
O
O Uo
C E-4
o 4
> c
L. vQ
u
:> Z :
3 o_
I I I 1 i i . i
9 1 i i i i i i j i i 1
0f.
az
.
.1
-A
4
-o
* '
46
o"-40
asC)
Cd.4cao
a}
0
'44'-4
cu
r:
w4
o
*,«
u
ca0
O
'-m
co
'44
1I4·..iP%4
1$4 0
0rzi
$4 0
pp
1
4
ma
14JC
lii
X .
ror
0 1
p4
ppz
HHkI-4
w14
E-'
nCn
c9n
la
O
oO+nIv
-lt.4
1ocn
oC>cn·y
".H'-4oo40
un
74
O
-Ú
Oo4o
a%
o
o.'
y
o'-.4f-4
H
o'
oaO
rla
On
o\
nOI\i
r1lE!
oo
H
oy-.4
50S
w
n.
\i
o
liicn
o
Ci
Y
o
o'
\i
o
r-4CO
o
'-4oo
r.
.r4
9
cd
a>,Sí
r4
Cd4
ca4.
td
ri~
+
oSO
o'
LO
LO
Ln
Ln
'-4
o
oC)'-4
-rla>
o$4a)
C
w
47
+++++$+++%0 V-4 y-< V- r D Un 0
om co o ino U
$-n 000 CO . LO U* L
V ) b n sc4c
00 LO '.0 LO
oLOooor-oS '
C'4000hrOUIN
" V 'V \ V \ V\1
02
44L
'l% C -" .41 1 1 1 1
P-41-r- cP-4 P-4
vIjO
WC'4Z <%J1-1
4i 12
0)Qr. 4"~4i 4ic
+++++++0000000
U) C CS )
o 9 - O o aNOO D cO O O' OD
OOMO~O' o vo a Vv V x
O 0100 f0%.L 0 0 o N «r o
,4
*41
e14uO
a
oA7
cd Cd- .C
çg~ ~~c VV.
% = = = r,-4 ">a)
cn 1. 0% P- S d
0 r.u-la
CeC
I I I I +00w a)
,-4 -t r- O W W 54
1-4 " P4 P
4-
>4
z
H
'-E
o
w
r40<1
0
z
'.00,t
o
P4
A
-14P:
02
b
o
a
(ni
0
a0uOo
P.bOw
9bO
u..
e
000
O v*
000
. .'4 4
Id
000
4i.74 o
oo
lu
+o(O
a%
LnC\1
Un
LO
a)
e
o.4
e.4-La
aJ
dC>
0
-44u
É
o
0
'1>
e
o'-.
.,o
·C(.74<4-4
O
-oe
",Eek>
ON
r'-
e
o
u
.H
aE
40
wa
b'
O.H
(4
O1O
_
U)
,i
e
o
ap
.,7
-74
z00(U
r> e
.>
h
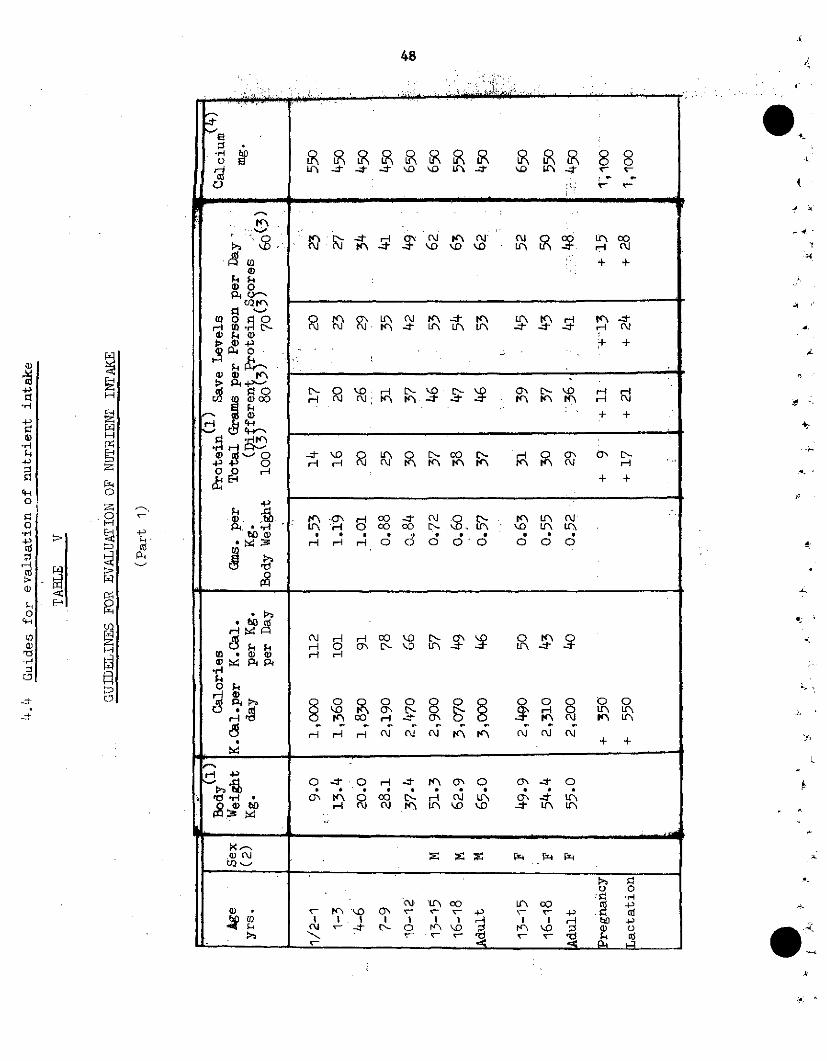
48
I I IL I O o II I I I Io Iu I I
o00
m " l0 \ U'\ (UJ S <0 00 .0 -1 nM
X a 0 r- O re h"c < D Lt- n n 4a'w > O ' X.( Iu -,t *.>/ H. '-, 4
H i
cl, C·on $ o -^ : - w + +
·'r L: '- O d- . . . d· iH 0 0 -Io o\o' k4) D'\
crfi~ h -.IJ
· oo. .O H 0 0 M ; .N
. A iMri * o: -S i p
H iin c3\ 0 Ln cg 0(
bo1r Lr\ Or\ t O
h3 ·i ,a r di 'n@ @ X >'
12.1
EH
H
H
x
i
O
C;:
PC4
H
z
0
i
H
iU)
-4
W
?7
Al.
4k
4
i
1
,.4
iI,
9 10
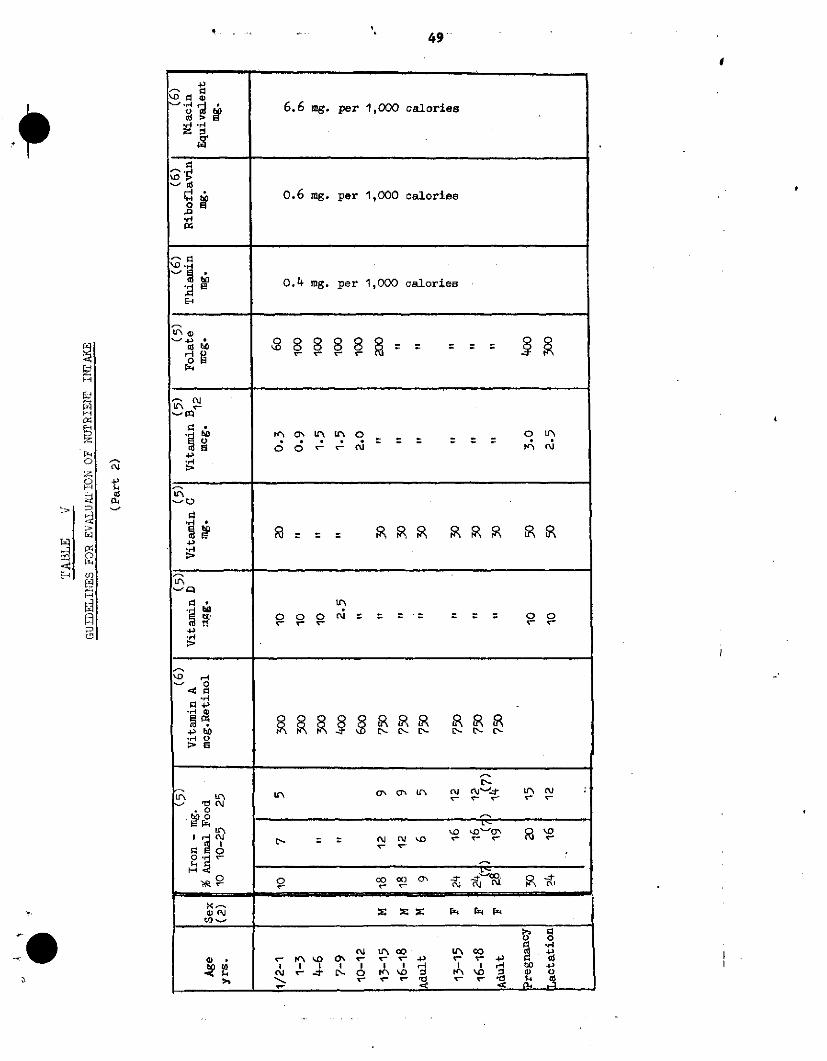
49
- -D 0
'r 08 6.6 mg. per 1,000 calories
0.6 mg. per 1,000 calories
0.4 mg. per 1,000 calories
E4q
u u
4~-
_ fr\ ta UN uo O r
ir'
4>
u.
·D 0
E~ '" L~ -O a :
4 >
R. Eo '_ - '"0 0
co · - co II
y-N V- y-y- . I n <l I I - * I II* 4 .a,
4> * (I'%1 D -' o' o' o '- ° 4 hp, ~<ur~~- ~\ ~ P'\r r-0 r~~~pz ~ ~ y y--' y-; y*- *t ~~4D
t
<-u4._
0al
F1FI
k-4
LQ
x
z
Cf)
o,
cnm,V--
dn

50
GUIDELINES FDR EVALUATION OF NUTRIENT INTAKE eJ(Part 3) 4
4,
R E F E R E N C ES
(1) Adopted after WHO/FAO Report.Ad-hoc Expert Committee on
'!Energy and Protein Requirements", Rome, 22 March / 2 April,
1971.
(2) M: male - F: female. .
(3) Scores are estimates of protein quality relative to egg milk
protein taken as 100. Corrected protein requirements for
80-70-60 score may over-estimate safe level needs for both
adult males and females.
(4) Calcium - adapted from INCAP (Institute of Nutrition for
Central America and Panama) "Regional Summary - Nutritional
Evaluation of the Population of Central.America and Panama",
1971.
(5) Report of a joint FAO/WHO Expert Group - FAO Report No. 47, 4
1970 - "Requirements of Ascorbic Acid, Vitamin D, Vitamin B12,
Folate and Iron - (Adjustments made for age groups).
(6) Report of joint.FAO/WIHO Expert Group - FAO Report No. 41, 1961 -
"Requirements of Vitamin A, Thiamine, Riboflavine and.Niacin".
(7) Iron requirement for a menstruating female.
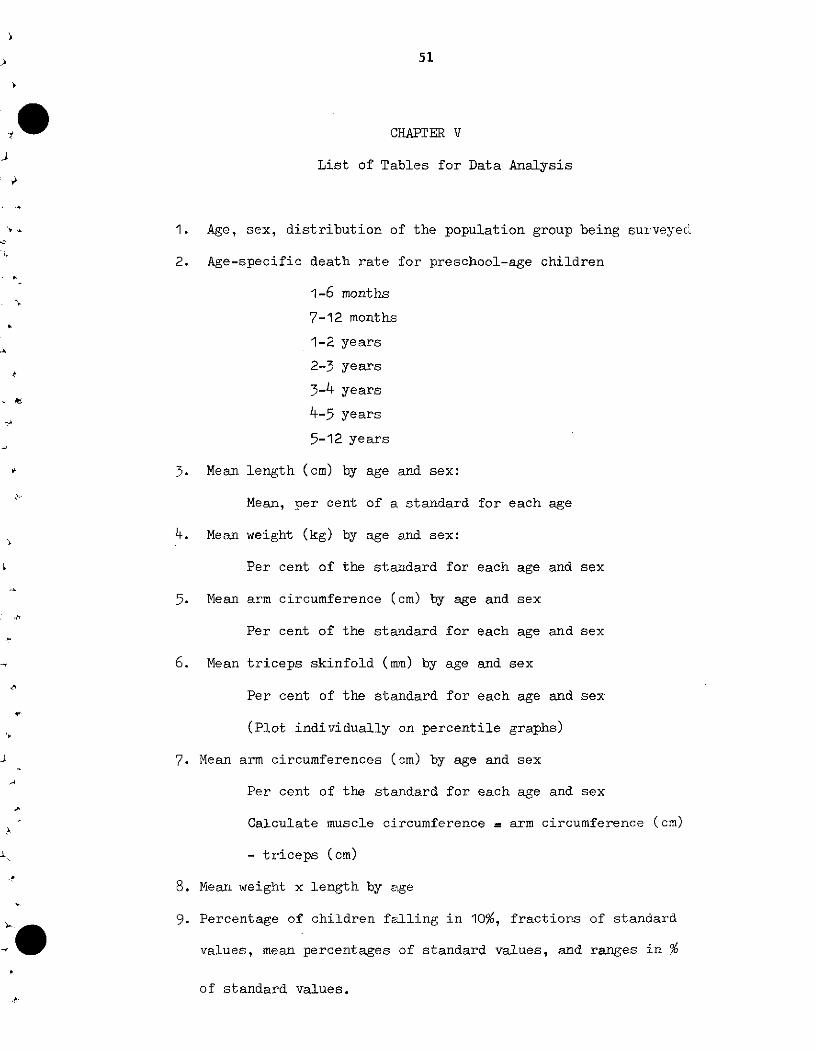
51
CHAPTER V
List of Tables for Data Analysis
1. Age, sex, distribution of the population group being surveyec;
2. Age-specific death rate for preschool-age children
1-6 months
7-12 months
1-2 years
2-3 years
3-4 years
4-5 years
5-12 years
3. Mean length (cm) by age and sex:
Mean, per cent of a standard for each age
4. Mean weight (kg) by age and sex:
Per cent of the standard for each age and sex
5. Mean arm circumference (cm) by age and sex
Per cent of the standard for each age and sex
6. Mean triceps skinfold (mmn) by age and sex
Per cent of the standard for each age and sex
(Plot individually on percentile graphs)
7. Mean arm circumferences (cm) by age and sex
Per cent of the standard for each age and sex
Calculate muscle circumference = arm circumference (cm)
- triceps (cm)
8. Mean weight x length by age
9. Percentage of children falling in 10%, fractions of standard
values, mean percentages of standard values, and ranges in %
of standard values.
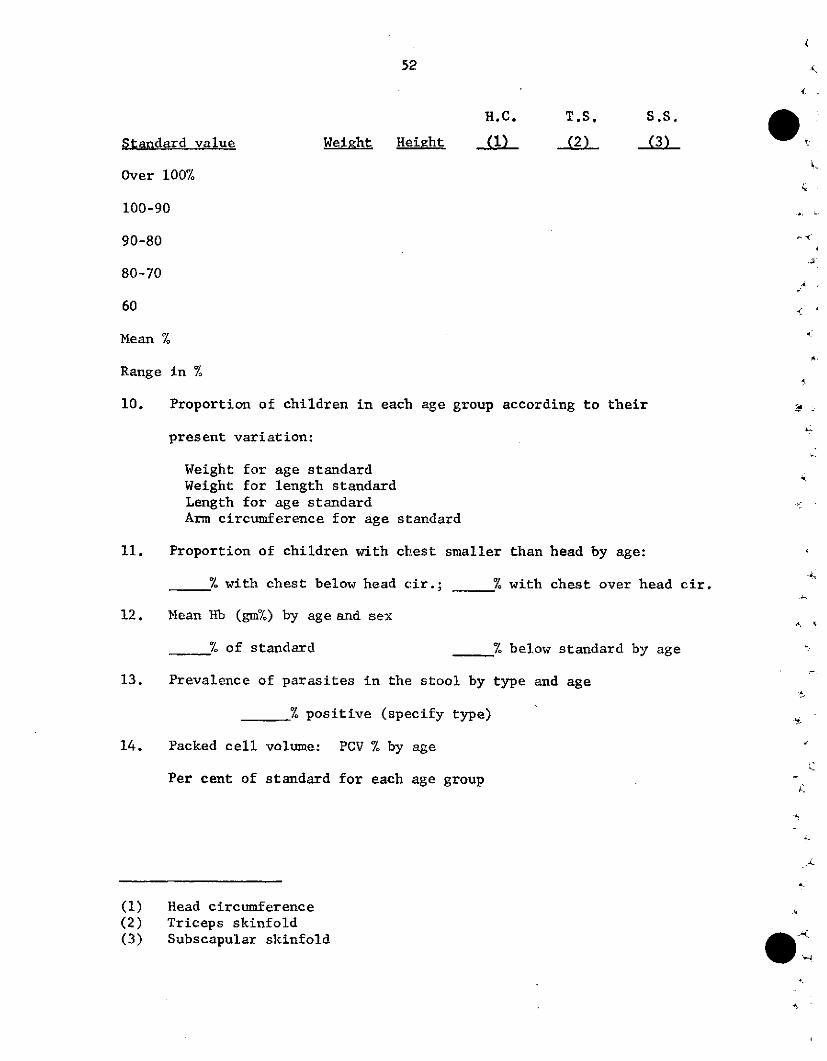
52
H,C. T.S. S.S.
Standard value WeiRht Height (1) (2) (3)
Over 100%
100-90
90-80
80-70
60
Mean %
Range in %
10. Proportion of children in each age group according to their .
present variation:
Weight for age standardWeight for length standardLength for age standardArm circumference for age standard
11. Proportion of children with chest smaller than head by age:
% with chest below head cir.; % with chest over head cir.
12. Mean Hb (gm%) by age and sex
% of standard % below standard by age
13. Prevalence of parasites in the stool by type and age
% positive (specify type)
14. Packed cell volume: PCV % by age
Per cent of standard for each age group
(1) Head circumference(2) Triceps skinfold(3) Subscapular skinfold
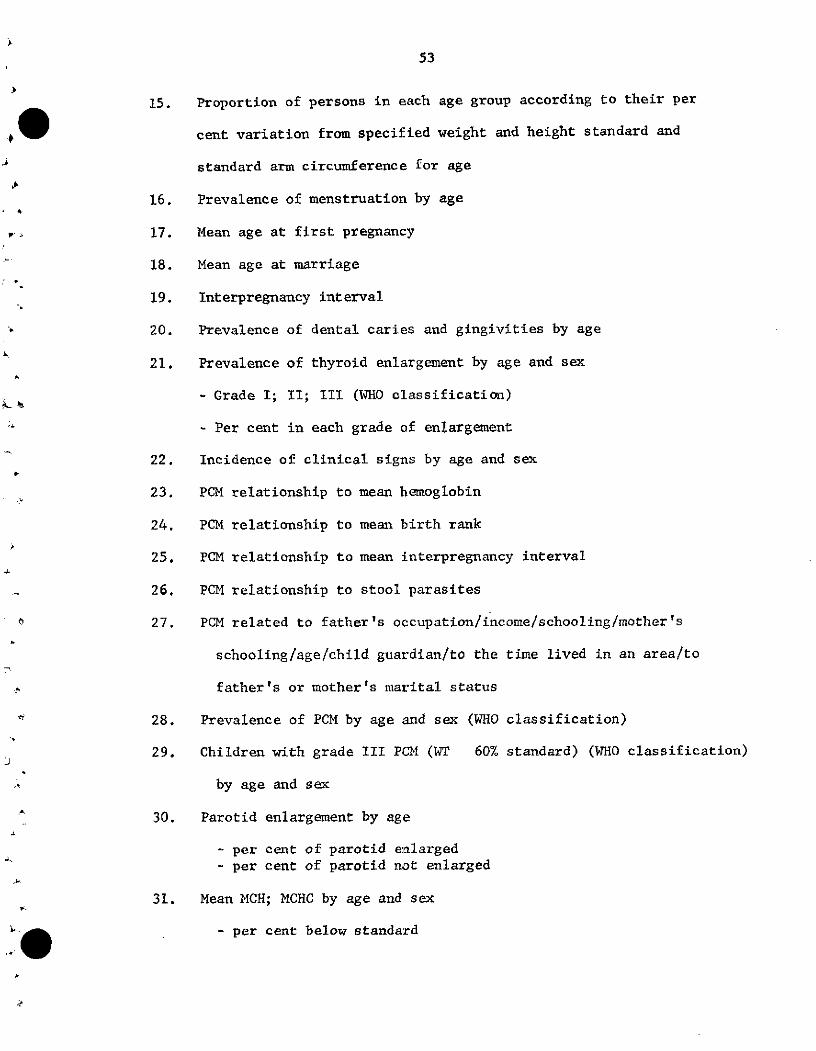
53
15. Proportion of persons in each age group according to their per
cent variation from specified weight and height standard and
standard arm circumference for age
16. Prevalence of menstruation by age
17. Mean age at first pregnancy
18. Mean age at marriage
19. Interpregnancy interval
20. Prevalence of dental caries and gingivities by age
21. Prevalence of thyroid enlargement by age and sex
- Grade I; II; III (WHO classification)
- Per cent in each grade of enlargement
22. Incidence of clinical signs by age and sex
23. PCM relationship to mean hemoglobin
24. PCM relationship to mean birth rank
25. PCM relationship to mean interpregnancy interval
26. PCM relationship to stool parasites
27. PCM related to father's occupation/income/schooling/mother's
schooling/age/child guardian/to the time lived in an area/to
father's or mother's marital status
28. Prevalence of PCM by age and sex (WHO classification)
29. Children with grade III PCM (WT 60% standard) (WHO classification)
by age and sex
30. Parotid enlargement by age
- per cent of parotid enlarged- per cent of parotid not enlarged
31. Mean MCH; MCHC by age and sex
- per cent below standard
54
32. Distribution of women by details of children:
-Live birth alive under 5 alive over 5
died under 5 died over 5
33. Distribution of mothers by nutritional status and children born
alive and died below 5 years
34. Distribution of individual HB, PCV and other biochemical tests in
relation to specified standards.
55
CHAPTER VI
Topics for Research
1. Evaluation of methods for estimating food intake on the basis of
unit cost and accuracy.
2. Evaluation of different methodologies comparing results obtained
using different sampling units (household, family, individual,
mealtime, etc.).
3. Development of indices which measure different aspects of nutri-
tional status. For example, expressing selected results on a
1,000 calorie basis, or on basis of calorie unit cost.
4. Exploration of procedures which would allow the determination
of risk factors in association with levels used as reference
guidelines.
5. Search for indicators of functional and mental development.
6. Indicators of sudden deterioration in nutritional status. Develop-
ment of early warning systems.
7. Development of models which would permit the estimation of the
cost-effect relations in different action programs.
8. Development of models for evaluating the effect of changes in the
offer-demand structure for selected foods with provision for
estimating elasticity patterns.
9. Explorations in the usefulness of systems analyses (linear pro-
gramming), factor analysis, multivariate analysis, etc.
10. Application of simultation techniques.
11. Development of simple and feasible indices for nutritional sur-
veillance.
12. Development of simple indicators of socioeconomic status.
13. Evaluation of economic value of a food supplement in terms of

56
changes in the structure of purchasing power. What does the
supplement substitute economically and nutritionally?
14. Age-independent indicators of nutritional status.
15. Effect of family structure and population dynamics on nutritional
status and vice versa. ,
A
£4
45
57
CHAPTER VII
Recommendations
In general, nutrition surveys require substantial invest-
ments in terms of money, personnel, and time. In the past, how-
ever, the information collected locally was not analyzed exten-
sively and exhaustively. Furthermore, after partial descriptive
analyses are completed, the basic information collected is not
systematically integrated with similar information available
from other sources, to permit diagnosis and quantification of
nutritional problems on a broader basis.
Numerous problems associated with the quality of the data
and lack of adequate facilities for data processing generally
contribute to establishing the conditions of limited use of the
information collected. At present, there are facilities and
instruments which under proper technological considerations
could bring to nutrition surveys the benefits that can be
derived from the sensible use of electronic data processing
systems.
The considerations enumerated indicate that there is a
need for establishing a facility which can operate and serve
as a basic general-purpose information system for nutrition
and related disciplines,
In order to be able to do this, the group recommended:
1. That nutrition research take advantage of the opportunities
available in using automated computer systems for the
processing of data collected in the course of extensive
surveys.
(
58
2. That the data collected in recent coordinated nutrition
surveys (INCAP, CFNI, U.S. National, etc.) be used in
exploring the feasibility of methods for the uniform ¿,
handling, proper indexing, storage, and retrieval of the --
information commonly used in the evaluation of nutritional
problems. 4
3. That once the feasibility of methods is determined, proper
locations be designated to implement procedures conducive
to the establishment of a nutrition information system.
4. Recognizing that computer operations can be inefficient
because of either inadequate facilities or suboptimal
utilization of facilities, site visits (by qualified ex-
perts) should be made to likely locations prior to desig-
nating the center(s) that will take charge of implementing
the information system.
5. That the data contained in the nutrition information
system be edited for internal consistency and validity
and then be continuously used in the search for more sen-
sitive indicators of nutritional status.
6. That, in the search for indicators of nutritional status,
priority be given in identifying those useful for conti-
nuous surveillance and, in particular, to those which as a
group could serve as a basis for establishing an early
warning system in forecasting possible nutritional problems.
7. That particular attention be given to the integration of
the nutrition information system with similar systems that
59
may exist for agriculture, education, and production.
This would make possible a better integration and
coordination of efforts, since real advances in nutri-
tion are conmonly dependent on factors belonging to
these three related areas.