Renewal time and the impact of harmful algal blooms on the extensive mussel raft culture of the...
28
X.A. Álvarez–Salgado et al. — Renewal time and HABs in an upwelling system 1 Renewal time and the impact of harmful algal blooms on the extensive mussel raft 1 culture of the Iberian coastal upwelling system (NE Europe) 2 X.A. Álvarez–Salgado 1 , U. Labarta 1 , M.J. Fernández–Reiriz 1 , F.G. Figueiras 1 , G. 3 Rosón 2 , S. Piedracoba 2 , R. Filgueira 1 , J.M. Cabanas 3 4 1 CSIC, Instituto de Investigacións Mariñas, Eduardo Cabello 6, 36208 Vigo, Spain 5 Corresponding author: Phone, +34 986231930; Fax, +34 986292762; Email, 6 [email protected] 7 2 Universidad de Vigo, Departamento de Física Aplicada, Campus Lagoas – 8 Marcosende, 36200 Vigo 9 3 IEO, Centro Oceanográfico de Vigo, Cabo Estay s/n, 36200 Vigo 10 25/04/2008 11
Transcript of Renewal time and the impact of harmful algal blooms on the extensive mussel raft culture of the...
X.A. Álvarez–Salgado et al. — Renewal time and HABs in an upwelling system
1
Renewal time and the impact of harmful algal blooms on the extensive mussel raft 1
culture of the Iberian coastal upwelling system (NE Europe) 2
X.A. Álvarez–Salgado1, U. Labarta1, M.J. Fernández–Reiriz1, F.G. Figueiras1, G. 3
Rosón2, S. Piedracoba2, R. Filgueira1, J.M. Cabanas3 4
1 CSIC, Instituto de Investigacións Mariñas, Eduardo Cabello 6, 36208 Vigo, Spain 5
Corresponding author: Phone, +34 986231930; Fax, +34 986292762; Email, 6
2 Universidad de Vigo, Departamento de Física Aplicada, Campus Lagoas – 8
Marcosende, 36200 Vigo 9
3 IEO, Centro Oceanográfico de Vigo, Cabo Estay s/n, 36200 Vigo 10
25/04/2008 11
X.A. Álvarez–Salgado et al. — Renewal time and HABs in an upwelling system
2
Abstract 13
The extension and intensity of the upwelling season in the NW Iberian Peninsula 14
(42º– 43ºN) have decreased by 30% and 45% over the last 40 years, respectively. 15
Accordingly, the renewal time (τ) of the Rías Baixas, four large coastal inlets where 16
15% of the World extraction of blue mussels occurs, has increased by 240%. We 17
indirectly demonstrate here that the growing τ has caused the increasing occurrence of 18
harmful microalgae in these embayments, dramatically affecting mussel raft cultivation. 19
The equation
)c
exp(1365D1
τ explains 80% of the variability of the number of 20
days per year that mussels cannot be extracted from the hanging ropes because of the 21
occurrence of harmful microalgae (D). The coefficient c1 = 37± 2 days indicates that an 22
average τ over the upwelling season of > 25±1 or 50± 3 days reduce mussel extraction 23
to only 50% or 25% of the year, respectively. 24
Keyworks: coastal upwelling; flushing time; harmful microalgae; climate change; 25
mussel raft; NW Spain 26
27
X.A. Álvarez–Salgado et al. — Renewal time and HABs in an upwelling system
3
1. Introduction 28
Coastal upwelling systems often experience the occurrence of harmful algal 29
blooms (HABs), which represent a serious threat to humans, induce important 30
ecological perturbations, and cause major economic losses in fisheries and aquaculture 31
(GEOHAB, 2005). Although the number of species and their harmful effects is highly 32
variable (Horner et al., 1997; Pitcher and Calder, 2000), those causing toxin syndromes 33
are of primary concern for human health and, therefore, the economy of the affected 34
regions. Paralytic shellfish poisoning (PSP) and diarrheic shellfish poisoning (DSP) 35
attributed to several members of the dinoflagellates genus regularly occur in the four 36
major coastal upwelling systems of the world ocean. Within the California Current 37
System, outbreaks of amnesic shellfish poisoning (ASP) caused by members of the 38
diatom genus Pseudo–nitzschia are also recurrent (Horner et al., 1997; Trainer et al., 39
2000). 40
The NW Iberian Peninsula is the northern limit of the eastern boundary Large 41
Marine Ecosystem that extend along the Atlantic coasts of Africa and Europe from 42
10ºN to 44ºN (Wooster et al., 1976; Bakun and Nelson, 1991). At our latitudes, coastal 43
winds are favourable to the upwelling of the cold and nutrient–rich Eastern North 44
Atlantic Central Water during the spring and summer and favourable to the 45
downwelling of surface coastal waters during the autumn and winter (Wooster et al., 46
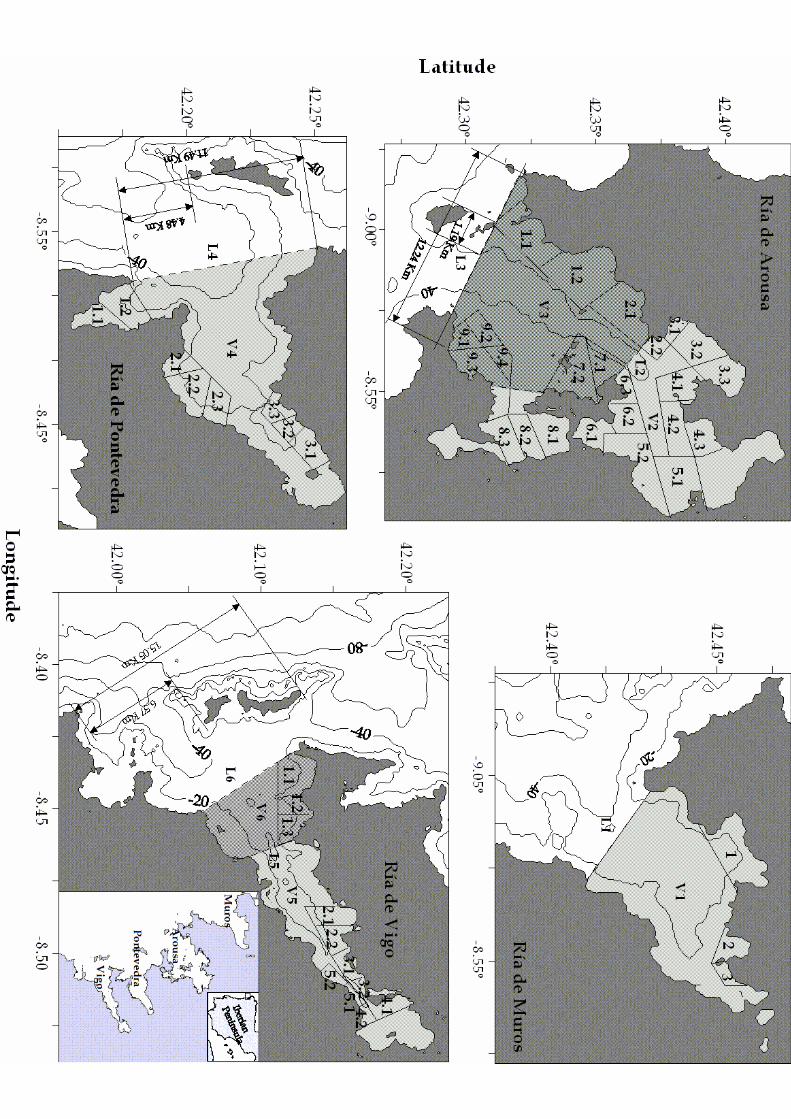
1976; Álvarez–Salgado et al., 2002). Four large coastal indentations of more than 2.5 47
km3, known as Rías Baixas, occupy the Spanish coast in the 42ºN–43ºN latitudinal 48
range (Fig. 1). The Rías Baixas behave as an extension of the shelf during the upwelling 49
season, with northerly winds enhancing the positive residual circulation pattern. On the 50
contrary, during the downwelling season, the outer part of the ría circulates like a 51
X.A. Álvarez–Salgado et al. — Renewal time and HABs in an upwelling system
4
negative estuary forced by the dominant southerly winds, whereas the inner part 52
behaves as a positive estuary forced by continental runoff (Álvarez–Salgado et al., 53
2000; Piedracoba et al., 2005). 54
This unique combination of wind patterns and coastal morphology makes the Rías 55
Baixas an exceptional site for the extensive culture of the blue mussel Mytilus 56
galloprovincialis on hanging ropes. The trophic conditions of these coastal ecosystems 57
—where the total particulate matter is below the pseudo faeces production threshold for 58
mussels (3 mg l–1) and a high proportion of phytoplankton cells is observed (Figueiras 59
et al., 2002) — stimulate high and stable clearance rates (Fernández–Reiriz et al., 2007). 60
As a consequence, the mussels cultivated in the Rías Baixas report the highest growth 61
rate in the word, with a total production of about 250,000 tons of blue mussels per year, 62
40% of European and 15% of the world production (Labarta et al., 2004). In the case of 63
the Ría de Arousa (Fig. 1), with 2300 mussel rafts, the organic carbon in mussels flesh 64
represent about 10% of the net primary production of the ecosystem (Figueiras et al., 65
2002). The highest economic impact on the mussel harvest is caused by DSP episodes 66
due to Dinophysis acuminata and D. acuta (Reguera et al., 2003). D. acuminata, albeit in 67
low numbers, is always present in the Rías Baixas over the upwelling season, while D. 68
acuta typically occurs in short pulses at the end of the upwelling season in September 69
and October (Reguera et al., 1995) associated with downwelling episodes. Major PSP 70
events in the Rías Baixas are ascribed to blooms of the chain–forming dinoflagellate 71
Gymnodinium catenatum, which usually take place during downwelling events in late 72
summer–early autumn (Fraga et al., 1988; Figueiras et al., 1994; Fermín et al., 1996). 73
Both types of toxicity have a great impact on the economy of the region, with estimated 74
X.A. Álvarez–Salgado et al. — Renewal time and HABs in an upwelling system
5
economic losses of 56–225 million euros per year from 1989 and 1998 (ECOHARM, 75
2003). 76
This manuscript shows that the increasing flushing time of upwelled water 77
observed in the Rías Baixas over the last decade, caused by a decrease of the extension 78
and intensity of the upwelling season off NW Spain, is the reason behind the growing 79
number of days that blue mussels on hanging ropes cannot be extracted because of the 80
presence of harmful microalgae. 81
2. Material and methods 82
2.1. Offshore Ekman transport off NW Spain from 1966 to 2006 83
The northerly component of shelf wind–stress (y) causes upwelling favourable 84
offshore Ekman transport (IW) along the western coast of the Iberian Peninsula 85
(Wooster et al., 1976; Bakun and Nelson, 1991), and southerly winds result in the 86
opposite effect. Ekman transport can be roughly estimated by Bakun’s (1973) method: 87
ffy
W
yDA
WW
VVCI
(1)
where A is the density of air (1.22 kg m–3 at 15°C), CD is an empirical dimensionless 88
drag coefficient (1.4·10–3 according to Hidy, 1972), f is the Coriolis parameter (9.946 89
10–5 s–1 at 43° latitude), W is the density of seawater (~1025 kg m–3), and V and yV 90
are the average daily module and northerly component of the geostrophic winds in a 91
2º×2º cell centred at 43°N 11°W, representative for the study area (shaded area in Fig. 92
1). Average daily geostrophic winds were estimated from atmospheric surface pressure 93
charts, provided at 6–hour intervals by the Spanish Institute of Meteorology. Positive 94
values of IW (in m2 s–1) indicate upwelling–favourable offshore Ekman transport. 95
X.A. Álvarez–Salgado et al. — Renewal time and HABs in an upwelling system
6
Conversely, negative values of IW indicate downwelling–favourable onshore Ekman 96
transport. Weekly–averaged gesotrophic IW values are not significantly different from 97
IW values calculated from coastal winds measured at the meteorological station of Cape 98
Fisterra (Otero et al. 2008). 99
A time–series of daily values of IW from January 1966 to December 2006 (n= 100
14274) was analysed. Values outside the lower extreme boundary (LEB = Q1 – 3·H= –101
3.02 m2 s–1) and upper extreme boundary (UEB = Q3 + 3·H = 3.02 m2 s–1) were 102
rejected before analysis of the time–series; Q1 and Q3 are the lower and upper quartile, 103
and H is the inter–quartile range. They represented ~3% of the whole time series. 104
To obtain the 1966–2006 and the 1966–1968, 1967–1969, 1968–1970, …, 2004– 2006 105
mean seasonal cycles of IW, SC[IW], a harmonic analysis of the annual (period, 365 106
days) and semi–annual (period, 365/2 days) components of the time series has been 107
performed by adjusting IW data to the following trigonometric equation: 108
22110W t
365
4cosAt
365
2cosAA]I[SC
(2)
where A0 is the annual average IW, A1 and A2 are the amplitude of annual and semi–109
annual components; 1 and 2 are the diphase of the annual and semi–annual 110
components; and t is the Julian day (ranging from 1 to 365/366). 111
2.2. Safety of the cultivation of blue mussel in the Galician rías from 1998 to 2006 112
Mussel rafts have been grouped by the Galician Government into 3 areas in the 113
Ría de Muros–Noia, 9 areas in the Ría de Arousa, 3 areas in the Ría de Pontevedra and 114
5 areas in the Ría de Vigo (see Fig. 1). The criterion followed by the Galician 115
Government to close a particular area to mussel extraction was based on the official 116
X.A. Álvarez–Salgado et al. — Renewal time and HABs in an upwelling system
7
mouse bioassay, entrusted to the “Instituto Tecnoloxico para o Control do Medio 117
Mariño” (INTECMAR). Over the period 1998–2006, mouse bioassays were preformed 118
in 3 sampling points for the 3 areas of the Ría de Muros, 24 points for the 9 areas of the 119
Ría de Arousa, 8 points for the 3 areas of the Ría de Pontevedra and 10 points for the 5 120
areas of the Ría de Vigo. The mussel raft cultivation areas of each ría were grouped on 121
basis of the number of days per year that each area was officially closed to extraction 122
(see Table 1). Two areas, i and j, will belong to the same group when 123
2j
2iji mm < 1, where mi and mj are the average number of days per year that 124
the areas i and j where close to extraction from 1998 to 2006; and i and j the 125
respective standard deviations. Conversely, if 2j
2iji mm ≥ 1, areas i and j 126
will not belong to the same group. As a result of this analysis, a unique group is retained 127
in the Ría de Muros–Noia and in the Ría de Pontevedra, and two groups are retained in 128
the Ría de Arousa and the Ría de Vigo, were the inner and outer part of the rías has been 129
differentiated (see Fig.1). 130
3. Results 131
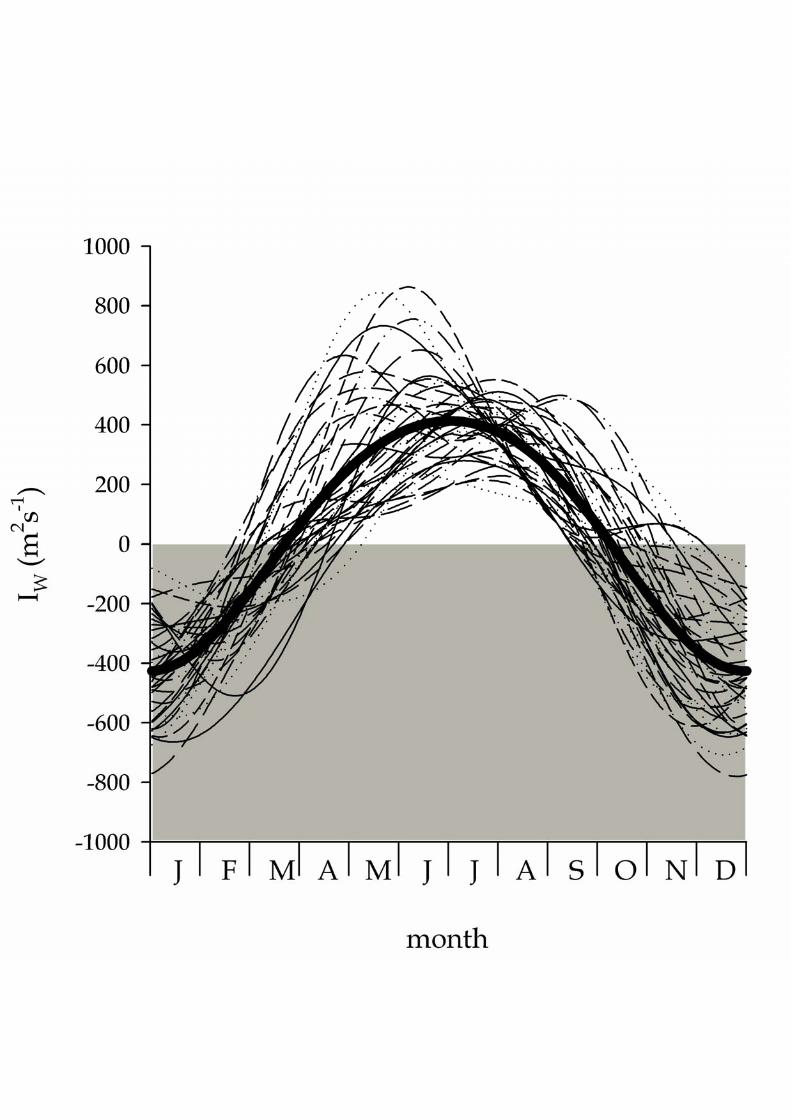
The average 1966–2006 seasonal cycle of IW, SC[IW], at the study latitudes (42º–132
43 ºN) consist of an upwelling favourable season (IW > 0) which extends from Julian 133
day 83±25 (24th March) to 283±22 (10th October), i.e. 200±33 days, and a downwelling 134
favourable season (IW < 0) the rest of the year, i.e. 165± 33 days (Fig. 2). The long–135
term average IW for the upwelling and downwelling seasons over the last 40 years has 136
been 0.29±0.08 and –0.29±0.08 m2 s–1, respectively. This seasonal cycle explains 7.6% 137
of the total variability of the daily time series, or 15.7% of the variability of the weekly–138
X.A. Álvarez–Salgado et al. — Renewal time and HABs in an upwelling system
8
average (7–day running mean) time series, or 23.2% of the fortnightly–average (15–day 139
running mean) time series of IW from 1966 to 2006. 140
When adjusting equation 2 for consecutive groups of 3 years (1966–1968, 1967–141
1969, …, and 2004–2006) it results in a strong temporal variability of SC[IW] (Fig. 2). 142
The percentage of the total variability explained by these seasonal cycles ranges from 143
3.3% to 16.3% for the daily time series, 6.8% to 10.1% for the 7–day running mean 144
time series, and from 33.7% to 49.8% for the 15–day running mean time series of IW. 145
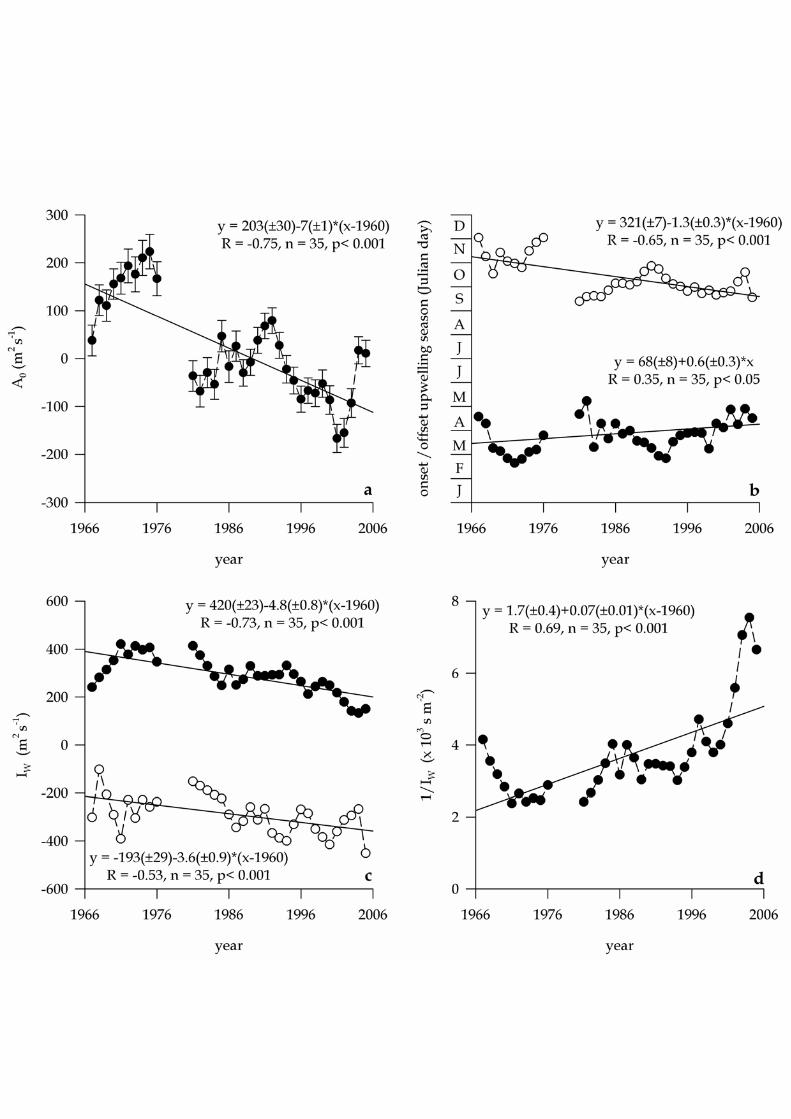
The variability observed in the seasonal cycles is not stochastic, but shows a marked 146
log–term trend in the value of IW (coefficient A0 in equation 2; Fig. 3a), the timing of 147
the upwelling and downwelling seasons (Fig. 3b), and the average value of IW during 148
both seasons (Fig. 3c). A significant decrease (p < 0.001) of A0 occurred over the last 40 149
years (Fig. 3a), from an upwelling–favourable IW value of 0.20±0.03 m2 s–1 in the early 150
1960’s to a slightly downwelling favourable value of –0.10±0.08 m2 s–1 in the early 151
2000’s. Superimposed on this monotonic decreasing trend, two cycles of period 15–20 152
years are also evident, which can be associated to the well–known North Atlantic 153
Oscillation climatic scenarios (Visbeck et al., 2001). 154
Therefore, the decrease in A0 associates to a significant i) delay of the onset (p 155
<0.05), and ii) advance of the off set (p <0.001) of the upwelling season (Fig. 3b); iii) 156
decrease of the intensity of upwelling (p < 0.001) during the upwelling season, and iv) 157
increase of the intensity of downwelling (p <0.001) during the downwelling season (Fig. 158
3c). At the beginning of the 1960’s the upwelling season started by Julian day 68±8 159
(around 10th march) and ended by Julian day 321±7 (around 17th November) whereas in 160
the early 2000’s it starts at day 95±14 (around 5th April) and ends by Julian day 261±14 161
X.A. Álvarez–Salgado et al. — Renewal time and HABs in an upwelling system
9
(around 20th September). The upwelling season has reduced by 85±22 days over the last 162
40 years. 163
The inverse of the offshore Ekman transport, 1/ IW (in s m–2), can be used as a 164
proxy to the renewal time of a coastal upwelling system, specially in the case of the 165
Rías Baixas (Rosón et al. 1997; Álvarez–Salgado et al. 2000; Piedracoba et al. 2005; 166
Gilcoto et al. 2007). Figure 3d show the long–term trend of 1/ IW for the coastal 167
upwelling system off NW Spain during the upwelling season, which increased from 168
2.2±0.5 s m–2 in the early 1960’s to 5.1±0.9 s m–2 in the early 2000’s. Interestingly, over 169
the short period between 1998 and 2006, renewal rates ranged from 3.8 to 7.5 s m–2, 170
increasing at the extremely high rate of 10%y–1. Therefore, this period can be very 171
useful to test the influence of the renewal rate of upwelled waters off NW Spain on the 172
occurrence of HABs. 173
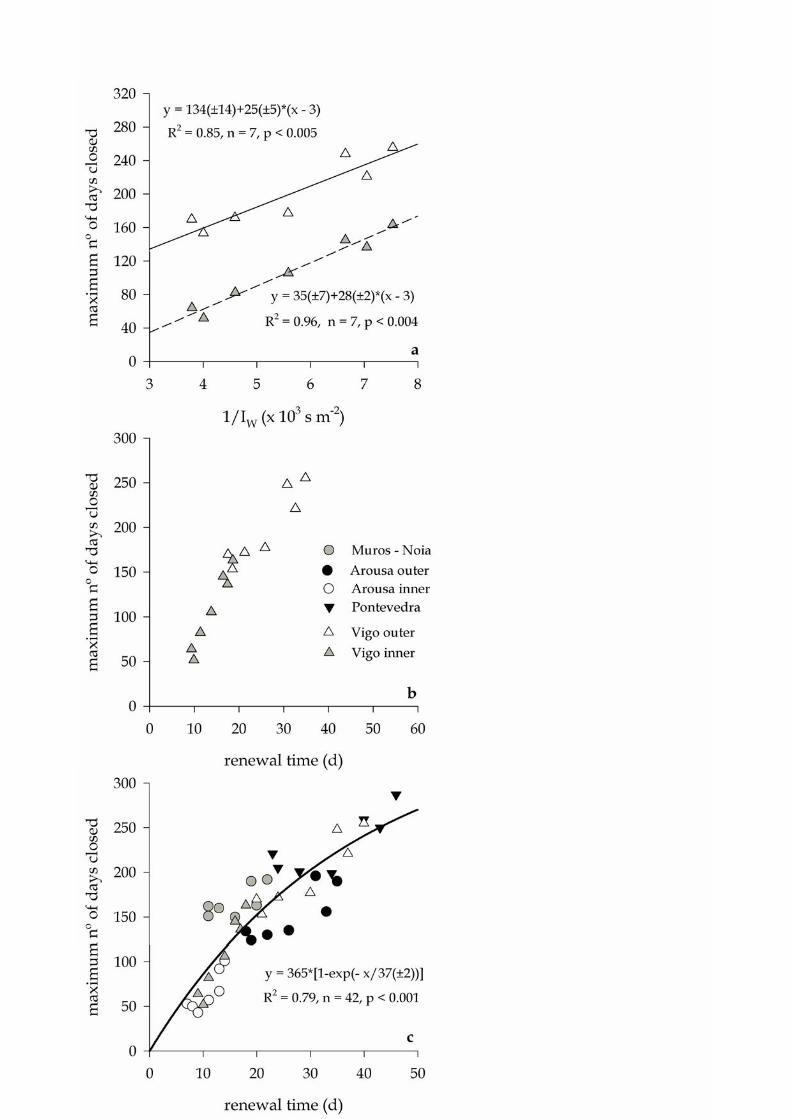
Figure 4a shows the maximum number of days that the mussel rafts areas were 174
closed to extraction in the inner and outer Ría the Vigo from 1998 to 2006. A 3–year 175
running mean was applied to be coherent with the analysis of the time evolution of the 176
seasonal cycle of the offshore Ekman transport. In both the inner and outer Ría de Vigo, 177
a significant (p <0.001) positive correlation was observed between the number of days 178
that mussels cannot be extracted and 1/ IW, with r2 = 0.85 for the inner and r2 = 0.96 for 179
the outer Ría de Vigo. The same trend was observed in the Ría de Pontevedra (r2 = 0.68, 180
p <0.02), the inner (r2 = 0.70, p <0.02) and outer (r2 = 0.70, p <0.02) Ría de Arousa and 181
the Ría de Muros–Noia (r2 = 0.51, p <0.07). Significant differences has been observed 182
in the maximum number of days per year that the different zones of the four Rías 183
Baixas are closed to extraction, with the Ría de Pontevedra (closed 227±57 days per 184
year in the period 1998–2006) and outer Ría de Vigo (closed 198±53 days per year) 185
X.A. Álvarez–Salgado et al. — Renewal time and HABs in an upwelling system
10
representing the upper end and the outer Ría de Arousa (closed 67± days per year) 186
representing the lower end (see Table 1). The abscissa of Figure 4a can be converted 187
into true renewal rates (τ) by multiplying 1/ IW times the volume of the embayment (V) 188
and dividing by the length of its open end to the shelf (L; Rosón et al. 1997; Álvarez–189
Salgado et al. 2000; Piedracoba et al. 2005; Gilcoto et al. 2007): 190
L
V
I
1
W
(3)
Lengths and volumes were estimated from digitalised charts published by the 191
Hydrographic Institute of the Spanish Navy processed with the programme Surfer 8 of 192
Golden Software. Figure 4b shows how the maximum number of days that the inner and 193
outer Ría de Vigo have been closed to mussel extraction distribute once the specific 194
volume and length of the inner and outer ría have been considered (see Table 2). 195
Applying the same concepts to the other three Rías Baixas —Pontevedra, Arousa and 196
Muros–Noia (Fig. 1)— the distribution of Figure 4c is obtained, which can be adjusted 197
to the equation: 198
)exp(1
1c365D
(4)
where D is the maximum number of days that the mussel rafts are closed to extraction 199
during a year, and c1 , 37 ± 2 days, is the coefficients of the non linear regression 200
equation (r2 = 0.79, n = 42, p < 0.001). According to this equation, the mussels rafts of a 201
given area will be closed to extraction a maximum of 50% and 75% of the days per year 202
if the renewal time is over 25± 1 and 50±3 days, respectively. 203
X.A. Álvarez–Salgado et al. — Renewal time and HABs in an upwelling system
11
4. Discussion and Conclusions 204
The seasonality of coastal winds off NW Spain over the last 40 years is consistent 205
with previous descriptions of the Iberian upwelling system (Wooster et al., 1976; Fiúza, 206
1983; Álvarez Salgado et al., 2002; Cabanas and Álvarez, 2006) and it is a common 207
feature of coastal upwelling systems at temperate latitudes world wide (Bakun and 208
Nelson, 1991). The dramatic decrease of coastal upwelling intensity during the second 209
half of the XX century, switching from average upwelling favourable conditions in the 210
early 1960’s to average downwelling favourable conditions in the early 2000’s, is not 211
exclusive of the Galician coast, but a common feature of the Atlantic coast of the 212
Iberian Peninsula. Lemos and Sansó (2006) obtained the same result from the records 213
of the coastal meteorological stations along the Portuguese coast from 37ºN to 41 ºN. 214
These observations contradicts Bakun’s (1990) hypothesis on the progressive 215
intensification of coastal winds in the major coastal upwelling systems of the world as a 216
consequence of the differential warming of land and the adjacent ocean masses in the 217
context of climate change. Bakun’s (1990) hypothesis has been invoked by Gregg et al. 218
(2005) to explain the significant increase in satellite derived chlorophyll fluorescence in 219
the coastal upwelling systems of SW Africa, Peru– Chile, California–Oregon or 220
Somalia. Interestingly, no significant increases were observed by these authors in the 221
coastal upwelling systems of the Western Iberian Peninsula and NW Africa. On the 222
contrary, studies of these coastal upwelling systems using the International 223
Comprehensive Ocean–Atmosphere Data Set Project wind data base 224
(http://www.ncdc.noaa.gov/oa/climate/coads/), recorded by ship–based meteorological 225
stations, suggest a long–term increase in wind intensity (Guisande et al., 2004; 226
X.A. Álvarez–Salgado et al. — Renewal time and HABs in an upwelling system
12
McGregor et al., 2007). This apparent contradiction between land and ship based 227
meteorological stations has not been solved yet. 228
The original analysis applied in this work to the time series of offshore Ekman 229
transports allows going deeply on the structure of the switch from upwelling to 230
downwelling favourable conditions over the last 40 years off NW Spain: the extension 231
of the upwelling season has reduced by 30% and upwelling intensity by 45% over the 232
study period. However, the final causes of the changes in the wind structure, which 233
according to Bakun’s (1990) hypothesis should be related to a decrease of the 234
temperature gradient between the land and ocean masses off the Western Iberian 235
Peninsula, remain also unresolved. 236
This dramatic change in the wind regime should have a direct influence on the 237
recruitment of commercial species with life cycles adapted to the seasonality of coastal 238
winds along the Western Iberian Peninsula such as Sardina pilchardus (Guisande et al., 239
2004) or Octupus vulgaris (Otero et al., 2008). Barth et al. (2007) have recently shown 240
the dramatic consequences of a 1–month delay in the spring transition to the upwelling–241
favourable season in the northern California Current Large Marine Ecosystem on the 242
low recruitment of rocky intertidal organisms, specifically blue mussels. In this sense, 243
the upwelling season off NW Spain has delayed 27±15 days over the last 40 years. 244
For the case of the occurrence of HABs, microplankton succession in the Rías 245
Baixas progress from the supremacy of large diatoms in spring, when the water column 246
is still weakly stratified, to an increasing importance of dinoflagellates in late summer 247
when stratification is stronger (Margalef, 1958; Figueiras et al., 2002). This seasonal 248
change can be altered by strong summer upwelling events, which reset the succession to 249
earlier stages characterised by the dominance of diatoms. The dynamics of the system 250
X.A. Álvarez–Salgado et al. — Renewal time and HABs in an upwelling system
13
also promotes the spatial segregation between diatoms and dinoflagellates, with the 251
former being more abundant in the interior of the Rías Baixas, where upwelling is 252
stronger. Later stages of succession, typified by a higher importance of dinoflagellates, 253
are usually found in the outer parts of the Rías Baixas, where the water column is 254
stratified. Upwelling and relaxation events modify this structure along the longitudinal 255
axis of these embayments (Tilstone et al., 1994; 2000). Thus, upwelling enhances 256
positive residual circulation and transports dinoflagellates to the shelf, leaving the Rías 257
Baixas dominated by diatoms. Conversely, during relaxation events the spatial structure 258
contracts and dinoflagellates are advected to the inner part of these coastal inlets. 259
Therefore, the residual circulation determines the microplankton composition in the 260
Rías Baixas during the upwelling season. Since harmful dinoflagellates are habitual 261
components of the summer microplankton community in these embayments (Margalef, 262
1958; Figueiras and Ríos, 1993; Figueiras et al., 2002), a decrease of the offshore 263
Ekman transport, which produces an increase of the renewal time of the upwelled 264
waters, favours the selection of these species adapted to increased stability – reduced 265
turbulence. The selected species could take advantage from their swimming ability to 266
perform vertical migrations (Villarino et al., 1995) and to obtain inorganic nutrients 267
from the nutricline (Fraga et al., 1992; Álvarez–Salgado et al., 1998) or to maintain in 268
the photic layer counteracting the downward vertical velocity imposed by physical 269
conditions during downwelling (Figueiras et al., 1995, Fermín et al., 1996). 270
The increasing recurrence of harmful microalgae in the Rías Baixas of NW Spain, 271
specially of the genus Dynophysis, over the last decade has been a serious handicap for 272
the exploitation of the blue mussel Mytilus galloprovincialis cultured on hanging ropes 273
(ECOHARM, 2003). It has been shown in this work that the renewal time of water is 274
X.A. Álvarez–Salgado et al. — Renewal time and HABs in an upwelling system
14
the key environmental variable that better explains the constrictions to the efficient 275
exploitation of blue mussels in the Rías Baixas. The significant differences observed in 276
the number of days per year that the cultivation zones of the four Rías Baixas are closed 277
to extraction by the Galician Government for health safety reasons can be explained by 278
the simple geomorphology index V/L, involving the volume of the mussel raft 279
cultivation area (V) and the length of its open end to the shelf (L). Renewal times of 280
more than 25 and 50 days reduce mussel extraction to 50% and 25% of the year, 281
respectively. Predictions in the context of global warming indicate that the intensity of 282
coastal winds off the Rías Baixas will continue to decrease at least up to the horizon 283
2070–2100 (Moreno Rodríguez, 2005), leading to an increase of the renewal time of 284
these embayments and, consequently, a probable increase in the number of days that the 285
cultivation areas will be closed to extraction. 286
Acknowledgements 287
We want to express our gratitude to Manuel Franco for compiling the number of 288
days that each zone was closed to mussel extraction from 1998 to 2006. This study was 289
supported by the contract–project PROINSA Mussel Farm, Code CSIC 20061089, 290
Xunta de Galicia PGIDIT06RMA018E. Additional support came from the Ministry of 291
the Environment and Sustainable Development of the Galician Government funds to 292
study the evidences and impact of climate change in Galicia. This is a contribution to 293
the GEOHAB Core Research Project – HABs in upwelling systems. 294
X.A. Álvarez–Salgado et al. — Renewal time and HABs in an upwelling system
15
References 295
Álvarez–Salgado, X.A., Gago, J., Míguez, B.M., Gilcoto M., Pérez, F.F., 2000. Surface 296
waters of the NW Iberian margin: upwelling on the shelf versus outwelling of 297
upwelled waters from the Rías Baixas. Estuar. Coast. Shelf Sci. 51, 821–837. 298
Álvarez–Salgado, X.A., Figueiras, F.G., Villarino, M.L., Pazos, Y., 1998. 299
Hydrodynamics and chemical conditions for the incipient development of a red–300
tide assemblage in an estuarine upwelling ecosystem. Mar. Biol. 130, 509–519. 301
Bakun, A., Nelson, C., 1991. The seasonal cycle of wind stress curl in subtropical 302
eastern boundary current regions. J. Phys. Oceanogr. 21, 1815–1834. 303
Bakun, A., 1973. Coastal upwelling indices, west coast of North America 1946-1971. 304
NOAA technical report, NMFSSSRF-671, 103 pp 305
Bakun, A., 1990. Global climate change and intensification of coastal upwelling. 306
Science 247, 198–201. 307
Barth, J.A., Menge, B.A., Lubchenco, J., Chan, F., Bane, J.M., Kirincich, A.R., 308
McManus, M.A., Nielsen, K.J., Pierce, S.D., Washburn, L., 2007. Delayed 309
upwelling alters nearshore coastal ocean ecosystems in the northern California 310
current. Proc. Nat. Acad. Sci. 104, 3719–3724. 311
Cabanas, J.M., Álvarez, I., 2005. Ekman transport patterns in the area close to the 312
Galician coast (NW, Spain). J. Atm. Ocean Sci. 10, 325–341. 313
ECOHARM. 2003. Scatasta S., W. Stolte, E. Granéli, H.P. Weikard and E. van Ierland. 314
Harmful algal blooms in European marine water: socio–economic analysis of 315
selected cases studies. Third deliverable for the EU–funded project ECOHARM 316
X.A. Álvarez–Salgado et al. — Renewal time and HABs in an upwelling system
16
Fermín, E.G., Figueiras, F.G., Arbones, B., Villarino, M.L., 1996. Short–time scale 317
development of a Gymnodinium catenatum population in the Ría de Vigo (NW 318
Spain). J. Phycol. 32, 212–221. 319
Fernández–Reiriz, M.J., Duarte, P., Labarta, U., 2007. Modelos de comportamiento 320
alimentario en el mejillón de las Rías de Galicia. In: Biología y cultivo del 321
mejillón (Mytilus galloprovincialis) en Galicia, CSIC, Biblioteca de Ciencias 26, 322
ISBN: 978–84–00–08526–1, pp. 195–223. 323
Figueiras F.G., Labarta, U., Fernández–Reiriz, M.J., 2002. Coastal upwelling, primary 324
production and mussel growth in the Rías Baixas of Galicia. Hydrobiología 484, 325
121–131. 326
Figueiras, F.G., Jones, K.J., Mosquera , A.M., Álvarez–Salgado, X.A., Edwards, A., 327
MacDougall, N., 1994. Red tide assemblage formation in an estuarine upwelling 328
ecosystem: Ria de Vigo. J. Plankton Res. 16, 857–878. 329
Figueiras, F.G., Ríos, A.F., 1993. Phytoplankton succession, red tides and the 330
hydrographic regime in the Rías Bajas of Galicia. In: Smayda, T.J., Shimizu, Y. 331
(Eds.), Toxic phytoplankton blooms in the Sea. Elsevier, pp. 239–244. 332
Figueiras, F.G., Wyatt, T., Álvarez–Salgado, X.A., Jenkinson, I., 1995. Advection, 333
diffusion, and patch development of red tide organisms in the Rías Baixas,. In: 334
Lassus, P., Arzul, G., Erard, E., Gentin, P., Marcaillou, C. (Eds.), Harmful Marine 335
Algal Blooms. Technique et Documentacion–Lavoisier, Intercept Ltd., pp. 579–336
584. 337
Fiúza, A.F.G., 1983. Upwelling Patterns off Portugal. In: Suess, E., Thiede, J. (Eds.), 338
Coastal Upwelling: its Sediment Record. Plenum, pp. 85–98. 339
X.A. Álvarez–Salgado et al. — Renewal time and HABs in an upwelling system
17
Fraga, S., Anderson, D.M., Bravo, I., Reguera, B., Steidinger, K.A., Yentsch, C.M., 340
1988. Influence of upwelling relaxation on dinoflagellates and shellfish toxicity in 341
Ria de Vigo, Spain. Estuar. Coast. Shelf Sci. 27, 349–361. 342
Fraga, F., Pérez, F.F., Figueiras, F.G., Ríos, A.F., 1992. Stoichiometric variations of N, 343
P, C and O2 during a Gymnodinium catenatum red tide and their interpretation. 344
Mar. Ecol. Prog. Ser. 87, 123–134. 345
GEOHAB, 2005. Global Ecology and oceanography of Harmful Algal Blooms, 346
GEOHAB Core Research Project: HABs in Upwelling Systems. G. Pitcher, T. 347
Moita, V. Trainer, R. Kudela, F.G Figueiras and T. Probyn [eds.], IOC and SCOR, 348
Paris and Baltimore. 82pp. 349
Gilcoto, M., Conde, P., Álvarez–Salgado, X.A., Pérez, F.F., 2007. Exchange fluxes 350
between the Ría de Vigo and the shelf through a bidirectional flow forced by 351
remote winds. J. Geophys. Res. 112, C06001, doi: 10.1029/2005JC003140. 352
Gregg. W.W., Casey, N.W., McClain, C.R., 2005. Recent trends in global ocean 353
chlorophyll. Geophys. Res. Lett. 32, L03606, doi:10.1029/2004GL021808. 354
Guisande, C., Vergara, A.R., Riveiro, I., Cabanas, J.M., 2004. Climate change and 355
abundance of the Atlantic Iberian sardine (Sardina pilchardus). Fish. Oceanogr. 13, 356
91–101. 357
Hidy, G. M., 1972. A view of recent air–sea interaction research. Bull. Am. Meteorol. 358
Soc. 53, 1083–1102. 359
Horner, R.A., Garrison, D.L., Plumley, F.G., 1997. Harmful algal blooms and red tide 360
problems on the U.S. west coast. Limnol. Oceanogr. 42, 1076–1088. 361
X.A. Álvarez–Salgado et al. — Renewal time and HABs in an upwelling system
18
Labarta, U., Fernández–Reiriz, M.J., Pérez–Camacho, A., Pérez Corbacho, E., 2004. 362
Bateeiros, mar, mejillón. Una perspectiva bioeconómica. CIEF. Fundación 363
Caixagalicia. Santiago de Compostela, 262pp, ISBN 84–95491–69–9 364
Lemos, R.T., Sansó, B., 2006. Spatio–temporal variability of ocean temperature in the 365
Portugal Current System. J. Geophys. Res. 111, C04010, doi: 366
10.1029/2005JC003051. 367
Margalef, R. 1958. Temporal succession and spatial heterogeneity in phytoplankton In: 368
Buzzati–Traverso, A.A. (Ed.), Perspectives in Marine Biology. University 369
California Press, pp. 323–348. 370
McGregor, H.V., Dima, M., Fischer, H.W., Mulitza, S., 2007. Rapid 20th–Century 371
Increase in Coastal Upwelling off Northwest Africa. Science 315, 637–639. 372
Moreno Rodríguez, J.M. (coord.), 2005. Evaluación preliminar de los impactos en 373
España por efecto del cambio climático. Final report of the project ECCE, 374
Ministerio de Medio Ambiente, Gobierno de España, 822 pp. 375
Otero, J., Álvarez–Salgado, X.A., González, A.F.G., Miranda, A., Groom, S.B., 376
Cabanas, J.M., Wheatley, B., Guerra, A., 2008. Bottom–up and top–down control 377
of Octopus vulgaris abundance in a wind–driven upwelling ecosystem (NE 378
Atlantic). Mar. Ecol. Prog. Ser., in press. 379
Piedracoba, S., Álvarez–Salgado, X.A., Rosón, G., Herrera, J.L., 2005. Short time scale 380
thermohaline variability and residual circulation in the central segment of the 381
coastal upwelling system of the Ría de Vigo (NW Spain) during four contrasting 382
periods. J. Geophys. Res. 110, C03018, doi: 10.1029/2004JC002556. 383
X.A. Álvarez–Salgado et al. — Renewal time and HABs in an upwelling system
19
Pitcher, G.C., Calder, D., 2000. Harmful algal blooms of the southern Benguela current: 384
a review and appraisal of monitoring from 1989 to 1997. South African J. Mar. 385
Sci. 22, 255–271. 386
Reguera, B., Bravo, I., Fraga, S., 1995. Autoecology and some life history stages of 387
Dinophysis acuta Ehrenberg. J. Plankton Res. 17, 999–1015. 388
Reguera, B., Garcés, E., Bravo, I., Pazos, Y., Ramilo, I., 2003. In situ division rates of 389
several species of Dinophysis estimated by a postmitotic index. Mar. Ecol. Prog. 390
Ser. 249, 117–131. 391
Rosón, G., Álvarez–Salgado, X.A., Pérez, F.F., 1997. A non–stationary box–model to 392
determine residual fluxes in a partially mixed estuary based on both thermohaline 393
properties. Application to the Ría de Arousa (NW Spain). Estuar. Coast. Shelf Sci. 394
44, 249–262. 395
Tilstone, G.H., Figueiras, F.G., Fraga, F., 1994. Upwelling–downwelling sequences in 396
the generation of red tides in a coastal upwelling system. Mar. Ecol. Prog. Ser. 397
112, 241–253. 398
Tilstone, G.H., Míguez, B.M., Figueiras, F.G., Fermín, E.G., 2000. Diatom dynamics in 399
a coastal ecosystem affected by upwelling: coupling between species succession, 400
circulation and biogeochemical processes. Mar. Ecol. Prog. Ser. 205, 23–41. 401
Trainer, V.L., Adams, N.G., Bill, B.D., Stehr, C.M., Wekell, J.C., Moeller, P., Busman, 402
M., Woodruff, D., 2000. Domoic acid production near California upwelling zones, 403
June 1998. Limnol. Oceanogr. 45, 401–440. 404
Villarino, M.L., Figueiras, F.G., Jones, K.J., Álvarez–Salgado, X.A., Richard, J., 405
Edwards, A., 1995. Evidence of in situ diel vertical migration of a red–tide 406
microplankton species in Ría de Vigo (NW Spain). Mar. Biol. 123, 607–617. 407
X.A. Álvarez–Salgado et al. — Renewal time and HABs in an upwelling system
20
Visbeck, M.H., Hurrell, J.W., Polvani, L., Cullen, H.M., 2001. The North Atlantic 408
Oscillation: Past, present, and future. Proc. Nat. Acad. Sci. 98, doi: 409
10.1073/pnas.231391598. 410
Wooster, W.S., Bakun, A., McLain, D.R., 1976. The seasonal upwelling cycle along the 411
eastern boundary of the North Atlantic. J. Mar. Res. 34, 131–140. 412
X.A. Álvarez–Salgado et al. — Renewal time and HABs in an upwelling system
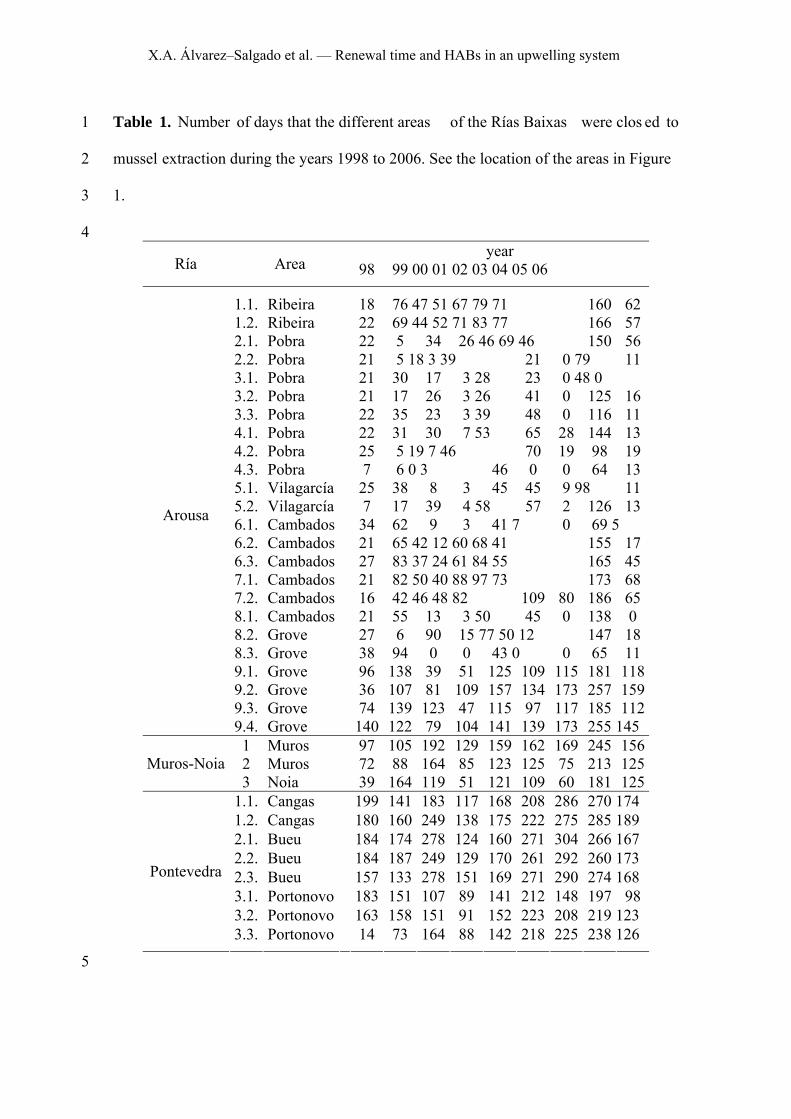
Table 1. Number of days that the different areas of the Rías Baixas were clos ed to 1
mussel extraction during the years 1998 to 2006. See the location of the areas in Figure 2
1. 3
4 year
Ría Area 98 99 00 01 02 03 04 05 06
1.1. Ribeira 18 76 47 51 67 79 71 160 62 1.2. Ribeira 22 69 44 52 71 83 77 166 57 2.1. Pobra 22 5 34 26 46 69 46 150 56 2.2. Pobra 21 5 18 3 39 21 0 79 11 3.1. Pobra 21 30 17 3 28 23 0 48 0 3.2. Pobra 21 17 26 3 26 41 0 125 16 3.3. Pobra 22 35 23 3 39 48 0 116 11 4.1. Pobra 22 31 30 7 53 65 28 144 13 4.2. Pobra 25 5 19 7 46 70 19 98 19 4.3. Pobra 7 6 0 3 46 0 0 64 13 5.1. Vilagarcía 25 38 8 3 45 45 9 98 11 5.2. Vilagarcía 7 17 39 4 58 57 2 126 13 6.1. Cambados 34 62 9 3 41 7 0 69 5 6.2. Cambados 21 65 42 12 60 68 41 155 17 6.3. Cambados 27 83 37 24 61 84 55 165 45 7.1. Cambados 21 82 50 40 88 97 73 173 68 7.2. Cambados 16 42 46 48 82 109 80 186 65 8.1. Cambados 21 55 13 3 50 45 0 138 0 8.2. Grove 27 6 90 15 77 50 12 147 18 8.3. Grove 38 94 0 0 43 0 0 65 11 9.1. Grove 96 138 39 51 125 109 115 181 118 9.2. Grove 36 107 81 109 157 134 173 257 159 9.3. Grove 74 139 123 47 115 97 117 185 112
Arousa
9.4. Grove 140 122 79 104 141 139 173 255 145 1 Muros 97 105 192 129 159 162 169 245 156 2 Muros 72 88 164 85 123 125 75 213 125 Muros-Noia 3 Noia 39 164 119 51 121 109 60 181 125
1.1. Cangas 199 141 183 117 168 208 286 270 174 1.2. Cangas 180 160 249 138 175 222 275 285 189 2.1. Bueu 184 174 278 124 160 271 304 266 167 2.2. Bueu 184 187 249 129 170 261 292 260 173 2.3. Bueu 157 133 278 151 169 271 290 274 168 3.1. Portonovo 183 151 107 89 141 212 148 197 98 3.2. Portonovo 163 158 151 91 152 223 208 219 123
Pontevedra
3.3. Portonovo 14 73 164 88 142 218 225 238 126
5
X.A. Álvarez–Salgado et al. — Renewal time and HABs in an upwelling system
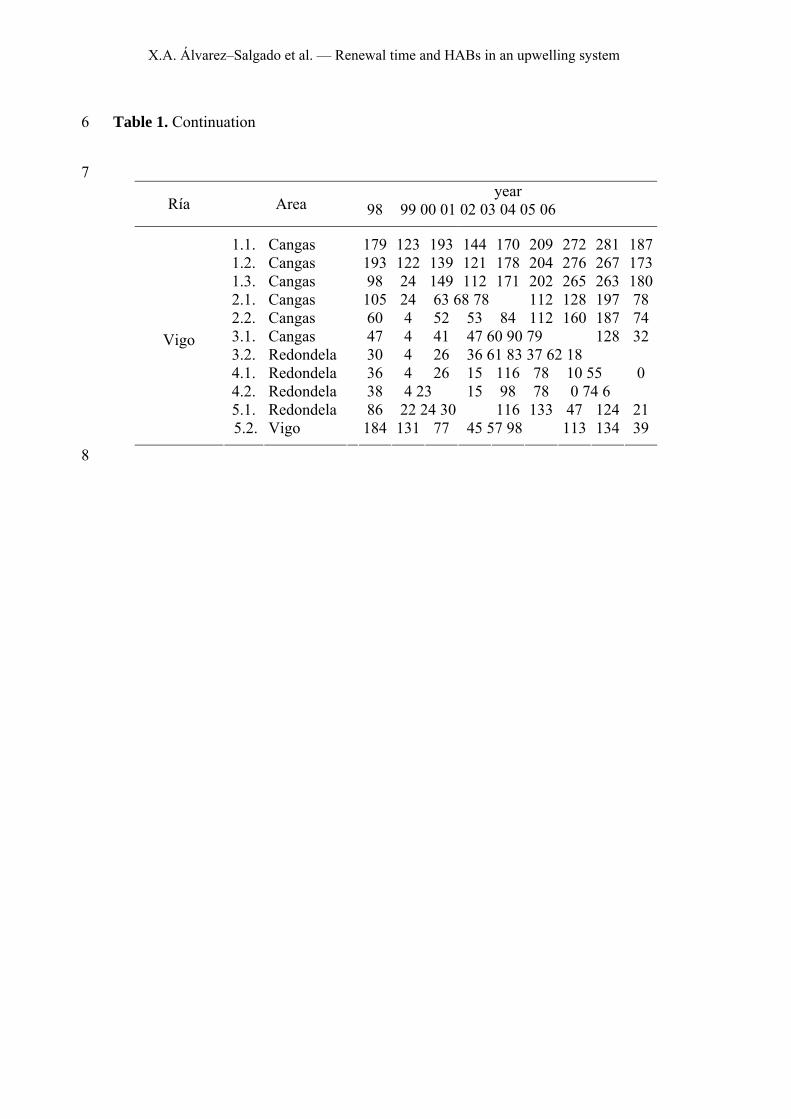
Table 1. Continuation 6
7 year
Ría Area 98 99 00 01 02 03 04 05 06
1.1. Cangas 179 123 193 144 170 209 272 281 187 1.2. Cangas 193 122 139 121 178 204 276 267 173 1.3. Cangas 98 24 149 112 171 202 265 263 180 2.1. Cangas 105 24 63 68 78 112 128 197 78 2.2. Cangas 60 4 52 53 84 112 160 187 74 3.1. Cangas 47 4 41 47 60 90 79 128 32 3.2. Redondela 30 4 26 36 61 83 37 62 18 4.1. Redondela 36 4 26 15 116 78 10 55 0 4.2. Redondela 38 4 23 15 98 78 0 74 6 5.1. Redondela 86 22 24 30 116 133 47 124 21
Vigo
5.2. Vigo 184 131 77 45 57 98 113 134 39
8
X.A. Álvarez–Salgado et al. — Renewal time and HABs in an upwelling system
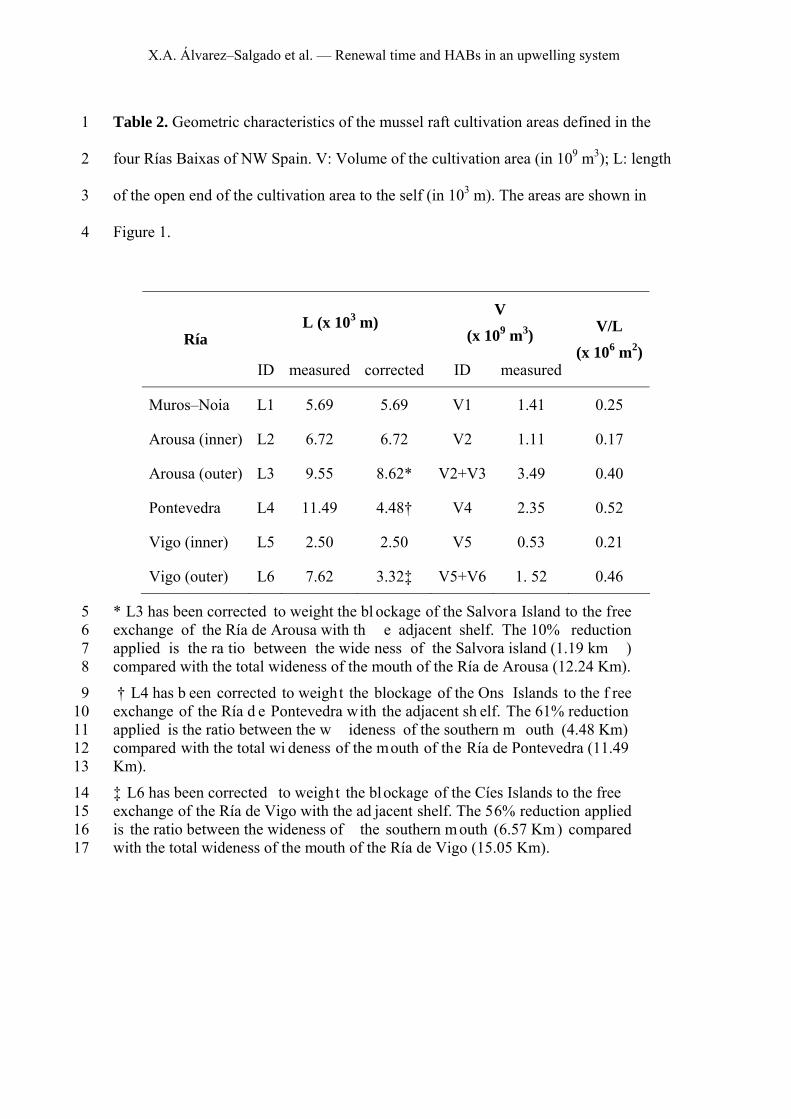
Table 2. Geometric characteristics of the mussel raft cultivation areas defined in the 1
four Rías Baixas of NW Spain. V: Volume of the cultivation area (in 109 m3); L: length 2
of the open end of the cultivation area to the self (in 103 m). The areas are shown in 3
Figure 1. 4
L (x 103 m) V
(x 109 m3) Ría
ID measured corrected ID measured
V/L
(x 106 m2)
Muros–Noia L1 5.69 5.69 V1 1.41 0.25
Arousa (inner) L2 6.72 6.72 V2 1.11 0.17
Arousa (outer) L3 9.55 8.62* V2+V3 3.49 0.40
Pontevedra L4 11.49 4.48† V4 2.35 0.52
Vigo (inner) L5 2.50 2.50 V5 0.53 0.21
Vigo (outer) L6 7.62 3.32‡ V5+V6 1. 52 0.46
* L3 has been corrected to weight the bl ockage of the Salvora Island to the free 5 exchange of the Ría de Arousa with th e adjacent shelf. The 10% reduction 6 applied is the ra tio between the wide ness of the Salvora island (1.19 km ) 7 compared with the total wideness of the mouth of the Ría de Arousa (12.24 Km). 8
† L4 has b een corrected to weight the blockage of the Ons Islands to the f ree 9 exchange of the Ría d e Pontevedra with the adjacent sh elf. The 61% reduction 10 applied is the ratio between the w ideness of the southern m outh (4.48 Km) 11 compared with the total wi deness of the mouth of the Ría de Pontevedra (11.49 12 Km). 13
‡ L6 has been corrected to weight the blockage of the Cíes Islands to the free 14 exchange of the Ría de Vigo with the ad jacent shelf. The 56% reduction applied 15 is the ratio between the wideness of the southern m outh (6.57 Km ) compared 16 with the total wideness of the mouth of the Ría de Vigo (15.05 Km). 17
X.A. Álvarez–Salgado et al. — Renewal time and HABs in an upwelling system
Figure captions 1
Figure 1. Map of the Galician Rías Baixas (NW Spain) showing the position of the 2
mussel raft cultivation areas and the volumes (V) and lengths (L) defined in this work. 3
V1, L1: Ría de Muros–Noia; V2, L2: Ría de Arousa (inner); V3, L3: Ría de Arousa 4
(outer); V4, L4: Ría de Pontevedra; V5, L5: Ría de Vigo (inner); V6, L6: Ría de Vigo 5
(outer). 6
Figure 2. Offshore Ekman transport off the Ría Baixas: average seasonal cycle for the 7
period 1966–2006 (solid line) and average seasonal cycles for consecutive groups of 3 8
years (dotted lines). 9
Figure 3. Time evolution of (a) A0, the constant of the harmonic analysis of the 10
offshore Ekman transport (in m2 s–1); (b) the onset (black dots) and offset (white dots) 11
of the upwelling season (in days); (c) upwelling (black dots) and downwelling (white 12
dots) seasons average offshore Ekman transport (in m2 s–1); renewal time, 1/IW (in 103 13
s m–2). 14
Figure 4. Relationship between the maximum number of days per year that a given 15
mussel raft cultivation area is closed to extraction and (a) 1/IW for the inner and outer 16
Ría de Vigo; (b) the renewal time for the inner and outer Ría de Vigo; and (c) the 17
renewal time for the six study areas of the Rías Baixas. For symbols, please see legend 18
of panel b. 19