Kinetics and Mechanism of Catalytic Ozonation of Aqueous Pollutants on Metal Oxide Catalysts
Upload
khangminh22Category
view
2download
0
Investigation of the Kinetics andMechanism of RAFT Polymerization via
EPR Spectroscopy
Dissertation
zur Erlangung des mathematisch-naturwissenschaftlichen Doktorgrades„Doctor rerum naturalium“
der Georg-August-Universität Göttingen
vorgelegt vonWibke Meiser
aus Berlin
Göttingen 2012

Referent: Prof. Dr. Michael Buback
Korreferent: Prof. Dr. Philipp Vana
Tag der mündlichen Prüfung: 4. Juli 2012

Meiner Familie


Table of Contents
Abstract 1
Zusammenfassung 3
Resumen 5
1 Introduction 7
2 Mechanism and kinetics of RAFT polymerization 112.1 The ideal RAFT mechanism . . . . . . . . . . . . . . . . . . . . . . . . 112.2 Features of the RAFT agent . . . . . . . . . . . . . . . . . . . . . . . . 132.3 Kinetic anomalies in dithiobenzoate-mediated polymerizations . . . . . 15
2.3.1 Intermediate radical termination . . . . . . . . . . . . . . . . . 172.3.2 Slow fragmentation . . . . . . . . . . . . . . . . . . . . . . . . . 192.3.3 “Missing step” reactions . . . . . . . . . . . . . . . . . . . . . . 202.3.4 Intermediate radical termination with short chains only . . . . 21
3 Choice of the methods of investigation 233.1 Experiments based on polymerization behavior . . . . . . . . . . . . . 233.2 Quasi-stationary EPR experiments . . . . . . . . . . . . . . . . . . . . 243.3 Time-resolved EPR experiments . . . . . . . . . . . . . . . . . . . . . 253.4 Product analysis by NMR spectroscopy and mass spectrometry . . . . 273.5 Selection of experimental conditions . . . . . . . . . . . . . . . . . . . 27
4 EPR with macromolecular systems 314.1 Xanthate-mediated n-butyl acrylate polymerization . . . . . . . . . . . 31
4.1.1 Quasi-stationary EPR experiments . . . . . . . . . . . . . . . . 334.1.2 Time-resolved EPR experiments . . . . . . . . . . . . . . . . . 364.1.3 Comparison of both approaches . . . . . . . . . . . . . . . . . . 41
i

Table of Contents
4.2 Trithiocarbonate-mediated n-butyl acrylate polymerization . . . . . . 434.2.1 Quasi-stationary EPR experiments . . . . . . . . . . . . . . . . 434.2.2 Time-resolved EPR experiments . . . . . . . . . . . . . . . . . 484.2.3 Comparison of both approaches . . . . . . . . . . . . . . . . . . 53
4.3 Dithiobenzoate-mediated n-butyl acrylate polymerization . . . . . . . 544.3.1 Quasi-stationary EPR experiments . . . . . . . . . . . . . . . . 584.3.2 Time-resolved EPR experiments . . . . . . . . . . . . . . . . . 624.3.3 Comparison of both approaches . . . . . . . . . . . . . . . . . . 66
4.4 Discussion . . . . . . . . . . . . . . . . . . . . . . . . . . . . . . . . . . 67
5 EPR with monomer-free model systems 715.1 tert-Butyl/tert-butyl dithiobenzoate . . . . . . . . . . . . . . . . . . . 71
5.1.1 Choice of the initiator . . . . . . . . . . . . . . . . . . . . . . . 735.1.2 Determination of the equilibrium constant . . . . . . . . . . . . 74
5.2 Cyano-iso-propyl/2-(2’-cyanopropyl)-dithiobenzoate . . . . . . . . . . 785.3 Phenylethyl/1-phenylethyl dithiobenzoate . . . . . . . . . . . . . . . . 91
5.3.1 Investigation of initiator kinetics . . . . . . . . . . . . . . . . . 915.3.2 Determination of the equilibrium constant . . . . . . . . . . . . 96
5.4 Discussion . . . . . . . . . . . . . . . . . . . . . . . . . . . . . . . . . . 106
6 Closing Remarks 111
7 Experimental 1157.1 Chemicals . . . . . . . . . . . . . . . . . . . . . . . . . . . . . . . . . . 115
7.1.1 Transfer agents . . . . . . . . . . . . . . . . . . . . . . . . . . . 1157.1.2 Initiators . . . . . . . . . . . . . . . . . . . . . . . . . . . . . . 1217.1.3 Miscellaneous . . . . . . . . . . . . . . . . . . . . . . . . . . . . 123
7.2 Instrumentation . . . . . . . . . . . . . . . . . . . . . . . . . . . . . . . 1237.2.1 Electron paramagnetic resonance spectroscopy . . . . . . . . . 1237.2.2 Size-exclusion chromatography . . . . . . . . . . . . . . . . . . 1257.2.3 UV Spectroscopy . . . . . . . . . . . . . . . . . . . . . . . . . . 1257.2.4 NMR Spectroscopy . . . . . . . . . . . . . . . . . . . . . . . . . 125
7.3 Procedures . . . . . . . . . . . . . . . . . . . . . . . . . . . . . . . . . 1257.3.1 Sample preparation for EPR experiments . . . . . . . . . . . . 1257.3.2 Calibration of the EPR setup . . . . . . . . . . . . . . . . . . . 1267.3.3 Deconvolution of EPR spectra . . . . . . . . . . . . . . . . . . 1277.3.4 Identification of side products in the model systems cyano-iso-
propyl/2-(2’-cyanopropyl)-dithiobenzoate . . . . . . . . . . . . 1287.3.5 Identification of PEDA decomposition products . . . . . . . . . 1307.3.6 Identification of side products in the model system phenylethyl/
1-phenylethyl dithiobenzoate . . . . . . . . . . . . . . . . . . . 132
ii

Table of Contents
8 Development of PREDICI models 1358.1 Implementation of the 2D RAFT mechanism into PREDICI . . . . . . 1368.2 Implementation of the 3D RAFT mechanism into PREDICI . . . . . . 142
Appendix 155A Abbreviations . . . . . . . . . . . . . . . . . . . . . . . . . . . . . . . . 155B Matlab Code . . . . . . . . . . . . . . . . . . . . . . . . . . . . . . . . 160
Bibliography 167
iii


Abstract
This thesis provides new insights into the mechanism and kinetics of reversibleaddition-fragmentation chain transfer (RAFT) polymerizations. Electron paramag-netic resonance (EPR) spectroscopy experiments to determine the rate coefficientsgoverning the RAFT equilibrium were developed. The equilibrium constant, Keq, isdeduced from the concentration ratio of the intermediate species, INT, and propagat-ing radicals, P, via an EPR spectrum taken during stationary RAFT polymerization.Another approach uses highly time-resolved EPR spectroscopy to trace INT and Pconcentrations in single-pulse laser-initiated RAFT polymerizations (SP-PLP-EPR-RAFT). Predici R© simulations of the experimental data result in rate coefficients foraddition, kad, fragmentation, kβ, and cross-termination, kcrosst .Both methods have been applied to xanthate-, trithiocarbonate- and dithioben-
zoate-mediated RAFT polymerizations of butyl acrylate at −40 ◦C. The equilibriumconstants, Keq = kad/kβ, obtained from the stationary approach are in excellent agree-ment with the ones from SP-PLP-EPR-RAFT, indicating that both experimentalapproaches provide access to reliable data for RAFT kinetics. Fast fragmentation ofINT has been observed in all polymerizations under investigation. The values for thefragmentation rate coefficient, kβ, are 2.3×10³ s−1 for the xanthate, 1.4×10² s−1 and4.5× 101 s−1 for the trithiocarbonates, and 4.7 s−1 for the dithiobenzoate. The corre-sponding equilibrium constants are 12 L ·mol−1, 2.6×10⁴ L ·mol−1, 8×10⁴ L ·mol−1,and 3×10⁵ L ·mol−1, respectively. Keq is highest for the dithiobenzoate and lowest forthe xanthate, which is consistent with the better control of dithiobenzoate-mediatedacrylate polymerization as compared with the xanthate. Cross-termination plays aminor role when xanthates or trithiocarbonates are used as the RAFT agent, but isan important reaction step when dithiobenzoates are employed. In the latter case,adopting a chain-length dependent kcrosst is necessary to explain the experimentaldata.To gain further insight into the rate retardation phenomenon observed in some
dithiobenzoate-mediated polymerizations and to evaluate the accuracy of ab initiocalculated Keq values reported by Coote et al., the EPR experiments were carriedout on monomer-free model systems. These systems were composed of a radical,
1

Abstract
generated by decomposition of an appropriate initiator, and a dithiobenzoate-typeRAFT agent bearing a leaving group, which was identical to the initiator-derivedradical, i. e., a tert-butyl, a cyano-iso-propyl or a phenylethyl group. The correspondingequilibrium constants at 20 ◦C are between 105 and 108 L ·mol−1, 53 L ·mol−1 and2.2× 103 L ·mol−1, respectively.The trends in Keq for the different model systems correlate with the stability of
the intermediate radical and the stabilization energy of the radical which adds tothe thiocarbonyl bond of the RAFT agent. The theoretical values show the sametrends but are up to six orders of magnitude above the experimentally obtainedequilibrium constants. In addition, ab initio calculations predict a pronounced chain-length dependence of Keq, which was tested using macromolecular RAFT agentsfor stationary EPR experiments and by comparing the macromolecular systemswith monomer-free model systems. Only a minor influence of the chain length wasobserved. The experimental results thus question ab initio calculations predictingslow fragmentation of INT and a pronounced chain-length dependence of Keq.In addition, the product mixtures of the model systems were analyzed by nuclear
magnetic resonance (NMR) spectroscopy. The results of EPR and NMR measure-ments show that cross-termination with subsequent “missing step” reactions of unsta-ble cross-termination products are responsible for the rate retardation observed indithiobenzoate-mediated polymerizations.
2

Zusammenfassung
Die vorliegende Doktorarbeit eröffnet neue Einblicke in den Mechanismus und dieKinetik von Reversiblen Additions-Fragmentierungs Kettenübertragungs (RAFT)-Polymerisationen. Es wurden Elektronenspinresonanz (ESR)-spektroskopische Un-tersuchungsmethoden zur Bestimmung der Geschwindigkeitskoeffizienten des RAFT-Gleichgewichts entwickelt. Die Gleichgewichtskonstante, Keq, wird aus dem Konzen-trationsverhältnis der Intermediatspezies, INT, und wachsenden Radikale, P, erhal-ten. Dieses Verhältnis lässt sich aus dem ESR-Spektrum einer stationären RAFT-Polymerisation berechnen. Zudem wird hoch-zeitaufgelöste ESR-Spektroskopie ver-wendet, um die INT- und P-Konzentrationen in Laser-Einzelpuls-initiierten RAFT-Polymerisationen (SP-PLP-EPR-RAFT) zu verfolgen. Die Geschwindigkeitskoeffizien-ten der Addition, kad, der Fragmentierung, kβ, und der Kreuzterminierung, kcrosst ,wurden durch Predici R©-Simulationen der experimentellen Daten erhalten.
Beide ESR-Methoden wurden zur Untersuchung von Xanthat-, Trithiocarbonat- undDithiobenzoat-vermittelten Butylacrylat-Polymerisationen bei −40 ◦C verwendet. DieGleichgewichtskonstanten, Keq = kad/kβ, der untersuchten Systeme, die mit Hilfe derstationären Methode erhalten wurden, stimmen gut mit den Werten aus den SP-PLP-EPR-RAFT-Experimenten überein. Mit beiden experimentellen Untersuchungsmetho-den können daher zuverlässige kinetische Daten für RAFT-Polymerisationen bestimmtwerden. In allen Polymerisationen war eine schnelle Fragmentierung des Intermediatszu beobachten. Die Werte für die Fragmentierungsgeschwindigkeitskoeffizienten, kβ,sind 2.3×10³ s−1 für das Xanthat, 1.4×10² s−1 und 4.5×101 s−1 für die Trithiocarbo-nate und 4.7 s−1 für das Dithiobenzoat. Die entsprechenden Gleichgewichtskonstantensind 12 L ·mol−1, 2.6× 10⁴ L ·mol−1, 8× 10⁴ L ·mol−1 und 3× 10⁵ L ·mol−1. Diegrößte Gleichgewichtskonstante wurde dementsprechend für das Dithiobenzoat gefun-den und die niedrigste für das Xanthat. Dies ist im Einklang mit der experimentellenBeobachtung, dass Dithiobenzoate Acrylat-Polymerisationen besser kontrollieren alsXanthate. Wenn Xanthate oder Trithiocarbonate als RAFT-Agenzien verwendetwerden, spielt die Kreuzterminierung nur eine untergeordnete Rolle. Werden hingegenDithiobenzoate eingesetzt, kann dieser Reaktionsschritt nicht vernachlässigt werden.
3

Zusammenfassung
In diesem Fall ist die Anpassung der experimentellen Daten nur mit Hilfe eineskettenlängenabhängigen kcrosst möglich.Um die Ursachen der Retardierung der Polymerisationsgeschwindigkeit in Dithio-
benzoat-vermittelten Polymerisationen zu ergründen und die Genauigkeit der mittelsab initio-Methoden berechneten Gleichgewichtskonstanten abzuschätzen, wurdenzusätzliche ESR-Untersuchungen an monomerfreien Modellsystemen durchgeführt.Diese Systeme bestanden aus einem durch Initiatorzerfall gebildeten Radikal undeinem Dithiobenzoat mit einer Abgangsgruppe, die identisch war mit dem vomInitiator stammenden Radikal, d. h. tert-Butyl, Cyano-iso-propyl oder Phenylethyl.Die entsprechenden Gleichgewichtskonstanten bei 20 ◦C sind 105 − 108 L ·mol−1,53 L ·mol−1 und 2.2× 10³ L ·mol−1.Der Trend, der für die Keq-Werte zu beobachten ist, korreliert mit der Stabilität
des Intermediat-Radikals und der Stabilisierungsenergie des Radikals, das an dieC=S-Doppelbindung des RAFT-Agens addiert. Die von Coote et al. berechnetenGleichgewichtskonstanten folgen dem gleichen Trend, liegen aber um bis zu sechsGrößenordnungen über den experimentell ermittelten Werten. Außerdem sagen dieab initio-Berechnungen eine starke Kettenlängenabhängigkeit für Keq voraus. Daswurde experimentell überprüft indem polymere RAFT-Agenzien für die stationärenESR-Untersuchungen verwendet wurden und die polymeren mit den monomerfreienModellsystemen verglichen wurden. Es wurde nur eine sehr schwache Kettenlän-genabhängigkeit beobachtet. Die experimentellen Befunde widerlegen somit die abinitio-Berechnungen, die eine langsame Fragmentierung von INT und eine deutlicheKettenlängenabhängigkeit für Keq voraussagen.
Desweiteren wurden die Produktgemische der Modellsysteme mittels Kernspinreso-nanzspektroskopie (NMR) analysiert. Die Ergebnisse der ESR- und NMR-Messungenzeigen, dass Kreuzterminierung mit anschließenden „Missing Step“-Reaktionen derinstabilen Kreuzterminierungsprodukte für die Retardierung der Polymerisations-geschwindigkeit in Dithiobenzoat-vermittelten Polymerisationen verantwortlich sind.
4

Resumen
La tesis proporciona nueva información acerca del mecanismo y de la cinética delas polimerizaciones de transferencia de cadena por adición-fragmentación reversible(RAFT). Para determinar los coeficientes cinéticos que gobiernan el equilibrio RAFT sedesarrollaron experimentos realizados con resonancia paramagnética electrónica (EPR).La constante de equilibrio, Keq, se obtiene de la proporción de las concentracionesdel radical intermedio, INT, y de los radicales propagadores, P. Ésta proporciónse calcula de un espectro EPR durante la polimerización RAFT estacionaria. Elotro método utiliza la espectroscopía EPR con alta resolución temporal para seguirlas concentraciones de INT y P en polimerizaciones iniciadas por un pulso de láser(SP-PLP-EPR-RAFT). Simulaciones de los datos experimentales dan como resultadolas constantes de velocidad de adición, kad, de fragmentación, kβ, y de terminaciónentre el radical intermedio y radicales propagadores, kcrosst .
Los dos métodos se han aplicado a las polimerizaciones RAFT de acrilato de butilomediadas por xantato, tritiocarbonato y ditiobenzoato. Las constantes de equilibrio,Keq = kad/kβ, de los sistemas investigados obtenidas con el enfoque estacionario soniguales a las del método SP-PLP-EPR-RAFT, indicando que las dos estrategiasexperimentales proporcionan valores fiables para la cinética de RAFT. La rápidafragmentación de INT ha sido observada en todas las polimerizaciones. Los valores delos coeficientes de fragmentación, kβ, son 2.3×10³ s−1 para el xantato, 1.4×10² s−1 y4.5× 101 s−1 para los tritiocarbonatos y 4.7 s−1 para el ditiobenzoato. Las constantesde equilibrio correspondientes son 12 L ·mol−1, 2.6× 10⁴ L ·mol−1, 8× 10⁴ L ·mol−1
y 3× 10⁵ L ·mol−1. Por lo tanto, la constante de equilibrio más alta se ha encontradoen el caso del ditiobenzoato y la más baja en el caso del xantato. Esto es consistentecon la observación experimental que muestra que las polimerizaciones mediadas porditiobenzoatos están mejor controladas que las mediadas por xantatos. La terminaciónentre el radical intermedio y radicales propagadores desempeña un papel menor enlas polimerizaciones en las cuales tritiocarbonatos o xantatos están usados, pero esuna reacción muy importante si se emplean ditiobenzoatos. En este caso, un kcrosstdependiente de la longitud de cadena es necesario para poder explicar los datosexperimentales.
5

Resumen
Para examinar los origenes del efecto de retardación en polimerizaciones mediadaspor ditiobenzoatos y para evaluar la exactitud de las constantes de equilibro calculadaspor Coote et al. con el método ab initio, se llevaron a cabo investigaciones EPR consistemas de modelo libre de monómero. Estos sistemas estuvieron formados por unradical, generado por descomposición de un iniciador apropiado, y un ditiobenzoatocon un grupo saliente R, que es idéntico al radical procedente del iniciador, o seatert-butilo, ciano-iso-propilo o feniletilo. Las constantes de equilibrio correspondientesa 20 ◦C son 105 − 108 L ·mol−1, 53 L ·mol−1 y 2.2× 10³ L ·mol−1.La tendencia de los valores de Keq observada corresponde con la estabilidad del
radical intermedio y con la energía de estabilización del radical, que adiciona alenlace doble C=S del agente RAFT. Las constantes de equilibrio teóricas siguen lamisma tendencia, pero están hasta seis ordenes de magnitud encima de las valoresexperimentales. Además, los calculos ab initio pronostican una gran dependencia de lalongitud de cadena para Keq. Esto se revisó experimentalmente usando agentes RAFTpoliméricos para la investigación estacionaria y comparando los sistemas poliméricoscon los sistemas de modelo libre de monómero. Se observó solamente una dependenciade la longitud de cadena muy leve. Por lo tanto, los resultados experimentales refutenlos cálculos ab initio que predicen una fragmentación lenta y una dependencia clarade la longitud de cadena.Además, se analizó con espectroscopia de resonancia magnética nuclear (RMN) la
mezcla de productos de los sistemas de modelo. Los resultados de las mediciones EPRy RMN demuestran, que la terminación de INT con radicales propagadores seguida deunas reacciones llamadas “Missing Step” de los productos de terminación inestableses responsable de la retardación de la velocidad en las polimerizaciones mediadas porditiobenzoatos.
6

1Introduction
A polymer is a large molecule built up by the repetition of small monomer-derivedunits. Biopolymers such as the genetic information carrier deoxyribonucleic acid(DNA), proteins, and polysaccharides are the building blocks of life. Natural polymers,for example wood, wool, silk, starch, and rubber, are used by mankind since manycenturies as construction material, for clothing or as thickener. [1]
Since the invention of the first man-made synthetic plastic by Baekeland [2] in1907 and the investigations of Staudinger [3] in the 1920’s that form the basis formodern macromolecular science, synthetic polymers have revolutionized our wayof life. Applications range from packaging, sports and outdoor equipment, paints,coatings, electronics, automobiles to the aircraft and space industry. [4] In manyof these applications, plastics replaced other materials because of their beneficialproperties like low weight, chemical resistance, shape flexibility, durability, as well asthermal, acoustic and electrical insulation properties.Over the past two decades plastics production grew almost 5 % per year. In 2010,
265 million tons were produced worldwide – thereof approximately 50 % by radicalpolymerization (RP). [5,6] The success of radical polymerization can be attributed to thelarge range of monomers, which can be homo- and co-polymerized under convenientreaction conditions, and the insensitivity to impurities. [6] However, conventionalradical polymerization produces non-biodegradable polymeric chains. This is a majorproblem considering that, in Europe alone, 10.4 million tons of plastic waste weredisposed of in landfill in 2010. [5] While the world is gradually running out of fossilfuel, the conventional radical polymerization process depends on petroleum resourcesas the raw material. [7] The need of modern society for highly functional polymeric
7

1 Introduction
materials is increasing, but conventional radical polymerization does not providecontrol over the microstructure of the polymer.The most promising candidates for minimizing the environmental impact and pro-
ducing materials with well-defined properties at the same time are the controlled/livingradical polymerization techniques (CLRP) developed since the early 1990s. The con-cept of living polymerization was first discovered by Szwarc [8,9] in 1956 and describespolymerization processes in which chain transfer and chain termination are absent –a major key for tailoring macromolecular architecture. [10] Applying the concept of liv-ingness to radical polymerizations affords techniques which combine the advantages ofboth approaches. Of particular scientific interest are currently nitroxide-mediated poly-merization (NMP), [11] atom transfer radical polymerization (ATRP), [12,13] reversibleaddition-fragmentation chain transfer polymerization (RAFT), [14] and reversible chaintransfer catalyzed polymerization (RTCP). [15–17]
All CLRP systems are based on a dynamic equilibrium between propagating radicalsand a dormant species, [18] which suppresses termination reactions. In this way, thelifetime of growing chains can be extended from approximately one second in free-radical polymerization to hours or days in CLRP. This leads to polymers of uniformchain length that is pre-determined by monomer conversion and initiator concentration.The International Union of Pure and Applied Chemistry (IUPAC) encourages theuse of the term “reversible-deactivation radical polymerization” for polymerizationsexhibiting these characteristics. [19]
The increasing attention that particularly RAFT polymerization has attracted sinceits invention in 1998, [14] is partly due to the fact that it allows for the sustainableproduction of highly functionalized plastics. Environmentally friendly solvents likewater and supercritical carbon dioxide may be employed, [20,21] polymerization canbe carried out at room temperature, [22] renewable monomers can be polymerized, [23]and biodegradable polymers can be produced. [24] In addition, RAFT enables theformation of a large variety of macromolecular architectures such as block copoly-mers, [25–27] star-like polymers, [28,29] comb-like structures, [30] hyperbranched polymers,dendritic structures, and polymer networks. [31] These novel structures are valuablefor surface and particle modification, [31] drug delivery, [32,33] nano- and microporousmaterials, [30,34,35] and microelectronics. [6]The RAFT process operates on the principle of reversible chain transfer (also
termed degenerative chain transfer), [18] with the pre- and main equilibrium beingsuperimposed on a conventional radical polymerization scheme. The equilibria aredecisive for the control of polymerization and, consequently, for polymer properties.The rate coefficients governing the equilibria are the addition and fragmentation rates,kad and kβ, respectively. Precise determination of these rate coefficients is thereforeessential. The rate coefficients kad and kβ are, however, not easily accessible, as theRAFT equilibria do only cause a minimal perturbation to the conventional radicalpolymerization kinetics. The rate of polymerization remains unaffected, which poses
8

a challenge with respect to the determination of kad and kβ, as rate measurementsare one of the key techniques for gaining insight into a mechanistic process.Due to these difficulties most of the literature values for kad and kβ were de-
rived from ab initio quantum-chemical calculations. [36–42] Experimentally obtainedrate coefficients depend strongly on the assumed kinetic scheme and, in some cases,differ by up to six orders of magnitude for the same polymerization system. [43–46]The biggest controversy concerns the addition and fragmentation rate coefficientsin dithiobenzoate-mediated polymerizations, because with some dithiobenzoates thepolymerization rate is decreasing with increasing RAFT agent concentration. Thisphenomenon, called rate retardation, has given rise to an ongoing debate on the originof this effect. The proposed models include slow fragmentation (SF) of the intermedi-ate radical, [47] intermediate radical termination (IRT) [48] and IRT with subsequent“missing step” reactions of unstable cross-termination products. [49] Whereas ab initiocalculations carried out so far support the slow fragmentation model, [42] electronparamagnetic resonance (EPR) measurements, nuclear magnetic resonance (NMR)spectroscopy and size-exclusion chromatography (SEC) studies point to the IRTmodel. [50] In addition, ab initio calculations predict a strong chain-length dependencefor kad and kβ, which needs to be experimentally verified. [39]
The aims of this thesis are to develop direct experimental methods for the determi-nation of the rate coefficients relevant to the RAFT equilibria and to test whetherthese rate coefficients are chain-length dependent. In this way, the evaluation ofthe accuracy of theoretical calculations becomes possible. Additionally, the workintends to shed light on the reasons behind the rate retardation observed in somedithiobenzoate-mediated polymerizations. The design of an appropriate kinetic modeland the accurate measurement of the kinetic parameters is needed, as the molecularstructure is determined by the individual reaction steps that occur during polymeriza-tion. The microscopic structure, in turn, governs the macroscopic material properties.Knowledge of the entire kinetic scheme and the rate coefficients involved thereforeserves as the basis for further development and optimization of the RAFT process.
9


2Mechanism and kinetics of RAFT
polymerization
This chapter provides the theoretical background for the thesis. It introduces thereader to the mechanism of the RAFT process, the key features of a RAFT agentand the associated rate coefficients. The kinetic anomalies which occur with someRAFT agents are illustrated and an overview of the models proposed to describe thereasons behind the observed behavior is given.
2.1 The ideal RAFT mechanismThe basic kinetic scheme of the RAFT process is illustrated in Scheme 2.1. The pre-and main equilibrium (II and V, respectively) are superimposed on a conventionalradical polymerization scheme with the elementary steps, [51] i. e. initiation (I), propa-gation (IV), and termination (VI), being unaffected. The mechanism and kinetics ofconventional radical polymerization are detailed in literature. [6]In the first reaction step, radical formation is induced either by thermal, chemical
or photochemical excitation of an initiator (Ia). The initiator-derived radicals, I q,subsequently initiate polymerization by adding to a monomer molecule (Ib).
In the pre-equilibrium (II), macroradicals, P qi, add to the C=S double bond of the
RAFT agent forming an intermediate radical, INT1, which can either react back tothe educts or proceed to release the leaving group, R q, and form a polymeric RAFTagent, polyRAFT. The leaving group radical may either react with the polymericRAFT agent, forming INT1, or with the initial RAFT agent to yield an intermediate
11

2 Mechanism and kinetics of RAFT polymerization
I. Initiation
SS
ZRPi +
SS
ZRPi
..R.SS
ZPi +
kad,1
kβ,1
kβ,2
kad,2
SS
ZPjPi +
SS
ZPjPi
..Pj.SS
ZPi +
kad,1
kβ,1
kβ,2
kad,2
R.
+ M P1kp,rein
Pi.
+ M Pi+1kp
I Ikd, f .
2
Pi.
+ Pj Pi+jktc.
Pi.
+ Pj Piktd.
Pj+
(Ia)
(IV)
(IIa)
(III)
(V)
(VIa)
(VIb)
Iki .
(Ib).
+ M P1
(IIb)SS
ZR+
SS
ZRR
.. kad,3
kβ,3R
R.
+ R R-Rkt.
(VIc)
Pi.
+ I Pikt.
(VId)
Pi.
+ R Pikt.
(VIe)
RAFT INT1 polyRAFT
INTRR
polyRAFT INT
.
.
II. Pre-equilibrium
SS
ZRPi +
SS
ZRPi
..R.SS
ZPi +
kad,1
kβ,1
kβ,2
kad,2
SS
ZPjPi +
SS
ZPjPi
..Pj.SS
ZPi +
kad,1
kβ,1
kβ,2
kad,2
R.
+ M P1kp,rein
Pi.
+ M Pi+1kp
I Ikd, f .
2
Pi.
+ Pj Pi+jktc.
Pi.
+ Pj Piktd.
Pj+
(Ia)
(IV)
(IIa)
(III)
(V)
(VIa)
(VIb)
Iki .
(Ib).
+ M P1
(IIb)SS
ZR+
SS
ZRR
.. kad,3
kβ,3R
R.
+ R R-Rkt.
(VIc)
Pi.
+ I Pikt.
(VId)
Pi.
+ R Pikt.
(VIe)
RAFT INT1 polyRAFT
INTRR
polyRAFT INT
.
.
III. Reinitiation
SS
ZRPi +
SS
ZRPi
..R.SS
ZPi +
kad,1
kβ,1
kβ,2
kad,2
SS
ZPjPi +
SS
ZPjPi
..Pj.SS
ZPi +
kad
kβ
kβ
kad
R.
+ M P1kp
Pi.
+ M Pi+1kp
I Ikd, f .
2
Pi.
+ Pj Pi+jktc.
Pi.
+ Pj Piktd.
Pj+
(Ia)
(IV)
(IIa)
(III)
(V)
(VIa)
(VIb)
Iki .
(Ib).
+ M P1
(IIb)SS
ZR+
SS
ZRR
.. kad,3
kβ,3R
R.
+ R R-Rkt.
(VIc)
Pi.
+ I Pikt.
(VId)
Pi.
+ R Pikt.
(VIe)
RAFT INT1 polyRAFT
INTRR
polyRAFT INT
.
.
rein
IV. Propagation
SS
ZRPi +
SS
ZRPi
..R.SS
ZPi +
kad,1
kβ,1
kβ,2
kad,2
SS
ZPjPi +
SS
ZPjPi
..Pj.SS
ZPi +
kad,1
kβ,1
kβ,2
kad,2
R.
+ M P1kp,rein
Pi.
+ M Pi+1kp
I Ikd, f .
2
Pi.
+ Pj Pi+jktc.
Pi.
+ Pj Piktd.
Pj+
(Ia)
(IV)
(IIa)
(III)
(V)
(VIa)
(VIb)
Iki .
(Ib).
+ M P1
(IIb)SS
ZR+
SS
ZRR
.. kad,3
kβ,3R
R.
+ R R-Rkt.
(VIc)
Pi.
+ I Pikt.
(VId)
Pi.
+ R Pikt.
(VIe)
RAFT INT1 polyRAFT
INTRR
polyRAFT INT
.
.
V. Main equilibrium
SS
ZRPi +
SS
ZRPi
..R.SS
ZPi +
kad,1
kβ,1
kβ,2
kad,2
SS
ZPjPi +
SS
ZPjPi
..Pj.SS
ZPi +
kad
kβ
kβ
kad
R.
+ M P1kp,rein
Pi.
+ M Pi+1kp
I Ikd, f .
2
Pi.
+ Pj Pi+jktc.
Pi.
+ Pj Piktd.
Pj+
(Ia)
(IV)
(IIa)
(III)
(V)
(VIa)
(VIb)
Iki .
(Ib).
+ M P1
(IIb)SS
ZR+
SS
ZRR
.. kad,3
kβ,3R
R.
+ R R-Rkt.
(VIc)
Pi.
+ I Pikt.
(VId)
Pi.
+ R Pikt.
(VIe)
RAFT INT1 polyRAFT
INTRR
polyRAFT INT
.
.
VI. Termination
SS
ZRPi +
SS
ZRPi
..R.SS
ZPi +
kad,1
kβ,1
kβ,2
kad,2
SS
ZPjPi +
SS
ZPjPi
..Pj.SS
ZPi +
kad
kβ
kβ
kad
R.
+ M P1kp,rein
Pi.
+ M Pi+1kp
I Ikd, f .
2
Pi.
+ Pj Pi+jktc.
Pi.
+ Pj Piktd.
Pj+
(Ia)
(IV)
(IIa)
(III)
(V)
(VIa)
(VIb)
Iki .
(Ib).
+ M P1
(IIb)SS
ZR+
SS
ZRR
.. kad,3
kβ,3R
R.
+ R R-Rkt.
(VIc)
Pi.
+ I Pikt.
(VId)
Pi.
+ R Pikt.
(VIe)
RAFT INT1 polyRAFT
INTRR
polyRAFT INT
.
.
Scheme 2.1. Basic RAFT mechanism.
12

2.2 Features of the RAFT agent
radical bearing two leaving groups, INTRR. The pre-equilibrium is governed by threeaddition and fragmentation rate coefficients (kad,1, kad,2, kad,3, kβ,1, kβ,2 and kβ,3).
The next sequence of reaction steps are the reinitiation (III) and propagation (IV),which are proceeding with the rate coefficients kp and kreinp , respectively. In thepropagation step (IV), the radicals grow by adding monomer molecules.
The reinitiation step shifts the pre-equilibrium to the side of the polyRAFT speciesand the initial RAFT agent is consumed. After complete consumption the polymeriza-tion is governed by the main equilibrium (V), which constitutes the core of the RAFTprocess. Rapid equilibration between the active propagating radicals, P q
i and P qj ,
and the dormant polymeric thiocarbonylthio compounds, polyRAFT, provides equalprobability for all chains to grow and allows for the production of narrow-dispersitypolymers. The addition reaction proceeds with the rate coefficient kad, whereasthe formed intermediate radical, INT, fragments with the rate coefficient kβ. Thekad and kβ values are different from those of the pre-equilibrium. The presence ofintermediate radicals in the pre- and main equilibrium (given in reaction step IIa, IIband V, respectively) has been evidenced by electron paramagnetic resonance (EPR)spectroscopy. [50,52–58] The main equilibrium is usually described by the equilibriumconstant Keq, which indicates the stability of the intermediate radical and is definedby
Keq = kadkβ
(2.1)
Finally, reaction steps VI consider radical-radical termination, which is not fullysuppressed by the RAFT process. As in conventional radical polymerization, termi-nation occurs either by disproportionation, in which a hydrogen atom is transferredfrom one radical to another, or by combination, which is mostly a simple head-to-headcoupling of two radicals. [59] The termination rate coefficient, kt, is the sum of theindividual rate coefficients for disproportionation, ktd, and combination, ktc. Thetermination reaction, in which “dead” polymer is formed, is preceded by translationaldiffusion of the two radicals and the segmental diffusion to make contact betweentheir radical sites. [60–62]
2.2 Features of the RAFT agent
The mediating compounds employed in RAFT polymerizations are thiocarbonylthio compounds, the structural features of which are illustrated in Scheme 2.2. Theeffectiveness of RAFT agents strongly depends on the nature of the stabilizing Z groupand the leaving group R, the monomer, and the polymerization conditions. [25,47,63–75]The group Z can be chosen to activate or deactivate the thiocarbonyl double bond ofthe RAFT agent and modifies the stability of the intermediate radicals, INT1, INTRR
13

2 Mechanism and kinetics of RAFT polymerization
and INT. As a result, RAFT agents vary in their suitability for different monomers.The main classes of RAFT agents – which are distinguished by their different Z groups– are dithioesters, [14] dithiocarbamates, [63,67] trithiocarbonates, [76] and xanthates. [77]The structures of the RAFT classes used in this work are illustrated in Scheme 2.3.
SS
ZR
SS
ZRR'
leaving groupshould effectively
reinitiate polymerization
stabilizing group modifies addition and fragmentation rates
reactivedouble bond weak single bond
.
Scheme 2.2. Structural features of the RAFT agent and the intermediateformed on radical addition. [78]
SSR
SS
OR
R'
SS
SR
R'1 2 3
Scheme 2.3. Overview of the RAFT classes investigated in this work: (1)dithiobenzoates belonging to the group of dithioesters, (2) xanthates, and(3) trithiocarbonates.
The features of a RAFT agent which efficiently controls polymerization and therequirements for the corresponding rate coefficients can be summarized as follows: [78,79]
• The initial and the polymeric RAFT agent should have a reactive C=S doublebond, allowing for a high kad.
• The intermediate radicals, INT1, INTRR and INT, should fragment rapidlyand undergo no side reactions. Therefore, the S–R bond of the intermediateshould be weak to assure a high kβ.
• The intermediate radical INT1 should partition in favor of products, i. e. kβ,2 >kβ,1.
• The expelled radicals, R q, must efficiently reinitiate the polymerization, i. e.kreinp > kp.
14

2.3 Kinetic anomalies in dithiobenzoate-mediated polymerizations
2.3 Kinetic anomalies in dithiobenzoate-mediatedpolymerizations
In case the RAFT process depicted in Scheme 2.1 proceeds ideally, that is the chain-transfer process is fast and the RAFT intermediate is short-lived, the propagatingradical concentration is not altered. The rate of polymerization should therefore besimilar to the one found for conventional radical polymerization. However, somepolymerization systems employing dithiobenzoates (compound 1 in Scheme 2.3) asmediating agents deviate from the ideal behavior in showing extended inductionperiods and a significant deceleration in polymerization rate – termed rate retardation– with increasing RAFT agent concentration. The two phenomena are illustrated inFigure 2.1 taking the 2-(2’-cyanopropyl)-dithiobenzoate-mediated polymerization ofn-butyl acrylate as an example.
0 5000 10000 15000 20000 250000.00
0.05
0.10
0.15
0.20
0.25
0.30
retardation""rate
cRAFT
/ mol L1
=
2.4 x 10⁻³
5.0 x 10⁻³
1.0 x 10⁻²
2.0 x 10⁻²
monom
er c
onve
rsio
n
t / s"induction period"
Figure 2.1. Illustration of induction period and rate retardation usingthe example of 2-(2’-cyanopropyl)-dithiobenzoate-mediated polymerizationof n-butyl acrylate at 65 ◦C with 2,2’-azobis(2-methylpropionitrile) (1.5×10⁻³ mol · L−1) as the initiator.
There are several potential explanations for the induction period. Inhibition maybe induced by slow reinitiation by the leaving group of the RAFT agent, the selectiveconversion of the original RAFT agent into a single monomer adduct, [80–84] slowfragmentation of the leaving group, [85] or termination reactions of the intermediate
15

2 Mechanism and kinetics of RAFT polymerization
radicals INT1 and INTRR. [58] When performing RAFT polymerizations using a poly-meric RAFT agent, i. e., effectively skipping the pre-equilibrium, no induction periodcan be observed, whereas rate retardation still occurs. The induction period canhence be attributed to the pre-equilibrium. [86] Since pre-equilibrium characteristicsdo not seem to be the cause of rate retardation during main-equilibrium conditions,both phenomena should be investigated separately.
This work will focus on the origin of rate retardation. The different explanationsput forward for rate retardation are
• intermediate radical termination (Section 2.3.1)
• slow fragmentation of the RAFT intermediate (Section 2.3.2)
• intermediate radical termination followed by “missing step” reactions (Sec-tion 2.3.3)
• intermediate radical termination with short chains only (Section 2.3.4).
The proposed models have in common that they attribute rate retardation to the higherstability of the intermediate radical during the main equilibrium in polymerizationsmediated by dithiobenzoate as compared to the ones mediated by other RAFT agents.The high stability of the intermediate radical is assigned to the delocalization of theradical into the phenyl ring, which is illustrated in Scheme 2.4.
S SPi Pj
S SPi Pj
S SPi Pj
S SPi Pj
.
..
.=
S SPi Pj
.INT
Scheme 2.4. Resonance structures of the intermediate radical indithiobenzoate-mediated polymerizations.
For example, almost no retardation is observed in cumyl phenyldithioacetate-mediated styrene or methyl acrylate polymerization, whereas the cumyl dithiobenzoatemediated polymerization shows significant retardation. [22,64] The rate retardationphenomenon has caused a lively debate in the scientific community leading to theformation of the IUPAC task group “Towards a Holistic Mechanistic Model for RAFTPolymerizations: Dithiobenzoates as Mediating Agents” in 2005. There are severalarticles reviewing the current situation. [78,84,86,87]
Note that all RAFT agents induce retardation when they are employed in very highconcentrations, since chain length decreases with increasing RAFT content which
16

2.3 Kinetic anomalies in dithiobenzoate-mediated polymerizations
leads to higher termination rates. [88] This apparent retardation, which is due to asignificant enhancement of termination rate upon lowering radical size, is not coveredin the following.
2.3.1 Intermediate radical termination
Monteiro and de Brouwer [48] proposed that rate retardation is caused by terminationreactions of the intermediate radical, which may either terminate with a propagatingradical (cross-termination) or with another intermediate radical (self-termination).This so-called intermediated radical termination model (IRT) is illustrated in Scheme2.5. As the radical center of the dithiobenzoate intermediate is delocalized into thearomatic ring and may be shifted to more exposed sites (see Scheme 2.4), such reactionsmay suffer less steric hindrance than is the case with other RAFT intermediateswhere the radical functionality is localized between the sulfur atoms. When sterichindrance is introduced at the para position of the Z group – making this positionless prone to radical attack – a significant reduction of the rate retardation effecthas been observed. [89] It is therefore reasonable to assume that intermediate radicaltermination is favored by the delocalization of the radical functionality.
S SPjPi
.+ Pk
S SPjPi
Pk
ktcross
S SPjPi
. S SPlPk
.
S
SPk
Pl
S
SPi
Pjkt
self
+
Scheme 2.5. Illustration of the cross-termination reaction between apropagating radical and an intermediate radical (upper part) and the self-termination reaction of two intermediate radicals (lower part). Only onepossible reaction pathway for each termination reaction is shown. Bothtermination reactions may occur with all resonance structures depicted inScheme 2.4.
Evidence for this model mainly comes from electron spin resonance (EPR) spec-troscopy. Using this technique, Kwak et al. [50,90] studied the polymerization of styrene
17

2 Mechanism and kinetics of RAFT polymerization
mediated by a polystyryl dithiobenzoate. A relatively low concentration of interme-diate radicals (of the order of 10−7 mol · L−1) was produced by the addition of thepolystyryl radical to the RAFT agent. From the rate of polymerization the concen-tration of the growing radical was estimated. The ratio of radical concentrationsyields a Keq value of 55 L ·mol−1 at 60 ◦C (see Equation 3.3) and it was shown thatfragmentation of the intermediate radical is a fast process with a relevant rate constantof the order of kβ = 104 s−1. In addition, cross-termination with the polystyryl radicalled to the formation of a stable 3-arm star, which causes rate retardation. Thus,Kwak et al. proposed to calculate Keq from the observed rates of polymerization, Rp,at different RAFT agent concentrations, cRAFT, via the equations [50,90]
Rp =R0p√
1 + 2·kcrosstkt·Keq · cRAFT
(2.2)
andRp =
R0p√
1 + kselftkt·K2
eq · c2RAFT
(2.3)
where R0p denotes the rate of the RAFT-free polymerization, cRAFT the initial RAFT
agent concentration and kt, kcrosst and kselft the chain-length averaged termination,cross-termination and self-termination rate coefficient, respectively.Tonge et al. [91] used EPR spectroscopy to directly detect both propagating and
intermediate radicals during dithiobenzoate-mediated polymerizations of styrene andmethyl acrylate. From the RAFT agent concentrations used and the fact that bothspecies are seen, i. e., that they occur at similar concentrations, one can concludethat Keq < 100 L ·mol−1. Unfortunately, not all concentrations are given so that noquantitative estimate of Keq can be made.
The identification of IRT products is challenging as only a few percent of dead chainswith broad molecular mass distribution are formed during the process. However,some studies prove the occurrence of cross- and self-termination products: Calitz etal. [58] investigated the reactions of short-chain species during the initial periods ofcumyl dithiobenzoate-mediated polymerizations of styrene at 84 ◦C using 13C NMRspectroscopy and found species resulting from termination of intermediate radicals.Venkatesh et al. [92] showed on the basis of model experiments that the formationof long-arm star-shaped polymers through IRT is possible using a combination ofsize-exclusion chromatography (SEC) and matrix-assisted laser desorption ionizationtime-of-flight mass spectrometry (MALDI-TOF-MS). Geleen and Klumperman usedthe same method to identify IRT products formed during a “normal” RAFT-mediatedBA polymerization. [93] They employed a dithiobenzoate with a chromophore in theleaving group and found that cross- and self-termination products of the intermediate
18

2.3 Kinetic anomalies in dithiobenzoate-mediated polymerizations
species are being formed from the early stages of polymerization on and remainunchanged throughout.Wang and Zhu successfully fitted molar mass, polydispersity index (PDI ) and
monomer conversion versus reaction time data of the polystyryl dithiobenzoate-mediated styrene polymerization with the IRT model using the method of mo-ments. [45,46] Monte Carlo simulations of cumyl dithiobenzoate mediated methyl acry-late polymerization also suggest that cross-termination occurs. [55] Both simulationswere able to predict intermediate radical concentrations correctly.
Further evidence for the IRT model comes from miniemulsion polymerization.Lou et al. [94] investigated the RAFT miniemulsion polymerization of styrene with adithioacetate and a dithiobenzoate as mediating agents. The Keq values are estimatedto be 22 L ·mol−1 and 314 L ·mol−1 for the dithioacetate and dithiobenzoate, respec-tively. Monomer conversion versus time traces were fitted to a kinetic model yieldingfragmentation rate coefficients of about 104 to 105 s−1. Suzuki et al. [95,96] carried outstyrene polymerization using dithiobenzoate as the RAFT agent in both bulk andminiemulsion systems with the same rates of radical generation and the same RAFTagent concentrations. Polymerization in miniemulsion was by far faster than in bulkand the obtained rate of polymerization agreed with the calculated results assumingcross-termination between the propagating radical and intermediate radical.
2.3.2 Slow fragmentation
Moad et al. [47] proposed that resonance stability of the intermediate radical by itselfleads to slow fragmentation, that is a very low kβ and a high Keq value. Support forthis so-called slow fragmentation (SF) model comes from ab initio calculations byCoote and co-workers. [36–42] Most of these calculations focus on the pre-equilibriumsituation, i. e., small model compounds, and predict Keq values in the order of107 L ·mol−1 at 60 ◦C. This SF value exceeds the Keq value from the IRT model bysix orders of magnitude.Quantum-chemical studies of dithiobenzoates and oligomeric species are available
for the 2-(2’-cyanopropyl)-dithiobenzoate-mediated styrene polymerization up to thetrimer stage of the attacking radical [39,97] and for tert-butyl dithiobenzoate-mediatedMMA polymerization. [98] For the styrene system Keq increases by about three ordersof magnitude going from the unimer to trimer stage. For the MMA system an increaseby one order of magnitude is predicted. Hence, a chain-length dependence of Keqalone can not account for the huge discrepancy between SF and IRT model.
Experimental evidence for slow fragmentation is scarce. Barner-Kowollik et al. [43,44]successfully modeled the evolution of molar mass, PDI and monomer conversionversus reaction time in polystyryl dithiobenzoate-mediated styrene polymerizationwith Predici R© using kβ = 3×10⁻² s−1 andKeq = 1.6×10⁷ L ·mol−1. Yet, with these
19

2 Mechanism and kinetics of RAFT polymerization
coefficients intermediate radical concentrations of about 10−4 mol · L−1 should occur,1which contradicts EPR measurements. In another experiment, Barner-Kowollik etal. subjected a mixture of CDB and styrene to γ-irradiation. From the results theysuggested that a stable intermediate product is formed. [99] However, the influence ofγ-irradiation on RAFT polymerization is not yet fully understood. [84]The only direct observation of slow fragmentation comes from Chernikova et al.
for the model system tert-butyl/tert-butyl dithiobenzoate (TB/TBDB) using a spintrap method (see Section 5.1). [100] The observed slow fragmentation rate is in linewith the high intermediate radical concentrations, which were detected with EPRspectroscopy by the same group in the initial period of n-butyl acrylate polymerizationsin the presence of tert-butyl dithiobenzoate. [56] However, the intermediate radicalconcentration then slowly decreased and it was concluded that retardation in theinitial stages was caused by slow fragmentation, but retardation afterwards was dueto IRT. This model system does not prove slow fragmentation, as it is not generallyvalid.
The supporters of the SF model further argue that high amounts of cross- andself-termination products should be found in dithiobenzoate-mediated polymerizations,which is however not the case in acrylate polymerizations. [101–103] Barner-Kowollik andJunkers also compared acrylate midchain radicals with RAFT intermediate radicalsand concluded that both species should be associated with a low fragmentation ratecoefficient. [104]
2.3.3 “Missing step” reactionsNeither the intermediate radical termination model nor the slow fragmentation modelare capable of explaining the entire body of experimental observations. The highconcentrations of cross- and self-termination products predicted by the IRT model werenot found under polymerization conditions. Slow fragmentation should lead to highintermediate radical concentrations, which is incompatible with EPR data. Therefore,Buback and Vana proposed to include an additional reaction – termed “missing step”– into the kinetic scheme. [49] As illustrated in Scheme 2.6, the “missing step” occurssubsequent to cross-termination and transforms a highly reactive propagating radicaland a not overly stable three-arm star species into the resonance-stabilized RAFTintermediate radical and a very stable polymer molecule. DFT estimates suggest thatthese reactions should be rather fast. [105]
Predici R© simulations show that these steps neither influence polymerization ratenor intermediate radical concentration but provide a way to resolve the controversyabout the low concentrations of IRT products. Thus, an extended kinetic schemeincluding IRT and “missing step” reactions represents all essential observations made
1The concentration of intermediate radicals was simulated with Predici R© using the rate coefficientsgiven by Barner-Kowollik et al. [43]
20

2.3 Kinetic anomalies in dithiobenzoate-mediated polymerizations
for the main-equilibrium period of dithiobenzoate-mediated RAFT polymerizations.Indication for the occurrence of a “missing step” reaction has been provided byMoad et al. by monitoring AIBN-initiated benzyl dithiobenzoate-mediated styrenepolymerization via real-time 13C NMR. They found an NMR resonance signal whichcould correspond to a ring-substituted benzyl dithiobenzoate formed by a “missingstep” process. [106]
S SPi Pj
.
kt
S SPi Pj
+ Pk
Pk
Pl Pk
+ Pl
kMS
INT Pk INT
cross
Scheme 2.6. Illustration of the “missing reaction step” by Buback andVana. [49]
2.3.4 Intermediate radical termination with short chains only
Intermediate radical termination in conjunction with the “missing step” processallows for adequate representation of the entire body of kinetic characteristics ofdithiobenzoate-mediated polymerization, but clear experimental evidence for thelatter reaction steps is still pending (see above). Therefore, the debate has not yetcome to an end. The supporters of the SF model claim that the ab initio calculationsare correct, whereas the results from experiments are model-dependent and differencesin experimental and calculated Keq may be due to effects of chain-length dependenceand/or of solvent interactions. [98,107] As some kind of a compromise, the supportersof the SF model by now accept a model which assumes cross-termination of RAFTintermediates with propagating radicals up to a chain length of i = 3 and very slowcross-termination of larger species. [108–110]
This model, as introduced by Konkolewicz et al., [109,110] accounts for the absence of3-armed stars predicted by IRT with radicals of arbitrary chain length, since the short
21

2 Mechanism and kinetics of RAFT polymerization
radical makes a negligible difference to the overall molecular mass. The predictedrate coefficients are consistent with slow fragmentation of the RAFT intermediate,and the overall concentration of radicals is consistent with ESR experiments.As in the case of the “missing step” process, there is currently no unambiguous
proof for this proposition. A study of Ting et al. [111] certainly indicates that cross-termination becomes negligibly small at longer chain lengths. In this study, all shortradicals where eliminated from the polymerization system by employing a macro-azo-initiator and a polymeric RAFT agent based on cumyl dithiobenzoate. The resultsshow – in agreement with the model proposed by Konkolewicz et al. – that there isvery little retardation in dithiobenzoate-mediated RAFT polymerization of styrenein the absence of short radicals, but it must be stressed that initial chain lengths ofaround 50 were used. Thus, this experiment does not provide any information aboutthe influence of cross-termination in the chain length range of 3 to 50. In addition,Geelen and Klumperman found indications for 3- and 4-arm stars consisting of longchain arms in dithiobenzoate-mediated butyl acrylate polymerizations. [93]
That intermediate radicals exclusively terminate with propagating radicals of veryshort chain length is also in conflict with results from Monte Carlo simulations, wherethe contact probability between radical chain ends and several positions along thearms of star-branched chains with up to six arms was investigated. [112] For a two-armstar, a reduction of the contact probability with radical size according to a powerlaw with an exponent of −0.27 has been found, which number is only slightly abovethe exponent of −0.16 for the contact probability of the radical chain ends of twolinear chains. Thus, the contact probability is not reduced to such an extent as toimpede the production of larger star-shaped species. The result from theory is infull agreement with the observed control of RAFT synthesis of star polymers, whichrequires efficient chain transfer at the center of the star-shaped polymer. [113] Forcross-termination between an intermediate radical and a growing chain, the sameshielding effects as for chain transfer processes should operate.The IRT process and the associated termination rate coefficients can also be
discussed using the mean field theory [114] or the theory of irreversible intermolecularreactions of polymeric species in dilute polymer solutions. [115] The power law exponentsare close to the ones from Monte Carlo simulations, which suggests that the ratecoefficient for a 100-meric radical is still about 27 % that of a monomeric radical. [84]Therefore, restricting termination of INT species to reaction with very small radicalswould be associated with a highly unusual chain-length dependence of this process,for which no physical reason is seen.
22

3Choice of the methods of investigation
This chapter focuses on the appropriate design of experiments to determine additionand fragmentation rate coefficients of the RAFT equilibrium and to clarify the kineticsof dithiobenzoate-mediated polymerizations. The requirements of discriminationbetween the models presented in Chapter 2 are discussed. Quasi-stationary EPRexperiments for the determination of the RAFT equilibrium constant and time-resolved EPR experiments for measuring the individual rate coefficients for additionand fragmentation are outlined. In addition, the considerations made for selectingthe appropriate reaction conditions are given.
3.1 Experiments based on polymerization behavior
Measuring the rate of radical polymerization constitutes one of the main techniquesfor gaining insight into a mechanistic process. However, since the RAFT equilibriado – in principle – not change the concentration of propagating radicals, the ratecoefficients associated with the equilibria are difficult to obtain. Only the additionrate coefficient, kad, may be calculated from the transfer constant, which is obtainedusing the Mayo equation or by analyzing the dependence of the monomer conversionon RAFT conversion. [43,47,64,66,73,74,116,117] The equilibrium constant, Keq, and thefragmentation rate coefficient, kβ, can not be obtained from the polymerizationbehavior.If the polymerization rate is retarded Kwak et al. [50] proposed to derive Keq from
the observed rates of polymerization at different RAFT agent concentrations via
23

3 Choice of the methods of investigation
Equation 2.2 and 2.3. However, this procedure is only applicable to a restricted extent,since
• determination of Keq is limited to RAFT agents which retard polymerizationrate,
• determination of Keq is model-dependent (assumption of chain-length averagedkcrosst and kselft ), and
• rate retardation may not be only a consequence of intermediate radical termina-tion, but also of a combination of various effects (see Section 2.3).
One may thus conclude that Equations 2.2 and 2.3 provide only limited access to anaccurate RAFT equilibrium constant.
Measuring the polymerization rate, the PDI or the molar mass distribution duringRAFT polymerization also does not allow for discrimination between the intermediateradical termination and the slow fragmentation model. Since only a small fractionof intermediate radicals undergoes termination, the loss of RAFT species is only bya few percent. Hence, there is little or no effect on the molecular mass distributionand controlled polymer architecture with low polydispersity will be maintained. Amethod which focuses on the RAFT equilibrium and directly traces the species whichare being part of it should be developed preferentially.
3.2 Quasi-stationary EPR experimentsSince two of the three species involved in the RAFT equilibrium are of radical nature,electron paramagnetic resonance (EPR) spectroscopy should be the method of choice.First attempts to determine the rate coefficients associated with the RAFT equilibriumvia EPR spectroscopy were undertaken by Kwak et al. [50] They assumed that withthe polymerization system illustrated in Scheme 2.1 and 2.5 being in a stationarystate for observation over a relatively short time scale, the following equation shouldhold with respect to the intermediate-radical concentration:
0 = dcINTdt
= kad × cP × cRAFT − kβ × cINT − kcrosst × cP × cINT − kselft × c2INT (3.1)
If the rates of cross- and self-termination reactions are negligibly small comparedto those of addition and fragmentation, Equation 3.1 may be rewritten as:
kad × cP × cRAFT = kβ × cINT (3.2)
Combining Equation 3.2 and the definition for the RAFT equilibrium constant(Equation 2.1) one obtains the relation:
cINTcP
= kadkβ× cRAFT = Keq × cRAFT (3.3)
24

3.3 Time-resolved EPR experiments
Hence, the radical concentration ratio allows evaluation of the RAFT equilibriumconstant by way of a plot of cINT/cP against initial RAFT agent concentration, cRAFT.The slope of the so-obtained straight line yields Keq.
Kwak et al. [50] derived the intermediate-radical concentration, cINT, during dithio-benzoate-mediated styrene bulk polymerization at 60 ◦C via EPR spectroscopy. Inaddition, the rate of polymerization was monitored to deduce the concentration ofpropagating radicals, cP. The ratio of cINT to cP gave the equilibrium constant, Keq.Apart from the assumption that cross- and self-termination occur at negligible ratesas compared to addition and fragmentation – which has to be verified by additionalexperiments – this approach is model-free.
In the present thesis, the accuracy of Keq determination based on Equation 3.3 hasbeen improved by measuring the ratio of cINT and cP in one EPR experiment, whicheliminates the necessity of calibrating the EPR setup and thus greatly facilitates theexperiment. [118] The two types of radicals may be spectroscopically distinguisheddue to their individual hyperfine splitting. The individual radical fractions can bedetermined by the deconvolution procedure described in Section 7.3.3. This constitutesan enormous advantage over methods forKeq determination, [50] where absolute radicalconcentrations have to be measured. For determination of the INT to P ratio with thelowest possible experimental error the two types of radicals have to occur at similarconcentrations, which – according to Equation 3.3 – is the case, when cRAFT is closeto the inverse of Keq. Therefore, the RAFT agent concentrations has to be adjustedto Keq.In systems where significant cross-termination between intermediate and propa-
gating or initiator-derived radicals occurs, the RAFT agent concentration decreaseswith reaction time. In this case, the cINT/cP ratios were determined from successiveEPR scans and extrapolated to t = 0. The extrapolated value refers to the initialconcentration of RAFT agent.
3.3 Time-resolved EPR experiments
The individual rate coefficients kad and kβ can not be derived via the stationaryapproach illustrated in Section 3.2, but require measurement of the concentrations ofboth INT and P species by time-resolved EPR spectroscopy after pulse laser initiation(SP-PLP-EPR-RAFT). Such EPR measurements of two types of radicals have alreadybeen used to study the intramolecular chain transfer (backbiting) kinetics of n-butylacrylate where secondary chain-end radicals may react via 1,5 H-shift to tertiarymidchain radicals. [119]During RAFT polymerization, the time evolutions of INT and P concentrations
are monitored and kad and kβ are deduced from fitting the associated concentrationversus time profiles via the software package Predici R©(see Chapter 8). Chain-length
25

3 Choice of the methods of investigation
INT•
P•
b
Figure 3.1. Illustration of the quasi-stationary Keq determination andthe SP-PLP-EPR-RAFT method using the example of a trithiocarbonate-mediated n-butyl acrylate polymerization.
dependent rate coefficients for termination and cross-termination reactions wereimplemented into the model as obtained from SP-PLP-EPR from the associatedRAFT-free system. This procedure constitutes a considerable improvement over thepreviously described approach where only the concentration versus time trace of theintermediate radical has been measured. [120]As shown in Figure 3.1, the equilibrium constant, Keq, obtained from this single-
pulse approach can be compared directly with Keq determined via the quasi-stationaryapproach. Since the accuracy of kad and kβ determination depends on the applicationof the correct kinetic scheme, the comparison of the results obtained by the twoindependent methods is valuable to ensure the applicability of the model implementedinto Predici R©.In addition, kcrosst may be estimated and – in conjunction with kad and kβ – the
assumption made for the stationary determination of Keq, i. e., that the rates ofcross-termination and self-termination are negligibly small as compared to the ratesof addition and fragmentation, can be verified.
26

3.4 Product analysis by NMR spectroscopy and mass spectrometry
3.4 Product analysis by NMR spectroscopy and mass spec-trometry
The EPR experiments are valuable for deducing the rate coefficients relevant for theRAFT equilibrium. Especially the magnitude of the fragmentation rate coefficientallows to distinguish between the competing models put forward to describe rateretardation in dithiobenzoate-mediated polymerizations, i. e., intermediate radical ter-mination and slow fragmentation in particular. Most studies using NMR spectroscopyand mass spectrometry focus on the detection of cross- and self-termination products.To check, however, whether cross-termination products undergo follow-up reactions,the identification of all side product which form during the process is required.
In most of the previous studies described in Section 2.3.1 high initial RAFT agentconcentrations were used, which resulted in a very long pre-equilibrium period andonly oligomeric material was formed. The products were monitored online. The 3-armstar oligomeric products, which have been found, may result from cross-termination,but also from the “missing step” process. The exact structures have not been identified,because the separation of all products is not possible under conditions where oligomeror polymer is formed.
In the present work, the product compositions of model systems without monomerwere analyzed. Studying model systems provides the advantage of having reactants andproducts showing significant differences in their chemical structure, which enables theirindividual spectroscopic monitoring. All products can be isolated and characterizedindividually. The products of the model systems (Chapter 5) were therefore separatedby column chromatography and their structures subsequently identified via massspectrometry, 1D (1H, 13C) and 2D (COSY, HSQC, HMBC) NMR spectroscopy. Thefractions of side products were determined from 1H NMR spectroscopy. In this way,the impact of side reactions on the RAFT kinetics may be evaluated.
3.5 Selection of experimental conditions
For the experiments described in the previous sections (I) RAFT agent, (II) initiator,(III) solvent, (IV) monomer and (V) reaction conditions have to be chosen carefullyin order to avoid side reactions and reduce the complexity of the kinetic scheme.
(I) The leaving group of the RAFT agent should have the same chemical structureas the propagating radical for the experiments with macromolecular systems (Chapter4) and as the initiator-derived radical for the model systems (Chapter 5). This assuresthe applicability of Equation 3.3 and reduces the number of fitting parameters forPredici R© simulations.
27

3 Choice of the methods of investigation
For the experiments with photoinitiation, the RAFT agent should show only weakabsorption in the spectral range of the 500 W mercury UV lamp or at the laserline (351 nm) and should be stable towards laser and UV irradiation. To checkfor this conditions, UV spectra were recorded after irradiation of the investigatedRAFT agents with UV light. The RAFT agents used in this work, which had to bechecked for their UV stability, are the xanthate ethyl 2-[1-diethoxyphosphoryl-2,2,2-trifluoroethoxythio carbonylsulfanyl] propionate (EDTCP), the trithiocarbonates S-ethyl propan-2-ylonate-S ’-propyl trithiocarbonate (EPPT) and S ’-bis(methyl-propion-2-ylate) trithiocarbonate (BMPT), as well as the dithiobenzoate ethyl S-thiobenzoyl-2-thiopropionate (ETTP). The decay of EDTCP, EPPT and ETTP concentrationwith UV irradiation are illustrated in Figure 3.2. The decay of BMPT is not shown, asit is identical to the one of EPPT. For all RAFT agents, the decrease in concentrationis less than 1 % after 75 s UV irradiation, whereas the maximum UV irradiation inthe experiments is about 60s. No influence of laser pulsing at 351 nm on the RAFTagent concentrations has been observed.The concentration of the RAFT agent has to be chosen in such a way that inter-
mediate and propagating or initiator-derived radical, respectively, occur at similarconcentrations to reduce the experimental error. In addition, high concentrations ofRAFT agents induce high UV absorbance, which reduces the overall concentrationof radicals – when polymerization is started with a photoinitiator – and leads toinhomogeneities in the EPR sample tube.
(II) For the experiments with photoinitiation (see Chapter 4), the initiator shoulddecompose efficiently upon irradiation with the excimer laser and the mercury UVlamp. The decomposition must be fast as compared to propagation. For the SP-PLP-EPR-RAFT experiments the two initiator-derived radical fragments should becapable of rapidly initiating chain growth at similar rate. In this work, 2-methyl-1-[4-(methylthio)phenyl]-2-morpholin-4-ylpropan-1-one (MMMP) was used, the decompo-sition mechanism of which is shown in Scheme 3.1. [121]For the experiments with thermal initiation (see Chapter 5), the initiator should
decompose into radicals which have the same structure as the RAFT leaving groupand exhibit no side reactions with the RAFT agent or the initiator itself.
(III) The solvent should be inert to transfer reactions to avoid an influence onradical concentration, should have a wide liquid range and show no significant UVabsorbance. In the present work, toluene was used between −40 ◦C to 110 ◦C andnaphthalene at temperatures above 110 ◦C.
(IV) The monomer needs to be chosen in such a way that the termination rateof the propagating radicals is not too high, since the steady state concentration ofpropagating radicals has to be above the limit of detection of EPR. If possible, no side
28

3.5 Selection of experimental conditions
0 20 40 60 800.90
0.92
0.94
0.96
0.98
1.00
EDTCP
EPPT
ETTP
t / s
c RA
FT /
c0 RA
FT
Figure 3.2. Decrease of RAFT agent concentrations in tolueneafter irradiation with a 500 W mercury UV lamp for ethyl 2-[1-diethoxyphosphoryl-2,2,2-trifluoroethoxythio carbonylsulfanyl] propionate(EDTCP), S-ethyl propan-2-ylonate-S ’-propyl trithiocarbonate (EPPT)and ethyl S-thiobenzoyl-2-thiopropionate (ETTP).
S
O
N
O
N
OS
O
+hν
..
Scheme 3.1. Decomposition reaction of the photoinitiator used inthis thesis, 2-methyl-1-[4-(methylthio)phenyl]-2-morpholin-4-ylpropan-1-one (MMMP).
29

3 Choice of the methods of investigation
reactions (backbiting, transfer to solvent) should occur. In addition, the monomershould not absorb light in the UV range. As n-butyl acrylate has already beenthoroughly investigated by EPR spectroscopy, it was chosen as the monomer for thiswork.
(V) For the macromolecular systems (Chapter 4), the polymerization temperatureof −40 ◦C was chosen in order to avoid significant backbiting of the secondarypropagating radicals. The presence of three types of radicals – secondary chain-endones, tertiary midchain ones, and RAFT intermediate ones – turns EPR analysis moredifficult but should pose no principal problem toward the applicability of the EPRprocedures described in the above sections. For the SP-PLP-EPR-RAFT experimentsseveral radical concentration versus time traces were co-added in order to enhancesignal-to-noise ratio.For the model systems (Chapter 5) the temperature range was varied to ensure
sufficiently fast decomposition of the initiator and thus a detectable radical concen-tration.To avoid side reactions, all solutions have to be completely deoxygenated prior to
the EPR measurements.
30

4EPR with macromolecular systems
This chapter covers the RAFT-mediated polymerization of n-butyl acrylate. Differenttypes of RAFT agents, i. e. a xanthate, a symmetric and a non-symmetric trithio-carbonate and a dithiobenzoate, were used to investigate the influence of the stabilizingZ group on the rate coefficients associated with the RAFT equilibrium. To allow fordirect comparison of the results, the same acrylate-type leaving group was used for allRAFT agents. The quasi-stationary approach was chosen to measure the equilibriumconstant and the SP-PLP-EPR-RAFT experiment to determine independently theaddition, fragmentation and cross-termination rate coefficients.
4.1 Xanthate-mediated n-butyl acrylate polymerization
Ethyl 2-[1-diethoxyphosphoryl-2,2,2-trifluoroethoxythio carbonylsulfanyl] propionate,EDTCP, was chosen as the first RAFT agent to be studied. [122] EDTCP belongs to thexanthate chain transfer agents where Z = O–alkyl. The structure of the investigatedRAFT agent and the monomer are depicted in Scheme 4.1. RAFT polymerizationsinvolving xanthates are also referred to as MADIX for MAcromolecular Design viathe Interchange of Xanthates. [123]Both processes essentially follow the same mechanism, but in the MADIX process
fragmentation of the intermediate radical potentially occurs via two pathways, whichare illustrated in Scheme 4.2: In addition to normal β-scission, the alkoxy group mayfragment. If this additional fragmentation step can be excluded, determination ofthe RAFT-related rate coefficients via the procedures outlined in Chapter 3 becomespossible. In order to check for β-scission of the Z-group, product samples were
31

4 EPR with macromolecular systems
O
OS
S
O
F FF
PO O
O
O
O
EDTCP BA
Scheme 4.1. The RAFT agent ethyl 2-[1-diethoxyphosphoryl-2,2,2-trifluoroethoxythio carbonylsulfanyl] propionate and the monomer n-butylacrylate, which are used in this study.
SS
OPj
Z
Pi SS
OPjPi
SS
OZ
Pi kβ
kad+ Z
.
Pj+kad
kβ. .
Scheme 4.2. Normal β-scission (l. h. s.) versus alkoxy β-scission (r. h. s.).
collected after the EPR experiments and subjected to end-group analysis by massspectrometry. [124,125] The results prove that alkoxy β-scission of the O-Z bond maybe ignored, since no oligomer from reinitiation by the Z-group could be found.
Xanthates are normally used for vinyl monomers and only poor control is observedwith acrylates. [126,127] The reactivity of the carbon-sulfur double bond against radicalattack is reduced because of conjugation with the free electron pair on the oxygenatom. Better transfer may be achieved by introducing an electron-withdrawing group,i. e., phosphor or fluorine as with EDTCP, which disfavors such conjugation andenhances the reactivity. [128] Furthermore, EDTCP carries a leaving group, which issimilar to the growing radical. Thus, the addition and fragmentation rate coefficientsfor the primary EDTCP-derived radical and for propagating radicals may be assumedto be identical.
The polymerization temperature of −40 ◦C was chosen in order to avoid significantbackbiting of the secondary propagating radicals. [129] EPR spectra measured athigher temperature clearly show midchain radicals. The presence of three types ofradicals – secondary chain-end ones, tertiary midchain ones, and RAFT intermediateones – turns EPR analysis more difficult but poses no principal problem toward theapplicability of the procedures described in Chapter 3. Determination of Keq fromthe ratio of EPR intensities via the stationary approach is detailed in the followingsection. Afterwards, time-resolved monitoring of cINT and cP is used to investigatethe individual rate coefficients.
32

4.1 Xanthate-mediated n-butyl acrylate polymerization
4.1.1 Quasi-stationary EPR experimentsAs Keq is expected to be rather low, relatively large MADIX concentrations, cMADIX ≈10−2 mol · L−1 were used to obtain similar INT and P concentrations under quasi-stationary conditions (see Equation 3.3). Since two types of radicals, INT and P, aremonitored, the molar fractions of the individual radical species need to be known.This information may be obtained by deconvolution of the spectra (detailed in Section7.3.3). The individual spectra are simulated on the basis of the coupling constantsand line widths determined from EPR measurements under conditions where eitherthe propagating radical or the intermediate radical is dominant. The EPR splittingschemes of the INT and P components shown in Figure 4.1a and b may be adequatelydescribed by the hyperfine coupling constants listed in Table 4.1.The EPR spectrum of the intermediate radical is characterized by the coupling of
the carbon-centered radical with the phosphor and fluorine atoms in γ and δ position,respectively. The spectrum actually consists of 8 lines but reduces to a 7-line spectrumdue to line broadening. Fitting of the measured EPR spectrum by the individualINT and P spectra yields the fractions of both species, xINT and xP, respectively.Experimental and simulated spectra for a MADIX polymerization of BA at −40 ◦Cusing an EDTCP concentration of 2.1× 10⁻² mol · L−1 are compared in Figure 4.1c.
EPR spectra of different MADIX agent concentrations were taken during pulsed-laser-initiated polymerization. A pulse repetition rate of 20 Hz was chosen to generatequasi-stationary concentrations of INT and P. [59] In Figure 4.2, the measured ratiosof cINT/cP are plotted for BA polymerizations carried out at different initial EDTCPconcentrations. According to Equation 3.3, the slope of the straight line passingthrough the origin yields Keq = (12.0±0.2) L ·mol−1. The low Keq value is consistentwith the poor control observed in xanthate-mediated acrylate polymerization. To ex-amine, whether this Keq value refers to pre-equilibrium or main-equilibrium conditions,product samples were collected after irradiation and analyzed via SEC. The molecularmass increases from Mn = 1.3 × 10³ g ·mol−1 at cEDTCP = 4.3 × 10⁻² mol · L−1
to Mn = 1.2 × 10⁴ g ·mol−1 at cEDTCP = 3.5 × 10⁻³ mol · L−1. These results areindicative of a main-equilibrium situation.
33

4 EPR with macromolecular systems
Figure 4.1. (a) Simulated (blue line) and experimental (gray line) EPRspectra of the EDTCP intermediate radical, INT. (b) Simulated (green line)and experimental (gray line) EPR spectra of the propagating radical, P.(c) Section of the EPR spectrum used for determining cINT/cP. Grayline: EPR spectrum recorded during laser-initiated polymerization ofBA (1.5 mol · L−1 in toluene) in the presence of EDTCP at −40 ◦C;cEDTCP = 2.1 × 10⁻² mol · L−1, cMMMP = 1.0 × 10⁻² mol · L−1. Pulserepetition rate: 20 Hz; sweep time: 42 s; modulation amplitude: 1 G;microwave power: 10 mW. Red line: Simulated EPR spectrum; the fieldpositions for monitoring INT and P individually as a function of time afterlaser initiation are indicated by the arrows.
34

4.1 Xanthate-mediated n-butyl acrylate polymerization
Table 4.1. Coupling constants deduced from experimental spectra ofintermediate radical, INT, and propagating radical, P, in EDTCP-mediatedn-butyl acrylate polymerization.
radical coupling constants / G
INT aP,γ aF,δ0.5 1.4
P aH,α aH,β24.3 21.0
0 1x10⁻²
2x10⁻²
0.0
0.1
0.2
0.3
c INT /
cP
cEDTCP
/ mol L1
Figure 4.2. cINT/cP ratio at different RAFT agent concentrations duringBA (1.5 mol · L−1 in toluene) polymerization at −40 ◦C using MMMP(1.0 × 10⁻² mol · L−1) as the photoinitiator. The slope of the linear fityields the equilibrium constant, Keq. Each data point refers to an averagevalue from at least three independent experiments at the same EDTCPconcentration.
35

4 EPR with macromolecular systems
4.1.2 Time-resolved EPR experiments
For deducing the individual rate coefficients, kad and kβ, both the intermediate andpropagating radical concentrations, cINT and cP, were separately measured via time-resolved EPR spectroscopy after single laser pulse initiation. In order to enhancesignal-to-noise ratio, up to 20 INT and up to 200 P concentration-versus-time traceswere co-added. The absolute concentration of the intermediate radical, cINT, and thepropagating radical, cP, were determined via the three-step calibration proceduredescribed in Section 7.3.2. The field positions used for monitoring the individualradical concentrations are indicated by the arrows in Figure 4.1.
Illustrated in Figure 4.3 is the time evolution of the concentration of the intermediateradical and of the propagating radical after firing the laser pulse at t = 0. The linesin each figure refer to different RAFT agent concentrations. The concentration hasbeen varied to assure that the obtained rate coefficients are independent of cEDTCP.The data in Figure 4.3 demonstrate that, towards lower cEDTCP, cP increases whereascINT decreases.
The experimental traces were fitted to the kinetic Scheme 8.1 given in Section 8.1,which encompasses initiation, propagation, chain-length dependent termination, theindividual RAFT pre- and main equilibrium reaction steps as well as cross-terminationof the intermediate radical. The alkoxy β-scission reaction has not been consideredbecause of the experimental findings presented above. Backbiting of the propagatingradical was ignored at −40 ◦C. [129]Radical chain length increases linearly with time t after applying a laser pulse at
t =0. It is known that the impact of a chain-length dependence of kt is pronounced inPLP experiments where relatively large amounts of small radicals undergo termination.Chain-length dependent termination, considering both the chain lengths of propagatingradicals and of the “arms” of the INT species was thus implemented into Predici R©.The “arms” of the intermediate radical bear two chains which, in principle, requiresa two-dimensional (2D) treatment of chain-length dependence. As the solution ofthe 2D problem is associated with extensive numerical effort, reactions involving atwo-armed intermediate radical had to be translated into a one-dimensional problem.The derivation and implementation of the kinetic scheme into Predici R© are detailedin Section 8.1.
The rate coefficients for the homo-termination of propagating radical, ki,it , as well asfor cross-termination, kcrosst = 0.5× ki,it , were taken from literature. [119] It should benoted that the chain-length dependent approach used for modeling the experimentalradical concentration-versus-time traces is based entirely on experimental data fromprevious studies and thus does not afford for any fitting.
Although ab initio calculations predict a chain-length dependence of kad and kβ, noexperimental evidence was presented so far. [39,41] Therefore, these coefficients have notbeen implemented into the model as chain-length dependent quantities. This would
36

4.1 Xanthate-mediated n-butyl acrylate polymerization
0.000 0.005 0.010 0.015
0
5x10⁻⁶
1x10⁻⁵
0.00 0.02 0.04 0.06 0.08
0
5x10⁻⁷
1x10⁻⁶
2x10⁻⁶
c P /
mol
L1
t / s
cEDTCP
/ mol L1
3.5 x 10⁻³
2.1 x 10⁻²
4.3 x 10⁻²
c INT /
mol
L1
Figure 4.3. Intermediate radical and propagating radical concentration-versus-time profiles obtained by EPR spectroscopy in single laser pulseinduced polymerization of BA (1.5 mol · L−1 in toluene) at −40 ◦C withEDTCP being the MADIX agent and MMMP (1.0× 10⁻² mol · L−1) thephotoinitiator.
37

4 EPR with macromolecular systems
require the fitting of additional parameters and the reliability of such an approachis questionable. Thus, the addition and fragmentation rate coefficients obtained arechain-length averaged values. Since the experimental radical concentration-versus-time traces are fitted over an extended chain-length regime, the first polymerizationsteps do not influence the fitted parameters significantly.
Simulation of the concentration-time profiles yields the addition rate coefficient, kad,the fragmentation rate coefficient, kβ, the primary concentration of initiator-derivedradicals produced by the laser pulse, c0
R, and the addition rate coefficient of theinitiator-derived radical to the MADIX species, kIad. It is assumed that, due tochemical similarity, the addition and the fragmentation rate coefficients of radicalspecies containing the EDTCP-derived moiety do not differ from the associatedcoefficients for growing radicals of arbitrary size. Furthermore, the leaving group isassumed to add to a monomer molecule, and thus reinitiate, at the same rate as thepropagating radical, i. e., kreinp = kp. The propagation rate coefficient, kp, [130] thechain-length dependent termination rate coefficient, ki,it , [119] and the initiation ratecoefficient, ki, [131] were taken from literature. A chain-length dependent propagationrate coefficient may be implemented into the simulation as soon as such data isavailable. As will be shown further below, the cross-termination rate coefficient, kcrosst ,was varied to check for its impact on the radical concentration-versus-time profiles.
Figure 4.4 compares the simulated and experimental concentration-versus-timetraces of the intermediate radical and the propagating radical for an EDTCP-mediatedBA polymerization (cEDTCP = 2.1 × 10⁻² mol · L−1) at −40 ◦C. The experimentaltraces are remarkably well fitted by the kinetic model, as are the traces for the poly-merizations at other RAFT agent concentrations employed in the present study. Thebest fits were obtained for kcrosst = 0.5× kt and for assuming an identical chain-lengthdependence of cross-termination between INT and P and of termination between twoP species.
The results of the Predici R© simulations as listed in Table 4.2 can be summarizedas follows:
1. Towards increasing EDTCP concentration, the amount of initiator-derived radi-cals produced by a single laser pulse, c0
R, decreases, which is assigned to laser lightabsorption by EDTCP. The absorbance at higher EDTCP content may affect thehomogeneity, in particular of radical production, in the polymerizing solutionand thus may reduce the reliability of data obtained at the highest EDTCPconcentration. As a consequence, the data for cEDTCP = 4.3× 10⁻² mol · L−1 isgiven in italics. In what follows, only the results from the EPR experiments atthe two lower EDTCP concentrations will be considered.
2. The rate coefficient for addition of an initiator fragment to EDTCP, kIad, wasfound to be (2.2±0.3)×105 L ·mol−1 · s−1. Thus, the rate coefficient for addition
38

4.1 Xanthate-mediated n-butyl acrylate polymerization
0.00 0.02 0.04 0.06 0.08
0
2x10⁻⁶
4x10⁻⁶
6x10⁻⁶
8x10⁻⁶
0
2x10⁻⁷
4x10⁻⁷
6x10⁻⁷
8x10⁻⁷
1x10⁻⁶
c P /
mol
L1
t / s
c INT /
mol
L1
Figure 4.4. Comparison of simulated and experimental concentration-versus-time profiles for propagating and intermediate radicals in BA poly-merization (1.5 mol · L−1 in toluene) at −40 ◦C with EDTCP beingthe RAFT agent (2.1 × 10⁻² mol · L−1) and MMMP the photoinitiator(1.0× 10⁻² mol · L−1).
39

4 EPR with macromolecular systems
Table 4.2. Rate coefficients, equilibrium constants, and primary radicalconcentrations for EDTCP-mediated BA polymerization at −40 ◦C. Thefollowing input parameters have been used in the fitting procedure: kp =2.27 × 10³ L ·mol−1 · s−1, ki = 2.27 × 10⁴ L ·mol−1 · s−1, k1,1
t = 1.65 ×10⁸ L ·mol−1 · s−1, αs = 0.85, αl = 0.22, ic = 30, kcross
t = 0.5× kt.
cEDTCP / mol · L−1 3.5× 10⁻³ 2.1× 10⁻² 4 .3 × 10−2
c0R / mol · L−1 2.79× 10⁻⁵ 8.80× 10⁻⁶ 5 .80 × 10−6
kIad / L ·mol−1 · s−1 2.00× 10⁵ 2.42× 10⁵ 1 .78 × 10 5
kad / L ·mol−1 · s−1 2.40× 10⁴ 2.59× 10⁴ 7 .38 × 10 4
kβ / s−1 2.00× 10³ 2.51× 10³ 4 .56 × 10 3
Keq / mol · L−1 12.0 10.3 16.2
to the RAFT agent is by about a factor of 10 above the rate coefficient for addi-tion of the initiator fragment to a BA molecule, ki = 2.27× 10⁴ L ·mol−1 · s−1.Such a difference of about one order of magnitude has also been found betweenthe addition rate coefficients of a propagating radical to EDTCP and to BA, kadand kp, respectively. This observation indicates that the reactivity for additionof the initiator fragment and of the propagating radical is higher by about thesame factor for addition to the carbon-sulfur double bond of the MADIX agentthan for addition to the BA carbon-carbon double bond.
3. The arithmetic mean values of the addition and fragmentation rate coefficientsobtained from the two experiments at lower EDTCP concentration are: kad =(2.5± 0.1)× 104 L ·mol−1 · s−1 and kβ = (2.3± 0.3)× 103 s−1.
4. The addition rate coefficient is in good agreement with the ab initio value of(kad = 104 L ·mol−1 · s−1) reported by Coote et al. [40] The comparison betweenthe two kad values referring to different temperatures can be made, as theaddition reaction, according to the ab initio estimates, should be associated witha small activation energy. No such information is available for the activationenergy of kβ. It should however be noted that the obtained fragmentation ratecoefficient is not too far off the value of kβ = 102 to 103 s−1 that has beenreported by Coote et al. [40]
To obtain information on macroradical size after applying a very few laser pulses,molar mass distributions were determined via SEC. Depending on MADIX concentra-tion, average chain lengths between 20 and 90 have been obtained, which are closeto the values determined from the above-mentioned stationary experiments. The
40

4.1 Xanthate-mediated n-butyl acrylate polymerization
obtained rate coefficients thus also refer to main-equilibrium conditions.
The fitting has been carried out assuming kcrosst = 0.5× kt. To check, whether andto which extent this assumption affects kβ, the time-resolved EPR trace measured forthe BA polymerization at the lowest RAFT content, cEDTCP = 3.5× 10⁻³ mol · L−1,has additionally been fitted for kcrosst = kt and for kcrosst = 0. In Figure 4.5, the initialphase of the polymerization is illustrated, where the magnitude of cross-terminationshows the strongest effects. Approximately 0.1 s after application of the single laserpulse all simulated concentration traces coincide irrespective of the size of consideredkcrosst . The resulting change in kβ is by less than a factor of two. The concentrationdecay measured for both types of radicals is thus not sensitive enough to decidewhether there is any significant contribution from cross-termination. The insensitivityis due to the low intermediate radical concentration and the high addition andfragmentation rates.
4.1.3 Comparison of both approachesFrom the individual kad and kβ values obtained via the SP-PLP-EPR-RAFT method,the equilibrium constant for −40 ◦C is found to be Keq = (11.1± 1.2) L ·mol−1, inclose agreement with Keq = (12.0± 0.2) L ·mol−1 deduced from the above-describedmethod in which the ratio of intermediate and propagating radical concentrations ismeasured. Thus, both EPR-based methods are suitable for accurate measurement ofRAFT equilibrium constants. The stationary method, which rests on measuring aratio of radical concentrations, does not require calibration, which constitutes a majoradvantage. The time-resolved method, which requires calibrated EPR data is, on theother hand, far more powerful because the individual rate coefficients kad and kβ areaccessible and because the assumption rcrosst � rad, rβ needs not to be fulfilled.The resulting kad and kβ may be used to check, whether the reaction conditions
of the stationary experiments were adequate for estimating Keq via Equation 3.3,i. e., whether rate of cross-termination is negligible as compared to the addition andfragmentation rates. The absolute concentrations of INT and P were determinedby calibration of the EPR spectra. The maximum value of rcrosst was estimated byadopting kcrosst = k1,1
t , whereas the lowest rates of addition and fragmentation werecalculated for lowest cEDTCP. Under these limiting conditions of our study, rcrosst isstill by about one order of magnitude below the addition and fragmentation rates,thus verifying the validity of using Equation 3.3 for the RAFT concentration rangeselected for our experiments.
41

4 EPR with macromolecular systems
0.000 0.001 0.002 0.003
0.0
5.0x10⁻⁶
1.0x10⁻⁵
1.5x10⁻⁵
2.0x10⁻⁵ 0.000 0.001 0.002 0.003 0.004
0.0
1.0x10⁻⁷
2.0x10⁻⁷
3.0x10⁻⁷
4.0x10⁻⁷
5.0x10⁻⁷
c P /
mol
L1
t / s
experimental data
simulations with kcross
t =
0
0.5 x kt
kt
c INT /
mol
L1
Figure 4.5. Predici R© fitting of the experimental intermediate andpropagating radical concentrations as a function of time after applying alaser pulse at t = 0 for BA polymerization (1.5 mol · L−1 in toluene) at−40 ◦C in the presence of EDTCP (3.5×10⁻³ mol · L−1) and with MMMP(1.0× 10⁻² mol · L−1) as the photoinitiator. The fitting was carried out fordifferent cross-termination rate coefficients: kcross
t = kt, kcrosst = 0.5× kt,
and kcrosst = 0, where kt refers to the chain-length dependent termination
rate coefficient of BA radicals.
42

4.2 Trithiocarbonate-mediated n-butyl acrylate polymerization
4.2 Trithiocarbonate-mediated n-butyl acrylate polymerizationAs the second type of RAFT agent, two trithiocarbonates were investigated: S-ethyl propan-2-ylonate-S ’-propyl trithiocarbonate (EPPT), which transforms intoan intermediate radical bearing two growing chains, and S,S ’-bis(methyl-propion-2-ylate) trithiocarbonate (BMPT), which gives rise to an intermediate radical withthree growing chains. The structures of the trithiocarbonates are illustrated inScheme 4.3. BMPT was studied previously, monitoring the build-up and subsequentdecay in intermediate radical concentration after laser single pulse initiation. [120] Asimple kinetic scheme was used to deduce kad and kβ, in which neither terminationwas considered as chain-length dependent nor the propagating radical concentrationmonitored. A relatively high BMPT concentration was chosen (4× 10⁻³ mol · L−1),which might be considered as a problem because of light absorbance of the RAFTagent. This can lead to inhomogeneities in the sample tube. To avoid this, lowerconcentrations (around 10−5 mol · L−1) were used in the following study and theRAFT agent concentration was varied.
O
OS S
SO
O
O
OS S
S
BMPT EPPT
Scheme 4.3. RAFT agents under investigation: S,S ’-bis(methyl-propion-2-ylate) trithiocarbonate (BMPT) and S-ethyl propan-2-ylonate-S ’-propyltrithiocarbonate (EPPT).
4.2.1 Quasi-stationary EPR experimentsThe EPR spectrum of the intermediate radical in BMPT-mediated BA polymerizationis presented in Figure 4.6a. It appears as a singlet signal and is identical to the INTpeak observed in EPPT- and benzyl propyl trithiocarbonate (BPT)-mediated BApolymerizations. [118] The EPR spectrum of the propagating BA radical is shown inFigure 4.1b. The experimental spectrum for a BA polymerization at −40 ◦C using aBMPT concentration of cBMPT = 2.3× 10⁻⁵ mol · L−1 is depicted in Figure 4.6b. It isin excellent agreement with the simulated one, which is a summation of the individualradical spectra of INT and P. The spectra of the investigated trithiocarbonate-mediatedBA polymerizations are identical, so that the EPPT spectrum is not shown separately.
Fitting of the measured EPR spectrum by the individual INT and P spectra yieldsthe fractions of both species. The measured cINT/cP ratios are plotted versus BMPTconcentration in Figure 4.7. According to Equation 3.3 the slope of the straight
43

4 EPR with macromolecular systems
3335 3340 3345 3350 3355
3340 3345 3350 3355
P
(b)
Inte
nsi
ty
B / G
INT
(a)
Inte
nsi
ty
Figure 4.6. EPR spectrum of the intermediate radical recorded during aBMPT-mediated polymerization of BA with MMMP as the photoinitiatorat −40 ◦C. (a) Pseudo-stationary conditions apply with laser pulsing ata repetition rate of 20 Hz; modulation amplitude: 3 G, microwave power:10 mW, cBMPT = 1 × 10⁻⁴ mol · L−1. (b) EPR spectrum recorded in a2.6 s field sweep during a stationary BA polymerization (cBMPT = 2.3×10⁻⁵ mol · L−1) with continuous UV initiation under otherwise identicalexperimental conditions. The red line indicates the best fit of overallEPR contour by summation of the individually simulated EPR spectra forINT and P. The P component is more pronounced in (b) because of thelower BMPT concentration. Note, that the same spectra are observed inEPPT-mediated polymerizations of BA.
44

4.2 Trithiocarbonate-mediated n-butyl acrylate polymerization
0 1x10⁻⁵
2x10⁻⁵
3x10⁻⁵
4x10⁻⁵
0
1
2
3
c INT /
cP
cBMPT
/ mol L1
Figure 4.7. Ratio of intermediate radical and propagating radicalconcentrations, cINT/cP, plotted versus BMPT concentration for BApolymerizations (1.5 mol · L−1 in toluene) at −40 ◦C using MMMP(1.0 × 10⁻² mol · L−1) as the photoinitiator. The slope of the straight-line fit yields the equilibrium constant, Keq = (7.0± 0.2)× 104 L ·mol−1.
line passing through the origin yields Keq = (7.0± 0.2)× 104 L ·mol−1. The valuesobtained in the previous study of BMPT-mediated BA polymerization at −30 ◦Care 9.5 × 10² L ·mol−1 assuming that intermediate radicals do not undergo cross-termination reactions and 2.5 × 10⁴ L ·mol−1 assuming kcrosst = 0.5 × kt. [120] Thepreviously applied model-dependent approach, which requires calibration of the EPRsetup, thus yields slightly lower Keq values.In order to check for a possible chain-length dependence of Keq the stationary
EPR experiments for the second trithiocarbonate EPPT were not only carried outwith monomeric but also with pre-polymerized RAFT agent, i. e. with initial RAFTchain lengths of 1, 17 and 38, respectively. For the synthesis of low polydispersitymacroEPPT with defined chain length, high initial RAFT agent concentrations wereused. The measured cINT/cP ratios for the monomeric and macromolecular RAFTagent are plotted versus EPPT concentration in Figure 4.8. The resulting equilibriumconstant, Keq = (2.6± 0.1)× 104 L ·mol−1, does not vary with initial chain length,which indicates that either Keq is not chain-length dependent or the main equilibriumsituation is reached rapidly with monomeric EPPT.
45

4 EPR with macromolecular systems
0.0 5.0x10⁻⁶
1.0x10⁻⁵
1.5x10⁻⁵
0.0
0.1
0.2
0.3
0.4 i
t=0
EPPT = 1
i t=0
EPPT = 17
i t=0
EPPT = 38
c INT /
cP
cEPPT
/ mol L1
Figure 4.8. Ratio of intermediate radical and propagating radicalconcentrations, cINT/cP, plotted versus EPPT concentration for BApolymerizations (1.5 mol · L−1 in toluene) at −40 ◦C using MMMP(1.0×10⁻² mol · L−1) as the photoinitiator. The EPR experiments under sta-tionary conditions were carried out with monomeric (i t=0
EPPT = 1) and macro-molecular (i t=0
EPPT = 17, i t=0EPPT = 38) RAFT agent. The slope of the straight-
line fit yields the equilibrium constant, Keq = (2.6± 0.1)× 104 L ·mol−1.
In comparison, the equilibrium constant of the previously studied BA polymerizationmediated by BPT is (1.0±0.1)×104 L ·mol−1. [118] Apart from the leaving group, thetrithiocarbonates BPT and EPPT possess the same structure. Under main-equilibriumconditions, macromolecular BPT and macromolecular EPPT are therefore identicaland their equilibrium constants should be the same. However, BPT bears a benzylleaving group instead of an acrylate-type leaving group, which is part of the samemonomer family as the propagating radical. The resonance stabilization of the benzylradical may enhance fragmentation and slow down addition, resulting in a lowerequilibrium constant for the pre-equilibrium. The value of (1.0± 0.1)× 104 L ·mol−1
obtained in the previous study thus refers to a combined pre- and main equilibriumconstant. [118] Since it is not possible to separate both Keq values, it is important tochoose a RAFT agent with an adequate leaving group. One can conclude, that theequilibrium constant is different for the pre- and main equilibrium when the stabilityof the leaving group significantly differs from the one of the propagating radical. Thechain-length dependence of RAFT agents bearing a leaving group which resembles
46

4.2 Trithiocarbonate-mediated n-butyl acrylate polymerization
the propagating species cannot be excluded finally since the degree of polymerizationis not well controlled when very low concentrations of the RAFT agent are used, asis the case in the present study. The samples which were subjected to SEC analysisafter EPR measurements show very broad molecular mass distributions.Thus, the kinetic studies presented here were obviously not carried out under
conditions of good control. As the novel method, however, focuses on the determinationof accurate rate coefficients, it is of primary importance that the concentrations ofboth the intermediate and propagating radicals are not too dissimilar and thus mayprecisely be determined by EPR. The so-obtained rate coefficients are physicallyreasonable quantities and thus, although being determined under conditions of poorcontrol, should be well suited for estimating and designing polymerization conditionswith excellent control by the particular RAFT agent.
The equilibrium constants for the trithiocarbonates are around 3 orders of mag-nitude above the one for the xanthate, which is probably due to faster addition tothe trithiocarbonate and slower fragmentation of the resulting intermediate species.The equilibrium constant for BMPT is higher than for EPPT. This may be explainedby a slightly slower fragmentation of the intermediate radical bearing three growingchains as compared to the one bearing only two growing chains. The 3-arm speciesis most likely more stable than the 2-arm radical. To check these assumptions, theindividual rate coefficients, kad and kβ, are determined in Section 4.2.2.
To investigate the temperature dependence of Keq the stationary EPR experimentsfor EPPT were additionally carried out at −20, 0 and 20 ◦C. At a polymerizationtemperature of −40 ◦C midchain radical (MCR) formation is negligible and theEPR spectra only show peaks resulting from the intermediate radical, INT, and thesecondary propagating radical, SPR. At higher temperatures, midchain radicals canbe observed by EPR spectroscopy. Figure 4.9 compares the spectra of a RAFT-freeBA polymerization at 0 ◦C with the same polymerization in the presence of 1.4 ×10⁻³ mol · L−1 EPPT. The characteristic peaks of the individual radical species areindicated by symbols. The EPR spectrum of the EPPT-mediated BA polymerizationonly differs from the RAFT-free system due to the occurrence of an additional EPRsignal in the center of the spectrum, which belongs to the INT species. It seems thatthe addition of RAFT agent does not significantly alter the MCR/SPR ratio and Keqmay therefore be estimated from Equation 4.1:
cINT(cSPR + cMCR) = Keq × cRAFT (4.1)
The cINT/(cSPR+cMCR) ratios were determined from the EPR spectra taken at differenttemperatures and the resulting equilibrium constants are listed in Table 4.3. Thefraction of intermediate radicals and consequently the equilibrium constant sharplydecreases with increasing temperature. The Keq values at temperatures above −40 ◦C
47

4 EPR with macromolecular systems
3300 3320 3340 3360 3380 3400
cEPPT
/ mol L1
=
1.4 x 10³
0
SPR
MCR
INT
Inte
nsi
ty
B / G
Figure 4.9. EPR spectra recorded during BA polymerization with andwithout EPPT at 0 ◦C. The symbols indicate the characteristic EPR signalsof the secondary propagating radical, SPR, the midchain radical, MCR,and the intermediate radical, INT.
represent apparent equilibrium constants since both SPRs and MCRs take part inthe addition-fragmentation equilibrium.In Figure 4.10 the EPR-derived equilibrium constants are plotted in an Arrhenius
form. The resulting slope of the straight-line fit yields an activation energy ofEa = −67 kJ ·mol−1. Since ab initio calculations predict an activation energy closeto zero for the addition reaction, [38] the fragmentation reaction is associated with ahigh activation energy and fragmentation becomes faster at higher temperatures.
4.2.2 Time-resolved EPR experiments
EPPT- and BMPT-mediated BA polymerizations at −40 ◦C were investigated via theSP-PLP-EPR-RAFT approach. The intermediate and propagating radical concentra-tions, cINT and cP, were separately measured after single laser pulse initiation. In orderto enhance signal-to-noise ratio, up to 10 INT and up to 20 P concentration-versus-time traces were co-added. The absolute concentration of the intermediate radical,cINT, and the propagating radical, cP, were determined via the three-step calibrationprocedure described in Section 7.3.2. The field positions used for monitoring theindividual radical concentrations are indicated by the arrows in Figure 4.6.
48

4.2 Trithiocarbonate-mediated n-butyl acrylate polymerization
Table 4.3. Equilibrium constants for EPPT-mediated BA polymerizationsat temperatures between −20 and 20 ◦C using 1.4× 10⁻³ mol · L−1 EPPT.
T / ◦C cINT/(cSPR+cMCR) Keq / L ·mol−1
20 ≈ 0 ≈ 00 0.23 165−20 1.78 1270
The experimental INT and P traces during EPPT-mediated BA polymerization at−40 ◦C, after initiation with a single laser pulse at t = 0, are shown in Figure 4.11. Incomparison with the xanthate-containing polymerization, the INT lifetime is extendedfrom 0.05 s to around 0.5 s. The concentration-versus-time profiles were fitted to thekinetic Scheme 8.1 given in Section 8.1, which has already been used for simulatingthe xanthate-mediated BA polymerization (see Section 4.1.2). To reduce the numberof fitting parameters the same assumptions as in the xanthate case have been made,i. e. kreinp = kp, ki = 10 × kp, kcrosst displays the same chain-length dependence aski,it , and kad and kβ are equal for the leaving group and the propagating radicals,respectively. The propagation rate coefficient, kp, [130] and the chain-length dependenttermination rate coefficient, ki,it , [119] were taken from literature. The remaining ratecoefficients, which need to be estimated by fitting the experimental data to the kineticscheme, are the rate coefficients for addition, kad, fragmentation, kβ, and addition ofan initiator-derived radical to the RAFT agent, kIad, as well as the initial concentrationof initiator radicals produced by the laser pulse, c0
R.Figure 4.11 compares the experimental and simulated time traces of the BA poly-
merization in the presence of EPPT. The influence of the cross-termination reactionbetween an intermediate species and a propagating radical is examined by varyingthe kcrosst value between kcrosst = 0 and kcrosst = ki,it . Best fits for three different cross-termination coefficients are shown in Figure 4.11. The concentration of propagatingradicals decreases more rapidly assuming a higher kcrosst , which leads to a better fit ofthe experimental data at later stages of the polymerization. However, the variationof kcrosst has only a negligibly small influence on the decay of the intermediate andpropagating radical concentration.The SP-PLP-EPR-RAFT approach yields the rate coefficients and equilibrium
constants listed in Table 4.4. Addition and fragmentation are fast for all assumedkcrosst values. The average numbers obtained are (3.4± 0.3)× 106 L ·mol−1 · s−1 forthe addition rate coefficient, (1.4±0.4)×102 s−1 for the fragmentation rate coefficient,
49

4 EPR with macromolecular systems
3.6x10⁻³
3.8x10⁻³
4.0x10⁻³
4.2x10⁻³
4.4x10⁻³
4
5
6
7
8
9
10
11
ln (
Keq /
L m
ol
1)
T1
/ K1
Figure 4.10. Arrhenius plot of the (apparent) equilibrium constantsobtained in stationary EPPT-mediated BA polymerizations at −40, −20and 0 ◦C. The slope of the straight-line fit yields an apparent activationenergy of Ea = −(67± 4) kJ ·mol−1.
and (2.6± 0.8)× 104 L ·mol−1 for the equilibrium constant.
The experimental INT and P traces during BMPT-mediated BA polymerization at−40 ◦C after initiation with a single laser pulse at t = 0 are shown in Figure 4.12.The lifetime of the “3-arm” intermediate radical formed when BMPT is employedas the RAFT agent is 3 s, which is significantly longer than the lifetime of around0.5 s in the case of the “2-arm” intermediate radical formed during EPPT-mediatedpolymerization (see Figure 4.11). Since the BMPT-derived intermediate radical bearsthree chains a three-dimensional (3D) treatment of the kinetic scheme is required,which is associated with extensive numerical effort. Therefore, the reactions involvinga three-armed intermediate radical were translated into a one-dimensional problem.The derivation and implementation of the kinetic scheme into Predici R© are detailedin Section 8.2. To reduce the number of fitting parameters, the same assumptionsas in the EPPT-mediated polymerization were made and kp and ki,it taken fromliterature. [119,130]Figure 4.12 compares the experimental and simulated time traces of the BA poly-
merization in the presence of BMPT. The influence of the cross-termination reactionbetween an intermediate species and a propagating radical is examined by varying
50

4.2 Trithiocarbonate-mediated n-butyl acrylate polymerization
0.0 0.1 0.2 0.3 0.4
0.0
5.0x10⁻⁷
1.0x10⁻⁶
1.5x10⁻⁶
0.00 0.02 0.04 0.06 0.08
0.0
5.0x10⁻⁶
1.0x10⁻⁵
experiment
simulation with kt
cross =
0
0.75 kt
kt
c INT /
mol
L1
t / s
c P /
mol
L1
Figure 4.11. Comparison of simulated and experimental concentration-versus-time profiles for the propagating and the intermediate radical in BApolymerization (1.5 mol · L−1 in toluene) at −40 ◦C with EPPT beingthe RAFT agent (5.0 × 10⁻⁵ mol · L−1) and MMMP the photoinitiator(1.0× 10⁻² mol · L−1). The simulations were carried out assuming differentvalues for the cross-termination coefficient, kcross
t , which was assumed tobe chain-length dependent.
51

4 EPR with macromolecular systems
0.0 0.5 1.0 1.5 2.0 2.5
0.0
1.0x10⁻⁶
2.0x10⁻⁶
3.0x10⁻⁶
0.00 0.02 0.04 0.06 0.08
0.0
1.0x10⁻⁵
2.0x10⁻⁵
3.0x10⁻⁵
c INT /
mol
L1
t / s
experiment
simulation with kt
cross =
0
0.1 kt
0.2 kt
c P
/ m
ol
L1
Figure 4.12. Comparison of simulated and experimental concentration-versus-time profiles for the propagating and the intermediate radical inBA polymerization (1.5 mol · L−1in toluene) at −40 ◦C with BMPT beingthe RAFT agent (3.5 × 10⁻⁵ mol · L−1) and MMMP the photoinitiator(1.0× 10⁻² mol · L−1). The simulations were carried out assuming differentvalues for the cross-termination coefficient, kcross
t , which was assumed tobe chain-length dependent.
52

4.2 Trithiocarbonate-mediated n-butyl acrylate polymerization
Table 4.4. Rate coefficients and equilibrium constants for EPPT-mediatedBA polymerization at −40 ◦C. The following input parameters have beenused in the fitting procedure: kp = 2.27× 10³ L ·mol−1 · s−1, ki = 2.27×10⁴ L ·mol−1 · s−1, k1,1
t = 1.65× 10⁸ L ·mol−1 · s−1, αs = 0.85, αl = 0.22,ic = 30. The best fit was achieved using primary radical concentrations ofc0
R = 2.0× 10⁻⁵ mol · L−1.
kcrosst / ki,itkIad /
L ·mol−1 · s−1kad /
L ·mol−1 · s−1 kβ / s−1 Keq /L ·mol−1
0 1.70× 10⁶ 3.16× 10⁶ 1.74× 10² 1.82× 10⁴
0.75 5.99× 10⁶ 3.60× 10⁶ 1.28× 10² 2.82× 10⁴
1 9.38× 10⁶ 3.58× 10⁶ 1.13× 10² 3.17× 10⁴
the kcrosst value between kcrosst = 0 and kcrosst = 0.5× ki,it . Good fits are obtained forkcrosst values between 0 and 0.2 × ki,it . For kcrosst > 0.2 × ki,it the INT trace can befitted well but the decay of the propagating radical becomes faster than observed inthe experiment. There is probably less cross-termination with three-armed INTs thanwith two-armed INTs due to sterical hindrance.
The resulting parameters are listed in Table 4.5. The average numbers obtained are(4.1± 0.9)× 106 L ·mol−1 · s−1 for the addition rate coefficient, (45± 5) s−1 for thefragmentation rate coefficient, and (9±3)×104 L ·mol−1 for the equilibrium constant.Whereas the addition of a growing chain to BMPT is similarly fast as the addition toEPPT, fragmentation is slower. This is reasonable as the radical is delocalized overthree sulfur atoms instead of two. The resulting equilibrium constant is thereforehigher for the BMPT polymerization.
4.2.3 Comparison of both approaches
For EPPT-mediated BA polymerization at −40 ◦C the equilibrium constant obtainedvia the stationary approach, Keq = (2.6±0.1)×104 L ·mol−1, is in excellent agreementwith the one obtained with the SP-PLP-EPR-RAFT method, Keq = (2.6 ± 0.8) ×104 L ·mol−1. For BMPT the corresponding values areKeq = (7.0±0.2)×104 L ·mol−1
and Keq = (9±3)×104 L ·mol−1, respectively. The kinetic scheme used for Predici R©
simulations is therefore appropriate to describe the BA polymerization mediated bythese trithiocarbonates.The rate coefficients deduced from the single-pulse approach can be used to check
whether the reaction conditions of the stationary experiments were adequate forestimating Keq via Equation 3.3. An assumption made is that the rate of cross-
53

4 EPR with macromolecular systems
Table 4.5. Rate coefficients and equilibrium constants for BMPT-mediatedBA polymerization at −40 ◦C. The following input parameters have beenused in the fitting procedure: kp = 2.27× 10³ L ·mol−1 · s−1, ki = 2.27×10⁴ L ·mol−1 · s−1, k1,1
t = 1.65× 10⁸ L ·mol−1 · s−1, αs = 0.85, αl = 0.22,ic = 30. The best fit was achieved using primary radical concentrations ofc0
R = 7.1× 10⁻⁵ mol · L−1 and kIad values of 3.0× 10⁶ L ·mol−1 · s−1.
kcrosst / ki,it kad / L ·mol−1 · s−1 kβ / s−1 Keq / L ·mol−1
0 3.15× 10⁶ 50 6.3× 10⁴
0.1 4.23× 10⁶ 45 9.4× 10⁴
0.2 4.98× 10⁶ 41 1.2× 10⁵
0.5 5 .50 × 10 6 25 2 .2 × 10 5
termination, rcrosst , is negligibly small as compared to the addition and fragmentationrates, rad and rβ. These rates are therefore calculated. The absolute concentrationsof INT and P are known from the EPR spectra. The maximum value of rcrosst wasestimated by implementing kcrosst = k1,1
t , which refers to the upper limit of terminationtaking place between a propagating and an intermediate radical, both of chain lengthunity. In order to consider the worst case scenario also for addition and fragmentation,both rates were estimated for the lowest EPPT and BMPT concentrations used(5 × 10⁻⁶ mol · L−1). Even under these conditions, rcrosst values are below rad andrβ, thus verifying the validity of using Equation 3.3 in the chosen EPPT and BMPTconcentration range.
4.3 Dithiobenzoate-mediated n-butyl acrylate polymerization
The EPR methods developed and tested on xanthate- and trithiocarbonate-mediatedpolymerizations are now extended to dithiobenzoates. [132] The investigation of themechanism of dithiobenzoate-mediated polymerizations is of particular interest asrate retardation is observed with some monomers, like styrene and acrylates, but notwith methacrylates.
For evaluation of rate retardation, polymerization rate-versus-time behavior ofBA bulk polymerizations was studied with cumyl dithiobenzoate (CDB), 2-(2’-cyanopropyl)-dithiobenzoate (CPDB), and ethyl S-thiobenzoyl-2-thiopropionate (ETTP)as RAFT agents (see Scheme 4.4). Under main-equilibrium conditions, the resonance-stabilized INT species of these RAFT agents are of identical structure (see Scheme
54

4.3 Dithiobenzoate-mediated n-butyl acrylate polymerization
SCN
S
S
S
S
SO
O
ETTP CPDB CDB
Scheme 4.4. RAFT agents under investigation: ethyl S-thiobenzoyl-2-thiopropionate (ETTP), 2-(2’-cyanopropyl)-dithiobenzoate (CPDB) andcumyl dithiobenzoate (CDB).
8.2 in Section 8.1). Figure 4.13 shows that pronounced rate retardation is observedwith all of the three RAFT agents.
CDB-mediated polymerization at higher RAFT agent concentration exhibits anextended induction period, which is assigned to resonance stabilization of the cumylradical. This effect is considerably larger than in case of ethyl acrylate and cyano-iso-propyl radicals, which are released from the primary intermediate radical specieswith ETTP and CPDB, respectively. The cumyl radical is less active in reinitiatingpolymerization. With CDB, the addition of a cumyl radical to BA, under otherwiseidentical conditions, is by about a factor of 700 slower than the addition of a BAradical to BA (i. e., in homo-propagation). [133,134] This factor reduces to about 10for addition of the cyano-iso-propyl radical to BA and is smaller than unity in thecase of addition of the ethyl acrylate radical to BA. [130,131,135] The rate coefficientfor addition of the first monomer unit is expected to be well above kp for subsequentpropagation steps of larger growing radicals. [136]
No pre-equilibrium situation is observed in systems where the leaving radical moietyis of similar structure as the propagating radicals, as is the case with ETTP/BA. ForCPDB where the leaving group is identical to the initiator fragments from AIBN,inhibition may be interpreted as a decrease in initiator efficiency, since reinitiationby the leaving group does not occur quantitatively until the initial RAFT agent isconverted to propagating chain adducts. This effect is more pronounced at higherRAFT agent concentration due to the higher amount of leaving/inhibiting groups. Incase of ETTP, reinitiation efficiency of the ethyl acrylate radicals is supposed to bemuch higher than for AIBN. As a consequence, no inhibition occurs. For CDB andCPDB, this interpretation is in full agreement with the current understanding of theinitialization period as put forward by the Klumperman group: The rate-determiningstep in the initial stage of RAFT polymerization is the addition of the leaving radicalmoiety to a monomer molecule, unless the leaving group exhibits higher reactivitythan the radical fragments from initiator decomposition (see Section 2.3). [80–84]
As soon as the initial RAFT agent has been completely transformed into macromolec-ular RAFT species, main-equilibrium conditions apply and the same polymerizationrates are observed for the three RAFT agents (Figure 4.13). This comes as no surprise,
55

4 EPR with macromolecular systems
Figure 4.13. Induction period and rate retardation observed for BAbulk polymerizations at 70 ◦C mediated by ETTP, CPDB, CDB andwithout RAFT agent using AIBN (1.5× 10⁻³ mol · L−1) as the initiator.Open symbols: cRAFT = 1.5 × 10⁻³ mol · L−1; closed symbols: cRAFT =2.0× 10⁻² mol · L−1.
as the identical type of intermediate radical occurs under main-equilibrium conditionswith CDB, CPDB, and ETTP (see Scheme 8.2). Polymerization rates are given by theslope of the straight-line fits under stationary reaction conditions. They are below thepolymerization rate in the absence of RAFT agent (Rp = 1.4×10⁻² mol · L−1 · s−1) bya factor of 10 at cRAFT = 1.5× 10⁻³ mol · L−1 (Rp = 1.3× 10⁻³ mol · L−1 · s−1) andby a factor of 100 at cRAFT = 2.0× 10⁻² mol · L−1 (Rp = 1.5× 10⁻⁴ mol · L−1 · s−1).
As detailed in Section 2.3.1, the equilibrium constant may be deduced from Equa-tions 2.2 and 2.3 proposed by Kwak et al. [50,90] Assuming that cross-terminationbetween the intermediate species and propagating radicals is the main cause forthe observed rate retardation, the experimental data may be plotted as R−2
p ver-sus c0
RAFT (see Figure 4.14a). The slope of the straight line, 2kcrosst /kt(R0
p)−2Keq,is a measure for retardation. Adopting kcross
t /kt = 0.5 yields an equilibrium con-stant of (4.8 ± 0.2) × 105 L ·mol−1 for the dithiobenzoate-mediated BA bulk poly-
56

4.3 Dithiobenzoate-mediated n-butyl acrylate polymerization
0.0 1.0x10⁻²
2.0x10⁻²
0
1x10⁷
2x10⁷
3x10⁷
4x10⁷
5x10⁷
0.0 2.0x10⁻⁴
4.0x10⁻⁴
(b)
R
p
2 /
mol
2
L2
s2
c0
RAFT / mol L
1
(a) ETTP
CDB
CPDB
(c0
RAFT)2 / mol
2 L
2
Figure 4.14. (a) Plot of R−2p versus c0
RAFT and (b) plot of R−2p versus
(c0RAFT)2 for ETTP-, CPDB- and CDB-mediated BA bulk polymerizations
at 70 ◦C using AIBN (1.5× 10⁻³ mol · L−1) as the initiator.
merization at 70 ◦C. When the rate retardation is exclusively assigned to self-termination between two intermediate radicals, plotting R−2
p versus (c0RAFT)2 re-
sults in a slope of kselft /kt(R0
p)−2Keq (see Figure 4.14b). An equilibrium constant of(9.5± 0.2)× 103 L ·mol−1 is obtained, assuming kself
t /kt = 0.5. The difference in Keqvalues of more than one order of magnitude shows that this method strongly dependson the assumptions made. Since only two different RAFT agent concentrations werestudied, it cannot be decided whether cross- or self-termination is the main causefor rate retardation in these polymerizations. The Keq values determined via themethod described by Kwak et al. [50] will be compared to the EPR-derived values inthe following section.
Because of the close similarity of polymerization rates under main-equilibriumconditions as indicated by Figure 4.13, EPR experiments were carried out for ETTP.This RAFT agent exhibits no induction period and is far more stable toward UVand laser irradiation than are CDB and CPDB. The decay of ETTP concentrationdue to broad-band UV irradiation occurs by less than 1 % within 1.3 s, which isthe typical irradiation time chosen for the quasi-stationary EPR experiments withthis dithiobenzoate. No decomposition of the RAFT agent however occurs even by
57

4 EPR with macromolecular systems
applying 10 laser pulses at 351 nm. To carry out the experiment, only one laserpulse is required. Since ETTP bears an acrylate leaving group, the number of ratecoefficients to be fitted by Predici R© simulations of an acrylate polymerization islower than, e. g., in CDB-mediated BA polymerization. [122]A reaction temperature of −40 ◦C was chosen not only to avoid midchain radical
formation but also to test slow-fragmentation behavior. Since a significant activationenergy is expected for kβ, the intermediate radical should be extremely long-lived at−40 ◦C in the case of slow fragmentation. [38]
4.3.1 Quasi-stationary EPR experiments
Presented in Figure 4.15a is the EPR spectrum of the intermediate radical recordedduring an ETTP-mediated BA polymerization at −40 ◦C under laser pulsing at arepetition rate of 20 Hz. The essential features of the experimental spectrum areadequately represented by the simulated EPR curve (dashed line). Delocalization ofthe radical functionality over the phenyl ring is indicated by the hyperfine splittingpattern already reported for styrene and for acrylate polymerizations mediated bydithiobenzoates. [50,54,56,57,137] The EPR spectrum in Figure 4.15b has been recordedunder continuous UV initiation under otherwise identical conditions.From the EPR signals of intermediate and propagating radicals recorded during a
single fast scan (Figure 4.15b), the equilibrium constant, Keq, may be estimated viaEquation 3.3. Because of the shorter sweep time, the spectrum is noisier than theone in Figure 4.15a. EPR spectra as in Figure 4.15b were taken at different ETTPconcentrations. The measured cINT/cP ratios obtained by deconvolution of the EPRspectra are plotted versus ETTP concentration in Figure 4.16. The deconvolutionprocedure is detailed in Section 7.3.3. The coupling constants of the intermediate andpropagating radical are listed in Table 4.6 of this section and in Table 4.1 of Section4.1, respectively.
According to Equation 3.3 the slope of the straight line passing through the originyields Keq = (2.3±0.6)×105 L ·mol−1. The accuracy of Keq is essentially determinedby the error associated with measuring cINT/cP and depends on the validity of Equation3.3 under the specific experimental conditions. That Equation 3.3 is indeed applicablewill be demonstrated further below. The observed Keq value is by about 1 order ofmagnitude above the one found for BA polymerization mediated by trithiocarbonates(see Section 4.2) and is by 4 orders of magnitude above Keq for BA polymerized underxanthate control (see Section 4.1).
Product samples were analyzed via size-exclusion chromatography. The numberaverages of molar mass, Mn > 700 g ·mol−1, are indicative of main-equilibriumconditions. The Mn values decrease toward higher ETTP concentration. If Keqwould be clearly different for pre-equilibrium and main-equilibrium conditions, thecINT/cP versus cRAFT correlation should be nonlinear. This is, however, not what
58

4.3 Dithiobenzoate-mediated n-butyl acrylate polymerization
3335 3340 3345 3350 3355
3345 3350 3355 3360
INT
P
Inte
nsi
ty
B / G
(b)
Inte
nsi
ty(a)
Figure 4.15. EPR spectrum of the intermediate radical recorded during anETTP-mediated polymerization of BA with MMMP as the photoinitiatorat −40 ◦C. (a) Pseudo-stationary conditions apply with laser pulsingat a repetition rate of 20 Hz; modulation amplitude: 3 G, microwavepower: 10 mW, cETTP = 5 × 10⁻⁴ mol · L−1. Simulated spectrum: a/G= 1.3 (2H, meta); 3.9 (2H, ortho); 4.7 (1H, para). (b) EPR spectrumrecorded in a 1.3 s field sweep during a stationary BA polymerization(cETTP = 2×10⁻⁵ mol · L−1) with continuous UV initiation under otherwiseidentical experimental conditions. The dashed line indicates the best fitof overall EPR contour by summation of the individually simulated EPRspectra for INT and P. Because of lower ETTP concentration, the Pcomponent is more pronounced in (b). The field positions for monitoringINT and P individually as a function of time after laser initiation areindicated by the arrows.
59

4 EPR with macromolecular systems
Table 4.6. Coupling constants deduced from the experimental spectra ofINT at −40 ◦C.
coupling constants / GaH,meta aH,ortho aH,para
1.3 3.9 4.7
0.0 5.0x10⁻⁶
1.0x10⁻⁵
1.5x10⁻⁵
2.0x10⁻⁵
2.5x10⁻⁵
0
1
2
3
4
5
6 i
t=0
ETTP = 1
i t=0
ETTP = 100
c INT
/ c P
cETTP
/ mol L1
Figure 4.16. Ratio of intermediate radical and propagating radical con-centrations, cINT/cP, plotted versus ETTP concentration for BA poly-merizations (1.5 mol · L−1 in toluene) at −40 ◦C; photoinitiator: MMMP(1.0 × 10⁻² mol · L−1). The slope of the straight-line fit yields the equi-librium constant, Keq. Stationary experiments were carried out withmonomeric (i t=0
ETTP = 1) and macromolecular (i t=0ETTP = 100) RAFT agent.
60

4.3 Dithiobenzoate-mediated n-butyl acrylate polymerization
the experimental data indicate. No clear chain-length dependence is observed, whichmay be due to the fact that the radical which fragments from the addition productof a radical to ETTP is very similar to the growing (secondary) radical of BApolymerization at low temperature. This is not to say that the very first stepsof addition and fragmentation are independent of chain length. The experimentis however not sufficiently sensitive to investigate such a dependence under pre-equilibrium conditions.
As in the case of the trithiocarbonate EPPT, the stationary EPR experiments wereadditionally carried out with a pre-polymerized dithiobenzoate. An initial chain-lengthof i = 100 was chosen to cover a broad chain-length range. The measured cINT/cPratios for the macromolecular RAFT agent are plotted together with the monomericRAFT in Figure 4.16. The resulting equilibrium constant, does not vary with ini-tial chain length, which is a further indication for the chain-length independence ofKeq.
As mentioned above, the determination of Keq for BA polymerizations at elevatedtemperatures is complicated due to the occurrence of midchain radicals. However,an apparent equilibrium constant may be obtained at elevated temperatures, e. g., at70 ◦C, by determination of cINT and cP from two independent experiments: The concen-tration of secondary propagating radicals, cP, has been determined from the measuredrate of polymerization and the known kp value of these radical species, [130,138] as de-tailed by Kwak et al. [50] The resulting value is (5.2±0.5)×10−10 mol · L−1 for BA poly-merization carried out at a RAFT agent concentration of cRAFT = 2.0×10⁻² mol · L−1.In addition, EPR spectra were taken during ETTP-mediated BA polymerization at70 ◦C. The INT concentration is determined by double integration of the associatedEPR component to be (3.9±0.4)×10−8 mol · L−1. The resulting equilibrium constantis (75± 15) L ·mol−1. It has to be mentioned that this value is an apparent one asMCRs and SPRs are present at 70 ◦C, whereas only SPRs occur at −40 ◦C. Due tothe low concentration of growing radicals the exact SPR to MCR ratio has not beendetermined. This ratio may be lower than in the case of free-radical polymerizationbecause Ahmad et al. [139] showed that controlled radical polymerizations give rise tolower levels of branching. In contrast, no difference in MCR/SPR ratio was observedbetween the trithiocarbonate-mediated and conventional BA polymerization (seeFigure 4.9).
Nevertheless, the apparent value is close to Keq = 55 L ·mol−1 as reported by Kwaket al. for polystyryl dithiobenzoate-mediated styrene polymerization at 60 ◦C. [50]From the Keq values for BA polymerization at −40 ◦C and at 70 ◦C, the difference inactivation energies, Ea(Keq) = Ea(kad)− Ea(kβ) = −49.5 kJ ·mol−1, is found.
The EPR-derived equilibrium constant (75 L ·mol−1) is about two to four ordersof magnitude below the Keq values determined via Equations 2.2 and 2.3 (4.8 ×10⁵ L ·mol−1 and 9.5× 10³ L ·mol−1, respectively). The discrepancy is probably due
61

4 EPR with macromolecular systems
to the fact that rate retardation is overestimated by the equations of Kwak et al., [50]since a decrease in polymerization rate at higher RAFT agent concentrations is, atleast partly, due to the chain-length dependence of the termination rate coefficient,kt. [88] In addition, the equations were derived for only one type of propagating radicaltaking part in the equilibrium. However, at 70 ◦C SPRs and MCRs are present duringpolymerization and secondary and tertiary radicals probably differ significantly intheir cross-termination reactivities. Equations 2.2 and 2.3 are therefore not suitablefor a reliable determination of the equilibrium constant.
4.3.2 Time-resolved EPR experiments
Without further assumptions, the rate coefficients for addition, kad, and fragmentation,kβ, are not accessible from Keq. These individual rate coefficients may, however,be deduced by measuring the concentrations of both intermediate and propagatingradicals, cINT and cP, via microsecond time-resolved EPR spectroscopy after lasersingle pulse initiation and subsequent fitting of the experimental time traces to akinetic scheme via Predici R©. In Figure 4.17, the measured time evolutions of INTand P concentrations after applying the laser pulse at t = 0 are shown.
In spite of resonance stabilization of radical functionality over the phenyl ring andthe low temperature of −40 ◦C, the RAFT intermediate radical decays on the timescale of a few seconds, signifying that INT is a relatively short-lived species. Thisobservation makes slow fragmentation a very unlikely explanation for retardationin dithiobenzoate-mediated polymerization because this model predicts a half-life ofmore than 10 s at 60 ◦C, which would result in a half-life of hours at −40 ◦C. [42]Quantitative evidence is provided by subjecting the experimental radical concentration-versus-time profiles to parameter estimation via the program package Predici R©. Thekinetic scheme, which encompasses initiation, propagation, chain-length-dependenttermination, the individual RAFT pre-equilibrium and main-equilibrium reactionsteps, and chain-length-dependent cross-termination of the intermediate radical, isdetailed in Section 8.1. It is assumed that, due to chemical similarity of the leavinggroup of the reaction product from addition of the RAFT agent to the propagatingBA radical, the addition and the fragmentation rate coefficients of the ETTP-derivedradical should be very similar to the associated rate coefficients of growing BAradicals. Moreover, the leaving group is assumed to add to a monomer molecule, andthus reinitiate, at the same rate as the propagating radical, i. e., kreinp = kp. Thepropagation rate coefficient, kp, and the chain-length-dependent termination ratecoefficient, ki,it , are known from the literature. [130,140,141] The initiation rate coefficient,ki, was assumed to be by 1 order of magnitude above the propagation rate coefficient:ki = 10× kp.The primary free-radical concentration, c0
R, which is almost instantaneously pro-duced by absorption of the laser pulse, is identified with the concentration of initiator
62

4.3 Dithiobenzoate-mediated n-butyl acrylate polymerization
0.00 0.02 0.04 0.06 0.08
0
2x10⁻⁶
4x10⁻⁶
6x10⁻⁶
8x10⁻⁶
c P /
mol
L-1
t / s
0 2 4 6 8
0
1x10⁻⁶
2x10⁻⁶
c INT /
mol
L-1
Figure 4.17. Simulated and experimental concentration-versus-timetraces for propagating and intermediate radicals during BA polymerization(1.5 mol · L−1 in toluene) at −40 ◦C. The initial ETTP and MMMP concen-trations were 2.0× 10⁻⁵ and 1.0× 10⁻² mol · L−1, respectively. The inputparameters for Predici R© simulation were kp = 2.27× 10³ L ·mol−1 · s−1,ki = 2.27× 10⁴ L ·mol−1 · s−1, c0
R = 1.30× 10⁻⁵ mol · L−1, k1,1t = 1.65×
108 L ·mol−1 · s−1, αs = 0.85, αl = 0.22, ic = 30, and kcrosst = 0.25× ki,i
t .
63

4 EPR with macromolecular systems
fragments at t = 0. The c0R value has to be varied within the simulation procedure to
fit the maxima of experimental cINT and cP traces. The final choice of the parametersc0R, kIad and ki, however, does not affect the results for the fitted parameters kad andkβ, as the impact of the reactions associated with c0
R, ki and kIadis essentially restrictedto the increasing part of the experimental concentration-versus-time traces.So far, no reliable number is available for the cross-termination rate coefficient.
Kwak et al. estimated kcrosst to be around 0.5 × kt, thus allowing for rapid cross-termination between radicals of arbitrary size. [90] The chain-length dependence ofkcrosst is adopted to be identical to the one measured for kt. To check for the impactof cross-termination, parameter estimates have been carried out for various sizes ofrelative cross-termination rate, Ccross = kcrosst /kt, with Ccross being varied from 0 to1. Best fits of both the cINT and cP versus time traces from EPR spectroscopy wereobtained for Ccross being in the range of 0.2 to 0.3. The lower value is determinedby the fitting quality of cP versus time and the upper value by the cINT versus timefit; i. e., the decay of P suggests Ccross ≥ 0.2, whereas the decay of INT is best fittedby Ccross ≤ 0.3. Simultaneous fitting of both concentration-versus-time profiles thusresults in a narrow range for the size of cross-termination: Ccross = 0.25± 0.05.
Because of the need for calibration of the EPR setup and because of reduced signal-to noise quality of the spectra, the accuracy of radical concentration measurement isestimated to be about 20 %. Simulations of the experimental concentration-versus-timetraces have thus been carried out for various combinations of potential uncertainty,i. e., assuming cINT and cP to be either as calibrated or by 10 % below or above thisvalue.
Plotted in Figure 4.18 are the so-obtained values of addition rate coefficient, kad,and fragmentation rate coefficient, kβ, (upper part), and the resulting values ofequilibrium constant, Keq = kad/kβ (lower part). The smaller symbols indicate theresults for a particular combination of the concentrations being taken as calibratedor as 10 % above or below this value. The larger symbols indicate the mean valueobtained for the 9 combinations selected at identical Ccross. The error bars indicatethe range of kad, kβ, and Keq values resulting from simulation of cINT and cP varyingby ±10 %. Toward increasing Ccross, kβ slightly decreases and Keq increases, whereaskad is almost insensitive toward the variation of Ccross within the range 0.2–0.3. Therate coefficients obtained for Ccross = 0.25, which allows the best fit of both radicalconcentration profiles (see Figure 4.17), are kad = (1.4± 0.4)× 106 L ·mol−1 · s−1 andkβ = (4.7± 1.5) s−1.
64

4.3 Dithiobenzoate-mediated n-butyl acrylate polymerization
0.20 0.25 0.30
2x10⁵
3x10⁵
4x10⁵
1x10⁶
2x10⁶
3x10⁶
0
2
4
6
Keq /
L m
ol
1
Ccross
k ad /
L m
ol
1 s
1
k /
s1
Figure 4.18. Results from fitting the experimental trace for ETTP-mediated BA polymerization at −40 ◦C for various adopted Ccross =(kcross
t /kt) values. Upper part: kad (triangles) and kβ (squares); lower part:Keq (circles). The shaded area indicates Keq = (2.3± 0.6) L ·mol−1 · s−1
which value has been deduced from measuring cINT/cP during stationaryRAFT polymerization.
65

4 EPR with macromolecular systems
4.3.3 Comparison of both approachesFrom these kad and kβ values, the equilibrium constant at −40 ◦C is obtained to beKeq = (3.4 ± 0.6) × 105 L ·mol−1. This number is in satisfactory agreement withKeq = (2.3 ± 0.6) × 105 L ·mol−1, as obtained from the measured ratio of INT toP concentrations under stationary polymerization conditions (see Section 4.3.1). InFigure 4.18, the range of uncertainty quoted for Keq is indicated by the shadedarea. The data show that Keq estimated from kad and kβ for Ccross = 0.25 is notsignificantly different from the corresponding value deduced from experimentallydetermined cINT/cP. The RAFT model thus appears to adequately describe thepolymerization kinetics and thus should be well suited for determination of kad andkβ.
The obtained kad and kβ values may be used to check whether the reaction conditionsof the stationary experiments were adequate for estimating Keq via Equation 3.3, i. e.,whether the rate of cross-termination, rcrosst , is indeed negligible as compared to theaddition and fragmentation rates, rad and rβ. The absolute concentrations of INTand P are known from the EPR spectra. The maximum value of rcrosst was estimatedby implementing kcrosst = k1,1
t , which refers to the upper limit of termination takingplace between a propagating and an intermediate radical, both of chain length unity.In order to consider the worst case scenario also for addition and fragmentation, bothrates were estimated for the lowest cETTP. Even under these conditions, rcrosst is byabout 1 order of magnitude below rad and rβ, thus verifying the validity of usingEquation 3.3 for the ETTP concentration range selected for our experiments.Via the activation energy Ea(Keq) = −49.5 kJ ·mol−1 (see Section 4.3.1) and
assuming that kad is associated with a low activation energy, e. g., of 8.4 kJ ·mol−1,as suggested by ab initio quantum-chemical calculations for the addition of smallradicals to dithioester compounds, [38] the activation energy of kβ is estimated tobe Ea(kβ) = 57.9 kJ ·mol−1. This number together with kβ measured for −40 ◦Cresults in a fragmentation rate coefficient of 3.1 × 10⁴ s−1 at 60 ◦C, which is byorders of magnitude above kβ values predicted by the slow fragmentation model;e. g., kβ = 10−2 s−1 has been reported for CDB-mediated styrene polymerizationat 60 ◦C. [43] It is very unlikely that polymerizing styrene rather than BA may beresponsible for this difference by about 5 orders of magnitude. Moreover, if themonomers matters, one would expect that, with identical RAFT agent, kβ is higherfor styrene than for BA, as the styryl radical is stabilized by delocalization of radicalfunctionality over the aromatic ring.
66

4.4 Discussion
4.4 DiscussionThe experimentally obtained equilibrium constants and addition and fragmentationrate coefficients for the RAFT-mediated BA polymerizations at −40 ◦C are listedin Table 4.7. The values for three different types of RAFT agents are compared,i. e. the xanthate EDTCP, the trithiocarbonates BMPT and EPPT, as well as thedithiobenzoate ETTP. The rate coefficients kad and kβ are the ones obtained fromSP-PLP-EPR-RAFT experiments and the equilibrium constants represent the averagevalues of the stationary and the single pulse measurements.
Table 4.7. Comparison of experimentally obtained equilibrium constantsand addition and fragmentation rate coefficients for RAFT-mediated BApolymerizations (1.5 mol · L−1 in toluene) at −40 ◦C.
kad / L ·mol−1 · s−1 kβ / s−1 Keq / L ·mol−1
EDTCP (2.5± 0.1)× 104 (2.3± 0.3)× 103 12± 2EPPT (3.4± 0.3)× 106 (1.4± 0.4)× 102 (2.6± 0.8)× 104
BMPT (4.1± 0.9)× 106 45± 5 (8± 4)× 104
ETTP (1.4± 0.4)× 106 5± 2 (3± 1)× 105
Comparison of addition rate coefficients
The addition of propagating radicals to the trithiocarbonate and to the dithiobenzoateis almost equally fast. This is in agreement with ab initio calculations predicting thatfor most RAFT agents, the addition rate coefficients fall into a relatively narrow range(105 – 107 L ·mol−1 · s−1). [40] An exception are xanthates where the reactivity of thethiocarbonyl bond is reduced due to the free electron pair on the oxygen atom. Theaddition rate coefficient for the xanthate is by two orders of magnitude smaller thanfor the trithiocarbonate and the dithiobenzoate. Therefore, xanthates are typicallyused to control polymerizations of highly reactive propagating radicals, like vinylacetate, whereas trithiocarbonates and dithiobenzoates are employed with stablepropagating radicals, such as styrene. Ab initio calculations predict kad values around104 L ·mol−1 · s−1 for xanthates at 60 ◦C, [40] since the addition reaction is associatedwith a very low energy barrier. The calculated value is in close agreement with theexperimentally obtained one.
67

4 EPR with macromolecular systems
Comparison of fragmentation rate coefficients
Considering the low polymerization temperature, fragmentation of the intermediatespecies is fast for all RAFT agents. With reference to the trithiocarbonates, frag-mentation is around one order of magnitude faster for the xanthate and one orderof magnitude slower for the dithiobenzoate. For xanthates a fragmentation ratecoefficient in the range of 102 – 103 s−1 is predicted by ab initio calculations, [40] whichis close to the coefficient obtained from SP-PLP-EPR-RAFT measurements.
For the trithiocarbonate-mediated BA polymerizations kβ has not been calculatedseparately. However, the equilibrium constants for the trithiocarbonates are in closeagreement with the calculated Keq value of 1.4×10⁴ L ·mol−1 for the BMPT-mediatedpolymerization of MA in toluene at −30 ◦C [41] and calculated and experimental kadvalues are similar. The experimentally obtained fragmentation rate coefficient for thetrithiocarbonate is therefore in agreement with the calculated one.The dithiobenzoate-mediated BA polymerization has not been investigated with
ab initio methods so far. The experimentally obtained kβ value can therefore onlybe compared with kβ in a dithiobenzoate-mediated styrene polymerization. Thefragmentation rate coefficient should not significantly differ for both systems. At70 ◦C, kβ = 2.5× 10⁻⁴ s−1 deduced from ab initio calculations is significantly belowkβ = 4.7 s−1 determined from the SP-PLP-EPR-RAFT experiment. As fragmentationbecomes faster with increasing temperature, there is a difference of at least 5 ordersof magnitude between the calculated and experimental fragmentation rate coefficientif one adopts the styrene value for the extrapolation.
Comparison of equilibrium constants
The equilibrium constants for the trithiocarbonates and the dithiobenzoate are threeto four orders of magnitude above the Keq value for the xanthate. The low equilibriumconstant results from a combination of slow addition of BA to the thiocarbonyl bondof the xanthate and the fast fragmentation of the intermediate radical species. A keyaspect to controlling radical polymerization by RAFT is the rapid exchange betweenthe propagating species and dormant macroRAFT agent, which entails that both theaddition and the fragmentation reactions are sufficiently fast. The significantly lowerkad value for the xanthate system therefore explains why acrylate polymerizations areless well controlled by xanthates compared with trithiocarbonates or dithiobenzoates.
The equilibrium constants for the trithiocarbonates are only one order of magnitudesmaller than for the dithiobenzoate. This is caused by the slightly faster fragmenta-tion of the intermediate radical in trithiocarbonate-mediated polymerizations. Thetheoretically predicted Keq value for xanthate-mediated polymerizations is around10 to 100 L ·mol−1, [40] which is in good agreement with the experimental value of12 L ·mol−1. A good correlation between experiment and ab initio prediction is
68

4.4 Discussion
also found for the trithiocarbonates, with the calculated value of 1.4× 10⁴ L ·mol−1
being close to the experimental ones, 2.6× 10⁴ and 8× 10⁴ L ·mol−1 for EPPT andBMPT, respectively. [41] The equilibrium constant for the dithiobenzoate expectedfrom ab initio studies is 4 × 10⁹ L ·mol−1 at 70 ◦C. [39] Since Keq increases withdecreasing temperature, the difference between the experimental (3× 10⁵ L ·mol−1)and theoretical value is even more pronounced at −40 ◦C.
In summary, the rate coefficients determined by EPR spectroscopy are in goodagreement with the calculated ones reported by the Coote group, [40,41] with theexception of dithiobenzoate being the RAFT agent. [39] For dithiobenzoate-mediatedpolymerizations slow fragmentation of the intermediate radical is predicted, whichis in sharp contrast to the fast decay of INT concentration monitored by EPR spec-troscopy after laser single pulse initiation. A chain-length dependence of Keq waschecked by monitoring stationary BA polymerizations mediated by a pre-polymerizedtrithiocarbonate and a pre-polymerized dithiobenzoate, respectively. No pronouncedchain-length dependence, as predicted by ab initio studies, was found. [39]
The accuracy of the determination of the RAFT equilibrium constant via the novelEPR methods represents an enormous advantage over the approach suggested by Kwaket al., [50] where Keq is deduced by comparing polymerization rates at different RAFTagent contents (see Section 4.3). In addition, the EPR strategies are not restrictedto polymerizations which exhibit rate retardation and they provide access to theindividual addition and fragmentation rate coefficients. No control of polymerizationis required, so that all RAFT agent/monomer combinations may be investigated.The EPR experiments can be carried out over a wide range of temperatures butare restricted to ambient pressure, since no pressure-resistant EPR tubes have beendeveloped so far.
The EPR methods may be applied to other RAFT agents, like dithiocarbamates, andother monomers, like methacrylates or vinyl acetate. However, the EPR investigationof styrene polymerization still poses a problem since the radical delocalization into thearomatic ring of the propagating radical gives rise to a multi-line spectrum. Duringnormal polymerization conditions this spectrum can hardly be distinguished fromnoise. Further development of EPR instrumentation will increase the signal-to-noiseratio and the detection limit, so that this monomer should be measurable in the nearfuture. Meanwhile, the investigation of an appropriate model system provides insightinto the dithiobenzoate-mediated styrene polymerization (see Section 5.3).Studies of BA polymerizations at higher temperatures are complicated by the
occurrence of MCRs. Thus, three radicals are detected in the EPR spectrum. Decon-volution of such a spectrum poses no general problem, but single-pulse experimentswith subsequent Predici R© fitting of the radical concentration-versus-time profilesbecomes more difficult due to the increased number of unknown rate coefficients.
69

4 EPR with macromolecular systems
It would therefore be recommendable to separately investigate the RAFT equilib-rium with a system which only contains MCRs. This may be possible by applyingacrylate-type macromonomers. By initiation of such macromonomers radical speciesare produced which are similar to MCRs formed during acrylate polymerization.
70

5EPR with monomer-free model systems
The results from the EPR experiments with macromolecular systems are in good agree-ment with the theoretically predicted ones for xanthate- and trithiocarbonate-mediatedRAFT polymerizations, but there remains a huge difference for dithiobenzoates. Toexclude that the discrepancy is due to possible chain-length dependencies of kad, kβor kcrosst , this chapter deals with model systems which contain no monomer but thecompounds which are used for ab initio calculations. In this way, the direct compar-ison of experimental and theoretical values becomes possible. For the investigatedmodel systems the attacking radicals (tert-butyl, cyano-iso-propyl and phenylethyl,respectively) are identical to the leaving group of the dithiobenzoate.
5.1 tert-Butyl/tert-butyl dithiobenzoate
The first attempt to use a model reaction for comparing experimental and theoreticalKeq values was made by Chernikova et al., [100] who applied a spin trap method inconjunction with EPR spectroscopy. As spin trap agent, 2-methyl-2-nitrosopropane(MNP) was used which simultaneously functioned as a visible-light photoinitiator.This initiator decomposes into tert-butyl and NO radicals (see reaction I in Scheme5.1). The tert-butyl radical adds to another MNP molecule resulting in the stablenitroxide radical di-tert-butyl nitroxide (DTBN in reaction II). The tert-butyl radicalmay also add to tert-butyl dithiobenzoate (TBDB in reaction III), which was usedas RAFT agent. The resulting intermediate radical INT and the nitroxide radicalDTBN can be monitored by EPR spectroscopy.
71

5 EPR with monomer-free model systems
SS
N +
+
SSkad
kβ
TBDB INT
TB
(I)
(II)
.
..
O
MNP
(III)
NO.
NO .+ N
O
DTBN
krT
Scheme 5.1. Reactions that were considered by Chernikova et al. for Keqdetermination of the TB/TBDB system. [100]
Tracing INT and DTBN concentrations after irradiation of the reaction mixturewith visible light and subsequent fitting of the concentration profiles resulted in anequilibrium constant of Keq = (6± 4)× 108 L ·mol−1 for the TB/TBDB system inbenzene solution at 20 ◦C. Simultaneously performed quantum-chemical calculationsresulted in Keq = 4.5× 10⁸ L ·mol−1. [100]
From Scheme 5.1 one would expect that the consumption of INT after switching offthe irradiation source equals the accumulation of the nitroxide spin trap DTBN. Thisis however only the case for c0
TBDB/c0MNP = 1. For the other concentration ratios, e. g.
for c0TBDB/c
0MNP = 9, less DTBN than expected is formed. Chernikova et al. assigned
the effect to self-termination of INT. [100] This conclusion is however in conflict withthe ln(cINT)-versus-time curves being linear which indicates a first-order decay ofINT as one would expect with unimolecular decomposition. Yet, a clearly non-linearINT decay is predicted by Predici R© simulations when self-termination is included tothe extent indicated by Chernikova et al. [100,108] Scheme 5.1 is thus not sufficient todescribe the kinetics of this particular model system.The problem of the spin trap method is that the reaction mechanism is far more
complex than brief inspection may indicate and that the system involves at leastfour types of radicals. In addition to TB and INT, the radicals DTBN and NO arepresent, which may add to the RAFT agent forming additional INT species or undergofurther reactions. For example, evidence for the combination of TB and NO radicalscan be found in literature. [142] Thus, only part of the resulting complexity has beenconsidered by Chernikova et al. [100]
72

5.1 tert-Butyl/tert-butyl dithiobenzoate
Figure 5.1. Radical formed when TBDA decomposes thermally at 80 ◦C.The hyperfine coupling constant, a = 15.3 G, and the intensity ratio of theEPR lines, 1:1:1, point to a nitrogen-centered radical.
5.1.1 Choice of the initiator
Since the model reaction is apparently disturbed by the occurrence of too many radicalspecies, it is preferable to develop a system of lower complexity. This can be achievedby producing TB from an initiator which only decomposes into the desired radicalsand an inert molecule which does not react with any species taking part in the RAFTequilibrium such as symmetrical azo-initiators. Therefore, EPR spectroscopy wasused to check whether 1,2-di-tert-butyldiazene (TBDA) is suitable for this purpose.Thermal decomposition of TBDA at 80 ◦C, however, does not only lead to the
expected TB radical. Instead, the EPR spectrum shown in Figure 5.1 points to theformation of a nitrogen-centered radical, probably di-tert-butylamine (DTBA), whichcould be formed via the mechanism shown in Scheme 5.2. This reaction probably onlyplays an important role below the temperature at which the initiator decomposes at areasonable rate. Normally, TBDA is used in high-pressure ethene polymerization andthe thermal decomposition rate coefficient, kd, is around 0.5 s−1 at 280 ◦C. [143] Atsuch high temperatures the addition rate of the TB radical to TBDA should becomenegligibly small as compared to the rate of termination between two TB radicals.Hence, TBDA is not suitable for confirming the Keq value derived by Chernikova etal. for the TB/TBDB system at lower temperatures (up to 100 ◦C). [100]
73

5 EPR with monomer-free model systems
N+
TB
(I)
(II)
.N
TBDA
N22
+.N
NN
N
.
.
NN
N.
DTBA
2
Scheme 5.2. Assumed reaction mechanism for the decomposition of TBDAat 80 ◦C and formation of DTBA. The shown cross-termination reaction(IV) represents one of the possible reaction pathways. Cross-terminationreactions may occur with all resonance structures depicted in Scheme 2.4.
In an attempt to find another initiator which does not form any additional radicalsat temperatures below 100 ◦C Tetramethylpropyl peroxypivalate (TMPPP) wasinvestigated. Its kd value in high-pressure ethene polymerizations is 0.5 s−1 at 147 ◦Cand it should therefore decompose sufficiently fast at temperatures around 70 ◦C intoluene. [144] As shown in Scheme 5.3, TMPPP decomposes thermally into TB, acetoneand CO2. [145,146] The EPR spectrum of the TB radical is presented in Figure 5.2a.The corresponding coupling constants and line width, deduced from the experimentalspectrum by fitting with the EasySpin toolbox (see Section 7.3.3), are presented inTable 5.1.
5.1.2 Determination of the equilibrium constant
A degassed solution of TMPPP (0.3 mol · L−1) and TBDB (4.5× 10⁻³ mol · L−1) intoluene has been prepared and the reaction mixture was monitored at 70 ◦C via EPRspectroscopy. The EPR spectrum of the INT radical resulting from the addition ofTB to the RAFT agent TBDB is shown in Figure 5.2b, which can be simulated usingthe coupling constants listed in Table 5.1.The concentration profiles of the INT and TB radical are illustrated in Figure 5.3.
At the beginning of the reaction the INT concentration is very high and the TBradical is not detectable. A fast decay of the INT species is observed and after 300 sINT disappears completely. Only then TB concentration becomes measurable, which
74

5.1 tert-Butyl/tert-butyl dithiobenzoate
Figure 5.2. (a) Simulated and experimental TB spectrum; (b) experi-mental INT spectrum; obtained of EPR scans at 70 ◦C, an initial initiatorconcentration of cTMPPP = 0.30 mol · L−1, and a RAFT agent concentra-tion of cCPDB = 4.5× 10⁻³ mol · L−1. The EPR parameters are listed inTable 5.1. Note the different abscissa scales.
75

5 EPR with monomer-free model systems
Table 5.1. Coupling constants and line widths deduced from experimentalspectra of INT and TB in toluene at 70 ◦C.
radical coupling constants / G line width / G
TB aH 0.122.6
INT aH,meta aH,ortho aH,para aH,δ 0.11.3 3.7 4.2 0.4
SS
OO2 +
+
SS
kd
kad
kβ
TBDB INT
TB
(I)
(II)
TB
.
..
OCO2+
O
TMPPP
2 .
H2 .
SS ..
SS
ktc
ktd
(III a)
(III b)
(IV)
+
ktcross
+
CT
Scheme 5.3. Assumed reaction scheme for the model system TB/TBDB.
76

5.1 tert-Butyl/tert-butyl dithiobenzoate
Figure 5.3. Concentration profiles of TB and INT during the de-composition of TMPPP (cTMPPP = 0.3 mol · L−1) in the presence of4.5 × 10−3 mol · L−1 TBDB in toluene at 70 ◦C. Note that the concen-tration of the radical species is proportional to the double integral of thesignal.
indicates that INT and TB are consumed by cross-termination until the RAFT agentconcentration is completely depleted (see Scheme 5.3). The sudden and pronounced de-cay of RAFT would also explain the decolorization of the solution which was observedduring the reaction. Due to the apparently high cross-termination rate, determinationof Keq via Equation 3.3 is not possible. The extrapolation of the cINT/cTB ratio tot = 0 can however provide a rough estimate. With the concentration ratio beingabove 1000 and an initial RAFT agent concentration of 4.5 × 10⁻³ mol · L−1, Keqexceeds 105 L ·mol−1. Although no exact Keq may be obtained from this experiment,the result confirms that Keq is high, which is consistent with the Keq value proposedby Chernikova et al. [100]
It appears from the experiments described above that Keq for the TB/TBDB systemis probably in the range of 105 to 109 L ·mol−1 (between 20 and 70 ◦C). Adopting anaddition rate coefficient of kad = 5× 10⁶ L ·mol−1 · s−1, as proposed by the spin trapmethod, yields fragmentation rate coefficients of kβ = 8× 10⁻³ to 50 s−1. In anotherstudy, Chernikova et al. observed high intermediate radical concentrations during the
77

5 EPR with monomer-free model systems
early stage of a TBDB-mediated BA polymerization. [56] These experimental resultssuggest slow fragmentation of the intermediate radical in dithiobenzoate-mediatedpolymerizations. This conclusion is however misleading as the tert-butyl radical doesnot resemble any monomer in its chemical properties. The tert-butyl radical is lessstabilized than styrene, acrylate or methacrylate radicals and common RAFT leavinggroups, such as cumyl or cyano-iso-propyl. The results from this model system cantherefore not be transferred directly to other dithiobenzoate systems.
Since neither the spin trap method reported by Chernikova et al. [100] nor the EPRexperiment described above provide an exact value for the equilibrium constant, noneof the both approaches can be used for checking the accuracy of the calculated Keqvalue (4.5× 10⁸ L ·mol−1). The theoretical equilibrium constant lies within the rangeof 105 to 109 L ·mol−1, which constitutes a rough estimate of Keq obtained fromthe experiments. This does not necessarily mean that the quantum-chemical studiesby Coote and co-workers yield exact Keq values for other dithiobenzoate-containingsystems. For this particular model system the approximations made and the methodused for modeling solvation energies differ from previous studies (see Table 5.8 andthe Supporting Information of the corresponding publications). [39,98,100]
5.2 Cyano-iso-propyl/2-(2’-cyanopropyl)-dithiobenzoate
In order to meet the requirement of using a model system of low complexity, whichresembles monomer addition and fragmentation and allows at the same time fortesting of quantum-chemical calculations, 2,2’-azobis(2-methylpropionitrile) (AIBN)was selected as thermal initiator and 2-(2’-cyanopropyl)-dithiobenzoate (CPDB) asthe RAFT agent. The enormous advantage of this model system relates to the factthat only two radical species are present, the intermediate radical, INT, and the CIPradical, which are both easily monitored by EPR spectroscopy. Moreover, quantum-chemical estimates of Keq have been made for a system composed of these two radicalspecies. [39,98] The results of the following section have already been published. [147,148]
The kinetic scheme associated with the CIP/CPDB system is given in Scheme 5.4.It includes AIBN decomposition into two cyano-iso-propyl (CIP) radicals (I), additionof CIP to CPDB and fragmentation of the resulting INT species (II), self-terminationof two CIP species via reaction IIIa, IIIb or IV, [149] and cross-termination betweenCIP and INT (Va). By means of Predici R© simulation it was verified that reactionsIII to IV do not affect Keq measurement under the reaction conditions selected.
To check whether side reactions occur which may interfere with the determinationof Keq via Equation 3.3, NMR analyses of the product mixture of the CIP + CPDBreaction after 18 h at 80 ◦C were performed. The experimental procedure as wellas the NMR and mass spectrometry data of the entire set of products are given inSection 7.3.4.
78

5.2 Cyano-iso-propyl/2-(2’-cyanopropyl)-dithiobenzoate
SSCN
NNCN CN
CN N22 +
CN +
SCN
SNC
CN2
CN
NC
kd
kad
kβ
ktc
CN2kcom
kdis
SCN
SNC
CNS
CNSkt
cross1
+
(IIIa)
CN2ktd(IIIb)
CN CN+
NCCN
CPDB INT
CIP
(I)
(II)
(IV)
(Va)
CIP
TMSN
IBN MAN
K
NC
CT1
INT
CN
.
..
.
.
.
..
AIBN
Scheme 5.4. Kinetic scheme for the model system CIP/CPDB. AIBN:2,2’-azobis(2-methylpropionitrile); CIP: cyano-iso-propyl radical; CPDB:2-(2’-cyanopropyl)-dithiobenzoate; INT: intermediate radical; TMSN: tetra-methylsuccinonitrile; IBN: iso-butyronitrile; MAN: methacrylonitrile; K:ketenimine; CT1: cross-termination product 1.
79

5 EPR with monomer-free model systems
SCN
SNC
CNS
CNS
+(Va)NC
CT1
S
CN
S
NC
CN
INT
S
CN
S
CN
NCCT2
CN
(Vb)
SCN
SNC
H
H
S
CN
S
CN
NC
HH
S
CN
S
NC
CNS
CN
S
CN
NC
CT2
H
S
S
CN
CN
(VI)
(VIIa)
CN+
INT
CT3
CPDB*
INT2
kH-shift
S
CN
S
NC
S
CN
S
CN
NC
H
S
S
CN
(VIIb)
CPDB
INT
CN+
CN
CN
TMSN
+
kβ
CN+
CN+
kad
CN+ CN+H
CT2
CT2
ktcross1
kMS1
kMS2
..
..
. .
.
. .
.
ktcross2
kβkad
Scheme 5.5. Products (highlighted in red) found after complete decom-position of 0.3 mol · L−1 AIBN in the presence of 0.75 mol · L−1 CPDBin toluene at 80 ◦C. CT1, CT2, CT3: cross-termination products 1, 2, 3,respectively; INT2: ring-substituted intermediate radical; CPDP*: ring-substituted CPDB. The red structures indicate the side products.
80

5.2 Cyano-iso-propyl/2-(2’-cyanopropyl)-dithiobenzoate
The observed side products and the mechanism of their formation are shown inScheme 5.5. As expected, cross-termination product CT1 has been found (Va),whereas cross-termination product CT2 is missing (Vb). The absence of CT2 maybe explained by the lower stability of this compound, which exhibits no extendeddelocalization of radical functionality over the cyclic moiety. Aromaticity may begained back by an H-shift reaction of CT2 to yield CT3 (VI). Alternatively, thehydrogen atom in para position may be abstracted by another radical (VIIa), whichprocess is one out of a multitude of so-called “missing step” reactions [105] resultingin the formation of the intermediate radical, INT2. This species may fragment andproduce the ring-substituted RAFT agent CPDB*, which should be less prone tocross-termination than CPDB. The “missing step” process may also occur accordingto step VIIb, which goes with the formation of the resonance-stabilized INT radicalplus a stable molecule from a highly reactive radical and relatively labile molecule.Fragmentation subsequent to step VIIb restores CPDB. Further side products werenot detected at our reaction conditions, which indicates that cross-termination via anintermediate radical with the radical functionality in ortho position plays no significantrole. Products resulting from self-termination between two INT radicals were alsomissing. These reaction steps are therefore not included in Scheme 5.5.
The occurrence of products from cross-termination and “missing step” reactions isno surprise because of the enormous driving force behind both processes. [105] DFTcalculations of reaction enthalpies for the ethyl radical/ethyl dithiobenzoate systemsuggest that step Va is faster than Vb, since step Vb is accompanied by a loss of ringaromaticity. However, due to the bulkiness of the CIP radical, step Va should bemore demanding with the system under investigation and thus may be of comparablerate or even slower than step Vb. The absence of product CT2 in the final reactionmixture is most likely due to the fast follow-up reactions (VI through VIIb). Theintramolecular H-shift step VI has not been investigated in the earlier DFT study, [105]but is assumed to be comparably fast as reaction steps VIIa and VIIb. Within thelatter three processes, products with resonance stabilization over the entire aromaticring are obtained.
It should be noted that the enthalpies from ab initio calculations for the ethylradical/ethyl dithiobenzoate system differ only by about 5 % for reactions VIIa andVIIb. [105] This finding is of relevance, as high rates for radical abstraction from a cross-termination product by another radical, e.g., via step VIIb, account for the absenceof three-arm star polymeric material in RAFT polymerizations and thus invalidateobjections against the intermediate radical termination model which are based onsignificant amounts of star-shaped species being absent. “Missing step” reactionsof CT1 have not been included into Scheme 5.5, as DFT calculations indicate asignificantly lower enthalpy for this reaction. [105] Moreover, hydrogen abstraction isunlikely to occur with CT1.
81

5 EPR with monomer-free model systems
Table 5.2. Coupling constants and line widths deduced from the experi-mental spectra of INT and CIP.
radical coupling constants / G line widths / G
CIP aH aN 0.620.5 3.3
INT aH,meta aH,ortho aH,para aH,δ 0.51.3 3.7 4.2 0.4
The occurrence of the cross-termination product CT1 and of the “missing step”product CPDB* has already been reported by Moad et al. for AIBN decompositionin the presence of benzyl dithiobenzoate. [106] They did not observe the product CT1during RAFT polymerization, probably because monomer addition to CIP is fasterthan cross-termination. In addition, they found a by-product under polymerizationconditions, which originates from the ketenimine K (see reaction IV in Scheme 5.4).The molecular structure of this by-product has not been identified so far and couldnot be detected in the experiment carried out as described in Section 7.3.4. However,the product was also detected by real-time NMR when AIBN was used as initiatorfor a trithiocarbonate-mediated polymerization. [150]Formation of CT1 and CT3 may interfere with the determination of Keq via
Equation 3.3. To determine whether this is the case, one has to check
(I) whether the radical concentration ratio cINT/cCIP decreases with ongoing reac-tion and
(II) whether significant amounts of CT1 and CT3 are formed.
(I) The radical concentration ratio cINT/cCIP was monitored via EPR spectroscopy.For this purpose, the EPR spectra of the individual species need to be known. Incontrast to the situation met in the studies of the RAFT-mediated BA polymerization(see Section 4) the EPR signals of the CIP radical and of INT are not fully separated.Thus, the following deconvolution procedure has been applied. The EPR spectrumof CIP, as recorded after heating a degassed AIBN solution in toluene to 80 ◦C, wassimulated. The coupling constants, a, obtained from least-squares fitting via theNelder-Mead simplex algorithm of the EasySpin toolbox (see Section 7.3.3), are listedin Table 5.2. The simulated CIP spectrum is illustrated in Figure 5.4a.[hb]From the EPR spectra measured of AIBN- and CPDB-containing solutions the
simulated CIP radical spectrum was subtracted, which procedure yields an EPR
82

5.2 Cyano-iso-propyl/2-(2’-cyanopropyl)-dithiobenzoate
Figure 5.4. (a) Simulated CIP spectrum; (b) simulated INT spectrum; (c)experimental spectrum (gray line) obtained by co-addition of 10 EPR scansat 80 ◦C, an initial initiator concentration of cAIBN = 0.30 mol · L−1, anda RAFT agent concentration of cCPDB = 0.60 mol · L−1. The green linein (c) represents the summation over the simulated CIP and INT spectra.The EPR parameters are listed in Table 5.2. Note the different abscissascales.
83

5 EPR with monomer-free model systems
spectrum that should entirely originate from the INT species. Fitting of the so-obtained INT spectrum (Figure 5.4b) via EasySpin yields as best fit parameters thevalues listed in Table 5.2. To enhance signal-to-noise quality several EPR scans werecoadded and only part of the magnetic field range in Figure 5.4a has been recordedfor evaluation of cINT/cCIP. Coaddition of 10 EPR scans results in the spectrumillustrated by the gray line in Figure 5.4c. The green line in Figure 5.4c representsthe sum of simulated CIP and INT spectra.The concentration ratio cINT/cCIP was obtained from the ratio of the double
integrals of the simulated INT and CIP contributions of each EPR spectrum. Thisratio was determined at several points in time during the reaction of CPDB and AIBNat temperatures between 60 and 100 ◦C. Spectral analysis was carried out using theMatlab code given in Appendix B.The resulting numbers for 80 ◦C are plotted in Figure 5.5. The ratio cINT/cCIP
does not, at least not significantly, vary with reaction time. No decay of cINT/cCIP isseen at 80 ◦C up to 4000 s, where about 50 % of initial AIBN has undergone thermaldecomposition. The scattering of the cINT/cCIP data increases toward higher CPDBconcentration, as the concentrations of INT and CIP become more dissimilar. Atidentical temperature, the scattering is lower for cINT/cCIP being close to unity, asthe deconvolution procedure is associated with smaller uncertainty in case of similarINT and CIP concentrations. At lower temperatures, longer reaction periods havebeen selected and more EPR scans were taken.At temperatures between 60 and 100 ◦C no cINT/cCIP decrease has been ob-
served, which indicates that the RAFT agent is not measurably consumed by cross-termination or self-termination reactions of INT. Thus Keq may be deduced fromEquation 3.3, i. e., from the slope to the straight-line plot of cINT/cCIP versus cCPDB.RAFT equilibrium constants determined for the temperature range 60 to 100 ◦Care listed in Table 5.3. Plotted in Figure 5.6 is an Arrhenius-type representationof Keq with the associated difference in activation energies for kad and kβ beingEa(Keq) = Ea(kad)− Ea(kβ) = (−28 ± 4) kJ ·mol−1.
(II) The cINT/cCIP does not decrease during the reaction and the EPR approachusing Equation 3.3 to determine Keq should therefore be valid. Nevertheless, Junkerset al. [107] claimed that this EPR approach would be model dependent and that thedata could be equally well fitted by assuming slow addition of radicals to the RAFTagent in conjunction with slow fragmentation of the so-obtained intermediate radicalas well as a high cross-termination rate. The method for disproving this assumptionis straight-forward: The amount of cross-termination products in the composition ofthe product mixture of AIBN and CPDB in toluene has to be analyzed. Subsequently,this amount is compared to the amount of cross-termination products expected whenthe SF and the IRT model are assumed at the same time.
84

5.2 Cyano-iso-propyl/2-(2’-cyanopropyl)-dithiobenzoate
Figure 5.5. Ratios of radical concentration, cINT/cCIP, plotted versusreaction time for different initial CPDB concentrations: cCPDB/mol · L−1 =0.12 (squares), 0.30 (circles), 0.48 (triangles), 0.60 (stars) at 80 ◦C. Theblack line for t = 0 indicates the linear regression of cINT/cCIP versuscCPDB according to Equation 3.3 with cINT/cCIP being obtained as thearithmetic mean value over the full reaction time period of each experiment,as represented by the gray lines. The time period up to 4000 s roughlycorresponds to the decomposition half-life of AIBN at 80 ◦C.
85

5 EPR with monomer-free model systems
Table 5.3. Equilibrium constants obtained at temperatures from 60 to100 ◦C.
T / ◦C Keq / L ·mol−1
60 13± 170 9± 180 7.4± 0.790 5.1± 0.9100 4.6± 0.5
2.7x10⁻³
2.8x10⁻³
2.9x10⁻³
3.0x10⁻³
1.4
1.6
1.8
2.0
2.2
2.4
2.6
ln (
Keq /
Lm
ol
1)
T1
/ K1
Figure 5.6. Arrhenius-type plot of Keq in the temperature range 60 to100 ◦C. The difference in activation energies of kad and kβ, Ea(Keq) =−28.4 kJ ·mol−1, has been determined from the slope to the linear regres-sion (gray line).
86

5.2 Cyano-iso-propyl/2-(2’-cyanopropyl)-dithiobenzoate
Table 5.4. Product composition of a solution of CPDB (0.75 mol · L−1)and AIBN (0.30 mol · L−1) in toluene after stirring for 18 h at 80 ◦C.
product AIBN CPDB TMSN CT1 CT3 CPDB*
percentage in 0 71 15 3 8 3product mixture
Table 5.4 shows the product composition, analyzed by 1H NMR, after stirring asolution of 0.75 mol · L−1 CPDB and 0.30 mol · L−1 AIBN in toluene for 18 h at 80 ◦C.In what follows, it will be shown that these numbers prove cross-termination to be noimportant reaction channel as compared to addition and fragmentation.
The ratio of cross-termination products to products resulting from CIP combination,cCT/cTMSN, is 0.73 with cCT being the sum of cCT1 and cCT3. This measuredratio may be compared to the ratio, which is estimated by Predici R© simulationof experimental cINT/cCIP data adopting a range of Keq and kad values and usinga) the cross-termination rate coefficient suggested by Junkers et al., [107] kcrosst =1.0×10⁹ L ·mol−1 · s−1 as well as b) kcrosst = 1.0×10⁸ L ·mol−1 · s−1. The kcrosst valuehas been varied for illustrating the impact on the concentration of cross-terminationproducts. The comparison is shown in Figure 5.7. The experimental cCT/cTMSN ratioat 80 ◦C is represented by the dotted line.
Figure 5.7 demonstrates that – if SF and IRT are operative at the same time as statedby Junkers et al. [107] – experimental data can only be fitted assuming an unrealisticallylow kad values of 1.0 × 10² L ·mol−1 · s−1. Even for kad = 1.0 × 10³ L ·mol−1 · s−1,cCT should be at least 10 times larger than cTMSN, i. e., cCT/cTMSN should be above10, which disagrees with the experimental cCT/cTMSN being below unity. For morerealistic kad values, i. e., of kad above 1.0 × 10⁵ L ·mol−1 · s−1, TMSN should bevirtually absent for Keq above 104. The closest match between experimental andsimulated cCT/cTMSN is found for Keq = 1.0 L ·mol−1 and Keq = 10 L ·mol−1 withkcrosst = 1.0× 10⁹ L ·mol−1 · s−1 (Figure 5.7a) and kcrosst = 1.0× 10⁸ L ·mol−1 · s−1
(Figure 5.7b), respectively. If one assumes Keq to be above 10 L ·mol−1, experimentalcCT/cTMSN may only be fitted by lowering kcrosst by orders of magnitude. Thushigh Keq in conjunction with high kcrosst , as claimed by Junkers et al., [107] is not inagreement with experimental data.
In an attempt to check for consistency of the strategy of deducing Keq fromEquation 3.3, the size of the individual terms on the r. h. s. of Equation 3.1 havebeen estimated. These terms refer to the rates of addition, fragmentation and cross-
87

5 EPR with monomer-free model systems
Figure 5.7. Dependence of the ratio cCT/cTMSN on kad and Keq forcCPDB = 0.75 mol · L−1, cAIBN = 0.30 mol · L−1, assuming a) kcross
t = kt =1.0×10⁹ L ·mol−1 · s−1 and b) kcross
t = 0.10×kt = 1.0×10⁸ L ·mol−1 · s−1.Note that at constant kad increasingKeq goes with a lowering of kβ. Scheme5.4 and the literature kd value [151] were used for Predici R© simulation.
88

5.2 Cyano-iso-propyl/2-(2’-cyanopropyl)-dithiobenzoate
termination, respectively. The radical concentrations cINT and cCIP do not exceed1.0× 10−6 mol · L−1 whereas cCPDB will be above 0.1 mol · L−1. The maximum valueof kcrosst should be 1.0×10⁹ L ·mol−1 · s−1. Adopting kad to be 1.0×10⁶ L ·mol−1 · s−1
or higher, as is indicated by the quantum-chemical calculations, [38] in conjunction withthe experimental Keq = (7.4± 0.7) L ·mol−1, yields a fragmentation rate coefficientof kβ ≈ 105 s−1. The resulting rates of addition, fragmentation and cross-termination(in mol · L−1 · s−1) are: rad = rβ ≈ 10−1 � rcrosst ≈ 10−3. On the basis of the Keqvalue at 80 ◦C (see Table 5.3), these numbers demonstrate that cross-terminationrate is negligible as compared to both the rate of addition and of fragmentation.
It should be noted that the rate of the “missing step” reaction (VIIb in Scheme 5.5),which contributes another term to the r. h. s. of Equation 3.1, is even smaller thanthe one of cross-termination. This “missing step” rate can be estimated from rMS2 =kMS2 × cCIP × cCT2. For an upper limiting value of kMS2 = 1.0× 10⁹ L ·mol−1 · s−1,Predici R© simulation predicts cCT2 to be below 1.0 × 10⁻⁷ mol · L−1. Thus rMS2should not exceed 1.0× 10⁻⁴ mol · L−1 · s−1.
From Figure 5.7 it becomes clear that assuming SF and IRT can only matchexperimental data if kad ≤ 102 L ·mol−1 · s−1. However, no experimental evidencefor slow addition of CIP to dithiobenzoates has been put forward so far. If kadwere of such small size, the addition of the CIP radical to the C=S double bondwould be slower than to a C=C double bond. [131] One would however expect theopposite to be true, since the barrier for addition of a radical to a C=S double bondis below the one for addition to a C=C bond: [152] For methyl radical addition toCH2 = CH2 and CH2 = S at 0 K, reaction barriers of ∆H‡0 = 38.4 kJ ·mol−1 and∆H‡0 = 9.0 kJ ·mol−1, respectively, have been calculated using high-level ab initiocalculations. As a consequence, the addition of a radical to the C=S bond is by aboutthree orders of magnitude faster than addition to the C=C bond of alkenes. [152]
Junkers et al. [107] try to assign the suggested low kad to the homoanomeric effect,i. e., to the electron-withdrawing cyano group of the CIP radical which reducesthe ability of sulfur to stabilize the resulting intermediate radical via lone pairdonation. They suggest that pseudo-π acceptance by the antibonding orbital ofthe C=S bond weakens the forming bond and increases the barrier for addition.Ab initio calculations however do not predict this homoanomeric effect, e. g., forthe addition of CIP to a dithiobenzoate RAFT agent bearing methyl as the Z-group, kad = 8.29 × 10⁵ L ·mol−1 · s−1 has been calculated for 60 ◦C. [38] Withphenyl being the Z-group of the dithiobenzoates, as in the CIP/CPDB system, theintermediate radical should exhibit even better stabilization and kad values in theorder of 1.0× 10⁶ L ·mol−1 · s−1 must be expected.
From the transfer coefficient for CIP to poly(methyl methacrylate) dithiobenzoateat 60 ◦C, determined by Chong et al., a kad value of 7.2× 10⁵ L ·mol−1 · s−1 can be
89

5 EPR with monomer-free model systems
estimated. [74] In addition, Houshyar et al. investigated the single unit monomer inser-tion into a cyano-iso-propyl trithiocarbonate. [150] Their kinetic simulations resultedin a value of 1.0× 10⁴ L ·mol−1 · s−1 for the addition of CIP to the trithiocarbonate.EPR-derived kad values for trithiocarbonate- and dithiobenzoate-mediated n-butylacrylate polymerizations suggest that the addition of a radical to a trithiocarbonateis about one order of magnitude slower than the addition to a dithiobenzoate (seeChapter 4). Hence, these experimental results are also indicating a minimum kadvalue of at least 105 L ·mol−1 · s−1.
If the barrier for addition of CIP would be enhanced by a homoanomeric effect,similar behavior would be expected for methacrylates and acrylates, as the carbonylmoiety is also electron withdrawing. Slow addition would be associated with poorcontrol of dithiobenzoate-mediated (meth)acrylate polymerization, which is not whatis experimentally found. Moreover, this argument would not be in line with the highaddition rate coefficients from experiment and calculation: The reported experimentalvalues are 1.5×10⁶ L ·mol−1 · s−1 for addition of a methyl acrylate radical to a dithioac-etate at 80 ◦C, [153] and 2.0× 10⁶ L ·mol−1 · s−1, [153] 1.7× 10⁶ L ·mol−1 · s−1 [154] and2.4 × 106 L ·mol−1 · s−1, [155] respectively, for methyl acrylate, butyl acrylate, anddodecyl acrylate radicals adding to a trithiocarbonate. The values were determinedfrom the analysis of molar mass versus monomer conversion plots of RAFT-mediatedpolymerizations displaying hybrid behavior.These high kad values are confirmed by direct time-resolved observation of inter-
mediate radical concentration in RAFT-mediated n-butyl acrylate polymerizationsvia EPR detection after almost instantaneous production of primary photoinitiator-derived radicals. These experiments also demonstrate that the peak concentrationof radicals is reached a few milliseconds after applying the laser pulse and the inter-mediate radical concentration starts to decline immediately (see Section 4.3). A kadvalue as low as suggested by Junkers et al. [107] would result in a significantly slowerincrease of INT concentration. It would take several seconds to reach the maximumradical concentration, if kad were around 105 L ·mol−1 · s−1, and minutes if kad wereof the order of 103 L ·mol−1 · s−1.
The EPR-derived values for addition rate coefficients are close to the ab initio valuesfor addition of several small radicals to RAFT agents. [38] The entire body of existingexperimental evidence supports kad to be of the order of 105 to 106 L ·mol−1 · s−1 atthe reaction conditions of our experiment and thus disagrees with the assumptionmade by Junkers et al. of kad being around 103 L ·mol−1 · s−1.
90

5.3 Phenylethyl/1-phenylethyl dithiobenzoate
5.3 Phenylethyl/1-phenylethyl dithiobenzoate
The above-described model reactions are essential for testing ab initio methods. How-ever, TB and CIP are non-monomeric radicals, which makes direct comparison withRAFT polymerizations difficult. Therefore, an additional model system, phenylethylradical/phenylethyl dithiobenzoate, has been investigated. The phenylethyl radi-cal (PE) – which is equivalent a the styrene radical – is of particular interest, asthe controversy concerning rate retardation is mainly based on different evaluationprocedures of experimental data from dithiobenzoate-mediated styrene polymeriza-tions. [42–44,46,48,50,57,58,64,84,90,94,109,110,156–159]Under polymerization conditions, styrene radicals are barely detectable via EPR
spectroscopy. [160,161] The equilibrium constant is therefore not accessible via thestrategies outlined in Chapter 4. The problems met with the styrene radical relate tothe fact that hyperfine coupling with the aromatic and vicinal hydrogen atoms leadsto a multi-line spectrum. This dramatically reduces the intensity of each line, whichmakes some kinetic investigations, like kt measurements, nearly impossible. Usingdeuterated compounds is one approach to reduce the number of EPR lines. [162,163]Hyperfine coupling of the radical with a deuterium atom is only 1/6.5 of that witha proton, [164] so that more lines are condensed into a single line. The drawbacks ofthis strategy are the high cost of deuterated chemicals and, more importantly, thatan impact of C–D bonds on the rate coefficients cannot be ruled out. For example,Clouet et al. [165] observed a 1.2 times higher kp value for styrene-d8 than for normalstyrene.
5.3.1 Investigation of initiator kinetics
Using a model reaction allows for producing significantly higher radical concentrationsthan in the presence of monomer, where polymerization would proceed far too rapidlyfor recording EPR spectra. An appropriate initiator for producing high PE radicalconcentrations is meso-1,2-bis(1-phenylethyl)diazene (PEDA). Its decompositionmechanism has not been thoroughly investigated before. For that purpose, degassedsolutions of the initiator in toluene were stirred under an argon atmosphere at 80,100 and 110 ◦C, respectively. Subsequently, the solvent and volatile products wereremoved under reduced pressure and the product mixture was analyzed by NMRspectroscopy and mass spectrometry (see Section 7.3.5). The resulting products aredepicted in Scheme 5.6 and their fractions at each reaction temperature are listed inTable 5.5.
At 110 ◦C only the expected products 2,3-butane-2,3-diyldibenzene 1 and 2 (BDDB1,BDDB2) are found. They are formed via termination by combination of two PEradicals. The lower the temperature, however, the higher is the amount of a by-product, which according to NMR data could be tris(1-phenylethyl)amine (TPEA). 2D
91

5 EPR with monomer-free model systems
NN
PEDAN
+
+
BDDB1 BDDB2
TPEA
Scheme 5.6. PEDA decomposition products found after stirring theinitiator solution in toluene at 80, 100 and 110 ◦C for 20 h. BDDB1 andBDDB2: 2,3-butane-2,3-diyldibenzene; TPEA: tris(1-phenylethyl)amine.
Table 5.5. PEDA decomposition products found after stirring the initiatorsolution in toluene at different temperatures.
T / ◦C product fraction in %BDDB1 BDDB2 TPEA
80 10.5 10.5 79.0100 39.2 40.8 20.0110 48.0 52.0 0
NMR spectra show that the methyl and methine protons correlate with the aromaticcarbons and the nitrogen. Based on the connectivity of the atoms three structuresare possible, but because of the chemical shifts in the 1H and 13C NMR spectra andthe lack of correlations of nitrogen with other protons, 1-phenylethylamine and N,N -bis(1-phenylethyl)amine can be ruled out (see Section 7.3.5). Further confirmation ofthe structure by mass spectrometry was not possible. A molecular ion peak was notobserved, due to the instability of the compound.
The formation of TPEA probably follows the mechanism outlined in Scheme 5.2 fordecomposition of 1,2-di-tert-butyldiazene: A nitrogen-centered radical bearing twoPE units may be formed, which acts as a spin trap. Reaction of this spin trap with aPE radical affords TPEA.
92

5.3 Phenylethyl/1-phenylethyl dithiobenzoate
Figure 5.8. UV/VIS spectra recorded during the decomposition of 3.2×10⁻² mol · L−1 PEDA in toluene under an argon atmosphere at 110 ◦C.The time period depicted is 22 h. The arrows indicate the formation ofproducts BDDB1 and BDDB2 at 283 nm, the formation and subsequentdecay of an intermediate product at 315 nm, and the decay of the initiatorat 358 nm.
0 2000 4000 6000 8000
-4.5
-4.0
-3.5
ln(c
PED
A /
mol
L1)
t / s
Figure 5.9. First order ln(cPEDA)-versus-time plot for the decompositionof 3.2× 10⁻² mol · L−1 PEDA in toluene at 110 ◦C.
93

5 EPR with monomer-free model systems
The occurrence of radicals others than the PE radical could lead to unexpectedreactions with the RAFT agent or the intermediate radical. This potentially interfereswith Keq evaluation via Equation 3.3. All experiments were therefore carried out at110 ◦C. Decomposition of PEDA at 110 ◦C has, however, not been investigated so far.Cohen andWang [166] determined the rates of PEDA decomposition in toluene at 43 and53 ◦C by measuring the volume of evolved nitrogen as a function of time. Extrapolationof their values to 110 ◦C gives kd = 9.75 × 10⁻² s−1. However, below 110 ◦C theconcentration of produced N2 is most likely not proportional to the concentration ofdecomposed initiator, as significant amounts of the side product TPEA are formed(see Scheme 5.6 and Table 5.5). Consequently, the data might be erroneous and shouldnot be used for extrapolation to higher temperatures. In this work, the initiatordecomposition rate coefficient was determined by UV/VIS spectroscopy monitoringthe decay in absorption of the N=N double bond at λ = 358 nm.
The spectral series for the decomposition of 3.2× 10⁻² mol · L−1 PEDA in tolueneunder argon atmosphere at 110 ◦C shown in Figure 5.8 covers a time period of 22 h.The solution was degassed by three freeze–pump–thaw cycles prior to the experiment.As indicated by the arrows, formation of products BDDB1 and BDDB2 is responsiblefor the growing peak at 283 nm. The barely discernible absorbance at 315 nm ispresumably due to an intermediate product, which disappears completely after 2 h.
According to the Beer-Lambert law, [167] the characteristic absorbance of a species isproportional to its concentration. The absorbances obtained from the spectra of PEDAdecomposition allow for the determination of kd by plotting ln(cPEDA) versus time.From the slope of the straight line in Figure 5.9 the coefficient kd = (1.3±0.2)×10−4 s−1
is obtained at 110 ◦C. This value differs by more than two orders of magnitude fromkd = 9.75× 10⁻², which was extrapolated from the decomposition rates determinedby Cohen and Wang [166] at 43 and 53 ◦C. This discrepancy is probably due to thefact, that the extrapolation over a wide temperature range is associated with a highdegree of uncertainty. In addition, the data at 43 and 53 ◦C is probably erroneousbecause of the side reactions of the initiator, which were not taken into account byCohen and Wang. In the following, kd = 1.3 × 10⁻⁴ s−1 will therefore be used forevaluating further kinetic data.
As the next step, termination kinetics of the PE radical are investigated. Figure5.11a illustrates the PE spectrum at 110 ◦C in toluene, which may be simulated usingthe coupling constants listed in Table 5.6 that are close to the numbers reportedin the literature. [162] Recording consecutive spectra during PEDA decompositionyields the PE concentration-versus-time plot shown in Figure 5.10. The experimentalconcentration profile was simulated with Predici R© to give the first EPR-derived ratecoefficient for the termination of two styrene radicals of chain length unity, k1,1
t . Thevalue of 3.25× 10¹⁰ L ·mol−1 · s−1 is close to the diffusion-controlled rate coefficient,
94

5.3 Phenylethyl/1-phenylethyl dithiobenzoate
0 5000 10000 150000
1x10⁻⁸
2x10⁻⁸
3x10⁻⁸
4x10⁻⁸
5x10⁻⁸
6x10⁻⁸
7x10⁻⁸
experiment
simulation
c PE /
mol
L1
t / s
Figure 5.10. Experimental and simulated decay of PE radical concentra-tion for a solution containing 1.3 mol · L−1 PEDA in toluene at 110 ◦C fordetermining kt.
kdiff = 3.38× 10¹⁰ L ·mol−1 · s−1, which was estimated from the Smoluchowski andStokes-Einstein equation via [168]
kdiff = 8RT3η (5.1)
where R is the gas constant and η the viscosity of toluene at 110 ◦C, which wastaken from the literature. [169] The close match between the experimental k1,1
t and thecalculated kdiff indicates that the termination between two PE radicals is a diffusion-controlled process. This is due to the stability of the radical by delocalization intothe aromatic ring so that almost all collisions of two PE radicals lead to reaction.
95

5 EPR with monomer-free model systems
Table 5.6. Coupling constants deduced from the experimental spectra ofPE and INT at 110 ◦C.
radical coupling constants / G
PE aH,α aH,β aH,meta aH,ortho aH,para16.7 17.8 1.7 4.9 6.1
INT aH,γ aH,meta aH,ortho aH,para0.4 1.3 3.7 4.2
5.3.2 Determination of the equilibrium constant
In order to establish a mechanistic model for the reaction of PEDA and PEDB intoluene at 110 ◦C, the product mixture was analyzed. The experimental procedureas well as the NMR and mass spectrometry data of the entire set of products aregiven in Section 7.3.6. The kinetic scheme 5.7 involves decomposition of the initiator(I), termination of two PE radicals (II), addition of PE to the RAFT agent PEDBand fragmentation of the resulting INT species (III), cross-termination between PEand INT (IVa and IVb), as well as “missing step” reactions (Va and Vb). Productsresulting from other cross-termination reactions have not been detected at 110 ◦C. Theproduct resulting from a hydrogen shift in CT2 which was detected in the CIP/CPDBreaction is missing (see Scheme 5.5). Below 110 ◦C additional side products werefound. These side products have not been characterized so far. Furthermore, the mainproduct of initiator decomposition at 80 ◦C, TPEA, is not formed in the presence ofRAFT agent.When 0.43 mol · L−1 PEDA and 0.43 mol · L−1 PEDB were stirred in toluene at
110 ◦C up to complete decomposition of the initiator, 23 % of the product mixturewas made up of CT1 compared to 44 % PEDB, 3 % PEDB*, and 30 % BDDB1 andBDDB2. Thus, a higher amount of cross-termination product CT1 is formed thanin the CIP/CPDB model experiment, which means that reaction step IVa plays animportant role in the PE/PEDB system. Formation of a cross-termination product isin accordance with the study of de Brouwer et al., [170] who reported the occurrenceof a three-arm star after irradiating polystyryl dithiobenzoate with UV light in amonomer-free model experiment. Another model experiment conducted by Kwak etal. [90] also gave rise to a three-arm species. When polystyryl dithiobenzoate reactedwith polystyryl radicals (produced from an ATRP initiator) a stable compound ofthreefold molecular weight was detected by size-exclusion chromatography. It wasshown that the cross-termination reaction is irreversible at 60 ◦C. Only after 25 h of
96

5.3 Phenylethyl/1-phenylethyl dithiobenzoate
NN N22 +kd(I)
.
.2(II)
kt
.+
S S S S(III)
kad
kβ
.
S S..+ S S
ktcross1
(IVa)
CT1
PEDA PE
BDDB
PEDB INT
S S
.
.+
S S
H
ktcross2
(IVb)
INT
CT2
S S
H
.S S.
H
S S
+
.+
S S
H
+
.+
S S.
S S .+
(Va)
(Vb) +
CT2 INT2
PEDB*
CT2
INT BDDB
kMS1
kad kβ
kad kβ
kMS2
PEDB
Scheme 5.7. Kinetic scheme for the model system PE/PEDB. PEDA:meso-1,2-bis(1-phenylethyl)diazene; PE: phenylethyl radical; BDDB: 2,3-butane-2,3-diyldibenzene; PEDB: 1-phenylethyl dithiobenzoate; INT: inter-mediate radical; CT1: cross-termination product 1. The side products arehighlighted in red.
97

5 EPR with monomer-free model systems
NN N22 +kd(I)
.
.2(II)
kt
.+
S S S S(III)
kad
kβ
.
S S..+ S S
ktcross1
(IVa)
CT1
PEDA PE
BDDB
PEDB INT
S S
.
.+
S S
H
ktcross2
(IVb)
INT
CT2
S S
H
.S S.
H
S S
+
.+
S S
H
+
.+
S S.
S S .+
(Va)
(Vb) +
CT2 INT2
PEDB*
CT2
INT BDDB
kMS1
kad kβ
kad kβ
kMS2
PEDB
Scheme 5.7. Kinetic scheme for the model system PE/PEDB (continued).CT2: cross-termination product 2; INT2: ring-substituted intermediate radical;PEDB*: ring-substituted PEDB. The side products are highlighted in red.
98

5.3 Phenylethyl/1-phenylethyl dithiobenzoate
heating to 120 ◦C a slight decrease of the species was observed. One may concludethat the formation of CT1 at the chosen reaction conditions proceeds irreversibly.The low amount of the “missing step” product PEDB* as compared to the cross-
termination product CT1 indicates that the reaction barrier for cross-terminationof PE with the radical site at the carbon between the two sulfur atoms of the INTspecies is reduced as compared to the cross-termination with CIP. This may be dueto the radical delocalization being possible in the case of the PE radical, which iscaptured rapidly by INT. Subsequent rearrangement of the resulting product affordsCT1. In addition, PE is a secondary radical and the cross-termination at the carbonbetween the two sulfur atoms of the INT is less impeded by steric hindrance.
By analogy to the Keq determination of the CIP/CPDB system (see Section 5.2)the radical concentration ratio cINT/cPE was obtained from consecutively recordedEPR spectra during the reaction of PEDA and PEDB in toluene at 110 ◦C. The EPRsignals were not fully separated. Consequently, the strategy applied in Section 5.2was adopted. First, EPR spectra of the individual compounds were recorded by usingconditions where only one radical species was present. The PE spectrum was obtainedby monitoring PEDA decomposition in toluene as described above. Employing a highPEDB concentration gave the INT spectrum shown in Figure 5.11b.
To obtain the molar fractions of the individual species, the two-component spectrumis modeled as a linear combination of the individual INT and PE spectra. The least-square fitting was performed using Excel. Due to the high signal-to-noise ratio ofthe experimental PE spectrum, the spectrum was smoothed by applying a Fourierfilter prior to the fitting procedure. The simulated spectrum was not used, because itdid not entirely match the experimental one. Figure 5.11c proves that this strategyleads to a close agreement between the experimental two-component spectrum andthe simulated one.Figure 5.12 shows the cINT/cPE ratios observed during the reaction for various
initial RAFT agent concentrations, c0PEDA. Contrary to the CIP/CPDB system a
clear decay of the radical concentration ratio is seen. It is therefore necessary to checkwhether Keq may be calculated from Equation 3.3 since the decay indicates that cross-termination is considerable compared to addition and fragmentation. A first estimateof Keq is obtained by extrapolating cINT/cPE to t = 0. Plotting cINT/cPE versus
√t
and ln(cINT/cPE) versus t (see Figure 5.12a and b, respectively) yields straight linefits. Both methods however have no theoretical basis. Interestingly, plots with almostthe same slope (around −1.3× 10⁻⁴ s−1) are observed in the latter case. The onlyexception is the data with an initial PEDB concentration of 4.4 × 10⁻² mol · L−1.The different slope is due to scattering in cINT/cPE ratios at longer reaction times. Adeviation for this concentration is therefore also observed in the ln(cINT/cPE)-versus-tdiagram.
99

5 EPR with monomer-free model systems
Figure 5.11. (a) Spectrum of the PE radical; (b) spectrum of INT; (c)best fit and experimental spectrum of INT and PE obtained by co-additionof 8 EPR scans at 110 ◦C, a RAFT agent concentration of cPEDB = 5.6×10⁻² mol · L−1, and an initiator concentration of cPEDA = 0.8 mol · L−1.Note the different abscissa scales.
100

5.3 Phenylethyl/1-phenylethyl dithiobenzoate
0 2000 4000 6000 8000 10000 12000
-2
-1
0
0 20 40 60 80 100 1200.0
0.5
1.0
1.5
ln(c
INT /
cPE)
t / s
(b)
c0
PEDB / mol L
1 =
5.6 x 10²
4.4 x 10²
3.2 x 10²
1.2 x 10²
8.0 x 10³
c INT /
cPE
t 0.5
/ s0.5
(a)
Figure 5.12. Decay of cINT/cPE ratio at 110 ◦C for extrapolation tocINT/cPE(t = 0). (a) cINT/cPE versus
√t; (b) ln(cINT/cPE) versus t for
various initial RAFT agent concentrations, c0PEDB.
101

5 EPR with monomer-free model systems
0 2x10⁻²
4x10⁻²
6x10⁻²
0.0
0.5
1.0
1.5
2.0
evaluation of Keq via ln(c
INT/c
PE)
evaluation of Keq via t
0.5
c INT /
cPE (
t =
0)
c0
PEDB / mol L
1
Figure 5.13. cINT/cPE(t = 0) versus initial PEDB concentration fordetermination of Keq at 110 ◦C. cINT/cPE(t = 0) ratios were obtainedfrom Figure 5.12 by extrapolation of cINT/cPE versus
√t and ln(cINT/cPE)
versus t, respectively.
In Figure 5.13 the cINT/cPE(t = 0) values are plotted versus initial RAFT agentconcentration. Evaluating the EPR data using the
√t-based method gives Keq =
(31 ± 1) L ·mol−1. Interpretation via ln(cINT/cPE) yields Keq = (27 ± 1) L ·mol−1.Thus, the first estimate affords an average Keq of (29± 3) L ·mol−1.
To check for the consistency of the estimate via Equation 3.3, the EPR setup wascalibrated by using solutions of TEMPO in toluene. This procedure is applied becauseneither PEDA nor PEDB increases the polarity of the sample significantly. Thequality factor Q and the difference in field strength between sample and referenceremain unchanged (see Section 7.3.2). The concentration profiles are illustrated inFigure 5.14. All profiles were fitted simultaneously using the reactions depicted inScheme 5.7. In addition, the concentration of the cross-termination product CT1,found in the experiment designed to identify all side products (see Section 7.3.6),should be reproduced by the Predici R© simulation.Figure 5.14 shows the best fits for the various initial RAFT agent concentrations
using kad = 107 L ·mol−1 · s−1 and the kd and k1,1t values from the above described
102

5.3 Phenylethyl/1-phenylethyl dithiobenzoate
0 2000 4000 6000 8000 10000 120000
2x10⁻⁸
4x10⁻⁸
6x10⁻⁸
0
2x10⁻⁸
4x10⁻⁸
6x10⁻⁸
8x10⁻⁸ c
0
PEDB / mol L
1 =
5.6 x 10²
4.4 x 10²
3.2 x 10²
1.2 x 10²
8.0 x 10³
c PE /
mol
L1
t / s
(b)
c INT /
mol
L1
(a)
Figure 5.14. Experimental and simulated decay of PE and INT radicalconcentrations for various initial RAFT agent concentrations, c0
PEDB, at110 ◦C for determining Keq and kcross
t using kad = 107 L ·mol−1 · s−1.
103

5 EPR with monomer-free model systems
experiments. Since the INT concentration can be measured with higher accuracythan the PE concentration, less scattering is seen in the INT traces and these profilesare therefore more suitable for fitting. It should be noted however that it makesno difference whether all profiles are used for parameter estimation or only the INTtraces. The same rate coefficients are obtained.The addition rate coefficient was varied in the range of 104 to 1010 L ·mol−1 · s−1.
The experimental data could be fitted equally well for all kad values and the correspond-ing numbers for Keq and kcrosst are listed in Table 5.7. For kad < 104 L ·mol−1 · s−1
fitting was not successful anymore. It becomes clear that neither Keq nor kcrosst dodepend significantly on kad. The experimental cCT1/cPEDB ratio is 0.52, compared to0.59 predicted by simulation. The experimental cCT1/cBDDB1+2 ratio is 0.76, comparedto the calculated number of 0.59. For kad being between 105 to 1010 L ·mol−1 · s−1
the Keq values are within the error margin of the equilibrium constant estimated viaEquation 3.3.
Mean values of Keq = (31.5±0.3) L ·mol−1 and kcrosst = 1.8×10⁹ L ·mol−1 · s−1 areobtained at 110 ◦C. In comparison, the equilibrium constant estimated via Equation3.3 is (29± 3) L ·mol−1. The close agreement between the constants obtained fromthe two different approaches shows that extrapolation of cINT/cPE to t = 0 minimizesthe error induced by the high cross-termination rate. The average Keq from Equation3.3 and Predici R© fitting is (30± 4) L ·mol−1.
With kad being in the range of 105–1010 L ·mol−1 · s−1 and an equilibrium constantof 30 L ·mol−1 the fragmentation step proceeds at a rate constant of 3 × 10³ to3× 108 s−1. Assuming kad to be 2× 10⁶ L ·mol−1 · s−1, as derived for the polystyryldithiobenzoate-mediated styrene polymerization at 40 ◦C studied by Goto et al., [66]yields kβ ≈ 6.7×10⁴ s−1. This value is in agreement with kβ = 1.8×10⁴ s−1 obtainedby Kwak et al. during a polystyryl dithiobenzoate-mediated styrene polymerizationat 60 ◦C. [90] The authors used EPR spectroscopy to determine the intermediateradical concentration and dilatometry to calculate the propagating radical concen-tration. Barner-Kowollik et al. deduced a value of kβ = 3 × 10⁻² s−1 for thecumyl dithiobenzoate-mediated styrene polymerization at 60 ◦C by modeling of thetime-dependent evolution of experimental molecular mass distributions. The latterapproach however fails to predict intermediate radical concentrations correctly. [45,46]It is thus reasonable to conclude that fragmentation is fast for the PE/PEDB system.
The PE/PEDB reaction was also investigated at 150 ◦C to estimate Ea(Keq), as itis likely that less side reactions occur at elevated temperatures. At 80 and 100 ◦C, notyet identified side products were found, which are probably related to the side productTPEA observed during initiator decomposition at these temperatures. Toluene has aboiling point of 110.6 ◦C [171] and could therefore not be used as the solvent. Instead,naphthalene with a boiling point of 218 ◦C [171] was employed. A decrease of cINT/cPEis seen comparable with the one observed at 110 ◦C. Using naphthalene as a solvent,
104

5.3 Phenylethyl/1-phenylethyl dithiobenzoate
Table 5.7. Equilibrium constants and cross-termination rate coefficientsderived from the best fits of the experimental data shown in Figure 5.14.
kad / L ·mol−1 · s−1 Keq / L ·mol−1 kcrosst / L ·mol−1 · s−1
104 38.1 1.7× 10⁹
105 31.8 1.8× 10⁹
106–1010 31.2 1.8× 10⁹
0.0 0.1 0.2 0.30
1
2
3
cINT
/cPE
vs t
ln(cINT
/cPE
) vs t
cINT
/cPE
vs t0.5
c INT /
cPE (
t =
0)
c0
PEDB / mol L
1
Figure 5.15. cINT/cPE(t = 0) versus initial PEDB concentration, c0PEDB,
for determination of Keq at 150 ◦C. cINT/cPE(t = 0) ratios were obtained byextrapolation of cINT/cPE versus t, cINT/cPE versus
√t and ln(cINT/cPE)
versus t, respectively.
105

5 EPR with monomer-free model systems
however, complicates EPR calibration and thus determination of kd and kt, since it is asolid at room temperature (melting point 80.3 ◦C [171]). The equilibrium constant maytherefore only be estimated from Equation 3.3. The above detailed strategy of cINT/cPEextrapolation to t = 0 was used. The cINT/cPE(t = 0) versus c0
PEDB plots are shown inFigure 5.15. Evaluation of the data via cINT/cPE versus time, ln(cINT/cPE) versus timeand cINT/cPE versus
√t yield Keq = (6.8± 0.2), (7.8± 0.7) and (8.8± 0.8) L ·mol−1,
respectively. The average Keq is (8± 2) L ·mol−1. Note that the product analysis byNMR does not exclude the possibility of side reactions because the solvent naphthalenecannot be easily removed from the mixture. The signal-to-noise ratio was too highfor reliable identification of reaction products due to the huge naphthalene fraction.From the equilibrium constants at 110 and 150 ◦C the apparent activation energywas determined to be: Ea(Keq) = Ea(kad)−Ea(kβ) ≈ −44.5 kJ ·mol−1. This valueis in close agreement with −40.5 kJ ·mol−1 obtained by Arita et al. [157] for cumyldithiobenzoate-mediated styrene polymerizations between 120 and 180 ◦C.
5.4 DiscussionIn Table 5.8 the experimentally obtained and theoretically predicted equilibrium con-stants for dithiobenzoate model systems and dithiobenzoate-mediated polymerizationsare listed. The temperatures and solvents used in the study are given below eachvalue. Experimental activation energies are also provided.
Note that the theoretical equilibrium constants calculated by Coote and co-workersare mainly listed for the sake of completeness and since there is no a priori reasonsto assume that the general trends are not a true reflection of what can be expectedin a RAFT polymerization. One has to be careful however in taking the calculatedequilibrium constants as face values since they are significantly influenced by solvationeffects. Coote and co-workers compared calculated gas- and solution-phase free energiesand found that the gas-phase values are up to −30 kJ ·mol−1 more exothermic, i. e.,the gas-phase equilibrium constants are up to six orders of magnitude higher. [41] Aparticularly strong influence of solvation effects was found for acrylates due to theirgreater polarity and their greater potential for hydrogen bonding as compared toother monomers.In the following, radical stabilization energies (RSEs) are used to explain the
experimental results. The radical stabilization energy is a thermodynamic measure ofrelative radical stability. [172] It compares the energy of the radical R q to a referencespecies qCH3. The standard RSE is the difference of the corresponding R–H andCH3–H bond dissociation enthalpies (BDEs): RSE = BDE[CH3–H] − BDE[R–H].When the RSE for radical R q is positive, R q is more stabilized than qCH3 and if theRSE is negative, R q is less stabilized. [173]
106

5.4 Discussion
Table 5.8. Comparison of equilibrium constants and activation energiesfor dithiobenzoate model systems and dithiobenzoate-mediated polymeriza-tions. The theoretical values were obtained using (A) B3LYP/6-13G(d) forgeometry optimization, W1-ONIOM for energy calculations and COSMO-RS for modeling of solvation energies, (B) B3LYP/6-13G(d), W1-ONIOMwith PCM-UAHF for modeling of solvation energies, (C) B3LYP/6-31G(d),W1-ONIOM. The ab initio methods are explained in the references providedin the table. (D) The values refer to apparent activation energies. See textfor further details.
Kexpeq / L ·mol−1 Ktheo
eq / L ·mol−1 Ea(Keq) /kJ ·mol−1
model systems
TB/TBDB
> 105 2.55× 10¹⁰
–70 ◦C in toluene 25 ◦C in MMA [98], A
(6± 4)× 108 4.5× 10⁸
20 ◦C in benzene [100] 20 ◦C in benzene [100], B
CIP/CPDB 9± 170 ◦C in toluene
2.35× 10⁵
−28.460 to 100 ◦C
70 ◦C in gas phase [39], C
3.51× 10³
25 ◦C in MMA [98], A
PE/PEDB 30± 4 3.45× 10⁸ −44.5D
110 and 150 ◦C110 ◦C in toluene 70 ◦C in gas phase [39], C
macromolecular systems
PS/PSDB 55 2.06× 10¹¹ −40.5 [157]
60 ◦C in styrene [90] 70 ◦C in gas phase [39], C 120 to 180 ◦C
BA/ETTP 75 – −49.5D
70 ◦C in toluene −40 and 70 ◦C
107

5 EPR with monomer-free model systems
Comparison of equilibrium constants of model systems
The values for CIP/CPDB and PE/PEDB are extrapolated to 20 ◦C, using theactivation energies given in Table 5.8, to allow for direct comparison of the equilibriumconstants. The resulting values are Keq = 53 L ·mol−1 for the CIP/CPDB systemand Keq = 2.2 × 10³ L ·mol−1 for the PE/PEDB system. The value reported byChernikova et al. for the TB/TBDB system is Keq = 6 × 10⁸ L ·mol−1. [100] Thus,there is a 5 to 7 orders of magnitude difference in Keq for the equilibrium involvingtert-butyl to the ones involving phenylethyl and cyano-iso-propyl, respectively. Thisis due to the lower radical stabilization energy of TB (28.5 kJ ·mol−1) [173] versusCIP (58.3 kJ ·mol−1) [173] or PE (68.3 kJ ·mol−1), [174] which shifts the addition-fragmentation equilibrium from the side of the tert-butyl radical towards the one of theintermediate radical (see reaction II in Scheme 5.3). Since tert-butyl does not resemblea monomeric species, the model equilibrium constant does not provide evidence for slowfragmentation being the cause of rate retardation in other dithiobenzoate-mediatedpolymerizations.Considering the radical stabilization energies of CIP and PE one would expect
a larger equilibrium constant for CIP than for PE. However, the PE/PEDB valueis around 40 times higher than the one for CIP/CPDB. This is caused by theelectron-withdrawing cyano-iso-propyl which exerts a significant homoanomeric effectby weakening the bond formed between the sulfur and the attacking radical. TheCIP radical therefore adds at a slower rate to the C=S double bond and fragmentsfaster from the RAFT intermediate. [74] As a result, the equilibrium constant issmaller than expected from radical stabilization energy. [40] For a methyl methacry-late/dithiobenzoate system a similar equilibrium constant is expected, as the radicalstabilization energy of MMA (54.6 kJ ·mol−1) [173] is close to the one of CIP and asMMA also bears an electron-withdrawing group. This assumption is supported by abinitio calculations. [98]The homoanomeric effect also plays a role in acrylate-dithiobenzoate systems.
However, the radical stabilization energy of ethyl acrylate (42.0 kJ ·mol−1) [173] ismuch lower than for CIP or MMA and the equilibrium constant should therefore behigher. This could explain why rate retardation has been observed with acrylates butnot in methyl methacrylate polymerization. [88]
108

5.4 Discussion
Comparison of experimental and theoretical equilibrium constants
For the TB/TBDB model system experimental Keq values are not in conflict with thetheoretical ones. The difference of two orders of magnitude between the theoreticalvalues in benzene and MMA is most likely due to the different solvent methods usedfor calculation, i. e. COSMO-RS and PCM-UAHF, respectively. [98]
The higher Ktheoeq value for the CIP/CPDB system listed in Table 5.8 was calculated
in the gas phase. The lower Ktheoeq was calculated in MMA as the solvent and refers
to the addition of CIP to TBDB. Calculations were carried out using COSMO-RS asa solvent model. The authors recommend, however, PCM-UAHF for the prediction ofRAFT-based solvation energies. With this model, equilibrium constants are reduced upto two orders of magnitude. [98] Additional calculations of the CIP/CPDB equilibriumusing PCM-UAHF for calculating solvation energies may therefore yield the sameresults as the experiment.For PE/PEDB only gas-phase calculations have been carried out so far. The
calculated value is around six orders of magnitude above the experimental one.Comparison with CIP/CPDB shows that – if the solvent environment is considered –Ktheo
eq may be reduced up to four orders of magnitude. Still, a difference of two ordersof magnitude remains. A particular difficulty of quantum-chemical calculations forthis system may be associated with adequately taking the delocalization of radicalfunctionality for both species, PE and INT, into account. It therefore appearsrecommendable to revise the ab initio calculations for this system.
Comparison of model systems and macromolecular systems
A direct comparison between model and macromolecular system is possible in the caseof PE/PEDB and polystyryl/polystyryl dithiobenzoate (PS/PSDB). Extrapolationof Keq to 60 ◦C yields Keq = 244 L ·mol−1 using the apparent activation energyEa(Keq) = −44.5 kJ ·mol−1. Thus, Keq for the model system is about four timesabove Keq for dithiobenzoate-mediated styrene polymerization. This may be dueto a chain-length dependence of Keq. Ab initio calculations predict an even morepronounced chain-length effect of three orders of magnitude. However, the chain-length effect is contrary to the observed one, i. e. fragmentation of a growing chainshould be much slower than the fragmentation of a phenylethyl radical. [39]
It should be noted that Suzuki et al. [95,96] measured rates of dithiobenzoate-mediatedstyrene polymerization in bulk and in miniemulsion and found significantly higher ratesfor miniemulsion polymerization. The experimental observation cannot be understoodby the slow fragmentation model, but is adequately described by the intermediatetermination model assuming a relatively high fragmentation rate coefficient and ahigh rate coefficient for termination between the intermediate radical, INT, and a
109

5 EPR with monomer-free model systems
propagating radical. These conclusions are in full agreement with the EPR data andclearly contradict the high equilibrium constant from ab initio calculations.The investigation into the n-butyl acrylate polymerization mediated by ethyl S-
thiobenzoyl-2-thiopropionate, which is a dithiobenzoate RAFT agent with an acrylateleaving group (see Section 4.3), yielded Keq = 75 L ·mol−1 at 70 ◦C. This lattervalue for BA polymerization is affected by the simultaneous occurrence of secondarypropagating chain-end radicals (SPRs) and midchain radicals (MCRs) produced bybackbiting reactions of SPRs. Both radicals with their relative concentration beingtemperature dependent may add to the RAFT agent. Keq for BA/ETTP shouldtherefore be considered as an apparent value. As expected by comparison of radicalstabilization energies (see above), Keq is higher for acrylate polymerization than forthe CIP/CPDB system. The homoanomeric effect causes the styrene and acrylatepolymerizations to have similar equilibrium constants despite the difference in radicalstabilization energy of more than 25 kJ ·mol−1.
Comparison of activation energies
Whereas the experimental equilibrium constants listed in Table 5.8 were measuredwith high accuracy and are therefore exact values, the accuracy of the experimentalactivation energies is limited. This is due to the narrow temperature range investigatedand do to the fact that different solvents had to be used in order to cover a largertemperature range.The difference in activation energies for kad and kβ for the CIP/CPDB system is
Ea(Keq) = (−28 ± 4) kJ ·mol−1. This number is slightly below the styrene modelsystem and styrene polymerization. Arita et al. obtained Ea(Keq) = −40.5 kJ ·mol−1
for the cumyl dithiobenzoate-mediated styrene polymerization. [157,175] This value is inclose agreement with the PE/PEDB model system, although the activation energy isslightly uncertain as solvents were changed from toluene at 110 ◦C to naphthalene at150 ◦C. The value for dithiobenzoate-mediated BA polymerization is also an apparentvalue and is based on the measurement of Keq at two different temperatures. Athigher temperatures, midchain radicals occur, which have a higher radical stabilizationenergy (54.7 compared to 42.0 kJ ·mol−1). The higher radical stabilization energy ofthe MCRs should lower Keq, so that the activation energy for SPRs could be evenhigher than the one listed in Table 5.8.Activation energies from ab initio calculations for various model systems, e. g., for
reaction of CH3, CH2COOCH3, CH2Ph, or C(CH3)2CN radicals with RAFT agentsbearing a CH3 leaving group and a CH3, phenyl, or benzyl Z-group, are in the rangeof −95 to −34 kJ ·mol−1. [38]
110

6Closing Remarks
The novel EPR strategies presented in this thesis are highly advantageous comparedto previously used methods for deducing the RAFT equilibrium constant, Keq, andthe rate coefficients for addition, kad, and fragmentation, kβ. Due to direct mon-itoring of the radical species involved in the RAFT equilibrium, determination ofKeq without assuming a kinetic model becomes possible. Tracing of intermediateradical concentration after laser single pulse initiation provides information about thelifetime of this species. The two methods allow for independent access to Keq. Inaddition, the EPR experiments are not restricted to RAFT agents which induce rateretardation, but can be applied to all types of RAFT agents.
Lower Keq values were observed in BA polymerizations mediated by xanthate andtrithiocarbonate than the ones mediated by dithiobenzoate. This is consistent withthe experimental finding, that dithiobenzoates control acrylate polymerizations betterthan xanthates or trithiocarbonates. The equilibrium constants for the latter twotypes of RAFT agents are in agreement with ab initio values calculated by Coote etal. [40,41] The equilibrium constant for the dithiobenzoate is, however, by six ordersof magnitude smaller than the theoretically predicted one. Therefore, monomer-freemodel systems with dithiobenzoates were investigated to check the accuracy of thequantum-chemical methods. Since the Keq values of the model systems also deviatesignificantly from the calculated ones, it appears highly advisable to revisit the abinitio method employed for dithiobenzoates.
Quantum-chemical calculations for the model systems cyano-iso-propyl/2-(2’-cyano-propyl)-dithiobenzoate and phenylethyl/1-phenylethyl dithiobenzoate are currentlyunderway in the “Computational Chemistry and Biochemistry” research group of
111

6 Closing Remarks
Jun.-Prof. Dr. Ricardo Mata at the University of Göttingen. Preliminary equilibriumconstants are much closer to the values obtained from the EPR measurements [176]than the theoretical values calculated by the Coote group. [39] Both groups carried outtheir ab initio calculations for the gas phase, showing that the discrepancy betweentheoretically and experimentally obtained equilibrium constants cannot be attributedto solvent effects. It is more likely that the new ab initio method developed in theMata group is capable of describing the delocalization of the radical function into thearomatic ring.
The model systems investigated in this thesis can explain the rate retardationphenomena observed in dithiobenzoate-mediated polymerizations. In CIP/CPDB-related polymerizations, such as the dithiobenzoate-mediated MMA polymerization,no rate retardation is observed due to the relatively low equilibrium constant andcross-termination being slow as compared to addition and fragmentation. Part ofthe cross-terminated species undergo “missing step” reactions to either yield backthe RAFT agent or a RAFT agent being substituted at the para position of thearomatic ring. To check whether the results from the CIP/CPDB model system can betransferred to dithiobenzoate-mediated polymerizations of tertiary monomers, studiesinto the MMA polymerization mediated by a dithiobenzoate with MMA leaving groupare currently underway in our laboratory. [177]
For dithiobenzoate-mediated styrene polymerizations cross-termination seems tobe the main cause for rate retardation. “Missing step” reactions play a minor rolewith this monomer. In tert-butyl dithiobenzoate-mediated polymerizations stronginhibition is seen in the early stages of the polymerization due to a combination of slowfragmentation of tert-butyl from the RAFT adduct radical and fast cross-terminationof tert-butyl radicals with intermediate radicals.
The presented results thus indicate that rate retardation in some RAFT polymeriza-tions is due to a reduced fragmentation rate, which however is by orders of magnitudefaster than proposed by the supporters of the slow fragmentation model. The reducedfragmentation rate of the RAFT adduct only serves to increase its concentration,and thus makes cross-termination more likely than in the corresponding non-retardedsystems.
Cross-termination occurs at the para position of the phenyl group and at the carbonbetween the two sulfur atoms of the INT species. The other possible sites, like theortho position, are not affected. This may be explained by the fact that the aromaticsystem remains intact when cross-termination occurs at the carbon between the twosulfur atoms. Despite the steric hindrance, cross-termination at this position thereforetakes place. In the case of xanthates or trithiocarbonates this reaction site does notcause rate retardation since Keq is lower than for dithiobenzoates and the lifetime of
112

the intermediate radical is reduced. Cross-termination may therefore only occur to avery limited extent.
For dithiobenzoates, cross-termination preferably takes place at the para positioninstead of the ortho position of the phenyl ring, due to less steric hindrance. Forthe same reason, tertiary radicals preferably add to the para position and secondaryradicals to the carbon between the two sulfur atoms. The cross-termination productresulting from the addition at the para position is not overly stable. Consecutivereaction steps which restore the aromaticity of the phenyl ring are fast. Therefore,significant amounts of “missing step” products are found when tertiary radicals areinvolved in the RAFT process.
The main factors that contribute to the reduction of cross-termination during thecourse of dithiobenzoate-mediated polymerizations are the chain-length dependence ofkcrosst and the transformation of part of the original RAFT agent into a “missing step”product, which is less prone to cross-termination. Adopting a reasonable chain-lengthdependence of kcrosst together with fast fragmentation, yields excellent fits of thepresented EPR data. In addition, experimental evidence for chain-length-dependentcross-termination has been deduced by Ting et al. from dithiobenzoate-mediatedstyrene polymerization, where only radicals of chain length i > 50 were present. [111]The absence of significant rate retardation with long-chain radicals is most likely dueto the fact that in macroRAFT-mediated and conventional polymerization (withoutRAFT agent) almost exclusively large radicals are present. From the composite modelit is well known, that large radicals exhibit only minor differences in terminationrate that are not easily detected. [178] On the other hand, RAFT polymerization atlow degrees of conversion exhibits quite different termination behavior, as almost allradicals are of small size and thus terminate much faster. The behavior under suchconditions is quite different from the one of a conventional polymerization, wherelarge radicals are present from the very beginning on. As a consequence, comparedto conventional polymerization, a clear retardation is seen with RAFT-mediatedpolymerization at small chain lengths, i. e., at low degrees of monomer conversion.
To confirm the results of this thesis, the EPR strategies developed herein should beapplied to a broad range of monomer/RAFT agent combinations. Pre-polymerizedRAFT agents in conjunction with macromonomers may be used in SP-PLP-EPR-RAFT experiments to investigate a possible chain-length dependence of the individualrate coefficients, kad and kβ. For the determination of the activation energies of thesecoefficients monomers which do not undergo backbiting reactions are well suited.
The novel EPR techniques are also useful for investigating other reversible-deactiva-tion radical polymerizations, where two species taking part in the equilibrium canbe monitored by EPR spectroscopy. Recently, first SP-PLP-EPR experiments were
113

6 Closing Remarks
carried out in our laboratory to determine the deactivation rate coefficient in ATRPpolymerization. [179] EPR spectroscopy may also provide further insight into NMPand RTCP polymerization.
114

7Experimental
This chapter focuses on the synthesis of transfer agents and initiators and lists thesolvents, monomers and calibration standards used in this thesis. Experimentalprocedures and data treatment are detailed and the instrumentation employed ispresented.
7.1 Chemicals
7.1.1 Transfer agents
S-Ethyl propan-2-ylonate-S’-propyl trithiocarbonate
O
OS S
S
S-Ethyl propan-2-ylonate-S ’-propyl trithiocarbonate (EPPT, M = 252.42 g ·mol−1)was prepared according to the procedure described by Rotzoll [180] for a similar trithio-carbonate. To a solution of sodium methoxide (10.8 g, 11.4 mL, 0.05 mol, 25 wt% inmethanol) in methanol (15 mL), propanethiol (3.8 g, 4.5 mL, 0.05 mol) was addeddropwise at 0 ◦C. The reaction mixture was stirred for 2 h and carbon disulfide(3.8 g, 3.0 mL, 0.05 mol) was added. After stirring for another 3 h at 0 ◦C, ethyl-2-bromopropionate (9.1 g, 6.5 mL, 0.05 mol) was added and the mixture was stirredfor 20 h at ambient temperature. Methanol was removed in vacuo and the crude
115

7 Experimental
product was purified by column chromatography (SiO2, n-pentane, Rf : 0.17). Theproduct was isolated as a yellowish oil. According to NMR the purity was at least 98 %.
1H NMR (300 MHz, CDCl3): δ(ppm) = 1.00 (t, 3H, J =7.4 Hz, CH2–CH2–CH3),1.26 (t, 3H, J =7.1 Hz, O–CH2–CH3), 1.58 (d, 3H, J =7.4 Hz, CH–CH3), 1.72 (tq,2H, J =7.4 Hz, 7.4 Hz, CH2–CH2–CH3), 3.33 (t, 2H, J =7.4 Hz, CH2–CH2–CH3),4.17 (q, 2H, J =7.1 Hz, O–CH2–CH3), 4.79 (q, 1H, J =7.4 Hz, CH–CH3).
13C NMR (75 MHz, CDCl3): δ(ppm) = 13.6 (CH2–CH2–CH3), 14.2 (O–CH2–CH3), 17.1 (CH–CH3), 21.6 (CH2–CH2–CH3), 39.1 (CH2–CH2–CH3), 48.1 (CH–CH3), 61.9 (O–CH2–CH3), 171.2 (C=O), 222.2 (C=S).
S,S’-Bis(methyl-propion-2-ylate) trithiocarbonate
O
OS S
SO
O
S,S ’-Bis(methyl-propion-2-ylate) trithiocarbonate (BMPT, M = 282.40 g ·mol−1)was synthesized according to the procedure described by Tamami and Kiasat. [181]Dried Ambersep 900 (30 g) was dispersed in carbon disulfide (150 mL) and stirredfor approximately 10 min at ambient temperature. The anion-exchange resin changedfrom light yellow to dark red immediately. Subsequently, methyl-2-bromopropionate(10 g) as the alkylating agent was added dropwise. The reaction mixture was thenstirred at room temperature for 30 h. After filtration and extraction, the organic layerwas dried over sodium sulfate, concentrated and purified by column chromatography(SiO2, toluene). The trithiocarbonate was obtained as a yellow liquid. Its structureand purity were determined by NMR.
1H NMR (300 MHz, CDCl3): δ(ppm) = 1.58 (d, 6H, J =7.2 Hz, CH–CH3), 3.71(s, 6H, O–CH3), 4.78 (q, 2H, J =7.2 Hz, CH–CH3).
13C NMR (75 MHz, CDCl3): δ(ppm) = 17.2 (CH–CH3), 48.3 (CH–CH3), 53.2(O–CH3), 171.5 (C=O), 219.7 (C=S).
116

7.1 Chemicals
Ethyl S-thiobenzoyl-2-thiopropionate
S
S
S
O
O
O O
BMPT
S S
S
BPT
S
S
S
O
O
O O
BMiPT
O
O
S
S
O
ethyl 2-[(ethoxycarbonothioyl)thio]propanoate
MADIX1
O
O
S
S
O P
O
O
O
FF
F
MADIX2
S
S
CN
CPDB
S
S
CDB
S-S'-bis(methyl-2-propionate)-trithiocarbonateBenzylpropyltrithiocarbonate
S-S'-bis(methyl-2-isobutyrate)-trithiocarbonate
Cumyl-dithiobenzoate Cyano-isopropyl-dithiobenzoate
S
S
S
O
O
OH OH
Molecular Formula = C9H
14O
4S
3
S,S'-Bis(,'-dimethyl-''-acetic acid)-trithiocarbonate
Formula Weight = 282.40006
BDMAAT
242.42 g/mol
282.40 g/mol
310.45 g/mol
222.32496 g/mol
SS
S
O
O
Formula Weight = 412.3825716
Formula Weight = 271.4155432
ethyl 2-{[(propylthio)carbonothioyl]thio}propanoate
S
S
O
O
ethyl 2-[(phenylcarbonothioyl)thio]propanoate
254.36836
ethyl acrylate dithiobenzoateEADB
EAPT
Molecular Formula = C9H
16O
2S
3
Molecular Formula = C12
H14
O2S
2
Molecular Formula = C12
H20
F3O
6PS
2
Ethyl S-thiobenzoyl-2-thiopropionate (ETTP, M = 254.39 g ·mol−1) was synthesizedsimilar to the procedure described by Chong et al. [74] for the synthesis of a similardithiobenzoate. Phenylmagnesium bromide was prepared from bromobenzene (6.28 g,4.21 mL, 0.04 mol) and magnesium turnings (1.00 g, 0.04 mol) in dry THF (30 mL).The solution was warmed to 40 ◦C and carbon disulfide (3.05 g, 2.41 mL, 0.04 mol)was added over 15 min while maintaining the reaction temperature at 40 ◦C. Ethyl-2-bromopropionate (7.24 g, 5.20 mL, 0.04 mol) was added to the resultant dark brownsolution and the reaction temperature was raised to 80 ◦C and maintained for 60 h.Ice-water (50 mL) was added, and the organic products were extracted with diethylether (3 x 50 mL). The combined organic extracts were washed with water and brineand dried over anhydrous magnesium sulfate. After removal of solvent and purificationby column chromatography (SiO2, n-hexane/diethyl ether 9 : 1, Rf = 0.21). EthylS-thiobenzoyl-2-thiopropionate was obtained as a red oil. According to NMR thepurity was at least 98 %.
1H NMR (300 MHz, CDCl3): δ(ppm) = 1.25 (t, 3H, J =6.3 Hz, CH2–CH3), 1.64(d, 3H, J =6.6 Hz, CH–CH3), 4.21 (q, 2H, J =6.3 Hz, CH2–CH3), 4.72 (q, 1H,J =6.6 Hz, CH–CH3), 7.33–7.40 (m, 2H, C6H5), 7.49–7.58 (m, 1H, C6H5), 7.94–8.00(d, 2H, C6H5).
13C NMR (75 MHz, CDCl3): δ(ppm) = 14.1 (CH2–CH3), 16.5 (CH–CH3), 48.6(CH–CH3), 61.8 (CH2–CH3), 126.9, 128.4, 132.6, 144.4 (C6H5), 171.1 (C=O), 225.9(C=S).
ESI-HRMS m/z: [M+H]+ clcd for C12H14O2S2 255.0508, found 255.0509.
tert-Butyl dithiobenzoate
S S
tert-Butyl dithiobenzoate (TBDB,M = 210.36 g ·mol−1) was synthesized according tothe procedure described by Ladav. [65] S-(thiobenzoyl)thioglycolic acid (10 g, 47 mmol)
117

7 Experimental
was dissolved in dilute alkaline solution containing 2 eq of NaOH (3.8 g, 94 mmolin 400 mL of H2O). Then, 2-methyl-2-propanethiol (4.67 g, 52 mmol) was addedand the mixture was stirred at room temperature for a period of 20.5 h. tert-Butyldithiobenzoate, which separated out as a dark, pink oil, was extracted with diethylether (1×600 mL, 1×300 mL). The organic extracts were washed with 0.1 N aqueousNaOH (3× 330mL) and water (3× 300 mL), dried over sodium sulfate, filtered, andevaporated. The product was left overnight under vacuum (4× 10⁻² mbar, 25 ◦C) toeliminate the residual 2-methyl-2-propanethiol. The yield of tert-butyl dithiobenzoate,which remained as a dark pink oil, was 59 %.
1H NMR (300 MHz, CDCl3): δ(ppm) = 1.71 (s, 9H, C(CH3)3), 7.31–7.41 (m,2H, C6H5), 7.45–7.55 (m, 1H, C6H5), 7.86–7.92 (m, 2H, C6H5).
13C NMR (75 MHz, CDCl3): δ(ppm) = 28.3 (C(CH3)3), 52.2 (C (CH3)3), 126.7,128.1, 131.7, 147.2 (C6H4), 230.3 (C=S).
2-(2’-Cyanopropyl)-dithiobenzoate
SCN
S
2-(2’-Cyanopropyl)-dithiobenzoate (CPDB, M = 221.34 g ·mol−1) was synthesized asdescribed in literature. [85,182,183] The purity was better than 98 % as verified by 1HNMR analysis.
1H NMR (300 MHz, CDCl3): δ(ppm) = 1.92 (s, 6H, CH3), 7.37 (t, 2H, J =7.2 Hz,C6H5), 7.54 (t, 1H, J =7.2 Hz, C6H5), 7.89 (d, 2H, J =7.2 Hz, C6H5).
13C NMR (75 MHz, CDCl3): δ(ppm) = 26.7 (CH3), 42.0 (C (CH3)2C≡N), 120.2(C ≡N), 126.9, 128.8, 133.1, 144.8 (C6H5), 223.4 (C (=S)S).
EI-HRMS m/z: [M+Na]+ clcd for C11H11NS2 244.0232, found 244.0232.
118

7.1 Chemicals
Cumyl dithiobenzoate
S
S
S
O
O
O O
BMPT
S S
S
BPT
S
S
S
O
O
O O
BMiPT
O
O
S
S
O
ethyl 2-[(ethoxycarbonothioyl)thio]propanoate
MADIX1
O
O
S
S
O P
O
O
O
FF
F
MADIX2
S
S
CN
CPDB
S
S
CDB
S-S'-bis(methyl-2-propionate)-trithiocarbonateBenzylpropyltrithiocarbonate
S-S'-bis(methyl-2-isobutyrate)-trithiocarbonate
Cumyl-dithiobenzoate Cyano-isopropyl-dithiobenzoate
S
S
S
O
O
OH OH
Molecular Formula = C9H
14O
4S
3
S,S'-Bis(,'-dimethyl-''-acetic acid)-trithiocarbonate
Formula Weight = 282.40006
BDMAAT
242.42 g/mol
282.40 g/mol
310.45 g/mol
222.32496 g/mol
SS
S
O
O
Formula Weight = 412.3825716
Formula Weight = 271.4155432
ethyl 2-{[(propylthio)carbonothioyl]thio}propanoate
S
S
O
O
ethyl 2-[(phenylcarbonothioyl)thio]propanoate
254.36836
ethyl acrylate dithiobenzoateEADB
EAPT
Molecular Formula = C9H
16O
2S
3
Molecular Formula = C12
H14
O2S
2
Molecular Formula = C12
H20
F3O
6PS
2
Cumyl dithiobenzoate (CDB) was synthesized according to a literature procedure. [85]The purity was ≥ 98 % according to NMR spectroscopy.
Ethyl 2-[1-diethoxyphosphoryl-2,2,2-trifluoroethoxythio carbonylsulfanyl]propionate
O
OS
S
O
F FF
PO O
O
Ethyl 2-[1-diethoxyphosphoryl-2,2,2-trifluoroethoxythio carbonylsulfanyl] propionate(EDTCP, M = 412.38 g ·mol−1) was synthesized according to a two-step proceduredescribed by Destarac: [128] A solution of fluoral hydrate (10.0 g of a 75 % aqueoussolution, 64.6 mmol) and diethylphosphite HP(O)(OEt)2 (64.6 mmol) in triethylamine(9.0 ml, 64.6 mmol) was stirred at room temperature for 15 h. The mixture wasrapidly concentrated under partial vacuum while keeping the temperature below 40 ◦C.The residue was purified by flash chromatography (SiO2, n-heptane/acetone 10 : 1,then diethyl ether, then diethyl ether/methanol: 10 : 1) to give diethyl 2,2,2-trifluoro-1-hydroxyethylphosphonate.
A solution of this alcohol (5.0 g, 21.18 mmol) in DMF (6 ml) was added drop-wise to a suspension of sodium hydride (1.03 g of a 60 % dispersion in mineral oil,25.75 mmol) in DMF (30 ml) and cooled to 0 ◦C. After 30 min at 0 ◦C, carbondisulfide (2.65 ml, 44 mmol) was added and stirring was continued for another 15 min.Ethyl 2-bromopropionate (3.51 ml, 26.7 mmol) was added and the mixture kept at0 ◦C for 23 h. It was neutralized with saturated aqueous ammonium chloride solution,extracted three times with ethyl acetate, and the combined organic layers were driedover magnesium sulfate. The solvent was removed under vacuum and the residue waspurified by flash column chromatography (SiO2, n-hexane/ethyl acetate 7 : 3) to givethe pure product.
1H NMR (300 MHz, CDCl3): δ(ppm) = 1.23–1.40 (m, 9H, O–CH2–CH3), 1.62(d, 3H, J =6.8 Hz, CH–CH3), 4.10–4.46 (m, 7H, O–CH2–CH3, CH–CH3), 6.67 (m,1H, CH–CF3).
119

7 Experimental
13C NMR (75 MHz, CDCl3): δ(ppm) = 14.2 (C(=O)O–CH2–CH3), 16.5 (P–O–CH2–CH3), 17.2 (CH–CH3), 48.8 (CH–CH3), 62.2 (C(=O)O–CH2–CH3), 64.6 (P–O–CH2–CH3), 71.8 (CH–CF3), 121.6 (CH–CF3), 170.5 (C=O), 211.2 (C=S).
EI-MS m/z: [M+Na]+ clcd for C12H20F3O6PS2 435.0283, found 435.0294.
1-Phenylethyl dithiobenzoate
S S
1-Phenylethyl dithiobenzoate (PEDB, M = 258.40 g ·mol−1) was synthesized similarto the procedure described by Perrier. [85] Benzyl bromide (171.0 g, 1.0 mol) wasadded dropwise over two hours to a round bottomed flask containing elemental sulfur(64.1 g, 2.0 mol), 25 % sodium methoxide solution in methanol (432 g) and methanol(300 mL). The solution was refluxed for 6 h at 80 ◦C and stirred at room temperatureover night. The mixture was filtered to remove the white solid (sodium bromide) andthe methanol was removed under reduced pressure. The resulting brown solid wasdissolved in water (1200 mL) and washed three times with diethyl ether (2400 mLtotal). A final layer of diethyl ether was added to the solution and the two-phasemixture was then acidified with 37 % aqueous HCl until the aqueous layer lost itscharacteristic brown color and the top layer was deep purple. The etherous layer wasdried over magnesium sulfate and the solvent was removed under reduced pressure toyield dithiobenzoic acid as a deep purple oil.
Part of the acid (10.0 g, 64.8 mmol) was dissolved in n-pentane (300 mL) andstyrene (8.1 g, 77.8 mmol). Para-toluenesulfonic acid (0.1 g, 0.7 mmol) was added ascatalyst and the reaction mixture was stirred for 13 h at room temperature. The pro-duct was purified by column chromatography (SiO2, n-heptane) to give 1-phenylethyldithiobenzoate in 11 % yield.
1H NMR (300 MHz, CDCl3): δ(ppm) = 1.82 (d, 3H, J =7.1 Hz, CH3), 5.26 (q,1H, J =7.1 Hz, CH ), 7.28–7.38 (m, 5H, C6H5), 7.43–7.51 (m, 3H, C6H5), 7.94–7.98(m, 2H, C6H5).
13C NMR (75 MHz, CDCl3): δ(ppm) = 20.9 (CH3), 50.4 (CH), 127.0, 127.8,128.0, 128.4, 128.8, 132.4, 141.4, 145.1 (C6H5), 226.9 (C=S).
120

7.1 Chemicals
7.1.2 Initiators
2-Methyl-1-[4-(methylthio)phenyl]-2-morpholin-4-ylpropan-1-one
S
O
N
O
The photoinitiator 2-methyl-1-[4-(methylthio)phenyl]-2-morpholin-4-ylpropan-1-one(MMMP, M = 279.40 g ·mol−1, Aldrich, > 98 %) was used as received.
2,2’-Azobis(2-methylpropionitrile)
NNC
NCN
2,2’-Azobis(2-methylpropionitrile) (AIBN, M = 164.21 g ·mol−1, Akzo Nobel, 98 %)was recrystallized twice from diisopropyl ether prior to use.
Tetramethylpropyl peroxypivalate
OO
O
Tetramethylpropyl peroxypivalate (TMPPP,M = 216.32 g ·mol−1) has been providedby Akzo Nobel (Polymer Chemicals Research Center Deventer) in 90.9 % purity.
1,2-Di-tert-butyldiazene
NN
1,2-Di-tert-butyldiazene (TBDA, M = 142.24 g ·mol−1, Aldrich, 97 %) was used asreceived.
121

7 Experimental
meso-1,2-bis(1-Phenylethyl)diazene
NN
Two syntheses for the azo-initiator meso-1,2-bis(1-phenylethyl)diazene (PEDA, M =238.15 g ·mol−1) are described in literature. Smolyar [184] reported that the reactionof acetophenone oxime with hydrazine hydrate gives the azo-initiator in 99.9 % yield.However, this one-step procedure results in the exclusive formation of acetophenoneazine as can be proven by NMR.
Thus, the initiator was synthesized according to the three-step procedure describedby Daub: [185] Acetophenone (50 mL, 428 mmol), hydrazine hydrate (50–60 %, 12 mL,214 mmol) and glacial acetic acid (0.9 mL) were refluxed in ethanol (200 mL) for4 h. After cooling to room temperature acetophenone azine (> 98 % yield, Rf : 0.80in 3 : 1 toluene/ethyl acetate) precipitated as yellow crystals, which were filtered andair-dried.
Acetophenone azine (15.1 g, 63.8 mmol) was dissolved in dry ethyl acetate (500 mL)under argon atmosphere and Pd/C (10 %, 6.8 g, 6.4 mmol) was added. Subsequently,the argon atmosphere was replaced by hydrogen and the reaction mixture stirredat room temperature for 48 h. After completion of the reaction (TLC control, Rf
of 1,2-bis(1-phenylethyl)diazene: 0.28 in 3 : 1 toluene/ethyl acetate) the mixture wasfiltered over celite to remove the catalyst.
The filtrate was transferred into a round-bottomed flask and stirred under oxygenatmosphere until the reaction was completed (TLC). The solvent was evaporated at30 ◦C under reduced pressure, methanol was added and the solution stored at –10 ◦Covernight. The colorless crystals were filtered off and washed with ice-cold methanol.The product was recrystallized twice from methanol to give 3.2 g (13.4 mmol, 21 %yield from acetophenone azine, Rf : 0.72 in 3 : 1 toluene/ethyl acetate) of meso-1,2-bis(1-phenylethyl)diazene. The purity was checked by NMR.
1H NMR (300 MHz, CDCl3): δ(ppm) = 1.56 (d, 6H, J =6.8 Hz, CH–CH3), 4.66(q, 2H, J =6.8 Hz, CH–CH3), 7.28–7.47 (m, 10H, C6H5).
13C NMR (75 MHz, CDCl3): δ(ppm) = 20.4 (CH–CH3), 76.8 (CH–CH3), 127.5,128.7, 141.4 (C6H5).
122

7.2 Instrumentation
7.1.3 Miscellaneous
n-Butyl acrylate
O
O
The monomer n-butyl acrylate (BA, M = 128.17 g ·mol−1, Fluka, purum, 99.5 %,stabilized by hydroquinone monomethylether) was purified by passing over a columnfilled with inhibitor remover (Aldrich) prior to use.
(2,2,6,6-Tetramethylpiperidine-1-yl)oxyl
NO
The EPR calibration standard (2,2,6,6-tetramethylpiperidine-1-yl)oxyl (TEMPO,M = 156.25 g ·mol−1, Aldrich, 99 %) was used as received.
Solvents
The principal solvents used for the EPR studies were obtained in high quality form andwere used without further purification: Toluene (99.8 %, Sigma-Aldrich), naphthalene(≥ 99.7 %, Fluka) and benzene (99.8 %, Sigma-Aldrich).
7.2 Instrumentation
7.2.1 Electron paramagnetic resonance spectroscopy
EPR experiments were performed on a Bruker Elexsys E 500 series CW (continuouswave) spectrometer operating at X-band frequency. [186] A schematic view of thespectrometer arrangement is illustrated in Figure 7.1. The microwave bridge housesthe electromagnetic radiation source and the detector. The optical transmissioncavity is a metal box into which the sample tube is placed. It is equipped with agrid which can be opened for experiments where irradiation of the sample is required.The cavity amplifies weak signals from the sample and is characterized by its qualityfactor Q, which indicates how efficiently the cavity stores microwave energy. As Qis inversely proportional to the amount of energy lost during one microwave period,an increasing Q enhances the sensitivity of the spectrometer. The magnet tunesthe electronic energy levels and the console contains signal processing and control
123

7 Experimental
Figure 7.1. Schematic view of the EPR setup.
electronics. Temperature control was achieved via an ER 4131VT unit (Bruker) bypurging the sample cavity with nitrogen.For investigations which need a light source, additional components complete the
setup: A 500 W mercury UV lamp (LAX, Mueller Elektronik) was used for continuousirradiation of the sample and a XeF excimer laser (COMPex 102, Lambda Physik)for generating short laser pulses at 351 nm. The laser source is triggered by the pulsegenerator Quantum Composers 9314 (Scientific Instruments). The spectrometer isconnected to a computer, which is used for analyzing data as well as coordinating allthe units for acquiring a spectrum.
The spectrometer settings were carefully chosen for each set of experiments to reducepotential errors (see Section 7.3.2). For best signal-to-noise ratio a field modulationfrequency of 100 kHz was used, modulation amplitudes were varied between 0.5 and3 G, and microwave powers ranged between 2 and 20 mW. With laser energies between20 and 80 mJ per pulse and pulse repetition rates up to 20 Hz, spectra of the desiredquality were obtained. The sweep time for recording one single spectrum dependslargely on the radical concentration and ranges from 2 s to 10 min. At very lowradical concentrations, instead of the sweep time, the number of added scans wasincreased to avoid a shift in the baseline of the spectrum. The signal channel digitizerwas chosen to record full EPR spectra and the fast digitizer for acquiring time scansat a constant magnetic field value.
124

7.3 Procedures
7.2.2 Size-exclusion chromatographyProduct solutions were collected and subjected to size-exclusion chromatography (SEC)after evaporation of residual monomer and solvent. As the eluent, tetrahydrofuran forSEC (THF, Carl Roth, Rotipuran, stabilized with 2,6-di-tert-butyl-4-methylphenol)was used without further purification. Molar mass distributions were determinedby means of SEC using a Waters 515 HPLC pump, three PSS–SDV columns withnominal 5 mm particle size and pore sizes of 105, 103, and 102 Å, and a Waters2410 refractive index detector. The SEC setup was operated at 35 ◦C with a flowrate of 1 mL · min−1 and was calibrated against polystyrene standards of narrowpolydispersity (MP=800–2,000,000 g ·mol−1, Polymer Standards Service). As Mark-Houwink parameters for polyBA, K = 12.2 × 10⁻⁵ dL · g−1 and a=0.70, [187] wereused.
7.2.3 UV SpectroscopyMeasurements of the stability of RAFT agents under UV irradiation, of the RAFTagent concentrations in pre-polymerized samples, and of the decay of azo-initiatorswere performed on a Cary 100 UV-Vis spectrometer. The spectra were processed viathe spectrometer software (Bruker).
7.2.4 NMR SpectroscopyNMR spectra were recorded on a Varian Unity 300 spectrometer using CDCl3 orCDCN as the solvent. The analyte concentrations were in the range of 20–60 g·L−1.The residual proton signal of the deuterated solvent served as internal standard forthe 1H and 13C NMR spectra. The NMR data were processed with the programMestReNova 7.0.3-8830 (Mestrelab Research).
7.3 Experimental Procedures
7.3.1 Sample preparation for EPR experimentsIn case of liquid solvents the RAFT agent and the monomer were deoxygenated bythree freeze-pump-thaw cycles. The solution was mixed with the initiator in a glovebox under an argon atmosphere. The mixture was transferred into an EPR quartztube of 5 mm outer and 4 mm inner diameter. The tube was sealed with a screwcap with teflon liner and protected from light prior to the experiment. In case ofsolid solvents the RAFT agent, the initiator and the solvent were directly weighedinto the EPR tube and transferred to the glove box for deoxygenating and sealing.The volume of the samples was calculated from the filling level of the tube at thetemperature used in the experiment.
125

7 Experimental
7.3.2 Calibration of the EPR setupEPR spectroscopy is the only technique that can directly detect and quantify theconcentration of free radicals. Therefore, it plays an important role in investigatingthe RAFT equilibrium in which two radical species are present. The concentrationof intermediate radicals cannot be determined by any other experimental techniqueand the concentration of propagating radicals is only indirectly accessible throughthe polymerization rate.
The absolute radical concentration of a sample is normally obtained by comparisonwith a standard sample of known concentration. Potential errors might be reducedto 3–5 % if the calibration conditions are chosen carefully. [188] The largest source ofuncertainty has been assigned to the difference in field strength between sample andreference. [189] Therefore, several precautions were taken: The reference and samplewere positioned identically in the cavity, they were measured in sample tubes of samematerial, diameter and wall thickness, the same sample volumes were used and thereference was dissolved in the same solvent/monomer mixture as the sample. Sincethe sensitivity of the EPR spectrometer depends on several experimental parameterswhich may change with temperature, [160] EPR calibration has been carried out at theactual reaction temperatures. In addition, the same spectroscopical parameters, i. e.microwave power, modulation amplitude, sweep time, number of recorded points andtime constant, were used for sample and reference. For the correct determination ofabsolute radical concentrations it is further required to avoid signal saturation. Tocheck for the absence of saturation, the microwave power was decreased and it wasverified that the signal intensity also decreased by the square root of the microwavepower. [186]The double integral of the EPR first derivative spectrum is correlated with the
concentration of the radical. Thus, the intensities of the reference and the samplewere determined by double integration of the full spectra. In this work TEMPO wasused as calibration standard since it is a stable radical which could be dissolved in allsolvent/monomer mixtures used. In addition, its g value is close to the ones of theinvestigated radical species so that the absolute radical concentration of the sample,cS, can be calculated from Equation 7.1 [189,190]
cS = cR ·∫∫ISsc∫∫IRsc
= h1 ·∫∫
ISsc (7.1)
with cR being the concentration of the reference and∫∫ISsc and
∫∫IRsc being the
double integrals of the sample spectrum and the reference spectrum, respectively. Theindex sc refers to the recording of the spectrum via the signal channel. Equation 7.1is also valid for spectra acquired with the fast digitizer.
For determining the radical concentration of the sample from a recorded spectrumTEMPO standards were prepared. The standards contained radical concentrations
126

7.3 Procedures
close to the experimentally observed ones. The double integral of the EPR signalintensities were plotted versus TEMPO concentration to yield a straight line with theslope h1 which is the proportionality constant between cS and
∫∫ISsc.
Time scans were recorded at a constant magnetic field, Bx. Thus, the intensity ofthe recorded line has to be correlated to the double integral of the full spectrum. Fordifferent concentrations of one type of radical the double integral is plotted versusthe intensity of the signal. Both quantities should be correlated linearly according toEquation 7.2 ∫∫
ISsc = h2 · ISsc(Bx) (7.2)
The constant h2 is the slope of the regression line and characteristic for each type ofradical. Since it does not depend on the digitizer, the relation is also valid for thefast digitizer ∫∫
ISfd = h2 · ISfd(Bx) (7.3)
Since the decay of radical species was traced with the fast digitizer the sensitivityhas to be correlated with the signal channel detection. Hence, the double integralsof the TEMPO spectra recorded with the fast digitizer,
∫∫ISfd, are compared to the
ones recorded with the signal channel,∫∫ISsc using Equation 7.4∫∫
ISsc = h3 ·∫∫
ISfd (7.4)
For the EPR spectrometer used the proportional constant h3 is around 2 and inde-pendent of radical concentration and temperature.At a given time point, the radical concentration of a sample which contains one
radical species is obtained by combining Equation 7.1 to 7.4
cS(t) = h1 · h2 · h3 · ISfd(Bx)(t) (7.5)
A detailed illustration of the calibration procedure may be found in the PhD thesisof P. Hesse. [191]
7.3.3 Deconvolution of EPR spectraFor samples containing more than one radical species the calibration proceduredescribed in Section 7.3.2 has to be extended by a deconvolution procedure. Thisadditional step yields the molar fractions of all contributing radical species. It isassumed that the EPR spectrum consists of a superposition of the individual EPRcomponents. [129,192] Therefore, the spectra of the individual species needed to beknown. This was achieved by recording them under conditions where only one of theradical species was present. Subsequently, the EPR spectra were simulated eitherwith Simfonia (Bruker, version 1.25) or with EasySpin, version 3.1.6 (a Matlab
127

7 Experimental
based computational package). The simulated EPR spectra of the species were fittedto the experimental spectra using a least-squares method. Fitting was performedeither by Excel (Microsoft Office 2007) or by a Matlab code (see Appendix B).Note that a newer version of the EasySpin toolbox is now available, which includesthe fitting of a two-component spectrum. Prior to the fitting, very noisy spectra weresmoothed by applying a Fourier filter. In case where simulation of the spectrum of anindividual species was not possible, i. e. the phenylethyl radical, several EPR spectrawere coadded, further noise reduction was achieved by Fourier transformation andthe resulting spectrum was than used for least-square fitting of the mixed spectra.The deconvolution procedure is illustrated in detail in Chapter 4 and 5.
If the radical ratio stays constant during the field scan the so-obtained molarfraction of the radical, xi, can be used to calculate the time-dependent concentrationof that radical
cS,i(t) = h1 · h2,i · h3 · xi · ISfd(Bx)(t) (7.6)
During UV-initiated RAFT polymerization a high percentage of the radicals isalready destroyed during the field scan. The first laser pulse is therefore used for thetime scan and no full spectrum is available for the deconvolution procedure. In thiscase molar fractions were calculated using the concentration ratio ci/cj obtained fromseparate UV experiments:
xi = 1− xj and xj = 11 + ci/cj
(7.7)
7.3.4 Identification of side products in the model systems cyano-iso-propyl/2-(2’-cyanopropyl)-dithiobenzoate
A solution of CPDB in toluene (0.75 mol · L−1) was deoxygenated by three freeze-pump-thaw cycles. AIBN was added to the degassed solution in a glove box under anargon atmosphere to yield concentrations of 0.30 mol · L−1. The solution was filledinto a glass vial and sealed with a screw cap. The reaction mixture was stirred for18 h at 80 ◦C. After removal of the solvent and the volatile products under vacuum,the remaining product mixture was analyzed by 1H and 13C NMR for determinationof the fraction of each product. Subsequently, CPDB and TMSN were separated fromthe other products by column chromatography (SiO2, n-pentane/ethyl acetate 98 : 2).The residual side product mixture was again subjected to column chromatography(SiO2, dichloromethane/n-pentane 2 : 1) to yield the “missing step” product CPDB*as a red solid and a mixture of the cross-termination products CT1 and CT3 as ayellow oil. The isolated side products were identified via ESI-MS, 1D (1H, 13C) and2D (COSY, HSQC, HMBC) NMR spectroscopy.
128

7.3 Procedures
2,2,3,3-Tetramethylsuccinonitrile (TMSN)
NC CN
1H NMR (300 MHz, CDCl3): δ(ppm) = 1.53 (s, C–CH3).
13C NMR (75 MHz, CDCl3): δ(ppm) = 23.5 (C–CH3), 39.5 (C–CH3), 121.5(C≡N).
2,2’-((2-Cyano-2-methyl-1-phenylpropane-1,1-diyl)bis(sulfanediyl))bis(2-methyl-propanenitrile) (CT1)
S S CN
CN
NC
1H NMR (300 MHz, CDCN): δ(ppm) = 1.62 (s, 6H, C–C–CH3), 1.66 (s, 6H,S–C–CH3), 1.71 (s, 6H, S–C–CH3), 7.44 (m, 2H, C6H5), 7.46 (m, 1H, C6H5), 8.15(m, 2H, C6H5).
13C NMR (75 MHz, CDCN): δ(ppm) = 26.8 (C–C–CH3), 29.1 (S–C–CH3), 30.1(S–C–CH3), 41.9 (C–C–CH3), 44.8 (C–C–CH3), 128.9 (C6H5), 130.5 (C6H5), 131.8(C6H5).
ESI-HRMS m/z: [M+Na]+ clcd for C19H23N3S2 380.1226, found 380.1226.
2,2’-(((4-(2-Cyanopropan-2-yl)phenyl)methylene)bis(sulfanediyl))bis(2-methyl-propanenitrile) (CT3)
S S CNNC
CN
129
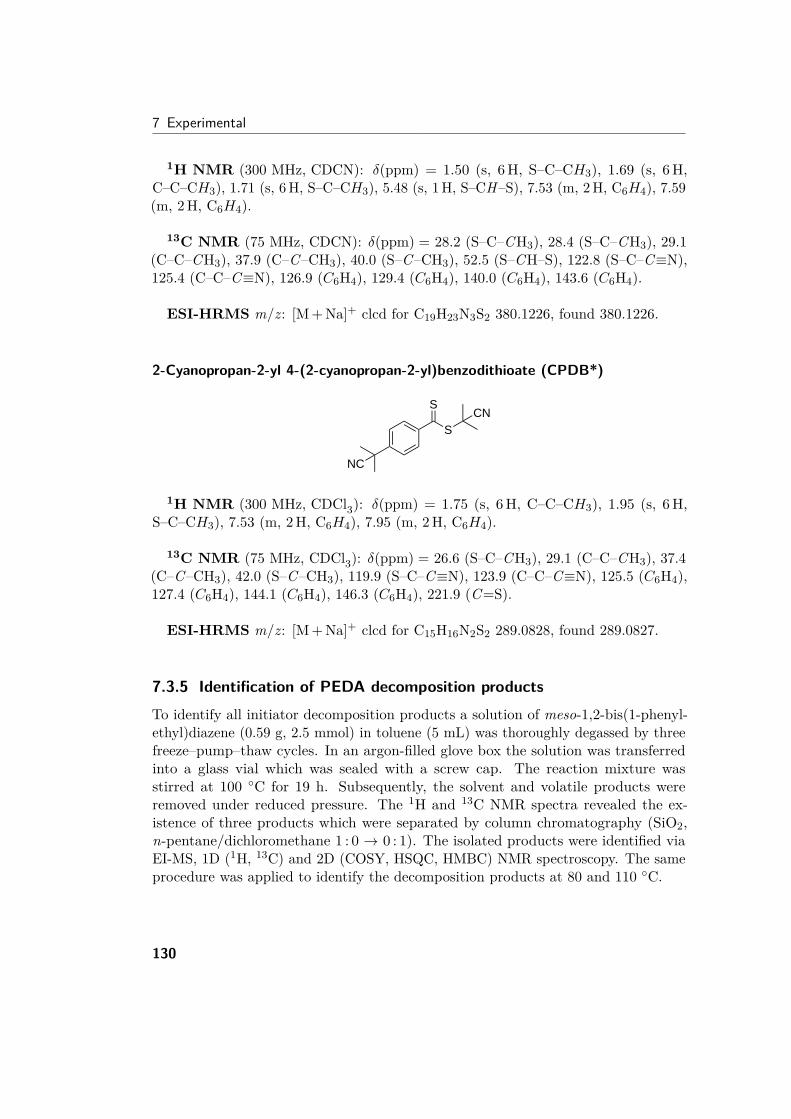
7 Experimental
1H NMR (300 MHz, CDCN): δ(ppm) = 1.50 (s, 6H, S–C–CH3), 1.69 (s, 6H,C–C–CH3), 1.71 (s, 6H, S–C–CH3), 5.48 (s, 1H, S–CH–S), 7.53 (m, 2H, C6H4), 7.59(m, 2H, C6H4).
13C NMR (75 MHz, CDCN): δ(ppm) = 28.2 (S–C–CH3), 28.4 (S–C–CH3), 29.1(C–C–CH3), 37.9 (C–C–CH3), 40.0 (S–C–CH3), 52.5 (S–CH–S), 122.8 (S–C–C≡N),125.4 (C–C–C≡N), 126.9 (C6H4), 129.4 (C6H4), 140.0 (C6H4), 143.6 (C6H4).
ESI-HRMS m/z: [M+Na]+ clcd for C19H23N3S2 380.1226, found 380.1226.
2-Cyanopropan-2-yl 4-(2-cyanopropan-2-yl)benzodithioate (CPDB*)
SCN
NC
S
1H NMR (300 MHz, CDCl3): δ(ppm) = 1.75 (s, 6H, C–C–CH3), 1.95 (s, 6H,S–C–CH3), 7.53 (m, 2H, C6H4), 7.95 (m, 2H, C6H4).
13C NMR (75 MHz, CDCl3): δ(ppm) = 26.6 (S–C–CH3), 29.1 (C–C–CH3), 37.4(C–C–CH3), 42.0 (S–C–CH3), 119.9 (S–C–C≡N), 123.9 (C–C–C≡N), 125.5 (C6H4),127.4 (C6H4), 144.1 (C6H4), 146.3 (C6H4), 221.9 (C=S).
ESI-HRMS m/z: [M+Na]+ clcd for C15H16N2S2 289.0828, found 289.0827.
7.3.5 Identification of PEDA decomposition productsTo identify all initiator decomposition products a solution of meso-1,2-bis(1-phenyl-ethyl)diazene (0.59 g, 2.5 mmol) in toluene (5 mL) was thoroughly degassed by threefreeze–pump–thaw cycles. In an argon-filled glove box the solution was transferredinto a glass vial which was sealed with a screw cap. The reaction mixture wasstirred at 100 ◦C for 19 h. Subsequently, the solvent and volatile products wereremoved under reduced pressure. The 1H and 13C NMR spectra revealed the ex-istence of three products which were separated by column chromatography (SiO2,n-pentane/dichloromethane 1 : 0 → 0 : 1). The isolated products were identified viaEI-MS, 1D (1H, 13C) and 2D (COSY, HSQC, HMBC) NMR spectroscopy. The sameprocedure was applied to identify the decomposition products at 80 and 110 ◦C.
130

7.3 Procedures
(2S,3S)-Butane-2,3-diyldibenzene and (2R,3S)-butane-2,3-diyldibenzene (BDDB1and BDDB2)
1H NMR (300 MHz, CDCl3): δ(ppm) = 1.02 (d, 6H, J =6.8 Hz, CH3), 2.80(ddq, 2H, J =6.8, 4.8, 2.4 Hz, CH ), 7.19–7.25 (m, 6H, C6H5), 7.28–7.35 (m, 4H,C6H5).
13C NMR (75 MHz, CDCl3): δ(ppm) = 21.2 (CH3), 47.4 (CH), 126.2, 127.8,128.4, 145.4 (C6H5).
EI-MS m/z: clcd for C16H18 210.1, found 210.2.
1H NMR (300 MHz, CDCl3): δ(ppm) = 1.29 (d, 6H, J =7.0 Hz, CH3), 2.95(ddq, 2H, J =7.0, 4.8, 2.1 Hz, CH ), 6.99–7.05 (m, 4H, C6H5), 7.06–7.13 (m, 2H,C6H5), 7.14–7.21 (m, 4H, C6H5).
13C NMR (75 MHz, CDCl3): δ(ppm) = 18.1 (CH3), 46.6 (CH), 125.8, 127.9,128.0, 146.0 (C6H5).
EI-MS m/z: clcd for C16H18 210.1, found 210.2.
Tris(1-phenylethyl)amine (TPEA)
N
1H NMR (300 MHz, CDCl3): δ(ppm) = 1.54 (d, 3H, J =6.9 Hz, CH3), 4.64 (q,1H, J =6.9 Hz, CH ), 7.27–7.45 (m, 5H, C6H5).
131

7 Experimental
13C NMR (75 MHz, CDCl3): δ(ppm) = 20.4 (CH3), 76.8 (CH), 127.5, 127.5,141.4 (C6H5).
15N HMBC NMR (30 MHz, CDCl3): δ(ppm) = –253.4.
7.3.6 Identification of side products in the model system phenylethyl/1-phenylethyl dithiobenzoate
PEDA (0.22 g, 0.91 mmol) was added to a solution of PEDB (0.24 g, 0.91 mmol) intoluene (2.1 mL). The solution was degassed by three freeze–pump–thaw cycles. In anargon glove box the solution was transferred into a glass vial and sealed with a screwcap. The reaction mixture was stirred at 110 ◦C for 19 h. Subsequently, the solventand volatile products were removed under reduced pressure. NMR spectra showed amixture of various products, which were separated by column chromatography (SiO2,n-heptane/ethyl acetate 99 : 1) yielding the RAFT agent, initiator decompositionproducts and a fraction which contained the side products. This side product mixturewas again subjected to column chromatography (SiO2, n-heptane) The isolatedproducts were identified via ESI-MS, 1D (1H, 13C) and 2D (COSY, HSQC, HMBC)NMR spectroscopy. The same procedure was applied to identify the side products inthe PE/PEDB model system at 80 and 100 ◦C.
(1,2-Diphenylpropane-1,1-diyl)bis((1-phenylethyl)sulfane) (CT1)
S S
1H NMR (300 MHz, CDCl3): δ(ppm) = 0.77 (d, 3H, J =7.2 Hz, CH3), 0.79(d, 3H, J =7.2 Hz, CH3), 1.07 (d, 3H, J =7.3 Hz, CH3), 1.21 (d, 3H, J =7.2 Hz,CH3), 1.22 (d, 3H, J =7.2 Hz, CH3), 1.24 (d, 3H, J =7.2 Hz, CH3), 1.37 (d, 3H,J =7.2 Hz, CH3), 1.39 (d, 3H, J =7.2 Hz, CH3), 1.65 (d, 3H, J =7.2 Hz, CH3), 1.66(d, 3H, J =7.2 Hz, CH3), 1.74 (d, 3H, J =7.4 Hz, CH3), 1.78 (d, 3H, J =7.2 Hz,CH3), 2.81 (q, 1H, J =7.0 Hz, CH ), 2.97 (q, 1H, J =7.1 Hz, CH ), 3.40 (q, 1H,J =7.0 Hz, CH ), 3.55 (q, 1H, J =7.1 Hz, CH ), 3.83 (q, 2H, J =7.3 Hz, CH ), 4.10(q, 2H, J =7.4 Hz, CH ), 4.21 (q, 1H, J =7.1 Hz, CH ), 4.30 (q, 1H, J =7.2 Hz, CH ),4.35 (q, 1H, J =7.2 Hz, CH ), 4.72 (q, 1H, J =7.4 Hz, CH ), 6.30–7.68 (m, 80H, C6H5).
132

7.3 Procedures
13C NMR (75 MHz, CDCl3): δ(ppm) = 17.7 (2C), 18.4 (2C), 23.5, 23.9, 24.8,25.2, 25.3, 25.4, 25.9, 26.1 (CH3), 44.3, 44.4, 44.7, 45.0, 45.1 (2C), 45.5, 45.8, 48.1,48.6, 49.7, 50.1 (CH), 126.0, 126.1, 126.3, 126.4, 126.6, 126.7, 126.8 (2C), 126.9, 127.0,127.1 (2C), 127.3, 127.4, 127.7, 127.8 (2C), 127.9, 128.0, 128.4, 128.5 (3C), 128.7,130.3 (2C), 130.4 (2C), 130.5, 130.7, 130.8 (2C), 136.7, 136.9, 138.6, 138.8, 140.9,141.0 (2C), 141.1, 144.4, 145.2, 145.5, 145.6, 146.0, 146.1, 146.3, 146.5 (C6H5).
Note: The quaternary carbons between the sulfur atoms are not resolved due tothe poor signal-to-noise ratio.
ESI-HRMS m/z: [M+Na]+ clcd for C31H32S2 491.1838, found 491.1831.
1-Phenylethyl 4-(1-phenylethyl)benzodithioate (PEDB*)
S
S
1H NMR (300 MHz, CDCl3): δ(ppm) = 1.63 (d, 3H, J =7.1 Hz, S–CH–CH3),1.79 (d, 3H, J =7.0 Hz, C–CH–CH3), 4.16 (q, 1H, J =7.1 Hz, S–CH–CH3), 5.25 (q,1H, J =7.0 Hz, C–CH–CH3), 7.15–7.23 (m, 5H, C6H5 or C6H4), 7.25–7.38 (m, 5H,C6H5 or C6H4), 7.40–7.45 (m, 2H, C6H5 or C6H4), 7.86–7.93 (m, 2H, C6H5 or C6H4).
13C NMR (75 MHz, CDCl3): δ(ppm) = 21.0 (C–CH–CH3), 21.6 (S–CH–CH3),127.2, 127.7, 127.7, 128.0, 128.6, 128.8 (C6H5 and C6H4).
Note: Tertiary and quaternary carbons are not resolved due to the poor signal-to-noise ratio. The red color of the compound is however suggestive of the C=S doublebond.
ESI-HRMS m/z: [M+H]+ clcd for C23H22S2 363.1236, found 363.1237.
133

7 Experimental
not yet identified product
X X
1H NMR (300 MHz, CDCl3): δ(ppm) = 1.78 (d, 3H, J =7.1 Hz, CH3), 4.97 (q,1H, J =7.1 Hz, CH ), 7.15–7.38 (m, 9H, C6H5), 7.43–7.50 (m, 1H, C6H5), 7.92–7.97(m, 2H, C6H5).
13C NMR (75 MHz, CDCl3): δ(ppm) = 22.5 (CH3), 43.2 (CH), 127.4 (2C), 127.5(3C), 128.7 (2C), 128.8 (2C), 133.5, 137.1, 142.8 (C6H5), 191.3 (C=X).
Note: The signals are very similar to PEDB, but the product is yellow and the 13Csignal is shifted from 226.9 to 191.3 ppm.
ESI-MS m/z: [M+Na]+ 265.1.
134

8Development of PREDICI models
For the accurate determination of the rate coefficients relevant to the RAFT equilibria,simulations of the complete kinetic scheme had to be performed. RAFT polymerizationwas previously studied with different modeling strategies including Monte Carlosimulations, [193] the discrete Galerkin approach, [64] and the method of moments. [45,194]
In this thesis the commercial software package Predici R© (Version 6.4.8) providedby CiT (Computing in Technology, GmbH) was used. It is based on the h-p Galerkinmethod, [195] which is a numerical method for solving differential equations employingelements of defined size, h, and polynomial degree, p. By using a commerciallyavailable software, simulation results can be compared. Predici R© works by creatinga reaction mechanism from a database of pre-defined reaction step patterns. It is ableto compute concentrations and full molecular mass distributions of polymeric speciesand includes a parameter estimation tool for fitting experimental data – a featurewhich is valuable for the determination of rate coefficients. [196]
Predici R© does not include a direct reversible reaction between macromolecules inits reaction step database. In order to implement reactions such as the addition andfragmentation reactions of RAFT, where the intermediate radical is composed of twoor three “arms” which differ in chain length, temporary chain size memory specieshave to be used. It has been shown that mathematically this approach is the same ashaving the direct reversible steps. [197–199]
The xanthate EDTCP, the trithiocarbonate EPPT and the dithiobenzoate ETTPform intermediate radicals bearing two growing chains. These intermediates aredescribed by a two-dimensional (2D) chain-length distribution. The trithiocarbonateBMPT forms an intermediate radical bearing three growing chains, which is described
135

8 Development of PREDICI models
by a three-dimensional (3D) chain-length distribution. Since Predici R© provides noreaction steps for equilibria containing two- or three-dimensional species, the 2D and3D problem have to be translated to a 1D problem. The deviation of these translationsis detailed in the following sections. To ensure that the output is correct, speciesconcentrations from the full molecular mass distribution simulation and the momentssimulation were checked for agreement.
8.1 Implementation of the 2D RAFT mechanism into PREDICI
Scheme 8.1 shows the reactions and associated rate coefficients that have beentranslated into differential equations in the program package Predici R©. The detailedkinetic scheme consists of initiation (reaction step A), propagation (M), termination(O-R3), the individual RAFT pre-equilibrium (B1-I2) and main equilibrium reactionsteps (J-L2), reinitiation of the leaving group (N), and cross-termination of theintermediate radical species (S1-Y12).The model considers 3 RAFT species and 6 INT species, which differ in their
chemical structure. A RAFT species may either bear an initiator-derived radical, I,or the leaving group, C, or a growing chain, R, whereas an intermediate radical maybear a combination of two arms, i. e. I, C and R (see Scheme 8.2). The arguments sand r refer to the chain length of the species.
An intermediate radical bearing two chemically different arms, for example INT(CI),may either fragment into an initiator-derived radical plus the original RAFT agent(reaction B2) or the leaving group and a RAFT agent bearing an initiator-derivedspecies (reaction F2). As the reaction proceeds to either one side or the other, kβ hasto be divided by two. The same is valid for the pre-equilibrium reaction steps D2,and G2 to I2.In the main equilibrium, a propagating chain adds to the macromolecular RAFT
agent to form an intermediate radical, which carries two polymeric chains that maydiffer in chain length (reaction J). The arms of the intermediate radical bearing twogrowing chains are described by a two-dimensional (2D) chain-length distribution.Since the calculation of a 2D problem requires extensive numerical efforts, the reactionsinvolving an intermediate radical, which carries two polymeric chains (J to L2 and Y1to Y12), have been translated to a 1D problem via the approach of boundary densityintegrals. The mathematical basis of this procedure is detailed by Wulkow et al. andits validity was independently verified by Gao and Zhu. [197,200,201] According to thismethod, two temporary chain size memory species, INTa(RR) and INTb(RR), havebeen introduced, each acting as a chain length memory for the macroRAFT species,RAFT(R). Similar to the pre-equilibrium, the RAFT end group may either remain onthe original growing radical chain or exchange its place to the other growing chain.
136

8.1 Implementation of the 2D RAFT mechanism into PREDICI
InitiationA I + Monomer −→ R1 ki
Pre-equilibriumB1 I + RAFT(C) −→ INT(CI) kIadB2 INT(CI) −→ I + RAFT(C) 1/2 kβ
C1 I + RAFT(I) −→ INT(II) kIadC2 INT(II) −→ I + RAFT(I) kβ
D1 I + RAFT(R)s −→ INT(RI)s kIadD2 INT(RI)s −→ I + RAFT(R)s 1/2 kβ
E1 C + RAFT(C) −→ INT(CC) kad
E2 INT(CC) −→ C + RAFT(C) kβ
F1 C + RAFT(I) −→ INT(CI) kad
F2 INT(CI) −→ C + RAFT(I) 1/2 kβ
G1 C + RAFT(R)s −→ INT(RC)s kad
G2 INT(RC)s −→ C + RAFT(R)s 1/2 kβ
H1 Rs + RAFT(C) −→ INT(RC)s kad
H2 INT(RC)s −→ Rs + RAFT(C) 1/2 kβ
I1 Rs + RAFT(I) −→ INT(RI)s kad
I2 INT(RI)s −→ Rs + RAFT(I) 1/2 kβ
Main equilibriumJ Rs + RAFT(R)r −→ INTa(RR)s + INTb(RR)r kad
K1 INTa(RR)s −→ RAFT(R)s 1/2 kβ
K2 INTa(RR)s −→ Rs 1/2 kβ
L1 INTb(RR)r −→ RAFT(R)r 1/2 kβ
L2 INTb(RR)r −→ Rr 1/2 kβ
PropagationM Rs + M −→ Rs+1 kp
ReinitiationN C + M −→ R1 kp
Scheme 8.1. Kinetic scheme for the 2D models.
137

8 Development of PREDICI models
TerminationO Rs + Rr −→ Pr+s ki,itP Rs + I −→ Ps ki,itQ Rs + C −→ Ps ki,itR1 C + C −→ CC k1,1
tR2 I + I −→ II k1,1
tR3 C + I −→ CI k1,1
t
Cross-terminationS1 INT(CI) + Rs −→ deadINT kcrosstS2 INT(CI) + I −→ deadINT kcrosstS3 INT(CI) + C −→ deadINT kcrosstT1 INT(CC) + Rs −→ deadINT kcrosstT2 INT(CC) + I −→ deadINT kcrosstT3 INT(CC) + C −→ deadINT kcrosstU1 INT(RC)s + Rr −→ deadINT kcrosstU2 INT(RC)s + I −→ deadINT kcrosstU3 INT(RC)s + C −→ deadINT kcrosstV1 INT(II) + Rs −→ deadINT kcrosstV2 INT(II) + I −→ deadINT kcrosstV3 INT(II) + C −→ deadINT kcrosstX1 INT(RI)s + Rr −→ deadINT kcrosstX2 INT(RI)s + I −→ deadINT kcrosstX3 INT(RI)s + C −→ deadINT kcrosstY1 INTa(RR)s + Rr −→ deadINT 1/2 kcrosstY2 INTa(RR)s −→ deadINT 1/2 kcrosst µ0(Rr)Y3 INTa(RR)s + I −→ deadINT 1/2 kcrosstY4 INTa(RR)s −→ deadINT 1/2 kcrosst cI
Y5 INTa(RR)s + C −→ deadINT 1/2 kcrosstY6 INTa(RR)s −→ deadINT 1/2 kcrosst cC
Scheme 8.1. (continued)
138

8.1 Implementation of the 2D RAFT mechanism into PREDICI
Cross-termination (continued)Y7 INTb(RR)s + Rr −→ deadINT 1/2 kcrosstY8 INTb(RR)s −→ deadINT 1/2 kcrosst µ0(Rr)Y9 INTb(RR)s + I −→ deadINT 1/2 kcrosstY10 INTb(RR)s −→ deadINT 1/2 kcrosst cI
Y11 INTb(RR)s + C −→ deadINT 1/2 kcrosstY12 INTb(RR)s −→ deadINT 1/2 kcrosst cC
Scheme 8.1. (continued)
O
OS
S
Z
RAFT(C)
Z =
S
S
ZN
O
RAFT(I)
O P
CF3
EtO
O
OEtS
S
S
ZR'
OO
RAFT(R)s
s
S Z
NO
S
OO
INT(RC)s
OO
S
Z
OO
SO
OZ
S
OO
INT(CI) INT(CC)
SR'
s
.. .
Scheme 8.2. All possible RAFT species and 3 of 6 possible intermediateradical species that have been considered in the kinetic scheme for BApolymerizations mediated by the xanthate EDTCP, the trithiocarbonateEPPT and the dithiobenzoate ETTP, respectively.
139

8 Development of PREDICI models
For an overall balanced process, the decomposition is implemented twice (reactionsK1 to L2) and kβ was divided by two. The change in the temporary chain size memoryspecies, INTa(RR) and INTb(RR), can be formulated as decoupled (either K1 andK2 or L1 and L2) because it is a unimolecular reaction.The approach of boundary density integrals was also applied to implement the
cross-termination reactions. The method is illustrated by example of the addition ofa propagating radical to a macroRAFT species and the subsequent termination ofthe resulting intermediate radical:
Rs + RAFT(R)rkad−−→ INT(RR)s,r
INT(RR)s,r + Rkkad−−→ deadINTs,r,k
Here Rs and RAFT(R)r describe 1D polymer distributions, INT(RR)s,r denotes a2D distribution consisting of sub-chains of lengths s and r and deadINTs,r,k refers tothe corresponding 3D distribution.This leads to the following differential equation system where the chain lengths s,
r, k are written as subscript and µ0 denotes the zero moment of a distribution:
δRsδt
= −kad · Rs · µ0(RAFT(R)r
)− kcrosst · Rs · µ0,0
(INT(RR)s,r
)(8.1)
δRAFT(R)sδt
= −kad · µ0(Rs) · RAFT(R)r (8.2)
δINT(RR)s,rδt
= kad · Rs · RAFT(R)r − kcrosst · µ0(Rs) · INT(RR)s,r (8.3)
δdeadINTs,r,kδt
= −kcrosst · Rs · INT(RR)s,r (8.4)
Since a full computation of the 2D and 3D distribution is not necessary for computingthe molecular mass distributions of Rs and RAFTr, the following boundary densityintegrals are introduced:
INTa(RR)s =∑r
INT(RR)s,r (8.5)
INTb(RR)r =∑s
INT(RR)s,r (8.6)
deadINTa(RRR)s =∑r,k
deadINT(RRR)s,r,k (8.7)
deadINTb(RRR)r =∑s,k
deadINT(RRR)s,r,k (8.8)
deadINTc(RRR)k =∑s,r
deadINT(RRR)s,r,k (8.9)
140

8.1 Implementation of the 2D RAFT mechanism into PREDICI
The overall concentration of the INT(RR)s,r species is given by:
µ0,0(INT(RR)s,r
)=∑s
∑r
INT(RR)s,r (8.10)
Using the definitions of Equation 8.5 and 8.6 we derive the following:
µ0,0(INT(RR)s,r
)=∑s
∑r
INT(RR)s,r
=∑r
INTa(RR)s =∑s
INTb(RR)r
= µ0(INTa(RR)s
)= µ0
(INTb(RR)r
) (8.11)
In the same way, the overall concentration of the deadINTs,r,k species is given by:
µ0,0,0(deadINT(RRR)s,r,k
)=∑s
∑r
∑k
deadINT(RRR)s,r,k
=∑s
deadINTa(RRR)s
=∑r
deadINTb(RRR)r
=∑k
deadINTc(RRR)k
= µ0(deadINTa(RRR)s
)= µ0
(deadINTb(RRR)r
)= µ0
(deadINTc(RRR)k
)
(8.12)
Substituting the expressions 8.5 to 8.12 into the differential equations 8.1 to 8.4yields:
δRsδt
= −kad · Rs · µ0(RAFT(R)r
)− 1
2 · kcrosst · Rs ·
(µ0(INTa(RR)s
)+ µ0
(INTb(RR)r
))(8.13)
δRAFT(R)rδt
= −kad · µ0(Rs) · RAFT(R)r (8.14)
δINTa(RR)sδt
= kad · Rs · RAFT(R)r − kcrosst · µ0(Rs) · INTa(RR)s (8.15)
δINTb(RR)sδt
= kad · Rs · RAFT(R)r − kcrosst · µ0(Rs) · INTb(RR)s (8.16)
141

8 Development of PREDICI models
δdeadINTa(RRR)sδt
= kcrosst · Rs · INTa(RR)s (8.17)
δdeadINTb(RRR)rδt
= kcrosst · Rs · INTb(RR)s (8.18)
δdeadINTc(RRR)kδt
= 12 · k
crosst · Rs ·
(µ0(INTa(RR)s
)+ µ0
(INTb(RR)r
))(8.19)
This new set of equations 8.13 to 8.19 can then be translated back to a reactionsystem:
Rs + RAFT(R)rkad−−→ INTa(RR)s + INTb(RR)r
INTa(RR)s + Rr1/2 kcross
t−−−−−→ deadINTas + deadINTcrINTa(RR)s
1/2 kcrosst µ0(Rs)
−−−−−−−−−−→ deadINTasINTb(RR)s + Rr
1/2 kcrosst−−−−−→ deadINTbs + deadINTcr
INTb(RR)s1/2 kcross
t µ0(Rs)−−−−−−−−−−→ deadINTbs
Since the concentration of the terminated intermediate radical is too low to bedetected in the reaction mixture, it was not necessary to obtain any exact values forthe termination product and the temporary chain size memory species, deadINTa,deadINTb and deadINTc, were not distinguished. Instead a general species, deadINT,was used and the reaction system obtained is described by reactions J, Y1, Y2, Y7and Y8.The same method was applied to implement the addition of an initiator-derived
radical to the intermediate radical (reactions Y3, Y4, Y9 and Y10) and the additionof the leaving group to intermediate radical (reactions Y5, Y6, Y11 and Y12).
8.2 Implementation of the 3D RAFT mechanism into PREDICI
As in the case of the 2D model the full kinetic scheme consists of initiation (reactionstep A), propagation (M), termination (O-R3), the individual RAFT pre- and mainequilibrium reaction steps (B1-L9), reinitiation of the leaving group radical (N), andcross-termination of the intermediate radical species (S1-ZC18). The reaction stepsare listed in Scheme 8.3.The model considers 6 RAFT species and 10 INT species, which differ in their
chemical structure. Scheme 8.4 shows 3 possible RAFT and INT structures, respec-tively. Each RAFT species bears a combination of 2 arms and each INT species acombination of 3 arms, with the arms being the initiator-derived radical, I, the leavinggroup, C, or a growing chain, R.
142

8.2 Implementation of the 3D RAFT mechanism into PREDICI
InitiationA I + Monomer −→ R1 ki
Pre-equilibriumB1 I + RAFT(CC) −→ INT(CCI) kIadB2 C + RAFT(CI) −→ INT(CCI) kad
B3 INT(CCI) −→ I + RAFT(CC) 1/3 kβ
B4 INT(CCI) −→ C + RAFT(CI) 2/3 kβ
C1 I + RAFT(II) −→ INT(III) kIadC2 INT(III) −→ I + RAFT(II) kβ
D1 I + RAFT(CI) −→ INT(CII) kIadD2 C + RAFT(II) −→ INT(CII) kad
D3 INT(CII) −→ I + RAFT(CI) 2/3 kβ
D4 INT(CII) −→ C + RAFT(II) 1/3 kβ
E1 I + RAFT(RI)s −→ INT(RII)s kIadE2 Rs + RAFT(II) −→ INT(RII)s kad
E3 INT(RII)s −→ I + RAFT(RI)s 2/3 kβ
E4 INT(RII)s −→ Rs + RAFT(II) 1/3 kβ
F1 I + RAFT(RC)s −→ INT(RCI)s kIadF2 C + RAFT(RI)s −→ INT(RCI)s kad
F3 Rs + RAFT(CI) −→ INT(RCI)s kad
F4 INT(RCI)s −→ I + RAFT(RC)s 1/3 kβ
F5 INT(RCI)s −→ C + RAFT(RI)s 1/3 kβ
F6 INT(RCI)s −→ Rs + RAFT(CI) 1/3 kβ
G1 C + RAFT(CC) −→ INT(CCC) kad
G2 INT(CCC) −→ C + RAFT(CC) kβ
H1 C + RAFT(RC)s −→ INT(RCC)s kad
H2 Rs + RAFT(CC) −→ INT(RCC)s kad
H3 INT(RCC)s −→ C + RAFT(RC)s 2/3 kβ
H4 INT(RCC)s −→ Rs + RAFT(CC) 1/3 kβ
Scheme 8.3. Kinetic scheme for the 3D model.
143

8 Development of PREDICI models
Pre-equilibrium (continued)I1 Rs + RAFT(RI)r −→ INTa(RRI)s + INTb(RRI)r kad
I2 I + RAFTa(RR)s −→ INTa(RRI)s 1/2 kIadI3 I + RAFTb(RR)r −→ INTb(RRI)r 1/2 kIadI4 RAFTa(RR)s −→ INTa(RRI)s 1/2 kIad cI
I5 RAFTb(RR)r −→ INTb(RRI)r 1/2 kIad cI
I6 INTa(RRI)s −→ I + RAFTa(RR)s 1/6 kβ
I7 INTa(RRI)s −→ RAFTb(RR)s 1/6 kβ
I8 INTb(RRI)r −→ I + RAFTb(RR)r 1/6 kβ
I9 INTb(RRI)r −→ RAFTa(RR)r 1/6 kβ
I10 INTa(RRI)s −→ RAFT(RI)s 1/3 kβ
I11 INTa(RRI)s −→ Rs 1/3 kβ
I12 INTb(RRI)r −→ RAFT(RI)r 1/3 kβ
I13 INTb(RRI)r −→ Rr 1/3 kβ
J1 Rs + RAFT(RC)r −→ INTa(RRC)s + INTb(RRC)s kad
J2 C + RAFTa(RR)s −→ INTa(RRC)s 1/2 kad
J3 C + RAFTb(RR)r −→ INTb(RRC)r 1/2 kad
J4 RAFTa(RR)s −→ INTa(RRC)s 1/2 kad cC
J5 RAFTb(RR)r −→ INTb(RRC)r 1/2 kad cC
J6 INTa(RRC)s −→ C + RAFTa(RR)s 1/6 kβ
J7 INTa(RRC)s −→ RAFTb(RR)s 1/6 kβ
J8 INTb(RRC)r −→ C + RAFTb(RR)r 1/6 kβ
J9 INTb(RRC)r −→ RAFTa(RR)r 1/6 kβ
J10 INTa(RRC)s −→ RAFT(RC)s 1/3 kβ
J11 INTa(RRC)s −→ Rs 1/3 kβ
J12 INTb(RRC)r −→ RAFT(RC)r 1/3 kβ
J13 INTb(RRC)r −→ Rr 1/3 kβ
Scheme 8.3. (continued)
144

8.2 Implementation of the 3D RAFT mechanism into PREDICI
Main equilibriumK1 RAFTa(RR)s + Rk −→ INTa(RRR)s + INTc(RRR)k 1/2 kad
K2 RAFTb(RR)r + Rk −→ INTb(RRR)r + INTc(RRR)k 1/2 kad
K3 RAFTa(RR)s −→ INTa(RRR)s 1/2 kad µ0(Rs)K4 RAFTb(RR)r −→ INTb(RRR)r 1/2 kad µ0(Rs)L1 INTa(RRR)s −→ RAFTa(RR)s 1/3 kβ
L2 INTa(RRR)s −→ RAFTb(RR)s 1/3 kβ
L3 INTa(RRR)s −→ Rs 1/3 kβ
L4 INTb(RRR)r −→ RAFTa(RR)r 1/3 kβ
L5 INTb(RRR)r −→ RAFTb(RR)r 1/3 kβ
L6 INTb(RRR)r −→ Rr 1/3 kβ
L7 INTc(RRR)k −→ RAFTa(RR)k 1/3 kβ
L8 INTc(RRR)k −→ RAFTb(RR)k 1/3 kβ
L9 INTc(RRR)k −→ Rk 1/3 kβ
PropagationM Rs + M −→ Rs+1 kp
ReinitiationN C + M −→ R1 kp
TerminationO Rs + Rr −→ Pr+s ki,itP Rs + I −→ Ps ki,itQ Rs + C −→ Ps ki,itR1 C + C −→ CC k1,1
tR2 I + I −→ II k1,1
tR3 C + I −→ CI k1,1
t
Scheme 8.3. (continued)
145

8 Development of PREDICI models
Cross-terminationS1 INT(CCI) + Rs −→ deadINT kcrosstS2 INT(CCI) + I −→ deadINT kcrosstS3 INT(CCI) + C −→ deadINT kcrosstT1 INT(III) + Rs −→ deadINT kcrosstT2 INT(III) + I −→ deadINT kcrosstT3 INT(III) + C −→ deadINT kcrosstU1 INT(CII) + Rs −→ deadINT kcrosstU2 INT(CII) + I −→ deadINT kcrosstU3 INT(CII) + C −→ deadINT kcrosstV1 INT(RII)s + Rr −→ deadINT kcrosstV2 INT(RII)s + I −→ deadINT kcrosstV3 INT(RII)s + C −→ deadINT kcrosstW1 INT(RCI)s + Rr −→ deadINT kcrosstW2 INT(RCI)s + I −→ deadINT kcrosstW3 INT(RCI)s + C −→ deadINT kcrosstX1 INT(CCC) + Rs −→ deadINT kcrosstX2 INT(CCC) + I −→ deadINT kcrosstX3 INT(CCC) + C −→ deadINT kcrosstY1 INT(RCC)s + Rr −→ deadINT kcrosstY2 INT(RCC)s + I −→ deadINT kcrosstY3 INT(RCC)s + C −→ deadINT kcrosstZA1 INTa(RRI)s + Rr −→ deadINT 1/2 kcrosstZA2 INTa(RRI)s −→ deadINT 1/2 kcrosst µ0(Rr)ZA3 INTa(RRI)s + I −→ deadINT 1/2 kcrosstZA4 INTa(RRI)s −→ deadINT 1/2 kcrosst cI
ZA5 INTa(RRI)s + C −→ deadINT 1/2 kcrosstZA6 INTa(RRI)s −→ deadINT 1/2 kcrosst cC
ZA7 INTb(RRI)s + Rr −→ deadINT 1/2 kcrosstZA8 INTb(RRI)s −→ deadINT 1/2 kcrosst µ0(Rr)
Scheme 8.3. (continued)
146

8.2 Implementation of the 3D RAFT mechanism into PREDICI
Cross-termination (continued)ZA9 INTb(RRI)s + I −→ deadINT 1/2 kcrosstZA10 INTb(RRI)s −→ deadINT 1/2 kcrosst cI
ZA11 INTb(RRI)s + C −→ deadINT 1/2 kcrosstZA12 INTb(RRI)s −→ deadINT 1/2 kcrosst cC
ZB1 INTa(RRC)s + Rr −→ deadINT 1/2 kcrosstZB2 INTa(RRC)s −→ deadINT 1/2 kcrosst µ0(Rr)ZB3 INTa(RRC)s + I −→ deadINT 1/2 kcrosstZB4 INTa(RRC)s −→ deadINT 1/2 kcrosst cI
ZB5 INTa(RRC)s + C −→ deadINT 1/2 kcrosstZB6 INTa(RRC)s −→ deadINT 1/2 kcrosst cC
ZB7 INTb(RRC)s + Rr −→ deadINT 1/2 kcrosstZB8 INTb(RRC)s −→ deadINT 1/2 kcrosst µ0(Rr)ZB9 INTb(RRC)s + I −→ deadINT 1/2 kcrosstZB10 INTb(RRC)s −→ deadINT 1/2 kcrosst cI
ZB11 INTb(RRC)s + C −→ deadINT 1/2 kcrosstZB12 INTb(RRC)s −→ deadINT 1/2 kcrosst cC
ZC1 INTa(RRR)s + Rr −→ deadINT 1/3 kcrosstZC2 INTa(RRR)s −→ deadINT 2/3 kcrosst µ0(Rr)ZC3 INTa(RRR)s + I −→ deadINT 1/3 kcrosstZC4 INTa(RRR)s −→ deadINT 2/3 kcrosst cI
ZC5 INTa(RRR)s + C −→ deadINT 1/3 kcrosstZC6 INTa(RRR)s −→ deadINT 2/3 kcrosst cC
ZC7 INTb(RRR)s + Rr −→ deadINT 1/3 kcrosstZC8 INTb(RRR)s −→ deadINT 2/3 kcrosst µ0(Rr)ZC9 INTb(RRR)s + I −→ deadINT 1/3 kcrosstZC10 INTb(RRR)s −→ deadINT 2/3 kcrosst cI
ZC11 INTb(RRR)s + C −→ deadINT 1/3 kcrosstZC12 INTb(RRR)s −→ deadINT 2/3 kcrosst cC
Scheme 8.3. (continued)
147

8 Development of PREDICI models
ZC13 INTc(RRR)s + Rr −→ deadINT 1/3 kcrosstZC14 INTc(RRR)s −→ deadINT 2/3 kcrosst µ0(Rr)ZC15 INTc(RRR)s + I −→ deadINT 1/3 kcrosstZC16 INTc(RRR)s −→ deadINT 2/3 kcrosst cI
ZC17 INTc(RRR)s + C −→ deadINT 1/3 kcrosstZC18 INTc(RRR)s −→ deadINT 2/3 kcrosst cC
Scheme 8.3. (continued)
O
OS
S
S
RAFT(CC)
S
S
SN
O
RAFT(CI)
S
S
SR'
OO
RAFT(RI)s
s
S
S
NO
SO
O
INT(RRR)s,r,k
OO
S
S
OO
SO
OS
S
OO
INT(RCI)s INT(CCI)
SR'
. ..
O
O
O
O
NO
R'
OO
s
NO
O
OR'
R'
s
r
k
Scheme 8.4. 3 out of 6 possible RAFT species and 3 out of 10 possibleintermediate radical species that have been considered in the kinetic schemefor BA polymerizations mediated by BMPT.
148
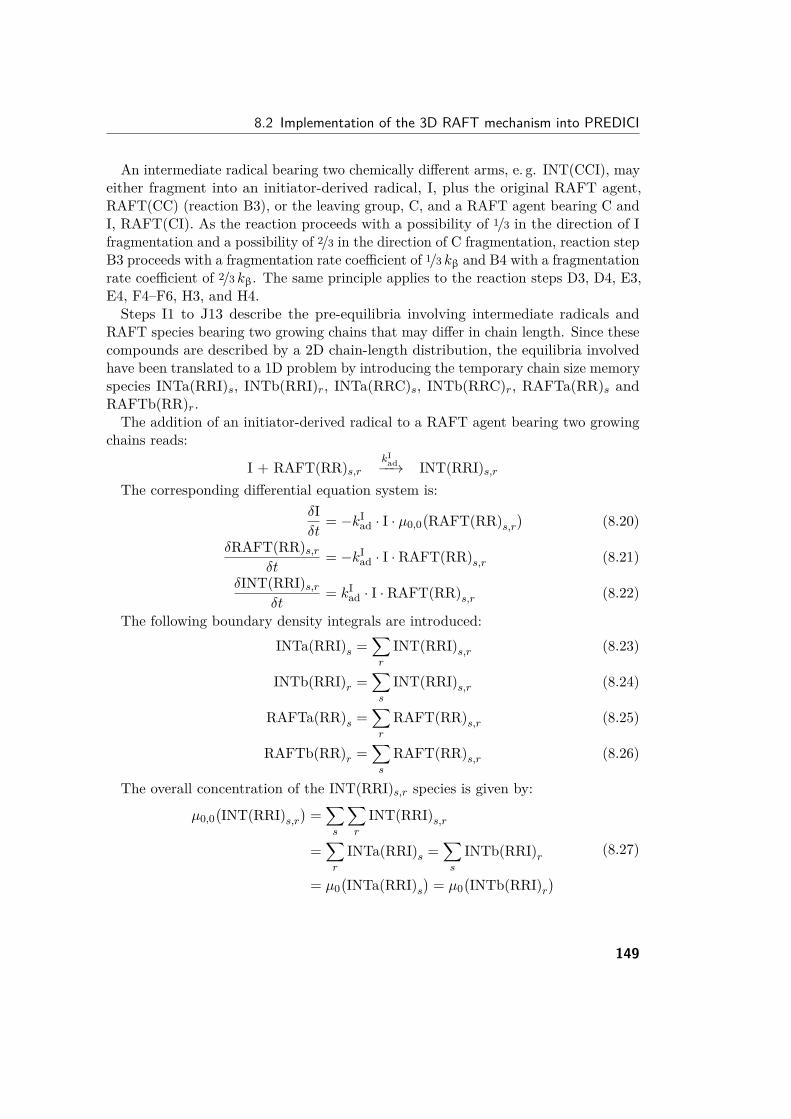
8.2 Implementation of the 3D RAFT mechanism into PREDICI
An intermediate radical bearing two chemically different arms, e. g. INT(CCI), mayeither fragment into an initiator-derived radical, I, plus the original RAFT agent,RAFT(CC) (reaction B3), or the leaving group, C, and a RAFT agent bearing C andI, RAFT(CI). As the reaction proceeds with a possibility of 1/3 in the direction of Ifragmentation and a possibility of 2/3 in the direction of C fragmentation, reaction stepB3 proceeds with a fragmentation rate coefficient of 1/3 kβ and B4 with a fragmentationrate coefficient of 2/3 kβ. The same principle applies to the reaction steps D3, D4, E3,E4, F4–F6, H3, and H4.Steps I1 to J13 describe the pre-equilibria involving intermediate radicals and
RAFT species bearing two growing chains that may differ in chain length. Since thesecompounds are described by a 2D chain-length distribution, the equilibria involvedhave been translated to a 1D problem by introducing the temporary chain size memoryspecies INTa(RRI)s, INTb(RRI)r, INTa(RRC)s, INTb(RRC)r, RAFTa(RR)s andRAFTb(RR)r.
The addition of an initiator-derived radical to a RAFT agent bearing two growingchains reads:
I + RAFT(RR)s,rkI
ad−−→ INT(RRI)s,rThe corresponding differential equation system is:
δIδt
= −kIad · I · µ0,0(RAFT(RR)s,r
)(8.20)
δRAFT(RR)s,rδt
= −kIad · I · RAFT(RR)s,r (8.21)
δINT(RRI)s,rδt
= kIad · I · RAFT(RR)s,r (8.22)
The following boundary density integrals are introduced:INTa(RRI)s =
∑r
INT(RRI)s,r (8.23)
INTb(RRI)r =∑s
INT(RRI)s,r (8.24)
RAFTa(RR)s =∑r
RAFT(RR)s,r (8.25)
RAFTb(RR)r =∑s
RAFT(RR)s,r (8.26)
The overall concentration of the INT(RRI)s,r species is given by:
µ0,0(INT(RRI)s,r
)=∑s
∑r
INT(RRI)s,r
=∑r
INTa(RRI)s =∑s
INTb(RRI)r
= µ0(INTa(RRI)s
)= µ0
(INTb(RRI)r
) (8.27)
149

8 Development of PREDICI models
The overall concentration of the RAFT(RR)s,r species is given by:
µ0,0(RAFT(RR)s,r
)=∑s
∑r
RAFT(RR)s,r
=∑r
RAFTa(RR)s =∑s
RAFTb(RR)r
= µ0(RAFTa(RR)s
)= µ0
(RAFTb(RR)r
) (8.28)
Substituting the expressions 8.23 to 8.28 into the differential equations 8.20 to 8.22yields:
δIδt
= −12 · k
Iad · I ·
(µ0(RAFTa(RR)s
)+ µ0
(RAFTb(RR)r
))(8.29)
δRAFTa(RR)sδt
= −kIad · I · RAFTa(RR)s (8.30)
δRAFTb(RR)rδt
= −kIad · I · RAFTb(RR)r (8.31)
δINTa(RRI)sδt
= kIad · I · RAFTa(RR)s (8.32)
δINTb(RRI)rδt
= kIad · I · RAFTb(RR)r (8.33)
The equation set 8.29 to 8.33 is translated back to the following reaction system:
I + RAFTa(RR)s1/2 kI
ad−−−−→ INTa(RRI)sI + RAFTb(RR)r
1/2kIad−−−−→ INTb(RRI)r
RAFTa(RR)s1/2 kI
ad cI−−−−−→ INTa(RRI)sRAFTb(RR)r
1/2 kIad cI−−−−−→ INTb(RRI)r
The same translation is applied for the addition of C to RAFT(RR)s,r and the reac-tions are described in Scheme 8.3 by steps I1 to I5 and J1 to J5, respectively.
The reaction system for the addition of a polymeric radical, Rs, to RAFT(RI)r andthe subsequent fragmentation reactions reads:
Rs + RAFT(RI)rkad−−→ INT(RRI)s,r
INT(RRI)s,r1/3 kβ−−−→ I + RAFT(RR)s,r
INT(RRI)s,r2/3 kβ−−−→ Rs + RAFT(RI)r
150

8.2 Implementation of the 3D RAFT mechanism into PREDICI
These reactions are described by the following differential equation system:
δIδt
= 13 · kβ · µ0,0
(INT(RRI)s,r
)(8.34)
δRsδt
= −kad · Rs · µ0(RAFT(RI)r
)+ 2
3 · kβ · µ0,0(INT(RRI)s,r
)(8.35)
δRAFT(RI)rδt
= −kad · µ0(Rs) · RAFT(RI)r + 23 · kβ · µ0,0
(INT(RRI)s,r
)(8.36)
δRAFT(RR)s,rδt
= 13 · kβ · µ0,0
(INT(RRI)s,r
)(8.37)
δINT(RRI)s,rδt
= kad · Rs · RAFT(RI)r − kβ · INT(RRI)s,r (8.38)
Substituting the expressions 8.23 to 8.28 into the differential equations 8.34 to 8.38yields:
δIδt
= 16 · kβ ·
(µ0(INTa(RRI)s
)+ µ0
(INTb(RRI)r
))(8.39)
δRsδt
= −kad · Rs · µ0(RAFT(RI)r
)+ 1
3 · kβ ·(µ0(INTa(RRI)s
)+ µ0
(INTb(RRI)r
))(8.40)
δRAFT(RI)rδt
= −kad · µ0(Rs) · RAFT(RI)r
+ 13 · kβ ·
(µ0(INTa(RRI)s
)+ µ0
(INTb(RRI)r
))(8.41)
δRAFTa(RR)sδt
= 16 · kβ ·
(µ0(INTa(RRI)s
)+ µ0
(INTb(RRI)r
))(8.42)
δRAFTb(RR)sδt
= 16 · kβ ·
(µ0(INTa(RRI)s
)+ µ0
(INTb(RRI)r
))(8.43)
δINTa(RRI)sδt
= kad · Rs · RAFT(RI)r − kβ · INTa(RRI)s (8.44)
δINTb(RRI)rδt
= kad · Rs · RAFT(RI)r − kβ · INTb(RRI)r (8.45)
The differential equations 8.39 to 8.45 represent the following reactions:
Rs + RAFT(RI)rkad−−→ INTa(RRI)s + INTb(RRI)r
INTa(RRI)s1/6 kβ−−−→ I + RAFTa(RR)s
INTa(RRI)s1/6 kβ−−−→ RAFTb(RR)s
INTb(RRI)r1/6 kβ−−−→ I + RAFTb(RR)r
151

8 Development of PREDICI models
INTb(RRI)r1/6 kβ−−−→ RAFTa(RR)r
INTa(RRI)s1/3 kβ−−−→ RAFT(RI)s
INTa(RRI)s1/3 kβ−−−→ Rs
INTb(RRI)r1/3 kβ−−−→ RAFT(RI)r
INTb(RRI)r1/3 kβ−−−→ Rr
This reaction scheme is illustrated by steps I1 and I6 to I13. The same translationcan be applied to the addition of Rs to RAFT(RC)r and subsequent fragmentation ofthe intermediate radicals. The corresponding reactions are given by steps J1 and J6to J13 in Scheme 8.3.
The main equilibrium consists of the one-dimensional species Rk, the two-dimensionalmacromolecular RAFT agent, RAFT(RR)s,r, and the three-dimensional macromolec-ular intermediate radical, INT(RRR)s,r,k:
RAFT(RR)s,r + Rkkad−−→ INT(RRR)s,r,k
The corresponding differential equations read:
δRAFT(RR)s,rδt
= −kad · µ0(Rk) · RAFT(RR)s,r+ kβ · µ0,0,0
(INT(RRR)s,r,k
)(8.46)
δRkδt
= −kad · Rk · µ0,0(RAFT(RR)s,r
)+ kβ · µ0,0,0
(INT(RRR)s,r,k
)(8.47)
δINT(RRR)s,r,kδt
= kad · µ0(Rk) · RAFT(RR)s,r − kβ · INT(RRR)s,r,k (8.48)
The full two- and three-dimensional distributions RAFT(RR)s,r and INT(RRR)s,r,kare not necessary for the balance of the one-dimensional species Rk. Therefore, thefollowing temporary chain size memory species are introduced:
RAFTa(RR)s =∑r
RAFT(RR)s,r (8.49)
RAFTb(RR)r =∑s
RAFT(RR)s,r (8.50)
INTa(RRR)s =∑r,k
INT(RRR)s,r,k (8.51)
152

8.2 Implementation of the 3D RAFT mechanism into PREDICI
INTb(RRR)r =∑s,k
INT(RRR)s,r,k (8.52)
INTc(RRR)k =∑s,r
INT(RRR)s,r,k (8.53)
The overall concentration of RAFT(RR)s,r species is given by:
µ0,0(RAFT(RR)s,r
)=∑s
∑r
RAFT(RR)s,r (8.54)
Using the definitions 8.49 and 8.50 we derive the following:
µ0,0(RAFT(RR)s,r
)=∑s
RAFTa(RR)s =∑r
RAFTb(RR)r
= µ0(RAFTa(RR)s
)= µ0
(RAFTb(RR)r
) (8.55)
The overall concentration of INT(RRR)s,r,k species is given by:
µ0,0,0(INT(RRR)s,r,k
)=∑s
∑r
∑k
INT(RRR)s,r,k (8.56)
Using the definitions 8.51 to 8.53 we derive the following:
µ0,0,0(INT(RRR)s,r,k
)= µ0
(INTa(RRR)s
)= µ0
(INTb(RRR)r
)= µ0
(INTc(RRR)k
) (8.57)
Applying equations 8.49 to 8.57 to the differential equation system 8.46 to 8.48yields:
δRAFTa(RR)sδt
= −kad · µ0(Rk) · RAFTa(RR)s
+ 13 · kβ ·
(µ0(INTa(RRR)s
)+ µ0
(INTb(RRR)r
)+ µ0
(INTc(RRR)k
))(8.58)
δRAFTb(RR)rδt
= −kad · µ0(Rk) · RAFTb(RR)r
+ 13 · kβ ·
(µ0(INTa(RRR)s
)+ µ0
(INTb(RRR)r
)+ µ0
(INTc(RRR)k
))(8.59)
153

8 Development of PREDICI models
δRkδt
= −kad · Rk ·(µ0(RAFTa(RR)s
)+ µ0
(RAFTb(RR)r
))+ 1
3 · kβ ·(µ0(INTa(RRR)s
)+ µ0
(INTb(RRR)r
)+ µ0
(INTc(RRR)k
))(8.60)
δINTa(RRR)sδt
= kad · µ0(Rk) · RAFTa(RR)s − kβ · INTa(RRR)s (8.61)
δINTb(RRR)rδt
= kad · µ0(Rk) · RAFTb(RR)r − kβ · INTb(RRR)r (8.62)
δINTc(RRR)kδt
= 12 · kad · Rk ·
(µ0(RAFTa(RR)s
)+ µ0
(RAFTb(RR)r
))− kβ · INTc(RRR)k (8.63)
The differential equations 8.58 to 8.63 can be translated back to a reaction system:
RAFTa(RR)s + Rk1/2 kad−−−−→ INTa(RRR)s + INTc(RRR)k
RAFTb(RR)r + Rk1/2 kad−−−−→ INTb(RRR)r + INTc(RRR)k
RAFTa(RR)s1/2 kad µ0(Rk)−−−−−−−−→ INTa(RRR)s
RAFTb(RR)r1/2 kad µ0(Rk)−−−−−−−−→ INTb(RRR)r
INTa(RRR)s1/3 kβ−−−→ RAFTa(RR)s
INTa(RRR)s1/3 kβ−−−→ RAFTb(RR)s
INTa(RRR)s1/3 kβ−−−→ Rs
INTb(RRR)r1/3 kβ−−−→ RAFTa(RR)r
INTb(RRR)r1/3 kβ−−−→ RAFTb(RR)r
INTb(RRR)r1/3 kβ−−−→ Rr
INTc(RRR)k1/3 kβ−−−→ RAFTa(RR)k
INTc(RRR)k1/3 kβ−−−→ RAFTb(RR)k
INTc(RRR)k1/3 kβ−−−→ Rk
The reaction system is given in Scheme 8.3 by steps K1 to L9.For the cross-termination reactions S1 to ZC18 the translation into the 1D model
was done in analogy to the translation in Section 8.1.
154

Appendix
A Abbreviations
a EPR hyperfine coupling constantA absorbanceAIBN azobis-iso-butyronitrileαl power-law exponent describing the chain-length dependence
of kt for long-chain radicalsαs power-law exponent describing the chain-length dependence
of kt for short-chain radicalsATRP atom transfer radical polymerization
BA n-butyl acrylateBDDB 2,3-butane-2,3-diyldibenzeneBMPT S,S ’-bis(methyl-propion-2-ylate) trithiocarbonateBPT benzyl propyl trithiocarbonateBx magnetic field
C RAFT leaving group in the Predici R© modelsCcross relative cross-termination rateCDB cumyl dithiobenzoateCDCl3 deuterated chloroformCDCN deuterated acetonitrileCIP cyano-iso-propyl radicalclcd calculatedCLRP controlled/living radical polymerizationCOSY correlation spectroscopyCPDB cyano-iso-propyl dithiobenzoateCPDB* ring-substituted CPDBCT cross-termination product
155

Appendix
CW continuous wavecX concentration of substance Xc0X initial concentration of substance X
δ chemical shift in NMR spectroscopyd doubletdeadINT cross-termination product in Predici R© modelsDNA deoxyribonucleic acidDFT density functional theoryDTBA di-tert-butylamineDTBN di-tert-butylnitroxide
Ea activation energye. g. for exampleEI-(HR)MS electron ionization (high resolution) mass spectrometryEPPT S-ethyl propan-2-ylonate-S ’-propyl trithiocarbonateEPR electron paramagnetic resonanceESI-(HR)MS electrospray ionization (high resolution) mass spectrometryet al. and othersETTP ethyl S-thiobenzoyl-2-thiopropionate
g g-factor in EPR spectroscopyg gramG Gauss
H reaction enthalpyh1, h2, h3 proportionality constants used for EPR calibrationHMBC heteronuclear multiple bond correlationHPLC high-performance liquid chromatographyHSQC heteronuclear single quantum coherenceHz hertz [s−1]
I initiator-derived radicalIBN iso-butyronitrileic crossover chain lengthi. e. that isINT RAFT intermediate radicalIRsc intensity of the EPR reference spectrum recorded with the
signal channel digitizerIRT intermediate radical terminationISsc intensity of the EPR sample spectrum recorded with the
156

A Abbreviations
signal channel digitizerISfd intensity of the EPR sample spectrum recorded with the
fast digitizerIUPAC International Union of Pure and Applied Chemistry
J NMR coupling constant
K ketenimineK Mark-Houwink parameterkad addition rate coefficientkIad addition rate coefficient for the initiator fragmentkβ fragmentation rate coefficientkd initiator decomposition rate coefficientkdiff diffusion-controlled rate coefficientKeq RAFT equilibrium constantki initiation rate coefficientkMS “missing step” rate coefficientkp propagation rate coefficientkreinp reinitiation rate coefficientkt termination rate coefficientkcrosst cross-termination rate coefficientki,it chain-length dependent termination rate coefficientk1,1t termination rate coefficient of two radicals with chain length
onekselft self-termination rate coefficient
λ wavelengthL literln natural logarithm
m meter, milli, multipletM molar massµ0 zero moment of a distributionMADIX macromolecular design via the interchange of xanthatesMALDI-TOF-MS matrix-assisted laser desorption ionization time-of-flight
mass spectrometryMAN methacrylonitrileMCR midchain radicalmJ millijouleMn number average molecular weight
157

Appendix
MNP 2-methyl-2-nitrosopropaneMMMP 2-methyl-1-[4-(methylthio)phenyl]-2-morpholin-4-ylpropan-
1-onem/z mass-to-charge ratio
η viscositynm nanometerNMP nitroxide-mediated polymerizationNMR nuclear magnetic resonanceNO nitric oxide radical
P propagating radicalPDI polydispersity indexPE phenylethyl radicalPEDA meso-1,2-bis(1-phenylethyl)diazenePEDB 1-phenylethyl dithiobenzoatePEDB* ring-substituted PEDBppm parts per millionPredici R© Polyreaction Distributions by Countable System IntegrationPSS Polymer Standards Service
Q quality factorq quartet
R leaving group radicalR ideal gas constantrad addition rateRAFT reversible addition-fragmentation chain transferrβ fragmentation rateRP radical polymerizationRp polymerization rateRSE radical stabilization energyRTCP reversible chain transfer catalyzed polymerizationrcrosst cross-termination rate
s second, singuletSEC size-exclusion chromatographySF slow fragmentationSiO2 silicaSP-PLP-EPR single pulse-pulsed laser polymerization-electron paramagnetic
resonance
158

A Abbreviations
SPR secondary propagating radical
t timet tripletT temperatureTB tert-butyl radicalTBDA 1,2-di-tert-butyldiazeneTBDB tert-butyl dithiobenzoateTEMPO (2,2,6,6-tetramethylpiperidine-1-yl)oxylTMPPP tetramethylpropyl peroxypivalateTMSN tetramethylsuccinonitrileTPEA tris(1-phenylethyl)amine
UV ultraviolet
W Watt
xX molar fraction of compound X
Z stabilizing group of the RAFT agent
159

Appendix
B Matlab Code
1 % Load EasySpin2 easyspin;3
4 % Load and display spectrum5
6 % Load spectrum from folder7 [specdat,pathdat] = uigetfile(’d:\Doktorarbeit\ESR-Experimente\*.txt’,8 ’Spektrum laden’);9 addpath(pathdat);
10 data1 = importdata(specdat);11
12 % Identify spectral data13 a=getfield(data1, ’data’);14 dimension=size(a);15 for i=1:dimension(1,1)16 B(i,1)=a(i,2);17 CorrSpec(i,1)=a(i,dimension(1,2));18 end;19
20 % Ask for measuring conditions21 rg=input(’receiver gain: ’);22 scans=input(’number of added scans: ’);23 Anfangsfeld=min(B)/10;24 Endfeld=max(B)/10;25 MwFrequenz=input(’Mikrowellenfrequenz / GHz: ’);26 np=i;27
28 % Convert field values from G to mT29 B=B/10; ...30
31 % Convert to receiver gain 5032 dimension=size(CorrSpec);33 for i=1: dimension(1,1)34 if CorrSpec(i,1) < 035 spc1(i,1)=CorrSpec(i,1)*(-1);36 spc1(i,1)=(10^(0.0502*(50-rg)+log10(spc1(i,1))))/scans;37 spc1(i,1)=spc1(i,1)*(-1);38 end;39 if CorrSpec(i,1) > 040 spc1(i,1)=(10^(0.0502*(50-rg)+log10(CorrSpec(i,1))))/scans;41 end;42 end; ...43
44 % Correction of the baseline45 CorrSpec = basecorr(spc,1,0);46 [CorrSpec,BLine] = basecorr(spc,1,0);47 clear spc;48
160

B Matlab Code
49 % Fitting of the first species50
51 % Define range where only one species is present52 Spec=[B,CorrSpec];53 plot(Spec(1:np,1),Spec(1:np,2), ’c’) ;54 v2=axis;55 disp(’Please define the range of the spectrum you like to use (by expanding)’);56 nix=input(’press any key (and RETURN) to continue’);57 clear nix;58 v=axis;59
60 startspektrum=v(1,1);61 endspektrum=v(1,2);62
63 if v2==v64 startspektrum=v(1,1)+1;65 endspektrum=v(1,2)-1;66 end;67
68 r=size(B);69 zaehler=0;70
71 for i=1:r(1,1)72 if B(i)<startspektrum73 zaehler=zaehler+1;74 end;75
76 if B(i)>startspektrum77 if B(i)<endspektrum78 nB(i-zaehler)=B(i);79 nCorrSpec(i-zaehler)=CorrSpec(i);80 end;81 end;82 end;83
84 nB=nB’;85 nCorrSpec=nCorrSpec’;86 np1=size(nB);87 np1=np1(1,1);88 close all;89
90 % g value of first radical91 gFaktor=2.0053;92
93 % Coupling constants of first radical94 A1=2.053;95 A2=0.331;96 A1= mt2mhz(A1,gFaktor);97 A2= mt2mhz(A2,gFaktor);98
161

Appendix
99 % Line width of first radical100 linewidthgaussian=0.054;101 linewidthlorenzian=0.006;102
103 % Fitting (g value)104 Sys1.g = gFaktor;105 Sys1.Nucs = ’1H, 14N’;106 Sys1.n = [6 1];107 Exp.mwFreq = MwFrequenz;108 Exp.Range = [startspektrum endspektrum];109 Exp.nPoints = np1;110 Sys1.A = [A1 A2];111 Sys1.lwpp = [linewidthgaussian linewidthlorenzian];112 Vary1.g=[0.001];113 [BestSys1,BestSpc1]=esfit(’garlic’,nCorrSpec,Sys1,Vary1,Exp);114
115 % Fitting (Coupling constants)116 clear Vary1;117 clear A1;118 clear A2;119 clear gFaktor;120 clear linewidthgaussian;121 clear linewidthlorenzian;122 clear Anfangsfeld;123 clear Endfeld;124 clear MwFrequenz;125 clear dimension;126 clear i;127 clear m;128 clear np;129 Sys1.g = BestSys1.g;130 Sys1.Nucs = BestSys1.Nucs;131 Sys1.A = BestSys1.A;132 Sys1.lwpp = BestSys1.lwpp;133 Vary1.A=[0 0.01];134 [BestSys1,BestSpc1]=esfit(’garlic’,nCorrSpec,Sys1,Vary1,Exp);135 clear Vary1;136
137 % Fitting (line width)138 Sys1.A = BestSys1.A;139 Vary1.lwpp=[0.1 0.1];140 [BestSys1,BestSpc1]=esfit(’garlic’,nCorrSpec,Sys1,Vary1,Exp);141
142 % Maximum of simulated spectrum143 IsnB=max(BestSpc1);144
145 % Maximum of experimental spectrum in selected range146 IeB=max(nCorrSpec);147 BestSpc1=BestSpc1*IeB*IsnB; ...148
162

B Matlab Code
149 % Simulate spectrum over full measuring range150 Anfangsfeld=min(B);151 Endfeld=max(B);152 np=size(B);153 np=np(1,1);154 Exp.Range=[Anfangsfeld Endfeld];155 Exp.nPoints=np;156 [x,BestSpc1b]=garlic(Sys1,Exp);157 BestSpc1b=BestSpc1b’;158
159 % Bring simulated spectrum to same intensity as BestSpc1160 zaehler=0;161 for i=1:r(1,1)162 if x(i)<startspektrum163 zaehler=zaehler+1;164 end;165
166 if x(i)>startspektrum167 if x(i)<endspektrum168 nx(i-zaehler)=x(i);169 nBestSpc1b(i-zaehler)=BestSpc1b(i);170 end;171 end;172 end;173
174 nx=nx’;175 nBestSpc1b=nBestSpc1b’;176
177 BestSpc1b=BestSpc1b*max(BestSpc1)/max(nBestSpc1b); ...178
179 % Simulate complete spectrum of first species180 Exp.Range=[325 345];181 Exp.nPoints=5000;182 [x2,BestSpc1c]=garlic(Sys1,Exp);183 BestSpc1c=BestSpc1c’;184 x2=x2’;185
186 % Bring spectrum to same itensity as fitted one187 BestSpc1c=BestSpc1c*max(BestSpc1b)/max(BestSpc1c); ...188
189 % Fitting of the second species190
191 % Substract simulated spectrum of 1st species of experimental one192 ExpSpec2=CorrSpec-BestSpc1c;193
194 % Remove noise195 y2=ExpSpec2;196 m = 5; % half-width of smoothing window197 y_sg2 = smooth(y2,m,’savgol’,2); % Savitzky-Golay moving average198
163

Appendix
199 % Coupling constants200 A1=0.134;201 A2=0.366;202 A3=0.42;203 A4=0.042;204 A1= mt2mhz(A1,BestSys1.g);205 A2= mt2mhz(A2, BestSys1.g);206 A3= mt2mhz(A3, BestSys1.g );207 A4= mt2mhz(A4, BestSys1.g );208
209 % Line width210 linewidth=0.045;211
212 % Fittting of 2nd species (g value)213 Anfangsfeld=min(B);214 Endfeld=max(B);215 np=size(B);216 np=np(1,1);217 Exp.Range=[Anfangsfeld Endfeld];218 Exp.nPoints=np;219 Sys2.Nucs = ’1H,1H,1H,1H’;220 Sys2.A = [A1 A2 A3 A4];221 Sys2.n = [2 2 1 12];222 Sys2.g = BestSys1.g;223 Sys2.lwpp = [linewidth];224 Vary2.g=[0.01];225 [BestSys2,BestSpc2]=esfit(’garlic’,y_sg2,Sys2,Vary2,Exp);226
227 % Fittting of 2nd species (Coupling constants)228 clear Vary2;229 Sys2.A = [A1 A2 A3 A4];230 Sys2.g = BestSys2.g;231 Vary2.A=[0.1 0.1 0 0];232 [BestSys2,BestSpc2]=esfit(’garlic’,y_sg2,Sys2,Vary2,Exp);233
234 clear Vary2;235 Sys2.A = BestSys2.A236 Vary2.A=[0.1 0.1 0.1 0];237 Vary2.lwpp=[0.1];238 [BestSys2,BestSpc2]=esfit(’garlic’,y_sg2,Sys2,Vary2,Exp);239
240 clear Vary2;241 Sys2.lwpp=BestSys2.lwpp;242 Sys2.A = BestSys2.A;243 Vary2.A=[0 0 0 0.1];244 Vary2.g=[0.01];245 [BestSys2,BestSpc2]=esfit(’garlic’,y_sg2,Sys2,Vary2,Exp);246
247 clear Vary2;248 Sys2.A = BestSys2.A
164

B Matlab Code
249 Vary2.A=[0.1 0.1 0.1 0.1];250 [BestSys2,BestSpc2]=esfit(’garlic’,y_sg2,Sys2,Vary2,Exp);251
252 %Spektrum der zweiten Spezies fitten (g-Wert)253 Sys2.A = BestSys2.A;254 Sys2.g = BestSys1.g;255 Vary2.g=[0.01];256 [BestSys2,BestSpc2]=esfit(’garlic’,ExpSpec2,Sys2,Vary2,Exp);257
258 %Spektrum der zweiten Spezies fitten (Kopplungskonstanten)259 clear Vary2;260 Sys2.A = [A1 A2 A3 A4];261 Sys2.g = BestSys2.g;262 Vary2.A=[0.1 0.1 0 0];263 [BestSys2,BestSpc2]=esfit(’garlic’,ExpSpec2,Sys2,Vary2,Exp); ...264
265 % Bring simulated spectrum to same itensity as ExpSpec2266 BestSpc2b=BestSpc2*max(ExpSpec2);267 BestSpc2b= BestSpc2b’;268
269 simges=BestSpc1b+BestSpc2b;270 res=CorrSpec-simges; ...271
272 % Write fitting results into a table273 Kopplungskonstanten = mhz2mt(BestSys2.A,BestSys2.g);274 BestSys2.A=Kopplungskonstanten;275 Kopplungskonstanten = mhz2mt(BestSys1.A,BestSys1.g);276 BestSys1.A=Kopplungskonstanten;277 clear Kopplungskonstanten;278
279 % Calculate the ratio of double integrals280
281 % Double integral of 1st species282 x2=10*x2;283 IntSpezies1=cumtrapz(x2,BestSpc1c);284 DIntSpezies1=cumtrapz(x2,IntSpezies1);285 maxDIntSpezies1=max(DIntSpezies1);286
287 % Double integral of 2nd species288 B=10*B;289 IntSpezies2=cumtrapz(B,BestSpc2b);290 DIntSpezies2=cumtrapz(B,IntSpezies2);291 maxDIntSpezies2=max(DIntSpezies2);292
293 % Ratio of double integrals294 VerhaeltnisINTzuP=maxDIntSpezies2/maxDIntSpezies1; ...295
296 % Display results297
298 % Substract simulated spectrum of 2nd species from experimental one
165

Appendix
299 ExpSpec1=CorrSpec-BestSpc2b;300
301 close all;302 figure303 subplot(2,2,1); plot(B,BestSpc1b,B,ExpSpec1); title(’Radikal 1’)304 subplot(2,2,2); plot(B,simges,B,CorrSpec); title(’beide Radikale’)305 subplot(2,2,3); plot(B,ExpSpec2,B,BestSpc2b); title(’Radikal 2’)306 subplot(2,2,4); plot(B,res); title(’Residuum’);307
308 figure309 subplot(2,1,1); plot(x2,BestSpc1c,x2,IntSpezies1,x2,DIntSpezies1);310 title(’Doppelintegral Radikal 1’)311 subplot(2,1,2); plot(B,BestSpc2b,B,IntSpezies2,B,DIntSpezies2);312 title(’Doppelintegral Radikal 2’)313
314 BestFit=[B,CorrSpec,BestSpc1b,BestSpc2b,simges,res];315 Doppelintegrale=[maxDIntSpezies1,maxDIntSpezies2,VerhaeltnisINTzuP];316 Spezies1ges=[x2,BestSpc1c,IntSpezies1,DIntSpezies1];317 Spezies2ges=[B,BestSpc2b,IntSpezies2,DIntSpezies2]; ...318
319 Ergebnisse=[Doppelintegrale,BestSys1.A,BestSys1.g,BestSys2.A,BestSys2.g];
166

Bibliography
[1] H.-G. Elias, An Introduction to Polymer Science, 1st Ed., VCH Weinheim,1997.
[2] L. H. Baekeland, US Patent 942 699, 1907.
[3] H. Staudinger, J. Fritschi, Helvetica Chimica Acta 1922, 5, 785–806.
[4] K. Matyjaszewski, W. A. Braunecker, Y. Gnanou, L. Leibler, MacromolecularEngineering. Precise Synthesis, Materials Properties, Applications, (Ed.: Wiley-VCH), Matyjaszewski, K, 2007.
[5] Plastics – the Facts 2011: An analysis of European plastics production, demandand recovery for 2010, www.plasticseurope.de (10.04.2012), 2011.
[6] K. Matyjaszewski, Controlled and Living Polymerization, WILEY-VCH, Chap.Radical Polymerization, 2009, 103–166.
[7] M. Semsarilar, S. Perrier, Nature Chemistry 2010, 2, 811–820.
[8] M. Szwarc, Nature 1956, 178, 1168–1169.
[9] M. Szwarc, Journal of Polymer Science Part A-Polymer Chemistry 1998, 36,IX–XV.
[10] IUPAC. Compendium of Chemical Terminology, 2nd Ed. (the "Gold Book"),compiled by A. D. McNaught and A. Wilkinson, Blackwell Scientific Publications,Oxford, 1997.
[11] C. J. Hawker, A. W. Bosman, E. Harth, Chemical Reviews 2001, 101, 3661–3688.
[12] J. S. Wang, K. Matyjaszewski, Journal of the American Chemical Society 1995,117, 5614–5615.
167

Bibliography
[13] M. Kato, M. Kamigaito, M. Sawamoto, T. Higashimura, Macromolecules 1995,28, 1721–1723.
[14] J. Chiefari, Y. K. Chong, F. Ercole, J. Krstina, J. Jeffery, T. P. T. Le, R. T. A.Mayadunne, G. F. Meijs, C. L. Moad, G. Moad, E. Rizzardo, S. H. Thang,Macromolecules 1998, 31, 5559–5562.
[15] A. Goto, H. Zushi, N. Hirai, T. Wakada, Y. Tsojii, T. Fukuda, Journal of theAmerican Chemical Society 2007, 129, 13347–13354.
[16] A. Goto, N. Hirai, K. Nagasawa, Y. Tsujii, T. Fukuda, H. Kaji, Macromolecules2010, 43, 7971–7978.
[17] A. Wolpers, L. Ackermann, P. Vana, Macromolecular Chemistry and Physics2011, 212, 259–265.
[18] D. Greszta, D. Mardare, K. Matyjaszewski, Macromolecules 1994, 27, 638–644.
[19] A. D. Jenkins, R. G. Jones, G. Moad, Pure and Applied Chemistry 2010, 82,483–491.
[20] A. B. Lowe, C. L. McCormick, Progress in Polymer Science 2007, 32, 283–351.
[21] K. J. Thurecht, A. M. Gregory, S. Villarroya, J. Zhou, A. Heise, S. M. Howdle,Chemical Communications 2006, 4383–4385.
[22] J. F. Quinn, E. Rizzardo, T. P. Davis, Chemical Commuications 2001, 11,1044–1045.
[23] Y. Wang, A.-L. Li, H. Liang, J. Lu, European Polymer Journal 2006, 42,2695–2702.
[24] C. Boyer, V. Bulmus, T. P. Davis, V. Ladmiral, J. Liu, S. Perrier, ChemicalReviews 2009, 109, 5402–5436.
[25] Y. K. Chong, T. P. T. Le, G. Moad, E. Rizzardo, S. H. Thang, Macromolecules1999, 32, 2071–2074.
[26] Y. Z. You, C. Y. Hong, W. P. Wang, W. Q. Lu, C. Y. Pan, Macromolecules2004, 37, 9761–9767.
[27] P. Relogio, M. T. Charreyre, J. P. S. Farinha, J. M. G. Martinho, C. Pichot,Polymer 2004, 45, 8639–8649.
[28] M. Stenzel-Rosenbaum, T. P. Davis, V. Chen, A. G. Fane, Journal of PolymerScience Part A-Polymer Chemistry 2001, 39, 2777–2783.
168

Bibliography
[29] V. Darcos, A. Dureault, D. Taton, Y. Gnanou, P. Marchand, A.-M. Caminade,J.-P. Majoral, M. Destarac, F. Leising, Chemical Commuications 2004, 18,2110–2111.
[30] M. H. Stenzel-Rosenbaum, T. P. Davis, A. G. Fane, V. Chen, AngewandteChemie International Edition 2001, 40, 3428–3432.
[31] C. Barner-Kowollik, M. Coote, E. Krenske, E. Izgorodina, G. Moad, T. Junkers,T. Lovestead, S. Zard, E. Rizzardo, S. Thang, A. Lowe, C. McCormick, C. Ur-bani, M. Monteiro, M. Stenzel, D. Taton, M. Destarac, Y. Li, L. Schadler,B. Benicewicz, L. Barner, S. Perrier, A. Favier, B. de Lambert, M.-T. Char-reyre, Handbook of RAFT Polymerization, (Ed.: Barner-Kowollik, Christopher),Wiley-VCH, 2008.
[32] A. W. York, S. E. Kirkland, C. L. McCormick, Advanced Drug Delivery Reviews2008, 60, 1018–1036.
[33] M. H. Stenzel, Chemical Communications 2008, 3486–3503.
[34] C. Barner-Kowollik, H. Dalton, T. P. Davis, M. H. Stenzel, Angewandte ChemieInternational Edition 2003, 42, 3664–3668.
[35] X. Hao, M. H. Stenzel, C. Barner-Kowollik, T. P. Davis, E. Evans, Polymer2004, 45, 7401–7415.
[36] M. L. Coote, L. Radom, Journal of the American Chemical Society 2003, 125,1490–1491.
[37] M. L. Coote, Macromolecules 2004, 37, 5023–5031.
[38] M. L. Coote, Journal of Physical Chemistry A 2005, 109, 1230–1239.
[39] M. L. Coote, E. I. Izgorodina, E. H. Krenske, M. Busch, C. Barner-Kowollik,Macromolecular Rapid Communications 2006, 27, 1015–1022.
[40] M. L. Coote, E. H. Krenske, E. I. Izgorodina, Macromolecular Rapid Communi-cations 2006, 27, 473–497.
[41] C. Y. Lin, M. L. Coote, Australian Journal of Chemistry 2009, 62, 1479–1483.
[42] A. Feldermann, M. L. Coote, M. H. Stenzel, T. P. Davis, C. Barner-Kowollik,Journal of the American Chemical Society 2004, 126, 15915–15923.
[43] C. Barner-Kowollik, J. F. Quinn, D. R. Morsley, T. P. Davis, Journal of PolymerScience Part A-Polymer Chemistry 2001, 39, 1353–1365.
169

Bibliography
[44] C. Barner-Kowollik, M. L. Coote, T. P. Davis, L. Radom, P. Vana, Journal ofPolymer Science Part A-Polymer Chemistry 2003, 41, 2828–2832.
[45] A. R. Wang, S. P. Zhu, Journal of Polymer Science Part A-Polymer Chemistry2003, 41, 1553–1566.
[46] A. R. Wang, S. P. Zhu, Y. W. Kwak, A. Goto, T. Fukuda, M. S. Monteiro,Journal of Polymer Science Part A-Polymer Chemistry 2003, 41, 2833–2839.
[47] G. Moad, J. Chiefari, Y. K. Chong, J. Krstina, R. T. A. Mayadunne, A. Postma,E. Rizzardo, S. H. Thang, Polymer International 2000, 49, 993–1001.
[48] M. J. Monteiro, H. de Brouwer, Macromolecules 2001, 34, 349–352.
[49] M. Buback, P. Vana, Macromolecular Rapid Communications 2006, 27, 1299–1305.
[50] Y. Kwak, A. Goto, Y. Tsujii, Y. Murata, K. Komatsu, T. Fukuda, Macro-molecules 2002, 35, 3026–3029.
[51] P. Vana, C. Barner-Kowollik, T. P. Davis, K. Matyjaszewski, Encyclopedia OfPolymer Science and Technology, 3rd Ed., Wiley-Interscience, Hoboken, Vol. 11,Chap. Radical Polymerization, 2003, 359–472.
[52] A. Alberti, M. Benaglia, M. Laus, D. Macciantelli, K. Sparnacci, Macromolecules2003, 36, 736–740.
[53] A. Alberti, M. Benaglia, H. Fischer, M. Guerra, M. Laus, D. Macciantelli,A. Postma, K. Sparnacci, Helvetica Chimica Acta 2006, 89, 2103–2118.
[54] D. G. Hawthorne, G. Moad, E. Rizzardo, S. H. Thang, Macromolecules 1999,32, 5457–5459.
[55] M. Drache, G. Schmidt-Naake, M. Buback, P. Vana, Polymer 2005, 46, 8483–8493.
[56] E. Chernikova, A. Morozov, E. Leonova, E. Garina, V. Golubev, C. O. Bui,B. Charleux, Macromolecules 2004, 37, 6329–6339.
[57] F. Calitz, M. P. Tonge, R. D. Sanderson, Macromolecules 2003, 36, 5–8.
[58] F. M. Calitz, J. B. McLeary, J. M. McKenzie, M. P. Tonge, B. Klumperman,R. D. Sanderson, Macromolecules 2003, 36, 9687–9690.
[59] T. Junkers, PhD thesis, Georg-August-Universität Göttingen, 2006.
170

Bibliography
[60] R. Rotzoll, PhD thesis, Georg-August-Universität Göttingen, 2011.
[61] S. W. Benson, A. M. North, Journal of the American Chemical Society 1959,81, 1339–1345.
[62] S. W. Benson, A. M. North, Journal of the American Chemical Society 1962,84, 935–940.
[63] R. T. A. Mayadunne, E. Rizzardo, J. Chiefari, Y. K. Chong, G. Moad, S. H.Thang, Macromolecules 1999, 32, 6977–6980.
[64] C. Barner-Kowollik, J. F. Quinn, T. L. U. Nguyen, J. P. A. Heuts, T. P. Davis,Macromolecules 2001, 34, 7849–7857.
[65] C. Ladaviere, N. Dorr, J. P. Claverie, Macromolecules 2001, 34, 5370–5372.
[66] A. Goto, K. Sato, Y. Tsujii, T. Fukuda, G. Moad, E. Rizzardo, S. H. Thang,Macromolecules 2001, 34, 402–408.
[67] M. Destarac, D. Charmot, X. Franck, S. Z. Zard, Macromolecular Rapid Com-munications 2000, 21, 1035–1039.
[68] M. S. Donovan, A. B. Lowe, B. S. Sumerlin, C. L. McCormick, Macromolecules2002, 35, 4123–4132.
[69] M. S. Donovan, T. A. Sanford, A. B. Lowe, B. S. Sumerlin, Y. Mitsukami, C. L.McCormick, Macromolecules 2002, 35, 4570–4572.
[70] R. Severac, P. Lacroix-Desmazes, B. Boutevin, Polymer International 2002, 51,1117–1122.
[71] E. Rizzardo, J. Chiefari, R. T. A. Mayadunne, G. Moad, S. H. Thang, ACSSymposia Series 2000, 768, 278–296.
[72] B. S. Sumerlin, M. S. Donovan, Y. Mitsukami, A. B. Lowe, C. L. McCormick,Macromolecules 2001, 34, 6561–6564.
[73] J. Chiefari, R. T. A. Mayadunne, C. L. Moad, G. Moad, E. Rizzardo, A. Postma,M. A. Skidmore, S. H. Thang, Macromolecules 2003, 36, 2273–2283.
[74] Y. K. Chong, J. Krstina, T. P. T. Le, G. Moad, A. Postma, E. Rizzardo, S. H.Thang, Macromolecules 2003, 36, 2256–2272.
[75] M. Benaglia, E. Rizzardo, A. Alberti, M. Guerra, Macromolecules 2005, 38,3129–3140.
171

Bibliography
[76] R. T. A. Mayadunne, E. Rizzardo, J. Chiefari, J. Krstina, G. Moad, A. Postma,S. H. Thang, Macromolecules 2000, 33, 243–245.
[77] R. Francis, A. Ajayaghosh, Macromolecules 2000, 33, 4699–4704.
[78] G. Moad, E. Rizzardo, S. H. Thang, Australian Journal of Chemistry 2009, 62,1402–1472.
[79] G. Moad, E. Rizzardo, S. H. Thang, Australian Journal of Chemistry 2006, 59,669–692.
[80] J. B. McLeary, J. M. McKenzie, M. P. Tonge, R. D. Sanderson, B. Klumperman,Chemical Commuications 2004, 17, 1950–1951.
[81] J. B. McLeary, F. M. Calitz, J. M. McKenzie, M. P. Tonge, R. D. Sanderson,B. Klumperman, Macromolecules 2004, 37, 2383–2394.
[82] G. Pound, J. B. McLeary, J. M. McKenzie, R. F. M. Lange, B. Klumperman,Macromolecules 2006, 39, 7796–7797.
[83] E. T. A. van den Dungen, H. Matahwa, J. B. McLeary, R. D. Sanderson,B. Klumperman, Journal of Polymer Science Part A-Polymer Chemistry 2008,46, 2500–2509.
[84] B. Klumperman, E. T. A. van den Dungen, J. P. A. Heuts, M. M. J, Macro-molecular Rapid Communications 2010, 31, 1846–1862.
[85] S. Perrier, C. Barner-Kowollik, J. F. Quinn, P. Vana, T. P. Davis,Macromolecules2002, 35, 8300–8306.
[86] C. Barner-Kowollik, M. Buback, B. Charleux, M. L. Coote, M. Drache,T. Fukuda, A. Goto, B. Klumperman, A. B. Lowe, J. B. Mcleary, G. Moad,M. J. Monteiro, R. D. Sanderson, M. P. Tonge, P. Vana, Journal of PolymerScience Part A-Polymer Chemistry 2006, 44, 5809–5831.
[87] M. J. Monteiro, Journal of Polymer Science Part A-Polymer Chemistry 2005,43, 3189–3204.
[88] M. Buback, W. Meiser, P. Vana, Australian Journal of Chemistry 2009, 62,1484–1487.
[89] T. P. Davis, C. Barner-Kowollik, T. L. U. Nguyen, M. H. Stenzel, J. F. Quinn,P. Vana, ACS Symposia Series 2003, 854, 551–569.
[90] Y. Kwak, A. Goto, T. Fukuda, Macromolecules 2004, 37, 1219–1225.
172

Bibliography
[91] M. P. Tonge, F. M. Calitz, R. D. Sanderson, Macromolecular Chemistry andPhysics 2006, 207, 1852–1860.
[92] R. Venkatesh, B. B. P. Staal, B. Klumperman, M. J. Monteiro, Macromolecules2004, 37, 7906–7917.
[93] P. Geelen, B. Klumperman, Macromolecules 2007, 40, 3914–3920.
[94] Y. W. Luo, R. Wang, L. Yang, B. Yu, B. G. Li, S. P. Zhu, Macromolecules2006, 39, 1328–1337.
[95] K. Suzuki, Y. Nishimura, Y. Kanematsu, Y. Masuda, S. Satoh, H. Tobita,Macromolecular Reaction Engineering 2012, 6, 17–23.
[96] H. Tobita, Macromolecular Theory and Simulations 2011, 20, 709–720.
[97] E. I. Izgorodina, M. L. Coote, Macromolecular Theory and Simulations 2006,15, 394–403.
[98] C. Y. Lin, M. L. Coote, Australian Journal of Chemistry 2011, 64, 747–756.
[99] C. Barner-Kowollik, P. Vana, J. F. Quinn, T. P. Davis, Journal of PolymerScience Part A-Polymer Chemistry 2002, 40, 1058–1063.
[100] E. Chernikova, V. Golubev, A. Filippov, C. Y. Lin, M. L. Coote, PolymerChemistry 2010, 1, 1437–1440.
[101] P. Vana, L. Albertin, L. Barner, T. P. Davis, C. Barner-Kowollik, Journal ofPolymer Science Part A-Polymer Chemistry 2002, 40, 4032–4037.
[102] A. A. Toy, P. Vana, T. P. Davis, C. Barner-Kowollik, Macromolecules 2004, 37,744–751.
[103] A. Feldermann, A. A. Toy, T. P. Davis, M. H. Stenzel, C. Barner-Kowollik,Polymer 2005, 46, 8448–8457.
[104] C. Barner-Kowollik, T. Junkers, Journal of Polymer Science Part A-PolymerChemistry 2011, 49, 1293–1297.
[105] M. Buback, O. Janssen, R. Oswald, S. Schmatz, P. Vana, MacromolecularSymposia 2007, 248, 158–167.
[106] G. Moad, Y. K. Chong, R. Mulder, E. Rizzardo, S. H. Thang, ACS SymposiumSeries 2009, k.a., 1–15.
[107] T. Junkers, C. Barner-Kowollik, M. L. Coote, Macromolecular Rapid Commu-nications 2011, 32, 1891–1898.
173

Bibliography
[108] T. Junkers, Journal of Polymer Science Part A-Polymer Chemistry 2011, 49,4154–4163.
[109] D. Konkolewicz, B. Hawkett, A. Gray-Weale, S. Perrier, Macromolecules 2008,41, 6400–6412.
[110] D. Konkolewicz, B. S. Hawkett, A. Gray-Weale, S. Perrier, Journal of PolymerScience Part A-Polymer Chemistry 2009, 47, 3455–3466.
[111] S. R. S. Ting, T. P. Davis, P. B. Zetterlund, Macromolecules 2011, 44, 4187–4193.
[112] M. G. Froehlich, P. Vana, G. Zifferer, Journal of Chemical Physics 2007, 127,1649061–1649067.
[113] D. Boschmann, R. Edam, P. J. Schoenmakers, P. Vana, Polymer 2008, 49,5199–5208.
[114] B. Friedman, B. O’Shaughnessy, Macromolecules 1993, 26, 5726–5739.
[115] A. R. Khokhlov, Makromolekulare Chemie - Rapid Communications 1981, 2,633–636.
[116] F. R. Mayo, Journal of the American Chemical Society 1943, 65, 2324–2329.
[117] A. Goto, T. Fukuda, Progress in Polymer Science 2004, 29, 329–385.
[118] J. Barth, M. Buback, W. Meiser, P. Vana, Macromolecules 2010, 43, 51–54.
[119] J. Barth, M. Buback, P. Hesse, T. Sergeeva, Macromolecules 2010, 43, 4023–4031.
[120] M. Buback, P. Hesse, T. Junkers, P. Vana, Macromolecular Rapid Communica-tions 2006, 27, 182–187.
[121] M. Buback, A. Kuelpmann, Macromolecular Chemistry and Physics 2003, 204,632–637.
[122] W. Meiser, M. Buback, J. Barth, P. Vana, Polymer 2010, 51, 5977–5982.
[123] D. Charmot, P. Corpart, H. Adam, S. Z. Zard, T. Biadatti, G. Bouhadir,Macromolecular Symposia 2000, 150, 23–32.
[124] M. Buback, H. Frauendorf, F. Guenzler, P. Vana, Polymer 2007, 48, 5590–5598.
[125] M. Buback, H. Frauendorf, O. Janssen, P. Vana, Journal of Polymer SciencePart A-Polymer Chemistry 2008, 46, 6071–6081.
174

Bibliography
[126] M. H. Stenzel, L. Cummins, G. E. Roberts, T. P. Davis, P. Vana, C. Barner-Kowollik, Macromolecular Chemistry and Physics 2003, 204, 1160–1168.
[127] D. Boschmann, P. Vana, Polymer Bulletin 2005, 53, 231–242.
[128] M. Destarac, W. Bzducha, D. Taton, I. Gauthier-Gillaizeau, S. Z. Zard, Macro-molecular Rapid Communications 2002, 23, 1049–1054.
[129] R. X. E. Willemse, A. M. van Herk, E. Panchenko, T. Junkers, M. Buback,Macromolecules 2005, 38, 5098–5103.
[130] M. Buback, C. H. Kurz, C. Schmaltz, Macromolecular Chemistry and Physics1998, 199, 1721–1727.
[131] H. Fischer, L. Radom, Angewandte Chemie-International Edition 2001, 40,1340–1371.
[132] W. Meiser, J. Barth, M. Buback, H. Kattner, P. Vana, Macromolecules 2011,44, 2474–2480.
[133] N. T. McManus, A. Penlidis, M. A. Dube, Polymer 2002, 43, 1607–1614.
[134] M. L. Coote, T. P. Davis, Macromolecules 1999, 32, 4290–4298.
[135] J. B. L. de Kock, PhD thesis, Technical University of Eindhoven, 1999.
[136] A. A. Gridnev, S. D. Ittel, Macromolecules 1996, 29, 5864–5874.
[137] F. S. Du, M. Q. Zhu, H. Q. Guo, Z. C. Li, F. M. Li, M. Kamachi, A. Kajiwara,Macromolecules 2002, 35, 6739–6741.
[138] C. Barner-Kowollik, F. Guenzler, T. Junkers, Macromolecules 2008, 41, 8971–8973.
[139] N. Ahmad, B. Charleux, C. Farcet, C. Ferguson, S. Gaynor, B. Hawkett,F. Heatley, B. Klumperman, D. Konkolewicz, P. Lovell, K. Matyjaszewski,R. Venkatesh, Macromolecular Rapid Communications 2009, 30, 2002–2021.
[140] J. Barth, M. Buback, P. Hesse, T. Sergeeva, Macromolecular Rapid Communi-cations 2009, 30, 1969–1974.
[141] J. M. Asua, S. Beuermann, M. Buback, P. Castignolles, B. Charleux, R. G.Gilbert, R. A. Hutchinson, J. R. Leiza, A. N. Nikitin, J. P. Vairon, A. M. vanHerk, Macromolecular Chemistry and Physics 2004, 205, 2151–2160.
[142] J. B. Levy, B. K. W. Copeland, Journal of the American Chemical Society1960, 82, 5314–5318.
175

Bibliography
[143] S. Jauer, PhD thesis, Georg-August-Universität Göttingen, 2005.
[144] M. Buback, B. Fischer, S. Hinrichs, S. Jauer, J. Meijer, J. Sandmann, Macro-molecular Chemistry and Physics 2007, 208, 772–783.
[145] M. Buback, J. Sandmann, Zeitschrift fuer Physikalische Chemie–InternationalJournal of Research in Physical Chemistry & Chemical Physics 2000, 214,583–607.
[146] M. Buback, D. Nelke, H. P. Vogele, Zeitschrift fuer Physikalische Chemie–International Journal of Research in Physical Chemistry & Chemical Physics2003, 217, 1169–1191.
[147] W. Meiser, M. Buback, Macromolecular Rapid Communications 2011, 32,1490–1494.
[148] W. Meiser, M. Buback, Macromolecular Rapid Communications 2012, DOI:10.1002/marc.201200068.
[149] G. Moad, J. Chiefari, R. T. A. Mayadunne, C. L. Moad, A. Postma, E. Rizzardo,S. H. Thang, Macromolecular Symposia 2002, 182, 65–80.
[150] S. Houshyar, D. J. Keddie, G. Moad, R. J. Mulder, S. Saubern, J. Tsanaktsidis,Polymer Chemistry 2012, DOI: 10.1039/C2PY00529H.
[151] AKZO Nobel Chemicals, Initiators for High Polymers, 2006.
[152] D. J. Henry, M. L. Coote, R. Gomez-Balderas, L. Radom, Journal of theAmerican Chemical Society 2004, 126, 1732–1740.
[153] A. Theis, A. Feldermann, N. Charton, M. H. Stenzel, T. P. Davis, C. Barner-Kowollik, Macromolecules 2005, 38, 2595–2605.
[154] T. Junkers, A. Theis, M. Buback, T. P. Davis, M. H. Stenzel, P. Vana, C. Barner-Kowollik, Macromolecules 2005, 38, 9497–9508.
[155] A. Theis, A. Feldermann, N. Charton, T. P. Davis, M. H. Stenzel, C. Barner-Kowollik, Polymer 2005, 46, 6797–6809.
[156] T. Arita, M. Buback, O. Janssen, P. Vana, Macromolecular Rapid Communica-tions 2004, 25, 1376–1381.
[157] T. Arita, M. Buback, P. Vana, Macromolecules 2005, 38, 7935–7943.
[158] J. F. Quinn, L. Barner, C. Barner-Kowollik, E. Rizzardo, T. P. Davis, Macro-molecules 2002, 35, 7620–7627.
176

Bibliography
[159] P. Vana, T. P. Davis, C. Barner-Kowollik, Macromolecular Theory and Simula-tions 2002, 11, 823–835.
[160] M. P. Tonge, A. Kajiwara, M. Kamachi, R. G. Gilbert, Polymer 1998, 39,2305–2313.
[161] B. Yamada, M. Kageoka, T. Otsu, Macromolecules 1991, 24, 5234–5236.
[162] B. Yamada, S. Tagashira, K. Sakamoto, Y. Nagano, Y. Miura, Polymer Bulletin1997, 38, 339–346.
[163] J. Barth, M. Buback, Macromolecular Rapid Communications 2009, 30, 1805–1811.
[164] P. D. Sullivan, N. A. Brette, Journal of Physical Chemistry 1975, 79, 474–479.
[165] G. Clouet, P. Chaffanjon, Journal of Macromolecular Science - Chemistry 1990,A27, 193–212.
[166] S. G. Cohen, C. H. Wang, Journal of the American Chemical Society 1953, 75,5504–5507.
[167] A. Beer, Annalen der Physik und Chemie 1852, 86, 78–88.
[168] M. von Smoluchowski, Zeitschrift für Physikalische Chemie 1917, 92, 129–168.
[169] F. J. V. Santos, C. A. N. de Castro, J. H. Dymond, N. K. Dalaouti, M. J. Assael,A. Nagashima, Journal of Physical and Chemical Reference Data 2006, 35, 1–8.
[170] H. de Brouwer, M. A. J. Schellekens, B. Klumperman, M. J. Monteiro, A. L.German, Journal of Polymer Science Part A-Polymer Chemistry 2000, 38,3596–3603.
[171] D. R. Lide, Handbook of Chemistry and Physics, 84 Ed., CRC Press, 2004.
[172] D. Griller, K. U. Ingold, Accounts of Chemical Research 1976, 9, 13–19.
[173] M. L. Coote, C. Y. Lin, A. L. J. Beckwith, A. A. Zavitsas, Physical ChemistryChemical Physics 2010, 12, 9597–9610.
[174] C. Y. Lin, S. R. A. Marque, K. Matyjaszewski, M. L. Coote, Macromolecules2011, 44, 7568–7583.
[175] P. Vana, Macromolecular Symposia 2007, 248, 71–81.
[176] J. Oliveira, personal communication, 2012.
177

Bibliography
[177] A. Schlieper, personal communication, 2012.
[178] G. Smith, G. Russell, J. Heuts, Macromolecular Theory and Simulations 2003,12, 299–314.
[179] N. Soerensen, J. Barth, M. Buback, J. Morick, H. Schroeder, K. Matyjaszewski,Macromolecules 2012, 45, 3797–3801.
[180] R. Rotzoll, P. Vana, Journal of Polymer Science Part A-Polymer Chemistry2008, 46, 7656–7666.
[181] B. Tamami, A. R. Kiasat, Journal of Chemical Research-S 1998, 8, 454–455.
[182] G. Bouhadir, N. Legrand, B. Quiclet-Sire, S. Z. Zard, Tetrahedron Letters 1999,40, 277–280.
[183] W. G. Weber, J. B. McLeary, R. D. Sanderson, Tetrahedron Letters 2006, 47,4771–4774.
[184] N. N. Smolyar, Russian Journal of Organic Chemistry 2010, 46, 122–125.
[185] G. H. Daub, L. F. Cannizzo, Journal of Organic Chemistry 1982, 47, 5034–5035.
[186] J. J. Jiang, R. T. Weber, Bruker Elexsys E 500 User’s Manual, 2001.
[187] R. A. Hutchinson, J. H. McMinn, D. A. Paquet, S. Beuermann, C. Jackson,Industrial & Engineering Chemistry Research 1997, 36, 1103–1113.
[188] M. Mazur, Analytica Chimica Acta 2006, 561, 1–15.
[189] A. Lund, M. Shiotani, S. Shimada, Principles and Applications of ESR Spec-troscopy, 1st Ed., Springer Science + Business Media, 2011, 430.
[190] V. Y. Nagy, Analytica Chimica Acta 1997, 339, 1–11.
[191] P. Hesse, PhD thesis, Georg-August-Universität Göttingen, 2008.
[192] E. Sato, T. Emoto, P. B. Zetterlund, B. Yamada, Macromolecular Chemistryand Physics 2004, 205, 1829–1839.
[193] H. Chaffey-Millar, D. Stewart, M. M. T. Chakravarty, G. Keller, C. Barner-Kowollik, Macromolecular Theory and Simulations 2007, 16, 575–592.
[194] M. Zhang, W. H. Ray, Industrial & Engineering Chemistry Research 2001, 40,4336–4352.
[195] M. Wulkow, Macromolecular Theory and Simulations 1996, 5, 393–416.
178

Bibliography
[196] M. Wulkow, PREDICI - Simulation package for polyreactions, Computing inTechnology GmbH, 2003.
[197] M. Wulkow, M. Busch, T. P. Davis, C. Barner-Kowollik, Journal of PolymerScience Part A-Polymer Chemistry 2004, 42, 1441–1448.
[198] P. Deuflhard, W. Huisinga, T. Jahnke, M. Wulkow, SIAM Journal on ScientificComputing 2008, 30, 2990–3011.
[199] J. Pallares, G. Jaramillo-Soto, C. Flores-Cataño, E. V. Lima, L. M. F. Lona,A. Penlidis, Journal of Macromolecular Science, Part A: Pure and AppliedChemistry 2006, 43, 1293–1322.
[200] M. Wulkow, Macromolecular Reaction Engineering 2008, 2, 461–494.
[201] X. Gao, S. Zhu, Journal of Applied Polymer Science 2011, 122, 497–508.
179


Danksagung
Ich danke Herrn Prof. Dr. Michael Buback für die interessante Themenstellung sowiedie vielen aufschlussreichen Diskussionen beim Erarbeiten meiner Doktorarbeit. BeiHerrn Prof. Dr. Philipp Vana möchte ich mich für die Übernahme des Korreferatsfür diese Arbeit danken.Außerdem bedanke ich mich bei Jun.-Prof. Dr. Ricardo Mata und João Oliveira
aus der Arbeitsgruppe Computational Chemistry and Biochemistry für die quanten-chemischen Berechnungen ausgewählter Modellsysteme.Allen Mitgliedern der Arbeitsgruppen Makromolekulare Chemie und Technische
und Makromolekulare Chemie danke ich für die freundliche und offene Arbeitsatmo-sphäre sowie die stete Hilfsbereitschaft. Besonderen Dank gilt hier natürlich meinenBürokollegen Joachim, Bastian, Vanessa und Katharina. Bei Herrn Dr. H.-P. Vögelemöchte ich mich für die sehr kompetente Unterstützung bei technischen Problemenbedanken.Besonderen Dank gilt meinen Bachelorstudenten Alana Schlieper und Hendrik
Kattner für die fruchtbare Zusammenarbeit im Rahmen der Dithiobenzoat- undTrithiocarbonat-vermittelten Polymerisationen. Bei Johannes Barth möchte ich michfür die Einführung in die ESR-Spektroskopie und die aufschlussreichen Diskussionenbedanken. Annika und Oliver Ries danke ich für die zahlreichen Hilfestellungenbei synthetischen Fragen und der Auswertung von NMR- und Massenspektren. Fürdie Unterstützung bei Computerproblemen jeder Art bedanke ich mich bei BastianEbeling. Für das Korrekturlesen dieser Arbeit möchte ich mich bei Hendrik Schröder,Joachim Morick, Nils Wittenberg und Nicolai Sörensen bedanken.
Mein herzlicher Dank gilt meiner gesamten Familie dafür, dass sie mich in all meinenEntscheidungen unterstützt und gefördert hat. Insbesondere danke ich meinen Elternfür ihre materielle und vor allem auch moralische Unterstützung. Meinen Schwesterndanke ich für die erlebnisreichen Wochenenden in Berlin, Leipzig, Köln und Bonn, dieimmer eine willkommene Abwechslung zur Promotion darstellten.Weiterhin möchte ich mich bei meinen Freunden und WG-Mitbewohnern für die
interessante Zeit im und neben dem Studium bedanken. Stellvertretend möchte ich

Dany, Jo, Steffi, Annika, Olli, Christina, Julia, Anke, Anne, Eva und Anja nennen,denen ich eine schöne und erlebnisreiche Zeit verdanke.
Para terminar agradezco a mi marido Alejandro, con todo mi cariño, las experienciasinolvidables de los últimos años y los que todavía vienen. Porque siempre me relajas,me haces sonreír y me recuerdas las cosas importantes de la vida. ¡Quérote moito!

Lebenslauf
persönliche Daten
geboren am 15. März 1983 in Berlin, Deutsch, verheiratet
Schulbildung
09/1989 - 06/1995 Grundschule in Berlin und Teltow
08/1995 - 06/2003 Weinberg-Gymnasium Kleinmachnow, Abschluss: Abitur (1,3)
10/2000 - 06/2001 Austauschjahr und Besuch der Olive Branch High School in OliveBranch, Mississippi, USA
Studium
10/2003 - 01/2009 Studium der Chemie an der Georg-August Universität Göttingen
09/2006 - 07/2007 Forschungspraktikum und Studium der Chemie an der Universidadde A Coruña, Galicien, Spanien
03/2008 - 09/2008 Diplomarbeit an der Georg-August-Universität Göttingen, In-stitut für Physikalische Chemie im Arbeitskreis von Prof. Dr.Michael Buback, Titel der Diplomarbeit:Mechanismus und Kinetikvon RAFT-Polymerisationen bis zu hohem Druck
seit 04/2008 wissenschafliche Mitarbeiterin am Institut für Physikalische Chemieder Universität Göttingen
01/2009 Diplomprüfungen im Fach Chemie, Note: 1,2
seit 03/2009 Promotionsstudium an der Georg-August-Universität Göttingenunter der Anleitung von Prof. Dr. Michael Buback
Copyright © 2022 FDOKUMEN