Investigations of the kinetics and mechanism of the selective ...
167
Investigations of the kinetics and mechanism of the selective methanation of CO in CO 2 and H 2 -rich reformates over Ru supported catalysts Universität Ulm Institut für Oberflächenchemie und Katalyse Dissertation zur Erlangung des Doktorgrades Dr. rer. nat. der Fakultät für Naturwissenschaften der Universität Ulm Stephan Eckle (München) 2012
-
Upload
khangminh22 -
Category
Documents
-
view
2 -
download
0
Transcript of Investigations of the kinetics and mechanism of the selective ...
Investigations of the kinetics and mechanism of the
selective methanation of CO in CO2 and H2-rich
reformates over Ru supported catalysts
Universität Ulm
Institut für Oberflächenchemie und Katalyse
Dissertation zur Erlangung des Doktorgrades
Dr. rer. nat. der Fakultät für Naturwissenschaften der Universität Ulm
Stephan Eckle
(München)
2012
- II -
Amtierender Dekan: Prof. Axel Groß
1. Gutachter: Prof. R.J. Behm
2. Gutachter: Prof. N. Hüsing
3. Gutachter: Prof. M. Muhler
Tag der Promotion: 07.02. 2012

- III -
Für Iris und Jonah

- IV -
Preface
The Ru/zeolite catalysts investigated in this work were supplied by Sued Chemie AG.
Due to a non disclosure agreement it is not possible to provide any details on the
synthesis or type of the zeolite. General information such as metal loading, BET
area, metal particle sizes, however, will be given in section 3.1.
Table of contents
- V -
Table of contents
1 Introduction ................................................................................................... 7
2 Experimental ............................................................................................... 15
2.1 Kinetic and conversion experiments ........................................................... 15
2.1.1 The ‚plug flow’ model .................................................................................. 16
2.1.2 Theory of the ‚plug-flow’ reactor.................................................................. 17
2.1.3 Gas mixing unit ........................................................................................... 20
2.1.4 Gas Chromatograph (GC)........................................................................... 22
2.1.5 IMR / MS..................................................................................................... 22
2.2 Transmission Electron Micropsocope (TEM) .............................................. 23
2.3 X-ray Photoelectron Spectroscopy (XPS) ................................................... 24
2.4 X-ray Diffraction (XRD) ............................................................................... 25
2.5 Hydrogen chemisorption ............................................................................. 26
2.6 Dispersion and TOF calculation.................................................................. 27
2.7 Diffuse Reflectance Infrared Fourier Transform Spectroscopy (DRIFTS) ... 28
2.8 X-ray Absorption Spectroscopy (XAS) ........................................................ 31
2.8.1 Technical preconditions .............................................................................. 31
2.8.2 Physical principles of the electron transition ............................................... 33
2.8.3 XAS spectrum (XANES and EXAFS).......................................................... 35
2.8.4 EXAFS: mathematical description............................................................... 37
2.8.5 Sample preparation and experiment ........................................................... 39
2.8.6 EXAFS evaluation....................................................................................... 42
3 Results and Discussion............................................................................... 49
3.1 Catalyst characterization............................................................................. 49
3.2 Activity, selectivity, and adsorbed reaction intermediates/reaction side
products in the selective methanation of CO in reformate gases on
supported Ru catalysts ............................................................................... 57
3.2.1 Temperature screening experiments .......................................................... 58
3.2.2 Kinetic measurements ................................................................................ 63
3.2.3 DRIFTS measurements .............................................................................. 70
3.2.4 Transient experiments ................................................................................ 79
3.2.5 Summary..................................................................................................... 83
Table of contents
- VI -
3.3 Reaction intermediates and side products in the methanation of CO and
CO2 over supported Ru catalysts in H2-rich reformate gases ..................... 87
3.3.1 CO methanation.......................................................................................... 87
3.3.2 Carbon dioxide methanation ....................................................................... 94
3.3.3 Conclusion .................................................................................................. 98
3.4 What drives the selectivity for CO methanation in the methanation of
CO2-rich refomate gases on supported Ru catalysts. ............................... 100
3.4.1 In situ DRIFTS measurements.................................................................. 100
3.4.2 Kinetic measurements .............................................................................. 109
3.4.3 Conclusions .............................................................................................. 114
3.5 Influence of the catalyst loading on the activity and the CO Selectivity of
supported Ru catalysts in the selective methanation of CO in CO2
containing feed gases ............................................................................... 116
3.5.1 In situ DRIFTS measurements.................................................................. 117
3.5.2 SR-ref 6000 reformate .............................................................................. 118
3.5.3 Reformate gases with low CO concentrations .......................................... 120
3.5.4 Kinetic measurements .............................................................................. 126
3.5.5 Conclusion ................................................................................................ 133
4 Summary................................................................................................... 136
5 References................................................................................................ 141
6 Appendix................................................................................................... 150
6.1 German Summary..................................................................................... 157
6.1.1 List of publications .................................................................................... 163
6.1.2 Curriculum Vitae ....................................................................................... 165
7 Acknowledgement..................................................................................... 166
8 Declaration................................................................................................ 167
1 Introduction
7
1 Introduction
Economically and ecologically efficient techniques for the production of sufficiently
pure H2 are a prerequisite for the introduction of H2 based energy technologies [1].
Today, H2 is mainly produced by partial oxidation (eq. 1.0) or catalytic steam
reforming (eq. 1.1) of fossil fuels [2-8]. During partial oxidation (eq. 1.0)
substoichiometric amounts of oxygen are added to the reformate, generating CO and
hydrogen in an exothermic reaction. Steam reforming of fossil feed stocks
necessitates the presence of water, a catalyst (usually Nickel based) [2] and high
temperatures (~ 700°C) to produce H2. Due to the reaction conditions in the reformer
the latter reaction is usually accompanied by the water gas shift (eq. 1.2) and the
methanation reaction (eq.1.3) both producing substantial amounts of CO2 (up to
20%), CH4 (5%) and CO (1-8%) in the resulting H2-rich feed gas (‘reformate’) [5-8].
CnHm + 2
nO2 ↔ n CO +
2
m H2 ∆H0
R < 0 [9] eq. 1.0
CnHm + H2O ↔ n CO + (n + 2
m) H2 ∆H0
R > 0 [2] eq. 1.1
CO + H2O ↔ CO2 + H2 ∆H0R = -41,2 kJ�mol-1 [2] eq. 1.2
CO + 3H2 → CH4 + H2O ∆H0R = -206,2 kJ�mol-1 [2] eq. 1.3
For the operation of low-temperature polymer electrolyte fuel cells (PEFCs), the
resulting H2-rich gas should be free of catalyst poisons, in particular the CO content
has to be reduced to ≤10 ppm [10;11], which is most commonly achieved catalytically
[2-4;7;12;13], besides other techniques such as pressure swing adsorption [14]. In a
first step the combination of the high (HTS) and low (LTS) temperature water gas
shift reaction (eq. 1.2 and 1.4) reduces the CO content of the feed gas. The high
temperature water gas shift reaction (T= 310-450°C) features a large reaction rate for
CO conversion, reducing the CO content to 3% over FexOy/Cr2O3 catalysts. Lower
amounts are not possible due to the exothermic reaction. Therefore the subsequent
low temperature water gas shift reaction (T= 200-260°C) lowers the remaining
amount of CO to about 0.5-1%, employing Cu/ZnO catalysts. In a second step the
remaining CO is usually lowered to below 10 ppm by the preferential oxidation of CO
over Pt or Fe catalysts (PROX, eq. 1.4).
CO + ½ O2 → CO2 ∆H0R = -283,2 kJ�mol-1 [15] eq. 1.4
H2 + ½ O2 → H2O ∆H0R = -241,8 kJ�mol-1 [15] eq. 1.5
1 Introduction
8
However, the process management requires additional monitoring and units for O2
dosing, as well as additional maintenance, which is only profitable for large scale
applications. In addition the reaction of H2 and excess oxygen to water (eq. 1.5) may
lower the overall efficiency. Therefore, in cost sensitive, small scale applications
(such as block heating stations), the methanation of the CO (eq. 1.3) may be a more
attractive alternative for CO removal compared to the PROX reaction. The
methanation reaction uses the H2 present in the feed gas and avoids the need for an
additional unit for O2 dosing [5;16]. The loss of H2 is tolerable, as long as the initial
CO content, after the WGS reaction, is low (0.5 %). Precondition for this concept,
however, is that the reaction is highly selective for the methanation of CO and that
CO2 methanation (eq. 1.7) is essentially inhibited, otherwise the losses of hydrogen
would become intolerable [5;17].
CO2 + 4H2 → CH4 + 2H2O ∆H0R = -164,9 kJ�mol-1 [18] eq.1.7
The CO methanation reaction is closely related to the Fischer-Tropsch reaction,
where higher hydrocarbons are generated by the reaction of CO and H2. Depending
on the desired product (long or short alkanes, olefins etc.), the reaction conditions
vary over a wide range (T= 150-600°C, p= 1 bar to 100 bars, CO:H2 ratio between
1.6-3) [19-21]. The most active catalysts in the Fischer-Tropsch reaction were oxide
supported Fe, Co, Ni and Ru catalysts (see [19]) and references therein, [22]). Ru
was identified as the most active and the most expensive catalyst, leading to a
commercial use of the cheaper and less active iron, copper or nickel catalysts. Not
surprisingly, the catalysts active for the Fischer-Tropsch Synthesis were identified
also as the most active catalysts for the CO methanation reaction [20;22-34]. In the
latter case the reaction conditions were usually altered to atmospheric pressure,
moderate temperature (~200°C) and a CO:H2 ratio of 3 in order to obtain mostly CH4.
Again, Ru was identified as the most active catalyst [23;24]. Even recent DFT studies
showed, that the CO methanation reaction mechanism is faster over Ru than over Ni
or Fe based catalysts [35-38]. However, due to the high costs of Ru metal the
industrially used catalysts for this reaction are usually based on moderately priced Ni
or Fe metal supported catalysts. Disadvantage of these catalysts is the fast
deactivation with time due to a higher CO disproportionation probability (even in the
absence of H2) [29], as a result of strongly bound carbides and graphite. In contrast,
Ru supported catalysts do not feature this problem to such an extent, resulting in
1 Introduction
9
more stable catalysts. In addition, these catalysts showed a high selectivity / activity
towards CO methanation in CO2 containing gas mixtures [31;39-42]. For supported
Ru catalysts, it was established in a number of studies that, in addition to the nature
of the support material (see below), such as Al2O3, TiO2 or zeolites, that the Ru
particle size has a pronounced effect on their activity for CO methanation [26;43-45].
The Ru mass normalized reaction rate was found to increase with increasing Ru
particle size. This was associated with the higher fraction of Ru terrace sites on larger
Ru nanoparticles, which were considered to be more active for this reaction
[25;26;43-45]. For very small Ru nanoparticles with diameter ~ 1 nm, the activity de-
creased steeply. In the latter publications the metal particle size was determined by
TEM or H2 chemisorption. While the above studies were conducted under Fischer-
Tropsch reaction conditions in a typical syngas mixture (H2:CO = 3), this trend was
confirmed also in more recent studies performed under conditions more relevant for
feed gas processing (H2:CO = 14 or 100) [41;42;46-48].
Besides a high activity, the selectivity for CO methanation in the selective
methanation in CO2-rich gas atmospheres is an important property of methanation
catalysts. In realistic reformates the CO selectivity is generally attributed to a surface
blocking by adsorbed CO. This is driven by the higher adsorption energy of CO
compared to CO2. COad blocks the surface for (dissociative) adsorption of CO2 and
subsequent methanation reaction [49;50]. In that case, CO2 methanation will be
inhibited, as long as the CO partial pressure and hence the COad coverage on the
catalyst is sufficiently high. Increasing the selectivity of Ru supported catalysts was
already tried in many different ways, including the use of different support materials
such as TiO2, Al2O3, SiO2 or CeO2 [42;51-55] or of dopants [56;57], or varying the Ru
particle size [40]. Also the use of zeolite supports was proposed as an alternative to
standard supports such as TiO2 or Al2O3. The zeolite supported Ru catalysts which
did not affect the turn over frequency markedly for the methanation of CO compared
to Ru/Al2O3 or Ru/SiO2 catalysts, however enabled to maintain a high metal
dispersion [58]. The CO2 methanation under low CO partial pressures was not
investigated by the various scientific groups. Despite of partially promising results of
increasing the catalysts CO selectivity by doping [56;57] or the use of different
supports [42;51-55], the physical origin of the increased selectivity remained unclear.
This is partly due to the fact that in most cases the CO selectivity in the selective
methanation reaction was evaluated only from “temperature screening”
1 Introduction
10
measurements, which provide little mechanistic insight [17;47;48;53;54;56;57;59;60].
Furthermore, most of the previous studies on COx methanation over Ru catalysts
dealt with the methanation of either CO or CO2 rather than with the selective
methanation of CO in CO2-rich gas mixtures [26;30;32;41;42;51;61;62]. Finally,
despite of a number of theoretical studies on CO methanation or on the Fischer-
Tropsch reaction on Ru surfaces [37;38;63;64], the question of the selectivity has
also not been investigated theoretically so far.
The mechanism of the reaction of CO or CO2 to CH4 as well as the active surface
species of the selective methanation of CO are still under debate. The surface
species formed during reaction were characterized mostly by in situ infrared
spectroscopy studies on different Ru catalysts. Different types of COad adsorbed on
the Ru particles, e.g., COad on oxidized Ru, linear and bridged COad on Ru0, surface
formates and / or surface carbonates, as well as adsorbed CHx,ad species were
observed during CO methanation on the catalyst [26-29;31;32;65]. From these
studies it was not clear, however, whether there is a preference for a specific type of
COad as active species, and if so, for which of them. Surface formates and
carbonates were commonly interpreted as side products [26;27]. In earlier studies, it
was proposed that CO dissociates in the first step, leading to active and inactive
carbon species, where the former are stepwise methanated to CH, CH2, CH3 and fi-
nally CH4 [22;31;66-70]. Yamasaki et al. [28] showed in a very detailed in situ IR
study that upon changing from a 12CO/H2 reaction atmosphere to a 13CO/H2 gas
mixture the signals related to 12CHx,ad species disappeared, while signals related to
the corresponding 13CHx,ad species were growing in [28]. They also estimated
concentrations of CH2 and CH3 groups present on the surface under steady-state
conditions. Assuming that these groups belonged to adsorbed CxHy hydrocarbon
chains, they calculated the average length of the CxHy hydrocarbon chains. Based on
these data they proposed a complex mechanism for the CO methanation reaction,
where CHx,ad species act as reaction intermediates and CH4 formation proceeds via
formation and decomposition of adsorbed hydrocarbon chains [28]. However, since
in the SSITKA-type (Steady State Isotope Transient Kinetic Analysis) experiments
the CHx,ad removal rate in H2 was not quantified and compared to the CH4 formation
rate, it is not clear, whether the reactive removal of the CHx,ad species observed in IR
is really the rate-limiting step in the dominant reaction pathway, which would mean
that these species represent reaction intermediates in that pathway, or whether they
1 Introduction
11
should better be considered as spectator species or as reaction intermediates in a
minority pathway (side reaction). Other studies, however, involving transient
experiments, where H2 was exchanged by D2 after achieving steady-state conditions,
provided convincing evidence that the adsorbed CHx species, at least those detected
by IR spectroscopy, represent side products rather than reaction intermediates
[26;27]. In the latter studies it was observed that the CHx species related IR signal did
not decline even after 3 h. In a different concept, CO disproportionation was
proposed as initial step, followed by carbon hydrogenation to CH4 and CO2 reduction
to CO via the Reverse Water Gas Shift (RWGS) reaction [22;66]. More recent studies
indicated that a formyl type (HCO) ad-species plays an important role in the CO
methanation reaction, followed by C-O bond breaking and further hydrogenation
[36;71]. This species was also identified as intermediate in the dominant reaction
pathway during Fischer-Tropsch reactions in density functional theory (DFT) studies
by Inderwildi et al. [37;64;72]. Still, the main question is whether the reaction starts
with C-O bond breaking or with association of hydrogen and subsequent C-O band
breaking.
The mechanism of the CO2 methanation reaction is similarly controversial [22;73-78].
Following earlier proposals of direct CO2 methanation [22], it is nowadays generally
accepted that COad is the main intermediate of the CO2 methanation [71;73;74;76-
79]. This COad species is subsequently hydrogenated via the mechanism for CO
methanation as discussed above. Several groups proposed for Ru supported
catalysts that CO2 first reacts to COad via the Reverse Water Gas Shift (RWGS)
reaction, which then continues to react to CH4. It was suggested that the RWGS
reaction proceeds via a formate intermediate [73;76-78]. However, the reaction
mechanism of the RWGS may change for different catalytic systems, i.e. for CO2
conversion on oxide supported Au catalysts a redox-type mechanism was proposed
for the RWGS reaction [80]. Finally, dissociative CO2 adsorption to COad and Oad and
subsequent reaction of COad to CH4 was considered as a third alternative for the
methanation of CO2 [74].
It is important to realize also that almost all of the studies listed above focus on the
hydrogenation of CO or CO2 under conditions relevant for methane formation from
synthesis gas, at nearly stoichiometric conditions (CO:H2 = 1:3-1:4). Only few studies
deal with reaction atmospheres with a high excess of hydrogen (CO:H2 = 1:20-
1:100), as it is typical for the selective methanation reaction
1 Introduction
12
[17;27;36;40;42;47;48;51;53;54;56;57;60;68] with the above mentioned limitations.
The different reactant ratios may have considerable effects on the reaction behavior
and the dominance of a specific reaction pathway. In that sense, studies performed
at close stoichiometric CO: H2 ratios may lead to mechanistic conclusions which are
not necessarily relevant for the reaction under conditions typical for the selective
methanation in H2-rich reformate gases. In addition the few studies investigating the
selective CO methanation deal mostly with integral reaction conditions or concentrate
on either CO or CO2 methanation. There are no publications investigating both
reactions at the same time under differential reaction conditions, which are certainly
needed to draw conclusions on the molecular based mechanism and the driving
force behind the CO selectivity.
The motivation of this PhD thesis is to shine more light on the molecular mechanism
of the CO and CO2 methanation over supported Ru catalysts and to elucidate the
physical origin of the driving force behind the selectivity for CO methanation
specifically. This included two parts. First, the performance of commercial, supported
Ru catalysts in the selective methanation of CO, various zeolite supported catalysts
developed for these purposes and, for comparison, a standard Ru/Al2O3 catalyst was
investigated. Second, the mechanistic details of the reaction were studied by various
spectroscopic techniques, aiming at a physical understanding of the reaction
mechanism and the resulting CO selectivities under conditions typical for selective
methanation in H2-rich reformate gases
The layout of the thesis is as follows:
First (section 3.1) the main techniques used for catalyst characterization will be
described. Moreover in situ EXAFS results are described for all catalysts, which were
finally used to determine the coordination number and thus the Ru particle size.
Second (section 3.2) the results of the CO methanation reaction in a number of
different reaction atmospheres, going from pure H2/CO and H2/CO2 mixtures to more
realistic reaction mixtures, over a 2.2 wt.% Ru/zeolite and a 5 wt.% Ru/Al2O3 catalyst
will be presented. The activity, selectivity and stability of the two catalysts were
characterized in conversion experiments. Kinetic measurements, performed under
differential reaction conditions, gave insight into reaction rates, activation energies
and reaction orders. In the second part, the formation and their accumulation with
time of different surface species under reaction conditions as well as their
1 Introduction
13
decomposition in CO-free atmosphere (H2/N2 mixtures) was followed in transient in
situ diffuse reflection IR Fourier transform spectroscopy (DRIFTS) measurements,
performed under comparable reaction conditions (differential conversion, identical
gas mixtures and reaction temperatures) as used in the kinetic measurements and
compared to reaction and mass spectrometric transient data. The correlation
between activity and build-up of surface species during the reaction under different
reaction conditions and between the removal of adsorbates and CH4 formation in
transients in CO-free atmosphere on both Ru catalysts as well as consequences for
the reaction pathway are discussed.
The next section (3.3) describes the identification and characterization of the active
reaction intermediates of the CO and CO2 methanation reaction on the standard
Ru/Al2O3 catalyst and the Ru/zeolite catalyst under these reaction conditions. This
was studied in transient SSITKA (Steady State Isotope Transient Kinetic Analysis)
type IR experiments, where after 1000 min of reaction in idealized CO or CO2
reformate one educt was replaced by its isotope labeled (13CO, 13CO2) isotopomer.
Correlation of the build-up / decay of various surface species such as HCOad, CH4,ad
and COad upon the exchange step under otherwise constant reaction conditions with
the steady-state activity of the catalysts allowed me to distinguish between reaction
intermediates in the dominant reaction pathway and stable or less active reaction
side products (‘spectator species’).
This is followed by an investigation of the reasons underlying the high CO selectivity
of the Ru/zeolite catalyst in section 3.4, where results of a combined kinetic and in
situ IR spectroscopic study on the effect of the CO content on the adsorption and
reaction behavior on a Ru/zeolite and a Ru/Al2O3 catalyst are reported, focuses on
correlations between COad coverage and selectivity. The measurements were
performed in a number of different idealized (H2/CO) and semi-realistic (H2/CO/CO2)
reaction atmospheres, decreasing the CO content to as low as 100 ppm. The
temporal evolution of the adsorbed surface species during the methanation reaction
in different reaction atmospheres, characterized by time-resolved in situ IR
measurements is discussed in this section. In combination, these measurements
allow me to not only to determine the steady-state COad coverages in different
reaction atmospheres, but also to quantitatively assess the contribution from CO2
decomposition to the COad signal in the experiments performed under semi-realistic
conditions. The influence of the CO content on the CO methanation activity and on
1 Introduction
14
the selectivity for CO methanation was also investigated. The resulting correlations
between COad coverage and the selectivity for CO methanation as well as
consequences on the molecular scale mechanism responsible for the selectivity are
discussed.
In the last section (3.5), the influence of the particle size of differently loaded
Ru/zeolite catalysts on the CO selectivity is elucidated, where contributions of
possibly different metal support interactions due to the different supports can be ruled
out. Here results of a systematic, combined kinetic and in situ spectroscopy study on
the effect of Ru metal loading and Ru particle size on the activity and in particular on
the selectivity of Ru/zeolite catalysts in the selective methanation of CO are reported.
The measurements were performed in a number of different idealized (H2/CO,
H2/CO2) and semi-realistic (H2/CO/CO2) reaction atmospheres, decreasing the CO
content to as low as 100 ppm. In situ extended X ray absorption fine structure
spectroscopy (EXAFS) and in situ diffuse reflectance IR spectroscopy (DRIFTS)
measurements were employed, in addition to kinetic measurements, in order to gain
information on the Ru particle sizes of the different catalysts during reaction under
steady-state conditions (EXAFS) and on the temporal evolution of the adsorbate
layer during the reaction (time-resolved DRIFTS). Finally, a brief comment on
consequences of these findings for technical applications is provided.
2 Experimental
15
2 Experimental
2.1 Kinetic and conversion experiments
The kinetic experiments performed in this work were carried out using a ‘plug flow’
reactor at atmospheric pressure. The first set up, employing ‘Gas Chromatography’
(GC) for the detection of the different feed gas and product components, was used
for kinetic experiments under differential conditions (conversion of one educt < 15%),
such as deactivation, activation energy, reaction orders. In order to achieve
differential conditions, the catalyst was diluted with different amounts of SiO2, which
is inactive for the methanation reaction (refer to Table 8, appendix). In addition,
conversion experiments under integral reaction conditions (conversion of one educt
up to 100%) were performed, where pure undiluted catalysts were employed.
The second set-up, employing an ‘Ion Molecule Reaction Mass Spectrometer (IMR /
MS) as detection unit, was used for instationary experiments, where one educt (CO)
was shut off after reaching steady-state conditions. Details on the apparatus will be
given in the following sections.
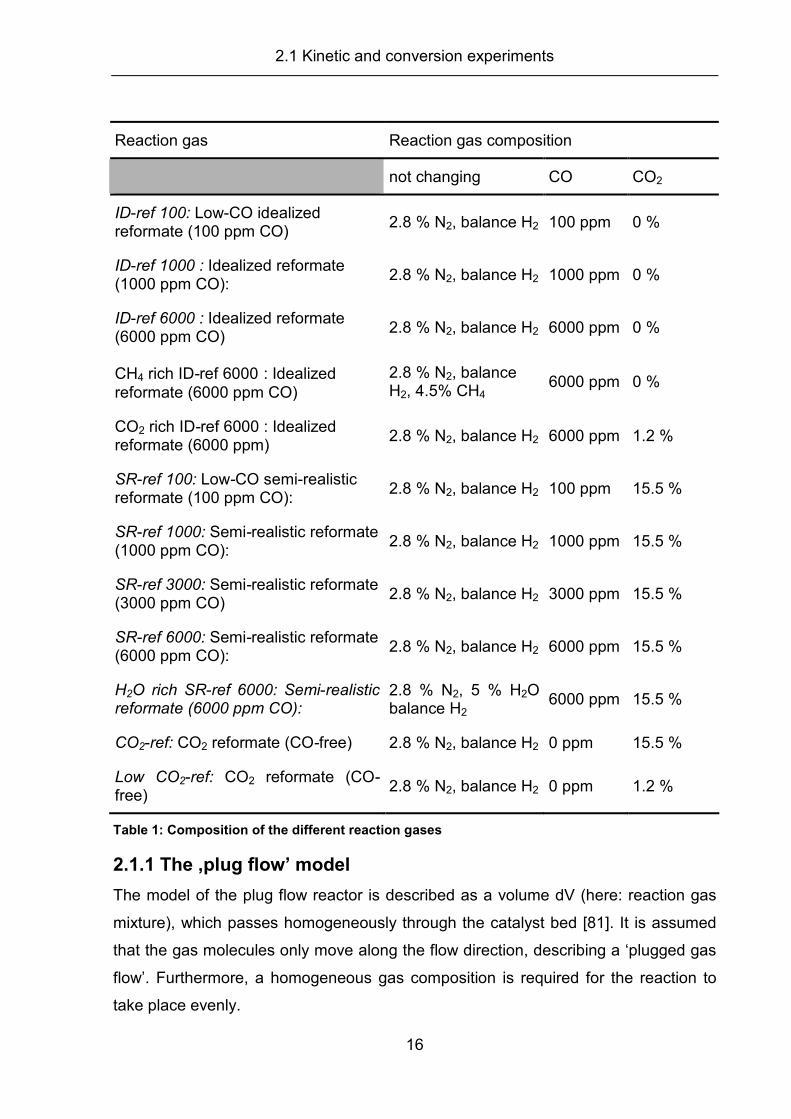
The compositions of the reformate gases applied during the experiments are given in
Table 1.
2.1 Kinetic and conversion experiments
16
Reaction gas Reaction gas composition
not changing CO CO2
ID-ref 100: Low-CO idealized reformate (100 ppm CO)
2.8 % N2, balance H2 100 ppm 0 %
ID-ref 1000 : Idealized reformate (1000 ppm CO):
2.8 % N2, balance H2 1000 ppm 0 %
ID-ref 6000 : Idealized reformate (6000 ppm CO)
2.8 % N2, balance H2 6000 ppm 0 %
CH4 rich ID-ref 6000 : Idealized reformate (6000 ppm CO)
2.8 % N2, balance H2, 4.5% CH4
6000 ppm 0 %
CO2 rich ID-ref 6000 : Idealized reformate (6000 ppm)
2.8 % N2, balance H2 6000 ppm 1.2 %
SR-ref 100: Low-CO semi-realistic reformate (100 ppm CO):
2.8 % N2, balance H2 100 ppm 15.5 %
SR-ref 1000: Semi-realistic reformate (1000 ppm CO):
2.8 % N2, balance H2 1000 ppm 15.5 %
SR-ref 3000: Semi-realistic reformate (3000 ppm CO)
2.8 % N2, balance H2 3000 ppm 15.5 %
SR-ref 6000: Semi-realistic reformate (6000 ppm CO):
2.8 % N2, balance H2 6000 ppm 15.5 %
H2O rich SR-ref 6000: Semi-realistic reformate (6000 ppm CO):
2.8 % N2, 5 % H2O balance H2
6000 ppm 15.5 %
CO2-ref: CO2 reformate (CO-free) 2.8 % N2, balance H2 0 ppm 15.5 %
Low CO2-ref: CO2 reformate (CO-free)
2.8 % N2, balance H2 0 ppm 1.2 %
Table 1: Composition of the different reaction gases
2.1.1 The ‚plug flow’ model
The model of the plug flow reactor is described as a volume dV (here: reaction gas
mixture), which passes homogeneously through the catalyst bed [81]. It is assumed
that the gas molecules only move along the flow direction, describing a ‘plugged gas
flow’. Furthermore, a homogeneous gas composition is required for the reaction to
take place evenly.
2.1 Kinetic and conversion experiments
17
A typical reactor consists of a quartz tube, 23.5 cm long, with a 6 and 4 mm outer
and inner diameter and a wall thickness of 1 mm. The powder catalyst is placed in
the middle of the reactor and fixed by glass wool at both ends. A Ni/CrNi
thermocouple, which is placed in a small cavity in the middle of the reactor and
attached by a ceramic glue on the basis of SiO2 (Plytec, Type 905), measures the
temperature. Normally, about 200 mg of diluted catalyst powder was used, which
results in a catalyst bed of ca. 1 cm. The reactor is embedded into an oven, which is
heated up to 600°C by a heating wire (Horst company). The heating power is
adjusted by a control unit (Watlow, Model 982). Quartz wool serves as insulation of
the oven and provides a basis for a constant temperature.
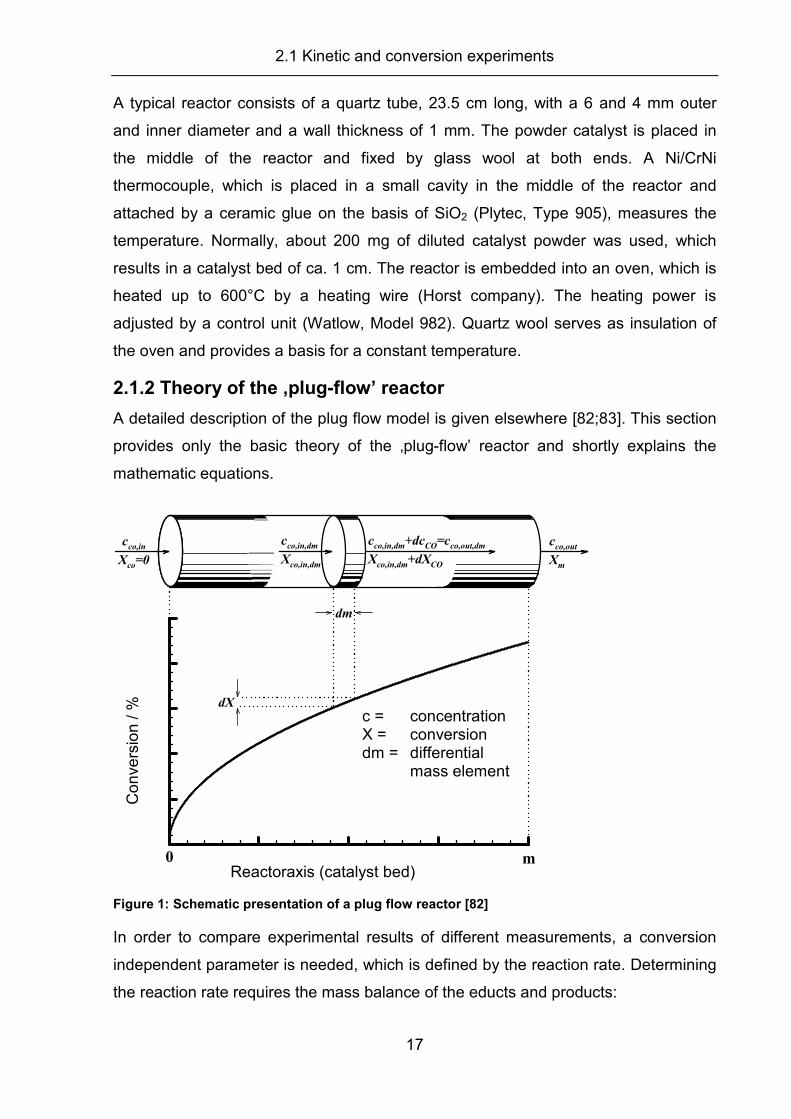
2.1.2 Theory of the ‚plug-flow’ reactor
A detailed description of the plug flow model is given elsewhere [82;83]. This section
provides only the basic theory of the ‚plug-flow’ reactor and shortly explains the
mathematic equations.
0 mReaktorachse (Katalysatorbett)
Umsatz X dX
dm
c = Konzentration
X = Umsatz
dm= differentielles
Massenelement
cco,in
Xco=0
cco,out
Xm
cco,in,dm
Xco,in,dm
cco,in,dm
+dcCO=c
co,out,dm
Xco,in,dm
+dXCO
Figure 1: Schematic presentation of a plug flow reactor [82]
In order to compare experimental results of different measurements, a conversion
independent parameter is needed, which is defined by the reaction rate. Determining
the reaction rate requires the mass balance of the educts and products:
Reactoraxis (catalyst bed)
Co
nve
rsio
n / %
c = concentration X = conversion dm = differential mass element
2.1 Kinetic and conversion experiments
18
substancein = substanceout + substancereaction eq. 2.1
The introduction of the volumetric flows ( itoti cVV ⋅=..
) yields:
dmrdccVcV iiitotitot ⋅−++⋅=⋅ )()(..
eq. 2.2
where
ri: reaction rate of the component i
for differential mass element dm
iV.
: volumetric flows of component i
ci: concentration of component i
Rearrangement of eq. 2.2 yields:
dmrdcV iitot ⋅=⋅.
eq. 2.3
The conversion of the component i can be described by the differential change in the
concentration of the component:
in
out
in
out
i
i
i
ii
ic
c
c
ccX −=
−= 1 eq. 2.4
where
Xi: conversion of component i for the differential mass element dm
For differential conversions the following simplification applies:
inii
i
cdc
dX 1−= or:
iniii cdXdc ⋅−= eq. 2.4
with eq. 2.3 this results in:
dmrcdXV iiitotin
⋅=⋅⋅.
eq. 2.5
Applying itoti cVV ⋅=..
on eq. 2.5 yields:
dmrdXV iiiin ⋅−=⋅.
or
ini
ii
V
dmrdX
.⋅−= eq. 2.6
⋅⋅
Katgs
imol
2.1 Kinetic and conversion experiments
19
Integration of the equation establishes the relationship between the differential mass
element dm and the whole catalyst bed:
∫∫ −=
m
in
X
i
i
m
ir
dX
V
dm
00
. eq. 2.7
In order to easily determine the reaction rate, the experiments have to be conducted
under differential reaction conditions and conversions. These are met, if the
conversion of the reacting educts is equal or smaller than 15 %. The low conversion
also helps to maintain a constant temperature, even under strong exo – or
endothermic reactions. When ensuring small conversions of the reaction educts, the
reaction rates, concentrations of the educts and volumetric flow rates along the
catalyst bed can be assumed as constant, which leads to:
∫∫ ⋅−
=⋅m
in
X
i
i
m
i
dXr
dm
V 00
.
11 eq. 2.8
Integration of eq. 2.8 yields:
m
VXr ini
mi −= eq. 2.9
For CO the equation above would result in:
m
VXr inCO
mCO −= eq. 2.10
The conversion of other components taking part in the reaction is calculated in the
same way as written above.
For CO2 this results in:
in
out
in
outin
CO
CO
CO
COCO
COc
c
c
ccX
2
2
2
22
21−=
−= eq. 2.11
for CH4 :
2
2
44
4 COCO
COCO
CHCH
CH XXcc
ccX
inin
outin +=+
−= eq. 2.12
The CO selectivity is calculated by the following equation:
%100·%100·
444 CH
CO
CHCH
COCO
COX
X
cc
ccS
outin
outin =−
−= eq. 2.13
2.1 Kinetic and conversion experiments
20
2.1.3 Gas mixing unit
All instruments used for the in situ investigation of the selective methanation of CO
(plug flow reactors connected to the GC or MS, the DRIFTS or the XAS reaction cell)
were connected to a gas mixing unit, which allowed experiments with four different
gases and flow rates up to 200 Nml�min-1. Four mass flow controllers (MFC), which
were connected with the gases (CO, CO2, H2, N2, CH4), adjusted the gas flow. The
gases were intermixed after passing the MFCs prior to entering the reactor.
Subsequently they were fed to the detection system. During bypass measurements
the intermixed gases did not flow through the reactor prior to entering the detection
system. This was adjusted by a four port valve. Details on the gas mixing units can
be found in [84].
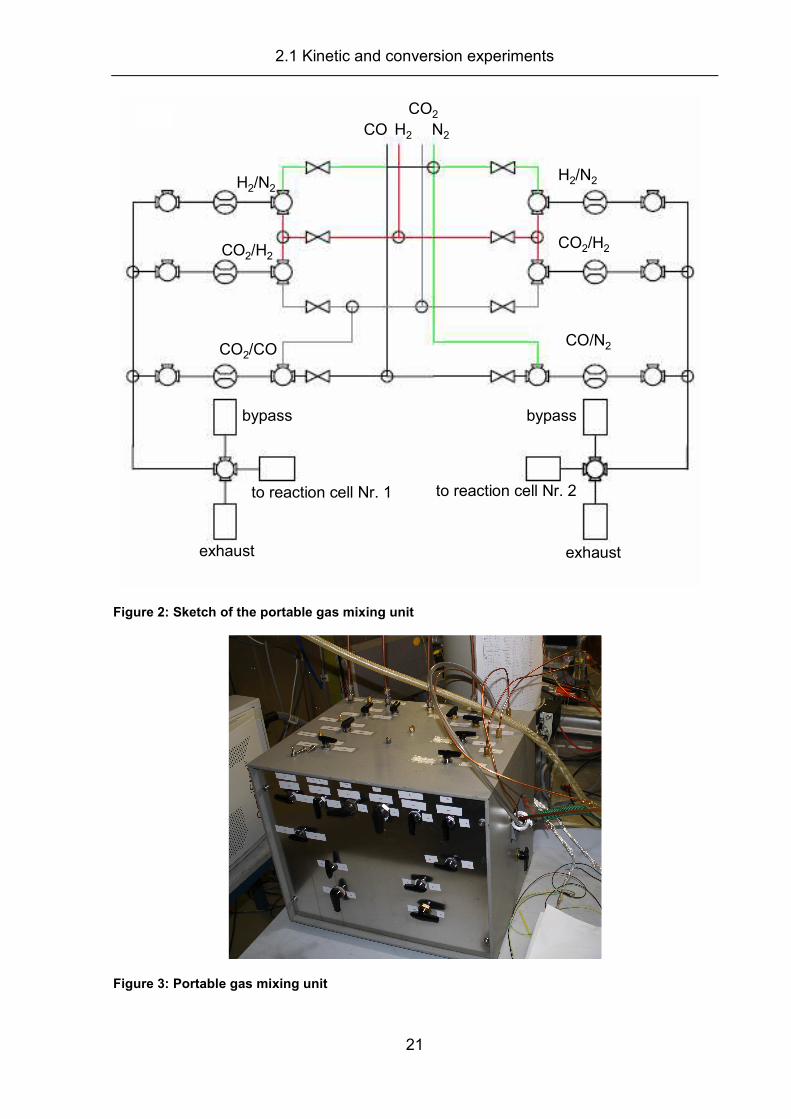
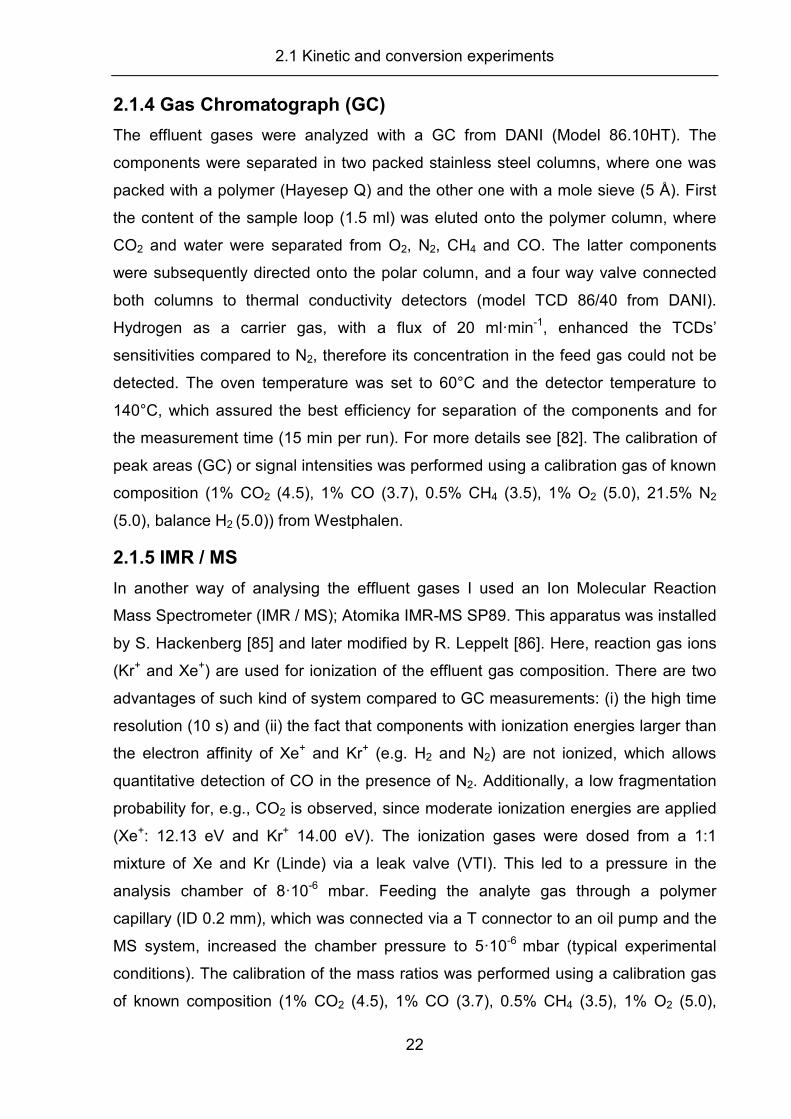
For the in situ XAS measurements, a small transportable gas mixing unit (Figure 2
and Figure 3) was built, including six digital mass flow controllers (Bronkhorst), which
were controlled via a computer program (FlowView, Bronkhorst). The principal set-up
is similar to the gas mixing units used for DRIFTS or kinetic measurements. Figure 2
shows a schematic description of the gas mixing unit. This set-up allowed the use of
two XAS in situ cells simultaneously, e.g., one for pre-treatment and one for
measurements under idealized conditions (maximum of three MFC per cell). For
experiments under realistic conditions, one cell could be connected to four MFCs.
This was achieved by switching one mass flow controller from one side via three port
valves to the three MFCs on the other side.
Table 9 (see appendix) summarizes the different MFCs for the different experimental
stations.
2.1 Kinetic and conversion experiments
21
N2
CO2
CO H2
H2/N2H2/N2
CO2/H2CO2/H2
CO2/COCO/N2
exhaust exhaust
to reaction cell Nr. 1 to reaction cell Nr. 2
bypass bypass
a)N2
CO2
CO H2
H2/N2H2/N2
CO2/H2CO2/H2
CO2/COCO/N2
exhaust exhaust
to reaction cell Nr. 1 to reaction cell Nr. 2
bypass bypass
a)
Figure 2: Sketch of the portable gas mixing unit
Figure 3: Portable gas mixing unit
2.1 Kinetic and conversion experiments
22
2.1.4 Gas Chromatograph (GC)
The effluent gases were analyzed with a GC from DANI (Model 86.10HT). The
components were separated in two packed stainless steel columns, where one was
packed with a polymer (Hayesep Q) and the other one with a mole sieve (5 Å). First
the content of the sample loop (1.5 ml) was eluted onto the polymer column, where
CO2 and water were separated from O2, N2, CH4 and CO. The latter components
were subsequently directed onto the polar column, and a four way valve connected
both columns to thermal conductivity detectors (model TCD 86/40 from DANI).
Hydrogen as a carrier gas, with a flux of 20 ml�min-1, enhanced the TCDs’
sensitivities compared to N2, therefore its concentration in the feed gas could not be
detected. The oven temperature was set to 60°C and the detector temperature to
140°C, which assured the best efficiency for separation of the components and for
the measurement time (15 min per run). For more details see [82]. The calibration of
peak areas (GC) or signal intensities was performed using a calibration gas of known
composition (1% CO2 (4.5), 1% CO (3.7), 0.5% CH4 (3.5), 1% O2 (5.0), 21.5% N2
(5.0), balance H2 (5.0)) from Westphalen.
2.1.5 IMR / MS
In another way of analysing the effluent gases I used an Ion Molecular Reaction
Mass Spectrometer (IMR / MS); Atomika IMR-MS SP89. This apparatus was installed
by S. Hackenberg [85] and later modified by R. Leppelt [86]. Here, reaction gas ions
(Kr+ and Xe+) are used for ionization of the effluent gas composition. There are two
advantages of such kind of system compared to GC measurements: (i) the high time
resolution (10 s) and (ii) the fact that components with ionization energies larger than
the electron affinity of Xe+ and Kr+ (e.g. H2 and N2) are not ionized, which allows
quantitative detection of CO in the presence of N2. Additionally, a low fragmentation
probability for, e.g., CO2 is observed, since moderate ionization energies are applied
(Xe+: 12.13 eV and Kr+ 14.00 eV). The ionization gases were dosed from a 1:1
mixture of Xe and Kr (Linde) via a leak valve (VTI). This led to a pressure in the
analysis chamber of 8�10-6 mbar. Feeding the analyte gas through a polymer
capillary (ID 0.2 mm), which was connected via a T connector to an oil pump and the
MS system, increased the chamber pressure to 5�10-6 mbar (typical experimental
conditions). The calibration of the mass ratios was performed using a calibration gas
of known composition (1% CO2 (4.5), 1% CO (3.7), 0.5% CH4 (3.5), 1% O2 (5.0),
2.2 Transmission Electron Microscope (TEM)
23
21.5% N2 (5.0), balance H2 (5.0)) from Westphalen. For a detailed description of the
system see [85;86].
2.2 Transmission Electron Microscope (TEM)
All TEM images presented in this work were recorded by Dr. J. Biskupek (Ulm
University) on a Philips CM20 200KV equipped with a CCD camera. It is a powerful
technique to visualize particle sizes and catalyst morphologies [87;88]. In principle,
an electron beam passes through a condenser where parallel rays are produced. An
aperture controls the size of the illuminated sample. Those electrons, passing in
parallel through the sample, produce an image, after passing several lenses and the
“backfocal plane”. This small intermediate image passes through several lenses
which magnify the image. Subsequently it is displayed on a fluorescent screen [89]. A
two dimensional grey scale projection is formed by the transmitted electrons, where
the grey scale levels result from the attenuation of the beam, which in turn depends
on the weight of the element, thickness of the sample and oxidation state of the
elements. This is called a bright field image. The Ru/Zeolite catalyst contains
particles below 1 nm in size, which are essentially invisible to TEM at least for this
instrument. In addition, the zeolite matrix was found to decompose under the focused
electron beam, resulting in images with low resolution. Therefore, an evaluation of
the Ru particles was not possible. For the Ru/Al2O3 catalyst, TEM characterization
was possible, since the Ru particle sizes were sufficiently large and the support was
stable under the electron beam. In order to obtain a reasonable statistics, at least
200 particles were evaluated with the ‘i-TEM’ program. The average particle size is
needed for the calculation of their dispersion on the catalysts support (see section
2.6), so that a turn-over frequency (TOF) can be calculated.
2.3 X-ray Photoelectron Spectroscopy (XPS)
24
2.3 X-ray Photoelectron Spectroscopy (XPS)
XPS is commonly and widely used to obtain information on the elemental
composition of surfaces and on the oxidation state of the particular elements in
catalysis and surface science [90-92]. The spectra presented in this work were
recorded by Dr. S. Kielbassa and Dr. T Diemant with a PHI 5800 ESCA system using
monochromatized Al-Kα radiation (1486 eV). In principle, the kinetic energy of the
photo electrons is measured after excitation of core level electrons by X-rays. The
kinetic energy is converted into a binding energy, which is element specific.
Eb = h�ν − Ekin − φ eq. 2.14
Ekin: kinetic energy of the photoelectron
Eb: binding energy of the photoelectron
φ: work function of the spectrometer
ν: frequency of the exciting irradiation
h: Planck’s constant
All spectra were recorded with a power of 250 W, an emission angle of 45° and with
an aperture size of 4 mm (acceptance angle ±5°, sampled size 1 mm). The detail
spectra of the elements of interest, here Ru, O, Si, Al and C, were recorded with a
pass energy of 23.5 eV. The scanning time differed, depending on the catalyst. For
the characterization of the Ru/zeolite catalyst, the measurement times were about 60
hours, in order to get an acceptable signal to noise ratio. For the Ru/Al2O3 catalyst
the respective measurement time was only 6 hours. Neutralization of the powder
samples was achieved by an electron gun with an emission current of 20µA. The
fitting parameters (FWHM: Full width at half maximum) for the Ru signals were
determined by measuring RuO2 and a metallic Ru single crystal under identical
conditions. Shirley background subtraction [91] and peak fitting were performed using
a public XPS peak fit program (XPSPEAK4.1). In order to remove shifts due to
surface charging effects, the binding energies were calibrated using the C (1s) peak
as reference (284.4 eV). Due to the interference of the C (1s) peaks with the Ru (3d)
signals, fits of the Ru (3p) peaks were performed based on the following
assumptions:
The peak positions for Ru0 and for Ru4+ corresponds to 461.3 and 462.3 eV
respectively [93]. The spin orbit splitting between Ru(3p3/2) and Ru(3p1/2) was 22.2
2.4 X-Ray Diffraction (XRD)
25
eV [93-95]. The intensity of the Ru(3p1/2) is half the intensity of the Ru(3p3/2) signal.
The FWHM is constant for all peaks and the Gauss-Lorentz ratio was not changed.
2.4 X-Ray Diffraction (XRD)
Catalyst properties as well as particle sizes of metallic nanoparticles can be studied
by XRD. This technique is based on the interference of X-rays upon passing through
a crystalline lattice where the diffracted radiation results in a diffractogram [89]. A Co
source is used to produce Co Kα radiation (electron acceleration voltage: 40.00 keV,
35 mA). If the diffracted plane waves are in phase, this results in constructive
interference and maxima are detected in the diffractogram. These signals allow the
evaluation of particle sizes via the Debye-Scherrer equation.
θβ
λcos*
*KL >=< eq. 2.15
where:
<L>: Measure for the dimension of the (single crystalline) particle in the
direction perpendicular to the reflecting plane
λ: X-ray wavelength
β: Peak width
θ: Angle between the beam and the normal on the reflecting area
K: Constant (0.9)
The XRD diffractograms were recorded and evaluated by Lionel Kroner at the
Institute of Micro and Nano Materials, Ulm University, using a Philips X’PERT D5000
diffractometer and the X’PERT Highscore Plus program.
2.5 Hydrogen chemisorption
26
2.5 Hydrogen chemisorption
The H2 chemisorption is a widely used indirect technique to assess the catalytically
active surface area of supported catalysts [96;97]. This method provides, besides X-
ray spectroscopic, diffractometric or electron microscopy techniques (XAS, XRD or
TEM) the possibility to obtain the metal dispersion and subsequently a mean particle
size. In principle, the catalyst characterization by H2 chemisorption is based on the
identification of the amount of adsorbed Had which is necessary to cover the
catalyst’s active surface by a monomolecular chemisorbed atomic layer (see also
DIN 66166). On the basis of this amount and under consideration of a defined
stoichiometry of the adsorbates and metal atoms (for Had on metals at RT: 0.7) it is
possible to calculate the specific active surface of the catalyst sample. If the
geometric parameters of the active particles are known, it is possible to calculate an
average metal (Ru) particle size.
However, in most cases these parameters are estimated, especially when disperse
catalysts are used, which may result in an overestimated active particle size and thus
in low dispersions. Normally, spherical or hemispherical particles are assumed [97].
The resulting particle sizes and dispersions obtained by this technique represent the
active surface area, which is accessible to the adsorbents and is not necessarily
identical to the whole particle surface area. Therefore the results (dispersions) may
differ when comparing to TEM or XAS derived dispersions, since the last two
techniques consider the whole particle as active surface.
Static volumetric H2 chemisorption isotherms on Ru supported catalysts were
measured by Dr. Volker Hagen and Susanne Buse (Univ. Bochum) using an
Autosorb 1C (Quantachrome, USA) machine. The catalysts were pre-treated in situ
under a flowing H2 stream (20 Nml�min-1, H2 grade 6.0) at 200°C for 3h.
Subsequently the catalyst was evacuated to UHV conditions and the temperature
was lowered to 25°C. Afterwards, defined amounts of H2 were introduced stepwise to
the sample cell. These amounts can be converted into a pressure, which would
occur, if no sample was present. The difference between the pressure calculated by
this way and the pressure measured after admission, leads to the adsorbed amount
of H2 on the catalyst. The measurements were conducted in a range between 80-800
Torr. The obtained isotherm contains contributions of physisorbed and chemisorbed
Had on the active surface. Additional evacuation and remeasuring of the same
2.6 Dispersion and TOF calculation
27
catalyst results in the amount of only physisorbed Had, since the chemisorbed Had will
still be present on the catalyst. Subtraction of the two values gives the amount of
chemisorbed hydrogen atoms, which correlates with the active surface area. The
latter is calculated from the known catalyst loading and the assumption of 70% Had
coverage and a Ru atom cross-section of 8.17Å2 [98]. The data evaluation was
performed using the Quantachrome software package.
2.6 Dispersion and TOF calculation
For catalyst characterization and comparison it is important to gain information on the
dispersion to calculate a mass and molar independent reactivity. A frequently used
unit is the turnover frequency, which displays the reactivity of a catalyst to convert an
educt per time (TOF). For the calculation of the catalyst’s dispersion it is inevitable to
know the particle size of the catalytically active species (here: Ru particles), which
can be measured by the techniques discussed above. Bergeret et al. [97] suggested
that the dispersion of small particles (< 2 nm) depends to a great extent on the
particle shape. In case of Ru model catalysts, the particle shape can be investigated
easily and therefore taken into account for the dispersion calculation. It is however
almost impossible to investigate the particle shape of the active metal on dispersed
catalysts, especially when the particles are very small (≤ 1 nm). Due to these reasons
a hemispherical particle shape is assumed for the dispersed catalysts investigated
(as it is done by numerous research groups), even for the ones with very small
nanoparticles (2.2 wt.% Ru/zeolite, 0.9 nm particle diameter), in order to be
comparable to former publications [98]. The dispersion can be calculated as follows
[88].
2
··4 2rS particle
π= eq. 2.16
6
··4 3rVparticle
π= eq. 2.17
atom
particle
atomssurfaceC
SN =− '' eq. 2.18
atom
particle
atomsvolumeV
VN =− '' eq. 2.19
''
''
atomvolume
atomsurface
N
ND
−
−= eq. 2.20
2.7 Diffuse Reflectance Infrared Fourier Transform Spectroscopy (DRIFTS)
28
where:
Sparticle : mean particle surface
Vparticle : mean particle volume
r: mean particle radius
N’surface-atoms’ number of surface atoms
N’volume-atoms:’ number of volume atoms
Catom: Ru atom cross-section
Vatom: volume of a Ru atom
D: dispersion
For the Ru atom cross-section the same value as in the H2 chemisorption
measurements is taken (8.17A2) [98].
A dispersion close to 1 represents a small cluster, where all atoms are surface
atoms, whereas a lower dispersion denotes the fraction of surface atoms relative to
all volume atoms.
The turnover frequency, as a molar and mass independent unit, is calculated as
follows:
D
MrTOF Ru·
= eq. 2.21
whereas:
TOF: turnover frequency [s-1]
r: reaction rate
⋅ sg
mol
Ru
MRu: molar mass Ruthenium
mol
g
D: dispersion
2.7 Diffuse Reflectance Infrared Fourier Transform
Spectroscopy (DRIFTS)
In situ IR measurements were performed in a DRIFTS configuration with a Magna
6700 spectrometer (Thermo Fisher), equipped with a MCT narrow band detector and
a commercial in situ reaction cell unit from Harricks (HV-DR2) at atmospheric
pressure. This common set-up allows measurements under flowing reaction
atmospheres, comparable to the conditions in a plug-flow micro reactor, and at
elevated temperatures (maximum 400°C). About 25 mg of catalyst mass diluted 1:5
2.7 Diffuse Reflectance Infrared Fourier Transform Spectroscopy (DRIFTS)
29
with α-Al2O3 (Aldrich Al2O3 fused 325 mesh, 99+%) were used in each experiment.
This resulted in an optimum reflectivity value to assure a maximum signal-to-noise
ratio. Typically, 20 scans (acquisition time 9 s plus 3 s for data saving) at a nominal
resolution of 4 cm-1 were added for one spectrum under conditions where fast
changes (reaction transients) were expected (first 10 min of reaction). Subsequently
400 scans (acquisition time 4 min 8 s plus 3 s for data saving) at a nominal resolution
of 4 cm-1 were added for one spectrum, under conditions, where changes in the build
up of surface products are expected to be small (~steady-state conditions). Prior to
the experiments, background spectra were recorded on the freshly heated catalyst at
150°C under pure N2 flow (41.6 Nml�min-1). Subsequently, the gases were switched
to reaction atmosphere and heated to the reaction temperature (190°C). Afterwards,
the reaction spectrum is divided by the background spectrum to obtain a DRIFTS
spectrum. The changes in reflectivity due to the small temperature difference were
negligible as they only had a marginal influence on the evolving signals. The
intensities were evaluated in Kubelka Munk units, which are linearly related to the
adsorbate concentration [99-102]. For further details on the apparatus and the theory
I refer to the PhD thesis of M. Schubert [84].
The Kubelka Munk function is defined as:
s
K
R
RRf =
−=
∞
∞∞
·2
)1()(
2
eq. 2.22
where :
)( ∞Rf : Kubelka Munk function
∞R : diffuse reflection of an infinite thick sample
K: absorption coefficient
S: scattering coefficient (constant in most cases)
∞R is defined as
)(
)(
backgroundI
sampleIR
∞
∞∞ = eq. 2.23
The linear relationship between the Kubelka Munk function (signal intensity) and the
concentration of the adsorbate is given by the absorption coefficient (K), which can
also be written as
cconstK ·.·ε= eq. 2.24
2.7 Diffuse Reflectance Infrared Fourier Transform Spectroscopy (DRIFTS)
30
where
ε: absorption coefficient of the analyte
c: concentration of the analyte
For weakly adsorbed species (relative reflectivity larger 0.6) Sirita et al. [101]
suggested a different evaluation. In their work, the reflectivity is defined as follows:
∞
=R
RR ' eq. 2.25
0I
IR adcat+= eq. 2.26
0I
IR cat=∞ eq. 2.27
where
R’: relative reflectivity
Icat+ad: intensity during reaction
I0: intensity of a nonabsorbing sample (mirror)
Icat: intensity of the background
The resulting spectra are presented in log(1/R’) vs. wave number. Since the
adsorbed species reported and discussed in this work do not comply (relative
reflectivity is lower than 0.6) with the preconditions of Sirita et al. all spectra
presented here are evaluated with the Kubelka Munk function.
2.8 X-ray Absorption Spectroscopy (XAS)
31
2.8 X-ray Absorption Spectroscopy (XAS)
X-ray Absorption Spectroscopy (XAS) is a powerful technique which allows
elucidating catalyst changes during reaction (in situ). The most valuable information
obtained from these experiments is the chemical composition and the electronic
structure of the catalyst. In principle, XAS probes the local structure around all atoms
of a particular element at any temperature and pressure. Information on the number
of neighbors, atom-atom distances and disorder can be derived which allows to
reconstruct the structure. Additionally, XAS spectra give information on the local
density of states as the total number of unfilled states in the valence band is
proportional to the integrated area of the absorption edge [103]. However, since in
XAS experiments all atoms of one species contribute to the resulting spectrum, the
information gained is only an average over all contributions. In the following, a short
introduction on how synchrotron radiation is produced will be given. Next, the theory
of the electron transition and EXAFS (Extended X-ray Absorption Fine Structure) is
explained and in the last part of this section the evaluation of the raw data will be
described.
2.8.1 Technical preconditions
A precondition to perform XAS experiments is the availability of tuneable, high
brilliance X-rays. These conditions are met at electron storage rings, where radiation
is generated by acceleration of electrons or positrons, which move at a circular track
forced by deviation magnets. Once these particles have been accelerated to near the
speed of light in accelerator rings, they are transferred to a storage ring, where the
high energy of the particle is kept constant. This corresponds to a steady
acceleration of the particles to the center of the circuit; the necessitated additional
kinetic energy for the acceleration is emitted by the particles tangent in form of broad
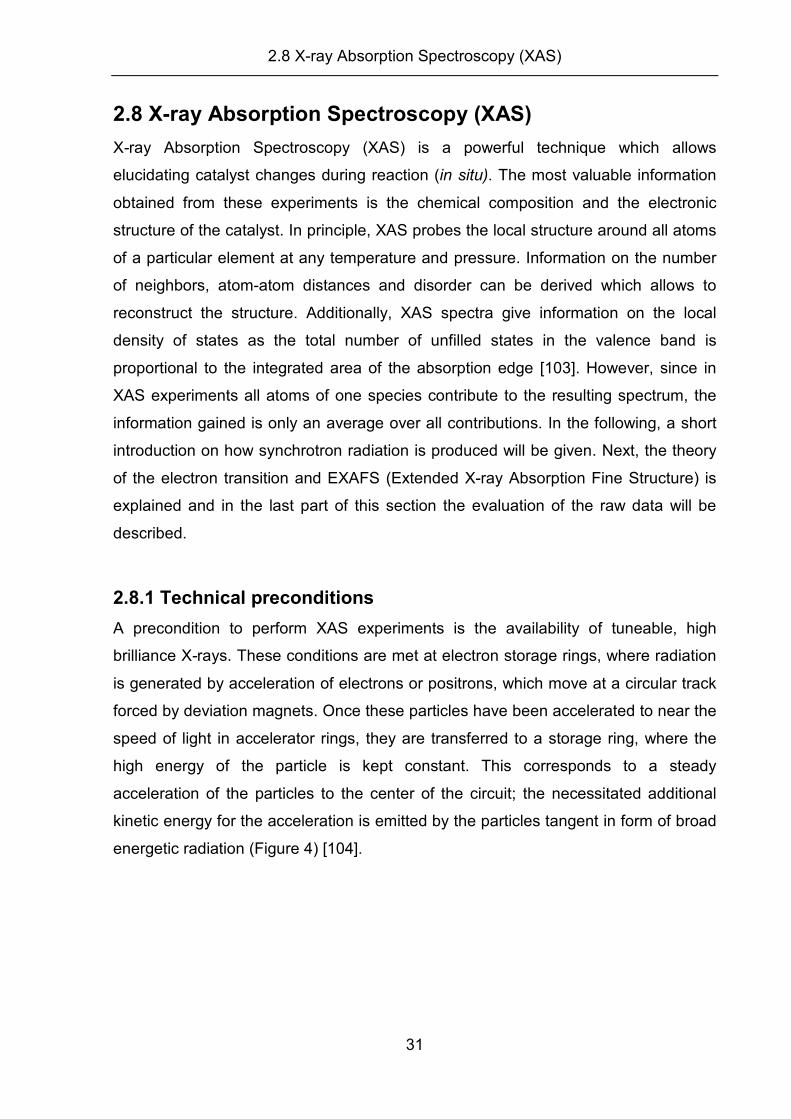
energetic radiation (Figure 4) [104].
2.8 X-ray Absorption Spectroscopy (XAS)
32
Figure 4: Sketch of the tangent emitted synchrotron radiation
Due to the acceleration with high frequencies, the charged particles are concentrated
into small bunches. Radiation is only emitted when a respective bunch passed the
respective section of the storage ring. With the use of special insertion devices
(Undulators) [104], the synchrotron radiation can be enhanced, by forcing the
electron bunches on a sinusoidal track. This additional acceleration results in an
enhanced radiation. Undulators consist of dipole magnets, which are periodically
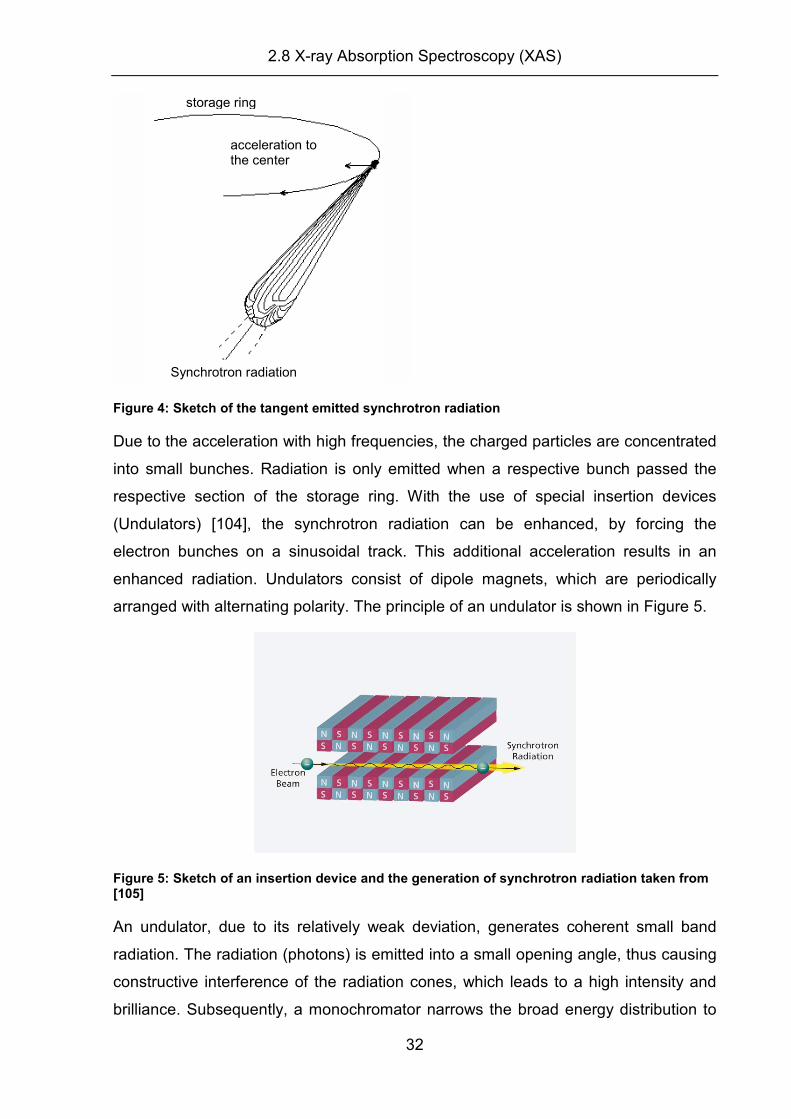
arranged with alternating polarity. The principle of an undulator is shown in Figure 5.
Figure 5: Sketch of an insertion device and the generation of synchrotron radiation taken from [105]
An undulator, due to its relatively weak deviation, generates coherent small band
radiation. The radiation (photons) is emitted into a small opening angle, thus causing
constructive interference of the radiation cones, which leads to a high intensity and
brilliance. Subsequently, a monochromator narrows the broad energy distribution to
storage ring
acceleration to the center
Synchrotron radiation
2.8 X-ray Absorption Spectroscopy (XAS)
33
the required energy range, and the beam is focused onto the sample. For more
details see [104].
2.8.2 Physical principles of the electron transition
The basic principle of X-ray Absorption Spectroscopy is the interaction of photons
with matter. When an X-ray photon penetrates matter, elastic and inelastic interaction
between radiation and electrons of the atoms occur in addition to photoabsorption.
Therefore, the intensity of the incoming beam is reduced after passing through
matter. X-ray radiation is usually continuously absorbed along the energy spectrum,
and at specific energetic values a discontinuity (absorption edge) can be observed
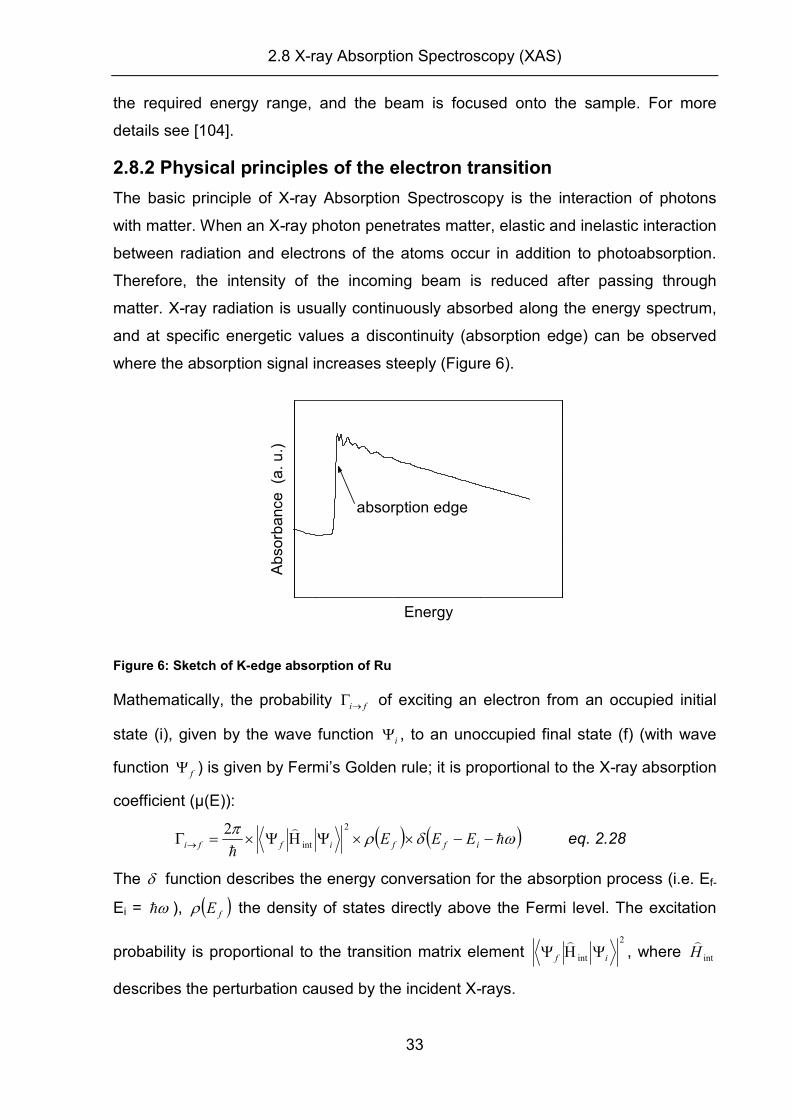
where the absorption signal increases steeply (Figure 6).
absorption edge
Energy
Ab
sorb
ance
(a
. u
.)
Figure 6: Sketch of K-edge absorption of Ru
Mathematically, the probability fi→Γ of exciting an electron from an occupied initial
state (i), given by the wave function iΨ , to an unoccupied final state (f) (with wave
function fΨ ) is given by Fermi’s Golden rule; it is proportional to the X-ray absorption
coefficient (µ(E)):
( ) ( )ωδρπ
h)
h−−××ΨΗΨ×=Γ→ iffiffi EEE
2
int
2 eq. 2.28
The δ function describes the energy conversation for the absorption process (i.e. Ef-
Ei = ωh ), ( )fEρ the density of states directly above the Fermi level. The excitation
probability is proportional to the transition matrix element 2
int if ΨΗΨ)
, where intH)
describes the perturbation caused by the incident X-rays.
2.8 X-ray Absorption Spectroscopy (XAS)
34
The interaction operator is approximated by the coulomb gauge:
pAm
eH
e
·int −≈)
eq. 2.29
∇−=r
hip .
where p represents the electron momentum operator and A describes the vector
potential of the electromagnetic field. The vector potential is described by:
( ){ } ( ){ }[ ]trkitrkieAtrA ωω −−+−= ·exp·exp),( 0 eq. 2.30
Here, ‘ er
’ represents the polarization vector of the field. From those terms, only the
left one (e-iωt) is important, as it describes the absorption process. Developing this
term in a Taylor series results in:
++−−= ...)·(2
1·1exp·),( 2
0 rikriktiAetrA ω eq. 2.31
The resulting equation describes the electrical dipole, electrical quadrupole and
magnetic dipole transitions. In the dipole approximation only the first term is
considered. Therefore inserting equation 2.31 and 2.29 in equation 2.28 results in:
( ) ( )ωδρπ
hh
−−××ΨΨ×
−=Γ→ iff
e
fi EEEipefAm
e 22
0
2
·2
eq. 2.32
which shows the details of the interaction operator. It consists of the final state, the
electron momentum operator and the vector potential, which define if a transition is
allowed or not [106], [104]. As the final state is defined as
redbackscatteoutgoingf Ψ+Ψ=Ψ eq. 2.33
and both contributions to the final state are a function of energy of the incident beam,
the transition probability Γ is not a smooth function above the absorption edge, but
results in maxima and minima that constitute the EXAFS signal.
2.8 X-ray Absorption Spectroscopy (XAS)
35
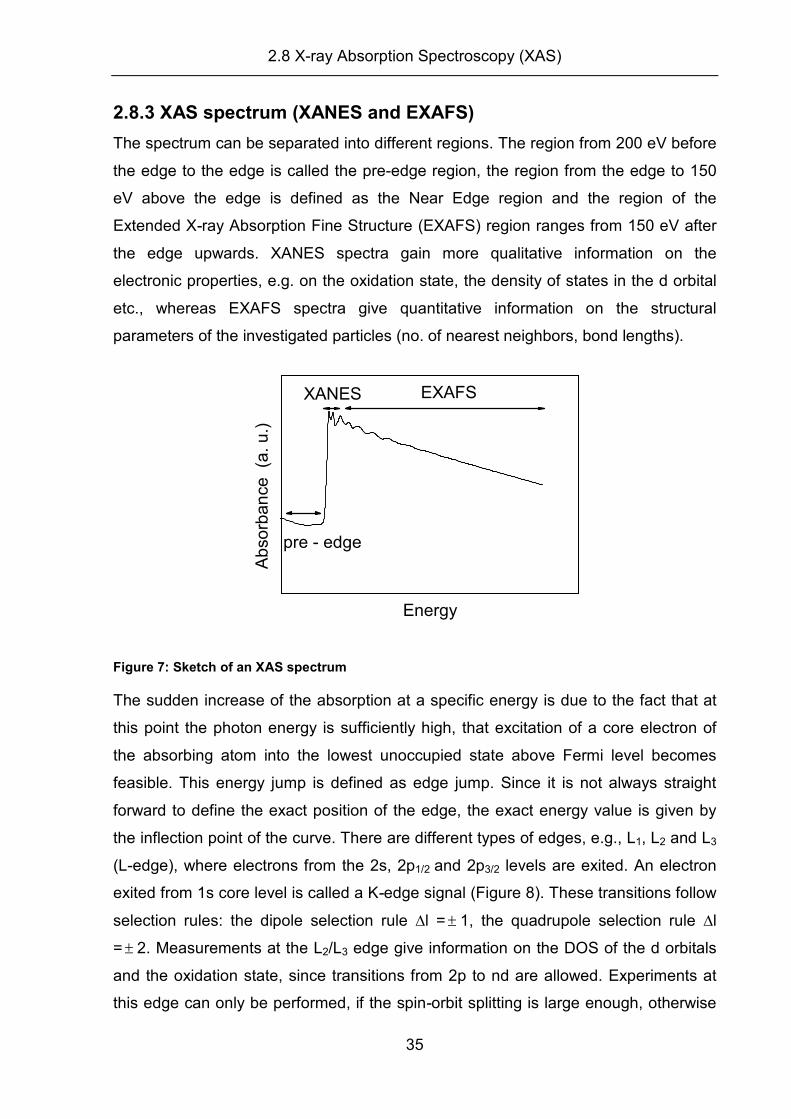
2.8.3 XAS spectrum (XANES and EXAFS)
The spectrum can be separated into different regions. The region from 200 eV before
the edge to the edge is called the pre-edge region, the region from the edge to 150
eV above the edge is defined as the Near Edge region and the region of the
Extended X-ray Absorption Fine Structure (EXAFS) region ranges from 150 eV after
the edge upwards. XANES spectra gain more qualitative information on the
electronic properties, e.g. on the oxidation state, the density of states in the d orbital
etc., whereas EXAFS spectra give quantitative information on the structural
parameters of the investigated particles (no. of nearest neighbors, bond lengths).
pre - edge
EXAFSXANES
Energy
Ab
sorb
an
ce (a
. u
.)
Figure 7: Sketch of an XAS spectrum
The sudden increase of the absorption at a specific energy is due to the fact that at
this point the photon energy is sufficiently high, that excitation of a core electron of
the absorbing atom into the lowest unoccupied state above Fermi level becomes
feasible. This energy jump is defined as edge jump. Since it is not always straight
forward to define the exact position of the edge, the exact energy value is given by
the inflection point of the curve. There are different types of edges, e.g., L1, L2 and L3
(L-edge), where electrons from the 2s, 2p1/2 and 2p3/2 levels are exited. An electron
exited from 1s core level is called a K-edge signal (Figure 8). These transitions follow
selection rules: the dipole selection rule ∆l =± 1, the quadrupole selection rule ∆l
=± 2. Measurements at the L2/L3 edge give information on the DOS of the d orbitals
and the oxidation state, since transitions from 2p to nd are allowed. Experiments at
this edge can only be performed, if the spin-orbit splitting is large enough, otherwise
2.8 X-ray Absorption Spectroscopy (XAS)
36
EXAFS experiments are not possible (only XANES, as for Ru). Moreover, if the L2 or
L3 edge energy is below 4 keV, the experiments can only be conducted under
vacuum conditions, since absorption of N2 would be too high otherwise. The
measurements presented in this work were measured at the Ru K-edge due to the
latter reasons. When measuring at the K edge, only transitions from 1s to np (here:
5p) energy levels are allowed. Hence, no information on the d-band structure can be
obtained. However, since the shape of the edge also correlates with the oxidation
state of the sample, conclusions on the oxidation state of the sample can be drawn
by comparison with known reference compounds.
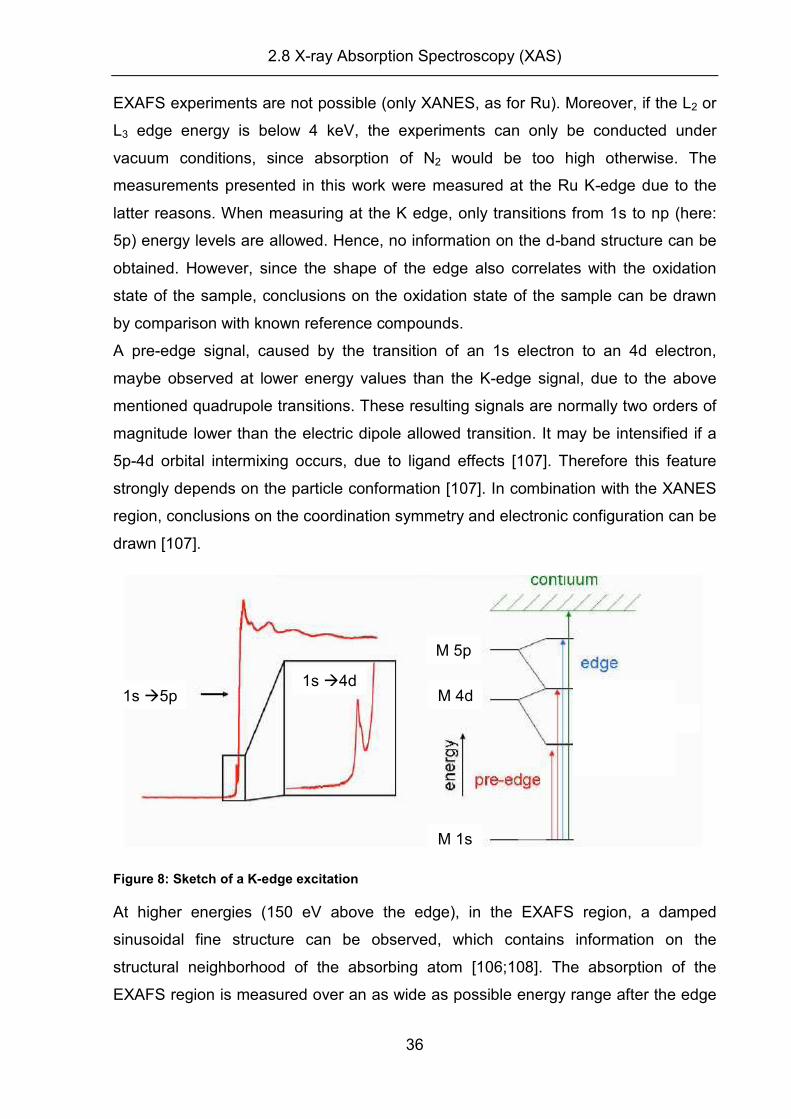
A pre-edge signal, caused by the transition of an 1s electron to an 4d electron,
maybe observed at lower energy values than the K-edge signal, due to the above
mentioned quadrupole transitions. These resulting signals are normally two orders of
magnitude lower than the electric dipole allowed transition. It may be intensified if a
5p-4d orbital intermixing occurs, due to ligand effects [107]. Therefore this feature
strongly depends on the particle conformation [107]. In combination with the XANES
region, conclusions on the coordination symmetry and electronic configuration can be
drawn [107].
1s �5p1s �4d
M 5p
M 4d
M 1s
L 4p
1s �5p1s �4d
M 5p
M 4d
M 1s
L 4p
Figure 8: Sketch of a K-edge excitation
At higher energies (150 eV above the edge), in the EXAFS region, a damped
sinusoidal fine structure can be observed, which contains information on the
structural neighborhood of the absorbing atom [106;108]. The absorption of the
EXAFS region is measured over an as wide as possible energy range after the edge
2.8 X-ray Absorption Spectroscopy (XAS)
37
jump (500-1500 eV), in order to gain a sufficiently detailed spectrum. The details of
the EXAFS theory will be explained in the next section.
2.8.4 EXAFS: mathematical description
When a photon, defined by the frequency ω, hits matter it is usually absorbed. The
degree of absorption in principle follows the Lambert-Beer Law (eq. 2.34) with the
absorption depending on the energy of the photons.
xE
t eII )(
0
µ−= eq. 2.34
where µ = absorption coefficient
x = sample thickness
Upon absorption of an X-ray photon by matter an electron with mass me may be
emitted from a core level (Eb) of the absorbing atom if the photon energy is higher
than the edge energy. The kinetic energy (Ek) of the emitted electron is defined by:
bk EE −= ωh eq. 2.35
In order to describe the following scattering process, the electron is usually regarded
as a wave which interacts with neighbouring atoms, resulting in the extended X-ray
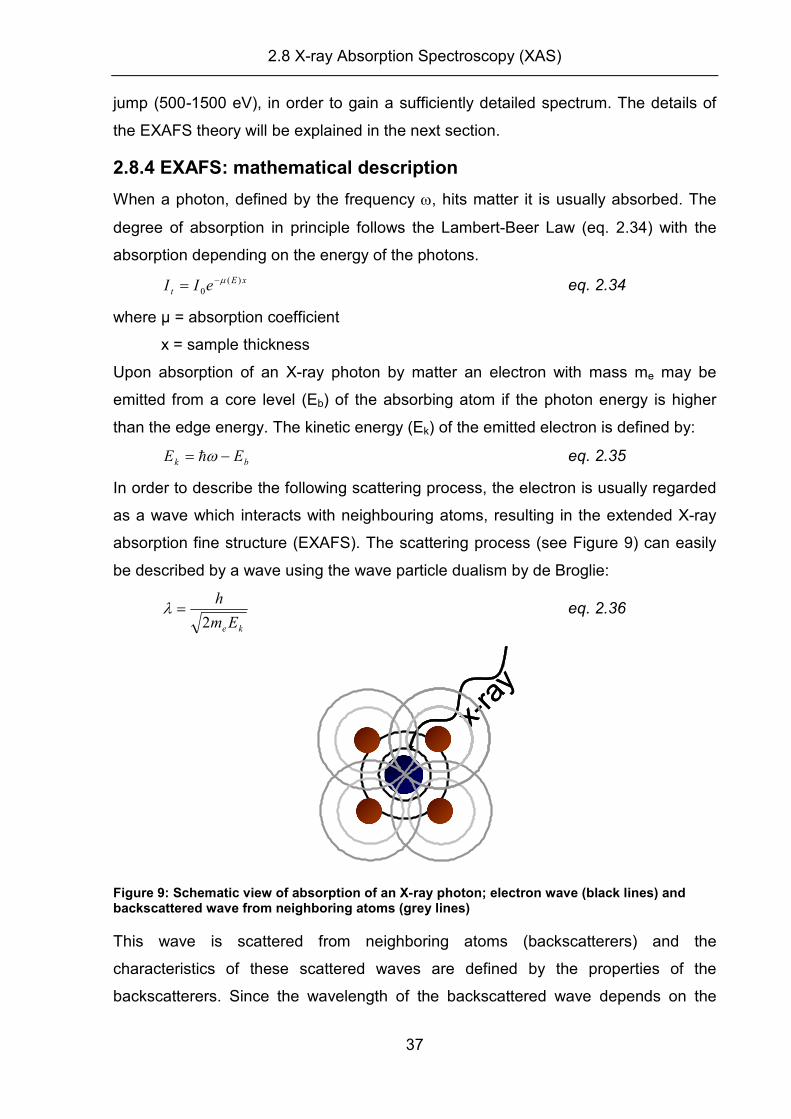
absorption fine structure (EXAFS). The scattering process (see Figure 9) can easily
be described by a wave using the wave particle dualism by de Broglie:
keEm
h
2=λ eq. 2.36
x-ra
yx-
ray
Figure 9: Schematic view of absorption of an X-ray photon; electron wave (black lines) and backscattered wave from neighboring atoms (grey lines)
This wave is scattered from neighboring atoms (backscatterers) and the
characteristics of these scattered waves are defined by the properties of the
backscatterers. Since the wavelength of the backscattered wave depends on the
2.8 X-ray Absorption Spectroscopy (XAS)
38
kinetic energy of the photoelectron (and thus finally on the incident energy), a
dependence of the absorption coefficient on the energy arises from that, resulting in
local minima and maxima (constructive and destructive interference) in the EXAFS
spectrum [103]. In addition, the EXAFS oscillations depend on the number of
neighbors, where a higher density of neighboring atoms result in higher amplitude of
the EXAFS oscillation, since more scattering processes contribute to the resulting
signal. However, a too dense sample will result in a too high absorption coefficient
and eventually in a low signal. Second, if there is a high degree of disorder in the
system, i.e., if the scatterers are at different distances, different patterns will be
generated, which cause a decrease in the EXAFS amplitude. This, in turn, results in
poor quality data, which can hardly be evaluated. The same effect is observed when
experiments are conducted at higher temperatures, due to an increased oscillation
(∆σ) of the atoms. This interference increases with increasing photon energies; at
high energies the EXAFS oscillations decay faster.
The main information gained from the EXAFS signal is the number of backscatterers
(N), their distance from the absorber (R) and their displacement given by the Debye
Waller factor (σ).
The EXAFS function itself is described as:
( )∑ +−
−=
)(22
2
2
0 ))(2·sin(2·exp2
·exp)·()(shellsN
j
jj
j
j
jj kkRkR
kR
SkFNk ϕσ
λχ eq. 2.37
where N: coordination number
σ : Debye Waller factor
S02: damping factor
Fj’: scattering power of the neighbor
φ: phase shift
λ: mean free path of the photoelectrons
R: distance between absorber/scatterer pair.
The probability of the scattering processes depends on Fj’ (see eq. 2.37), which is
element specific and a function of energy [103]. S02 has values between 0.7 and 0.9,
since usually between 10% and 30% of the ejected electrons do not contribute to the
EXAFS, as they take part in shake up/shake off processes. φeff describes the phase
shift when the electron wave is scattered once by the absorber and once by the
scatterer [103]. The local structure around the absorber is described by R
2.8 X-ray Absorption Spectroscopy (XAS)
39
representing the scatterer / backscatterer distance, N the number of neighbors, the
intensity decrease of the EXAFS spectrum with increasing disorder of the scatterers
is characterized by σ and is sample specific. The remaining parameters in eq. 2.37
are element specific and can be obtained from calculations, tables or extracted from
EXAFS spectra of reference compounds [103]. In order to compensate for the
sinusoidal damping and to obtain a uniform amplitude, the EXAFS spectra are
weighted by a certain factor before the evaluation. For systems with absorbers
containing an atomic number Z>36, a k3 weighting is used. Absorbers with atomic
numbers between 36<Z<57, k2 weighting is applied, and a k1 weighting is used for
higher values of Z. However, a higher weighting causes the noise to increase in
spectral regions with higher k values, which has to be accounted for during the fitting
process.
2.8.5 Sample preparation and experiment
XAS experiments presented in this work were conducted at HASYLAB (Beamline X1)
and ESRF (Beamline DUBBLE) at an energy range of 20917-22117 eV. The EXAFS
experiments were performed at the X1 beamline at Hasylab and BM26 at ESRF,
using a Si(311) double crystal monochromator and a beam size of approximately
6 mm vertical and 2 mm horizontal. The monochromator was stabilized by a
MOSTAB system, which keeps the two monochromator crystals parallel in lateral
direction by piezo crystals. The reaction cell consisted of a stainless steel ring with a
cylindrical channel (i.d. 4 mm) along the diameter, which contained the catalyst bed
(length ca. 10 mm, ~25 mg catalyst, undiluted, conversion <15%) (see Figure 10)
2.8 X-ray Absorption Spectroscopy (XAS)
40
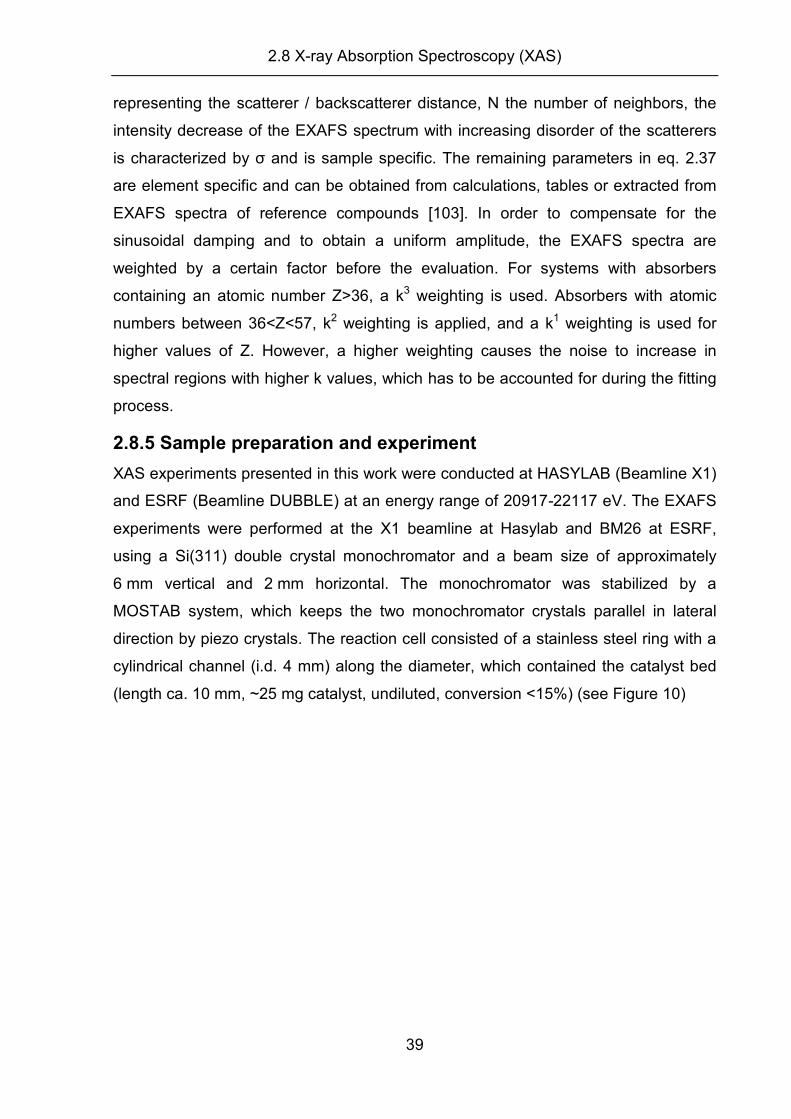
Figure 10: Sketch of the XAS reaction cell
A second bore along the central axis of the ring and perpendicular to the catalyst
bed, allowed the X-ray beam to pass through the catalyst bed. In these directions,
the reaction cell was closed by two Kapton windows. Sample heating was achieved
by 4 wires, which passed through the ring in 4 small bores parallel to the reaction
channel. A NiCr/Ni thermocouple was used to monitor the temperature. The reaction
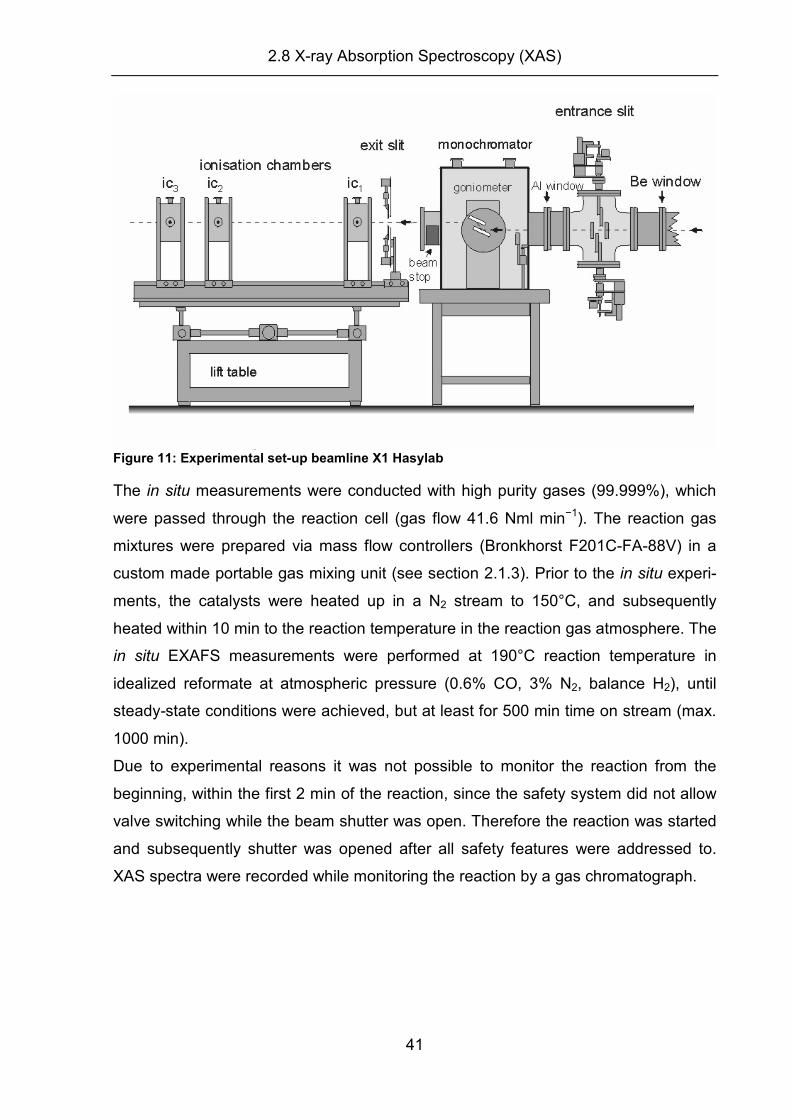
cell was placed between two He filled ionization chambers (ic1 and ic2) for collecting
the spectra at the Ru K-edge (22117 eV) in transmission geometry. A Ru metal foil
placed in between the second and a subsequent third ionization chamber (Ic3)
allowed for internal energy calibration during all measurements. A scheme of the set-
up is shown in Figure 11. The pre-edge region was measured from 21867-22087 eV,
with a step size of 10 eV, for the XANES region from 22087 to 22157 eV, in steps of
0.5 eV, and for the EXAFS region from 22157 to 23317 eV in steps of 0.98 eV.
2.8 X-ray Absorption Spectroscopy (XAS)
41
Figure 11: Experimental set-up beamline X1 Hasylab
The in situ measurements were conducted with high purity gases (99.999%), which
were passed through the reaction cell (gas flow 41.6 Nml min−1). The reaction gas
mixtures were prepared via mass flow controllers (Bronkhorst F201C-FA-88V) in a
custom made portable gas mixing unit (see section 2.1.3). Prior to the in situ experi-
ments, the catalysts were heated up in a N2 stream to 150°C, and subsequently
heated within 10 min to the reaction temperature in the reaction gas atmosphere. The
in situ EXAFS measurements were performed at 190°C reaction temperature in
idealized reformate at atmospheric pressure (0.6% CO, 3% N2, balance H2), until
steady-state conditions were achieved, but at least for 500 min time on stream (max.
1000 min).
Due to experimental reasons it was not possible to monitor the reaction from the
beginning, within the first 2 min of the reaction, since the safety system did not allow
valve switching while the beam shutter was open. Therefore the reaction was started
and subsequently shutter was opened after all safety features were addressed to.
XAS spectra were recorded while monitoring the reaction by a gas chromatograph.
2.8 X-ray Absorption Spectroscopy (XAS)
42
2.8.6 EXAFS evaluation
The evaluation of XAS spectra will be explained in the following section. In principle,
the procedure can be separated into three different steps:
(i) Data reduction
(ii) Generation of reference spectra
(iii) Fitting process
All of these steps were performed with the commercially available software ‘XDAP’.
The calculation of theoretical references was performed with the software ATOMS
and FEFF8.0.
(i) Data reduction: Before the EXAFS spectra (sample or reference) can be
evaluated, different steps have to be performed in order to obtain a good quality ‘pre-
edge and background subtracted’, normalized EXAFS spectrum. In ‘XDAP’, all of
these steps can be performed under the tab ‘data reduction’, which opens a menu
where the user is guided through a step by step process.
The general principle of the data reduction is described by the following function:
)(
)()()()(
0
0
E
EPEEk
µµµµ
χ−−
= eq. 2.38
where µ(E): uncorrected spectrum
µ(PE): pre-edge subtracted spectrum
µ0(E): background subtracted spectrum
(a) Pre-edge subtraction, edge jump and deglitching:
A raw XAS spectrum consists of the sum of:
(i) absorption of other atoms in the sample
(ii) absorption of the probed atom due to absorption at lower edges
(iii) the actual absorption edge, which consists of the atomic absorption and the
superimposed EXAFS.
Hence, to obtain the desired EXAFS signal from the measured absorption the ‘pre-
edge’ has to be subtracted from the measured absorption to account for absorption
by other atoms and the absorption of lower edges of the probed atom. It is accurately
modelled with a Victoreen curve [103]:
4
3
3
21)(
E
C
E
CCPE ++=µ eq. 2.39
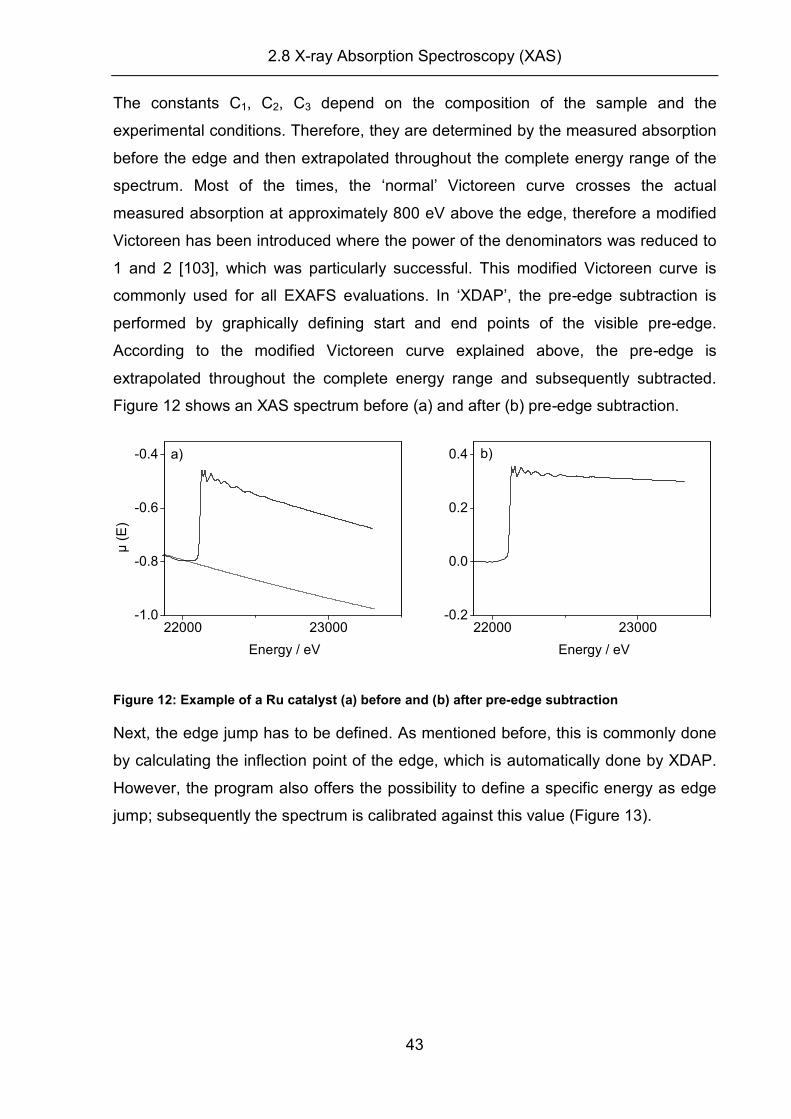
2.8 X-ray Absorption Spectroscopy (XAS)
43
The constants C1, C2, C3 depend on the composition of the sample and the
experimental conditions. Therefore, they are determined by the measured absorption
before the edge and then extrapolated throughout the complete energy range of the
spectrum. Most of the times, the ‘normal’ Victoreen curve crosses the actual
measured absorption at approximately 800 eV above the edge, therefore a modified
Victoreen has been introduced where the power of the denominators was reduced to
1 and 2 [103], which was particularly successful. This modified Victoreen curve is
commonly used for all EXAFS evaluations. In ‘XDAP’, the pre-edge subtraction is
performed by graphically defining start and end points of the visible pre-edge.
According to the modified Victoreen curve explained above, the pre-edge is
extrapolated throughout the complete energy range and subsequently subtracted.
Figure 12 shows an XAS spectrum before (a) and after (b) pre-edge subtraction.
22000 23000-1.0
-0.8
-0.6
-0.4
Energy / eV
µ (
E)
a)
22000 23000-0.2
0.0
0.2
0.4
Energy / eV
b)
Figure 12: Example of a Ru catalyst (a) before and (b) after pre-edge subtraction
Next, the edge jump has to be defined. As mentioned before, this is commonly done
by calculating the inflection point of the edge, which is automatically done by XDAP.
However, the program also offers the possibility to define a specific energy as edge
jump; subsequently the spectrum is calibrated against this value (Figure 13).
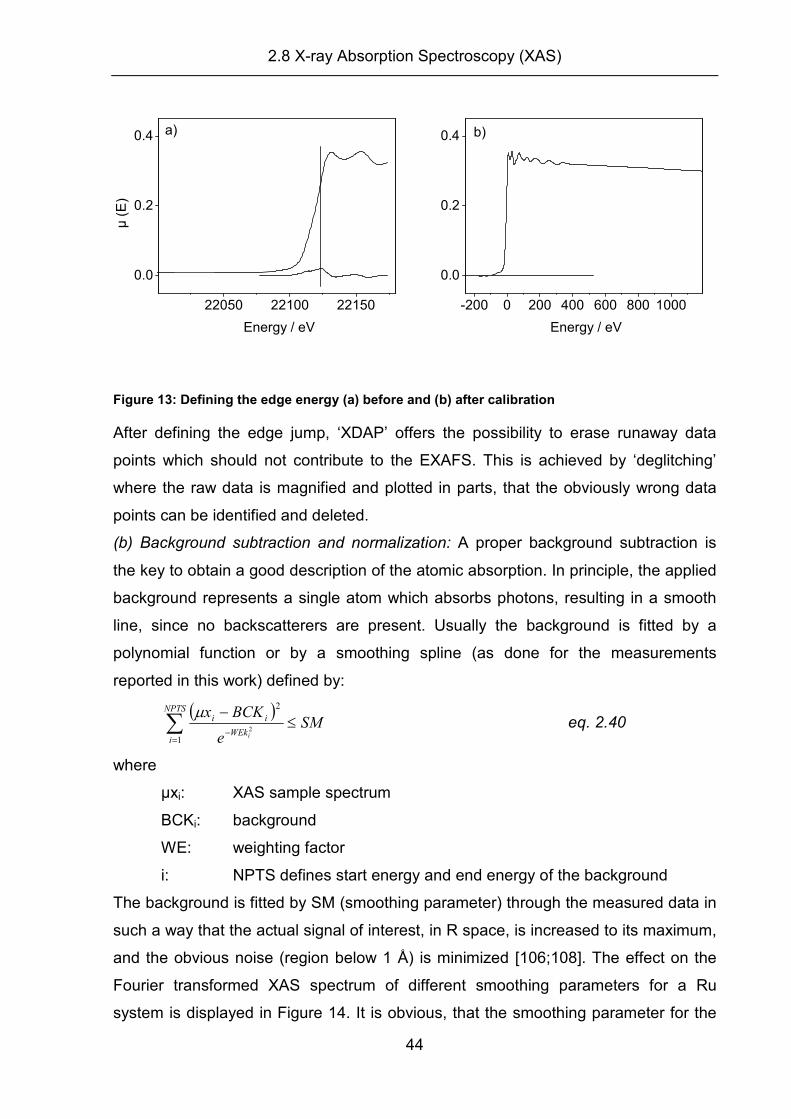
2.8 X-ray Absorption Spectroscopy (XAS)
44
22050 22100 22150
0.0
0.2
0.4 a) µ
(E
)
Energy / eV
-200 0 200 400 600 800 1000
0.0
0.2
0.4 b)
Energy / eV
Figure 13: Defining the edge energy (a) before and (b) after calibration
After defining the edge jump, ‘XDAP’ offers the possibility to erase runaway data
points which should not contribute to the EXAFS. This is achieved by ‘deglitching’
where the raw data is magnified and plotted in parts, that the obviously wrong data
points can be identified and deleted.
(b) Background subtraction and normalization: A proper background subtraction is
the key to obtain a good description of the atomic absorption. In principle, the applied
background represents a single atom which absorbs photons, resulting in a smooth
line, since no backscatterers are present. Usually the background is fitted by a
polynomial function or by a smoothing spline (as done for the measurements
reported in this work) defined by:
( )
∑=
−≤
−NPTS
iWEk
ii SMe
BCKx
i1
2
2
µ eq. 2.40
where
µxi: XAS sample spectrum
BCKi: background
WE: weighting factor
i: NPTS defines start energy and end energy of the background
The background is fitted by SM (smoothing parameter) through the measured data in
such a way that the actual signal of interest, in R space, is increased to its maximum,
and the obvious noise (region below 1 Å) is minimized [106;108]. The effect on the
Fourier transformed XAS spectrum of different smoothing parameters for a Ru
system is displayed in Figure 14. It is obvious, that the smoothing parameter for the
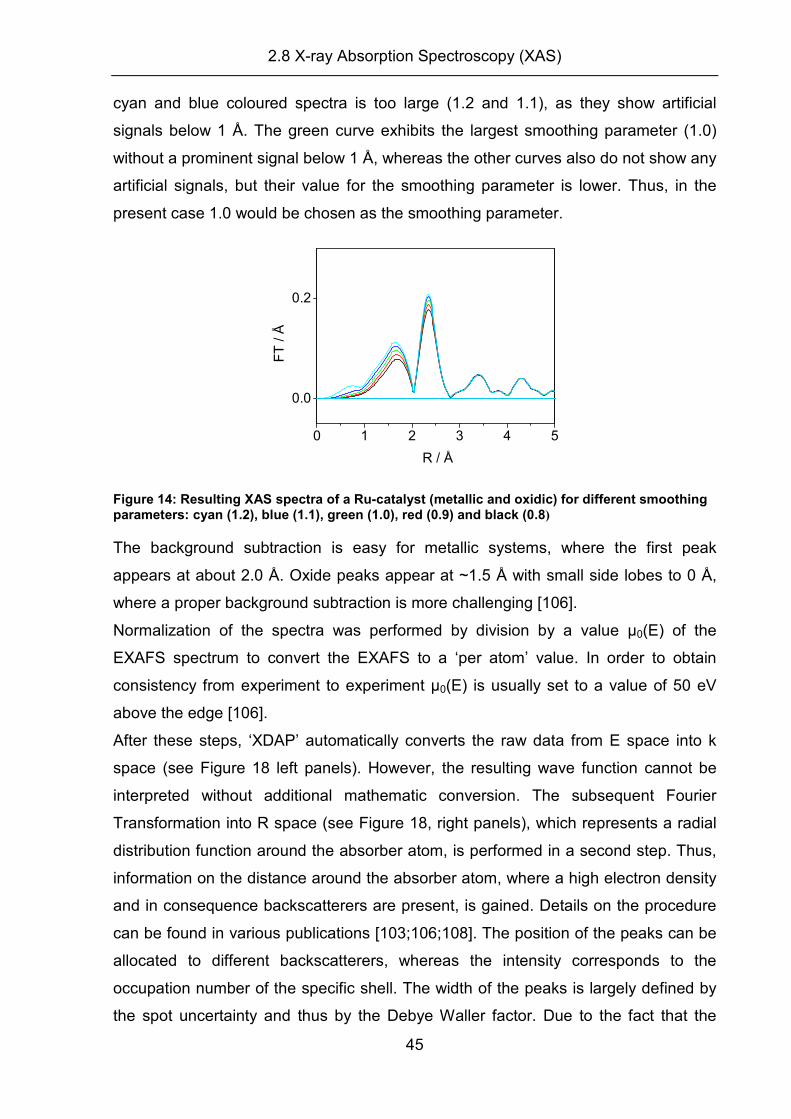
2.8 X-ray Absorption Spectroscopy (XAS)
45
cyan and blue coloured spectra is too large (1.2 and 1.1), as they show artificial
signals below 1 Å. The green curve exhibits the largest smoothing parameter (1.0)
without a prominent signal below 1 Å, whereas the other curves also do not show any
artificial signals, but their value for the smoothing parameter is lower. Thus, in the
present case 1.0 would be chosen as the smoothing parameter.
0 1 2 3 4 5
0.0
0.2
FT
/ Å
R / Å
Figure 14: Resulting XAS spectra of a Ru-catalyst (metallic and oxidic) for different smoothing parameters: cyan (1.2), blue (1.1), green (1.0), red (0.9) and black (0.8)
The background subtraction is easy for metallic systems, where the first peak
appears at about 2.0 Å. Oxide peaks appear at ~1.5 Å with small side lobes to 0 Å,
where a proper background subtraction is more challenging [106].
Normalization of the spectra was performed by division by a value µ0(E) of the
EXAFS spectrum to convert the EXAFS to a ‘per atom’ value. In order to obtain
consistency from experiment to experiment µ0(E) is usually set to a value of 50 eV
above the edge [106].
After these steps, ‘XDAP’ automatically converts the raw data from E space into k
space (see Figure 18 left panels). However, the resulting wave function cannot be
interpreted without additional mathematic conversion. The subsequent Fourier
Transformation into R space (see Figure 18, right panels), which represents a radial
distribution function around the absorber atom, is performed in a second step. Thus,
information on the distance around the absorber atom, where a high electron density
and in consequence backscatterers are present, is gained. Details on the procedure
can be found in various publications [103;106;108]. The position of the peaks can be
allocated to different backscatterers, whereas the intensity corresponds to the
occupation number of the specific shell. The width of the peaks is largely defined by
the spot uncertainty and thus by the Debye Waller factor. Due to the fact that the
2.8 X-ray Absorption Spectroscopy (XAS)
46
range of measurement is not infinite but limited, abort effects can occur during the
Fourier transformation into R space, which may cause side lobes or a higher noise
level. Due to the phase shift, the peaks are normally observed at 0.2-0.5 Å lower
distances. This can be corrected by a proper phase correction in ‘XDAP’. These
characteristics must be addressed while evaluating the spectrum, in order to obtain
realistic results.
(ii) Reference spectra:
The section above described the data reduction process for all XAS (sample and
reference) spectra, in order to obtain normalized and comparable spectra. For fitting
a sample, a reference spectrum needs to be created, which is obtained by measuring
a standard sample, here a Ru foil (thickness: 50 µm). If experimental references are
measured, the coordination number and interatomic distances must be precisely
known, e.g., by X ray diffraction. In that case, the backscattering amplitude, phase
shift, damping factor and mean free path λ, are still unknown parameters. However,
they can be transferred from one compound (sample) to another (reference) with
identical absorber backscatterer pairs and thus the local structure can be accessed
[106]. If a reference compound is used for data fitting, its EXAFS spectrum is
measured and the X(k) (EXAFS in k space) of a specific absorber backscatterer pair
is extracted by means of Fourier filtering. The method works well, if the phase and
amplitude of the Xref(k) is well separated from other contributions in the Fourier
transform, otherwise errors in the Fourier transformation will affect the fitting results.
[106;108]. Moreover, the back transformation into R space for data fitting limits the
accurate data range of the backscatterer pair at the beginning and the end of the
total k range (∆k = 0.5-1 Å-1) due to truncation errors. In addition, the phase shifts
and backscattering amplitudes derived from EXAFS data of reference compounds
are only reliable (in a good case) for a k-range above 3.5 Å-1 [106;108]. However, for
a precise evaluation, a large k-range is desirable, especially at the lower end. This
limits the choice of suitable reference material. Due to these problems, the use of
calibrated theoretical references is very effective and commonly used [106]. In
addition, their k-range is reliable down to 2.0 Å-1 [108]. This is of great importance if
one is interested in the contributions that show significant intensity in the low k-range
or if heavy scatterers dominate the EXAFS [106]. Moreover, the analysis is carried
out in R space and therefore the back transformation is unnecessary, thus truncation
errors will not affect the fitting.
2.8 X-ray Absorption Spectroscopy (XAS)
47
For the measurements presented in this work, these were calculated by the FEFF 8.0
code, which is a self consistent real space, full multiple scattering code that
calculates the X-ray absorption spectrum and the backscattering amplitudes as well
as the phase shifts at once [106;108;109]. Prior to the theoretical calculation a FEFF
input file was generated by the freeware program ATOMS by Bruce Ravel [110]. This
program calculated the Ru atom coordinates until the 5th backscatterer shell with
crystallographic data of the reference compound. The ATOMS output file (a normal
text file) is read by the FEFF 8.0 program, generating a reference spectrum
(feff0001.dat), which is processed by the XDAP program. This calculated theoretical
reference is then iteratively calibrated (Debye Waller factor and inner potential should
be ‘0’) against the experimentally measured standard. Subsequently, the damping
factor S02 (between 0.7 and 0.9) is determined by fitting the resulting coordination
number of the measured reference of the first shell to that of the theoretical reference
[103;106]. The procedure is consistent with those suggested by Koningsberger et al.,
Vaarkamp et al. and van Bokhoven [103;106;108]. Additionally, due to the
information of the phase shift, these references will correct the phase shift occurring
in sample measurements in such way that the respective peaks are observed at their
real distances. If no experimental reference is available for calibration, only the
theoretical reference can be used for evaluation, which may result in lower accuracy
of the fits.
(iii) Data Fitting:
Once the references and the raw data are data reduced and calibrated, data fitting
was performed in R space with ‘XDAP’. Using the tab ‘Analyse’ and ‘multiple shells’
opens a window, where samples, references, phase corrections and different fitting
parameters can be loaded (Figure 15). Normally, lambda has a value between 5 and
6 (metallic or oxidic correction factor for Ncor), Ncor (corrected value) and N represent
the number of nearest neighbors, DW depicts the Debye Waller factor, R shows the
interatomic distance and E0 equals the energy offset from 0 eV. Usually, the value for
N (nearest neighbors) is underestimated by the normal EXAFS function and therefore
is corrected (Ncor). C3 and C4 are variables (higher cumulants) used for correction of
systems with expected high disorder, e.g., when experiments are performed under
high pressures and temperatures [111]. The tab ‘Limits’ provides access to the upper
and lower boundaries for the fitting parameters, which should be adjusted. The tabs
‘Combinations’, ‘Plots’, and ‘Correlations’ provide additional information and
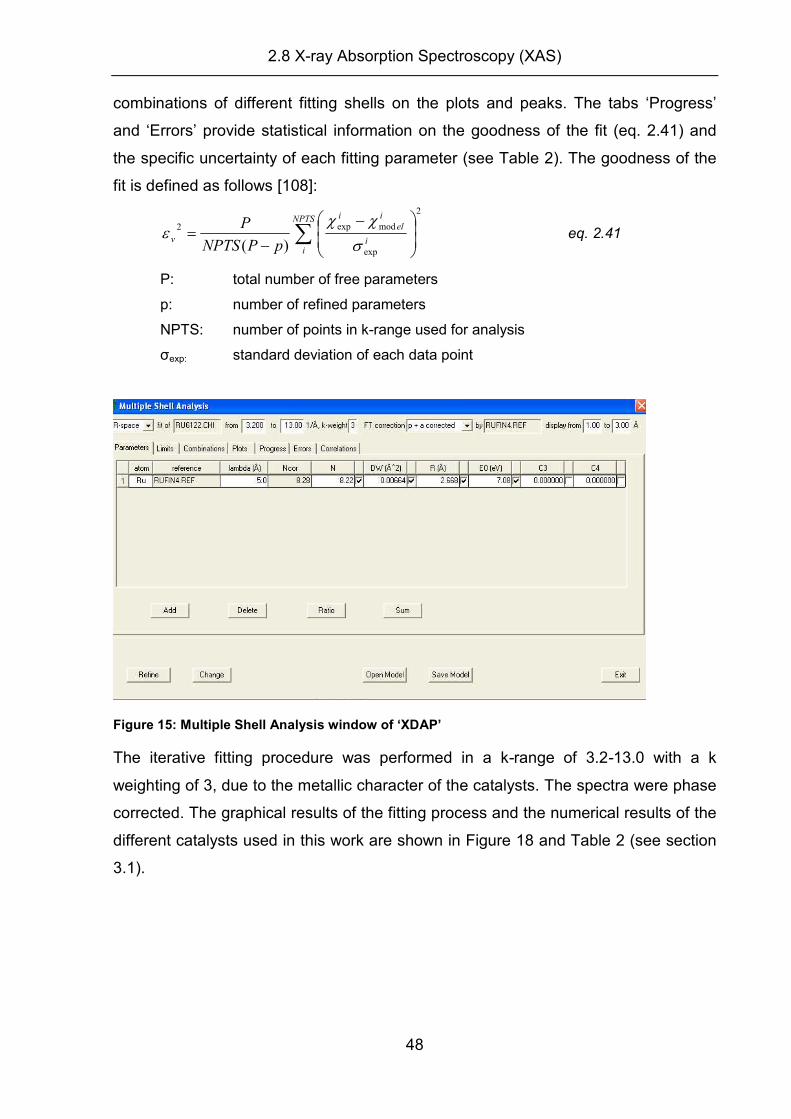
2.8 X-ray Absorption Spectroscopy (XAS)
48
combinations of different fitting shells on the plots and peaks. The tabs ‘Progress’
and ‘Errors’ provide statistical information on the goodness of the fit (eq. 2.41) and
the specific uncertainty of each fitting parameter (see Table 2). The goodness of the
fit is defined as follows [108]:
2
exp
modexp2
)(∑
−
−=
NPTS
ii
i
el
i
vpPNPTS
P
σ
χχε eq. 2.41
P: total number of free parameters
p: number of refined parameters
NPTS: number of points in k-range used for analysis
σexp: standard deviation of each data point
Figure 15: Multiple Shell Analysis window of ‘XDAP’
The iterative fitting procedure was performed in a k-range of 3.2-13.0 with a k
weighting of 3, due to the metallic character of the catalysts. The spectra were phase
corrected. The graphical results of the fitting process and the numerical results of the
different catalysts used in this work are shown in Figure 18 and Table 2 (see section
3.1).
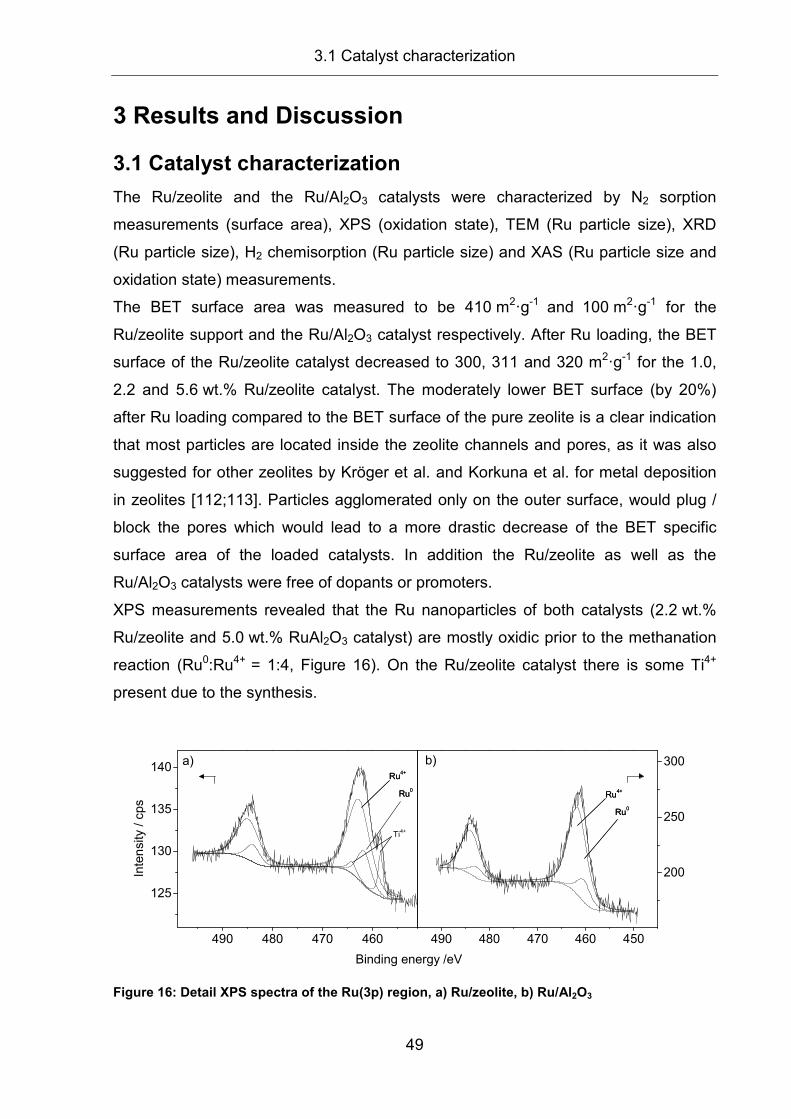
3.1 Catalyst characterization
49
3 Results and Discussion
3.1 Catalyst characterization
The Ru/zeolite and the Ru/Al2O3 catalysts were characterized by N2 sorption
measurements (surface area), XPS (oxidation state), TEM (Ru particle size), XRD
(Ru particle size), H2 chemisorption (Ru particle size) and XAS (Ru particle size and
oxidation state) measurements.
The BET surface area was measured to be 410 m2�g-1 and 100 m2�g-1 for the
Ru/zeolite support and the Ru/Al2O3 catalyst respectively. After Ru loading, the BET
surface of the Ru/zeolite catalyst decreased to 300, 311 and 320 m2�g-1 for the 1.0,
2.2 and 5.6 wt.% Ru/zeolite catalyst. The moderately lower BET surface (by 20%)
after Ru loading compared to the BET surface of the pure zeolite is a clear indication
that most particles are located inside the zeolite channels and pores, as it was also
suggested for other zeolites by Kröger et al. and Korkuna et al. for metal deposition
in zeolites [112;113]. Particles agglomerated only on the outer surface, would plug /
block the pores which would lead to a more drastic decrease of the BET specific
surface area of the loaded catalysts. In addition the Ru/zeolite as well as the
Ru/Al2O3 catalysts were free of dopants or promoters.
XPS measurements revealed that the Ru nanoparticles of both catalysts (2.2 wt.%
Ru/zeolite and 5.0 wt.% RuAl2O3 catalyst) are mostly oxidic prior to the methanation
reaction (Ru0:Ru4+ = 1:4, Figure 16). On the Ru/zeolite catalyst there is some Ti4+
present due to the synthesis.
490 480 470 460
125
130
135
140
490 480 470 460 450
200
250
300b)
Binding energy /eV
a)
Ru0
Inte
nsi
ty / c
ps
Ru4+Ru0
Ru4+
Ru0
Ru4+
Ru0
Ru4+
Figure 16: Detail XPS spectra of the Ru(3p) region, a) Ru/zeolite, b) Ru/Al2O3
Ti4+
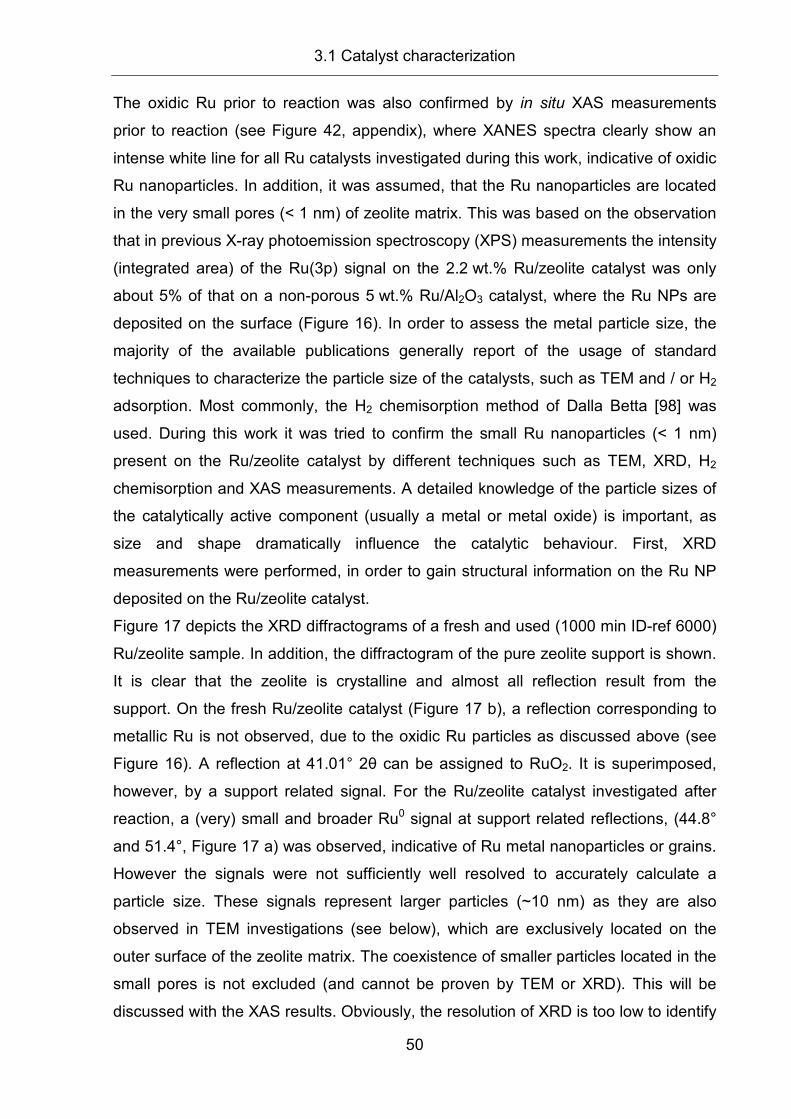
3.1 Catalyst characterization
50
The oxidic Ru prior to reaction was also confirmed by in situ XAS measurements
prior to reaction (see Figure 42, appendix), where XANES spectra clearly show an
intense white line for all Ru catalysts investigated during this work, indicative of oxidic
Ru nanoparticles. In addition, it was assumed, that the Ru nanoparticles are located
in the very small pores (< 1 nm) of zeolite matrix. This was based on the observation
that in previous X-ray photoemission spectroscopy (XPS) measurements the intensity
(integrated area) of the Ru(3p) signal on the 2.2 wt.% Ru/zeolite catalyst was only
about 5% of that on a non-porous 5 wt.% Ru/Al2O3 catalyst, where the Ru NPs are
deposited on the surface (Figure 16). In order to assess the metal particle size, the
majority of the available publications generally report of the usage of standard
techniques to characterize the particle size of the catalysts, such as TEM and / or H2
adsorption. Most commonly, the H2 chemisorption method of Dalla Betta [98] was
used. During this work it was tried to confirm the small Ru nanoparticles (< 1 nm)
present on the Ru/zeolite catalyst by different techniques such as TEM, XRD, H2
chemisorption and XAS measurements. A detailed knowledge of the particle sizes of
the catalytically active component (usually a metal or metal oxide) is important, as
size and shape dramatically influence the catalytic behaviour. First, XRD
measurements were performed, in order to gain structural information on the Ru NP
deposited on the Ru/zeolite catalyst.
Figure 17 depicts the XRD diffractograms of a fresh and used (1000 min ID-ref 6000)
Ru/zeolite sample. In addition, the diffractogram of the pure zeolite support is shown.
It is clear that the zeolite is crystalline and almost all reflection result from the
support. On the fresh Ru/zeolite catalyst (Figure 17 b), a reflection corresponding to
metallic Ru is not observed, due to the oxidic Ru particles as discussed above (see
Figure 16). A reflection at 41.01° 2θ can be assigned to RuO2. It is superimposed,
however, by a support related signal. For the Ru/zeolite catalyst investigated after
reaction, a (very) small and broader Ru0 signal at support related reflections, (44.8°
and 51.4°, Figure 17 a) was observed, indicative of Ru metal nanoparticles or grains.
However the signals were not sufficiently well resolved to accurately calculate a
particle size. These signals represent larger particles (~10 nm) as they are also
observed in TEM investigations (see below), which are exclusively located on the
outer surface of the zeolite matrix. The coexistence of smaller particles located in the
small pores is not excluded (and cannot be proven by TEM or XRD). This will be
discussed with the XAS results. Obviously, the resolution of XRD is too low to identify
3.1 Catalyst characterization
51
the smaller particles (< 1 nm) of the Ru/zeolite catalyst, as the normal detection limit
is 2-3 nm, if a good quality spectrum is obtained without additional peaks around the
2θ region of interest. At smaller particle sizes, the FHWM is getting too large,
resulting in a small peak caused by the lower number of ‘in phase’ reflecting planes.
Therefore the FHWM of such a signal can hardly be interpreted as it cannot be
distinguished from the noise level.
45 50 55 60
51.4°41.01° 44.8°
c
b
a
10000 a.u.
Inte
nsi
ty
2 Theta / °
Figure 17: XRD diffractogram of Ru/zeolite catalyst after 1000 min of reaction in ID-ref 6000 (a), fresh Ru/zeolite (b) and the zeolite support (c)
Next, it was tried to evaluate the Ru particle size by TEM imaging. However, high
resolution TEM imaging was complicated by electron beam induced decomposition of
the zeolite matrice. The images showed a very inhomogeneous distribution of Ru
particles, with few individual particles (10-20 nm diameter) and agglomerates of Ru
particles, in addition to larger areas without visible nanoparticles (representative TEM
images are shown in the appendix). Due to the decomposition of the zeolite it was
not possible to statistically analyze the size of Ru particles. Moreover, due the
stability problems of the material it was not possible to use the powerful techniques of
TEM, e.g. cross section of HAADF to clarify the presence of very small RU NPs
inside the porous system. Increasing of the resolution is disadvantageous due to the
drastic decomposition of the zeolite matrix upon the irradiation of the sample by the
electron beam that is needed for further magnification of the images. Thus, the
method can be used only for determination of the larger Ru particles (> ~5 nm in
diameter) that will be located exclusively on the surface of the zeolite. The recorded
3.1 Catalyst characterization
52
images (representative TEM images are shown in the appendix (Figure 41), revealed
only few individual particles and agglomerates inhomogeneously distributed on the
surface. Consequently, most of the surface area is without visible nanoparticles (< 1
nm in diameter). This is in agreement with the previous XRD measurement where
small reflections of metallic Ru in the collected diffractograms, typical for the particles
around 10 nm, suggested a rather low amount of these crystallites. These findings
are explained by the coexistence of the larger particles on the surface and very small
Ru nanoparticles, where the latter can be located on both the outer and inner surface
of the microporous system. These small particles cannot be detected by the standard
methods (TEM and XRD). Further support for the coexistence of large and small Ru
NP will be given below (see XAS), where the EXAFS results lead to a mean Ru
particle size which is slightly larger (~0.9 nm) than the pores of the zeolite (0.6-0.8
nm).
For the Ru/Al2O3 catalyst, the Ru particle size was determined by TEM (statistical
analysis) to 2.27 nm diameter (see Figure 41 appendix). This result was expected for
the standard Ru/Al2O3 catalyst.
Next, H2 adsorption experiments were conducted on the two catalysts after reduction
in H2 (30 min, 200°C), which yielded active surface areas of 3.7 m2 g-1 (Ru/Al2O3) and
0.095 m2 g-1 (Ru/zeolite). This would correspond to dispersions / Ru particles sizes of
15%/4.2 nm and <1%/113 nm, respectively. (It should be noted that higher reduction
temperatures up to 300°C had no effect on the active surface area, above that
temperature, the active surface area decreases, probably due to agglomeration.)
Obviously, the dispersions and particle sizes derived from the adsorption ex-
periments are incompatible with those determined by TEM or XRD in the case of the
Ru/Al2O3 catalyst. This discrepancy can be explained by assuming that the surface
area H2 adsorption does not necessarily correspond to the whole particle. For the
Ru/zeolite catalyst the dispersion calculated by H2 chemisorption seems to be far too
low. Obviously this method is not applicable for this (acidic) zeolite supported catalyst
due to suppression of H2 chemisorption, as it was already reported for acidic zeolites
by Wang et al. [114] and McCarthy et al. [115]. They explained this observation to the
interaction of the Ru clusters with the protons of the zeolite.
The in situ XAS measurements were conducted in idealized reformate gas (ID-ref
6000), until the coordination number did not change any more, at least over 500 min.
3.1 Catalyst characterization
53
By determining the average coordination number of the Ru atoms in the Ru
nanoparticles during reaction, the average particle sizes of all catalysts were
calculated. The results are shown in Figure 18 and Table 2. The k3 weighted chi
functions obtained on the 2.2, 3.6 and 5.6 wt.% Ru/zeolite and the 5.0 wt.% Ru/Al2O3
catalysts are plotted in the k-range from 3.2-13.0 Å-1 in the left panels in Figure 18.
Measurements on the 1 wt.% Ru/zeolite catalyst could not be evaluated, as the
catalyst loading was too low to obtain a good quality spectrum. The right panels show
the resulting Fourier transforms in r-space in the range of the first shell (Ru-Ru
scattering, r-range:1.0-3.0). It is clear that with higher loading and larger particles,
respectively, the signal intensities in both k and r-space increase. The prominent
signal (Ru-Ru scattering) at ~2.7 Å in r-space indicates that the particles are
essentially metallic under steady-state conditions. It should be noted that the spectra
could be fitted with only a single Ru-Ru shell. The result of metallic Ru NPs is
compatible with findings of in situ DRIFTS measurements, which yielded vibrational
frequencies for adsorbed CO similar to those characteristic for COad on metallic Ru
(see below) [116].
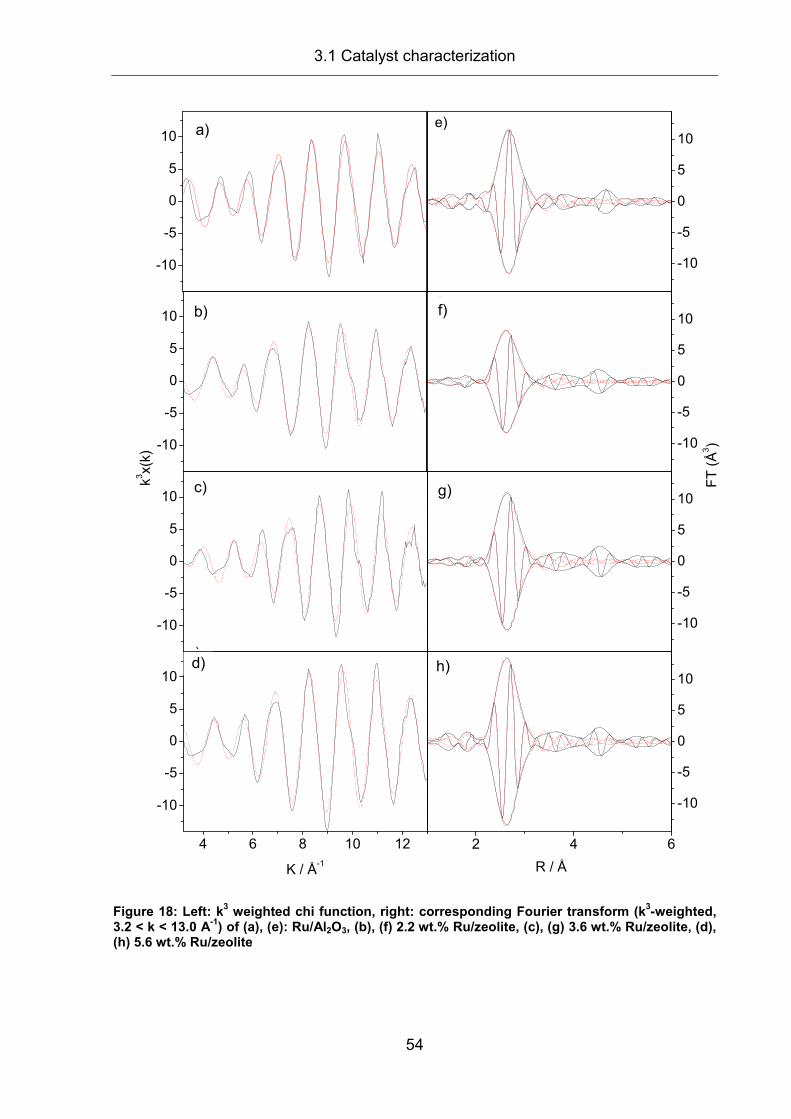
3.1 Catalyst characterization
54
4 6 8 10 12
-10
-5
0
5
10
c)
k3x(
k)
K / Å-1
-10
-5
0
5
10 f)
-10
-5
0
5
10
FT
(Å
3)-10
-5
0
5
10
-10
-5
0
5
10k3
x(k)
a)
b)
c) g)
h)d)
-10
-5
0
5
10 e)
f)
-10
-5
0
5
10
k3x(
k)
2 4 6
-10
-5
0
5
10
R / Å
Figure 18: Left: k3 weighted chi function, right: corresponding Fourier transform (k
3-weighted,
3.2 < k < 13.0 A-1
) of (a), (e): Ru/Al2O3, (b), (f) 2.2 wt.% Ru/zeolite, (c), (g) 3.6 wt.% Ru/zeolite, (d), (h) 5.6 wt.% Ru/zeolite
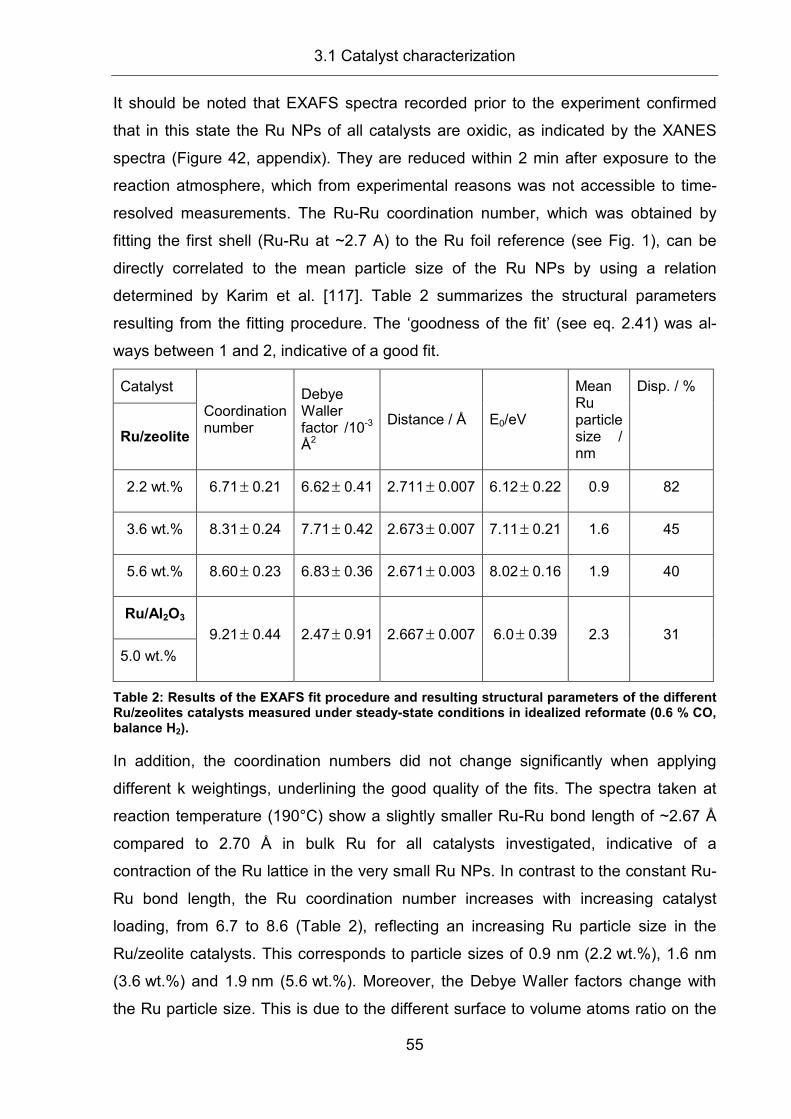
3.1 Catalyst characterization
55
It should be noted that EXAFS spectra recorded prior to the experiment confirmed
that in this state the Ru NPs of all catalysts are oxidic, as indicated by the XANES
spectra (Figure 42, appendix). They are reduced within 2 min after exposure to the
reaction atmosphere, which from experimental reasons was not accessible to time-
resolved measurements. The Ru-Ru coordination number, which was obtained by
fitting the first shell (Ru-Ru at ~2.7 A) to the Ru foil reference (see Fig. 1), can be
directly correlated to the mean particle size of the Ru NPs by using a relation
determined by Karim et al. [117]. Table 2 summarizes the structural parameters
resulting from the fitting procedure. The ‘goodness of the fit’ (see eq. 2.41) was al-
ways between 1 and 2, indicative of a good fit.
Catalyst
Ru/zeolite
Coordination number
Debye Waller factor /10-3 Å2
Distance / Å E0/eV
Mean Ru particle size / nm
Disp. / %
2.2 wt.% 6.71± 0.21 6.62± 0.41 2.711± 0.007 6.12± 0.22 0.9 82
3.6 wt.% 8.31± 0.24 7.71± 0.42 2.673± 0.007 7.11± 0.21 1.6 45
5.6 wt.% 8.60± 0.23 6.83± 0.36 2.671± 0.003 8.02± 0.16 1.9 40
Ru/Al2O3
5.0 wt.%
9.21± 0.44 2.47± 0.91 2.667± 0.007 6.0± 0.39 2.3 31
Table 2: Results of the EXAFS fit procedure and resulting structural parameters of the different Ru/zeolites catalysts measured under steady-state conditions in idealized reformate (0.6 % CO, balance H2).
In addition, the coordination numbers did not change significantly when applying
different k weightings, underlining the good quality of the fits. The spectra taken at
reaction temperature (190°C) show a slightly smaller Ru-Ru bond length of ~2.67 Å
compared to 2.70 Å in bulk Ru for all catalysts investigated, indicative of a
contraction of the Ru lattice in the very small Ru NPs. In contrast to the constant Ru-
Ru bond length, the Ru coordination number increases with increasing catalyst
loading, from 6.7 to 8.6 (Table 2), reflecting an increasing Ru particle size in the
Ru/zeolite catalysts. This corresponds to particle sizes of 0.9 nm (2.2 wt.%), 1.6 nm
(3.6 wt.%) and 1.9 nm (5.6 wt.%). Moreover, the Debye Waller factors change with
the Ru particle size. This is due to the different surface to volume atoms ratio on the
56
Ru catalysts, where surface atoms experience a different ‘neighborhood’ than volume
atoms and in consequence have a larger Debye Waller factor. The very small Ru
particle size obtained from EXAFS for the 2.2 wt.% Ru/zeolite catalyst supports the
proposal above, according to which most of the Ru NPs of the 2.2 wt.% Ru/zeolite
catalyst are located inside the pores of the zeolite (0.6-0.8 nm diameter). It can not
be ruled out that in addition to the very small Ru NPs proposed to be located in the
pores (0.6-0.8 nm) of the zeolite also a few larger Ru NPs are present on the outer
surface. Their number, however, must be rather small on the 2.2 wt.% catalyst. For
the catalysts with higher Ru loading, the 3.6 and 5.6 wt.% Ru/zeolite catalysts, it is
tentatively suggested that the larger mean particle sizes obtained from the EXAFS
measurements (1.6 and 1.9 nm, respectively) result from a higher fraction of larger
particles, in addition to the very small Ru NPs in the pores of the zeolite. In semi-
realistic reformate (SR-ref 6000), containing 15.5% CO2 in addition to 6000 ppm CO,
similar Ru particle sizes as determined in idealized reformate were expected, since
COad will block the surface and hence the active sites for CO2 dissociation and
methanation. Therefore, the presence of CO2 is not expected to measurably affect
the Ru particle size. The particle size derived by the EXAFS measurements of the
Ru/Al2O3 catalyst (2.3 nm) is in good accordance with the TEM results, which proves
the compatibility of both methods. However, a deviation is observed when comparing
these results to the results of the H2 chemisorption (2.3 nm vs. 4.2 nm). The result of
the H2 chemisorption corresponds most likely to the catalytically active surface, most
probably due to the partially blocking of active surface area by carbonaceous
deposits, resulting in a smaller surface for H2 chemisorption, which in fact is not
measured by the EXAFS experiments.
For calculating TOFs during this work it is most appropriate to take the particle sizes
derived by XAS measurements for all catalysts investigated. Only in section 3.3
where the intermediate of the CO and CO2 methanation is investigated on the Ru
Al2O3 catalyst, the active surface derived by H2 chemisorption is used, since this is
directly correlated to the methanation reaction mechanism.
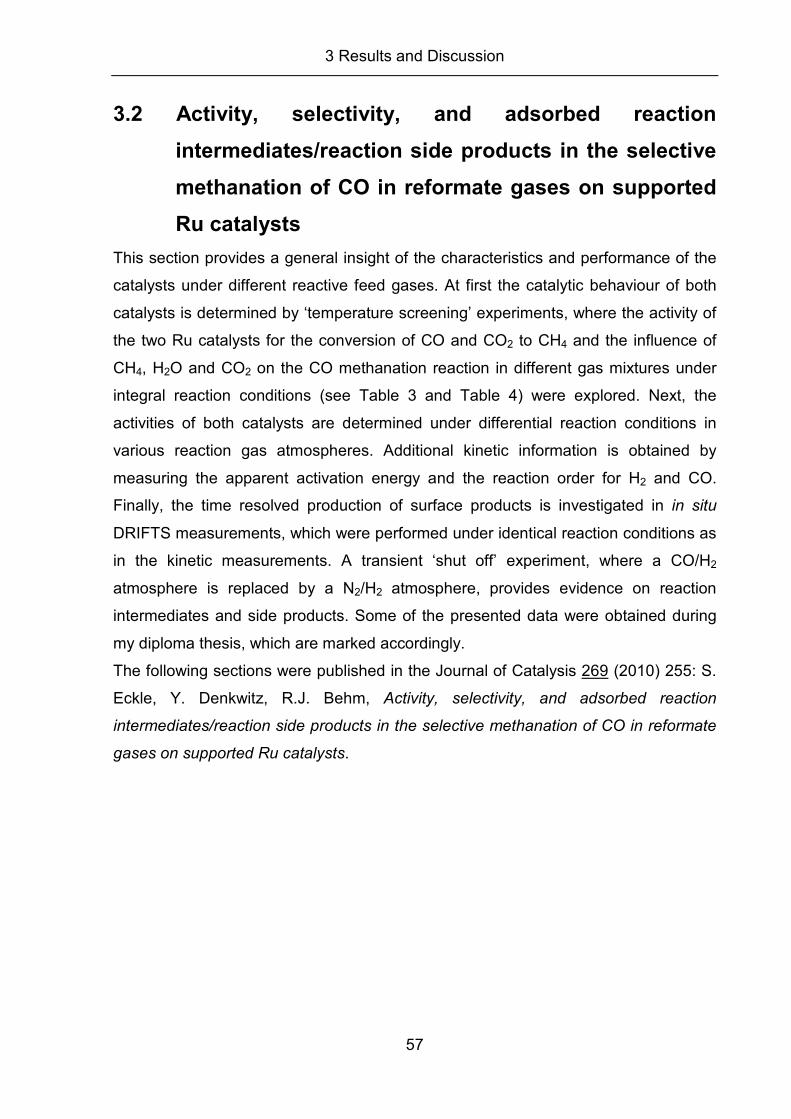
3 Results and Discussion
57
3.2 Activity, selectivity, and adsorbed reaction
intermediates/reaction side products in the selective
methanation of CO in reformate gases on supported
Ru catalysts
This section provides a general insight of the characteristics and performance of the
catalysts under different reactive feed gases. At first the catalytic behaviour of both
catalysts is determined by ‘temperature screening’ experiments, where the activity of
the two Ru catalysts for the conversion of CO and CO2 to CH4 and the influence of
CH4, H2O and CO2 on the CO methanation reaction in different gas mixtures under
integral reaction conditions (see Table 3 and Table 4) were explored. Next, the
activities of both catalysts are determined under differential reaction conditions in
various reaction gas atmospheres. Additional kinetic information is obtained by
measuring the apparent activation energy and the reaction order for H2 and CO.
Finally, the time resolved production of surface products is investigated in in situ
DRIFTS measurements, which were performed under identical reaction conditions as
in the kinetic measurements. A transient ‘shut off’ experiment, where a CO/H2
atmosphere is replaced by a N2/H2 atmosphere, provides evidence on reaction
intermediates and side products. Some of the presented data were obtained during
my diploma thesis, which are marked accordingly.
The following sections were published in the Journal of Catalysis 269 (2010) 255: S.
Eckle, Y. Denkwitz, R.J. Behm, Activity, selectivity, and adsorbed reaction
intermediates/reaction side products in the selective methanation of CO in reformate
gases on supported Ru catalysts.
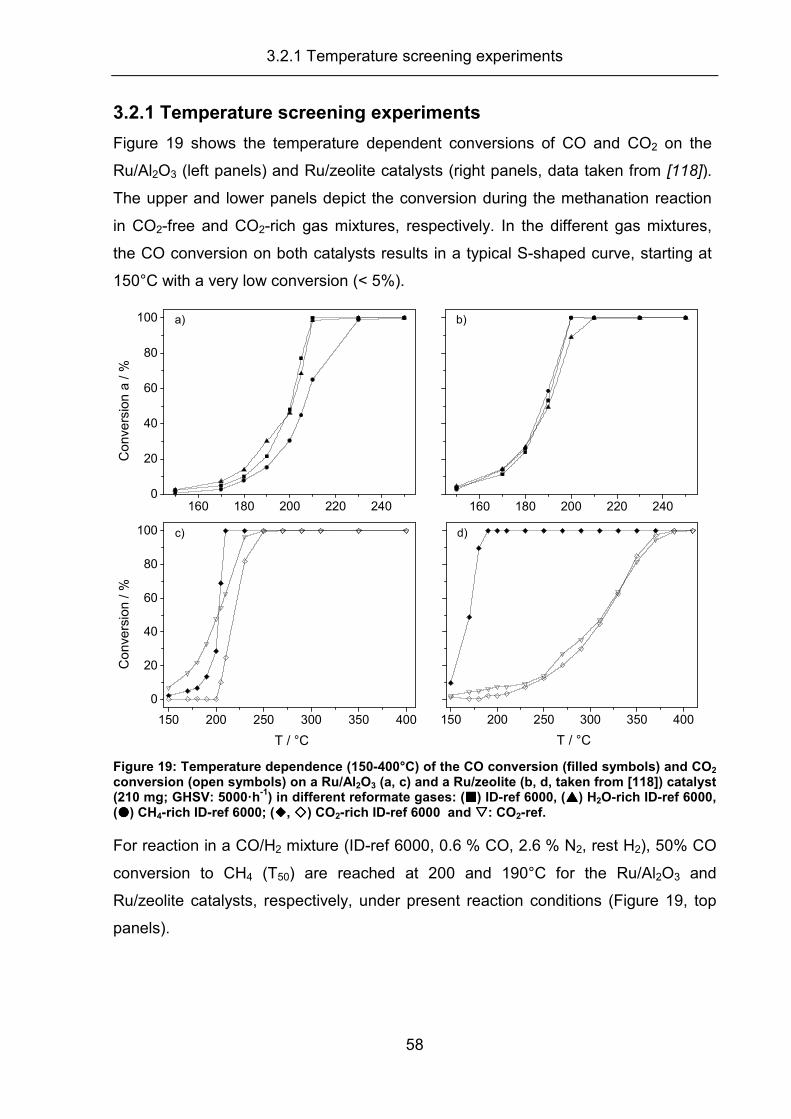
3.2.1 Temperature screening experiments
58
3.2.1 Temperature screening experiments
Figure 19 shows the temperature dependent conversions of CO and CO2 on the
Ru/Al2O3 (left panels) and Ru/zeolite catalysts (right panels, data taken from [118]).
The upper and lower panels depict the conversion during the methanation reaction
in CO2-free and CO2-rich gas mixtures, respectively. In the different gas mixtures,
the CO conversion on both catalysts results in a typical S-shaped curve, starting at
150°C with a very low conversion (< 5%).
160 180 200 220 2400
20
40
60
80
100
Co
nve
rsio
n a
/ %
a)
160 180 200 220 240
b)
150 200 250 300 350 400
0
20
40
60
80
100
T / °C
Co
nve
rsio
n / %
c)
150 200 250 300 350 400
T / °C
d)
Figure 19: Temperature dependence (150-400°C) of the CO conversion (filled symbols) and CO2 conversion (open symbols) on a Ru/Al2O3 (a, c) and a Ru/zeolite (b, d, taken from [118]) catalyst (210 mg; GHSV: 5000�h
-1) in different reformate gases: (����) ID-ref 6000, (����) H2O-rich ID-ref 6000,
(����) CH4-rich ID-ref 6000; (����, ����) CO2-rich ID-ref 6000 and ����: CO2-ref.
For reaction in a CO/H2 mixture (ID-ref 6000, 0.6 % CO, 2.6 % N2, rest H2), 50% CO
conversion to CH4 (T50) are reached at 200 and 190°C for the Ru/Al2O3 and
Ru/zeolite catalysts, respectively, under present reaction conditions (Figure 19, top
panels).

3.2.1 Temperature screening experiments
59
Table 3: Reaction temperature for 50 and 100% CO/CO2 conversion in the methanation reaction on 210 mg Ru/Al2O3 catalyst (5 wt.% Ru, GSVH: 5000 h
-1)
Re
act
ion g
as
Re
act
ion
ga
s-co
mpo
sitio
n
T50 =
50
%
con
vers
ion
(C
O)
T100 =
1
00
%
con
vers
ion
(C
O)
T50 =
50
%
con
vers
ion
(C
O2)
T100 =
1
00
%
con
vers
ion
(C
O2)
Ide
aliz
ed
refo
rma
te
0.6
% C
O,
2.8
% N
2,
ba
lan
ce H
2
20
0°C
2
10
°C
- -
CH
4-ri
ch id
ea
lize
d
refo
rma
te
0.6
% C
O,
2.8
% N
2,
4.5
% C
H4,
ba
lan
ce H
2
20
0°C
2
30
°C
- -
H2O
-ric
h id
ea
lize
d
refo
rma
te
0.6
% C
O,
2.8
% N
2,
5 %
H2O
, b
ala
nce
H2
20
5°C
2
30
°C
- -
CO
2-
rich
ide
aliz
ed
re
form
ate
0
.6 %
CO
, 2
.8 %
N2,
1.2
% C
O2,
ba
lan
ce H
2
20
5°C
2
30
°C
22
5°C
2
70
°C
CO
-fre
e id
ea
lize
d r
efo
rma
te
1.2
% C
O2,
2.8
% N
2, b
ala
nce
H2
- -
20
5°C
2
50
°C
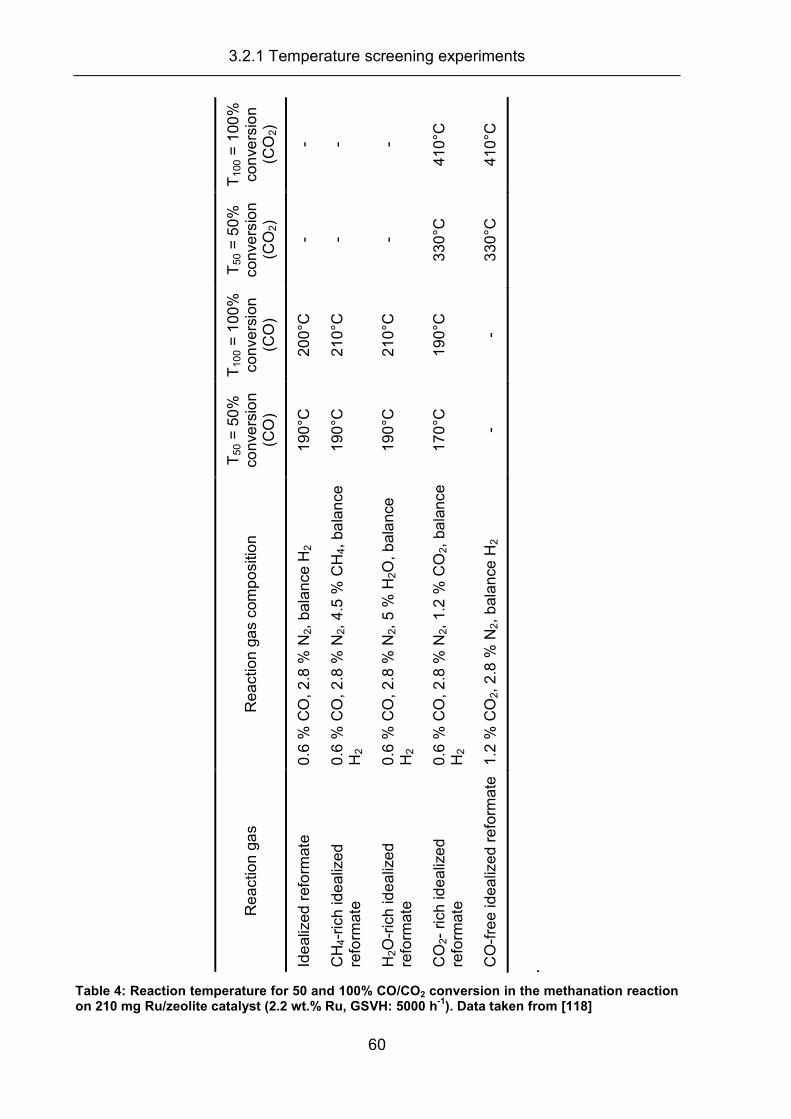
3.2.1 Temperature screening experiments
60
.
Table 4: Reaction temperature for 50 and 100% CO/CO2 conversion in the methanation reaction on 210 mg Ru/zeolite catalyst (2.2 wt.% Ru, GSVH: 5000 h
-1). Data taken from [118]
Re
act
ion
ga
s R
ea
ctio
n g
as
com
po
sitio
n
T50 =
50
%
con
vers
ion
(C
O)
T100 =
100
%
con
vers
ion
(C
O)
T50 =
50
%
con
vers
ion
(C
O2)
T100
= 1
00
%
con
vers
ion
(C
O2)
Ide
aliz
ed
refo
rmate
0
.6 %
CO
, 2
.8 %
N2,
ba
lan
ce H
2
19
0°C
2
00
°C
- -
CH
4-r
ich
ide
aliz
ed
re
form
ate
0
.6 %
CO
, 2
.8 %
N2,
4.5
% C
H4,
ba
lan
ce
H2
19
0°C
2
10
°C
- -
H2O
-ric
h id
ea
lize
d
refo
rmate
0
.6 %
CO
, 2
.8 %
N2,
5 %
H2O
, b
ala
nce
H
2
19
0°C
2
10
°C
- -
CO
2-
rich
ide
aliz
ed
re
form
ate
0
.6 %
CO
, 2
.8 %
N2,
1.2
% C
O2,
ba
lan
ce
H2
17
0°C
1
90
°C
33
0°C
4
10
°C
CO
-fre
e id
ea
lize
d r
efo
rma
te
1.2
% C
O2,
2.8
% N
2,
ba
lan
ce H
2
- -
33
0°C
4
10
°C
3.2.1 Temperature screening experiments
61
After reaching full conversion, a further increase of the temperature did not exert any
effect on the CH4 production on either catalyst. Full CO conversion is reached at 10°C
lower temperature on the Ru/zeolite catalyst (200°C) than on the Ru/Al2O3 catalyst
(210°C) (see Table 3 and Table). Since the Ru loading of the Ru/zeolite catalyst
(2.2 wt.%) is less than half of that of the Ru/Al2O3 catalyst (5 wt.%), its Ru mass
normalized activity is higher than that of the latter catalyst. Similar trends are
observed when adding H2O (H2O-rich ID-ref 6000) or CH4 (CH4-rich ID-ref 6000) to
the gas-mixture, with the differences in activity becoming slightly larger (Figure 19, top
panels; Table 3 and Table 4). For both the H2O-rich and the CH4-rich reformate, the
temperature dependence does not change for the Ru/zeolite catalyst. The Ru/Al2O3
catalyst behaves similarly in the CH4-rich reformate, while in H2O-rich reformate the
T50 temperature is shifted to slightly higher values, from 200 to 205°C.
Next, the CO2 methanation reaction in low CO2-ref (CO-free) reaction gas mixture
(H2/CO2 mixture) was investigated. The general shape of the temperature dependent
CO2 methanation curve is comparable to that for CO methanation in ID-ref 6000
(0.6 % CO; 2.6 % N2; rest H2) for the Ru/Al2O3 catalyst, except for a slight shift to
higher temperatures (CO2 conversion: T50 = 205°C, CO conversion: T50 = 200°C,
see). In contrast, on the Ru/zeolite catalyst the increase of the CO2 conversion with
increasing temperature is significantly slower. The temperature for 50% conversion
(T50) is shifted to 330°C (CO methanation: T50 = 190°C, see Table 4), and full
conversion is reached only at 410°C (CO methanation: 200°C, see Table 4).
Adding CO to the gas-mixture (CO2-rich ID-ref 6000: 0.6 % CO, 2.8 % N2, 1.2 % CO2,
rest H2), the general shape of the conversion curve for CO and CO2 methanation does
not change, neither for the Ru/zeolite nor for the Ru/Al2O3 catalyst (Figure 19, bottom
panels; (Table 3and Table 4). For the Ru/Al2O3 catalyst, however, the CO2 conversion
curve is shifted to higher temperatures, and seems to be suppressed by the presence
of CO, at least over a temperature range of 20°C. The temperature for 50% CO2
conversion is shifted from 205°C in a H2/CO2 mixture to 225°C in the presence of CO,
in CO2-rich ID-ref 6000. Nevertheless, CO2 conversion starts already well before all
CO is converted to CH4. At 100% CO conversion (230°C), the selectivity is 48%. On
the other hand, for the Ru/zeolite catalyst, the CO2 methanation reaction is only little
affected by the presence of CO. Furthermore, the CO methanation is accelerated by
the presence of CO2, and 50% CO conversion was reached at 170°C in CO2-rich
3.2.1 Temperature screening experiments
62
idealized reformate rather than at 190°C in idealized reformate. In the presence of
CO2, the reaction is 100% selective for CO methanation on the Ru/zeolite catalyst up
to 190°C. Only at 230°C, the CO2 conversion reaches 10%, i.e., there is a
temperature window of 40°C where the selectivity for CO methanation is >85%.
Comparison of the temperature screenings results with previously reported data is
hardly possible, at least not on a quantitative scale, because of the different reaction
conditions, reaction mixtures and procedures for catalyst pre-treatment. For the
Ru/zeolite catalyst, there are no previous studies on the CO methanation reaction at
all. For CO methanation in idealized reformate on a Ru/Al2O3 catalyst, Randhava et
al. [23] reported a T50 value (200°C) which is similar to the result obtained in this work.
It was measured, however, on a lower loaded 0.5 wt.% Ru/Al2O3 catalyst in 0.3% CO
(rest H2) at a significantly higher space velocity (GHSV: 36000 h-1, measurement
presented here: GSHV: 5000 h-1). They observed that the T50 value shifts to higher
temperature with higher GHSV and attributed this to the lower contact time (CO
conversion of 50% at 230°C for a GHSV of 36000 h-1). Echigo and Tabata [17]
performed temperature screening experiments on a 1 wt.% Ru/Al2O3 catalyst at a
lower GHSV (7500 h-1) in H2O-rich reformate (0.54% CO, 20% H2O, rest H2) and in
realistic reformate (0.54% CO, 21% CO2, 20% H2O, rest H2). In the first gas mixture,
they measured a T50 temperature of 190°C, and full conversion (<10 ppm) was
reached at 210°C. Adding CO2 to the gas mixture, the CO conversion at 190°C
dropped to about 45%, and full conversion was not reached up to 230°C (maximum
conversion 96% at 230°C). Comparable to the observations for the Ru/Al2O3 catalyst
in this work, not all CO is converted, although the methane production exceeds the
CO consumption. The CO2 conversion starts already at 205°C; at 230°C the
selectivity was 40%. Adding CH4 to the gas-mixture did not change the performance
of their catalyst. Dagle et al. [40] also investigated the methanation reaction in realistic
reformate (0,9% CO, 24,5% CO2, 5,7% H2O, rest H2) on differently loaded Ru/Al2O3
catalysts (3 wt.%, 5 wt.% and 7 wt.%, GHSV 13500 h-1). They observed the same T50
value (T50 = 205°C) on their 5 wt.% Ru/Al2O3 catalyst as determined on the 5 wt.%
Ru/Al2O3 catalyst, but at significantly higher CO, CO2 and H2O contents and at a
higher space velocity. At higher temperatures, however, their catalyst became active
for the reverse water gas shift (RWGS) reaction, which was evidenced by the onset of
CO production at higher temperatures. Such effects were not observed in the present
work, neither for the Ru/zeolite nor for the Ru/Al2O3 catalyst. The temperature for 99
3.2.2 Kinetic measurements
63
% conversion (100 ppm CO in the gas mixture) was lowest for the 5 wt.% catalyst,
and increased in the order 5 wt.% < 3 wt.% << 7 wt.%.
In total, the activity, measured in terms of conversion curves and T50 values, and the
selectivity of the Ru/Al2O3 catalyst in this work are comparable to those reported in
previous studies [17;23;40]. The Ru/zeolite catalyst shows a comparable activity,
despite of the much lower Ru content, and a significantly higher selectivity for the CO
methanation in the presence of CO2 over a wide temperature range.
3.2.2 Kinetic measurements
For more detailed information on the time dependent activity and the stability of the
catalysts under reaction conditions, the reaction rates were evaluated under
differential reaction conditions (conversion < 15%) as a function of increasing time on
stream, up to over 1000 min reaction time. This time was chosen since initial
measurements showed only very slow changes in the reaction behavior after 800 min
on stream. The activity is given in Ru mass normalized rates in Figure 20. In addition,
these data were used to calculate turn-over frequencies (TOFs) using the Ru surface
areas determined by the in situ XAS experiments (see section 3.1), which are listed in
Table 2 where 190°C were used as reaction temperature. At this temperature, both
Ru catalysts showed 100% selectivity in CO2-rich ID-ref 6000 reformates in the
temperature screening measurements and both catalysts exhibited a high CO activity
(Figure 19). The conversion was reduced by using smaller amounts of catalyst (see
section 2.1.1).
Figure 20 illustrates the reactivity-time curves resulting for the two catalysts at 190°C
in different reaction atmospheres. In order to approach more realistic situations, two
gas mixtures with higher CO2 contents (semirealistic conditions) were included,
namely SR-ref 6000 (0.6 % CO, 2.8 % N2, 15.5 % CO2, balance H2) and H2O-rich SR-
ref 6000 reformate (0.6 % CO, 2.8 % N2, 15.5 % CO2, 5 % H2O, balance H2), in
addition to the ID-ref 6000 and the CH4-rich ID-ref 6000 used also in the temperature
screening experiments.
For reaction in ID-ref 6000 (0.6 % CO, 2.8 % N2, balance H2; Figure 20a), the
catalysts exhibit initial reaction rates of 65×10-6 and 3.4×10⁻⁶ mol�s-1�gRu-1 for the
Ru/zeolite (data taken from [118]) and the Ru/Al2O3 catalyst, respectively. At the
beginning of the reaction, over ~50 min, the Ru/zeolite catalyst shows a slight
increase in activity and then decays slowly, reaching ~80% of its maximum intensity

3.2.2 Kinetic measurements
64
after 1000 min. In contrast, on the Ru/Al2O3 the reaction is about stable over the entire
time on stream of 1000 min.
The steady-state reaction rates for the Ru/zeolite and the Ru/Al2O3 catalyst are
63.9±1.5×10⁻⁶ mol�s-1�gRu-1 and 3.4±0.3×10⁻⁶ mol�s-1�gRu
-1 respectively, equivalent to
TOFs of 7.9 s-1 and 1.1 s-1. It should be noted that the TOFs were calculated by the
average particle size derived by the XAS measurements. Therefore deviations caused
by missing very small Ru nanoparticles or clusters, e.g. in TEM images, do not affect
these results. Changing to CH4-rich ID-ref 6000 or SR-ref 6000 does not influence the
activity and its characteristic development during 1000 min reaction for either of the
two catalysts. In the SR-ref 6000 gas mixture (Figure 20, b), both catalysts are 100%
selective, which was associated with the high remaining CO partial pressure (about
10% CO conversion) and the low reaction temperature (COad blocking of the catalyst
surface). In all cases, the Ru/zeolite catalyst shows a significantly higher activity than
the Ru/Al2O3 catalyst. It exceeds that of the latter catalyst by at least a factor of about
10 for the Ru mass normalized reaction rate. The small differences between the rates
measured for different gas compositions are within the precision of the
measurements. A significantly lower activity (~50%) is obtained, however, in H2O-rich
SR-ref 6000, on the Ru/zeolite catalyst. The other characteristics, the low deactivation
with time by about 20% over 1000 min and 100% selectivity remain unchanged. On
the Ru/Al2O3 catalyst, the addition of water to SR-ref 6000 has essentially no
consequences on the reaction behavior.
Comparing the Ru mass normalized rates for the methanation reaction with results
reported previously for reaction on supported Ru catalysts (see Table 10, appendix)
[41;42;61;119-121], the Ru/zeolite catalyst exhibits a high activity at lower reaction
temperature (190°C) even in SR-ref 6000. Only the Ru/Al2O3 catalyst studied by
Kowalczyk et al. [41] shows a higher reaction rate, yet their measurement was
performed at a higher temperature. The Ru/Al2O3 catalyst exhibits a lower activity
compared to the rates reported for other Ru/Al2O3 catalysts (Table 10, appendix).
However, one has to take into account that the reaction temperature and the gas com-
positions used in the previous studies differ considerably. Panagiotopoulou et al. [42]
measured the CO methanation rate on a 0.5 wt.% Ru/Al2O3 catalyst at 250°C in
idealized reformate as well as in more realistic gas mixtures (see Table 10, appendix),
and obtained higher reaction rates than determined in this work.
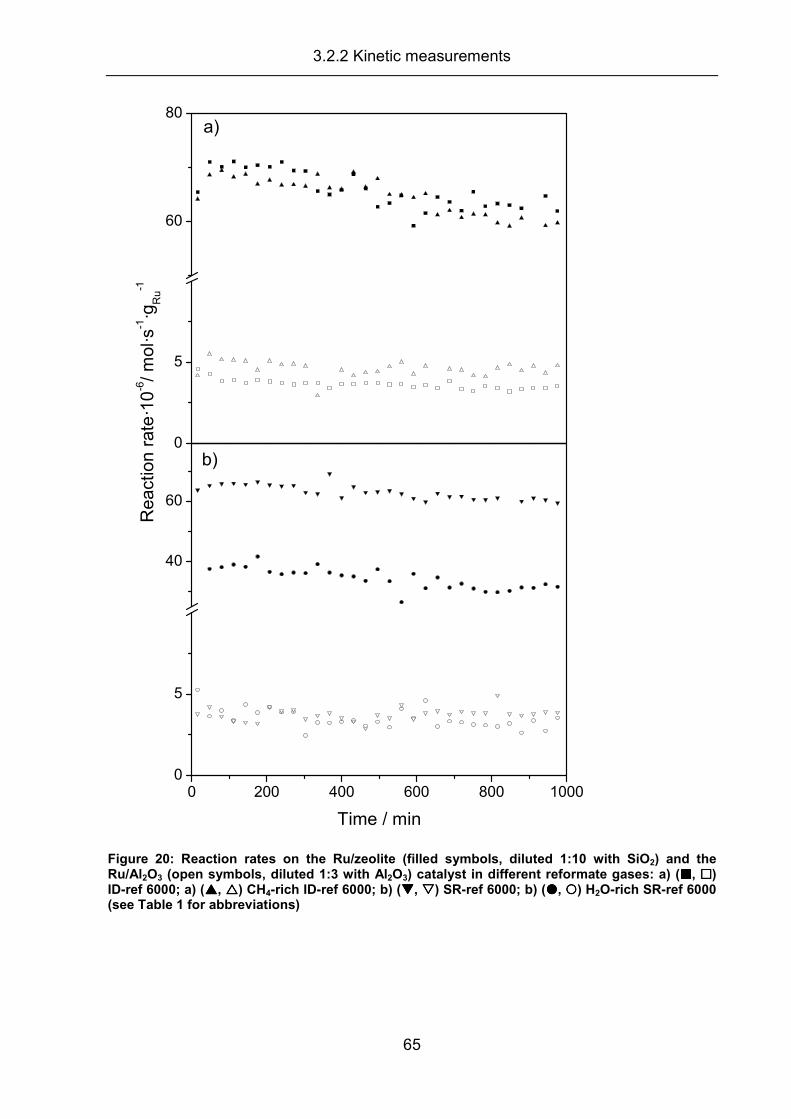
3.2.2 Kinetic measurements
65
0
5
60
80
React
ion r
ate
�10
-6/ m
ol�s
-1�g
Ru
-1
a)
0 200 400 600 800 10000
5
40
60
Time / min
b)
Figure 20: Reaction rates on the Ru/zeolite (filled symbols, diluted 1:10 with SiO2) and the Ru/Al2O3 (open symbols, diluted 1:3 with Al2O3) catalyst in different reformate gases: a) (����, ����) ID-ref 6000; a) (����, ����) CH4-rich ID-ref 6000; b) (����, ����) SR-ref 6000; b) (����, ) H2O-rich SR-ref 6000 (see Table 1 for abbreviations)
3.2.2 Kinetic measurements
66
The higher reaction temperature in their measurements has a positive effect on the
activity, but they also used a gas mixture with higher CO and lower H2 concentration,
which has a negative influence on the activity [26]. Additionally, they used a different
Ru loading, which may also affect the activity [40].
Using turn-over frequencies as a measure of the intrinsic activity of the Ru particle
surface rather than the Ru mass normalized rates for comparison (see Table 10,
appendix), the very high activity of the Ru/zeolite catalyst is even more obvious,
showing a smaller but comparable TOF value, despite the lower reaction temperature
in the present study (Table 10). The general trends of the mass normalized activities,
however, are reproduced. It is important to realize that the turnover frequencies
reported in the different studies are based on different methods for determining the
active Ru particle surface. Kowalczyk et al. [41] used O2 chemisorption at 0°C after
reduction at 430°C or 520°C for 20h. Subsequently, the catalyst was reduced at the
same temperatures again and CO chemisorption was performed at room temperature
(stoichiometries: 1.1 O atoms per Ru surface atom, 0.6 CO molecules per Ru surface
atom). Panagiotopoulou et al [42] performed H2 chemisorption at 100°C to calculate
the Ru dispersion. All other groups [119;121;122] used reversible/irreversible H2
chemisorption at room temperature to determine the Ru surface area and thus the Ru
particle size.
Comparing two 3 wt.% Ru/Al2O3 catalysts with 10 nm and 34 nm Ru particles, Dagle
et al. [40] found 99% CO conversion at a 20°C lower temperature on the former
catalyst (10 nm) than on the other one. These authors concluded that catalysts with
higher dispersion exhibit a higher activity for the CO methanation, while the lower
dispersed catalyst tends to suppress the CO2 conversion better. A similar particle size
dependence of the activity was observed also by other groups [123;124], whereas
other studies reported a decreasing activity with increasing Ru dispersion [25;41;125].
Gupta et al. [31;32] concluded from combined DRIFTS and kinetic measurements,
that the influence of the Ru dispersion on the methanation activity depends on the
reaction temperature and suggested that different mechanisms are dominant below
and above 220°C. Only at temperatures below 220°C, a dispersion dependent
mechanism prevails.
The much higher activity of the Ru/Zeolite compared to the Ru/Al2O3 catalyst
observed in this study, both in terms of Ru mass normalized rates and in turnover
frequencies, is attributed to several reasons. Most directly, support effects arising from
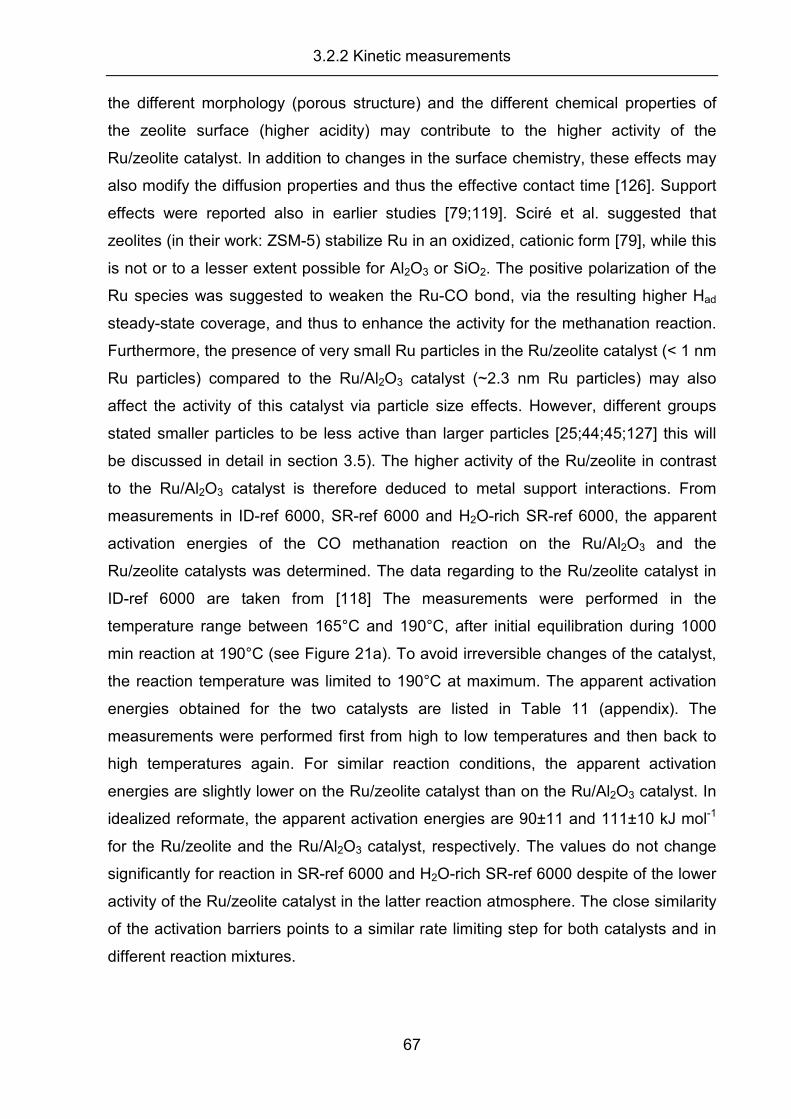
3.2.2 Kinetic measurements
67
the different morphology (porous structure) and the different chemical properties of
the zeolite surface (higher acidity) may contribute to the higher activity of the
Ru/zeolite catalyst. In addition to changes in the surface chemistry, these effects may
also modify the diffusion properties and thus the effective contact time [126]. Support
effects were reported also in earlier studies [79;119]. Sciré et al. suggested that
zeolites (in their work: ZSM-5) stabilize Ru in an oxidized, cationic form [79], while this
is not or to a lesser extent possible for Al2O3 or SiO2. The positive polarization of the
Ru species was suggested to weaken the Ru-CO bond, via the resulting higher Had
steady-state coverage, and thus to enhance the activity for the methanation reaction.
Furthermore, the presence of very small Ru particles in the Ru/zeolite catalyst (< 1 nm
Ru particles) compared to the Ru/Al2O3 catalyst (~2.3 nm Ru particles) may also
affect the activity of this catalyst via particle size effects. However, different groups
stated smaller particles to be less active than larger particles [25;44;45;127] this will
be discussed in detail in section 3.5). The higher activity of the Ru/zeolite in contrast
to the Ru/Al2O3 catalyst is therefore deduced to metal support interactions. From
measurements in ID-ref 6000, SR-ref 6000 and H2O-rich SR-ref 6000, the apparent
activation energies of the CO methanation reaction on the Ru/Al2O3 and the
Ru/zeolite catalysts was determined. The data regarding to the Ru/zeolite catalyst in
ID-ref 6000 are taken from [118] The measurements were performed in the
temperature range between 165°C and 190°C, after initial equilibration during 1000
min reaction at 190°C (see Figure 21a). To avoid irreversible changes of the catalyst,
the reaction temperature was limited to 190°C at maximum. The apparent activation
energies obtained for the two catalysts are listed in Table 11 (appendix). The
measurements were performed first from high to low temperatures and then back to
high temperatures again. For similar reaction conditions, the apparent activation
energies are slightly lower on the Ru/zeolite catalyst than on the Ru/Al2O3 catalyst. In
idealized reformate, the apparent activation energies are 90±11 and 111±10 kJ mol-1
for the Ru/zeolite and the Ru/Al2O3 catalyst, respectively. The values do not change
significantly for reaction in SR-ref 6000 and H2O-rich SR-ref 6000 despite of the lower
activity of the Ru/zeolite catalyst in the latter reaction atmosphere. The close similarity
of the activation barriers points to a similar rate limiting step for both catalysts and in
different reaction mixtures.
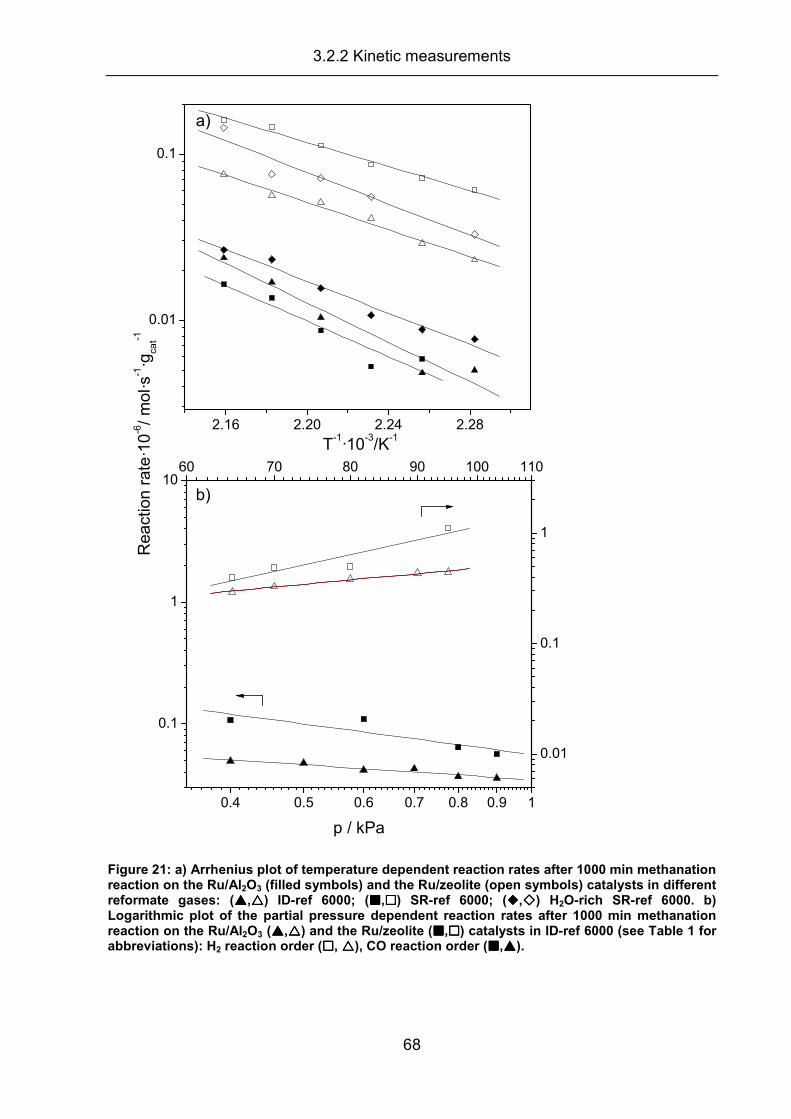
3.2.2 Kinetic measurements
68
2.16 2.20 2.24 2.28
0.01
0.1
60 70 80 90 100 110
0.01
0.1
1
T-1�10
-3/K
-1
a)
0.4 0.5 0.6 0.7 0.8 0.9 1
0.1
1
10
Re
act
ion
rate
�10
-6/
mo
l�s-1�g
cat-1
p / kPa
b)
Figure 21: a) Arrhenius plot of temperature dependent reaction rates after 1000 min methanation reaction on the Ru/Al2O3 (filled symbols) and the Ru/zeolite (open symbols) catalysts in different reformate gases: (����,����) ID-ref 6000; (����,����) SR-ref 6000; (����,����) H2O-rich SR-ref 6000. b) Logarithmic plot of the partial pressure dependent reaction rates after 1000 min methanation reaction on the Ru/Al2O3 (����,����) and the Ru/zeolite (����,����) catalysts in ID-ref 6000 (see Table 1 for abbreviations): H2 reaction order (����, ����), CO reaction order (����,����).
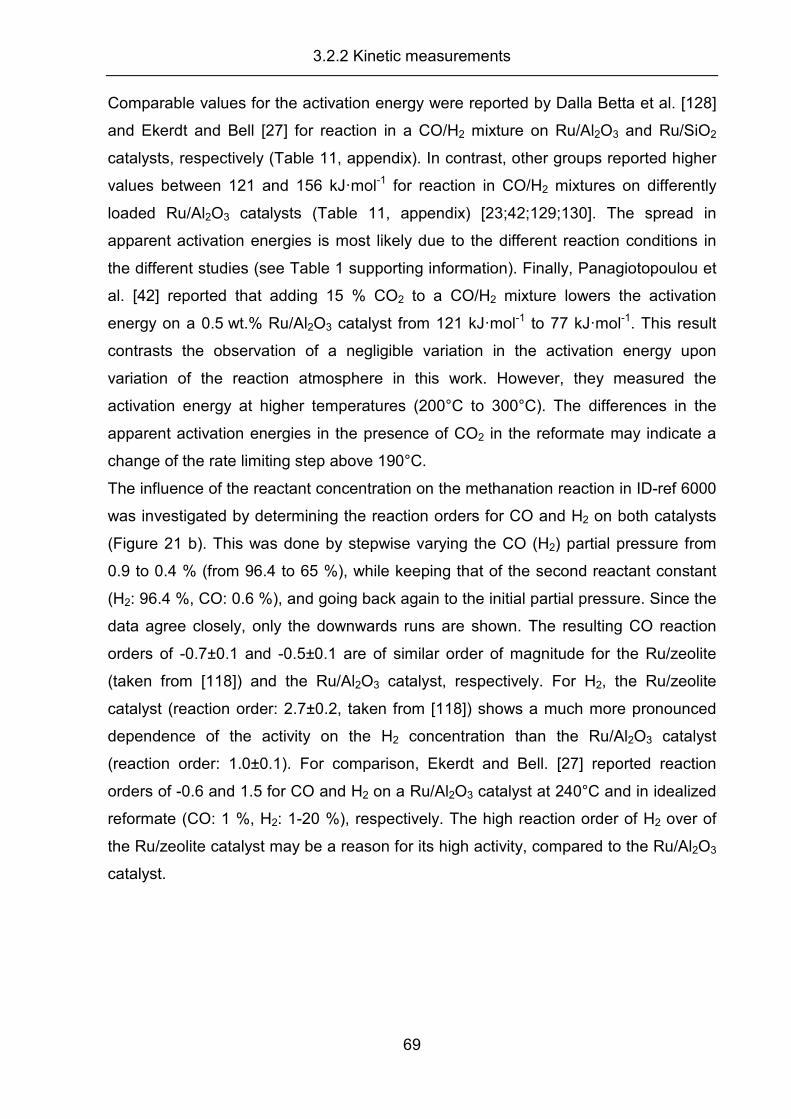
3.2.2 Kinetic measurements
69
Comparable values for the activation energy were reported by Dalla Betta et al. [128]
and Ekerdt and Bell [27] for reaction in a CO/H2 mixture on Ru/Al2O3 and Ru/SiO2
catalysts, respectively (Table 11, appendix). In contrast, other groups reported higher
values between 121 and 156 kJ�mol-1 for reaction in CO/H2 mixtures on differently
loaded Ru/Al2O3 catalysts (Table 11, appendix) [23;42;129;130]. The spread in
apparent activation energies is most likely due to the different reaction conditions in
the different studies (see Table 1 supporting information). Finally, Panagiotopoulou et
al. [42] reported that adding 15 % CO2 to a CO/H2 mixture lowers the activation
energy on a 0.5 wt.% Ru/Al2O3 catalyst from 121 kJ�mol-1 to 77 kJ�mol-1. This result
contrasts the observation of a negligible variation in the activation energy upon
variation of the reaction atmosphere in this work. However, they measured the
activation energy at higher temperatures (200°C to 300°C). The differences in the
apparent activation energies in the presence of CO2 in the reformate may indicate a
change of the rate limiting step above 190°C.
The influence of the reactant concentration on the methanation reaction in ID-ref 6000
was investigated by determining the reaction orders for CO and H2 on both catalysts
(Figure 21 b). This was done by stepwise varying the CO (H2) partial pressure from
0.9 to 0.4 % (from 96.4 to 65 %), while keeping that of the second reactant constant
(H2: 96.4 %, CO: 0.6 %), and going back again to the initial partial pressure. Since the
data agree closely, only the downwards runs are shown. The resulting CO reaction
orders of -0.7±0.1 and -0.5±0.1 are of similar order of magnitude for the Ru/zeolite
(taken from [118]) and the Ru/Al2O3 catalyst, respectively. For H2, the Ru/zeolite
catalyst (reaction order: 2.7±0.2, taken from [118]) shows a much more pronounced
dependence of the activity on the H2 concentration than the Ru/Al2O3 catalyst
(reaction order: 1.0±0.1). For comparison, Ekerdt and Bell. [27] reported reaction
orders of -0.6 and 1.5 for CO and H2 on a Ru/Al2O3 catalyst at 240°C and in idealized
reformate (CO: 1 %, H2: 1-20 %), respectively. The high reaction order of H2 over of
the Ru/zeolite catalyst may be a reason for its high activity, compared to the Ru/Al2O3
catalyst.
3.2.3 DRIFTS measurements
70
3.2.3 DRIFTS measurements
In order to characterize the temporal evolution of the adsorbed surface species during
the methanation reaction, in situ IR measurements under the same reaction condi-
tions as applied in the kinetic measurements described above (Figure 20) were
performed. Sequences of DRIFT spectra, recorded during 1000 min reaction on the
Ru/zeolite and the Ru/Al2O3 catalyst in different reaction atmospheres, are shown in
Figure 22 and Figure 23. The spectra are split into 3 frequency ranges, the region of
the OH (4000-3500 cm-1, top left) and CHx (3000-2800 cm-1, top right) stretch
vibrations in the top panels, respectively, and the spectral range between 800 and
2300 cm-1 including the CO stretch (2300-1900 cm-1) and the OCO bending (1600-
800 cm-1) vibrations (bottom panel). The temporal evolution of the different surface
species was followed by the peak intensities. For reaction in ID-ref 6000 and CH4-rich
ID-ref 6000 (Figure 22), a fast build-up of signals in the CO region at 2075, 2036 and
1980 cm-1 on the Ru/Zeolite catalyst, and at 2030 and 1940 cm-1 on the Ru/Al2O3
catalyst is observed. On the latter catalyst, a dynamic equilibrium is reached after
~100 min, while on the Ru/zeolite catalyst the intensity decreased steadily until about
800 min of reaction. These signals are attributed to CO adsorbed on Ru
[31;65;79;131-138]. The exact position depends on the pre-treatment of the catalyst
and on the reaction conditions used in the experiment. The signal at 2036 cm-1 is
commonly assigned to linearly adsorbed CO on Ru0 [65;133;136;139]. In measure-
ments on Ru/TiO2 and Ru/Al2O3 catalysts, Londhe et al. [61] interpreted this signal as
COad linearly adsorbed on Ru, coadsorbed with and adjacent to Oad species.
Guglielminotti et al. [136] observed a similar signal during the methanation reaction on
a completely pre-reduced (only Ru0 species) Ru/TiO2 catalyst, and related this to
linearly adsorbed CO on Ru0. Measurements performed at different CO pressures
revealed that the wave number of the linearly bound COad species depends on the
coverage, in good agreement with results of CO adsorption experiments on Ru (0001)
[139]. The signals at 1980 cm-1 and 1940 cm-1 observed on the Ru/zeolite and the
Ru/Al2O3 catalyst, respectively, were related to a bridge bonded COad adsorbed on
Ru0 [140]. Finally, the COad related signal at higher wave numbers (2080 cm-1), which
is observed only on the Ru/Zeolite catalyst, is assigned to dicarbonyl CO species
adsorbed on very small Ru clusters or atoms on the support. These Ru species were
proposed to result from oxidative disruption of Ru-Ru bonds, and by some authors
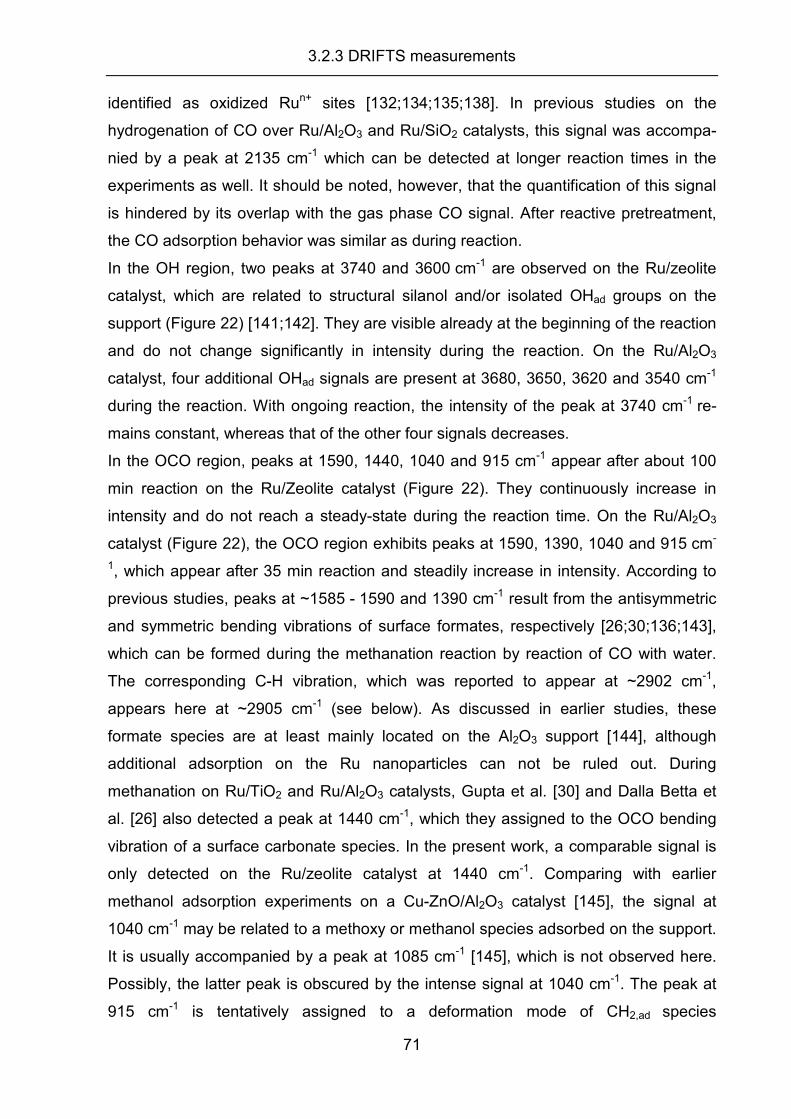
3.2.3 DRIFTS measurements
71
identified as oxidized Run+ sites [132;134;135;138]. In previous studies on the
hydrogenation of CO over Ru/Al2O3 and Ru/SiO2 catalysts, this signal was accompa-
nied by a peak at 2135 cm-1 which can be detected at longer reaction times in the
experiments as well. It should be noted, however, that the quantification of this signal
is hindered by its overlap with the gas phase CO signal. After reactive pretreatment,
the CO adsorption behavior was similar as during reaction.
In the OH region, two peaks at 3740 and 3600 cm-1 are observed on the Ru/zeolite
catalyst, which are related to structural silanol and/or isolated OHad groups on the
support (Figure 22) [141;142]. They are visible already at the beginning of the reaction
and do not change significantly in intensity during the reaction. On the Ru/Al2O3
catalyst, four additional OHad signals are present at 3680, 3650, 3620 and 3540 cm-1
during the reaction. With ongoing reaction, the intensity of the peak at 3740 cm-1 re-
mains constant, whereas that of the other four signals decreases.
In the OCO region, peaks at 1590, 1440, 1040 and 915 cm-1 appear after about 100
min reaction on the Ru/Zeolite catalyst (Figure 22). They continuously increase in
intensity and do not reach a steady-state during the reaction time. On the Ru/Al2O3
catalyst (Figure 22), the OCO region exhibits peaks at 1590, 1390, 1040 and 915 cm-
1, which appear after 35 min reaction and steadily increase in intensity. According to
previous studies, peaks at ~1585 - 1590 and 1390 cm-1 result from the antisymmetric
and symmetric bending vibrations of surface formates, respectively [26;30;136;143],
which can be formed during the methanation reaction by reaction of CO with water.
The corresponding C-H vibration, which was reported to appear at ~2902 cm-1,
appears here at ~2905 cm-1 (see below). As discussed in earlier studies, these
formate species are at least mainly located on the Al2O3 support [144], although
additional adsorption on the Ru nanoparticles can not be ruled out. During
methanation on Ru/TiO2 and Ru/Al2O3 catalysts, Gupta et al. [30] and Dalla Betta et
al. [26] also detected a peak at 1440 cm-1, which they assigned to the OCO bending
vibration of a surface carbonate species. In the present work, a comparable signal is
only detected on the Ru/zeolite catalyst at 1440 cm-1. Comparing with earlier
methanol adsorption experiments on a Cu-ZnO/Al2O3 catalyst [145], the signal at
1040 cm-1 may be related to a methoxy or methanol species adsorbed on the support.
It is usually accompanied by a peak at 1085 cm-1 [145], which is not observed here.
Possibly, the latter peak is obscured by the intense signal at 1040 cm-1. The peak at
915 cm-1 is tentatively assigned to a deformation mode of CH2,ad species
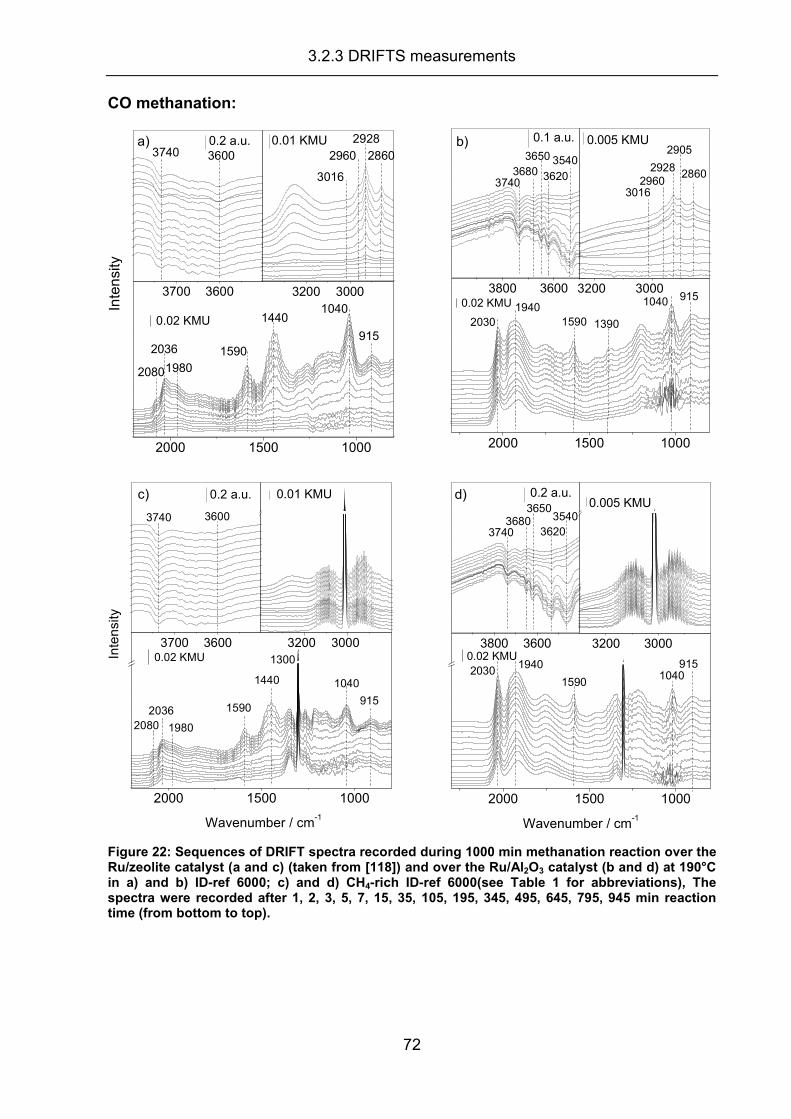
3.2.3 DRIFTS measurements
72
CO methanation:
2000 1500 1000
1440
915
1040
1590
1980
2036
2080
2860
2928
2960
3016
36003740
Inte
nsi
ty
0.02 KMU
3200 3000
0.01 KMU
3700 3600
0.2 a.u.a)
2000 1500 1000
2905
9151040
13901590
3540
3620
3650
36803740
19402030
0.02 KMU3200 3000
28602960
2928
3016
0.005 KMU
3800 3600
0.1 a.u.b)
2000 1500 1000
915
1040
1300
1440
2036
1980
1590
2080
36003740
Wavenumber / cm-1
In
ten
sity
0.02 KMU3200 3000
0.01 KMU
3700 3600
0.2 a.u.c)
2000 1500 1000
9151040
1590
19402030
Wavenumber / cm-1
0.02 KMU3200 3000
0.005 KMU
3800 3600
35403620
36503680
3740
0.2 a.u.d)
Figure 22: Sequences of DRIFT spectra recorded during 1000 min methanation reaction over the Ru/zeolite catalyst (a and c) (taken from [118]) and over the Ru/Al2O3 catalyst (b and d) at 190°C in a) and b) ID-ref 6000; c) and d) CH4-rich ID-ref 6000(see Table 1 for abbreviations), The spectra were recorded after 1, 2, 3, 5, 7, 15, 35, 105, 195, 345, 495, 645, 795, 945 min reaction time (from bottom to top).
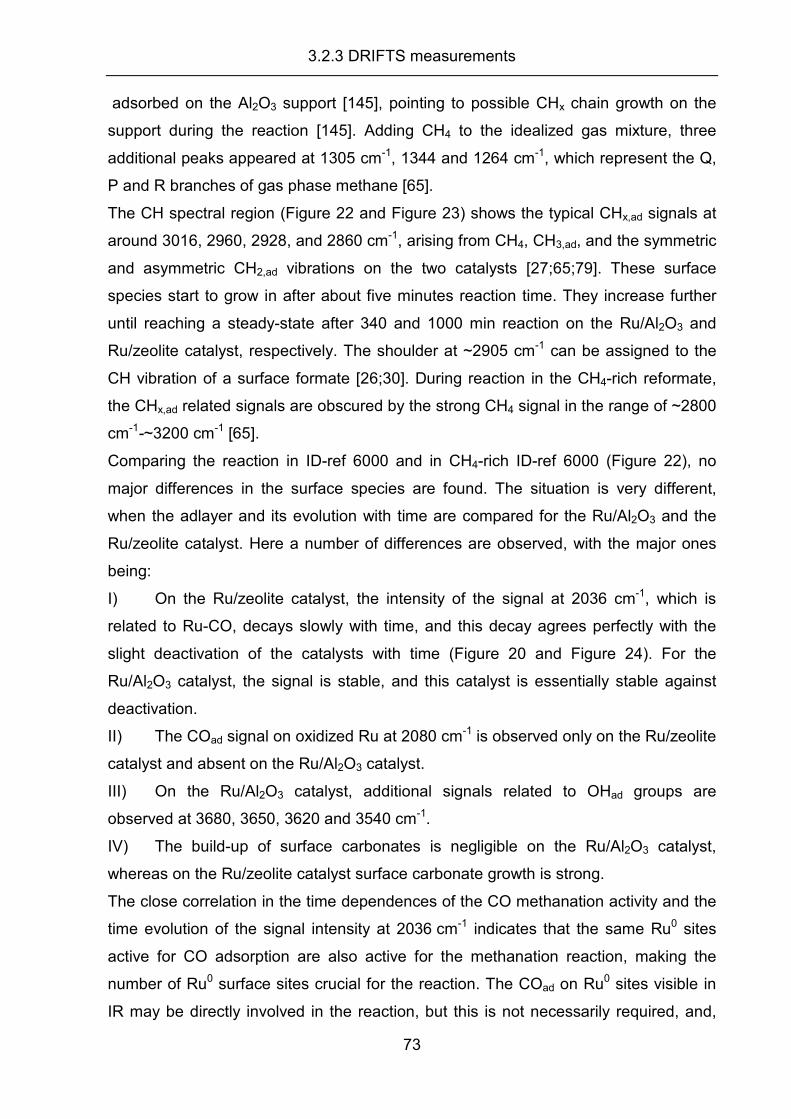
3.2.3 DRIFTS measurements
73
adsorbed on the Al2O3 support [145], pointing to possible CHx chain growth on the
support during the reaction [145]. Adding CH4 to the idealized gas mixture, three
additional peaks appeared at 1305 cm-1, 1344 and 1264 cm-1, which represent the Q,
P and R branches of gas phase methane [65].
The CH spectral region (Figure 22 and Figure 23) shows the typical CHx,ad signals at
around 3016, 2960, 2928, and 2860 cm-1, arising from CH4, CH3,ad, and the symmetric
and asymmetric CH2,ad vibrations on the two catalysts [27;65;79]. These surface
species start to grow in after about five minutes reaction time. They increase further
until reaching a steady-state after 340 and 1000 min reaction on the Ru/Al2O3 and
Ru/zeolite catalyst, respectively. The shoulder at ~2905 cm-1 can be assigned to the
CH vibration of a surface formate [26;30]. During reaction in the CH4-rich reformate,
the CHx,ad related signals are obscured by the strong CH4 signal in the range of ~2800
cm-1-~3200 cm-1 [65].
Comparing the reaction in ID-ref 6000 and in CH4-rich ID-ref 6000 (Figure 22), no
major differences in the surface species are found. The situation is very different,
when the adlayer and its evolution with time are compared for the Ru/Al2O3 and the
Ru/zeolite catalyst. Here a number of differences are observed, with the major ones
being:
I) On the Ru/zeolite catalyst, the intensity of the signal at 2036 cm-1, which is
related to Ru-CO, decays slowly with time, and this decay agrees perfectly with the
slight deactivation of the catalysts with time (Figure 20 and Figure 24). For the
Ru/Al2O3 catalyst, the signal is stable, and this catalyst is essentially stable against
deactivation.
II) The COad signal on oxidized Ru at 2080 cm-1 is observed only on the Ru/zeolite
catalyst and absent on the Ru/Al2O3 catalyst.
III) On the Ru/Al2O3 catalyst, additional signals related to OHad groups are
observed at 3680, 3650, 3620 and 3540 cm-1.
IV) The build-up of surface carbonates is negligible on the Ru/Al2O3 catalyst,
whereas on the Ru/zeolite catalyst surface carbonate growth is strong.
The close correlation in the time dependences of the CO methanation activity and the
time evolution of the signal intensity at 2036 cm-1 indicates that the same Ru0 sites
active for CO adsorption are also active for the methanation reaction, making the
number of Ru0 surface sites crucial for the reaction. The COad on Ru0 sites visible in
IR may be directly involved in the reaction, but this is not necessarily required, and,
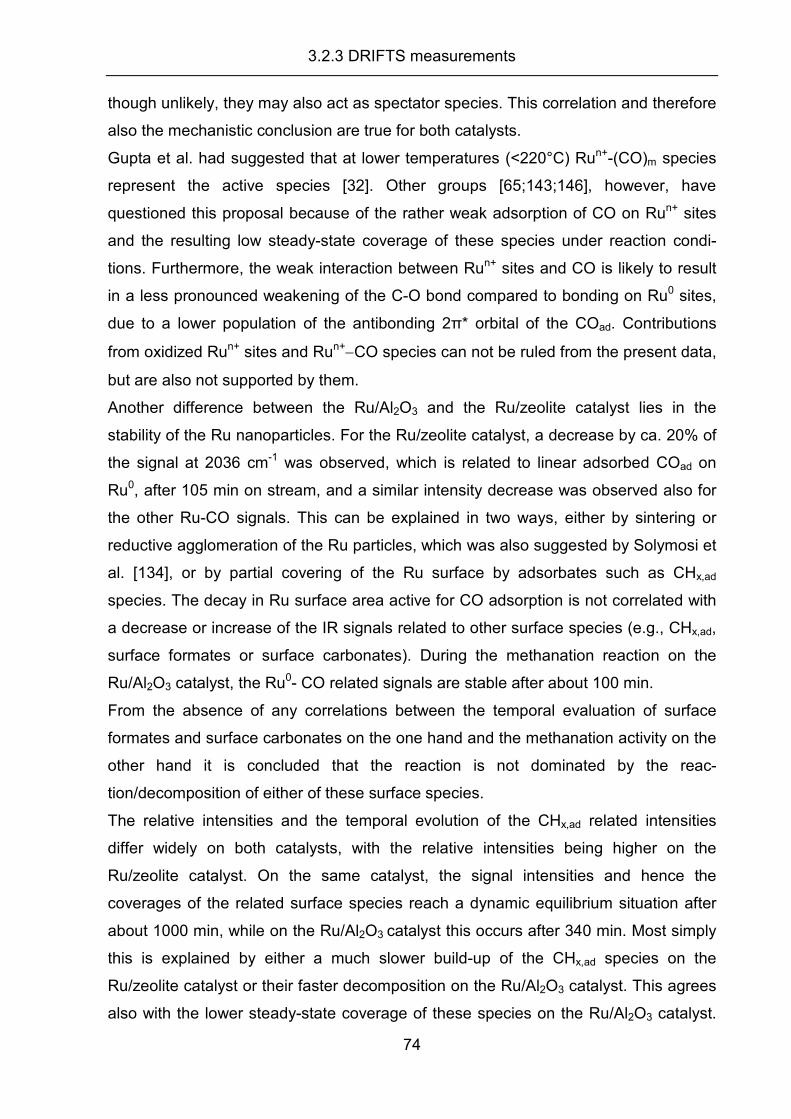
3.2.3 DRIFTS measurements
74
though unlikely, they may also act as spectator species. This correlation and therefore
also the mechanistic conclusion are true for both catalysts.
Gupta et al. had suggested that at lower temperatures (<220°C) Run+-(CO)m species
represent the active species [32]. Other groups [65;143;146], however, have
questioned this proposal because of the rather weak adsorption of CO on Run+ sites
and the resulting low steady-state coverage of these species under reaction condi-
tions. Furthermore, the weak interaction between Run+ sites and CO is likely to result
in a less pronounced weakening of the C-O bond compared to bonding on Ru0 sites,
due to a lower population of the antibonding 2π* orbital of the COad. Contributions
from oxidized Run+ sites and Run+−CO species can not be ruled from the present data,
but are also not supported by them.
Another difference between the Ru/Al2O3 and the Ru/zeolite catalyst lies in the
stability of the Ru nanoparticles. For the Ru/zeolite catalyst, a decrease by ca. 20% of
the signal at 2036 cm-1 was observed, which is related to linear adsorbed COad on
Ru0, after 105 min on stream, and a similar intensity decrease was observed also for
the other Ru-CO signals. This can be explained in two ways, either by sintering or
reductive agglomeration of the Ru particles, which was also suggested by Solymosi et
al. [134], or by partial covering of the Ru surface by adsorbates such as CHx,ad
species. The decay in Ru surface area active for CO adsorption is not correlated with
a decrease or increase of the IR signals related to other surface species (e.g., CHx,ad,
surface formates or surface carbonates). During the methanation reaction on the
Ru/Al2O3 catalyst, the Ru0- CO related signals are stable after about 100 min.
From the absence of any correlations between the temporal evaluation of surface
formates and surface carbonates on the one hand and the methanation activity on the
other hand it is concluded that the reaction is not dominated by the reac-
tion/decomposition of either of these surface species.
The relative intensities and the temporal evolution of the CHx,ad related intensities
differ widely on both catalysts, with the relative intensities being higher on the
Ru/zeolite catalyst. On the same catalyst, the signal intensities and hence the
coverages of the related surface species reach a dynamic equilibrium situation after
about 1000 min, while on the Ru/Al2O3 catalyst this occurs after 340 min. Most simply
this is explained by either a much slower build-up of the CHx,ad species on the
Ru/zeolite catalyst or their faster decomposition on the Ru/Al2O3 catalyst. This agrees
also with the lower steady-state coverage of these species on the Ru/Al2O3 catalyst.

3.2.3 DRIFTS measurements
75
In addition, due to the higher surface area of the Ru/zeolite support, more adsorption
sites for the CHx,ad species are expected. The CHx,ad species were suggested as in-
termediates in the methanation reaction [28;147] will be discussed later in more detail
(section 3.2.4).
The role of surface formates and carbonates, which are formed by reaction of CO with
H2O during the methanation reaction, is not clear yet. Since carbonates are only
present on the Ru/zeolite catalyst, it is more likely that these species represent
reaction side products. Regarding the role of the surface formates, several groups
proposed them to be side products of the reaction [26;27;30]. Praire et al. [73]
suggested that during CO2 methanation surface formates may serve as a reversible
CO reservoir. The role of the surface formates will be discussed in more detail in
section 3.2.4.
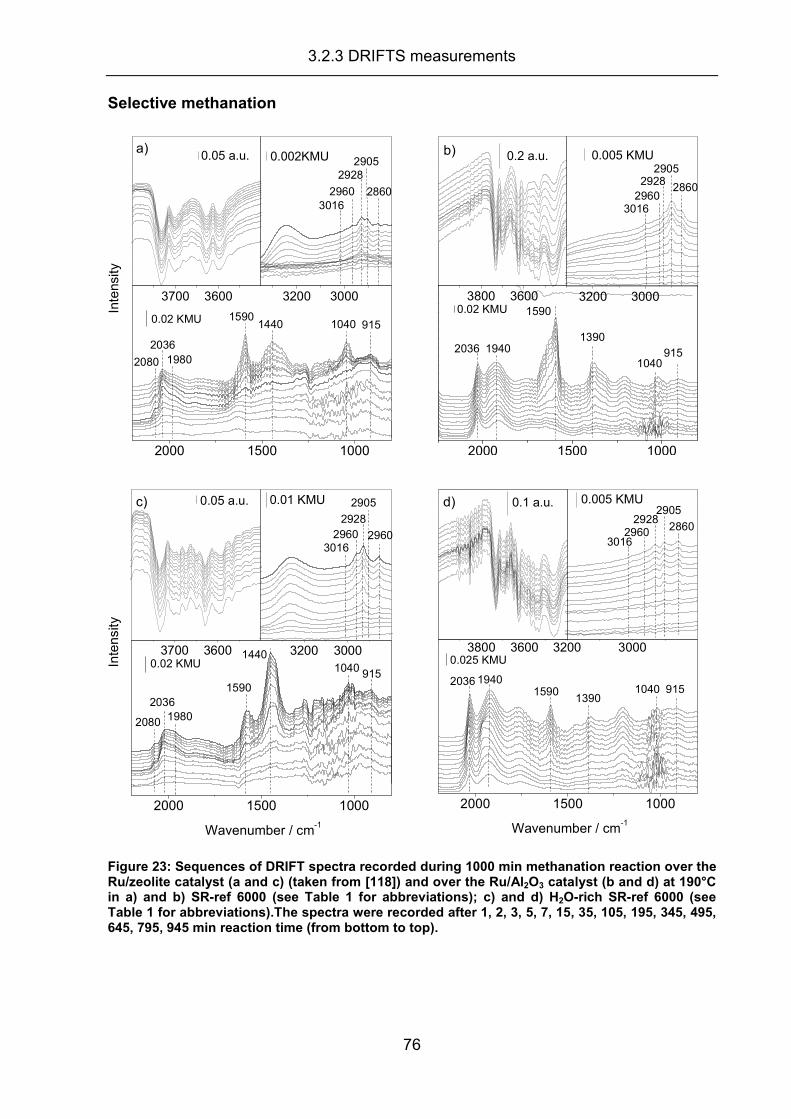
3.2.3 DRIFTS measurements
76
Selective methanation
2000 1500 1000
915104014401590
19802036
2080
Inte
nsi
ty
0.02 KMU
3200 3000
2860
29052928
29603016
0.002KMU
3700 3600
0.05 a.u.a)
2000 1500 1000
9151040
1390
1590
19402036
0.02 KMU3200 3000
2860
29052928
29603016
0.005 KMU
3800 3600
0.2 a.u.b)
2000 1500 1000
91510401440
1590
19802036
2080
Wavenumber / cm-1
In
ten
sity
0.02 KMU3200 3000
2960
2905
2928
29603016
0.01 KMU
3700 3600
0.05 a.u.c)
2000 1500 1000
91510401390
159019402036
Wavenumber / cm-1
0.025 KMU3200 3000
2860
29052928
29603016
0.005 KMU
3800 3600
0.1 a.u.d)
Figure 23: Sequences of DRIFT spectra recorded during 1000 min methanation reaction over the Ru/zeolite catalyst (a and c) (taken from [118]) and over the Ru/Al2O3 catalyst (b and d) at 190°C in a) and b) SR-ref 6000 (see Table 1 for abbreviations); c) and d) H2O-rich SR-ref 6000 (see Table 1 for abbreviations).The spectra were recorded after 1, 2, 3, 5, 7, 15, 35, 105, 195, 345, 495, 645, 795, 945 min reaction time (from bottom to top).
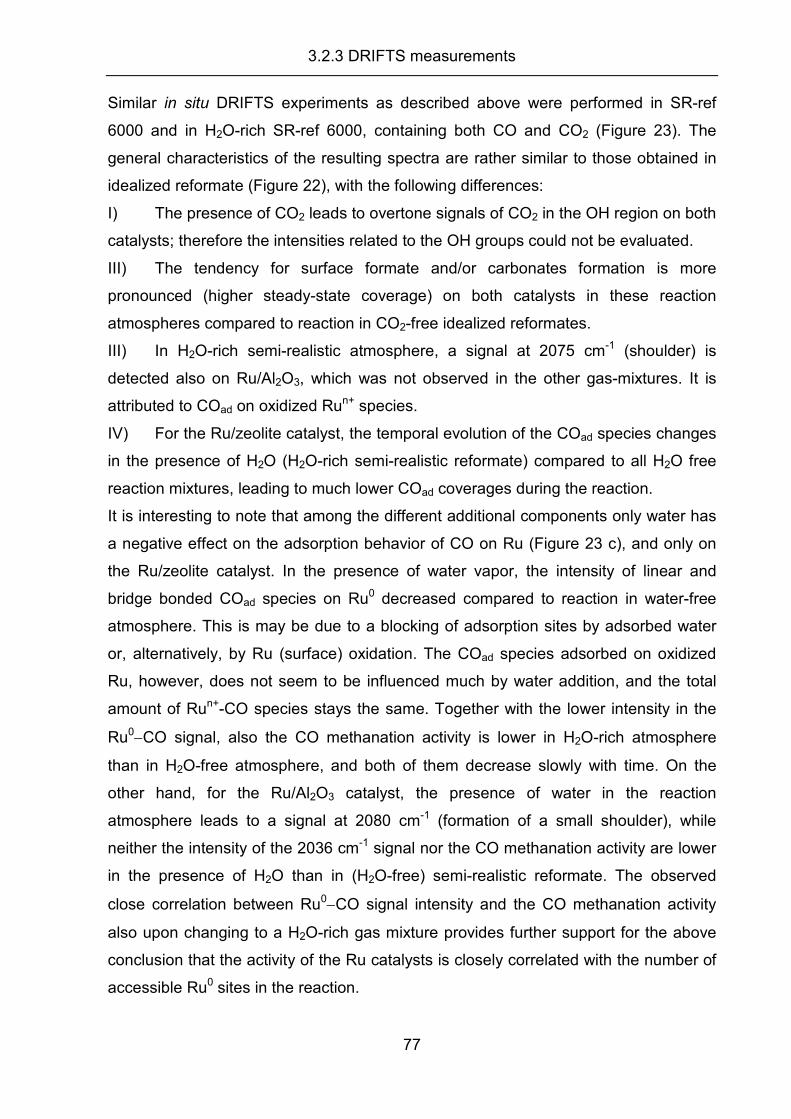
3.2.3 DRIFTS measurements
77
Similar in situ DRIFTS experiments as described above were performed in SR-ref
6000 and in H2O-rich SR-ref 6000, containing both CO and CO2 (Figure 23). The
general characteristics of the resulting spectra are rather similar to those obtained in
idealized reformate (Figure 22), with the following differences:
I) The presence of CO2 leads to overtone signals of CO2 in the OH region on both
catalysts; therefore the intensities related to the OH groups could not be evaluated.
III) The tendency for surface formate and/or carbonates formation is more
pronounced (higher steady-state coverage) on both catalysts in these reaction
atmospheres compared to reaction in CO2-free idealized reformates.
III) In H2O-rich semi-realistic atmosphere, a signal at 2075 cm-1 (shoulder) is
detected also on Ru/Al2O3, which was not observed in the other gas-mixtures. It is
attributed to COad on oxidized Run+ species.
IV) For the Ru/zeolite catalyst, the temporal evolution of the COad species changes
in the presence of H2O (H2O-rich semi-realistic reformate) compared to all H2O free
reaction mixtures, leading to much lower COad coverages during the reaction.
It is interesting to note that among the different additional components only water has
a negative effect on the adsorption behavior of CO on Ru (Figure 23 c), and only on
the Ru/zeolite catalyst. In the presence of water vapor, the intensity of linear and
bridge bonded COad species on Ru0 decreased compared to reaction in water-free
atmosphere. This is may be due to a blocking of adsorption sites by adsorbed water
or, alternatively, by Ru (surface) oxidation. The COad species adsorbed on oxidized
Ru, however, does not seem to be influenced much by water addition, and the total
amount of Run+-CO species stays the same. Together with the lower intensity in the
Ru0−CO signal, also the CO methanation activity is lower in H2O-rich atmosphere
than in H2O-free atmosphere, and both of them decrease slowly with time. On the
other hand, for the Ru/Al2O3 catalyst, the presence of water in the reaction
atmosphere leads to a signal at 2080 cm-1 (formation of a small shoulder), while
neither the intensity of the 2036 cm-1 signal nor the CO methanation activity are lower
in the presence of H2O than in (H2O-free) semi-realistic reformate. The observed
close correlation between Ru0−CO signal intensity and the CO methanation activity
also upon changing to a H2O-rich gas mixture provides further support for the above
conclusion that the activity of the Ru catalysts is closely correlated with the number of
accessible Ru0 sites in the reaction.
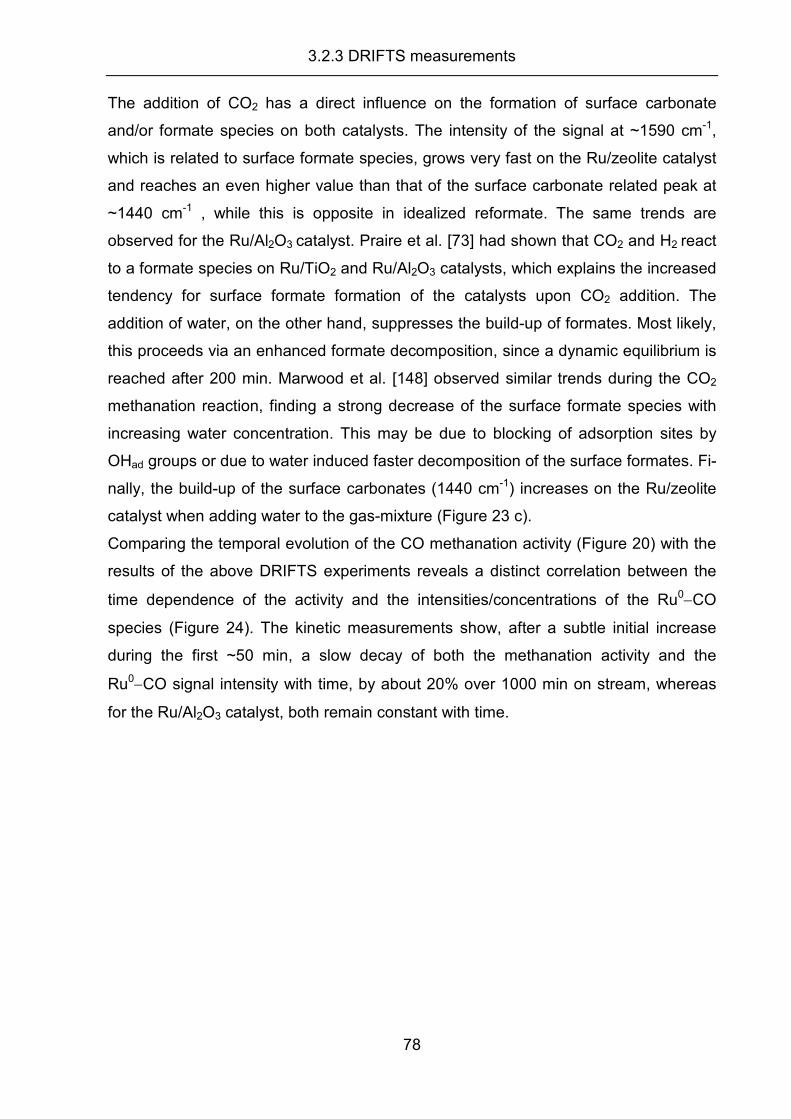
3.2.3 DRIFTS measurements
78
The addition of CO2 has a direct influence on the formation of surface carbonate
and/or formate species on both catalysts. The intensity of the signal at ~1590 cm-1,
which is related to surface formate species, grows very fast on the Ru/zeolite catalyst
and reaches an even higher value than that of the surface carbonate related peak at
~1440 cm-1 , while this is opposite in idealized reformate. The same trends are
observed for the Ru/Al2O3 catalyst. Praire et al. [73] had shown that CO2 and H2 react
to a formate species on Ru/TiO2 and Ru/Al2O3 catalysts, which explains the increased
tendency for surface formate formation of the catalysts upon CO2 addition. The
addition of water, on the other hand, suppresses the build-up of formates. Most likely,
this proceeds via an enhanced formate decomposition, since a dynamic equilibrium is
reached after 200 min. Marwood et al. [148] observed similar trends during the CO2
methanation reaction, finding a strong decrease of the surface formate species with
increasing water concentration. This may be due to blocking of adsorption sites by
OHad groups or due to water induced faster decomposition of the surface formates. Fi-
nally, the build-up of the surface carbonates (1440 cm-1) increases on the Ru/zeolite
catalyst when adding water to the gas-mixture (Figure 23 c).
Comparing the temporal evolution of the CO methanation activity (Figure 20) with the
results of the above DRIFTS experiments reveals a distinct correlation between the
time dependence of the activity and the intensities/concentrations of the Ru0−CO
species (Figure 24). The kinetic measurements show, after a subtle initial increase
during the first ~50 min, a slow decay of both the methanation activity and the
Ru0−CO signal intensity with time, by about 20% over 1000 min on stream, whereas
for the Ru/Al2O3 catalyst, both remain constant with time.
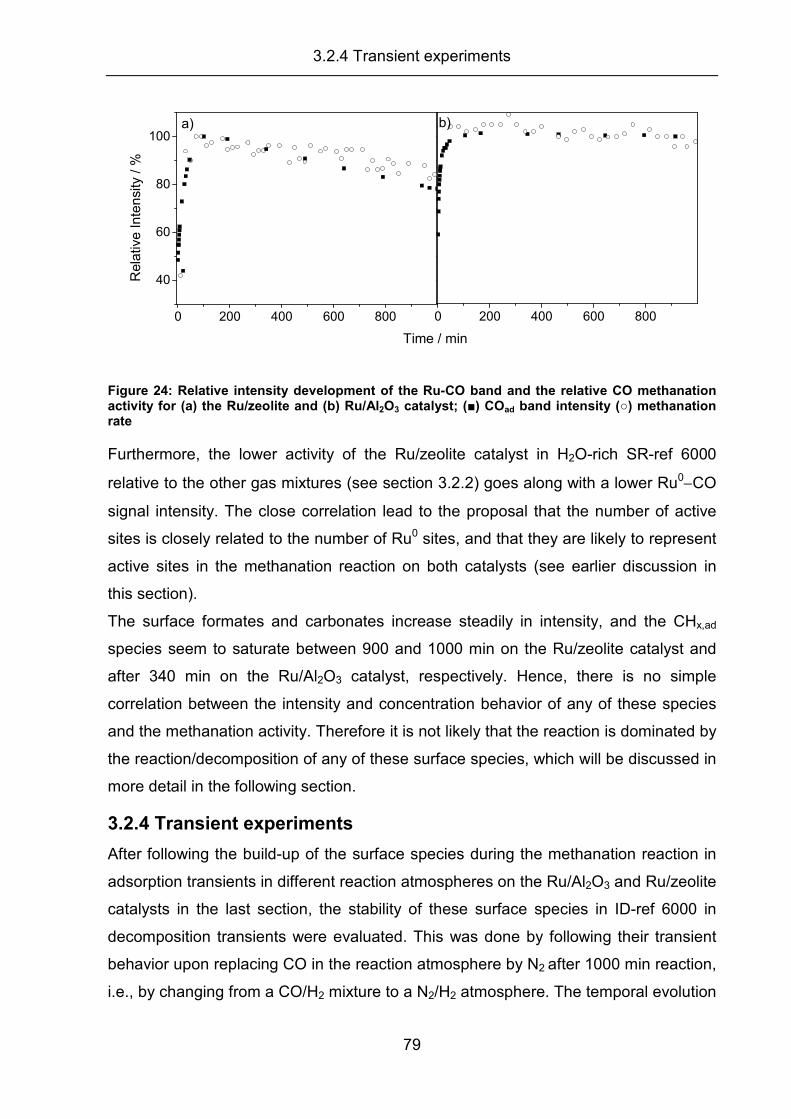
3.2.4 Transient experiments
79
0 200 400 600 8000 200 400 600 800
40
60
80
100
b)a)
Time / min
Rela
tive
In
ten
sity
/ %
Figure 24: Relative intensity development of the Ru-CO band and the relative CO methanation activity for (a) the Ru/zeolite and (b) Ru/Al2O3 catalyst; (■) COad band intensity (○) methanation rate
Furthermore, the lower activity of the Ru/zeolite catalyst in H2O-rich SR-ref 6000
relative to the other gas mixtures (see section 3.2.2) goes along with a lower Ru0−CO
signal intensity. The close correlation lead to the proposal that the number of active
sites is closely related to the number of Ru0 sites, and that they are likely to represent
active sites in the methanation reaction on both catalysts (see earlier discussion in
this section).
The surface formates and carbonates increase steadily in intensity, and the CHx,ad
species seem to saturate between 900 and 1000 min on the Ru/zeolite catalyst and
after 340 min on the Ru/Al2O3 catalyst, respectively. Hence, there is no simple
correlation between the intensity and concentration behavior of any of these species
and the methanation activity. Therefore it is not likely that the reaction is dominated by
the reaction/decomposition of any of these surface species, which will be discussed in
more detail in the following section.
3.2.4 Transient experiments
After following the build-up of the surface species during the methanation reaction in
adsorption transients in different reaction atmospheres on the Ru/Al2O3 and Ru/zeolite
catalysts in the last section, the stability of these surface species in ID-ref 6000 in
decomposition transients were evaluated. This was done by following their transient
behavior upon replacing CO in the reaction atmosphere by N2 after 1000 min reaction,
i.e., by changing from a CO/H2 mixture to a N2/H2 atmosphere. The temporal evolution
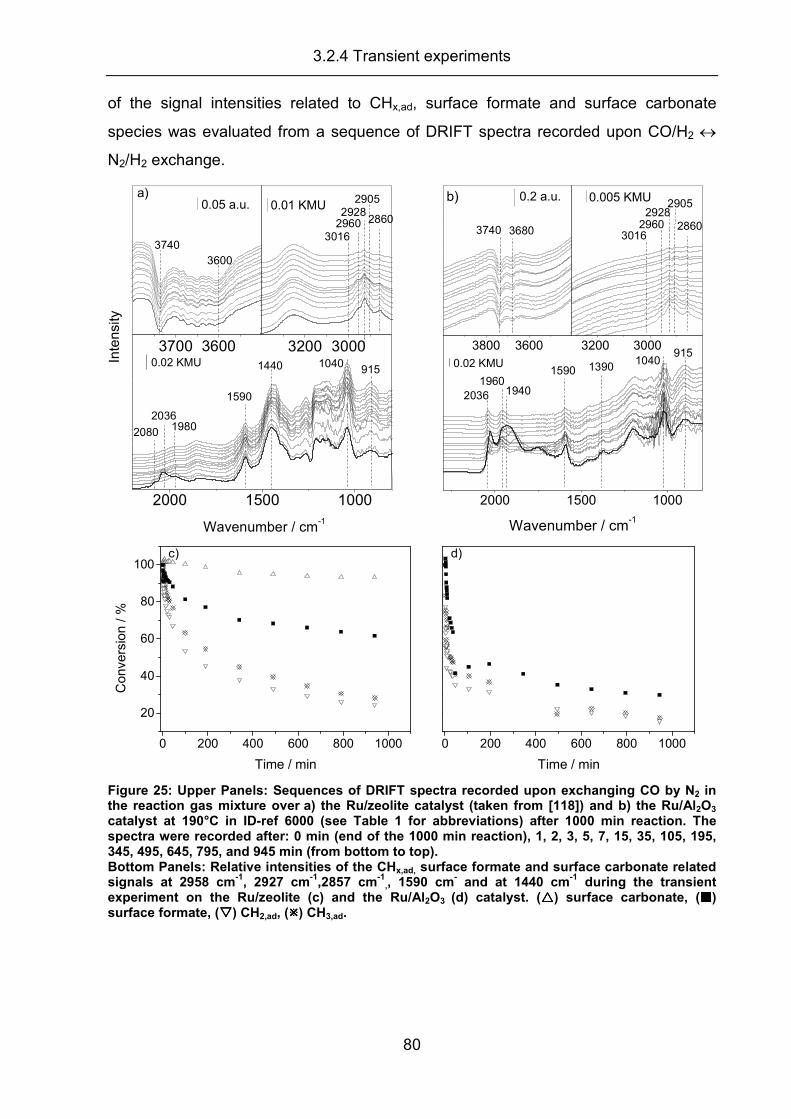
3.2.4 Transient experiments
80
of the signal intensities related to CHx,ad, surface formate and surface carbonate
species was evaluated from a sequence of DRIFT spectra recorded upon CO/H2 ↔
N2/H2 exchange.
2000 1500 1000
1040 9151440
1590
19802036
2080
29603016
3600
3740
Wavenumber / cm-1
Inte
nsi
ty
0.02 KMU3200 3000
2860
29052928
0.01 KMU
3700 3600
a)
0.05 a.u.
2000 1500 1000
9151040
139015901960
2036 1940
2860
29052928
2960301636803740
Wavenumber / cm-1
0.02 KMU
3200 3000
0.005 KMU
3800 3600
0.2 a.u.b)
0 200 400 600 800 1000
20
40
60
80
100
Time / min
Conve
rsio
n /
%
c)
0 200 400 600 800 1000
Time / min
d)
Figure 25: Upper Panels: Sequences of DRIFT spectra recorded upon exchanging CO by N2 in the reaction gas mixture over a) the Ru/zeolite catalyst (taken from [118]) and b) the Ru/Al2O3 catalyst at 190°C in ID-ref 6000 (see Table 1 for abbreviations) after 1000 min reaction. The spectra were recorded after: 0 min (end of the 1000 min reaction), 1, 2, 3, 5, 7, 15, 35, 105, 195, 345, 495, 645, 795, and 945 min (from bottom to top). Bottom Panels: Relative intensities of the CHx,ad, surface formate and surface carbonate related signals at 2958 cm
-1, 2927 cm
-1,2857 cm
-1,, 1590 cm
- and at 1440 cm
-1 during the transient
experiment on the Ru/zeolite (c) and the Ru/Al2O3 (d) catalyst. (����) surface carbonate, (����) surface formate, (����) CH2,ad, (����) CH3,ad.
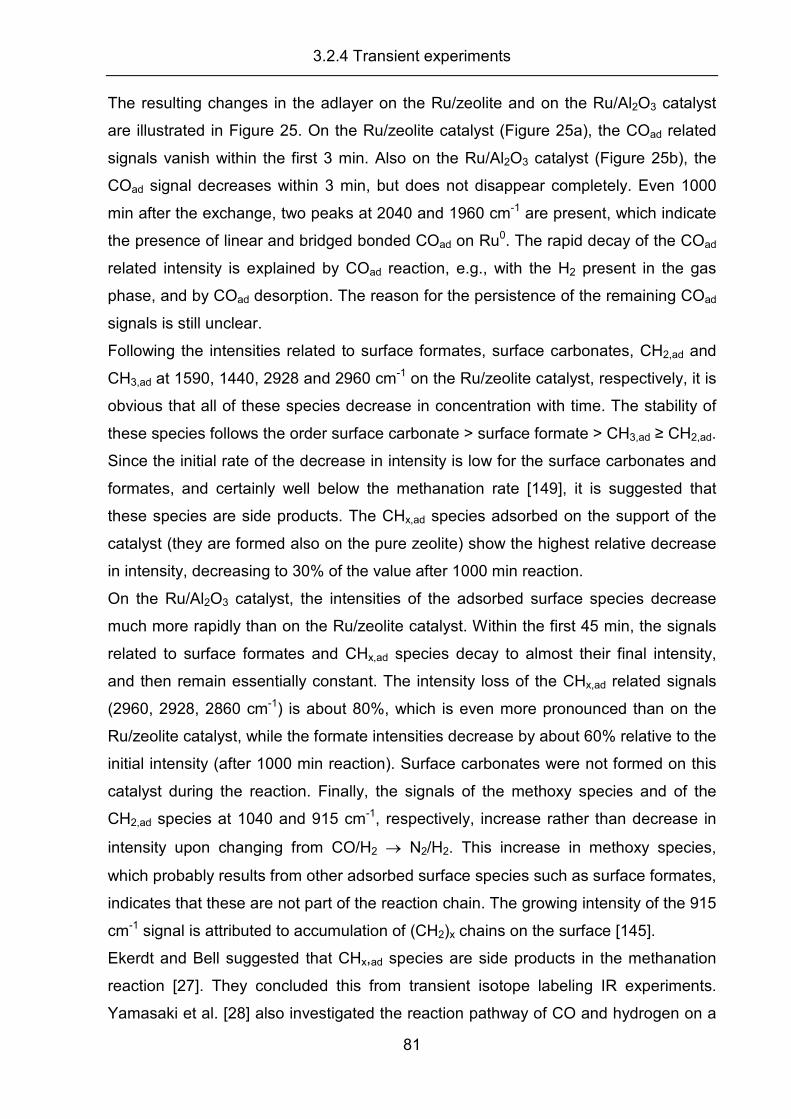
3.2.4 Transient experiments
81
The resulting changes in the adlayer on the Ru/zeolite and on the Ru/Al2O3 catalyst
are illustrated in Figure 25. On the Ru/zeolite catalyst (Figure 25a), the COad related
signals vanish within the first 3 min. Also on the Ru/Al2O3 catalyst (Figure 25b), the
COad signal decreases within 3 min, but does not disappear completely. Even 1000
min after the exchange, two peaks at 2040 and 1960 cm-1 are present, which indicate
the presence of linear and bridged bonded COad on Ru0. The rapid decay of the COad
related intensity is explained by COad reaction, e.g., with the H2 present in the gas
phase, and by COad desorption. The reason for the persistence of the remaining COad
signals is still unclear.
Following the intensities related to surface formates, surface carbonates, CH2,ad and
CH3,ad at 1590, 1440, 2928 and 2960 cm-1 on the Ru/zeolite catalyst, respectively, it is
obvious that all of these species decrease in concentration with time. The stability of
these species follows the order surface carbonate > surface formate > CH3,ad ≥ CH2,ad.
Since the initial rate of the decrease in intensity is low for the surface carbonates and
formates, and certainly well below the methanation rate [149], it is suggested that
these species are side products. The CHx,ad species adsorbed on the support of the
catalyst (they are formed also on the pure zeolite) show the highest relative decrease
in intensity, decreasing to 30% of the value after 1000 min reaction.
On the Ru/Al2O3 catalyst, the intensities of the adsorbed surface species decrease
much more rapidly than on the Ru/zeolite catalyst. Within the first 45 min, the signals
related to surface formates and CHx,ad species decay to almost their final intensity,
and then remain essentially constant. The intensity loss of the CHx,ad related signals
(2960, 2928, 2860 cm-1) is about 80%, which is even more pronounced than on the
Ru/zeolite catalyst, while the formate intensities decrease by about 60% relative to the
initial intensity (after 1000 min reaction). Surface carbonates were not formed on this
catalyst during the reaction. Finally, the signals of the methoxy species and of the
CH2,ad species at 1040 and 915 cm-1, respectively, increase rather than decrease in
intensity upon changing from CO/H2 → N2/H2. This increase in methoxy species,
which probably results from other adsorbed surface species such as surface formates,
indicates that these are not part of the reaction chain. The growing intensity of the 915
cm-1 signal is attributed to accumulation of (CH2)x chains on the surface [145].
Ekerdt and Bell suggested that CHx,ad species are side products in the methanation
reaction [27]. They concluded this from transient isotope labeling IR experiments.
Yamasaki et al. [28] also investigated the reaction pathway of CO and hydrogen on a
3.2.4 Transient experiments
82
Ru/SiO2 catalyst. They used an indirect method proposed by Wexler [150] for
quantifying the coverages of the adsorbed methylene and methyl groups, and
calculated the mean chain length of adsorbed hydrocarbon chains from the ratio of
these groups. From transient IR experiments, they proposed a complex mechanism
for the CO methanation reaction, where CHx,ad species act as reaction intermediates
and CH4 formation proceeds via formation and decomposition of adsorbed
hydrocarbon chains [28]. Since, however, the authors could not demonstrate that the
decomposition rate of the hydrocarbon chains under steady-state conditions
corresponds quantitatively to the CH4 formation rate, definite proof for this proposal is
still missing.
For more quantitative information on these aspects, in particular on the correlation
between decomposition of the CHx,ad species and CH4 formation rate on the
Ru/zeolite catalyst, a similar transient experiment as shown in Figure 25 was
performed, but following the decay of the CH4 formation rate by a mass spectrometer.
The resulting CH4 formation transient, recorded upon changing from a CO/H2 mixture
to an Ar/H2 mixture under similar reaction conditions as before (see Figure 25), is
plotted in Figure 26.
0 2 4 6 80
20
40
60
time / min
conve
rsio
n / %
Figure 26: Transient activity measurement of Ru/Zeolite upon exchange of CO by Ar under ID-ref 6000 (see Table 1 for abbreviations) after 1000 min reaction at 190°C; ����: CH4 conversion
3.2.5 Summary
83
Upon changing from the reaction mixture to the Ar/H2 mixture, the formation of CH4
decreases rapidly and reaches the background level within 3 to 4 min. For
comparison, the decay of the IR intensities related to CH2,ad and CH3,ad proceeds on a
much longer time scale (Figure 25). After 100 min exposure to Ar/H2, the related
signals show still more than 50% of their initial intensity, and the further decay of the
CHx,ad related signals is rather slow. Even after 1000 min exposure to an Ar/H2
mixture, the intensity of these signals is still around 25% of the initial value. Hence,
hydrogenation of the CHx,ad species visible in IR to CH4,ad and its subsequent rapid
desorption can not represent the rate limiting step for CH4 formation. The question for
the rate limiting step and the nature of the reaction intermediate in the dominant
reaction pathway is, at least from the experimental point of view, still open. Based on
the present data, the CHx,ad species visible in the IR spectra represent spectator
species, whose reaction to CH4 is much slower than required for explaining the
observed CH4 formation rate. Therefore, the formation and hydrogenation of the
CHx,ad species visible in IR can not represent the dominant reaction pathway. This
conclusion agrees well with recent predictions based on density functional theory
calculations [37;64;72], which favor a reaction pathway via formyl formation rather
than via C-O bond splitting and subsequent hydrogenation. Based on the similar
trends in the DRIFTS transients shown in Figure 25, it is expected that these
mechanistic conclusions are valid for both Ru catalysts, although the removal of the
adsorbed CHx,ad species is faster on the Ru/Al2O3 catalyst than on the Ru/zeolite
catalyst.
3.2.5 Summary
The selective methanation of CO in different CO2 containing reformates on a 2.2 wt.%
Ru/zeolite catalyst and, for comparison, on a 5 wt.% Ru/Al2O3 catalyst by temperature
screening measurements, kinetic measurements under differential reaction conditions
and by transient in situ DRIFTS and mass spectrometric measurements was
investigated. The latter experiments focused on the build-up of adsorbed surface
species during the reaction and their decomposition upon replacing the CO/H2 mixture
in the reaction gas by a N2/H2 mixture. These measurements led to the following
results:
Temperature dependent conversion measurements showed that both catalysts are
active for the selective methanation reaction. Under present reaction conditions, full
3.2.5 Summary
84
conversion of CO was achieved at 200°C and 230°C for the Ru/zeolite and the
Ru/Al2O3 catalyst, respectively, in ID-ref 6000. The addition of water and methane did
not influence the CO methanation activity on the Ru/zeolite catalyst and caused only
minor changes in the CO conversion on the Ru/Al2O3 catalyst. The addition of CO2
(CO2-rich idealized reformate) led to an acceleration of the reaction on the Ru/zeolite
catalyst, where complete CO conversion (T100) was reached now at 190°C. On that
catalyst, CO2 methanation started after complete CO conversion, and the selectivity
for CO conversion remained above 85% over a temperature range of 40°C. On the
Ru/Al2O3 catalyst, CO2 conversion started at 200°C, where CO still was still left in the
reformate. With increasing temperature, both CO and CO2 are converted and at full
CO conversion the selectivity for CO methanation has decreased to 48% under
present reaction conditions. In the absence of CO, in CO2/H2 mixtures, the CO2
conversion exhibits similar conversion characteristics as the CO conversion on the
Ru/Al2O3 catalyst. On the Ru/zeolite catalyst, in contrast, the onset of CO2 conversion
is shifted to lower temperature (170°C), and the subsequent increase in conversion is
rather slow, reaching full conversion only at 410°C. The latter behavior points to a
kinetic hindrance in CO2 methanation, in the absence and presence of CO.
Kinetic measurements performed under differential conditions exhibited an ~10 - ~20
times higher Ru mass normalized reaction rate over the Ru/zeolite catalyst compared
to the Ru/Al2O3 catalyst, depending on the reaction gas. For the inherent activity,
expressed by the turnover frequency, the differences are also distinct with factors
between 3.9 and 7.3, which correspond to TOFs between 3.9 and 8 s-1 on the
Ru/zeolite catalyst, depending on the reaction atmosphere. Temperature dependent
measurements, performed in idealized reformate after 1000 min on stream in the
range 190-160°C, revealed comparable apparent activation energies for both
catalysts under these conditions, pointing to a similar rate limiting step on both cata-
lysts. On the Ru/Al2O3 catalyst, reaction orders of -0.5 and 1.0 were obtained for CO
and H2, respectively. Higher reaction orders of -0.7 and 2.7 for CO and H2,
respectively, were observed on the Ru/zeolite catalyst. One may speculate that the
high value for the reaction order of H2 is linked to the high activity of this catalyst.
In situ IR (DRIFTS) measurements showed that exposing the catalysts to different
reaction mixtures under reaction conditions leads to the immediate adsorption of
linearly and bridge bonded COad species on Ru0 sites on both catalysts. On the
Ru/zeolite catalyst, an additional signal appeared at higher frequency (2075 cm-1),
3.2.5 Summary
85
which is attributed to COad on Run+ sites. This species was not observed on the
Ru/Al2O3 catalyst in H2O-free reaction atmospheres, whereas in the presence of water
a small shoulder of this signal developed, due to the more oxidizing reaction
conditions. In addition, on both catalysts the build-up of surface formates and CHx,ad
species were observed, while surface carbonates were formed on the Ru/zeolite
catalyst only. Thus, the presence of a Run+-CO species and the observation of an
additional OHad signal are the most striking differences in the IR spectra between the
two catalysts.
The temporal evolution of the DRIFTS signals related to the different adsorbed CO
surface species differs significantly between the two catalysts. On the Ru/zeolite
catalyst, the intensity of the COad related signals passes through a maximum after 100
min reaction, whereas for the Ru/Al2O3 a steady-state situation is reached at the same
time. The signals related to surface formates and carbonates do not saturate during
1000 min on stream, those related to CHx,ad species reach a dynamic equilibrium after
about 1000 min on the Ru/zeolite catalyst and after 340 min on the Ru/Al2O3 catalyst,
respectively.
From the close correlation between Ru0−CO signal intensity and the methanation
activity on both catalysts, which is observed in the time dependent behavior and also
when comparing different gas mixtures, it is proposed that the activity in the
methanation reaction is determined by the number of accessible Ru0 sites on the two
catalysts. Ru0−CO species may act as active sites and active species, but other
species adsorbed on Ru0 sites may be possible as well. On the other hand, the
absence of such correlations between surface formates and surface carbonates and
methanation activity indicates that the reaction is not dominated by the reac-
tion/decomposition of either of these surface species.
Changing from CO-containing to CO-free reaction atmosphere after 1000 min on
stream in idealized reformate, surface formates and CHx,ad species disappear with
time on both catalysts. The initial rate of decomposition, however, differs significantly
from the steady-state reaction rate. Therefore, the reaction between the CHx.ad
species visible by IR and hydrogen can not represent the rate limiting step in the
*dominant reaction pathway. The same experiment performed with a mass
spectrometer shows that CH4 is not produced anymore after three minutes upon
switching to an Ar/H2 mixture, providing further support for the above conclusion. The
3.2.5 Summary
86
signals representing (-CH2-) chain groups were growing even after replacement of
CO, and are therefore identified as side products.
The kinetic and DRIFTS measurements showed that both Ru catalysts are active and
selective for the CO methanation even at low temperatures (190°C). Using zeolite as
support material, the Ru catalyst shows significantly higher activity and selectivity,
probably due to specific interactions between the more acidic support and the Ru
nanoparticles and via the stabilization of very small metallic and partly oxidic Ru
particles, which result in pronounced modifications of the intrinsic Ru surface activity
described by turnover frequencies. The higher surface area of the zeolite support may
further contribute to the better performance of this catalyst.
3 Results and Discussion
87
3.3 Reaction intermediates and side products in the
methanation of CO and CO2 over supported Ru
catalysts in H2-rich reformate gases
The previous sections gave insight in the general reaction characteristics and proved
that the spectroscopically observed CHx species are unlikely to take part in the
dominant reaction pathway. This section will elucidate the reaction intermediates of
the CO and the CO2 methanation on the supported Ru catalysts. Aiming at a
mechanistic understanding of the CO and CO2 methanation reaction over supported
Ru catalysts and the underlying physical reasons for the mechanism, the methanation
of CO and CO2 over a Ru/zeolite and a Ru/Al2O3 catalyst was investigated by in situ
diffuse reflectance infrared Fourier transform spectroscopy (DRIFTS) measurements,
in idealized and CO2-rich reformate gases, employing quantitative steady-state
isotope transient kinetic analysis (SSITKA) techniques, where one educt, e.g., 12CO is
replaced by its isotopomer 13CO.
The results of the following sections were published in the Journal of Physical
Chemistry C, 115 (2010) 1361: Reaction Intermediates and Side Products in the
Methanation of CO and CO2 over Supported Ru Catalysts in H2-Rich Reformate
Gases.
3.3.1 CO methanation
In a first set of experiments, reaction intermediates and side products of the CO
methanation on the Ru/zeolite and Ru/Al2O3 catalyst, respectively, were investigated
and characterized in idealized reformate (CO/H2/N2) by sequences of in situ DRIFTS
measurements (Figure 27). The relative intensities of the respective surface species
(HCO, CH4 and CO) are plotted as function of time in Figure 28. The characteristic
bands arising on the Ru/zeolite and the Ru/Al2O3 catalyst from the interaction with the
reaction atmosphere are evident from the spectra presented in Figure 27 a and Figure
27 b, which were recorded during 1000 min on stream. Panels Figure 27 c and Figure
27 d, show the resulting spectra of the first 40 minutes during the SSITKA
measurement, where after 1000 min of reaction one educt (12CO) was replaced by its
isotope labeled analog (13CO). This procedure allowed me to distinguish between
reaction intermediates and side products, since in the first case the signal of the
respective
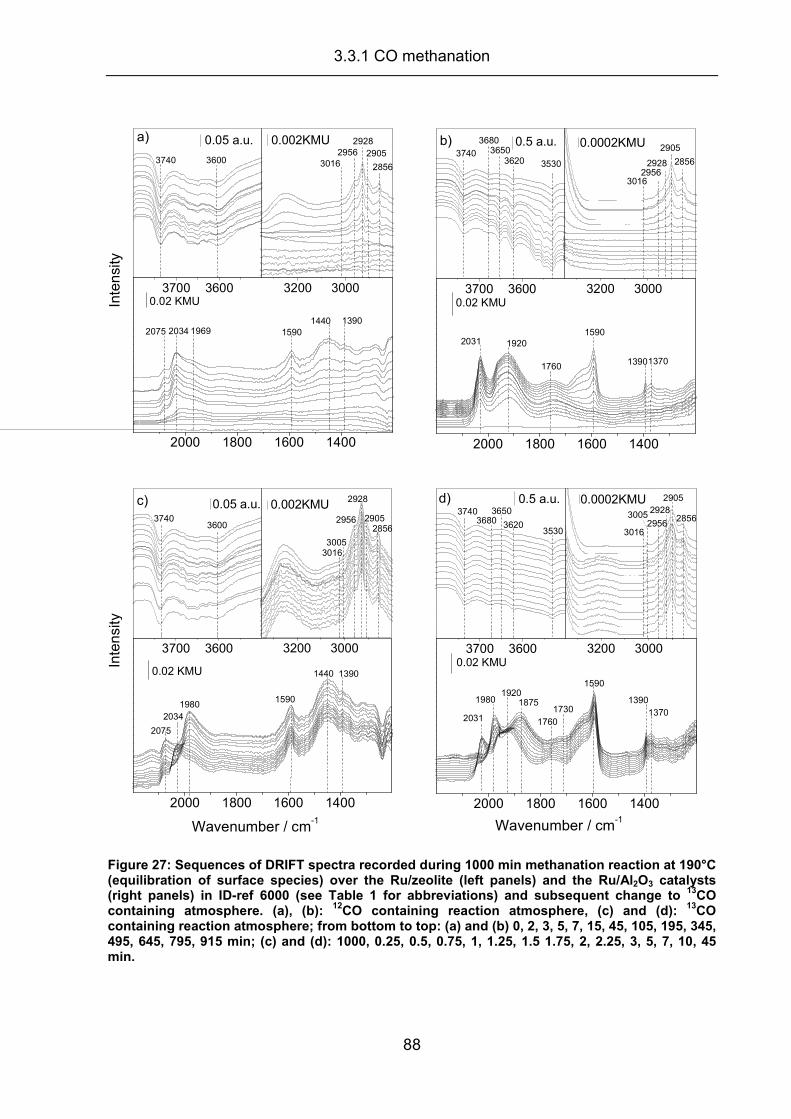
3.3.1 CO methanation
88
2000 1800 1600 1400
1390
14401590196920342075
Inte
nsi
ty
0.02 KMU3200 3000
2856
29052928
29563016
0.002KMU
3700 3600
36003740
0.05 a.u.a)
2000 1800 1600 1400
13701390
1590
1760
19202031
0.02 KMU3200 3000
2856
2905
29282956
3016
0.0002KMU
3700 3600
353036203650
3680
3740
0.5 a.u.b)
2000 1800 1600 1400
1390
Wavenumber / cm-1
1440
15901980
2034
2075
Inte
nsi
ty
0.02 KMU
3200 3000
28562905
2928
2956
30053016
0.002KMU
3700 3600
36003740
0.05 a.u.c)
2000 1800 1600 1400
Wavenumber / cm-1
1370
1390
1590
1730
1760
18751920
1980
2031
0.02 KMU3200 3000
2856
29052928
29563005
3016
0.0002KMU
3700 3600
35303620
36503680
3740
0.5 a.u.d)
Figure 27: Sequences of DRIFT spectra recorded during 1000 min methanation reaction at 190°C (equilibration of surface species) over the Ru/zeolite (left panels) and the Ru/Al2O3 catalysts (right panels) in ID-ref 6000 (see Table 1 for abbreviations) and subsequent change to
13CO
containing atmosphere. (a), (b): 12
CO containing reaction atmosphere, (c) and (d): 13
CO containing reaction atmosphere; from bottom to top: (a) and (b) 0, 2, 3, 5, 7, 15, 45, 105, 195, 345, 495, 645, 795, 915 min; (c) and (d): 1000, 0.25, 0.5, 0.75, 1, 1.25, 1.5 1.75, 2, 2.25, 3, 5, 7, 10, 45 min.
3.3.1 CO methanation
89
surface species should decrease fast, and in the latter case, the respective signals will
prevail while a new signal belonging to the 13C containing species will start to grow in.
The assignments of the main bands (see lines) will be briefly summarized below, a
detailed discussion was given in section 3.2.3.
During reaction in idealized reformate (Figure 27 a and Figure 27 b) on both catalysts
characteristic signals are observed in the COad region at ~2034 cm-1 and 1969 on the
Ru/zeolite and at 2031 and 1920 cm-1 on the Ru/Al2O3 catalyst, respectively, which
are generally attributed to CO adsorbed linearly or in a bridged configuration on Ru
[31;65;79;132-134;136-138;151]. A signal at 2075 cm-1, only appearing on the
Ru/zeolite, is usually attributed to CO adsorbed on oxidized Run+ or coadsorbed with
Oad on Ru [65;132;152]. Again, no evidence is found for a band at 2075 cm-1 on the
Ru/Al2O3 catalyst. A dynamic equilibrium of- the adsorbed COad surface species is
reached after 100 min on both catalysts.
In the OH region, two peaks at 3740 and 3600 cm-1 appear on the Ru/zeolite catalyst,
which is related to silanol and structural or isolated OHad groups on the support
[141;142] and which do not change during reaction. On the Ru/Al2O3 catalyst, the
peak at 3740 cm-1 is accompanied by four additional OHad signals at 3680, 3650,
3620 and 3530 cm-1, which were attributed to OH groups on different Al2O3 crystal
facets [141]. With ongoing reaction, the intensity of the peaks at 3735 and 3670 cm-1,
attributed to terminal and isolated OH groups, remains constant, whereas that of the
other two signals decreases.
The CHx spectral region shows the typical CHx,ad signals at 3016, 2956, 2928, and
2856 cm-1, arising from CH4, CH3,ad, and the symmetric and asymmetric CH2,ad
vibrations on the two catalysts [27;65;79]. On both catalysts, these species (except for
CH4) start to grow in after about 15 min of reaction and reach a steady-state situation
after 340 minutes on the Ru/Al2O3 catalyst and after 1000 minutes on the Ru/zeolite
catalyst. For the CH4 signal, steady-state is reached much faster on both catalysts,
after about 10 min. A shoulder at ~2905 cm-1 observed on both catalysts was
assigned to the C-H vibration of a surface formate [26;30].
In the OCO region, bands at 1590, 1440 and 1390 cm-1, which appear after about 100
min on stream on the Ru/zeolite catalyst, were assigned to surface formates (1590
and 1390 cm-1) and carbonates (1440 cm-1) [26;30;136]. On the Ru/Al2O3 catalyst, the
corresponding bands start to grow in after 45 min of reaction at 1590, 1390, 1370 cm-1

3.3.1 CO methanation
90
(additional formate vibration). The carbonate band is missing on this catalyst. An
additional band at 1760 cm-1 is ascribed to adsorbed HCO species [36;153]. While
this band is clearly visible on the Ru/Al2O3 catalyst, it is not seen on the Ru/zeolite
catalyst. In addition Wu and Goodman [154] could observe such a signal on a Ru
single crystal after admission of H2 to a COad covered surface. Admission of only CO
did only result in linearly COad at 2030cm-1. They ascribed this signal to a weakened
COad species, due to coadsorption / perturbation of hydrogen and proposed it as
intermediate during CO hydrogenation. Visconti et al [155] observed a similar feature
during Fischer-Tropsch reactions on Co/Al2O3 catalysts describing as CHOad species.
On both catalysts, the bands in the OCO region (except for the HCO band) grow
steadily and do not saturate over 1000 min.
Sequences of DRIFT spectra, recorded after changing from 12CO to 13CO after 1000
min on stream on the Ru/zeolite and the Ru/Al2O3 catalysts, are shown in Figure 27 c
and Figure 27 d. For more clarity, only spectra recorded during the first 40 min after
the exchange step are shown, since the relevant changes of the adsorbed surface
species occur on a short time scale (~10min).
On the Ru/zeolite catalyst, the 12COad signals at 2075 and 2034 cm-1, belonging to
linearly adsorbed COad on Run+ and on Ru0, respectively, vanish within the first three
minutes after the substitution by 13CO, and the respective 13COad signals start to grow
in at 1980 cm-1 (linearly adsorbed 13COad). The same happens on the Ru/Al2O3
catalyst with the respective 12COad signals at 2031 and 1920 cm-1 (linearly adsorbed
COad and bridge bonded COad), which are replaced by signals at 1980 and 1875 cm-1
(linearly adsorbed and bridge bonded 13COad). The signal related to linear 13COad on
Run+ on the Ru/zeolite catalyst, which is expected at ~2040 cm-1, is probably obscured
by the prominent 13CO gas phase signals at 2172 and 2072 cm-1. The 12CO signal at
1980 cm-1 (12COad in a bridged configuration on Ru) on the Ru/zeolite catalyst does
not seem to change, and a new signal at about 40 cm-1 lower wave number cannot be
observed to grow in. The expected changes in the 1980 cm-1 band are obscured by
the evolution of the prominent band at 1980 cm-1, and the same is expected also for
the weak shoulder expected at ~1940 cm-1.
Hardly any changes are observed in the CHx region, except for the anticipated
replacement of the 12CH4 signal at 3016 cm-1 by a 13CH4 band at ~3005 cm-1 [156]
within the first three minutes, comparable to the changes in the CO region. Since the
3.3.1 CO methanation
91
other CHx surface species do not change, at least not on this time scale, they do not
seem to be involved in the main reaction pathway to CH4 (see section 3.2.4) [26;27]. It
may, however, well be that significant amounts of inactive CHx species (e.g. CHx
chains etc.) obscure the signals of active surface CHx species. In the latter case it
would hardly be possible to detect the active CHx surface species and separate it from
inactive species.
The OCO region shows almost no changes for the Ru/zeolite and the Ru/Al2O3
catalyst over the reaction time covered in these spectra (40 min). The formate and
carbonate bands do not change in frequency, and also their intensity remains about
constant. At longer reaction times (after 100 min, not shown), new formate bands
related to the corresponding 13C species appear in addition to those at 1590 cm-1
(Ru/zeolite), 1390 and 1370 cm-1 (Ru/Al2O3), indicating that these formate species are
side products in the reaction rather than reaction intermediates, as already stated
above (see section 3.2).
Only for the signal at 1760 cm-1 on the Ru/Al2O3 catalyst, attributed to an HCOad
species, [36] the situation is different. Here, a new signal develops at a lower wave
number at ~1730 cm-1, while the signal at 1760 cm-1 decreases in intensity. The
decrease of the HCOad signal at 1760 cm-1 agrees quantitatively with the increase of
the new signal at 1730 cm-1. Furthermore, the decrease/increase of these signals with
time agrees qualitatively with that of the linearly adsorbed 13COad / 12COad species at
1981 and 2031 cm-1 and the 13CH4,ad / 12CH4,ad products at 3005 and 3017 cm-1. This
is illustrated in Figure 28 a, which shows the relative intensities of the different surface
species (12COad, 13CH4,ad, (inverted) 12HCOad and 13HCOad) as a function of time.
Since the rates of depletion of the 12CH4,ad and 12COad signals agree quantitatively
with the rate of increase of the 13CH4,ad and 13COad signals, respectively, only the
evolution of the 12COad, 13CH4,ad, (inverted) 12HCOad and 13HCOad signals are shown
for clarity. To illustrate the quantitative agreement between the intensity loss of the 12C isotopomer and the intensity growth of the 13C isotopomer, the evolution of the
H13COad surface species and the inverted intensity of that species (1-I(H12CO)) is
included, together with the intensity decay of the H12CO species, with time in Figure
28 a. These plots demonstrate that the intensity change upon 12CO/13CO exchange is
fastest for the COad related signals, while that of the HCOad related signals are
somewhat slower, though on a similar time scale.
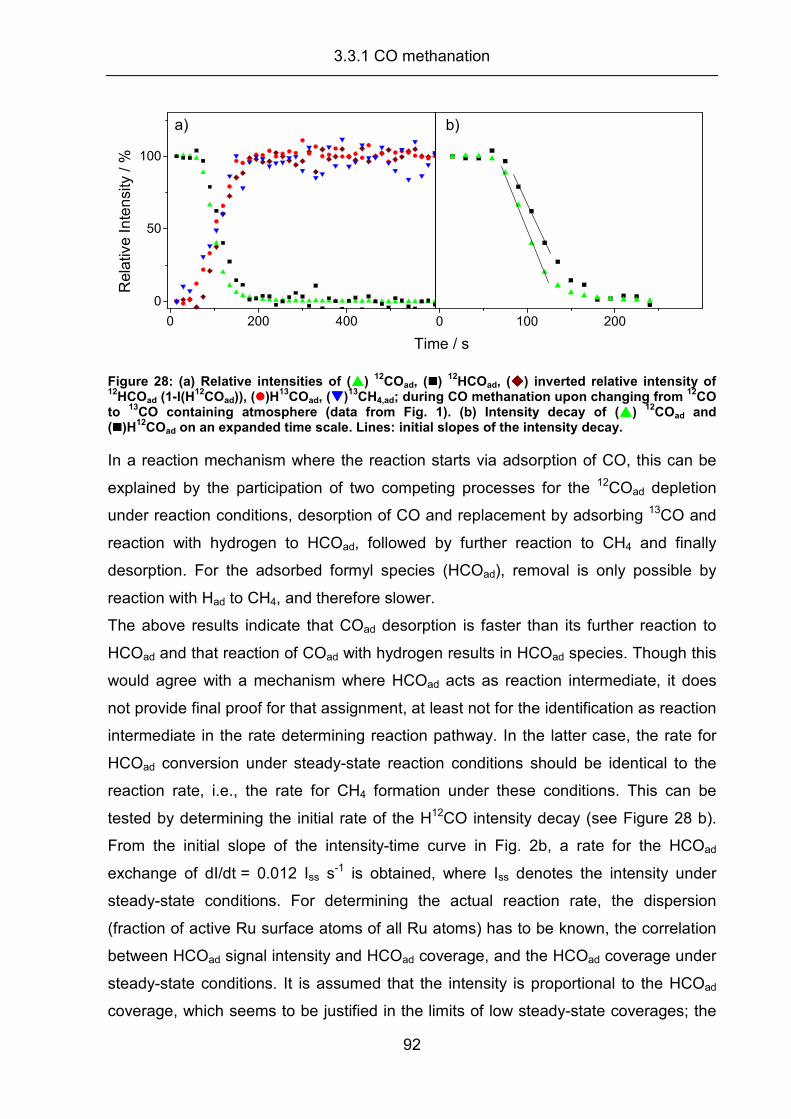
3.3.1 CO methanation
92
0 100 200
b)
0 200 400
0
50
100
a)R
ela
tive I
nte
nsi
ty / %
Time / s
Figure 28: (a) Relative intensities of (����) 12
COad, (����) 12
HCOad, (����) inverted relative intensity of 12
HCOad (1-I(H12
COad)), (����)H13
COad, (����)13
CH4,ad; during CO methanation upon changing from 12
CO to
13CO containing atmosphere (data from Fig. 1). (b) Intensity decay of (����)
12COad and
(����)H12
COad on an expanded time scale. Lines: initial slopes of the intensity decay.
In a reaction mechanism where the reaction starts via adsorption of CO, this can be
explained by the participation of two competing processes for the 12COad depletion
under reaction conditions, desorption of CO and replacement by adsorbing 13CO and
reaction with hydrogen to HCOad, followed by further reaction to CH4 and finally
desorption. For the adsorbed formyl species (HCOad), removal is only possible by
reaction with Had to CH4, and therefore slower.
The above results indicate that COad desorption is faster than its further reaction to
HCOad and that reaction of COad with hydrogen results in HCOad species. Though this
would agree with a mechanism where HCOad acts as reaction intermediate, it does
not provide final proof for that assignment, at least not for the identification as reaction
intermediate in the rate determining reaction pathway. In the latter case, the rate for
HCOad conversion under steady-state reaction conditions should be identical to the
reaction rate, i.e., the rate for CH4 formation under these conditions. This can be
tested by determining the initial rate of the H12CO intensity decay (see Figure 28 b).
From the initial slope of the intensity-time curve in Fig. 2b, a rate for the HCOad
exchange of dI/dt = 0.012 Iss s-1 is obtained, where Iss denotes the intensity under
steady-state conditions. For determining the actual reaction rate, the dispersion
(fraction of active Ru surface atoms of all Ru atoms) has to be known, the correlation
between HCOad signal intensity and HCOad coverage, and the HCOad coverage under
steady-state conditions. It is assumed that the intensity is proportional to the HCOad
coverage, which seems to be justified in the limits of low steady-state coverages; the
3.3.1 CO methanation
93
catalytically active dispersion of the Ru/Al2O3 catalyst was determined to 15% (section
3.1). For the steady-state HCOad coverage, a value of 0.065 monolayers (ML) is
estimated. This value, which would be obtained for similar cross-sections of the C-O
stretch vibration in HCOad and COad, can certainly only serve as rough estimate. On
the other hand, since the purpose of this evaluation is to check whether the HCOad
exchange rate and the reaction (CH4 formation) rate are of similar order of magnitude,
and since the coverage goes linearly into the rate, deviations by small factors are
tolerable. With these data, a HCOad conversion rate of 1.2×10⁻⁶ mol�gRu�s-1 is
calculated, which is rather close to the reaction rate of 3.6×10⁻⁶ mol�gRu�s-1 determined
for CH4 formation (see section 3.2.2).
For comparison, the rate for the initial intensity decay of the 12COad related signal is
also evaluated (Figure 28 a, b). It yields a rate of dI/dt = 0.015 Iss�s-1. Assuming that
under steady-state conditions (pCO = 10 mbar, 190°C) the COad coverage is close to
saturation including also the HCOad coverage (this can be derived from the adsorption
isotherm, using adsorption characteristics typical for CO/Ru) and that the intensity is
proportional to the COad coverage, this corresponds to a COad exchange rate of
1.5×10⁻⁵ mol�gRu�s-1. The difference in rate compared to HCOad exchange results
mainly from the much higher steady-state coverage of COad compared to HCOad. As
discussed above, the much higher rate for COad exchange compared to HCOad
exchange and CH4 formation is mainly due to the additional fast equilibrium for CO
adsorption / desorption.
These results unambiguously prove that adsorbed formyl species indeed act as
reaction intermediate in the rate determining majority reaction pathway for CO
methanation over a Ru/Al2O3 catalyst under present reaction conditions. Its direct
spectroscopic identification was possible because of its significant coverage under
present steady-state reaction conditions. This indicates that the rate constants for
HCOad formation and its further reaction are of similar order of magnitude. If the latter
were much higher, the steady-state HCOad coverage would be correspondingly lower
and vanish below the detection limit of these measurements.
These observations are backed by other studies, where the role of the formyl species
was discussed and emphasized as well. Mitchell et al. found that on Ru(001) and at
100 K a HCOad species was formed during reaction of COad with atomic hydrogen
[153]. Their study, however, did not allow any conclusions on whether this species
3.3.2 Carbon dioxide methanation
94
indeed acts as reaction intermediate in the CO methanation reaction under typical
reaction conditions. Investigating the CO methanation on different Ni surfaces
experimentally and theoretically over a wide (partial) pressure range, Andersson et al.
showed that depending on the Ni sites, different surface species are favorable (HCOad
or COHad) [36]. In all cases, however, H-assisted CO dissociation was always more
facile than direct CO dissociation. Comparable results were obtained by Inderwildi et
al., who using DFT techniques calculated that on Ru surfaces the methanation
reaction proceeds via a H-assisted CO dissociation; reaction via the formyl
mechanism was found to be more favorable than a possible CHx mechanism, where
CO is dissociated right in the first step [64].
Interestingly, such a formyl species is not observed on the Ru/zeolite catalyst. While
on a first view this may point to a different reaction mechanism, the apparent absence
of this species is related to the much higher activity of this catalyst, which is,
depending on the reaction conditions, about 10 to 20 times higher than that of the
Ru/Al2O3 catalyst (see section 3.2.2). If the increase of the rate constant for formyl off-
reaction (decomposition) on the Ru/zeolite catalyst, relative to the Ru/Al2O3 catalyst,
is more pronounced than that for formyl formation, the steady-state coverage of
HCOad will be correspondingly lower on the Ru/zeolite catalyst. In that case, the signal
of the formyl species may well be below the detection limit of the DRIFTS
measurement.
The stability of the 12C-formate related bands and the additional slow appearance of 13C-formate related bands on both catalysts clearly demonstrates, that these surface
formate species represent stable side products in the methanation reaction under
present reaction conditions rather than reaction intermediates, in agreement with
earlier reports [26;27;30].
3.3.2 Carbon dioxide methanation
In a second, similar set of experiments, possible intermediates and side products of
the CO2 methanation reaction on the Ru/zeolite and a Ru/Al2O3 catalyst in CO2-rich
reformate (CO2/H2/N2) were investigated. Figure 29 shows a sequence of DRIFT
spectra recorded during the CO2 methanation reaction and the subsequent SSITKA
experiment on the Ru/zeolite (a and c) and on the Ru/Al2O3 (b and d) catalyst. During
1000 min of reaction, similar bands appear on both catalysts as during CO
methanation (see above).
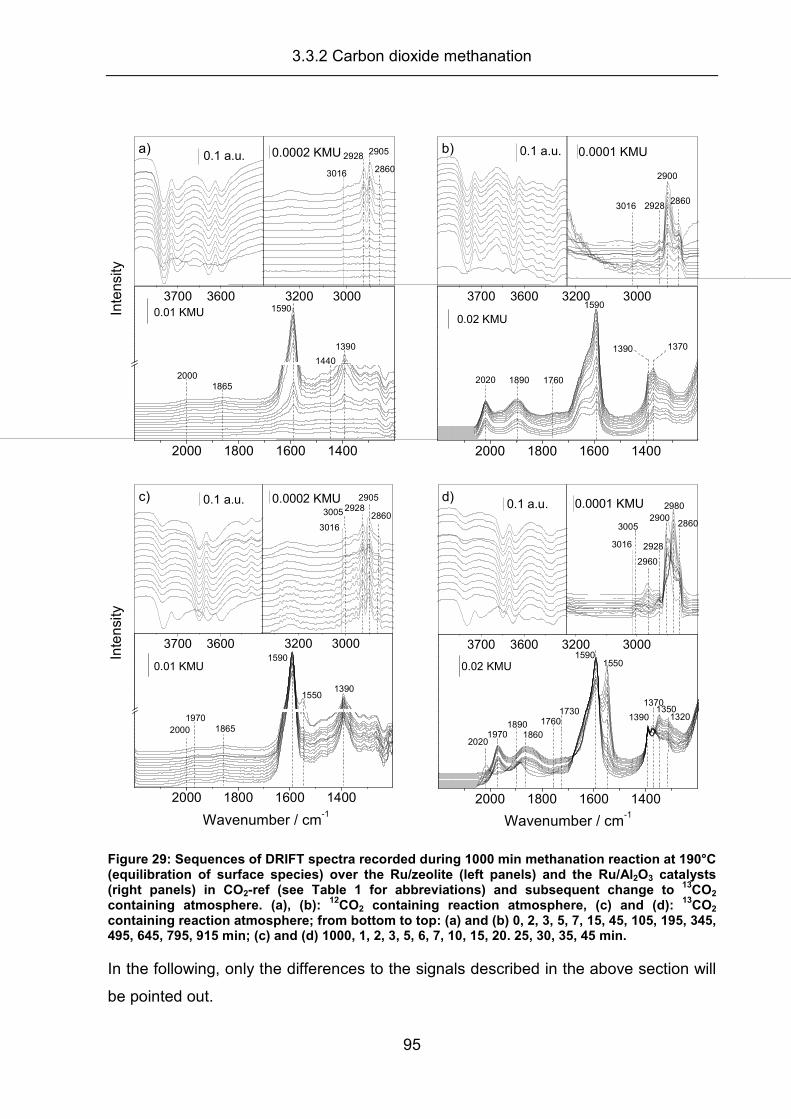
3.3.2 Carbon dioxide methanation
95
2000 1800 1600 1400
1440
1390
1590
18652000
Inte
nsi
ty
0.01 KMU
3200 3000
2860
29052928
3016
0.0002 KMU
3700 3600
0.1 a.u.a)
2000 1800 1600 1400
1760
13701390
1590
18902020
0.02 KMU
3200 3000
2860
2900
29283016
0.0001 KMU
3700 3600
0.1 a.u.b)
2000 1800 1600 1400
Wavenumber / cm-1
Inte
nsi
ty
13901550
1590
18651970
2000
0.01 KMU
3200 3000
2860
290529283005
3016
0.0002 KMU
3700 3600
0.1 a.u.c)
2000 1800 1600 1400
17301760
Wavenumber / cm-1
13501320
1370
1390
15501590
186019701890
2020
0.02 KMU
3200 3000
2928
2860
29802900
2960
3005
3016
0.0001 KMU
3700 3600
0.1 a.u.d)
Figure 29: Sequences of DRIFT spectra recorded during 1000 min methanation reaction at 190°C (equilibration of surface species) over the Ru/zeolite (left panels) and the Ru/Al2O3 catalysts (right panels) in CO2-ref (see Table 1 for abbreviations) and subsequent change to
13CO2
containing atmosphere. (a), (b): 12
CO2 containing reaction atmosphere, (c) and (d): 13
CO2 containing reaction atmosphere; from bottom to top: (a) and (b) 0, 2, 3, 5, 7, 15, 45, 105, 195, 345, 495, 645, 795, 915 min; (c) and (d) 1000, 1, 2, 3, 5, 6, 7, 10, 15, 20. 25, 30, 35, 45 min.
In the following, only the differences to the signals described in the above section will
be pointed out.
3.3.2 Carbon dioxide methanation
96
In the OH region, CO2-related overtone signals (not marked) appear at 3600, 3640,
3700 and 3740 cm-1, in addition to the OH-related signals in this region, which
obscure the OH signals.
The CO region only exhibits two weak signals at ~2000 and 1865 cm-1 on the
Ru/zeolite catalyst, commonly attributed to linearly adsorbed COad on Ru and COad in
a bridged configuration. They appear after 45 min (Figure 29 a) and reach a steady-
state situation after about 100 min. The steady-state intensity is about 1/16 of that
obtained during CO methanation (Figure 27) (see also section 3.4.1). On the Ru/Al2O3
catalyst, in contrast, prominent COad signals at 2020 cm-1 (linearly COad) and 1890
cm-1 (bridge bonded COad) appear during the first minutes of reaction and increase,
until reaching steady-state conditions after 100 min at an intensity which is
comparable to that obtained during CO methanation (Figure 27 b). The much lower
intensity of the COad related bands on the Ru/zeolite catalyst compared to the
Ru/Al2O3 catalyst agrees perfectly with the much higher CO2 methanation activity of
the latter catalyst under similar reaction conditions reported above (section 3.2). The
slight deviation of the COad peak positions during CO2 methanation compared to those
observed in the CO methanation experiments discussed above is attributed to the
different COad coverages in both cases [139].
Main difference in the OCO region compared to the CO methanation experiments
described above (Figure 27 a and Figure 27 b) are the much more pronounced
formate bands at 1590, 1390 and 1370 on both catalysts in the presence of CO2,
indicating its strong effect on the growth / coverage of surface formates. Similar
observations were reported and discussed above (section 3.2.3). Also for reaction of
CO2, HCOad surface species are formed on the Ru/Al2O3 catalyst, as indicated by the
small peak at 1760 cm-1. Comparable differences are observed in the CH region,
which reveals the typical signals at 3016, 2960, 2928, ~2900, 2860 cm-1 as discussed
above on both catalysts, but a much more pronounced band at ~2900 cm-1 attributed
to a C-H vibration of the formate.
Changing from 12CO2 to 13CO2 (Figure 29 c and Figure 29 d) after 1000 min on stream
causes the following main changes in the spectra:
- The COad signals at ~2000 cm-1 on the Ru/zeolite catalyst and at 2020 and 1890
cm-1 on the Ru/Al2O3 catalyst are replaced by bands at 1970 and 1860 cm-1,
respectively, within the first 3 minutes.
3.3.2 Carbon dioxide methanation
97
- At the same time, also the 12CH4 signal decreases and disappears and the 13CH4
related signal grows in and saturates.
- On the Ru/Al2O3 catalyst, the band at 1760 cm-1 related to HCOad species
decreases and is replaced by a signal at 1730 cm-1, observable as a small shoulder
within 3 minutes.
- The formate bands at 1590, 1390 and 1370 cm-1 decrease only very little during
that time, while new bands of a 13C containing formate at 1550, 1350 and 1320 cm-
1 grow in and increase rapidly in intensity. Furthermore, a new signal at 2880 cm-1
develops, which is attributed to the C-H vibration of the 13C surface formate signal.
The 12C signal is still present as a shoulder of the 13C signal.
A quantitative evaluation shows that also in this case the loss of 12C related intensities
of COad is identical to the gain in 13C-related CO intensity. Furthermore, the
quantitative agreement between the 12COad / 13COad and the 12CH4,ad / 13CH4,ad
exchange characteristics confirms the earlier proposals that COad acts as reaction
intermediate in the main reaction pathway for CO2 methanation on Ru catalysts
[71;73]. For the Ru/Al2O3 catalyst, comparison of the peak intensity of COad derived
from CO2 with that obtained in idealized reformate shows that CO2 dissociation leads
to a COad coverage close to saturation. This explains the high CO2 methanation ac-
tivity of the Ru/Al2O3 catalyst discussed below (see section 3.4). Moreover, the
decomposition rate of 12HCOad on the Ru/Al2O3 catalyst (9�10-7 mol�gRu�s-1) is of
similar magnitude as that calculated above for CO methanation, which is clear proof
that the reaction pathway via formation of COad and subsequent formation/off-reaction
of HCOad to CH4 is the dominant reaction pathway for CO2 methanation.
In addition, these observations perfectly agree with the mechanism responsible for the
high CO selectivity of the Ru/zeolite catalyst during the methanation of reformate
gases containing large amounts of CO2 in addition to CO, which will be discussed
later (section 3.4). In that section it is postulated that the high selectivity of the
Ru/zeolite catalyst is mainly driven by its inherent low activity for CO2 dissociation. In
contrast, on the Ru/Al2O3 catalyst, where CO2 is readily dissociated to COad on free
active sites, the CO selectivity is determined by the abundance of free active sites. In
that case, high selectivities are only reached for sufficiently high CO partial pressures
(low coverage of free active sites) under steady-state conditions. Otherwise, CO2 is
readily dissociated to COad on free active sites, leading to a high CO2 methanation
3.3.3 Conclusion
98
rate at low CO partial pressures. As already discussed in the introduction, the
mechanism for COad formation during CO2 methanation over Group VIII metal
supported catalysts is still under debate [71;73-78]. Mostly it is assumed that COad is
produced via the Reverse Water Gas Shift Reaction (RWGS), either involving the
formation and subsequent decomposition of surface formate species [73;76-78;157].
However these studies do not provide a quantitative evaluation of the suggested
formate intermediate and neither is it correlated to the COad species, which should be
connected to the intermediate. Second, a redox mechanism is proposed [80]. As a
third alternative, dissociative adsorption of CO2 was discussed [74]. Under present
reaction conditions and for the Ru catalyst investigated, a redox mechanism can be
excluded because of the non-reducible support material. Also the formate mechanism
is highly unlikely, though it should be favored by the high H2 partial pressure. It would
require a similarly rapid decrease of the formate related bands, at least of those
attributed to one surface formate species, upon changing from 12CO2 to 13CO2. This is
in contrast to the experimental observations, which show a very slow decrease of the
H12COO related bands only, in contrast to the rapid exchange of the COad related
bands. Instead, bands related to 13C-containing formate species grow in additionally,
indicating that the (total) surface formate coverage has not reached steady-state
conditions after 1000 min on stream. Hence, under present experimental conditions,
COad formation via formate formation/decomposition can not represent the dominant
reaction pathway, although contributions from this reaction pathway as minority
pathway can not be ruled out. In consequence, no evidence is provided for COad
formation via the RWGS reaction in the CO2 methanation reaction, at least not in the
main reaction pathway, and therefore propose that under present reaction conditions
(high H2 excess, atmospheric pressure) CO2 methanation on Ru catalysts proceeds
via dissociative adsorption of CO2 to form COad and Oad, which subsequently reacts to
CH4 and H2O. As the results and observations described above hold true for both
catalysts, CO2 adsorbs dissociatively on the Ru/Al2O3 and on the Ru/zeolite catalyst.
3.3.3 Conclusion
Based on time resolved DRIFTS measurements during the methanation of CO and
CO2 over two supported Ru catalyst, a Ru/zeolite catalyst and a Ru/Al2O3 catalyst,
and employing SSITKA type exchange techniques, adsorbed formyl species with a
characteristic band at 1760 cm-1 were unambiguously identified as reaction
3.3.3 Conclusion
99
intermediate for CO methanation in a CO/H2/N2 mixture on the Ru/Al2O3 catalyst
under reaction conditions typical for reformate purification. The identification as
reaction intermediate rather than a spectator type reaction side product is based on its
formation/reaction rate under steady-state conditions, which is of similar order of
magnitude as the overall ration rate (CH4 formation rate). For the Ru/zeolite catalyst,
the same reaction mechanism is proposed. The absence of a similar band on the
Ru/zeolite catalyst is attributed to a much lower steady-state coverage of that species,
which is rationalized by the much higher reaction rate on that catalyst. Similar
experiments performed for the CO2 methanation reaction revealed that under present
reaction conditions the reaction proceeds via formation and further reaction of COad.
This, however, can not be formed via a formate based reverse water gas shift reac-
tion, at least not as main reaction pathway, since the decomposition of surface
formate species is too slow compared to the COad exchange rate. Since a redox
RWGS mechanism involving reaction with the catalyst is equally unlikely for the
present catalysts, it is suggested that under present reaction conditions COad is
formed via dissociative adsorption of CO2 to form COad and Oad, which subsequently
reacts to CH4 and H2O.
3 Results and Discussion
100
3.4 What drives the selectivity for CO methanation in the
methanation of CO2-rich refomate gases on supported
Ru catalysts?
The previous sections gave insight into the general behavior and characteristics of the
two Ru supported catalysts, and elucidated the reaction intermediate of the
methanation reaction. The following section will show the differences in the selectivity
mechanisms, which apply for the CO selectivity of the Ru catalysts. The effect of the
CO content on the adsorption and reaction behavior on a Ru/zeolite and a Ru/Al2O3
catalyst will be investigated in a combined kinetic and in situ IR spectroscopic study
on, focusing on correlations between COad coverage and selectivity. The
measurements were performed in a number of different idealized (H2/CO) and semi-
realistic (H2/CO/CO2) reaction atmospheres, decreasing the CO content to as low as
100 ppm. The temporal evolution of the adsorbed surface species during the
methanation reaction in different reaction atmospheres, characterized by time-
resolved in situ IR measurements, is described in section 3.4.1. In combination, these
measurements allow me to not only to determine the steady-state COad coverages in
different reaction atmospheres, but also to qualitatively assess the contribution from
CO2 decomposition to the COad signal in the experiments performed under semi-
realistic conditions. The influence of the CO content on the CO methanation activity
and on the selectivity for CO methanation is topic of the following section 3.4.2. The
resulting correlations between COad coverage and the selectivity for CO methanation
as well as consequences on the molecular scale mechanism responsible for the
selectivity are discussed. Finally, it will be briefly commented on consequences of
these findings for technical applications of the reaction.
All results of the following sections were published in Applied Catalysis A: 391 (2011)
325: What drives the selectivity for CO methanation in the methanation of CO2-rich
refomate gases on supported Ru catalysts.
3.4.1 In situ DRIFTS measurements
The interaction of the different reaction atmospheres with the two catalysts and the
resulting adlayer build-up were characterized by sequences of in situ DRIFTS
measurements. These were preformed in different reaction atmospheres, including
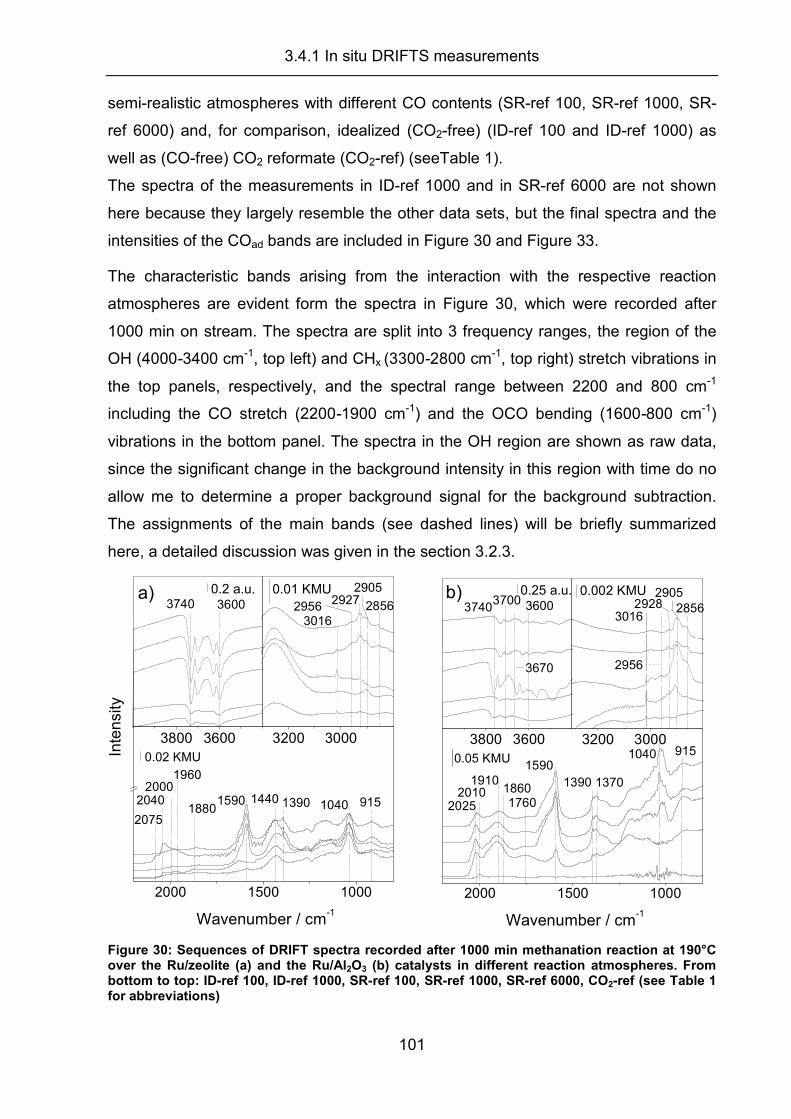
3.4.1 In situ DRIFTS measurements
101
semi-realistic atmospheres with different CO contents (SR-ref 100, SR-ref 1000, SR-
ref 6000) and, for comparison, idealized (CO2-free) (ID-ref 100 and ID-ref 1000) as
well as (CO-free) CO2 reformate (CO2-ref) (seeTable 1).
The spectra of the measurements in ID-ref 1000 and in SR-ref 6000 are not shown
here because they largely resemble the other data sets, but the final spectra and the
intensities of the COad bands are included in Figure 30 and Figure 33.
The characteristic bands arising from the interaction with the respective reaction
atmospheres are evident form the spectra in Figure 30, which were recorded after
1000 min on stream. The spectra are split into 3 frequency ranges, the region of the
OH (4000-3400 cm-1, top left) and CHx (3300-2800 cm-1, top right) stretch vibrations in
the top panels, respectively, and the spectral range between 2200 and 800 cm-1
including the CO stretch (2200-1900 cm-1) and the OCO bending (1600-800 cm-1)
vibrations in the bottom panel. The spectra in the OH region are shown as raw data,
since the significant change in the background intensity in this region with time do no
allow me to determine a proper background signal for the background subtraction.
The assignments of the main bands (see dashed lines) will be briefly summarized
here, a detailed discussion was given in the section 3.2.3.
2000 1500 1000
1960
9151390
29272956a)
20751040144015902040
360037403016
1880
2000
Wavenumber / cm-1
Inte
nsi
ty
0.02 KMU
3200 3000
2856
2905
0.01 KMU
3800 3600
0.2 a.u.
2000 1500 1000
1760
2956
915
1370
290528562928
b) 3700
3670
2025
1040
13901590
2010
360037403016
18601910
Wavenumber / cm-1
0.05 KMU
3200 3000
0.002 KMU
3800 3600
0.25 a.u.
Figure 30: Sequences of DRIFT spectra recorded after 1000 min methanation reaction at 190°C over the Ru/zeolite (a) and the Ru/Al2O3 (b) catalysts in different reaction atmospheres. From bottom to top: ID-ref 100, ID-ref 1000, SR-ref 100, SR-ref 1000, SR-ref 6000, CO2-ref (see Table 1 for abbreviations)
3.4.1 In situ DRIFTS measurements
102
On both catalysts, characteristic signals in the COad region at ~2000 / 2040 cm-1 and
1960 / ~1880 cm-1 on the Ru/zeolite, depending on the CO content in the gas mixture,
and at ~2010 / 2025 cm-1 and ~1860 / 1910 cm-1 on the Ru/Al2O3 catalyst are found,
which are generally attributed to CO adsorbed linearly or in a bridged configuration on
Ru [31;65;79;132-134;136-138;151]. A signal at 2075 cm-1 on the Ru/zeolite is usually
assigned to CO adsorbed on Run+ [65;152]. The exact frequencies vary slightly with
reaction conditions.
The OH region exhibits two peaks at 3740 and 3600 cm-1 on the Ru/zeolite catalyst,
which are related to structural silanol and/or isolated OHad groups on the support
[141;142]. After 1000 min of reaction on the Ru/Al2O3 catalyst, two additional OHad
signals appear at 3700, 3670 cm-1, which were attributed to OHad groups on different
Al2O3 crystal facets [141]. Isolated OH groups are observed on this catalyst at 3740
cm-1 again. In CO2 containing reformates, CO2-related overtone signals (not marked)
appear at 3600, 3640, 3700 and 3740 cm-1, in addition to the OH-related signals in
this region.
The CHx spectral region shows the typical CHx,ad signals at 3016, 2956, 2928, and
2856 cm-1, arising from CH4, CH3,ad, and the symmetric and asymmetric CH2,ad
vibrations on the two catalysts [27;65;79]. A shoulder at ~2905 cm-1 was assigned to
the CH vibration of a surface formate [26;30]. Depending on the catalyst and the
reaction conditions, only some of the bands are resolved. At higher conversions, all of
these bands are visible.
In the OCO region, bands at 1590, 1440, 1390, 1040 and 915 cm-1 on the Ru/Zeolite
catalyst were assigned to surface formates (1590 and 1390 cm-1), carbonates (1440
cm-1), possibly methoxy (1040 cm-1) species and CH2 vibrations (915 cm-1) resulting
from chain growth. On the Ru/Al2O3 catalyst, the corresponding bands appear at
1590, 1390, 1370 (additional formate vibration), 1040 and 915 cm-1, except for the
carbonate band, which is not formed on this catalyst (see section 3.2).
Sequences of DRIFT spectra, recorded during 1000 min reaction on the Ru/zeolite
and the Ru/Al2O3 catalyst in different reaction atmospheres, are shown in Figure 31
and Figure 32 (Figure 31: (a) Ru/zeolite and (b) Ru/Al2O3: ID-ref 100, (c) Ru/zeolite
and (d) Ru/Al2O3: SR-ref 100; Figure 32: (a) Ru/zeolite and (b) Ru/Al2O3: CO2–ref.
3.4.1 In situ DRIFTS measurements
103
Reaction in ID-ref 100 (100 ppm CO): First the build-up and evolution of the different
surface species on both catalysts in ID-ref 100 were followed (Figure 31). On both
catalysts, COad bands appear at 2000 cm-1 / 1880 cm-1 on the Ru/zeolite and at 2010
cm-1 and 1860 cm-1 on the Ru/Al2O3 catalyst after ~2 and ~1 min, respectively. A
dynamic equilibrium is reached after 100 min. The COad signals appear at a
significantly lower wavenumber than reported in section 3.2.3 with a higher CO
concentration (6000 ppm CO), which is explained by the lower COad coverage under
present conditions [139]. Interestingly, no evidence is found for bands at 2075 cm-1 or
2135 cm-1, which were attributed to CO adsorbed on oxidized Run+ or coadsorbed
with Oad on Ru [132;134;135;138], on either of the two catalysts, in contrast to
previous findings discussed above for the Ru/zeolite catalyst. This apparent
discrepancy can be explained by the much lower CO partial pressure in the present
measurements as compared to the previous ones. Also for 0.6% CO in idealized
reformate it took about 100 min, until a small shoulder of the COad signal at 2075 cm-1
was detected (see section 3.2.3).
The two bands at 3740 and 3600 cm-1 on the Ru/zeolite catalyst related to structural
silanol and isolated OHad groups on the support [141;142] are visible already at the
beginning of the reaction and do not change significantly in intensity during the
reaction. On the Ru/Al2O3 catalyst, additional OHad signals, besides the feature at
3740 cm-1, can be observed at 3680, 3640, 3620, 3530 and 3460 cm-1 at the
beginning and during the reaction, which were previously assigned to OH groups on
different Al2O3 facets [141]. With ongoing reaction, the intensity of the peak at 3740
and 3680 cm-1, attributed to terminal and isolated OH groups, remains constant,
whereas that of the other four signals decreases. This can either result from a
reconstruction of the Al2O3 crystallites, induced by the loss of the OH species, or it
simply reflects the loss of OH species due to reaction with hydrogen and subsequent
desorption of water.
In the OCO region, bands at 1590, 1440, 1040 and 915 cm-1, which were attributed to
surface formates, carbonates, methoxy and CH2 vibrations, appear after about 100
min reaction on the Ru/Zeolite catalyst. On the Ru/Al2O3 catalyst, the respective
bands start growing in after about 45 min, except for the surface carbonate band,
which is not observed at all on this catalyst.
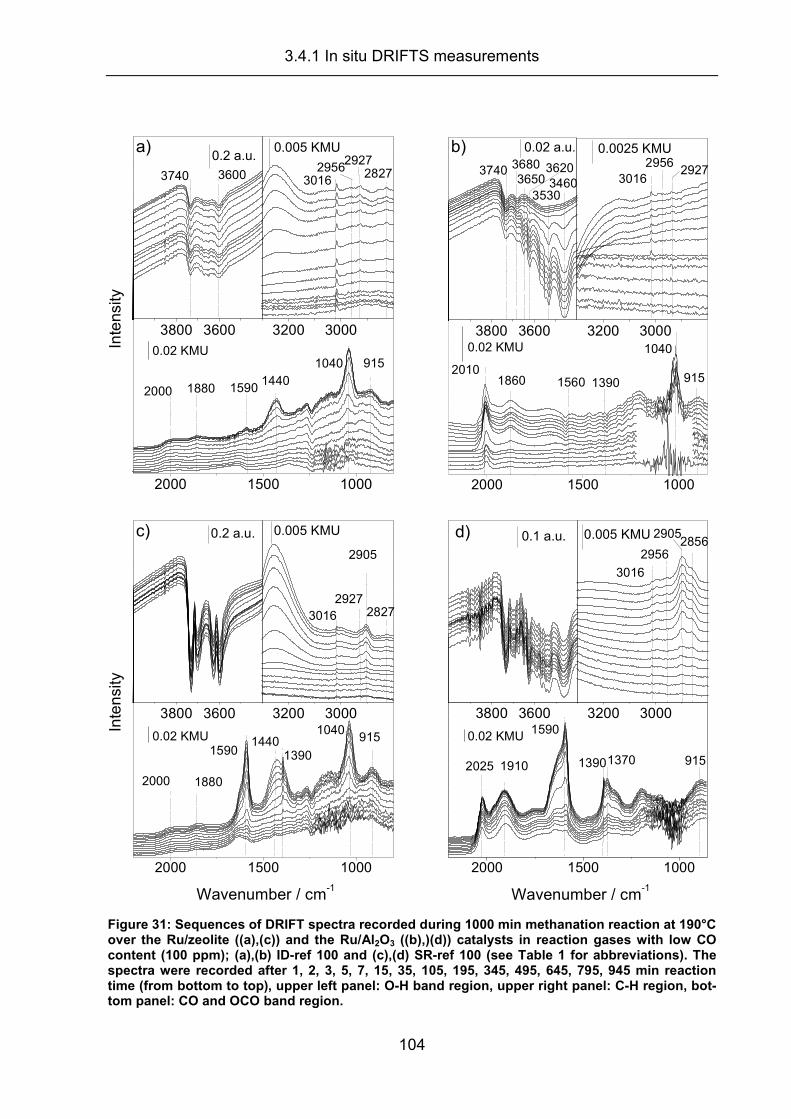
3.4.1 In situ DRIFTS measurements
104
2000 1500 1000
915
1590
1040
144018802000
Inte
nsi
ty
0.02 KMU
3200 3000
282729562927
3016
0.005 KMU
3800 3600
36003740
a)
0.2 a.u.
2000 1500 1000
9151390
29562927
3016
1040
1560
18602010
0.02 KMU3200 3000
0.0025 KMU
3800 3600
34603530
3650362036803740
b)
0.02 a.u.
2000 1500 1000
915
1390
10401440
1590
18802000
Wavenumber / cm-1
Inte
nsi
ty
0.02 KMU
3200 3000
2827
2905
29273016
0.005 KMU
3800 3600
c)
0.2 a.u.
2000 1500 1000
91513701390
1590
3016
19102025
Wavenumber / cm-1
0.02 KMU
3200 3000
28562956
2905
0.005 KMU
3800 3600
d)
0.1 a.u.
Figure 31: Sequences of DRIFT spectra recorded during 1000 min methanation reaction at 190°C over the Ru/zeolite ((a),(c)) and the Ru/Al2O3 ((b),)(d)) catalysts in reaction gases with low CO content (100 ppm); (a),(b) ID-ref 100 and (c),(d) SR-ref 100 (see Table 1 for abbreviations). The spectra were recorded after 1, 2, 3, 5, 7, 15, 35, 105, 195, 345, 495, 645, 795, 945 min reaction time (from bottom to top), upper left panel: O-H band region, upper right panel: C-H region, bot-tom panel: CO and OCO band region.

3.4.1 In situ DRIFTS measurements
105
Depending on the gas mixture the formate band is shifted to 1560 cm-1. Additionally, a
signal at 1390 cm-1 is observed, which is attributed to an additional formate vibration.
The bands steadily increase in intensity and do not reach a steady-state situation after
1000 min, similar to previous observations in idealized and (H2O-rich) semi-realistic
atmospheres (section 3.2.3). An additional band at 1760 cm-1 is related to adsorbed
HCO species, which was proposed to play a major role as reaction intermediate for
CO methanation (see section 3.3). In the CHx spectral region (Figure 31 a and b), the
typical CHx,ad signals at 3016, 2956, 2927, and 2827 cm-1 (Ru/zeolite) and 3016, 2956
and 2927 cm-1 (Ru/Al2O3) (assignment see above) start to grow in after about fifteen
minutes reaction time. They increase further until saturating after 340 and 1000 min
reaction on the Ru/Al2O3 and Ru/zeolite catalyst, respectively. Hence, in contrast to
the surface formates/carbonates, these species do reach a steady-state coverage.
Comparing the reaction in ID-ref 100 on Ru/zeolite and Ru/Al2O3 catalysts (Figure
31 a and b)), no major differences are observed in the type of adsorbed surface spe-
cies. The situation is different, however, when comparing the temporal evolution and
peak intensities of the adsorbed CO. Here the intensity of the COad species is much
lower on the Ru/zeolite compared to the Ru/Al2O3 catalyst, and furthermore the
intensities are much lower than those observed previously (section 3.2.3) at higher
CO partial pressure. This will be discussed in more detail below.
Reaction in SR-ref 100 (100 ppm CO) and in CO2-ref: Similar DRIFTS measurements
were performed in these CO2 containing atmospheres (see Table 1) to identify the
influence of CO2 on the COad formation, which has been shown to be an intermediate
in the CO2 methanation (see section 3.3). The general characteristics of the resulting
spectra (Figure 31 c and d and Figure 32 a and b) are rather similar to those obtained
in ID-ref 100 (Figure 31 a and b). The addition of CO2 results further in an increase of
the formate and carbonate related signals and in overtone vibration in the OH region.
Most obvious are differences in the COad band intensities in the different atmospheres
and in their temporal evolution. Therefore, the band intensities of linearly adsorbed
COad species on Ru, are plotted for different reaction atmospheres in Figure 33 a
(Ru/zeolite catalyst) and Figure 33 b (Ru/Al2O3 catalyst), respectively, as a function of
the time on stream.
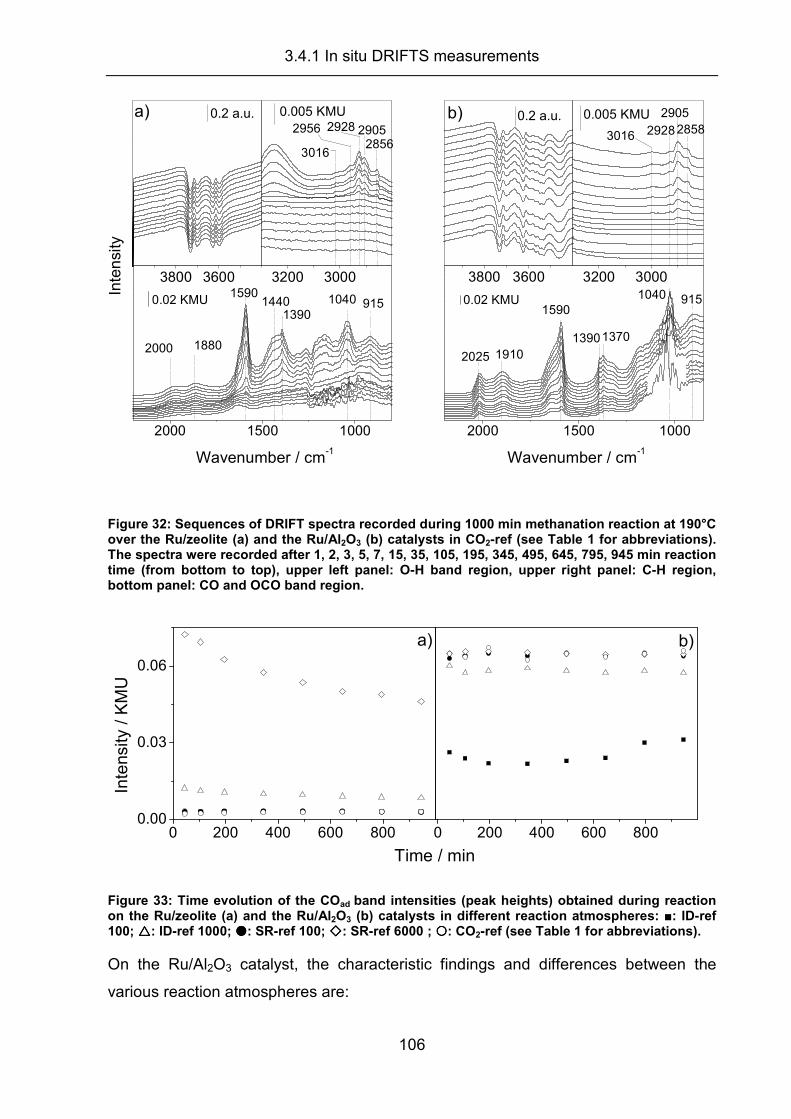
3.4.1 In situ DRIFTS measurements
106
2000 1500 1000
9151390
29052928
28562956
3016
104014401590
18802000
Wavenumber / cm-1
Inte
nsi
ty
0.02 KMU
3200 3000
0.005 KMU
3800 3600
a)
0.2 a.u.
2000 1500 1000
915
1370
1040
1390
1590
292828582905
3016
19102025
Wavenumber / cm-1
0.02 KMU
3200 3000
0.005 KMU
3800 3600
b)
0.2 a.u.
Figure 32: Sequences of DRIFT spectra recorded during 1000 min methanation reaction at 190°C over the Ru/zeolite (a) and the Ru/Al2O3 (b) catalysts in CO2-ref (see Table 1 for abbreviations). The spectra were recorded after 1, 2, 3, 5, 7, 15, 35, 105, 195, 345, 495, 645, 795, 945 min reaction time (from bottom to top), upper left panel: O-H band region, upper right panel: C-H region, bottom panel: CO and OCO band region.
0 200 400 600 8000.00
0.03
0.06
0 200 400 600 800
a)
Inte
nsi
ty /
KM
U
Time / min
b)
Figure 33: Time evolution of the COad band intensities (peak heights) obtained during reaction on the Ru/zeolite (a) and the Ru/Al2O3 (b) catalysts in different reaction atmospheres: ■: ID-ref 100; ����: ID-ref 1000; ����: SR-ref 100; ����: SR-ref 6000 ; : CO2-ref (see Table 1 for abbreviations).
On the Ru/Al2O3 catalyst, the characteristic findings and differences between the
various reaction atmospheres are:
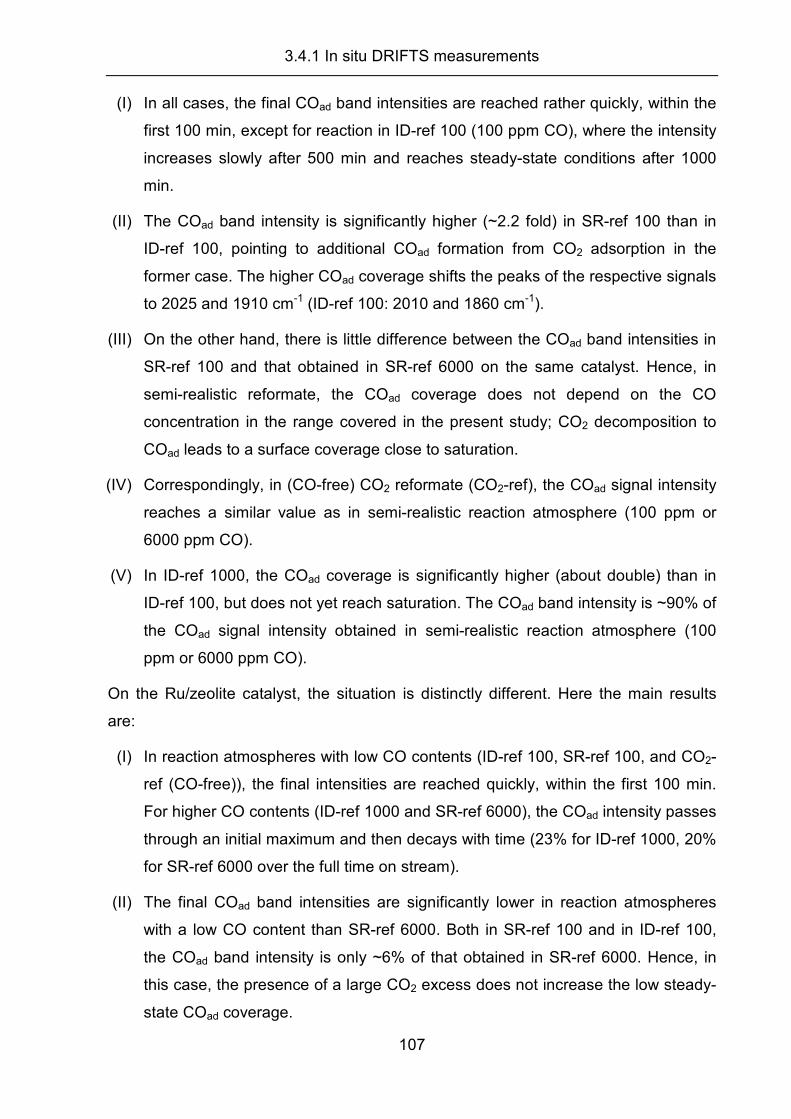
3.4.1 In situ DRIFTS measurements
107
(I) In all cases, the final COad band intensities are reached rather quickly, within the
first 100 min, except for reaction in ID-ref 100 (100 ppm CO), where the intensity
increases slowly after 500 min and reaches steady-state conditions after 1000
min.
(II) The COad band intensity is significantly higher (~2.2 fold) in SR-ref 100 than in
ID-ref 100, pointing to additional COad formation from CO2 adsorption in the
former case. The higher COad coverage shifts the peaks of the respective signals
to 2025 and 1910 cm-1 (ID-ref 100: 2010 and 1860 cm-1).
(III) On the other hand, there is little difference between the COad band intensities in
SR-ref 100 and that obtained in SR-ref 6000 on the same catalyst. Hence, in
semi-realistic reformate, the COad coverage does not depend on the CO
concentration in the range covered in the present study; CO2 decomposition to
COad leads to a surface coverage close to saturation.
(IV) Correspondingly, in (CO-free) CO2 reformate (CO2-ref), the COad signal intensity
reaches a similar value as in semi-realistic reaction atmosphere (100 ppm or
6000 ppm CO).
(V) In ID-ref 1000, the COad coverage is significantly higher (about double) than in
ID-ref 100, but does not yet reach saturation. The COad band intensity is ~90% of
the COad signal intensity obtained in semi-realistic reaction atmosphere (100
ppm or 6000 ppm CO).
On the Ru/zeolite catalyst, the situation is distinctly different. Here the main results
are:
(I) In reaction atmospheres with low CO contents (ID-ref 100, SR-ref 100, and CO2-
ref (CO-free)), the final intensities are reached quickly, within the first 100 min.
For higher CO contents (ID-ref 1000 and SR-ref 6000), the COad intensity passes
through an initial maximum and then decays with time (23% for ID-ref 1000, 20%
for SR-ref 6000 over the full time on stream).
(II) The final COad band intensities are significantly lower in reaction atmospheres
with a low CO content than SR-ref 6000. Both in SR-ref 100 and in ID-ref 100,
the COad band intensity is only ~6% of that obtained in SR-ref 6000. Hence, in
this case, the presence of a large CO2 excess does not increase the low steady-
state COad coverage.
3.4.1 In situ DRIFTS measurements
108
(III) Correspondingly, the COad coverage and band intensity obtained in (CO-free)
CO2-ref are also low and similar to those obtained in ID-ref 100 and SR-ref 100
on the same catalyst.
(IV) Even at 1000 ppm CO concentration, the CO coverage is far from saturation.
The COad band intensity obtained in ID-ref 1000 reaches 1/6 of the value of the
COad band intensity obtained in SR-ref 6000, where the latter is again assumed
to reflect COad saturation.
The most important observations are that i) the presence of CO2 in the reformate
gases (CO2-ref, SR-ref 100) increases the COad band intensity and hence the COad
coverage significantly on the Ru/Al2O3 catalyst compared to the ID-ref 100 (see Figure
33 b), while on the Ru/zeolite catalyst the presence of CO2 has essentially no effect
on the COad coverage, and that ii) in reaction atmospheres with low CO content (ID-
ref 100) the COad coverage is much lower on the Ru/zeolite catalyst than on the
Ru/Al2O3 catalyst.
Considering that on the Ru/Al2O3 catalyst the COad level in SR-ref 100 is about
equally high as in SR-ref 6000, which in turn is likely to represent the COad saturation
coverage, the first point implies that on this catalyst CO2 decomposition is facile on
sites which are active also for CO adsorption. In SR-ref 100, the two pathways for
COad formation, CO adsorption and CO2 decomposition, are sufficiently fast to reach
the COad coverage close to saturation under present reaction conditions (190°C
reaction temperature). Facile decomposition of CO2 to COad on this catalyst is sup-
ported by the fact that also in (CO-free) CO2-ref a COad value close to saturation
coverage is reached. In contrast, on the Ru/zeolite catalyst, the COad band intensities
in SR-ref 100 and in (CO-free) CO2-ref are essentially identical to that obtained in ID-
ref 100. Hence, on this catalyst CO2 decomposition to COad occurs only at very low
rates even at very low CO partial pressures, in CO-free CO2-ref and in SR-ref 100.
This indicates that on the very small Ru NPs in this catalyst the COad formation from
CO2 is inherently slow and not just hindered by a blocking CO adlayer. A more
detailed discussion will be given in the next section.
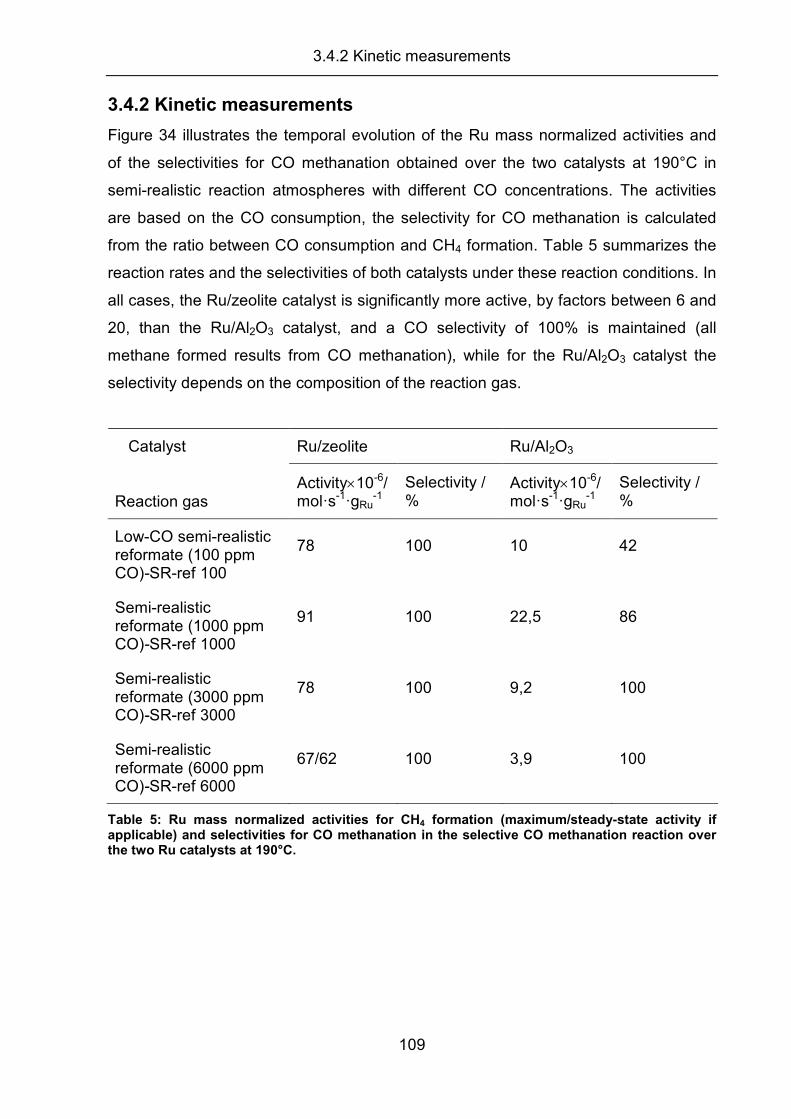
3.4.2 Kinetic measurements
109
3.4.2 Kinetic measurements
Figure 34 illustrates the temporal evolution of the Ru mass normalized activities and
of the selectivities for CO methanation obtained over the two catalysts at 190°C in
semi-realistic reaction atmospheres with different CO concentrations. The activities
are based on the CO consumption, the selectivity for CO methanation is calculated
from the ratio between CO consumption and CH4 formation. Table 5 summarizes the
reaction rates and the selectivities of both catalysts under these reaction conditions. In
all cases, the Ru/zeolite catalyst is significantly more active, by factors between 6 and
20, than the Ru/Al2O3 catalyst, and a CO selectivity of 100% is maintained (all
methane formed results from CO methanation), while for the Ru/Al2O3 catalyst the
selectivity depends on the composition of the reaction gas.
Ru/zeolite Ru/Al2O3 Catalyst Reaction gas
Activity×10-6/ mol�s-1�gRu
-1 Selectivity / %
Activity×10-6/ mol�s-1�gRu
-1 Selectivity / %
Low-CO semi-realistic reformate (100 ppm CO)-SR-ref 100
78 100 10 42
Semi-realistic reformate (1000 ppm CO)-SR-ref 1000
91 100 22,5 86
Semi-realistic reformate (3000 ppm CO)-SR-ref 3000
78 100 9,2 100
Semi-realistic reformate (6000 ppm CO)-SR-ref 6000
67/62 100 3,9 100
Table 5: Ru mass normalized activities for CH4 formation (maximum/steady-state activity if applicable) and selectivities for CO methanation in the selective CO methanation reaction over the two Ru catalysts at 190°C.

3.4.2 Kinetic measurements
110
60
80
100
20
40
60
80
20
40
60
80
100
120
0 200 400 600 8000
20
40
60
80
5
1040
60
80
60
80
100
60
80
100
200 400 600 800
60
80
100
f)
e)
b)
a)
Sele
ctiv
ity / %
Rea
ctio
n r
ate
/ m
ol�
s-1�g
-1
Ru
Time / min
h)
g)c)
d)
Figure 34: Reaction rates (left panels) and selectivities (right panels) obtained for reaction over the Ru/zeolite and the Ru/Al2O3 catalysts, both diluted with SiO2 to achieve differential conditions, in different semi-realistic reaction atmospheres (x % CO, 2.8 % N2, 15.5 % CO2, rest H2). CO reaction rate: (����) Ru/zeolite, (����) Ru/Al2O3; CH4 formation rate: (����) Ru/zeolite, (����) Ru/Al2O3; selectivity: (����) Ru/zeolite , () Ru/Al2O3; (a), (e): x = 6000 ppm, (b), (f): x = 3000 ppm, (c),(g): x = 1000 ppm, (d), (h): x = 100 ppm.
3.4.2 Kinetic measurements
111
Comparing the reaction rates and selectivity of the two catalysts at ‘normal’ reaction
conditions, i.e., in SR-ref 6000 at 190°C, the catalysts exhibit initial reaction rates of
63×10-6 mol�s-1�gRu-1 (Ru/zeolite) and 3.4×10⁻⁶ mol�s-1�gRu
-1 (Ru/Al2O3). The Ru/zeolite
catalyst shows a slight initial activation for about 50 min (maximum rate 67×10-6 mol�s-
1�gRu-1), followed by a slow decay by ~8% of its highest rate over the remaining time
on stream, reaching steady-state conditions at a rate of 65×10-6 mol�s-1�g-1Ru and a
selectivity of 100%. In contrast, on the Ru/Al2O3 catalyst, the reaction is essentially
stable over the entire time on stream of 1000 min, with a reaction rate of 3.9�10-6
mol�s-1�g-1Ru and a selectivity of 100%. These results agree very well with previous
findings (sections 3.2.1 and 3.2.2).
Using a lower CO concentration of 3000 ppm (ID-ref 3000), while leaving the other
components constant, the initial activation of the Ru/zeolite catalyst is more
pronounced; starting from an initial rate of 60×10-6 mol�s-1�g-1Ru, it reaches a maximum
rate of 78×10-6 mol�s-1�g-1Ru after ~50 min. Interestingly, the activity does not decrease
subsequently as described in the measurement above. The absence of an apparent
deactivation is explained by counteracting contributions from catalyst activation and
deactivation. (Note that the steady-state COad coverage decreases with time in both
SR-ref 6000 and in ID-ref 1000.) The higher activity under these conditions, as
compared to reaction in SR-ref 6000, is attributed to a lower COad coverage, which
leaves more sites for H2 adsorption. Assuming a Langmuir-Hinshelwood reaction
mechanism, this should increase the activity. For the Ru/Al2O3 catalyst, qualitatively
similar, but even more pronounced trends in the activity (increasing rate with lower
CO content) are observed, pointing to a similar reaction mechanism. The present
results and conclusions agree very well with the negative reaction order measured for
CO under comparable reaction conditions on both catalysts (Ru/Al2O3: αCO = -0.5,
Ru/zeolite: αCO = -0.7 (section 3.2.2)). Only for the lowest CO concentration (100 ppm
CO), the activity decreases again on both catalysts. At this point (at ~1000 ppm), the
reaction has apparently changed from Had limited to COad limited, which now results in
an opposite effect upon further lowering of the CO partial pressure.
The selectivity of the Ru/zeolite catalyst remains constant at 100%, independent of
the CO concentration in the reformate. On the Ru/Al2O3 catalyst, it is around 100% at
the higher CO concentrations (3000 ppm, 6000 ppm CO), but decreases to 85% for
reaction with 1000 ppm CO in the reformate and even to only 42% for reaction in low-
3.4.2 Kinetic measurements
112
CO semi-realistic reformate (SR-ref 100). Hence, the difference in selectivities
observed in integral measurements on the two catalyst, with complete removal of CO
at negligible CO2 conversion on the Ru/zeolite catalyst compared to only partial CO
removal (remaining CO content 3000 ppm CO) at the onset of CO2 conversion or
sizable CO2 conversion (selectivity 48%) at complete CO removal on the Ru/Al2O3
catalyst (see section 3.2.1), is reflected also by the different reaction characteristics
under differential reaction conditions at low CO contents.
The significantly higher activity of the Ru/zeolite catalyst compared to the Ru/Al2O3
catalyst in SR-ref 6000 was already discussed above. Differences in the morphology
and chemical properties of the support such as pore structure, support acidity (metal
support effects) and BET surface area were held responsible for the significantly
higher activity of the Ru/zeolite catalyst. These effects are likely to be active also at
lower CO contents. Obviously, these explanations are rather qualitative, a more
quantitative molecular scale explanation, which would be desirable, is still missing.
The selectivity for CO methanation in the selective methanation reaction is commonly
attributed to a blocking of the active catalyst surface by COad, due to the higher
adsorption energy of CO compared to CO2 [49;50]. The authors claimed that CO2
methanation sets in only if there is not sufficient CO in the gas phase to block all
active surface sites CO adsorption. In that case, the adsorption of CO2 and its
subsequent dissociation and methanation would become active. In a more detailed
picture, one has to consider that complete blocking of the surface by COad would not
only inhibit dissociative CO2 adsorption, but also H2 adsorption, which is pre-requisite
for the methanation of CO. Hence, under reaction conditions, the surface can not be
fully blocked by COad, but must leave open sites for dissociative H2 adsorption. In that
picture, the inhibition of dissociative CO2 adsorption and hence the selectivity for CO
methanation results from the higher adsorption energy of hydrogen (dissociative
adsorption) compared to CO2 (molecular adsorption) and the much higher barrier for
CO2,ad dissociation [37] than for dissociative H2 adsorption. (On most surfaces, the
latter barrier is negligible [158].) In that case, adsorption of CO2 or H2 on empty
surface sites will be determined by the respective partial pressures, but the lifetime on
the surface will be much shorter for CO2,ad than for Had. As long as the CO2 steady-
state coverage is sufficiently low, dissociation of CO2,ad (and the subsequent
methanation of the resulting COad) will effectively be inhibited, while dissociative
adsorption of H2 to Had and its subsequent reaction with COad will already be active.

3.4.2 Kinetic measurements
113
This reaction scheme agrees fully with the findings for the Ru/Al2O3 catalyst, where
CO2 methanation sets in as soon as the steady-state COad coverage (from CO
adsorption) decreases below a critical value. At that point, CO2 dissociation and
subsequent methanation set in, and the selectivity decreases. Most clearly, this is
demonstrated by methanation of (CO-free) CO2-ref, which results in a rapid build-up
of a CO adlayer, close to or at COad saturation under present reaction conditions. But
also in SR-ref 100 or SR-ref 1000, the critical COad coverage is not reached any more,
and CO2 methanation is observed. Hence, on these Ru NPs, CO2 dissociation on the
adsorbate free Ru NPs is facile.
The situation is very different for the Ru/zeolite catalyst. On this catalyst, the
selectivity for COad methanation remains high, at essentially 100%, even at very low
CO concentrations and at very low COad coverages under steady-state conditions (6%
of the saturation COad band intensity in SR-ref 100). This indicates already that
surface blocking can not be the main reason for the high selectivity. Together with the
observation of a very low activity for CO2 dissociation in (CO-free) CO2-ref (see
section 3.1), this provides clear proof that on this catalyst the high selectivity for CO
methanation does not originate from blocking of surface sites by adsorbed CO, but
rather from an inherent, low activity of this catalyst for dissociative adsorption of CO2.
This conclusion is supported also by the much lower steady-state COad coverage at
100 ppm CO content on the Ru/zeolite catalyst, with ~6% of the saturation COad band
intensity compared to ~45% on the Ru/Al2O3 catalyst (ID-ref 100), which points to a
distinct decrease of the CO adsorption energy and hence to a weakening of the COad-
substrate bond on the very small Ru NPs compared to the larger Ru NPs on the
Ru/Al2O3 catalyst. According to the Brønstedt-Evans-Polanyi (BEP) relation [159;160],
a COad-substrate bond weakening corresponds to an increase of the barrier for CO2
dissociation to COad on the very small Ru NPs, which in turn must result from distinct
differences in the electronic structures of the differently sized Ru NPs on the two
catalysts. Using the d-band model introduced by Hammer and Nørskov [161;162], this
corresponds to a down-shift of the center of the d-band when going from the 3 nm Ru
NPs to the very small Ru NPs in the Ru/zeolite catalyst. Additional effects on the
intrinsic activity of the small Ru NPs for CO2 methanation may be imposed by
interaction between the Ru NPs and the zeolite support, which in turn would lead to
electronic (and geometric) modifications of the Ru NPs [56].
3.4.3 Conclusions
114
3.4.3 Conclusions
The influence of the CO partial pressure on the reaction behavior and in particular on
the selectivity of a 2.2 wt.% Ru/zeolite and a 5 wt.% Ru/Al2O3 catalyst in the selective
methanation of CO in CO2 containing reformate gases was investigated by a
combination of kinetic measurements and in situ DRIFTS measurements, where the
latter focused on the correlation between the build-up of the adlayer and in particular
of the COad coverage and its influence on the selectivity in the idealized and semi-
realistic reformates with different CO contents. These measurements led to the
following results and conclusions:
(I) The Ru/zeolite catalyst shows under all reaction conditions a higher activity (up
to a factor of 20), and 100% selectivity for CO methanation, even at 100 ppm CO
content, whereas for the Ru/Al2O3 catalyst the selectivity decreases to 80% and
45% in reaction gas mixtures containing 1000 ppm and 100 ppm CO.
(II) On both catalysts, the reaction rate increases with decreasing CO content, down
to 1000 ppm CO in semi-realistic reformate (negative reaction order for CO),
while for reaction gas mixtures containing 100 ppm CO the reaction rate
decreases again, reflecting a change from a hydrogen limited to a COad limited
reaction process in a Langmuir-Hinshelwood reaction mechanism.
(III) The steady-state COad coverages obtained in low –CO reaction gases (ID-ref
100 and SR-ref 100) differ significantly for the two catalysts. The very different
behavior of the two catalysts points i) to a stronger COad-Ru interaction on the
Ru/Al2O3 catalyst and ii) to a lower barrier for CO2 dissociation on that catalyst
compared to the Ru/zeolite catalyst. This is mainly attributed to electronic effects
arising from the much smaller size of the Ru NPs on the latter catalyst, and
possibly effects introduced by interactions with the support.
(IV) For reaction on the Ru/Al2O3 catalyst, the selectivity decreases for the two lower
CO contents, and the same trend is obtained also for the COad band intensity.
Furthermore, COad formation in CO2-ref is facile, resulting in a high steady state
COad coverage at or close to saturation under these conditions. This supports a
mechanism where CO2 methanation is not inherently inhibited, but limited by
blocking of the active surface sites by COad. Hence, existence of a sufficiently
3.4.3 Conclusions
115
high COad coverage is precondition for a high selectivity for CO methanation
during reaction in CO2 containing semi-realistic reformate.
(V) For reaction on the Ru/zeolite catalyst, the main reason for a high selectivity for
CO methanation and hence for inhibiting the CO2 methanation is not a blocking
of surface sites by adsorbed CO, but rather the low inherent activity of the small
Ru NPs for CO2 dissociation. Using the Brønstedt-Evans-Polanyi relation, the
higher barrier for CO2 dissociation is related to the weaker adsorption of CO on
this catalyst, and both result from a change in electronic properties in the very
small Ru NPs compared to the larger Ru NPs in the Ru/Al2O3 catalyst, with
possibly additional contributions from metal-support interactions.
The difference in physical origin for the selectivity for CO methanation between the
two catalysts can perfectly explain the high selectivity of the Ru/zeolite in practical
applications, with negligible CO2 methanation down to complete removal of CO (<10
ppm), while for the Ru/Al2O3 catalyst, CO2 methanation will start to contribute as soon
as the CO partial pressure and hence the COad coverage will drop below a critical
value, i.e., in the final part of the reactor. In that case, complete removal of CO will not
be possible without contributions from CO2 methanation.
3 Results and Discussion
116
3.5 Influence of the catalyst loading on the activity
and the CO selectivity of supported Ru catalysts
in the selective methanation of CO in CO2 containing
feed gases
The previous section dealt with the question of the underlying reasons for the high CO
selectivity in case of the 2.2 wt.% Ru/zeolite catalyst. It was shown, that the very small
Ru particle size of the zeolite supported catalyst results in a high selectivity of the CO
methanation compared to the larger Ru particle size of the Al2O3 supported catalyst.
On the latter it was observed, that the CO2 methanation is not inherently inhibited but
limited by blocking of active surface sites by COad. When the COad coverage
decreases under a critical value the CO2 will be methanated. In contrast, on the
Ru/zeolite catalyst the situation is different. Even at very low COad coverages CO2 is
not methanated. According to the Brønstedt-Evans-Polanyi relation, a higher barrier
for CO2 dissociation is related to the weaker adsorption of COad when going from
large to small particles. However, an effect on the selectivity of the CO methanation
due to variations in the metal support effects of the differently supported catalysts
cannot be excluded. Therefore, results of the investigation of the selective
methanation of CO over differently loaded Ru/zeolite catalysts, which comprise
different Ru particle sizes on the identical zeolite support, in order to exclude
contributions of metal support interactions, are presented in the following sections.
The methanation of CO and CO2 over Ru/zeolite catalysts was investigated in
idealized and semi-realistic reformate gases by in situ diffuse reflectance infrared
Fourier transform spectroscopy (DRIFTS) and kinetic measurements.
The results of the following section were published in Catalysis Today 181 (2012) 40:
S.Eckle, M. Augustin, H. G. Anfang and R. J. Behm. Influence of the catalyst loading
on the activity and the CO selectivity of supported Ru catalysts in the selective
methanation of CO in CO2 containing feed gases
3.5.1 In situ DRIFTS measurements
117
3.5.1 In situ DRIFTS measurements
The interaction of the different reaction atmospheres with the differently loaded
Ru/zeolite catalysts and the resulting adlayer build-up were characterized by
sequences of in situ DRIFT spectra, which were recorded over 1000 min on stream.
The measurements were performed in different reaction atmospheres, including semi-
realistic reformates (SR-ref 6000 and SR-ref 100), idealized reaction atmosphere with
low CO content (ID-ref 100) and CO2 reformate (CO2-ref). The compositions are given
in Table 1.
The characteristic bands arising from the interaction with the respective reaction
atmospheres are labeled in the spectra in Figure 35, Figure 36, Figure 37. Since the
different characteristic bands and their assignment were discussed in detail in section
3.2.3, the assignment of the different signals will be summarized at this point just
shortly. On all four catalysts, the characteristic signals are found in the COad region at
~2000 - 2040 cm-1 and at 1980 cm-1, depending on the CO content in the gas mixture,
which are generally attributed to CO adsorbed in a linear or bridged configuration on
the Ru NPs, respectively [31;65;79;132-134;136-138;151]. A signal at 2075 cm-1 was
assigned previously to CO adsorbed on Run+ species [65;152]. The exact frequencies
vary slightly with reaction conditions.
The OH region exhibits two peaks at 3740 and 3600 cm-1, which we relate to silanol
species and isolated structural or adsorbed OH groups on the support [141;142]. In
CO2-containing reformates CO2-related overtone signals (not marked) appear at
3600, 3640, 3700 and 3740 cm-1, in addition to the OH-related signals in this region.
The CHx spectral region shows the typical CHx,ad signals at 3016, 2928, and 2860 cm-
1, arising from gas phase CH4, CH3,ad, and the symmetric and asymmetric CH2
vibrations on the respective catalysts [27;65;79]. A shoulder at ~2905 cm-1 was
assigned to the CH vibration of a surface formate [26;30]. Depending on the catalyst
and the reaction conditions, only some of the bands are resolved. At higher
conversions, all of these bands are visible.
In the OCO region, bands at 1590, 1440, 1390 and 915 cm-1 were assigned to surface
formates (1590 and 1390 cm-1), carbonates (1440 cm-1) and CH2 vibrations (915 cm-1)
resulting from chain growth.
3.5.2 SR-ref 6000 reformate
118
3.5.2 SR-ref 6000 reformate
In a first set of experiments, the temporal evolution of the different signals of the
respective surface species on the 1.0 wt.%, 2.2 wt.%, 3.6 wt.%, and 5.6 wt.%
Ru/zeolite catalysts in SR-ref 6000 (CO/CO2/H2/N2) was investigated and
characterized by sequences of in situ DRIFTS measurements (Figure 35 a - d) over
1000 min. During reaction in SR-ref 6000 (Figure 35 a - d), for all four catalysts
characteristic signals in the COad region are observed at ~2036 cm-1 (linear COad) and
1980 cm-1 (bridged COad) [31;65;79;133;134;136-138;151], and a signal at 2080 cm-1,
associated with CO adsorbed on oxidized Run+ or coadsorbed with Oad on Ru
[65;132;152]. After passing through a maximum after about 100 min, a constant level
of the adsorbed COad surface species is reached after ~500 min on all four catalysts.
It should be noted that the COad band intensity in SR-ref 6000 represents the
maximum COad intensity that can be reached on the respective catalysts. This was
tested in measurements using reaction gas mixtures with higher CO concentrations,
which yielded similar band intensities. Accordingly, the COad coverage must be at or
close to saturation. The loss of the COad signal intensity with time on stream, after
having passed through the maximum, is most likely due to agglomeration of Ru NPs
or deposition of deactivating carbon on the Ru surface as already discussed in section
3.2.
In the OH region, CO2-related overtone signals (not marked) appear at 3600, 3640,
3700 and 3740 cm-1, in addition to the OH-related signals in this region, which blur the
OH signals.
The CHx spectral region shows the typical CHx,ad signals at 3016, 2928, and 2860 cm-
1 [65;79]. On all four catalysts, these species (except CH4) start to grow in after about
15 min on stream and reach a steady-state situation after 1000 minutes. For the CH4
signal, steady-state is reached much faster, after about 10 min. A shoulder at
~2905 cm-1, observed all on four catalysts, indicates the presence of C-H vibrations of
surface formate species [26;30].
In the OCO region, bands at 1590, 1440 and 1390 cm-1, related to surface formates
(1590 and 1390 cm-1) and carbonates (1440 cm-1) [26], appear after about 100 min on
stream on the four Ru/zeolite catalyst [30;136]. These bands grow steadily in intensity
and do not saturate over 1000 min.
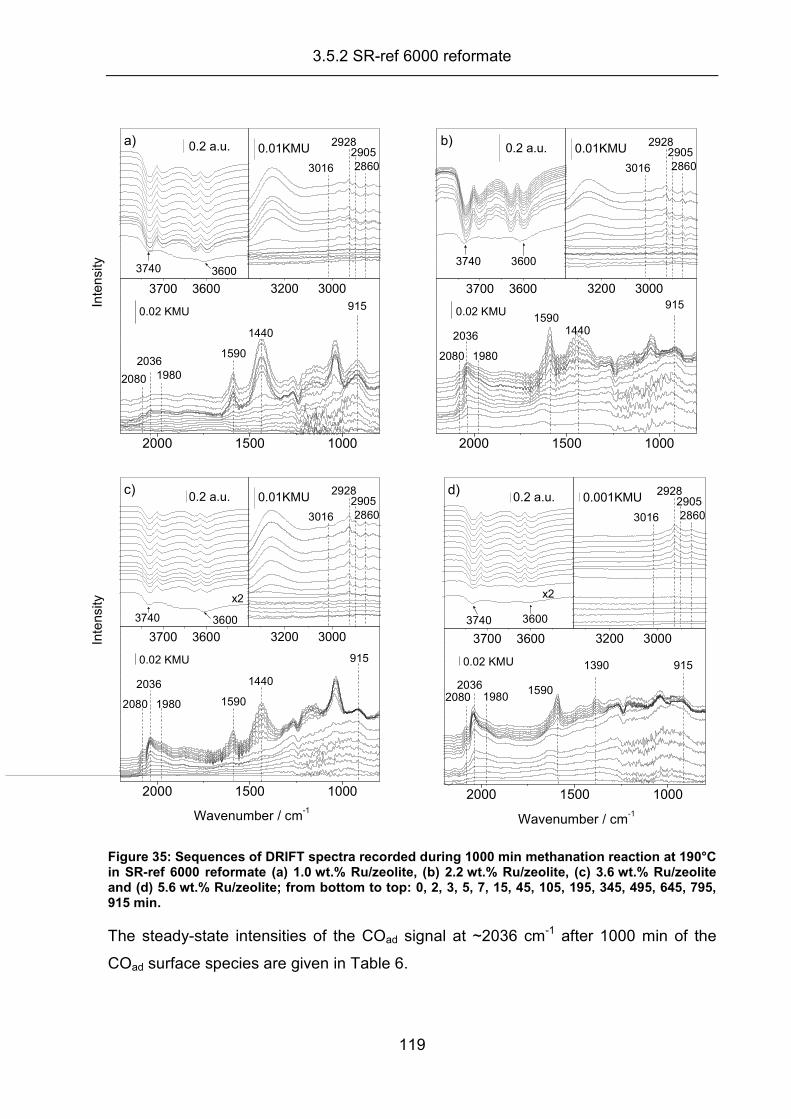
3.5.2 SR-ref 6000 reformate
119
2000 1500 1000
915
1440
1590
2080 19802036
In
ten
sity
0.02 KMU
3200 3000
28602905
2928
3016
0.01KMU
3700 3600
36003740
0.2 a.u.a)
2000 1500 1000
915
14401590
2080 1980
2036
0.02 KMU
3200 3000
28602905
2928
3016
0.01KMU
3700 3600
36003740
0.2 a.u.b)
2000 1500 1000
Wavenumber / cm-1
915
1440
15902080 1980
2036
Inte
nsi
ty
0.02 KMU
3200 3000
28602905
2928
3016
0.01KMU
3700 3600
x2
36003740
0.2 a.u.c)
2000 1500 1000
2080 1980
Wavenumber / cm-1
9151390
15902036
0.02 KMU
3200 3000
28602905
2928
3016
0.001KMU
3700 3600
3600
x2
3740
0.2 a.u.d)
Figure 35: Sequences of DRIFT spectra recorded during 1000 min methanation reaction at 190°C in SR-ref 6000 reformate (a) 1.0 wt.% Ru/zeolite, (b) 2.2 wt.% Ru/zeolite, (c) 3.6 wt.% Ru/zeolite and (d) 5.6 wt.% Ru/zeolite; from bottom to top: 0, 2, 3, 5, 7, 15, 45, 105, 195, 345, 495, 645, 795, 915 min.
The steady-state intensities of the COad signal at ~2036 cm-1 after 1000 min of the
COad surface species are given in Table 6.
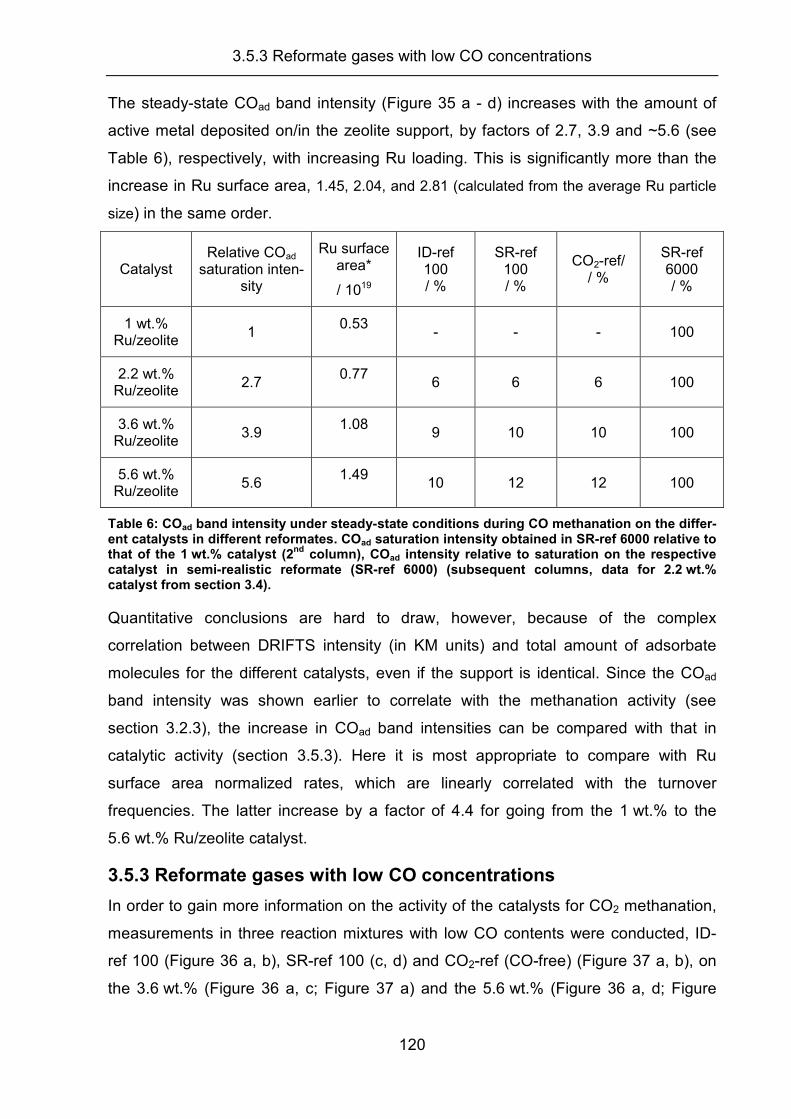
3.5.3 Reformate gases with low CO concentrations
120
The steady-state COad band intensity (Figure 35 a - d) increases with the amount of
active metal deposited on/in the zeolite support, by factors of 2.7, 3.9 and ~5.6 (see
Table 6), respectively, with increasing Ru loading. This is significantly more than the
increase in Ru surface area, 1.45, 2.04, and 2.81 (calculated from the average Ru particle
size) in the same order.
Catalyst Relative COad
saturation inten-sity
Ru surface area*
/ 1019
ID-ref 100 / %
SR-ref 100 / %
CO2-ref/ / %
SR-ref 6000 / %
1 wt.% Ru/zeolite
1 0.53
- - - 100
2.2 wt.% Ru/zeolite
2.7 0.77
6 6 6 100
3.6 wt.% Ru/zeolite
3.9 1.08
9 10 10 100
5.6 wt.% Ru/zeolite
5.6 1.49
10 12 12 100
Table 6: COad band intensity under steady-state conditions during CO methanation on the differ-ent catalysts in different reformates. COad saturation intensity obtained in SR-ref 6000 relative to that of the 1 wt.% catalyst (2
nd column), COad intensity relative to saturation on the respective
catalyst in semi-realistic reformate (SR-ref 6000) (subsequent columns, data for 2.2 wt.% catalyst from section 3.4).
Quantitative conclusions are hard to draw, however, because of the complex
correlation between DRIFTS intensity (in KM units) and total amount of adsorbate
molecules for the different catalysts, even if the support is identical. Since the COad
band intensity was shown earlier to correlate with the methanation activity (see
section 3.2.3), the increase in COad band intensities can be compared with that in
catalytic activity (section 3.5.3). Here it is most appropriate to compare with Ru
surface area normalized rates, which are linearly correlated with the turnover
frequencies. The latter increase by a factor of 4.4 for going from the 1 wt.% to the
5.6 wt.% Ru/zeolite catalyst.
3.5.3 Reformate gases with low CO concentrations
In order to gain more information on the activity of the catalysts for CO2 methanation,
measurements in three reaction mixtures with low CO contents were conducted, ID-
ref 100 (Figure 36 a, b), SR-ref 100 (c, d) and CO2-ref (CO-free) (Figure 37 a, b), on
the 3.6 wt.% (Figure 36 a, c; Figure 37 a) and the 5.6 wt.% (Figure 36 a, d; Figure
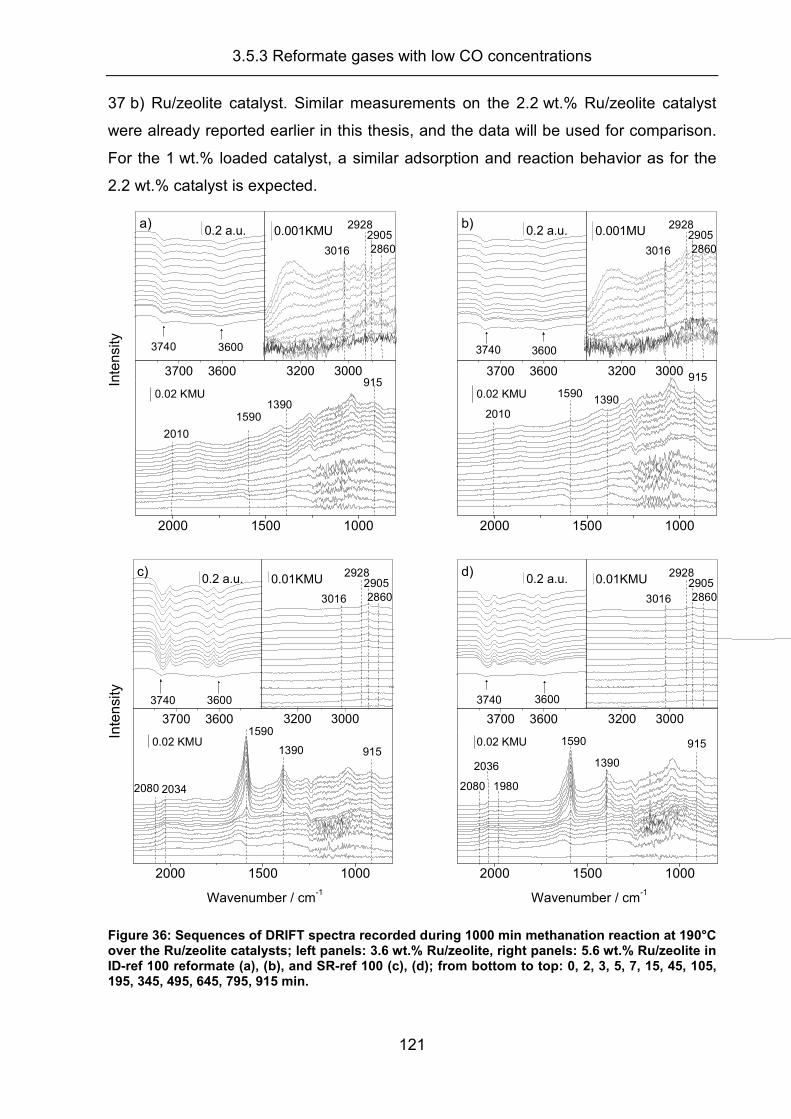
3.5.3 Reformate gases with low CO concentrations
121
37 b) Ru/zeolite catalyst. Similar measurements on the 2.2 wt.% Ru/zeolite catalyst
were already reported earlier in this thesis, and the data will be used for comparison.
For the 1 wt.% loaded catalyst, a similar adsorption and reaction behavior as for the
2.2 wt.% catalyst is expected.
2000 1500 1000
915
13901590
2010
0.02 KMU
3200 3000
28602905
2928
3016
0.001KMU
3700 3600
36003740
Inte
nsi
ty
0.2 a.u.a)
2000 1500 1000
915
13901590
2010
0.02 KMU
3200 3000
28602905
2928
3016
0.001MU
3700 3600
36003740
0.2 a.u.b)
2000 1500 1000
Wavenumber / cm-1
9151390
1590
2080 2034
Inte
nsi
ty
0.02 KMU
3200 3000
28602905
2928
3016
0.01KMU
3700 3600
36003740
0.2 a.u.c)
2000 1500 1000
Wavenumber / cm-1
1390
9151590
2080 1980
2036
0.02 KMU
3200 3000
28602905
2928
3016
0.01KMU
3700 3600
36003740
0.2 a.u.d)
Figure 36: Sequences of DRIFT spectra recorded during 1000 min methanation reaction at 190°C over the Ru/zeolite catalysts; left panels: 3.6 wt.% Ru/zeolite, right panels: 5.6 wt.% Ru/zeolite in ID-ref 100 reformate (a), (b), and SR-ref 100 (c), (d); from bottom to top: 0, 2, 3, 5, 7, 15, 45, 105, 195, 345, 495, 645, 795, 915 min.
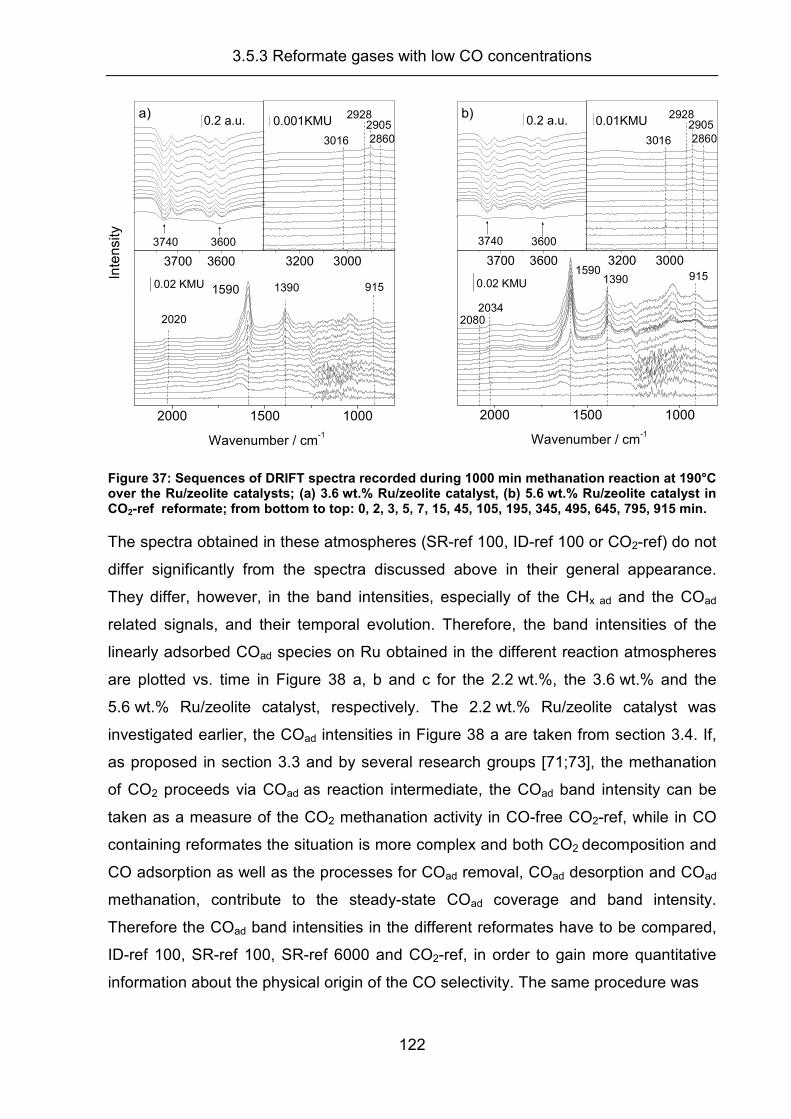
3.5.3 Reformate gases with low CO concentrations
122
2000 1500 1000
Wavenumber / cm-1
91513901590
2020
0.02 KMU
3200 3000
28602905
2928
3016
0.001KMU
3700 3600
36003740
In
ten
sity
0.2 a.u.a)
2000 1500 1000
Wavenumber / cm-1
91513901590
20802034
0.02 KMU
3200 3000
28602905
2928
3016
0.01KMU
3700 3600
3740 3600
0.2 a.u.b)
Figure 37: Sequences of DRIFT spectra recorded during 1000 min methanation reaction at 190°C over the Ru/zeolite catalysts; (a) 3.6 wt.% Ru/zeolite catalyst, (b) 5.6 wt.% Ru/zeolite catalyst in CO2-ref reformate; from bottom to top: 0, 2, 3, 5, 7, 15, 45, 105, 195, 345, 495, 645, 795, 915 min.
The spectra obtained in these atmospheres (SR-ref 100, ID-ref 100 or CO2-ref) do not
differ significantly from the spectra discussed above in their general appearance.
They differ, however, in the band intensities, especially of the CHx ad and the COad
related signals, and their temporal evolution. Therefore, the band intensities of the
linearly adsorbed COad species on Ru obtained in the different reaction atmospheres
are plotted vs. time in Figure 38 a, b and c for the 2.2 wt.%, the 3.6 wt.% and the
5.6 wt.% Ru/zeolite catalyst, respectively. The 2.2 wt.% Ru/zeolite catalyst was
investigated earlier, the COad intensities in Figure 38 a are taken from section 3.4. If,
as proposed in section 3.3 and by several research groups [71;73], the methanation
of CO2 proceeds via COad as reaction intermediate, the COad band intensity can be
taken as a measure of the CO2 methanation activity in CO-free CO2-ref, while in CO
containing reformates the situation is more complex and both CO2 decomposition and
CO adsorption as well as the processes for COad removal, COad desorption and COad
methanation, contribute to the steady-state COad coverage and band intensity.
Therefore the COad band intensities in the different reformates have to be compared,
ID-ref 100, SR-ref 100, SR-ref 6000 and CO2-ref, in order to gain more quantitative
information about the physical origin of the CO selectivity. The same procedure was
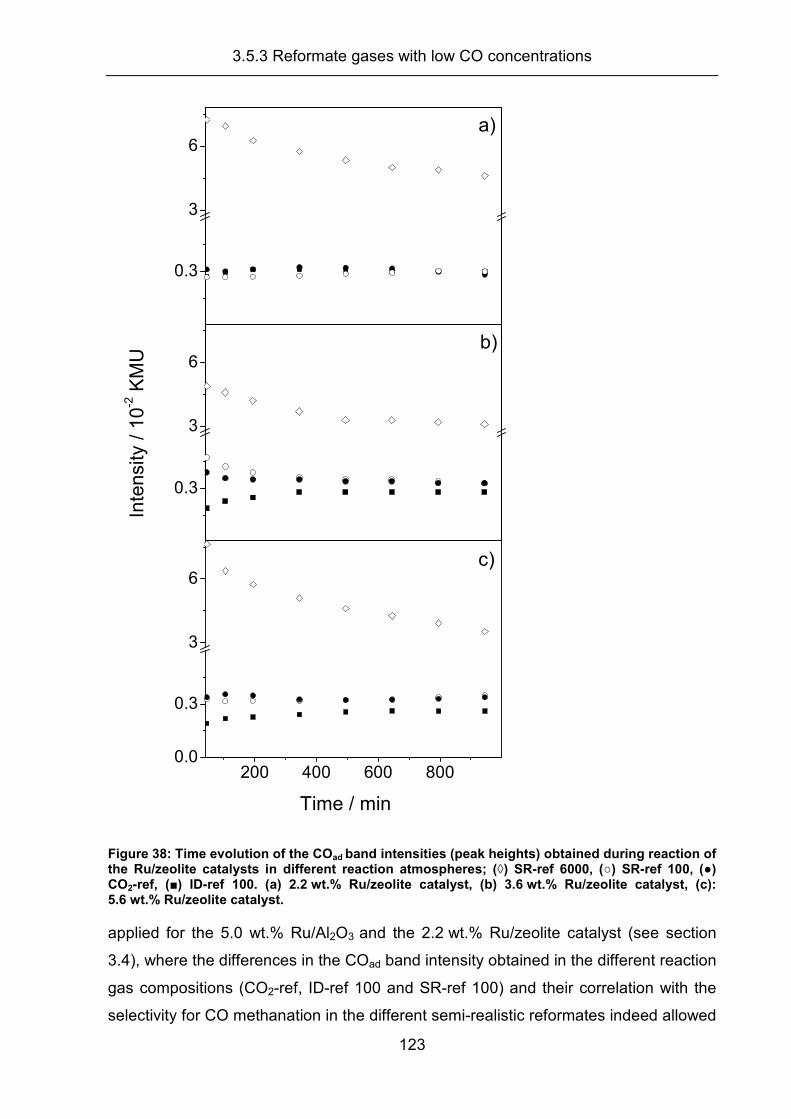
3.5.3 Reformate gases with low CO concentrations
123
0.3
3
6
200 400 600 8000.0
0.3
3
6
0.3
3
6
Time / min
Inte
nsi
ty /
10
-2 K
MU
a)
c)
b)
Figure 38: Time evolution of the COad band intensities (peak heights) obtained during reaction of the Ru/zeolite catalysts in different reaction atmospheres; (◊) SR-ref 6000, (○) SR-ref 100, (●) CO2-ref, (■) ID-ref 100. (a) 2.2 wt.% Ru/zeolite catalyst, (b) 3.6 wt.% Ru/zeolite catalyst, (c): 5.6 wt.% Ru/zeolite catalyst.
applied for the 5.0 wt.% Ru/Al2O3 and the 2.2 wt.% Ru/zeolite catalyst (see section
3.4), where the differences in the COad band intensity obtained in the different reaction
gas compositions (CO2-ref, ID-ref 100 and SR-ref 100) and their correlation with the
selectivity for CO methanation in the different semi-realistic reformates indeed allowed
3.5.3 Reformate gases with low CO concentrations
124
us to draw conclusions on the origin of the selectivity for CO methanation on these
catalysts. A similar approach will be used in this section. It should be noted that a
similar quantitative evaluation of the evolution of the CHx,ad related band intensities is
not possible as these signals at ~2928 cm-1 may be due to different surface species,
CH2 groups of carbon chains and CH2,ad as active intermediate for methanation.
The most important observations on the three catalysts are:
(I) In reaction atmospheres with low CO contents (ID-ref 100, SR-ref 100 and CO2-
ref (CO free); Figure 36 a, b, c, d, Figure 37 a and b), the final intensities of the
COad related signals are reached quickly within the first 100 minutes, as
compared to ~800 min of the respective signals in reaction atmospheres with
higher CO content (SR-ref 6000) (Figure 38 a, b, c).
(II) The final intensities of the COad related bands are significantly lower in
atmospheres, with low CO contents, regardless of the presence of CO2, and in
CO2-ref than in SR-ref 6000 for all catalysts. For the 2.2/3.6/5.6 wt.% Ru/zeolite
catalysts, the final COad band intensity in ID-ref 100 is only ~6/~9/~10% of that in
SR-ref 6000, where the latter corresponds to saturation of the COad band
intensity. Hence, under these conditions, the Ru NPs are largely free of a
reaction inhibiting CO adlayer and per se available for CO2 methanation.
(III) The effect of CO2 in the gas-phase in low-CO (SR-ref 100) (Figure 36 a and b) or
CO-free (CO2-ref) (Figure 37 b and c; Figure 38 b and c) reformate depends
sensitively on the catalyst loading. On the higher loaded 3.6 wt.% and 5.6 wt.%
catalysts, the COad band intensities in SR-ref 100 and CO2-ref (CO-free) are ~10
and ~12% of the signal intensity in SR-ref 6000. The presence of CO2 results in a
clear increase in the COad band intensity (relative to the intensity in a comparable
CO2-free atmosphere, ID-ref 100), indicating that the rate for CO2 decomposition
to COad is of comparable order of magnitude as the rates for CO adsorption (from
100 ppm CO) and COad desorption plus methanation, respectively, under present
reaction conditions. Accordingly, exposure to CO2-ref results in a COad band
intensity which is comparable to that obtained in SR-ref 100.
On the 2.2 wt.% Ru/zeolite catalyst, the situation is distinctly different (Figure
38 a). Addition of CO2, by going from ID-ref 100 to SR-ref 100 reaction gas, does
not increase the COad signal intensity significantly. This implies that
decomposition of CO2 to COad is slow compared to the rates for CO adsorption
3.5.3 Reformate gases with low CO concentrations
125
and COad removal, by desorption plus COad methanation, in SR-ref 100.
Correspondingly, the COad signal intensity resulting from exposure to CO2-ref is
much lower (~6%) than on the higher loaded Ru/zeolite catalysts and
comparable to the that obtained from direct adsorption of CO in 100 ppm CO
containing atmosphere (exposure to ID-ref 100), which is also lower than on the
higher loaded catalysts.
The above findings directly demonstrate that on the 2.2 wt.% Ru/zeolite catalyst CO2
decomposition to COad on the largely adsorbate-free Ru NPs is significantly slower
than on the higher loaded catalysts with their larger Ru NPs, supporting the claim of
an inherently slower CO2 methanation rate on the former catalysts. Since these
catalysts differ only in the Ru loading and in the Ru particle size, but not in the nature
of the support, the differences in the CO2 adsorption and CO formation behavior must
be due to Ru particle size effects. This will be discussed in more detail in section
3.5.4, after presentation of the catalytic activities.
3.5.4 Kinetic measurements
126
3.5.4 Kinetic measurements
Figure 39 illustrates the temporal evolution of the Ru mass normalized reaction rates
of the 4 different Ru/zeolite catalysts in semi-realistic reformate (CO/CO2/H2) over 500
min. For all four catalysts, the reaction rate increases initially for about 100 min and
stay constant afterwards. Table 7 summarizes the resulting final reaction rates. The
results of the 2.2 wt.% catalyst closely resemble the data shown in previous sections
[116]. All catalysts show 100% CO selectivity under the present reaction conditions,
which is mainly attributed to the fact that in the presence of 6000 ppm CO the surface
of the Ru NPs is covered by a reaction inhibiting CO adlayer (the COad band intensity
is saturated under these conditions on all four catalysts), the high selectivity for CO
methanation under these conditions is predominantly attributed to a surface blocking
effect, which prevents the decomposition of CO2 to COad and its further reaction to
CH4. The higher CO methanation activity of all Ru/zeolite catalysts compared to the
Ru/Al2O3 catalyst discussed earlier is attributed to strong metal support-interactions
on the Ru/zeolite catalyst (see also below) [79;163]. Pronounced support effects on
the CO methanation activity of Ru catalysts with comparable Ru particle sizes had
been reported earlier [26;40]. Obviously, the Ru mass normalized reaction rate
increases with increasing Ru content. A 5.6 fold increase of the Ru content (1 wt.% to
5.6 wt.% Ru) results in a 2.2 fold increase of the Ru mass normalized rate, and similar
effects are observed also for the other two catalysts with intermediate loadings (see
Table 7). This effect becomes even more pronounced when accounting for the lower
fraction of surface atoms (dispersion) on the larger Ru NPs by using turnover
frequencies, which are also listed in Table 4. (The TOFs are calculated assuming
hemispherical Ru NPs of the mean particle size for the respective catalysts.) The
TOF-based inherent activity of the Ru NPs increases by more than a factor of 4.4
from the 1 wt.% to the 5.6 wt.% Ru/zeolite catalyst. These trends in the CO methana-
tion activity are also evident for reaction in low-CO reformate (SR-ref 100, see below
and Figure 40), where the mass based activity / TOF based activity increases by
factors of ~1.84 and 2.14, respectively, when going from the 2.2 to the 5.6 wt.% cata-
lyst (see Table 7). Hence, the intrinsic activity of the Ru/zeolite catalysts for CO
methanation increased significantly when higher catalyst loadings are used.
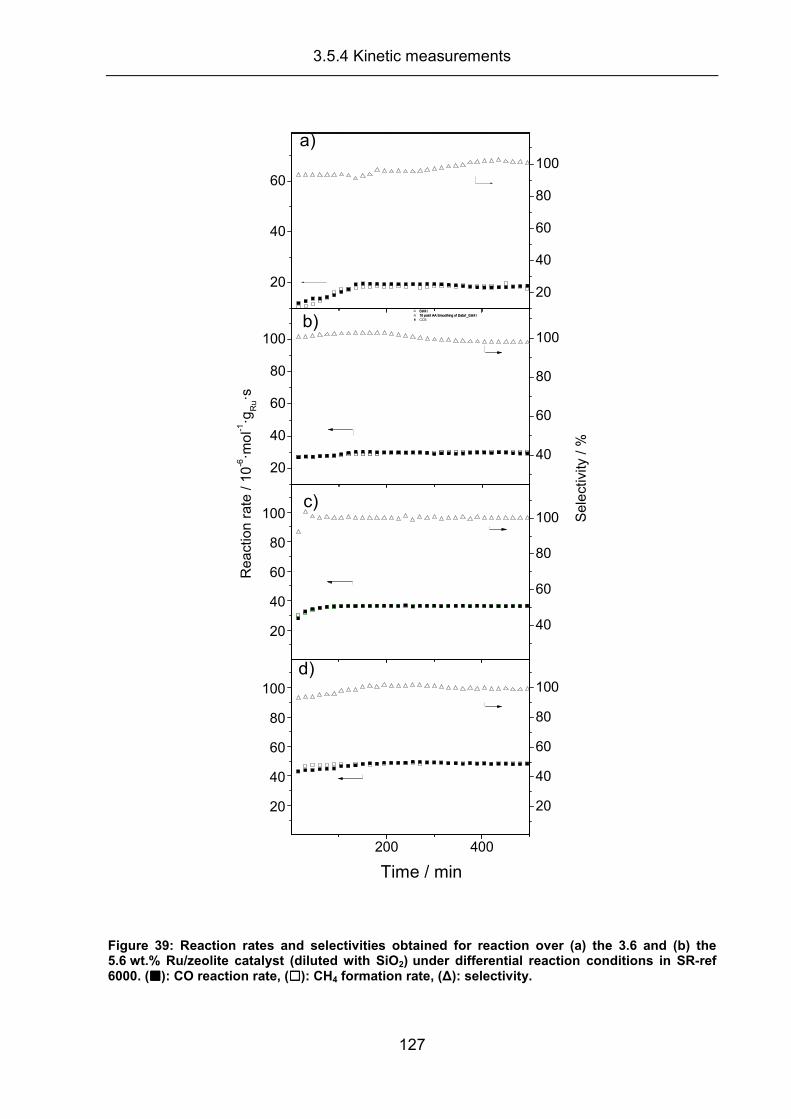
3.5.4 Kinetic measurements
127
200 400
20
40
60
80
100
20
40
60
80
100
20
40
60
80
100
40
60
80
100
20
40
60
80
100
40
60
80
100
20
40
60
80
100
20
40
60
c)
b)
Time / min
CH43 10 point AA Smoothing of Data1_CH43 CO3
R
ea
ctio
n r
ate
/ 1
0-6�m
ol-1
�gR
u�s
Sel3 10 point AA Smoothing of Data1_Sel3
Sele
ctiv
ity / %
d)
a)
Figure 39: Reaction rates and selectivities obtained for reaction over (a) the 3.6 and (b) the 5.6 wt.% Ru/zeolite catalyst (diluted with SiO2) under differential reaction conditions in SR-ref 6000. (����): CO reaction rate, (����): CH4 formation rate, (∆): selectivity.
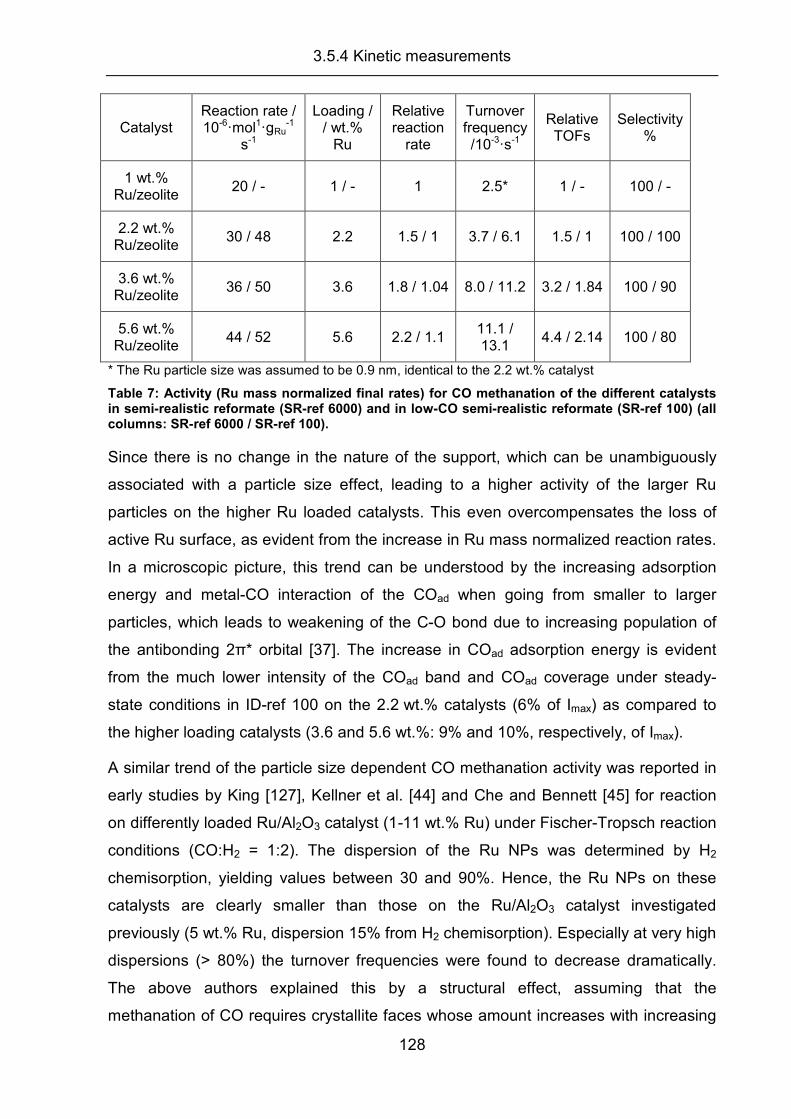
3.5.4 Kinetic measurements
128
Catalyst Reaction rate / 10-6�mol1�gRu
-1 s-1
Loading / / wt.%
Ru
Relative reaction
rate
Turnover frequency /10-3�s-1
Relative TOFs
Selectivity %
1 wt.% Ru/zeolite
20 / - 1 / - 1 2.5* 1 / - 100 / -
2.2 wt.% Ru/zeolite
30 / 48 2.2 1.5 / 1 3.7 / 6.1 1.5 / 1 100 / 100
3.6 wt.% Ru/zeolite
36 / 50 3.6 1.8 / 1.04 8.0 / 11.2 3.2 / 1.84 100 / 90
5.6 wt.% Ru/zeolite
44 / 52 5.6 2.2 / 1.1 11.1 / 13.1
4.4 / 2.14 100 / 80
* The Ru particle size was assumed to be 0.9 nm, identical to the 2.2 wt.% catalyst
Table 7: Activity (Ru mass normalized final rates) for CO methanation of the different catalysts in semi-realistic reformate (SR-ref 6000) and in low-CO semi-realistic reformate (SR-ref 100) (all columns: SR-ref 6000 / SR-ref 100).
Since there is no change in the nature of the support, which can be unambiguously
associated with a particle size effect, leading to a higher activity of the larger Ru
particles on the higher Ru loaded catalysts. This even overcompensates the loss of
active Ru surface, as evident from the increase in Ru mass normalized reaction rates.
In a microscopic picture, this trend can be understood by the increasing adsorption
energy and metal-CO interaction of the COad when going from smaller to larger
particles, which leads to weakening of the C-O bond due to increasing population of
the antibonding 2π* orbital [37]. The increase in COad adsorption energy is evident
from the much lower intensity of the COad band and COad coverage under steady-
state conditions in ID-ref 100 on the 2.2 wt.% catalysts (6% of Imax) as compared to
the higher loading catalysts (3.6 and 5.6 wt.%: 9% and 10%, respectively, of Imax).
A similar trend of the particle size dependent CO methanation activity was reported in
early studies by King [127], Kellner et al. [44] and Che and Bennett [45] for reaction
on differently loaded Ru/Al2O3 catalyst (1-11 wt.% Ru) under Fischer-Tropsch reaction
conditions (CO:H2 = 1:2). The dispersion of the Ru NPs was determined by H2
chemisorption, yielding values between 30 and 90%. Hence, the Ru NPs on these
catalysts are clearly smaller than those on the Ru/Al2O3 catalyst investigated
previously (5 wt.% Ru, dispersion 15% from H2 chemisorption). Especially at very high
dispersions (> 80%) the turnover frequencies were found to decrease dramatically.
The above authors explained this by a structural effect, assuming that the
methanation of CO requires crystallite faces whose amount increases with increasing
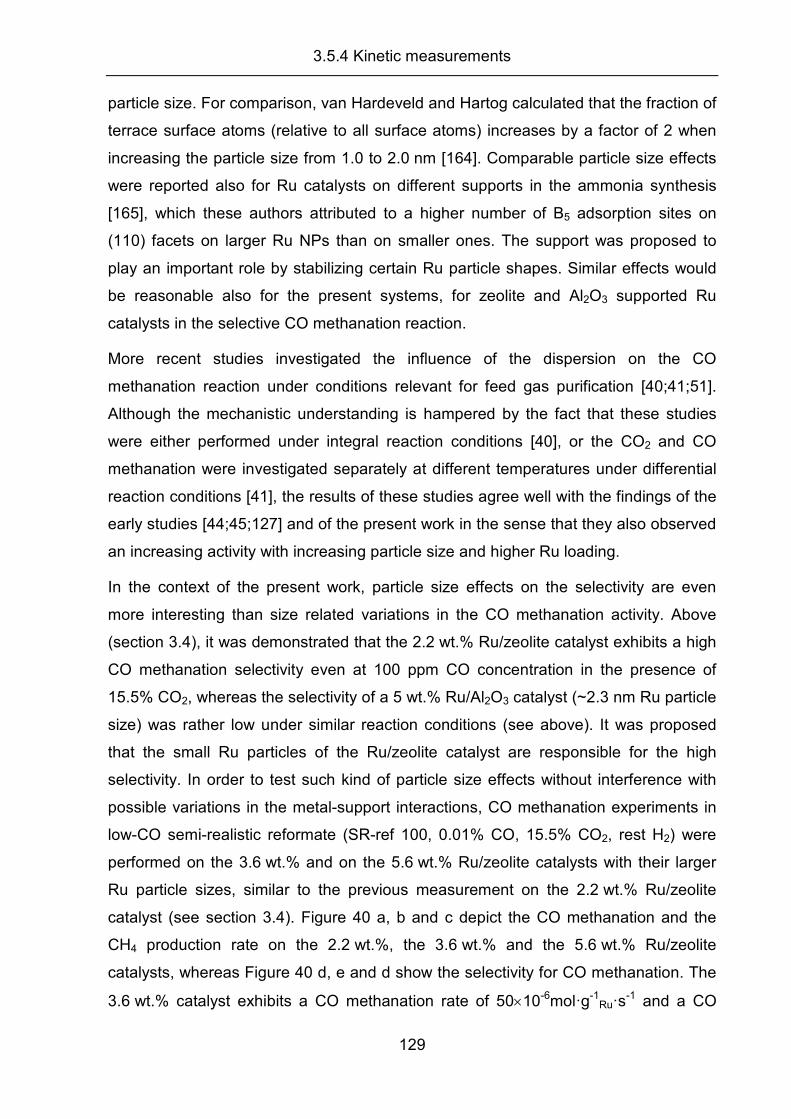
3.5.4 Kinetic measurements
129
particle size. For comparison, van Hardeveld and Hartog calculated that the fraction of
terrace surface atoms (relative to all surface atoms) increases by a factor of 2 when
increasing the particle size from 1.0 to 2.0 nm [164]. Comparable particle size effects
were reported also for Ru catalysts on different supports in the ammonia synthesis
[165], which these authors attributed to a higher number of B5 adsorption sites on
(110) facets on larger Ru NPs than on smaller ones. The support was proposed to
play an important role by stabilizing certain Ru particle shapes. Similar effects would
be reasonable also for the present systems, for zeolite and Al2O3 supported Ru
catalysts in the selective CO methanation reaction.
More recent studies investigated the influence of the dispersion on the CO
methanation reaction under conditions relevant for feed gas purification [40;41;51].
Although the mechanistic understanding is hampered by the fact that these studies
were either performed under integral reaction conditions [40], or the CO2 and CO
methanation were investigated separately at different temperatures under differential
reaction conditions [41], the results of these studies agree well with the findings of the
early studies [44;45;127] and of the present work in the sense that they also observed
an increasing activity with increasing particle size and higher Ru loading.
In the context of the present work, particle size effects on the selectivity are even
more interesting than size related variations in the CO methanation activity. Above
(section 3.4), it was demonstrated that the 2.2 wt.% Ru/zeolite catalyst exhibits a high
CO methanation selectivity even at 100 ppm CO concentration in the presence of
15.5% CO2, whereas the selectivity of a 5 wt.% Ru/Al2O3 catalyst (~2.3 nm Ru particle
size) was rather low under similar reaction conditions (see above). It was proposed
that the small Ru particles of the Ru/zeolite catalyst are responsible for the high
selectivity. In order to test such kind of particle size effects without interference with
possible variations in the metal-support interactions, CO methanation experiments in
low-CO semi-realistic reformate (SR-ref 100, 0.01% CO, 15.5% CO2, rest H2) were
performed on the 3.6 wt.% and on the 5.6 wt.% Ru/zeolite catalysts with their larger
Ru particle sizes, similar to the previous measurement on the 2.2 wt.% Ru/zeolite
catalyst (see section 3.4). Figure 40 a, b and c depict the CO methanation and the
CH4 production rate on the 2.2 wt.%, the 3.6 wt.% and the 5.6 wt.% Ru/zeolite
catalysts, whereas Figure 40 d, e and d show the selectivity for CO methanation. The
3.6 wt.% catalyst exhibits a CO methanation rate of 50×10-6mol�g-1Ru�s
-1 and a CO
3.5.4 Kinetic measurements
130
methanation selectivity of 90%, whereas for the 5.6 wt.% catalyst the corresponding
values are 52×10-6 mol�g-1Ru�s
-1 and 80%. For the 2.2 wt.% catalyst, values of 48×10-6
mol�g-1Ru�s
-1 and 100% were determined (see above). The higher reaction rates
compared to reaction in the SR-ref 6000 reformate (0.6% CO) are due to the lower
CO concentrations (0.01%), reflecting the negative CO reaction order reported in
section 3.2.2.
200 400 600 800
40
60
80
100
200 400 600 800
40
60
80
100
20
40
60
80
100
40
60
80
100
40
60
80
100
40
60
80
100
e)
d)
b)
a)
Time / min
R
ea
ctio
n r
ate
�1
0-6�m
ol-1
�gR
u�s
Sele
ctiv
ity / %
f)c)
a)
Figure 40: Reaction rates (left panels) and selectivities (right panels) obtained for reaction over the 2.2 (a), (d), 3.6 (b), (e), and 5.6 wt.% (c), (f) Ru/zeolite catalysts (diluted with SiO2) under differential reaction conditions in SR-ref 100. (����) CO reaction rate, (����) CH4 formation rate, (∆) selectivity.
The observed decay in selectivity with increasing Ru particle size agrees well with the
trends in the COad signal intensities in the DRIFTS measurements, where the
difference between reaction in ID-ref 100 and SR-ref 100 increases from essentially
zero (2.2 wt.%) via 1% of the saturation intensity (3.6 wt.%) to 2% of the saturation
3.5.4 Kinetic measurements
131
intensity (5.6 wt.%) (note that the error margins are below 1%), and where the COad
intensity in CO2-ref increases from 6% to 12% of the saturation intensity in the same
order (Table 6). These trends fully agree also with the previous proposal for the
physical origin of the selectivity for CO methanation on Ru/zeolite catalyst (see
section 3.4). The very small particles dominant on the lower loaded Ru/zeolite
catalysts (1 wt.% and 2.2 wt.%) are little active for CO formation from reversibly
adsorbing CO2, as indicated by the lower COad band intensity observed in CO-free
CO2-reformate as compared to the higher loading Ru/zeolite catalysts. (For the 1 wt.%
catalyst similar or lower particle sizes are assumed compared to the 2.2 wt.% catalyst
based on the adsorption / reaction characteristics.) This is attributed to a higher
barrier for CO2 dissociation, which, according to the Brønstedt-Evans-Polanyi relation
[159;160], agrees perfectly with the weaker CO adsorption, derived from the
decreasing COad band intensity on these catalysts. Hence, on the catalysts, the high
selectivity for CO methanation even at low CO concentrations is driven by an
inherently low activity for CO2 methanation, due to a higher barrier for CO formation
from reversibly adsorbed CO2. Of course, at higher CO concentrations site blocking
by a closed CO adlayer comes as an additional effect.
For the higher loading Ru/zeolite catalysts it was assumed that their larger mean Ru
particle sizes (3.6 wt.%: 1.6 nm, 5.6 wt.%: 1.9 nm) results from a coexistence of larger
Ru NPs outside the zeolite particles and very small Ru NPs (0.-8-0.9 nm diameter)
inside the pores, as present on the low loading catalysts. On the larger Ru NPs, the
selectivity is proposed to be controlled by a site blocking mechanism, where the active
Ru surface is essentially covered by strongly adsorbed COad, preventing the
dissociative adsorption of CO2, which corresponds to the previous ideas for the origin
of the selectivity in the selective CO methanation over Ru catalysts [49;50]. As the CO
concentration and hence the COad coverage decreases, CO2 can adsorb on the
resulting empty sites and dissociate to COad, which acts as intermediate for the CO2
methanation [71;73]. Therefore, the selectivity for CO methanation decreases with
decreasing CO concentration in the feed gas. The very small Ru NPs (in the zeolite
pores), which are most likely present also on these catalysts, behave similarly as on
the low loading Ru/zeolite catalysts, with an inherently lower activity for CO2
dissociation to COad. On a microscopic scale, this trend towards a higher inherent
activity for larger Ru particles can again be explained by in terms of the Brønstedt-
3.5.4 Kinetic measurements
132
Evans-Polanyi relation, similar to the correlation between CO methanation rate and
COad adsorption energy, where larger Ru particles result in a higher CO methanation
rate and a higher CO adsorption energy. A similar correlation is likely also between
COad stabilization and CO2 decomposition, where stabilisation of COad (increasing
particle size) should be correlated with an increase in CO2 decomposition
(stabilization of the final state and of the transition state), in agreement with experi-
mental findings.
Based on the above trends, the variation in the selectivity for CO methanation on the
different Ru/zeolite catalysts is dominated and can be rationalized consistently by
particle size effects. This may be different when changing the nature of the support. It
was demonstrated above that particle size effects are not sufficient to rationalize the
different activities of the Ru/zeolite catalysts and a Ru/Al2O3 catalyst with larger Ru
NPs (~2.3 nm). Also, for the 5.6 wt.% Ru/zeolite catalysts, whose mean particle sizes
is not so different from that of the Ru/Al2O3 catalyst, the Ru mass based activity differs
by more than one order of magnitude from that of the latter one. (Extrapolating from
lower loaded Ru/zeolite catalysts with smaller Ru NPs this difference should even
increase when going to hypothetical Ru/zeolite catalysts with even larger Ru NPs
(~2.3 nm).) Similar discrepancies are also observed for the inherent activity for CO2
methanation, which controls the selectivity at low CO concentrations. In section 3.4.1
it was reported, that exposure of the Ru/Al2O3 catalyst to CO2-ref under identical
reaction conditions results in a similar COad band intensity as obtained in SR-ref 6000,
which in turn corresponds to the maximum intensity achieved on this catalyst (COad
saturation). In contrast, on the 5.6 wt.% Ru/zeolite catalyst, this value was only 12%
of the saturation intensity. Hence, on the Ru/Al2O3 catalyst with its larger Ru NPs
(~2.3 nm particle size), CO2 decomposition is relatively fast compared to the
combined rates of COad desorption and COad methanation on that catalyst. On the
other hand, it has to be considered that on the Ru/Al2O3 catalyst also the methanation
of the resulting COad was much slower, by at least one order of magnitude, than on
the 5.6 wt.% Ru/zeolite catalyst (see above and section 3.4), which leads to a higher
COad steady–state coverage on Ru/Al2O3 in CO2–ref than on the 5.6 wt.% Ru/zeolite
catalyst for a similar CO2 decomposition rate. Hence, metal–support interactions
affect also the CO2 methanation reaction and hence the selectivity, either indirectly via

3.5.5 Conclusion
133
the build–up of a reaction inhibiting CO adlayer, via the competition between COad
formation from CO2 and COad removal, or directly.
Finally, a brief comment on the implications of these findings for technical application
will be given, i.e., for CO removal from CO–contaminated feed gases for low–
temperature polymer electrolyte fuel cells (PEFCs). Obviously, both processes for
removal of small amounts of CO (<1%), the preferential oxidation of CO (PROX) and
the selective methanation of CO (SelMeth) are facing limitations in the down–stream
part of the reactor with its low residual CO concentrations, if the selectivity is only due
to reaction inhibiting CO adlayer on the active particles. This leads to considerable H2
consumption due to H2 oxidation (PROX reaction) or due to CO2 methanation
(SelMeth reaction). The much simpler technical realization of the SelMeth reaction as
compared to a PROX reactor makes this pathway attractive from a technical point of
view. Therefore, catalysts with an inherently low activity for H2 oxidation (PROX
reaction) or, as in the present case, for CO2 methanation (SelMeth reaction) are ideal
candidates for complete CO removal from these fuels, and fundamental for the
realization of the SelMeth process.
For reaction in the regime of very low CO contents, at the end of the catalyst bed in
technical applications, only inherently low activities for CO2 decomposition will
maintain the high selectivities of ~100%, which can be obtained via the site blocking
mechanism at higher CO concentrations in the reformate gas mixture. This is crucial
for the implementation of the selective methanation as a technically simple and
therefore attractive technology for fine purification of H2-rich feed gases for low-
temperature PEFCs, which were prepared by steam reforming of fossil fuels and
therefore contain large amounts of CO2 in addition to CO impurities.
3.5.5 Conclusion
The effect of Ru loading and of the Ru particle size on the reaction behavior of
differently loaded Ru/zeolite catalysts in the selective methanation of CO in CO2-rich
reformate gases was systematically investigated, employing in situ DRIFTS and
kinetic measurements in reformate gases with different CO contents. Combining the
structural information (particle sizes) from XAS measurements, the time-resolved
information on the build–up of the adlayer and in particular of the COad coverage on
the different catalysts and in different reaction atmospheres from DRIFTS
measurements, and the trends in reactivities and selectivities for CO methanation
3.5.5 Conclusion
134
obtained from the kinetic measurements, led to the following conclusions on the
reaction behavior of these Ru/zeolite catalysts:
(I) The activity of the Ru/zeolite catalysts for CO methanation (both TOF–based
activity and Ru mass normalized rates) increases with increasing Ru particle size.
Since variations in the metal–support interactions can be excluded, the changes in
reactivity purely reflect a particle size effect. In addition, the rates are significantly
higher, by at least a one order of magnitude, than for a Ru/Al2O3 catalyst under
identical reaction conditions and extrapolated to similar particle sizes. This difference
must be solely due to a variation in the metal–support interaction.
(II) The adsorption energy of COad increases with increasing Ru particle size, as
evident from the increasing relative COad band intensity and hence increasing COad
coverage in low–CO idealized reformate under identical adsorption/reaction
conditions. In reformate gas with higher CO concentrations, the COad band intensity
reaches its saturation level, independent of catalyst loading / Ru NP size.
(III) In the absence of CO, the dissociation rate for CO2 increases with increasing
Ru particle size, as indicated by the increasing COad band intensity. This leads to an
increasing inherent activity for CO2 methanation with increasing Ru particle size. In
good agreement with the increasing activity for CO2 decomposition, its contribution to
the COad band intensity in low–CO reformate with Ru loading / NP size, as evident
from comparison with the band intensity in the same atmosphere, but without CO2.
(IV) In low–CO reformate, the CO selectivity decreases with increasing Ru NP size,
from 100% for the 2.2 wt.% catalyst to 80% for the 5.6 wt.% Ru/zeolite catalyst. In
contrast, in reformate gas with higher CO concentration, the CO selectivity is constant
at 100%, independent of catalyst loading / Ru NP size.
(V) The high selectivity for CO methanation of the Ru/zeolite catalysts and its
particle size dependence are explained by a combination of two effects: i) a site
blocking mechanism, where a reaction inhibiting, strongly bound CO adlayer blocks
the decomposition of CO2 to COad and its further methanation, as it was proposed for
Ru catalysts earlier, and ii) a decreasing inherent activity for CO2 dissociation to COad
with decreasing Ru particle size. The former results in a high selectivity at higher CO
concentrations, independent of the Ru particle size, while the latter is responsible for
the very high selectivities obtained even at very low CO concentrations, despite the
presence of vast amounts of CO2. The pronounced decrease in activity for CO2 dis-
3.5.5 Conclusion
135
sociation for very small Ru particles is explained in terms of the Brønstedt-Evans-
Polanyi relation, with the barrier for CO2 dissociation increasing with a decrease of the
COad adsorption energy at decreasing Ru particle size.
(VI) In addition to particle size effects, also metal–support interactions play a role
and affect the selectivity for CO methanation of the Ru/zeolite catalysts, as evident
from the much higher selectivity of the highest loading Ru/zeolite compared to the
Ru/Al2O3 catalyst with similar particle sizes in low–CO reformate. Metal support
interactions may affect the selectivity either directly, via the activity for CO2
decomposition, or indirectly, by modifying the ratio between COad formation and COad
removal (desorption plus methanation), which changes the steady–state coverage of
the reaction inhibiting CO adlayer.
4 Summary
136
4 Summary
In the present PhD thesis I described the investigations of the mechanism of the
selective CO methanation in the presence of CO2 in H2-rich feed gases over various
supported Ru catalysts and presented their results. During this thesis I introduced the
in situ X-ray Absorption Spectroscopy as characterization method for very small Ru
nanoparticles on zeolite supported catalysts and constructed an in situ XAS reaction
cell and a portable gas mixing unit, in order to perform in situ experiments at a
synchrotron. These measurements revealed changes in the average coordination
numbers of the Ru nanoparticles and its oxidation state. The results of the in situ XAS
measurements gave access to the mean particle size of the different Ru/zeolite
catalysts. This in consequence allowed me to compare the intrinsic activity and to
draw conclusions on the driving force behind the differences in CO selectivity for the
particular catalysts, a 1.0 wt.% 2.2 wt.%, 3.6 wt.% and 5.6 wt.% Ru/zeolite and 5 wt.%
Ru/Al2O3 catalyst.
The obtained results during this work can be summarized as follows:
(I) The catalysts feature different Ru nanoparticle sizes which were derived from
in situ EXAFS measurements for the 2.2, 3.6 and 5.6 wt.% Ru/zeolite (d= 0.9, 1.6 and
1.9 nm) catalyst and from TEM as well as in situ EXAFS experiments for the Ru/Al2O3
(2.3 nm) catalyst. Standard characterization techniques such as TEM, XRD did not
lead to realistic Ru particle sizes for the Ru/zeolite catalyst, due to the decomposition
of the zeolite support under the focused electron beam during TEM measurements
and the parallel existence of large and very small nanoparticles in case of XRD
experiments. The similar particle size derived by in situ EXAFS and TEM for the
Ru/Al2O3 catalyst underlined the correctness of evaluation. The Ru nanoparticles of
the Ru/zeolite catalyst are expected to be located inside the pores mostly, as
indicated by the small Ru particle size. For the 2.2 wt.% Ru/zeolite catalyst, the mean
particle sizes almost correspond to the pore size of the zeolite support. In addition, a
much smaller XPS intensity on this catalyst compared to the Ru/Al2O3 catalyst
provided additional evidence of the existence of the small Ru nanoparticles. The
increasing average particle size with higher metal loading on the Ru/zeolite catalyst
was explained by the existence of a larger amount of bigger Ru particles on the outer
surface.
4 Summary
137
(II) All catalysts are active for the methanation of CO. The CO2 methanation activity
in contrast was dependent on the catalyst and on the Ru particle size. Integral
measurements showed a higher CO methanation activity and selectivity of the
2.2 wt.% Ru/zeolite catalyst compared to the 5.0 wt.% Ru Al2O3 catalyst. The
experiments revealed that the Ru/zeolite catalyst exhibits 100% conversion at a 20°C
lower temperature (190°C) than the Ru/Al2O3 catalyst (210°C). The major difference
of the two catalysts lies in the methanation of CO2, where the 2.2 wt.% Ru/zeolite
catalyst exhibits a selectivity of 100% for CO under semi-realistic conditions
(H2/CO/CO2) at this temperature. CO2 only is converted at much higher temperatures,
where 50% CO2 conversion are reached at 330°C and full conversion is achieved at
410°C. Even if no CO is present (H2/CO2) the conversion of CO2 reaches 50% and full
conversion at the same temperatures. On the other hand, the Ru/Al2O3 catalyst shows
full CO2 conversion at 230 °C, even in the presence of CO (H2/CO/CO2). The catalyst
readily converts CO2 in CO free reformates (H2/CO2) exhibiting full conversion at the
same temperature as under CO methanation conditions (210°C), pointing to
unselective active sites, which readily methanate CO and CO2 even at low
temperatures. On the latter catalyst the selectivity is driven by the much higher
adsorption enthalpy of CO compared to CO2. As long as the partial pressure of CO is
sufficiently high, CO2 will not be methanated.
(III) The reaction rates of both catalysts are in a range between 3.1 and 4.4 or 31.8
and 63.9x10⁻⁶ mol�g-1Ru�s
-1 for the 5.0 wt.% Ru/Al2O3 and the 2.2 wt.% Ru/zeolite
catalyst, respectively, depending on the reformate gases. Addition of CH4 and CO2 did
not significantly affect the reaction rate on both catalysts. In contrast, the addition of
5 % H2O to the gas mixture resulted in a twofold lower activity for the Ru/zeolite
catalyst, which also corresponds to a 50% lower linearly adsorbed COad signal
intensity on metallic Ru during the in situ DRIFTS experiments. Obviously, water
prevents adsorption of CO on Ru on this catalyst and also blocks active sites for the
reaction intermediate. The activation energy of the selective methanation was in the
range between 90 and 110 kJ�mol-1 for both, the Ru/zeolite and the Ru/Al2O3 catalyst.
The reaction order of CO was measured to be -0.7 and -0.5 for the Ru/zeolite and the
Ru/Al2O3 catalyst, respectively. The reaction order of H2 was found to be 1.0 on the
Ru/Al2O3 catalyst compared to 2.7 on the Ru/zeolite catalyst as determined in my
diploma thesis. This distinctly higher value on the latter catalyst was proposed as one
reason for the higher CO methanation activity of the Ru/zeolite catalyst compared to
4 Summary
138
that of the Ru/Al2O3 catalyst. Transient experiments carried out by in situ DRIFTS and
mass spectroscopic measurements, where CO was replaced by N2 after 1000 min of
reaction, revealed that the observed CHx,ad species cannot play a dominant role in the
reaction pathway, since their off reaction, followed by the in situ DRIFTS
measurements, does not match with the depletion of CH4 measured by the mass
spectrometer. It was shown that possibly only a small fraction of reactive CHx takes
part in the reaction whose bands are obscured by large signals of produced side
products.
(IV) The molecular mechanism of the CO methanation and the CO2 methanation
was investigated by SSITKA (Steady State Isotope Transient Kinetic Analysis)
experiments, where after reaching a dynamic equilibrium (1000 min) one educt (12CO
or 12CO2) was replaced by its isotopomer (13CO or 13CO2). It was shown, that on the
Ru/Al2O3 a ‘formyl’ species (CHOad) is likely to act as a reaction intermediate of the
CO methanation, since the off reaction of this surface species, determined in the in
situ DRIFTS experiments, revealed a similar reaction rate as observed in the kinetic
measurements. The same mechanism is tentatively assigned to occur on the
Ru/zeolite, although such a formyl species was not yet detected. This is explained by
the much higher activity (20 fold) for the reaction and possibly also for the off reaction,
where the surface concentration of such a species is likely to be below the detection
limit. For the CO2 methanation it was shown by similar experiments on both catalysts
that CO2 adsorbs and dissociates directly to COad under the present reaction
conditions. A participation of formates can be excluded. The produced COad reacts
further to CH4.
The combination of the above mentioned results proposes COad adsorbed on metallic
Ru as active species which reacts to CH4 via HCOad, which is also adsorbed on the
Ru nanoparticles. Moreover I showed, that the Ru/zeolite catalyst, comprising very
small Ru particles, exhibits a higher reaction rate compared to the Ru/Al2O3 catalyst.
This is currently explained by metal support effects, and by the high reaction order for
hydrogen. In addition the Ru/zeolite catalyst showed in integral measurements a very
high selectivity for CO methanation, which is also explained by the very small Ru
particles (see below). The observed high selectivity for CO methanation may also be
an explanation for the fact, that the Reverse Water Gas Shift reaction did not occur on
the Ru/zeolite catalyst under the conditions applied during this work.
4 Summary
139
(V) By combination of kinetic and in situ IR (DRIFTS) results it was possible to
demonstrate that the particle size influences the CO selectivity of the CO methanation
reaction. On the Ru/Al2O3 catalyst, which features larger particles (~ 2.3 nm), derived
by in situ EXAFS and TEM measurements, the CO selectivity is solely controlled by a
surface blocking mechanism. As long as sufficient gas phase CO is present to form a
monolayer of COad (saturation coverage) on the active sites, CO2 will not be
dissociated. Once the monolayer of adsorbed COad cannot be maintained, as the gas
phase CO concentration decreases below a critical value, free active sites will adsorb
and dissociate CO2 to COad. In consequence, the CO selectivity decreases to about
45% in very low CO partial pressures in the presence of CO2 (100 ppm CO). These
selectivity values correlated with the COad band intensities measured in different
reformates. The situation is very different for the 2.2 wt.% Ru/zeolite catalyst, which
features very small Ru nanoparticles (d= 0.9 nm), as derived by in situ EXAFS
measurements. Here, CO2 is not adsorbed and dissociated even if the reformate
contains only 100 ppm CO besides CO2. Kinetic experiments revealed a 100% CO
selectivity under all investigated reaction conditions. In situ DRIFTS showed that even
in a CO free reformate the COad signal intensity reaches only 6% of the possible COad
saturation band intensity (on the Ru/Al2O3 catalyst saturation coverage was reached).
This points to an inherently low CO2 methanation activity, which was attributed to a
very low activity of the very small Ru NPs for the dissociation of CO2. This different
behaviour of the two catalysts was explained by the BrØnstedt-Evans-Polanyi (BEP)
relation, according to which COad is adsorbed weaker on smaller nanoparticles than
on larger nanoparticles. This in turn raises the dissociation barrier for CO2, since the
intermediate (COad) is less stable on smaller nanoparticles.
(VI) In order to confirm the CO selectivity model presented above, similar
experiments were carried out on differently loaded (3.6 and 5.6 wt.%) Ru/zeolite
catalysts. These experiments enabled the identification of the particle size as driving
force for the CO selectivity apart from possible support effects. The higher loaded
catalysts featured larger average particle sizes (d= 1.6 and 1.9 nm), where the particle
size of the catalyst with the highest loading was comparable to that of the standard
Ru/Al2O3 catalyst. The rate of CO2 methanation and in consequence its dissociation
increased with larger particles, when the CO concentration was low. The selectivity
derived from the results of the kinetic measurements, correlates well again with the
COad band intensity of the Ru/zeolite catalysts under different gas atmospheres. In
4 Summary
140
addition, the increase in particles size correlated with an increase of the reaction rate
(Ru mass normalized). This was explained by the existence of a larger number of
active Ru sites (e.g. B5 sites) on larger nanoparticles, as it is often proposed in the
present Literature.
Finally, the importance of the present results for practical applications is presented.
Using the 5.0 wt.% Ru/Al2O3 and the 3.6 or 5.6 wt.% Ru/zeolite catalysts with Ru
nanoparticles larger than 1 nm, CO2 methanation will start to contribute as soon as
the CO partial pressure and hence the COad coverage will drop below a critical value,
i.e., in the final part of the methanation reactor. In that case, complete removal of CO
will not be possible without contributions from CO2 methanation, and this was indeed
observed experimentally. The higher loaded Ru/zeolite catalysts showed in fact a
higher methanation reaction rate, however, on the cost of the CO selectivity. For the
2.2 wt.% Ru/zeolite catalyst, in contrast, CO2 methanation is essentially inhibited even
at very low COad coverages, due to the inherent low activity of this catalyst, and most
likely of the very small Ru NPs for dissociative adsorption of CO2 and the subsequent
methanation of the resulting COad. Hence, the mechanistic origin of the selectivity for
CO methanation is distinctly different from that on the Ru/Al2O3 catalyst. This allows
highly selective CO removal even at very low CO contents in the reformate, and
hence complete removal of CO (> 10 ppm) from CO containing feed gases for fuel
cells without measurable CO2 methanation, as long as the reaction temperature is
kept below the onset of significant CO2 dissociation. Based on the inherently low
activity for CO2 methanation, the Ru/zeolite catalyst is predicted to perform also very
well under dynamic reaction conditions, where the variation in COad coverage would
otherwise lead to substantial CO2 methanation.
As a final point, the results showed that the Ru particle size is the key to control the
CO methanation selectivity. It is therefore essential to maintain a small Ru particle
size in order to preserve a high CO selectivity during reaction. This can be achieved
by using a zeolite support where the Ru nanoparticles are mostly located inside the
pores, which slows down their agglomeration and in turn the CO2 methanation,
resulting in a high efficiency of the process. This concept is the precondition for PEM
fuel cells, since they require stable H2 purification catalysts, to prevail against
standard technologies.
5 References
141
5 References
1 W. Lubitz and W. Tumas, Chem. Rev., 107 (2007) 3900-3903.
2 K. Kochloefl, in G.Ertl, H.Knözinger, and J.Weitkamp (Eds.), Handbook of Heterogeneous
Catalysis, Vol. 2, Wiley-VCH, Weinheim, 1997.
3 S. Kawatsu, J. Power Sources, 71 (1998) 150-155.
4 D. L. Trimm and Z. I. Önsan, Catal. Rev., 43 (2001) 31-84.
5 J. R. Rostrup-Nielsen and K. Aasberg-Petersen, in W.Vielstich, H.A.Gasteiger, and A.Lamm
(Eds.), Fuel Cell technology and applications, Vol. 3, Wiley, Chichester, 2003, Ch. 14.
6 J. Sehested, S. Dahl, J. Jacobsen, and J. R. Rostrup-Nielsen, J. Phys. Chem. B, 109 (2005)
2432-2438.
7 R. M. Navarro, M. A. Pena, and J. L. G. Fierro, Chem. Rev., 107 (2007) 3952-3991.
8 D. R. Palo, R. A. Dagle, and J. D. Holladay, Chem. Rev., 107 (2007) 3992-4021.
9 O. Deutschmann and L. D. Schmidt. Two dimensional modeling of partial oxidation of methane
on rhodium in a short contact time reactor. Twenty-Seventh Symposium (International) on
Combustion/The Combustion Institute. 2283-2291. 1998
10 S. Gottesfeld and T. A. Zawodzinski, in R.C.Alkire, H.Gerischer, D.M.Kolb, and C.W.Tobias
(Eds.), Advances in Electrochemical Science and Engineering, Vol. 5, Wiley-VCH, Weinheim,
1997.
11 W. Vielstich, in A.J.Bard, M.Stratmann, and E.J.Calvo (Eds.), Encyclopedia of Electrochemistry -
Interfacial Kinetics and Mass Transport, Vol. 2, VCH, Weinheim, 2003.
12 J. R. Ladebeck and J. P. Wagner, in W.Vielstich, A.Lamm, and H.A.Gasteiger (Eds.), Handbook
of Fuel Cells - Fundamentals Technology and Applications, Vol. 3, Wiley, Chichester, 2003, Ch.
16.
13 L. Shore and R. Farrauto, in W.Vielstich, H.A.Gasteiger, and A.Lamm (Eds.), Fuel Cell
technology and applications, Vol. 3, Wiley, Chichester, 2003, Ch. 18.
14 S. Sircar and T. C. Golden, Separation Science and Technology, 35 (2000) 667-687.
15 E. Riedel, Anorganische Chemie, Walter de Gruyter, Berlin, 1994.
16 E. D. Park, D. Lee, and H. C. Lee, Catal. Today, 139 (2009) 280-290.
5 References
142
17 M. Echigo and T. Tabata, J. Chem. Eng. Japan, 37 (2004) 75-81.
18 J. R. Rostrup-Nielsen, K. Pedersen, and J. Sehested, Appl. Catal. A, 330 (2007) 134-138.
19 H. Pichler, in W.G.Frankenburg (Ed.), Adv. Catal., Academic Press, 1952.
20 V. Ponec, Catalysis Reviews, 18 (1978) 151-171.
21 G. Henrici-Olivé and S. Olivé, Angew. Chem. Int. Ed. Engl., 15 (1976) 136-141.
22 G. A. Mills and F. W. Steffgen, Catal. Rev. Sci. Eng., 8 (1974) 159-210.
23 S. S. Ranghava and R. C. E. H. Amirali, I&EC Process Design and Development, (1969) 482-
486.
24 M. A. Vannice, J. Catal., 37 (1975) 449-461.
25 M. Boudart and M. A. McDonald, J. Phys. Chem., 88 (1984) 2185-2195.
26 R. A. Dalla Betta and M. Shelef, J. Catal., 48 (1977) 111-119.
27 J. G. Ekerdt and A. T. Bell, J. Catal., 58 (1979) 170-187.
28 H. Yamasaki, K. Yoshihiro, Y. Kobori, S. Naito, T. Ohnishi, and K. Tamaru, J. Chem. Soc.
Faraday Trans. I, 77 (1980) 2913-2925.
29 R. D. Kelley and D. W. Goodman, in D.A.King and D.P.Woodruff (Eds.), Fundamental Studies of
Heterogeneous Catalysis, Vol. 4, Elsevier Scientific Publishing, Amsterdam, 1982, Ch. 10.
30 N. M. Gupta, V. S. Kamble, V. B. Kartha, R. M. Iyer, K. R. Thampi, and M. Gratzel, J. Catal., 146
(1994) 173-184.
31 N. M. Gupta, V. P. Londhe, and V. S. Kamble, J. Catal., 169 (1997) 423-437.
32 N. M. Gupta and A. K. Tripathi, Bull. Catal. Soc. India, (2003) 213-219.
33 L. Caldwell. Selectivity in Fischer-Tropsch Synthesis. 660 5 2, 1-4. 1-6-1980. South Africa,
Council for Scientific and Industrial Research.
34 C. H. Bartholomew, Catal. Lett., 7 (1990) 303-316.
35 M. P. Andersson, T. Bligaard, A. Kustov, K. E. Larsen, J. Greeley, T. Johannessen, C. H.
Christensen, and J. K. N°rskov, J. Catal., 239 (2006) 501-506.
5 References
143
36 M. P. Andersson, F. Abild-Pedersen, I. N. Remediakis, T. Bligaard, G. Jones, J. Engbæk, O.
Lytken, S. Horch, J. H. Nielsen, J. Sehested, J. R. Rostrup-Nielsen, J. K. Nørskov, and I.
Chorkendorff, J. Catal., 255 (2008) 6-19.
37 O. R. Inderwildi, S. J. Jenkins, and D. A. King, J. Phys. Chem. C, 112 (2008) 1305-1307.
38 T. Bligaard, J. K. Nørskov, S. Dahl, J. Matthiesen, C. H. Christensen, and J. Sehested, J. Catal.,
224 (2004) 206-217.
39 J. Zhang, M. B. Vukmirovic, K. Sasaki, U. N. Anand, M. Mavrikakis, and R. Adzic, J. Am. Chem.
Soc., 127 (2005) 12480-12481.
40 A. R. Dagle, Y. Wang, G.-G. Xia, J. J. Strohm, J. Holladay, and D. R. Palo, Appl. Catal. A, 326
(2007) 213-218.
41 Z. Kowalczyk, K. Stolecki, W. Rarog - Pilecka, E. Miskiewicz, E. Wiczkowska, and Z. Karpinski,
Appl. Catal. A, 342 (2008) 35-39.
42 P. Panagiotopoulou, D. I. Kondarides, and X. E. Verykios, Appl. Catal. A, 344 (2008) 45-54.
43 D. L. King and J. B. Peri, J. Catal., 79 (1979) 164-175.
44 C. S. Kellner and A. T. Bell, J. Catal., 75 (1982) 251-261.
45 M. Che and C. O. Bennet, Adv. Catal., 36 (1989) 55-172.
46 K. Asakura and Y. Iwasara, J. Chem. Soc. Faraday Trans. I, 86 (1990) 2657-2662.
47 C. Galletti, S. Specchia, G. Saracco, and V. Specchia, Chem. Engin. Sci., 65 (2010) 590-596.
48 C. Galletti, S. Specchia, and V. Specchia, Chemical Engineering Journal, 167 (2011) 616-621.
49 T. Inui, M. Funabiki, and Y. Takegami, Ind. Eng. Chem. Prod. Res. Dev., 19 (1980) 385-388.
50 M. B. I. Choudhury, S. Ahmed, and M. A. Shalabi, Appl. Catal. A, 314 (2006) 47-53.
51 P. Panagiotopoulou, D. I. Kondarides, and X. E. Verykios, Appl. Catal. B, 88 (2009) 470-478.
52 K. Urasaki, K. i. Endo, T. Takahiro, R. Kikuchi, T. Kojima, and S. Satokawa, Top. Catal., 53
(2010) 707-711.
53 V. Jimonez, P. Sanchez, P. Panagiotopoulou, J. L. Valverde, and A. Romero, Appl. Catal. A, 390
(2010) 35-44.
54 P. Djinovic, C. Galletti, S. Specchia, and V. Specchia, Catal. Today, 164 (2011) 282-287.
5 References
144
55 P. Panagiotopoulou and D. I. Kondarides, J. Catal., 225 (2004) 327-336.
56 M. Krämer, M. Duisberg, K. Stöwe, and WF. Maier, J. Catal., 251 (2007) 410-422.
57 M. Krämer, K. Stöwe, M. Duisberg, F. Müller, M. Reiser, S. Sticher, and WF. Maier, Appl. Catal.
A, 369 (2009) 42-52.
58 D. J. Elliott and J. H. Lunsford, J. Catal., 57 (1979) 11-26.
59 A. Rehmat and S. S. Randhava, Ind. Eng. Chem. Prod. Res. Dev., 9 (1970) 512-515.
60 O. Görke, P. Pfeifer, and K. Schubert, Catal. Today, 110 (2005) 132-139.
61 V. P. Londhe, V. S. Kamble, and N. M. Gupta, J. Mol. Catal. A, 121 (1997) 33-44.
62 D. Li, N. Ichikuni, S. Shimazu, and T. Uematsu, Appl. Catal. A, 180 (1999) 227-235.
63 M. P. Andersson, T. Bligaard, A. Kustov, K. E. Larsen, J. Greeley, T. Johannessen, C. H.
Christensen, and J. K. Nørskov, J. Catal., 239 (2006) 501-506.
64 O. Inderwildi and P. Jenkins, Chem. Soc. Rev., 37 (2008) 2274-2309.
65 M. W. McQuire and C. H. Rochester, J. Catal., 141 (1993) 355-367.
66 H. H. Nijs and P. A. Jacobs, J. Catal., 66 (1980) 401-411.
67 D. W. Goodman, R. D. Kelley, T. E. Madey, and J. T. Yates, J. Catal., 63 (1980) 226-234.
68 H. P. Bonzel and H. J. Krebs, Surf. Sci., 91 (1980) 499-513.
69 A. T. Bell, Cat. Rev. Sci. Eng., 23 (1981) 203-232.
70 R. D. Kelley and D. W. Goodman, Surf. Sci., 123 (1982) L743-L749.
71 I. A. Fisher and A. T. Bell, J. Catal., 162 (1996) 54-65.
72 O. Inderwildi, Jenkins.J.S., and D. King, Angew. Chem. Int. Ed., 47 (2008) 5253-5255.
73 M. R. Prairie, A. Renken, J. G. Highfield, K. R. Thampi, and M. Grätzel, J. Catal., 129 (1991) 130-
144.
74 L. F. Liotta, G. A. Martin, and G. Deganello, J. Catal., 164 (1996) 322-333.
75 Y. Traa and Weitkamp J., Chem. Eng. Technol., 21 (1999) 291-293.
76 K. Yaccato, R. Carhart, A. Hagemeyer, A. Lesik, P. Strasser, A. F. Volpe jr., H. Turner, H.
Weinberg, R. K. Graselli, and C. Brooks, Appl. Catal. A, 296 (2005) 30-48.
5 References
145
77 J.-N. Park and E. W. McFarland, J. Catal., 266 (2009) 92-97.
78 H. Y. Kim, H. M. Lee, and J.-N. Park, J. Phys. Chem., 114 (2010) 7128-7131.
79 S. Scirè, C. Crisafulli, R. Maggiore, S. Minico, and S. Galvagno, Catal. Lett., 51 (1998) 41-45.
80 R. Burch, Phys. Chem. Chem. Phys., 8 (2006) 5483-5500.
81 O. Levenspiel, Chemical Reaction Engineering, Wiley & Sons, New York, 1972.
82 M. J. Kahlich. Untersuchungen zur selektiven CO-Oxidation an geträgerten
Edelmetallkatalysatoren in einem Gasphasenreaktorsystem mit on-line Analytik (1996)
Universität Ulm.
83 M. J. Kahlich. CO-Feinreinigung H2-reicher Reformergase durch selektive Oxidation an
geträgerten Edelmetallkatalysatoren: Kinetische Untersuchungen und Reaktoredesign-
Berechnungen(2000) Universität. Ulm.
84 M. M. Schubert. In-situ DRIFTS (diffuse reflectance infrared Fourier transform spectroscopy)
Messungen zur Charakterisierung der selektiven CO- Oxidation in H2-reichem Gas (2000)
University of Ulm.
85 S. Hackenberg. Untersuchungen zum Einfluß von Kalium und Cadmium auf die Formierung und
katalytische Aktivität SiO2 geträgerter Palladiumkatalysatoren bei der Totaloxidation von Ethylen
(2002) Universität Ulm.
86 R. Leppelt. Untersuchungen zur Wasser-Gas-Shift-Reaktion bei tiefen Temperaturen an
geträgerten Goldkatalysatoren (2002) Universität Ulm.
87 Z. Liu, L. M. Gan, L. Hong, W. Chen, and J. Y. Lee, J. Power Sources, 139 (2005) 73-78.
88 Handbook of Heterogeneous Catalysis, VCH-Wiley, Weinheim, 1997.
89 J. W. Niemantsverdriet, Spectroscopy in Catalysis - An Introduction -, VCH, Weinheim, 1993.
90 S. V. Thomas and V. I. Birss, J. Electrochem. Soc., 144 (1997) 1353-1362.
91 D. Briggs and M. P. Seah, Practical Surface Analysis - Auger and X-Ray Photoelectron
Spectroscopy, 2nd ed., John Wiley & Sons, Chichester, 1990.
92 G. A. Somorjai, Introduction to Surface Science and Catalysis, John Wiley and Sons, New York,
1994.
93 J. F. Moulder, W. F. Stickle, P. E. Sobol, and K. D. Bomben, Handbook of X-ray Photoelectron
Spectroscopy, Perkin Elmer Corp., Eden Prairie/USA, 1992.
5 References
146
94 J. C. Fuggle, T. E. Madey, M. Steinkilberg, and D. Menzel, Surf. Sci., 52 (1975) 521-541.
95 R. Nyholm and N. Martensson, J. Phys. C. Solid State Phys., 13 (1980) L279-L284.
96 R. A. Dalla Betta, J. Phys. Chem., 79 (1975) 2519-2525.
97 G. Bergeret and P. Gallezot, in G.Ertl, H.Knözinger, and J.Weitkamp (Eds.), Handbook of
Heterogeneous Catalysis, Vol. 2, Wiley-VCH, Weinheim, 1997.
98 R. A. D. Betta, J. Catal., 34 (1974) 57-60.
99 T. Armaroli, T. Bécu, and S. Gautier, Oil&Gas Science and Technology, 59 (2004) 215-237.
100 P. Kubelka and F. Munk, Z. Tech. Phys., 11 (1931) 593-601.
101 J. Sirita, S. Phanichphant, and F. C. Meunier, Anal. Chem., 79 (2007) 3912-3918.
102 I. M. Hamadeh and P. R. Griffiths, Appl. Spectrosc., 41 (1987) 682-688.
103 M. Vaarkamp and D. C. Koningsberger, in G.Ertl, E.Knözinger, and Weitkamp J. (Eds.),
Handbook of Heterogeneous Catalysis, Vol. 2, Wiley - VCH, Weinheim, 1997, Ch. 3.1.3.2.
104 K. Wille, Physik der Teilchenbeschleuniger und Synchrotronstrahlungsquellen, Teubner
Studienbücher, Stuttgart, 1996, Ch. 2.2.
105 Graph. www.psi.ch (2011)
106 J. A. van Bokhoven, T. Ressler, F. M. F. De Groot, and G. Knop-Gericke, in B.M.Weckhuysen
(Ed.), In-situ Spectroscopy of Catalysts, American Scientific Publishers, 2004, Ch. 26.
107 K. Getty, M. U. Delgado-Jaime, and P. Kennepohl, Inorg. Chim. Acta, 361 (2008) 1059-1065.
108 D. C. Koningsberger, B. L. Mojet, G. E. van Dorssen, and D. E. Ramaker, Top. Catal., 10 (2000)
143-155.
109 J. J. Rehr and R. C. Albers, Rev. Mod. Phys., 72 (2000) 621-654.
110 A. L. Ankudinov, B. Ravel, J. J. Rehr, and S. D. Conradson, Phys. Rev. B, 58 (1998) 7565-7576.
111 E. Bus, J. T. Miller, A. J. Kropf, R. Prins, and J. A. van Bokhoven, Phys. Chem. Chem. Phys., 8
(2006) 3248-3258.
112 V. Kröger, T.Kanerva, U. Lassi, K. Rahkamaa-Tolonen, T. Lepistö, and R. L. Keiski, Top. Catal.,
42 – 43 (2007) 433-436.

5 References
147
113 O. Korkuna, R. Leboda, J. Skubiszewska-Zie,ba, T. Vrublevs'ka, V. M. Gun'ko, and J.
Ryczkowski, Micropor. Mesopor. Mater., 87 (2006) 243-254.
114 H. T. Wang, Y. W. Chen, and J. G. Goodwin, Zeolites, 4 (1984) 56-60.
115 T. J. McCarthy, C. M. P. Marques, H. Trevino, and W. M. H. Sachtler, Catal. Lett., 43 (1997) 11-
18.
116 S. Eckle, H.-G. Anfang, and R. J. Behm, Appl. Catal. A, 391 (2011) 325-333.
117 A. M. Karim, V. Prasad, G. Mpourmpakis, W. W. Lonergan, A. I. Frenkel, J. G. Chen, and D. G.
Vlachos, J. Am. Chem. Soc., 191 (2009) 12230-12239.
118 S. Eckle. Untersuchungen zu Kinetik und Mechanismus der Selektiven Methanisierung von CO
auf geträgerten Ru Katalysatoren. (2008) Universität Ulm
119 I.-G. Bajusz and J. G. Goodwin Jr., J. Catal., 169 (1997) 157-165.
120 Y. Men, G. Kolb, R. Zapf, V. Hessel, and H. Löwe, Catal. Today, 125 (2007) 81-87.
121 S. Fujita and T. Notbutsune, Chem. Engin. J., 68 (1997) 63-68.
122 V. P. Londhe and N. M. Gupta, J. Catal., 169 (1997) 415-422.
123 S. Takenaka, T. Shimizu, and K. Otsuka, Int. J. Hydrogen Energy, 29 (2004) 1065-1073.
124 Z. Z. Lin, T. Okuhara, M. Misono, K. Tohji, and Y. Udagawa, J. Chem. Soc. Chem. Commun.,
(1986) 1673-1675.
125 T. Iwasita-Vielstich, in H.Gerischer and C.W.Tobias (Eds.), Advances in Electrochemical Science
and Engineering, VCH Verlagsgesellschaft, Weinheim, 1990.
126 R. L. Gorring and A. J. de Rosset, J. Catal., 3 (1964) 341-352.
127 D. L. King, J. Catal., 51 (1978) 386-397.
128 R. A. Dalla Betta, A. G. Piken, and M. Shelef, J. Catal., 35 (1974) 54-60.
129 H. Knözinger, Y. Zhao, B. Tesche, R. Barth, R. Epstein, B. C. Gates, and J. P. Scott, Faraday
Discuss., 72 (1981) 53-74.
130 J. Zhang, M. Li, Z. Feng, J. Chen, and C. Li, J. Phys. Chem. B, 110 (2006) 927-935.
131 E. Guglielminotti, A. Zecchina, A. Bossi, and M. Camia, J. Catal., 74 (1982) 240-251.
132 R. D. Gonzalez and M. F. Brown, J. Phys. Chem., 80 (1976) 1731.
5 References
148
133 A. A. Davydov and A. T. Bell, J. Catal., 49 (1977) 332-344.
134 F. Solymosi and J. Raskó, J. Catal., 15 (1989) 107-119.
135 G. H. Yokomizo, C. Louis, and A. T. Bell, J. Catal., 120 (198) 1-14.
136 E. Guglielminotti and G. C. Bond, J. Chem. Soc. Faraday Trans. I, 86 (1990) 979-987.
137 N. M. Gupta, V. S. Kamble, R. M. Iyer, T. Ravindranathan, and M. Grätzel, J. Catal., 137 (1992)
473-486.
138 S. ZH. Todorova and G. B. Kadinov, Res. Chem. Intermed., 28 (2002) 291-301.
139 H. Pfnür, D. Menzel, F. M. Hoffmann, A. Ortega, and A. M. Bradshaw, Surf. Sci., 93 (1980) 431-
452.
140 J. Assmann, E. Loffler, A. Birkner, and M. Muhler, Catal. Today, 85 (2003) 235-249.
141 H. Knözinger and P. Ratnasamy, Catal. Rev., 17 (1978) 31-70.
142 S. T. Yong, K. Hidajat, and S. Kawi, J. Power Sources, 131 (2004) 91-95.
143 C. S. Kellner and A. T. Bell, J. Catal., 71 (1981) 296.
144 F. Solymosi, A. Erdöhelyi, and M. Kocsis, J. Catal., 65 (1980) 428-436.
145 V. Sanchez-Escribando, M. A. Larrubia Vargas, E. Finocchio, and G. Busca, Appl. Catal. A,
(2007) 68-74.
146 T. Yamada and K.-I. Tanaka, J. Am. Chem. Soc., 113 (1991) 1173-1176.
147 C. K. Rofer-DePoorter, Chem. Rev., 81 (1981) 447-474.
148 M. Marwood, R. Doepper, and A. Renken, Appl. Catal. A, 151 (1997) 223-246.
149 R. Leppelt, B. Schumacher, V. Plzak, M. Kinne, and R. J. Behm, J. Catal., 244 (2006) 137-152.
150 A. S. Wexler, Spectrochim. Acta, 21 (1965) 1725-1742.
151 K. Yokota, M. Fukui, and T. Tanaka, Appl. Surf. Sci., 121/122 (1997) 273-277.
152 F. Solymosi, A. Erdöhelyi, and T. Bansagi, J. Catal., 68 (1981) 371-382.
153 W. J. Mitchell, Y. Wang, J. Xie, and W. H. Weinberg, J. Am. Chem. Soc., 115 (1993) 4381-4382.
154 M. Wu, D. W. Goodman, and G. W. Zajac, Catal. Lett., 24 (1994) 23-30.
5 References
149
155 C. G. Visconti, L. Lietti, E. Tronconi, P. Forzatti, R. Zennaro, and E. Finocchio, Appl. Catal. A,
355 (2009) 61-68.
156 N. M. Gupta, V. S. Kamble, R. M. Iyer, K. Ravindranathan Thampi, and M. Grätzel, Catal. Lett.,
21 (1993) 245-255.
157 C. Schild, A. Wokaun, and A. Baiker, Journal of Molecular Catalysis, 69 (1991) 347-357.
158 K. Christmann, Progr. Surf. Sci., 48 (1995) 15-26.
159 N. Bronstedt, Chem. Rev., 5 (1928) 231-338.
160 M. G. Evans and N. P. Polanyi, Trans. Faraday Soc., 34 (1938) 11-29.
161 B. Hammer and J. K. Nørskov, Surf. Sci., 343 (1995) 211-220.
162 B. Hammer and J. K. Nørskov, Adv. Catal., 45 (2000) 71-129.
163 R. J. Davis, J. Catal., 216 (2003) 396-405.
164 R. van Hardeveld and F. Hartog, Surf. Sci., 15 (1969) 189-230.
165 C. J. H. Jacobsen, S. Dahl, P. L. Hansen, E. Törnqvist, L. Jensen, H. Topsøe, D. V. Prip, P. B.
Møenshaug, and I. Chorkendorff, J. Mol. Catal. A, 163 (2000) 19-26.
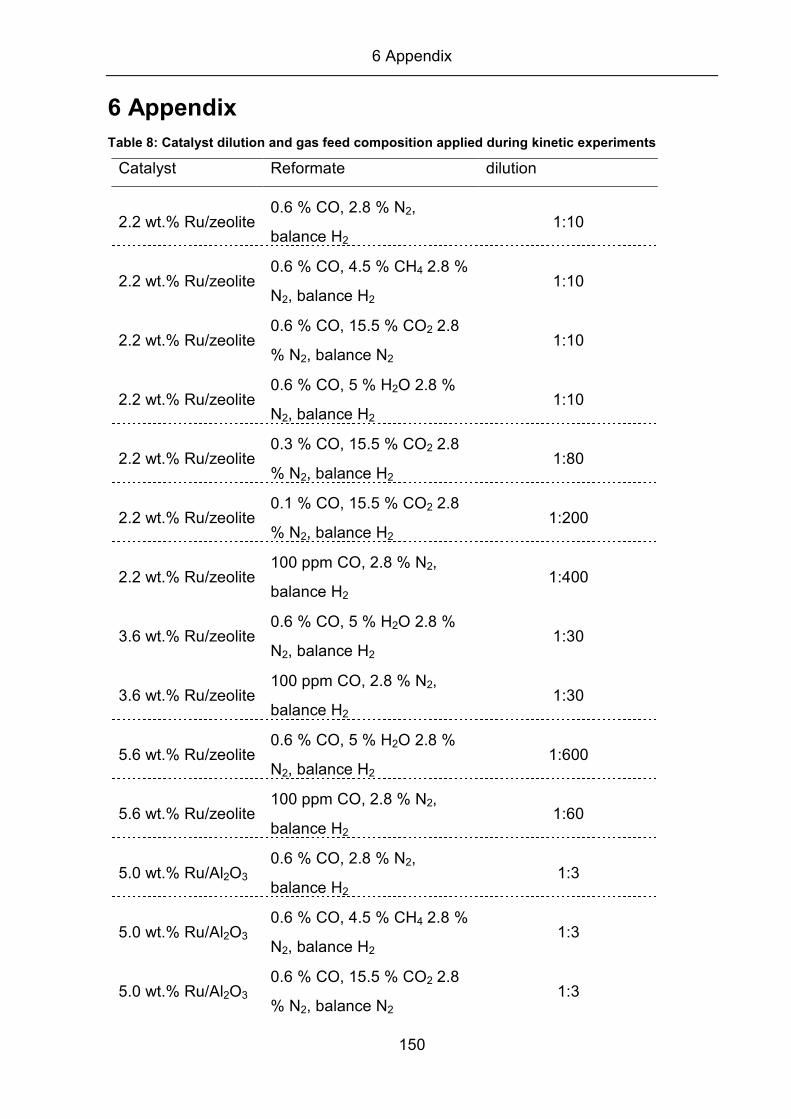
6 Appendix
150
6 Appendix
Table 8: Catalyst dilution and gas feed composition applied during kinetic experiments
Catalyst Reformate dilution
2.2 wt.% Ru/zeolite 0.6 % CO, 2.8 % N2,
balance H2 1:10
2.2 wt.% Ru/zeolite 0.6 % CO, 4.5 % CH4 2.8 %
N2, balance H2 1:10
2.2 wt.% Ru/zeolite 0.6 % CO, 15.5 % CO2 2.8
% N2, balance N2 1:10
2.2 wt.% Ru/zeolite 0.6 % CO, 5 % H2O 2.8 %
N2, balance H2 1:10
2.2 wt.% Ru/zeolite 0.3 % CO, 15.5 % CO2 2.8
% N2, balance H2 1:80
2.2 wt.% Ru/zeolite 0.1 % CO, 15.5 % CO2 2.8
% N2, balance H2 1:200
2.2 wt.% Ru/zeolite 100 ppm CO, 2.8 % N2,
balance H2 1:400
3.6 wt.% Ru/zeolite 0.6 % CO, 5 % H2O 2.8 %
N2, balance H2 1:30
3.6 wt.% Ru/zeolite 100 ppm CO, 2.8 % N2,
balance H2 1:30
5.6 wt.% Ru/zeolite 0.6 % CO, 5 % H2O 2.8 %
N2, balance H2 1:600
5.6 wt.% Ru/zeolite 100 ppm CO, 2.8 % N2,
balance H2 1:60
5.0 wt.% Ru/Al2O3 0.6 % CO, 2.8 % N2,
balance H2 1:3
5.0 wt.% Ru/Al2O3 0.6 % CO, 4.5 % CH4 2.8 %
N2, balance H2 1:3
5.0 wt.% Ru/Al2O3 0.6 % CO, 15.5 % CO2 2.8
% N2, balance N2 1:3
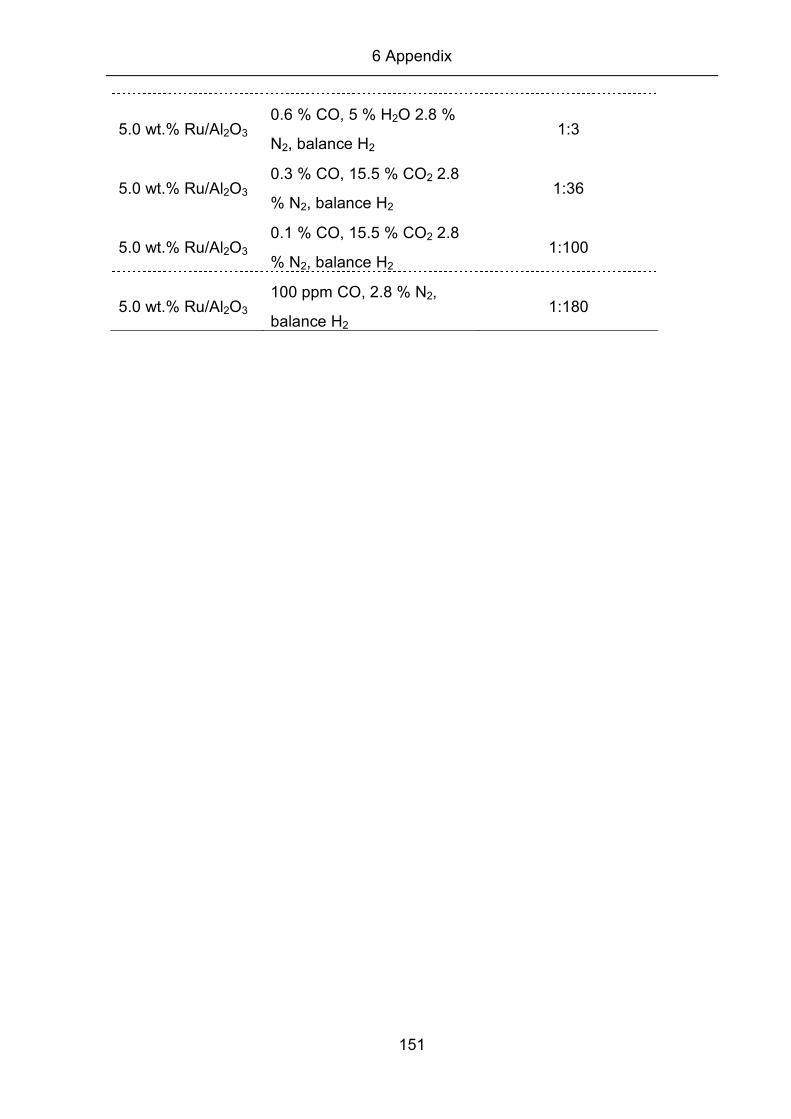
6 Appendix
151
5.0 wt.% Ru/Al2O3 0.6 % CO, 5 % H2O 2.8 %
N2, balance H2 1:3
5.0 wt.% Ru/Al2O3 0.3 % CO, 15.5 % CO2 2.8
% N2, balance H2 1:36
5.0 wt.% Ru/Al2O3 0.1 % CO, 15.5 % CO2 2.8
% N2, balance H2 1:100
5.0 wt.% Ru/Al2O3 100 ppm CO, 2.8 % N2,
balance H2 1:180
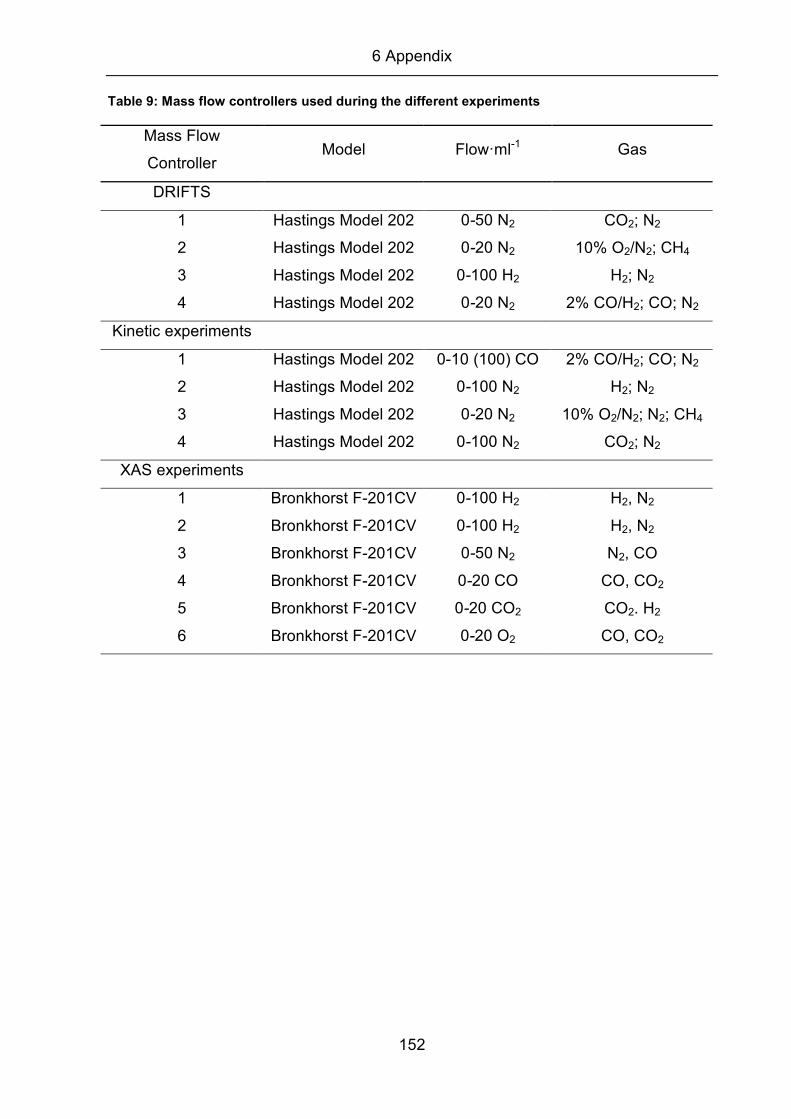
6 Appendix
152
Table 9: Mass flow controllers used during the different experiments
Mass Flow
Controller Model Flow�ml-1 Gas
DRIFTS
1 Hastings Model 202 0-50 N2 CO2; N2
2 Hastings Model 202 0-20 N2 10% O2/N2; CH4
3 Hastings Model 202 0-100 H2 H2; N2
4 Hastings Model 202 0-20 N2 2% CO/H2; CO; N2
Kinetic experiments
1 Hastings Model 202 0-10 (100) CO 2% CO/H2; CO; N2
2 Hastings Model 202 0-100 N2 H2; N2
3 Hastings Model 202 0-20 N2 10% O2/N2; N2; CH4
4 Hastings Model 202 0-100 N2 CO2; N2
XAS experiments
1 Bronkhorst F-201CV 0-100 H2 H2, N2
2 Bronkhorst F-201CV 0-100 H2 H2, N2
3 Bronkhorst F-201CV 0-50 N2 N2, CO
4 Bronkhorst F-201CV 0-20 CO CO, CO2
5 Bronkhorst F-201CV 0-20 CO2 CO2. H2
6 Bronkhorst F-201CV 0-20 O2 CO, CO2
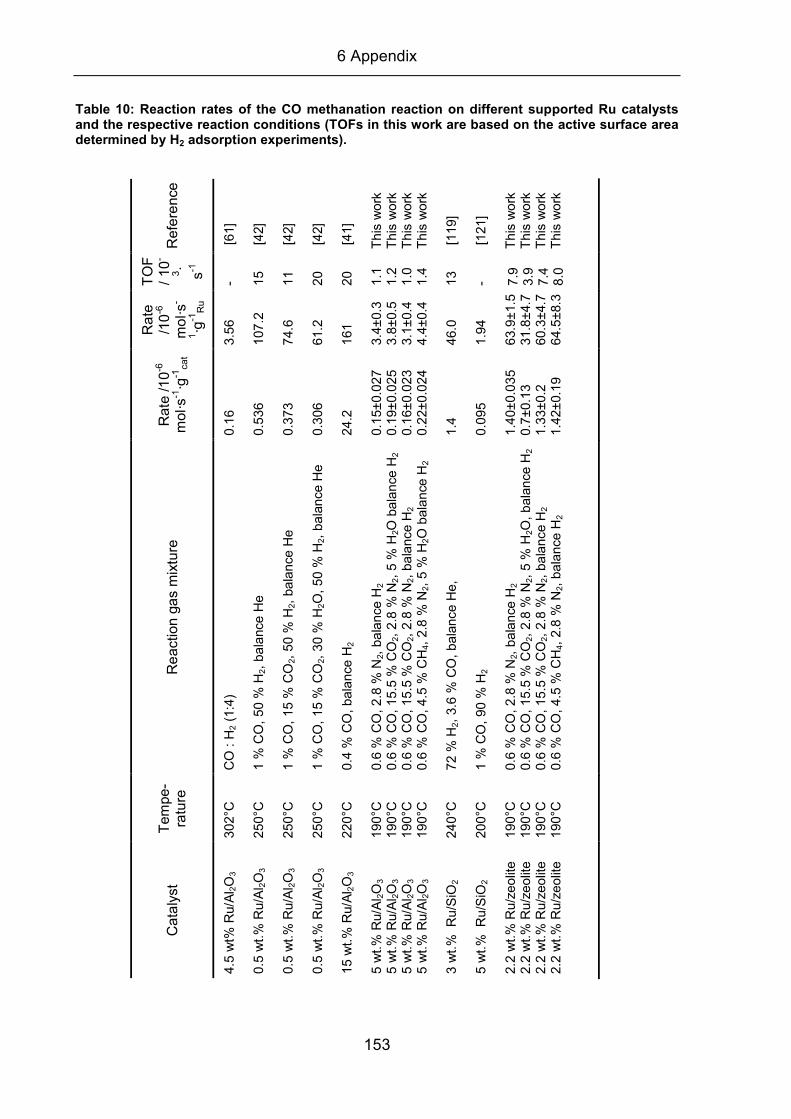
6 Appendix
153
Table 10: Reaction rates of the CO methanation reaction on different supported Ru catalysts and the respective reaction conditions (TOFs in this work are based on the active surface area determined by H2 adsorption experiments).
Ca
taly
st
Tem
pe
-ra
ture
R
ea
ctio
n g
as
mix
ture
R
ate
/1
0-6
m
ol�s
-1�g
-1ca
t
Ra
te
/10
-6
mo
l�s-
1�g
-1R
u
TO
F
/ 1
0-
3�
s-1
Re
fere
nce
4.5
wt%
Ru/A
l 2O
3
30
2°C
C
O :
H2 (
1:4
)
0.1
6
3.5
6
- [
61]
0.5
wt.
% R
u/A
l 2O
3
25
0°C
1
% C
O,
50 %
H2,
ba
lance
He
0
.53
6
107
.2
15
[
42]
0.5
wt.
% R
u/A
l 2O
3
25
0°C
1
% C
O,
15 %
CO
2, 5
0 %
H2,
ba
lan
ce H
e
0.3
73
7
4.6
1
1
[4
2]
0.5
wt.
% R
u/A
l 2O
3
25
0°C
1
% C
O,
15 %
CO
2, 3
0 %
H2O
, 5
0 %
H2,
ba
lan
ce H
e
0.3
06
6
1.2
2
0
[4
2]
15
wt.
% R
u/A
l 2O
3
22
0°C
0
.4 %
CO
, b
ala
nce
H2
24
.2
161
2
0
[4
1]
5 w
t.%
Ru/A
l 2O
3
5 w
t.%
Ru/A
l 2O
3
5 w
t.%
Ru/A
l 2O
3
5 w
t.%
Ru/A
l 2O
3
19
0°C
1
90
°C
19
0°C
1
90
°C
0.6
% C
O, 2
.8 %
N2,
ba
lan
ce H
2
0.6
% C
O, 1
5.5
% C
O2, 2
.8 %
N2,
5 %
H2O
ba
lan
ce H
2
0.6
% C
O, 1
5.5
% C
O2, 2
.8 %
N2,
ba
lan
ce H
2
0.6
% C
O, 4
.5 %
CH
4,
2.8
% N
2,
5 %
H2O
ba
lan
ce H
2
0.1
5±
0.0
27
0
.19
±0.0
25
0
.16
±0.0
23
0
.22
±0.0
24
3.4
±0.3
3
.8±
0.5
3
.1±
0.4
4
.4±
0.4
1.1
1
.2
1.0
1
.4
Th
is w
ork
T
his
wo
rk
Th
is w
ork
T
his
wo
rk
3 w
t.%
R
u/S
iO2
24
0°C
7
2 %
H2,
3.6
% C
O,
ba
lan
ce H
e,
1
.4
46.0
1
3
[1
19]
5 w
t.%
R
u/S
iO2
20
0°C
1
% C
O,
90 %
H2
0.0
95
1
.94
-
[1
21]
2.2
wt.
% R
u/z
eo
lite
2
.2 w
t.%
Ru
/ze
olit
e
2.2
wt.
% R
u/z
eo
lite
2
.2 w
t.%
Ru
/ze
olit
e
19
0°C
1
90
°C
19
0°C
1
90
°C
0.6
% C
O, 2
.8 %
N2,
ba
lan
ce H
2
0.6
% C
O, 1
5.5
% C
O2, 2
.8 %
N2,
5 %
H2O
, b
ala
nce
H2
0.6
% C
O, 1
5.5
% C
O2, 2
.8 %
N2,
ba
lan
ce H
2
0.6
% C
O, 4
.5 %
CH
4,
2.8
% N
2,
ba
lan
ce H
2
1.4
0±
0.0
35
0
.7±
0.1
3
1.3
3±
0.2
1
.42
±0.1
9
63.9
±1.
5
31.8
±4.
7
60.3
±4.
7
64.5
±8.
3
7.9
3
.9
7.4
8
.0
Th
is w
ork
T
his
wo
rk
Th
is w
ork
T
his
wo
rk
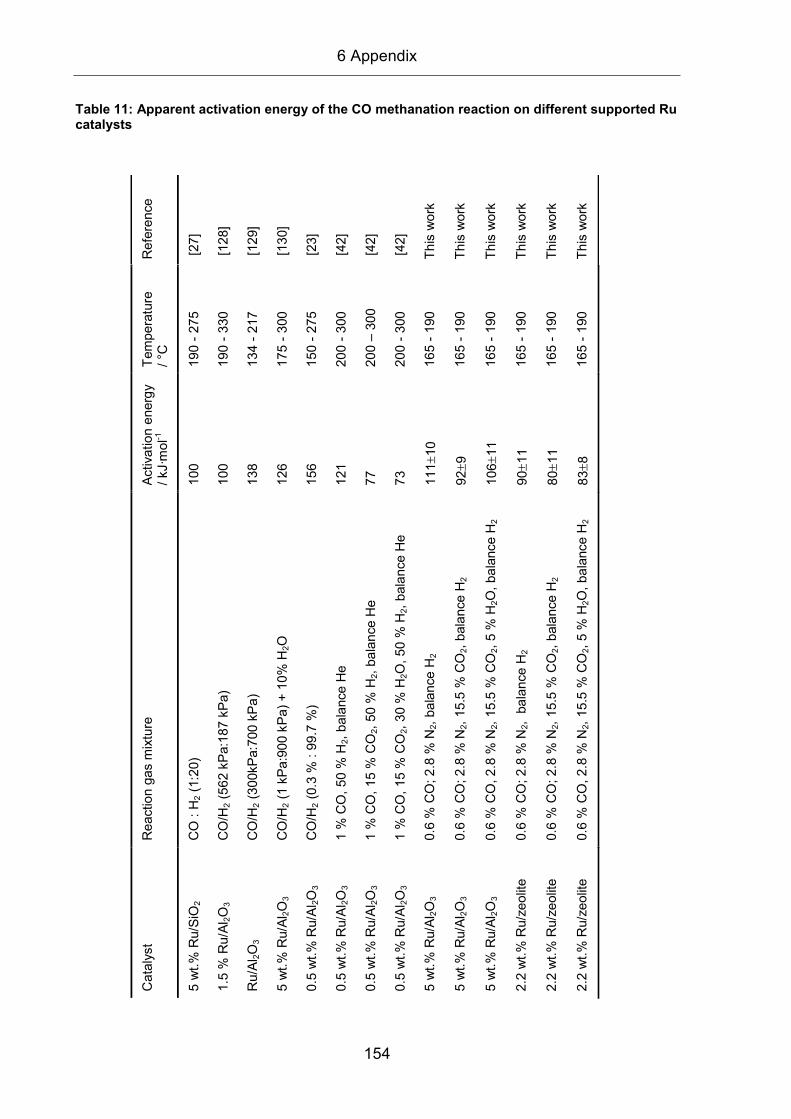
6 Appendix
154
Table 11: Apparent activation energy of the CO methanation reaction on different supported Ru catalysts
C
ata
lyst
R
ea
ctio
n g
as
mix
ture
A
ctiv
atio
n e
nerg
y
/ kJ
�mo
l-1
Tem
pe
ratu
re
/ °C
R
efe
ren
ce
5 w
t.%
Ru/S
iO2
C
O :
H2 (
1:2
0)
1
00
1
90
- 2
75
[
27]
1.5
% R
u/A
l 2O
3
CO
/H2 (
56
2 k
Pa:1
87
kP
a)
10
0
19
0 -
330
[
12
8]
Ru
/Al 2
O3
CO
/H2 (
30
0kP
a:7
00 k
Pa
) 1
38
1
34
- 2
17
[
12
9]
5 w
t.%
Ru/A
l 2O
3
CO
/H2 (
1 k
Pa
:90
0 k
Pa)
+ 1
0%
H2O
1
26
1
75
- 3
00
[
13
0]
0.5
wt.
% R
u/A
l 2O
3
CO
/H2 (
0.3
% : 9
9.7
%)
1
56
1
50
- 2
75
[
23]
0.5
wt.
% R
u/A
l 2O
3
1 %
CO
, 5
0 %
H2,
ba
lance
He
1
21
2
00
- 3
00
[
42]
0.5
wt.
% R
u/A
l 2O
3
1 %
CO
, 1
5 %
CO
2, 5
0 %
H2,
ba
lan
ce H
e
77
2
00
– 3
00
[
42]
0.5
wt.
% R
u/A
l 2O
3
1 %
CO
, 1
5 %
CO
2, 3
0 %
H2O
, 5
0 %
H2,
bala
nce
He
7
3
20
0 -
300
[
42]
5 w
t.%
Ru/A
l 2O
3
0.6
% C
O; 2
.8 %
N2,
ba
lan
ce H
2 1
11±1
0
16
5 -
190
T
his
wo
rk
5 w
t.%
Ru/A
l 2O
3
0.6
% C
O; 2
.8 %
N2,
15.5
% C
O2,
bala
nce
H2
92±9
1
65
- 1
90
T
his
wo
rk
5 w
t.%
Ru/A
l 2O
3
0.6
% C
O, 2
.8 %
N2,
15.5
% C
O2,
5 %
H2O
, b
ala
nce
H2
10
6±1
1
16
5 -
190
T
his
wo
rk
2.2
wt.
% R
u/z
eo
lite
0.6
% C
O; 2
.8 %
N2,
ba
lan
ce H
2
90±1
1
16
5 -
190
T
his
wo
rk
2.2
wt.
% R
u/z
eo
lite
0.6
% C
O; 2
.8 %
N2,
15.5
% C
O2,
bala
nce
H2
80±1
1
16
5 -
190
T
his
wo
rk
2.2
wt.
% R
u/z
eo
lite
0.6
% C
O, 2
.8 %
N2,
15.5
% C
O2,
5 %
H2O
, b
ala
nce
H2
83±8
1
65
- 1
90
T
his
wo
rk
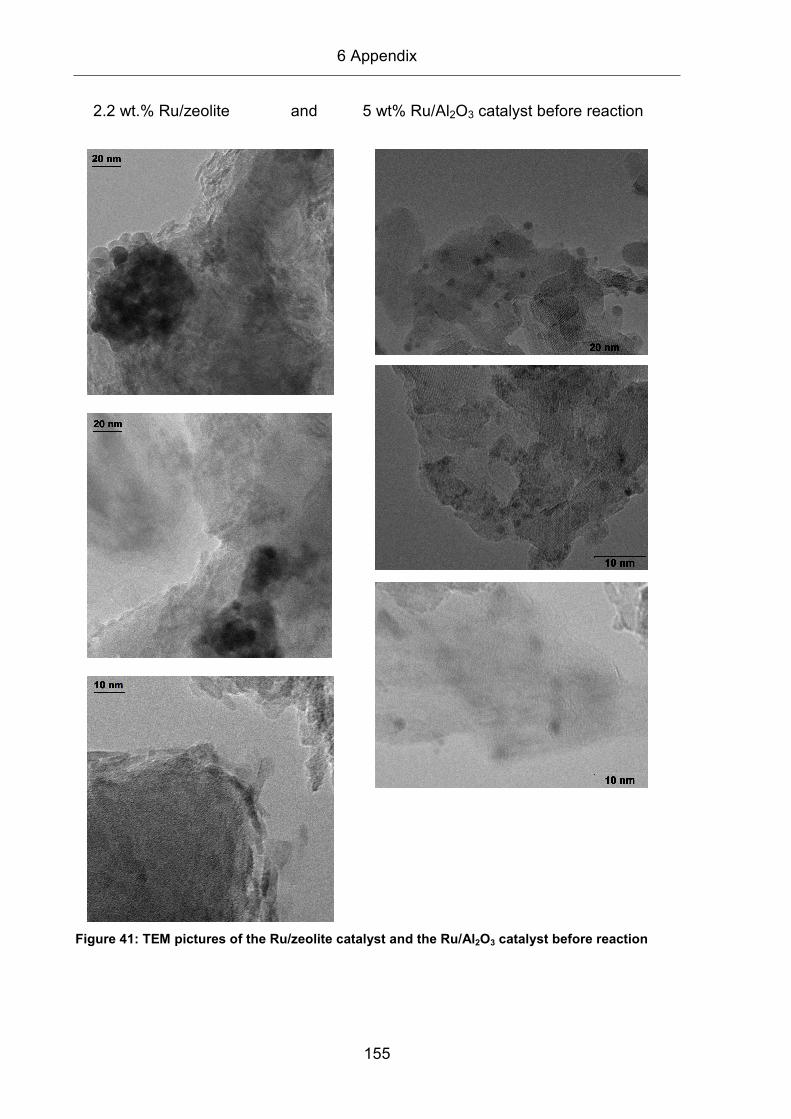
6 Appendix
155
2.2 wt.% Ru/zeolite and 5 wt% Ru/Al2O3 catalyst before reaction
Figure 41: TEM pictures of the Ru/zeolite catalyst and the Ru/Al2O3 catalyst before reaction
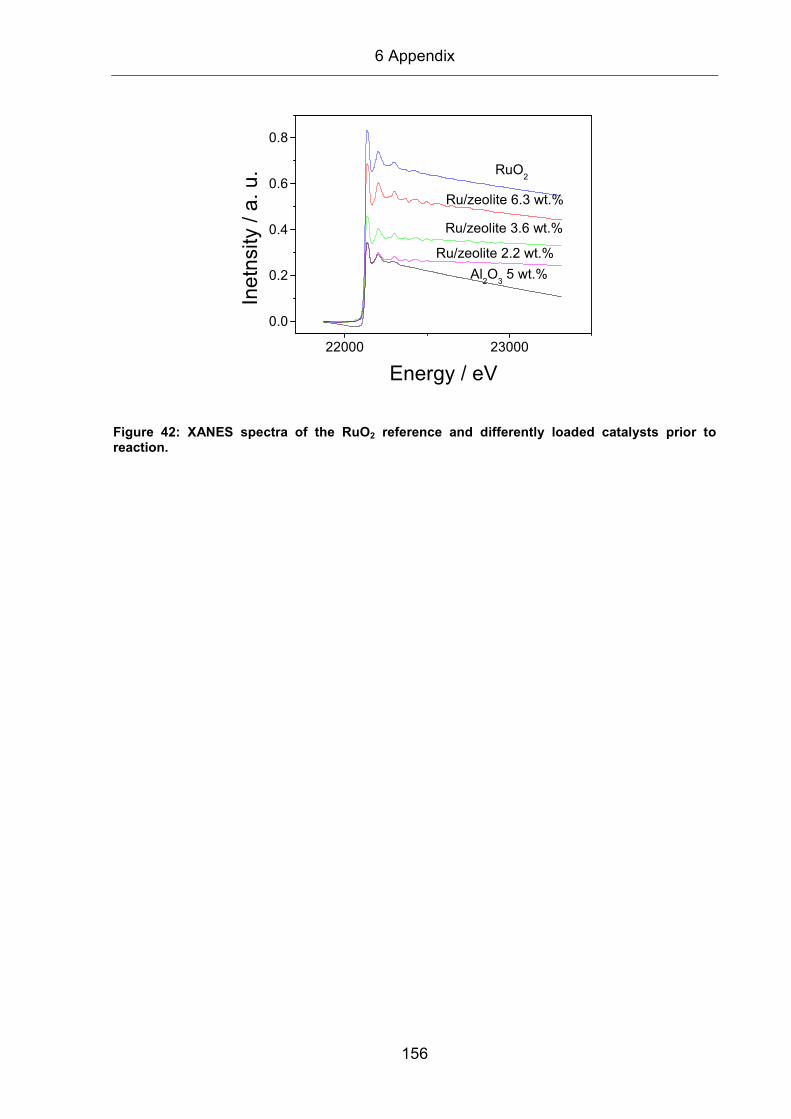
6 Appendix
156
22000 23000
0.0
0.2
0.4
0.6
0.8
Ru/zeolite 2.2 wt.%
RuO2
Ru/zeolite 6.3 wt.%
Ru/zeolite 3.6 wt.%
Al2O
3 5 wt.%
Ine
tnsi
ty /
a.
u.
Energy / eV
Figure 42: XANES spectra of the RuO2 reference and differently loaded catalysts prior to reaction.
6 Appendix
157
6.1 German Summary
In der vorliegenden Arbeit habe ich Ergebnisse zum Mechanismus der selektiven
Methanisierung von CO über geträgerte Ru Katalysatoren aus kinetischen, in situ IR
spektroskopischen und in situ XAS Messungen beschrieben. Während dieser
Dissertation konnte ich die Röntgen Absorptionspektroskopie als
Charakterisierungsmethode einführen und im Zuge dessen, zur Durchführung von
XAS Messungen, als Teil dieser Arbeit eine Messzelle mit portabler Gasmischeinheit
konstruiert. Die am Synchrotron durchgeführten XAS Messungen zeigten dabei
Änderungen der mittleren Koordinationszahl und des Oxidationszustandes von Ru.
Diese Ergebnisse ermöglichten die Bestimmung und die Beobachtung der Änderung
der mittleren Ru Partikelgröße während der Reaktion und dadurch deren Korrelation
zur Aktivität und CO Selektivität. Während dieser Arbeit wurden folgende Ergebnisse
erhalten:
(I) Die Katalysatoren wiesen unterschiedliche mittlere Ru Nanopartikelgrößen
auf, welche im Falle der 2.2, 3.6 und 5.6 Gew.% Ru/Zeolith Katalysatoren (d= 0.9,
1.6 und 1.9 nm) durch in situ EXAFS Messungen und im Falle des 5.0 Gew.%
Ru/Al2O3 Katalysators (d= 2.3 nm) durch TEM und in situ EXAFS Messungen
erhalten wurden. Standard Charakterisierungsmethoden wie TEM oder XRD führten
bei den Ru/Zeolith Katalysatoren zu unrealistischen Ru Partikelgrößen, da sich der
Träger unter dem fokusierten Elektronenstrahl zersetzte und dadurch eine
Auswertung der Partikelgrößen unmöglich wurde, bzw. die Koexistenz sehr großer
Nanopartikel das Signal der kleinen im XRD überlagerte. Da jedoch die
Partikelgrößen des Ru/Al2O3 Katalysators aus den TEM Messungen mit denen aus
den EXAFS Messungen übereinstimmten, konnte davon ausgegangen werden, dass
Auswertung der Partikelgrößen aus den EXAFS Messungen korrekt erfolgt ist. Die
Ru Nanopartikel werden für die Ru/Zeolith Katalysatoren in den Poren vermutet, da
die mittlere Ru Partikelgröße des 2.2 Gew.% Ru/Zeolith Katalysators ungefähr mit
der Porengröße des Trägers übereinstimmte. Weiterhin wies der Katalysator eine viel
geringere XPS Intensität im Vergleich zu dem Ru/Al2O3, Katalysator auf, was als
zusätzlicher Hinweis für die Einlagerung der Ru Partikel in die Poren des Zeolithen
gewertet werden kann. Die zunehmende Größe der Ru Nanopartikel auf den Zeolith
Katalysatoren mit höherer Beladung wurde einer zunehmenden Anzahl von größeren
Ru Partikeln auf der äußeren Oberfläche des Zeolithen zugeschrieben.
6 Appendix
158
(II) Sowohl der Ru/Al2O3, als auch der Ru/Zeolith Katalysator sind für die selektive
CO Methanisierung aktiv. Die Aktivität der CO2 Methanisierung hängt sowohl vom
Katalysator als auch von der Ru Partikelgröße ab. Integrale Messungen zeigten für
den 2.2 Gew.% Ru/Zeolith Katalysator eine um 20°C niedrigere Reaktionstemperatur
(190°C) für den Vollumsatz von CO im Vergleich zu dem 5 Gew.% Ru/Al2O3
Katalysator, welcher Vollumsatz erst bei 210°C aufwies. Zusätzlich war der
Ru/Zeolith Katalysator bei dieser Temperatur auch in semirealistischen Reformaten
(H2/CO/CO2) 100% CO selektiv. CO2 wurde hier nur bei sehr viel höheren
Temperaturen zu einem merklichen Anteil umgesetzt, wobei 50% CO2 Umsatz bei
330°C und Vollumsatz erst bei 410°C beobachtet wurde, sogar dann, wenn kein CO
in der Gasphase vorhanden war (CO2/H2). Der Ru/Al2O3 Katalysator zeigte
Vollumsatz von CO2 in semirealistischen Reformaten (H2/CO/CO2) schon bei 230°C.
Zusätzlich wies dieser Katalysator für die CO2 Methanisierung in CO freien
Gasgemischen (CO2/H2) das gleiche charakteristische Temperaturprofil auf, wie es
bei der CO Methanisierung beobachtet wurde, was auf unselektive aktive Zentren
hindeutet, die sowohl CO als auch CO2 mit nahezu gleicher Aktivität methanisieren.
Dies wurde durch einen Blockade Mechanismus von adsorbierten COad auf den
aktiven Plätzen erklärt. Solange genügend COad auf der Oberfläche vorhanden ist (1
Monolage), wird CO2 nicht dissoziiert. Fällt diese Bedeckung unter einen kritischen
Wert, so werden die freien Adsorptionsplätze von COad aus CO2 aufgefüllt.
(III) Die Reaktionsraten beider Katalysatoren liegen je nach Reaktionsreformat
zwischen 3.1 und 4.4x10⁻⁶ mol�g-1�s-1 (Ru/Al2O3) bzw. 31.8 und 63.9x10⁻⁶ mol�g-1�s-1
(2.2 Gew.% Ru/Zeolith). Die Erweiterung des Reformats um CH4 und CO2 um damit
realistischere Reformate zu simulieren, hatte bei beiden Katalysatoren keinen
merklichen Einfluss auf die Reaktionsrate. Lediglich das Hinzufügen von 5 % Wasser
zum Reformat führte im Falle des Ru/Zeolith Katalysators zu einer Halbierung der
Reaktionsrate. In situ DRIFTS Messungen zeigten hier eine 50%ige
Intensitätserniedrigung der auf metallischem Ru linear adsorbierten COad Spezies.
Es wurde vermutet, dass das Zwischenprodukt, welches auf denselben Plätzen wie
COad adsorbiert, ebenfalls durch Wasser verdrängt wird, und dadurch Einfluss auf die
Reaktionsrate nimmt. Die Aktivierungsenergie der selektiven Methanisierung von CO
lag für alle untersuchten Reformate bei beiden Katalysatoren zwischen 90
(Ru/Zeolith) und 110 (Ru/Al2O3) kJ�mol-1. Die Reaktionsordnung bezüglich CO lag bei
-0.7 (Ru/Zeolith) und bei -0.5 (Ru/Al2O3). Für H2 wurde auf dem Ru/Al2O3 Katalysator
6 Appendix
159
eine Reaktionsordnung 1.0 gemessen, was einen deutlich niedrigeren Wert als die
Reaktionsordnung von 2.7 auf dem Ru/Zeolith Katalysator darstellt. Dieser um den
Faktor 2.7 höhere Wert wird als einer der Gründe für die hohe Aktivität des
Ru/Zeolith Katalysators verantwortlich gemacht. Transiente in situ DRIFTS und MS
Messungen, bei denen nach Erreichen des dynamischen Gleichgewichts nach 1000
min Reaktion in idealisierter Atmosphäre (H2/CO), CO durch N2 ersetzt wurde,
zeigten, dass die beobachteten CHx Spezies keinen dominanten Reaktionspfad
darstellen können. Die Abreaktion dieser Spezies verläuft, verglichen mit dem
Abklingen des CH4 Signals im Massenspektrometer, auf einer zu langen Zeitskala.
Möglicherweise nimmt nur ein geringer reaktiver Anteil von CHx Spezies an der
Reaktion teil. Deren Signale im IR wurden wahrscheinlich von den weitaus größeren
Banden der unreaktiven CHx Spezies überdeckt.
(IV) Der molekulare Mechanismus der CO und CO2 Methanisierung wurde mittels
SSITKA (Steady State Isotope Transient Kinetic Analysis) Experimenten untersucht,
bei denen nach Erreichen des dynamischen Gleichgewichts nach 1000 min Reaktion
ein Edukt (12CO oder 12CO2) durch sein Isotop (13CO oder 13CO2) ersetzt wurde. Auf
dem Ru/Al2O3 Katalysator konnte so eine ‚Formyl’ Spezies (CHOad) als
Zwischenprodukt der CO Methansierung identifiziert werden, da seine
Abreaktionsrate der Reaktionsrate aus kinetischen Messungen entsprach. Derselbe
Mechanismus wurde für den Ru/Zeolith Katalysator vorgeschlagen, obwohl eine
ähnliche Spezies noch nicht nachgewiesen werden konnte, was vermutlich an seiner
20-fach höheren Aktivität lag. Weiterhin konnte für beide Katalysatoren gezeigt
werden, dass der Mechanismus der CO2 Methansierung über COad zu CH4 abläuft.
Hierbei wird CO2 dissoziativ adsorbiert (COad und Oad), und nicht über ein Formiat in
COad umgewandelt.
Die Kombination der bisher gezeigten Ergebnisse, lässt metallisches Ru als aktives
Zentrum der selektiven Methanisierung schließen. Auf diesem reagiert adsorbiertes
COad zu HCOad und schließlich zu CH4. Das Zwischenprodukt (HCOad) scheint
ebenfalls auf den Ru Nanopartikeln adsorbiert zu sein. Weiterhin konnte ich zeigen,
dass der 2.2 Gew.% Zeolith Katalysator mit den sehr kleinen Ru Nanopartikeln eine
höhere Reaktionsrate als der Ru/Al2O3 Katalysator aufweist. Dies wird einerseits den
möglicherweise vorhandenen Träger-Metall Wechselwirkungen und andererseits der
hohen H2 Reaktionsordnung zugeschrieben. Für die sehr hohe CO Selektivität des
Zeolith Katalysators sind ebenfalls die sehr kleinen Ru Nanopartikel verantwortlich
6 Appendix
160
(siehe weiter unten). Dies ist auch eine Erklärung dafür, dass die Wassergas-Shift-
Rückreaktion (CO2 zu CO) nie unter den hier gewählten Bedingungen auf dem
Ru/Zeolith Katalysator beobachtet wurde.
(V) Es konnte gezeigt werden, dass die Ru Partikelgröße einen maßgeblichen
Einfluß auf die CO Selektivität der selektiven Methanisierung von CO in CO2 reichen
Brenngasen ausübt. Der Ru/Al2O3 Katalysator, mit einer mittleren Ru Partikelgröße
von 2,3 nm, wies eine deutlich schlechtere CO Selektivität (~45%) bei geringen CO
Partialdrücken (100 ppm) in semirealistischen Reformaten auf, als der Ru/Zeolith
Katalysator (d= 0.9 nm, 100%) bei identischen Bedingungen. Die Abnahme der CO
Selektivität korrelierte mit einer Erniedrigung der COad Signalintensität in in situ
DRIFTS Messungen, welches als Maß für das Zwischenprodukt der CO2
Methanisierung und damit für die Selektivität genommen werden kann. Im Falle des
Ru/Al2O3 Katalysators wird der Mechanismus der CO Selektivität über einen
Blockademechanismus gesteuert, bei dem CO2 nicht adsobiert und gespalten wird,
solange genügend CO die Oberfläche bedeckt (1 Monolage). Sinkt die CO
Bedeckung unter den kritischen Wert einer Monolage, füllt CO aus dissoziertem CO2
die frei gewordenen aktiven Plätze auf, was einer Erniedrigung der Selektivität gleich
kommt. Folgerichtig wurde auch unter CO freien Bedingungen ein Wert nahe der
COad Sättigungsintensität erreicht, wenn nur CO2 in der Gasmischung vorhanden war
(H2/CO). Der Ru/Zeolith Katalysator zeigte hierbei eine ganz andere Charakteristik.
Hier konnte in in situ DRIFTS Messungen unter geringen CO Partialdrücken (100
ppm CO) kein zusätzliches COad aus CO2 beobachtet werden. Sogar in CO freiem
Reformat erreichte die COad Bande, welche durch dissoziiertes CO2 entstand, nur
6% der Sättigungsintensität. Dieses Verhalten wurde einer inhärent kleinen CO2
Methanisierungsaktivität der sehr kleinen Ru Nanopartikel zugeordnet. Das
unterschiedliche Verhalten konnte mit Hilfe des BrØnstedt-Evans-Polanyi (BEP)
Zusammenhangs erklärt werden, demzufolge mit zunehmender Partikelgröße die
CO2 Dissoziationsrate steigt, da dessen Produkt (COad) auf großen Partikeln besser
stabilisiert ist.
(VI) Um Träger-Metall Wechselwirkungen als Ursache für die unterschiedliche
Selektivität der zwei Katalysatoren (5.0 Gew.% Ru/Al2O3 und 2.2 Gew.% Ru/Zeolith)
auszuschließen, wurden identische Experimente auf unterschiedlich beladenen
(3.6 Gew.% und 5.6 Gew.%) aber ansonsten gleichen Ru/Zeolith Katalysatoren
durchgeführt. Diese Katalysatoren wiesen im Vergleich zum 2.2 Gew.% Ru/Zeolith
6 Appendix
161
Katalysator (d= 0.9 nm) größere mittlere Ru Partikelgrößen auf (d= 1.6 und 1.9 nm),
welche vergleichbar mit der des Ru/Al2O3 Katalysators sind. Es konnte gezeigt
werden, dass auch auf dem Zeolith geträgerten Katalysatorsystem die CO
Selektivität mit zunehmender Ru Partikelgröße abnimmt, was sowohl durch
kinetische als auch durch in situ DRIFTS Messungen verifiziert wurde. Im Gegensatz
dazu nahm die Methanisierungsaktivität (auf gRu normiert) mit größerer Ru
Partikelgröße, sowohl für CO als auch für CO2 Methanisierung, zu.
Zum Abschluß möchte ich auf die Bedeutung dieser Ergebnisse für die praktische
Anwendung dieser Katalysatoren in der Reformatreinigung für PEM Brennstoffzellen
eingehen. Werden die 5 Gew.% Ru/Al2O3, 3.6 oder 5.6 Gew.% Ru/Zeolith
Katalysatoren mit Ru Partikelgrößen größer als 1.5 nm für die selektive
Methanisierung verwendet, wird die CO2 Methanisierung immer dann stattfinden,
sobald der CO Partialdruck und daraus folgend die COad Bedeckung unter einen
kritischen Wert fällt; zum Beispiel am Ende eines Methanisierungsreaktors. In diesem
Fall ist die komplette Entfernung von CO ohne einen Beitrag der CO2 Methanisierung
nicht möglich. Die höher beladenen Ru/Zeolith Katalysatoren weisen zwar gegenüber
dem 2.2 Gew.% Ru/Zeolith Katalysator höhere Methanisierungsraten auf, was
prinzipiell immer wünschenswert ist, jedoch wird dieser Vorteil auf Kosten der CO
Methanisierungsselektivität erreicht. Im Gegensatz dazu wird die CO2
Methanisierung auf dem 2.2Gew.% Ru/Zeolith Katalysator sogar bei sehr kleinen CO
Partialdrücken verhindert. Dies wird der inhärent niedrigen CO2 Dissoziationsaktivität
auf den sehr kleinen Ru Nanopartikeln zugeschrieben. Deshalb, ist der Mechanismus
welcher der CO Selektivität zugrunde liegt ein anderer als der, welcher auf dem
Ru/Al2O3 Katalysator abläuft. Dieser erlaubt die hochselektive Entfernung von CO
aus H2 reichen Brenngasen bis hin zu sehr kleinen CO Partialdrücken, und folglich
die komplette Entfernung von CO (< 10 ppm), ohne eine merkliche CO2
Methanisierung, solange die Reaktionstemperatur unterhalb der Temperatur ist, die
für eine deutliche CO2 Dissoziation benötigt wird. Basierend auf der inhärent
niedrigen CO2 Methanisierungsaktivität wird der 2.2 Gew.% Ru/Zeolith Katalysator
auch unter dynamischen Bedingungen hervorragend arbeiten, bei welchen
ansonsten eine Änderung des CO Partialdruckes zu einer merklichen Methanisierung
von CO2 führen würde. Als letzen Punkt möchte ich darauf eingehen, dass der
Schlüssel für eine hohe Selektivität für die CO Methanisierung auf den hier
6 Appendix
162
untersuchten Systemen die Ru Partikelgröße darstellt. Es ist essentiell eine sehr
kleine und stabile Partikelgröße zu produzieren, um eine hohe CO Selektivität zu
gewährleisten. Dies wurde durch die Verwendung eines Zeolithen als Träger
realisiert. Dort befinden sich die Ru Nanopartikel in den Poren, so dass das Sintern
zu größeren Agglomeraten verlangsamt wird, was folglich die CO2 Methanisierung
hemmt. Diese Eigenschaft ist die wichtigste Voraussetzung um PEM
Brennstoffzellen, welche hochreinen Wasserstoff benötigen, gegenüber bewährten
Technologien attraktiver zu machen.
6 Appendix
163
6.1.1 List of publications
Publications in scientific journals
1. S. Eckle, Y. Denkwitz and R.J. Behm, Activity, selectivity, and adsorbed
reaction intermediates/reaction side products in the selective methanation of
CO in reformate gases on supported Ru catalysts, Journal of Catalysis 269
(2010) 255 - 268
2. S. Eckle, H.G. Anfang and R.J. Behm, What drives the selectivity for CO
methanation in the methanation of CO2-rich reformate gases on supported Ru
catalysts, Applied Catalysis A: General 391 (2011) 325-333
3. S. Eckle, H.G. Anfang and R.J. Behm, Reaction intermediates and side
products in the methanation of CO and CO2 over supported Ru catalysts in H2-
rich reformate gases, Journal of Physical Chemistry C 115 (2011) 1361-1367
4. J. Geserick, T. Fröschl, N. Hüsing, G. Kucerova, M. Makosch, T. Diemant, S.
Eckle, and R.J. Behm, Molecular approaches towards mixed metal oxides and
their behaviour in mixed oxide support Au catalysts for CO oxidation, Dalton
Transaction 40 (2011) 3269-3286
5. S. Eckle, M. Augustin, H.G. Anfang and R.J. Behm, Influence of the catalyst
loading on the activity and the CO selectivity of supported Ru catalysts in the
selective methanation of CO in CO2 containing feed gases, Catalysis Today
181 (2012) 40-51
Conference Contributions
1. S. Eckle, A. Karpenko, R. Leppelt and R.J. Behm, Kinetik und Mechanismus
der selektiven Methanisierung von CO über Ru Katalysatoren, 41.
Jahrestreffen Deutscher Katalytiker, Weimar, 2008
2. S. Eckle, M. Wassner, R. Leppelt and R.J. Behm, Kinetics and Mechanism of
the selective methanation of CO on Ru catalysts, Ulm ElectroChemical Talks,
Ulm, 2010
3. S. Eckle, H.G. Anfang and R.J. Behm, Kinetik und Mechanismus der
selektiven Methanisierung von CO über Ru Katalysatoren, 42. Jahrestreffen
Deutscher Katalytiker, Weimar, 2009
6 Appendix
164
4. S. Eckle, H.G. Anfang and R.J. Behm, Aktivität und Selektivität der selektiven
Methanisierung von CO über Ru Katalysatoren in Abhängigkeit der Ru
Beladung, 43. Jahrestreffen Deutscher Katalytiker, Weimar, 2010
5. S. Eckle, H.G. Anfang, R.J. Behm, Carriers selective methanation of CO in
CO2–rich feed Gases on Supported Ru Catalysts, 18th World Hydrogen
Energy Conference 2010 - WHEC 2010 : Parallel Sessions Book 3: Hydrogen
Production Technologies - Part 2 / Detlef Stolten, Thomas Grube (Ed.)
Forschungszentrum Jülich GmbH, Zentralbibliothek, Verlag : 2010 ; WHEC,
May 16.-21. 2010, Essen ; 271
6. S.Eckle, H.G. Anfang and R.J. Behm, High selectivity for CO methanation in
the methanation of CO2-rich reformate gases on supported Ru catalysts-
Mechanism and physical origin, Ulm ElectroChemical Talks, Ulm, 2010
7. S. Eckle, H.G. Anfang and R.J. Behm, Influence of the support on the activity
and selectivity of supported Ru catalysts in feed gas processing by selective
methanation of CO, First International Conference on Materials for Energy,
Karlsruhe, 2010
8. S. Eckle, H.G. Anfang and R.J. Behm, Mechanismus der selektiven
Methanisierung von CO über Ru Katalysatoren, 44. Jahrestreffen Deutscher
Katalytiker, Weimar, 2011

6.1.2 Curriculum Vitae
165
6.1.2 Curriculum Vitae
The curriculum vitae has been removed for reasons of data protection from the
electronic version
7 Acknowledgement
166
7 Acknowledgement
At this point I would like to thank all those who contributed to the success of this
thesis.
- I am especially grateful to Prof. R.J. Behm for providing the challenging
and interesting topic, the opportunity to work on it in his institute and his
ongoing support throughout the years.
- I thank Prof. N. Hüsing for her willingness to review the thesis and for
coming from Salzburg to Ulm for my defense.
- I thank Prof. M. Muhler for giving the third expert opinion.
- Georg Anfang I would like to thank for his support concerning the synthesis
of the Ru catalysts and the nice discussions throughout the years.
- I thank Daniel Widmann, Dr. Gabriela Kucerova for the great working
atmosphere, the nice discussions and the fun during the synchrotron
experiments.
- I thank in particular Dr. Gabriela Kucerova for reading the PhD thesis
before submission, and Robert Reichert and Christian Gebauer, for helping
to find typos.
- Prof. van Bokhoven and Evalyn Alayon (ETH) I would like to thank for
introducing me to EXAFS spectroscopy, and their help with its evaluation
- Thomas Häring I would like to thank for the ongoing support when
something broke again, his time and advices when setting up the in situ
XAS cell and for the great times during the synchrotron trips, especially in
France, and especially for the discussions in his office.
- Gerd Bräth I would like to thank for his support in all electronic concerns.
- I give thanks to PD Dr. Joachim Bansmann for his helping hand and
advices concerning XAS planning and measurements.
- All colleagues of the IOK I would like to thank for the great atmosphere and
the good discussions during coffee breaks.
8 Declaration
167
8 Declaration
I hereby certify that this dissertation has been composed by me and is based on my
own work, unless stated otherwise. This work has not been submitted for any other
degree.
Ulm, 09.02.2012
------------------------------------------
(Stephan Eckle)